UNITED STATES SECURITIES AND EXCHANGE COMMISSION Washington, DC 20549 FORM 10-K ☒ ANNUAL REPORT PURSUANT TO SECTION 13 OR 15(d) OF THE SECURITIES EXCHANGE ACT OF 1934 For the fiscal year ended January 31, 2022 ☐ TRANSITION REPORT PURSUANT TO SECTION 13 OR 15(d) OF THE SECURITIES EXCHANGE ACT OF 1934 For the transition period from ________ to ________ Commission File No. 000-22754 URBAN OUTFITTERS, INC. (Exact Name of Registrant as Specified in Its Charter) Pennsylvania 23-2003332 (State or Other Jurisdiction of Incorporation or Organization) (I.R.S. Employer Identification No.) 5000 South Broad Street, Philadelphia, PA 19112-1495 (Address of Principal Executive Offices) (Zip Code) Registrant’s telephone number, including area code: (215) 454-5500 Securities registered pursuant to Section 12(b) of the Act: Title of each class Trading Symbol(s) Name of each exchange on which registered Common Shares, par value $.0001 per share URBN NASDAQ Global Select Market Securities registered pursuant to Section 12(g) of the Act: None Indicate by checkmark if the registrant is a well-known seasoned issuer, as defined in Rule 405 of the Securities Act. Yes ☒ No ☐ Indicate by checkmark if the registrant is not required to file reports pursuant to Section 13 or Section 15(d) of the Act. Yes ☐ No ☒ Indicate by checkmark whether the registrant (1) has filed all reports required to be filed by Section 13 or 15(d) of the Securities Exchange Act of 1934 during the preceding 12 months (or for such shorter period that the registrant was required to file such reports), and (2) has been subject to such filing requirements for the past 90 days. Yes ☒ No ☐ Indicate by check mark whether the registrant has submitted electronically every Interactive Data File required to be submitted pursuant to Rule 405 of Regulation S-T during the preceding 12 months (or for such shorter period that the registrant was required to submit such files). Yes ☒ No ☐ Indicate by checkmark whether the registrant is a large accelerated filer, an accelerated filer, a non-accelerated filer, a smaller reporting company, or an emerging growth company. See the definitions of “large accelerated filer,” “accelerated filer,” “smaller reporting company” and “emerging growth company” in Rule 12b-2 of the Exchange Act. Large accelerated filer ☒ Accelerated filer ☐ Non-accelerated filer ☐ Smaller Reporting Company ☐ Emerging Growth Company ☐ If an emerging growth company, indicate by check mark if the registrant has elected not to use the extended transition period for complying with any new or revised financial accounting standards provided pursuant to Section 13(a) of the Exchange Act. ☐ Indicate by check mark whether the registrant has filed a report on and attestation to its management’s assessment of the effectiveness of its internal control over financial reporting under Section 404(b) of the Sarbanes-Oxley Act (15 U.S.C. 7262(b)) by the registered public accounting firm that prepared or issued its audit report. ☒ Indicate by a checkmark whether the registrant is a shell company (as defined in Rule 12b-2 of the Act). Yes ☐ No ☒ The aggregate market value of the voting and non-voting common equity held by non-affiliates computed by reference to the price at which the common equity was last sold, or the average bid and asked price of such common equity, as of the last business day of the registrant’s most recently completed second fiscal quarter, was $2,747,218,191. The number of shares outstanding of the registrant’s common stock on March 25, 2022 was 95,661,980. DOCUMENTS INCORPORATED BY REFERENCE Certain information required by Items 10, 11, 12, 13 and 14 is incorporated by reference into Part III hereof from portions of the Proxy Statement for the registrant’s 2022 Annual Meeting of Shareholders.

Welcome message from author
This document is posted to help you gain knowledge. Please leave a comment to let me know what you think about it! Share it to your friends and learn new things together.
Transcript

UNITED STATESSECURITIES AND EXCHANGE COMMISSION
Washington, DC 20549
FORM 10-K☒ ANNUAL REPORT PURSUANT TO SECTION 13 OR 15(d) OF THE SECURITIES EXCHANGE ACT OF 1934
For the fiscal year ended January 31, 2022☐ TRANSITION REPORT PURSUANT TO SECTION 13 OR 15(d) OF THE SECURITIES EXCHANGE ACT OF 1934
For the transition period from ________ to ________ Commission File No. 000-22754
URBAN OUTFITTERS, INC.(Exact Name of Registrant as Specified in Its Charter)
Pennsylvania 23-2003332(State or Other Jurisdiction of
Incorporation or Organization) (I.R.S. Employer
Identification No.)
5000 South Broad Street, Philadelphia, PA 19112-1495(Address of Principal Executive Offices) (Zip Code)
Registrant’s telephone number, including area code: (215) 454-5500Securities registered pursuant to Section 12(b) of the Act:
Title of each class Trading Symbol(s) Name of each exchange on which registeredCommon Shares, par value $.0001 per share URBN NASDAQ Global Select Market
Securities registered pursuant to Section 12(g) of the Act: None
Indicate by checkmark if the registrant is a well-known seasoned issuer, as defined in Rule 405 of the Securities Act. Yes ☒ No ☐
Indicate by checkmark if the registrant is not required to file reports pursuant to Section 13 or Section 15(d) of the Act. Yes ☐ No ☒
Indicate by checkmark whether the registrant (1) has filed all reports required to be filed by Section 13 or 15(d) of the Securities Exchange Act of 1934 during the preceding 12 months (or for such shorter period that the registrant wasrequired to file such reports), and (2) has been subject to such filing requirements for the past 90 days. Yes ☒ No ☐
Indicate by check mark whether the registrant has submitted electronically every Interactive Data File required to be submitted pursuant to Rule 405 of Regulation S-T during the preceding 12 months (or for such shorter period that theregistrant was required to submit such files). Yes ☒ No ☐
Indicate by checkmark whether the registrant is a large accelerated filer, an accelerated filer, a non-accelerated filer, a smaller reporting company, or an emerging growth company. See the definitions of “large accelerated filer,” “acceleratedfiler,” “smaller reporting company” and “emerging growth company” in Rule 12b-2 of the Exchange Act. Large accelerated filer ☒ Accelerated filer ☐Non-accelerated filer ☐ Smaller Reporting Company ☐ Emerging Growth Company ☐
If an emerging growth company, indicate by check mark if the registrant has elected not to use the extended transition period for complying with any new or revised financial accounting standards provided pursuant to Section 13(a) of theExchange Act. ☐
Indicate by check mark whether the registrant has filed a report on and attestation to its management’s assessment of the effectiveness of its internal control over financial reporting under Section 404(b) of the Sarbanes-Oxley Act (15 U.S.C.7262(b)) by the registered public accounting firm that prepared or issued its audit report. ☒
Indicate by a checkmark whether the registrant is a shell company (as defined in Rule 12b-2 of the Act). Yes ☐ No ☒The aggregate market value of the voting and non-voting common equity held by non-affiliates computed by reference to the price at which the common equity was last sold, or the average bid and asked price of such common equity, as of
the last business day of the registrant’s most recently completed second fiscal quarter, was $2,747,218,191.The number of shares outstanding of the registrant’s common stock on March 25, 2022 was 95,661,980.
DOCUMENTS INCORPORATED BY REFERENCECertain information required by Items 10, 11, 12, 13 and 14 is incorporated by reference into Part III hereof from portions of the Proxy Statement for the registrant’s 2022 Annual Meeting of Shareholders.
TABLE OF CONTENTS
PART I
Item 1. Business 1 Item 1A. Risk Factors 8 Item 1B. Unresolved Staff Comments 16 Item 2. Properties 16 Item 3. Legal Proceedings 17 Item 4. Mine Safety Disclosures 17
PART II Item 5. Market for Registrant’s Common Equity, Related Shareholder Matters and Issuer Purchases of Equity Securities 18 Item 6. Selected Financial Data 19 Item 7. Management’s Discussion and Analysis of Financial Condition and Results of Operations 20 Item 7A. Quantitative and Qualitative Disclosures About Market Risk 33 Item 8. Financial Statements and Supplementary Data 33 Item 9. Changes in and Disagreements with Accountants on Accounting and Financial Disclosure 34 Item 9A. Controls and Procedures 34 Item 9B. Other Information 34
PART III Item 10. Directors, Executive Officers and Corporate Governance 36 Item 11. Executive Compensation 39 Item 12. Security Ownership of Certain Beneficial Owners and Management and Related Shareholder Matters 39 Item 13. Certain Relationships and Related Transactions, and Director Independence 39 Item 14. Principal Accountant Fees and Services 39
PART IV Item 15. Exhibits and Financial Statement Schedules 40 Item 16. Form 10-K Summary 42 Signatures 43 INDEX TO CONSOLIDATED FINANCIAL STATEMENTS F-1
Certain matters contained in this filing with the United States Securities and Exchange Commission (“SEC”) may contain forward-looking statements and are being made pursuant to the “safe harbor” provisions of the
Private Securities Litigation Reform Act of 1995. When used in this Annual Report on Form 10-K, the words “project,” “believe,” “plan,” “will,” “anticipate,” “expect” and similar expressions are intended to identify forward-looking statements, although not all forward-looking statements contain these identifying words. Any one, or all, of the following factors could cause actual financial results to differ materially from those financial results mentioned inthe forward-looking statements: the impacts of public health crises such as the coronavirus (COVID-19) pandemic, overall economic and market conditions (including inflation) and worldwide political events and the resultant impacton consumer spending patterns, the difficulty in predicting and responding to shifts in fashion trends, changes in the level of competitive pricing and promotional activity and other industry factors, the effects of the implementation ofthe United Kingdom's withdrawal from membership in the European Union (commonly referred to as “Brexit”), including currency fluctuations, economic conditions and legal or regulatory changes, any effects of war (includinggeopolitical instability), terrorism and civil unrest, natural disasters, severe or unseasonable weather conditions (including as a result of climate change) or public health crises, increases in labor costs, increases in raw material costs,availability of suitable retail space for expansion, timing of store openings, risks associated with international expansion, seasonal fluctuations in gross sales, response to new concepts, our ability to integrate acquisitions, risksassociated with digital sales, our ability to maintain and expand our digital sales channels, any material disruptions or security breaches with respect to our technology systems, the departure of one or more key senior executives,import risks (including any shortage of transportation capacities or delays at ports), changes to U.S. and foreign trade policies (including the enactment of tariffs, border adjustment taxes or increases in duties or quotas), the closing ordisruption of, or any damage to, any of our distribution centers, our ability to protect our intellectual property rights, failure of our manufacturers and third-party vendors to comply with our social compliance program, risks related toenvironmental, social and governance activities, changes in our effective income tax rate, changes in accounting standards and subjective assumptions, regulatory changes and legal matters and other risks identified in our filings withthe SEC, including those set forth in Item 1A of this Annual Report on Form 10-K for the fiscal year ended January 31, 2022. We disclaim any intent or obligation to update forward-looking statements even if experience or futurechanges make it clear that actual results may differ materially from any projected results expressed or implied therein.
Unless the context otherwise requires, all references to the “Company,” “we,” “us” or “our” refer to Urban Outfitters, Inc., together with its subsidiaries.
PART I
Item 1. Business
GeneralWe are a leading lifestyle products and services company that operates a portfolio of global consumer brands comprised of the Anthropologie, Bhldn, Free People, FP Movement, Terrain, Urban Outfitters, Nuuly and Menus &
Venues brands. We have achieved compounded annual sales growth of approximately 5% over the past five years, with sales of approximately $4.5 billion during the fiscal year ended January 31, 2022. The COVID-19 pandemic had anegative impact on our results for the fiscal year ended January 31, 2021, and continued to impact our operations for the fiscal year ended January 31, 2022. See Item 7: Management’s Discussion and Analysis of Financial Conditionand Results of Operations–Overview–Current Trends for further discussion.
We operate under three reportable segments – Retail, Wholesale and Nuuly. Our Retail segment includes our store and digital channels and consists of our Anthropologie, Bhldn, Free People, FP Movement, Terrain, UrbanOutfitters and Menus & Venues brands. We have over 51 years of experience creating and managing retail stores that offer highly differentiated collections of fashion apparel, accessories and home goods, among other things, in invitingand dynamic store settings. Our core strategy is to provide unified environments that establish emotional bonds with the customer, through Company-owned stores and franchisee-owned stores. In addition to retail stores, we offer ourproducts and services directly to our customers through our websites, mobile applications, social media and third-party digital platforms, catalogs and customer contact centers. The Menus & Venues brand includes various casual diningconcepts and event venues.
We operate a Wholesale segment under the Free People, FP Movement and Urban Outfitters brands. The Wholesale segment sells through department and specialty stores worldwide, digital businesses and our Retail segment.The Wholesale segment primarily designs, develops and markets apparel, intimates and activewear.
Our Nuuly segment, formerly known as the Subscription segment, consists of the Nuuly brand, which offers customers with a more sustainable way to explore fashion. Nuuly Rent is a monthly women’s apparel subscriptionrental service that launched in July 2019. Nuuly Thrift, which launched in October 2021, is a peer-to-peer resale marketplace where customers can buy and sell women’s, men’s and kids’ clothes, shoes and accessories from any brands.
Milestones in our Company’s growth are as follows: • 1970: First Urban Outfitters store opened near the University of Pennsylvania campus in Philadelphia, Pennsylvania • 1976: Incorporated in the Commonwealth of Pennsylvania • 1984: Free People Wholesale division established
1

• 1992: First Anthropologie store opened in Wayne, Pennsylvania • 1993: Initial public offering of URBN shares on NASDAQ • 1998: First European Urban Outfitters store opened in London; Anthropologie website launched • 1999: Urban Outfitters website launched • 2002: First Free People store opened in the Garden State Plaza Mall in Paramus, New Jersey • 2004: Free People website launched • 2008: First Terrain garden center opened in Glen Mills, Pennsylvania • 2009: First European Anthropologie store opened in London • 2018: Urban Outfitters Wholesale division established; first European Free People store opened in Amsterdam • 2019: Launch of Nuuly Rent, a subscription rental service • 2020: First FP Movement store opened in Los Angeles, California • 2021: Launch of Nuuly Thrift, a peer-to-peer resale marketplace
Our Retail segment omni-channel strategy enhances our customers’ brand experience by providing a seamless approach to the customer shopping experience. All available Company-owned Retail segment shopping channelsare fully integrated, including stores, websites, mobile applications, catalogs and customer contact centers. Our investments in areas such as marketing campaigns and technology advancements are designed to generate demand for theRetail segment omni-channel and not the separate store or digital channels. We manage and analyze our performance based on a single Retail segment omni-channel rather than separate channels and believe that the Retail segmentomni-channel results present the most meaningful and appropriate measure of our performance.
Our fiscal year ends on January 31. All references to our fiscal years refer to the fiscal years ended on January 31 in those years. For example, our fiscal 2022 ended on January 31, 2022.
Our annual report on Form 10-K, quarterly reports on Form 10-Q, current reports on Form 8-K and amendments to those reports filed with, or furnished to, the SEC pursuant to Section 13(a) or 15(d) of the SecuritiesExchange Act of 1934, as amended, are available free of charge on our investor relations website, www.urbn.com/investor-relations, as soon as reasonably practicable after we electronically file such material with, or furnish suchmaterial to, the SEC. We will voluntarily provide electronic or paper copies (other than exhibits) of our filings free of charge upon written request. You may also obtain any materials we file with, or furnish to, the SEC on its website atwww.sec.gov.
Retail Segment
Urban Outfitters. Urban Outfitters targets young adults aged 18 to 28 through a unique merchandise mix, compelling store environment, social media and third-party digital platforms, websites and mobile applications. Wehave established a reputation with these young adults, who are culturally sophisticated, self-expressive and actively engaged with their peer group. The product offering includes women’s and men’s fashion apparel, activewear,intimates, footwear, accessories, home goods, electronics and beauty. A large portion of our merchandise is exclusive to Urban Outfitters, consisting of an assortment of products designed internally and designed in collaboration withthird-party brands. Stores average approximately 9,000 square feet of selling space. Our stores are located in street locations in large metropolitan areas and select university communities, specialty centers and enclosed malls thataccommodate our customers’ propensity not only to shop, but also to congregate with their peers.
As of January 31, 2022, we operated 261 Urban Outfitters stores, of which 184 were located in the United States, 18 were located in Canada and 59 were located in Europe, and sold merchandise through franchisee-ownedstores in the United Arab Emirates. We plan to open approximately 10 Urban Outfitters stores and close approximately 5 Urban Outfitters stores due to lease expiration, globally, in fiscal 2023. We plan for future store growth to comefrom expansion domestically and internationally, which may include opening stores in new and existing markets or entering into additional franchise or joint venture agreements. Urban Outfitters operates websites and mobileapplications in North America and Europe that capture the spirit of the brand by offering a similar yet broader selection of merchandise as found in its stores. We plan for future digital channel growth to come from expansiondomestically and internationally. Urban Outfitters’ North American Retail segment net sales accounted for approximately 27.5% of consolidated net sales for fiscal 2022. European and Asian Retail segment net sales accounted forapproximately 9.1% of consolidated net sales for fiscal 2022.
Anthropologie Group. The Anthropologie Group consists of the Anthropologie, Bhldn and Terrain brands.
The Anthropologie brand tailors its merchandise and inviting store environment to sophisticated and contemporary women aged 28 to 45. The Anthropologie brand’s unique and eclectic internally designed and third-partybrand product assortment includes women’s apparel, accessories, intimates, shoes, home furnishings, a diverse array of gifts and decorative items and beauty and
2

wellness. In addition, the brand offers a catalog in North America that markets select merchandise, most of which is also available in Anthropologie brand stores.
The Bhldn brand emphasizes every element that contributes to a wedding. The brand offers a curated collection of heirloom quality wedding gowns, bridesmaid frocks, party dresses, assorted jewelry, headpieces, footwear,lingerie and decorations.
The Terrain brand is designed to appeal to women and men interested in a creative and sophisticated outdoor living and gardening experience. Terrain’s product offering includes lifestyle home, garden and outdoor livingproducts, antiques, live plants, flowers, wellness products and accessories.
As of January 31, 2022, we operated 238 Anthropologie Group stores, of which 206 were located in the United States, 11 were located in Canada and 21 were located in Europe, and sold merchandise through a franchisee-owned store in the United Arab Emirates. Stores average approximately 8,000 square feet of selling space. In addition to individual brand stores, we operate expanded format stores that include multiple Anthropologie Group brands,which allows for the presentation of an expanded assortment of products in certain categories. Our stores are located in specialty centers, upscale street locations and enclosed malls. We plan to open approximately 8 AnthropologieGroup stores and close approximately 8 Anthropologie Group stores due to lease expiration, globally, in fiscal 2023. We plan for future store growth to come from expansion domestically and internationally, which may include openingstores in new and existing markets or entering into additional franchise or joint venture agreements. The Anthropologie Group operates websites and mobile applications in North America and Europe that capture the spirit of its brandsby offering a similar yet broader selection of merchandise as found in its stores, and offers a catalog in North America that markets select merchandise, most of which is also available in Anthropologie brand stores. We plan for futuredigital channel growth to come from expansion domestically and internationally. The Anthropologie Group’s North American Retail segment net sales accounted for approximately 37.4% of consolidated net sales for fiscal 2022.European and Asian Retail segment net sales accounted for approximately 2.0% of consolidated net sales for fiscal 2022.
Free People Group. The Free People Group consists of the Free People and FP Movement brands.
Our Free People and FP Movement retail stores primarily offer private label merchandise targeted to young contemporary women aged 25 to 30. The Free People brand offers a unique merchandise mix of casual women’sapparel, intimates, FP Movement activewear, shoes, accessories, home products, gifts and beauty and wellness. The FP Movement brand offers performance-ready activewear, beyond-the-gym staples and wellness essentials. Retailstores average approximately 2,000 square feet of selling space. Our stores are located in enclosed malls, upscale street locations and specialty centers.
As of January 31, 2022, we operated 173 Free People Group stores, of which 162 were located in the United States, five were located in Canada and six were located in Europe. Of the 173 Free People Group stores open as ofJanuary 31, 2022, 20 were FP Movement stores, all located in the United States. We plan to open approximately 28 new Free People Group stores (including 16 FP Movement stores) and close approximately 1 Free People Group storedue to lease expiration, globally, in fiscal 2023. We plan for future store growth to come from expansion domestically and internationally, which may include opening stores in new and existing markets or entering into additionalfranchise or joint venture agreements. The Free People Group operates websites and mobile applications in North America, Europe and Asia that capture the spirit of the brand by offering a similar yet broader selection of merchandiseas found in its stores, as well as substantially all of the Free People and FP Movement wholesale offerings. The Free People Group also offers catalogs that market select merchandise, most of which is also available in our Free Peopleand FP Movement stores. We plan for future digital channel growth to come from expansion domestically and internationally. The Free People Group’s North American Retail segment net sales accounted for approximately 16.3% forfiscal 2022. European and Asian Retail segment net sales accounted for less than 1.0% of consolidated net sales for fiscal 2022.
Menus & Venues. The Menus & Venues brand focuses on a dining experience that provides excellence in food, beverage and service. As of January 31, 2022, we operated 10 restaurants, all of which were located in theUnited States. The Menus & Venues brand net sales accounted for less than 1.0% of consolidated net sales for fiscal 2022.
Wholesale Segment
The Wholesale segment consists of the Free People, FP Movement and Urban Outfitters brands. The Wholesale segment was established in 1984 with the Free People brand to develop, in conjunction with Urban Outfitters,private label apparel lines of young women’s casual wear that could be effectively sold in Urban Outfitters stores and later began selling to department and specialty stores worldwide. The Urban Outfitters wholesale division,established in 2018, designs and sells the BDG and other own brand apparel collections to select department stores. We display our wholesale products in certain department stores using a shop-within-shop sales model. We believe thatthe shop-within-shop model allows for a more complete merchandising of our products, which allows us to differentiate ourselves from our competition and further strengthens each brand’s image. During fiscal 2022, the Wholesalesegment’s range of young women’s contemporary casual apparel, intimates, FP Movement activewear and shoes under the Free People brand and the BDG and other own brand apparel collections under the Urban Outfitters brand weresold through department and specialty stores worldwide, including Nordstrom, Dillard’s, digital businesses and our Retail segment. We monitor the styles and products that are popular with our wholesale customers to give us insightinto current fashion trends, helping us to better
3
serve our retail customers. Wholesale sales and showroom facilities are located in Dallas, New York City, Los Angeles, Chicago and London. Our Wholesale segment net sales accounted for approximately 5.5% of consolidated netsales for fiscal 2022.
Nuuly SegmentNuuly. Our Nuuly segment consists of the Nuuly brand, which includes Nuuly Rent and Nuuly Thrift. Nuuly Rent is a monthly women’s apparel subscription rental service that launched in July 2019. For a monthly fee, Nuuly
subscribers can select rental product from a wide selection of the Company’s own brands, third-party market brands and one-of-a-kind vintage pieces via a custom-built, digital platform. Subscribers select their products each month,wear them as often as they like and then swap into new products the following month. Subscribers are also able to purchase the rented product. Nuuly Thrift, which launched in October 2021, is a peer-to-peer resale marketplace wherecustomers can buy and sell women’s, men’s and kids’ apparel, shoes and accessories from any brands. Sellers on Nuuly Thrift can transfer their earnings to their bank account or convert them to “Nuuly Cash,” a gift card with a bonus tobe used at any of the Company’s brands. The Company earns a commission based on sales made in the marketplace. Nuuly segment net sales accounted for approximately 1.1% of consolidated net sales for fiscal 2022.
Store Environment
We create a unified environment in our stores that establishes an emotional bond with the customer. Every element of the environment is tailored to the aesthetic preferences of our target customers. Through creative design,much of the existing retail space is modified to incorporate a mosaic of fixtures, finishes and revealed architectural details. In our stores, merchandise is integrated into a variety of creative vignettes and displays designed to offer ourcustomers an entire look at a distinct lifestyle. This dynamic visual merchandising and display technique provides the connection among the store design, the merchandise and the customer. Essential components of the ambiance of eachstore may include playing music that appeals to our target customers, using unique signage and employing a staff that understands and identifies with the target customer.
Our Urban Outfitters, Anthropologie Group and Free People Group stores are primarily located in upscale street locations, free-standing locations, enclosed malls and specialty centers. We plan for our store environment andlocation strategy to remain consistent over the next several years.
Buying and Design OperationsMaintaining a constant flow of fresh and fashionable merchandise for our Retail segment is critically important to our ongoing performance. We maintain our own buying groups that select and develop products to satisfy our
target customers and provide us with the appropriate amount and timing of products offered. Our buyers stay in touch with the evolving tastes of their target customers by shopping at major trade markets, attending national and regionaltrade shows and staying current with mass media influences, including social media, music, video, film, magazines and pop culture.
Our buyers and designers play an important role in our ability to identify and deliver the latest fashion trends to our customers. The success of our brands relies upon our ability to attract, train and retain talented, highlymotivated buying and design employees. In addition to management training programs for both newly hired and existing employees, we have a number of retention programs that offer qualitative and quantitative performance-basedincentives.
MerchandiseOur Urban Outfitters brand offers a wide array of eclectic merchandise, including women’s and men’s fashion apparel, activewear, intimates, footwear, accessories, home products, electronics and beauty. Our Anthropologie
brand product offerings include women’s apparel, accessories, intimates, shoes, home furnishings, a diverse array of gifts and decorative items and beauty and wellness. Our Bhldn brand offers a curated collection of heirloom qualitywedding gowns, bridesmaid frocks, party dresses, assorted jewelry, headpieces, footwear, lingerie and decorations. Our Terrain brand product offerings include lifestyle home, garden and outdoor living products, antiques, live plants,flowers, wellness products and accessories. Our Free People brand offers a showcase for casual women’s apparel, intimates, FP Movement activewear, shoes, accessories, home products, gifts and beauty and wellness. Our FPMovement brand offers performance-ready activewear, beyond-the-gym staples and wellness essentials. Our Nuuly brand allows subscribers to select rental product from a wide selection of the Company’s own brands, third-partymarket brands and one-of-a-kind vintage pieces. Our merchandise is continuously updated to appeal to our target customers’ changing tastes and is supplied by a large number of domestic and foreign vendors, with new shipments ofmerchandise arriving at our stores and fulfillment centers almost daily.
The wide breadth of merchandise offered by our brands includes a combination of national third-party brands, private label product designed in collaboration with third-party brands and exclusive merchandise developed anddesigned internally by our brands. This combination allows us to offer fashionable merchandise and to differentiate our product mix from that of traditional department stores, as well as that of other specialty and digital retailers. Privatelabel and exclusive merchandise generally yields higher gross profit margins than third-party branded merchandise, and helps to keep our product offerings current and unique.
4
The ever-changing mix of products available to our customers allows us to adapt our merchandise to prevailing fashion trends, and together with the inviting atmosphere and experience of our stores, social media and third-party digital platforms, websites and mobile applications encourages our core customers to visit our shopping channels frequently.
We select price points for our merchandise that are consistent with the spending patterns of our target customers. As such, our stores carry merchandise at a wide range of price points that may vary considerably within productcategories.
Store Operations
We have organized our retail store operations by brand into geographic areas or districts that each have a district leader. District leaders are responsible for several stores and monitor and supervise individual store leaders.Each store leader is responsible for overseeing the daily operations of one of our stores. In addition to a store leader, the staff of a typical store includes a combination of some or all of the following positions: a visual merchandisingmanager, several department managers and full and part-time sales and visual staff.
An essential requirement for the success of our stores is our ability to attract, train and retain talented, highly motivated store leaders, visual merchandising managers and other key employees. In addition to managementtraining programs for both newly hired and existing employees, we have a number of retention programs that offer qualitative and quantitative performance-based incentives to district-level leaders and store leaders.
Marketing and PromotionWe believe we have highly effective marketing tools in our websites, mobile applications, catalogs, email campaigns and social media and third-party digital platforms. We refresh this media as frequently as daily to reflect the
most cutting edge trends in fashion and culture. We also believe that highly visible store locations, broad merchandise selection and creative and visual presentation within our stores, on our websites and on our mobile applicationsentice our customers to explore these channels and purchase merchandise. Consequently, we rely on these elements, as well as the brand recognition created by our direct marketing activities, to draw customers to our omni-channeloperations. Marketing activities for each of our brand’s retail stores may include special event promotions and a variety of public relations activities designed to create community awareness of our stores and products. We also are activein social media and third-party digital platforms. We believe that the traditional method of a one-way communication to customers is no longer enough. We believe that by starting a conversation and interacting directly with ourcustomers, most notably via Instagram, Facebook, TikTok, Pinterest and Google and our own mobile applications, we are more effective at understanding and serving their fashion needs.
Customer Loyalty ProgramsLoyalty programs offer customers access to member-only benefits and rewards, which promotes brand loyalty. The Urban Outfitters brand offers UO Rewards, a customer loyalty program designed to create authentic, lasting
relationships with customers by rewarding devoted members with reward coupons, exclusive offers and unique experiences. Members can earn and accumulate points based on purchase activity and engaging with the brand throughsocial media. Upon reaching the specified point threshold, members are issued a reward coupon which can be redeemed for both in-store and online purchases.
The Anthropologie brand offers AnthroPerks. AnthroPerks is a customer loyalty program that is designed to deliver benefits and experiences to help make our customers’ shopping journey in-store and online easier and moreinspirational. Members are given free shipping benefits, birthday discounts, receipt look up, exclusive offers, early access to special collections and invitations to “Anthro Events” experiences.
In February 2021, we began testing a paid loyalty program called UP. In exchange for an annual fee, UP provides membership benefits across our entire portfolio of brands, including a gift card, free standard shipping and freereturns on all orders, a discount on orders, early access to products and exclusive events and a discount on the monthly Nuuly subscription fee. We plan to expand our test pilot through fiscal 2023.
Suppliers
To serve our target customers and to recognize changes in fashion trends and seasonality, we purchase merchandise from numerous foreign and domestic vendors, the majority of which is settled in U.S. dollars. We also havearrangements with agents and third-party manufacturers to produce our private label and exclusive merchandise. To the extent that our vendors are located overseas or, in the case of third-party vendors, rely on overseas sources for alarge portion of their merchandise, any event causing a disruption of imports, such as the imposition of increased security or regulatory requirements applicable to imported goods, war, public health concerns (including globalpandemics such as COVID-19), acts of terrorism, natural disasters (including as a result of climate change), port security considerations or labor disputes, financial or political instability in any of the countries in which merchandise wepurchase is manufactured, the effects of Brexit, changes to U.S. or foreign trade policies, including the enactment of tariffs, border adjustment taxes, or increases in duties or quotas, disruption in the supply of fabrics or raw materials,transportation capacity shortages and delays, increases in the cost of fuel or decreases in the value of the U.S. dollar relative to foreign currencies could adversely affect
5
our business. During fiscal 2022, we purchased merchandise from approximately 4,000 vendors located throughout the world. No single vendor or manufacturer accounted for more than 10% of merchandise purchased during that time.We do not believe that the loss of any one vendor would have a material adverse effect on our business.
Company OperationsDistribution. We own a 291,000 square foot distribution center in Gap, Pennsylvania that receives and distributes approximately half of our retail store merchandise in North America. We also lease a 214,500 square foot
distribution center located in Reno, Nevada that receives and distributes the remaining half of our retail store merchandise in North America.
We own and operate an approximately 956,000 square foot fulfillment center in Indiana, Pennsylvania, for which construction was completed in fiscal 2020. The center primarily stores and distributes home products, homefurnishings and electronics for the Retail segment.
We own and operate a 1,000,000 square foot fulfillment center in Gap, Pennsylvania. Primary operations at the center include Retail and Wholesale segment fulfillment services, including inventory warehousing, receivingand customer shipping.
We also own and operate a 463,000 square foot fulfillment center located in Reno, Nevada. This center is used primarily to house and distribute merchandise to our western United States digital customers.
We lease a 309,000 square foot fulfillment center located in Bristol, Pennsylvania, which is used primarily to conduct our Nuuly Rent operations. The lease commenced in fiscal 2020. In addition, this fulfillment center hasbeen recently used to support increased customer demand in the digital channel.
We own and operate an approximately 400,000 square foot omni-channel fulfillment center in Peterborough, England that supports our European stores, digital and wholesale channels. We began construction on the facilityduring fiscal 2020 and completed the installation of the remaining material handling equipment and became fully operational during fiscal 2022. We exited our distribution and fulfillment centers in Rushden, England during fiscal 2022upon completion of the omni-channel fulfillment center in Peterborough, England.
In fiscal 2021, we purchased land in Kansas City, Kansas for the development of an approximately 880,000 square foot omni-channel fulfillment center. Construction of the facility began in fiscal 2021 and is expected to befully operational during fiscal 2024. The facility will support the growth and expansion of our Retail segment business in North America by providing more efficient and faster inventory processing, as well as faster and more consistentdelivery times to our stores and digital customers. To support customer demand until the omni-channel fulfillment center is operational, we signed a short-term lease in fiscal 2022 for an approximately 401,000 square foot fulfillmentcenter located in Kansas City, Missouri.
Information Systems. We recognize the need for high-quality information to manage merchandise planning, buying, inventory management and control functions and have therefore invested in a retail software package thatmeets our processing and reporting requirements. We utilize point-of-sale register systems connected by a secure data network to our home offices. Additionally, our stores have mobile point-of-sale devices that have virtually the samefunctionality as our cash registers. These systems provide for register efficiencies, timely customer checkout and instant back office access to register information, as well as daily updates of sales, inventory data and price changes. Ourdigital channel, which includes our websites, mobile applications and catalogs, maintains separate software systems that manage the merchandise and customer information for our customer contact centers and fulfillment functions. OurWholesale segment uses a separate software system for customer service, order entry, production planning and inventory management. Nuuly Rent uses a custom-built digital platform that helps us manage merchandising functions,customer information and service, financial accounting and fulfillment of customer orders. Nuuly Thrift uses a custom-built digital platform that helps us manage peer-to-peer resale marketplace operational functions, customerinformation and service and financial accounting. We host digital and business applications across private cloud infrastructure as well as have our own fully redundant data centers, located at the Philadelphia Navy Yard and at our Renofulfillment center. All systems are fully redundant and have full disaster recovery plans either within our private cloud or our own data centers.
Competition
Our Retail and Wholesale segments compete with individual and chain fashion specialty brands as well as department stores, both in stores and online, in highly competitive domestic and international markets. Our Retailsegment competes on the basis of, among other things, the location of our stores, website, mobile application and catalog presentation, website and mobile application design and functionality, the breadth, quality, style, price andavailability of our merchandise and the level of customer service offered. Although we believe that the eclectic mix of products and the unique store and digital experiences offered by our Retail segment help differentiate us, it alsomeans that our stores compete against a wide variety of smaller, independent specialty retailers, as well as department stores and national specialty chains. Some of our competitors have substantially greater name recognition as well asfinancial, marketing and other resources. Our Anthropologie Group and Free People Group stores also face competition from small boutiques that offer an individualized shopping experience similar to the one we strive to provide toour target customers. In addition, some of our third-party vendors offer products directly to consumers and certain of our competitors.
6
Along with certain Retail segment competitive factors noted above, other key factors for our digital channel include website and mobile application availability, the effectiveness of our customer lists and the speed andaccuracy of our merchandise delivery. Additionally, our digital channel competes against numerous websites, mobile applications, catalogs and digital marketplaces, which may have a greater volume of circulation and web traffic ormore effective marketing through online media and social networking sites.
Our Wholesale segment competes with numerous wholesale companies on the basis of quality, price, performance and fashion of our merchandise offerings. Many of our Wholesale segment competitors have a wider productdistribution network. In addition, certain of our wholesale competitors have greater name recognition and greater financial, marketing and other resources than us.
Our Nuuly Rent business operates in an evolving apparel subscription rental market in which our competitors offer varying types of subscription rental models and products that may have greater appeal to consumers. OurNuuly Thrift business operates in a developing apparel and accessories resale market in which our competitors have sellers and products that may have greater appeal to customers.
Trademarks and Service Marks
We are the registered owner in the United States of certain service marks and trademarks, including, but not limited to “Urban Outfitters,” “Anthropologie,” “Free People,” “Bhldn,” “Terrain,” “BDG,” “FP Movement” and“Nuuly.” Each mark is renewable indefinitely, contingent upon continued use at the time of renewal. In addition, we currently have pending registration applications with the U.S. Patent and Trademark Office covering certain othermarks. We also own marks that have been registered in foreign countries, and have applications for marks pending in additional foreign countries. We regard our marks as important to our business due to their name recognition with ourcustomers. We are not aware of any valid claims of infringement or challenges to our right to use any of our marks in the United States.
Human Capital
The Company strives to build a unique creative culture capable of growing strong, customer-centric brands. We seek to foster an inclusive environment where our employees unite to communicate with integrity, respect ourplanet, our world and each other, build our future through creative entrepreneurship and nurture meaningful connections with customers and each other.
Employees. As of January 31, 2022, we employed approximately 23,000 people, approximately 42% of whom were full-time employees. The number of part-time employees fluctuates depending on seasonal needs. Of ourtotal employees, approximately 1% work in the Wholesale segment, 2% work in the Nuuly segment and the remaining 97% work in our Retail segment. Except in certain international locations, our employees are not covered by acollective bargaining agreement. We believe that our relations with our employees are excellent.
Talent Acquisition, Development and Retention. The Company aims to be the leading destination for creative and entrepreneurial talent in the specialty fashion market. Hiring, retaining and developing talented employees iscritically important to our operations. Our talent strategy is focused on attracting the best employees, recognizing and rewarding their performance, and continually developing, engaging and retaining them. The future success of ourbusiness initiatives relies heavily on our employees. By combining a robust internal pipeline of existing talent through development initiatives and external attraction, we believe we are positioned to drive high levels of performance,engagement and retention. We continue to invest in resources that encourage our employees to be active participants in the navigation of their careers. Through the alignment of functional expertise, training, mentorship and coaching,we believe we have created an environment that allows our employees to excel. We invest in our employees through accessible resources and structured training programs that offer all employees opportunities for development. Wecreate, manage or offer a large collection of courses for employees that cover a range of subjects such as onboarding, diversity and inclusion fundamentals, tactical tools to support completion of job functions, support for compliance,well-being and a respectful workplace, skills and tools to lead with confidence, inspire and connect authentically and courses to build skills and knowledge to support sound judgment and strong decision-making. We deliver training toemployees through live in-person and virtual classes, pre-recorded self-led written, audio and video courses and curated on demand courses from third-party platforms such as LinkedIn Learning.
Compensation, Benefits and Wellness. We aim to offer competitive compensation and category leading benefits to our employees. Varying by level, our compensation strategy is built around providing a mix of salary or hourlypay, cash based short-term incentives, and equity based long-term incentives to employees. In addition, we offer a comprehensive suite of health and retirement benefits, including medical, dental and prescription drug coverage, as wellas paid parental leave, 401(k) matching contributions and a generous employee discount. Our home office in Philadelphia, Pennsylvania includes a state-of-the-art fitness center, walkable river paths, and spacious dog parks, fosteringemployee health, wellness, and engagement. Following our experience with remote work during the COVID-19 pandemic, depending on business needs, individual performance, and other factors, we permit employees to work under a“hybrid” mix of in-person and remote work, fully in-office or fully remote positions as necessary to meet business needs while providing employees flexibility to match their own preferences.
7
Diversity and Inclusion. We are committed to creating and maintaining an inclusive culture that values and respects diversity of all kinds. Women hold key leadership positions throughout the Company, including positions onour Board of Directors and executive team. Our diversity and inclusion commitments focus on building an inclusive community, finding and developing the best talent possible and supporting our local communities. In July 2020, wecreated a Diversity & Inclusion Committee that is tasked with reporting and recommending actions aligned to those commitments to our executive team. In 2021, based on a recommendation from the Diversity & Inclusion Committee,we worked with employees to create a suite of Employee Resource Groups (“ERGs”). Our ERGs empower employees to share their voices, ideas and passions with the Diversity & Inclusion Committee and the Company community atlarge. In addition to the ERG’s, the executive team has engaged in the design and implementation of a listening strategy, which includes an all-company engagement survey, expanded new hire touchpoints, and the ability to deployfollow up pulse surveys as needed. We include diversity and inclusion initiatives as bonus goals for members of the executive team to drive progress to our goals. We have offered bias training to our entire field and home officeorganization and fulfillment center management. We have integrated diversity and inclusion fundamentals training into the onboarding experience for all home office employees, as well as field and fulfillment center salaried new hiresand have engaged with various organizations to support our talent acquisition and development efforts in this space. In fiscal 2023, the Diversity & Inclusion Committee will continue partnering with the Company’s executive leadershipto support and engage our diverse employees and expand the pool of available diverse talent in the fashion industry.
Human Capital Oversight. The Board of Directors, as well as the Compensation and Leadership Development Committee (the “Compensation Committee”), oversee human capital issues. The Compensation Committee hasformal oversight over the Company’s policies and strategies relating to its human capital management including policies, processes and strategies relating to employee recruitment, retention and development, workforce diversity andworkplace and employment practices. The Compensation Committee regularly receives reports on talent, succession planning and diversity and inclusion. On a quarterly basis, the Compensation Committee receives a talent dashboardwith key metrics including employee survey feedback and turnover information. The Compensation Committee engages periodically on compensation program design for employees at various levels.
Financial Information about Operations
We aggregate our operations into three reportable segments, the Retail segment, the Wholesale segment and the Nuuly segment. See Note 17, “Segment Reporting,” in the Notes to our Consolidated Financial Statementsincluded in this Annual Report on Form 10-K for additional information.
Financial Information about Geographical AreasSee Note 17, “Segment Reporting,” in the Notes to our Consolidated Financial Statements included in this Annual Report on Form 10-K for information regarding net sales and long-lived assets from domestic and foreign
operations.
SeasonalityOur business is subject to seasonal fluctuations in net sales and net income, with a more significant portion typically realized in the second half of each year predominantly due to the year-end holiday period. Historically, and
consistent with the retail industry, this seasonality also impacts our working capital requirements, particularly with regard to inventory. Item 1A. Risk Factors Macroeconomic and Industry Risks
The Coronavirus pandemic has and will continue to materially and adversely affect our business operations globally.
The continuing impacts of the COVID-19 pandemic are highly unpredictable and volatile and are affecting certain business operations, demand for our products and services, in-stock positions, costs of doing business,availability of labor, access to inventory, supply chain operations, our ability to predict future performance, and our financial performance, among other things.
The pandemic has resulted in widespread and continuing impacts on the global economy and on our employees, customers, suppliers and other people and entities with which we do business. There is considerable uncertaintyregarding the extent to which COVID-19 will continue to spread and the extent and duration of measures to try to contain the virus, such as travel bans and restrictions, quarantines, shelter-in-place orders and business and governmentshutdowns. The pandemic and any preventative or protective actions that governments may implement, or we may take to protect the health and safety of our employees and customers, may result in business disruption, reducedcustomer traffic and reduced sales in certain merchandise categories, and increased operating expenses.
The pandemic continues to impact the global supply chain, with restrictions and limitations on business activities causing disruption and delay, which have strained certain domestic and international supply chains, and couldcontinue to negatively affect the flow or availability of certain products. Customer demand for certain products has and may continue to fluctuate as the pandemic progresses and customer behaviors change, which may challenge ourability to anticipate and/or adjust inventory levels to meet that
8

demand. Similarly, increased demand for online purchases of products has impacted our fulfillment operations, resulting in delays in deliveries and lost sales from being out of stock for certain SKUs.
Failure to appropriately respond, or the perception of an inadequate response to evolving events around the pandemic could cause reputational harm to our brand and subject us to lost sales, as well as claims from employees,customers, suppliers, regulators or other parties. Additionally, a future outbreak of confirmed cases of COVID-19 in our facilities could result in temporary or sustained workforce shortages or facility closures, which would negativelyimpact our business and results of operations. Some jurisdictions have taken measures intended to expand the availability of workers compensation or to change the presumptions applicable to workers compensation measures. Theseactions may increase our exposure to claims and increase our costs.
Other factors and uncertainties include, but are not limited to:
• The severity and duration of the pandemic, including future mutations or related variants of the virus in areas in which we operate; • Evolving macroeconomic factors, including general economic uncertainty, inflation, unemployment rates, and recessionary pressures; • Changes in labor markets affecting us and our suppliers; • Unknown consequences on our business performance and initiatives stemming from the substantial investment of time and other resources to the pandemic response; • The pace of recovery when the pandemic subsides; • The long-term impact of the pandemic on our business, including consumer behaviors; and • Disruption and volatility within the financial and credit markets.
To the extent that COVID-19 continues to adversely affect the U.S. and global economy, our business, results of operations, cash flows, or financial condition, it may also heighten other risk factors included elsewhere withinthis “Risk Factors” section of our Form 10-K. See Item 7: Management’s Discussion and Analysis of Financial Condition and Results of Operations—Overview—Current Trends for further discussion.
Our reportable segments are sensitive to economic conditions (including inflation), market disruptions and other factors that affect consumer confidence and discretionary spending.
Consumer purchases and rentals of discretionary retail items and specialty retail products, including our products, may decline during recessionary periods and also may decline at other times when disposable income islower. A prolonged economic downturn, including any such downturn occurring as a result of COVID-19, could have a material adverse impact on our business, financial condition or results of operations.
Economic conditions, both on a global level and in particular markets, may have significant effects on consumer confidence and discretionary spending that would in turn, affect our business or the retail industry generally.Some of these economic conditions include inflation, wages and employment, consumer debt, reductions in net worth based on severe market declines, residential real estate and mortgage markets, taxation, fuel and energy prices,interest rates, volatility in credit markets, credit availability, political and economic crises and other macroeconomic factors. These factors may affect consumer purchases and rentals of our merchandise and adversely impact our resultsof operations and continued growth. The economic conditions may also affect department stores and specialty retail businesses and impact their ability to purchase merchandise from our Wholesale segment. It is difficult to predict nearterm and/or future economic, capital and credit market conditions and what impact they will have on our business.
In addition, there is a risk that consumer confidence may decline as a result of market disruptions caused by severe weather conditions, unseasonable weather, or natural disasters, including as a result of climate change, healthhazards, actual or threatened health epidemics and pandemics (such as COVID-19), terrorist activities, political crises or other major events or the prospect of these events, which could negatively impact our financial position andresults of operations. The recovery we receive under any insurance we maintain for these purposes may be delayed or may be insufficient to fully offset potential losses.
9

We rely heavily on our ability to identify changes in fashion.
Customer tastes and fashion trends are volatile and can change rapidly. Our success depends in part on our ability to effectively predict and respond to changing fashion tastes and consumer demands, and to translate markettrends into appropriate, saleable product offerings. If we are unable to predict or respond to changing styles or trends successfully or if we misjudge the market for products or new product lines, our sales may be impacted and we maybe faced with a substantial amount of unsold inventory or missed opportunities. In response, we may be forced to rely on additional markdowns or promotional sales to dispose of excess, slow-moving inventory, which could decreaseour revenues or gross profit margins. Conversely, if we underestimate consumer demand for our merchandise, our manufacturers fail to supply quality products in a timely manner, or we experience transportation capacity constraintsand delays, we may experience inventory shortages, which may negatively impact customer relationships, diminish brand loyalty and result in lost sales. In addition, we could be at a competitive disadvantage if we are unable toleverage data analytics to obtain timely customer insights to appropriately respond to customer demands.
Compared to our Retail and Nuuly segments, our Wholesale segment is more sensitive to changes in fashion trends because of longer lead times in the manufacturing and sale of its apparel. Our fashion decisions, ifunsuccessfully forecasted, constitute a material risk and may have an adverse effect on our financial condition and results of operations.
Existing and increased competition in the specialty retail, wholesale apparel and apparel subscription rental industries may reduce our net revenues, profits and market share.
The specialty retail and wholesale apparel industries are each highly competitive. Our Retail segment competes on the basis of, among other things, the location of our stores, website, mobile application and catalogpresentation, website and mobile application design, the breadth, quality, style, price and availability of our merchandise and the level of customer service offered. Our Anthropologie Group and Free People Group stores also facecompetition from small boutiques that offer an individualized shopping experience similar to the one we strive to provide to our target customers.
Additionally, the internet and other technologies facilitate competitive entry and comparison shopping in our Retail and Nuuly segments. Our digital channel competes against numerous websites, mobile applications andcatalogs, which may have a greater volume of circulation and web traffic or more effective marketing through online media and social networking sites. We offer an omni-channel shopping experience for our customers and use socialmedia and mobile applications as a way to interact with them to enhance their shopping experiences. Omni-channel retailing is constantly evolving, and we must keep pace with changing customer expectations and new developmentsby our competitors. There is no assurance that we will be able to continue to successfully maintain or expand our digital sales channels and respond to shifting consumer traffic patterns and digital buying trends. Our inability toadequately respond to these risks and uncertainties or successfully maintain and expand our digital business could have an adverse impact on our results of operations.
In addition, some of our third-party vendors offer products directly to consumers and certain of our competitors. Our Wholesale segment competes with numerous wholesale companies, many of whose products have a widerdistribution, based on the quality, fashion and price of its product offerings. Our Nuuly Rent business operates in an evolving apparel subscription rental market in which our competitors offer varying types of subscription rental modelsand products that may have greater appeal to consumers. Our Nuuly Thrift business operates in a developing apparel and accessories resale market in which our competitors have sellers and products that may have greater appeal toconsumers. New competitors frequently enter, and existing competitors enter or increase their presence in, the markets in which we operate, expand their merchandise offerings, add new sales channels or change their pricing strategies,all of which affect the competitive landscape. In addition, many of our competitors have greater name recognition and greater financial, marketing and other resources than us.
We cannot assure you that we will continue to be able to compete successfully against existing or future competitors. Changing economic and retail environments may result in our competitors forcing a markdown orpromotional sales environment, which could impair our ability to achieve our historical profit margins. Our expansion into markets served by our competitors and entry of new competitors or expansion of existing competitors into ourmarkets could have a material adverse effect on our business, financial condition and results of operations.
Our business depends on effective marketing and high customer traffic.We have many initiatives in our marketing programs particularly with regard to our websites, mobile applications and our social media presence. If our competitors increase their spending on marketing, if our marketing
expenses increase, if our marketing becomes less effective than that of our competitors, or if we do not adequately leverage technology and data analytics capabilities needed to generate concise competitive insight, we could experiencea material adverse effect on our results of operations. Among other factors, (1) a failure to sufficiently innovate or maintain effective marketing strategies and (2) U.S. and foreign laws and regulations that make it more difficult orcostly to digitally market, such as the European Union General Data Protection Regulation (“GDPR”) and the California Consumer Privacy Act of 2018 (“CCPA”), may adversely impact our ability to maintain brand relevance anddrive increased sales. Further, consumer concerns with COVID-19 may continue, which will likely continue to adversely affect foot traffic to our stores.
10

We rely significantly on international sources of production.
We receive a substantial portion of our apparel and other merchandise from foreign sources, both purchased directly in foreign markets and indirectly through domestic vendors with foreign sources. The majority of thesepurchases are settled in U.S. dollars. To the extent that our vendors are located overseas or, in the case of third-party vendors, rely on overseas sources for a large portion of their products, the following risks may adversely impact ourbusiness: • Any event causing a disruption of imports, including the imposition of increased security or regulatory requirements applicable to imported goods, war, public health concerns (including COVID-19), acts of terrorism,
natural disasters and port security considerations or labor disputes; • New initiatives may be proposed that may have an impact on the trading status of certain countries and may include retaliatory duties or other trade sanctions that, if enacted, could increase the cost of products
purchased from suppliers in such countries or restrict the importation of products from such countries; • Changes to U.S. and foreign trade policies, including the enactment of tariffs, border adjustment taxes, changes resulting from Brexit or increases in duties or quotas applicable to the products we sell that could increase
the cost and reduce the supply of products available to us; • Changes resulting from the Russian invasion of Ukraine in February 2022 and from the related sanctions imposed by the United States, the European Union and others; • Changes resulting from the United States-Mexico-Canada Agreement (USMCA); • Significant labor issues, such as strikes or shortage of workers to manage inbound vessels at any of our ports in the United States, which could make it difficult or impossible for us to bring foreign-sourced products
into the United States; • Financial or political instability in any of the countries in which the products we purchase are manufactured, if the instability affects the production or export of merchandise from those countries; • A significant disruption in the supply of the fabrics or raw materials used by our vendors in the manufacture of our products, as our vendors may not be able to locate alternative suppliers of materials of comparable
quality at an acceptable price, or at all; • Fluctuation in the prices of raw materials, such as cotton and synthetic fabrics, as increases in such costs can increase the cost of merchandise and potentially lead to reduced consumer demand or reduced margins; • The shortage of transportation capacity (such as the availability of inbound ocean containers and vessels, cargo space for inbound airplanes, and trucks to transport products from ports to our distribution facilities) can
result in transportation cost premiums and also delay delivery of merchandise to our distribution facilities leading to an increase in markdowns both of which can adversely affect our gross profit; • The cost of fuel is a significant component in transportation costs; therefore, increases in petroleum prices can adversely affect our gross profit; • Increased regulation related to environmental costs, such as carbon taxes and emissions management systems, which could adversely affect our costs of doing business, including utility, transportation and logistics
costs; and • Decreases in the value of the U.S. dollar relative to foreign currencies could increase the cost of products we purchase from overseas vendors.
Our operating results fluctuate from period to period.Our business experiences seasonal fluctuations in net sales and operating income, with a more significant portion of net income typically realized in the second half of each year predominantly due to the year-end holiday
period. Historically, and consistent with the retail industry, this seasonality also impacts our working capital requirements, particularly with regard to inventory. Any decrease in sales or gross profit during this period, or in theavailability of working capital needed in the months preceding this period, could have a more material adverse effect on our business, financial condition and results of operations than in other periods. Seasonal fluctuations also affectour inventory levels, as we usually order merchandise in advance of peak selling periods and sometimes before new fashion trends are confirmed by customer purchases. We must carry a significant amount of inventory, especiallybefore the holiday selling periods. If we are not successful in selling our inventory during this period, we may be forced to rely on markdowns or promotional sales to dispose of the excess inventory or we may not be able to sell theinventory at all, which could have a material adverse effect on our business, financial condition and results of operations.
War, terrorism, civil unrest, other violence, or public health crises may negatively impact availability of merchandise and/or otherwise adversely impact our business.In the event of war (including the recent invasion of Ukraine by Russia), terrorism, civil unrest or other violence, our ability to obtain merchandise available for sale in our stores or on our websites may be negatively
impacted. A substantial portion of our merchandise is imported from other countries, see “We rely significantly on international sources of production.” If commercial transportation is curtailed or substantially delayed, our business maybe adversely impacted, as we may have difficulty shipping merchandise to our distribution and fulfillment centers and stores, as well as fulfilling catalog, website and mobile application orders.
11

Our stores are located in public areas where large numbers of people typically gather. Terrorist attacks, threats of terrorist attacks, civil unrest, or health epidemics and pandemics (such as COVID-19) involving public areas could causepeople not to visit areas where our stores are located. In addition, other types of violence in malls or in other public areas could lead to lower customer traffic in areas in which we operate stores. If any of these events were to occur, wemay be required to suspend operations in some or all of our stores in the impacted areas, as the COVID-19 pandemic required us to do, which could have a material adverse impact on our business, financial condition and results ofoperations.
Strategic Risks
We may not be successful in expanding our business, executing our omni-channel strategy, opening new retail stores or extending our existing store leases.
The retail environment is rapidly evolving with customer shopping preferences continuing to shift to digital channels. We have made significant investments in capital spending and labor to develop our omni-channel strategypursuant to which all available Company-owned Retail segment shopping channels are fully integrated, including stores, websites, mobile applications, catalogs and customer contact centers. As omni-channel retailing continues togrow and evolve, our customers increasingly interact with our brands through a variety of media, including smart phones and tablets, and expect seamless integration across all touchpoints. Our success depends on our ability tointroduce innovative means of engaging our customers and our ability to respond to shifting consumer traffic patterns and digital buying trends. There is no assurance that we will be able to continue to successfully maintain or expandour digital sales channels and omni-channel initiatives, or that we will realize a return on our significant investments, and failure to adequately respond to these risks and uncertainties or to successfully maintain and expand our digitalbusiness may have an adverse impact on our results of operations.
Our growth strategy also depends on our ability to open and operate new retail stores on a profitable basis and to effectively extend our existing store leases. There can be no assurance that these stores will achieve long termsuccess. Further, our operating complexity will increase as our store base grows, and we may face challenges in managing our future growth. Such growth will require that we continue to expand and improve our operating capabilities,and expand, train and manage our employee base. We may be unable to hire and train a sufficient number of qualified personnel or successfully manage our growth.
Our expansion prospects also depend on a number of other factors, many of which are beyond our control, including, among other things, competition, the availability of financing for capital expenditures and working capitalrequirements and the availability of suitable sites for new store locations on acceptable lease terms. There can be no assurance that we will be able to achieve our store expansion goals, nor is there any assurance that our newly openedstores will achieve revenue or profitability levels comparable to those of our existing stores in the time periods estimated by us, or at all. If our stores fail to achieve, or are unable to sustain, acceptable revenue, profitability and cashflow levels, we may incur additional store asset impairment charges, significant costs associated with closing those stores or both, which could adversely affect our results of operations and financial condition.
We may not be successful expanding our business internationally and our ability to conduct business in international markets may be adversely affected by legal, regulatory, political, economic, and public health risks.Our current growth strategy includes plans to continue to open new stores, expand our digital marketing and grow our wholesale customer base and retail and digital presence internationally over the next several years. As we
seek to expand internationally, we face competition from more established international competitors. In addition, international stores and digital operations have different operational characteristics, including employment and labor,transportation, logistics, real estate and legal requirements. Furthermore, consumer demand and behavior, as well as tastes and purchasing trends may differ internationally, and as a result, sales of our merchandise may not be successful,or the margins on those sales may not be in line with those we anticipate. Additionally, our ability to conduct business internationally may be adversely impacted by political, economic, and public health risks (such as the COVID-19pandemic), as well as the global economy. Any challenges that we encounter as we expand internationally may divert financial, operational and managerial resources from our existing operations, which could adversely impact ourfinancial condition and results of operations.
To the extent we expand internationally under franchise or joint venture arrangements, we may face counterparty and/or operational risk. In addition, we are increasingly exposed to foreign currency exchange rate risk withrespect to our revenue, profits, assets and liabilities denominated in currencies other than the U.S. dollar. We currently do not utilize hedging instruments to mitigate these foreign currency risks. In the future, however, we may initiatestrategies to hedge certain foreign currency risks that may not succeed in offsetting all of the negative impact of foreign currency exchange rate movements on our business and results of operations.
As we continue to expand our international operations, we are subject to certain U.S. laws, including the Foreign Corrupt Practices Act, as well as the laws of the foreign countries in which we operate, including the U.K.Bribery Act. We are required to ensure compliance with these laws. Violations of these laws could subject us to sanctions or other penalties that could negatively affect our reputation, business and operating results.
The United Kingdom recently withdrew as a member of the European Union, commonly referred to as “Brexit,” effective January 31, 2020. In December 2020, the United Kingdom and the European Union entered into anagreement that defines their future
12

relationship, including terms of trade, which will result in new tariffs on goods imported to the United Kingdom from the European Union that were manufactured elsewhere, as well as require additional administrative effort to importand export goods, adding friction and cost to transportation. Brexit could also result in similar referendums or votes in other European countries in which we do business. The United Kingdom’s withdrawal could adversely impactconsumer and investor confidence, particularly in the United Kingdom, and the level of consumer purchases of discretionary items and retail products, including our products. Any of these effects, among others, could materiallyadversely affect our business, results of operations, and financial condition.
We may not be successful in introducing additional store concepts or brands.We may, from time to time, seek to develop and introduce new concepts or brands in addition to our established brands. Our ability to succeed in the early stages of new concepts could require significant capital expenditures
and management attention. Additionally, any new concept is subject to certain risks, including customer acceptance, competition, product differentiation, challenges relating to economies of scale in merchandise sourcing and the abilityto attract and retain qualified personnel, including management and designers. There can be no assurance that we will be able to develop and grow these or any other new concepts to a point where they will become profitable, orgenerate positive cash flow. If we cannot successfully develop and grow these new concepts, our financial condition and results of operations may be adversely impacted.
We may develop new concepts through acquisitions, and we may not be successful in integrating those acquisitions.
Acquisitions involve numerous risks, including the diversion of our management’s attention from other business concerns, the possibility that current operating and financial systems and controls may be inadequate to dealwith our growth and the potential loss of key employees.
We also may encounter difficulties in integrating any businesses we may acquire with our existing operations. The success of these transactions depends on our ability to successfully merge corporate cultures, operations andfinancial systems; realize cost reduction synergies; and, as necessary, retain key personnel of acquired companies.
In addition, there may be liabilities that we fail, or are unable, to discover in the course of performing due diligence investigations on any company that we may acquire, or have recently acquired. Also, there may beadditional costs relating to acquisitions including, but not limited to, possible purchase price adjustments. Any of our rights to indemnification from sellers to us, even if obtained, may not be enforceable, collectible or sufficient inamount, scope or duration to fully offset the possible liabilities associated with the business or property acquired. Any such liabilities, individually or in the aggregate, could have a material adverse effect on our business and financialcondition.
Operational Risks
We rely on information technology systems, and a material disruption or failure of such systems could adversely affect our business.The efficient operation and successful growth of our business depends upon our information systems, including our ability to operate, maintain and develop them effectively. A failure of those systems could disrupt our
business, subject us to liability, damage our reputation or otherwise impact our financial results.
Our operations, in particular our digital sales, are subject to numerous risks, including reliance on third-party computer hardware/software, rapid technological change, liability for online content, violations of state or federallaws, including those relating to online privacy, credit card fraud, risks related to the failure of the information technology systems that operate our websites, including computer viruses, telecommunications failures and electronicbreak-ins and similar disruptions. The potential issues associated with implementing technology initiatives and the time and resources required in seeking to optimize the benefits of new elements of our systems and infrastructure couldreduce the efficiency of our operations in the short term.
We regularly evaluate our information technology systems and have implemented modifications and/or upgrades to the information technology systems that support our business. Modifications include replacing legacysystems with successor systems, making changes to legacy systems or acquiring new systems with new functionality. There are inherent risks associated with replacing and modifying our information technology systems, includinginaccurate system information and system disruptions, which we may not be able to alleviate through testing, training, staging implementation and in-sourcing certain processes, or by securing appropriate commercial contracts withthird-party vendors supplying such replacement and redundancy technologies; however, we may not be effective in identifying and mitigating every risk to which we are exposed. Further, if our information systems or othertechnologies are damaged or cease to function properly, we may have to make a significant investment to fix or replace them, and we may suffer loss of critical data and interruptions or delays in our operations in the interim. Althoughwe have not experienced any interruptions or shutdowns of our systems for any material length of time for the reasons described above, such disruptions could lead to delays in our business operations and, if significant, affect our salesand profitability.
13
If we are unable to safeguard against security breaches with respect to our information technology systems, our business and our reputation may be adversely affected.
During the course of business, we obtain and transmit confidential customer, employee, vendor and Company information through our information technology systems. The protection of customer, employee, vendor andCompany data is critical. Although we have implemented systems and procedures that are designed to protect customer, employee, vendor and Company information, prevent data loss and other security breaches, and otherwise identify,assess, and analyze cybersecurity risks, these measures may not be effective. Development and maintenance of these systems is costly and requires ongoing monitoring and updating as technologies change and efforts to overcomesecurity measures increase and become more sophisticated.
We face an evolving threat landscape in which cybercriminals, among others, employ an increasingly complex array of techniques designed to access personal data and other information, including, for example, the use offraudulent or stolen access credentials, malware, ransomware, phishing, denial of service, supply chain and other types of attacks. Our and our suppliers’ and service providers’ information technology systems also may be damaged ordisrupted, or personal or sensitive information compromised, from a number of other causes, including power outages, system failures, catastrophic events, or employee inadvertence.
While, to the best of our knowledge, we have not experienced any material misappropriation, loss or other unauthorized disclosure of confidential or personally identifiable information as a result of a security breach or cyberattack that could materially increase financial risk to the Company or our customers, such a security breach or cyber attack could adversely affect our business and operations, including by damaging our reputation and our relationshipswith our customers, employees and investors, exposing us to litigation, fines, penalties or remediation costs and inhibiting our ability to accept debit and credit cards as forms of payment. Further, because many of our corporate andshowroom employees are working hybrid office and remote schedules in light of COVID-19, our business may be more vulnerable to cybersecurity breach attempts due to offsite working by employees, increased use of public Wi-Fiand use of office equipment off premises. In addition, this period of uncertainty could result in an increase in phishing and other scams, fraud, money laundering, theft and other criminal activity.
Our efforts to protect customer, employee, vendor and Company information may also be adversely impacted by data security or privacy breaches that occur at our third-party vendors or unrelated third parties. While webelieve we are diligent in selecting vendors, systems and procedures to enable us to maintain the integrity of our systems, we recognize that there are inherent risks and we cannot assure that any future interruptions, shutdowns orunauthorized breaches or disclosures will not occur.
The regulatory environment surrounding information security and privacy is demanding, with the frequent imposition of new and changing requirements, such as the GDPR and CCPA. With a heightened degree of publicawareness and scrutiny regarding information security and privacy, customers have a high expectation that companies will adequately protect their personal information from cyber attack or other security breaches.
We depend on key personnel and may not be able to retain or replace these employees or recruit additional qualified personnel, which could adversely impact our business.We believe that we have benefited substantially from the leadership and experience of our senior executives, including our co-founder, Chairman of the Board and Chief Executive Officer, Richard A. Hayne. The loss of the
services of any of our senior executives could have a material adverse effect on our business and prospects, as we may not be able to find suitable management personnel to replace departing executives on a timely basis. In addition, ifour senior executives do not fully integrate within the structure of our management team and core business, we may be adversely affected. We do not have an employment agreement with our Chief Executive Officer or most other keypersonnel. In addition, as our business expands, we believe that our future success will depend greatly on our continued ability to attract and retain highly skilled and qualified personnel. There is a high level of competition forpersonnel in the retail industry. Our inability to meet our staffing requirements in the future could impair our ability to increase revenue and could otherwise harm our business.
Increases in labor costs, including wages, could adversely impact our operational results, financial condition and results of operations.
Our retail store and distribution and fulfillment center operations are subject to laws governing such matters as minimum wages, working conditions and overtime pay. As minimum wage rates increase or related laws andregulations change, we may need to increase not only the wage rates of our minimum wage employees, but also the wages paid to our other hourly or salaried employees. Any increase in the cost of our labor could have an adverseeffect on our operating results, financial condition and results of operations. In addition, we operate in a competitive labor market, in which wage actions by other retailers and companies may require us to increase salary and wagerates, bonuses and other incentives in order to attract and retain talented employees across all of our retail store, distribution and fulfillment center, showroom and home office operations. Labor shortages and increased employeeturnover could also increase our labor costs. This in turn could lead us to increase prices, which could adversely impact our sales. We are also subject to risks related to other store and distribution and fulfillment center expenses andoperational costs. Conversely, if competitive pressures or other factors prevent us from offsetting increased labor costs by increases in prices, our profitability may decline.
14
Damage or disruption to our distribution or fulfillment centers could have material adverse effects on our operations.
We operate seven distribution and fulfillment centers worldwide to support our Retail and Wholesale segments in the United States, Europe and Canada, including the fulfillment of catalog, website and mobile applicationorders around the world. The merchandise purchased for our United States and Canadian retail store operations is managed by our distribution centers in Gap, Pennsylvania; Reno, Nevada; and Kansas City, Missouri. Merchandisepurchased for our digital operations is managed by our fulfillment centers in Gap, Pennsylvania; Reno, Nevada; and Indiana, Pennsylvania. Merchandise purchased for our wholesale operations is managed by our fulfillment centers inGap, Pennsylvania and Peterborough, England. The merchandise purchased for our Europe retail and digital operations is managed by our omni-channel fulfillment center in Peterborough, England. Merchandise purchased for ourNuuly Rent business is managed by our fulfillment center in Bristol, Pennsylvania. Damage to, or disruption of the operations at, any of these centers due to work stoppages, system failures, accidents, economic conditions, severeweather or natural disasters, including as a result of climate change, demographic and population changes, health epidemics and pandemics (such as COVID-19), as well as other unforeseen events and circumstances could have amaterial adverse effect on our financial condition, results of operations or cash flows. In addition, if any of our distribution or fulfillment centers were to close unexpectedly or operate significantly below historical efficiency levels foran extended period of time, the other centers may not be able to support the resulting additional volume demands. As a result, we could incur significantly higher costs and longer lead times associated with distributing our products toour stores and customers during the time it takes for us to re-open or replace the center. Legal, Tax, Regulatory and Compliance Risks
We may be unable to protect our trademarks and other intellectual property rights.We believe that our trademarks and service marks are important to our success and our competitive position due to their name recognition with our customers. We devote substantial resources to the establishment and
protection of our trademarks and service marks on a worldwide basis. We are not aware of any valid claims of infringement or challenges to our right to use any of our trademarks and service marks in the United States. Nevertheless,there can be no assurance that the actions we have taken to establish and protect our trademarks and service marks will be adequate to prevent imitation of our products by others or to prevent others from seeking to block sales of ourproducts as a violation of the trademarks, service marks and intellectual property of others. Also, others may assert rights in, or ownership of, our trademarks and other intellectual property, and we may not be able to successfullyresolve these types of conflicts to our satisfaction.
In addition, we face additional risks as we continue to expand our business outside the United States. Effective trademark and service mark protection may not be available in every country in which we sell our products, orthe laws of certain foreign countries may not protect proprietary rights to the same extent as do the laws of the United States. This could increase the risk that our intellectual property is misappropriated. We may also encounterjurisdictions in which one or more third parties have a pre-existing trademark registration. This may prevent us from registering our own marks in those jurisdiction, and could adversely affect our ability to effectively operate ourbusiness or market certain products.
Manufacturers and third-party vendors may not comply with our legal and social compliance program requirements, and we may be subject to risks related to environmental, social and governance activities, whichcould adversely affect our reputation.
We have a manufacturer compliance program that is monitored on a regular basis by our buying offices. Our production facilities are either certified as in compliance with our program, or areas of improvement are identifiedand corrective follow-up action is taken. All manufacturers are required to follow applicable national labor laws, as well as international compliance standards regarding workplace safety, such as standards that require clean and safeworking environments, clearly marked exits and paid overtime. We believe in protecting the safety and working rights of the people who manufacture the products we sell, while recognizing and respecting cultural and legal differencesfound throughout the world. We require our third-party vendors to register through an online website and agree that they and their suppliers will abide by certain standards and conditions of employment. If our third-party vendors fail tocomply with our social compliance program, our reputation may be adversely affected.
We maintain an Impact Committee (which reports to our Audit Committee and is co-chaired by our Chief Sourcing Officer and Chief Administrative Officer) to set sustainability policies and goals, provide oversight of thosepolicies, and track and report progress toward our goals. The Impact Committee also maintains a functional working group, which focuses on three areas: Environmental & Social, Data Privacy & Security, and Governance. Theworking group is comprised of operational management representatives and is responsible for recommending policies and goals to the Impact Committee, implementing policies established by the Impact Committee, and tracking andreporting to the Impact Committee on progress towards goals falling within the working group’s remit. If we do not demonstrate progress towards the environmental, social and governance ideals of our customers or such actions are notperceived to be adequate, our reputation and value of our brands could be harmed, which could adversely affect our business, financial performance, and growth.
15

Changes in accounting standards and subjective assumptions, estimates and judgments by management related to complex accounting matters could significantly affect our financial results or financial condition.
Generally accepted accounting principles and related accounting pronouncements, implementation guidelines and interpretations with regard to a wide range of matters that are relevant to our business, including but notlimited to revenue recognition, leases, impairment of goodwill and intangible assets, inventory, income taxes and litigation, are highly complex and involve many subjective assumptions, estimates and judgments. Changes in these rulesor their interpretation or changes in underlying assumptions, estimates or judgments could significantly change or increase volatility of our reported or expected financial performance or financial condition. See Note 2, “Summary ofSignificant Accounting Policies,” in the Notes to our Consolidated Financial Statements included in this Annual Report on Form 10-K for a description of recent accounting pronouncements.
We could be subject to changes in tax rates, the adoption of new U.S. or international tax legislation, or exposure to additional tax liabilities.A number of factors influence our effective income tax rate, including changes in tax law, tax treaties, interpretation of existing laws, changes in generally accepted accounting principles and related accounting
pronouncements, and our ability to sustain our reporting positions on examination. Changes in any of those factors could change our effective tax rate, which could adversely affect our net income. In addition, our operations outside ofthe United States may cause greater volatility in our effective tax rate.
We are subject to numerous regulations and legal matters that could adversely affect our business.
We are subject to customs, child labor, tax, employment, privacy, truth-in-advertising, e-commerce and other laws, including consumer protection regulations and zoning and occupancy ordinances that regulate retailersgenerally and/or govern the importation, promotion and sale of merchandise and the operation of retail stores and distribution and fulfillment centers. Additional legal and regulatory requirements (such as the “conflict minerals”provisions of the Dodd-Frank Wall Street Reform and Consumer Protection Act of 2010), and the fact that foreign laws occasionally conflict with domestic laws, have increased the complexity of the regulatory environment and the costof compliance. If these laws change without our knowledge, or are violated by importers, designers, manufacturers or distributors, we could experience delays in shipments and receipt of products or be subject to fines or other penaltiesunder the controlling regulations, any of which could adversely affect our business. In addition, various governmental authorities in jurisdictions in which we do business regulate the quality and safety of the merchandise we sell. If weor our vendors are unable to comply with regulatory requirements on a timely basis or at all, or to adequately monitor new regulations that may apply to us, significant fines or penalties could be incurred or we could have to curtailsome aspects of our sales or operations, which could have a material adverse effect on our financial results.
Moreover, legal actions may be filed against us from time to time, including class actions. These actions may assert commercial, tort, intellectual property, customer, employment, data privacy, securities or other claims. Wemay also be impacted by litigation trends, including class action lawsuits involving former employees, consumers and shareholders, which could have a material adverse effect on our reputation, the market price of our common shares,or our results of operations, financial condition and cash flows.
Item 1B. Unresolved Staff Comments
We have no outstanding comments with the staff of the SEC.
Item 2. Properties
Since 2006, our North American home office has been located in several buildings on one campus in the historic core of the Philadelphia, Pennsylvania Navy Yard. The consolidated offices at the Navy Yard campus allow foran efficient operation of our Philadelphia-based offices and will help to support our growth needs for the foreseeable future. Our North American home offices are approximately 575,000 square feet, and we own or have options topurchase adjacent buildings that would allow for additional expansion if necessary.
Our three European home offices were consolidated into one location on the former Truman Brewery Site in London, England during fiscal 2020. The office is approximately 70,000 square feet and houses all of our brand andshared leadership teams as well as a wholesale showroom and photo studio. The term of this lease is set to expire in July 2029, and we have the option to renew for up to an additional 10 years.
Our North American retail stores are supported by two distribution centers. We own a 291,000 square foot distribution center in Gap, Pennsylvania, which supports approximately half of our retail store merchandise. We leasea 214,500 square foot distribution center in Reno, Nevada that supports the remaining half of our retail store merchandise. The term of this lease is set to expire in June 2027, and we have the option to renew for up to an additionaltwenty years.
We own and operate an approximately 956,000 square foot fulfillment center in Indiana, Pennsylvania, for which construction was completed in fiscal 2020. The center primarily stores and distributes certain home products,home furnishings and electronics for the Retail segment and includes a customer contact center.
16
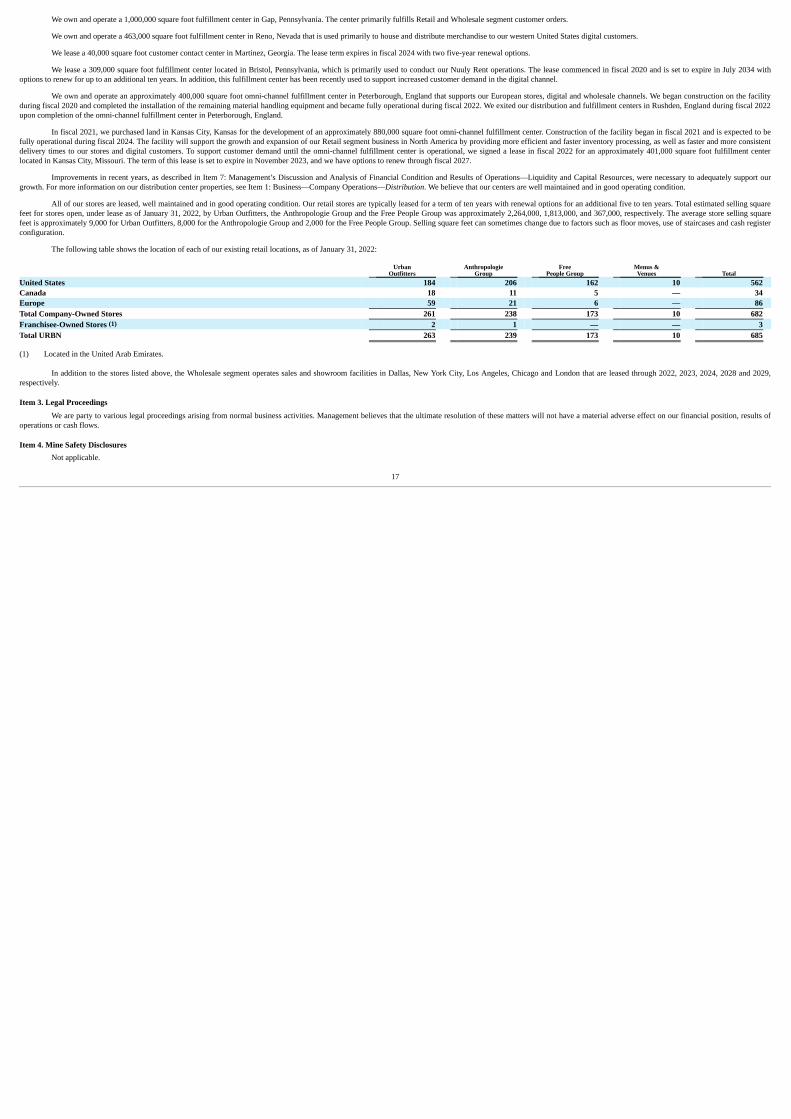
We own and operate a 1,000,000 square foot fulfillment center in Gap, Pennsylvania. The center primarily fulfills Retail and Wholesale segment customer orders.
We own and operate a 463,000 square foot fulfillment center in Reno, Nevada that is used primarily to house and distribute merchandise to our western United States digital customers.
We lease a 40,000 square foot customer contact center in Martinez, Georgia. The lease term expires in fiscal 2024 with two five-year renewal options.
We lease a 309,000 square foot fulfillment center located in Bristol, Pennsylvania, which is primarily used to conduct our Nuuly Rent operations. The lease commenced in fiscal 2020 and is set to expire in July 2034 withoptions to renew for up to an additional ten years. In addition, this fulfillment center has been recently used to support increased customer demand in the digital channel.
We own and operate an approximately 400,000 square foot omni-channel fulfillment center in Peterborough, England that supports our European stores, digital and wholesale channels. We began construction on the facilityduring fiscal 2020 and completed the installation of the remaining material handling equipment and became fully operational during fiscal 2022. We exited our distribution and fulfillment centers in Rushden, England during fiscal 2022upon completion of the omni-channel fulfillment center in Peterborough, England.
In fiscal 2021, we purchased land in Kansas City, Kansas for the development of an approximately 880,000 square foot omni-channel fulfillment center. Construction of the facility began in fiscal 2021 and is expected to befully operational during fiscal 2024. The facility will support the growth and expansion of our Retail segment business in North America by providing more efficient and faster inventory processing, as well as faster and more consistentdelivery times to our stores and digital customers. To support customer demand until the omni-channel fulfillment center is operational, we signed a lease in fiscal 2022 for an approximately 401,000 square foot fulfillment centerlocated in Kansas City, Missouri. The term of this lease is set to expire in November 2023, and we have options to renew through fiscal 2027.
Improvements in recent years, as described in Item 7: Management’s Discussion and Analysis of Financial Condition and Results of Operations—Liquidity and Capital Resources, were necessary to adequately support ourgrowth. For more information on our distribution center properties, see Item 1: Business—Company Operations—Distribution. We believe that our centers are well maintained and in good operating condition.
All of our stores are leased, well maintained and in good operating condition. Our retail stores are typically leased for a term of ten years with renewal options for an additional five to ten years. Total estimated selling squarefeet for stores open, under lease as of January 31, 2022, by Urban Outfitters, the Anthropologie Group and the Free People Group was approximately 2,264,000, 1,813,000, and 367,000, respectively. The average store selling squarefeet is approximately 9,000 for Urban Outfitters, 8,000 for the Anthropologie Group and 2,000 for the Free People Group. Selling square feet can sometimes change due to factors such as floor moves, use of staircases and cash registerconfiguration.
The following table shows the location of each of our existing retail locations, as of January 31, 2022:
Urban
Outfitters Anthropologie
Group Free
People Group Menus &Venues Total
United States 184 206 162 10 562 Canada 18 11 5 — 34 Europe 59 21 6 — 86 Total Company-Owned Stores 261 238 173 10 682 Franchisee-Owned Stores (1) 2 1 — — 3 Total URBN 263 239 173 10 685
(1) Located in the United Arab Emirates.
In addition to the stores listed above, the Wholesale segment operates sales and showroom facilities in Dallas, New York City, Los Angeles, Chicago and London that are leased through 2022, 2023, 2024, 2028 and 2029,respectively.
Item 3. Legal Proceedings
We are party to various legal proceedings arising from normal business activities. Management believes that the ultimate resolution of these matters will not have a material adverse effect on our financial position, results ofoperations or cash flows.
Item 4. Mine Safety DisclosuresNot applicable.
17
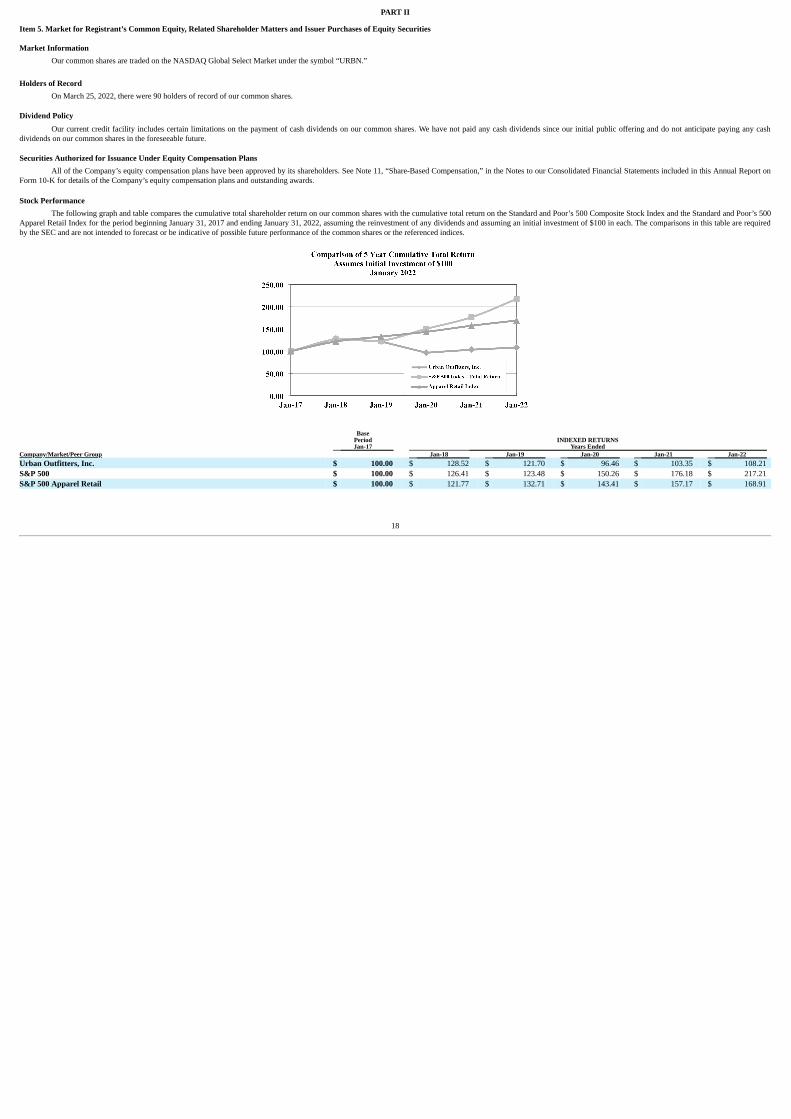
PART II
Item 5. Market for Registrant’s Common Equity, Related Shareholder Matters and Issuer Purchases of Equity Securities
Market InformationOur common shares are traded on the NASDAQ Global Select Market under the symbol “URBN.”
Holders of Record
On March 25, 2022, there were 90 holders of record of our common shares.
Dividend Policy
Our current credit facility includes certain limitations on the payment of cash dividends on our common shares. We have not paid any cash dividends since our initial public offering and do not anticipate paying any cashdividends on our common shares in the foreseeable future.
Securities Authorized for Issuance Under Equity Compensation PlansAll of the Company’s equity compensation plans have been approved by its shareholders. See Note 11, “Share-Based Compensation,” in the Notes to our Consolidated Financial Statements included in this Annual Report on
Form 10-K for details of the Company’s equity compensation plans and outstanding awards.
Stock PerformanceThe following graph and table compares the cumulative total shareholder return on our common shares with the cumulative total return on the Standard and Poor’s 500 Composite Stock Index and the Standard and Poor’s 500
Apparel Retail Index for the period beginning January 31, 2017 and ending January 31, 2022, assuming the reinvestment of any dividends and assuming an initial investment of $100 in each. The comparisons in this table are requiredby the SEC and are not intended to forecast or be indicative of possible future performance of the common shares or the referenced indices.
BasePeriodJan-17
INDEXED RETURNSYears Ended
Company/Market/Peer Group Jan-18 Jan-19 Jan-20 Jan-21 Jan-22 Urban Outfitters, Inc. $ 100.00 $ 128.52 $ 121.70 $ 96.46 $ 103.35 $ 108.21 S&P 500 $ 100.00 $ 126.41 $ 123.48 $ 150.26 $ 176.18 $ 217.21 S&P 500 Apparel Retail $ 100.00 $ 121.77 $ 132.71 $ 143.41 $ 157.17 $ 168.91
18

A summary of the repurchase of our common shares under the Company’s share repurchase programs for the quarter ended January 31, 2022 is as follows:
Period Total Number
of Shares Purchased (1) Average PricePaid Per Share
Total Numberof Shares Purchased
as Part ofPublicly
AnnouncedPlans
or Programs
MaximumNumber ofShares that
May YetBe Purchased
Under thePlans or
Programs (2) November 1, 2021 through November 30, 2021 — $ — — 25,351,954 December 1, 2021 through December 31, 2021 639,135 $ 28.55 639,135 24,712,819 January 1, 2022 through January 31, 2022 820,024 $ 27.60 820,024 23,892,795 Total Fiscal 2022 Fourth Quarter 1,459,159 1,459,159 23,892,795
(1) In addition to the shares repurchased under the share repurchase program, for the quarter ended January 31, 2022, the Company acquired and subsequently retired 3,325 common shares from employees to meet payroll
tax withholding requirements. These shares do not reduce the number of shares that may yet be purchased under our publicly announced share repurchase programs. (2) On August 22, 2017, the Company’s Board of Directors authorized the repurchase of 20,000,000 shares under a share repurchase program. On June 4, 2019, the Company’s Board of Directors authorized the repurchase
of an additional 20,000,000 shares under a share repurchase program.
Item 6. Selected Financial Data
Reserved.
19

Item 7. Management’s Discussion and Analysis of Financial Condition and Results of OperationsOverview
We operate under three reportable segments – Retail, Wholesale and Nuuly. Our Retail segment consists of our Anthropologie, Bhldn, Free People, FP Movement, Terrain, Urban Outfitters and Menus & Venues brands. OurRetail segment consumer products and services are sold directly to our customers through our retail locations, websites, mobile applications, catalogs and customer contact centers and franchisee-owned stores. The Wholesale segmentconsists of our Free People, FP Movement and Urban Outfitters brands that sell through department and specialty stores worldwide, digital businesses and our Retail segment. The Wholesale segment primarily designs, develops andmarkets apparel, intimates and activewear. Our Nuuly segment, formerly known as the Subscription segment, consists of the Nuuly brand, which offers customers with a more sustainable way to explore fashion. Nuuly Rent is amonthly women’s apparel subscription rental service that launched in July 2019. Nuuly Thrift, which launched in October 2021, is a peer-to-peer resale marketplace where customers can buy and sell women’s, men’s, and kids’ clothes,shoes and accessories from any brands.
Our fiscal year ends on January 31. All references to our fiscal years refer to the fiscal years ended on January 31 in those years. For example, our fiscal year 2022 ended on January 31, 2022, our fiscal year 2021 ended onJanuary 31, 2021, and our fiscal year 2020 ended on January 31, 2020.
Current Trends
Impact of the Coronavirus Pandemic on Fiscal 2021
In March 2020 the World Health Organization declared the novel strain of coronavirus (“COVID-19”) a global pandemic. Consequently, the Company announced that it temporarily closed all stores, offices andshowrooms globally, but began to reopen stores in late April 2020. The Company’s distribution and fulfillment centers remained open to support the digital business and the Wholesale segment operations. During the fourth quarter offiscal 2021, certain store operations were again impacted by an additional round of temporary store closures and occupancy restrictions, primarily in Europe and Canada.
In response to the COVID-19 pandemic, the Company took measures to protect its financial position and increase financial flexibility. During fiscal 2021, the Company recorded certain additional reserves, includinginventory obsolescence reserves and an allowance for doubtful accounts for Wholesale segment customer accounts receivable, and non-cash charges, primarily store impairment charges.
Impact of the Coronavirus Pandemic on Fiscal 2022
The COVID-19 pandemic continued to negatively impact the Company’s store operations during fiscal 2022 with residual impacts on store traffic and store sales resulting from store closures primarily in Europe andCanada, occupancy restrictions and reduced store hours globally. During the second quarter of fiscal 2022, all remaining COVID-19 government mandated store closures in Europe and Canada expired, although some capacityrestrictions continued in certain European and Canadian stores. The COVID-19 pandemic and general unfavorable macro-economic conditions have also disrupted the Company’s global supply chain in fiscal 2022, leading to COVID-19 related factory closures, continued port congestion and shipping delays, which have resulted in inventory receipt delays and an increase in inbound freight costs. The Company made a strategic decision to bring certain productcategories in earlier in the third and fourth quarters of fiscal 2022 in an attempt to minimize the impact of such disruptions on customer demand.
The Company continued to qualify for certain government assistance programs that partially offset related expenses in locations impacted by closures during fiscal 2022. As of the end of the second quarter of fiscal 2022,however, the programs either expired or the Company no longer qualified for such programs in the United States and Canada, and as of the end of the third quarter of fiscal 2022, the Company no longer qualified for the majority ofsuch programs in Europe. The Company recorded the benefit of the government assistance programs as an offset to selling, general, and administrative expenses or store occupancy expenses in cost of sales based on the nature of therelated expenses offset by such programs.
Impact of the Coronavirus Pandemic and Macroeconomic Uncertainties on Future Operations
The COVID-19 pandemic continues to impact the Company’s operations and related government and private sector responsive actions could continue to affect its business operations. The Company is also experiencingCOVID-19 supply chain disruptions resulting in inventory receipt delays. Furthermore, the Company expects that our operations will continue to be influenced by general economic conditions resulting from COVID-19, such as laborshortages and the impact of inflation including higher wages, increased merchandise costs and higher inbound transportation costs. The Company cannot reasonably estimate the duration and severity of the COVID-19 pandemic, whichhas had and may continue to have a material impact on its business. As a result, current financial information may not be necessarily indicative of future operating results and the Company’s plans to address the impact of the COVID-19pandemic may change. Additionally, ongoing global issues may affect our business and the global economy, including the geopolitical impact of Russia’s invasion of Ukraine and any related economic or other sanctions.
20

Retail Segment
Our Retail segment omni-channel strategy enhances our customers’ brand experience by providing a seamless approach to the customer shopping experience. All available Company-owned Retail segment shopping channelsare fully integrated, including retail locations, websites, mobile applications, catalogs and customer contact centers. Our investments in areas such as marketing campaigns and technology advancements are designed to generate demandfor the Retail segment omni-channel and not the separate store or digital channels. We manage and analyze our performance based on a single Retail segment omni-channel rather than separate channels and believe that the Retailsegment omni-channel results present the most meaningful and appropriate measure of our performance.
Our comparable Retail segment net sales data is equal to the sum of our comparable store and comparable digital channel net sales. A store is considered to be comparable if it has been open at least 12 full months, unless itwas materially expanded or remodeled within that year or was not otherwise operating at its full capacity within that year due to store specific closures from events such as damage from fire, flood and natural weather events. TheCompany did not remove stores that were closed or operating for an extended period of time at a reduced capacity due to the COVID-19 pandemic from the comparable stores net sales calculations. A digital channel is considered to becomparable if it has been operational for at least 12 full months. Sales from stores and digital channels that do not fall within the definition of comparable store or channel are considered to be non-comparable. Franchise net sales andthe effects of foreign currency translation are also considered non-comparable.
We monitor Retail segment metrics including customer traffic, conversion rates, average units per transaction at our stores and on our websites and mobile applications and average unit retail price at our stores and averageorder value on our websites and mobile applications. We believe that changes in any of these metrics may be caused by a response to our brands’ fashion offerings, our marketing campaigns, circulation of our catalogs and an overallgrowth in brand recognition.
Urban Outfitters targets young adults aged 18 to 28 through a unique merchandise mix, compelling store environment, social media and third-party digital platforms, websites and mobile applications and a product offeringthat includes women’s and men’s fashion apparel, activewear, intimates, footwear, accessories, home goods, electronics and beauty. A large portion of our merchandise is exclusive to Urban Outfitters, consisting of an assortment ofproducts designed internally and designed in collaboration with third-party brands. Urban Outfitters stores are in street locations in large metropolitan areas and select university communities, specialty centers and enclosed malls thataccommodate our customers’ propensity not only to shop, but also to congregate with their peers. Urban Outfitters operates websites and mobile applications in North America and Europe that capture the spirit of the brand by offering asimilar yet broader selection of merchandise as found in its stores and sells merchandise through franchisee-owned stores in the United Arab Emirates. Urban Outfitters’ North American Retail segment net sales accounted forapproximately 27.5% of consolidated net sales for fiscal 2022, compared to 31.3% for fiscal 2021. European and Asian Retail segment net sales accounted for approximately 9.1% of consolidated net sales for fiscal 2022, compared toapproximately 8.5% for fiscal 2021.
The Anthropologie Group consists of the Anthropologie, Bhldn and Terrain brands. Merchandise at the Anthropologie brand is tailored to sophisticated and contemporary women aged 28 to 45. The internally designed andthird-party brand product assortment includes women’s apparel, accessories, intimates, shoes, home furnishings, a diverse array of gifts and decorative items and beauty and wellness. The Bhldn brand emphasizes every element thatcontributes to a wedding. The Bhldn brand offers a curated collection of heirloom quality wedding gowns, bridesmaid frocks, party dresses, assorted jewelry, headpieces, footwear, lingerie and decorations. The Terrain brand is designedto appeal to women and men interested in a creative and sophisticated outdoor living and gardening experience. Merchandise includes lifestyle home, garden and outdoor living products, antiques, live plants, flowers, wellness productsand accessories. In addition to individual brand stores, the Anthropologie Group operates expanded format stores that include multiple Anthropologie Group brands, which allows for the presentation of an expanded assortment ofproducts in certain categories. Anthropologie Group stores are located in specialty centers, upscale street locations and enclosed malls. The Anthropologie Group operates websites and mobile applications in North America and Europethat capture the spirit of its brands by offering a similar yet broader selection of merchandise as found in its stores, offers a catalog in North America that markets select merchandise, most of which is also available in Anthropologiebrand. The Anthropologie Group’s North American Retail segment net sales accounted for approximately 37.4% of consolidated net sales for fiscal 2022, compared to 36.5% for fiscal 2021. European and Asian Retail segment net salesaccounted for approximately 2.0% of consolidated net sales for fiscal 2022, compared to approximately 1.7% for fiscal 2021.
The Free People Group consists of the Free People and FP Movement brands. The Free People brand focuses its product offering on private label merchandise targeted to young contemporary women aged 25 to 30 andprovides a unique merchandise mix of casual women’s apparel, intimates, FP Movement activewear, shoes, accessories, home products, gifts and beauty and wellness. The FP Movement brand offers performance-ready activewear,beyond-the-gym staples and wellness essentials. Free People Group stores are located in enclosed malls, upscale street locations and specialty centers. The Free People Group operates websites and mobile applications in North Americaand Europe that capture the spirit of the brand by offering a similar yet broader selection of merchandise as found in its stores, as well as substantially all of the Free People and FP Movement wholesale offerings. The Free PeopleGroup also offers catalogs that market select merchandise, most of which is also available in our Free People and FP Movement stores. The Free People Group’s North American Retail segment net sales accounted for approximately16.3% of consolidated net sales for fiscal 2022, compared to approximately 14.6% for fiscal 2021. European and Asian Retail segment net sales accounted for less than 1.0% of consolidated net sales for fiscal 2022 and fiscal 2021.
21

The Menus & Venues brand focuses on a dining experience that provides excellence in food, beverage and service. The Menus & Venues brand net sales accounted for less than 1.0% of consolidated net sales for fiscal 2022and fiscal 2021.
Net sales from the Retail segment accounted for approximately 93.4%, 93.6% and 91.6% of total consolidated net sales for fiscal 2022, 2021 and 2020, respectively.
Store data for fiscal 2022 was as follows:
January 31, Stores Stores January 31, 2021 Opened Closed 2022 Urban Outfitters
United States 174 13 (3) 184 Canada 17 1 — 18 Europe 56 3 — 59
Urban Outfitters Global Total 247 17 (3) 261 Anthropologie Group
United States 204 7 (5) 206 Canada 11 — — 11 Europe 22 2 (3) 21
Anthropologie Group Global Total 237 9 (8) 238 Free People Group
United States (1) 138 28 (4) 162 Canada 6 — (1) 5 Europe 5 1 — 6
Free People Group Global Total 149 29 (5) 173 Menus & Venues
United States 11 1 (2) 10 Menus & Venues Total 11 1 (2) 10
Total Company-Owned Stores 644 56 (18) 682 Franchisee-Owned Stores (2) 1 2 — 3 Total URBN 645 58 (18) 685
(1) 18 FP Movement stores were opened during the year ended January 31, 2022. 20 FP Movement stores were open as of January 31, 2022.
(2) Franchisee-owned stores are located in the United Arab Emirates.
Selling square footage by brand as of January 31, 2022 and January 31, 2021 was as follows:
January 31, January 31, 2022 2021 Change Selling square footage (in thousands):
Urban Outfitters 2,264 2,195 3.1%Anthropologie Group 1,813 1,815 -0.1%Free People Group (1) 367 331 10.9%
Total URBN (2) 4,444 4,341 2.4%
(1) Selling square footage for FP Movement was 25 and 2 as of January 31, 2022 and 2021, respectively. (2) Menus & Venues restaurants and franchisee-owned stores are not included in selling square footage.
We plan for future store growth for all three brands to come from expansion domestically and internationally, which may include opening stores in new and existing markets or entering into additional franchise or joint venture
agreements. We plan for future digital channel growth to come from expansion domestically and internationally.
22
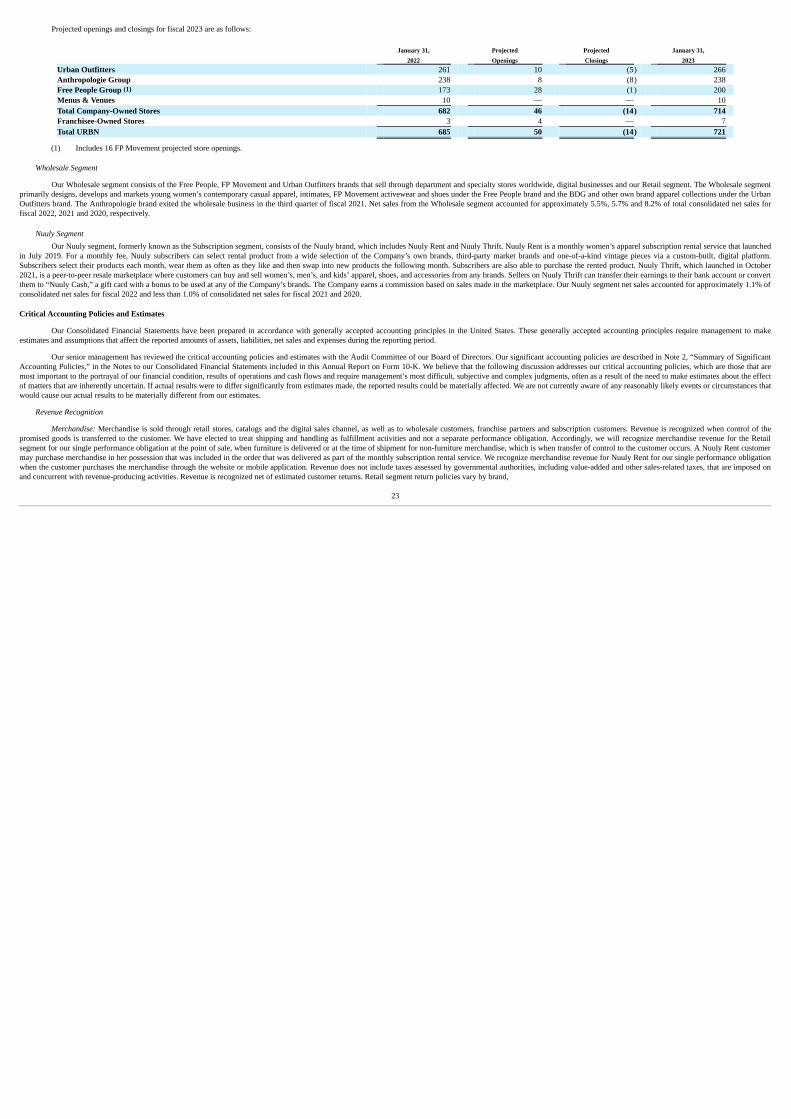
Projected openings and closings for fiscal 2023 are as follows:
January 31, Projected Projected January 31, 2022 Openings Closings 2023 Urban Outfitters 261 10 (5) 266 Anthropologie Group 238 8 (8) 238 Free People Group (1) 173 28 (1) 200 Menus & Venues 10 — — 10 Total Company-Owned Stores 682 46 (14) 714 Franchisee-Owned Stores 3 4 — 7 Total URBN 685 50 (14) 721
(1) Includes 16 FP Movement projected store openings.
Wholesale Segment
Our Wholesale segment consists of the Free People, FP Movement and Urban Outfitters brands that sell through department and specialty stores worldwide, digital businesses and our Retail segment. The Wholesale segmentprimarily designs, develops and markets young women’s contemporary casual apparel, intimates, FP Movement activewear and shoes under the Free People brand and the BDG and other own brand apparel collections under the UrbanOutfitters brand. The Anthropologie brand exited the wholesale business in the third quarter of fiscal 2021. Net sales from the Wholesale segment accounted for approximately 5.5%, 5.7% and 8.2% of total consolidated net sales forfiscal 2022, 2021 and 2020, respectively.
Nuuly SegmentOur Nuuly segment, formerly known as the Subscription segment, consists of the Nuuly brand, which includes Nuuly Rent and Nuuly Thrift. Nuuly Rent is a monthly women’s apparel subscription rental service that launched
in July 2019. For a monthly fee, Nuuly subscribers can select rental product from a wide selection of the Company’s own brands, third-party market brands and one-of-a-kind vintage pieces via a custom-built, digital platform.Subscribers select their products each month, wear them as often as they like and then swap into new products the following month. Subscribers are also able to purchase the rented product. Nuuly Thrift, which launched in October2021, is a peer-to-peer resale marketplace where customers can buy and sell women’s, men’s, and kids’ apparel, shoes, and accessories from any brands. Sellers on Nuuly Thrift can transfer their earnings to their bank account or convertthem to “Nuuly Cash,” a gift card with a bonus to be used at any of the Company’s brands. The Company earns a commission based on sales made in the marketplace. Our Nuuly segment net sales accounted for approximately 1.1% ofconsolidated net sales for fiscal 2022 and less than 1.0% of consolidated net sales for fiscal 2021 and 2020.
Critical Accounting Policies and Estimates
Our Consolidated Financial Statements have been prepared in accordance with generally accepted accounting principles in the United States. These generally accepted accounting principles require management to makeestimates and assumptions that affect the reported amounts of assets, liabilities, net sales and expenses during the reporting period.
Our senior management has reviewed the critical accounting policies and estimates with the Audit Committee of our Board of Directors. Our significant accounting policies are described in Note 2, “Summary of SignificantAccounting Policies,” in the Notes to our Consolidated Financial Statements included in this Annual Report on Form 10-K. We believe that the following discussion addresses our critical accounting policies, which are those that aremost important to the portrayal of our financial condition, results of operations and cash flows and require management’s most difficult, subjective and complex judgments, often as a result of the need to make estimates about the effectof matters that are inherently uncertain. If actual results were to differ significantly from estimates made, the reported results could be materially affected. We are not currently aware of any reasonably likely events or circumstances thatwould cause our actual results to be materially different from our estimates.
Revenue Recognition
Merchandise: Merchandise is sold through retail stores, catalogs and the digital sales channel, as well as to wholesale customers, franchise partners and subscription customers. Revenue is recognized when control of thepromised goods is transferred to the customer. We have elected to treat shipping and handling as fulfillment activities and not a separate performance obligation. Accordingly, we will recognize merchandise revenue for the Retailsegment for our single performance obligation at the point of sale, when furniture is delivered or at the time of shipment for non-furniture merchandise, which is when transfer of control to the customer occurs. A Nuuly Rent customermay purchase merchandise in her possession that was included in the order that was delivered as part of the monthly subscription rental service. We recognize merchandise revenue for Nuuly Rent for our single performance obligationwhen the customer purchases the merchandise through the website or mobile application. Revenue does not include taxes assessed by governmental authorities, including value-added and other sales-related taxes, that are imposed onand concurrent with revenue-producing activities. Revenue is recognized net of estimated customer returns. Retail segment return policies vary by brand,
23
but generally provide for no time limit on returns and the refund to be issued in either the form of original payment or as a gift card. Payment for merchandise is tendered primarily by cash, check, credit card, debit card, gift card oralternative payment methods. Uncollectible accounts receivable primarily results from unauthorized credit card transactions. We maintain an allowance for doubtful accounts for our Wholesale segment accounts receivable, which wereview on a regular basis and believe is sufficient to cover potential credit losses and billing adjustments. Payment terms in our Wholesale segment vary by customer with the most common being a net 30-day policy.
Menus & Venues: Revenue from restaurant sales and events is recognized upon completion of the service when we satisfy our single performance obligation. Customer deposits may be received in advance for events, whichrepresents a contract liability until we satisfy our performance obligation.
Subscription Fees: Revenue for Nuuly Rent is generated through monthly subscription fees and the purchase of merchandise in a customer’s possession. The monthly subscription rental fee is recognized as revenue on thedate the customer is billed. A customer may pause the monthly subscription, at which point the customer will not be billed for future months until the subscription is no longer on hold. Merchandise sales to Nuuly Rent customers arediscussed above under Merchandise.
Gift Cards: We account for a gift card transaction by recording a liability at the time the gift card is issued to the customer in exchange for consideration from the customer. At the time of issuance, we have an openperformance obligation for the future delivery of promised goods or services. The liability remains outstanding until the card is redeemed by the customer, at which time we recognize revenue. Over time, a portion of the outstanding giftcards will not be redeemed by the customer which we refer to as “breakage”. Revenue is recognized from breakage over time in proportion to gift card redemptions. Judgment is used in determining the amount of breakage revenue tobe recognized and is based on historical gift card redemption patterns. Gift card breakage revenue is included in net sales and is not material. Our gift cards do not expire.
Sales Return Reserve
We record a reserve for estimated product returns where the sale has occurred during the period reported, but the return is likely to occur subsequent to the period reported. The reserve for estimated product returns is based onour most recent historical return trends. If the actual return rate is materially different than our estimate, sales returns would be adjusted in the future. The costs of returns are recorded as a current asset rather than net with the salesreturn reserve liability. As of January 31, 2022 and 2021, reserves for estimated sales returns totaled $69.8 million and $82.0 million, representing 3.4% and 4.0% of total liabilities, respectively.
InventoryWe value our inventory, which consists primarily of general consumer merchandise held for sale, at the lower of cost or net realizable value. Cost is determined on the first-in, first-out method and includes the cost of
merchandise and import-related costs, including freight, import duties and taxes and agent commissions. A periodic review of inventory is performed in order to determine if inventory is properly stated at the lower of cost or netrealizable value. Factors we consider in our review, such as future expected consumer demand and fashion trends, current aging, current and anticipated retail markdowns or wholesale discounts and class or type of inventory, areanalyzed to determine estimated net realizable value. Criteria that we consider in our review of aging trends include average selling cycle and seasonality of merchandise, the historical rate at which merchandise has sold below costduring the prior 12 months and the value and nature of merchandise currently held in inventory and priced below original cost. A provision is recorded to reduce the cost of inventory to its estimated net realizable value, if appropriate.Any significant unanticipated changes in the factors noted above could have a significant impact on the value of our inventory and our reported operating results. Our estimates generally have been accurate, and our reserve methodshave been applied on a consistent basis. We expect the amount of our provision and related inventory to increase over time as we increase our sales. The majority of inventory at January 31, 2022 and 2021 consisted of finished goods.Raw materials and work-in-process were not material to the overall inventory value. Inventory as of January 31, 2022 and 2021 totaled $569.7 million and $389.6 million, representing 15.0% and 11.0% of total assets, respectively.
Rental ProductThe cost of our Nuuly segment rental product is amortized to cost of sales based on the cost of each unit rented, which is estimated based on the number of times the unit is expected to be rented and the cost of the rental
product. Lost, damaged and retired rental product is also charged to cost of sales. We make assumptions as to the number of times each unit can be rented. If the actual number of times a unit can be rented were to vary significantlyfrom our estimates, it could materially affect the amount of rental product amortization included in cost of sales. Rental product represented less than 1.0% of total assets as of January 31, 2022 and January 31, 2021.
Impairment of Long-lived Assets
We review the carrying values of our definite-lived, long-lived assets whenever events or changes in circumstances indicate that the carrying value may not be recoverable. Events that result in an impairment review includeplans to close a retail location, distribution or fulfillment center, a significant decrease in the operating results of a long-lived asset or significant adverse changes in the business climate. Our retail locations are reviewed for impairmentat the retail location level, which is the lowest level at which
24
individual cash flows can be identified. Newly opened retail locations may take time to generate positive operating and cash flow results. Factors such as store type (e.g., mall versus free-standing), location (e.g., urban area versuscollege campus or suburb), current marketplace awareness of our brands, local customer demographic data and current fashion trends are all considered in determining the time frame required for a retail location to achieve positivefinancial results. When events indicate that an asset may be impaired and the estimated undiscounted cash flows (based on forecasts of sales and gross profit) are less than the carrying amount of the asset, the impaired asset is adjustedto its estimated fair value and an impairment loss is recorded. The estimated fair value of the asset or asset group is based on future cash flows of the asset or asset group. For lease right-of-use assets, the Company determines theestimated fair value of the assets by comparing the discounted contractual rent payments to estimated market rent using an acceptable valuation methodology. During fiscal 2021, we recorded impairment charges for 42 retail locations,totaling $15.5 million, with a carrying value after impairment of $101.8 million primarily related to the right-of-use assets. During fiscal 2020, we recorded impairment charges for eight retail locations, totaling $14.6 million, with acarrying value after impairment of $51.9 million primarily related to the right-of-use assets.
Leases
On February 1, 2019, we adopted the Financial Accounting Standards Board (“FASB”) accounting standards update that amended the existing accounting standards for lease accounting. This update requires lessees torecognize a right-of-use asset and lease liability for both operating and finance leases. We adopted the new guidance using a modified retrospective approach at the beginning of the period of adoption.
We have operating leases for stores, distribution and fulfillment centers, corporate offices and equipment. We sublease certain properties to third parties. We have elected not to record a lease liability and right-of-use asset forleases with original terms of 12 months or less. We have elected the practical expedient to not separate non-lease components from lease components as it pertains to real estate leases.
Store leases have remaining lease terms that range from less than one year up to 15 years, some of which contain options to extend the lease for one or two 5-year periods. Payments related to a renewal period are included inthe lease liability and right-of-use asset only when we are reasonably certain that we will exercise the option to renew the lease for an extended period of time. Certain leases may contain variable lease payments such as rent based on apercentage of net sales. Variable lease payments may be subject to a breakpoint threshold of fixed rent. Variable lease payments, other than those that depend on an index or a rate, are not included in the measurement of the leaseliability. The lease liability is calculated at the present value of certain future payments, discounted using our incremental borrowing rate, which approximates the rate of interest we would pay to borrow an amount equal to the leasepayments on a fully collateralized basis over a similar term. Significant judgment is used in determining the incremental borrowing rate related to estimates for credit rating, credit spread and the impact of collateral. We developedincremental borrowing rates at a lease portfolio level. The right-of-use asset is initially equal to the value of the lease liability less any amounts received from the landlord as incentives or tenant improvement allowances.
Accounting for Income Taxes
As part of the process of preparing our Consolidated Financial Statements, we are required to estimate our income taxes in each of the tax jurisdictions in which we operate. This process involves estimating our actual currenttax obligations together with assessing temporary differences resulting from differing treatment of certain items for tax and accounting purposes, such as depreciation of property and equipment and valuation of inventories. Thesetemporary differences result in deferred tax assets and liabilities, which are included within our Consolidated Balance Sheets. We then assess the likelihood that our deferred tax assets will be recovered from future taxable income. Avaluation allowance is recognized if, based on the weight of available evidence, it is more-likely-than-not that some portion, or all, of the deferred tax asset will not be realized. In making such a determination, we consider all materialavailable positive and negative evidence, including future reversals of existing taxable temporary differences, projected future taxable income, tax-planning strategies and results of recent operations. Actual results could differ from thisassessment if adequate taxable income is not generated in future periods. Net deferred tax assets as of January 31, 2022 and January 31, 2021 totaled $69.9 million and $66.5 million, respectively, representing 1.8% and 1.9% of totalassets, respectively.
To the extent we believe that recovery of a deferred tax asset is at risk, we establish valuation allowances. To the extent we establish valuation allowances or increase the allowances in a period, we record additional income taxexpense in the Consolidated Statements of Income. Valuation allowances were $30.9 million as of January 31, 2022 and $18.7 million as of January 31, 2021. Valuation allowances are based on evidence of our ability to generatesufficient taxable income in certain foreign and state jurisdictions. In the future, if enough evidence of our ability to generate sufficient future taxable income in these jurisdictions becomes apparent, we would be required to reduce ourvaluation allowances, resulting in a reduction in “Income tax expense” in the Consolidated Statements of Income. On a quarterly basis, management evaluates the likelihood that we will realize the deferred tax assets and adjusts thevaluation allowances, if appropriate.
We record uncertain tax positions on the basis of a two-step process whereby (1) we determine whether it is more-likely-than-not that the tax positions will be sustained on the basis of the technical merits of the position and(2) for those tax positions that meet the more-likely-than-not recognition threshold, we recognize the largest amount of tax benefit that is more than 50% likely to be realized upon ultimate settlement with the related tax authority.
25

Our tax liability for uncertain tax positions contains uncertainties because we are required to make assumptions and to apply judgment to estimate the exposures associated with our various filing positions. Although webelieve that the judgments and estimates discussed herein are reasonable, actual results may differ, and we may be exposed to income tax expenses or benefits that could be material.
We consider certain earnings of non-U.S. subsidiaries to be indefinitely invested outside the United States on the basis of estimates that future United States cash generation will be sufficient to meet future United States cashneeds and our specific plans for reinvestment of those subsidiaries’ earnings. Should we decide to repatriate the foreign earnings, we would need to adjust our income tax provision in the period we determined that the earnings will nolonger be indefinitely invested outside the United States.
Accounting for Contingencies
From time to time, we are named as a defendant in legal actions arising from our normal business activities. We are required to record a reserve for estimated losses when information available prior to issuance of our financialstatements indicates that it is probable that a liability has been incurred at the date of the financial statements and the amount of the loss can be reasonably estimated. Accounting for contingencies arising from contractual disputes orlegal proceedings requires management to use its best judgment when estimating an accrual related to such contingencies. As additional information becomes known, our reserves for loss contingencies could fluctuate, thereby creatingvariability in our results of operations from period to period. Likewise, an actual loss arising from a loss contingency which significantly exceeds our reserve could have a material adverse impact on our operating results for the periodin which such actual loss becomes known. We believe that our reserves adequately reflect the anticipated final outcome of any matter currently pending against us and the ultimate settlement of such matters will not materially affect ourfinancial position or results of operations.
Share-Based CompensationAccounting for share-based compensation requires measurement of compensation cost for all share-based awards at fair value on the date of grant and recognition of compensation over the service period.
A Black-Scholes model was used to determine the fair value of our stock options granted in the fiscal year ended January 31, 2020. This model uses assumptions including the risk-free rate of interest, expected volatility of ourstock price and expected life of the awards. There were no stock options granted in the fiscal years ended January 31, 2022 and 2021. The fair value of the performance-based awards granted during fiscal 2022, 2021 and 2020 equaled thestock price on the date of the grant. We review our assumptions and the valuations provided by independent third-party valuation advisors in order to determine the fair value of share-based compensation awards at the date of grant. Theassumptions used in calculating the fair value of these share-based payment awards represent our best estimates, but these estimates involve inherent uncertainties and the application of judgment. Changes in these assumptions can materiallyaffect the fair value estimate.
Additionally, we make certain estimates about the number of awards that will become vested under performance-based incentive plans. We record expense for performance-based awards based on our current expectations ofthe probable number of awards that will ultimately vest. The estimation of awards that will ultimately vest requires judgment, and to the extent actual results or updated estimates differ from our current estimates, such amounts will berecorded as a cumulative adjustment in the period estimates are revised and could be materially different from share-based compensation expense recorded in prior periods.
We elect to account for forfeitures as they occur rather than estimate the expected forfeitures.
26

Results of Operations
As a Percentage of Net SalesBecause of the material impact COVID-19 had on our business operations in fiscal 2021, including mandated store closures, the following financial highlights have been provided as a comparison of fiscal 2022 results to
fiscal 2020. Management views the comparison of fiscal 2022 results to fiscal 2020 as a meaningful measurement of the Company’s business performance. • Total net sales increased 14.2% compared to the year ended January 31, 2020, reaching record net sales in dollars. The increase was driven by an increase in comparable Retail segment net sales, partially offset
by a decline in Wholesale segment net sales. • Gross profit rate improved to 32.8% for the year ended January 31, 2022, compared to 31.1% for the year ended January 31, 2020. The improvement was primarily driven by the lowest merchandise markdown
rates for a fiscal year and improved leverage in store occupancy expense due to the increased penetration of the digital channel in Retail segment net sales, partially offset by an increase in delivery and logisticsexpenses and lower initial merchandise markups resulting from higher inbound transportation expenses. During fiscal 2020, we also recorded impairment charges for eight retail locations, totaling $14.6million.
• As of January 31, 2022, total inventory increased by $160.2 million, or 39.1%, compared to total inventory as of January 31, 2020, primarily due to the Company continuing to bring certain product categoriesin earlier to protect against ongoing supply chain disruptions and delays and increasing inbound shipping costs.
• Selling, general and administrative expenses expressed as a percentage of net sales decreased to 23.8% for fiscal 2022, compared to 25.0% for fiscal 2020. The leverage was primarily related to disciplined storepayroll management and overall expense control and the increased penetration of the digital channel in Retail segment net sales, partially offset by deleverage in digital marketing and creative expenses to driveoverall customer growth and the strong digital sales. During the year ended January 31, 2020, the Company recorded a charge of approximately $13.9 million related to goodwill impairment of the Menus &Venues division.
• Income from operations expressed as a percentage of net sales improved to 9.0% for the year ended January 31, 2022, compared to 5.8% for the year ended January 31, 2020.
27
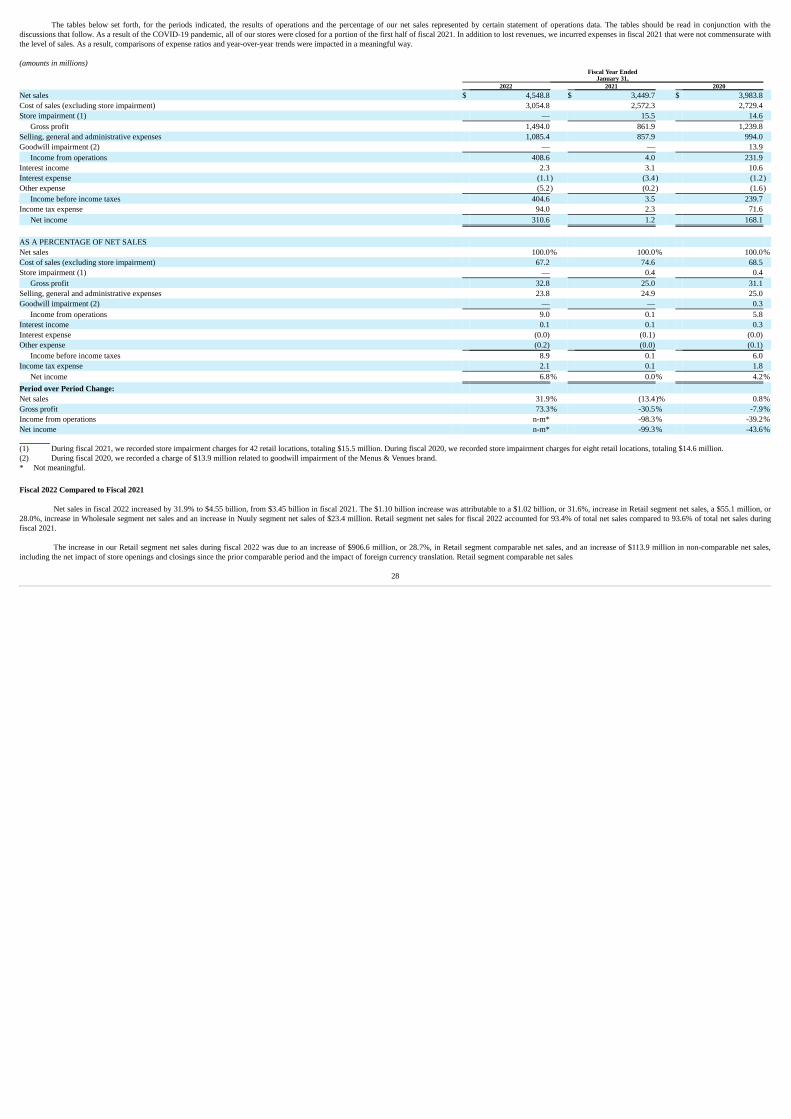
The tables below set forth, for the periods indicated, the results of operations and the percentage of our net sales represented by certain statement of operations data. The tables should be read in conjunction with the
discussions that follow. As a result of the COVID-19 pandemic, all of our stores were closed for a portion of the first half of fiscal 2021. In addition to lost revenues, we incurred expenses in fiscal 2021 that were not commensurate withthe level of sales. As a result, comparisons of expense ratios and year-over-year trends were impacted in a meaningful way. (amounts in millions)
Fiscal Year Ended
January 31, 2022 2021 2020
Net sales $ 4,548.8 $ 3,449.7 $ 3,983.8 Cost of sales (excluding store impairment) 3,054.8 2,572.3 2,729.4 Store impairment (1) — 15.5 14.6
Gross profit 1,494.0 861.9 1,239.8 Selling, general and administrative expenses 1,085.4 857.9 994.0 Goodwill impairment (2) — — 13.9
Income from operations 408.6 4.0 231.9 Interest income 2.3 3.1 10.6 Interest expense (1.1) (3.4) (1.2)Other expense (5.2) (0.2) (1.6)
Income before income taxes 404.6 3.5 239.7 Income tax expense 94.0 2.3 71.6
Net income 310.6 1.2 168.1
AS A PERCENTAGE OF NET SALES Net sales 100.0% 100.0% 100.0%Cost of sales (excluding store impairment) 67.2 74.6 68.5 Store impairment (1) — 0.4 0.4
Gross profit 32.8 25.0 31.1 Selling, general and administrative expenses 23.8 24.9 25.0 Goodwill impairment (2) — — 0.3
Income from operations 9.0 0.1 5.8 Interest income 0.1 0.1 0.3 Interest expense (0.0) (0.1) (0.0) Other expense (0.2) (0.0) (0.1)
Income before income taxes 8.9 0.1 6.0 Income tax expense 2.1 0.1 1.8
Net income 6.8% 0.0% 4.2%Period over Period Change: Net sales 31.9% (13.4)% 0.8%Gross profit 73.3% -30.5% -7.9%Income from operations n-m* -98.3% -39.2%Net income n-m* -99.3% -43.6% (1) During fiscal 2021, we recorded store impairment charges for 42 retail locations, totaling $15.5 million. During fiscal 2020, we recorded store impairment charges for eight retail locations, totaling $14.6 million.(2) During fiscal 2020, we recorded a charge of $13.9 million related to goodwill impairment of the Menus & Venues brand.* Not meaningful.
Fiscal 2022 Compared to Fiscal 2021
Net sales in fiscal 2022 increased by 31.9% to $4.55 billion, from $3.45 billion in fiscal 2021. The $1.10 billion increase was attributable to a $1.02 billion, or 31.6%, increase in Retail segment net sales, a $55.1 million, or28.0%, increase in Wholesale segment net sales and an increase in Nuuly segment net sales of $23.4 million. Retail segment net sales for fiscal 2022 accounted for 93.4% of total net sales compared to 93.6% of total net sales duringfiscal 2021.
The increase in our Retail segment net sales during fiscal 2022 was due to an increase of $906.6 million, or 28.7%, in Retail segment comparable net sales, and an increase of $113.9 million in non-comparable net sales,including the net impact of store openings and closings since the prior comparable period and the impact of foreign currency translation. Retail segment comparable net sales
28
increased 42.5% at the Free People Group, 34.5% at the Anthropologie Group and 17.2% at Urban Outfitters. Retail segment comparable net sales increased in North America and Europe. The increase in Retail segment comparable netsales for fiscal 2022 was driven by high double-digit growth in retail store sales and high single-digit growth in digital channel sales. Retail segment comparable net sales for fiscal 2021 were significantly impacted by lower retail storesales due to store closures, reduced store traffic in reopened store locations and significant growth in our digital channel. As a result, for fiscal 2021 the relative proportion of sales attributable to store and digital channels changedsignificantly. Positive comparable store net sales in fiscal 2022 resulted from an increase in store traffic, transactions and average unit retail price, while units per transaction and conversion rate declined. The digital channel net salesincrease was driven by an increase in average order value, while sessions and units per transaction decreased and conversion rate was flat. The increase in non-comparable net sales during fiscal 2022 was primarily due to net new storeopenings and a recovery from the negative impact of the COVID-19 pandemic in fiscal 2021, which resulted in reduced store traffic and lower store productivity in the 76 new Company-owned stores opened and 28 Company-ownedstores and restaurants closed since the prior comparable period. The benefit from foreign currency translation in fiscal 2022 also contributed to the increase in non-comparable net sales.
The increase in Wholesale segment net sales in fiscal 2022 as compared to fiscal 2021 was primarily due to a $46.5 million, or 24.9%, increase in sales for the Free People Group, due to a significant number of the brand’swholesale partners having had a meaningful portion of their businesses negatively impacted by the COVID-19 pandemic during fiscal 2021. The segment increase was also due to an increase of $9.2 million in Urban Outfitterswholesale sales.
Gross profit percentage for fiscal 2022 increased to 32.8% of net sales, from 25.0% of net sales in fiscal 2021. Gross profit increased to $1,494.0 million for fiscal 2022 from $861.9 million in fiscal 2021. The increase ingross profit rate was due to the significant negative impact of COVID-19 related store closures on the Company’s Retail segment and its partners in the Wholesale segment in the prior year period. Additionally, during the prior yearperiod, the Company recorded a $15.5 million store impairment charge and a meaningful increase in inventory obsolescence reserves due to the impact the store closures had on the aging of the Company’s inventory. Finally, all threebrands achieved record low merchandise markdown rates in the Retail segment during fiscal 2022, further contributing to the improvement in the current year.
Total inventory at January 31, 2022 increased by $180.1 million, or 46.2%, to $569.7 million from $389.6 million at January 31, 2021. This increase was driven by the increase in net sales and by the Company continuing tobring certain product categories in earlier to protect against ongoing supply chain disruptions and delays and increasing inbound transportation costs.
Selling, general and administrative expenses increased by $227.5 million, or 26.5%, to $1,085.4 million in fiscal 2022 compared to fiscal 2021. Selling, general and administrative expenses as a percentage of net salesdecreased in fiscal 2022 to 23.8% of net sales, compared to 24.9% of net sales for fiscal 2021. The increase in selling, general and administrative expenses was primarily related to increased direct selling and digital marketing expensesin the current year to support the increase in net sales, higher incentive-based compensation due to the impacts of COVID-19 on the prior year period and the benefit of COVID-19 related government relief packages recorded in theprior year period. The leverage in selling, general and administrative expenses in fiscal 2022 is primarily due to the increase in retail store sales, as store operations for fiscal 2021 were significantly impacted by store closures andreduced store traffic in reopened locations.
Income from operations for fiscal 2022 was 9.0% of net sales, or $408.6 million, compared to 0.1% of net sales, or $4.0 million, for fiscal 2021.
Our effective tax rate for fiscal 2022 was 23.2% compared to 64.8% in fiscal 2021. See Note 10, “Income Taxes,” in the Notes to our Consolidated Financial Statements included in this Annual Report on Form 10-K, for areconciliation of the statutory U.S. federal income tax rate to our effective tax rate.
Fiscal 2021 Compared to Fiscal 2020
Net sales in fiscal 2021 decreased by 13.4% to $3.45 billion, from $3.98 billion in fiscal 2020. The $534.0 million decrease was attributable to a $420.7 million, or 11.5%, decrease in Retail segment net sales and a$129.6 million, or 39.7%, decrease in Wholesale segment net sales, partially offset by a $16.3 million increase in Nuuly segment net sales. Retail segment net sales for fiscal 2021 accounted for 93.6% of total net sales compared to91.6% of total net sales during fiscal 2020.
The decrease in our Retail segment net sales during fiscal 2021 was due to a decrease of $372.6 million, or 10.6%, in Retail segment comparable net sales and a decrease of $48.1 million in non-comparable net sales, includingthe net impact of store openings and closings since the prior comparable period and the impact of foreign currency translation. Retail segment comparable net sales increased 5.7% at the Free People Group and decreased 7.0% at UrbanOutfitters and 18.4% at the Anthropologie Group. Retail segment comparable net sales decreased in both North America and Europe. The decrease in Retail segment comparable net sales was driven by negative comparable store netsales due to mandated store closures as a result of the COVID-19 pandemic and lower store productivity for stores since opened, partially offset by double-digit growth in the digital channel. Negative comparable store net sales resultedfrom a decrease in store traffic, transactions and average unit selling price, while units per transaction and conversion rate increased. The digital channel net sales increase was driven by an increase in conversion rate and sessions, whileaverage order value
29
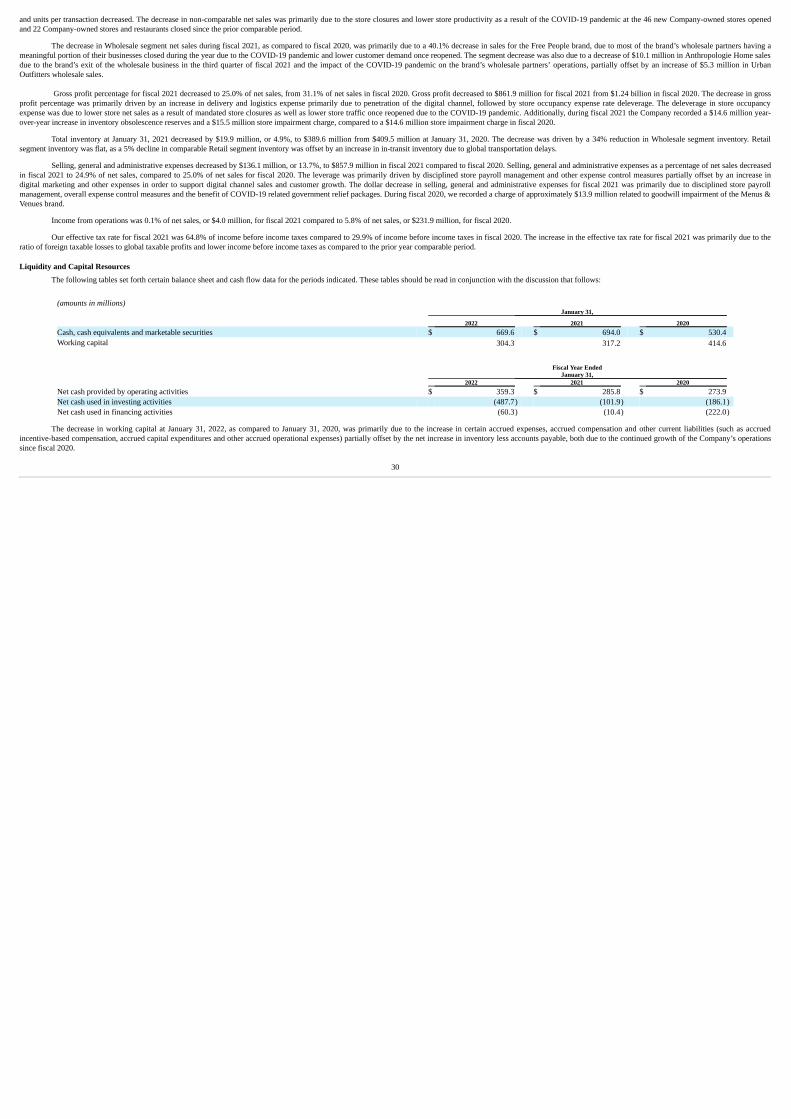
and units per transaction decreased. The decrease in non-comparable net sales was primarily due to the store closures and lower store productivity as a result of the COVID-19 pandemic at the 46 new Company-owned stores openedand 22 Company-owned stores and restaurants closed since the prior comparable period.
The decrease in Wholesale segment net sales during fiscal 2021, as compared to fiscal 2020, was primarily due to a 40.1% decrease in sales for the Free People brand, due to most of the brand’s wholesale partners having ameaningful portion of their businesses closed during the year due to the COVID-19 pandemic and lower customer demand once reopened. The segment decrease was also due to a decrease of $10.1 million in Anthropologie Home salesdue to the brand’s exit of the wholesale business in the third quarter of fiscal 2021 and the impact of the COVID-19 pandemic on the brand’s wholesale partners’ operations, partially offset by an increase of $5.3 million in UrbanOutfitters wholesale sales.
Gross profit percentage for fiscal 2021 decreased to 25.0% of net sales, from 31.1% of net sales in fiscal 2020. Gross profit decreased to $861.9 million for fiscal 2021 from $1.24 billion in fiscal 2020. The decrease in grossprofit percentage was primarily driven by an increase in delivery and logistics expense primarily due to penetration of the digital channel, followed by store occupancy expense rate deleverage. The deleverage in store occupancyexpense was due to lower store net sales as a result of mandated store closures as well as lower store traffic once reopened due to the COVID-19 pandemic. Additionally, during fiscal 2021 the Company recorded a $14.6 million year-over-year increase in inventory obsolescence reserves and a $15.5 million store impairment charge, compared to a $14.6 million store impairment charge in fiscal 2020.
Total inventory at January 31, 2021 decreased by $19.9 million, or 4.9%, to $389.6 million from $409.5 million at January 31, 2020. The decrease was driven by a 34% reduction in Wholesale segment inventory. Retailsegment inventory was flat, as a 5% decline in comparable Retail segment inventory was offset by an increase in in-transit inventory due to global transportation delays.
Selling, general and administrative expenses decreased by $136.1 million, or 13.7%, to $857.9 million in fiscal 2021 compared to fiscal 2020. Selling, general and administrative expenses as a percentage of net sales decreasedin fiscal 2021 to 24.9% of net sales, compared to 25.0% of net sales for fiscal 2020. The leverage was primarily driven by disciplined store payroll management and other expense control measures partially offset by an increase indigital marketing and other expenses in order to support digital channel sales and customer growth. The dollar decrease in selling, general and administrative expenses for fiscal 2021 was primarily due to disciplined store payrollmanagement, overall expense control measures and the benefit of COVID-19 related government relief packages. During fiscal 2020, we recorded a charge of approximately $13.9 million related to goodwill impairment of the Menus &Venues brand.
Income from operations was 0.1% of net sales, or $4.0 million, for fiscal 2021 compared to 5.8% of net sales, or $231.9 million, for fiscal 2020.
Our effective tax rate for fiscal 2021 was 64.8% of income before income taxes compared to 29.9% of income before income taxes in fiscal 2020. The increase in the effective tax rate for fiscal 2021 was primarily due to theratio of foreign taxable losses to global taxable profits and lower income before income taxes as compared to the prior year comparable period.
Liquidity and Capital Resources
The following tables set forth certain balance sheet and cash flow data for the periods indicated. These tables should be read in conjunction with the discussion that follows:
(amounts in millions) January 31, 2022 2021 2020 Cash, cash equivalents and marketable securities $ 669.6 $ 694.0 $ 530.4 Working capital 304.3 317.2 414.6
Fiscal Year Ended January 31, 2022 2021 2020 Net cash provided by operating activities $ 359.3 $ 285.8 $ 273.9 Net cash used in investing activities (487.7) (101.9) (186.1)Net cash used in financing activities (60.3) (10.4) (222.0)
The decrease in working capital at January 31, 2022, as compared to January 31, 2020, was primarily due to the increase in certain accrued expenses, accrued compensation and other current liabilities (such as accruedincentive-based compensation, accrued capital expenditures and other accrued operational expenses) partially offset by the net increase in inventory less accounts payable, both due to the continued growth of the Company’s operationssince fiscal 2020.
30

During the last three years, we have satisfied our cash requirements through our cash flow from operating activities. Additionally, during fiscal 2021, and in response to the COVID-19 pandemic, we had borrowings of$220.0 million under our Amended Credit Facility to protect our cash reserves. We subsequently repaid the entire $220.0 million during fiscal 2021. Our primary uses of cash have been to fund business operations, purchase inventory,expand our home offices and fulfillment centers, open new stores and repurchase our common shares.
Cash Flows from Operating Activities
For all periods, our major source of cash from operations was merchandise sales and our primary outflow of cash from operations was for the payment of operational costs. The increase in cash flows from operations for fiscal2022 compared to fiscal 2021 was primarily due to increased net income, partially offset by the net increase in inventory less accounts payable to support the continued growth of the Company’s operations. The increase in cash flowsfrom operations for fiscal 2021 compared to fiscal 2020 was primarily due to an increase in accounts payable and accrued expenses, accrued compensation and other current liabilities due to timing of payments, in addition to decreasedinventory levels, partially offset by lower merchandise sales in fiscal 2021 as a result of store closures and lower store productivity caused by the COVID-19 pandemic. Although the Company’s stores were closed for a part of the firstsix months of fiscal 2021, the Company continued to incur various store operational costs for a large portion of its store employees.
Cash Flows from Investing ActivitiesCash used in investing activities in fiscal 2022 and 2021 was primarily related to purchases of marketable securities and property and equipment, partially offset by the sales and maturities of marketable securities. The
Company initially liquidated its marketable securities portfolio earlier in fiscal 2021 to preserve financial flexibility and maintain liquidity in response to the COVID-19 pandemic, but reinvested in a marketable securities portfolio inthe fourth quarter of fiscal 2021. Cash paid for property and equipment for fiscal 2022, 2021 and 2020 was $262.4 million, $159.2 million and $217.4 million, respectively, which was primarily used to expand our fulfillment centernetwork in fiscal 2022, 2021, and 2020.
Cash Flows from Financing Activities
Cash used in financing activities in fiscal 2022, 2021 and 2020 was primarily related to $55.8 million, $7.0 million and $217.4 million, respectively, of repurchases of our common shares under our share repurchase programsduring each of those years. During fiscal 2021, we also borrowed $220.0 million under our Amended Credit Facility in order to preserve financial flexibility and maintain liquidity and flexibility in response to the COVID-19 pandemic.We subsequently repaid the entire $220.0 million during fiscal 2021.
Credit FacilitiesOn June 29, 2018, we entered into an amended and restated credit agreement (the “Amended Credit Agreement”) that amended our asset-based revolving credit facility with certain lenders, including JPMorgan Chase Bank,
N.A., as administrative agent, and J.P. Morgan Chase Bank, N.A. and Wells Fargo Bank, National Association, as joint lead arrangers and co-book managers.
The Amended Credit Agreement extended the maturity date of the senior secured revolving credit facility to June 2023 (the “Amended Credit Facility”). The Amended Credit Facility provides for loans and letters of credit upto $350.0 million, subject to a borrowing base that is comprised of our eligible accounts receivable and inventory. The Amended Credit Facility includes a swing-line sub-facility, a multicurrency sub-facility and the option to expand thefacility by up to $150.0 million. The funds available under the Amended Credit Facility may be used for working capital and other general corporate purposes.
The Amended Credit Facility provides for interest on borrowings, at our option, at either (i) adjusted LIBOR, CDOR, SONIA or EURIBOR plus an applicable margin ranging from 1.125% to 1.375%, or (ii) an adjusted ABRplus an applicable margin ranging from 0.125% to 0.375%, each such applicable margin depending on the level of availability under the Amended Credit Facility. Depending on the type of borrowing, interest on the Amended CreditAgreement is payable monthly, quarterly or at the end of the interest period. A commitment fee of 0.20% is payable quarterly on the unused portion of the Amended Credit Facility.
All obligations under the Amended Credit Facility are unconditionally guaranteed by the Company and certain of its U.S. subsidiaries. The obligations under the Amended Credit Facility are secured by a first-priority securityinterest in inventory, accounts receivable and certain other assets of the Company and certain of its U.S. subsidiaries. The obligations of URBN Canada Retail, Inc. are secured by a first-priority security interest in its inventory, accountsreceivable and certain other assets. The Amended Credit Agreement contains customary representations and warranties, negative and affirmative covenants and provisions relating to events of default.
As of January 31, 2022, the Company had $0 in borrowings under the Amended Credit Facility. The Company borrowed and subsequently repaid $220.0 million during fiscal 2021 in order to preserve financial flexibility andmaintain liquidity and flexibility in response to the COVID-19 pandemic. As of January 31, 2022, the Company was in compliance with the terms of the Amended Credit Agreement. The Company expects to remain in compliance withall terms, including covenants, of the Amended Credit Agreements. Outstanding stand-by letters of credit, which reduce the funds available under the Amended Credit Facility, were $13.1 million. Interest expense for the AmendedCredit Facility for the years ended January 31, 2022, January 31, 2021 and January 31, 2020, was $1.0 million, $2.7 million and $1.0 million, respectively, which was included in “Interest expense,” in the Consolidated Statements ofIncome.
31
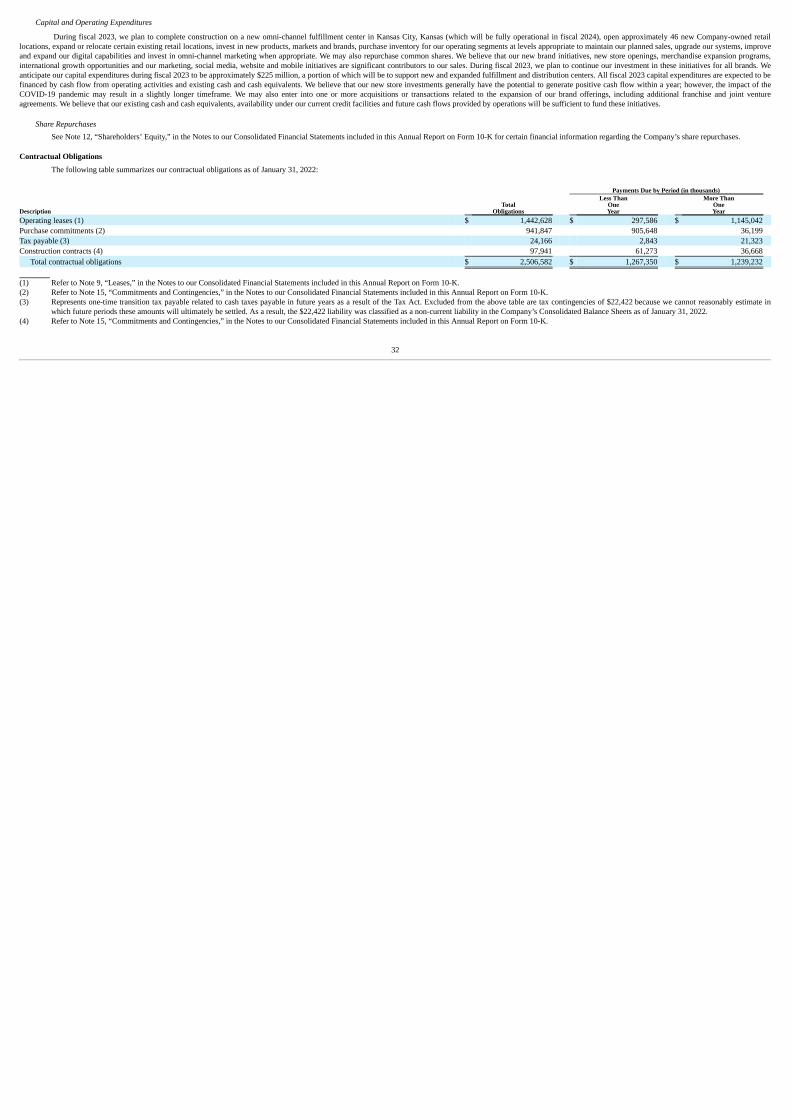
Capital and Operating Expenditures
During fiscal 2023, we plan to complete construction on a new omni-channel fulfillment center in Kansas City, Kansas (which will be fully operational in fiscal 2024), open approximately 46 new Company-owned retaillocations, expand or relocate certain existing retail locations, invest in new products, markets and brands, purchase inventory for our operating segments at levels appropriate to maintain our planned sales, upgrade our systems, improveand expand our digital capabilities and invest in omni-channel marketing when appropriate. We may also repurchase common shares. We believe that our new brand initiatives, new store openings, merchandise expansion programs,international growth opportunities and our marketing, social media, website and mobile initiatives are significant contributors to our sales. During fiscal 2023, we plan to continue our investment in these initiatives for all brands. Weanticipate our capital expenditures during fiscal 2023 to be approximately $225 million, a portion of which will be to support new and expanded fulfillment and distribution centers. All fiscal 2023 capital expenditures are expected to befinanced by cash flow from operating activities and existing cash and cash equivalents. We believe that our new store investments generally have the potential to generate positive cash flow within a year; however, the impact of theCOVID-19 pandemic may result in a slightly longer timeframe. We may also enter into one or more acquisitions or transactions related to the expansion of our brand offerings, including additional franchise and joint ventureagreements. We believe that our existing cash and cash equivalents, availability under our current credit facilities and future cash flows provided by operations will be sufficient to fund these initiatives.
Share RepurchasesSee Note 12, “Shareholders’ Equity,” in the Notes to our Consolidated Financial Statements included in this Annual Report on Form 10-K for certain financial information regarding the Company’s share repurchases.
Contractual Obligations
The following table summarizes our contractual obligations as of January 31, 2022:
Payments Due by Period (in thousands)
Description Total
Obligations
Less ThanOneYear
More ThanOneYear
Operating leases (1) $ 1,442,628 $ 297,586 $ 1,145,042 Purchase commitments (2) 941,847 905,648 36,199 Tax payable (3) 24,166 2,843 21,323 Construction contracts (4) 97,941 61,273 36,668
Total contractual obligations $ 2,506,582 $ 1,267,350 $ 1,239,232
(1) Refer to Note 9, “Leases,” in the Notes to our Consolidated Financial Statements included in this Annual Report on Form 10-K.(2) Refer to Note 15, “Commitments and Contingencies,” in the Notes to our Consolidated Financial Statements included in this Annual Report on Form 10-K.(3) Represents one-time transition tax payable related to cash taxes payable in future years as a result of the Tax Act. Excluded from the above table are tax contingencies of $22,422 because we cannot reasonably estimate in
which future periods these amounts will ultimately be settled. As a result, the $22,422 liability was classified as a non-current liability in the Company’s Consolidated Balance Sheets as of January 31, 2022.(4) Refer to Note 15, “Commitments and Contingencies,” in the Notes to our Consolidated Financial Statements included in this Annual Report on Form 10-K.
32
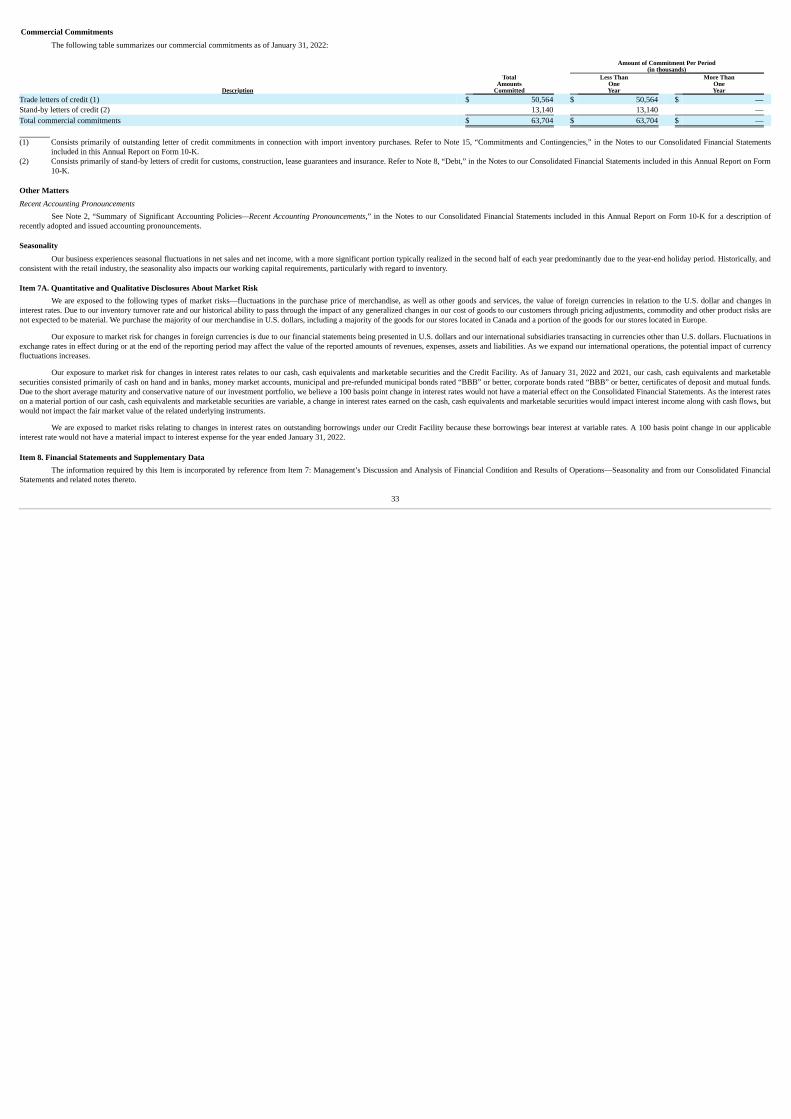
Commercial Commitments
The following table summarizes our commercial commitments as of January 31, 2022:
Amount of Commitment Per Period
(in thousands)
Description
TotalAmounts
Committed
Less ThanOneYear
More ThanOneYear
Trade letters of credit (1) $ 50,564 $ 50,564 $ — Stand-by letters of credit (2) 13,140 13,140 — Total commercial commitments $ 63,704 $ 63,704 $ —
(1) Consists primarily of outstanding letter of credit commitments in connection with import inventory purchases. Refer to Note 15, “Commitments and Contingencies,” in the Notes to our Consolidated Financial Statements
included in this Annual Report on Form 10-K.(2) Consists primarily of stand-by letters of credit for customs, construction, lease guarantees and insurance. Refer to Note 8, “Debt,” in the Notes to our Consolidated Financial Statements included in this Annual Report on Form
10-K.
Other Matters
Recent Accounting PronouncementsSee Note 2, “Summary of Significant Accounting Policies—Recent Accounting Pronouncements,” in the Notes to our Consolidated Financial Statements included in this Annual Report on Form 10-K for a description of
recently adopted and issued accounting pronouncements.
Seasonality
Our business experiences seasonal fluctuations in net sales and net income, with a more significant portion typically realized in the second half of each year predominantly due to the year-end holiday period. Historically, andconsistent with the retail industry, the seasonality also impacts our working capital requirements, particularly with regard to inventory.
Item 7A. Quantitative and Qualitative Disclosures About Market RiskWe are exposed to the following types of market risks—fluctuations in the purchase price of merchandise, as well as other goods and services, the value of foreign currencies in relation to the U.S. dollar and changes in
interest rates. Due to our inventory turnover rate and our historical ability to pass through the impact of any generalized changes in our cost of goods to our customers through pricing adjustments, commodity and other product risks arenot expected to be material. We purchase the majority of our merchandise in U.S. dollars, including a majority of the goods for our stores located in Canada and a portion of the goods for our stores located in Europe.
Our exposure to market risk for changes in foreign currencies is due to our financial statements being presented in U.S. dollars and our international subsidiaries transacting in currencies other than U.S. dollars. Fluctuations inexchange rates in effect during or at the end of the reporting period may affect the value of the reported amounts of revenues, expenses, assets and liabilities. As we expand our international operations, the potential impact of currencyfluctuations increases.
Our exposure to market risk for changes in interest rates relates to our cash, cash equivalents and marketable securities and the Credit Facility. As of January 31, 2022 and 2021, our cash, cash equivalents and marketablesecurities consisted primarily of cash on hand and in banks, money market accounts, municipal and pre-refunded municipal bonds rated “BBB” or better, corporate bonds rated “BBB” or better, certificates of deposit and mutual funds.Due to the short average maturity and conservative nature of our investment portfolio, we believe a 100 basis point change in interest rates would not have a material effect on the Consolidated Financial Statements. As the interest rateson a material portion of our cash, cash equivalents and marketable securities are variable, a change in interest rates earned on the cash, cash equivalents and marketable securities would impact interest income along with cash flows, butwould not impact the fair market value of the related underlying instruments.
We are exposed to market risks relating to changes in interest rates on outstanding borrowings under our Credit Facility because these borrowings bear interest at variable rates. A 100 basis point change in our applicableinterest rate would not have a material impact to interest expense for the year ended January 31, 2022.
Item 8. Financial Statements and Supplementary DataThe information required by this Item is incorporated by reference from Item 7: Management’s Discussion and Analysis of Financial Condition and Results of Operations—Seasonality and from our Consolidated Financial
Statements and related notes thereto.
33

Item 9. Changes in and Disagreements with Accountants on Accounting and Financial Disclosure
None.
Item 9A. Controls and ProceduresEvaluation of Disclosure Controls and Procedures
Management, including our Chief Executive Officer and Chief Financial Officer, evaluated the effectiveness of our disclosure controls and procedures as defined in Rules 13a-15(e) and 15d-15(e) of the Securities ExchangeAct of 1934, as amended. Based on this review, the Chief Executive Officer and Chief Financial Officer concluded that the Company’s disclosure controls and procedures were effective as of January 31, 2022.
Management’s Annual Report on Internal Controls Over Financial ReportingOur management is responsible for establishing and maintaining adequate internal control over financial reporting, as defined in the Securities Exchange Act Rule 13a-15(f). Our system of internal control is designed to
provide reasonable, not absolute, assurance regarding the reliability of financial reporting and the preparation of financial statements for external purposes in accordance with generally accepted accounting principles.
Under the supervision and with the participation of our management, including our Chief Executive Officer and Chief Financial Officer, we conducted an evaluation of the effectiveness of our system of internal control overfinancial reporting based on the framework in Internal Control—Integrated Framework issued in 2013 by the Committee of Sponsoring Organizations of the Treadway Commission. Based on this evaluation, our management concludedthat the Company’s internal control over financial reporting was effective as of January 31, 2022.
The effectiveness of internal control over financial reporting as of January 31, 2022 was audited by Deloitte & Touche LLP, an independent registered public accounting firm, as stated in their report that is included on page 35of this Annual Report on Form 10-K.
Changes in Internal Control Over Financial ReportingThere have been no changes in our internal controls over financial reporting during the fiscal quarter ended January 31, 2022 that have materially affected, or are reasonably likely to materially affect, our internal controls over
financial reporting.
Item 9B. Other Information
None.
34

REPORT OF INDEPENDENT REGISTERED PUBLIC ACCOUNTING FIRM
To the shareholders and the Board of Directors of Urban Outfitters, Inc.
Opinion on Internal Control over Financial Reporting
We have audited the internal control over financial reporting of Urban Outfitters, Inc. and subsidiaries (the “Company”) as of January 31, 2022, based on criteria established in Internal Control — Integrated Framework (2013) issuedby the Committee of Sponsoring Organizations of the Treadway Commission (COSO). In our opinion, the Company maintained, in all material respects, effective internal control over financial reporting as of January 31, 2022, based oncriteria established in Internal Control — Integrated Framework (2013) issued by COSO.
We have also audited, in accordance with the standards of the Public Company Accounting Oversight Board (United States) (PCAOB), the consolidated balance sheet of the Company as of January 31, 2022, and the related consolidatedstatements of income, comprehensive income, shareholders' equity, and cash flows for the year ended January 31, 2022, and our report dated April 1, 2022, expressed an unqualified opinion on those financial statements.
Basis for Opinion
The Company’s management is responsible for maintaining effective internal control over financial reporting and for its assessment of the effectiveness of internal control over financial reporting, included in the accompanyingManagement's Annual Report on Internal Controls over Financial Reporting. Our responsibility is to express an opinion on the Company’s internal control over financial reporting based on our audit. We are a public accounting firmregistered with the PCAOB and are required to be independent with respect to the Company in accordance with the U.S. federal securities laws and the applicable rules and regulations of the Securities and Exchange Commission andthe PCAOB.
We conducted our audit in accordance with the standards of the PCAOB. Those standards require that we plan and perform the audit to obtain reasonable assurance about whether effective internal control over financial reporting wasmaintained in all material respects. Our audit included obtaining an understanding of internal control over financial reporting, assessing the risk that a material weakness exists, testing and evaluating the design and operatingeffectiveness of internal control based on the assessed risk, and performing such other procedures as we considered necessary in the circumstances. We believe that our audit provides a reasonable basis for our opinion.
Definition and Limitations of Internal Control over Financial Reporting
A company’s internal control over financial reporting is a process designed to provide reasonable assurance regarding the reliability of financial reporting and the preparation of financial statements for external purposes in accordancewith generally accepted accounting principles. A company’s internal control over financial reporting includes those policies and procedures that (1) pertain to the maintenance of records that, in reasonable detail, accurately and fairlyreflect the transactions and dispositions of the assets of the company; (2) provide reasonable assurance that transactions are recorded as necessary to permit preparation of financial statements in accordance with generally acceptedaccounting principles, and that receipts and expenditures of the company are being made only in accordance with authorizations of management and directors of the company; and (3) provide reasonable assurance regarding preventionor timely detection of unauthorized acquisition, use, or disposition of the company’s assets that could have a material effect on the financial statements.
Because of its inherent limitations, internal control over financial reporting may not prevent or detect misstatements. Also, projections of any evaluation of effectiveness to future periods are subject to the risk that controls may becomeinadequate because of changes in conditions, or that the degree of compliance with the policies or procedures may deteriorate.
/s/ Deloitte & Touche LLP Philadelphia, PennsylvaniaApril 1, 2022
35

PART III
Item 10. Directors, Executive Officers and Corporate GovernanceThe following table sets forth the name, age and position of each of our executive officers and directors:
Name Age PositionRichard A. Hayne 74 Chairman of the Board and Chief Executive OfficerMelanie Marein-Efron 52 Chief Financial OfficerFrancis J. Conforti 46 Co-President and Chief Operating Officer, URBNSheila B. Harrington 49 Global Chief Executive Officer, Urban Outfitters Group and Free People GroupAzeez Hayne 45 Chief Administrative Officer and General Counsel, URBNMargaret A. HayneTricia D. Smith
6350
Co-President and Chief Creative Officer, URBN; DirectorGlobal Chief Executive Officer, Anthropologie Group
Edward N. Antoian (1) 66 DirectorKelly Campbell 44 DirectorSukhinder Singh Cassidy (3) 52 DirectorHarry S. Cherken, Jr. 72 DirectorElizabeth A. Lambert (2)(3) 58 DirectorAmin N. Maredia (2) 49 DirectorWesley McDonald (1)(2) 59 DirectorTodd R. Morgenfeld (1)(2) 49 DirectorJohn C. Mulliken (3) 49 DirectorMary C. Egan 54 Nominee for Director
(1) Member of the Audit Committee.(2) Member of the Compensation and Leadership Development Committee.(3) Member of the Nominating and Governance Committee.
Mr. R. Hayne co-founded Urban Outfitters in 1970. He has been Chairman of the Board of Directors since the Company’s incorporation in 1976 and, until February 2016, also served as the Company’s President. Mr. R. Hayne
served as the Company’s principal executive officer until 2007 and again beginning in January 2012. Margaret A. Hayne, Co-President and Chief Creative Officer of the Company, is Mr. R. Hayne’s spouse. Azeez Hayne, ChiefAdministrative Officer and General Counsel of the Company, is Mr. R. Hayne’s nephew. Mr. R. Hayne’s long tenure leading the Company as Chairman of the Board of Directors, his tenure as principal executive officer and hisexceptional leadership skills make him uniquely qualified to serve as a director.
Ms. Marein-Efron joined the Company in January 2013 as Director of Financial, Planning & Analysis, was subsequently promoted to Executive Director Finance & Corporate Development, and in November 2020 waspromoted to Chief Financial Officer. Prior to joining the Company, Ms. Marein-Efron worked at Campbell Soup Company, Godiva Chocolate and General Motors in various senior finance roles. She began her career at Arthur Andersenin 1991 in the financial advisory consulting practice. Ms. Marein-Efron holds a B.S. in Economics and M.B.A in Finance from the Wharton School of the University of Pennsylvania and is a Certified Public Accountant.
Mr. Conforti joined the Company in March 2007 as Director of Finance and SEC Reporting. After being promoted to Controller and then to Chief Accounting Officer, he was appointed Chief Financial Officer in April 2012,and Co-President and Chief Operating Officer in October 2020. Prior to joining the Company, Mr. Conforti, a Certified Public Accountant, worked for AlliedBarton Security Services, LLC for five years, serving as Controller for threeyears. Mr. Conforti began his career at KPMG in 1998 where he held various audit roles.
Ms. Harrington has served as Chief Executive Officer of the Urban Outfitters Group since January 2021 and as Chief Executive Officer of the Free People Group since October 2020. Prior to that, Ms. Harrington served asPresident of the Free People Group beginning in August 2016 and Chief Merchandising Officer of the Free People Group from February 2015 to August 2016 and Merchandise and Display Director of the Free People Group fromMarch 2010 to February 2015. Ms. Harrington joined the Free People brand in 2002 to help launch the first store. She was responsible for the merchant product development for the brand across all three channels; stores, digital andwholesale. Ms. Harrington has been instrumental in the launch and development of new businesses such as Intimates, Shoes, Movement, Endless Summer and We the Free, in addition to expansion of the core offering. Over the yearsshe has expanded the buying and planning teams and developed the visual merchandising team. Prior to joining Free People, Ms. Harrington spent time within the merchant organizations of Bloomingdales and The Gap. Ms. Harringtonhas a BS in Psychology from Queen’s University.
Mr. A. Hayne joined the Company in February 2015 as Associate General Counsel and was appointed General Counsel and Corporate Secretary in June 2015, and Chief Administrative Officer in October 2020. Before joiningthe Company, Mr. A. Hayne worked for Morgan Lewis & Bockius LLP, serving as a partner in their Labor & Employment Practice Group from October 2010 through January 2015. After graduating from the University of VirginiaSchool of Law in 2001, Mr. A. Hayne began his legal career
36
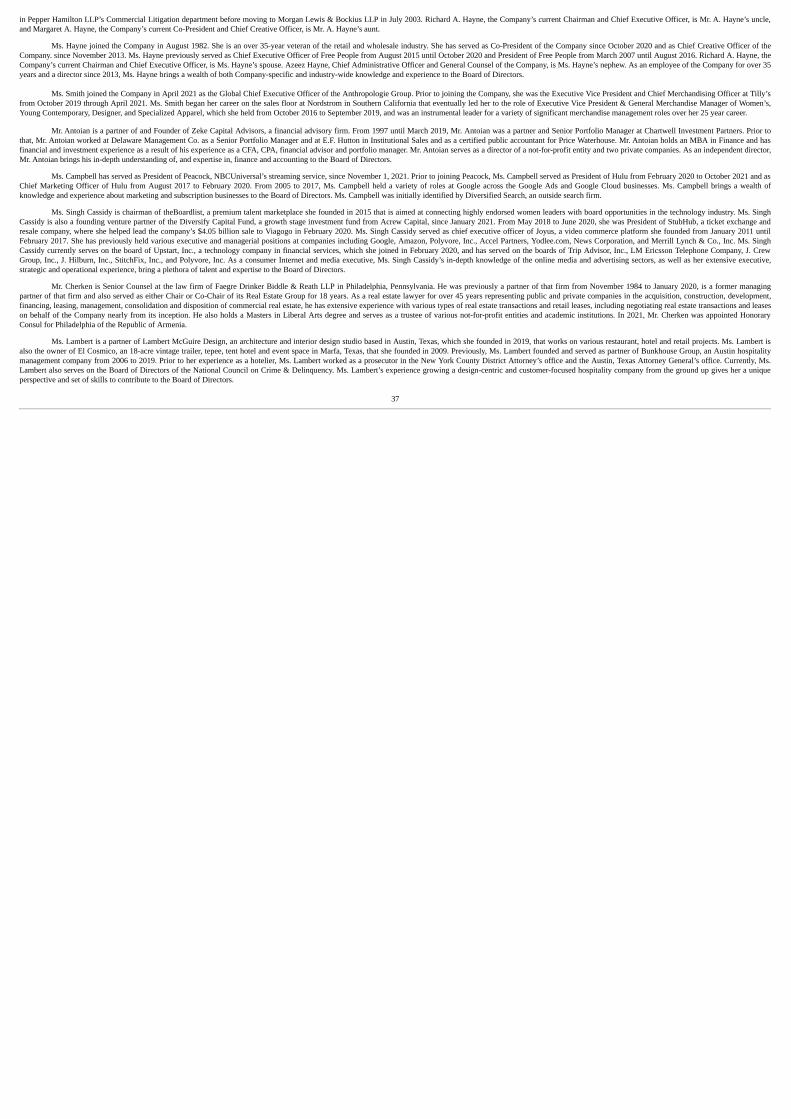
in Pepper Hamilton LLP’s Commercial Litigation department before moving to Morgan Lewis & Bockius LLP in July 2003. Richard A. Hayne, the Company’s current Chairman and Chief Executive Officer, is Mr. A. Hayne’s uncle,and Margaret A. Hayne, the Company’s current Co-President and Chief Creative Officer, is Mr. A. Hayne’s aunt.
Ms. Hayne joined the Company in August 1982. She is an over 35-year veteran of the retail and wholesale industry. She has served as Co-President of the Company since October 2020 and as Chief Creative Officer of theCompany. since November 2013. Ms. Hayne previously served as Chief Executive Officer of Free People from August 2015 until October 2020 and President of Free People from March 2007 until August 2016. Richard A. Hayne, theCompany’s current Chairman and Chief Executive Officer, is Ms. Hayne’s spouse. Azeez Hayne, Chief Administrative Officer and General Counsel of the Company, is Ms. Hayne’s nephew. As an employee of the Company for over 35years and a director since 2013, Ms. Hayne brings a wealth of both Company-specific and industry-wide knowledge and experience to the Board of Directors.
Ms. Smith joined the Company in April 2021 as the Global Chief Executive Officer of the Anthropologie Group. Prior to joining the Company, she was the Executive Vice President and Chief Merchandising Officer at Tilly’sfrom October 2019 through April 2021. Ms. Smith began her career on the sales floor at Nordstrom in Southern California that eventually led her to the role of Executive Vice President & General Merchandise Manager of Women’s,Young Contemporary, Designer, and Specialized Apparel, which she held from October 2016 to September 2019, and was an instrumental leader for a variety of significant merchandise management roles over her 25 year career.
Mr. Antoian is a partner of and Founder of Zeke Capital Advisors, a financial advisory firm. From 1997 until March 2019, Mr. Antoian was a partner and Senior Portfolio Manager at Chartwell Investment Partners. Prior tothat, Mr. Antoian worked at Delaware Management Co. as a Senior Portfolio Manager and at E.F. Hutton in Institutional Sales and as a certified public accountant for Price Waterhouse. Mr. Antoian holds an MBA in Finance and hasfinancial and investment experience as a result of his experience as a CFA, CPA, financial advisor and portfolio manager. Mr. Antoian serves as a director of a not-for-profit entity and two private companies. As an independent director,Mr. Antoian brings his in-depth understanding of, and expertise in, finance and accounting to the Board of Directors.
Ms. Campbell has served as President of Peacock, NBCUniversal’s streaming service, since November 1, 2021. Prior to joining Peacock, Ms. Campbell served as President of Hulu from February 2020 to October 2021 and asChief Marketing Officer of Hulu from August 2017 to February 2020. From 2005 to 2017, Ms. Campbell held a variety of roles at Google across the Google Ads and Google Cloud businesses. Ms. Campbell brings a wealth ofknowledge and experience about marketing and subscription businesses to the Board of Directors. Ms. Campbell was initially identified by Diversified Search, an outside search firm.
Ms. Singh Cassidy is chairman of theBoardlist, a premium talent marketplace she founded in 2015 that is aimed at connecting highly endorsed women leaders with board opportunities in the technology industry. Ms. SinghCassidy is also a founding venture partner of the Diversify Capital Fund, a growth stage investment fund from Acrew Capital, since January 2021. From May 2018 to June 2020, she was President of StubHub, a ticket exchange andresale company, where she helped lead the company’s $4.05 billion sale to Viagogo in February 2020. Ms. Singh Cassidy served as chief executive officer of Joyus, a video commerce platform she founded from January 2011 untilFebruary 2017. She has previously held various executive and managerial positions at companies including Google, Amazon, Polyvore, Inc., Accel Partners, Yodlee.com, News Corporation, and Merrill Lynch & Co., Inc. Ms. SinghCassidy currently serves on the board of Upstart, Inc., a technology company in financial services, which she joined in February 2020, and has served on the boards of Trip Advisor, Inc., LM Ericsson Telephone Company, J. CrewGroup, Inc., J. Hilburn, Inc., StitchFix, Inc., and Polyvore, Inc. As a consumer Internet and media executive, Ms. Singh Cassidy’s in-depth knowledge of the online media and advertising sectors, as well as her extensive executive,strategic and operational experience, bring a plethora of talent and expertise to the Board of Directors.
Mr. Cherken is Senior Counsel at the law firm of Faegre Drinker Biddle & Reath LLP in Philadelphia, Pennsylvania. He was previously a partner of that firm from November 1984 to January 2020, is a former managingpartner of that firm and also served as either Chair or Co-Chair of its Real Estate Group for 18 years. As a real estate lawyer for over 45 years representing public and private companies in the acquisition, construction, development,financing, leasing, management, consolidation and disposition of commercial real estate, he has extensive experience with various types of real estate transactions and retail leases, including negotiating real estate transactions and leaseson behalf of the Company nearly from its inception. He also holds a Masters in Liberal Arts degree and serves as a trustee of various not-for-profit entities and academic institutions. In 2021, Mr. Cherken was appointed HonoraryConsul for Philadelphia of the Republic of Armenia.
Ms. Lambert is a partner of Lambert McGuire Design, an architecture and interior design studio based in Austin, Texas, which she founded in 2019, that works on various restaurant, hotel and retail projects. Ms. Lambert isalso the owner of El Cosmico, an 18-acre vintage trailer, tepee, tent hotel and event space in Marfa, Texas, that she founded in 2009. Previously, Ms. Lambert founded and served as partner of Bunkhouse Group, an Austin hospitalitymanagement company from 2006 to 2019. Prior to her experience as a hotelier, Ms. Lambert worked as a prosecutor in the New York County District Attorney’s office and the Austin, Texas Attorney General’s office. Currently, Ms.Lambert also serves on the Board of Directors of the National Council on Crime & Delinquency. Ms. Lambert’s experience growing a design-centric and customer-focused hospitality company from the ground up gives her a uniqueperspective and set of skills to contribute to the Board of Directors.
37
Mr. Maredia is a Co-founder of, and Managing Partner at Meaningful Partners, a consumer-focused fund that invests in purpose, mission and consumer relevant businesses in the consumer sector. Prior to co-foundingMeaningful Partners in 2018, Mr. Maredia served as the Chief Executive Officer of Sprouts Farmers Market, Inc (“Sprouts”), the second largest healthy grocer in the United States, beginning in 2015 and also served on the board ofdirectors of Sprouts. Mr. Maredia also served as Chief Financial Officer of Sprouts from 2011 to 2015. Before Sprouts, Mr. Maredia served in key global strategic roles at Burger King Corporation including leading strategy, globalbusiness development and finance. Mr. Maredia has also been deeply involved in local and global community work for over two decades around health, education and economic development with various domestic and globalorganizations including the Aga Khan Development Network, the Sprouts Healthy Communities Foundation, Teach for America and Pratham USA. Mr. Maredia attended the Harvard Business School management program and has anundergraduate degree in Accounting from the University of Houston. Mr. Maredia’s in-depth experience in the consumer sector, including high growth omni-channel businesses, as well as his public company experience as ChiefExecutive Officer, Chief Financial Officer and board member brings valuable expertise to serve as a director.
Mr. McDonald has been retired since 2017. Previously, he held the principal officer position of Chief Financial Officer of Kohl’s Corporation from 2015 to 2017, and prior thereto, he served as Senior Executive Vice Presidentand Chief Financial Officer of Kohl’s beginning in 2010. Mr. McDonald began his tenure at Kohl’s in 2003 as its Executive Vice President and Chief Financial Officer. Before joining Kohl’s, Mr. McDonald served as Chief FinancialOfficer and Vice President of Abercrombie & Fitch Co. Earlier in his career, he held several positions of increasing responsibility at Target Corporation. Mr. McDonald currently serves on the Board of Directors of Wingstop Inc., whichoperates and franchises over 1,500 restaurants worldwide. Mr. McDonald’s experience as a chief financial officer and in other senior executive leadership roles working with publicly traded consumer products companies provides himwith a distinctive set of qualifications and skills to serve as a director.
Mr. Morgenfeld is the Chief Financial Officer and Head of Business Operations of Pinterest, Inc., a position he has held since 2019. From 2016 to 2019, he served as Chief Financial Officer of Pinterest, Inc. Before joiningPinterest, Mr. Morgenfeld served as Vice President of Finance at Twitter from 2015 to 2016 and Treasurer and Senior Vice President of Corporate Development and Corporate Financial Analytics for Hewlett-Packard Company from2013 to 2015. Prior to his role at Hewlett-Packard, Mr. Morgenfeld was an investment partner at Silver Lake Partners from 2004 to 2013. Mr. Morgenfeld graduated first in his class from the United States Military Academy and alsoholds an MBA degree from Stanford University. Mr. Morgenfeld has served as a director of a not-for-profit entity and as chairman of the board and member of the audit committee of a public company. His significant finance andconsumer internet experience provides valuable expertise to the Board of Directors.
Mr. Mulliken currently serves as a Senior Advisor with The Boston Consulting Group (“BCG”), a global management consulting firm where Mr. Mulliken previously served as a management consultant on topics of retail,
consumer goods and technology, and a frequent advisor to high growth technology companies. Prior to re-joining BCG in 2020, Mr. Mulliken served on the executive team at Wayfair Inc. for a decade, serving as Chief TechnologyOfficer and Senior Vice President of Strategic Initiatives. Mr. Mulliken founded and led several lifestyle brands including Joss & Main and Birch Lane. He also led the acquisition and integration of DwellStudio as well as the ground-upcreation of a proprietary ad tech business and tech stack. Mr. Mulliken previously served as the Chief Integrated Product Officer at IndigoAg, an agricultural technology company. Mr. Mulliken also serves on the board at Bombas, adirect-to-consumer apparel company. Mr. Mulliken has a 25-year track record of leading innovation and growth as a technology executive and management consultant. Mr. Mulliken earned his undergraduate degree in Mathematicsfrom Reed College and his MBA in Corporate Finance from London Business School. Mr. Mulliken’s decades of experience in ecommerce and multichannel retail as Chief Technology Officer and member of the executive team of apublicly traded company, as well as a strategy consultant and independent director, provides him valuable perspective as a director.
Ms. Egan has been serving as an independent strategy consultant to high growth private equity and venture-capital backed consumer companies since 2018, currently as principal of Egan Advisory Group. In 2013, Ms. Egan
founded Gatheredtable, a consumer software as a service company offering customized meal planning, and served as its Chief Executive Officer until Gatheredtable was sold to a strategic buyer in 2018. From 2010 to 2012, Ms. Eganserved as head of global strategy and corporate development for Starbucks Corporation and in 2012 led Starbucks’ food category in the Americas. From 1996 to 2010, Ms. Egan was a management consultant and Managing Director atThe Boston Consulting Group, where she partnered with several leading consumer and retail brands to develop and successfully implement aggressive growth strategies. Ms. Egan also serves on the board of directors of AmericanCampus Communities, Inc. and Noodles & Company. Ms. Egan’s decades of experience partnering with management teams to develop and implement consumer-centric strategies for high growth omnichannel consumer brands, as wellas working extensively with founders and entrepreneurs, gives her a unique set of skills to contribute to the Board of Directors. The Board of Directors has proposed to include Ms. Egan as a nominee to the Company’s Board ofDirectors in the Company’s Proxy Statement for the 2022 Annual Meeting of Shareholders upon recommendation by the Nominating and Governance Committee and initial identification by Diversified Search, an outside search firm.
Code of Conduct and Ethics
We have a written Code of Conduct and Ethics (the “Code”) that applies to our directors and employees, including our Chief Executive Officer, Chief Financial Officer and Principal Accounting Officer. The Code includesguidelines relating to compliance with laws, including anti-bribery and illegal payment laws, the ethical handling of actual or potential conflicts of interest, the use of
38

corporate opportunities, protection and use of our confidential information, accepting gifts and business courtesies, accurate financial reporting and procedures for promoting compliance with, and reporting violations of, the Code. TheCode is available on our website at www.urbn.com. We intend to post any amendments to the Code and also to disclose any waivers (to the extent applicable to the Company’s Chief Executive Officer, Chief Financial Officer orPrincipal Accounting Officer) on our website.
Other Information
Other information required by Item 10 relating to the Company’s directors is incorporated herein by reference from the Company’s Proxy Statement for the 2022 Annual Meeting of Shareholders.
Item 11. Executive CompensationInformation required by this item is incorporated herein by reference from the Company’s Proxy Statement for the 2022 Annual Meeting of Shareholders.
Item 12. Security Ownership of Certain Beneficial Owners and Management and Related Shareholder Matters
Information required by this item is incorporated herein by reference from the Company’s Proxy Statement for the 2022 Annual Meeting of Shareholders.
Item 13. Certain Relationships and Related Transactions, and Director IndependenceInformation required by this item is incorporated herein by reference from the Company’s Proxy Statement for the 2022 Annual Meeting of Shareholders.
Item 14. Principal Accountant Fees and ServicesOur independent registered public accounting firm is Deloitte & Touche LLP (PCAOB ID No. 34). Information required by this item is incorporated herein by reference from the Company’s Proxy Statement for the 2022
Annual Meeting of Shareholders.
39

PART IV
Item 15. Exhibits and Financial Statement Schedules(a) The following documents are filed as part of this Annual Report on Form 10-K:
(1) Financial StatementsConsolidated Financial Statements filed herewith are listed in the accompanying index on page F-1.
(2) Financial Statement Schedule
NoneAll other schedules are omitted because they are not applicable or not required, or because the required information is included in the Consolidated Financial Statements or notes thereto.
(3) Exhibits
The Exhibits listed below are filed as part of, or incorporated by reference into, this Annual Report on Form 10-K. ExhibitNumber
Description
3.1 Amended and Restated Articles of Incorporation are incorporated by reference to Exhibit 3.1 of the Company’s Quarterly Report on Form 10-Q (file no. 000-22754) filed on September 9, 2004.
3.2 Amendment No. 1 to Amended and Restated Articles of Incorporation is incorporated by reference to Exhibit 3.2 of the Company’s Quarterly Report on Form 10-Q (file no. 000-22754) filed on September 9,2004.
3.3 Amendment No. 2 to Amended and Restated Articles of Incorporation is incorporated by reference to Exhibit 3.1 of the Company’s Current Report on Form 8-K (file no. 000-22754) filed on May 31, 2013.
3.4 Amended and Restated By-laws are incorporated by reference to Exhibit 3.1 of the Company’s Current Report on Form 8-K filed on March 30, 2020.
4.1 Description of Registrant’s Securities Registered Pursuant to Section 12 is incorporated by reference to Exhibit 4.1 of the Company’s Annual Report on Form 10-K (file no. 000-22754) filed on March 31, 2020.
10.1 Credit Agreement, dated June 29, 2018, by and among Urban Outfitters, Inc., its domestic subsidiaries, URBN Canada Retail, Inc., JPMorgan Chase Bank, N.A., as administrative agent, J.P. Morgan Chase Bank,N.A. and Wells Fargo Bank, National Association, as joint lead arrangers and co-book managers, and certain other lenders party thereto is incorporated by reference to Exhibit 10.1 of the Company’s QuarterlyReport on Form 10-Q filed on September 10, 2018.
10.2 Amended and Restated U.S. Pledge and Security Agreement, dated June 29, 2018, by and among Urban Outfitters, Inc., its domestic subsidiaries, URBN Canada Retail, Inc., and JPMorgan Chase Bank, N.A., inits capacity as administrative agent is incorporated by reference to Exhibit 10.2 of the Company’s Quarterly Report on Form 10-Q filed on September 10, 2018.
10.3+ Urban Outfitters 2004 Stock Incentive Plan is incorporated by reference to Appendix B of the Company’s Definitive Proxy Statement on Schedule 14A (file no. 000-22754) filed on April 26, 2004 and AmendmentNo. 1 to the Urban Outfitters 2004 Stock Incentive Plan is incorporated by reference to Appendix A of the Company’s Definitive Proxy Statement on Schedule 14A (file no. 000-22754) filed on April 25, 2005.
10.4+ Urban Outfitters 401(k) Savings Plan (formerly known as The Urban Outfitters, Inc. PROFIT SHARING FUND prior to July 1, 1999) is incorporated by reference to Exhibit 10.4 of the Company’s AmendmentNo. 2 to the Registration Statement on Form S-1/A (file no. 033-69378) filed on November 3, 1993. (P)
10.5+ Urban Outfitters 2008 Stock Incentive Plan is incorporated by reference to Appendix B of the Company’s Definitive Proxy Statement on Schedule 14A (file no. 000-22754) filed on April 2, 2013.
10.6+ Urban Outfitters Executive Incentive Plan, as amended and restated effective February 1, 2010, is incorporated by reference to Appendix A of the Company’s Definitive Proxy Statement on Schedule 14A filed onApril 1, 2015.
10.7+ Urban Outfitters 2017 Stock Incentive Plan is incorporated by reference to Exhibit 10.7 of the Company’s Annual Report on Form 10-K filed on April 3, 2017.
10.8+ Form of 2004 Plan—Non-Qualified Stock Option Agreement is incorporated by reference to Exhibit 99.1 of the Company’s Current Report on Form 8-K (file no. 000-22754) filed on June 18, 2009.
10.9+ Form of 2004 Plan—Non-Qualified Stock Option Agreement for Non-Employee Directors is incorporated by reference to Exhibit 99.2 of the Company’s Current Report on Form 8-K (file no. 000-22754) filed onJune 18, 2009.
40
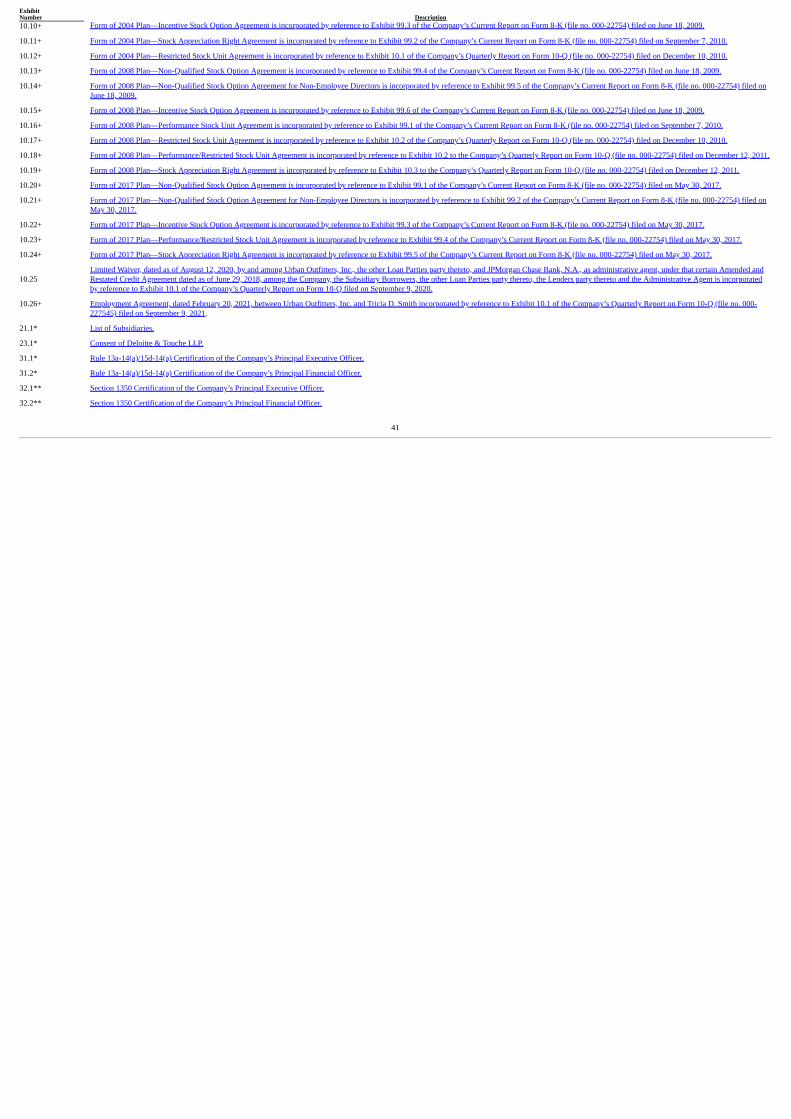
ExhibitNumber
Description
10.10+ Form of 2004 Plan—Incentive Stock Option Agreement is incorporated by reference to Exhibit 99.3 of the Company’s Current Report on Form 8-K (file no. 000-22754) filed on June 18, 2009.
10.11+ Form of 2004 Plan—Stock Appreciation Right Agreement is incorporated by reference to Exhibit 99.2 of the Company’s Current Report on Form 8-K (file no. 000-22754) filed on September 7, 2010.
10.12+ Form of 2004 Plan—Restricted Stock Unit Agreement is incorporated by reference to Exhibit 10.1 of the Company’s Quarterly Report on Form 10-Q (file no. 000-22754) filed on December 10, 2010.
10.13+ Form of 2008 Plan—Non-Qualified Stock Option Agreement is incorporated by reference to Exhibit 99.4 of the Company’s Current Report on Form 8-K (file no. 000-22754) filed on June 18, 2009.
10.14+ Form of 2008 Plan—Non-Qualified Stock Option Agreement for Non-Employee Directors is incorporated by reference to Exhibit 99.5 of the Company’s Current Report on Form 8-K (file no. 000-22754) filed onJune 18, 2009.
10.15+ Form of 2008 Plan—Incentive Stock Option Agreement is incorporated by reference to Exhibit 99.6 of the Company’s Current Report on Form 8-K (file no. 000-22754) filed on June 18, 2009.
10.16+ Form of 2008 Plan—Performance Stock Unit Agreement is incorporated by reference to Exhibit 99.1 of the Company’s Current Report on Form 8-K (file no. 000-22754) filed on September 7, 2010.
10.17+ Form of 2008 Plan—Restricted Stock Unit Agreement is incorporated by reference to Exhibit 10.2 of the Company’s Quarterly Report on Form 10-Q (file no. 000-22754) filed on December 10, 2010.
10.18+ Form of 2008 Plan—Performance/Restricted Stock Unit Agreement is incorporated by reference to Exhibit 10.2 to the Company’s Quarterly Report on Form 10-Q (file no. 000-22754) filed on December 12, 2011.
10.19+ Form of 2008 Plan—Stock Appreciation Right Agreement is incorporated by reference to Exhibit 10.3 to the Company’s Quarterly Report on Form 10-Q (file no. 000-22754) filed on December 12, 2011.
10.20+ Form of 2017 Plan—Non-Qualified Stock Option Agreement is incorporated by reference to Exhibit 99.1 of the Company’s Current Report on Form 8-K (file no. 000-22754) filed on May 30, 2017.
10.21+ Form of 2017 Plan—Non-Qualified Stock Option Agreement for Non-Employee Directors is incorporated by reference to Exhibit 99.2 of the Company’s Current Report on Form 8-K (file no. 000-22754) filed onMay 30, 2017.
10.22+ Form of 2017 Plan—Incentive Stock Option Agreement is incorporated by reference to Exhibit 99.3 of the Company’s Current Report on Form 8-K (file no. 000-22754) filed on May 30, 2017.
10.23+ Form of 2017 Plan—Performance/Restricted Stock Unit Agreement is incorporated by reference to Exhibit 99.4 of the Company’s Current Report on Form 8-K (file no. 000-22754) filed on May 30, 2017.
10.24+ Form of 2017 Plan—Stock Appreciation Right Agreement is incorporated by reference to Exhibit 99.5 of the Company’s Current Report on Form 8-K (file no. 000-22754) filed on May 30, 2017.
10.25 Limited Waiver, dated as of August 12, 2020, by and among Urban Outfitters, Inc., the other Loan Parties party thereto, and JPMorgan Chase Bank, N.A., as administrative agent, under that certain Amended and
Restated Credit Agreement dated as of June 29, 2018, among the Company, the Subsidiary Borrowers, the other Loan Parties party thereto, the Lenders party thereto and the Administrative Agent is incorporatedby reference to Exhibit 10.1 of the Company’s Quarterly Report on Form 10-Q filed on September 9, 2020.
10.26+ Employment Agreement, dated February 20, 2021, between Urban Outfitters, Inc. and Tricia D. Smith incorporated by reference to Exhibit 10.1 of the Company’s Quarterly Report on Form 10-Q (file no. 000-227545) filed on September 9, 2021.
21.1* List of Subsidiaries.
23.1* Consent of Deloitte & Touche LLP.
31.1* Rule 13a-14(a)/15d-14(a) Certification of the Company’s Principal Executive Officer.
31.2* Rule 13a-14(a)/15d-14(a) Certification of the Company’s Principal Financial Officer.
32.1** Section 1350 Certification of the Company’s Principal Executive Officer.
32.2** Section 1350 Certification of the Company’s Principal Financial Officer.
41

ExhibitNumber
Description
101.INS* Inline XBRL Instance Document
101.SCH* Inline XBRL Taxonomy Extension Schema
101.CAL* Inline XBRL Taxonomy Extension Calculation Linkbase
101.LAB* Inline XBRL Taxonomy Extension Label Linkbase
101.PRE* Inline XBRL Taxonomy Extension Presentation Linkbase
101.DEF* Inline XBRL Taxonomy Extension Definition Linkbase
104 Cover Page Interactive Data File (formatted as inline XBRL and contained in Exhibit 101)
* Filed herewith** Furnished herewith+ Compensatory planP Paper filing
Item 16. Form 10-K Summary
None.
42

SIGNATURES
Pursuant to the requirements of Section 13 or 15(d) of the Securities Exchange Act of 1934, the registrant has duly caused this report to be signed on its behalf by the undersigned, thereunto duly authorized. URBAN OUTFITTERS, INC. April 1, 2022 By: /s/ RICHARD A. HAYNE Richard A. Hayne
Chief Executive Officer
(Principal Executive Officer)
Pursuant to the requirements of the Securities Exchange Act of 1934, this report has been signed below by the following persons on behalf of the registrant and in the capacities and on the dates indicated.
Signature Title Date
/ S / RICHARD A. HAYNE Richard A. Hayne
(Principal Executive Officer)
Chairman of the Board and Chief Executive Officer
April 1, 2022
/ S / MELANIE MAREIN-EFRON
Melanie Marein-Efron(Principal Financial and Accounting Officer)
Chief Financial Officer
April 1, 2022
/ S / EDWARD N. ANTOIAN
Edward N. Antoian
Director
April 1, 2022
/ S / KELLY CAMPBELL Kelly Campbell
/ S / SUKHINDER SINGH CASSIDY
Sukhinder Singh Cassidy
Director April 1, 2022
Director
April 1, 2022
/ S / HARRY S. CHERKEN, JR.
Harry S. Cherken Jr. Director
April 1, 2022
/ S / MARGARET A. HAYNE
Margaret A. Hayne Director
April 1, 2022
/ S / ELIZABETH A. LAMBERT
Elizabeth A. Lambert Director
April 1, 2022
/ S / AMIN N. MAREDIA
Amin N. Maredia Director
April 1, 2022
/ S / WESLEY MCDONALD
Wesley McDonald Director
April 1, 2022
/ S / TODD R. MORGENFELD
Todd R. Morgenfeld Director
April 1, 2022
/ S / JOHN C. MULLIKEN
John C. Mulliken Director
April 1, 2022
43

URBAN OUTFITTERS, INC.INDEX TO CONSOLIDATED FINANCIAL STATEMENTS
Page Report of Independent Registered Public Accounting Firm—Deloitte & Touche LLP F-2 Consolidated Balance Sheets as of January 31, 2022 and January 31, 2021 F-4 Consolidated Statements of Income for the fiscal years ended January 31, 2022, 2021 and 2020 F-5 Consolidated Statements of Comprehensive Income for the fiscal years ended January 31, 2022, 2021 and 2020 F-6 Consolidated Statements of Shareholders’ Equity for the fiscal years ended January 31, 2022, 2021 and 2020 F-7 Consolidated Statements of Cash Flows for the fiscal years ended January 31, 2022, 2021 and 2020 F-8 Notes to Consolidated Financial Statements F-9
F-1

REPORT OF INDEPENDENT REGISTERED PUBLIC ACCOUNTING FIRM
To the Shareholders and the Board of Directors of Urban Outfitters, Inc. Opinion on the Financial Statements We have audited the accompanying consolidated balance sheets of Urban Outfitters, Inc. and subsidiaries (the "Company") as of January 31, 2022 and 2021, the related consolidated statements of income, comprehensive income,shareholders' equity, and cash flows for each of the three years in the period ended January 31, 2022, and the related notes (collectively referred to as the "financial statements"). In our opinion, the financial statements present fairly, inall material respects, the financial position of the Company as of January 31, 2022 and 2021, and the results of its operations and its cash flows for each of the three years in the period ended January 31, 2022, in conformity withaccounting principles generally accepted in the United States of America. We have also audited, in accordance with the standards of the Public Company Accounting Oversight Board (United States) (PCAOB), the Company's internal control over financial reporting as of January 31, 2022, based on criteriaestablished in lnternal Control - lntegrated Framework (2013) issued by the Committee of Sponsoring Organizations of the Treadway Commission and our report dated April 1, 2022, expressed an unqualified opinion on the Company'sinternal control over financial reporting. Basis for Opinion These financial statements are the responsibility of the Company's management. Our responsibility is to express an opinion on the Company's financial statements based on our audits. We are a public accounting firm registered with thePCAOB and are required to be independent with respect to the Company in accordance with the U.S. federal securities laws and the applicable rules and regulations of the Securities and Exchange Commission and the PCAOB. We conducted our audits in accordance with the standards of the PCAOB. Those standards require that we plan and perform the audit to obtain reasonable assurance about whether the financial statements are free of materialmisstatement, whether due to error or fraud. Our audits included performing procedures to assess the risks of material misstatement of the financial statements, whether due to error or fraud, and performing procedures that respond tothose risks. Such procedures included examining, on a test basis, evidence regarding the amounts and disclosures in the financial statements. Our audits also included evaluating the accounting principles used and significant estimatesmade by management, as well as evaluating the overall presentation of the financial statements. We believe that our audits provide a reasonable basis for our opinion. Critical Audit Matter The critical audit matter communicated below is a matter arising from the current-period audit of the financial statements that was communicated or required to be communicated to the audit committee and that (1) relates to accounts ordisclosures that are material to the financial statements and (2) involved our especially challenging, subjective, or complex judgments. The communication of critical audit matters does not alter in any way our opinion on the financialstatements, taken as a whole, and we are not, by communicating the critical audit matter below, providing a separate opinion on the critical audit matter or on the accounts or disclosures to which it relates. Retail Location Asset Impairment — Refer to Note 2 to the financial statements
Critical Audit Matter Description The Company evaluates retail location assets for impairment when events or changes in circumstances exist that may indicate that the carrying amounts of retail location assets may not be recoverable. Events that result in animpairment review include plans to close a retail location, a significant decrease in the operating results of the retail location or significant adverse changes in the business climate. When such events or changes in circumstances occur,the Company evaluates its retail location assets for impairment by comparing the undiscounted future cash flows expected to be generated by the location to the location assets’ carrying amount. If the carrying amount of the locationassets exceed the estimated undiscounted future cash flows, an analysis is performed to estimate the fair value of the assets. An impairment charge is recorded if the fair value of the retail location assets is less than the carrying amount. The Company makes significant assumptions to evaluate retail location assets for possible indications of impairment. When an indication of impairment is identified, management makes significant assumptions to estimate cash flowsfrom forecasts of sales and gross profit for retail locations and, when the carrying amount of the location assets exceed those cash flows, to determine the fair value of the Company’s operating lease right-of-use assets. Given the Company’s evaluation of retail location asset impairment requires management to make significant assumptions, performing audit procedures to evaluate whether management appropriately identified events or changes incircumstances indicating that the
F-2
carrying amounts of retail location assets may not be recoverable, and, when applicable, developed reasonable forecasts of sales and gross profit and fair value estimates for operating lease right-of-use assets, including the methodologyapplied and the measurement inputs of market rent, required a high degree of auditor judgment and an increased extent of effort, including the assistance of our fair value specialists. How the Critical Audit Matter Was Addressed in the Audit Our audit procedures to evaluate whether management appropriately identified events or changes in circumstances indicating that the carrying amounts of retail location assets may not be recoverable, and, when applicable, developedreasonable forecasts of sales and gross profit and determined fair value estimates for operating lease right-of-use assets, included the following, among others: • We tested the effectiveness of the controls over management’s identification of events or changes in circumstances that indicate that the carrying amounts of retail location assets may not be recoverable, the review of
forecasts of sales and gross profit and the review of the methodology and the measurement inputs of market rent, underlying the fair value estimates for operating lease right-of-use assets.
• We evaluated management’s impairment analysis by:
- Testing retail location assets for possible indications of impairment, including searching for locations with a current period loss and a history of losses.
- Evaluating whether the events or changes in circumstances that may have existed were identified by management, consistent with evidence obtained in other areas of the audit.
• We evaluated management’s ability to accurately estimate cash flow from forecasts of sales and gross profit for retail locations and the reasonableness of the forecasts by comparing them to:
- Historical sales and gross profit.
- Internal communications to management and the board of directors. - External communications made by management to analysts and investors. - External information regarding retail industry growth and trends. • With the assistance of our fair value specialists, we evaluated the reasonableness of the valuation methodology applied and fair value determined for the lease right-of-use assets by:
- Testing the methodology applied and measurement inputs of market rent, underlying the determination of the fair value and the mathematical accuracy of the calculation.
- Developing a range of independent estimates and comparing those to the fair value determined by management. /s/ Deloitte & Touche LLP Philadelphia, PennsylvaniaApril 1, 2022 We have served as the Company's auditor since 2005.
F-3

URBAN OUTFITTERS, INC.Consolidated Balance Sheets
(in thousands, except share and per share data)
January 31, January 31, 2022 2021
ASSETS Current assets:
Cash and cash equivalents $ 206,575 $ 395,635 Marketable securities 239,420 174,695 Accounts receivable, net of allowance for doubtful accounts of $1,348 and $4,028, respectively 63,760 89,952 Inventory 569,699 389,618 Prepaid expenses and other current assets 206,293 173,432
Total current assets 1,285,747 1,223,332 Property and equipment, net 1,145,085 967,422 Operating lease right-of-use assets 1,000,255 1,114,762 Marketable securities 223,557 123,662 Deferred income taxes and other assets 136,703 117,167
Total Assets $ 3,791,347 $ 3,546,345 LIABILITIES AND SHAREHOLDERS’ EQUITY
Current liabilities: Accounts payable $ 304,246 $ 237,386 Current portion of operating lease liabilities 236,315 254,703 Accrued compensation and benefits 89,914 54,796 Accrued expenses and other current liabilities 350,998 359,247
Total current liabilities 981,473 906,132 Non-current portion of operating lease liabilities 951,080 1,074,009 Long-term debt — — Deferred rent and other liabilities 113,054 88,846
Total Liabilities 2,045,607 2,068,987 Commitments and contingencies (see Note 15) Shareholders’ equity:
Preferred shares; $.0001 par value, 10,000,000 shares authorized, none issued — — Common shares; $.0001 par value, 200,000,000 shares authorized, 96,431,044 and 97,815,985 shares issued and outstanding, respectively 10 10 Additional paid-in-capital — 19,360 Retained earnings 1,770,560 1,475,108 Accumulated other comprehensive loss (24,830) (17,120)
Total Shareholders’ Equity 1,745,740 1,477,358 Total Liabilities and Shareholders’ Equity $ 3,791,347 $ 3,546,345
The accompanying notes are an integral part of these consolidated financial statements.
F-4
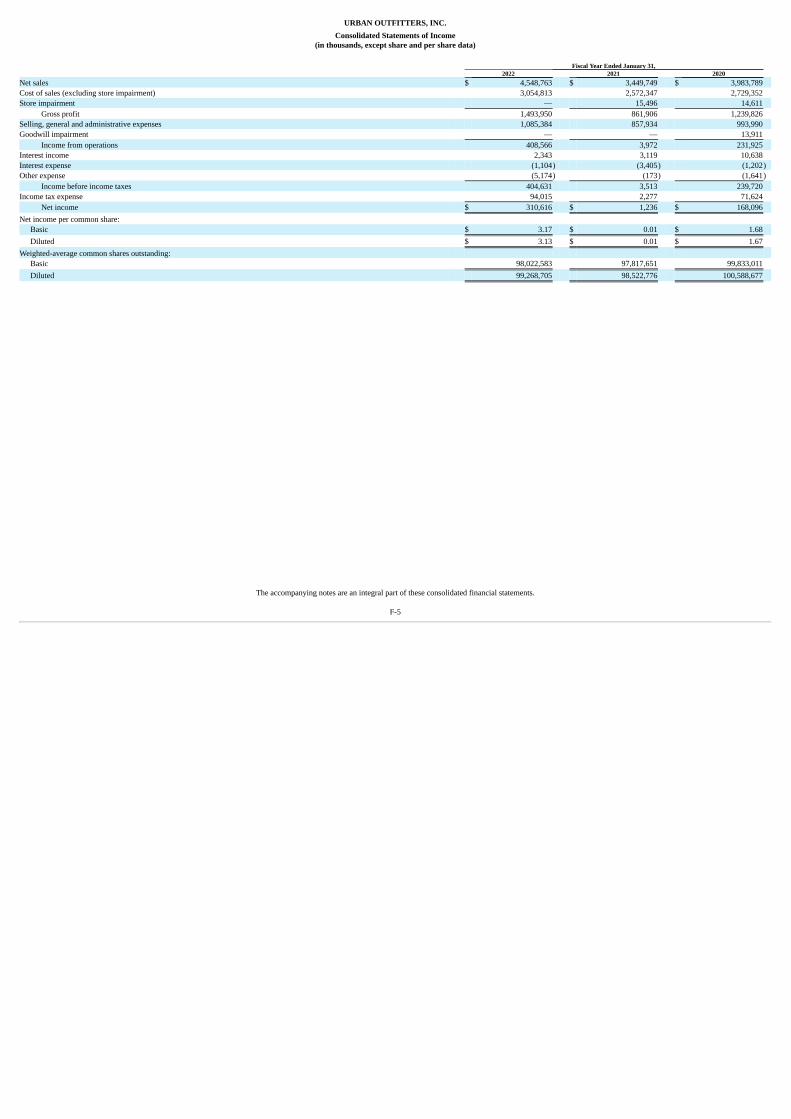
URBAN OUTFITTERS, INC.
Consolidated Statements of Income(in thousands, except share and per share data)
Fiscal Year Ended January 31, 2022 2021 2020
Net sales $ 4,548,763 $ 3,449,749 $ 3,983,789 Cost of sales (excluding store impairment) 3,054,813 2,572,347 2,729,352 Store impairment — 15,496 14,611
Gross profit 1,493,950 861,906 1,239,826 Selling, general and administrative expenses 1,085,384 857,934 993,990 Goodwill impairment — — 13,911
Income from operations 408,566 3,972 231,925 Interest income 2,343 3,119 10,638 Interest expense (1,104) (3,405) (1,202)Other expense (5,174) (173) (1,641)
Income before income taxes 404,631 3,513 239,720 Income tax expense 94,015 2,277 71,624
Net income $ 310,616 $ 1,236 $ 168,096 Net income per common share:
Basic $ 3.17 $ 0.01 $ 1.68 Diluted $ 3.13 $ 0.01 $ 1.67
Weighted-average common shares outstanding: Basic 98,022,583 97,817,651 99,833,011 Diluted 99,268,705 98,522,776 100,588,677
The accompanying notes are an integral part of these consolidated financial statements.
F-5

URBAN OUTFITTERS, INC.
Consolidated Statements of Comprehensive Income(in thousands)
Fiscal Year Ended January 31, 2022 2021 2020
Net income $ 310,616 $ 1,236 $ 168,096 Other comprehensive (loss) income:
Foreign currency translation (5,254) 11,378 (1,403)Change in unrealized (losses) gains on marketable securities, net of tax (2,456) (494) 502
Total other comprehensive (loss) income (7,710) 10,884 (901)Comprehensive income $ 302,906 $ 12,120 $ 167,195
The accompanying notes are an integral part of these consolidated financial statements.
F-6
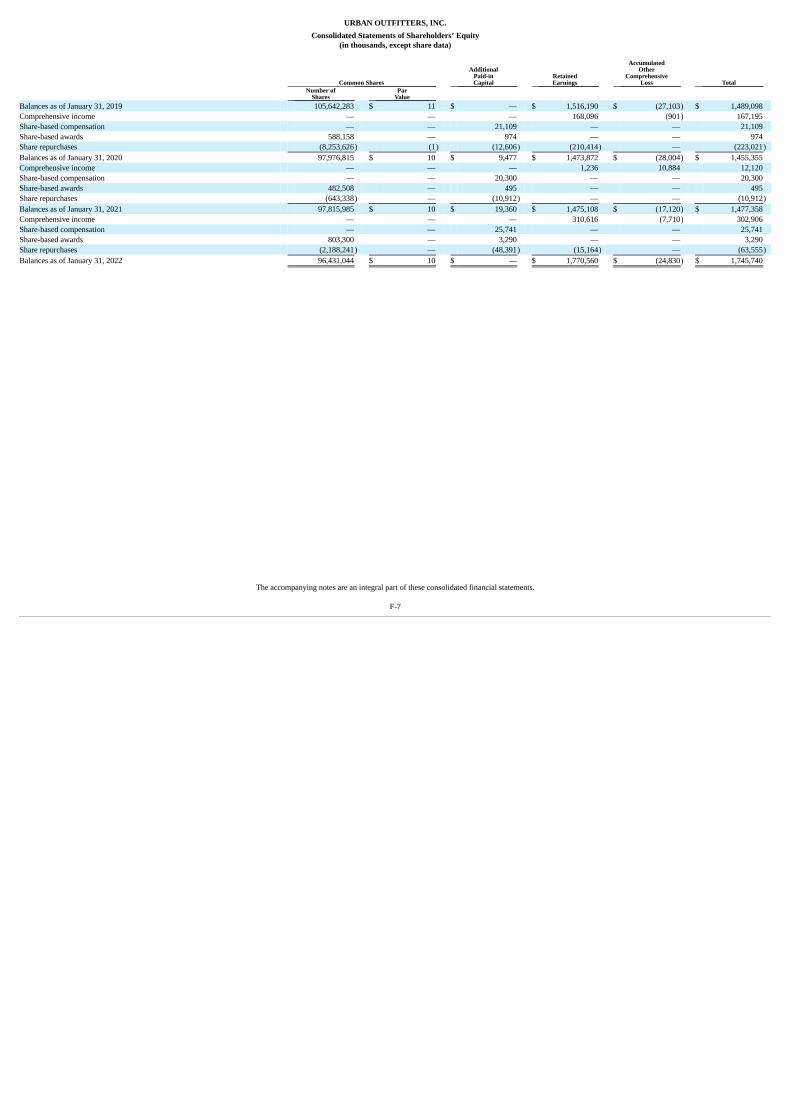
URBAN OUTFITTERS, INC.
Consolidated Statements of Shareholders’ Equity(in thousands, except share data)
Common Shares
AdditionalPaid-inCapital
RetainedEarnings
AccumulatedOther
ComprehensiveLoss Total
Number of
Shares Par
Value Balances as of January 31, 2019 105,642,283 $ 11 $ — $ 1,516,190 $ (27,103) $ 1,489,098 Comprehensive income — — — 168,096 (901) 167,195 Share-based compensation — — 21,109 — — 21,109 Share-based awards 588,158 — 974 — — 974 Share repurchases (8,253,626) (1) (12,606) (210,414) — (223,021)Balances as of January 31, 2020 97,976,815 $ 10 $ 9,477 $ 1,473,872 $ (28,004) $ 1,455,355 Comprehensive income — — — 1,236 10,884 12,120 Share-based compensation — — 20,300 — — 20,300 Share-based awards 482,508 — 495 — — 495 Share repurchases (643,338) — (10,912) — — (10,912)Balances as of January 31, 2021 97,815,985 $ 10 $ 19,360 $ 1,475,108 $ (17,120) $ 1,477,358 Comprehensive income — — — 310,616 (7,710) 302,906 Share-based compensation — — 25,741 — — 25,741 Share-based awards 803,300 — 3,290 — — 3,290 Share repurchases (2,188,241) — (48,391) (15,164) — (63,555)Balances as of January 31, 2022 96,431,044 $ 10 $ — $ 1,770,560 $ (24,830) $ 1,745,740
The accompanying notes are an integral part of these consolidated financial statements.
F-7
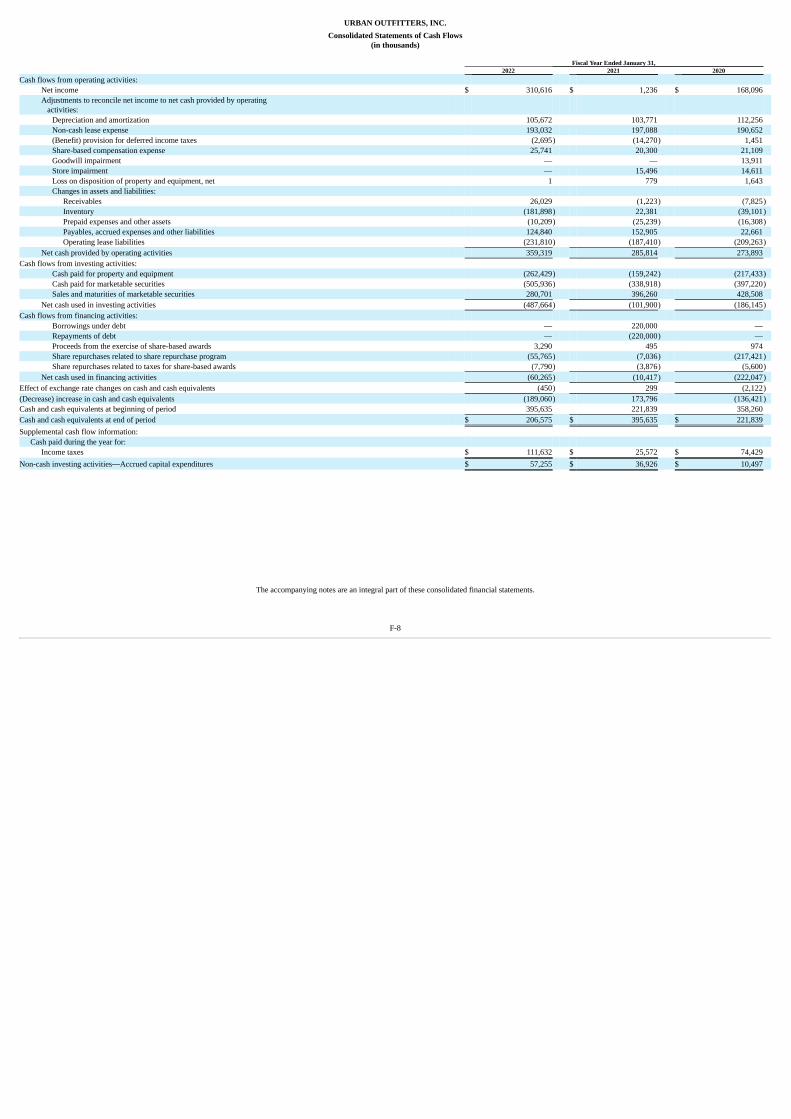
URBAN OUTFITTERS, INC.
Consolidated Statements of Cash Flows(in thousands)
Fiscal Year Ended January 31, 2022 2021 2020
Cash flows from operating activities: Net income $ 310,616 $ 1,236 $ 168,096 Adjustments to reconcile net income to net cash provided by operating activities:
Depreciation and amortization 105,672 103,771 112,256 Non-cash lease expense 193,032 197,088 190,652 (Benefit) provision for deferred income taxes (2,695) (14,270) 1,451 Share-based compensation expense 25,741 20,300 21,109 Goodwill impairment — — 13,911 Store impairment — 15,496 14,611 Loss on disposition of property and equipment, net 1 779 1,643 Changes in assets and liabilities:
Receivables 26,029 (1,223) (7,825)Inventory (181,898) 22,381 (39,101)Prepaid expenses and other assets (10,209) (25,239) (16,308)Payables, accrued expenses and other liabilities 124,840 152,905 22,661 Operating lease liabilities (231,810) (187,410) (209,263)
Net cash provided by operating activities 359,319 285,814 273,893 Cash flows from investing activities:
Cash paid for property and equipment (262,429) (159,242) (217,433)Cash paid for marketable securities (505,936) (338,918) (397,220)Sales and maturities of marketable securities 280,701 396,260 428,508
Net cash used in investing activities (487,664) (101,900) (186,145)Cash flows from financing activities:
Borrowings under debt — 220,000 — Repayments of debt — (220,000) — Proceeds from the exercise of share-based awards 3,290 495 974 Share repurchases related to share repurchase program (55,765) (7,036) (217,421)Share repurchases related to taxes for share-based awards (7,790) (3,876) (5,600)
Net cash used in financing activities (60,265) (10,417) (222,047)Effect of exchange rate changes on cash and cash equivalents (450) 299 (2,122)(Decrease) increase in cash and cash equivalents (189,060) 173,796 (136,421)Cash and cash equivalents at beginning of period 395,635 221,839 358,260 Cash and cash equivalents at end of period $ 206,575 $ 395,635 $ 221,839 Supplemental cash flow information:
Cash paid during the year for: Income taxes $ 111,632 $ 25,572 $ 74,429
Non-cash investing activities—Accrued capital expenditures $ 57,255 $ 36,926 $ 10,497
The accompanying notes are an integral part of these consolidated financial statements.
F-8

URBAN OUTFITTERS, INC.NOTES TO CONSOLIDATED FINANCIAL STATEMENTS
(in thousands, except share and per share data)
1. Nature of BusinessUrban Outfitters, Inc. (the “Company” or “Urban Outfitters”), which was founded in 1970, was incorporated in the Commonwealth of Pennsylvania in 1976. The principal business activity of the Company is the operation of a
general consumer product retail, wholesale, subscription and resale business selling to customers through various channels including retail locations, websites, catalogs and mobile applications. As of January 31, 2022 and 2021, theCompany operated 682 and 644 stores, respectively. Stores located in the United States totaled 562 as of January 31, 2022 and 527 as of January 31, 2021. Operations in Europe and Canada included 86 stores and 34 stores as ofJanuary 31, 2022, respectively, and 83 stores and 34 stores as of January 31, 2021, respectively. In addition, the Company’s Wholesale segment sold and distributed apparel to department and specialty stores worldwide, digitalbusinesses and to the Company’s Retail segment. The Company’s Nuuly segment, formerly known as the Subscription segment, consists of the Nuuly brand, which includes Nuuly Rent and Nuuly Thrift. Nuuly Rent is a monthlywomen’s apparel subscription rental service that launched in July 2019. Nuuly Thrift, which launched in October 2021, is a peer-to-peer resale marketplace where customers can buy and sell women’s, men’s, and kids’ apparel, shoes,and accessories from any brands.
Impact of the Coronavirus Pandemic
Impact of the Coronavirus Pandemic on Fiscal 2021
In March 2020, the World Health Organization declared the novel strain of coronavirus (“COVID-19”) a global pandemic. Consequently, the Company announced that it temporarily closed all stores, offices andshowrooms globally, but began to reopen stores in late April 2020. The Company’s distribution and fulfillment centers remained open to support the digital business and the Wholesale segment operations. During the fourth quarter offiscal 2021, certain store operations were again impacted by an additional round of temporary store closures and occupancy restrictions, primarily in Europe and Canada.
In response to the COVID-19 pandemic, the Company took measures to protect its financial position and increase financial flexibility. During fiscal 2021, the Company recorded certain additional reserves, includinginventory obsolescence reserves and an allowance for doubtful accounts for Wholesale segment customer accounts receivable, and non-cash charges, primarily store impairment charges.
Impact of the Coronavirus Pandemic on Fiscal 2022
The COVID-19 pandemic continued to negatively impact the Company’s store operations during fiscal 2022 with residual impacts on store traffic and store sales resulting from store closures primarily in Europe andCanada, occupancy restrictions and reduced store hours globally. During the second quarter of fiscal 2022, all remaining COVID-19 government mandated store closures in Europe and Canada expired, although some capacityrestrictions continued in certain European and Canadian stores. The COVID-19 pandemic and general unfavorable macro-economic conditions have also disrupted the Company’s global supply chain in fiscal 2022, leading to COVID-19 related factory closures, continued port congestions and shipping delays, which have resulted in inventory receipt delays and an increase in inbound freight costs. The Company made a strategic decision to bring certain productcategories in earlier in the third and fourth quarters of fiscal 2022 in an attempt to minimize the impact of such disruptions on customer demand.
The Company continued to qualify for certain government assistance programs that partially offset related expenses in locations impacted by closures during fiscal 2022. As of the end of the second quarter of fiscal 2022,however, the programs either expired or the Company no longer qualified for such programs in the United States and Canada, and as of the end of the third quarter of fiscal 2022, the Company no longer qualified for the majority ofsuch programs in Europe. The Company recorded the benefit of the government assistance programs as an offset to selling, general and administrative expenses or store occupancy expenses in cost of sales based on the nature of therelated expenses offset by such programs.
Impact of the Coronavirus Pandemic and Macroeconomic Uncertainties on Future Operations
The COVID-19 pandemic continues to impact the Company’s operations and related government and private sector responsive actions could continue to affect its business operations. The Company is also experiencingCOVID-19 supply chain disruptions resulting in inventory receipt delays. Furthermore, the Company expects that our operations will continue to be influenced by general economic conditions resulting from COVID-19, such as laborshortages and the impact of inflation including higher wages, increased merchandise costs and higher inbound transportation costs. The Company cannot reasonably estimate the duration and severity of the COVID-19 pandemic, whichhas had and may continue to have a material impact on its business. As a result, current financial information may not be necessarily indicative of future operating results and the Company’s plans to address the impact of the COVID-19pandemic may change.
F-9
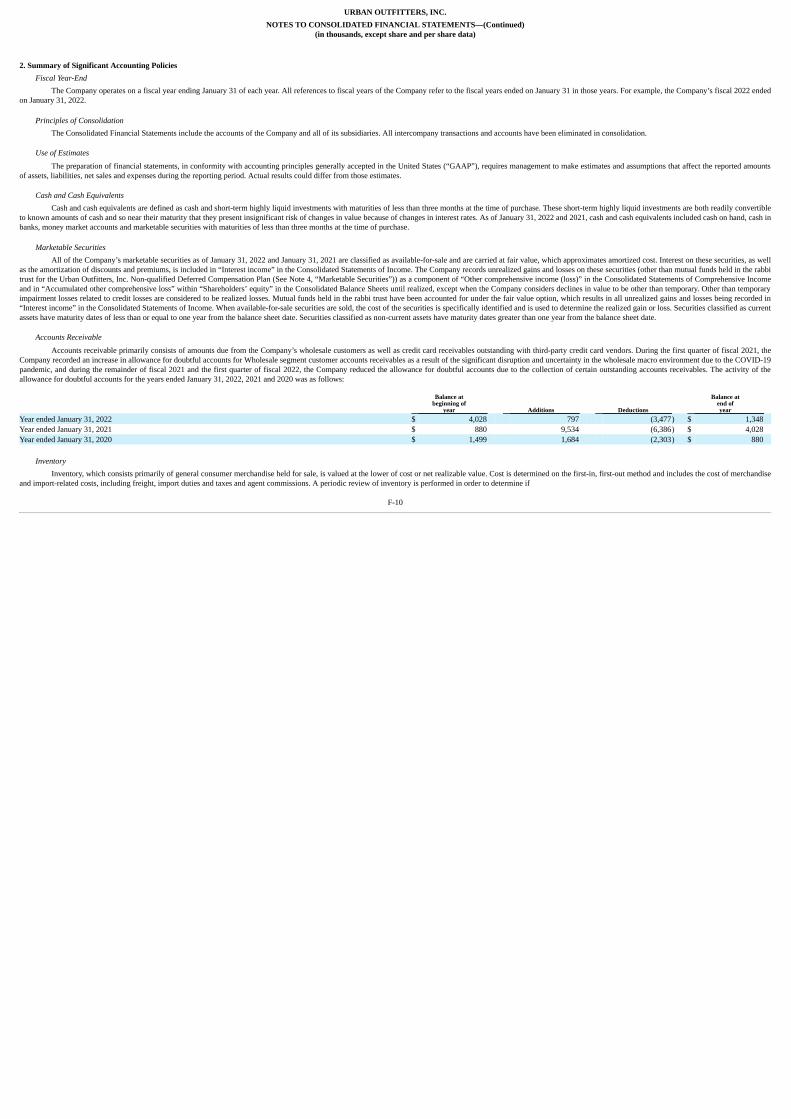
URBAN OUTFITTERS, INC.NOTES TO CONSOLIDATED FINANCIAL STATEMENTS—(Continued)
(in thousands, except share and per share data)
2. Summary of Significant Accounting PoliciesFiscal Year-End
The Company operates on a fiscal year ending January 31 of each year. All references to fiscal years of the Company refer to the fiscal years ended on January 31 in those years. For example, the Company’s fiscal 2022 endedon January 31, 2022.
Principles of ConsolidationThe Consolidated Financial Statements include the accounts of the Company and all of its subsidiaries. All intercompany transactions and accounts have been eliminated in consolidation.
Use of Estimates
The preparation of financial statements, in conformity with accounting principles generally accepted in the United States (“GAAP”), requires management to make estimates and assumptions that affect the reported amountsof assets, liabilities, net sales and expenses during the reporting period. Actual results could differ from those estimates.
Cash and Cash EquivalentsCash and cash equivalents are defined as cash and short-term highly liquid investments with maturities of less than three months at the time of purchase. These short-term highly liquid investments are both readily convertible
to known amounts of cash and so near their maturity that they present insignificant risk of changes in value because of changes in interest rates. As of January 31, 2022 and 2021, cash and cash equivalents included cash on hand, cash inbanks, money market accounts and marketable securities with maturities of less than three months at the time of purchase.
Marketable SecuritiesAll of the Company’s marketable securities as of January 31, 2022 and January 31, 2021 are classified as available-for-sale and are carried at fair value, which approximates amortized cost. Interest on these securities, as well
as the amortization of discounts and premiums, is included in “Interest income” in the Consolidated Statements of Income. The Company records unrealized gains and losses on these securities (other than mutual funds held in the rabbitrust for the Urban Outfitters, Inc. Non-qualified Deferred Compensation Plan (See Note 4, “Marketable Securities”)) as a component of “Other comprehensive income (loss)” in the Consolidated Statements of Comprehensive Incomeand in “Accumulated other comprehensive loss” within “Shareholders’ equity” in the Consolidated Balance Sheets until realized, except when the Company considers declines in value to be other than temporary. Other than temporaryimpairment losses related to credit losses are considered to be realized losses. Mutual funds held in the rabbi trust have been accounted for under the fair value option, which results in all unrealized gains and losses being recorded in“Interest income” in the Consolidated Statements of Income. When available-for-sale securities are sold, the cost of the securities is specifically identified and is used to determine the realized gain or loss. Securities classified as currentassets have maturity dates of less than or equal to one year from the balance sheet date. Securities classified as non-current assets have maturity dates greater than one year from the balance sheet date.
Accounts Receivable
Accounts receivable primarily consists of amounts due from the Company’s wholesale customers as well as credit card receivables outstanding with third-party credit card vendors. During the first quarter of fiscal 2021, theCompany recorded an increase in allowance for doubtful accounts for Wholesale segment customer accounts receivables as a result of the significant disruption and uncertainty in the wholesale macro environment due to the COVID-19pandemic, and during the remainder of fiscal 2021 and the first quarter of fiscal 2022, the Company reduced the allowance for doubtful accounts due to the collection of certain outstanding accounts receivables. The activity of theallowance for doubtful accounts for the years ended January 31, 2022, 2021 and 2020 was as follows:
Balance atbeginning of
year Additions Deductions
Balance atend ofyear
Year ended January 31, 2022 $ 4,028 797 (3,477) $ 1,348 Year ended January 31, 2021 $ 880 9,534 (6,386) $ 4,028 Year ended January 31, 2020 $ 1,499 1,684 (2,303) $ 880
InventoryInventory, which consists primarily of general consumer merchandise held for sale, is valued at the lower of cost or net realizable value. Cost is determined on the first-in, first-out method and includes the cost of merchandise
and import-related costs, including freight, import duties and taxes and agent commissions. A periodic review of inventory is performed in order to determine if
F-10
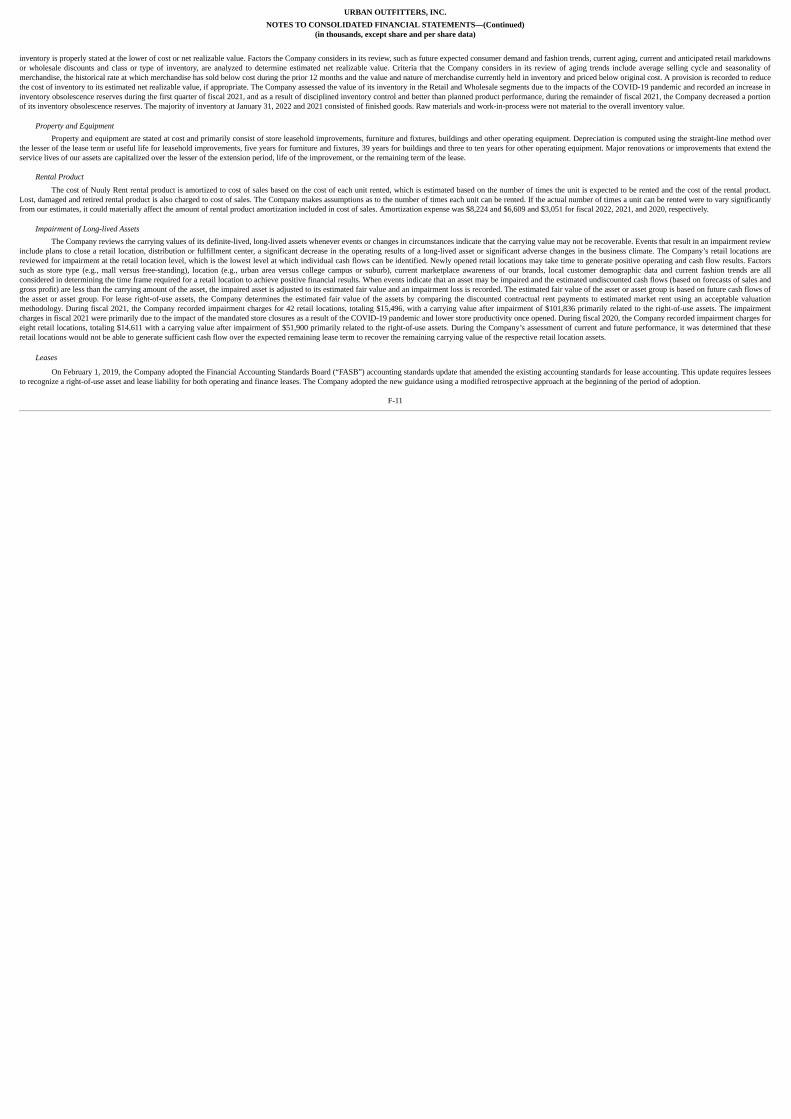
URBAN OUTFITTERS, INC.NOTES TO CONSOLIDATED FINANCIAL STATEMENTS—(Continued)
(in thousands, except share and per share data)
inventory is properly stated at the lower of cost or net realizable value. Factors the Company considers in its review, such as future expected consumer demand and fashion trends, current aging, current and anticipated retail markdownsor wholesale discounts and class or type of inventory, are analyzed to determine estimated net realizable value. Criteria that the Company considers in its review of aging trends include average selling cycle and seasonality ofmerchandise, the historical rate at which merchandise has sold below cost during the prior 12 months and the value and nature of merchandise currently held in inventory and priced below original cost. A provision is recorded to reducethe cost of inventory to its estimated net realizable value, if appropriate. The Company assessed the value of its inventory in the Retail and Wholesale segments due to the impacts of the COVID-19 pandemic and recorded an increase ininventory obsolescence reserves during the first quarter of fiscal 2021, and as a result of disciplined inventory control and better than planned product performance, during the remainder of fiscal 2021, the Company decreased a portionof its inventory obsolescence reserves. The majority of inventory at January 31, 2022 and 2021 consisted of finished goods. Raw materials and work-in-process were not material to the overall inventory value.
Property and EquipmentProperty and equipment are stated at cost and primarily consist of store leasehold improvements, furniture and fixtures, buildings and other operating equipment. Depreciation is computed using the straight-line method over
the lesser of the lease term or useful life for leasehold improvements, five years for furniture and fixtures, 39 years for buildings and three to ten years for other operating equipment. Major renovations or improvements that extend theservice lives of our assets are capitalized over the lesser of the extension period, life of the improvement, or the remaining term of the lease.
Rental Product
The cost of Nuuly Rent rental product is amortized to cost of sales based on the cost of each unit rented, which is estimated based on the number of times the unit is expected to be rented and the cost of the rental product.Lost, damaged and retired rental product is also charged to cost of sales. The Company makes assumptions as to the number of times each unit can be rented. If the actual number of times a unit can be rented were to vary significantlyfrom our estimates, it could materially affect the amount of rental product amortization included in cost of sales. Amortization expense was $8,224 and $6,609 and $3,051 for fiscal 2022, 2021, and 2020, respectively.
Impairment of Long-lived AssetsThe Company reviews the carrying values of its definite-lived, long-lived assets whenever events or changes in circumstances indicate that the carrying value may not be recoverable. Events that result in an impairment review
include plans to close a retail location, distribution or fulfillment center, a significant decrease in the operating results of a long-lived asset or significant adverse changes in the business climate. The Company’s retail locations arereviewed for impairment at the retail location level, which is the lowest level at which individual cash flows can be identified. Newly opened retail locations may take time to generate positive operating and cash flow results. Factorssuch as store type (e.g., mall versus free-standing), location (e.g., urban area versus college campus or suburb), current marketplace awareness of our brands, local customer demographic data and current fashion trends are allconsidered in determining the time frame required for a retail location to achieve positive financial results. When events indicate that an asset may be impaired and the estimated undiscounted cash flows (based on forecasts of sales andgross profit) are less than the carrying amount of the asset, the impaired asset is adjusted to its estimated fair value and an impairment loss is recorded. The estimated fair value of the asset or asset group is based on future cash flows ofthe asset or asset group. For lease right-of-use assets, the Company determines the estimated fair value of the assets by comparing the discounted contractual rent payments to estimated market rent using an acceptable valuationmethodology. During fiscal 2021, the Company recorded impairment charges for 42 retail locations, totaling $15,496, with a carrying value after impairment of $101,836 primarily related to the right-of-use assets. The impairmentcharges in fiscal 2021 were primarily due to the impact of the mandated store closures as a result of the COVID-19 pandemic and lower store productivity once opened. During fiscal 2020, the Company recorded impairment charges foreight retail locations, totaling $14,611 with a carrying value after impairment of $51,900 primarily related to the right-of-use assets. During the Company’s assessment of current and future performance, it was determined that theseretail locations would not be able to generate sufficient cash flow over the expected remaining lease term to recover the remaining carrying value of the respective retail location assets.
Leases
On February 1, 2019, the Company adopted the Financial Accounting Standards Board (“FASB”) accounting standards update that amended the existing accounting standards for lease accounting. This update requires lesseesto recognize a right-of-use asset and lease liability for both operating and finance leases. The Company adopted the new guidance using a modified retrospective approach at the beginning of the period of adoption.
F-11
URBAN OUTFITTERS, INC.NOTES TO CONSOLIDATED FINANCIAL STATEMENTS—(Continued)
(in thousands, except share and per share data)
The Company has operating leases for stores, distribution and fulfillment centers, corporate offices and equipment. The Company subleases certain properties to third parties. The Company has elected not to record a leaseliability and right-of-use asset for leases with original terms of 12 months or less. The Company has elected the practical expedient to not separate non-lease components from lease components as it pertains to real estate leases.
Store leases have remaining lease terms that range from less than one year up to 15 years, some of which contain options to extend the lease for one or two 5-year periods. Payments related to a renewal period are included inthe lease liability and right-of-use asset only when the Company is reasonably certain that it will exercise the option to renew the lease for an extended period of time. Certain leases may contain variable lease payments such as rentbased on a percentage of net sales. Variable lease payments may be subject to a breakpoint threshold of fixed rent. Variable lease payments, other than those that depend on an index or a rate, are not included in the measurement of thelease liability. The lease liability is calculated at the present value of certain future payments, discounted using the Company’s incremental borrowing rate, which approximates the rate of interest the Company would pay to borrow anamount equal to the lease payments on a fully collateralized basis over a similar term. Significant judgment is used in determining the incremental borrowing rate related to estimates for credit rating, credit spread and the impact ofcollateral. The Company developed incremental borrowing rates at a lease portfolio level. The right-of-use asset is initially equal to the value of the lease liability less any amounts received from the landlord as incentives or tenantimprovement allowances.
During fiscal 2022 and 2021, the Company received rent concessions for a number of our stores and continue to negotiate for additional rent concessions at various other store locations. To the extent the rent concessions donot result in a substantial increase in total payments in the existing lease, the Company has accounted for such rent concessions as negative variable rent. To the extent the rent concessions do result in a substantial increase in totalpayments in the existing lease, the Company has accounted for such rent concessions as a lease modification. Rent concessions recorded by the Company during fiscal 2022 and 2021, as either negative variable rent or leasemodifications have not had a material impact on the Company’s Financial Statements.
Revenue Recognition
Merchandise: Merchandise is sold through retail stores, catalogs and the digital sales channel, as well as to wholesale customers, franchise partners and Nuuly customers. Revenue is recognized when control of the promisedgoods is transferred to the customer. The Company has elected to treat shipping and handling as fulfillment activities and not a separate performance obligation. Accordingly, the Company will recognize merchandise revenue for theRetail segment for its single performance obligation at the point of sale, when furniture is delivered or at the time of shipment for non-furniture merchandise, which is when transfer of control to the customer occurs. A Nuuly Rentcustomer may purchase merchandise in her possession that was included in the order that was delivered as part of the monthly subscription rental service. The Company recognize merchandise revenue for Nuuly Rent for its singleperformance obligation when the customer purchases the merchandise through the website or mobile application. Revenue does not include taxes assessed by governmental authorities, including value-added and other sales-relatedtaxes, that are imposed on and concurrent with revenue-producing activities. Revenue is recognized net of estimated customer returns. Retail segment return policies vary by brand, but generally provide for no time limit on returns andthe refund to be issued in either the form of original payment or as a gift card. Payment for merchandise is tendered primarily by cash, check, credit card, debit card, gift card or alternative payment methods. Uncollectible accountsreceivable primarily results from unauthorized credit card transactions. The Company maintains an allowance for doubtful accounts for its Wholesale segment accounts receivable, which management reviews on a regular basis andbelieves is sufficient to cover potential credit losses and billing adjustments. Payment terms in the Wholesale segment vary by customer with the most common being a net 30-day policy.
Menus & Venues: Revenue from restaurant sales and events is recognized upon completion of the service, when the Company satisfies its single performance obligation. Customer deposits may be received in advance forevents and that represent a contract liability until the Company satisfies its performance obligation.
Subscription Fees: Revenue for Nuuly Rent is generated through monthly subscription fees and the purchase of merchandise in a customer’s possession. The monthly subscription rental fee is recognized as revenue on thedate the customer is billed. A customer may pause the monthly subscription, at which point the customer will not be billed for future months until the subscription is no longer on hold. Merchandise sales to Nuuly Rent customers arediscussed above under Merchandise.
Gift Cards: The Company accounts for a gift card transaction by recording a liability at the time the gift card is issued to the customer in exchange for consideration from the customer. At the time of issuance, the Companyhas an open performance obligation for the future delivery of promised goods or services. The liability remains outstanding until the card is redeemed by the customer, at which time the Company recognizes revenue. Over time, aportion of the outstanding gift cards will not be redeemed by the customer which we refer to as “breakage”. Revenue is recognized from breakage over time in proportion to gift card redemptions. Judgment is used in determining theamount of breakage revenue to be recognized and is based on historical gift card redemption patterns. Gift card breakage revenue is included in net sales and is not material. The Company’s gift cards do not expire.
F-12

URBAN OUTFITTERS, INC.NOTES TO CONSOLIDATED FINANCIAL STATEMENTS—(Continued)
(in thousands, except share and per share data)
Sales Return ReserveThe Company records a reserve for estimated product returns where the sale has occurred during the period reported, but the return is likely to occur subsequent to the period reported. The reserve for estimated product returns
is based on the Company’s most recent historical return trends. If the actual return rate is materially different than the Company’s estimate, sales returns would be adjusted in the future. The costs of returns are recorded as a current assetrather than net with the sales return reserve liability. As of January 31, 2022, 2021 and 2020, the sales return reserve was $69,817, $82,004 and $51,360, respectively.
Cost of Sales
Cost of sales includes the following: the cost of merchandise; merchandise markdowns; obsolescence and shrink provisions; store occupancy costs, including rent and depreciation; delivery expense; inbound and outboundfreight; customs related taxes and duties; inventory acquisition and purchasing costs; design costs; warehousing and handling costs; the amortization of rental product; the net amortized cost of rental product at time of purchase by acustomer; and other inventory and rental product acquisition related costs.
Selling, General and Administrative ExpensesSelling, general and administrative expenses includes expenses such as direct selling and selling supervisory expenses; marketing expenses; various corporate expenses such as information systems, finance, loss prevention,
talent acquisition, home office and executive management expenses; share-based compensation expense; and other associated general expenses.
Shipping and Handling Revenues and CostsThe Company includes shipping and handling revenues in net sales and shipping and handling costs in cost of sales. The Company’s shipping and handling revenues consist of amounts billed to customers for shipping and
handling merchandise. Shipping and handling costs include shipping supplies, related labor costs and third-party shipping costs.
Advertising
The Company expenses the costs of advertising when the advertising occurs, except for certain digital channel advertising, which is capitalized and expensed when the catalog is mailed or the content is published on theCompany’s websites and mobile applications. Advertising costs primarily relate to Retail segment marketing expenses which are comprised of web marketing, catalog printing, paper, postage and other costs related to production ofphotographic images used in the Company’s catalogs, websites, mobile applications and social media campaigns. If there is no expected future benefit, the cost of advertising is expensed when incurred. Advertising costs reported asprepaid expenses were $1,306 and $408 as of January 31, 2022, and 2021, respectively, and are included in “Prepaid expenses and other current assets” in the Consolidated Balance Sheets. Advertising expenses were $254,073,$184,465 and $161,879 for fiscal 2022, 2021 and 2020, respectively. In addition, the Company incurred web creative expenses of $59,746, $44,562 and $45,849 for fiscal 2022, 2021 and 2020, respectively. Advertising expenses andweb creative expenses are both included in “Selling, general and administrative expenses” in the Consolidated Statements of Income.
Store Opening CostsThe Company expenses all store opening and organization costs as incurred, including travel, training, recruiting, salaries and other operating costs, and all such costs are included in “Selling, general and administrative
expenses” in the Consolidated Statements of Income.
Website Development CostsThe Company capitalizes applicable costs incurred during the application and infrastructure development stage and expenses costs incurred during the planning and operating stage. During fiscal 2022, 2021 and 2020,
capitalized costs related to internally generated internal-use software were not material.
Income Taxes
The Company utilizes a balance sheet approach to provide for income taxes. Under this method, deferred tax assets and liabilities are recognized for the expected future tax consequences of net operating loss carryforwardsand temporary differences between the carrying amounts and the tax bases of assets and liabilities. Investment tax credits or grants are accounted for in the period earned. The Company files a consolidated United States federal incometax return (see Note 10, “Income Taxes,” for a further discussion of income taxes). The effect of a change in tax rates on deferred tax assets and liabilities is recognized in income in the period that includes the enactment date.
F-13
URBAN OUTFITTERS, INC.NOTES TO CONSOLIDATED FINANCIAL STATEMENTS—(Continued)
(in thousands, except share and per share data)
Net Income Per Common ShareBasic net income per common share is computed by dividing net income by the weighted-average number of common shares outstanding. Diluted net income per common share is computed by dividing net income by the
weighted-average number of common shares and common share equivalents outstanding. Common share equivalents include the effect of stock options, stock appreciation rights (“SAR’s”), restricted stock units (“RSU’s”) andperformance stock units (“PSU’s”).
Comprehensive Income and Accumulated Other Comprehensive Loss
Comprehensive income is comprised of two subsets—net income and other comprehensive income (loss). Amounts included in accumulated other comprehensive loss relate to foreign currency translation adjustments andunrealized gains or losses on marketable securities. The foreign currency translation adjustments are not adjusted for income taxes because these adjustments relate to non-U.S. subsidiaries for which foreign earnings have beendesignated as permanently reinvested. Accumulated other comprehensive loss consisted of foreign currency translation losses of $22,204 and $16,950 as of January 31, 2022 and January 31, 2021, respectively, and unrealized (losses)gains, net of tax, on marketable securities of ($2,626) and ($170) as of January 31, 2022 and January 31, 2021, respectively. The tax effect of the unrealized (losses) gains on marketable securities recorded in comprehensive loss was($1,249), ($236) and $202 during fiscal 2022, 2021 and 2020, respectively. Gross realized gains and losses are included in “Interest income” in the Consolidated Statements of Income and were not material to the Company’sConsolidated Financial Statements for all three years presented.
Foreign CurrencyThe financial statements of the Company’s foreign operations are translated into U.S. dollars. Assets and liabilities are translated at current exchange rates as of the balance sheet date, equity accounts at historical exchange
rates, while income statement accounts are translated at the average rates in effect during the year. Translation adjustments are not included in determining net income, but are included in “Accumulated other comprehensive loss” within“Shareholders’ equity.” Remeasurement gains and losses included in operating results for fiscal years 2022, 2021 and 2020 were not material.
Concentration of Credit RiskFinancial instruments that potentially subject the Company to concentrations of credit risk consist principally of cash, cash equivalents, marketable securities and accounts receivable. The Company manages the credit risk
associated with cash, cash equivalents and marketable securities by investing in high-quality securities held with reputable trustees and, by policy, limiting the amount of credit exposure to any one issuer or issue, as well as providinglimitations on investment maturities. The Company’s investment policy requires that its cash, cash equivalents and marketable securities are invested in corporate and municipal bonds rated “BBB” or better, commercial paper andfederally insured or guaranteed investment vehicles such as certificates of deposit, United States treasury bills and federal government agencies. Receivables from third-party credit cards are processed by financial institutions, which aremonitored for financial stability. The Company regularly evaluates the financial condition of its Wholesale segment customers. The Company’s allowance for doubtful accounts reflects current market conditions and management’sassessment regarding the collectability of its accounts receivable. The Company maintains cash accounts that, at times, may exceed federally insured limits. The Company has not experienced any losses from maintaining cash accountsin excess of such limits. Management believes that it is not exposed to any significant risks related to its cash accounts.
Commitments and Contingencies
From time to time, the Company is named as a defendant in legal actions arising from normal business activities. The Company records a reserve for estimated losses when information available prior to issuance of thefinancial statements indicates that it is probable that a liability has been incurred at the date of the financial statements and the amount of the loss can be reasonably estimated.
Recent Accounting Pronouncements
The Company has considered all new accounting standards updates issued by the FASB and has concluded that there are no recent accounting standard updates that will have a material impact on its consolidated financialstatements and related disclosures.
3. Revenue from Contracts with Customers
Contract receivables occur when the Company satisfies all of its performance obligations under a contract and recognizes revenue prior to billing or receiving consideration from a customer for which it has an unconditionalright to payment. Contract receivables arise from credit card and other electronic payment transactions and sales to the Company’s Wholesale segment customers and franchisees. For the year ended January 31, 2022, the opening andclosing balance of contract receivables, net of allowance for doubtful accounts,
F-14
URBAN OUTFITTERS, INC.NOTES TO CONSOLIDATED FINANCIAL STATEMENTS—(Continued)
(in thousands, except share and per share data)
was $89,952 and $63,760, respectively. For the year ended January 31, 2021, the opening and closing balance of contract receivables, net of allowance for doubtful accounts, was $88,288 and $89,952, respectively. Contract receivablesare included in “Accounts receivable, net of allowance for doubtful accounts” in the Consolidated Balance Sheets. During the first quarter of fiscal 2021, the Company recorded an increase in allowance for doubtful accounts forWholesale segment customer accounts receivables as a result of the significant disruption and uncertainty in the wholesale macro environment due to the COVID-19 pandemic, and during the remainder of fiscal 2021 and the firstquarter of fiscal 2022, the Company reduced the allowance for doubtful accounts due to the collection of certain outstanding accounts receivables.
Contract liabilities represent unearned revenue and result from the Company receiving consideration in a contract with a customer for which it has not satisfied all of its performance obligations. The Company’s contractliabilities result from customer deposits, customer loyalty programs and the issuance of gift cards. Gift cards are expected to be redeemed within two years of issuance, with the majority of redemptions occurring in the first year. For theyear ended January 31, 2022, the opening and closing balance of contract liabilities was $61,986 and $78,717, respectively. For the year ended January 31, 2021, the opening and closing balance of contract liabilities was $52,926 and$61,986, respectively. Contract liabilities are included in “Accrued expenses, accrued compensation and other current liabilities” in the Consolidated Balance Sheets. During the year ended January 31, 2022, the Company recognized$30,071 of revenue that was included in the contract liability balance at the beginning of the period. During the year ended January 31, 2021, the Company recognized $27,721 of revenue that was included in the contract liabilitybalance at the beginning of the period.
See Note 17, “Segment Reporting,” for additional information including net sales recorded by reportable segment and net sales from contracts with customers by merchandise category.
4. Marketable SecuritiesDuring all periods shown, marketable securities are classified as available-for-sale. The amortized cost, gross unrealized gains (losses) and fair values of available-for-sale securities by major security type and class of security
as of January 31, 2022 and 2021 are as follows:
Amortized
Cost Unrealized
Gains Unrealized
(Losses) Fair
Value As of January 31, 2022 Short-term Investments:
Corporate bonds $ 85,062 $ 1 $ (200) $ 84,863 Municipal and pre-refunded municipal bonds 128,984 1 (273) 128,712 US Treasury securities 14,999 — (38) 14,961 Commercial paper 10,884 — — 10,884
239,929 2 (511) 239,420 Long-term Investments:
Corporate bonds $ 148,830 $ — $ (2,478) $ 146,352 Municipal and pre-refunded municipal bonds 60,533 1 (912) 59,622 US Treasury securities 5,222 — (46) 5,176 Mutual funds, held in rabbi trust 12,419 — (606) 11,813 Federal government agencies 350 — (5) 345 Certificates of deposit 249 — — 249
227,603 1 (4,047) 223,557 $ 467,532 $ 3 $ (4,558) $ 462,977 As of January 31, 2021 Short-term Investments:
Corporate bonds $ 38,695 $ 1 $ (48) $ 38,648 Municipal and pre-refunded municipal bonds 127,097 11 (53) 127,055 Commercial paper 8,992 — — 8,992
174,784 12 (101) 174,695 Long-term Investments:
Corporate bonds $ 59,890 $ 3 $ (129) $ 59,764 Municipal and pre-refunded municipal bonds 53,134 17 (46) 53,105 Mutual funds, held in rabbi trust 10,827 20 (54) 10,793
123,851 40 (229) 123,662 $ 298,635 $ 52 $ (330) $ 298,357
F-15
URBAN OUTFITTERS, INC.NOTES TO CONSOLIDATED FINANCIAL STATEMENTS—(Continued)
(in thousands, except share and per share data)
Proceeds from the sales and maturities of available-for-sale securities were $280,701, $396,260 and $428,508 in fiscal 2022, 2021 and 2020, respectively. The Company included in “Interest income,” in the ConsolidatedStatements of Income, a net realized gain of $11 during fiscal 2022, a net realized loss of $419 during fiscal 2021 and a net realized gain of $39 during 2020. Amortization of discounts and premiums, net, resulted in a reduction of“Interest income” of $6,614, $1,574 and $706 for fiscal 2022, 2021 and 2020, respectively. Mutual funds represent assets held in an irrevocable rabbi trust for the Company’s Non-qualified Deferred Compensation Plan (“NQDC”).These assets are a source of funds to match the funding obligations to participants in the NQDC but are subject to the Company’s general creditors. The Company elected the fair value option for financial assets for the mutual fundsheld in the rabbi trust resulting in all unrealized gains and losses being recorded in “Interest income” in the Consolidated Statements of Income.
The following tables show the gross unrealized losses and fair value of the Company’s marketable securities with unrealized losses that are not deemed to have credit losses, aggregated by the length of time that individualsecurities have been in a continuous unrealized loss position, at January 31, 2022 and 2021, respectively.
January 31, 2022 Less Than 12 Months 12 Months or Greater Total
Description of Securities Fair Value Unrealized
Losses Fair Value Unrealized
Losses Fair Value Unrealized
Losses Corporate bonds $ 212,861 $ (2,661) $ 14,110 $ (17) $ 226,971 $ (2,678)Municipal and pre-refunded municipal bonds 162,081 (1,162) 7,118 (23) 169,199 (1,185)US Treasury securities 20,137 (84) — — 20,137 (84)Mutual funds, held in rabbi trust 11,813 (606) — — 11,813 (606)Federal government agencies 345 (5) — — 345 (5)
Total $ 407,237 $ (4,518) $ 21,228 $ (40) $ 428,465 $ (4,558)
January 31, 2021 Less Than 12 Months 12 Months or Greater Total
Description of Securities Fair Value Unrealized
Losses Fair Value Unrealized
Losses Fair Value Unrealized
Losses Corporate bonds $ 91,432 $ (177) $ — $ — $ 91,432 $ (177)Municipal and pre-refunded municipal bonds 90,308 (99) — — 90,308 (99)Mutual funds, held in rabbi trust 10,793 (54) — — 10,793 (54)
Total $ 192,533 $ (330) $ — $ — $ 192,533 $ (330)
As of January 31, 2022 and 2021, there were a total of 656 and 184 securities with unrealized loss positions within the Company’s portfolio, respectively.
5. Fair ValueThe Company utilizes a hierarchy that prioritizes fair value measurements based on the types of inputs used for the various valuation techniques (market approach, income approach and cost approach that relate to its financial
assets and financial liabilities). The levels of the hierarchy are described as follows: • Level 1: Observable inputs such as quoted prices in active markets for identical assets or liabilities. • Level 2: Inputs other than quoted prices that are observable for the asset or liability, either directly or indirectly; these include quoted prices for similar assets or liabilities in active markets and quoted prices for
identical or similar assets or liabilities in markets that are not active. • Level 3: Unobservable inputs that reflect the Company’s own assumptions.
F-16

URBAN OUTFITTERS, INC.NOTES TO CONSOLIDATED FINANCIAL STATEMENTS—(Continued)
(in thousands, except share and per share data)
Management’s assessment of the significance of a particular input to the fair value measurement requires judgment and may affect the valuation of financial assets and liabilities and their placement within the fair valuehierarchy. The Company’s financial assets that are accounted for at fair value on a recurring basis are presented in the tables below:
Marketable Securities Fair Value as of
January 31, 2022 Level 1 Level 2 Level 3 Total
Assets: Corporate bonds $ — $ 231,215 $ — $ 231,215 Municipal and pre-funded municipal bonds — 188,334 — 188,334 US Treasury securities — 20,137 — 20,137 Mutual funds, held in rabbi trust 11,813 — — 11,813 Commercial paper — 10,884 — 10,884 Federal government agencies — 345 — 345 Certificates of deposit — 249 — 249
$ 11,813 $ 451,164 $ — $ 462,977
Marketable Securities Fair Value as of
January 31, 2021 Level 1 Level 2 Level 3 Total
Assets: Corporate bonds $ — $ 98,412 $ — $ 98,412 Municipal and pre-refunded municipal bonds — 180,160 — 180,160 Mutual funds, held in rabbi trust 10,793 — — 10,793 Commercial paper — 8,992 — 8,992
$ 10,793 $ 287,564 $ — $ 298,357
Financial assetsLevel 1 assets consist of financial instruments whose value has been based on inputs that use, as their basis, readily observable market data that are actively quoted and are validated through external sources, including third-
party pricing services and brokers.
Level 2 assets consist of financial instruments whose value has been based on quoted prices for similar assets and liabilities in active markets as well as quoted prices for identical or similar assets or liabilities in markets thatare not active.
Level 3 assets consist of financial instruments where there has been no active market. The Company held no Level 3 financial instruments as of January 31, 2022 and January 31, 2021.
The fair value of cash and cash equivalents (Level 1) approximates carrying value since cash and cash equivalents consist of short-term highly liquid investments with maturities of less than three months at the time ofpurchase. As of January 31, 2022 and 2021, cash and cash equivalents included cash on hand, cash in banks, money market accounts and marketable securities with maturities of less than three months at the time of purchase. The fairvalue of debt approximates its carrying value as it is all variable rate debt.
Non-financial assets
The Company’s non-financial assets, primarily consisting of property and equipment and lease-related right-of-use assets, are tested for impairment whenever events or changes in circumstances indicate that the carrying valuemay not be recoverable and, in the case of goodwill, an annual assessment is performed.
The fair value of property and equipment was determined using a discounted cash-flow model that utilized Level 3 inputs. The Company’s retail locations are reviewed for impairment at the retail location level, which is thelowest level at which individual cash flows can be identified. In calculating future cash flows, the Company makes estimates regarding future operating results based on its experience and knowledge of market factors in which the retaillocation is located. Right-of-use assets are tested for impairment in the same manner as property and equipment. Goodwill has been assigned to reporting units for purposes of impairment testing. The Company evaluates goodwill todetermine if the carrying value exceeds the fair value of the reporting unit. During fiscal 2021 and 2020, the Company determined that certain long-lived assets at the Company’s retail locations were unable to recover their carryingvalue. The impairment charges in fiscal 2021 were primarily due to the impact of the mandated store closures as a result of the COVID-19 pandemic and lower store productivity once opened. These assets were written down to a fairvalue resulting in impairment charges of $15,496 and $14,611 in fiscal 2021 and 2020, respectively. During fiscal 2020, the Company evaluated the fair
F-17

URBAN OUTFITTERS, INC.NOTES TO CONSOLIDATED FINANCIAL STATEMENTS—(Continued)
(in thousands, except share and per share data)
value of the Menus & Venues brand as compared to the carrying value and determined that the goodwill assigned to the reporting unit is impaired in full, resulting in a goodwill impairment charge of $13,911.
6. Property and EquipmentProperty and equipment is summarized as follows:
January 31, 2022 2021
Land $ 56,166 $ 56,400 Buildings 469,188 413,001 Furniture and fixtures 425,021 416,204 Leasehold improvements 856,410 860,963 Other operating equipment 451,285 369,001 Construction-in-progress 269,596 195,661 2,527,666 2,311,230 Accumulated depreciation (1,382,581) (1,343,808)
Total $ 1,145,085 $ 967,422
Depreciation expense for property and equipment in fiscal 2022, 2021 and 2020 was $99,058, $102,197 and $111,550, respectively.
7. Accrued Expenses and Other Current Liabilities
Accrued expenses and other current liabilities consist of the following: January 31, 2022 2021
Sales return reserves $ 69,817 $ 82,004 Gift cards and merchandise credits 58,147 48,171 Accrued sales and VAT taxes 32,107 19,104 Accrued rents, estimated property taxes and other property expenses 32,316 26,740 Federal, state and foreign income taxes 3,870 3,313 Accrued construction 57,041 38,569 Accrued investments in transit 1,194 52,800 Other current liabilities 96,506 88,546
Total $ 350,998 $ 359,247
8. DebtOn June 29, 2018, the Company and its domestic subsidiaries entered into an amended and restated credit agreement (the “Amended Credit Agreement”) that amended the Company’s asset-based revolving credit facility with
certain lenders, including JPMorgan Chase Bank, N.A., as administrative agent, and J.P. Morgan Chase Bank, N.A. and Wells Fargo Bank, National Association, as joint lead arrangers and co-book managers.
The Amended Credit Agreement extended the maturity date of the senior secured revolving credit facility to June 2023 (the “Amended Credit Facility”). The Amended Credit Facility provides for loans and letters of credit upto $350,000, subject to a borrowing base that is comprised of the Company’s eligible accounts receivable and inventory. The Amended Credit Facility includes a swing-line sub-facility, a multicurrency sub-facility and the option toexpand the facility by up to $150,000. The funds available under the Amended Credit Facility may be used for working capital and other general corporate purposes.
The Amended Credit Facility provides for interest on borrowings, at the Company’s option, at either (i) adjusted LIBOR, CDOR, SONIA or EURIBOR plus an applicable margin ranging from 1.125% to 1.375%, or (ii) anadjusted ABR plus an applicable margin ranging from 0.125% to 0.375%, each such applicable margin depending on the level of availability under the Amended Credit Facility. Depending on the type of borrowing, interest on theAmended Credit Agreement is payable monthly, quarterly or at the end of the interest period. A commitment fee of 0.20% is payable quarterly on the unused portion of the Amended Credit Facility.
All obligations under the Amended Credit Facility are unconditionally guaranteed by the Company and certain of its U.S. subsidiaries. The obligations under the Amended Credit Facility are secured by a first-priority securityinterest in inventory, accounts
F-18
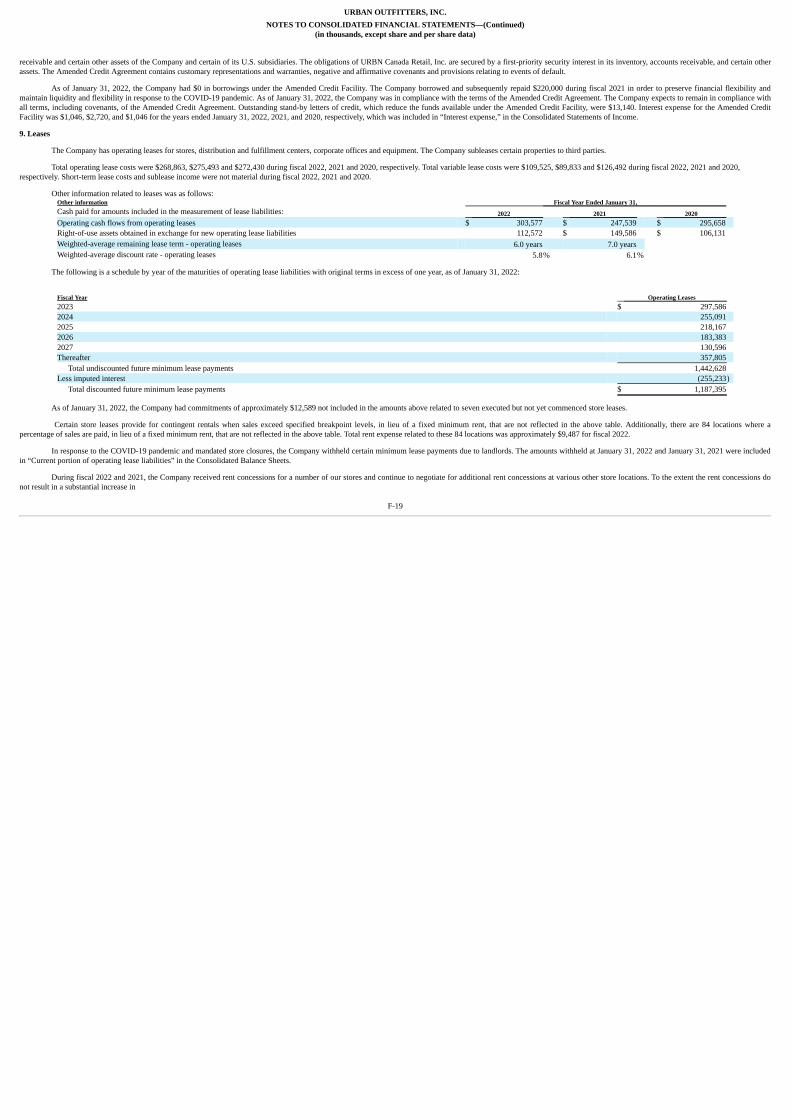
URBAN OUTFITTERS, INC.NOTES TO CONSOLIDATED FINANCIAL STATEMENTS—(Continued)
(in thousands, except share and per share data)
receivable and certain other assets of the Company and certain of its U.S. subsidiaries. The obligations of URBN Canada Retail, Inc. are secured by a first-priority security interest in its inventory, accounts receivable, and certain otherassets. The Amended Credit Agreement contains customary representations and warranties, negative and affirmative covenants and provisions relating to events of default.
As of January 31, 2022, the Company had $0 in borrowings under the Amended Credit Facility. The Company borrowed and subsequently repaid $220,000 during fiscal 2021 in order to preserve financial flexibility andmaintain liquidity and flexibility in response to the COVID-19 pandemic. As of January 31, 2022, the Company was in compliance with the terms of the Amended Credit Agreement. The Company expects to remain in compliance withall terms, including covenants, of the Amended Credit Agreement. Outstanding stand-by letters of credit, which reduce the funds available under the Amended Credit Facility, were $13,140. Interest expense for the Amended CreditFacility was $1,046, $2,720, and $1,046 for the years ended January 31, 2022, 2021, and 2020, respectively, which was included in “Interest expense,” in the Consolidated Statements of Income.
9. Leases
The Company has operating leases for stores, distribution and fulfillment centers, corporate offices and equipment. The Company subleases certain properties to third parties.
Total operating lease costs were $268,863, $275,493 and $272,430 during fiscal 2022, 2021 and 2020, respectively. Total variable lease costs were $109,525, $89,833 and $126,492 during fiscal 2022, 2021 and 2020,respectively. Short-term lease costs and sublease income were not material during fiscal 2022, 2021 and 2020.
Other information related to leases was as follows:Other information Fiscal Year Ended January 31, Cash paid for amounts included in the measurement of lease liabilities: 2022 2021 2020 Operating cash flows from operating leases $ 303,577 $ 247,539 $ 295,658 Right-of-use assets obtained in exchange for new operating lease liabilities 112,572 $ 149,586 $ 106,131 Weighted-average remaining lease term - operating leases 6.0 years 7.0 years Weighted-average discount rate - operating leases 5.8% 6.1%
The following is a schedule by year of the maturities of operating lease liabilities with original terms in excess of one year, as of January 31, 2022:
Fiscal Year Operating Leases 2023 $ 297,586 2024 255,091 2025 218,167 2026 183,383 2027 130,596 Thereafter 357,805
Total undiscounted future minimum lease payments 1,442,628 Less imputed interest (255,233)
Total discounted future minimum lease payments $ 1,187,395
As of January 31, 2022, the Company had commitments of approximately $12,589 not included in the amounts above related to seven executed but not yet commenced store leases.
Certain store leases provide for contingent rentals when sales exceed specified breakpoint levels, in lieu of a fixed minimum rent, that are not reflected in the above table. Additionally, there are 84 locations where apercentage of sales are paid, in lieu of a fixed minimum rent, that are not reflected in the above table. Total rent expense related to these 84 locations was approximately $9,487 for fiscal 2022.
In response to the COVID-19 pandemic and mandated store closures, the Company withheld certain minimum lease payments due to landlords. The amounts withheld at January 31, 2022 and January 31, 2021 were includedin “Current portion of operating lease liabilities” in the Consolidated Balance Sheets.
During fiscal 2022 and 2021, the Company received rent concessions for a number of our stores and continue to negotiate for additional rent concessions at various other store locations. To the extent the rent concessions donot result in a substantial increase in
F-19
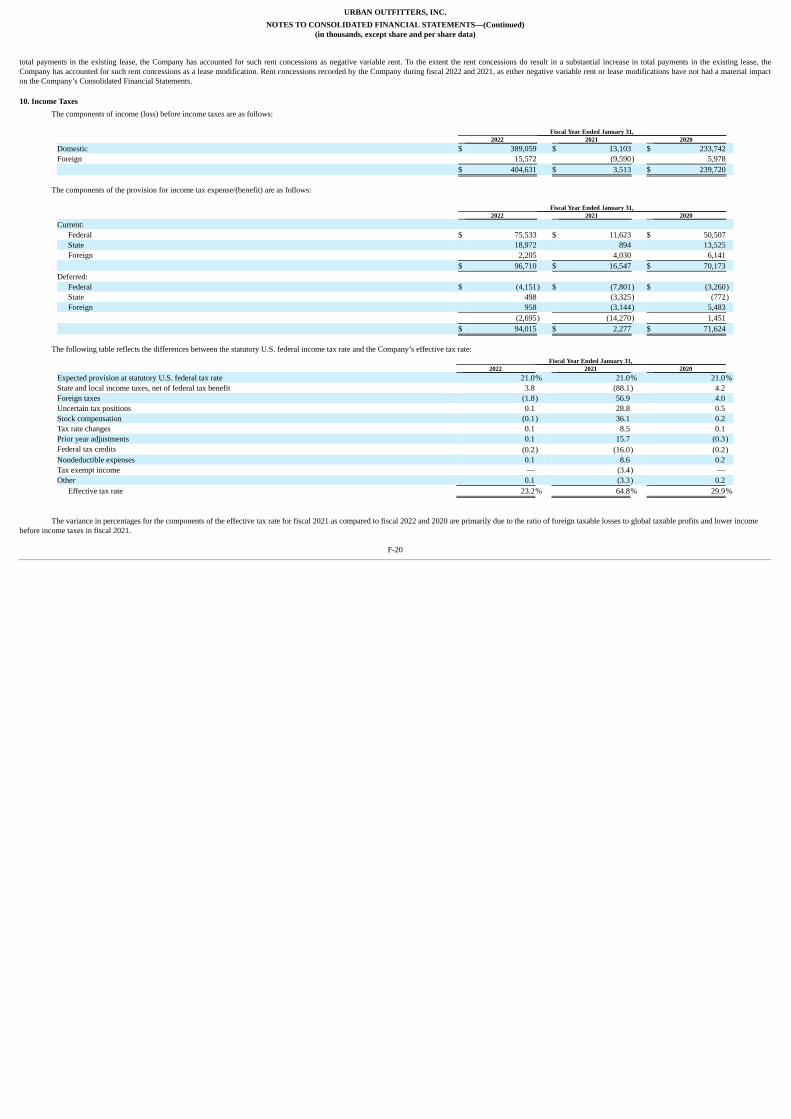
URBAN OUTFITTERS, INC.NOTES TO CONSOLIDATED FINANCIAL STATEMENTS—(Continued)
(in thousands, except share and per share data)
total payments in the existing lease, the Company has accounted for such rent concessions as negative variable rent. To the extent the rent concessions do result in a substantial increase in total payments in the existing lease, theCompany has accounted for such rent concessions as a lease modification. Rent concessions recorded by the Company during fiscal 2022 and 2021, as either negative variable rent or lease modifications have not had a material impacton the Company’s Consolidated Financial Statements.
10. Income TaxesThe components of income (loss) before income taxes are as follows:
Fiscal Year Ended January 31, 2022 2021 2020
Domestic $ 389,059 $ 13,103 $ 233,742 Foreign 15,572 (9,590) 5,978 $ 404,631 $ 3,513 $ 239,720
The components of the provision for income tax expense/(benefit) are as follows:
Fiscal Year Ended January 31, 2022 2021 2020
Current: Federal $ 75,533 $ 11,623 $ 50,507 State 18,972 894 13,525 Foreign 2,205 4,030 6,141
$ 96,710 $ 16,547 $ 70,173 Deferred:
Federal $ (4,151) $ (7,801) $ (3,260)State 498 (3,325) (772)Foreign 958 (3,144) 5,483
(2,695) (14,270) 1,451 $ 94,015 $ 2,277 $ 71,624
The following table reflects the differences between the statutory U.S. federal income tax rate and the Company’s effective tax rate:
Fiscal Year Ended January 31, 2022 2021 2020
Expected provision at statutory U.S. federal tax rate 21.0% 21.0% 21.0%State and local income taxes, net of federal tax benefit 3.8 (88.1) 4.2 Foreign taxes (1.8) 56.9 4.0 Uncertain tax positions 0.1 28.8 0.5 Stock compensation (0.1) 36.1 0.2 Tax rate changes 0.1 8.5 0.1 Prior year adjustments 0.1 15.7 (0.3)Federal tax credits (0.2) (16.0) (0.2)Nondeductible expenses 0.1 8.6 0.2 Tax exempt income — (3.4) — Other 0.1 (3.3) 0.2
Effective tax rate 23.2% 64.8% 29.9%
The variance in percentages for the components of the effective tax rate for fiscal 2021 as compared to fiscal 2022 and 2020 are primarily due to the ratio of foreign taxable losses to global taxable profits and lower incomebefore income taxes in fiscal 2021.
F-20

URBAN OUTFITTERS, INC.NOTES TO CONSOLIDATED FINANCIAL STATEMENTS—(Continued)
(in thousands, except share and per share data)
The significant components of deferred tax assets and liabilities as of January 31, 2022 and 2021 are as follows: January 31, 2022 2021
Deferred tax liabilities: Prepaid expense $ (3,132) $ (2,191)Depreciation (50,674) (34,476)Operating lease right-of-use assets (233,299) (250,292)Other temporary differences (365) (906)
Gross deferred tax liabilities (287,470) (287,865)Deferred tax assets:
Operating lease liabilities 272,953 296,413 Deferred rent 14,176 6,685 Inventory 19,896 18,279 Accounts receivable 1,252 1,930 Net operating loss carryforwards 20,873 11,359 Tax uncertainties 1,135 1,611 Accrued salaries and benefits 25,249 16,711 Income tax credits 4,714 4,494 Other temporary differences 28,000 15,548
Gross deferred tax assets, before valuation allowances 388,248 373,030 Valuation allowances (30,852) (18,689)Net deferred tax assets $ 69,926 $ 66,476
Net deferred tax assets are attributed to the jurisdictions in which the Company operates. As of January 31, 2022 and 2021, respectively, $38,718 and $34,037 were attributable to U.S. federal, $19,190 and $19,084 were
attributed to state jurisdictions and $12,018 and $13,355 were attributed to foreign jurisdictions.
As of January 31, 2022, certain non-U.S. subsidiaries of the Company had net operating loss carryforwards for tax purposes of approximately $7,710 that expire from 2022 through 2031 and approximately $65,193 that do notexpire. Certain U.S. subsidiaries of the Company had state net operating loss carryforwards for tax purposes of approximately $31,304 that expire from 2022 through 2042 and approximately $11,218 that do not expire. Certain U.S.subsidiaries of the Company had state credit carryforwards for tax purposes of approximately $5,925 that expire from 2022 through 2031. As of January 31, 2022, the Company had full and partial valuation allowances for certainforeign and state net operating loss carryforwards and a partial valuation allowance against state credit carryforwards where it was uncertain the carryforwards would be utilized. The Company had no valuation allowance for certainother foreign and state net operating loss carryforwards where management believes it is more-likely-than-not the tax benefit of these carryforwards will be realized.
As of January 31, 2022, approximately $153,700 of cash and cash equivalents were held by the Company’s non-U.S. subsidiaries for which no deferred taxes have been provided. The Company has accumulated undistributedearnings generated by foreign subsidiaries of approximately $430,495. Since such earnings have previously been subject to the one-time deemed repatriation transition tax required by the U.S. Tax Cuts and Jobs Act or other U.S. taxrequirements on undistributed foreign earnings, any additional taxes due with respect to such earnings or the excess of the amount for financial reporting over the tax basis of our foreign investments would generally be limited toforeign and state taxes. The Company continues to believe that foreign earnings are indefinitely reinvested excluding earnings that have previously been subject to the one-time deemed repatriation transition tax required by the U.S. TaxCuts and Jobs Act. With respect to outside basis differences in all other non-U.S. subsidiaries, the Company expects that either (i) such basis differences will not reverse in the foreseeable future, or (ii) such basis differences will reversein a tax-neutral manner.
F-21

URBAN OUTFITTERS, INC.NOTES TO CONSOLIDATED FINANCIAL STATEMENTS—(Continued)
(in thousands, except share and per share data)
A reconciliation of the beginning and ending balances of the total amounts of gross unrecognized tax benefits is as follows:
January 31, Tax Benefit Reconciliation 2022 2021 2020 Balance at the beginning of the period $ 22,259 $ 21,924 $ 21,406 Increases in tax positions for prior years 28 476 661 Decreases in tax positions for prior years (3,178) (51) (101)Increases in tax positions for current year 249 41 125 Settlements — — — Lapse in statute of limitations (413) (131) (167)Balance at the end of the period $ 18,945 $ 22,259 $ 21,924
The total amount of net unrecognized tax benefits that, if recognized, would impact the Company’s effective tax rate were $21,288 and $23,497 as of January 31, 2022 and 2021, respectively. The Company accrues interestand penalties related to unrecognized tax benefits in income tax expense in the Consolidated Statements of Income, which is consistent with the recognition of these items in prior reporting periods. During the years ended January 31,2022, 2021 and 2020, the Company recognized expense/(benefit) of $630, $950 and $1,038, respectively, related to interest and penalties. The Company accrued $3,440 and $2,810 for the payment of interest and penalties as ofJanuary 31, 2022 and 2021, respectively.
The Company files income tax returns in the U.S. federal jurisdiction and various state and foreign jurisdictions. The Company is under audit in certain state and foreign jurisdictions. Certain federal, foreign and statejurisdictions are subject to audit from fiscal 2010 to 2021. It is possible that a state or foreign examination may be resolved within 12 months. Due to the potential for resolution of federal and foreign audit and state examinations, andthe expiration of various statutes of limitation, it is possible that the Company’s gross unrecognized tax benefits balance may change within the next 12 months by a range of zero to $911.
11. Share-Based CompensationThe Company’s 2017 Stock Incentive Plan (the “2017 Plan”) authorized up to 10,000,000 common shares, which can be granted as restricted stock, RSU’s, PSU’s, incentive stock options, nonqualified stock options, SAR’s
and stock grant awards. As of January 31, 2022, there were 6,862,703 common shares available to grant under the 2017 Plan.
The Company’s 2008 Stock Incentive Plan (the “2008 Plan”) authorized up to 10,000,000 common shares, which can be granted as RSU’s, unrestricted shares, incentive stock options, nonqualified stock options, PSU’s orSAR’s. As of January 31, 2022, there were 5,464,830 common shares available to grant under the 2008 Plan. Pursuant to the terms of the 2008 Plan, certain awards may not be granted after February 25, 2018. Awards under the 2017Plan and the 2008 Plan generally expire seven or ten years from the date of grant, thirty days after termination of employment or six months after the date of death or termination due to disability of the grantee.
The Company elects to account for forfeitures as they occur rather than estimate the expected forfeitures.
Share-based compensation expense, included in “Selling, general and administrative expenses” in the Consolidated Statements of Income, for the fiscal years ended January 31, 2022, 2021 and 2020 was as follows:
Fiscal Year Ended January 31, 2022 2021 2020
Stock Options $ — $ 471 $ 1,737 Performance Stock Units (1) 4,067 181 3,483 Restricted Stock Units 21,674 19,648 15,889
Total $ 25,741 $ 20,300 $ 21,109
(1) Includes: (i) the reversal of $1,017 of previously recognized compensation expense in fiscal 2021, related to 87,997 PSU’s that were not projected to vest as the achievement of the related performance target was deemed not
probable, of which $364 related to 41,332 PSU’s was subsequently recognized in fiscal 2022 due to the Company’s better than projected performance that resulted in the performance target being achieved; and (ii) the reversalof $803 of previously recognized compensation expense in fiscal 2020, related to 54,356 PSU’s that will not vest as the achievement of the related performance target is not probable.
The total tax benefit associated with share-based compensation expense for the fiscal years ended January 31, 2022, 2021 and 2020 was $6,311, $4,899 and $5,230, respectively. The tax benefit realized from share-basedcompensation for the fiscal years ended January 31, 2022, 2021 and 2020 was $5,573, $2,528 and $4,425, respectively.
F-22

URBAN OUTFITTERS, INC.NOTES TO CONSOLIDATED FINANCIAL STATEMENTS—(Continued)
(in thousands, except share and per share data)
Stock OptionsThe Company may grant stock options that generally vest over a period of one year. Stock options become exercisable over the vesting period in installments determined by the Company, which can vary depending upon each
individual grant. Stock options granted to non-employee directors generally vest over a period of one year.There were no stock options granted in the fiscal year ended January 31, 2022 and 2021, as beginning in fiscal 2021, the Company began to grant restricted stock units to non-employee directors instead of stock options. A
Black-Scholes model was used to estimate the fair value of stock options granted in the fiscal year ended January 31, 2020. The model uses assumptions including the risk-free rate of interest, expected volatility of the Company’s stockprice and expected life of the awards. The Company uses historical data on exercise timing to determine the expected life assumption. The risk-free rate of interest for periods within the contractual life of the award is based on U.S.Government Securities Treasury Constant Maturities over the expected term of the equity instrument. The expected volatility is based on a weighted-average of the implied volatility and the Company’s most recent historical volatility.The following weighted-average assumptions were used in the models to estimate the fair value of stock options at the date of grant:
Fiscal Year Ended January 31, 2022 2021 2020
Expected life, in years — — 5.3 Risk-free interest rate — — 1.9%Volatility — — 37.6%Dividend rate — — —
The following table summarizes the Company’s stock option activity for the fiscal year ended January 31, 2022:
Shares
Weighted-AverageExercise
Price
Weighted-Average
ContractualTerms(years)
AggregateIntrinsic
Value Awards outstanding at beginning of year 515,000 $ 31.45 3.0 $ 1,249 Granted — — Exercised (120,000) 27.42 Forfeited or Expired (40,000) 46.42 Awards outstanding at end of year 355,000 31.12 2.5 $ 1,126 Awards outstanding fully vested and expected to vest 355,000 31.12 2.5 $ 1,126 Awards exercisable at end of year 355,000 $ 31.12 2.5 $ 1,126
The following table summarizes other information related to stock options during the years ended January 31, 2022, 2021 and 2020:
Fiscal Year Ended January 31, 2022 2021 2020
Weighted-average grant date fair value—per share $ — $ — $ 8.67 Intrinsic value of awards exercised $ 1,156 $ 187 $ 307 Net cash proceeds from the exercise of stock options $ 3,290 $ 495 $ 974
There were no unrecognized compensation costs of stock options granted, but not yet vested, as of January 31, 2022.
Performance Stock UnitsThe Company may grant PSU’s that vest based on the achievement of various company performance targets and external market conditions. The fair value of the PSU’s awarded during fiscal 2022, 2021 and 2020 equaled the
stock price on the date of the grant. The Company makes certain estimates about the number of awards that will vest. Once the Company determines that it is probable that the performance targets will be met, compensation expense isrecorded for these awards. If any of these performance targets are not met, the awards are forfeited. Each PSU is equal to one common share with varying maximum award value limitations. PSU’s typically vest over a two to five-yearperiod.
F-23

URBAN OUTFITTERS, INC.NOTES TO CONSOLIDATED FINANCIAL STATEMENTS—(Continued)
(in thousands, except share and per share data)
The following table summarizes the Company’s PSU activity for the fiscal year ended January 31, 2022:
Shares
Weighted-Average
Fair Value Non-vested awards outstanding at beginning of year 270,003 $ 27.32 Granted 213,750 38.15 Vested (70,001) 26.54 Forfeited (29,999) 30.19 Non-vested awards outstanding at end of year 383,753 $ 33.27
The weighted-average grant date fair value of PSU’s awarded during the fiscal years ended January 31, 2022, 2021 and 2020 was $38.15, $25.84 and $30.19, per share, respectively. Unrecognized compensation cost related to
unvested PSU’s as of January 31, 2022 was $6,671, which is expected to be recognized over a weighted-average period of 2.2 years.
Restricted Stock UnitsThe Company may grant RSU’s that vest based on the achievement of specified service conditions. The fair value of the RSU’s awarded during fiscal 2022, 2021 and 2020 equaled the stock price on the date of the grant.
RSU’s typically vest over a two to five-year period.
The following table summarizes the Company’s RSU activity for the fiscal year ended January 31, 2022:
Shares
Weighted-Average
Fair Value Non-vested awards outstanding at beginning of year 2,109,385 $ 28.65 Granted 1,075,250 37.30 Vested (613,299) 29.66 Forfeited (284,748) 30.41 Non-vested awards outstanding at end of year 2,286,588 $ 32.37
The weighted-average grant date fair value of RSU’s awarded during the fiscal years ended January 31, 2022, 2021 and 2020 was $37.30, $25.31 and $29.92, per share, respectively. The aggregate grant date fair value of
RSU’s vested during the fiscal years ended January 31, 2022, 2021 and 2020 was $29.66, $31.11 and $26.80, respectively. Unrecognized compensation costs related to unvested RSU’s as of January 31, 2022, was $33,444, which isexpected to be recognized over a weighted-average period of 2.1 years.
12. Shareholders’ Equity
Share repurchase activity under the Company’s share repurchase programs is as follows:
Fiscal Year Ended January 31, 2022 2021
Number of common shares repurchased and subsequently retired 1,959,159 482,003 Total cost $ 55,765 $ 7,036 Average cost per share, including commissions $ 28.46 $ 14.60
On August 22, 2017, the Company’s Board of Directors authorized the repurchase of 20,000,000 common shares under a share repurchase program. On June 4, 2019, the Company’s Board of Directors authorized therepurchase of an additional 20,000,000 common shares under a share repurchase program. As of January 31, 2022, 23,892,795 common shares were remaining under the programs.
Subsequent to January 31, 2022, the Company repurchased and subsequently retired a total of 1,194,699 common shares for approximately $31,802, at an average price of $26.62 per share, including commissions.
In addition to the common shares repurchased under the share repurchase programs, during the fiscal years ended January 31, 2022 and 2021, the Company acquired and subsequently retired 229,082 and 161,335 commonshares at a total cost of $7,790 and $3,876, respectively, from employees to meet payroll tax withholding requirements.
F-24
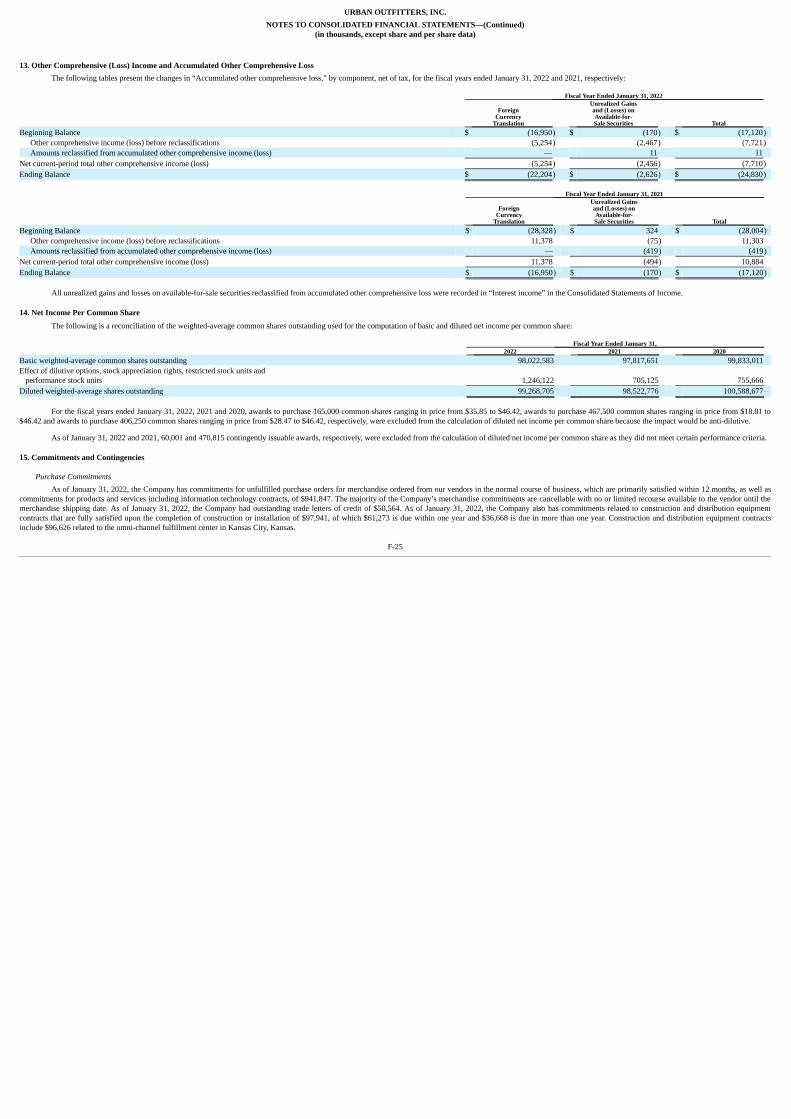
URBAN OUTFITTERS, INC.NOTES TO CONSOLIDATED FINANCIAL STATEMENTS—(Continued)
(in thousands, except share and per share data)
13. Other Comprehensive (Loss) Income and Accumulated Other Comprehensive LossThe following tables present the changes in “Accumulated other comprehensive loss,” by component, net of tax, for the fiscal years ended January 31, 2022 and 2021, respectively:
Fiscal Year Ended January 31, 2022
ForeignCurrency
Translation
Unrealized Gainsand (Losses) onAvailable-for-Sale Securities Total
Beginning Balance $ (16,950) $ (170) $ (17,120)Other comprehensive income (loss) before reclassifications (5,254) (2,467) (7,721)Amounts reclassified from accumulated other comprehensive income (loss) — 11 11
Net current-period total other comprehensive income (loss) (5,254) (2,456) (7,710)Ending Balance $ (22,204) $ (2,626) $ (24,830)
Fiscal Year Ended January 31, 2021
ForeignCurrency
Translation
Unrealized Gainsand (Losses) onAvailable-for-Sale Securities Total
Beginning Balance $ (28,328) $ 324 $ (28,004)Other comprehensive income (loss) before reclassifications 11,378 (75) 11,303 Amounts reclassified from accumulated other comprehensive income (loss) — (419) (419)
Net current-period total other comprehensive income (loss) 11,378 (494) 10,884 Ending Balance $ (16,950) $ (170) $ (17,120)
All unrealized gains and losses on available-for-sale securities reclassified from accumulated other comprehensive loss were recorded in “Interest income” in the Consolidated Statements of Income.
14. Net Income Per Common Share
The following is a reconciliation of the weighted-average common shares outstanding used for the computation of basic and diluted net income per common share:
Fiscal Year Ended January 31, 2022 2021 2020
Basic weighted-average common shares outstanding 98,022,583 97,817,651 99,833,011 Effect of dilutive options, stock appreciation rights, restricted stock units and performance stock units 1,246,122 705,125 755,666 Diluted weighted-average shares outstanding 99,268,705 98,522,776 100,588,677
For the fiscal years ended January 31, 2022, 2021 and 2020, awards to purchase 165,000 common shares ranging in price from $35.85 to $46.42, awards to purchase 467,500 common shares ranging in price from $18.81 to
$46.42 and awards to purchase 406,250 common shares ranging in price from $28.47 to $46.42, respectively, were excluded from the calculation of diluted net income per common share because the impact would be anti-dilutive.
As of January 31, 2022 and 2021, 60,001 and 470,815 contingently issuable awards, respectively, were excluded from the calculation of diluted net income per common share as they did not meet certain performance criteria.
15. Commitments and Contingencies
Purchase CommitmentsAs of January 31, 2022, the Company has commitments for unfulfilled purchase orders for merchandise ordered from our vendors in the normal course of business, which are primarily satisfied within 12 months, as well as
commitments for products and services including information technology contracts, of $941,847. The majority of the Company’s merchandise commitments are cancellable with no or limited recourse available to the vendor until themerchandise shipping date. As of January 31, 2022, the Company had outstanding trade letters of credit of $50,564. As of January 31, 2022, the Company also has commitments related to construction and distribution equipmentcontracts that are fully satisfied upon the completion of construction or installation of $97,941, of which $61,273 is due within one year and $36,668 is due in more than one year. Construction and distribution equipment contractsinclude $96,626 related to the omni-channel fulfillment center in Kansas City, Kansas.
F-25

URBAN OUTFITTERS, INC.NOTES TO CONSOLIDATED FINANCIAL STATEMENTS—(Continued)
(in thousands, except share and per share data)
Benefit PlansFull and part-time U.S. based employees who are at least 18 years of age are eligible after three months of employment to participate in the Urban Outfitters 401(k) Savings Plan (the “Plan”). Under the Plan, employees can
defer 1% to 25% of compensation as defined. The Company makes matching contributions in cash of $0.50 per employee contribution dollar on the first 6% of the employee contribution. The employees’ contribution is 100% vestedwhile the Company’s matching contribution vests at 20% per year of employee service. The Company’s contributions were $7,406, $6,677 and $7,094 for fiscal years 2022, 2021 and 2020, respectively.
The NQDC provides certain employees who are limited in their participation under the Plan the opportunity to defer compensation as defined within the NQDC. Deferred compensation under the NQDC consists of electivedeferral credits, if any, made by the participant and discretionary contribution credits made by the Company. Employee contributions are 100% vested on the contribution date and the Company’s discretionary contribution is 100%vested upon crediting to participants’ accounts on an annual basis. The Company made a matching contribution of $47, $66 and $56 during fiscal years 2022, 2021 and 2020, respectively. The NQDC obligation was $11,813 and$10,793 as of January 31, 2022 and 2021, respectively. The Company has purchased investments to fund the NQDC obligation. The investments had an aggregate market value of $11,813 and $10,793 as of January 31, 2022 and 2021,respectively, and are included in “Marketable securities” in the Consolidated Balance Sheets (see Note 4, “Marketable Securities”).
Contingencies
The Company is party to various legal proceedings arising from normal business activities. Management believes that the ultimate resolution of these matters will not have a material adverse effect on the Company’s financialposition, results of operations or cash flows.
16. Related Party TransactionsFaegre Drinker Biddle & Reath LLP, a law firm, provided general legal services to the Company. Fees paid to Faegre Drinker Biddle & Reath LLP during fiscal 2022, 2021 and 2020 were $1,027, $1,018 and $495,
respectively. Harry S. Cherken, Jr., a director of the Company, is Senior Counsel at Faegre Drinker Biddle & Reath LLP. Amounts due to Faegre Drinker Biddle & Reath LLP as of January 31, 2022 and 2021 were approximately $104and $67, respectively.
Todd R. Morgenfeld, a director of the Company, is Chief Financial Officer and Head of Business Operations of Pinterest, Inc., which provided digital marketing services to the Company in fiscal 2022 and 2021 and isexpected to continue to do so in the future. The amount paid to Pinterest, Inc. for such digital marketing services was financially immaterial to Pinterest, Inc. and is unrelated to Mr. Morgenfeld’s compensation from Pinterest, Inc. Mr.Morgenfeld did not provide and was not involved in the provision of digital marketing services by Pinterest, Inc. to the Company, and he does not intend to provide or be involved in the provision of such services by Pinterest, Inc. in thefuture. The Board of Directors considered these matters in determining Mr. Morgenfeld’s independence.
17. Segment ReportingThe Company offers lifestyle-oriented general merchandise and consumer products and services through a portfolio of global consumer brands. The Company operates three reportable segments—“Retail,” “Wholesale” and
“Nuuly.”
The Company’s Retail segment consists of the Anthropologie, Bhldn, Free People, FP Movement, Terrain, Urban Outfitters and Menus & Venues brands. The Anthropologie, Bhldn and Terrain brands make up theAnthropologie Group. The Free People and FP Movement brands make up the Free People Group. As of January 31, 2022, there were 261 Urban Outfitters stores, 238 Anthropologie Group stores, 173 Free People Group stores, 10Menus & Venues restaurants, two Urban Outfitters franchisee-owned stores, and one Anthropologie franchisee-owned store. Each of, Urban Outfitters, the Anthropologie Group and the Free People Group, including their Company-owned and franchisee-owned store and digital channels, and Menus & Venues restaurants, are considered an operating segment. Net sales from the Retail segment accounted for approximately 93.4%, 93.6% and 91.6% of totalconsolidated net sales for fiscal 2022, 2021 and 2020, respectively.
The Company has aggregated its brands into the Retail segment based upon their shared management, customer base and economic characteristics. Reporting in this format provides management with the financial informationnecessary to evaluate the success of the segments and the overall business. The Company’s Retail segment omni-channel strategy enhances its customers’ brand experience by providing a seamless approach to the customer shoppingexperience. All available Company-owned Retail segment
F-26

URBAN OUTFITTERS, INC.NOTES TO CONSOLIDATED FINANCIAL STATEMENTS—(Continued)
(in thousands, except share and per share data)
shopping channels are fully integrated, including retail locations, websites, mobile applications, catalogs and customer contact centers. The Company’s investments in areas such as marketing campaigns and technology advancementsare designed to generate demand for the Retail segment omni-channel and not the separate store or digital channels. The Company manages and analyzes its performance based on a single Retail segment omni-channel rather thanseparate channels and believes that the Retail segment omni-channel results present the most meaningful and appropriate measure of our performance.
The Company’s Wholesale segment consists of the Free People, FP Movement and Urban Outfitters brands. The Wholesale segment sells through department and specialty stores worldwide, digital businesses and the Retailsegment. The Wholesale segment primarily designs, develops and markets young women’s contemporary casual apparel, intimates, FP Movement activewear and shoes under the Free People Group and the BDG and other own brandapparel collections under the Urban Outfitters brand. The Urban Outfitters wholesale division was established in fiscal 2019. The Anthropologie brand exited the wholesale business in the third quarter of fiscal 2021. Our Wholesalesegment net sales accounted for approximately 5.5%, 5.7% and 8.2% of total consolidated net sales for fiscal 2022, 2021 and 2020, respectively.
The Nuuly segment, formerly known as the Subscription segment, consists of the Nuuly brand, which offers customers with a more sustainable way to explore fashion. Nuuly Rent is a monthly women’s apparel subscriptionrental service that launched in July 2019. For a monthly fee, Nuuly subscribers can select rental product from a wide selection of the Company’s own brands, third-party market brands and one-of-a-kind vintage pieces via a custom-built, digital platform. Subscribers select their products each month, wear them as often as they like and then swap into new products the following month. Subscribers are also able to purchase the rented product. Nuuly Thrift, whichlaunched in October 2021, is a peer-to-peer resale marketplace where customers can buy and sell women’s, men’s, and kids’ apparel, shoes, and accessories from any brands. Sellers on Nuuly Thrift can transfer their earnings to theirbank account or convert them to “Nuuly Cash,” a gift card with a bonus, to be used at any of the Company’s brands. The Company earns a commission based on sales made in the marketplace. Nuuly segment net sales accounted forapproximately 1.1% of consolidated net sales for fiscal 2022 and less than 1.0% of consolidated net sales for fiscal 2021 and 2020, respectively.
The Company evaluates the performance of each segment based on the net sales and pre-tax income from operations (excluding intercompany charges) of the segment. Corporate expenses include expenses incurred anddirected by the corporate office that are not allocated to segments. The principal identifiable assets for the Retail and Wholesale segments are inventory and property and equipment. The principal identifiable assets for the Nuulysegment are rental product and property and equipment.
Other assets are comprised primarily of general corporate assets, which principally consist of cash and cash equivalents, marketable securities, deferred taxes and prepaid expenses, and are typically not allocated to theCompany’s segments. The Company accounts for intersegment sales and transfers as if the sales and transfers were made to third parties making similar volume purchases.
The accounting policies of the reportable segments are the same as the policies described in Note 2, “Summary of Significant Accounting Policies.” All of the Company’s segments are highly diversified. No one customerconstitutes more than 10% of the Company’s total consolidated net sales. A summary of the information about the Company’s operations by segment is as follows:
Fiscal Year 2022 2021 2020
Net sales Retail operations $ 4,248,681 $ 3,228,200 $ 3,648,938 Wholesale operations 267,576 216,937 340,869 Nuuly operations 47,724 24,336 8,001 Intersegment elimination (15,218) (19,724) (14,019)
Total net sales $ 4,548,763 $ 3,449,749 $ 3,983,789 Income (loss) from operations
Retail operations $ 449,453 $ 68,384 $ 256,540 Wholesale operations 32,937 (10,180) 42,315 Nuuly operations (20,150) (18,367) (19,639)Intersegment elimination 1,643 (494) 257
Total segment operating income 463,883 39,343 279,473 General corporate expenses (1) (55,317) (35,371) (47,548)
Total income from operations $ 408,566 $ 3,972 $ 231,925
(1) General corporate expenses during fiscal 2021 benefitted from the recognition of COVID-19 related government relief packages.
F-27

URBAN OUTFITTERS, INC.NOTES TO CONSOLIDATED FINANCIAL STATEMENTS—(Continued)
(in thousands, except share and per share data)
Fiscal Year 2022 2021 2020
Depreciation expense for property and equipment Retail operations $ 94,099 $ 97,911 $ 109,622 Wholesale operations 547 545 578 Nuuly operations 4,412 3,741 1,350
Total depreciation expense for property and equipment $ 99,058 $ 102,197 $ 111,550 Inventory
Retail operations $ 507,510 $ 348,797 Wholesale operations 62,189 40,821
Total inventory $ 569,699 $ 389,618 Rental product, net (1)
Nuuly operations $ 32,075 $ 11,857 Total rental product, net $ 32,075 $ 11,857 (1) Rental product, net is included in "Deferred income taxes and other assets" in the Consolidated Balance Sheets.
Property and equipment, net
Retail operations $ 1,113,294 $ 938,020 Wholesale operations 1,458 2,096 Nuuly operations 30,333 27,306
Total property and equipment, net $ 1,145,085 $ 967,422 Cash paid for property and equipment
Retail operations $ 254,921 $ 155,343 $ 189,904 Wholesale operations 69 390 633 Nuuly operations 7,439 3,509 26,896
Total cash paid for property and equipment $ 262,429 $ 159,242 $ 217,433
The following tables summarize net sales and percentage of net sales from contracts with customers by merchandise category:
Fiscal Year 2022 2021 2020
Net sales Apparel (1) 2,912,901 2,111,828 2,596,926 Home (2) 852,379 731,237 649,184 Accessories (3) 543,337 411,927 517,219 Other (4) 240,146 194,757 220,460
Total net sales 4,548,763 3,449,749 3,983,789
As a percentage of net sales Apparel (1) 64% 61% 65%Home (2) 19% 21% 16%Accessories (3) 12% 12% 13%Other (4) 5% 6% 6%
Total net sales 100% 100% 100%
(1) Apparel includes intimates and activewear (2) Home includes home furnishings, electronics, gifts and decorative items (3) Accessories includes footwear, jewelry and handbags (4) Other includes beauty, shipping and handling, the Menus & Venues brand and the Nuuly segment
F-28

URBAN OUTFITTERS, INC.NOTES TO CONSOLIDATED FINANCIAL STATEMENTS—(Continued)
(in thousands, except share and per share data)
Apparel, Home, and Accessories are sold through both the Retail and Wholesale segments. Revenue recognized from the Other category is primarily attributable to the Retail segment.
The Company has foreign operations primarily in Europe and Canada. Revenues and long-lived assets, based upon the Company’s domestic and foreign operations, are as follows:
Fiscal Year 2022 2021 2020
Net Sales Domestic operations $ 3,950,381 $ 3,040,778 $ 3,485,383 Foreign operations 598,382 408,971 498,406
Total net sales $ 4,548,763 $ 3,449,749 $ 3,983,789 Property and equipment, net
Domestic operations $ 965,777 $ 768,440 Foreign operations 179,308 198,982
Total property and equipment, net $ 1,145,085 $ 967,422
F-29

Exhibit 21.1
Subsidiaries of Urban Outfitters, Inc., a Pennsylvania corporation(as of January 31, 2022)
Subsidiary Jurisdiction of OrganizationURBN US Retail LLC (f/k/a Anthropologie, Inc.) PennsylvaniaUrban Outfitters Wholesale, Inc. PennsylvaniaURBN UK Limited United KingdomURBN Holding LLC DelawareUO Fenwick, Inc. DelawareURBN Canada Retail, Inc. CanadaUrban Outfitters Ireland Limited IrelandU.O. Real Estate LLC PennsylvaniaU.O. Real Estate Holding I LLC PennsylvaniaU.O. Real Estate Holding II LLC PennsylvaniaUrban Outfitters Denmark(Branch of URBN UK Limited, UK) DenmarkUrban Outfitters i Sverige AB SwedenURBN Netherlands Retail BV NetherlandsUrban Outfitters Belgium BVBA BelgiumUrban Outfitters Germany GmbH GermanyHK Sourcing Limited Hong KongURBN HK Trading Limited Hong KongUO US LLC DelawareUrban Outfitters UK Limited United KingdomAnthropologie UK Limited United KingdomUO Bermuda Limited BermudaURBN Bermuda Holding Ltd BermudaURBN Ireland Retail Ltd IrelandURBN Spain Retail S.L. SpainURBN France Retail SARL FranceURBN PR Holding, Inc. DelawareURBN Italy Retail SRL ItalyURBN Puerto Rico LLC Puerto RicoURBN India Sourcing & Design Solutions Limited IndiaURBN International Operations Limited United KingdomURBN Holdings UK Limited United KingdomURBN Turkey Sourcing & Design Solutions LimitedURBN Group Holdings LP
TurkeyUnited Kingdom
URBN FNB Holdings LLC PennsylvaniaURBN Waverly Amis LLC PennsylvaniaURBN NVY LoSp LLC PennsylvaniaURBN VP Holdings LLC PennsylvaniaURBN Callowhill LLC PennsylvaniaURBN Chancellor LLC PennsylvaniaURBN 14th Street LLC Washington DCURBN Devon Yard LLC PennsylvaniaURBN Church Lane Amis LLC PennsylvaniaURBN KOP Pavilion LLC Pennsylvania

Subsidiary Jurisdiction of OrganizationURBN Trading (Shanghai) Co, Ltd.URBN Bethesda Row LLCURBN Austria GmbH
ChinaMarylandAustria
URBN SR LLC PennsylvaniaURBN Poland spółka
z ograniczoną odpowiedzialnością Poland
URBN Singapore Sourcing Pte. Ltd.URBN Global Design LLC
SingaporePennsylvania

Exhibit 23.1
CONSENT OF INDEPENDENT REGISTERED PUBLIC ACCOUNTING FIRM
We consent to the incorporation by reference in Registration Statement Nos. 333-33603, 333-38648, 333-84333, 333-119878, 333-153149, 333-183902 and 333-219285 on Form S-8 of our reports dated April 1, 2022, relating to thefinancial statements of Urban Outfitters, Inc. and the effectiveness of Urban Outfitters, Inc.’s internal control over financial reporting, appearing in this Annual Report on Form 10-K of Urban Outfitters, Inc. for the fiscal year endedJanuary 31, 2022.
/s/ DELOITTE & TOUCHE LLP
Philadelphia, PennsylvaniaApril 1, 2022

Exhibit 31.1
CERTIFICATION OF PRINCIPAL EXECUTIVE OFFICERPURSUANT TO SECTION 302 OF THE SARBANES-OXLEY ACT OF 2002
I, Richard A. Hayne, certify that:
1. I have reviewed this annual report on Form 10-K of Urban Outfitters, Inc.;
2. Based on my knowledge, this report does not contain any untrue statement of a material fact or omit to state a material fact necessary to make the statements made, in light of the circumstances under which such statementswere made, not misleading with respect to the period covered by this report;
3. Based on my knowledge, the financial statements, and other financial information included in this report, fairly present in all material respects the financial condition, results of operations and cash flows of the registrant asof, and for, the periods presented in this report;
4. The registrant’s other certifying officer and I are responsible for establishing and maintaining disclosure controls and procedures (as defined in Exchange Act Rules 13a-15(e) and 15d-15(e)) and internal control overfinancial reporting (as defined in Exchange Act Rules 13a-15(f) and 15d-15(f)) for the registrant and have:
a) Designed such disclosure controls and procedures, or caused such disclosure controls and procedures to be designed under our supervision, to ensure that material information relating to the registrant, includingits consolidated subsidiaries, is made known to us by others within those entities, particularly during the period in which this report is being prepared;
b) Designed such internal control over financial reporting, or caused such internal control over financial reporting to be designed under our supervision, to provide reasonable assurance regarding the reliability offinancial reporting and the preparation of financial statements for external purposes in accordance with generally accepted accounting principles;
c) Evaluated the effectiveness of the registrant’s disclosure controls and procedures and presented in this report our conclusions about the effectiveness of the disclosure controls and procedures, as of the end of theperiod covered by this report based on such evaluation; and
d) Disclosed in this report any change in the registrant’s internal control over financial reporting that occurred during the registrant’s most recent fiscal quarter (the registrant’s fourth fiscal quarter in the case of anannual report) that has materially affected, or is reasonably likely to materially affect, the registrant’s internal control over financial reporting; and
5. The registrant’s other certifying officer and I have disclosed, based on our most recent evaluation of internal control over financial reporting, to the registrant’s auditors and the audit committee of the registrant’s board ofdirectors:
a) All significant deficiencies and material weaknesses in the design or operation of internal control over financial reporting which are reasonably likely to adversely affect the registrant’s ability to record, process,summarize and report financial information; and
b) Any fraud, whether or not material, that involves management or other employees who have a significant role in the registrant’s internal control over financial reporting. Date: April 1, 2022 By: /s/ RICHARD A. HAYNE
Richard A. HayneChief Executive Officer
(Principal Executive Officer)

Exhibit 31.2
CERTIFICATION OF PRINCIPAL FINANCIAL OFFICERPURSUANT TO SECTION 302 OF THE SARBANES-OXLEY ACT OF 2002
I, Melanie Marein-Efron, certify that:
1. I have reviewed this annual report on Form 10-K of Urban Outfitters, Inc.;
2. Based on my knowledge, this report does not contain any untrue statement of a material fact or omit to state a material fact necessary to make the statements made, in light of the circumstances under which such statementswere made, not misleading with respect to the period covered by this report;
3. Based on my knowledge, the financial statements, and other financial information included in this report, fairly present in all material respects the financial condition, results of operations and cash flows of the registrant asof, and for, the periods presented in this report;
4. The registrant’s other certifying officer and I are responsible for establishing and maintaining disclosure controls and procedures (as defined in Exchange Act Rules 13a-15(e) and 15d-15(e)) and internal control overfinancial reporting (as defined in Exchange Act Rules 13a-15(f) and 15d-15(f)) for the registrant and have:
a) Designed such disclosure controls and procedures, or caused such disclosure controls and procedures to be designed under our supervision, to ensure that material information relating to the registrant, includingits consolidated subsidiaries, is made known to us by others within those entities, particularly during the period in which this report is being prepared;
b) Designed such internal control over financial reporting, or caused such internal control over financial reporting to be designed under our supervision, to provide reasonable assurance regarding the reliability offinancial reporting and the preparation of financial statements for external purposes in accordance with generally accepted accounting principles;
c) Evaluated the effectiveness of the registrant’s disclosure controls and procedures and presented in this report our conclusions about the effectiveness of the disclosure controls and procedures, as of the end of theperiod covered by this report based on such evaluation; and
d) Disclosed in this report any change in the registrant’s internal control over financial reporting that occurred during the registrant’s most recent fiscal quarter (the registrant’s fourth fiscal quarter in the case of anannual report) that has materially affected, or is reasonably likely to materially affect, the registrant’s internal control over financial reporting; and
5. The registrant’s other certifying officer and I have disclosed, based on our most recent evaluation of internal control over financial reporting, to the registrant’s auditors and the audit committee of the registrant’s board ofdirectors:
a) All significant deficiencies and material weaknesses in the design or operation of internal control over financial reporting which are reasonably likely to adversely affect the registrant’s ability to record, process,summarize and report financial information; and
b) Any fraud, whether or not material, that involves management or other employees who have a significant role in the registrant’s internal control over financial reporting. Date: April 1, 2022 By: /s/ MELANIE MAREIN-EFRON
Melanie Marein-EfronChief Financial Officer
(Principal Financial Officer)

Exhibit 32.1Certification Pursuant to 18 U.S.C. Section 1350, as AdoptedPursuant to Section 906 of the Sarbanes-Oxley Act of 2002
I, Richard A. Hayne, hereby certify, pursuant to 18 U.S.C. Section 1350, as adopted pursuant to Section 906 of the Sarbanes-Oxley Act of 2002, that (1) the Form 10-K of Urban Outfitters, Inc. (the “Company”) for the year endedJanuary 31, 2022 (the “Form 10-K”), fully complies with requirements of Section 13(a) or 15(d) of the Securities Exchange Act of 1934 (15 U.S.C. 78m or 78o(d)); and (2) the information contained in the Form 10-K fairly presents, inall material respects, the financial condition and results of operations of the Company. Date: April 1, 2022 By: /s/ RICHARD A. HAYNE Richard A. Hayne
Chief Executive Officer(Principal Executive Officer)

Exhibit 32.2Certification Pursuant to 18 U.S.C. Section 1350, as AdoptedPursuant to Section 906 of the Sarbanes-Oxley Act of 2002
I, Melanie Marein-Efron, hereby certify, pursuant to 18 U.S.C. Section 1350, as adopted pursuant to Section 906 of the Sarbanes-Oxley Act of 2002, that (1) the Form 10-K of Urban Outfitters, Inc. (the “Company”) for the year endedJanuary 31, 2022 (the “Form 10-K”), fully complies with requirements of Section 13(a) or 15(d) of the Securities Exchange Act of 1934 (15 U.S.C. 78m or 78o(d)); and (2) the information contained in the Form 10-K fairly presents, inall material respects, the financial condition and results of operations of the Company. Date: April 1, 2022 By: /s/ MELANIE MAREIN-EFRON Melanie Marein-Efron
Chief Financial Officer(Principal Financial Officer)
Related Documents


