Spotlight: New York January 2016 Urban Mobility Insights We live in a world that moves – transit systems, delivery vehicles, on-demand fleets, etc. This movement is generating unprecedented volumes of data, creating an Internet of Moving Things. What can this data show us? To find out, we used our space-time engine – Urban Engines’ system to map and analyze movement data generated from the IoMT – which provides comprehensive insights for transit agencies, logistics companies, and other organizations to understand and optimize performance. Dataset: This analysis uses open data from the New York Taxi and Limo Commission containing trip records from all trips completed in yellow and green taxis in NYC in 2014 and 2013 Each trip record includes: pickup and dropoff dates and times, pick-up and drop-off locations, trip distances, itemized fares, rate types, payment types, and driver-reported passenger counts. passenger counts. In this issue of Urban Mobility Insights, we analyzed open data from New York City taxicab trips in 2014 and 2013 to glean some fun insights into New Yorkers’ behavior. According to the New York City Taxi and Limo Commission, about 485,000 taxi trips are made each day for a total of over 350 million trips in the two-year data set we examined. We looked at some interesting questions to kick off the year — which gym should I pick if I want to stick with my New Year’s resolutions, how does Valentine’s Day affect taxi trends, and who tips more — tech or financial industry employees?

Urban Mobility Insights by Urban Engines – Spotlight: New York City (Jan 2016)
Jan 20, 2017
Welcome message from author
This document is posted to help you gain knowledge. Please leave a comment to let me know what you think about it! Share it to your friends and learn new things together.
Transcript
Spotlight:New York January
2016
Urban Mobility InsightsWe live in a world that moves – transit systems, delivery vehicles, on-demand fleets, etc. This movement is generating unprecedented volumes of data, creating an Internet of Moving Things.
What can this data show us? To find out, we used our space-time engine – Urban Engines’ system to map and analyze movement data generated from the IoMT – which provides comprehensive insights for transit agencies, logistics companies, and other organizations to understand and optimize performance.
Dataset: This analysis uses open data from the New York Taxi and Limo Commission containing trip records from all trips completed in yellow and green taxis in NYC in 2014 and 2013
Each trip record includes: pickup and dropoff dates and times, pick-up and drop-off locations, trip distances, itemized fares, rate types, payment types, and driver-reported passenger counts.passenger counts.
In this issue of Urban Mobility Insights, we analyzed open data from New York City taxicab trips in 2014 and 2013 to glean some fun insights into New Yorkers’ behavior.
According to the New York City Taxi and Limo Commission, about 485,000 taxi trips are made each day for a total of over 350 million trips in the two-year data set we examined.
We looked at some interesting questions to kick off the year — which gym should I pick if I want to stick with my New Year’s resolutions, how does Valentine’s Day affect taxi trends, and who tips more — tech or financial industry employees?
Urban Mobility Insights | January 20162
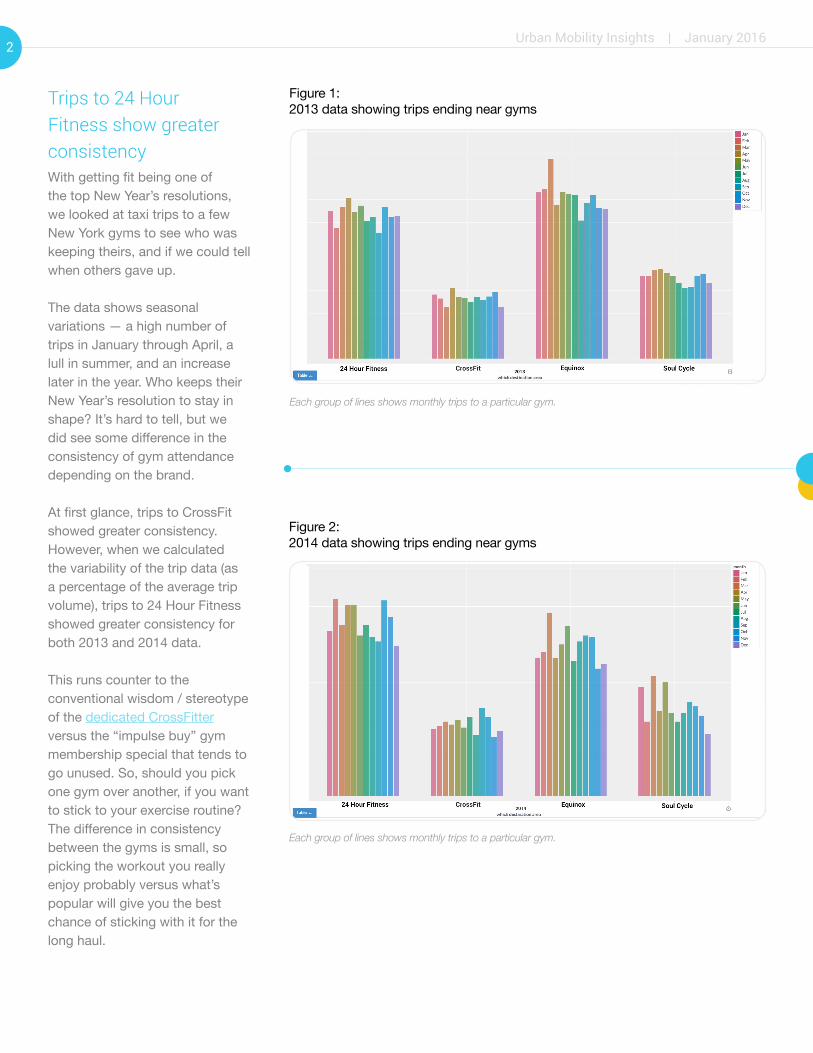
Figure 2:2014 data showing trips ending near gyms
Each group of lines shows monthly trips to a particular gym.
Figure 1:2013 data showing trips ending near gyms
Each group of lines shows monthly trips to a particular gym.
Trips to 24 Hour Fitness show greater consistency With getting fit being one of the top New Year’s resolutions, we looked at taxi trips to a few New York gyms to see who was keeping theirs, and if we could tell when others gave up.
The data shows seasonal variations — a high number of trips in January through April, a lull in summer, and an increase later in the year. Who keeps their New Year’s resolution to stay in shape? It’s hard to tell, but we did see some difference in the consistency of gym attendance depending on the brand.
At first glance, trips to CrossFit showed greater consistency. However, when we calculated the variability of the trip data (as a percentage of the average trip volume), trips to 24 Hour Fitness showed greater consistency for both 2013 and 2014 data.
This runs counter to the conventional wisdom / stereotype of the dedicated CrossFitter versus the “impulse buy” gym membership special that tends to go unused. So, should you pick one gym over another, if you want to stick to your exercise routine? The difference in consistency between the gyms is small, so picking the workout you really enjoy probably versus what’s popular will give you the best chance of sticking with it for the long haul.
Urban Mobility Insights | January 20163
Feb 7, 2013
0
2
4
Valentine’s Day Feb 28, 2013Feb 21, 2013
6
Thousands
Valentine’sDay
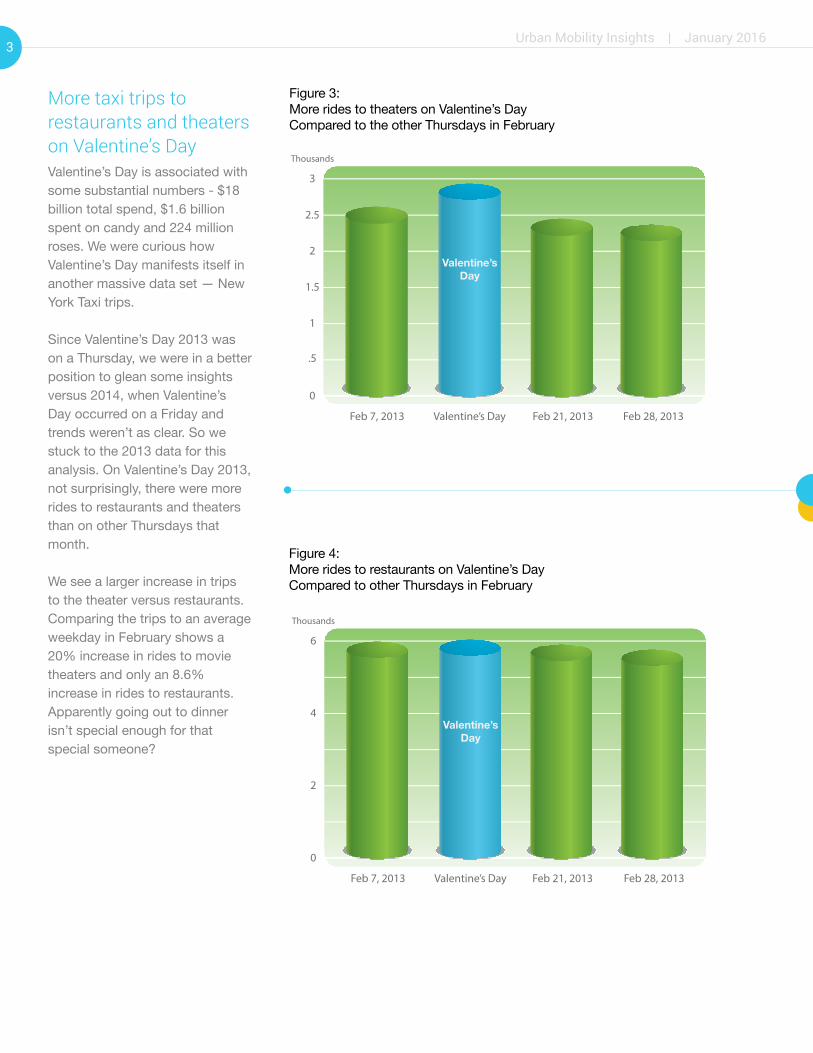
Figure 4:More rides to restaurants on Valentine’s Day Compared to other Thursdays in February
Feb 7, 2013
0
.5
1
1.5
2
2.5
Valentine’s Day Feb 28, 2013Feb 21, 2013
3
Thousands
Valentine’sDay
Figure 3:More rides to theaters on Valentine’s Day Compared to the other Thursdays in February
More taxi trips to restaurants and theaters on Valentine’s Day Valentine’s Day is associated with some substantial numbers - $18 billion total spend, $1.6 billion spent on candy and 224 million roses. We were curious how Valentine’s Day manifests itself in another massive data set — New York Taxi trips.
Since Valentine’s Day 2013 was on a Thursday, we were in a better position to glean some insights versus 2014, when Valentine’s Day occurred on a Friday and trends weren’t as clear. So we stuck to the 2013 data for this analysis. On Valentine’s Day 2013, not surprisingly, there were more rides to restaurants and theaters than on other Thursdays that month.
We see a larger increase in trips to the theater versus restaurants. Comparing the trips to an average weekday in February shows a 20% increase in rides to movie theaters and only an 8.6% increase in rides to restaurants. Apparently going out to dinner isn’t special enough for that special someone?
Urban Mobility Insights | January 20164
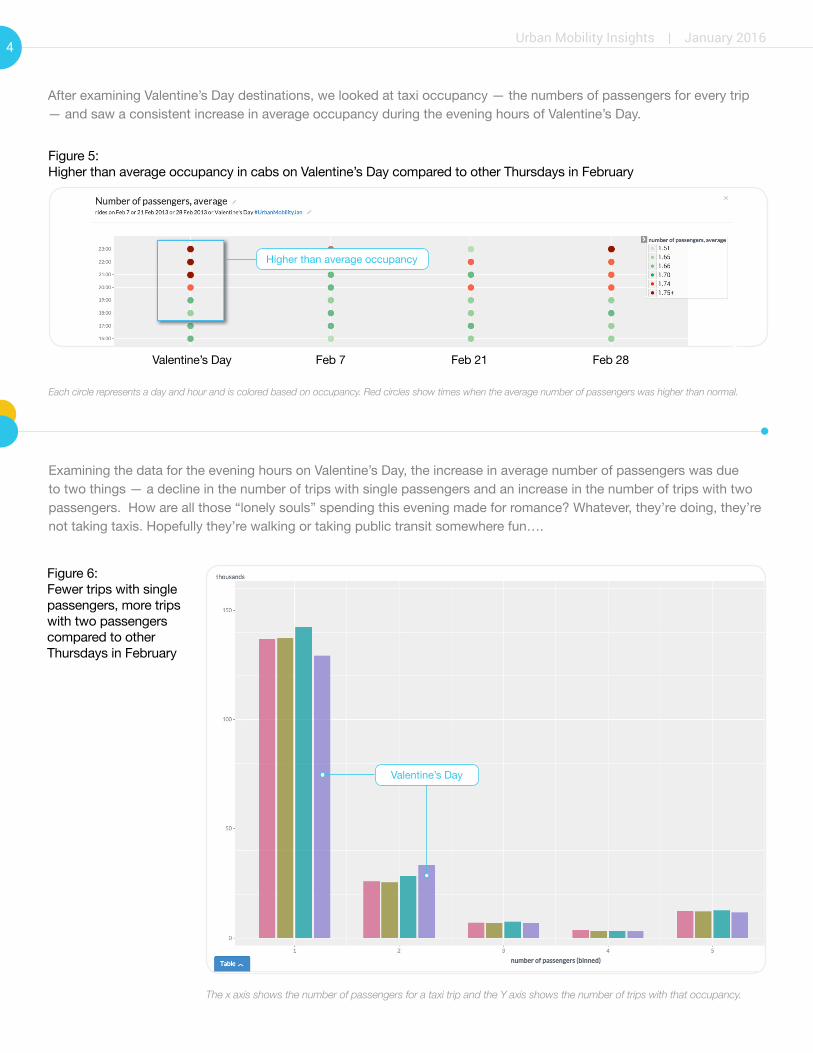
Figure 6:Fewer trips with single passengers, more trips with two passengers compared to other Thursdays in February
The x axis shows the number of passengers for a taxi trip and the Y axis shows the number of trips with that occupancy.
Figure 5:Higher than average occupancy in cabs on Valentine’s Day compared to other Thursdays in February
Valentine’s Day Feb 7 Feb 21 Feb 28
Each circle represents a day and hour and is colored based on occupancy. Red circles show times when the average number of passengers was higher than normal.
After examining Valentine’s Day destinations, we looked at taxi occupancy — the numbers of passengers for every trip — and saw a consistent increase in average occupancy during the evening hours of Valentine’s Day.
Examining the data for the evening hours on Valentine’s Day, the increase in average number of passengers was due to two things — a decline in the number of trips with single passengers and an increase in the number of trips with two passengers. How are all those “lonely souls” spending this evening made for romance? Whatever, they’re doing, they’re not taking taxis. Hopefully they’re walking or taking public transit somewhere fun….
Higher than average occupancy
Valentine’s Day

Urban Mobility Insights | January 20165
Interested in analyzing your own movement data to uncover trends and insights? Contact us at:https://www.urbanengines.com/mobility/contact
175 S. San Antonio Rd. Suite 100 Los Altos, CA 94022
About Urban EnginesUrban Engines improves urban mobility — making it easier to get where you’re going — by using information from the billions of trips that people and vehicles make each day. Our mapping, visualization, reporting, and analytics platform creates actionable insights — for companies, cities, and commuters — from the increasing amounts of movement data generated by the Internet of Moving Things.
This analysis of New York taxi data is just a first step towards understanding what’s happening at a macro-scale city-wide, and at a micro-scale near specific points-of-interest. In a world where every minute and move matters more and more, Urban Engines helps uncover deeper insights into how people, packages, and vehicles move throughout the city.
The tech industry tips better Tech and finance are the two largest economic sectors in New York. As a fun exercise, we checked for differences in how employees from each industry tip.
We looked at tip percentages for weekday trips starting near some of the largest tech companies (LinkedIn, Facebook, Google, Twitter). Twitter and Google were slightly higher than LinkedIn and Facebook. Next, we compared these to trips originating near the financial district. The tech industry tipped just slightly better overall — 18.6% compared to 18.1% for tips from the Financial District. Both tech and finance have generous tippers, with the tech industry edging out finance by a slight margin. In addition to tech edging out finance in the talent wars, looks like tech is winning over cab drivers in New York as well! Perhaps there is an uptick in tips from the Financial District during Wall Street bonus season? We looked— and nope — we did not see one.
Figure 7:Google and Twitter are better tippersComparing tips on trips originating near tech offices
Tech
0
5
10
Financial District
15
20
Figure 8:Tech tips betterComparing tips on trips originating near tech offices and Financial District
0
5
10
Facebook Twitter Linked in
15
20
Related Documents