resources Article Urban Mines of Copper: Size and Potential for Recycling in the EU Luca Ciacci *, Ivano Vassura and Fabrizio Passarini Department of Industrial Chemistry “Toso Montanari”, University of Bologna, 40136 Bologna, Italy; [email protected] (I.V.); [email protected] (F.P.) * Correspondence: [email protected]; Tel.: +39-0541-434483; Fax: +39-0541-434480 Academic Editor: Xianlai Zeng Received: 29 November 2016; Accepted: 18 January 2017; Published: 24 January 2017 Abstract: Copper is among the most important metals by production volume and variety of applications, providing essential materials and goods for human wellbeing. Compared to other world regions, Europe has modest natural reserves of copper and is highly dependent on imports to meet the domestic demand. Securing access to raw materials is of strategic relevance for Europe and the recycling of urban mines (also named “in-use stock”) is a significant mean to provide forms of secondary copper to the European industry. A dynamic material flow analysis model is applied to characterize the flows of copper in the European Union (EU-28) from 1960 to 2014 and to determine the accumulation of this metal in the in-use stock. A scrap balance approach is applied to reconcile the flow of secondary copper sent to domestic recycling estimated through the model and that reported by historic statistics. The results show that per capita in-use stock amounts at 160–200 kg/person, and that current end-of-life recycling rate is around 60%. The quantification of historic flows provides a measure of how the European copper cycle has changed over time and how it may evolve in the future: major hindrances to recycling are highlighted and perspectives for improving the current practices at end-of-life are discussed. Keywords: industrial ecology; urban mining; scrap generation; metal recycling; in-use stock; resource conservation; copper reserve 1. Introduction Copper (Cu) is among the most important metals by production volume and variety of applications, providing essential materials and goods for human wellbeing. Compared to other world regions, Europe has modest natural reserves of Cu [1,2] and is highly dependent on imports to meet the domestic demand. Securing access to raw materials is of strategic relevance for Europe and in 2010 the European Commission (EC) created a methodology [3] to classify raw materials deemed critical on the basis of two indicators: the economic importance of a given material in the European economy and its potential supply risk. The methodology was first applied in 2011 and a revision followed in 2014. None of the two assessments identified Cu as a critical raw material for Europe: overall, a medium economic importance is attributed to Cu but a negligible supply risk is computed for this metal [3,4]. Other methodologies have been developed in the past years by governments and institutions and although the criticality evaluation is performed considering more or less similar dimensions (i.e., economic relevance, supply risk, and environmental implications), the way in which indicators are calculated varies considerably method by method [5–9]. If the economic importance of Cu is beyond doubt considering the unique properties of this metal employed for many everyday uses, the risk of supply constraints seems to be more debatable. In particular, when other factors that can Resources 2017, 6, 6; doi:10.3390/resources6010006 www.mdpi.com/journal/resources

Welcome message from author
This document is posted to help you gain knowledge. Please leave a comment to let me know what you think about it! Share it to your friends and learn new things together.
Transcript
resources
Article
Urban Mines of Copper: Size and Potential forRecycling in the EU
Luca Ciacci *, Ivano Vassura and Fabrizio Passarini
Department of Industrial Chemistry “Toso Montanari”, University of Bologna, 40136 Bologna, Italy;[email protected] (I.V.); [email protected] (F.P.)* Correspondence: [email protected]; Tel.: +39-0541-434483; Fax: +39-0541-434480
Academic Editor: Xianlai ZengReceived: 29 November 2016; Accepted: 18 January 2017; Published: 24 January 2017
Abstract: Copper is among the most important metals by production volume and variety ofapplications, providing essential materials and goods for human wellbeing. Compared to otherworld regions, Europe has modest natural reserves of copper and is highly dependent on imports tomeet the domestic demand. Securing access to raw materials is of strategic relevance for Europe andthe recycling of urban mines (also named “in-use stock”) is a significant mean to provide forms ofsecondary copper to the European industry. A dynamic material flow analysis model is applied tocharacterize the flows of copper in the European Union (EU-28) from 1960 to 2014 and to determinethe accumulation of this metal in the in-use stock. A scrap balance approach is applied to reconcile theflow of secondary copper sent to domestic recycling estimated through the model and that reportedby historic statistics. The results show that per capita in-use stock amounts at 160–200 kg/person,and that current end-of-life recycling rate is around 60%. The quantification of historic flows providesa measure of how the European copper cycle has changed over time and how it may evolve in thefuture: major hindrances to recycling are highlighted and perspectives for improving the currentpractices at end-of-life are discussed.
Keywords: industrial ecology; urban mining; scrap generation; metal recycling; in-use stock;resource conservation; copper reserve
1. Introduction
Copper (Cu) is among the most important metals by production volume and variety ofapplications, providing essential materials and goods for human wellbeing. Compared to otherworld regions, Europe has modest natural reserves of Cu [1,2] and is highly dependent on imports tomeet the domestic demand. Securing access to raw materials is of strategic relevance for Europe andin 2010 the European Commission (EC) created a methodology [3] to classify raw materials deemedcritical on the basis of two indicators: the economic importance of a given material in the Europeaneconomy and its potential supply risk. The methodology was first applied in 2011 and a revisionfollowed in 2014. None of the two assessments identified Cu as a critical raw material for Europe:overall, a medium economic importance is attributed to Cu but a negligible supply risk is computedfor this metal [3,4].
Other methodologies have been developed in the past years by governments and institutionsand although the criticality evaluation is performed considering more or less similar dimensions(i.e., economic relevance, supply risk, and environmental implications), the way in which indicatorsare calculated varies considerably method by method [5–9]. If the economic importance of Cu isbeyond doubt considering the unique properties of this metal employed for many everyday uses,the risk of supply constraints seems to be more debatable. In particular, when other factors that can
Resources 2017, 6, 6; doi:10.3390/resources6010006 www.mdpi.com/journal/resources
Resources 2017, 6, 6 2 of 14
limit future material supply are considered such as the mine production peak [2], or the vulnerabilityto supply restrictions due to the absence of adequate substitutes [10], the criticality level of Cuincreases. Variations between different criticality assessments and for different geographical levels areunderstandable [11]. Also, concerns about mine production peaks and mineral reserves’ adequacy tosatisfy future Cu demand are downsized when all the potentially extractable resources are taken intoaccount, reducing the matter to the way the society can extract the maximum value from resourcesthrough its production and consumption patterns [12].
In this context, recycling is universally considered as an effective action to secure access toraw materials; for Cu, eliminating losses during and after use is estimated to determine up to25% reduction in the global primary Cu input [13]. In fact, Cu is among the most recycled metals,but its global end-of-life recycling has modest performance [14,15]. In light of the prospective of futureCu demand [16], improving Cu recycling rates is necessary to enhance Cu supply and the recyclingof urban mines (also known as above-ground reserves or in-use stock, IUS) is a significant mean toprovide valuable forms of secondary Cu.
A quantitative evaluation of Cu scrap generated is a pre-condition for efficient recovery.Material flow analysis (MFA) is among the most suitable and versatile techniques to balance physicalflows along the lifecycle of a target material [17]. MFA was applied to investigate the anthropogeniccycle of several materials such as construction minerals [18,19] and plastics [20–22]. Metals, however,captured most of the research interest due to their importance in modern technology and strongcorrelation with the human development [23]. In recent years, several studies have analyzed theanthropogenic Cu cycle at different geographical levels, providing a measure of several performanceindicators (e.g., end-of-life recycling rate, EOL-RR). Most of these studies applied MFA as a systematicevaluation of flows and stock over time or for a given year. Ayres et al. (2002) provided a pioneerperspective on the lifecycle of Cu and on the future of Cu recycling [24]; Graedel et al. (2004)presented a first characterization of global and regional Cu cycles [25]; Gerst (2009) built on MFAresults a perspective on possible Cu IUS scenarios [26]. More recently, Glöser et al. (2013) applieddynamic MFA to global Cu flows, providing novel information on recycling indicators [15]. At theEuropean level, the Yale Stock and Flows model was applied extensively to investigate the multilevelanthropogenic Cu cycle and considerable attention was given to the characterization of Cu flows atend-of-life [27–30]; Ruhrberg (2006) assessed the recycling efficiency of Cu from end-of-life products inWestern Europe [31].
Although these studies have provided an outstanding knowledge of the anthropogenic Cu cyclein Europe, major results are dated as they refer to the second half of the 1990s. Considering (i) the rapidincrease of the metal demand in developed economies; (ii) the relevance of Cu in the European metalindustry; and (iii) the importance of Europe in the global Cu cycle, we believe that an update of theEuropean Cu flows and stocks is timely and needed. In this study, the European (EU-28) Cu cycle isanalyzed by dynamic MFA from 1960 to 2014. The historic perspective adopted in this work provides anovel insight on how Cu flows have evolved over the years and enable a perspective on improvementsto increase secondary Cu flow. The results of this analysis are expected to contribute positively toenhance the Cu recycling industry in the region and to constitute a basis for further assessments.
2. Methods
2.1. The Anthropogenic Lifecycle of Cu
Sulfide ores and Cu oxides are the main virgin sources of primary Cu. Cu is converted to its metalform through several pyrometallurgical steps, which encompass extraction and comminution of themineral, roasting, smelting, converting, and refining. Cu anodes, which are the product of the smeltingstep, are refined electrolytically to increase the purity of the Cu metal form. The hydrometallurgical routebypasses smelting and involves leaching, solvent extraction and electrowinning stages. Cu cathodes,which are the refining output, enter fabrication and manufacturing stages in which the unwrought
Resources 2017, 6, 6 3 of 14
Cu forms are shaped to semifinished goods and employed in end-use products. A large fraction ofrefined Cu is remelted before the creation of shapes for alloying purposes. Copper alloys have the totalcontent by weight of alloying elements other than Cu at >2.5%; most common Cu alloys are brasses(Cu-Zn alloys), bronzes (Cu-Sn alloys), cupro-nickel (Cu-Ni alloys), nickel silvers (Cu-Ni-Zn alloys),and aluminum bronze (Al-Cu alloys). For simplicity, hereafter we use the term Cu for indicating bothCu and Cu alloys.
Obsolete Cu products that are discarded at end-of-life are collected for recovery or disposed.The majority of Cu waste that is collected for recovery undergoes functional recycling in which Cufunctionality is preserved in new products. Some of the Cu can be entrapped in alloys that follow othermanagement routes in which Cu is lost as a tramp element; for instance, Cu in steel alloys remains animpurity and brings no functionality to the recycled steel. According to common definitions, secondaryCu sources include either residues from fabrication and manufacturing stages (known as new scrap)and Cu waste and scrap generated at end-of-life and collected for recycling (i.e., old scrap). Dependingon the scrap quality, secondary Cu flows can follow two main routes: direct remelting, in which highquality Cu scrap is melted directly by fabricators, and secondary smelting, in which the Cu scrap oflower quality needs further refining before its utilization in new materials and goods. Most new scrapundergoes direct remelting. Old scrap is generally treated through secondary smelting, but someobsolete Cu products are suitable to direct melting leading to a partition between the fates of old scrap.
2.2. The European Cu Model
A dynamic MFA model was created using Microsoft Excel® and applied to quantify Cu flowsfrom 1960 to 2014 in the European Union (EU-28). For each main phase of the Cu lifecycle, themodel accounted for inflow, outflows, process efficiencies, losses, and accumulation in the IUS.A detailed description of the MFA model (Figures S1–S2), accounting equations, data sources and majorassumptions (Tables S1–S10) is reported in the Supplementary Materials. The expanded perspective onCu flows and related IUS proposed in this work has required considerable gathering of accurate inputdata. Because several assumptions and proxy data were employed in the modeling, we have evaluatedthe confidence of our estimates through data reconciliation using the Substance Flow Analysis (STAN)software [32].
Historic information on domestic production of Cu commodities was found for annual mineextraction, smelting production, primary and secondary refined production, and for fabrication ofsemifinished goods in metal statistics yearbooks [33]. End-use market shares were employed todisaggregate the utilization of Cu into its major applications: building and construction, electricaland electronic products, industrial machinery and equipment, transportation equipment, consumerand general products. Examples of Cu goods covered by each end use sector are reported in Table 1.Historic market shares data were obtained for selected years from the International Wrought CopperCouncil backwards to 1987 [34]; for 2008–2014, the Thomson Reuters GFMS reports were consulted [35].Values for the missing years between 1987 and 2008 were interpolated, while US data were usedas proxies for 1960–1986 [36]. Uncertainty associated with domestic production values reported inliterature and historic market shares was assumed to be negligible. New scrap was modeled accordingto fabrication and manufacturing recovery efficiency rates as reported in [15]. According to the samesource, 90% of new scrap was assumed directly melted and the remaining 10% entered the oldscrap market.
European trade statistics were considered to quantify imports and exports of commoditiescontaining Cu; historic records were mainly derived from the United Nations Commodity TradeStatistics database [37]. Because these flows are expressed in terms of product weight, mass conversionfactors were required to transform this information into Cu weight; to this aim, average Cu contentsfor ores and concentrates, unrefined and refined Cu forms, semifinished and finished goods wereapplied [28,31,38,39]. Uncertainty ranges were set arbitrarily based on a common sense of theuncertainty affecting this type of trade flows [40], i.e., an uncertainty range at ±10% was considered
Resources 2017, 6, 6 4 of 14
for imports and exports from mining through fabrication because Cu forms embedded in these stageshave well known Cu contents and relatively low variability. For finished goods, the percentage of Cucontent can vary remarkably compared to the mean values because material breakdown may havechanged either due to innovation and progress in manufacturing design and processing over time.Other uncertainty is due to different composition of materials and goods that are grouped togetherunder the same classification code. Traded flows of finished goods were attributed ±20% uncertainty.
Table 1. Principal end-use sectors of Cu and example of application included according to definitionsin [35,41].
End-Use Sector Example of Application Included
Building and construction Building wire; plumbing and heating; air conditioning andcommercial refrigerator; builders hardware; architectural
Electrical and electronic products Power utilities; telecommunications; business electronics;lighting and wiring devices
Industrial machinery and equipment In-plant equipment, industrial valves and fittings,non-electrical instruments, off-road vehicles, heat exchangers
Transportation equipment Automobile; truck and bus; railroad; marine, aircraft and aerospace
Consumer and general goodsAppliances, cord sets, military and commercial ordnance,consumer electronics, fasteners and closures, coinage,utensils and cutlery, miscellaneous
The amount of Cu apparently consumed (i.e., domestic production + imports − exports) inend-uses constitutes the final demand of Cu or the flow into use. A top-down approach was followedto determine the accumulation of Cu in the IUS. Such an approach considers the Cu flow into its majoruses and then lifespan distribution models are applied to simulate the generation of scrap and obsoleteproducts at end-of-life. In-use dissipation losses are estimated according to the methodology describedin [42]. The conservation of mass performed for each year of the analysis provided an estimate of thecumulative Cu IUS.
Annual Cu flows out of use generated from each application sector were aggregated into five wastetype categories [15] to enable a representative modeling of the regional waste management. Collectionand preprocessing rates [31] for construction and demolition waste (C&D), electrical and nonelectricalindustrial waste (IW), end-of-life vehicles (ELV), waste of electrical and electronic equipment (WEEE),and municipal solid waste (MSW) were applied to compute the amount of Cu old scrap domesticallyrecovered for recycling in a given year. This flow was further increased by the amount of new scrapnot directly recycled by fabricators in the same year. In turn, a fraction of Cu old scrap with highquality returned to fabrication and manufacturing: in the model this flow is computed as differencebetween the reported Cu input to direct melting and the estimated amount of new scrap used directlyfor fabricated goods. Annual net-imports of Cu waste and scrap were estimated from metal statisticsyearbooks [33]; old scrap have generally high variability in terms of metal content and ±20% ofuncertainty was assumed for trade flows of Cu waste and scrap.
The remaining fraction of Cu scrap was modeled to input the secondary domestic production ofCu cathodes. Historic records for secondary Cu cathodes production reported in [33] enabled a scrapbalance approach to reconcile [32] the amount of Cu scrap sent to domestic recycling estimated by themodel with the amounts reported by producers. Uncertainty associated with endogenous values wasdetermined by means of the error propagation law. Standard deviation either attributed or computedthrough the model embodies different types of uncertainty, varying from bias in annual data records,ranges of Cu content in materials and goods, hidden flows such as trade of second-hand goods and Cucontained in informal/illegal trade of goods. These types of uncertainty may contribute differentlyalong the Cu’s lifecycle and a clear disaggregation among them was not possible to achieve because oflack of information.
Resources 2017, 6, 6 5 of 14
3. Results
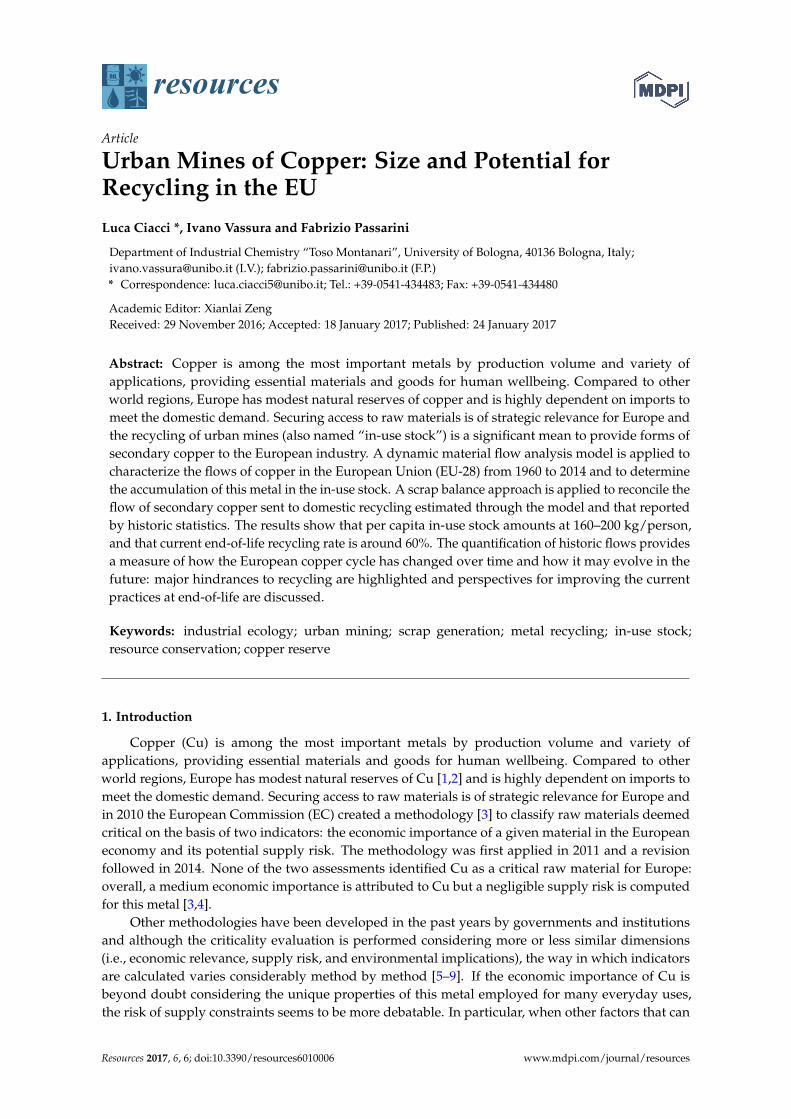
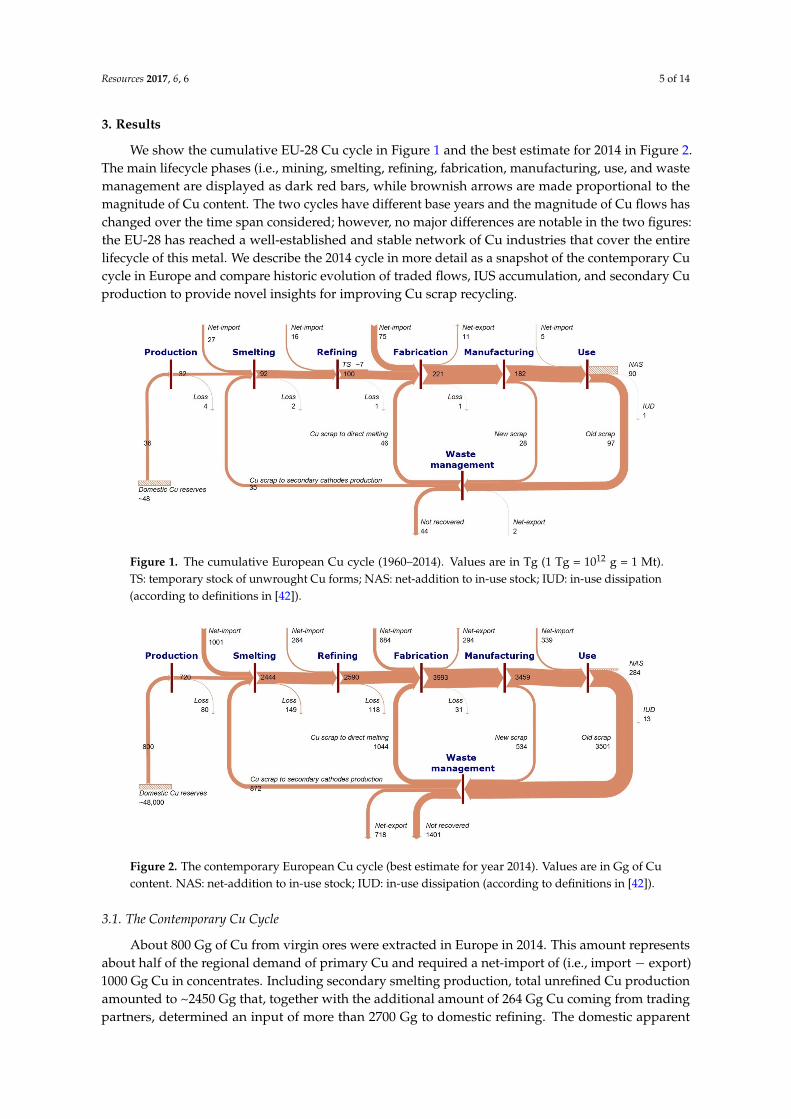
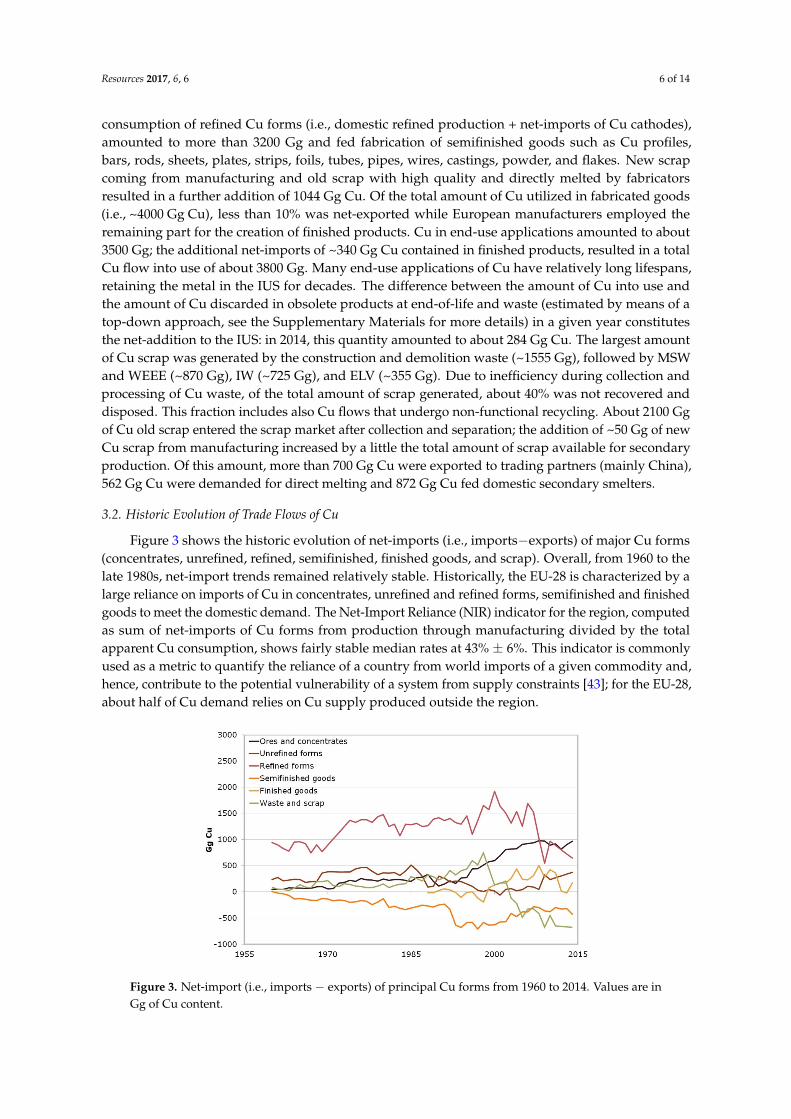
We show the cumulative EU-28 Cu cycle in Figure 1 and the best estimate for 2014 in Figure 2.The main lifecycle phases (i.e., mining, smelting, refining, fabrication, manufacturing, use, and wastemanagement are displayed as dark red bars, while brownish arrows are made proportional to themagnitude of Cu content. The two cycles have different base years and the magnitude of Cu flows haschanged over the time span considered; however, no major differences are notable in the two figures:the EU-28 has reached a well-established and stable network of Cu industries that cover the entirelifecycle of this metal. We describe the 2014 cycle in more detail as a snapshot of the contemporary Cucycle in Europe and compare historic evolution of traded flows, IUS accumulation, and secondary Cuproduction to provide novel insights for improving Cu scrap recycling.
Resources 2017, 6, 6 5 of 14
magnitude of Cu content. The two cycles have different base years and the magnitude of Cu flows has changed over the time span considered; however, no major differences are notable in the two figures: the EU-28 has reached a well-established and stable network of Cu industries that cover the entire lifecycle of this metal. We describe the 2014 cycle in more detail as a snapshot of the contemporary Cu cycle in Europe and compare historic evolution of traded flows, IUS accumulation, and secondary Cu production to provide novel insights for improving Cu scrap recycling.
Figure 1. The cumulative European Cu cycle (1960–2014). Values are in Tg (1 Tg = 1012 g = 1 Mt). TS: temporary stock of unwrought Cu forms; NAS: net-addition to in-use stock; IUD: in-use dissipation (according to definitions in [42]).
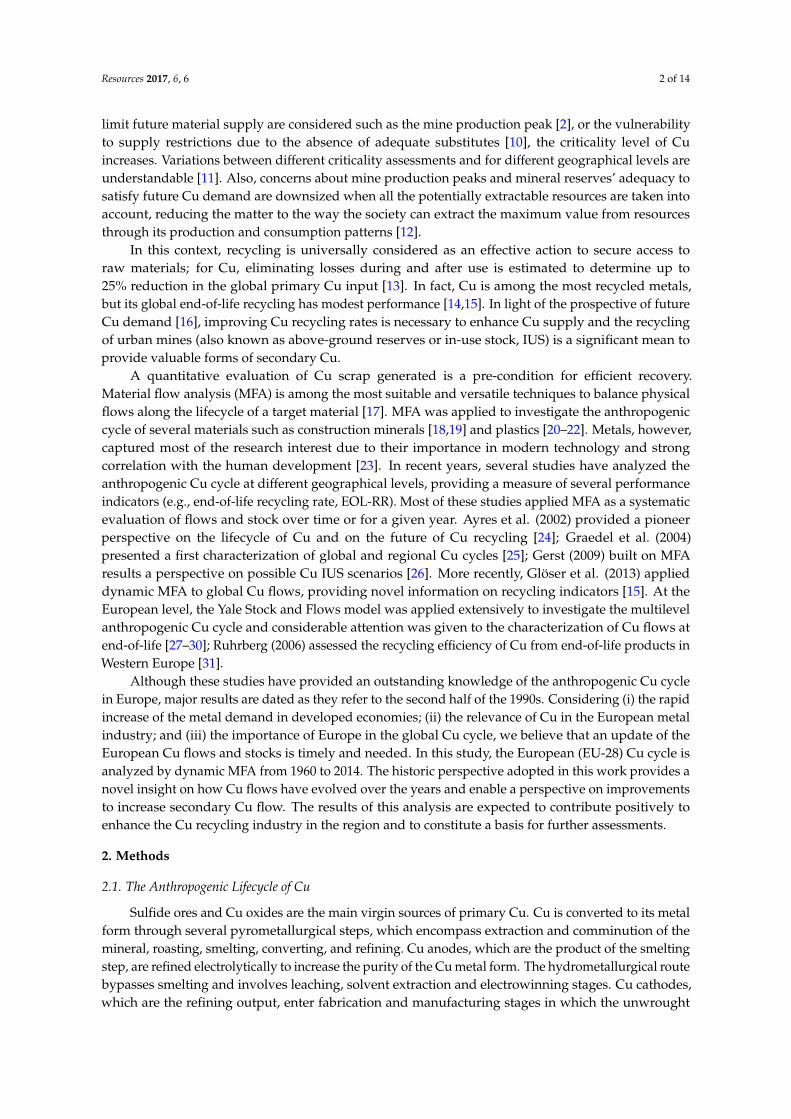
Figure 2. The contemporary European Cu cycle (best estimate for year 2014). Values are in Gg of Cu content. NAS: net-addition to in-use stock; IUD: in-use dissipation (according to definitions in [42]).
3.1. The Contemporary Cu Cycle
About 800 Gg of Cu from virgin ores were extracted in Europe in 2014. This amount represents about half of the regional demand of primary Cu and required a net-import of (i.e., import − export) 1000 Gg Cu in concentrates. Including secondary smelting production, total unrefined Cu production amounted to ~2450 Gg that, together with the additional amount of 264 Gg Cu coming from trading partners, determined an input of more than 2700 Gg to domestic refining. The domestic apparent consumption of refined Cu forms (i.e., domestic refined production + net-imports of Cu cathodes), amounted to more than 3200 Gg and fed fabrication of semifinished goods such as Cu profiles, bars, rods, sheets, plates, strips, foils, tubes, pipes, wires, castings, powder, and flakes. New
Figure 1. The cumulative European Cu cycle (1960–2014). Values are in Tg (1 Tg = 1012 g = 1 Mt).TS: temporary stock of unwrought Cu forms; NAS: net-addition to in-use stock; IUD: in-use dissipation(according to definitions in [42]).
Resources 2017, 6, 6 5 of 14
magnitude of Cu content. The two cycles have different base years and the magnitude of Cu flows has changed over the time span considered; however, no major differences are notable in the two figures: the EU-28 has reached a well-established and stable network of Cu industries that cover the entire lifecycle of this metal. We describe the 2014 cycle in more detail as a snapshot of the contemporary Cu cycle in Europe and compare historic evolution of traded flows, IUS accumulation, and secondary Cu production to provide novel insights for improving Cu scrap recycling.
Figure 1. The cumulative European Cu cycle (1960–2014). Values are in Tg (1 Tg = 1012 g = 1 Mt). TS: temporary stock of unwrought Cu forms; NAS: net-addition to in-use stock; IUD: in-use dissipation (according to definitions in [42]).
Figure 2. The contemporary European Cu cycle (best estimate for year 2014). Values are in Gg of Cu content. NAS: net-addition to in-use stock; IUD: in-use dissipation (according to definitions in [42]).
3.1. The Contemporary Cu Cycle
About 800 Gg of Cu from virgin ores were extracted in Europe in 2014. This amount represents about half of the regional demand of primary Cu and required a net-import of (i.e., import − export) 1000 Gg Cu in concentrates. Including secondary smelting production, total unrefined Cu production amounted to ~2450 Gg that, together with the additional amount of 264 Gg Cu coming from trading partners, determined an input of more than 2700 Gg to domestic refining. The domestic apparent consumption of refined Cu forms (i.e., domestic refined production + net-imports of Cu cathodes), amounted to more than 3200 Gg and fed fabrication of semifinished goods such as Cu profiles, bars, rods, sheets, plates, strips, foils, tubes, pipes, wires, castings, powder, and flakes. New
Figure 2. The contemporary European Cu cycle (best estimate for year 2014). Values are in Gg of Cucontent. NAS: net-addition to in-use stock; IUD: in-use dissipation (according to definitions in [42]).
3.1. The Contemporary Cu Cycle
About 800 Gg of Cu from virgin ores were extracted in Europe in 2014. This amount representsabout half of the regional demand of primary Cu and required a net-import of (i.e., import − export)1000 Gg Cu in concentrates. Including secondary smelting production, total unrefined Cu productionamounted to ~2450 Gg that, together with the additional amount of 264 Gg Cu coming from tradingpartners, determined an input of more than 2700 Gg to domestic refining. The domestic apparent
Resources 2017, 6, 6 6 of 14
consumption of refined Cu forms (i.e., domestic refined production + net-imports of Cu cathodes),amounted to more than 3200 Gg and fed fabrication of semifinished goods such as Cu profiles,bars, rods, sheets, plates, strips, foils, tubes, pipes, wires, castings, powder, and flakes. New scrapcoming from manufacturing and old scrap with high quality and directly melted by fabricatorsresulted in a further addition of 1044 Gg Cu. Of the total amount of Cu utilized in fabricated goods(i.e., ~4000 Gg Cu), less than 10% was net-exported while European manufacturers employed theremaining part for the creation of finished products. Cu in end-use applications amounted to about3500 Gg; the additional net-imports of ~340 Gg Cu contained in finished products, resulted in a totalCu flow into use of about 3800 Gg. Many end-use applications of Cu have relatively long lifespans,retaining the metal in the IUS for decades. The difference between the amount of Cu into use andthe amount of Cu discarded in obsolete products at end-of-life and waste (estimated by means of atop-down approach, see the Supplementary Materials for more details) in a given year constitutesthe net-addition to the IUS: in 2014, this quantity amounted to about 284 Gg Cu. The largest amountof Cu scrap was generated by the construction and demolition waste (~1555 Gg), followed by MSWand WEEE (~870 Gg), IW (~725 Gg), and ELV (~355 Gg). Due to inefficiency during collection andprocessing of Cu waste, of the total amount of scrap generated, about 40% was not recovered anddisposed. This fraction includes also Cu flows that undergo non-functional recycling. About 2100 Ggof Cu old scrap entered the scrap market after collection and separation; the addition of ~50 Gg of newCu scrap from manufacturing increased by a little the total amount of scrap available for secondaryproduction. Of this amount, more than 700 Gg Cu were exported to trading partners (mainly China),562 Gg Cu were demanded for direct melting and 872 Gg Cu fed domestic secondary smelters.
3.2. Historic Evolution of Trade Flows of Cu
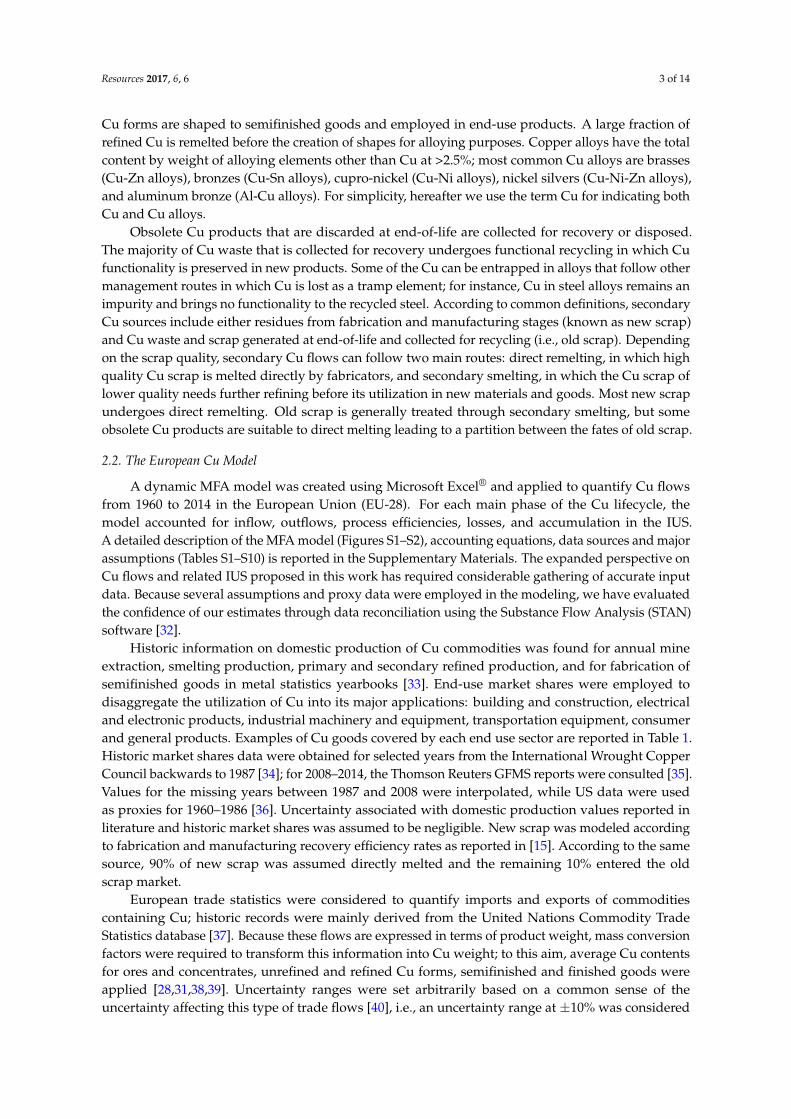
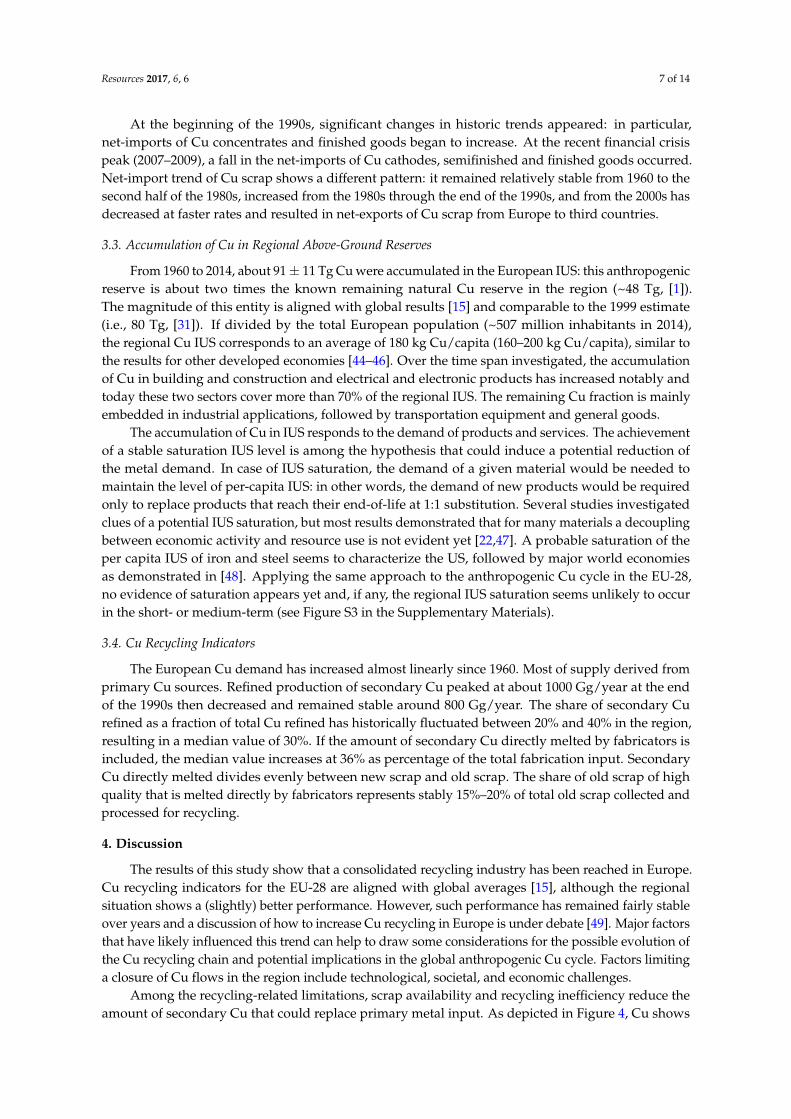
Figure 3 shows the historic evolution of net-imports (i.e., imports−exports) of major Cu forms(concentrates, unrefined, refined, semifinished, finished goods, and scrap). Overall, from 1960 to thelate 1980s, net-import trends remained relatively stable. Historically, the EU-28 is characterized by alarge reliance on imports of Cu in concentrates, unrefined and refined forms, semifinished and finishedgoods to meet the domestic demand. The Net-Import Reliance (NIR) indicator for the region, computedas sum of net-imports of Cu forms from production through manufacturing divided by the totalapparent Cu consumption, shows fairly stable median rates at 43% ± 6%. This indicator is commonlyused as a metric to quantify the reliance of a country from world imports of a given commodity and,hence, contribute to the potential vulnerability of a system from supply constraints [43]; for the EU-28,about half of Cu demand relies on Cu supply produced outside the region.
Resources 2017, 6, 6 6 of 14
scrap coming from manufacturing and old scrap with high quality and directly melted by fabricators resulted in a further addition of 1044 Gg Cu. Of the total amount of Cu utilized in fabricated goods (i.e., ~4000 Gg Cu), less than 10% was net-exported while European manufacturers employed the remaining part for the creation of finished products. Cu in end-use applications amounted to about 3500 Gg; the additional net-imports of ~340 Gg Cu contained in finished products, resulted in a total Cu flow into use of about 3800 Gg. Many end-use applications of Cu have relatively long lifespans, retaining the metal in the IUS for decades. The difference between the amount of Cu into use and the amount of Cu discarded in obsolete products at end-of-life and waste (estimated by means of a top-down approach, see the Supplementary Material for more details) in a given year constitutes the net-addition to the IUS: in 2014, this quantity amounted to about 284 Gg Cu. The largest amount of Cu scrap was generated by the construction and demolition waste (~1555 Gg), followed by MSW and WEEE (~870 Gg), IW (~725 Gg), and ELV (~355 Gg). Due to inefficiency during collection and processing of Cu waste, of the total amount of scrap generated, about 40% was not recovered and disposed. This fraction includes also Cu flows that undergo non-functional recycling. About 2100 Gg of Cu old scrap entered the scrap market after collection and separation; the addition of ~50 Gg of new Cu scrap from manufacturing increased by a little the total amount of scrap available for secondary production. Of this amount, more than 700 Gg Cu were exported to trading partners (mainly China), 562 Gg Cu were demanded for direct melting and 872 Gg Cu fed domestic secondary smelters.
3.2. Historic Evolution of Trade Flows of Cu
Figure 3 shows the historic evolution of net-imports (i.e., imports−exports) of major Cu forms (concentrates, unrefined, refined, semifinished, finished goods, and scrap). Overall, from 1960 to the late 1980s, net-import trends remained relatively stable. Historically, the EU-28 is characterized by a large reliance on imports of Cu in concentrates, unrefined and refined forms, semifinished and finished goods to meet the domestic demand. The Net-Import Reliance (NIR) indicator for the region, computed as sum of net-imports of Cu forms from production through manufacturing divided by the total apparent Cu consumption, shows fairly stable median rates at 43% ± 6%. This indicator is commonly used as a metric to quantify the reliance of a country from world imports of a given commodity and, hence, contribute to the potential vulnerability of a system from supply constraints [43]; for the EU-28, about half of Cu demand relies on Cu supply produced outside the region.
Figure 3. Net-import (i.e., imports − exports) of principal Cu forms from 1960 to 2014. Values are in Gg of Cu content.
At the beginning of the 1990s, significant changes in historic trends appeared: in particular, net-imports of Cu concentrates and finished goods began to increase. At the recent financial crisis peak (2007–2009), a fall in the net-imports of Cu cathodes, semifinished and finished goods occurred.
Figure 3. Net-import (i.e., imports − exports) of principal Cu forms from 1960 to 2014. Values are inGg of Cu content.
Resources 2017, 6, 6 7 of 14
At the beginning of the 1990s, significant changes in historic trends appeared: in particular,net-imports of Cu concentrates and finished goods began to increase. At the recent financial crisispeak (2007–2009), a fall in the net-imports of Cu cathodes, semifinished and finished goods occurred.Net-import trend of Cu scrap shows a different pattern: it remained relatively stable from 1960 to thesecond half of the 1980s, increased from the 1980s through the end of the 1990s, and from the 2000s hasdecreased at faster rates and resulted in net-exports of Cu scrap from Europe to third countries.
3.3. Accumulation of Cu in Regional Above-Ground Reserves
From 1960 to 2014, about 91 ± 11 Tg Cu were accumulated in the European IUS: this anthropogenicreserve is about two times the known remaining natural Cu reserve in the region (~48 Tg, [1]).The magnitude of this entity is aligned with global results [15] and comparable to the 1999 estimate(i.e., 80 Tg, [31]). If divided by the total European population (~507 million inhabitants in 2014),the regional Cu IUS corresponds to an average of 180 kg Cu/capita (160–200 kg Cu/capita), similar tothe results for other developed economies [44–46]. Over the time span investigated, the accumulationof Cu in building and construction and electrical and electronic products has increased notably andtoday these two sectors cover more than 70% of the regional IUS. The remaining Cu fraction is mainlyembedded in industrial applications, followed by transportation equipment and general goods.
The accumulation of Cu in IUS responds to the demand of products and services. The achievementof a stable saturation IUS level is among the hypothesis that could induce a potential reduction ofthe metal demand. In case of IUS saturation, the demand of a given material would be needed tomaintain the level of per-capita IUS: in other words, the demand of new products would be requiredonly to replace products that reach their end-of-life at 1:1 substitution. Several studies investigatedclues of a potential IUS saturation, but most results demonstrated that for many materials a decouplingbetween economic activity and resource use is not evident yet [22,47]. A probable saturation of theper capita IUS of iron and steel seems to characterize the US, followed by major world economiesas demonstrated in [48]. Applying the same approach to the anthropogenic Cu cycle in the EU-28,no evidence of saturation appears yet and, if any, the regional IUS saturation seems unlikely to occurin the short- or medium-term (see Figure S3 in the Supplementary Materials).
3.4. Cu Recycling Indicators
The European Cu demand has increased almost linearly since 1960. Most of supply derived fromprimary Cu sources. Refined production of secondary Cu peaked at about 1000 Gg/year at the endof the 1990s then decreased and remained stable around 800 Gg/year. The share of secondary Curefined as a fraction of total Cu refined has historically fluctuated between 20% and 40% in the region,resulting in a median value of 30%. If the amount of secondary Cu directly melted by fabricators isincluded, the median value increases at 36% as percentage of the total fabrication input. SecondaryCu directly melted divides evenly between new scrap and old scrap. The share of old scrap of highquality that is melted directly by fabricators represents stably 15%–20% of total old scrap collected andprocessed for recycling.
4. Discussion
The results of this study show that a consolidated recycling industry has been reached in Europe.Cu recycling indicators for the EU-28 are aligned with global averages [15], although the regionalsituation shows a (slightly) better performance. However, such performance has remained fairly stableover years and a discussion of how to increase Cu recycling in Europe is under debate [49]. Major factorsthat have likely influenced this trend can help to draw some considerations for the possible evolution ofthe Cu recycling chain and potential implications in the global anthropogenic Cu cycle. Factors limitinga closure of Cu flows in the region include technological, societal, and economic challenges.
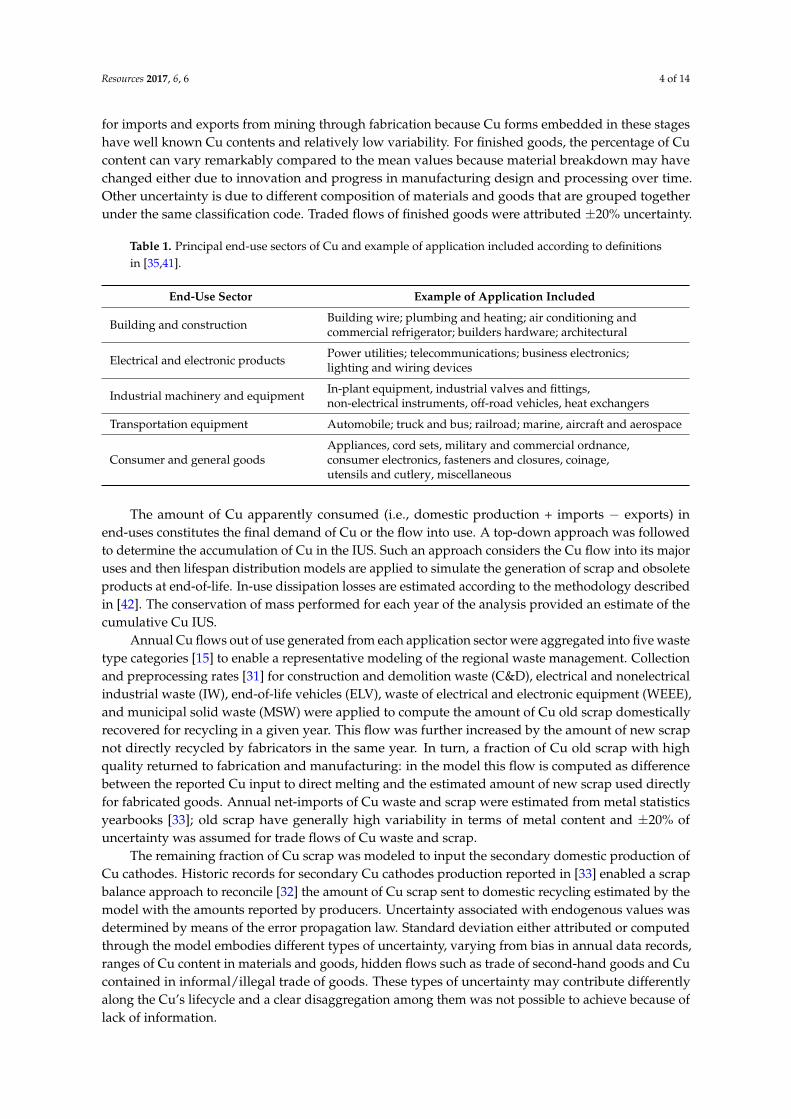
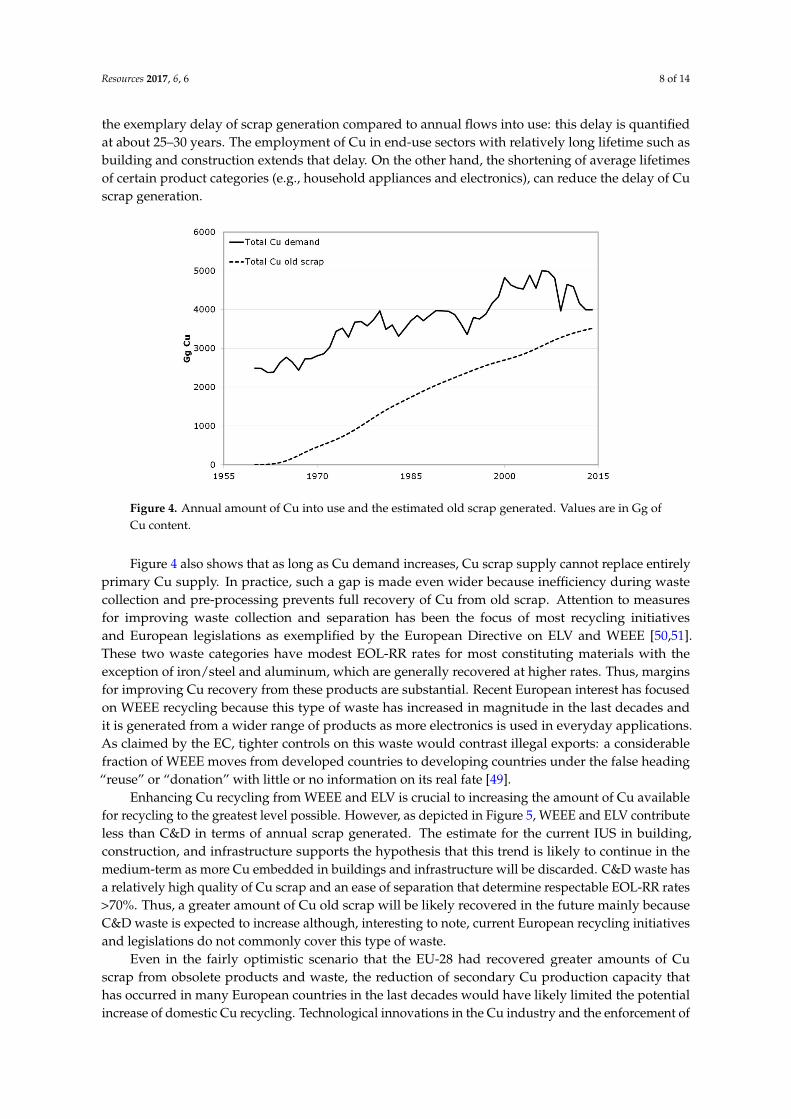
Among the recycling-related limitations, scrap availability and recycling inefficiency reduce theamount of secondary Cu that could replace primary metal input. As depicted in Figure 4, Cu shows
Resources 2017, 6, 6 8 of 14
the exemplary delay of scrap generation compared to annual flows into use: this delay is quantifiedat about 25–30 years. The employment of Cu in end-use sectors with relatively long lifetime such asbuilding and construction extends that delay. On the other hand, the shortening of average lifetimesof certain product categories (e.g., household appliances and electronics), can reduce the delay of Cuscrap generation.
Resources 2017, 6, 6 8 of 14
building and construction extends that delay. On the other hand, the shortening of average lifetimes of certain product categories (e.g., household appliances and electronics), can reduce the delay of Cu scrap generation.
Figure 4. Annual amount of Cu into use and the estimated old scrap generated. Values are in Gg of Cu content.
Figure 4 also shows that as long as Cu demand increases, Cu scrap supply cannot replace entirely primary Cu supply. In practice, such a gap is made even wider because inefficiency during waste collection and pre-processing prevents full recovery of Cu from old scrap. Attention to measures for improving waste collection and separation has been the focus of most recycling initiatives and European legislations as exemplified by the European Directive on ELV and WEEE [50,51]. These two waste categories have modest EOL-RR rates for most constituting materials with the exception of iron/steel and aluminum, which are generally recovered at higher rates. Thus, margins for improving Cu recovery from these products are substantial. Recent European interest has focused on WEEE recycling because this type of waste has increased in magnitude in the last decades and it is generated from a wider range of products as more electronics is used in everyday applications. As claimed by the EC, tighter controls on this waste would contrast illegal exports: a considerable fraction of WEEE moves from developed countries to developing countries under the false heading “reuse” or “donation” with little or no information on its real fate [49].
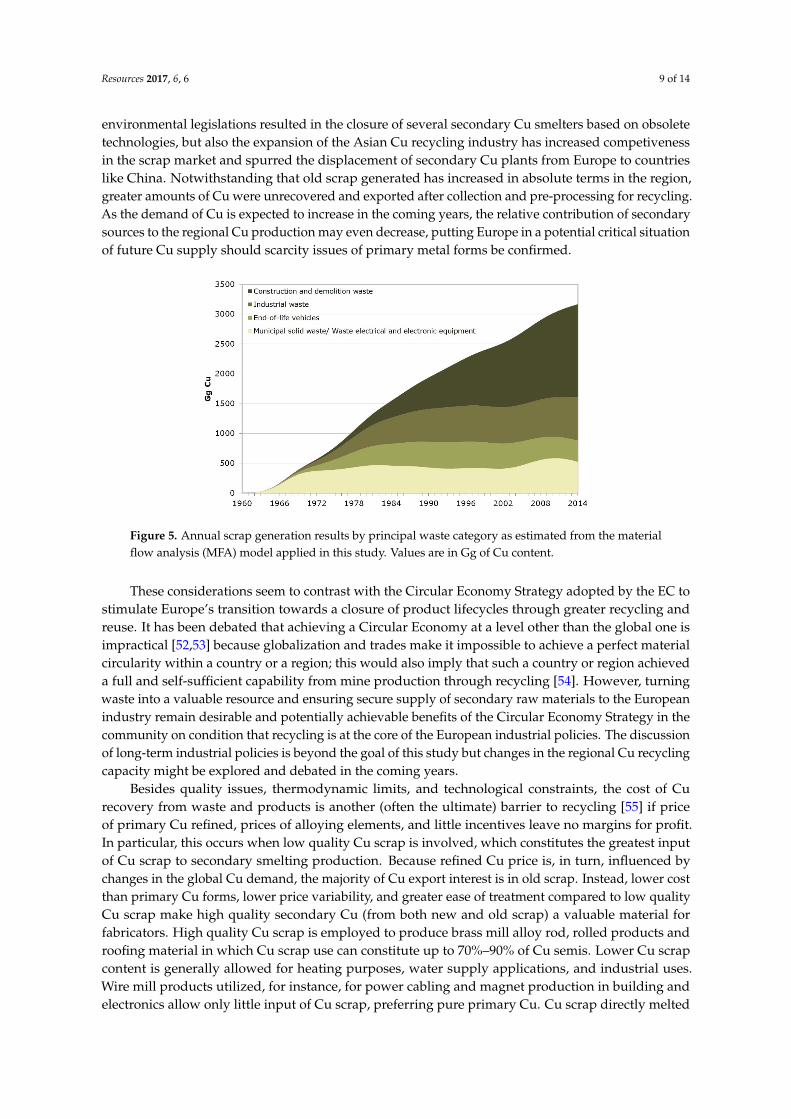
Enhancing Cu recycling from WEEE and ELV is crucial to increasing the amount of Cu available for recycling to the greatest level possible. However, as depicted in Figure 5, WEEE and ELV contribute less than C&D in terms of annual scrap generated. The estimate for the current IUS in building, construction, and infrastructure supports the hypothesis that this trend is likely to continue in the medium-term as more Cu embedded in buildings and infrastructure will be discarded. C&D waste has a relatively high quality of Cu scrap and an ease of separation that determine respectable EOL-RR rates >70%. Thus, a greater amount of Cu old scrap will be likely recovered in the future mainly because C&D waste is expected to increase although, interesting to note, current European recycling initiatives and legislations do not commonly cover this type of waste.
Even in the fairly optimistic scenario that the EU-28 had recovered greater amounts of Cu scrap from obsolete products and waste, the reduction of secondary Cu production capacity that has occurred in many European countries in the last decades would have likely limited the potential increase of domestic Cu recycling. Technological innovations in the Cu industry and the enforcement of environmental legislations resulted in the closure of several secondary Cu smelters based on obsolete technologies, but also the expansion of the Asian Cu recycling industry has increased competiveness in the scrap market and spurred the displacement of secondary Cu plants from Europe to countries like China. Notwithstanding that old scrap generated has increased in
Figure 4. Annual amount of Cu into use and the estimated old scrap generated. Values are in Gg ofCu content.
Figure 4 also shows that as long as Cu demand increases, Cu scrap supply cannot replace entirelyprimary Cu supply. In practice, such a gap is made even wider because inefficiency during wastecollection and pre-processing prevents full recovery of Cu from old scrap. Attention to measuresfor improving waste collection and separation has been the focus of most recycling initiativesand European legislations as exemplified by the European Directive on ELV and WEEE [50,51].These two waste categories have modest EOL-RR rates for most constituting materials with theexception of iron/steel and aluminum, which are generally recovered at higher rates. Thus, marginsfor improving Cu recovery from these products are substantial. Recent European interest has focusedon WEEE recycling because this type of waste has increased in magnitude in the last decades andit is generated from a wider range of products as more electronics is used in everyday applications.As claimed by the EC, tighter controls on this waste would contrast illegal exports: a considerablefraction of WEEE moves from developed countries to developing countries under the false heading“reuse” or “donation” with little or no information on its real fate [49].
Enhancing Cu recycling from WEEE and ELV is crucial to increasing the amount of Cu availablefor recycling to the greatest level possible. However, as depicted in Figure 5, WEEE and ELV contributeless than C&D in terms of annual scrap generated. The estimate for the current IUS in building,construction, and infrastructure supports the hypothesis that this trend is likely to continue in themedium-term as more Cu embedded in buildings and infrastructure will be discarded. C&D waste hasa relatively high quality of Cu scrap and an ease of separation that determine respectable EOL-RR rates>70%. Thus, a greater amount of Cu old scrap will be likely recovered in the future mainly becauseC&D waste is expected to increase although, interesting to note, current European recycling initiativesand legislations do not commonly cover this type of waste.
Even in the fairly optimistic scenario that the EU-28 had recovered greater amounts of Cuscrap from obsolete products and waste, the reduction of secondary Cu production capacity thathas occurred in many European countries in the last decades would have likely limited the potentialincrease of domestic Cu recycling. Technological innovations in the Cu industry and the enforcement of
Resources 2017, 6, 6 9 of 14
environmental legislations resulted in the closure of several secondary Cu smelters based on obsoletetechnologies, but also the expansion of the Asian Cu recycling industry has increased competivenessin the scrap market and spurred the displacement of secondary Cu plants from Europe to countrieslike China. Notwithstanding that old scrap generated has increased in absolute terms in the region,greater amounts of Cu were unrecovered and exported after collection and pre-processing for recycling.As the demand of Cu is expected to increase in the coming years, the relative contribution of secondarysources to the regional Cu production may even decrease, putting Europe in a potential critical situationof future Cu supply should scarcity issues of primary metal forms be confirmed.
Resources 2017, 6, 6 9 of 14
absolute terms in the region, greater amounts of Cu were unrecovered and exported after collection and pre-processing for recycling. As the demand of Cu is expected to increase in the coming years, the relative contribution of secondary sources to the regional Cu production may even decrease, putting Europe in a potential critical situation of future Cu supply should scarcity issues of primary metal forms be confirmed.
Figure 5. Annual scrap generation results by principal waste category as estimated from the material flow analysis (MFA) model applied in this study. Values are in Gg of Cu content.
These considerations seem to contrast with the Circular Economy Strategy adopted by the EC to stimulate Europe’s transition towards a closure of product lifecycles through greater recycling and reuse. It has been debated that achieving a Circular Economy at a level other than the global one is impractical [52,53] because globalization and trades make it impossible to achieve a perfect material circularity within a country or a region; this would also imply that such a country or region achieved a full and self-sufficient capability from mine production through recycling [54]. However, turning waste into a valuable resource and ensuring secure supply of secondary raw materials to the European industry remain desirable and potentially achievable benefits of the Circular Economy Strategy in the community on condition that recycling is at the core of the European industrial policies. The discussion of long-term industrial policies is beyond the goal of this study but changes in the regional Cu recycling capacity might be explored and debated in the coming years.
Besides quality issues, thermodynamic limits, and technological constraints, the cost of Cu recovery from waste and products is another (often the ultimate) barrier to recycling [55] if price of primary Cu refined, prices of alloying elements, and little incentives leave no margins for profit. In particular, this occurs when low quality Cu scrap is involved, which constitutes the greatest input of Cu scrap to secondary smelting production. Because refined Cu price is, in turn, influenced by changes in the global Cu demand, the majority of Cu export interest is in old scrap. Instead, lower cost than primary Cu forms, lower price variability, and greater ease of treatment compared to low quality Cu scrap make high quality secondary Cu (from both new and old scrap) a valuable material for fabricators. High quality Cu scrap is employed to produce brass mill alloy rod, rolled products and roofing material in which Cu scrap use can constitute up to 70%–90% of Cu semis. Lower Cu scrap content is generally allowed for heating purposes, water supply applications, and industrial uses. Wire mill products utilized, for instance, for power cabling and magnet production in building and electronics allow only little input of Cu scrap, preferring pure primary Cu. Cu scrap directly melted has higher quality, less sensitivity to global Cu demand, and seem to be driven by scrap availability more than Cu prices [49].
Should the demand of fabricated goods follow a sustained growth in the future, increasing the quality of old scrap containing Cu would secure access to end-uses driving the demand of pure Cu forms such as electrical and electronics and, perhaps, enable a growing use in direct melting first and
Figure 5. Annual scrap generation results by principal waste category as estimated from the materialflow analysis (MFA) model applied in this study. Values are in Gg of Cu content.
These considerations seem to contrast with the Circular Economy Strategy adopted by the EC tostimulate Europe’s transition towards a closure of product lifecycles through greater recycling andreuse. It has been debated that achieving a Circular Economy at a level other than the global one isimpractical [52,53] because globalization and trades make it impossible to achieve a perfect materialcircularity within a country or a region; this would also imply that such a country or region achieveda full and self-sufficient capability from mine production through recycling [54]. However, turningwaste into a valuable resource and ensuring secure supply of secondary raw materials to the Europeanindustry remain desirable and potentially achievable benefits of the Circular Economy Strategy in thecommunity on condition that recycling is at the core of the European industrial policies. The discussionof long-term industrial policies is beyond the goal of this study but changes in the regional Cu recyclingcapacity might be explored and debated in the coming years.
Besides quality issues, thermodynamic limits, and technological constraints, the cost of Curecovery from waste and products is another (often the ultimate) barrier to recycling [55] if priceof primary Cu refined, prices of alloying elements, and little incentives leave no margins for profit.In particular, this occurs when low quality Cu scrap is involved, which constitutes the greatest inputof Cu scrap to secondary smelting production. Because refined Cu price is, in turn, influenced bychanges in the global Cu demand, the majority of Cu export interest is in old scrap. Instead, lower costthan primary Cu forms, lower price variability, and greater ease of treatment compared to low qualityCu scrap make high quality secondary Cu (from both new and old scrap) a valuable material forfabricators. High quality Cu scrap is employed to produce brass mill alloy rod, rolled products androofing material in which Cu scrap use can constitute up to 70%–90% of Cu semis. Lower Cu scrapcontent is generally allowed for heating purposes, water supply applications, and industrial uses.Wire mill products utilized, for instance, for power cabling and magnet production in building andelectronics allow only little input of Cu scrap, preferring pure primary Cu. Cu scrap directly melted
Resources 2017, 6, 6 10 of 14
has higher quality, less sensitivity to global Cu demand, and seem to be driven by scrap availabilitymore than Cu prices [49].
Should the demand of fabricated goods follow a sustained growth in the future, increasing thequality of old scrap containing Cu would secure access to end-uses driving the demand of pure Cuforms such as electrical and electronics and, perhaps, enable a growing use in direct melting first andthen for secondary cathodes production in replacement of primary Cu. Limitations here are related tothe shift occurring in primary Cu country suppliers over time: the composition of Cu concentratesdepends on geology, and import from producers located in different regions may have implications forthe ability to feed Cu scrap into primary European Cu smelters. For instance, the EU-28 has historicallyimported Cu ores and concentrates mainly from South America (i.e., Chile, Peru, Argentina, and Brazil),but in the most recent years China has become a major supplier for Europe.
The achievement of increased quality of Cu scrap, however, requires us to improve the waymaterials and goods are produced today. Several strategies have been discussed in literature formetals [56], particularly for steel and aluminum because of their extensive presence in the modernsociety [57], and these approaches, aiming at increasing the resource efficiency, can be reasonablyextended to Cu. The variety of alloys in number and composition hinders efficient sorting andseparation and, ultimately, functional recycling. Reducing the number of alloying elements, on one side,and the development of scrap-sorting by alloy type techniques [58,59], on the other side, is expected toimprove and facilitate material recovery and functional recycling. Reuse and maintenance havebeen pointed as ways to increase the useful lifespan of products; these strategies have gainedpositive results in local areas, but an exhaustive consideration of environmental-related implications(e.g., energy consumptions and/or harmful emissions during a product use) is needed to avoidundesired consequences as, in general, new products have better environmental performance thanobsolete ones.
Potential for Cu substitution in its major end-uses seems to be very limited in today’sconditions [10], but promising materials such as graphene [60] could determine dramatic changes ingiven sectors including power distribution and infrastructure. Alternative materials would also likelyrequire new manufacturing procedures as different materials have commonly different behaviors inthe same system conditions [56]. The design and fabrication of new materials and goods is likelythe area in which research and development initiatives should focus the most: design for recycling,design for disassembly, design for resource efficiency, and similar techniques demand a sharp changein current material processing, making material recycling the top priority.
These methods would further benefit from the adoption of recycled content requirements fornew products. Recycling targets from obsolete products and waste have been set for several materials,but because these metrics are generally expressed as share of a product weight, major attentions weregiven to the heaviest materials such as iron and steel components, with ELV recycling targets being anexample. On one hand, this has enabled achieving good recycling performances on a total mass basis,but has limited the recovery of elements in low concentrations and amounts on the other. Instead,the adoption of recycled content requirements for new products, expressed on a single material basis,would likely boost the employment of secondary material sources in new product manufacturing andsupport the development of a consolidated recycling industry.
5. Conclusions
This study has demonstrated that the European Cu lifecycle is far from having efficient circularity.However, the potential for reducing inputs of virgin ores and Europe’s vulnerability to potentialshortages of primary resources is of great consideration in light of the size of the Cu in-use stockand margins for increasing scrap recovery rates at end-of-life. Increasing the circulation of secondaryCu into the economy is an essential lever to move towards an industrial ecology approach and aclosure of material loops [61], but this transition requires that recycling be adequately addressedand supported by industry and policy actors to maximize access to valuable secondary Cu sources.
Resources 2017, 6, 6 11 of 14
Product quality requirements, harmonized rules, clearer identification of scrap grades [62], and theadoption of design strategies oriented to facilitate Cu recovery at end-of-life are key elements to boostrecycling. Beyond this, quantitative evaluations of Cu flows and stocks such as those provided byMFA serve as a fundamental basis for system-wide management strategies including the analysis ofkey trading partners and the contrast to illegal trade of Cu-containing end-of-life products and waste.Periodic updates of Cu flow models could also enable identification of noticeable variations for selectedtime intervals. In a broader context, the more these approaches were accomplished internationally,the better the consolidated Cu recycling industry could be reached worldwide.
We anticipate that the results of this study will constitute a basis for evaluating future demandand scrap supply of Cu in the region under different scenarios and for assessing the recycling-relatedenvironmental implications.
Supplementary Materials: The following are available online at www.mdpi.com/2079-9276/6/1/6/s1, Figure S1:Mass balance for a generic process in the model created, Figure S2: Mass balance for the use phase in the modelcreated, Figure S3: Intensity of Cu in-use stock per economic activity: per capita in-use stock of Cu versus percapita gross domestic product (at constant 1990 international $), Table S1: Historic statistics of Cu production inthe EU-28 for selected years, Table S2: Historic statistics of import and export of unrefined, refined, waste andscrap of Cu in the EU-28 for selected years, Table S3: Commodity codes of Cu-containing goods considered in theanalysis as recorded by the United Nations Commodity Trade Statistics database, Table S4: Loss rates for selectedprocesses of the anthropogenic life cycle of Cu, Table S5: New scrap generation rates, Table S6: Major end-useapplication sectors of Cu and related market shares, Table S7: Lifetime distribution models and related parametersapplied to the major end-use application sectors of Cu, Table S8: Transfer coefficients for Cu end-use applicationsto major waste categories, Table S9: End-of-life collection (for recovery) rates and pre-processing efficiency of themain Cu waste category, Table S10: Uncertainty ranges applied to Cu flows in this study.
Acknowledgments: We express gratitude to Carlos Risopatron, from the International Copper Study Group,for his courtesy in providing the final report of the ICSG Global Copper Scrap Research Project. We thank MarkLoveitt, from the International Wrought Copper Council, and Marcel Soulier, from the Fraunhofer Institute forSystems and Innovation Research, for their help with historical Cu market shares. We also thank the “P. Baffi”Library of the Bank of Italy for the World Metal Statistics Yearbooks on copper.This project has received funding from the European Union’s Horizon 2020 research and innovation programmeunder the Marie Sklodowska-Curie grant agreement No. 704633. Disclaimer: Views expressed are those of theauthors and the Research Executive Agency (REA) of the European Commission is not responsible for any usethat may be made of the information it contains.
Author Contributions: L.C., F.P., and I.V. conceived and wrote the paper. L.C. performed the analysis andcreated figures.
Conflicts of Interest: The authors declare no conflict of interest.
Abbreviations
C&D Construction and demolition wasteCu CopperEC European CommissionELV End-of-life vehicleEOL-RR End-of-life recycling rateEU-28 European Union (28 Member States)Gg Gigagram (1 Gg = 1 × 10⁹ grams (g) = 1 kilo metric tonnes (kt))IUD In-use dissipationIUS In-use stockIW Electrical and non-electrical industrial wastekg Kilogram (1 kg = 1 × 10³ grams (g))MSW Municipal solid wasteNAS Net-addition to in-use stockNIR Net-Import RelianceTg Teragram (1 Tg = 1 × 10¹² grams (g) = 1 million metric tonnes (Mt))TS Temporary stockUN COMTRADE United Nations Commodity Trade Statistics DatabaseWEEE Waste electrical and electronic equipment
Resources 2017, 6, 6 12 of 14
References
1. U.S. Geological Survey (USGS), Mineral Commodity Summaries—Copper. Available online: https://minerals.usgs.gov/minerals/pubs/commodity/copper/mcs-2016-coppe.pdf (accessed on 20 January 2017).
2. Northey, S.; Mohr, S.; Mudd, G.M.; Weng, Z.; Giurco, D. Modelling future copper ore grade decline based ona detailed assessment of copper resources and mining. Resour. Conserv. Recycl. 2014, 83, 190–201. [CrossRef]
3. European Commission, Critical Raw Materials for the EU. Report of the Ad-hoc Working Group on DefiningCritical Raw Materials; European Commission: Bruxells, Belgium, 2010.
4. European Commission, Critical Raw Materials for the EU. Report of the Ad-hoc Working Group on DefiningCritical Raw Materials; European Commission: Bruxells, Belgium, 2014.
5. Buijs, B.S.H. Critical Thinking about Critical Minerals: Assessing Risks Related to Resource Security;German Geological Survey: Hannover, Germany, 2011.
6. U.S. National Research Council (NRC). Minerals, Critical Minerals, and the U.S. Economy; The NationalAcademies Press: Washington, DC, USA, 2008.
7. U.S. Department of Energy (DOE). Critical Materials Strategy; DOE: Washington, DC, USA, 2010.8. British Geological Survey. Risk List 2011; British Geological Survey: Nottingham, UK, 2011.9. British Geological Survey. Risk List 2015; British Geological Survey: Nottingham, UK, 2015.10. Nassar, N.T.; Barr, R.; Browning, M.; Diao, Z.; Friedlander, E.; Harper, E.M.; Henly, C.; Kavlak, G.; Kwatra, S.;
Jun, C.; et al. Criticality of the Geological Copper Family. Environ. Sci. Technol. 2012, 46, 1071–1078.[CrossRef] [PubMed]
11. Ciacci, L.; Nuss, P.; Reck, B.K.; Werner, T.T.; Graedel, T.E. Metal criticality determination for Australia, the US,and the planet—Comparing 2008 and 2012 results. Resources 2016, 5. [CrossRef]
12. Meinert, L.D.; Robinson, G.R.; Nassar, N.T. Mineral Resources: Reserves, Peak Production and the Future.Resources 2016, 5. [CrossRef]
13. Ciacci, L.; Harper, E.M.; Nassar, N.T.; Reck, B.K.; Graedel, T.E. Metal Dissipation and Inefficient RecyclingIntensify Climate Forcing. Environ. Sci. Technol. 2016, 50, 11394–11402. [CrossRef] [PubMed]
14. Graedel, T.E.; Allwood, J.; Birat, J.P.; Buchert, M.; Hagelüken, C.; Reck, B.K.; Sibley, S.F.; Sonnemann, G.What Do We Know About Metal Recycling Rates? J. Ind. Ecol. 2011, 15, 355–366. [CrossRef]
15. Glöser, S.; Soulier, M.; Tercero Espinoza, L.A. Dynamic Analysis of Global Copper Flows. Global Stocks,Postconsumer Material Flows, Recycling Indicators, and Uncertainty Evaluation. Environ. Sci. Technol. 2013,47, 6564–6572. [CrossRef] [PubMed]
16. Elshkaki, A.; Graedel, T.E.; Ciacci, L.; Reck, B.K. Copper demand, supply, and associated energy use to 2050.Glob. Environ. Chang. 2016, 39, 305–315. [CrossRef]
17. Baccini, P.; Brunner, P.H. Metabolism of the Anthroposphere; Springer: Heidelberg, Germany, 1991.18. Haas, W.; Krausmann, F.; Wiedenhofer, D.; Heinz, M. How Circular is the Global Economy?: An Assessment
of Material Flows, Waste Production, and Recycling in the European Union and the World in 2005. J. Ind. Ecol.2015, 19, 765–777. [CrossRef]
19. Hashimoto, S.; Tanikawa, H.; Moriguchi, Y. Where will large amounts of materials accumulated withinthe economy go?—A material flow analysis of construction minerals for Japan. Waste Manag. 2007, 27,1725–1738. [CrossRef] [PubMed]
20. Bogucka, R.; Kosinska, I.; Brunner, P.H. Setting priorities in plastic waste management—Lessons learnedfrom material flow analysis in Austria and Poland. Polimery-W 2008, 53, 55–59.
21. Kuczenski, B.; Geyer, R. Material flow analysis of polyethylene terephthalate in the US, 1996–2007.Resour. Conserv. Recycl. 2010, 54, 1161–1169. [CrossRef]
22. Ciacci, L.; Passarini, F.; Vassura, I. The European PVC cycle: In-use stock and flows. Resour. Conserv. Recycl.2016, in press. [CrossRef]
23. Graedel, T.E.; Cao, J. Metal spectra as indicators of development. Proc. Natl. Acad. Sci. USA 2010, 107,20905–20910. [CrossRef] [PubMed]
24. Ayres, R.U.; Ayres, L.W.; Råde, I. The Life Cycle of Copper, Its Co-Products and By-Products. Eco Effic.Ind. Sci. 2002, 13, 1–210.
25. Graedel, T.E.; Van Beers, D.; Bertram, M.; Fuse, K.; Gordon, R.B.; Gritsinin, A.; Kapur, A.; Klee, R.J.; Lifset, R.J.;Memon, L. Multilevel Cycle of Anthropogenic Copper. Environ. Sci. Technol. 2004, 38, 1242–1252. [CrossRef][PubMed]
Resources 2017, 6, 6 13 of 14
26. Gerst, M.D. Linking Material Flow Analysis and Resource Policy via Future Scenarios of In-Use Stock:An Example for Copper. Environ. Sci. Technol. 2009, 43, 6320–6325. [CrossRef] [PubMed]
27. Bertram, M.; Graedel, T.E.; Rechberger, H.; Spatari, S. The contemporary European copper cycle:Waste management subsystem. Ecol. Econ. 2002, 42, 43–57. [CrossRef]
28. Rechberger, H.; Graedel, T.E. The contemporary European copper cycle: Statistical entropy analysis.Ecol. Econ. 2002, 42, 59–72. [CrossRef]
29. Graedel, T.E.; Bertram, M.; Fuse, K.; Gordon, R.B.; Lifset, R.; Rechberger, H.; Spatari, S. The contemporaryEuropean copper cycle: The characterization of technological copper cycles. Ecol. Econ. 2002, 42, 9–26.[CrossRef]
30. Spatari, S.; Bertram, M.; Fuse, K.; Graedel, T.E.; Rechberger, H. The contemporary European copper cycle:1 year stocks and flows. Ecol. Econ. 2002, 42, 27–42. [CrossRef]
31. Ruhrberg, M. Assessing the recycling efficiency of copper from end-of-life products in Western Europe.Resour. Conserv. Recycl. 2006, 48, 141–165. [CrossRef]
32. Cencic, O.; Rechberger, H. Material flow analysis with software STAN. J. Environ. Eng. Manag. 2008, 18, 3–7.33. World Bureau of Metal Statistics (WBMS). World Metal Statistics Yearbook; World Bureau of Metal Statistics:
Ware, UK, 1984–2010.34. Soulier, M.; Fraunhofer Institute for Systems and Innovation Research, Karlsruhe, Germany. Personal
communication, 2016.35. Thomson Reuters GFMS. Copper Survey; Thomson Reuters: London, UK, 2013–2016.36. U.S. Geological Survey (USGS). Copper End-Use Statistics; Matos, G.R., Edelstein, D.L., Eds.; U.S. Geological
Survey: Reston, VA, USA, 2005.37. United Nations Commodity Trade Statistics Database (UN COMTRADE). Available online: comtrade.un.org
(accessed on 20 January 2017).38. Lossin, A. Copper. In Ullmann’s Encyclopedia of Industrial Chemistry; Wiley-VCH Verlag GmbH & Co. KGaA:
Weinheim, Germany, 2000.39. Isbell, C.A. Copper Alloys. In Ullmann’s Encyclopedia of Industrial Chemistry; Wiley-VCH Verlag GmbH & Co.
KGaA: Weinheim, Germany, 2000.40. Rechberger, H.; Cencic, O.; Fruhwirth, R. Uncertainty in material flow analysis. J. Ind. Ecol. 2014, 18, 159–160.
[CrossRef]41. Copper Development Association (CDA). Available online: http://copperalliance.org (accessed on
20 January 2017).42. Ciacci, L.; Reck, B.K.; Nassar, N.T.; Graedel, T.E. Lost by Design. Environ. Sci. Technol. 2015, 49, 9443–9451.
[CrossRef] [PubMed]43. Graedel, T.E.; Barr, R.; Chandler, C.; Chase, T.; Choi, J.; Christoffersen, L.; Friedlander, E.; Henly, C.; Jun, C.;
Nassar, N.T. Methodology of Metal Criticality Determination. Environ. Sci. Technol. 2011, 46, 1063–1070.[CrossRef]
44. Van Beers, D.; Graedel, T.E. Spatial characterisation of multi-level in-use copper and zinc stocks in Australia.J. Clean Prod. 2007, 15, 849–861. [CrossRef]
45. Kapur, A. The future of the red metal—Scenario analysis. Future 2005, 37, 1067–1094. [CrossRef]46. Spatari, S.; Bertram, M.; Gordon, R.B.; Henderson, K.; Graedel, T.E. Twentieth century copper stocks and
flows in North America: A dynamic analysis. Ecol. Econ. 2005, 54, 37–51. [CrossRef]47. Liu, G.; Müller, D.B. Centennial Evolution of Aluminum In-Use Stocks on Our Aluminized Planet.
Environ. Sci. Technol. 2013, 47, 4882–4888. [CrossRef] [PubMed]48. Müller, D.B.; Wang, T.; Duval, B. Patterns of Iron Use in Societal Evolution. Environ. Sci. Technol. 2010, 45,
182–188. [CrossRef] [PubMed]49. International Copper Study Group (ICSG). ICSG Global Copper Scrap Research Project. Final Report and
Statistical Annex; International Copper Study Group (ICSG): Lisbon, Portugal, 2010.50. European Commission. Directive 2000/53/EC of the European Parliament and of the Council of 18 September 2000
on End-of-Life Vehicles; European Commission: Bruxells, Belgium, 2000; p. 34.51. European Commission. Directive 2012/19/EU of the European Parliament and of the Council of 4 July 2012 on
Waste Electrical and Electronic Equipment (WEEE); European Commission: Bruxells, Belgium, 2012; p. 34.52. Corder, G.D.; Golev, A.; Giurco, D. “Wealth from metal waste”: Translating global knowledge on industrial
ecology to metals recycling in Australia. Miner. Eng. 2015, 76, 2–9. [CrossRef]
Resources 2017, 6, 6 14 of 14
53. Gregson, N.; Crang, M.; Fuller, S.; Holmes, H. Interrogating the circular economy: The moral economy ofresource recovery in the EU. Econ. Soc. 2015, 44, 218–243. [CrossRef]
54. Graedel, T.E.; Ciacci, L.; Reck, B.K. On the spatial dimension of the circular economy. 2016; under review.55. Dahmus, J.B.; Gutowski, T.G. What Gets Recycled: An Information Theory Based Model for Product
Recycling. Environ. Sci. Technol. 2007, 41, 7543–7550. [CrossRef] [PubMed]56. Gutowski, T.G.; Sahni, S.; Allwood, J.M.; Ashby, M.F.; Worrell, E. The energy required to produce materials:
Constraints on energy-intensity improvements, parameters of demand. Philos. Trans R. Soc. A 2013, 371.[CrossRef] [PubMed]
57. Cullen, J.M.; Allwood, J.M. Mapping the Global Flow of Aluminum: From Liquid Aluminum to End-UseGoods. Environ. Sci. Technol. 2013, 47, 3057–3064. [CrossRef] [PubMed]
58. Reuter, M.A.; Van Schaik, A.; Ignatenko, O.; De Haan, G.J. Fundamental limits for the recycling of end-of-lifevehicles. Miner. Eng. 2006, 19, 433–449. [CrossRef]
59. Modaresi, R.; Müller, D.B. The Role of Automobiles for the Future of Aluminum Recycling.Environ. Sci. Technol. 2012, 46, 8587–8594. [CrossRef] [PubMed]
60. Gibney, E. Graphene conducts electricity ten times better than expected. Available online: http://www.nature.com/news/graphene-conducts-electricity-ten-times-better-than-expected-1.14676 (accessed on 20 January 2017).
61. Giurco, D.; Petrie, J.G. Strategies for reducing the carbon footprint of copper: New technologies, morerecycling or demand management? Miner. Eng. 2007, 20, 842–853. [CrossRef]
62. Muchova, L.; Eder, P.; Villanueva, A. End-of-Waste Criteria for Copper and Copper Ally Scrap: Technical Proposals;EUR 24786 EN; Joint Research Centre—Institute for Prospective Technological Studies; Publications Office ofthe European Union: Luxembourg, 2011.
© 2017 by the authors; licensee MDPI, Basel, Switzerland. This article is an open accessarticle distributed under the terms and conditions of the Creative Commons Attribution(CC BY) license (http://creativecommons.org/licenses/by/4.0/).
Related Documents