[This is a draft paper for discussion. Please do not quote.] IWMI-Tata Water Policy Program Annual Partners’ Meet 2004 Urban - Hinterland Water Transactions: A Scoping Study Of Six Class I Indian Cities* Archana Londhe Jayesh Talati Lokesh Kumar Singh Mathew Vilayasseril Sanjay Dhaunta Bhavna Rawlley K.K. Ganapathy Robin P. Mathew Visit: http://www.iwmi.org/iwmi-tata The research covered by this paper was carried out with generous support from Sir Ratan Tata Trust, Mumbai under the IWMI-Tata Water Policy Program. This is a pre-publication paper prepared for the IWMI-Tata Annual Partners’ Meet, 2004. This is not a peer reviewed paper; views contained in it are those of the author(s) and not of the International Water Management Institute or Sir Ratan Tata Trust. * Based on Research by IWMI-Tata Core Team

Welcome message from author
This document is posted to help you gain knowledge. Please leave a comment to let me know what you think about it! Share it to your friends and learn new things together.
Transcript

[This is a draft paper for discussion. Please do not quote.]
IWMI-Tata Water Policy Program Annual Partners’ Meet 2004
Urban - Hinterland Water Transactions:
A Scoping Study Of Six Class I
Indian Cities*
Archana Londhe
Jayesh Talati Lokesh Kumar Singh Mathew Vilayasseril
Sanjay Dhaunta Bhavna Rawlley K.K. Ganapathy
Robin P. Mathew Visit: http://www.iwmi.org/iwmi-tata
The research covered by this paper was carried out with generous support from Sir Ratan Tata Trust, Mumbai under the IWMI-Tata Water Policy Program. This is a pre-publication paper prepared for the IWMI-Tata Annual Partners’ Meet, 2004.
This is not a peer reviewed paper; views contained in it are those of the author(s) and not of the International Water Management Institute or Sir Ratan Tata Trust.
* Based on Research by IWMI-Tata Core Team

1
ABSTRACT Indian demography is being marked by a dramatic shift from its rural dominance to urbanisation. Within a span of fifty years of independence the population increase in urban areas, is about fivefold, while at the aggregate level population increased 2.5 times. It is estimated that by the year 2025 about 50 % of total population will be living in the urban areas. The rapid growth in urban population is accompanied by high paced industrialization, concentrated primarily in urban centers. These two factors together are putting immense pressure on existing urban water utilities. The local urban authorities are facing a major challenge in meeting the fresh water demand and safe disposal of wastes generated by industries. This has led to large scale water transaction between urban and its hinterland putting stress on rural land and water resources. At one extreme, urban water authorities and informal water traders are importing water from hinterland to meet the urban water need, while on other extreme, farmers in hinterland are using wastewater disposed by urban centers for irrigation leading to land deterioration. This is setting a new urban rural dynamic. The paper is an attempt to understand the water transactions between urban areas and its hinterland, in the context of three subsystems in six Class I1 cities of the country: municipal water imports from the hinterland, informal urban water markets, and peri-urban wastewater economy. It brings out the mechanisms adopted by local bodies, informal institutional responses to meet the urban water demand. The study explores possible alternative arrangements; both the formal and informal bodies are looking for, to mitigate the increasing urban water demand. It also attempts to map the scale of operation and size of economy for waste water irrigation and informal urban water market, and finally the study is focusing on the impact of water transactions and conflicts arising out of the transaction.
1 Class I cities with population more than 100000

2
1.0 INTRODUCTION In India, the process of urbanization is characterized by its rapid population growth. In 1991, the percentage of urban population to total population was 25.7, which increased to 28 percent in the year 2001. The trend of urbanization is prominent in Class I cities. The Class I cities account for 65 % of the total urban population2.Between the year 1951 and 1991 the number of Class I cities increased from 75 to 300. The corresponding increase in the population inhabiting in these cities is from 7.75 percent to 16.53 percent of total population. As per Census 2001, the number of Class I cities is 430, inhabited by 16.75 percent of the total population. The increase in urban population is accompanied by increased economic activity. About one third of total population, residing in urban areas contributes 60 percent of National Income3. The study of population increase in Class I cities is important as these cities are hub of economic activities. Table 1: Growth in number of cities and population
1951 1961 1971 1981 1991 Class and Size of Towns % No. % No. % No. % No. % No. Class I : 100000 & above 7.75 75 9.29 105 11.37 149 14.01 224 16.53 300
Urban population as % of total population 17.29 17.97 19.91 23.34 25.71
Total population (million) 361.09 439.23 548.16 683
Source: www.Indiastat.com This mass concentration of population engaged in economic activities, especially industrial activities put immense pressure on physical, social and political environment. However in current scenario, the pressure created by urbanization on water, has become a major focus of discussion among academicians, researchers and government officials. In India, water provisioning system is state supported and role of private players is limited. Since water supply is considered as a ‘public good’, the government plays major role in financing and provisioning of water supply services. The institutional responsibility of water provisioning system is divided at centre and state level. The role of central government is limited to policy formulations, framing guidelines, monitoring and optional financing, while the main tasks performed by state government are: investigation, planning, designing and execution of water supply schemes; allocation of available water resources; construction of storage structures; generation of funds; framing public oriented policies and establishing proper organizational and institutional structures for the implementation. The state government plays pivotal role in water supply and sanitation services through its local bodies (municipal corporations) and water boards. The local bodies are responsible for creating water distribution and delivery infrastructure, resource augmentation, water purification, operation and maintenance, collection of water charges and finally piped water supply at individual households. However, the state supported water provisioning system is marked by inefficient operations lacking both quality and coverage of services. According to the WHO-UNICEF (2000) assessment, world wide, 94 per cent of urban population is covered by piped water supply. In context of India, 88 per cent of urban population has access to a piped water supply4. The term
2 www.indiacore.com/urban-infra.html 3 www.indiacore.com/urban-infra.html 4 Central Public Health Engineering Organization (CPHEEO), 2000 http://www.rainwaterharvesting.org/Crisis/Urbanwater-scenario.htm

3
‘coverage’ however does not represent the actual state of water supply. As per the recommendations by Central Public Health Engineering Organization (CPHEEO), per capita water supply in Class I cities should be in the range of 150-200 lpcd. In none of the Class I cities this standard is met and it usually ranges between 50 lpcd to 142 lpcd. Even in cities claiming 100 percent coverage, per capita availability varies 10 times between poor and rich locations.5 Apart from the resource scarcity, which is a natural constraint, poor water distribution infrastructure and lack of funds are cited as major constraints by urban water bodies. The limitation of resource scarcity is overcome by harnessing water sources in hinterland or by importing surface water from river basins, but poor distribution structures lead to loss of water in large volumes. In India 50 to 60 percent of water, treated and pumped by urban water authorities, is lost, or unaccounted for, due to poor water distribution infrastructure.6 As per the standards of CPHEEO, UFW losses upto 15 percent is acceptable7. However the actual losses are always much more than the standard set. These unaccounted for water (UFW) losses are of two types’ physical losses occurring due to leakages in physical infrastructure or administrative losses, due to theft and illegal or unrecorded connections.8 The third constraint of lack of funds arises due to failure of urban water bodies to generate funds internally and its increased dependence on government funds which are insufficient for proper governance. Under state ownership, water tariff is highly subsidized and is too low to recoup cost. In Indian cities average water tariff is Rs 2-8 per kl, while the cost of delivery is between Rs 9-30 per kl.9 The majority of cities have fixed water taxes based on property values. This fixed charge gives no incentive to save water. 10 The users’ failure to pay tariffs is also overlooked due to various socio-economic and political reasons. In such a scenario, when state governed water supply system is failing to meet growing urban water demand, informal water market or tanker water market is seen as an alternative. The tanker water suppliers cater to the needs of commercial establishment, schools, residential colonies and apartments and government offices, wholly or partially. Other customers are illegal colonizers who do not have regular connections for their settlements and hence depend on informal water market. For water source, tanker water suppliers are mainly dependent on groundwater, either within the city limits or in hinterland. According to Dr Sudhirendar Sharma (2003)11,”unrestricted access and lack of regulatory policies are encouraging trade in groundwater. Government’s apathy in setting up stringent groundwater regulations leaves a convenient loophole for water entrepreneurs. Though legally there are no de jure rights to groundwater, de facto all landowners literally own the groundwater under their land. From estimated Rs 3 billion a year, the groundwater trade is today close to Rs 30 billion.12” In some cases, farmers themselves engage into groundwater trade as they find groundwater sale as profitable venture than groundwater irrigation. In absence of a perennial source of surface water and dwindling water table in urban areas, urban water bodies also extract groundwater in hinterland. This coping mechanism adopted by
5 http://www.undp.org.in 6 Kirti Devi (2000)6, 7 http://planningcommission.nic.in 8 International experience shows that administrative losses can be two to three times the physical losses (The World Bank 1999b) 9 http://www.indianexpress.com 10 http://www.indianexpress.com 11 Consultant, UNDP-World Bank Water & Sanitation Program, Regional Water & Sanitation Group (RWSG) - South Asia, New Delhi, 12 http://www.infochangeindia.org
4
urban bodies has become a cause of loss of livelihoods for farmers in hinterland, who are dependent on groundwater for agricultural irrigation. On the whole, groundwater import is causing conflicts between urban collectives and tanker water suppliers on one side and scattered peri-urban farmers on the other. In context of rapid urbanization and its pressure on water resource, groundwater import from hinterland for meeting urban water demand forms the first dimension of town hinterland water transaction. The second dimension of urban hinterland water transactions deals with utilization of wastewater, generated by urban centers, for meeting irrigation demand of farmers in hinterland. Use of wastewater as a source of irrigation is extremely common, and in some countries, notably China, a very long-established practice. As per the estimates by CGIAR, farmers in developing countries irrigate an estimated 20 million hectares using partially diluted or undiluted wastewater.13 In India, it is reported that use of wastewater for irrigation is practiced in 200 places with a total land area of 73,000 ha (Ambujam, 1993). The wastewater is not always used as a last resort but it is preferred to cleaner water, because of its high nutrient content. It reduces the need for artificial fertilizers and hence considered as cost saving agricultural practice. In arid peri urban areas, wastewater serves as only reliable water source. However, despite its importance for countless livelihoods, the use of urban wastewater for irrigation is not without danger. Wastewater contains the full spectrum of pathogens found in the urban wastes, and many of these survive for several weeks when discharged onto fields. Wastewater use increases incidences of pests and weed attack. The most common threat comes from high concentrations of bacteria and intestinal worms, which pose a high risk to farming communities and customers consuming food crops grown with it. Environmental impacts of wastewater irrigation also raise doubts about its long-term sustainability. Long-term use of saline and sodium-rich water tends to erode soil structure and reduce land productivity. Moreover, due to increasing industrialization, there is change in the composition of wastewater, increasing the level of heavy metals, acids and the like, which adversely affect soil fertility and quality of crops. 2.0 OBJECTIVES OF THE STUDY The study was carried out primarily to understand and document the modes of town-hinterland water interaction under three subsystems: municipal water imports from the hinterland, informal urban water markets and peri-urban wastewater economy. The key objectives were examining and documenting the logic, actual working and the dynamics of each sub system; making an assessment of the volume/scale of transactions in each of the three sub- systems; analyzing the economics of each subsystem, it’s social and economic impacts, and the political economy underlying it. The study also examined the inequities between different income groups on the basic water provisioning facilities. It is often said that the poor pay more for water than do the rich. The study also attempted to test this hypothesis.
3.0 STUDY DESIGN AND METHODOLOGY
The study was conducted in six Class I cities viz. Ahmedabad, Bangalore, Chennai, Indore, Jaipur and Nagpur between October 2003 to December 2003. To study the attributes of each subsystem, key resource persons such as officials of different government departments, research scholars, consultants and NGOs were visited. Secondary data was gathered from city Municipal Corporations, Water Supply and Sewerage Boards, Ground Water Boards, Pollution Control Boards, Road Transport Authorities, Agriculture and Irrigation Departments, Universities and
13 http://www.futureharvest.org

5
NGOs. Primary data was collected through household, private water supplier and farmer surveys. Other tools used in the study were transects, PRA, focus group discussions and in-depth interviews. Besides these sources of information, preliminary data was also collected through exploratory city transects and village visits. Surveys, questionnaires and focused group discussions were conducted for assessing crop economics and the wastewater economy. Household surveys helped in assessing the water consumption of the users and total price paid. Questionnaires were also administered to the tanker water suppliers to understand the economics of informal water market.
4.0 SAMPLING PLAN
4.1 Wastewater Economy In Chennai, wastewater is not used for cultivation. In rest of the five cities 69 peri-urban villages along both the sides of wastewater channel were covered. In all 360 farmers practicing wastewater irrigation were interviewed. In order to capture the variation in the productivity and other aspects of agriculture between freshwater and wastewater irrigation across the entire stretch of the wastewater channel, 120 farmers practicing fresh water irrigation were interviewed. The sample size was as follows: Name of the cities
Name of wastewater channel
Length of wastewater channel under wastewater irrigation
No. of villages surveyed
Number of sampled farmers
Ahmedabad Sabarmati River Fatehwadi canal
80 Kms 14 112
Bangalore Vrishabavathi River
16 kms 7 56
Indore Khan river 55 kms 18 108 Jaipur Amanishah Nala 57 kms 14 104 Nagpur Nag river 50 kms 16 100 Since there was lack of official estimate for the area under wastewater irrigation, following formula was used to estimate the area under wastewater irrigation: Wastewater Irrigated area = 2 ? Mean Length of irrigation Pipeline ? Total Length Of Wastewater Channel
For calculating wastewater economics following formula was used: Wastewater crop economics = Wastewater irrigated area in Rabi*Total crop production with wastewater in Rabi/ha * selling price + Wastewater irrigated area in summer*total crop production with wastewater in summer/ha * selling price Fresh water crop economics = Wastewater irrigated area in Rabi*Total crop production with freshwater in Rabi/ha * selling price+ Wastewater irrigated area in summer*total crop production with freshwater in summer/ha * selling price Incremental benefit due to wastewater irrigation = Wastewater crop economics- Fresh water crop economics+ additional saving due to wastewater use - additional cost due to wastewater use

6
In absence of information regarding total area under different crops, the principal crop of each peri-urban area was assumed to be grown in all (100 %) wastewater irrigated area. The information regarding principle crops was sought from farmers in focused group discussion. In Indore, Nagpur and Jaipur, in Rabi season principal crop was wheat and in summer season vegetables were the main crop. In Ahmedabad, in Rabi season principal crops were rice and wheat. Here summer crop was not taken be farmers. In Bangalore in Rabi season rice was taken as principal crop and in summer season, sapota and flowers were main crops. 4.2 Household Surveys Household surveys were conducted with a total sample size of 1260 consumers across different income groups in all the six cities, to know the dependence of consumers on various sources of water, and the total price paid by them. The tanker water buyers at household level were divided into four income categories and sample size was as follows; Less than Rs 2,000 per month
Rs 2,000-5,000 per month
Rs 5,000-10,000 per month
More than Rs 10,000 per month
315 315 315 315 Equal numbers of respondents from each income category were administered questionnaires. Not more than 15 respondents were interviewed in any particular locality and the localities were chosen to cover the geographical spread of each city. 4.3 Informal Water Market For informal water market or tanker water suppliers’ market about 165 tanker water suppliers in all six cities were interviewed to know the modus operandi and size of economy. Except Chennai, in none of the cities there was any record of total number of tanker water suppliers. Hence snowball sampling was used and sample size was 30 tanker water suppliers or 30 percent of the population of tanker water suppliers whichever would be lower. A check list with open ended questionnaire was administered for the survey. To know the profile of tanker water buyers at household level , they were divided into three income groups: Lower Income Group Middle Income Group High Income Group Less than Rs 2000/month Between Rs 2000-
10000/month More than Rs 10000/month
5.0 RESULTS AND FINDINGS
5.1 Status of public water supply
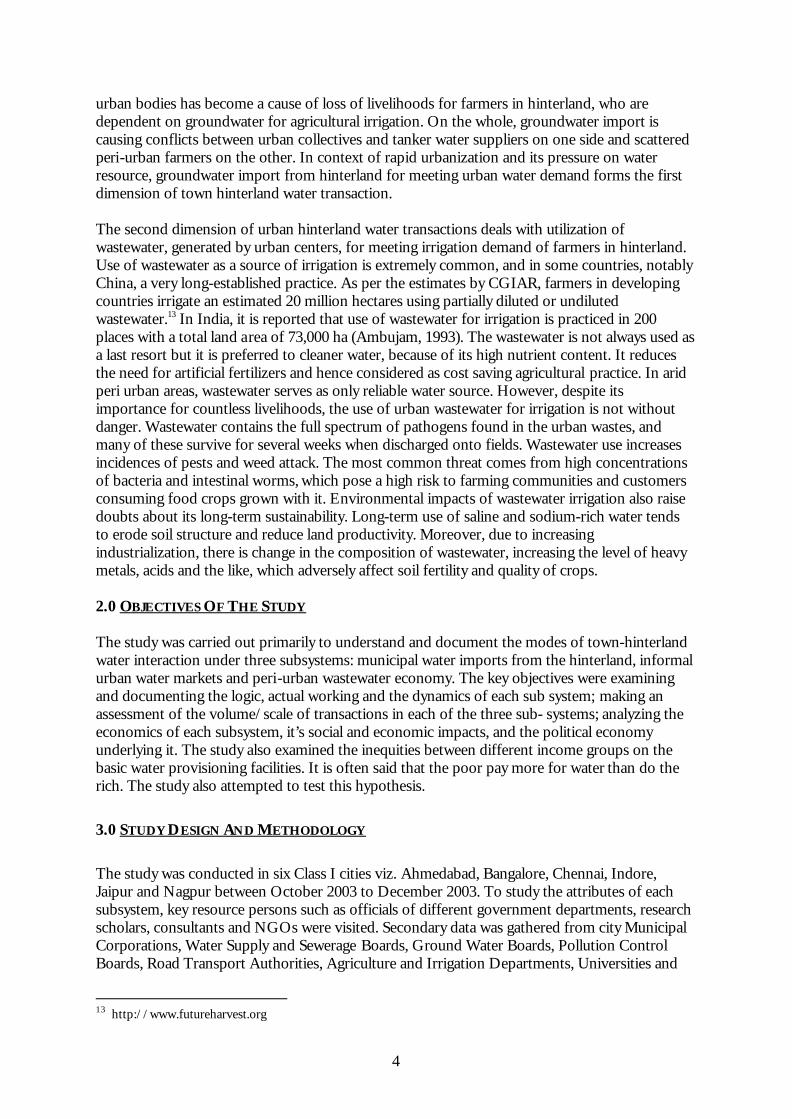
Depending on the scale and complexity of operations, different institutional models are observed in given cities. While in Ahmedabad, Indore, Jaipur and Nagpur, municipal corporations are managing water supply, in Chennai and Bangalore, separate water and sanitation boards14 have been created for management and augmentation of water supply. In all the six cities, local bodies meet only 51 % of the total demand at average supply of 80 lpcd. In Chennai, demand supply gap is huge. The gross water supply meets only 16 % of water demand. Among all the cities, in Nagpur the demand supply gap is the least. Increasing rate of 14 Chennai Metro Water Supply and Sanitation Board (CMWSSB) in Chennai & Bangalore Water Supply and Sewerage Board in Bangalore.
7
Figure 1: Demand Supply Gap
0
50
100
150
200
250
Indore Nagpur Jaipur Ahmedabad Bangalore Chennai
Lite
rs p
er c
apita
per
day
Water Demand Gross Water Supply Net Water Supply
Source: Urban Water Bodies (2003) population and constraints in terms of water scarcity and faulty distribution infrastructure are cited as major reasons for demand supply gap. Table 2: Decadal population growth rate City Indore Jaipur Nagpur Ahmedabad Bangalore Chennai Decadal Growth Rate 40 % 36 % 30 % 26 % 61 % 10 % Source: Census 2001 In all the six cities population is increasing at very high growth rate while the urban water authorities are still dependent on the old sources of water and water distribution infrastructure. The water distribution infrastructure is very old and of poor quality. The poor quality of water distribution infrastructure also leads to UFW losses. In Nagpur, authorities have succeeded in resource augmentation but due to UFW losses, they have not been able to touch the magic figure of 150-200 lpcd of water supply, recommended by Central Public Health Engineering Organization (CPHEEO) for class I cities. In rest of the cities, condition is even worse, as authorities do not even have enough resources to match the demand. According to the estimates given by various local bodies, about 740.52 MLD of water is lost due to UFW. The loss due to UFW is 30 percent of total water supply of all the six cities and can meet nearly 22 percent of total water demand. This lost amount is more than the net water supply (697 MLD) to the cities of Indore, Nagpur and Jaipur. The water scarcity at source is one main constraint affecting water supply, especially in groundwater dependant cities of Ahmedabad, Jaipur and Chennai. The situation is manageable in surface water dependent cities like Indore, Nagpur and Bangalore, where river projects are main source. In these cities river water is pumped to large distances, for water supply. The most glaring example is of Bangalore, where water is pumped from Cauvery and Arkavathi River to a distance of 150 kms. In Ahmedabad and Jaipur, groundwater within the city limits, is major source of public water supply. Chennai depends on ground water from six peri-urban well fields in the Araniyar-Kortalaiyar basin and the aquifer between Tiruvanmiyur and Muttukadu along the coast south of Chennai to meet 80% of its requirements, of which 20 MLD is drawn from wells leased from farmers. The well-fields yield 148 MLD and the southern aquifer supplies 10 MLD15.
15 Scott–Wilson, Second Chennai Water Supply Project Report – Presentation Before Board Members, CMWSSB, 2003

8
Figure 2: Contribution by surface and ground water in meeting urban water needs
89% 100%
1%28%
100%
20%
11% 0
99%72%
0
80%
0%
20%
40%
60%
80%
100%
120%
Indore
Nagpu
rJa
ipur
Ahmed
abad
Bang
alore
Chenn
ai
Contribution of ground water
Contribution of surface water
Source: Urban Water Bodies (2003) In wake of declining water table in groundwater dependant cities16, resource augmentation for meeting future needs has become a major concern for responsible authorities. The focus is to shift dependence from groundwater to surface water sources. In Ahmedabad, Sardar Sarovar Narmada Nigam Limited has recently made provision to supply 213 MLD of water from the Narmada main canal from 2004 onward. In Jaipur, the Bisalpur dam is under construction at a distance of 125 kms from the city on the Banas river and is expected to supply 317.2 million cum water to Jaipur city. The project is expected to be completed by 2007. As far as Chennai is concerned, Chennai Metro Water Supply and Sewerage Board (CMWSSB) officials plan to complete New Veeranam Project that bulk transports water from the Veeranam tank (which is over 40 sq. km. in area and 230 km away). Although this project was conceived in 1968, it has been marred with controversy and bureaucracy. The controversy has been over tradable water rights of the farmers in the area, with the tank directly irrigating 27,945 Ha.17In Bangalore, the Bangalore Water Supply and Sewerage Board (BWSSB) aim to cater to the burgeoning water needs of the population by further tapping the Cauvery river. The Cauvery Stage 4 Phase II planned to be completed by 2010, will add an additional capacity of 500 MLD to augment the city water supply. Besides this, BWSSB has commenced an Unaccounted for Water (UFW) programme that attempts to reduce leakage in the distribution system. It is planned that the project would be extended to the entire city at a total cost of Rs.400 crores. The water thus saved will be almost equal to a new Cauvery Project. In Indore Narmada phase III is supposed to augment water supply to Indore to the tune of 360MLD and 720 MLD for the designed years 2020 and 2035 respectively. Water from the river will be lifted in four or five stages to a distance of about 22 kms from where the water will be conveyed to Indore city through 48 kms long gravity main. In Nagpur authorities have drawn up plans of servicing the needs of Nagpur till 2031 wherein the Pench Phase III Stage II and the Rahari Project upstream will come up. The Pench Dam is expected to supply 213 MLD of water. 5.2 Who Is Paying More For Water? Rich or Poor? Resource augmentation is only a partial solution to the urban water supply problem. In absence of efficient management of water distribution infrastructure, the problem of water supply can not be fully solved. Lack of funds for expansion and improvement of operations is often cited 16 In Jaipur, in span of two years a downfall of 20 feet in water table has been observed. In case of Chennai also, as per Central Groundwater Board, 80 per cent of Chennai's groundwater has been depleted and in some cases leading to salt water ingression. 17 The Hindu, December 11th 2003
9
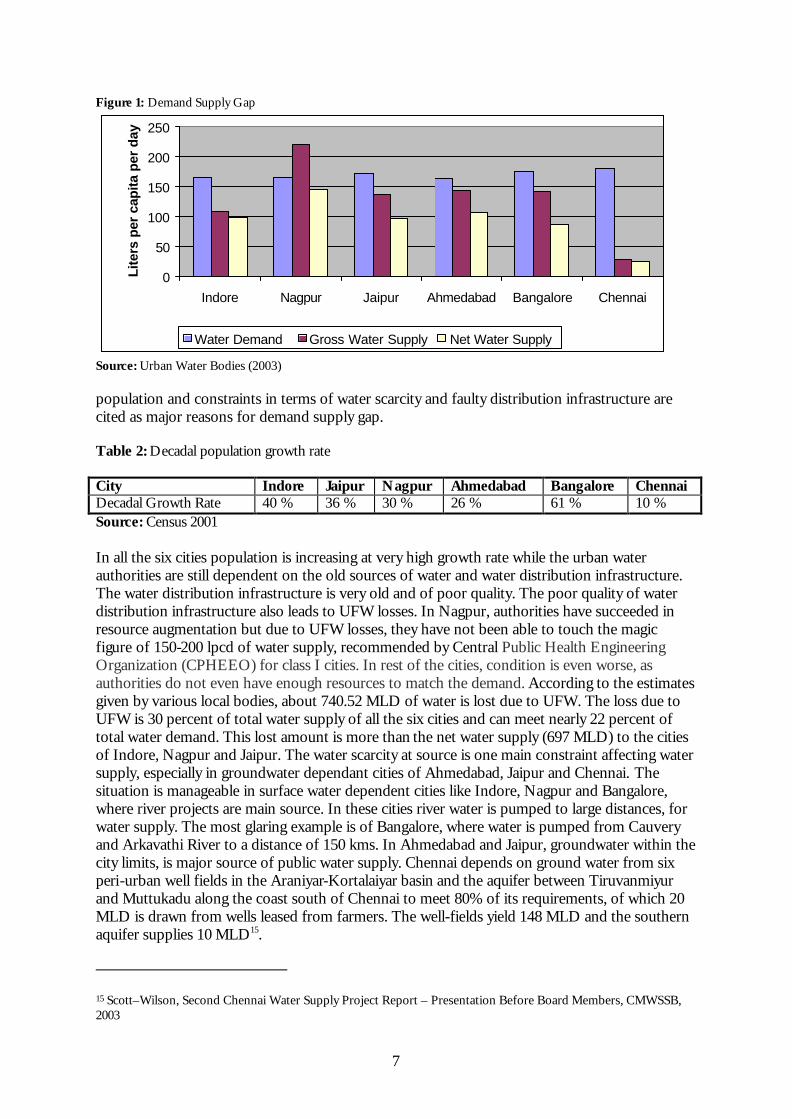
as major reason for inefficient operations. The problem of lack of funds arises due to over dependence on grants and subsidies and failure to generate funds internally. Water tariff is an important management tool to be used for achieving three basic objectives: revenue sufficiency, requiring revenue generation sufficient to pay the operation and maintenance costs, repayment of loans undertaken and to improve and expand current level of facilities; economic efficiency, creation of incentives ensuring largest possible aggregate benefits for a given water supply cost; and finally equity, requiring users to make a payment in proportionate to the usage18. However the existing water pricing policies adopted in all the given cities have failed to achieve desired objectives. The water tariff in all the cities is set at lower value then the cost of supply, and not in proportion to the usage. The water tariff is set at lower value so that poor families can benefit from lower prices. In Nagpur, Indore and Jaipur water consumption is metered and billed accordingly, however the water rate is so low that it neither covers cost of supply nor gives incentive to consumers to economize water use. In case of Bangalore, monthly water charges are calculated on volumetric basis that follows the Increasing Block Tariff (IBT) method. In IBT, different water charges are levied on slab wise consumption of water. Table 3: Increasing block tariff method in bangalore Slab Number Quantity of water (in Litres) Water Charge 1. 0 to 15000 Rs 5/kl 2. 15000 to 25000 Rs 6.5 /kl 3. 25000 to 50000 Rs 10/kl 4. 50000 to 75000 Rs 25/kl 5. Above 75000 Rs 30/kl Source: BWSSB The price for first slab is set at lower value then the actual cost of supply. Here the low price is set for the first slab so that poor households can benefit. However the subsidised rate fails to benefit poor and contrary it benefits rich households. The first block is of magnitude of 15000 liters, priced at Rs 5/kl. Due to lack of storage facilities, poor households do not use this large amount of water, as compared to rich households who have huge storage capacities. Thus a poor family, uses much less water than a rich family, but pay the same flat rate for that particular block. In Chennai, a fixed water tax is charged at rate of 1.5% of assessed annual value of the premises, irrespective of availability of water service. Apart from this a flat rate non-metered tariff of Rs.50 per month for individual house is charged. In none of the cities, basic objectives of imposing water tariff are fulfilled. At absolute terms, the rich people end up paying more then the poor and process of cross subsidization takes place.
18 D. Whittington, “Municipal water pricing and tariff design a reform agenda for South Asia”, Water Policy 5 (2003) 61–76

10
Table 4: Payment by consumers across the income group
Source: MTS studies However low water pricing by local bodies does not signify that poor consumers benefit from it. The total share of opportunity cost and economic rent is in fact equal to the absolute cost paid by poor people as seen in below Rs 2000/ month category. Even in slum areas where water is delivered free of cost, the poor pay in form of economic rent in terms of bribe to middle men and they end up paying more or less equal amount for lower quantity and quality of water. 5.3 Informal Urban Water Market In such a scenario, when public utilities are failing to meet growing urban water demand, emergence of informal water market is a possible alternative. The informal water market is in form of tanker water suppliers. At present in all the six cities, tanker water suppliers are supplying about 166.38 MLD of water, meeting about 7 % of demand supply gap. Though in terms of volume, size of informal water market is not very big19, but in terms of service and size of economy, its scale is considerable. In Chennai, where public water supply is not able to meet water demand, tanker water suppliers play very important role. In Chennai, water supplied by tanker water suppliers is about 21 % of net water supply by CMWSSB. After Chennai, Indore and Jaipur are two important tanker water markets. In case of Indore and Jaipur, volume of water sold by tanker water suppliers is 12 % and 10 % of net public water supply respectively. Figure 3: Water Supplied by Informal Water Market
Water supplied by informal water market
2014
22 18.28
37.1
55
0102030405060
Indore
Nagpur
Jaipur
Ahmed
abad
Bangalore
ChennaiV
olum
e of W
ater (M
LD)
Water supplied by informalwater market
Source: MTS studies
19 166.38 MLD of water supplied by tanker water suppliers is 5 % of total water demand and about 9 % of net water supplied by urban water bodies.
Mean Below Rs 2,000/month
Rs 2,000-5,000/month
Rs 5,000-10,000/month
Rs Above 10,000/month
Absolute Cost ( water charge+ O & M cost of storage facilities)Rs/Kl
4.75 5.83 8.86 13.61
Total cost (absolute cost +opportunity cost+ economic rent) Rs /Kl
9.57 8.13 10.50 14.43
Water consumption in lpcd
88 112 132 136
11
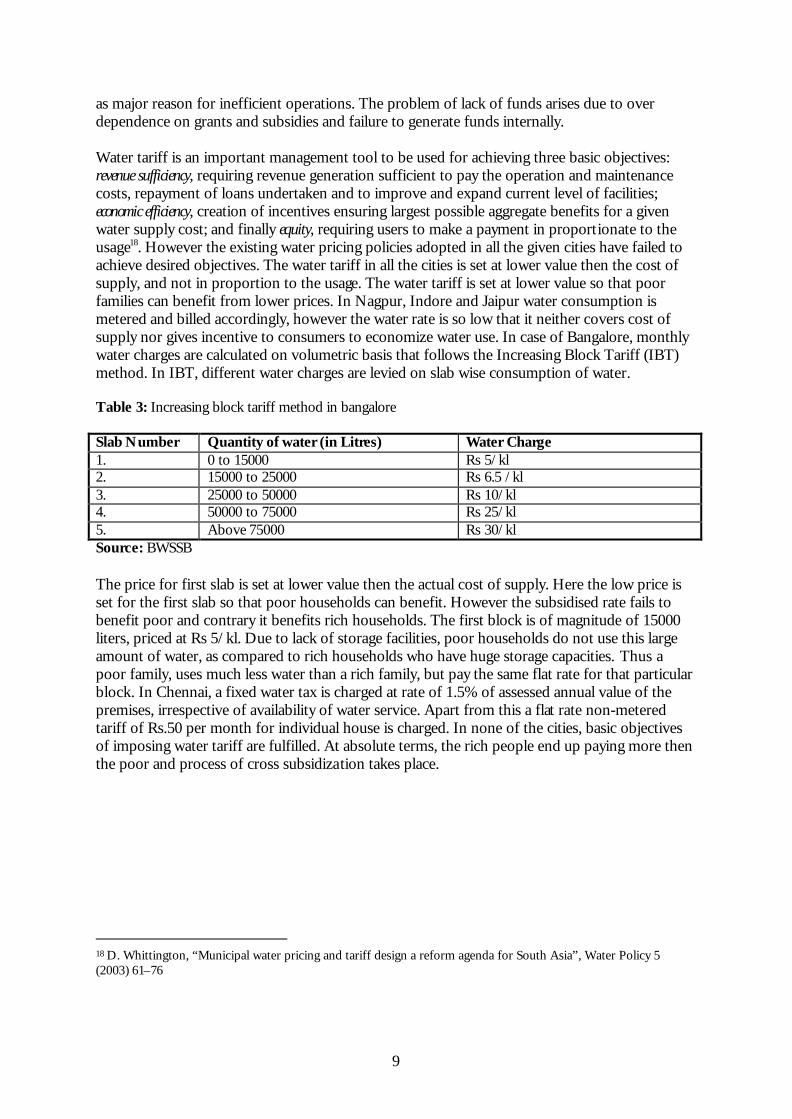
In Chennai due to large scale of operation, tanker water supply is undertaken as a separate year round business activity and there is a formal association of tanker water suppliers. In other cities, since the size of market is small and water demand is mainly seasonal, tanker water supply is not considered as the main business, but undertook as an additional activity by suppliers. The business operation is very informal in nature. The tanker water suppliers do not operate from registered office as required in other business activity. The orders for water delivery are taken mainly on phone. For source, tanker water suppliers are dependent on groundwater within and outside city limits. In Ahmedabad and Bangalore, groundwater is drawn from within the city limits and hence tanker suppliers need to seek commercial electricity connections, increasing cost of supply. In rest of the cities, water is drawn from agricultural wells in hinterland. In these cities, suppliers draw water either from owned wells or they purchase it from farmers. Tanker water supply is year round activity, though in summer the water demand is the highest, when the service quality of public water supply goes down. Household consumers form the major chunk of tanker water customers, who are dependant on tanker water in case of emergencies and in case of failure of water provisioning by public water supply. Figure 4: Customer Profile across the cities
40%
24%
5%
20%
11%household
commercial
functions
construction sites
other
Source: MTS studies Among various households, high income group is the biggest consumer of tanker water suppliers. High income group constitutes 51 % of total number of consumers, followed by middle income group, having 43 % share and finally lower income group having 6 % share. In terms of size of economy, tanker water market is thriving at a large scale. In all the six cities, about 3000 tankers, with varying capacities, have created economy of Rs 203 crores. The most astonishing fact about tanker water market is that there is no record with any government department about its size, scale and modus operandi. There is absence of any government regulation on groundwater withdrawal by tanker water suppliers. Only in Chennai, given the large size of tanker water market government has imposed certain restrictions on sources of groundwater withdrawal. 20 In other cities, authorities do not even acknowledge the existence of such market. There is complete apathy on part of authorities regarding quality of water supplied by tankers. The only legal provision required for tanker water suppliers, is registration of vehicle as liquid carrying vehicle, with Road Transport Office, but even then no specification about nature of liquid is required. 20 As per Chennai Metropolitan Area Ground Water (Regulation) Act 1987, the government has prohibited tanker suppliers from drawing water from wells within the city and from three hundred and two revenue villages on the outskirts of the city

12
Table 5: Tanker water economy
Source: MTS Studies Thus lack of government regulation and huge demand for water due to inefficiencies of local bodies, create a favorable environment for tanker water suppliers, where only entry barrier is capital. With average net return of 40 % per annum, tanker water suppliers have very good prospects in the business. Emergence of tanker water market can be seen possible alternative, but it can not replace public water supply. The scale of operation at which tanker water suppliers are operating is still very low as compared to public water supply. Also the price charged by tanker water suppliers is too high as compared to the price charged by local water bodies, which makes tanker water an unaffordable alternative to poor consumers. Table 6: Comparison of prices charged by tanker water suppliers and local water bodies Indore Nagpur Jaipur Ahmedabad Bangalore Chennai Price paid to local bodies (Rs/kl) 6 3-4 1.2 N.A. IBT N.A. Price paid to tanker water supplier (Rs/kl)
30-40 60-90 20-30 30-50 30-40 50-60
Source: MTS studies 5.4 Consequences of Water Import Emergence of informal water market has fulfilled the urban water demand to some extent. However continuous import of water from peri-urban areas by both local bodies and tanker water suppliers is only a short term solution to a bigger problem. Continuous water import has led to steep fall in groundwater table in peripheral areas. It has wide implications on livelihoods of people in peri-urban areas, who are dependant on ground water for agriculture. Large scale ground water exploitation in hinterland by water suppliers has led to steep fall in ground water table, thus leading to conflicts between farmers and water suppliers. In Jaipur indiscriminate sinking of bore wells has led to the depletion of ground water to the extent of 20 feet in the last two years. In the Jaisinghpura Khor farmers clashed with police after bore wells were dug in areas adjacent to their lands, to be used for water supply to Jaipur. In case of Indore, big farmers in Niranjanpur village, which is main source of groundwater for urban water supply, have abandoned farming and have engaged in tanker water business, while the small farmers have engaged in non farm activities. The situation is worst in Chennai. In coastal village of Kamapallai village near Minjur well field, groundwater withdrawal has led to sea water ingression leading to deterioration of groundwater and soil quality, making it unfit for remunerative cultivation. Other
Indore Nagpur Jaipur Ahmedabad Bangalore Chennai No. of tankers 300 240 350 550 700 1000 Capacity (in liters) 14000 5000 4500 4500-6000 6000 12000 Volume of water sold (in MLD)
20 14 22 18 37 55
Price (Rs/kl) 30-40 60-90 20-30 30-50 30-40 50-60 Annual Revenue (in Rs crores) 11 19 15 19.82 39.4 99.33
Annual Cost (in Rs crores) 5 12 8 15.44 25.4 64.5
Net profit (in Rs crores) 6 7 7 4.38 14 34.83
13
fallouts of the above phenomenon have been the increased migration of small and marginal farmers in search of alternative livelihood options and a gradual shift to aquaculture.
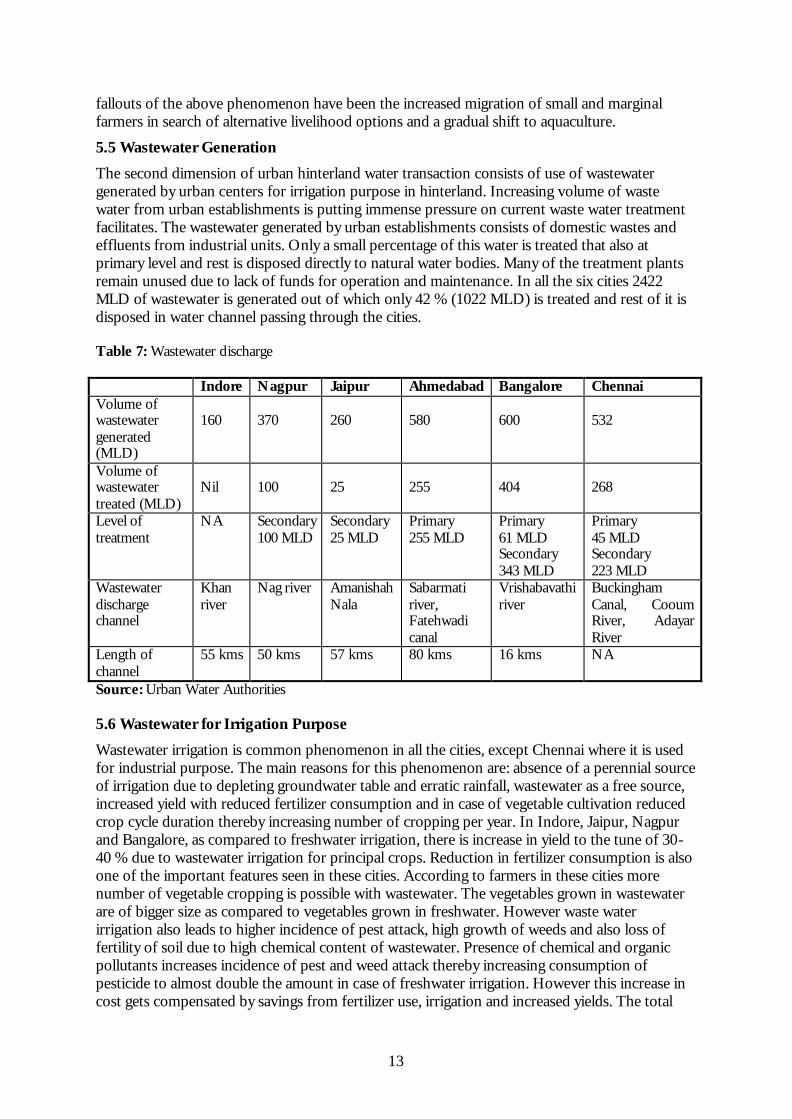
5.5 Wastewater Generation
The second dimension of urban hinterland water transaction consists of use of wastewater generated by urban centers for irrigation purpose in hinterland. Increasing volume of waste water from urban establishments is putting immense pressure on current waste water treatment facilitates. The wastewater generated by urban establishments consists of domestic wastes and effluents from industrial units. Only a small percentage of this water is treated that also at primary level and rest is disposed directly to natural water bodies. Many of the treatment plants remain unused due to lack of funds for operation and maintenance. In all the six cities 2422 MLD of wastewater is generated out of which only 42 % (1022 MLD) is treated and rest of it is disposed in water channel passing through the cities. Table 7: Wastewater discharge Indore Nagpur Jaipur Ahmedabad Bangalore Chennai Volume of wastewater generated (MLD)
160
370
260
580
600
532
Volume of wastewater treated (MLD)
Nil
100
25
255
404
268
Level of treatment
NA Secondary 100 MLD
Secondary 25 MLD
Primary 255 MLD
Primary 61 MLD Secondary 343 MLD
Primary 45 MLD Secondary 223 MLD
Wastewater discharge channel
Khan river
Nag river Amanishah Nala
Sabarmati river, Fatehwadi canal
Vrishabavathi river
Buckingham Canal, Cooum River, Adayar River
Length of channel
55 kms 50 kms 57 kms 80 kms 16 kms NA
Source: Urban Water Authorities 5.6 Wastewater for Irrigation Purpose
Wastewater irrigation is common phenomenon in all the cities, except Chennai where it is used for industrial purpose. The main reasons for this phenomenon are: absence of a perennial source of irrigation due to depleting groundwater table and erratic rainfall, wastewater as a free source, increased yield with reduced fertilizer consumption and in case of vegetable cultivation reduced crop cycle duration thereby increasing number of cropping per year. In Indore, Jaipur, Nagpur and Bangalore, as compared to freshwater irrigation, there is increase in yield to the tune of 30-40 % due to wastewater irrigation for principal crops. Reduction in fertilizer consumption is also one of the important features seen in these cities. According to farmers in these cities more number of vegetable cropping is possible with wastewater. The vegetables grown in wastewater are of bigger size as compared to vegetables grown in freshwater. However waste water irrigation also leads to higher incidence of pest attack, high growth of weeds and also loss of fertility of soil due to high chemical content of wastewater. Presence of chemical and organic pollutants increases incidence of pest and weed attack thereby increasing consumption of pesticide to almost double the amount in case of freshwater irrigation. However this increase in cost gets compensated by savings from fertilizer use, irrigation and increased yields. The total

14
land under wastewater cultivation in all the five cities is 53770 ha generating economy of Rs 491.679 crores.
Table 8: Wastewater irrigation economy
Indore Nagpur Jaipur Ahmedabad Bangalore
Land under wastewater cultivation (in ha) 8250 10200 11700 17800 5820
Wastewater economy (in Rs Crores) 108.075 133.62 146.25 69.34 45.2
Freshwater economy (in Rs Crores) 74.25 102 98.865 95.4 25.5
Incremental Benefit due to wastewater irrigation (in Rs Crores)
30.32 27.49 44.214 (26.06) 19.7
Source: MTS Studies
In Ahmedabad, farmers engaged in wastewater irrigation are at loss as compared to the farmers practicing freshwater irrigation. In Ahmedabad, level of pollution is high as compared to other cities. This affects soil fertility increasing fertilizer consumption. Thus farmers engaged in wastewater irrigation spend more on fertilizers and pesticides, as compared to farmers practicing freshwater irrigation. Table 9: Quality of wastewater
Indore Nagpur Jaipur Ahmedabad Bangalore Chennai Standard
ph 8.2 8.26 8 6.6 7.3 7.57 5.5-9.0
TDS 841 1496 814 8760 1200 12844 Below2100
BOD 110 320 70 460 160 42.92 Below30
Source: Urban Water Authorities
In all the cities pH level of wastewater is in accordance with standards stipulated by pollution control board. Ahmedabad, Bangalore and Chennai are having highest level of pollutants in terms of presence of heavy metals like Iron, Manganese, Lead, and Zinc due to presence of chemical, engineering, plastic, pharmaceutical, textiles, cement and printing industries. In absence of secondary treatment plant in Ahmedabad, the level of pollutants is very high in wastewater in terms of TDS and BOD level. The impact of wastewater on soil fertility can not be ascertained in isolation. It is affected by not only the chemical and biological constituents of wastewater but also the climatic condition and soil properties of the region where wastewater irrigation is practiced. Soil texture determines its moisture retention capacity, which is again dependent on percentage content of sand, silt and clay. Higher the clay content, higher is the water retention capacity of the soil. Black soil has higher clay content and therefore high water retention capacity. It requires less number of irrigation as compared to sandy alluvial soil and hence it is less susceptible to harmful chemicals present in wastewater. On the other hand alluvial soil requires more number of irrigations, and hence concentration of chemical present in wastewater is more for alluvial soil making it less fertile with additional wastewater irrigation. Second important soil property determining impact of chemical constituents is cation exchange capacity of soil. Roots absorb nutrients from soil in form of ions. The soil having high clay

15
content and organic matter has high cation exchange capacity i.e. such soil can easily hold cation and make it available for plant roots. Black soil has higher clay content and organic matter, and therefore higher cation exchange capacity than the alluvial soil making it more susceptible to heavy metals like lead present in wastewater. Two important climatic conditions affecting soil fertility are rainfall and temperature of the region. Area receiving higher rainfall has higher moisture content in the soil requiring lesser number of irrigations compared to areas with lower rainfall. Hence the harmful impact of wastewater irrigation is delayed in such areas compared to dry areas. Similarly the area having higher temperature has higher irrigation requirement and hence harmful impact of wastewater is more prominent in hot areas. Thus it can be concluded that impact of wastewater on soil fertility can not be ascertained by studying merely its chemical and biological composition. Chemical and biological constituents together with soil and climatic conditions determine the extent of damage posed by wastewater on soil fertility.
5.7 Impact of Wastewater Irrigation
5.7.1 Fertilizer Consumption
Reduction in fertilizer consumption is the most cited advantage of wastewater irrigation. In Indore, Nagpur, Jaipur and Bangalore fertilizer consumption in wastewater areas is lower by 50 -100%, as compared to only freshwater irrigated area . However as seen in case of wastewater users, fertilizer consumption shows an increasing trend of almost 33% to 150 % as one moves from head end to tail end. Figure 5: Fertilizer Consumption with wastewater
0
50
100
150
200
250
5 10 15 20 25 30 35 40 45 50 55
Distance in kms
Fertilize
r Con
sum
ption
(kgs
/acr
e)
Indore
Nagpur
JaipurBangalore
Source: MTS Studies Figure 6: Fertilizer Consumption with freshwater
0
50
100
150
200
250
300
5 10 15 20 25 30 35 40 45 50 55
Distance in kms
Fer
tiliz
er C
on
sum
pti
on
(k
gs/a
cre) Indore
Nagpur
Jaipur
Bangalore
Source: MTS Studies However in Ahmedabad, contrasting results can be seen. Here fertilizer consumption shows decreasing trend from head end to tail end in Sabarmati river.

16
Figure 13: Fertilizer Consumption in Ahmedabad
250
210
170
7570
170
0
50
100
150
200
250
300
5 10 30 40Fer
tiliz
er C
on
sum
pti
on
(kg
s/ac
re)
Sabarmati
Fatehwadi
Source: MTS Studies 5.7.2 Cropping Pattern In Indore, there is no shift in cropping pattern in villages adjacent to the wastewater channel. Here farmers prefer wastewater for vegetable cultivation. They are of the opinion that the size of the edible portion of vegetables is larger if grown in wastewater than if grown in fresh water. It takes about 10 days lesser for a vegetable crop grown in wastewater to be ready for harvesting as compared to vegetables grown in fresh water. In Nagpur, farmers using wastewater have ceased growing chilies and oranges. Wastewater use increases incidence of pest attack in chilies and reduces lifespan of orange tree from 20 years to 14 years. In Ahmedabad, cropping pattern has changed over the past ten years because of the unsuitability of various crops to the soil and water conditions. In the villages along the Sabarmati river, watermelon, potato, tobacco, sugarcane and chilly have been replaced by fodder, vegetables, castor and marigold among others. Rice and wheat have been the principal crops in this region. In Fatehwadi Canal region, farmers using wastewater have changed the varieties of rice. Before inflow of wastewater irrigation in the canal, varieties such as ‘Hero’ were cultivated. Now this variety is not cultivated as it is vulnerable to pest attack. Presently Gujarat-4 and Gujarat-70 varieties are cultivated. Vegetables were common crop in this region but now farmers have stopped vegetables cultivation, due to poor quality of produce. Continuous water availability has also enabled farmers to take Rabi crop. Both mustard and cotton which were the main crops in this area are no longer cultivated because of increased availability of water. In Bangalore, villages less than 10 kms downstream of wastewater channel have shifted from rice crop to sapota, ragi and flower cultivation. In rest of the areas of wastewater channel in Bangalore there is no significant change in cropping pattern and farmers are still growing rice.

17
Source: Irrigation Department, Jaipur 5.8 Wastewater for Industrial Purpose Chennai has been one of the pioneering cities where waste water is recycled for industrial purposes. In draught years of early 80s, when water supply by Metro water declined, water intensive industries faced acute water scarcity. Some water intensive industries like Madras Fertilizer Limited (MFL) which depended wholly on Metro water supply, had to shut down their operations for a substantial period. To overcome such water shortages industries like Madras Fertilizer Limited (MFL) and Chennai Petrochemical Corporation Limited (CPCL) started looking for alternatives like desalination of sea water or reuse of secondary treated waste water. Since desalination of sea water was very costly, reuse of secondary treated waste water was undertaken. Table 10: Cost of water from various sources Raw Water purchased from CMWSSB Sea Water Secondary Treated Sewage Cost Rs/kl 60 0 7.70 Treatment Cost Rs/kl
20 100 40 - 50
Total Cost Rs/kl 80 100 47.70 – 57.70 Source: CPCL and MFL officials, 2003 The two industries (MFL and CPCL) set up a tertiary treatment- reverse osmosis plant to meet 70% and 40% of their water requirements respectively. The secondary treated waste water is bought from the CMWSSB. This water is then passed through a number of treatment stages to remove the ammonia, dissolved solids and BOD. After this extensive treatment, it is passed through thin films for reverse osmosis. The outgoing water is cleaner than potable water. The dissolved solids are in the range of 15-30 ppm whereas the raw water from metro has 300-400ppm TDS21. The water thus obtained is used for refinery boilers coolant, steam generation and cooling process. The process has ensured an assured source of water supply at lower cost, saving of 19 MLD of raw water and environmental hygiene. Despite these benefits, reuse of
21 CPCL, Water Management at CPCL, 2003
Conflicts over wastewater in Jaipur In Jaipur, wastewater from Amanishah Nala is the only perennial source of irrigation for
villages in peri urban area. Presently it has become a major cause of conflict between downstream and upstream villages. The water of the Amanishah Nala is stored in Gullar dam, just on the outskirts of Jaipur city, from where the water is sent to Chandlei and Newta dams. These two dams were built to collect rainwater for irrigation. As the city expanded, the nala became the wastewater channel. In 1981 the Gullar dam broke down and wastewater started flowing into downstream villages. The farmers in downstream started using wastewater for irrigation. Once the dam was repaired, downstream farmers were deprived of the wastewater as the water started again filling the two dams through feeder canals. To ensure that they get wastewater for irrigation they filed a case in Rajasthan high court claiming that the wastewater stored in the Gullar dam can become a health hazard for the local people and hence the water from the dam should be released. The High court ordered release of water. Not to be outdone, the farmers who were lifting wastewater from the feeder canals for irrigation also filed a case admitting that they are using this wastewater for irrigation and the high courts decision to release the water from the dams would have an adverse impact on their livelihoods. The courts verdict on this case is still awaited.

18
secondary treated wastewater is not promoted by CMWSSB and many industries continue to depend on raw water from the Metro. The Metro depends on industries for 46% of its revenue though it supplies only 16% of its water to them, whereas the domestic users are highly subsidized and constitute only 40% of the revenue though they receive nearly 69% of the water22. Thus if industries like CPCL and MFL give up this source it would be a major loss to the CMWSSB. This forms a major policy issue for water diverted from industrial use that could be used for domestic purposes. 6.0 CONCLUSION To conclude water transactions between urban area and its hinterland has benefited urban areas. The inefficiencies of public water supply in terms of poor management of existing water supply infrastructure and its shortsightedness in assessing the water needs of growing population led the foundation of water transactions which is leading to mass scale groundwater extraction in hinterland. It is not only affecting livelihoods of several farmers who are facing water scarcity for meeting their irrigation needs but also causing environmental problem like sea water intrusion leading to water and soil salinity. The inability of urban water utilities to implement efficient water pricing is leading to inefficient use of water by consumers and hence there is no control over water demand management. Even then the subsidized low pricing is not benefiting poor in terms of quantity and better quality of water supply. Neither the subsidized pricing is benefiting rich class who end up paying more then the water price for operation and maintenance of extra water storage facilities, due to unreliable water supply. The emergence of tanker water market as a possible alternative to public water supply can be seen as a welcome change, but it is not substitute of public water supply. The high prices charged by tanker water suppliers and its small scale of operations are some of the major constraints. On the other hand in hinterland even though right now farmers engaged in wastewater irrigation are reaping gains by income from increased production, saving from water pumping cost and fertilizer cost, its long term environmental cost needs to be assessed. Inequitable benefit of urban hinterland water transactions is a reality, but efforts can be made to mitigate its impact on hinterland. The strategy outlined to do this suggests following policy decisions:
? Implement efficient pricing of water. ? Accept wastewater irrigation as a reality and promote adaptive strategies to mitigate its
harmful impact by educating farmers about its chemical and biological constituents and their suitability to soil type, climatic conditions and crops.
? Promote reuse of wastewater by industries by making wastewater treatment cost cheaper then wastewater generation. This can be done by imposing pollution tax.
? Formalize tanker water business and involve them as formal partner in urban water supply so as to control the quality and health aspects
22 Ruet, Joel et al, The Water & Sanitation scenario in Indian Metropolitan Cities: Resources and Management in Delhi, Calcutta, Chennai, Mumbai, 2002

19
REFERENCES Administrative estimate Reconstruction of Gullar Dam, Government of Rajasthan, Jaipur Ambujam, N.K. (1993), “Waste Water Reuse in Irrigation”, A thesis Submitted to the Anna University as a part of PhD. In civil Engineering, Anna University Annual Progress Report (NATP-Mission Mode Project A.S. Juwarkar, Asha Juwarkar, P.B. Deshbhartar and A.S. BAL (2000), Exploitation of Nutrient Potential of Sewage and Sludge Through Land Application, NEERI, Nagpur Assistant Executive Engineer, “Irrigation schemes in various parts of Kengeri Hobli of Bangalore South Taluka”, Minor Irrigation Sub-Division, Bangalore AUDA (2002), “Water Demand Survey in Western AUDA Region”, Gujarat Industrial and Technical Consultancy Organisation Ltd. for AUDA, Ahmedabad Bangalore Water Supply and Sewerage Board Act, BWSSB, Bangalore Bangalore Water Supply and Sewerage Board Annual Performance Reports (1998-99: 2000-01: 2001-2002), BWSSB, Bangalore Chaya, B. S. (1998), “Domestic wastewater studies along Vrishabavathi water shed”. PhD. Thesis Guided by S.G. Phene, Department of Environmental Sciences, Bangalore University Chief Engineer (November 2003), “ Report on the assessment of the Ground water Potential around Neyveli Area”, CMWSSB – Chennai water Supply Augmentation Project (Ground Water), State Ground and Surface Water Resources Data Centre, Chennai Chilekar, Satish (May-June 2001),” Everything about Water Wastewater Recycling”, CPCB (2002), “Tamilnadu Pollution Control Board And You: A hand book of Ready Reference for entrepreneurs ”, Tamilnadu Pollution Control Board, Chennai Department of Irrigation, Mansagar Irrigation Project, Department of Irrigation, Jaipur “Effluents in Agriculture”, Central Soil Research Institute-Karnal Expert Committee on Rain Water Harvesting and Safeguarding Ground Water (2003), “ Report on Development and Management of Water Resources of Tamil Nadu”, Government of Tamil Nadu Indore Development Plan-2011, Directorate of Town and Country Planning, Madhya Pradesh Institute for Water Studies (1997), “ State framework for Water Resources Plan: Chennai Basin Group”, WRO_PWD, Government of Tamilnadu Karnataka State Pollution Control Board, “Water Quality monitoring of lakes in & Around Bangalore City. Vol II”, KSPCB, Bangalore

20
Kumar, M. Dinesh (2001), “ Integrated Water Resources Management in Sabarmati Basin: Some Issues and Options”, Indian Natural Resource Economics and Management Foundation, Anand Maharashtra Ground Water Rules (1995) ,Government of Maharashtra, Nagpur Mangala, K P (2002), “Economic and Environmental Effects of Poor quality groundwater on the farm economy – A Study in Vrishabavathi river basin of Bangalore Rural district,” Thesis for the M.Sc. (Agri) in Agricultural Economics submitted to University of Agricultural Sciences under the guidance of N. Nagaraj, Chairman of Advisory committee & Prof. of Agriculture Economics, UAS, Bangalore Moench, Marcus and S. Janakrajan (2002), “ Water Markets, Commodity Chains and the Value of Water”, Working Paper No. 172, Madras Institute of Development Studies, Chennai Moench, Marcus et al (2002), “ The Fluid Mosaic: Water Governance in the context of variability, Uncertainty and Change”, A Synthesis Paper, Madras Institute of Development Studies, Chennai
M. Pagliai and P. Sequi( 2000),”The Influence of Animal Slurries on Soil Physical Properties”
Nagpur Sewerage Scheme, Stage-II, Phase-I, Nagpur Municipal Corporation, Nagpur Nair, K. M. et al (2002), “Land Degradation due to heavy metal pollution in Vrishabavathi Watershed, Bangalore”, Department of Soil Sciences and Agricultural Chemistry And Core Group on Watershed Management, University of Agricultural Sciences, Bangalore NMC, Water Supply Scenario, Nagpur Municipal Corporation, Nagpur
Note on Water Level Fluctuation Between Premonsoon 1984 and Premonsoon 2001 ,Jaipur, Groundwater Department, Jaipur Paul, Samuel and Sita Sekhar (2000), “Benchmarking Urban Services: The Second Report CARD on Bangalore”, Public Affairs Centre, Bangalore PHED,Indore Water Supply Project Phase – III, Indore Project Circle, PHED, Indore PHED,Pollution Abatement Scheme for River Khan, PHED, Indore PHED,Salient Features of Sewage Treatment Plant, PHED, Jaipur PHED,Water Level Monitoring, PHED, Indore Project Report on Common Effluent Treatment Plant for industrial unit in Peenya Industrial Estate, Bangalore – Compiled & presented by Pai & Pai Chemical (I) Pvt. Ltd, 101, “ Prestige Court”, K.H. Road, Bangalore – 560 027 Rao, Manjula N. (1997 –1998), “A comparative study between polluted and unpolluted soil in and around Jnanabharathi, Bangalore”, PhD. Thesis Guided by K.R. Venugopal & C.S. Harindranath, Department of Environmental Sciences, Bangalore University Reddy, Dr. M. Basappa (2003), “Status of Ground Water quality in Bangalore And its Environment”, Ground Water studies No. 426, Department of Mines and Geology, Ground Water (Minor Irrigation), Bangalore

21
R. Reddy, Manjunath (1998), “Performance studies on Vrishabavathi Valley sewage treatment plant, Bangalore”, PhD. Thesis Guided by Dr. P.K. Shetty, Department of Environmental Sciences, Bangalore University Ruet, Joel, V.S. Saravanan, Marie-Helene Zerah (2002), “ The Water & Sanitation scenario in Indian Metropolitan Cities: Resources and Management in Delhi, Calcutta, Chennai, Mumbai”, French Research Institutes in India, Pondicherry Sakthivadivel, R. and K. Venugopal (1990?), “Water P roblems in Madras Metropolitan Region, India” in Nickum, James E. and K. William Easter (ed.), “Metropolitan Water Use Conflicts in Asia and the Pacific: Studies in Water Policy and Management”, West View Press Scott Wilson Piesold (2003), “ Second Chennai Water Supply Project: The reassessment of Ground water potential and transferable water rights in the A-K Basin”, CMWSSB, Chennai
S.K.Jain (2000), “Rain Water Harvesting and Artificial Recharge for Ground Water Augumentation”, Central Ground Water Board, Nagpur Sunitha, R. (1997), “Performance studies on Koramangala and Challaghatta Valley sewage treatment plant and its effect on Bellandur tank”, PhD. Thesis Guided by S.G. Phene, Department of Environmental Sciences, Bangalore University Sujatha, M. S. (1998), “Urban Storm water Management in Kengeri Satellite town” PhD. Thesis Guided by S.G. Phene, Department of Environmental Sciences, Bangalore University The Water (Prevention and Control of Pollution) Act, 1974, Universal law Publishing Company Private Limited TATA Consulting Engineers (1997), “Ahmedabad City Water Supply Project”, Ahmedabad Municipal Corporation, Ahmedabad UN-HABITAT (2003), “Water and Sanitation for Cities: Compendium of Articles”, UN-HABITAT Information Office, Chennai Unnat Krishi Margdarshika Rabi, Department of Agriculture, Jaipur Vishwanath, G.V. (2002), “Urban Development and Urban Water Supply”, Karnataka State Infrastructure Task Force, Government of Karnataka Venkatachalam, L. (2003), “Factors influencing Household willingness to Pay (WTP) For Water: A Case Study”, Working Paper 123, Institute for Social and Economic Change, Bangalore Vishwanath, Nandini (1998),” Effects of Industrial effluents on the environment – A case study of river Vrishabavathi, Bangalore district, Karnataka”, PhD. Thesis Guided by S.G. Phene, Department of Environmental Sciences, Bangalore University WRO (2003), “ Sea water intrusion study: Minjur Area and South Chennai”, Ground water division, Water resources Organisation in PWD, Chennai YMCA Bangalore (April 1997), “Workshop on Vrishabavathi River Pollution”

22
IWMI-Tata Water Policy Program The IWMI-Tata Water Policy Program was launched in 2000 with the support of Sir Ratan Tata Trust, Mumbai. The program presents new perspectives and practical solutions derived from the wealth of research done in India on water resource management. Its objective is to help policy makers at the central, state and local levels address their water challenges – in areas such as sustainable groundwater management, water scarcity, and rural poverty – by translating research findings into practical policy recommendations. Through this program, IWMI collaborates with a range of partners across India to identify, analyse, and document relevant water-management approaches and current practices. The policy program’s website promotes the exchange of knowledge on water- resources management within the research community and between researchers and policy makers in India. IWMI-TATA WATER POLICY PROGRAM Elecon Complex, Anand-Sojitra Road Vallabh Vidyanagar, 388120, Gujarat, India Telephone: 91-2692-229311-12-13 Fax: 91-2692-229311 E-mail: [email protected] Website: http://www.iwmi.org/iwmi-tata
HEADQUARTERS127, Sunil Mawatha, Pelawatte, Battaramulla, Sri Lanka
Mailing Address: P O Box 2075, Colombo, Sri LankaTelephone: +94 – 11- 2787404, 2784080 Fax: +94 – 11- 2786854
E-Mail: [email protected]
REGIONAL OFFICE FOR ASIA(Bangladesh, China, Nepal and Sri Lanka)
127 Sunil Mawatha, Pelawatte, Battaramulla, Sri LankaMailing Address: P O Box 2075, Colombo, Sri Lanka
Telephone: +94 1 867404, 869080, 869081, 872178, 872181Fax: +94 1 866854; E-Mail: [email protected]
CHINACentre for Chinese Agricultural Policy, Chinese Academy of Sciences,
Building 917, Datun Road, Anwai, Beijing 100 101, ChinaTelephone: +86 10 64889440, 64856535, 64856837 Fax: +86 10 648556533; E-Mail: [email protected]
NEPALGPO 8975 EPC 416, Kathmandu, Nepal
Telephone: +977 – 1 – 5542306, 5535382 (Ext 486)Mobile Tel: 981022573; Fax: +977 – 1 -5536219
E-Mail: [email protected]
REGIONAL OFFICE FOR AFRICA141, Cresswell Street, 0184 Silverton, Pretoria, South Africa
Mailing Address: Private Bag x813, Silverton 0127, South AfricaTelephone: +27 12 8424132, 4125, 4128, 4131, 4136-9
Fax: +27 12 8040753; E-Mail: [email protected]
KENYAc/o ICRAF, United Nations Avenue, PO Box 30677, Nairobi, Kenya
Telephone: +254 2524751, 524000; Fax: +254 2524001 E-Mail: [email protected]
SENEGALc/o WARDA/ADRAO, BP 96 St. Louis, Senegal
Telephone: + 221 9626493, 9626441; Fax: +221 9626491 E-Mail: [email protected]
GHANAc/o KNUST, Kumasi, Ghana
Telephone/Fax: +233 51 60206E-Mail: [email protected]
REGIONAL OFFICE FOR SOUTH ASIAIWMI South Asia Regional Office, ICRISAT, Patancheru,
Andhra Pradesh 502 324, IndiaTelephone: +91- 40 - 23296161; Fax: +91- 40- 23241239
E-Mail: [email protected]
REGIONAL OFFICE FOR PAKISTAN, CENTRAL ASIA AND MIDDLE EAST
12KM, Multan Road, Chowk Thokar, NiazBaig, Lahore 53700, Pakistan
Telephone: +92 42 5410050-53Fax: +92 42 5410054; E-Mail: [email protected]
UZBEKISTANApartment No. 103, Home No. 6, Murtazaeva Street,
Tashkent 700000, UzbekistanTelephone: +998 71 1370445; Fax: +998 71 1370317
E-Mail: [email protected]
REGIONAL OFFICE FOR SOUTH-EAST ASIA(Cambodia, Indonesia, Laos, Malaysia, Myanmar, Philippines,
Thailand, Vietnam)PO Box 1025, Kasetsart University, Jatujak,
Bangkok 10903, ThailandTelephone: +66 2561 4433; Fax: +66 2561 1230
E-Mail: [email protected]
Related Documents