Urban Forms and Pedestrian, Transit-Oriented Urban Design FANG KE (方可) Sr. Urban Transport Specialist

Welcome message from author
This document is posted to help you gain knowledge. Please leave a comment to let me know what you think about it! Share it to your friends and learn new things together.
Transcript

Urban Forms and Pedestrian,
Transit-Oriented Urban Design
FANG KE (方可)
Sr. Urban Transport Specialist
Outline
• Urban Transport Problem
• How urban forms affect people’s travel
density, accessibility and walkability
• Pedestrian- oriented urban design
guidelines and best practices
• Transit-Oriented Development (TOD)
guidelines and a case study
• Q&A

Beijing, 2010
Urban transport problem in a global city…

Building more roads is not a solution

Beijing Guomao Interchange

Vicious Cycle: “Lock-in” affect of land
and transport development
CONGESTION
More
investments and
land for
roads/parking
NEW
CAPACITY FOR
CARS
Car movements
are much
easier
The average length
of movements
increases
INCREASED
CAR TRAFFIC
URBAN
SPRAWL IS
FAVORED
The number of
movements
increases

Is there any solution?
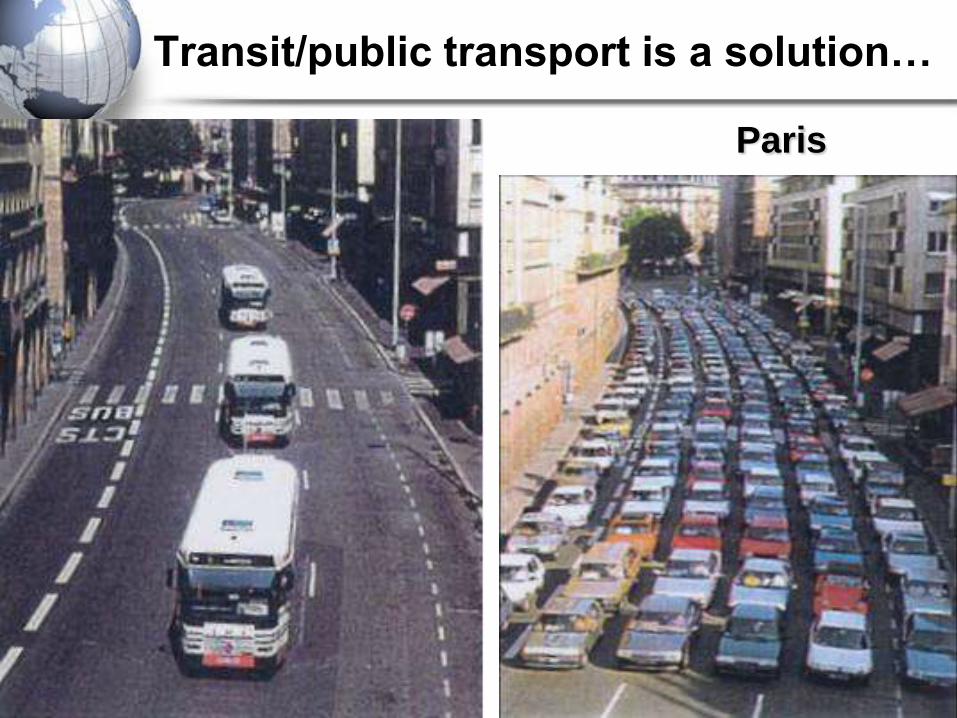
Paris
Transit/public transport is a solution…

Performance of UT Modes
0 10,000 20,000 30,000 40,000 50,000 60,000
Bus on conventional
road network
Bus using reserved lane
on highways
Urban railway
Light rapid transport
system
Private car on
conventional road
Private car on freeway
Capacity (pers/hr)
0 10 20 30 40 50 60 70 80
Speed (km/hr)
Maximum capacity
Average speed
Source: adapted from R. Tolley and B. Turton (1995), p. 63.
Many factors affecting use of transit…
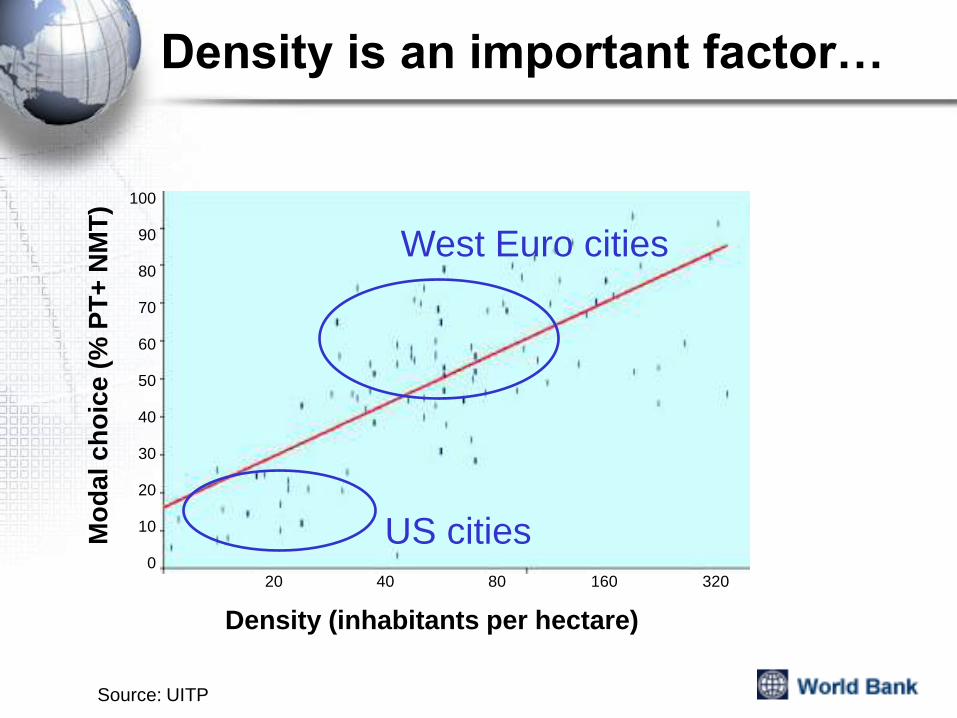
Density is an important factor…
Density (inhabitants per hectare)
Mo
dal ch
oic
e (
% P
T+
NM
T)
Source: UITP
100
90
80
70
60
50
40
30
20
10
0 20 40 80 160 320
US cities
West Euro cities

Atlanta vs. Barcelona
Source: Alain Bertaud, 2002

Difficult for transit if density is low…
• Public transport modal share
Atlanta: Barcelona - 4%: 30%

Density also has a long term “lock-in” impact ….

Typical development, late 1990s
Typical development, 1950
Atlanta
Metro
Starts
Operation
Inter-State
Highway
Program

First
subway
First
elevated
train line
New York City
Inter-State
Highway
Program

But density is not the only key factor….

Beijing has the highest density…
23,9
11
13,7
57
6,2
91
16,0
26
12,7
73
10,3
31
9,9
75
8,2
33
13,6
25
10,1
56
4,6
73
3793
3305
2294 3
821
1054
1472
928
4024
3607
5545
3494
1193
1637
734
912
536
890
640 1195
1055
1920
1899
699 1246
416
523
363
820
642
626
296 822
880
509
242
118
412
498
483
407
600
165
548
560
0
5,000
10,000
15,000
20,000
25,000
30,000
Shan
ghai M
R
Guan
gzhou M
R
Shen
zhen
MR
Bei
jing M
R
Tianjin
MR
Chen
gdu MR
Chongqin
g MR
London MR
Par
is M
R
New
York
MR
Los Angel
es M
R
inh
ab
itan
ts p
er
km
2 (
2000)
within 10 km radius from center 10 - 20 km radius from center 20 - 30 km radius from center
30 - 40 km radius from center 40 - 50 km radius from center
Population density in 10 km increments from Metropolitan Center
Beijing
London New York
Source: Creod, 2006

0
10
20
30
40
50
60
70
80
90
Beijing/2009 London/2001 New York/2010
high density = high transit modal share?
Sources:
Beijing: BTRC, Annual Report on Transport in Beijing, 2010.,
London: National Census 2001 +City of London
New York: New York Census, 2010.
Modal share by public transport for commuting to the central city

Case Studies
New York London Beijing

NEW YORK CITY
Case Study 1:
Grand Central Station
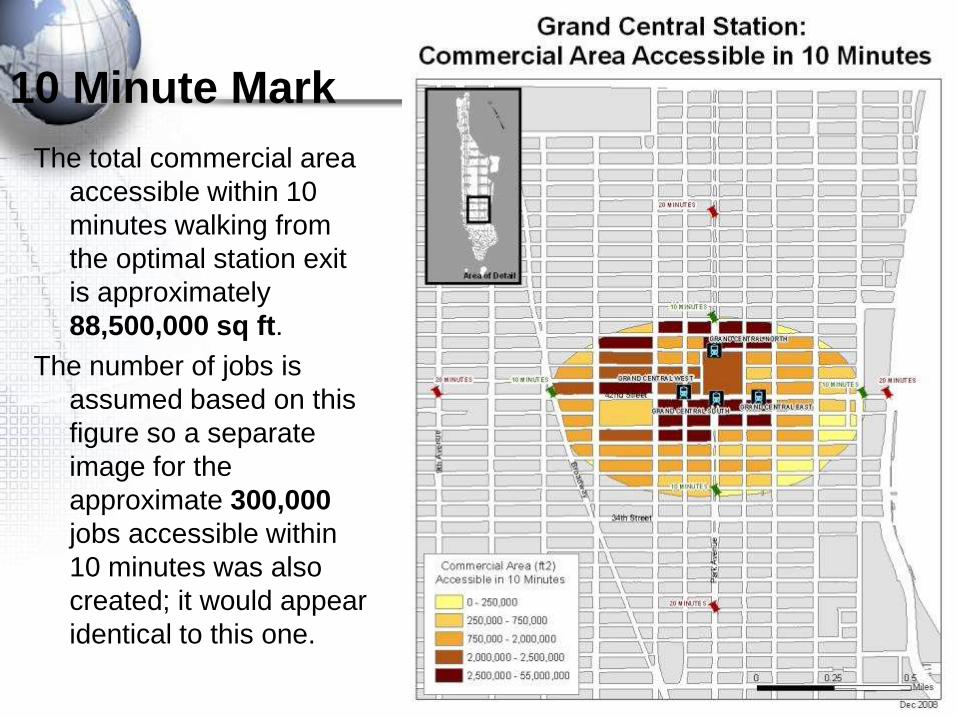
10 Minute Mark
The total commercial area
accessible within 10
minutes walking from
the optimal station exit
is approximately
88,500,000 sq ft.
The number of jobs is
assumed based on this
figure so a separate
image for the
approximate 300,000
jobs accessible within
10 minutes was also
created; it would appear
identical to this one.

20 Minute Mark
Total commercial area
within 20 minutes
walking is
approximately
265,300,000 sq ft.
The number of jobs is
estimated at
884,000

LONDON
Case Study 2:
Oxford Circus Station

10 Minute Mark
The total number of jobs accessible within 10 minutes walking from the optimal station exit is approximately 120,400
The area of commercial space is assumed based on this figure so a separate image for the estimated 36,000,000 square feet of commercial floorspace within 10 minutes was not created; it would appear identical to this one.

20 Minute Mark
Total number of jobs
within 20 minutes
walking is
approximately
277,000
The estimated area of
commercial
floorspace is
83,200,000 square
feet

BEIJING
Case Study 3:
Guomao Station 国贸地铁站

49327
90898
由国贸地铁站出发可到达的工作岗位数
Trade Center
国贸
CCTV Tower
中央电视台
Silk Market
秀水
Department
store
新光天地
SOHO City
SOHO 现代城
Tonghui River
通惠河
Hanwei Tower
汉威大厦
World Trade Plaza
世贸天街
Capital University of
Economics and business
首经贸大学
Fuli Cheng
富力城
Saite plaza
赛特购物
Tonghui River
通惠河
Jobs Accessed
around Guomao
Station
10
min.
20
min.

Jobs reached in 10 min walk
0
200,000
400,000
600,000
800,000
1,000,000
1,200,000
1,400,000
1,600,000
1,800,000
2,000,000
NYC London Beijing

Jobs reached in 20 min walk
0
200,000
400,000
600,000
800,000
1,000,000
1,200,000
1,400,000
1,600,000
1,800,000
2,000,000
NYC London Beijing

Significant difference in accessible jobs…

Compactness
Guomao, Beijing Oxford Circus, London Grand Central Station, New York
Difference in block size, building density and road network
design

12:00
Oxford Circus, London

19:00
Guomao, Beijing 步行设施和视觉环境

Guomao, Beijing
Oxford Circus, London
Grand Central Station, New York
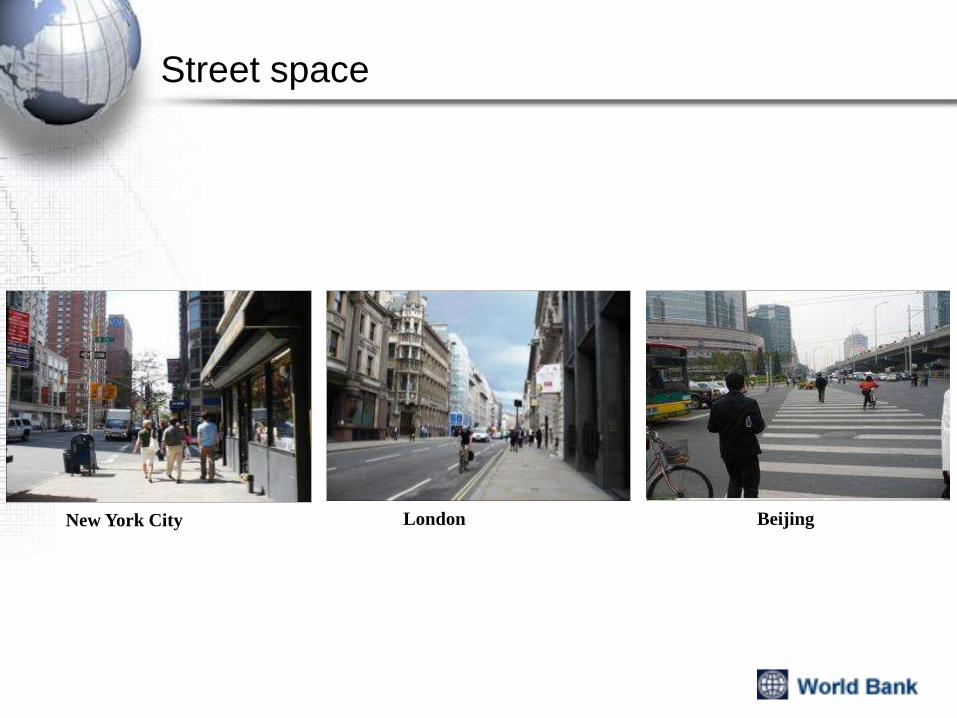
Beijing London New York City
Street space
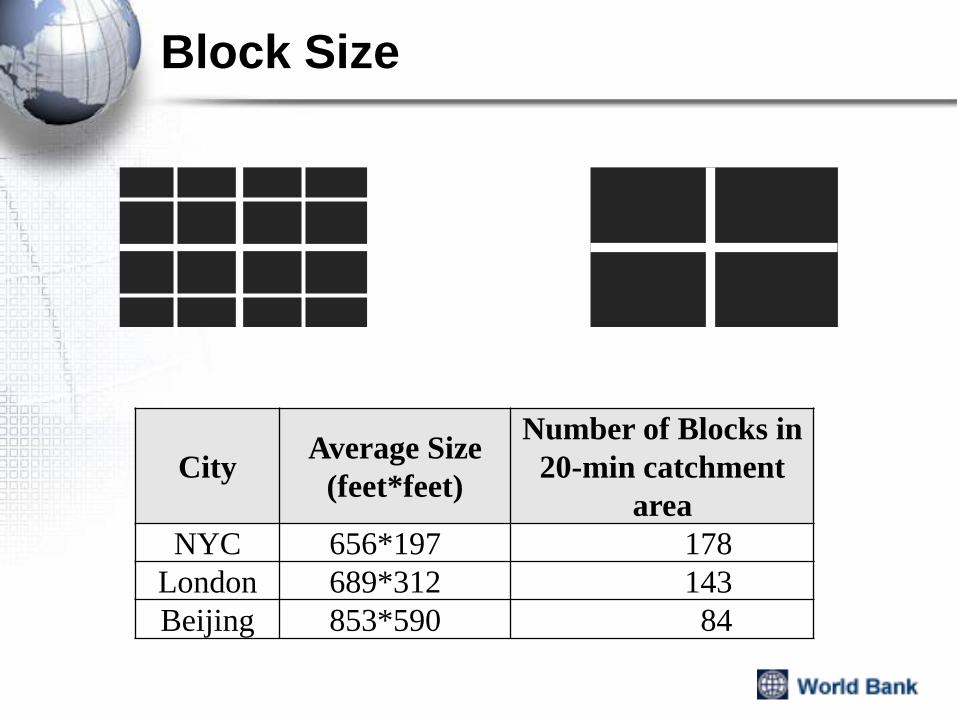
Block Size
City Average Size
(feet*feet)
Number of Blocks in
20-min catchment
area
NYC 656*197 178
London 689*312 143
Beijing 853*590 84

Building Density
City Approx. Number of Buildings in
“20-min walk"
NYC 710
London 430
Beijing 220

Road Network Characters
City Average Road
Width (feet)
Approximate
Length (miles)
NYC 66 21
London 43 17
Beijing 98 10
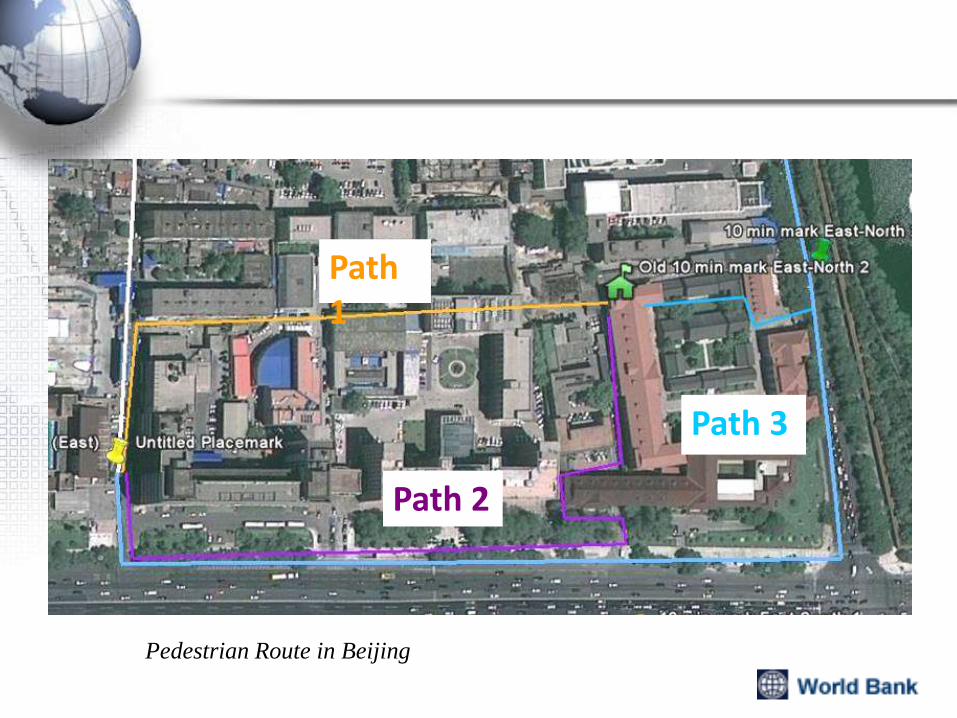
Path 1
Path 3
Path 2
Pedestrian Route in Beijing

Walkability is another key factor….

Importance of Walking as a Mode
• All trips, irrespective of mode involve walking
To/from another mode (e.g., PT, auto/parking) or
For the entire travel distance
• The use of public transport will increase if walking
safe, secure, easy and pleasant
Reducing the use of motorized transport or
Totally replacing motorized trips
• Walking can contribute to health
Physical fitness
Mental health
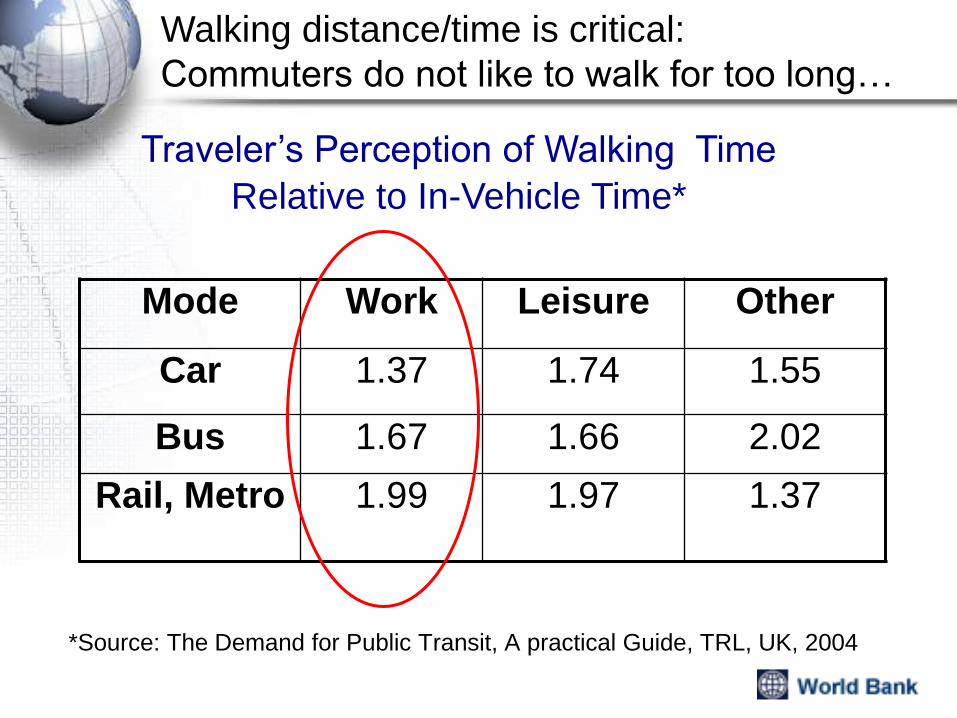
Walking distance/time is critical:
Commuters do not like to walk for too long…
Mode Work Leisure Other
Car 1.37 1.74 1.55
Bus 1.67 1.66 2.02
Rail, Metro 1.99 1.97 1.37
Traveler’s Perception of Walking Time
Relative to In-Vehicle Time*
*Source: The Demand for Public Transit, A practical Guide, TRL, UK, 2004

Quality of walking is also important: Commuters
can walk longer on roads with better walkability
* From paper by Yang Jiang done for World Bank

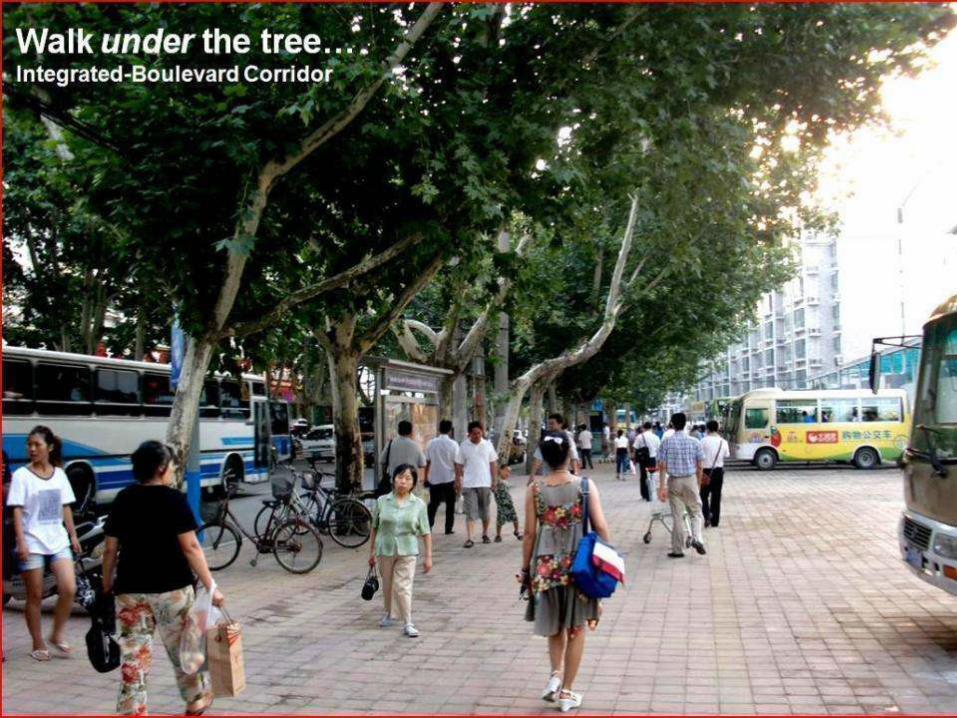


Corridor Walkability:
PT User Perspective
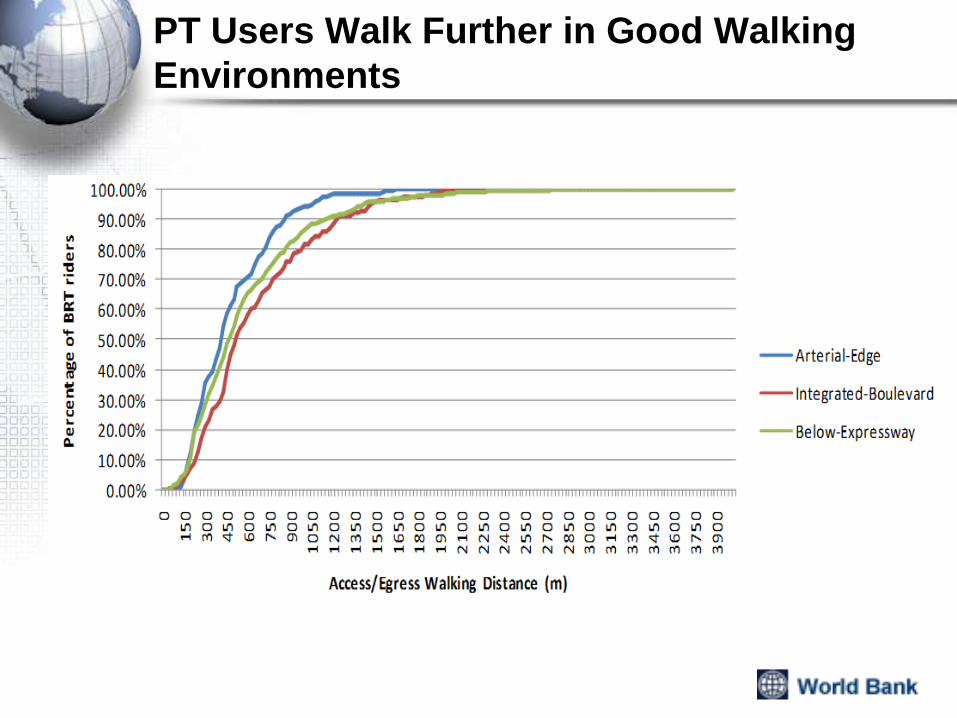
PT Users Walk Further in Good Walking
Environments

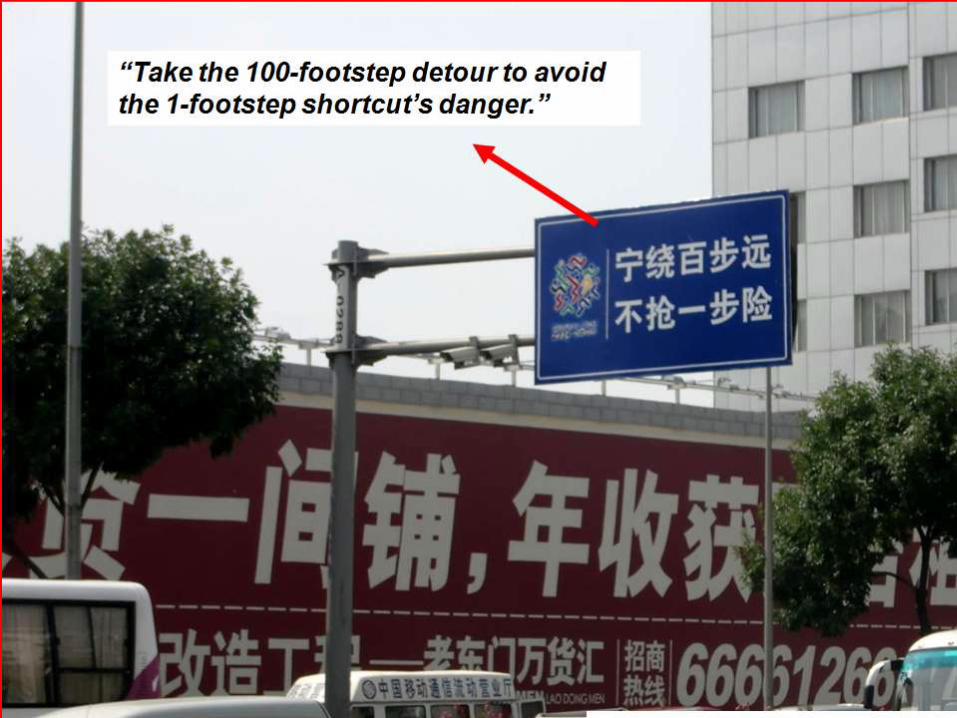
Street crossings also affect walkability


Pedestrian- Oriented Urban Design
Guidelines and Best Practices

Improve walkability
• Create walkable and safe environment
to encourage people to walk
• Extend reach of public transport
S=πR2
If R2= 2R
1
then S2= 4S
1

Shared streets –
segregation –
Shared Space
Source: Buchanan et al, 1963
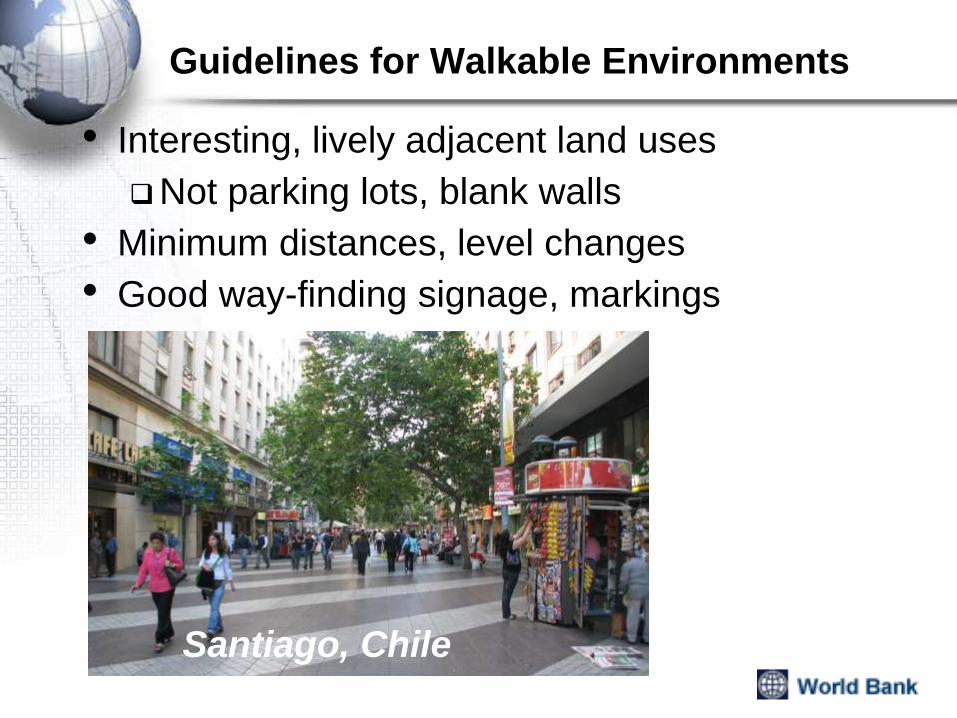
Guidelines for Walkable Environments
• Interesting, lively adjacent land uses
Not parking lots, blank walls
• Minimum distances, level changes
• Good way-finding signage, markings
Santiago, Chile

Guidelines for Sidewalks, Other Walkways
• Safe and Secure
Physically separated from high speed traffic
Wide enough to allow 2-direction walking without spillover
into street
Well lit, open without hiding places
• Well maintained
• Continuous; no obstructions,
e.g., parked cars, hawkers, merchandise
LA CBD

Protected Surface Crossings are Generally
Preferred
• No level changes
• Open and lit
Secure and safe!
Boston, US Singapore
Climate is important factor in walkability
• Must be considered in most cities, at least
in some seasons
Hot/cold temperatures, humidity, wind, rain
• Focus areas
Walking to/from public transport
Waiting time at public transport stops
Walking as a primary mode
Public gathering places near public transport
stations and terminals

Providing Walkability in Extreme Climates
• First-Story Pedestrian Walkways o Minneapolis (cold winters) Skyways
13 KM

Providing Walkability In Extreme Climates
• Underground Pedestrian Walkways Montreal, Toronto (cold winters) Houston (hot summers)
Montreal – 32 KM Houston – 11 KM

Underground Walkways Integrated with
Shopping
Houston
Montreal *Images From Wikipedia
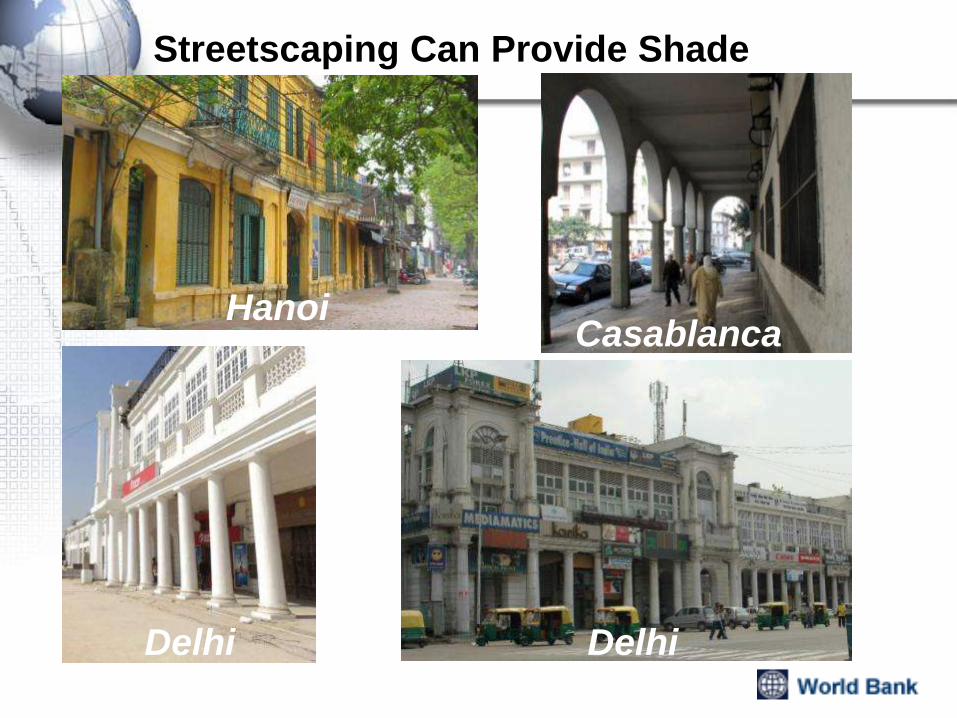
Hanoi Casablanca
Streetscaping Can Provide Shade
Delhi Delhi

Superblocks vs Smallblocks
Walking distance between any two given points is far
greater in Superblocks than Smallblocks
Courtesy: Energy Foundation

Street Hierarchy in Existing Plan Street Hierarchy in New Plan
Courtesy: Energy Foundation
Kunming New Urban Design

Courtesy: Energy Foundation
Block Size in Existing Plan Block Size In New Plan

Urban retrofit around transit stations
68
Railway line
Street
Circle of 800m 'as the crow flies' from rail station
Limit of 800m walking distance from rail station
Rail station
Green pathways
Expanded pedestrian catchment area
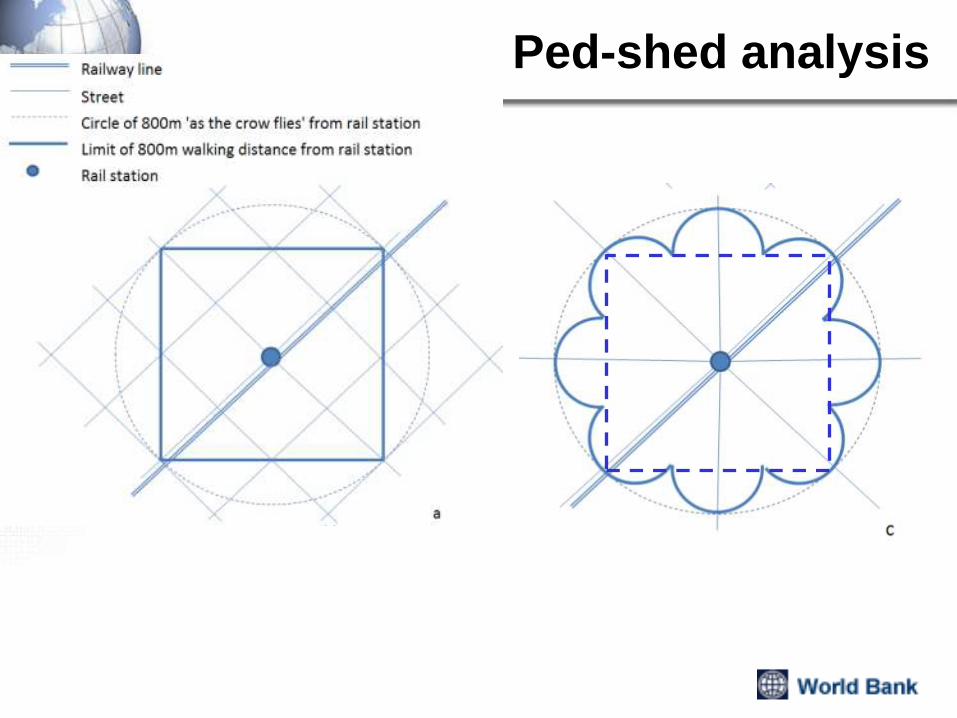
Ped-shed analysis

Bank Street, London
•
70
Railway line
Street
Circle of 800m 'as the crow flies' from rail station
Limit of 800m walking distance from rail station
Rail station
Green pathways
Expanded pedestrian catchment area

Canary Wharf, London
71
350m

VIVA Stations
Enterprise Drive Transitway
Markham Town Centre, York, Toronto

Transit-Oriented Development (TOD)

What is Transit Oriented Development (TOD)?
• Development near public transport stops, stations and interchange terminals
Compact, mixed-use developments
Encourages walking, cycling and transit use by residents, employees, shoppers, visitors
Development occurred by planning and design
• Often linked with rapid transit (bus, rail) Can happen with mixed traffic bus and streetcar
systems

Curitiba, Brazil

Benefits of TOD
• Reduces the need for personal motorized trips
• Shortens trip lengths when mixed use development is emphasized
• Can help pay for public and non-motorized transport improvements e.g., tax increment financing, direct
development of land

Market Factors that Support TOD
• A healthy development market in the city
• Stops, stations, terminals sites that are
accessible to/from entire city
By public transport and/or walking
• Large volumes of public transport customers
traveling to/from stops, stations, terminals

TOD Case Study: Arlington, Virginia

79 Arlington, Virginia
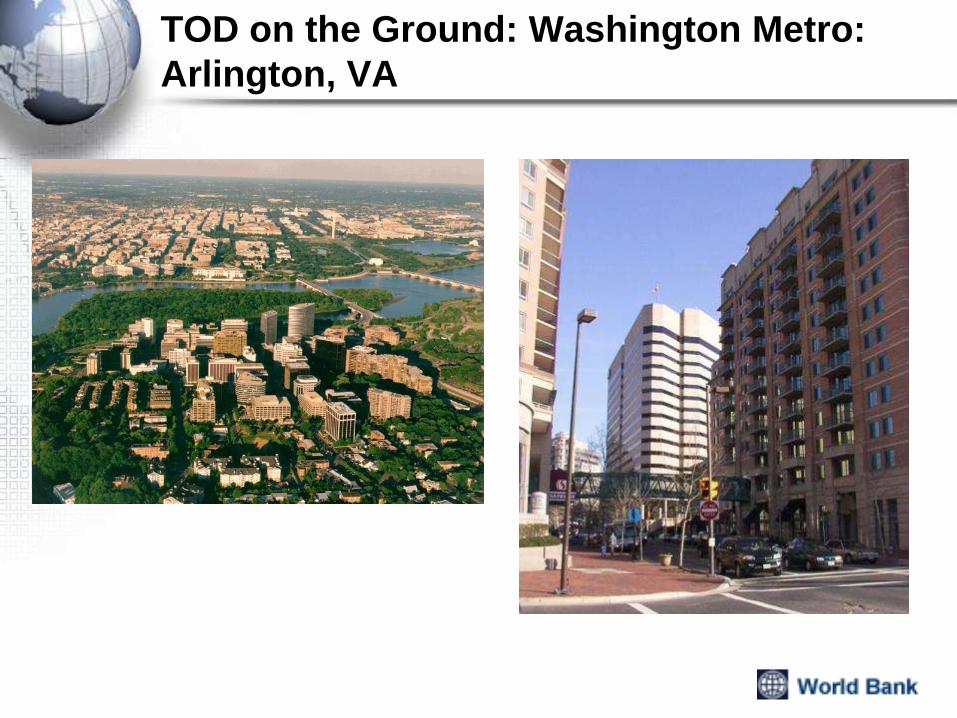
TOD on the Ground: Washington Metro:
Arlington, VA

81
Arlington, Virginia
• Across river from Washington, D.C.
• Home of the Pentagon
• Great development potential for government agencies,
government contractors
Arlington
Washington DC

82
Arlington, Virginia
• Development pattern
Central street with historic shopping nodes between Roslyn
and Ballston
Low-density suburban development elsewhere
• Early 1970s
Commercial areas and housing stock in central spine had
declined, were run-down
Ballston
Rosslyn
Central
Street
Area

83
Metro Becomes the Catalyst
• New metro system being planned in 1960s • Original alignment proposed in Median of I-66 Freeway
Highway • County Board saw future metro stations as the basis for
redevelopment and upgrading Requested that metro stations be located on Arlington’s traditional main
street Approval was granted
• Master plan updated Focus new high-rise, high density development around upcoming Metro
stations on spine Limit development elsewhere
• Site plan design criteria revised Promote mixed-use development
o Encourage commercial on the first floor of all office space
Limit parking

84
Original Alignment Proposal Rejected:
Interstate Highway 66 Median
X
85
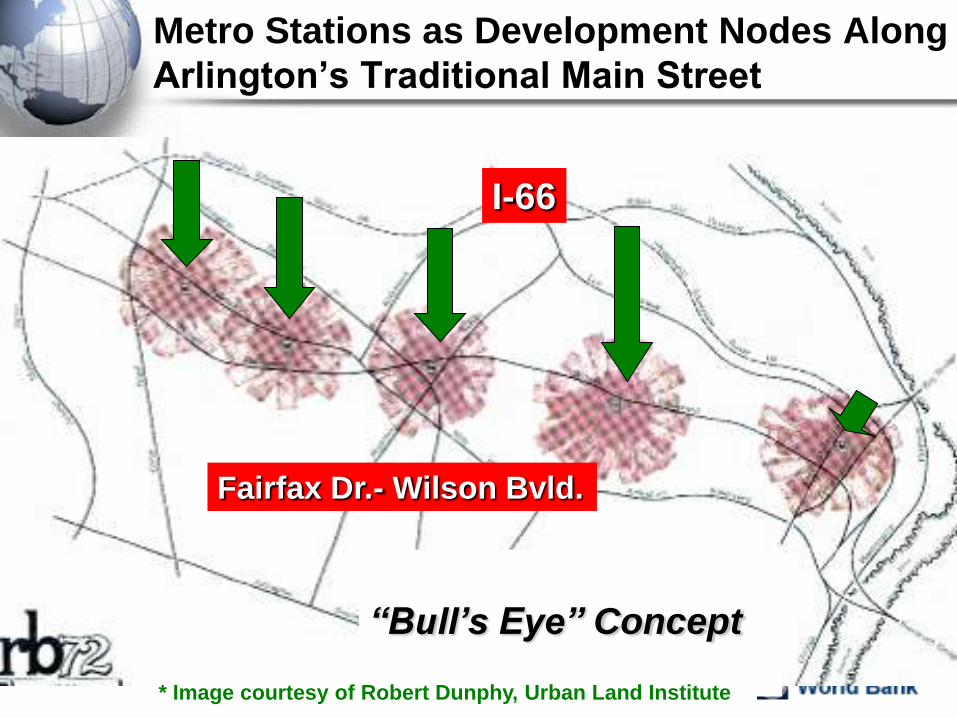
Metro Stations as Development Nodes Along
Arlington’s Traditional Main Street
“Bull’s Eye” Concept
* Image courtesy of Robert Dunphy, Urban Land Institute
I-66
Fairfax Dr.- Wilson Bvld.

86
Metro Alignment
Planned as New “Main Street”
* Image courtesy of Robert Dunphy, Urban Land Institute

87
Rosslyn-Ballston Today
I-66
I-66
I-66
I-66

88
Rosslyn
I-66

Mixed Use Above Rosslyn Metro Station
Metro
Entrance
East View West View

90
Courthouse
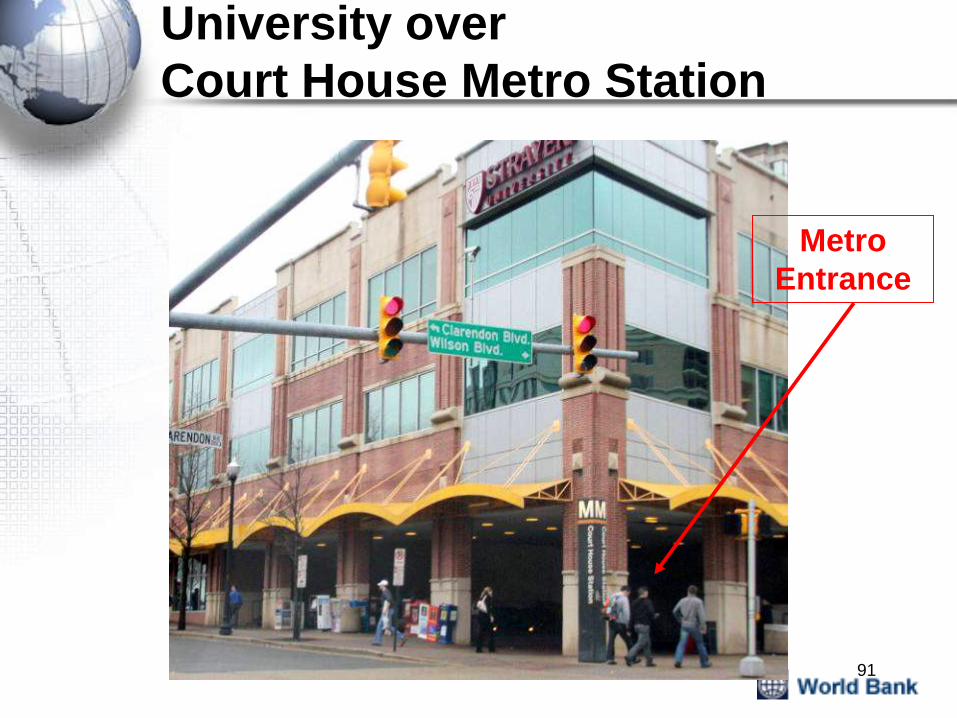
91
University over
Court House Metro Station
Metro
Entrance

92
Ballston

93
Offices, Hotel, Apartments, Shops,
Restaurants, Parking in One Building
Metro
Entrance

Lessons Learned from Successful TOD
Efforts
Creating a successful TOD is like baking
a cake ….
You need the right ingredients!!!
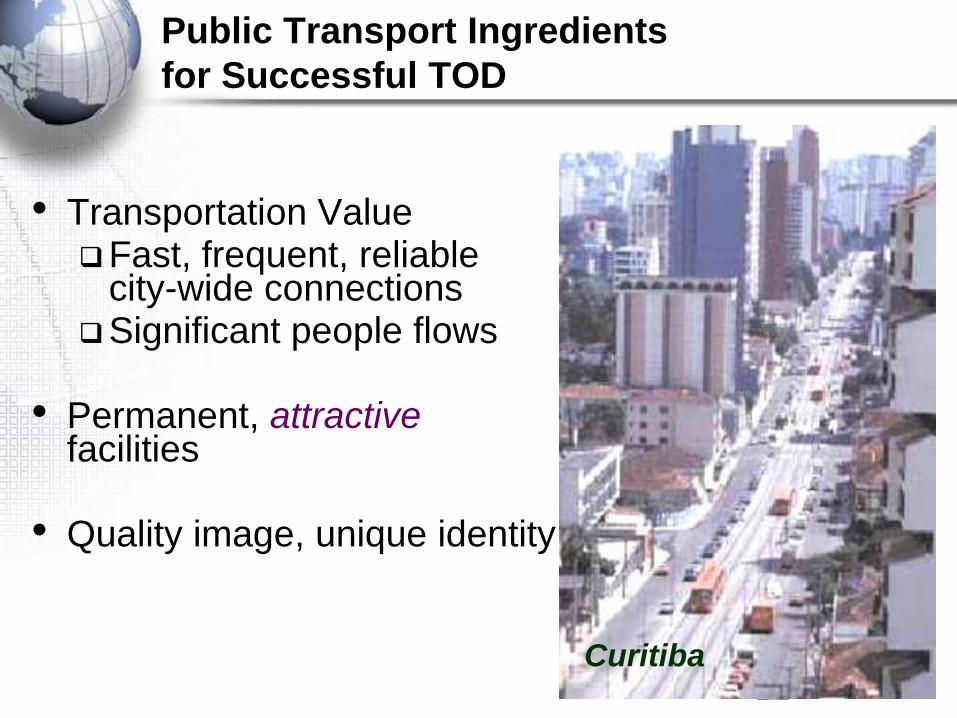
Public Transport Ingredients
for Successful TOD
• Transportation Value Fast, frequent, reliable
city-wide connections Significant people flows
• Permanent, attractive
facilities
• Quality image, unique identity
Curitiba

Development Ingredients
for Successful TOD
• Good development climate
• Supportive public policies and actions
Macro land planning, zoning/floor space ratios
Site plan review criteria
Tax abatements, other public investments
Cleveland State University
On “Health Line” (BRT)
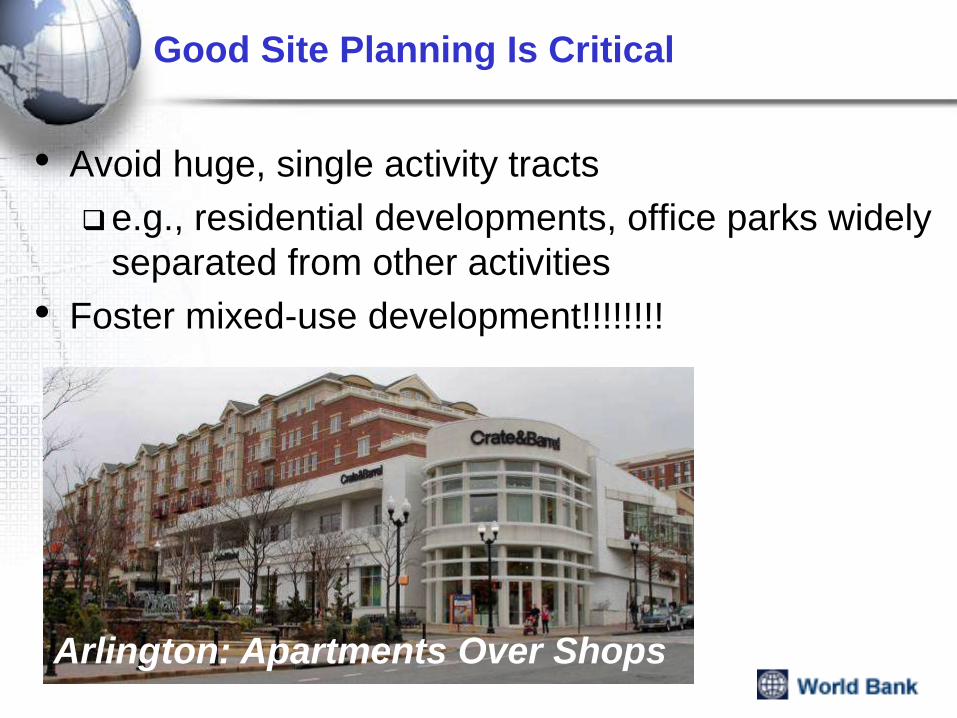
• Avoid huge, single activity tracts
e.g., residential developments, office parks widely
separated from other activities
• Foster mixed-use development!!!!!!!!
Good Site Planning Is Critical
Arlington: Apartments Over Shops

Site Planning Ingredients
for Successful TOD
• Pedestrian environment
Safe and secure
Short, direct connections
Environment friendly
Active, interesting
• Integration of facilities into
land & streetscape
• Make transit stations public
gathering places
Brisbane

Bogota Center City
Example of a Public Gathering Place

Take-Home Messages
• Complicated links between urban forms and
public transport:
Density
Accessibility to jobs/homes
Walkability
• Key elements of pedestrian and transit-oriented
urban planning
Increase accessibility to jobs/houses by transit
Improve walkability in areas surrounding stations
Increase density in areas surrounding stations
Expand “catchment areas” by walking from stations

Questions?
Email: [email protected]
Visit: http://www.worldbank.org.cn
or: http://weibo.com/worldbank
Related Documents