Welcome message from author
This document is posted to help you gain knowledge. Please leave a comment to let me know what you think about it! Share it to your friends and learn new things together.
Transcript

cSUR-UT Series: Library for Sustainable Urban Regeneration Volume 1 Series Editor: Shinichiro Ohgaki, Tokyo, Japan

cSUR-UT Series: Library for Sustainable Urban Regeneration
By the process of urban development in the 20th century, characterized by suburban expansion and urban redevelopment, many huge and sophisticated complexes of urban structures have been erected in developed countries. However, with conventional technologies focused on the con-struction of structures, it has become difficult to keep urban spaces adaptable to environmental constraints and economic, social and cultural changes. In other words, it has become difficult for conventional technologies to meet social demands for the upgrading of social capital in a sustain-able manner and for the regeneration of attractive urban space that is not only safe and highly ef-ficient but also conscious of historical, cultural and local identities to guarantee a high quality of life for all. Therefore, what is needed now is the creation of a new discipline that is able to reor-ganize the existing social capital and the technologies to implement it.
For this purpose, there is a need to go beyond the boundaries of conventional technologies of construction and structural design and to integrate the following technologies:
(1) Technology concerned with environmental and risk management (2) Technology of conservation and regeneration with due consideration to the local character-
istics of existing structures including historical and cultural resources (3) Technologies of communication, consensus building, plan making and space management
to coordinate and integrate the individual activities initiated by various actors of society
Up to now, architecture, civil engineering, and urban engineering in their respective fields have, while dealing with different time-space scales and structures, accumulated cutting-edge knowledge and contributed to the formation of favorable urban spaces. In the past, when empha-sis was put on developing new residential areas and constructing new structures, development and advancement of such specialized disciplines were found to be the most effective.
However, current problems confronting urban development can be highlighted by the fact that a set of optimum solutions drawn from the best practices of each discipline is not necessarily the best solution. This is especially true where there are relationships of trade-offs among such is-sues as human risk and environmental load. In this way, the integration of the above three disci-plines is strongly called for.
In order to create new integrated knowledge for sustainable urban regeneration, the Center for Sustainable Urban Regeneration (cSUR), The University of Tokyo, was established in 2003 as a core organization of one of the 21st Century Centers of Excellence Programs funded by the Min-istry of Education and Science, Japan, and cSUR has coordinated international research alliances and collaboratively engages with common issues of sustainable urban regeneration.
The cSUR series are edited and published to present the achievements of our collaborative re-search and new integrated approaches toward sustainable urban regeneration.
Editorial board of the cSUR series
Chair: Prof. Shinichiro Ohgaki
Members: Prof. Keisuke Hanaki Prof. Yuzo Sakamoto Prof. Yozo Fujino Prof. Hiroshi Naito Prof. Hitoshi Ieda Prof. Takeshi Ito Prof. Shuichi Matsumura Assoc. Prof. Takafumi Noguchi Prof. Atsuyuki Okabe Assoc. Prof. Yukio Sadahiro
Director: Prof. Junichiro Okata
Department of Urban Engineering, The University of Tokyo
Department of Urban Engineering, The University of Tokyo Department of Architecture, The University of Tokyo Department of Civil Engineering, The University of Tokyo Department of Civil Engineering, The University of Tokyo Department of Civil Engineering, The University of Tokyo Department of Architecture, The University of Tokyo Department of Architecture, The University of Tokyo Department of Architecture, The University of Tokyo Department of Urban Engineering, The University of Tokyo Department of Urban Engineering, The University of Tokyo
Department of Urban Engineering, The University of Tokyo

K. Hanaki (Ed.)
Urban Environmental Management and Technology

Keisuke Hanaki, Ph.D. Professor Department of Urban Engineering, The University of Tokyo 7-3-1 Hongo, Bunkyo-ku, Tokyo 113-8656, Japan Cover photo: Hangzhou, China; © Reiko Hayashi ISSN 1865-8504 ISBN 978-4-431-78396-1 e-ISBN 978-4-431-78397-8 Library of Congress Control Number: 2008923161
© 2008 to the complete printed work by Springer, except as noted. Individual authors or their assignees retain rights to their respective contributions; reproduced by permission. This work is subject to copyright. All rights are reserved, whether the whole or part of the material is concerned, specifically the rights of translation, reprinting, reuse of illustrations, recitation, broadcasting, reproduction on microfilms or in other ways, and storage in data banks. The use of registered names, trademarks, etc. in this publication does not imply, even in the absence of a specific statement, that such names are exempt from the relevant protec-tive laws and regulations and therefore free for general use. Springer is a part of Springer Science+Business Media springer.com Printed in Japan Typesetting: Camera-ready by the editors and authors Printing and binding: Shinano Inc., Japan Printed on acid-free paper

Preface
The environmental aspect of cities is nowadays well recognized as a criti-cal element of urban development, management and regeneration. There are various environmental issues related to cities, and they have been ana-lyzed in an individualized manner. Many types of technologies, such as wastewater treatment, have been developed to solve particular environ-mental problems. However, many of these problems are related to each other, and social and economic aspects are also important for urban regen-eration. A holistic view combining knowledge of various urban environmental fac-tors such as water, heat, energy, air, materials and waste, and a practical approach based on such understandings are essential to manage contempo-rary urban environmental issues, from a local scale to a global scale. The University of Tokyo has been conducting the 21st Century COE (Cen-ters of Excellence) Program on Sustainable Urban Regeneration. Transdis-ciplinary courses have been offered for graduate students from the depart-ments of Urban Engineering, Civil Engineering and Architecture to present a holistic view of urban regeneration.
This book is based on the contents of the transdisciplinary course on envi-ronmental management and technology. I hope that its content will be use-ful for undergraduate and graduate students and for experts and policy makers in developed and developing countries.
Shinichiro Ohgaki Project Leader, COE Program on Sustainable Urban Regeneration The University of Tokyo

Contents
Preface v Part I Water Environment 1. Water Management in Sustainable Buildings ………............. 3 Motoyasu Kamata and Masayuki Mae 2. Urban Water Use and Multifunctional Sewerage Systems as
Urban Infrastructure …………………………………………. 29 Hiroaki Furumai 3. Urban River Management: Harmonizing River Ecosystem
Conservation ……………………………………………….….47 Takeyoshi Chibana 4. Development of Coastal Urban Regions with Sustainable
Topographical Environments .………………………………... 67 Shinji Sato Part II Material Flow and Risk 5. Municipal Solid Waste Management for a Sustainable
Society ………………….…………….……………………….91 Kazuo Yamamoto 6. Dismantlement of Buildings and Recycling of Construction
Waste ……………………………………..……….……….…..107 Tsuyoshi Seike and Noriko Akita
viii
7. Holistic Approaches for Impact Assessment in Urban Envi-ronmental Management ……………………………….……..129
Toshiya Aramaki 8. Risk Assessments in Urban Environment …………………....145 Kensuke Fukushi 9. Fate of Water-Related Pathogens in Urban Water Systems...157 Hiroyuki Katayama Part III Heat and Energy Management 10. Global Climate Change and Cities ……………….…………175 Keisuke Hanaki 11. Japanese Strategies for Global Warming Issues and Energy
Conservation in Buildings …………………………………….195 Yuzo Sakamoto 12. Management of Urban Heat Environment ………………….215 Yasunobu Ashie Index ……………………………………………………………….239

Part I Water Environment
1. Water Management in Sustainable Buildings
Motoyasu Kamata
Masayuki Mae
Department of Architecture, The University of Tokyo 7-3-1, Hongo, Bunkyo-ku, Tokyo 113-8656, JAPAN
1.1 Introduction
In Japan, since World War II, better water systems have been developed and the amount of water used has increased rapidly. Nationally, rainfall is relatively plentiful and the cost of water service is not expensive in many regions. So people are not very sensitive about water conservation in re-gards to buildings. In that context, the main interest of designing the water system in a building has been to assure comfort by determining the proper number of fixtures and the system capacity.
In some regions like northern Kyushu or Shikoku, however, rainfall is scarce and severe water shortages happen almost annually. In those areas, water saving technology is considered very important. Recently, water shortage has become a global issue, and water saving technology is con-sidered very important.
In this chapter, a survey of water consumption in Japanese buildings will be presented. Then, water saving technologies will be introduced. Mainly there are two methods to reduce water consumption. The first is to develop a fixture and system which consumes less water. The second is to make efficient use of rain and grey (recycled) water. If a “sustainable building” is being designed, selecting the right piping material and system is also crucial, so some new methods for cold water supply and sewage will also be presented in this paper.
4 Motoyasu Kamata and Masayuki Mae
1.2 Water equipment in old Japanese houses
1.2.1 Toilets
Before WWII, the usual toilet in Japan was an outhouse, not a water closet. Excrement was stored in wooden or ceramic pots and used as fertilizer.
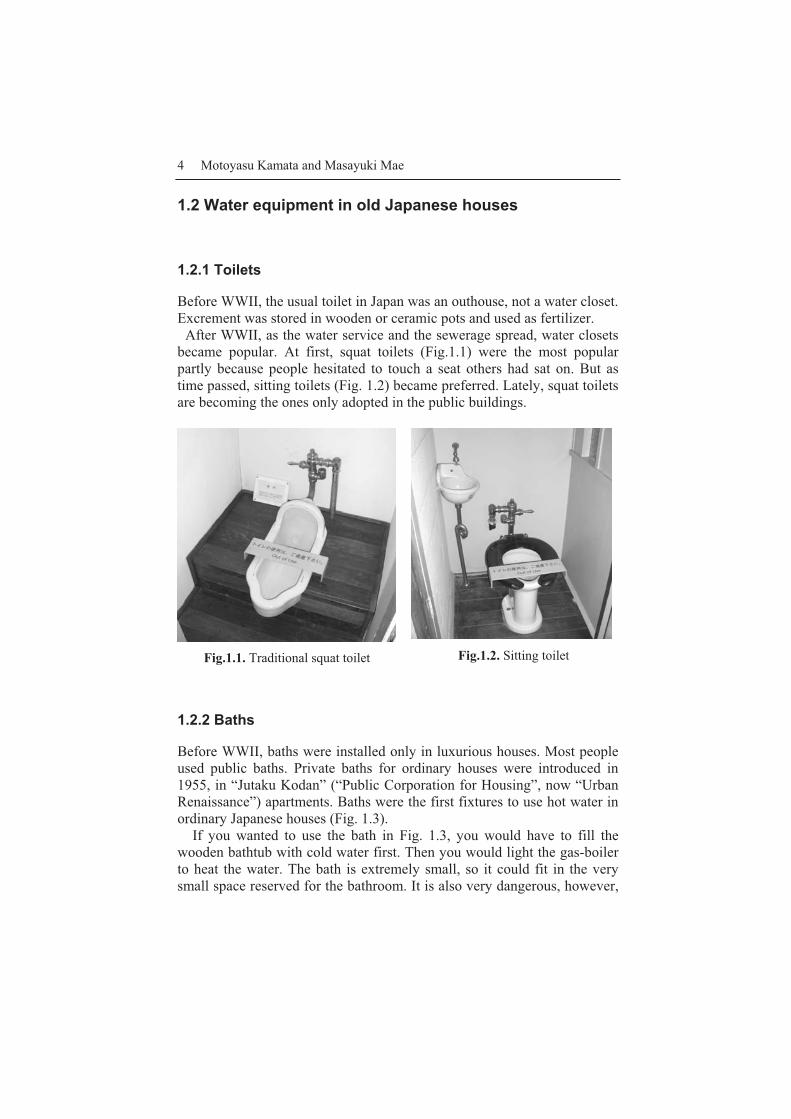
After WWII, as the water service and the sewerage spread, water closets became popular. At first, squat toilets (Fig.1.1) were the most popular partly because people hesitated to touch a seat others had sat on. But as time passed, sitting toilets (Fig. 1.2) became preferred. Lately, squat toilets are becoming the ones only adopted in the public buildings.
Fig.1.1. Traditional squat toilet
Fig.1.2. Sitting toilet
1.2.2 Baths
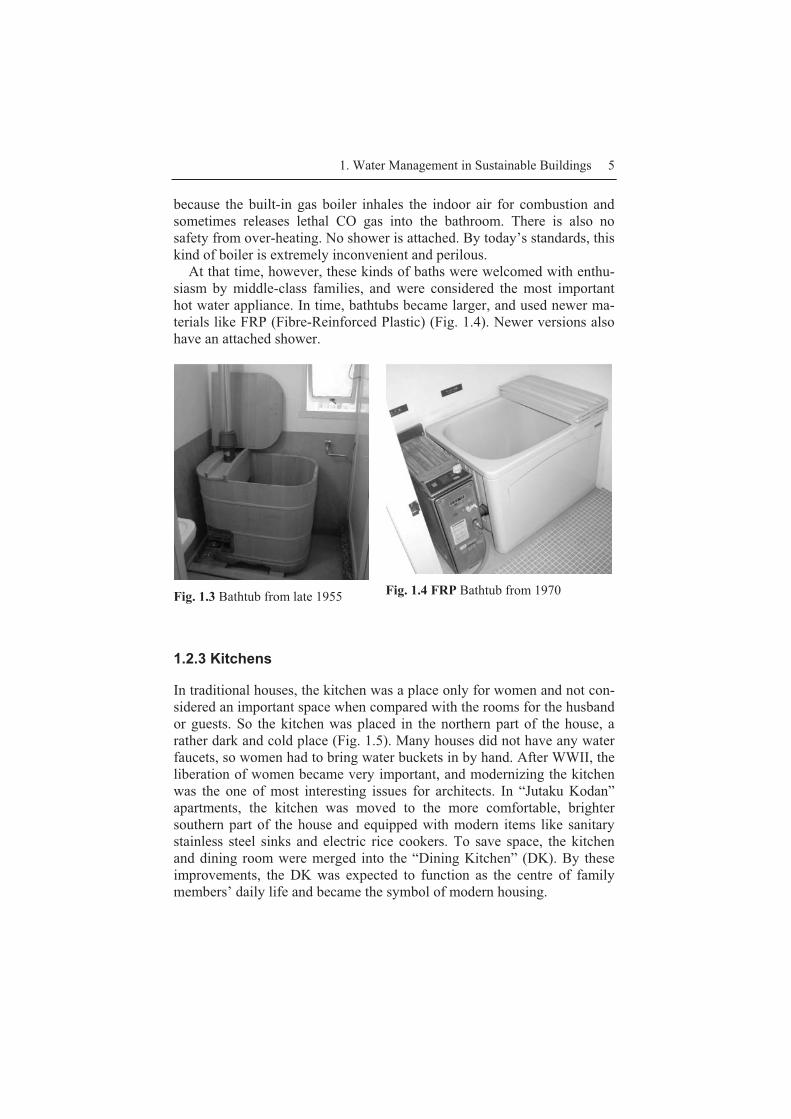
Before WWII, baths were installed only in luxurious houses. Most people used public baths. Private baths for ordinary houses were introduced in 1955, in “Jutaku Kodan” (“Public Corporation for Housing”, now “Urban Renaissance”) apartments. Baths were the first fixtures to use hot water in ordinary Japanese houses (Fig. 1.3).
If you wanted to use the bath in Fig. 1.3, you would have to fill the wooden bathtub with cold water first. Then you would light the gas-boiler to heat the water. The bath is extremely small, so it could fit in the very small space reserved for the bathroom. It is also very dangerous, however,
1. Water Management in Sustainable Buildings 5
because the built-in gas boiler inhales the indoor air for combustion and sometimes releases lethal CO gas into the bathroom. There is also no safety from over-heating. No shower is attached. By today’s standards, this kind of boiler is extremely inconvenient and perilous.
At that time, however, these kinds of baths were welcomed with enthu-siasm by middle-class families, and were considered the most important hot water appliance. In time, bathtubs became larger, and used newer ma-terials like FRP (Fibre-Reinforced Plastic) (Fig. 1.4). Newer versions also have an attached shower.
Fig. 1.3 Bathtub from late 1955
Fig. 1.4 FRP Bathtub from 1970
1.2.3 Kitchens
In traditional houses, the kitchen was a place only for women and not con-sidered an important space when compared with the rooms for the husband or guests. So the kitchen was placed in the northern part of the house, a rather dark and cold place (Fig. 1.5). Many houses did not have any water faucets, so women had to bring water buckets in by hand. After WWII, the liberation of women became very important, and modernizing the kitchen was the one of most interesting issues for architects. In “Jutaku Kodan” apartments, the kitchen was moved to the more comfortable, brighter southern part of the house and equipped with modern items like sanitary stainless steel sinks and electric rice cookers. To save space, the kitchen and dining room were merged into the “Dining Kitchen” (DK). By these improvements, the DK was expected to function as the centre of family members’ daily life and became the symbol of modern housing.

6 Motoyasu Kamata and Masayuki Mae
Hot water appliances in the kitchen were introduced in the 1960s. A small kitchen gas boiler was developed and set up for washing dishes (Fig. 1.6). These boilers had the same problems the bath boilers had. Kitchen boilers consumed indoor air as they burned and emitted CO2 and CO gases into the kitchen, which polluted the room environment. There was no con-trol of hot water temperature, nor any safety measures to avoid imperfect combustion. Despite these faults, these gas boilers were welcomed by housewives and became a common sight.
Fig. 1.5 A kitchen in 1930
Fig. 1.6 A kitchen in 1960 with a gas boiler
1.3 Present Condition of Water Usage Japan
1.3.1 Cold Water Usage
As the water closet, bath and other appliances pervade, daily life has be-come fairly convenient for many people. But these improvements to the living standard also raised the volume of water usage in buildings. The increase in the amount of “domestic water” is shown in Fig. 1.7. This value includes not only the amount used at home, but also the one con-

1. Water Management in Sustainable Buildings 7
sumed in public places like commercial buildings, hospitals, restaurant or so. Recently, the amount of “domestic water” used per person per day is estimated at 320~330 litres.
�
�
�
��
��
��
��� ��� �� ���� ��� ���� ��� ����
�� �������������
�������
�
�
���
��
���
��
���
��
��������������� ���!�����"�
�� ��
����������
���
���
�����
��
��� ��� ��� ���
��
��
��
���
���
����� ��� ���
Fig. 1.7 Domestic water consumption (including housing and public buildings) [1]
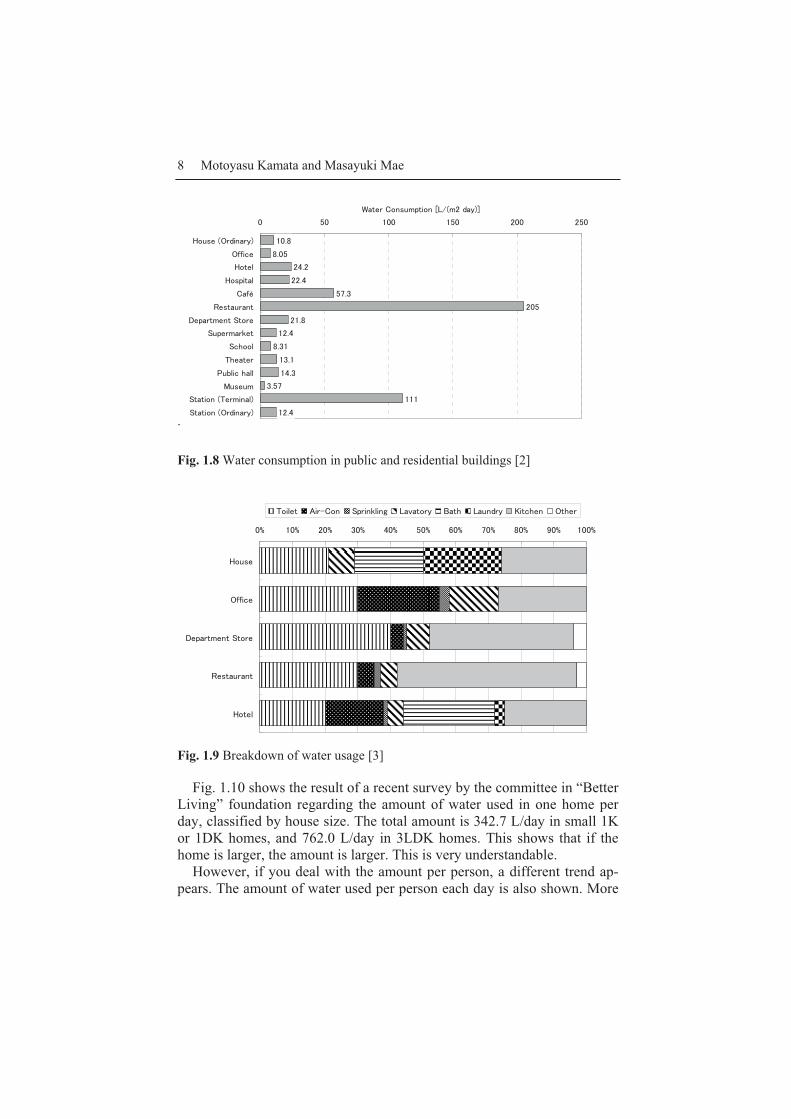
Fig. 1.8 shows the water usage in public and residential buildings. Each amount is standardized by floor area (m2) per day. It is obvious that the amount varies widely due to building type. The amounts in restaurants and cafés are prominent. The amount in terminal train stations is also huge, be-cause many people gather and use the toilets. In houses or offices, the amount is relatively small.
Fig. 1.9 shows the breakdown of water usage according to type. In houses, the proportion of toilet, bath, laundry and kitchen are almost the same. In many building types, toilet water usage is the largest type. In de-partment stores and restaurants, the kitchen consumes a considerable amount. In offices and hotels, the amount for air-conditioning is also high, which is mainly used in cooling towers for evaporation.
8 Motoyasu Kamata and Masayuki Mae
.
��#�
�#�
��#�
��#�
#�
��
��#�
��#�
�#��
��#�
��#�
�#
���
��#�
� � ��� �� ��� ��
$�%����&� �����"
&''�(�
$� ��
$��!� ��
)�'*
+�� �%���
,�!�� ��� �- ���
-%!�����.�
-(/���
�/�� ��
�%���(�/���
0%��%�
- � �������������"
- � �����&� �����"
1� ���)���%�! ����������� ��"�
Fig. 1.8 Water consumption in public and residential buildings [2]
�2 ��2 ��2 ��2 ��2 �2 ��2 �2 ��2 ��2 ���2
$�%��
&''�(�
,�!�� ��� �- ���
+�� �%���
$� ��
����� 3��4)�� -!���.���5 ��6� ��� 7� / ��%� �� 8� (/�� & /��
Fig. 1.9 Breakdown of water usage [3]
Fig. 1.10 shows the result of a recent survey by the committee in “Better Living” foundation regarding the amount of water used in one home per day, classified by house size. The total amount is 342.7 L/day in small 1K or 1DK homes, and 762.0 L/day in 3LDK homes. This shows that if the home is larger, the amount is larger. This is very understandable.
However, if you deal with the amount per person, a different trend ap-pears. The amount of water used per person each day is also shown. More

1. Water Management in Sustainable Buildings 9
than 200L of water is used by each person daily, and this figure becomes larger in small houses often inhabited by just one person. In smaller houses, water in the bathtubs or laundry machines can be shared only by a small number of people. You can guess that that decreases utilization effi-ciency
���#
���#
��#�
��#�
���#�
��#�
���#
��#�
���#�
��#
� ��� ��� ��� ��� �� ��� �� ��� ��� ����
�89�,8
�,8
�,8
��,8
���,8:;"
���� ��"�
!���$�%��
!���������
Fig. 1.10 Water consumption in residences (1�4: number of bedrooms, K: kitchen, DK: kitchen dining room, LDK: living-dining room with an attached kitchenette) [4]
1.3.2 Hot Water
As hot water equipment like bathtubs and kitchen boilers have gotten popular, hot water consumption has increased steadily. Hot water con-sumes not only water itself, but also a lot of energy like gas, electricity, or oil.
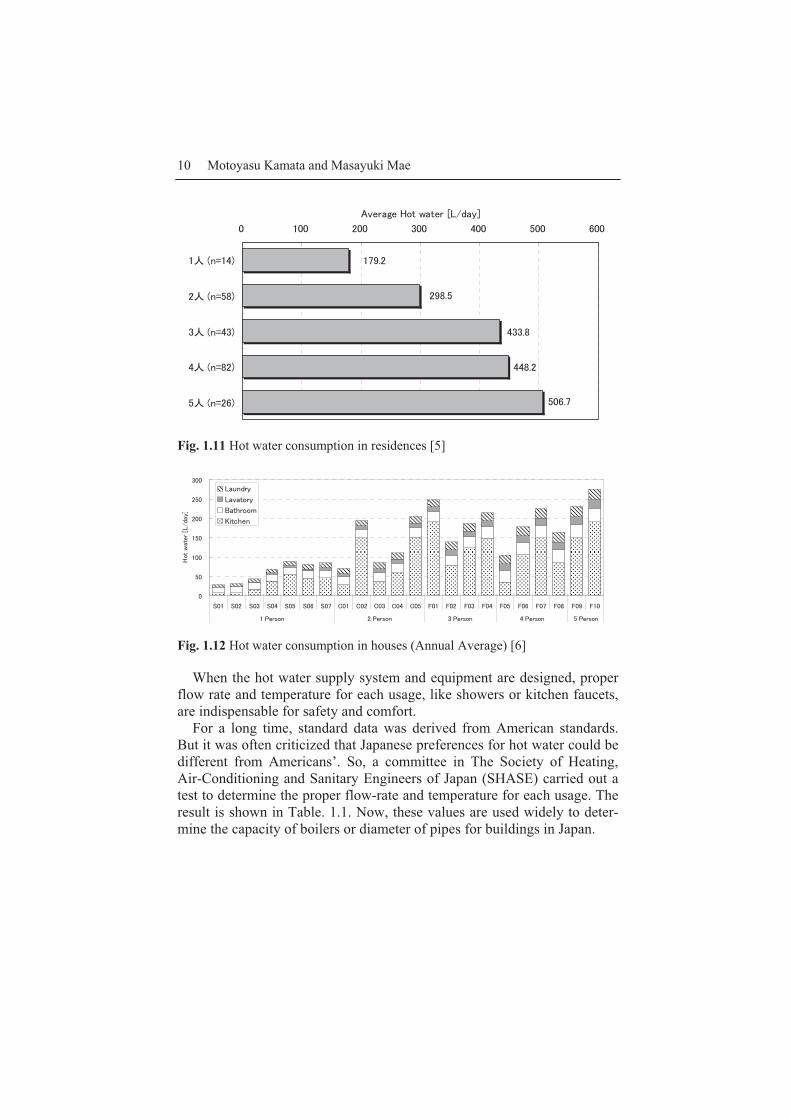
Fig. 1.11 shows the result of recent research on hot water consumption. Similar to cold water consumption, larger houses consume larger amounts. Houses with one person consume 186.8 L/day; houses with four people consume 444.9 L/day. However, if you measure the amount per person, 4-Person homes consume only 111.2 L/day, much smaller than 1-Person homes. This shows the same trend we already observed for cold water.
As you can guess, hot water consumption varies dramatically in differ-ent houses. Fig. 1.12 shows the volume and proportion of hot water con-sumption for each type of usage. The volume and breakdown of different types of water usage are widely different in each house.
10 Motoyasu Kamata and Masayuki Mae
��#
���#�
���#�
���#
��#�
� ��� ��� ��� ��� �� ���
�<���=��"
�<���=�"
�<���=��"
�<���=��"
<���=��"
36���5��$� �>� ������ ���
Fig. 1.11 Hot water consumption in residences [5]
�
�
���
��
���
��
���
-�� -�� -�� -�� -� -�� -� )�� )�� )�� )�� )� ?�� ?�� ?�� ?�� ?� ?�� ?� ?�� ?�� ?��
�������� �������� �������� �������� �������
$� �>� ������ ���
��%� ��
��6� ���
7� /����
8� (/��
Fig. 1.12 Hot water consumption in houses (Annual Average) [6]
When the hot water supply system and equipment are designed, proper flow rate and temperature for each usage, like showers or kitchen faucets, are indispensable for safety and comfort.
For a long time, standard data was derived from American standards. But it was often criticized that Japanese preferences for hot water could be different from Americans’. So, a committee in The Society of Heating, Air-Conditioning and Sanitary Engineers of Japan (SHASE) carried out a test to determine the proper flow-rate and temperature for each usage. The result is shown in Table. 1.1. Now, these values are used widely to deter-mine the capacity of boilers or diameter of pipes for buildings in Japan.

1. Water Management in Sustainable Buildings 11
Table 1.1 Optimum temperature and flow rate for each type of water usage [7]
Usage Optimum
Temperature [Co] Flow Rate [L/min] Dish Washing Ordinary faucet 39.0 7.8
Shower type 39.0 5.0 Face washing 37.5 8.5 Laundry with hands 39.0 10.5 Shampoo 40.5 8.0 Taking a shower
hand-held 40.5 8.5 attached to the wall 42.0 Fig 1.26
1.3.3 SHASE Standard
Until the 1970s, Japanese designers and engineers referred to the plumbing code of the USA for deciding the capacity of water system and sanitary condition in buildings. But as the difference of the actual state of Japanese buildings became obvious, SHASE (The Society of Heating, Air-Conditioning and Sanitary Engineers of Japan) established its own code based on the surveyed data of Japanese buildings. The original plumbing code of Japan was called “HASS 206.” This stan-dard has been revised three times in 1982, 1991 and 2000. The name of HASS 206 was changed to “SHASE-S 206” in 2003. This manual is con-stantly referred to in designing the water system in buildings and became one of most important codes available for ensuring the sanitary condition of drinking water.

12 Motoyasu Kamata and Masayuki Mae
Fig. 1.13 HASS 206-2000
1.4 “CASBEE”(Comprehensive Assessment System for Building Environmental Efficiency)
The term “sustainable building” includes many aspects of architecture. Regarding water systems, it usually means efficient and environmentally-friendly systems which consume less energy.
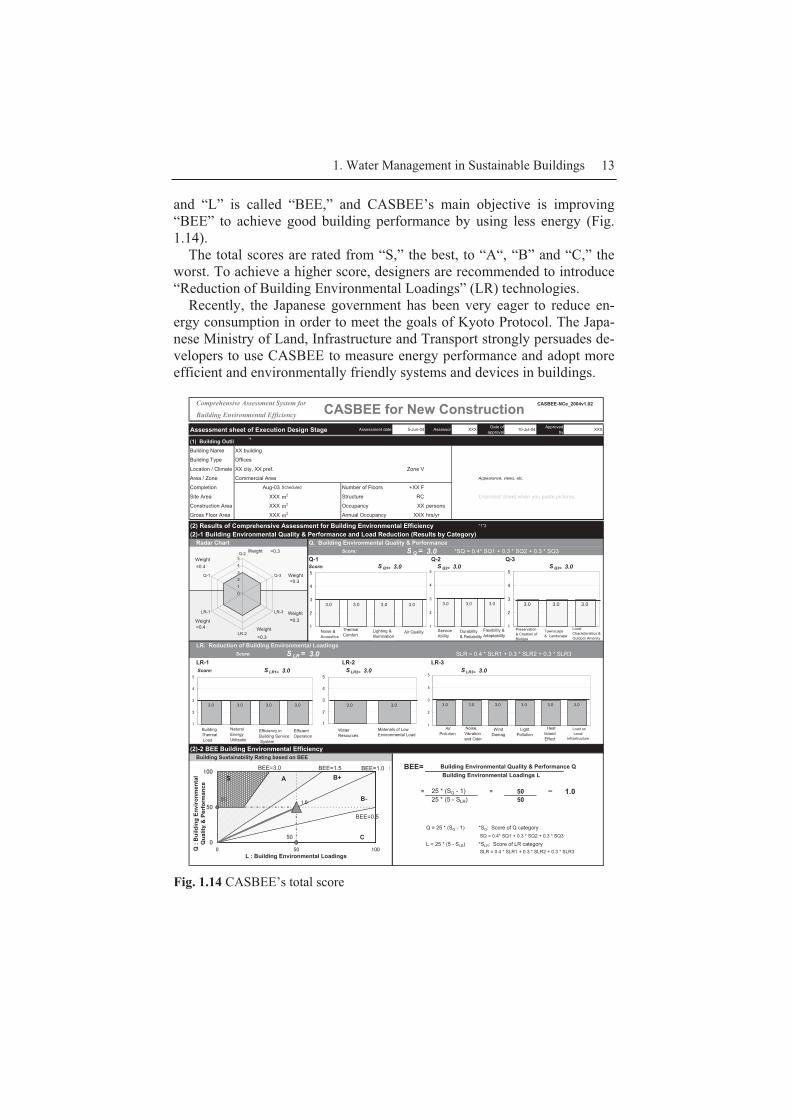
In 1997, the Kyoto Protocol was announced to restrain the progress of global warming. According to that protocol, Japan has to decrease CO2 emissions by 6 percent in 2010 compared to the rate of 1990. On the other hand, energy consumption in buildings has been increasing steadily and rapidly. To persuade building designers to consider saving energy, the “CASBEE” was developed [8]. CASBEE is the quantitative evaluation method to balance between building quality and environmental load. The former is called “Building Environmental Quality and Performance” (Q); the latter is called “Building Environmental Loadings” (L).
CASBEE can be used to evaluate the balance between “Q” and “L.” If a building achieves a lower “Q” by emitting a higher “L,” it is a low-performing “bad” building. If a building attains a higher “Q” through a lower “L,” it is a high-performing “good” building. The balance of “Q”
1. Water Management in Sustainable Buildings 13
and “L” is called “BEE,” and CASBEE’s main objective is improving “BEE” to achieve good building performance by using less energy (Fig. 1.14).
The total scores are rated from “S,” the best, to “A“, “B” and “C,” the worst. To achieve a higher score, designers are recommended to introduce “Reduction of Building Environmental Loadings” (LR) technologies.
Recently, the Japanese government has been very eager to reduce en-ergy consumption in order to meet the goals of Kyoto Protocol. The Japa-nese Ministry of Land, Infrastructure and Transport strongly persuades de-velopers to use CASBEE to measure energy performance and adopt more efficient and environmentally friendly systems and devices in buildings.
Comprehensive Assessment System for CASBEE-NCe_2004v1.02
Building Environmental Efficiency
Assessment sheet of Execution Design Stage Assessment date 5-Jun-04 Assessor XXX Date ofapproval 10-Jul-04 Approved
by XXX
(1) Building Outli *1
Building Name XX building
Building Type Offices
Location / Climate XX city, XX pref. Zone V
Area / Zone Commercial Area Appearance, views, etc.
Completion Aug-03 Scheduled Number of Floors +XX F
Site Area XXX m2 Structure RC Unprotect sheet when you paste pictures.
Construction Area XXX m2 Occupancy XX persons
Gross Floor Area XXX m2 Annual Occupancy XXX hrs/yr
(2) Results of Comprehensive Assessment for Building Environmental Efficiency *1*2
(2)-1 Building Environmental Quality & Performance and Load Reduction (Results by Category)Radar Chart Q. Building Environmental Quality & Performance
=0.3 Score: S Q = 3.0 *SQ = 0.4* SQ1 + 0.3 * SQ2 + 0.3 * SQ3 Q-1 Q-2 Q-3
=0.4 Score: S Q1= 3.0 S Q2= 3.0 S Q3= 3.0
=0.3
=0.3=0.4
=0.3
LR. Reduction of Building Environmental LoadingsScore: S LR = 3.0 SLR = 0.4 * SLR1 + 0.3 * SLR2 + 0.3 * SLR3
LR-1 LR-2 LR-3 Score: S LR1= 3.0 S LR2= 3.0 S LR3= 3.0
(2)-2 BEE Building Environmental EfficiencyBuilding Sustainability Rating based on BEE
BEE= Building Environmental Quality & Performance QBuilding Environmental Loadings L
= 25 * (SQ - 1) = 50 @ 1.0 25 * (5 - SLR) 50
Q = 25 * (SQ - 1) *SQ: Score of Q category SQ = 0.4* SQ1 + 0.3 * SQ2 + 0.3 * SQ3
L = 25 * (5 - SLR) *SLR: Score of LR category SLR = 0.4 * SLR1 + 0.3 * SLR2 + 0.3 * SLR3
CASBEE for New Construction
3.03.0 3.0 3.0 3.0 3.0
�
�
�
�
AirPollution
3.03.0
�
�
�
�
3.03.0 3.03.0
�
�
�
�
3.03.03.03.0
�
�
�
�
3.03.0 3.0
�
�
�
�
01
23
4
5Q-2
Q-3
LR-3
LR-2
LR-1
Q-1
WeightWeight
Weight
Weight
Weight
Weight
3.03.0 3.0
�
�
�
�
�#��
��
�
���
� � ���Q :
Bui
ldin
g En
viro
nmen
tal
Qua
lity
& P
erfo
rman
ce
L : Building Environmental Loadings
S A B+
B-
C
BEE=3.0 77
BEE=0.5
BEE=1.5 BEE=1.0
��Air Quality
Noise,Vibrationand Oder
WindDamag
LightPollution
HeatIslandEffect
��Load onLocal
Infrastructure
BuildingThermal Load
NaturalEnergyUtilizatio
Efficiency inBuilding Service System
EfficientOperation
Water Resources
Materials of LowEnvironmental Load
Noise &Acoustics
ThermalComfort
Lighting &Illumination
ServiceAbility
Durability& Reliability
Flexibility &Adaptability
Preservation& Creation ofBiotope
Townscape& Landscape
LocalCharacteristics &Outdoor Amenity
Fig. 1.14 CASBEE’s total score

14 Motoyasu Kamata and Masayuki Mae
In the CASBEE system, water is an important factor. Fig. 1.15 shows the categories related to water systems in Q and LR. In Q-2, “Quality of Service,” items like service life, reliability and flexibility are listed. In LR-1, “Energy,” hot water efficiency is listed. In LR-2, “Resource & Materi-als,” water saving technologies are listed.
(4) Score
Entire Building andCommon Properties
Residential andAccomodation sections
Concerned categories Score weightingcoefficients Score weighting
coefficientsTotal
Q Building Environmental Quality & Performance 3.0Q-2 Quality of Service 0.30 3.0
2 Durability & Reliability 3.0 0.31 - - 3.02.2 Service Life of Components 3.0 0.33 - -
3 Necessary Renewal Interval for Plumbing & Wiring Material 3.0 0.29 - -2.3 Reliability 3.0 0.19 - -
2 Water Supply & Drainage 3.0 0.20 - -3 Flexibility & Adaptability 3.0 0.29 - - 3.0
3.3 Adaptability of Facilities 3.0 0.38 - -2 Ease of Water Supply & Drain Pipe Renewal 3.0 0.17 - -
LR Reduction of Building Environmental Loadings - 3.0LR- Energy 0.40 3.0
3 Efficiency in Building Service System 3.0 0.30 - - 3.03.4 Hot Water Supply System 3.0 0.05 - -
LR- Resources & Materials 0.30 3.01 Water Resources 3.0 0.15 - - 3.0
1.1 Water Saving 3.0 0.40 - -1.2 Rainwater & Gray Water 3.0 0.60 - -
1 Rainwater Use Systems 3.0 0.67 - -2 Gray Water Reuse System 3.0 0.33 - -
Execution Design Stage
Fig. 1.15 Water related Q and LR items
The details of each category in “Q” and “LR” are shown in Fig. 1.16, Fig. 1.17 and Fig. 1.18. If higher-level implements are selected, a higher score in each category can be obtained. CASBEE sums up each category’s score and classifies the total score from “S” to “C.”
Many items are evaluated in CASBEE, even only regarding water sys-tems. Items covered range from pipe materials to water saving equipment and water recycling technology.
2.2.3 Necessary Renewal Interval for Plumbing & Wiring Materials Weight (default)= 0.29
Entire building and common propertiesOffices Schools Retailers Restaurants Halls Hospitals Hotels
Apartments Factories
Level 1 (Inapplicable)
Level 2 (Inapplicable)
�Level 3 15 years
Level 4 16 years or more, less than 30 years
Level 5 30 years or more
Level 3
Fig. 1.16 Service Life of Components (Durability & Reliability in Q-2)

1. Water Management in Sustainable Buildings 15
2.3 Reliability2.3.2 Water Supply & Drainage
Entire building and common propertiesOffices Schools Halls Hospitals Hotels
Apartments FactoriesRetailers Restaurants
Level 1
Level 2 (Inapplicable) (Inapplicable)
Level 3
Level 4 (Inapplicable)
Level 5
Efforts to improve the reliability of water supply & drainageBuilding
TypeOffices Schools Halls Hospitals Hotels
Apartments FactoriesRetailers Restaurants
Score Level 3 Level 3
5) Planning enables the use of well water, rainwater, gray water etc.
Weight (default)=2.0
7) The building is equipped with a simple filtration system allowing conversion of rainwater topotable water in the event of a disaster. (Not applied to “Retailers” and “Restaurants.”)
2) Plumbing systems are separated as far as possible to reduce the portions that becomeunserviceable in the event of a disaster.3) The building has a pit for temporary waste water storage, in case main sewerage isunavailable after a disaster.4) The building has two separate tanks, one for water reception and one elevated tank.
6) Provision of a rainwater storage tank to provide domestic noncommercial water in theevent of a disaster. . (Not applied to “Retailers” and “Restaurants.”)
Applicable to two of the efforts to beevaluated.Applicable to three or more of the efforts tobe evaluated.
Applicable to two or more of the efforts to beevaluated
1) Water-saving equipment is used. This is limited to cases where it is used on a majority ofthe installed equipment. Water-saving devices are those approved as Eco Mark products, or
None is applicable to the efforts to beevaluated.
None is applicable to the efforts to beevaluated.
Applicable to one of the efforts to beevaluated.
Applicable to one of the efforts to beevaluated.
Fig. 1.17 Reliability (Durability & Reliability in Q-2)
1 Water Resources1.1 Water Saving Weight(default)= 0.40
Level 3 Level 1 No systems for saving water. Level 2 (Inapplicable)�Level 3 Major faucets are equipped with water-saving valve.
Level 4 Level 5 (Inapplicable)
1.2 Rainwater & Gray Water 1.2.1 Rainwater Use System Weight(default)= 0.67Level 3 Offices Schools Retailers Restaurants Halls Hospitals Hotels Apartments Factories Level 1 (Inapplicable) Level 2 (Inapplicable)Level 3 No systems for using rainwater. Level 4 Rainwater is used. Level 51.2.2 Gray Water Reuse System Weight(default)= 0.33Level 3 Offices Schools Retailers Restaurants Halls Hospitals Hotels Apartments Factories Level 1 (Inapplicable)Level 2 (Inapplicable)Level 3 No systems for reusing gray water.Level 4 Gray water is reused.Level 5
In addition to water-saving valve, other water-saving equipment (such as flush-mimicking sound systems, water-saving toilets) is used.
Rainwater usage brings the rainwater usage rate to at least 20%.
In addition to gray water reuse, there is equipment to reuse sewage.
Offices Schools Retailers Restaurants Halls Hospitals Hotels Apartments Factories
Fig. 1.18 Water Resources (In LR-2)

16 Motoyasu Kamata and Masayuki Mae
1.5 Water saving technologies
The items adopted in CASBEE are considered very important components to realizing the goal of sustainable buildings. It is useful to know the de-tails of the water saving technologies.
1.5.1 Toilets
Water saving closet and urinal
As already mentioned, toilets use a lot of water in all types of buildings, so the development of less water consuming toilets is the most important goal. But it is not very easy to implement because less water consumption means less cleansing and transportation ability. To achieve a good balance, the shape of the bowl and flushing methods are carefully designed (Fig. 1.19). By this effort, the water necessary to flush has decreased remarkably (Fig. 1.20). Adoption of these water saving toilets is very effective and strongly recommended. But the sewage system for the items, like pipe tilt, should be designed to assure good transportation performance.
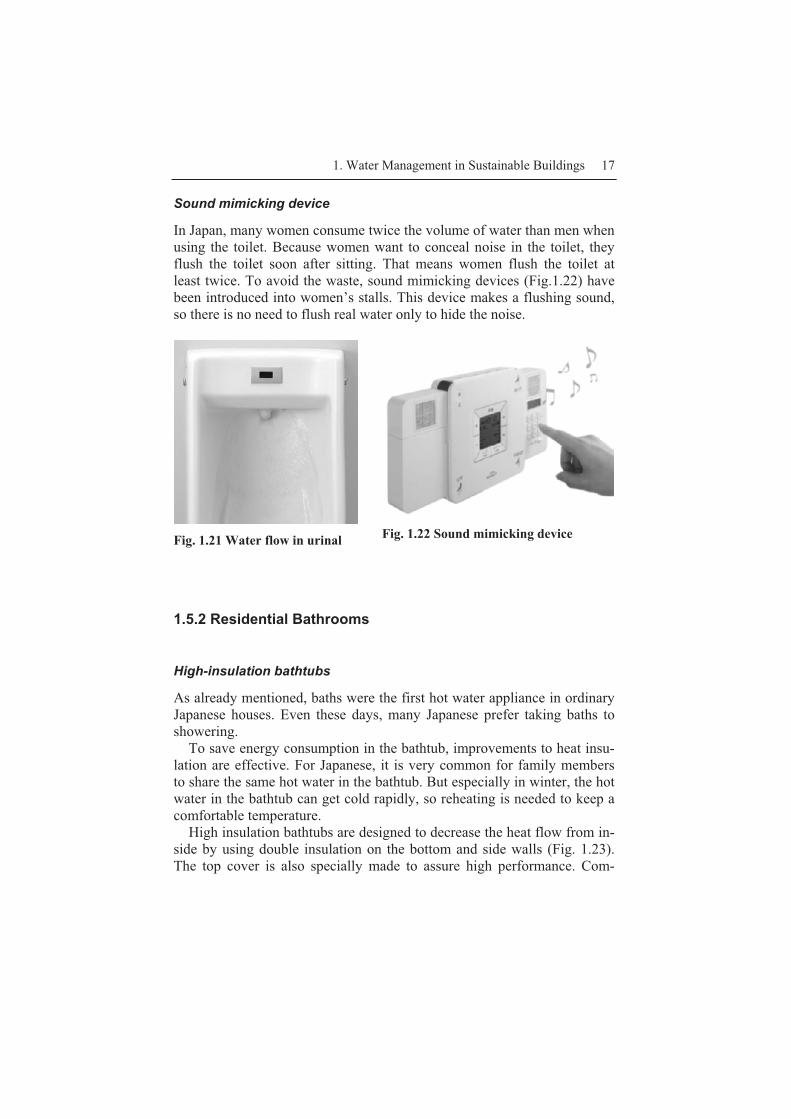
Regarding urinals, the water flow pattern has been improved to ensureenough cleansing using less water (Fig. 1.21). If the cleansing is not thor-ough enough, clotting from urine can easily block the sewage pipes. Soautomatic flushing systems are designed carefully to flush minimal water periodically, even without usage.
Fig. 1.19 Water saving toilet
�
�
�
�
�
��
��
��
��� ��� ���� ����
�� �����������������
����������
��������
Fig. 1.20 Progression of water saving [9]
1. Water Management in Sustainable Buildings 17
Sound mimicking device
In Japan, many women consume twice the volume of water than men when using the toilet. Because women want to conceal noise in the toilet, they flush the toilet soon after sitting. That means women flush the toilet at least twice. To avoid the waste, sound mimicking devices (Fig.1.22) have been introduced into women’s stalls. This device makes a flushing sound, so there is no need to flush real water only to hide the noise.
Fig. 1.21 Water flow in urinal
Fig. 1.22 Sound mimicking device
1.5.2 Residential Bathrooms
High-insulation bathtubs
As already mentioned, baths were the first hot water appliance in ordinary Japanese houses. Even these days, many Japanese prefer taking baths to showering.
To save energy consumption in the bathtub, improvements to heat insu-lation are effective. For Japanese, it is very common for family members to share the same hot water in the bathtub. But especially in winter, the hot water in the bathtub can get cold rapidly, so reheating is needed to keep a comfortable temperature.
High insulation bathtubs are designed to decrease the heat flow from in-side by using double insulation on the bottom and side walls (Fig. 1.23). The top cover is also specially made to assure high performance. Com-

18 Motoyasu Kamata and Masayuki Mae
pared with ordinary bathtubs, the temperature drop is decreased to less than one-third (Fig. 1.24).
Fig. 1.23 High-insulation bathtub
��
��
��
��
��
� � � � � �
��
���
���
� �
���
����
��
�� �������� ������� ��������
�������� ��!!��""�������������� �������������
������� ������� �
#������ ������� �
Fig. 1.24 Temperature drop [9]
Water-saving showerhead
Many people take a shower when bathing, and some young people prefer only showering now. To save hot water consumption in the shower, thedevelopment of a showerhead that satisfies users using a lower flow rate isimportant. Fig. 1.25 shows the relation between holes in the showerheadand optimum flow rate as the result of the examinees test. By adjusting theholes in the showerhead, optimum flow can be reduced without displeas-ure.
Total Holes Area of Showerhead A [mm2]
Qte
Q
w R
atFl
owm
um
Opt
imO
T s]
[L/s
����:Women QTT=1.45��A0.501
������Men QT=2.20��A0.442
Angle of showerhead’s Angle of showerhead’sAngle of showerhead s hole is 0
mean value of experimentsmean value of experimepeadsusing several showerhe
Angle of showerhead’s h l i t 0hole is not 0
Fig. 1.25 Relation of total hole area and optimum flow rate of showerheads [10]
1. Water Management in Sustainable Buildings 19
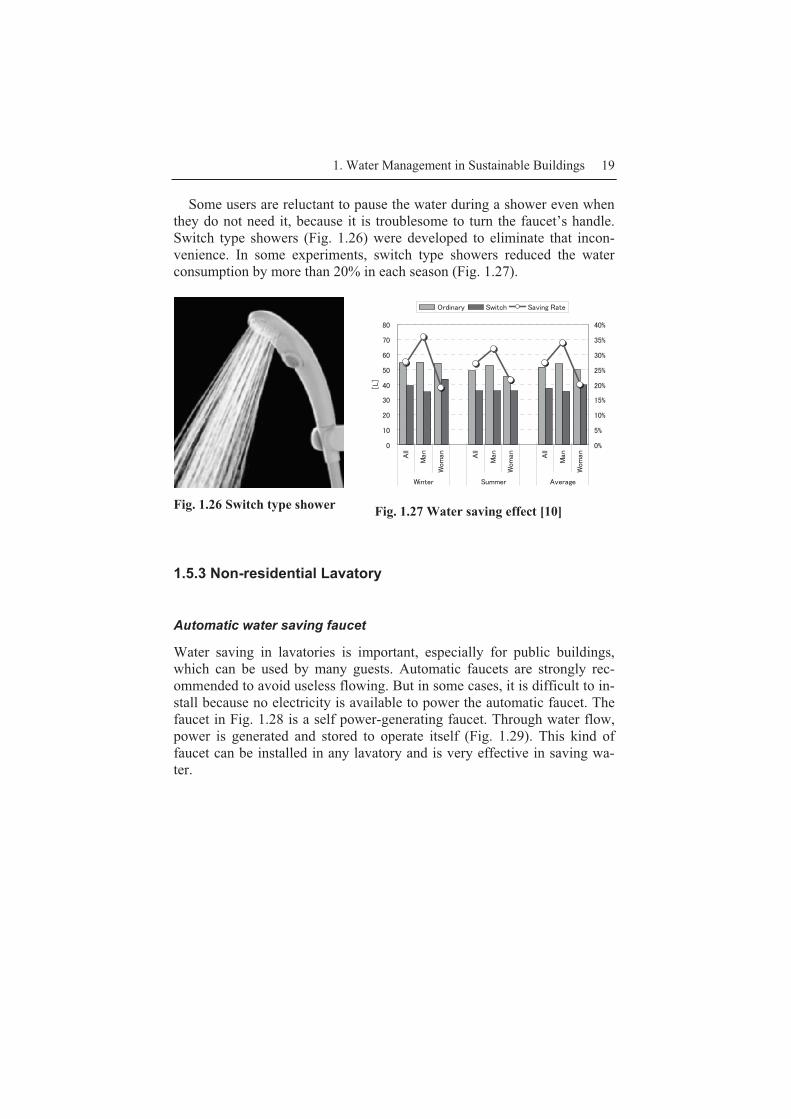
Some users are reluctant to pause the water during a shower even when they do not need it, because it is troublesome to turn the faucet’s handle. Switch type showers (Fig. 1.26) were developed to eliminate that incon-venience. In some experiments, switch type showers reduced the water consumption by more than 20% in each season (Fig. 1.27).
Fig. 1.26 Switch type shower
�
��
��
��
��
�
��
�
��
3��
0��
1����
3��
0��
1����
3��
0��
1����
1�� �� -%���� 36���5�
���
�2
2
��2
�2
��2
�2
��2
�2
��2
&� ����� ->� (/ -�6��5�+� �
Fig. 1.27 Water saving effect [10]
1.5.3 Non-residential Lavatory
Automatic water saving faucet
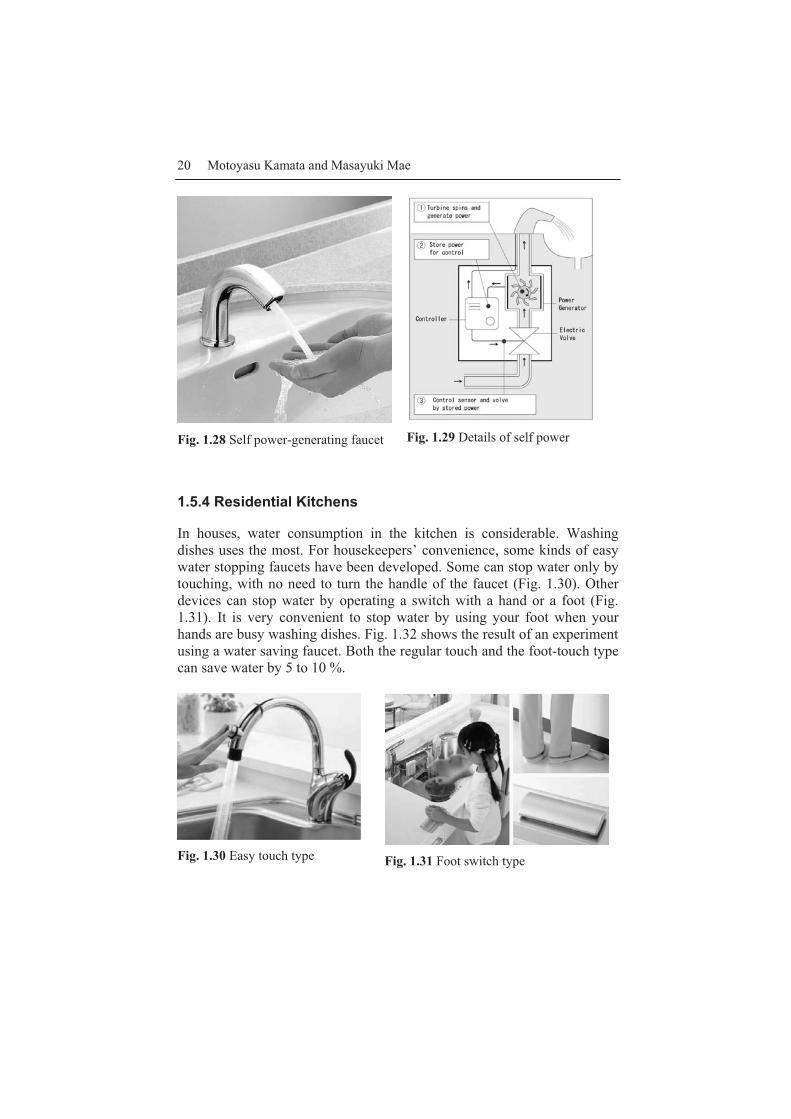
Water saving in lavatories is important, especially for public buildings, which can be used by many guests. Automatic faucets are strongly rec-ommended to avoid useless flowing. But in some cases, it is difficult to in-stall because no electricity is available to power the automatic faucet. The faucet in Fig. 1.28 is a self power-generating faucet. Through water flow, power is generated and stored to operate itself (Fig. 1.29). This kind of faucet can be installed in any lavatory and is very effective in saving wa-ter.
20 Motoyasu Kamata and Masayuki Mae
Fig. 1.28 Self power-generating faucet
Fig. 1.29 Details of self power
1.5.4 Residential Kitchens
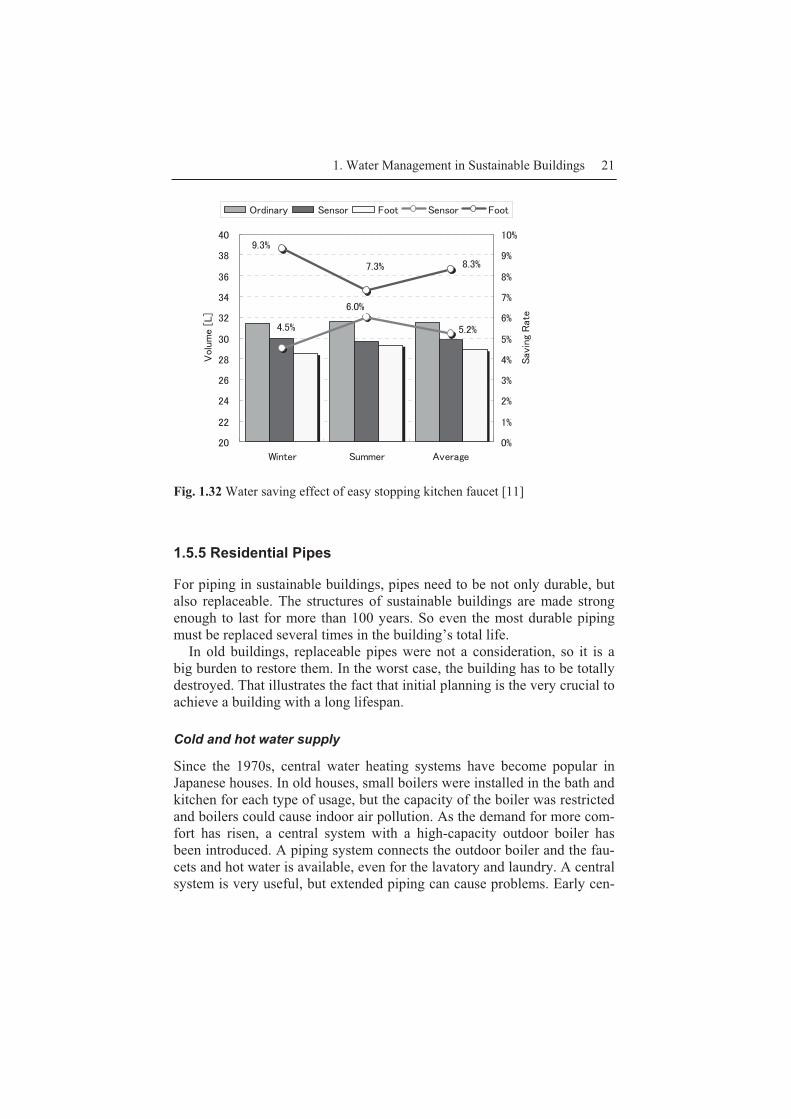
In houses, water consumption in the kitchen is considerable. Washing dishes uses the most. For housekeepers’ convenience, some kinds of easy water stopping faucets have been developed. Some can stop water only by touching, with no need to turn the handle of the faucet (Fig. 1.30). Other devices can stop water by operating a switch with a hand or a foot (Fig. 1.31). It is very convenient to stop water by using your foot when your hands are busy washing dishes. Fig. 1.32 shows the result of an experiment using a water saving faucet. Both the regular touch and the foot-touch type can save water by 5 to 10 %.
Fig. 1.30 Easy touch type
Fig. 1.31 Foot switch type
1. Water Management in Sustainable Buildings 21
#�2
�#�2
�#2
�#�2
�#�2
#�2
��
��
��
��
��
��
��
��
��
��
��
1�� �� -%���� 36���5�
C��%������
�2
�2
�2
�2
�2
2
�2
2
�2
�2
��2
-�6��5�+� �
&� ����� -����� ?�� -����� ?��
Fig. 1.32 Water saving effect of easy stopping kitchen faucet [11]
1.5.5 Residential Pipes
For piping in sustainable buildings, pipes need to be not only durable, but also replaceable. The structures of sustainable buildings are made strong enough to last for more than 100 years. So even the most durable piping must be replaced several times in the building’s total life.
In old buildings, replaceable pipes were not a consideration, so it is a big burden to restore them. In the worst case, the building has to be totally destroyed. That illustrates the fact that initial planning is the very crucial to achieve a building with a long lifespan.
Cold and hot water supply
Since the 1970s, central water heating systems have become popular in Japanese houses. In old houses, small boilers were installed in the bath and kitchen for each type of usage, but the capacity of the boiler was restricted and boilers could cause indoor air pollution. As the demand for more com-fort has risen, a central system with a high-capacity outdoor boiler has been introduced. A piping system connects the outdoor boiler and the fau-cets and hot water is available, even for the lavatory and laundry. A central system is very useful, but extended piping can cause problems. Early cen-

22 Motoyasu Kamata and Masayuki Mae
tral systems used copper pipes that could corrode within several years, and it was very difficult to replace the old copper pipe.
Recently, header-conduit piping systems have been installed in many residences, especially in apartment buildings (Fig. 1.33 to 1.35). For that
ConduitHeader Water or
Lavatory
Bath
Hot Water
Wall Surface
Water or Hot Water Pipe
Conduit
Washing MachineWater
Closet
Faucet Box
SupportConduit
Floor Surface
Faucet Box
Hot Water Heater
Pipe
Fig. 1.33 Header-conduit piping system
Fig. 1.34 Faucet
Fig. 1.35 Example of pipe system
1. Water Management in Sustainable Buildings 23
system, the pipes are made of cross-linked polyethylene, a very durable material. The most important characteristic is that the pipe is covered by a conduit. Only the conduit is fixed in the floor or wall when constructed, so the inside pipe can be replaced through the conduit without damaging the floor or wall. With durable material and easy replaceability, this system as-sures a long serving life for the piping.
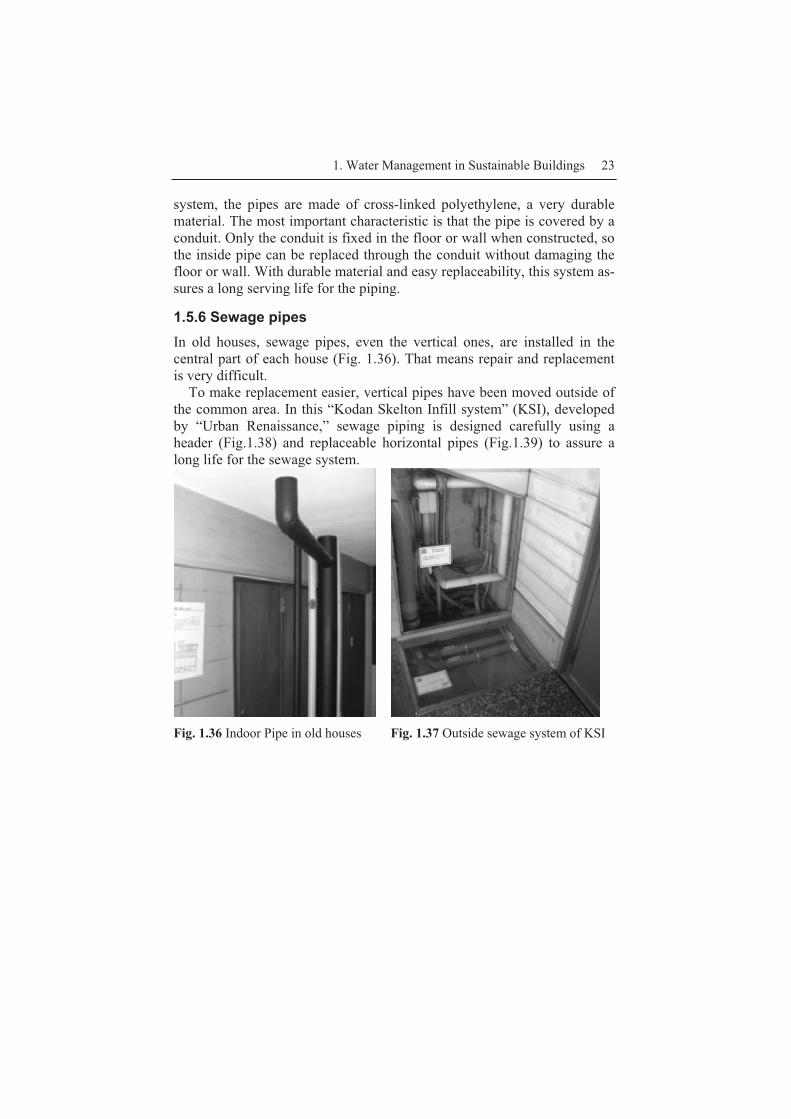
1.5.6 Sewage pipes In old houses, sewage pipes, even the vertical ones, are installed in the central part of each house (Fig. 1.36). That means repair and replacement is very difficult.
To make replacement easier, vertical pipes have been moved outside of the common area. In this “Kodan Skelton Infill system” (KSI), developed by “Urban Renaissance,” sewage piping is designed carefully using a header (Fig.1.38) and replaceable horizontal pipes (Fig.1.39) to assure a long life for the sewage system.
Fig. 1.36 Indoor Pipe in old houses
Fig. 1.37 Outside sewage system of KSI

24 Motoyasu Kamata and Masayuki Mae
Fig. 1.38 Sewage header of KSI
Fig. 1.39 “Easy to replace” layout
1.6 Water recycling technology in the supply system
Other than water saving fixtures and durable piping, water-recycling tech-nologies are vital to create appropriate water systems for sustainable build-ings. In this section, grey and rain water systems in real buildings are in-troduced.
1.6.1 Gray water treatment
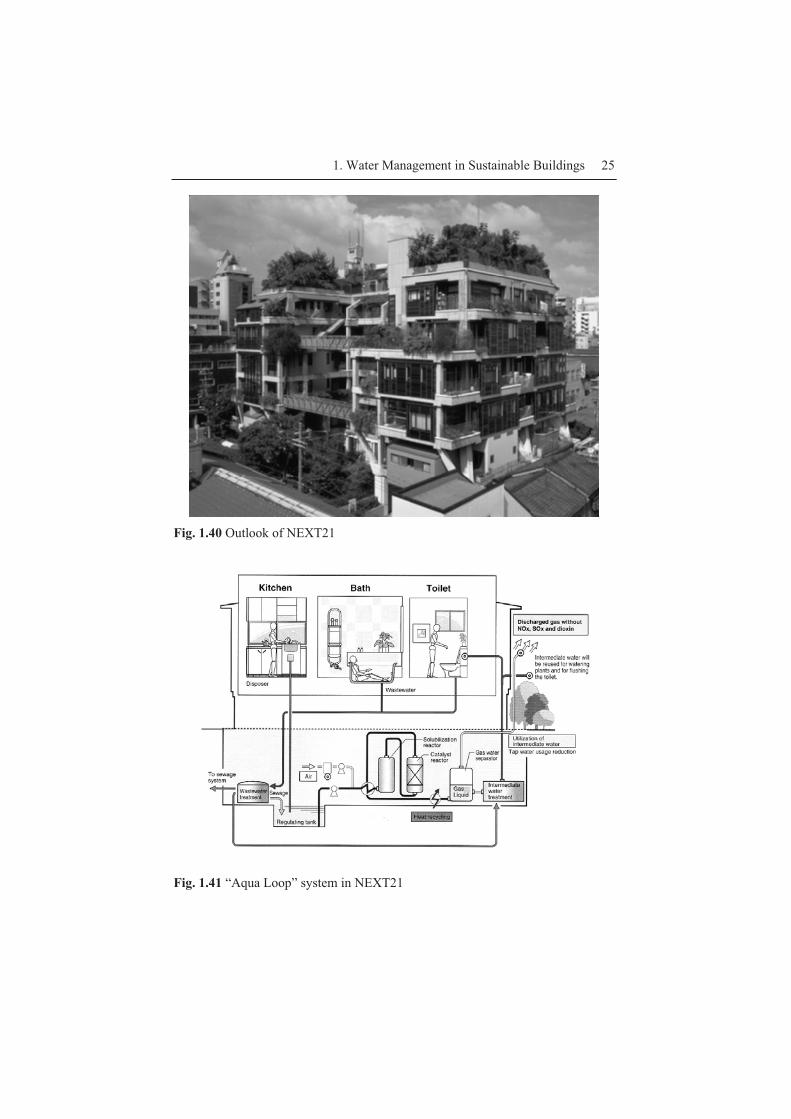
NEXT21 (Fig. 1.40) is an experimental sustainable building, planned and operated by the Osaka Gas Corporation. The theme of this interesting apartment is the harmony of human life and the environment. For that goal, many technologies were developed to achieve a long life expectancy for the structure, equipment and so on.
The structure is composed of extremely strong columns and beams without a structural wall. That makes the renovation of the housing and equipment easy. To reduce the environmental impact, a ground garden (with pond) and roof garden were made and reserved for wild birds.
1. Water Management in Sustainable Buildings 25
Fig. 1.40 Outlook of NEXT21
Fig. 1.41 “Aqua Loop” system in NEXT21
26 Motoyasu Kamata and Masayuki Mae
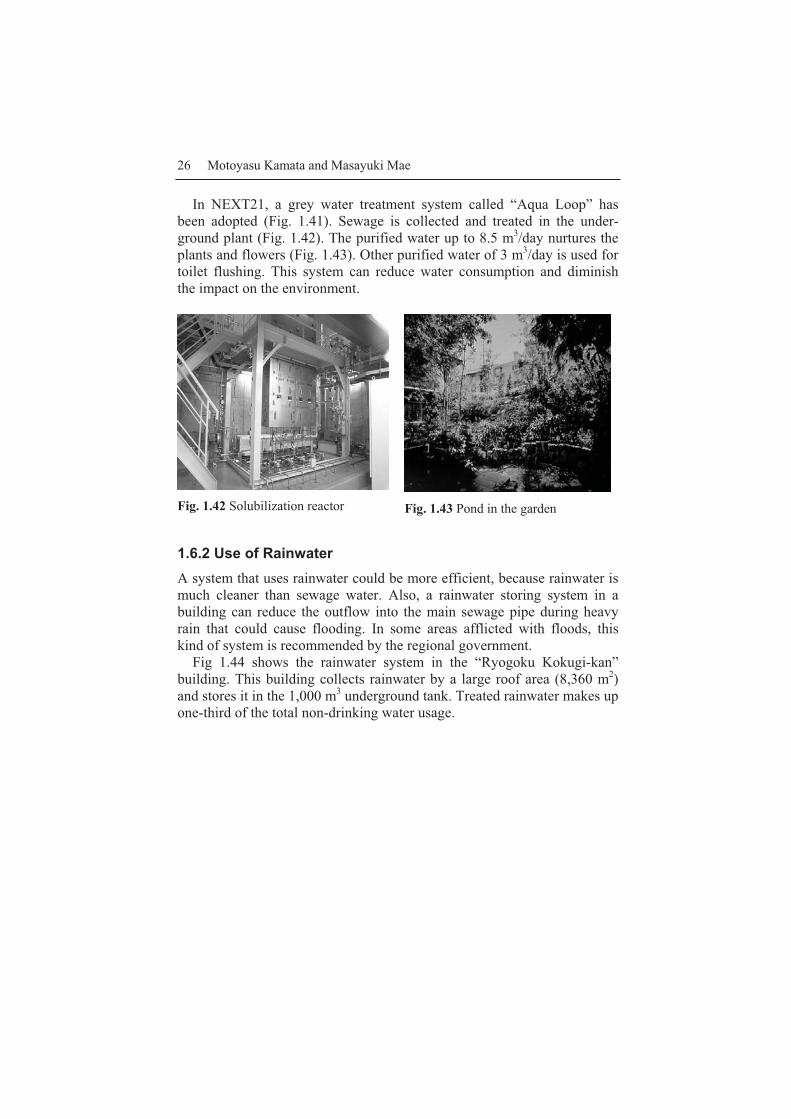
In NEXT21, a grey water treatment system called “Aqua Loop” has been adopted (Fig. 1.41). Sewage is collected and treated in the under-ground plant (Fig. 1.42). The purified water up to 8.5 m3/day nurtures the plants and flowers (Fig. 1.43). Other purified water of 3 m3/day is used for toilet flushing. This system can reduce water consumption and diminish the impact on the environment.
Fig. 1.42 Solubilization reactor
Fig. 1.43 Pond in the garden
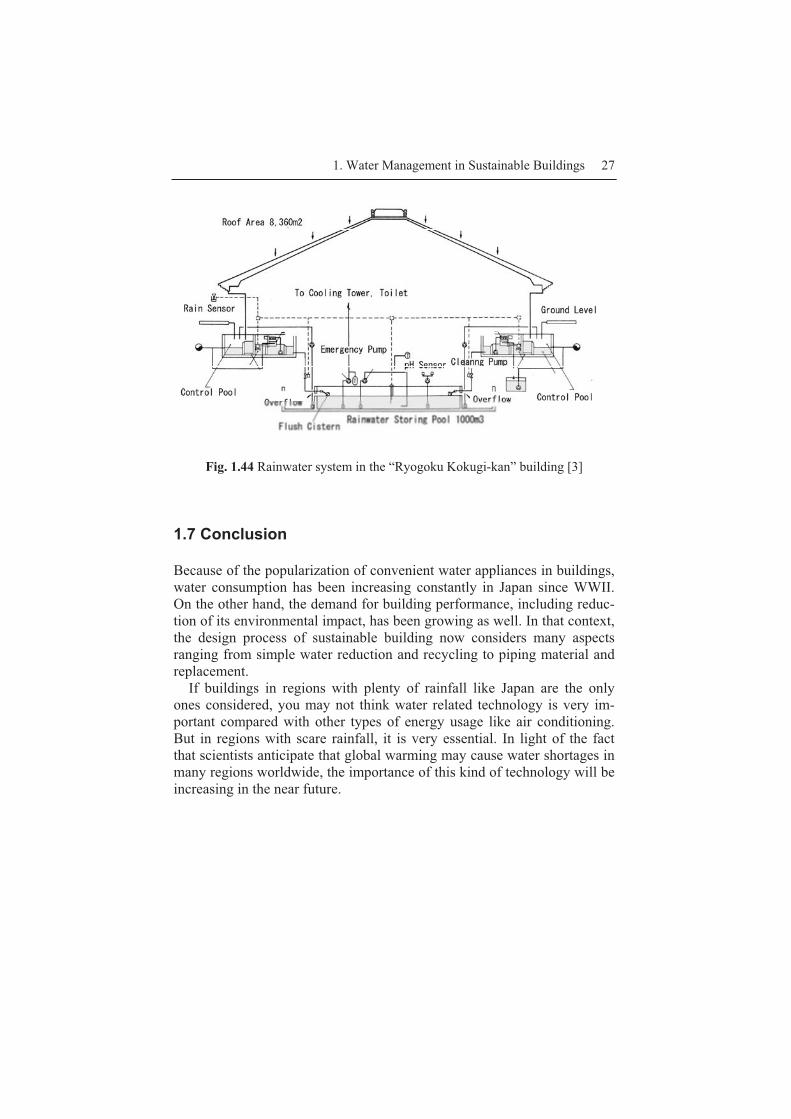
1.6.2 Use of Rainwater A system that uses rainwater could be more efficient, because rainwater is much cleaner than sewage water. Also, a rainwater storing system in a building can reduce the outflow into the main sewage pipe during heavy rain that could cause flooding. In some areas afflicted with floods, this kind of system is recommended by the regional government.
Fig 1.44 shows the rainwater system in the “Ryogoku Kokugi-kan” building. This building collects rainwater by a large roof area (8,360 m2) and stores it in the 1,000 m3 underground tank. Treated rainwater makes up one-third of the total non-drinking water usage.
1. Water Management in Sustainable Buildings 27
Fig. 1.44 Rainwater system in the “Ryogoku Kokugi-kan” building [3]
1.7 Conclusion
Because of the popularization of convenient water appliances in buildings, water consumption has been increasing constantly in Japan since WWII. On the other hand, the demand for building performance, including reduc-tion of its environmental impact, has been growing as well. In that context, the design process of sustainable building now considers many aspects ranging from simple water reduction and recycling to piping material and replacement.
If buildings in regions with plenty of rainfall like Japan are the only ones considered, you may not think water related technology is very im-portant compared with other types of energy usage like air conditioning. But in regions with scare rainfall, it is very essential. In light of the fact that scientists anticipate that global warming may cause water shortages in many regions worldwide, the importance of this kind of technology will be increasing in the near future.
28 Motoyasu Kamata and Masayuki Mae
References
[1] Ministry of Land, Infrastructure and Transport (2007), “Water resource in Ja-pan”
[2] The Society of Heating Air-Conditioning and Sanitary Engineers of Japan (2001), “Practical knowledge of Sanitary Equipment 2nd Edition”
[3] The Society of Heating Air-Conditioning and Sanitary Engineers of Japan (1997), “Rain Water Utilization System”
[4] Based on the data collected in several apartments near Tokyo [5] Masayuki MAE et al. (2007), “Survey on Actual Hot Water Consumption in
Families of Various Sizes Part.1 Average Amount of Consumption in Each Family Size” Summaries of Technical Papers of Annual Meeting, Architec-tural Institute of Japan,
[6] Masayuki MAE et al. (2003), “THE ANALYSIS ON THE SEASONAL CHANGE IN USAGE OF HOT AND COLD WATER, The analysis and evaluation on usage of hot and cold water on urban apartment house (Part1)”, JOURNAL OF ENVIRONMENTAL ENGINEERING (Transaction of AIJ) No.566, 2003.04
[7] Motoyasu KAMATA et al. (1993), “ABC of hot water”, TOTO Publishing [8] Japan Sustainable Building Consortium, “Comprehensive Assessment System
for Building Environmental Efficiency CASBEE for New Construction - Technical Manual 2004 Edition”, Institute for Building Environment and En-ergy Conservation (IBEC)
[9] Catalogue of TOTO Corporation, 2007 [10] Takeshi KONDO et al. (2006), “EFFECT OF THERMOSTATIC MIXING
FAUCET AND SHOWER HEAD WITH STOP VALVE, Study on perform-ance test of water saving fixture”, JOURNAL OF ENVIRONMENTAL ENGINEERING (Transaction of AIJ) No.607, 2006.09
[11] Takeshi KONDO et al. (2007), “EFFECT OF WATER SAVING FIXTURE FOR DISHWASHING, Study on performance test of water saving fixture Part 2”, JOURNAL OF ENVIRONMENTAL ENGINEERING (Transaction of AIJ) No.613, 2007.03
2. Urban Water Use and Multifunctional Sewerage Systems as Urban Infrastructure
Hiroaki Furumai
Department of Urban Engineering, The University of Tokyo 7-3-1, Hongo, Bunkyo-ku, Tokyo 113-8656, Japan
2.1 Introduction
2.1.1 Water Balance in Japan
Japan has a land area of 380,000 km2 and a population of 120 million. An average precipitation of approximately 1,700mm/year provides about 650 billion m3/year of water. The precipitation is much greater in Japan than the world average of 900mm/year. In Japan, one-third of the water disap-pears by evapotranspiration. Therefore, the available water resource is re-duced to about 420 billion m3/year. One-third of the water is runoff water from land to the sea during short periods, because of the rainy season and typhoons, leaving a stable water flow of one-third. This water balance is il-lustrated based on data from the fiscal year of 2000 in Fig.2.1. The artifi-cial water flow is categorized into agriculture, industry and domestic water uses.

30 Hiroaki Furumai
Evapotranspiration 230
Total Precipitation 650
Reserved Water Resources 420
Base flow Flood flow Unit: Billions m3/year
Domestic use12.7
Industrial use13.7
Agricultural use58.6
Fig. 2.1. Water balance in Japan (data from FY 2000)
2.1.2 Urbanization and escalated waster use
Demographic changes have significant impacts on water use and its man-agement. Fig.2.2 shows the past and predicted population growth in Japan and Southeast Asian countries from 1950 to 2025. It reveals a similarity in urban population growth from 1950 to 1970 in Japan and the coming fu-ture of Southeast Asian countries. This means that the early urbanization stage in Japan is being experienced in Southeast Asia; therefore, the his-tory of water management in Japan could be useful to explore better ways of water management for Southeast Asia. A stable water supply and effi-cient water use have become concerns in mega cities. It is necessary to in-troduce new concepts, policies and measures for sustainable water use and management (Wagner et al.; 2002, Furumai, 2007).

2. Urban Water Use and Multifunctional Sewage Systems 31
Fig. 2. 2. Urban and rural populations in Southeast Asia and Japan Southeast Asia includes Cambodia, Indonesia, Lao People’s Dem. Rep., Malaysia, Myanmar, Philip-pines, Thailand, and Vietnam.
Fig.2.3 shows representative locations with ground subsidence problems and their cumulative subsidence changes over time. In Tokyo, large scale groundwater pumping started in 1914. In the following years, the number of deep wells with a large diameter increased rapidly. Ground subsidence was first observed in Tokyo in the 1910s, and in Osaka in the 1920s.
The groundwater level continued to fall due to the extensive pumping to support increased production activities. Ground subsidence caused the de-struction of buildings, damage from floods and high tides and rising public concern. By the mid-1940s, the damage to industry from World War II re-duced the industrial use of groundwater, thereby halting ground subsi-dence. With the rapid progress of urbanization due to economic develop-ment after World War II, water supply had to catch up with remarkably increased water demand for domestic and industrial purposes. There was a sudden surge in demand for groundwater, and major subsidence took place again, especially in large urban areas.
Countermeasures against ground subsidence, e.g. control of groundwa-ter pumping rates, were started in the 1960s and thereafter, the rate of sub-sidence in metropolitan areas slowed. Nowadays, measures have been in-troduced to control the abstraction of the water level and to avoid changes in the subsidence levels by optimizing water use and introducing new sources of water.
Urban water consumption has a major impact on the natural water cycle and consequently on the water environment. Therefore, understanding the urban water cycle, the potential of rainwater use and water recycling in ur-ban areas is important for sustainability. In the case of mega cities, the sus-tainability of urban water use has become important in terms of a stable water supply and efficient water use. The achievement of sustainability is required to ensure a long-term water supply with adequate quality while minimizing adverse economic, social and environmental impacts.
0100200300400500600700800
Pop
ulat
ion
[mill
ion]
1950 1975 2000 2025Year
Population of Southeast Asia
Urban
Rural
0100200300400500600700800
Pop
ulat
ion
[mill
ion]
1950 1975 2000 2025Year
Population of Southeast Asia
Urban
Rural
020406080
100120140
Pop
ulat
ion
[mill
ion]
1950 1975 2000 2025Year
Population of Japan
Urban
Rural0
20406080
100120140
Pop
ulat
ion
[mill
ion]
1950 1975 2000 2025Year
Population of Japan
Urban
Rural

32 Hiroaki Furumai
1892 1902 1912 1922 1932 1942 1952 1962 1972 1982 1992 2002
[cm]
0
-100
-200
-300
-400
-500
The Great KantoEarthquake (1923)
World War II (1939-1945)
World War I(1914-1918)
Basic Law for Environmental Pollution Control (1967)
Industrial Water Law (1956)
Law Concerning the Regulation of Pumping-up of Ground Water for Use in Buildings(1961)
Basic Environment Law (1993)
Niigata (Muikamachi)Chiba (Mobara)Saga (Shiroishi)
Mie(Nagashima)Saitama (Koshigaya)
Osaka (Nishiyodogawa-ku)
Tokyo (Kohto-ku)
Fig. 2.3. Cumulative change in ground subsidence in typical areas over time
2.1.3 Water balance in Tokyo
Fig.2.4 shows the average temperature and rainfall in cities across the world: Tokyo, London, Cairo and Bangkok. Each city has different cli-mate, weather, rainfall and population levels.
When the available water resource per capita from precipitation is calcu-lated, Japan’s value is much lower than the world average, or that of the USA, Australia or Switzerland, as shown in Fig.2.5. If the calculation is applied to the city and province levels, the available water resource supply in Tokyo and Kanagawa is at the same level as Saudi Arabia and Egypt.
Precipitation Tokyo London Cairo Bangkok
15.3 Co15.3 CoCo 9.5 Co9.5 CoCo 21.8 Co21.8 CoCo 28.3 Co28.3 CoCo
1460mm
759mm21mm
1419mm
(mm)500
400
300
200
100
0 Fig. 2.4. Comparison of precipitation and temperature in several mega cities

2. Urban Water Use and Multifunctional Sewage Systems 33
Fig. 2. 5. Comparison of available water resources per capita
Fig.2.6 presents the water balance and recycling in the city of Tokyo. The overall precipitation is about 1,405mm/year (equivalent to 100%) with an evapotranspiration rate of 412mm/year (29%), while runoff and infiltra-tion account for 634mm/year (45%) and 359mm/year (26%), respectively. Compared with the national average, the runoff water in Tokyo is greater due to the high presence of urbanized areas. The imperviousness is esti-mated to be greater than 80% within 23 wards. In spite of poor infiltration and limited water availability within Tokyo, human consumption is more than the 1,100mm equivalent rainfall, including recycle water use (199mm) and reclaimed wastewater use (5mm). In Tokyo, there is an arti-ficial water cycle underground composed of the water supply system and the sewerage system, whose water flow is greater than the runoff flow.
Fig. 2. 6. Water balance and recycling in Tokyo (unit: mm/year) DWTP: Drinking water treatment plant, WWTP: Wastewater treatment plant, AT: Advanced treatment
Precipitation1405
(100%)
Evapotranspiration412
(29%)
River and
Tokyo Bay
Runoff634
(45%)
DWTPHuman
consumption
WWTP
Groundwater
River94
Infiltration
879912
90 53
Recycle199
Rainwateruse 0.23
Reclaimed water use 225
DWTPHuman
consumption
WWTP
359(26%)
879912
84
AT
Out of Watershed
791
7398
8791mm = 1.78x10⁶ m3/year
= 4,880 m3/day

34 Hiroaki Furumai
2.2 Roles and Functions of Sewerage System
2.2.1 History of the sewerage system and its status in Japan
The first modern sewerage system in Japan was the Kanda sewerage, which was built in 1884 in the Tokyo area. In 1922, the first wastewater treatment plant was built in Mikawashima as shown in Fig.2.7. The con-struction of a sewerage system to cover the entire Tokyo area did not start in earnest until the end of the World War II.
70.5% of the Japanese population used a sewerage system as of fiscal year 2006 though there is a need to increase the percentage of covered area in small towns with populations below 100,000, as shown in Fig.2.8.
Fig.2.7. The first modern sewerage system and aeration tanks in the first wastewa-ter treatment plant in Japan
Fig. 2. 8. Percentage of population with sewerage according to population size of cities in Japan
Sewer System in Kanda (Tokyo) Mikawashima Treatment Plant (Tokyo)
98.4
80.6 77.6 69.155.1
41.2
[%]
100
80
60
40
20
0>1000 500-1000 300-500 100-300 50-100 <50 x103
Population size of city
Perc
enta
ge o
f Sew
ered
Pop
ulat
ion
National average (FY 2006)70.5%
2. Urban Water Use and Multifunctional Sewage Systems 35
2.2.2 The role of the sewerage system
The role of the sewerage system has been generally divided into the fol-lowing three responsibilities; i) wastewater collection and treatment, ii) flood and inundation control, and iii) conservation of water quality in pub-lic water bodies.
These points have greatly contributed to improved living environments in urban areas. The sewerage system has an important role as an essential element of the urban infrastructure supporting safety, cultural life and ur-ban activities. The construction of sewerage systems has contributed to handling wastewater from households and factories and providing a flush toilet system. In addition, communities are protected from water damage by quickly removing storm water through a drainage system, while the wa-ter environment can be improved by the construction and operation of wastewater treatment plants, allowing a decrease of the pollution levels in urban rivers.
2.2.3 Components of the sewerage system
Sewerage systems are made up of the following three components: � Sewers and drainage Sewers collect wastewater and transport it to treatment plants. The total length of pipes in the 23 wards of Tokyo comes to 15,000km. Pipes range in size from 200mm to 8m in diameter. The drainage system discharges storm water for flood control. A conceptual illustration of a sewerage sys-tem, including a pumping station, is shown in Fig.2.9.
� Pumping stations Water collected in the sewers passes through pumping stations where it is sent to wastewater treatment plants. Sewer pipes are set at a slope to allow wastewater to naturally flow downwards, so the sewer can end up rather deep underground. Another important function of pumping stations is to guard against flooding. Pumping stations act to quickly discharge water from heavy rains into bays and rivers. � Wastewater treatment plant (WWTP) Sewage is generally treated by an activated sludge process in WWTPs. The configuration of the process is illustrated in Fig.2.10. For example, the Tokyo Metropolitan Sewerage Bureau manages 20 plants that treat around 5.8 million cubic meters of wastewater everyday. Since the activated
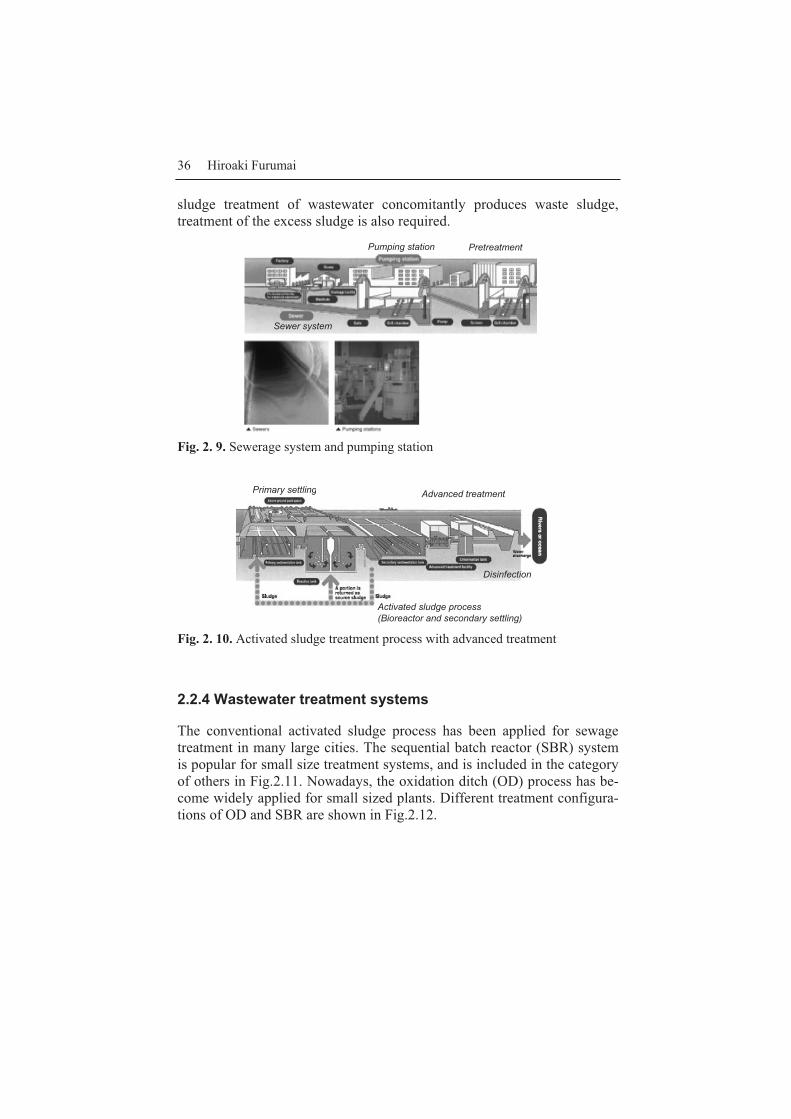
36 Hiroaki Furumai
sludge treatment of wastewater concomitantly produces waste sludge, treatment of the excess sludge is also required.
Fig. 2. 9. Sewerage system and pumping station
Fig. 2. 10. Activated sludge treatment process with advanced treatment
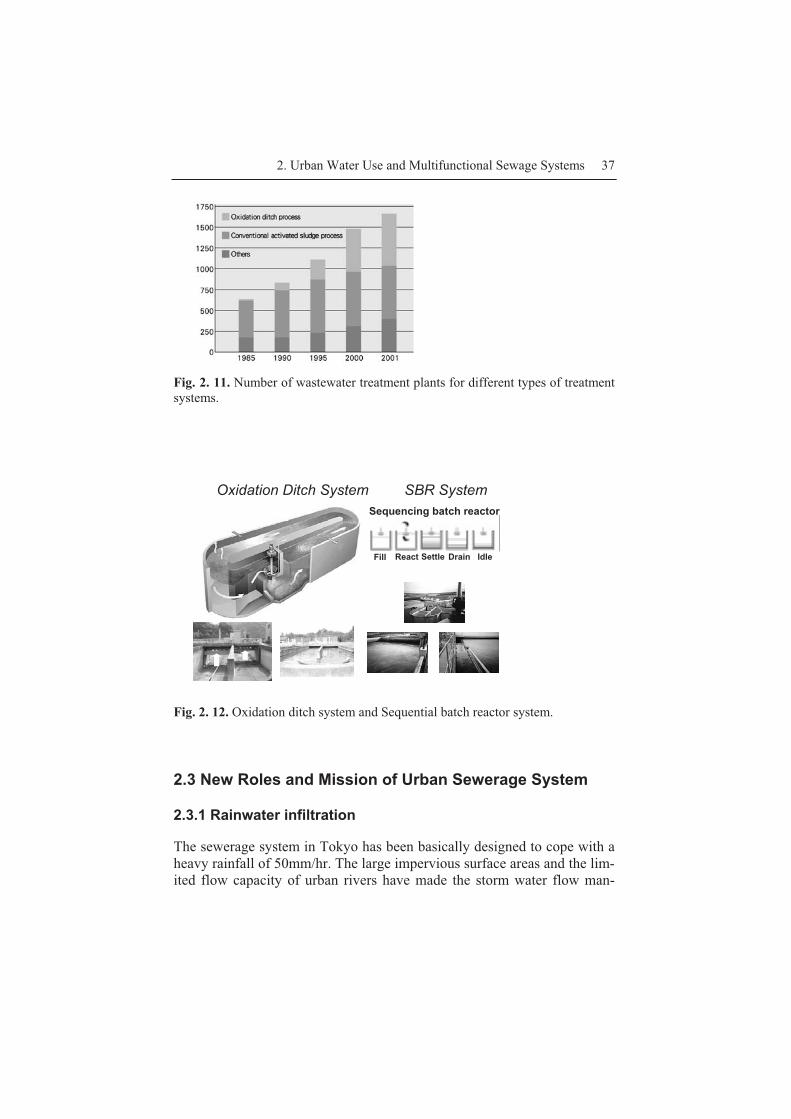
2.2.4 Wastewater treatment systems
The conventional activated sludge process has been applied for sewage treatment in many large cities. The sequential batch reactor (SBR) system is popular for small size treatment systems, and is included in the category of others in Fig.2.11. Nowadays, the oxidation ditch (OD) process has be-come widely applied for small sized plants. Different treatment configura-tions of OD and SBR are shown in Fig.2.12.
Pumping station
Sewer system
Pretreatment
Activated sludge process(Bioreactor and secondary settling)
Advanced treatment
Disinfection
Primary settling
2. Urban Water Use and Multifunctional Sewage Systems 37
Fig. 2. 11. Number of wastewater treatment plants for different types of treatment systems.
Fig. 2. 12. Oxidation ditch system and Sequential batch reactor system.
2.3 New Roles and Mission of Urban Sewerage System
2.3.1 Rainwater infiltration
The sewerage system in Tokyo has been basically designed to cope with a heavy rainfall of 50mm/hr. The large impervious surface areas and the lim-ited flow capacity of urban rivers have made the storm water flow man-
Oxidation Ditch System SBR System Sequencing batch reactor
SettleFill React Drain Idle

38 Hiroaki Furumai
agement system extremely important. Being a water conservation con-scious city, the Tokyo Metropolitan Sewerage Bureau constructed a new type of sewerage system in 1980s that incorporates various types of infil-tration facilities over a 1400-hectare area (Fujita, 1984). The infiltration facilities include infiltration soakaways, trenches, curbs and permeable pavements. Fig.2.13 illustrates the basic scheme of an infiltration-type sewer system.
The construction of infiltration facilities mainly aimed at inundation control in rapidly urbanized areas by reduced storm water peak flows. It lessened the necessity of improvement works of urban rivers. These infil-tration facilities provide secondary benefits such as the recharge of groundwater and the reduction of non-point pollutant loads from urban surfaces. The groundwater recharge is considered essential to secure a sound water cycle in Tokyo. Although Tokyo has restricted and controlled groundwater use, recharged groundwater is a potential storage of water re-sources and water can be withdrawn in the future if necessary.
Fig. 2. 13. Configuration of Infiltration-type Sewerage System
2.3.2 Rainwater harvesting
A good example of rainwater harvesting can be seen in the National Sport Stadium in Tokyo, as shown in Fig.2.14. It was introduced in 1984 and
2. Urban Water Use and Multifunctional Sewage Systems 39
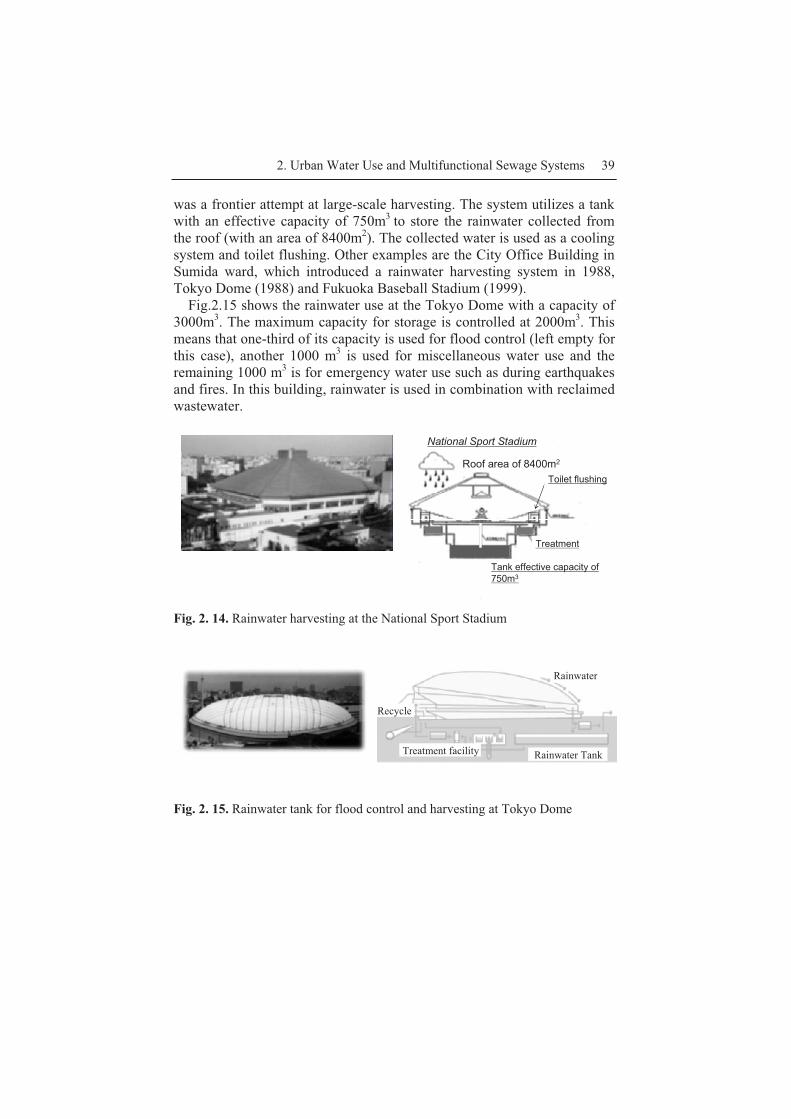
was a frontier attempt at large-scale harvesting. The system utilizes a tank with an effective capacity of 750m3 to store the rainwater collected from the roof (with an area of 8400m2). The collected water is used as a cooling system and toilet flushing. Other examples are the City Office Building in Sumida ward, which introduced a rainwater harvesting system in 1988, Tokyo Dome (1988) and Fukuoka Baseball Stadium (1999).
Fig.2.15 shows the rainwater use at the Tokyo Dome with a capacity of 3000m3. The maximum capacity for storage is controlled at 2000m3. This means that one-third of its capacity is used for flood control (left empty for this case), another 1000 m3 is used for miscellaneous water use and the remaining 1000 m3 is for emergency water use such as during earthquakes and fires. In this building, rainwater is used in combination with reclaimed wastewater.
Fig. 2. 14. Rainwater harvesting at the National Sport Stadium
Fig. 2. 15. Rainwater tank for flood control and harvesting at Tokyo Dome
National Sport Stadium
Tank effective capacity of 750m3
Treatment
Toilet flushingRoof area of 8400m2
Rainwater
Rainwater TankTreatment facility
Recycle

40 Hiroaki Furumai
2.3.3 Use of Reclaimed Wastewater
The water amount of about 16 billion m3 is annually supplied for domestic use in Japan. Domestic wastewater from 70% of the total population in Ja-pan flows into public sewerage systems. In the 2003 fiscal year, sewage of 13.7 billion m3 was treated and eventually discharged into rivers, lakes, and bays. Not all treated wastewater is discharged into bodies of water. As much as 186 million m3 of treated wastewater is reused. This amount cor-responds to 1.4% of the total amount of treated wastewater. Although the percentage is not very high, sewerage systems play an important role in the water cycle and contribute to effective water use in urban areas. In other words, reclaimed wastewater is a precious water resource and its efficient use should be promoted in case of limited availability of water.
Fig.2.16 shows the different uses of reclaimed water. The environmental use, landscape use and snow melting use are three major uses at the na-tionwide level. Reclaimed water has been also utilized for recreation, agri-culture, industry, flushing toilets and so on.
River environmental use
Agriculture
Direct water supply to factories etc.
IndustryFlush toilets
Snow melting
Spraying roads and trees etc.
20.89 (11.2%) 5.45 (2.9%)
45.67 (24.5%)
3.89 (2.1%)
3.44 (1.8%)
14.87 (8.0%)
0.44 (0.2%)
38.14 (20.5%)
53.66 (28.8%)
Recreation
Landscape
186 x106
[m3/year]
Fig. 2. 16. Reclaimed wastewater use in Japan (Fiscal year of 2003)
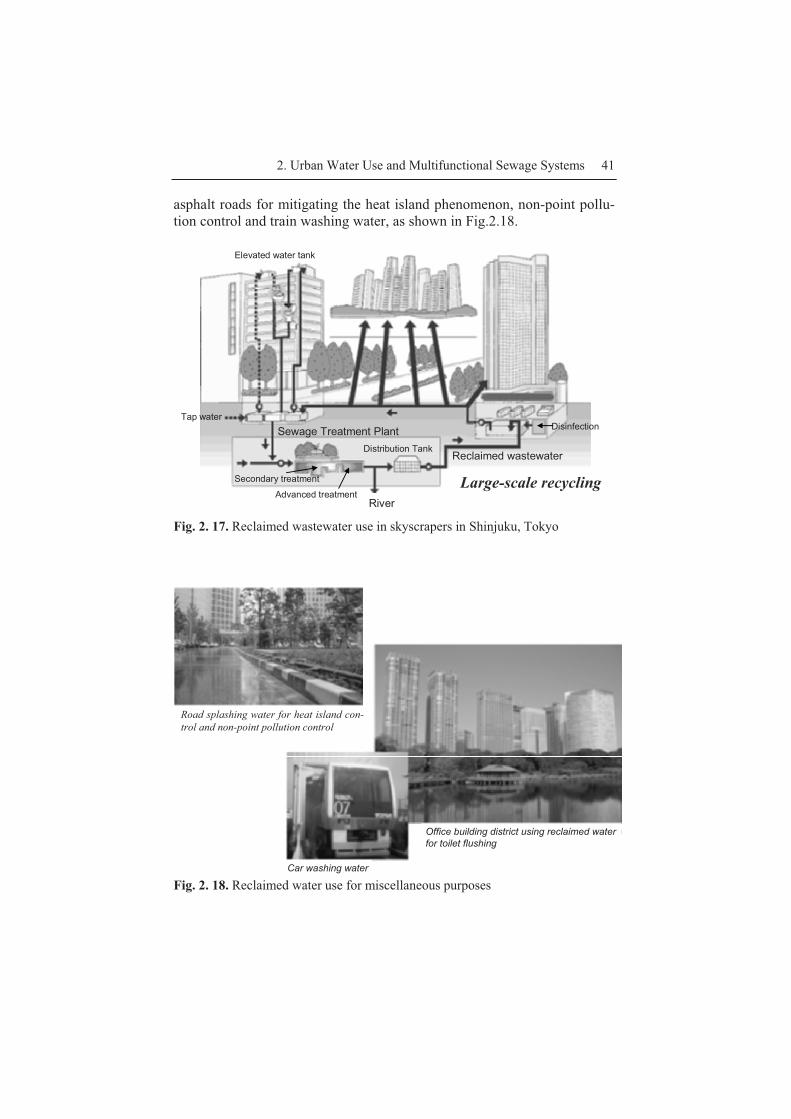
A famous example of toilet flushing use can be found in the skyscrapers in the Shinjuku area. This area has a higher demand of water than usual, as shown in Fig.2.17. The treatment plant supplies reclaimed wastewater with disinfection to storage tank in a water recycle centre. This means that they have a dual system where it is possible to use the supply water and the re-cycled water.
New types of reclaimed wastewater uses have been introduced as well, such as in flush toilets. Examples are splashing water on water-retaining
2. Urban Water Use and Multifunctional Sewage Systems 41
asphalt roads for mitigating the heat island phenomenon, non-point pollu-tion control and train washing water, as shown in Fig.2.18.
River
Reclaimed wastewaterDistribution Tank
Sewage Treatment Plant DisinfectionTap water
Elevated water tank
Advanced treatment
Secondary treatment Large-scale recycling
Fig. 2. 17. Reclaimed wastewater use in skyscrapers in Shinjuku, Tokyo
Fig. 2. 18. Reclaimed water use for miscellaneous purposes
Car washing water
Office building district using reclaimed water for toilet flushing
Road splashing water for heat island con-trol and non-point pollution control

42 Hiroaki Furumai
The concept of wastewater reclamation can also be used to restore the flow of urban rivers and water channels. The restoration project supplies reclaimed water to urban rivers whose base flow has decreased due to high urbanization and high numbers of impervious surfaces. As part of the solu-tion, reclaimed water is used to replenish urban river flow. Tama River was the main source of drinking water during the Edo era since 1654 when a water channel was constructed. The river water was introduced to a drinking water treatment plant in the central area of Tokyo until 1965. At that time, most of the intake water was transported to a new drinking water treatment plant in the suburbs of Tokyo, leaving the water channels with-out sufficient flow. Nowadays, the reclaimed water from the sewage treatment plants is used to revitalize the dried-up water channels.
Tama river
Tachikawa Mitaka
Tokyo
Ikebukuro
Open channel
Covered conduitDischarge point
Tama-Jyoryosewage treatment plant
Nobidome-channel
Tamagawa-channel
Senkawa-
channel
Meguro river
Ochiai sewage treatment plant
Nomu river
Shibuya river
TokyoBay
Ara river
Tama river
Tachikawa Mitaka
Tokyo
Ikebukuro
Open channel
Covered conduitDischarge point
Tama-Jyoryosewage treatment plant
Nobidome-channel
Tamagawa-channel
Senkawa-
channel
Meguro river
Ochiai sewage treatment plant
Nomu river
Shibuya river
TokyoBay
Ara river
Megura River
SenkawaNobidome
Dried up channel was restored by supplying reclaimed wastewater.
Fig. 2. 19. Reclaimed water use for restoration of water environment and aquatic amenity
It is very important to consider reclaimed wastewater usage not only from the viewpoint of quantity stability, but also quality risk that could rise ac-cording to exposure levels to human beings in water use. Therefore, water quality should be evaluated to characterize its potential for reuse and recy-cling. The Ministry of Land, Infrastructure and Transportation has estab-lished and revised the water quality criteria and guidelines for reclaimed wastewater use for miscellaneous purposes since 1981. In April 2005, the
2. Urban Water Use and Multifunctional Sewage Systems 43
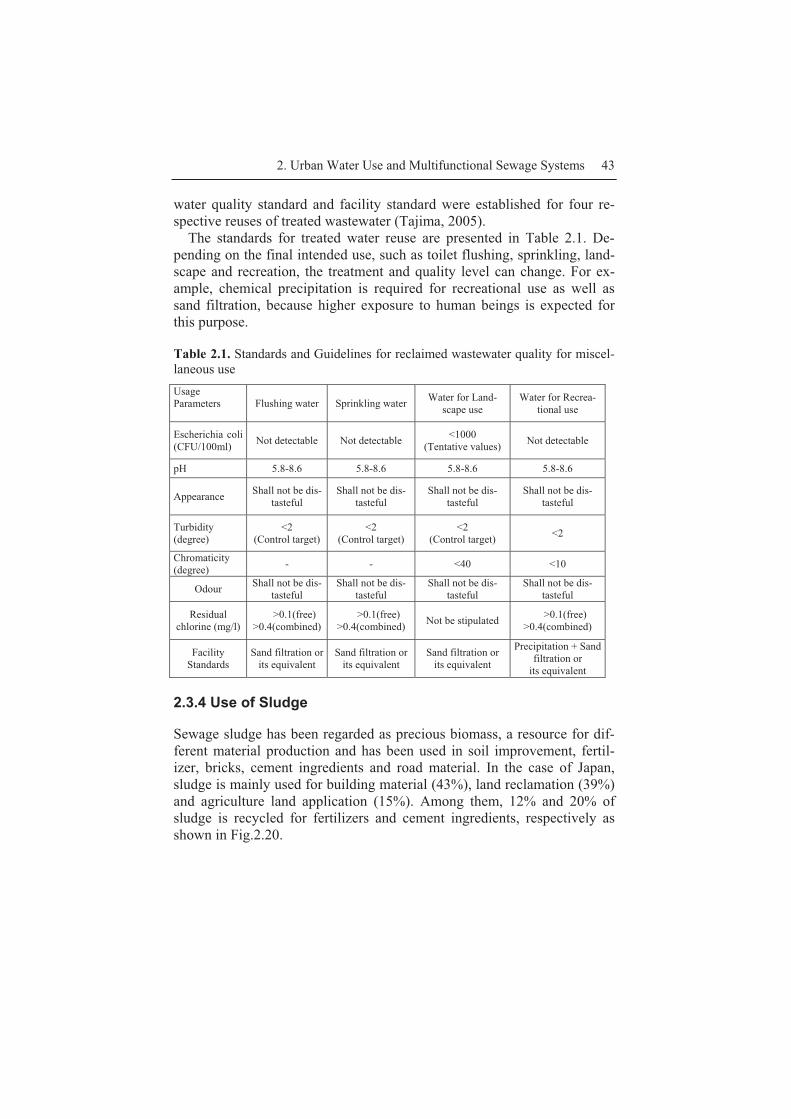
water quality standard and facility standard were established for four re-spective reuses of treated wastewater (Tajima, 2005).
The standards for treated water reuse are presented in Table 2.1. De-pending on the final intended use, such as toilet flushing, sprinkling, land-scape and recreation, the treatment and quality level can change. For ex-ample, chemical precipitation is required for recreational use as well as sand filtration, because higher exposure to human beings is expected for this purpose.
Table 2.1. Standards and Guidelines for reclaimed wastewater quality for miscel-laneous use Usage Parameters Flushing water� Sprinkling water Water for Land-
scape use Water for Recrea-
tional use
Escherichia coli (CFU/100ml) Not detectable Not detectable <1000
(Tentative values) Not detectable
pH 5.8-8.6 5.8-8.6 5.8-8.6 5.8-8.6
Appearance Shall not be dis-tasteful
Shall not be dis-tasteful
Shall not be dis-tasteful
Shall not be dis-tasteful
Turbidity��(degree)
<2 (Control target)
<2 (Control target)
<2 (Control target) <2
Chromaticity (degree) - - <40 <10
Odour Shall not be dis-tasteful
Shall not be dis-tasteful
Shall not be dis-tasteful
Shall not be dis-tasteful
Residual chlorine (mg/l)
>0.1(free) >0.4(combined)
>0.1(free) >0.4(combined) Not be stipulated >0.1(free)
>0.4(combined)
Facility Standards
Sand filtration or its equivalent
Sand filtration or its equivalent
Sand filtration or its equivalent
Precipitation + Sand filtration or
its equivalent
2.3.4 Use of Sludge
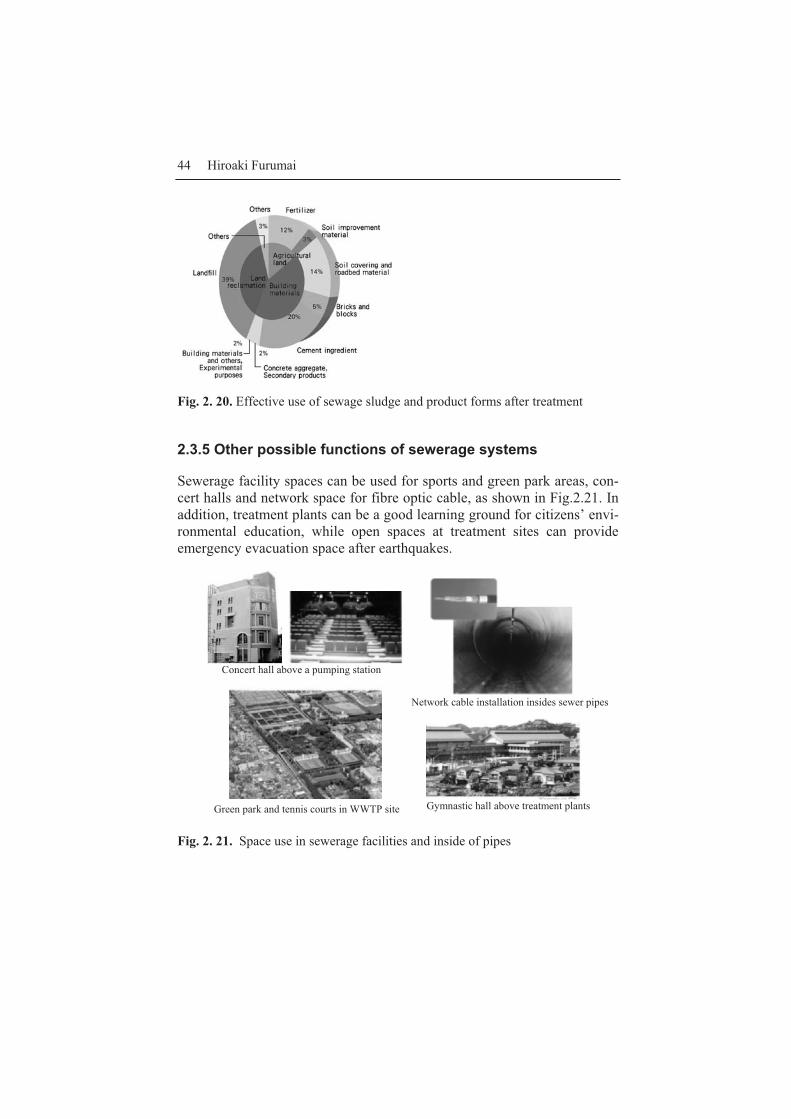
Sewage sludge has been regarded as precious biomass, a resource for dif-ferent material production and has been used in soil improvement, fertil-izer, bricks, cement ingredients and road material. In the case of Japan, sludge is mainly used for building material (43%), land reclamation (39%) and agriculture land application (15%). Among them, 12% and 20% of sludge is recycled for fertilizers and cement ingredients, respectively as shown in Fig.2.20.
44 Hiroaki Furumai
Fig. 2. 20. Effective use of sewage sludge and product forms after treatment
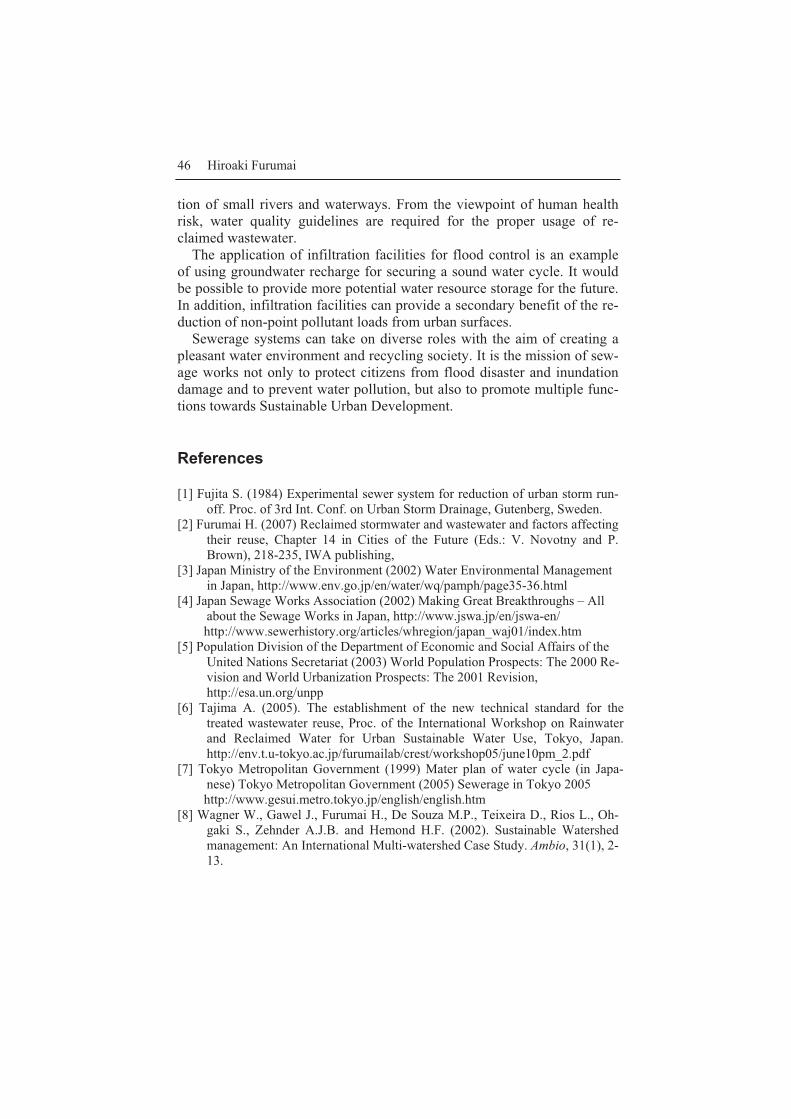
2.3.5 Other possible functions of sewerage systems
Sewerage facility spaces can be used for sports and green park areas, con-cert halls and network space for fibre optic cable, as shown in Fig.2.21. In addition, treatment plants can be a good learning ground for citizens’ envi-ronmental education, while open spaces at treatment sites can provide emergency evacuation space after earthquakes.
Fig. 2. 21. Space use in sewerage facilities and inside of pipes
Concert hall above a pumping station
Gymnastic hall above treatment plants Green park and tennis courts in WWTP site
Network cable installation insides sewer pipes

2. Urban Water Use and Multifunctional Sewage Systems 45
Another example of wastewater use is as a temperature regulator. Heat pumps can be used to utilize heating and cooling functions of wastewater. During the summer, the wastewater temperature is lower than the air tem-perature, and can play a cooling role while wastewater temperature is higher that the air temperature in the winter, and can be used for heating, as shown in Fig.2.22.
Fig. 2.22. Heat pump facility and seasonal changes of wastewater and air tempera-tures
2.4 Summary
Tokyo has taken several measures to meet the increased water demand from the viewpoint of sustainable water use. Rainwater and reclaimed wastewater have been applied for various purposes including the restora-
Wastew
ater Temperature/ A
ir Temperature ( oC
)
35
30
25
20
15
10
0
4 5 6 7 8 9 10 11 12 1 2 3
Air Temperature
Wastewater Temperature
Temperature of Wastewater and Outside Air
Wastewater temperature is warmer than outside air in winter
Wastewater temperature is cooler than outside air in summer
Heating
Cooling
Month
46 Hiroaki Furumai
tion of small rivers and waterways. From the viewpoint of human health risk, water quality guidelines are required for the proper usage of re-claimed wastewater.
The application of infiltration facilities for flood control is an example of using groundwater recharge for securing a sound water cycle. It would be possible to provide more potential water resource storage for the future. In addition, infiltration facilities can provide a secondary benefit of the re-duction of non-point pollutant loads from urban surfaces.
Sewerage systems can take on diverse roles with the aim of creating a pleasant water environment and recycling society. It is the mission of sew-age works not only to protect citizens from flood disaster and inundation damage and to prevent water pollution, but also to promote multiple func-tions towards Sustainable Urban Development.
References
[1] Fujita S. (1984) Experimental sewer system for reduction of urban storm run-off. Proc. of 3rd Int. Conf. on Urban Storm Drainage, Gutenberg, Sweden.
[2] Furumai H. (2007) Reclaimed stormwater and wastewater and factors affecting their reuse, Chapter 14 in Cities of the Future (Eds.: V. Novotny and P. Brown), 218-235, IWA publishing,
[3] Japan Ministry of the Environment (2002) Water Environmental Management in Japan, http://www.env.go.jp/en/water/wq/pamph/page35-36.html
[4] Japan Sewage Works Association (2002) Making Great Breakthroughs – All about the Sewage Works in Japan, http://www.jswa.jp/en/jswa-en/ http://www.sewerhistory.org/articles/whregion/japan_waj01/index.htm
[5] Population Division of the Department of Economic and Social Affairs of the United Nations Secretariat (2003) World Population Prospects: The 2000 Re-vision and World Urbanization Prospects: The 2001 Revision, http://esa.un.org/unpp
[6] Tajima A. (2005). The establishment of the new technical standard for the treated wastewater reuse, Proc. of the International Workshop on Rainwater and Reclaimed Water for Urban Sustainable Water Use, Tokyo, Japan. http://env.t.u-tokyo.ac.jp/furumailab/crest/workshop05/june10pm_2.pdf
[7] Tokyo Metropolitan Government (1999) Mater plan of water cycle (in Japa-nese) Tokyo Metropolitan Government (2005) Sewerage in Tokyo 2005 http://www.gesui.metro.tokyo.jp/english/english.htm
[8] Wagner W., Gawel J., Furumai H., De Souza M.P., Teixeira D., Rios L., Oh-gaki S., Zehnder A.J.B. and Hemond H.F. (2002). Sustainable Watershed management: An International Multi-watershed Case Study. Ambio, 31(1), 2-13.

3. Urban River Management: Harmonizing River Ecosystem Conservation
Takeyoshi Chibana
Department of Civil Engineering, the University of Tokyo 7-3-1, Hongo, Bunkyo-ku, Tokyo, 113-8656, Japan
3.1 Introduction
In 1997, river environmental conservation was declared one of the impor-tant purposes of river management in River Law. Before this year, the main purposes of river management concerned flood control and water use only. During the 1970s, however, ecological conditions in rivers became worse and worse. At this time, government and citizens started to try to re-store and preserve river environments. Against such a background, this chapter focuses on how to make urban river ecosystems harmonize with the mission of flood control.
In Japan, rivers are often quite steep, leading to a sudden rise in the dis-charge rate after rainfall. Especially in regards to large rivers, Japan has suffered from severe flood damage and the government and citizens have made great effort to control floods. Recently the number of damaging floods has been gradually decreasing, but there are still several problems in river management. Therefore, rivers have been continuously regulated and changed, especially in urbanized areas. For example, the photograph shown in Fig. 3.1 was taken in Gifu prefecture in Japan. All over Japan, we could see this kind of landscape in the past. This river runs through the village and village people have their houses near the river with no barrier between their village and the river. There is easy access to the riverfront.

48 Takeyoshi Chibana
Fig. 3.1 River that runs through a rural village
Fig. 3.2 Typical urban river
There are many aquatic species found in this river ecosystem (insects, frogs, fish, etc.). In such natural rivers, the interaction between forest and river is also important. Leaves fall into the river and decompose due to the activities of aquatic creatures, such as the feeding activity of macro-invertebrates.
Water quality is affected by decomposed organic matter, and at the same time, river insects move to terrestrial areas during their adult stage and die or are eaten. Material moves from land to river and river to land. Such ma-terial circulation takes place in and around rivers. This is the original con-dition of Japanese rivers.
However, Fig. 3.2 shows one of the typical urban river channels in which both banks are covered by concrete while the channel has many steps. Steps are constructed to reduce the riverbed slope and prevent ero-sion when a meandering river course has been shortcut and straightened.
3. Urban River Management 49
These concrete structures are often found in urban rivers. In this case, there is no interaction between the forest and the river and also fish neither mi-grate upstream nor find their preferred habitat. Around such a river, resi-dents seem not to care about the river, because no fishing activities are found and the water quality is usually bad. In this case, it is difficult for residents to keep their motivation to improve the river.
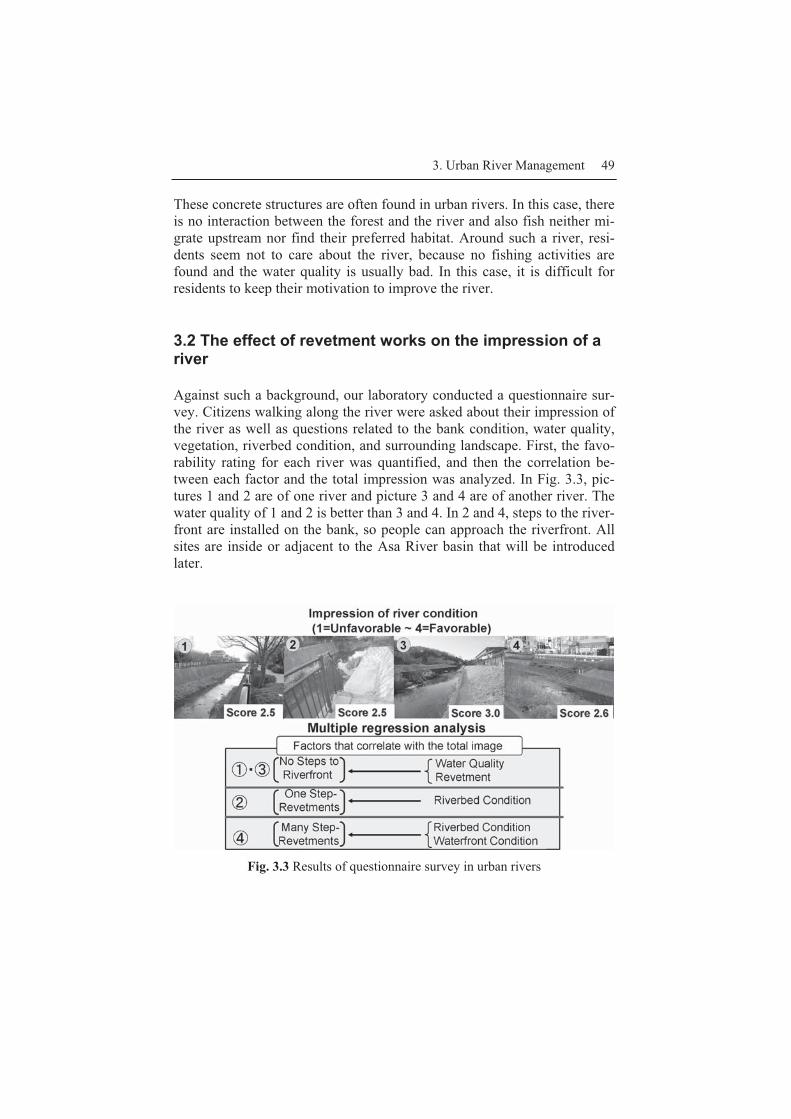
3.2 The effect of revetment works on the impression of a river
Against such a background, our laboratory conducted a questionnaire sur-vey. Citizens walking along the river were asked about their impression of the river as well as questions related to the bank condition, water quality, vegetation, riverbed condition, and surrounding landscape. First, the favo-rability rating for each river was quantified, and then the correlation be-tween each factor and the total impression was analyzed. In Fig. 3.3, pic-tures 1 and 2 are of one river and picture 3 and 4 are of another river. The water quality of 1 and 2 is better than 3 and 4. In 2 and 4, steps to the river-front are installed on the bank, so people can approach the riverfront. All sites are inside or adjacent to the Asa River basin that will be introduced later.
Fig. 3.3 Results of questionnaire survey in urban rivers

50 Takeyoshi Chibana
As is shown in Fig. 3.3, the favorability rating was 2.5 in three of four sites on a scale of 1 to 4 where 1 is unfavorable and 4 favorable. So a score of 2.5 means just 50% favorability. As this result shows, the condition of the river is not a matter of any consequence for residents around this river. However, in river 3 the score is higher than the other cases, though this river has no steps to the riverfront on the riverbank and the water quality is not so good. Next we analyzed which factors correlate with the total im-pression. The result is also shown in Fig. 3.3. In the case of photo 1 and 3 where no steps are installed, water quality and revetment (bank protection) were found to highly correlate with the total impression. This result shows that their impressions tend to be good in rivers where the revetment condi-tion and the water quality are good. In the case of photo 2, there is one step and people can approach the riverfront, and the riverbed condition highly correlates with the total impression. For this site, those who answered that the riverbed was dirty or that there was garbage also answered that the riv-er was not good, while people who answered that riverbed condition was good answered that the total image of the river was also favorable. In the case of photo 3, the riverbed condition and the riverfront condition (vege-tation, shape of shore etc) correlated with the total impression. This result shows that conditions inside a river channel affect the evaluation of a riv-er’s condition.
If there are no steps to the riverfront, citizens evaluated the river condi-tions based on water quality and revetment because they have never thought about nor approached the riverfront. In that case, the revetment condition and the water quality image were most important. Actually, wa-ter quality was not judged based on the actual condition. This analysis cla-rified that revetment works are very important for the evaluation of citi-zens when they cannot approach the riverfront. But in order to make citizens take an interest in riverbed condition, step-revetment is necessary in urban rivers. The design of revetment is quite important in urban rivers, so the revetment works in Japan and their effects and problems will be in-troduced below.
3.3 Structures of revetment works and their problems
The basic structure of revetment works is shown in Fig. 3.4. Usually we consider slope protection that is covered by concrete as revetment. How-ever, the crown of the levee and foot protection are also important parts for bank protection.
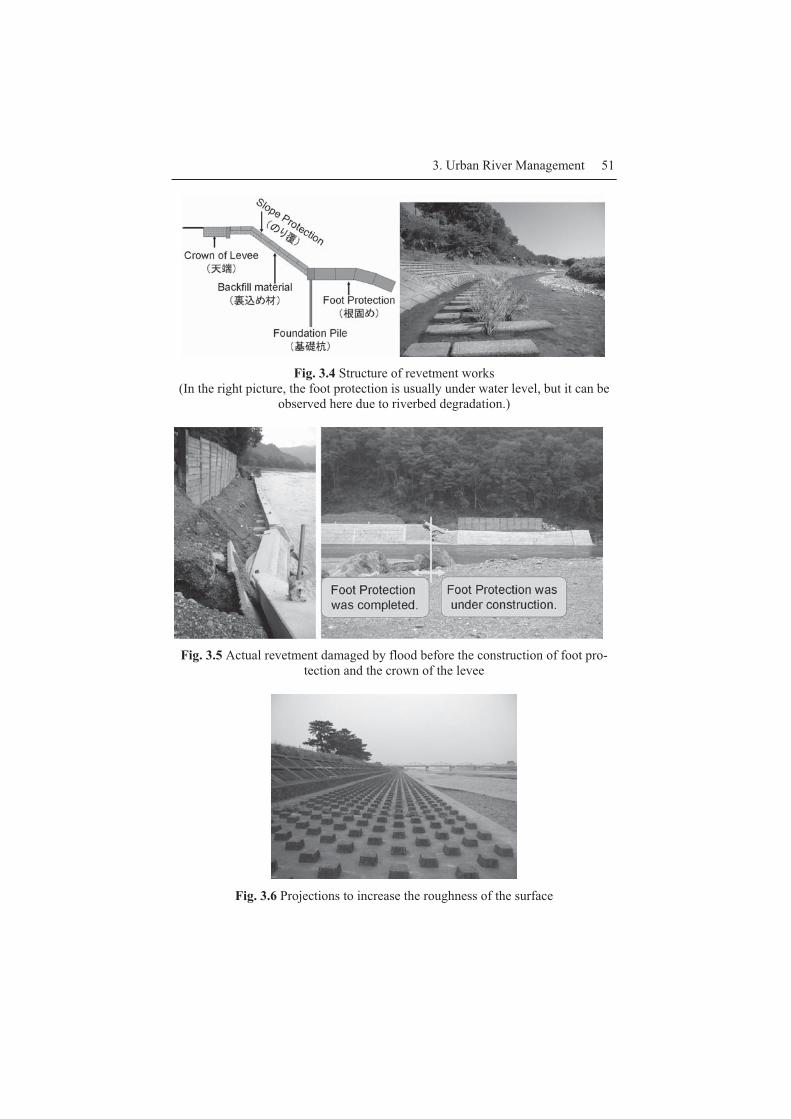
3. Urban River Management 51
Fig. 3.4 Structure of revetment works
(In the right picture, the foot protection is usually under water level, but it can be observed here due to riverbed degradation.)
Fig. 3.5 Actual revetment damaged by flood before the construction of foot pro-
tection and the crown of the levee
Fig. 3.6 Projections to increase the roughness of the surface

52 Takeyoshi Chibana
Fig. 3.7 Comparison of the velocity profiles near the river shore
between an artificial (left) and a natural (right) bank
The picture in Fig. 3.5 shows actual revetment works damaged by a flood and demonstrates the importance of the crown of the levee and foot protection. The backfill material behind the concrete that can be observed in the picture is sand and gravel. They were washed out from the top dur-ing the flood, because the water level increased before the completion of the crown. In the photo, foot protection is shown under construction along the river channel from left to right. However, before the completion, a very severe flood came. The area with foot protection was safe, but in the right hand side, the foot of the slope protection was damaged. As a result, the surface protection slid out.
It is clear that coverage of the crown and the foot is necessary to protect the riverbank, but these protections as well as the slope protection also damage the river ecosystem and reduce the diversity of river morphology.
One of the problems is monotonous slope protection. As Fig. 3.6 shows, usually some obstacles increase the roughness of the surface in order to re-duce the velocity during flood, but the velocity reduction is not very large during normal flow. Fig. 3.7 compares the diversity of velocity profiles near shore between a natural and an artificial bank. Our laboratory con-ducted field measurements of two rivers. In the figure below, the y-axis shows the distance from the riverbed to the surface and the x-axis shows

3. Urban River Management 53
the velocity. In front of the revetment (left picture), the velocity profiles follow a log distribution. However, at distances of 50 cm, 1 m, 1.5 m and 2 m, the profile is almost constant since depth is completely the same and there is no roughness on the foot protection. In this case, there is neither divergence nor convergence of flow in the cross-sectional direction. But in the natural river without any revetment works (right picture), several kinds of velocity profiles were observed. In some cases, due to the turbulent flow, very high velocity is found near the bottom and very slow velocity near the surface. Thus various velocity profiles are found and create di-verse riverbed conditions.
Another problem is caused by foot protections that affect a wider area than the previous case. Fig. 3.6 shows the revetment work in one river. In this site, a topographic survey was conducted in the longitudinal direction along the indicated line. Its result is also shown in Fig. 3.8. If foot protec-tions were installed, the flow power would not attenuate due to the erosion of the riverbank or riverbed during a flood. Then all riverbed materials would be washed out from the bed and the same depth would continue downstream. Usually many small concrete blocks are combined together and are installed as foot protections, because the foot protections should adjust to morphological change (see the picture in Fig. 3.4). However, as Fig. 3.8 shows, the longitudinal variation of depth disappears. In this case, fish cannot choose their suitable depth in a river. Moreover, even if the depth is suitable for a specific fish, the fluctuation of water level degrades the suitability of the pool. It is important to know how to create diverse flow and riverbed conditions from the viewpoint of ecosystem conserva-tion.
Fig. 3.8 Monotonous riverbed condition along revetment
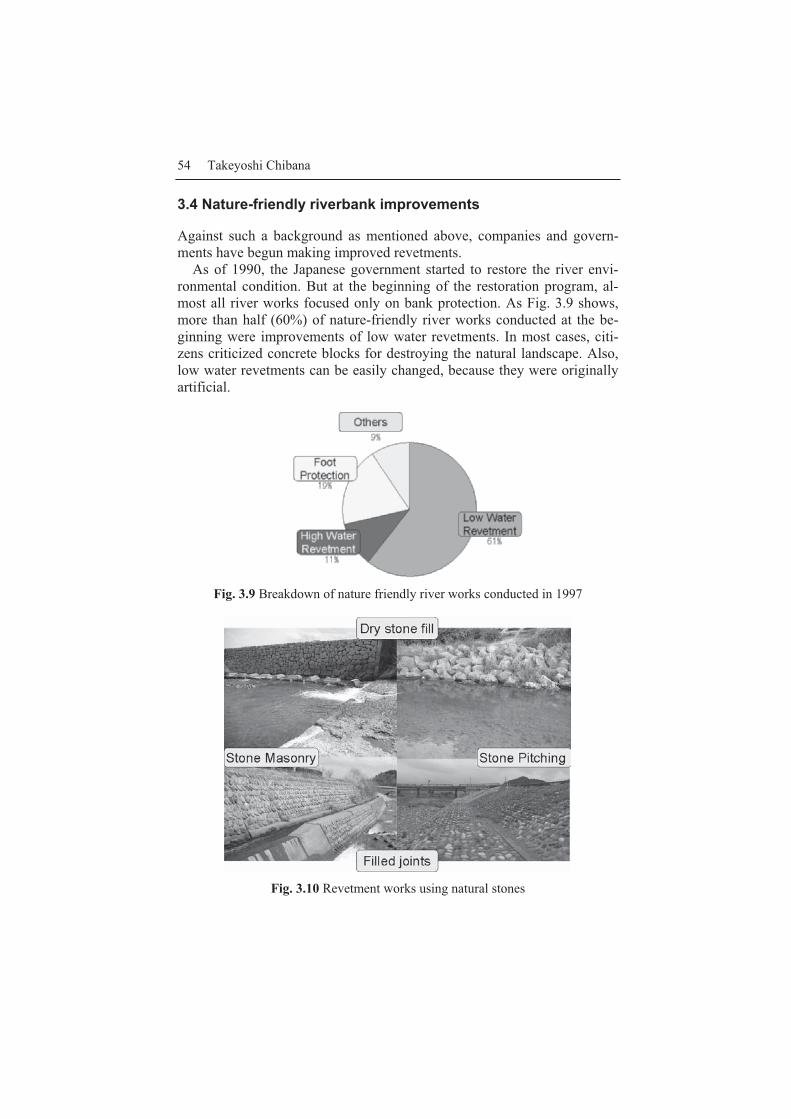
54 Takeyoshi Chibana
3.4 Nature-friendly riverbank improvements
Against such a background as mentioned above, companies and govern-ments have begun making improved revetments.
As of 1990, the Japanese government started to restore the river envi-ronmental condition. But at the beginning of the restoration program, al-most all river works focused only on bank protection. As Fig. 3.9 shows, more than half (60%) of nature-friendly river works conducted at the be-ginning were improvements of low water revetments. In most cases, citi-zens criticized concrete blocks for destroying the natural landscape. Also, low water revetments can be easily changed, because they were originally artificial.
Fig. 3.9 Breakdown of nature friendly river works conducted in 1997
Fig. 3.10 Revetment works using natural stones
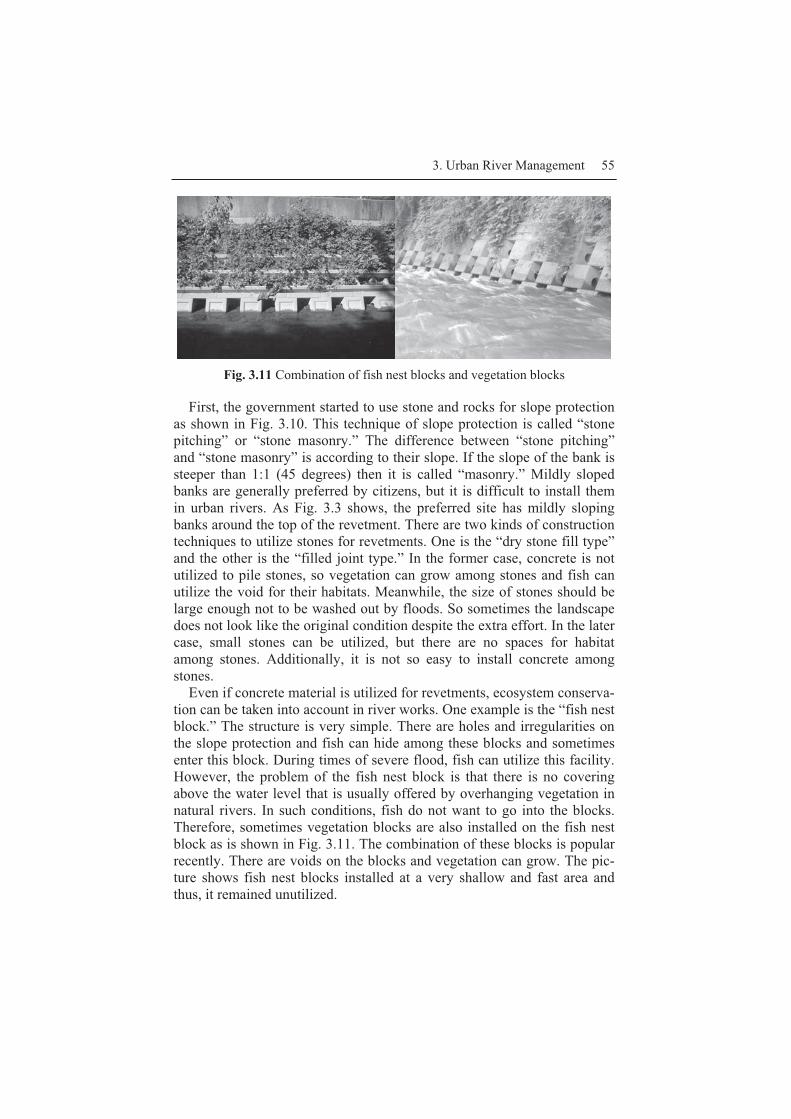
3. Urban River Management 55
Fig. 3.11 Combination of fish nest blocks and vegetation blocks
First, the government started to use stone and rocks for slope protection as shown in Fig. 3.10. This technique of slope protection is called “stone pitching” or “stone masonry.” The difference between “stone pitching” and “stone masonry” is according to their slope. If the slope of the bank is steeper than 1:1 (45 degrees) then it is called “masonry.” Mildly sloped banks are generally preferred by citizens, but it is difficult to install them in urban rivers. As Fig. 3.3 shows, the preferred site has mildly sloping banks around the top of the revetment. There are two kinds of construction techniques to utilize stones for revetments. One is the “dry stone fill type” and the other is the “filled joint type.” In the former case, concrete is not utilized to pile stones, so vegetation can grow among stones and fish can utilize the void for their habitats. Meanwhile, the size of stones should be large enough not to be washed out by floods. So sometimes the landscape does not look like the original condition despite the extra effort. In the later case, small stones can be utilized, but there are no spaces for habitat among stones. Additionally, it is not so easy to install concrete among stones.
Even if concrete material is utilized for revetments, ecosystem conserva-tion can be taken into account in river works. One example is the “fish nest block.” The structure is very simple. There are holes and irregularities on the slope protection and fish can hide among these blocks and sometimes enter this block. During times of severe flood, fish can utilize this facility. However, the problem of the fish nest block is that there is no covering above the water level that is usually offered by overhanging vegetation in natural rivers. In such conditions, fish do not want to go into the blocks. Therefore, sometimes vegetation blocks are also installed on the fish nest block as is shown in Fig. 3.11. The combination of these blocks is popular recently. There are voids on the blocks and vegetation can grow. The pic-ture shows fish nest blocks installed at a very shallow and fast area and thus, it remained unutilized.

56 Takeyoshi Chibana
3.5 Problems of present nature-friendly river works and future visions
Even if several kinds of improved blocks are installed, artificial revetment does not have the same functions as natural banks.Briefly speaking, in in-stalling revetments, the following aspects are missing: � A characteristic environment that depends on the geological conditions � Longitudinal transition of riverbank topography � Dynamism of river topography
Fig. 3.12 Natural riverbanks that depend on their geological conditions
Fig. 3.13 Monotonous condition in flow direction
First, the natural condition is quite different among rivers, and each riv-
er has its own function. For example, the shape of a riverbank depends on the geological conditions, as is shown in Fig. 3.12. In a mountain region, the riverbed is composed of rocks or boulders, so we can find a quite com-plicated shoreline, as is shown in the right picture of Fig. 3.7. Diverse flow
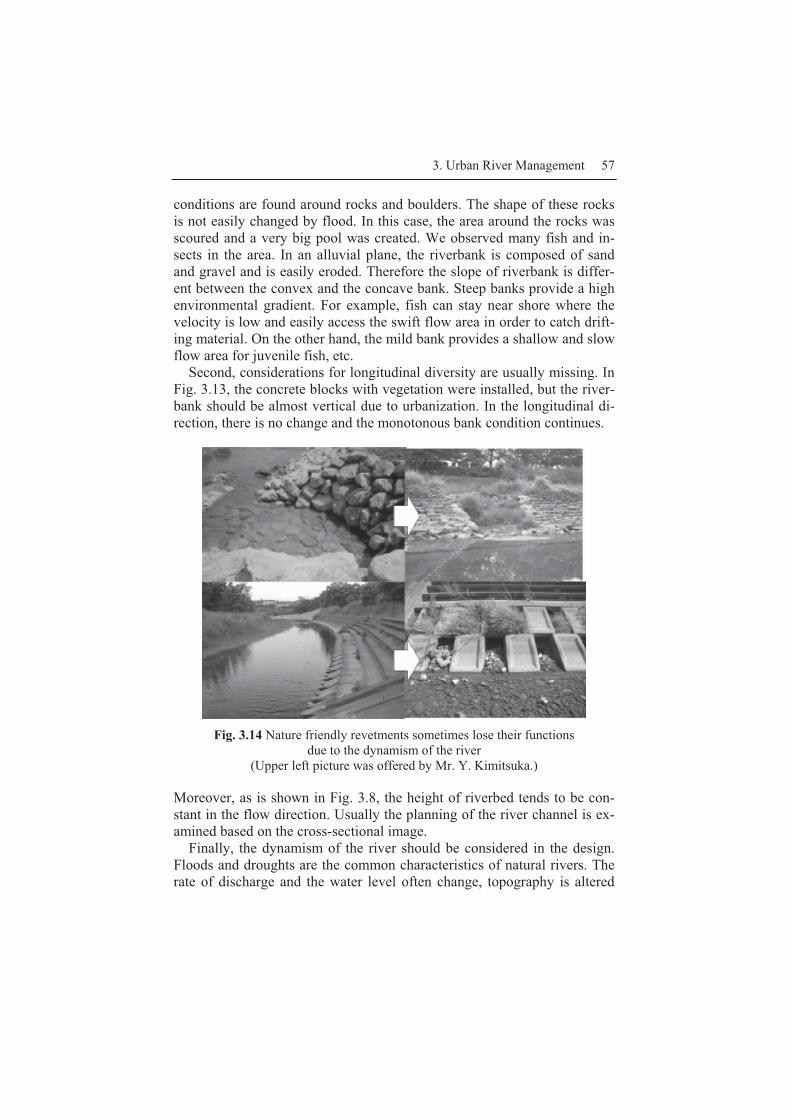
3. Urban River Management 57
conditions are found around rocks and boulders. The shape of these rocks is not easily changed by flood. In this case, the area around the rocks was scoured and a very big pool was created. We observed many fish and in-sects in the area. In an alluvial plane, the riverbank is composed of sand and gravel and is easily eroded. Therefore the slope of riverbank is differ-ent between the convex and the concave bank. Steep banks provide a high environmental gradient. For example, fish can stay near shore where the velocity is low and easily access the swift flow area in order to catch drift-ing material. On the other hand, the mild bank provides a shallow and slow flow area for juvenile fish, etc.
Second, considerations for longitudinal diversity are usually missing. In Fig. 3.13, the concrete blocks with vegetation were installed, but the river-bank should be almost vertical due to urbanization. In the longitudinal di-rection, there is no change and the monotonous bank condition continues.
Fig. 3.14 Nature friendly revetments sometimes lose their functions
due to the dynamism of the river (Upper left picture was offered by Mr. Y. Kimitsuka.)
Moreover, as is shown in Fig. 3.8, the height of riverbed tends to be con-stant in the flow direction. Usually the planning of the river channel is ex-amined based on the cross-sectional image.
Finally, the dynamism of the river should be considered in the design. Floods and droughts are the common characteristics of natural rivers. The rate of discharge and the water level often change, topography is altered
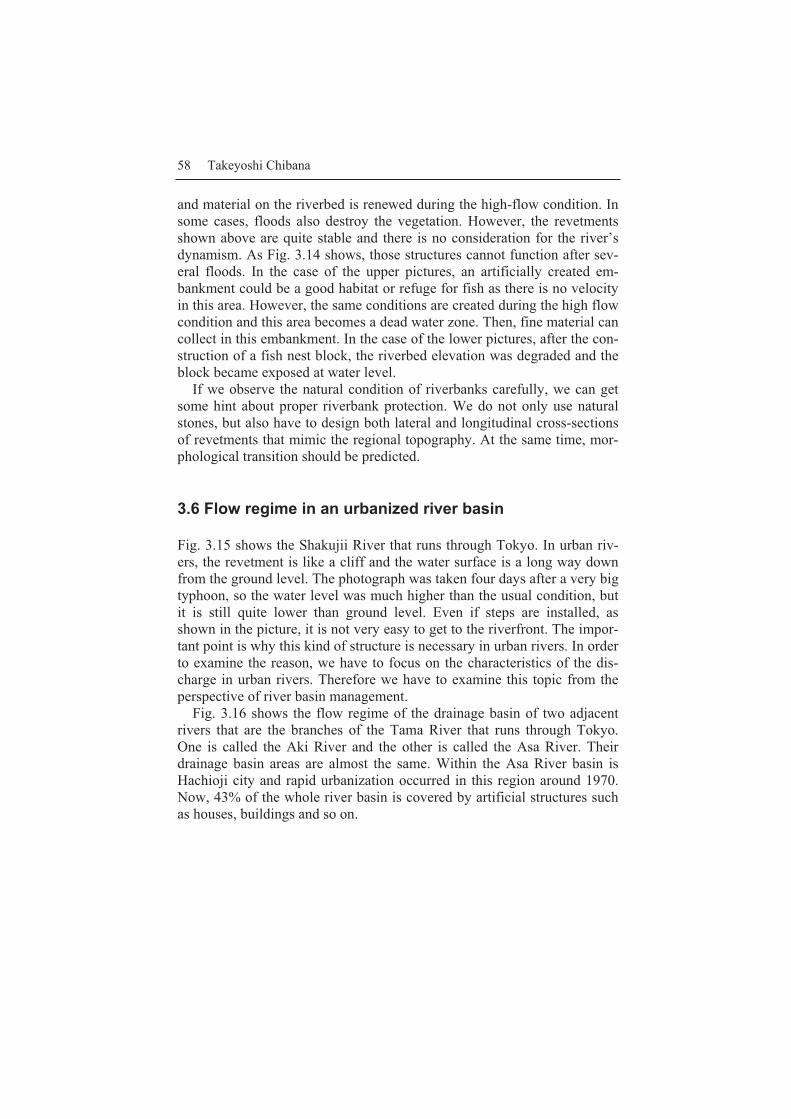
58 Takeyoshi Chibana
and material on the riverbed is renewed during the high-flow condition. In some cases, floods also destroy the vegetation. However, the revetments shown above are quite stable and there is no consideration for the river’s dynamism. As Fig. 3.14 shows, those structures cannot function after sev-eral floods. In the case of the upper pictures, an artificially created em-bankment could be a good habitat or refuge for fish as there is no velocity in this area. However, the same conditions are created during the high flow condition and this area becomes a dead water zone. Then, fine material can collect in this embankment. In the case of the lower pictures, after the con-struction of a fish nest block, the riverbed elevation was degraded and the block became exposed at water level.
If we observe the natural condition of riverbanks carefully, we can get some hint about proper riverbank protection. We do not only use natural stones, but also have to design both lateral and longitudinal cross-sections of revetments that mimic the regional topography. At the same time, mor-phological transition should be predicted.
3.6 Flow regime in an urbanized river basin
Fig. 3.15 shows the Shakujii River that runs through Tokyo. In urban riv-ers, the revetment is like a cliff and the water surface is a long way down from the ground level. The photograph was taken four days after a very big typhoon, so the water level was much higher than the usual condition, but it is still quite lower than ground level. Even if steps are installed, as shown in the picture, it is not very easy to get to the riverfront. The impor-tant point is why this kind of structure is necessary in urban rivers. In order to examine the reason, we have to focus on the characteristics of the dis-charge in urban rivers. Therefore we have to examine this topic from the perspective of river basin management.
Fig. 3.16 shows the flow regime of the drainage basin of two adjacent rivers that are the branches of the Tama River that runs through Tokyo. One is called the Aki River and the other is called the Asa River. Their drainage basin areas are almost the same. Within the Asa River basin is Hachioji city and rapid urbanization occurred in this region around 1970. Now, 43% of the whole river basin is covered by artificial structures such as houses, buildings and so on.
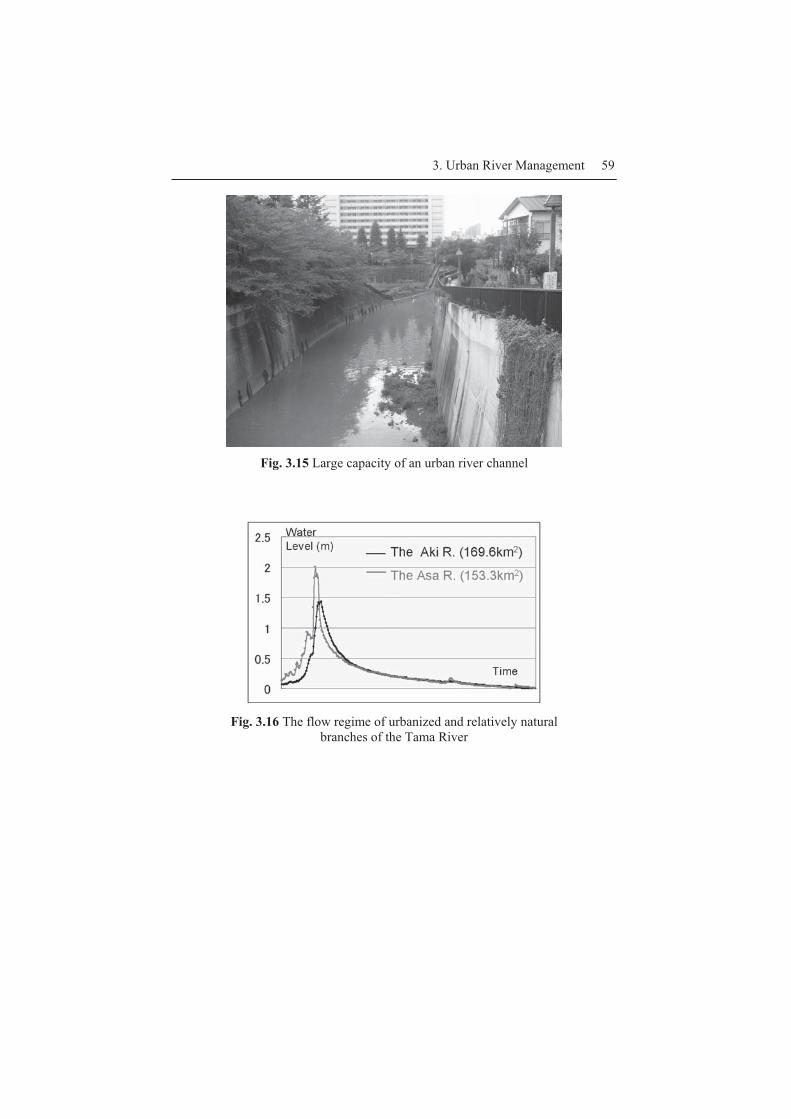
3. Urban River Management 59
Fig. 3.15 Large capacity of an urban river channel
Fig. 3.16 The flow regime of urbanized and relatively natural
branches of the Tama River
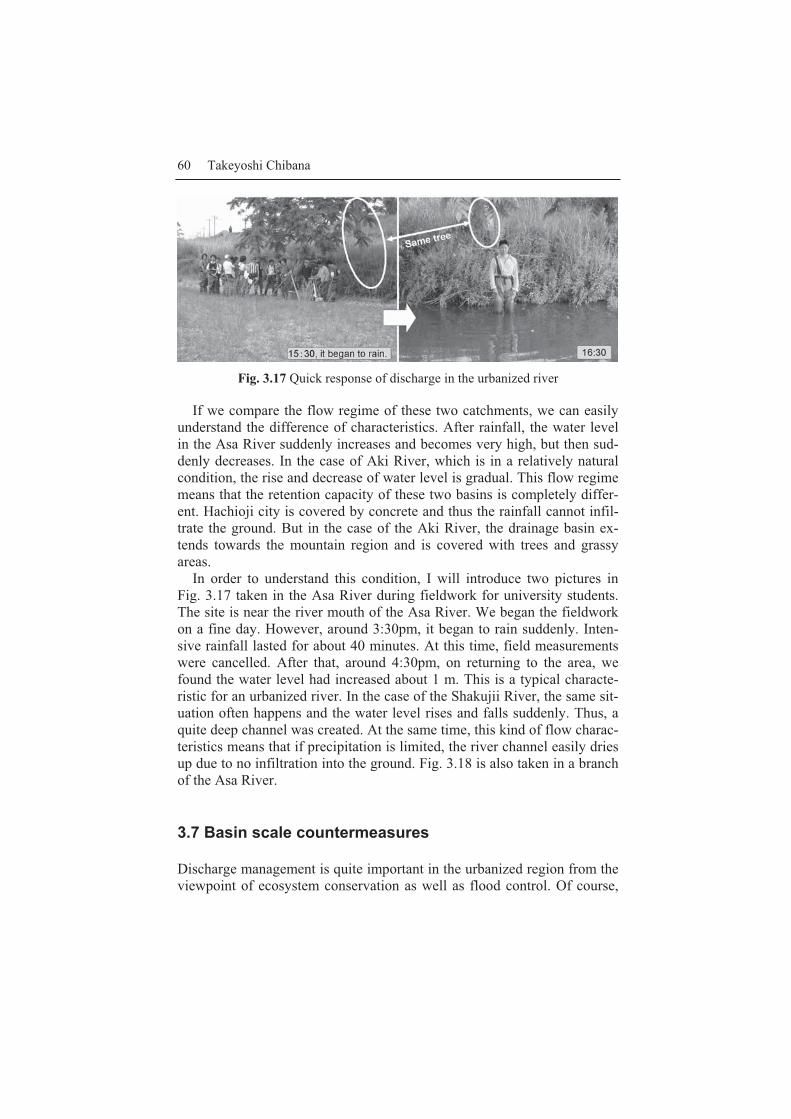
60 Takeyoshi Chibana
Fig. 3.17 Quick response of discharge in the urbanized river
If we compare the flow regime of these two catchments, we can easily understand the difference of characteristics. After rainfall, the water level in the Asa River suddenly increases and becomes very high, but then sud-denly decreases. In the case of Aki River, which is in a relatively natural condition, the rise and decrease of water level is gradual. This flow regime means that the retention capacity of these two basins is completely differ-ent. Hachioji city is covered by concrete and thus the rainfall cannot infil-trate the ground. But in the case of the Aki River, the drainage basin ex-tends towards the mountain region and is covered with trees and grassy areas.
In order to understand this condition, I will introduce two pictures in Fig. 3.17 taken in the Asa River during fieldwork for university students. The site is near the river mouth of the Asa River. We began the fieldwork on a fine day. However, around 3:30pm, it began to rain suddenly. Inten-sive rainfall lasted for about 40 minutes. At this time, field measurements were cancelled. After that, around 4:30pm, on returning to the area, we found the water level had increased about 1 m. This is a typical characte-ristic for an urbanized river. In the case of the Shakujii River, the same sit-uation often happens and the water level rises and falls suddenly. Thus, a quite deep channel was created. At the same time, this kind of flow charac-teristics means that if precipitation is limited, the river channel easily dries up due to no infiltration into the ground. Fig. 3.18 is also taken in a branch of the Asa River.
3.7 Basin scale countermeasures
Discharge management is quite important in the urbanized region from the viewpoint of ecosystem conservation as well as flood control. Of course,
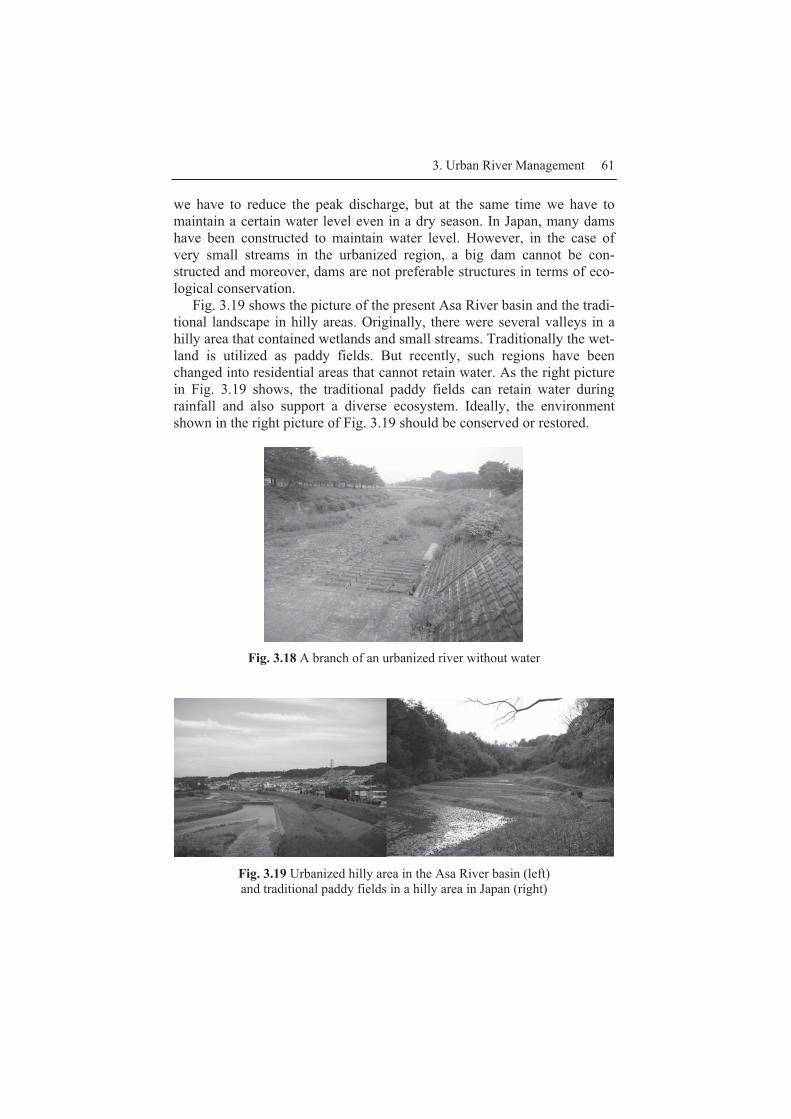
3. Urban River Management 61
we have to reduce the peak discharge, but at the same time we have to maintain a certain water level even in a dry season. In Japan, many dams have been constructed to maintain water level. However, in the case of very small streams in the urbanized region, a big dam cannot be con-structed and moreover, dams are not preferable structures in terms of eco-logical conservation.
Fig. 3.19 shows the picture of the present Asa River basin and the tradi-tional landscape in hilly areas. Originally, there were several valleys in a hilly area that contained wetlands and small streams. Traditionally the wet-land is utilized as paddy fields. But recently, such regions have been changed into residential areas that cannot retain water. As the right picture in Fig. 3.19 shows, the traditional paddy fields can retain water during rainfall and also support a diverse ecosystem. Ideally, the environment shown in the right picture of Fig. 3.19 should be conserved or restored.
Fig. 3.18 A branch of an urbanized river without water
Fig. 3.19 Urbanized hilly area in the Asa River basin (left) and traditional paddy fields in a hilly area in Japan (right)
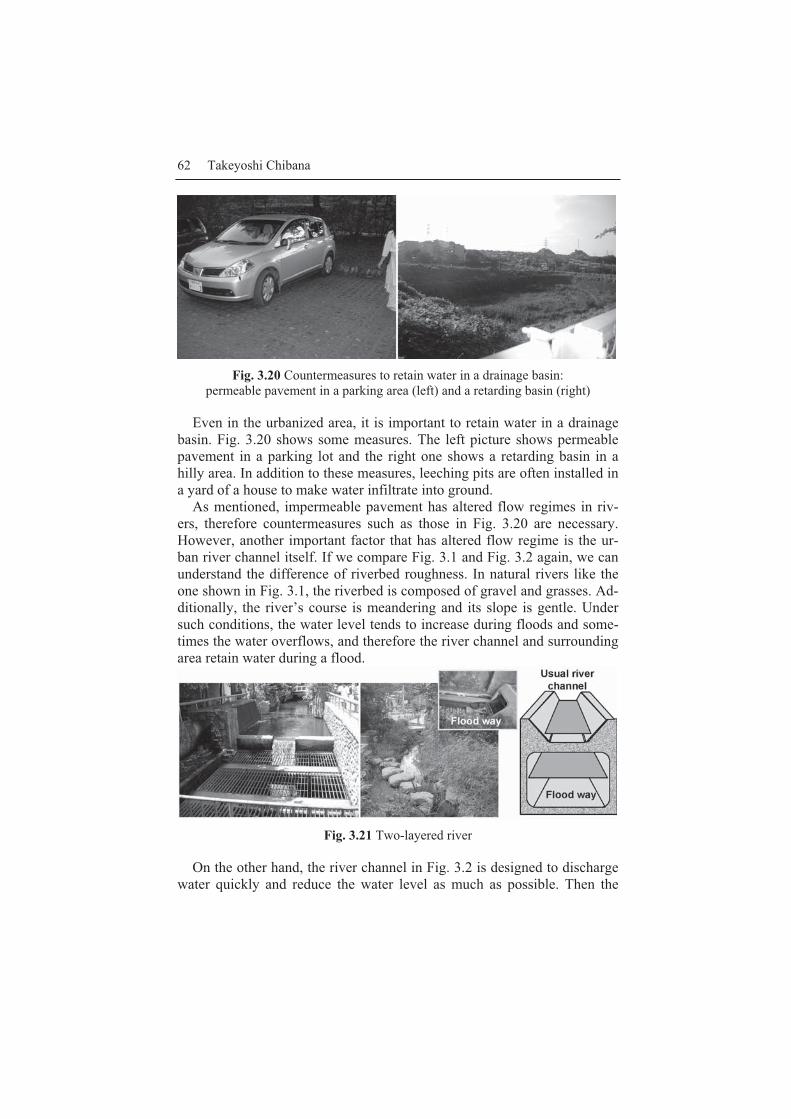
62 Takeyoshi Chibana
Fig. 3.20 Countermeasures to retain water in a drainage basin:
permeable pavement in a parking area (left) and a retarding basin (right)
Even in the urbanized area, it is important to retain water in a drainage basin. Fig. 3.20 shows some measures. The left picture shows permeable pavement in a parking lot and the right one shows a retarding basin in a hilly area. In addition to these measures, leeching pits are often installed in a yard of a house to make water infiltrate into ground.
As mentioned, impermeable pavement has altered flow regimes in riv-ers, therefore countermeasures such as those in Fig. 3.20 are necessary. However, another important factor that has altered flow regime is the ur-ban river channel itself. If we compare Fig. 3.1 and Fig. 3.2 again, we can understand the difference of riverbed roughness. In natural rivers like the one shown in Fig. 3.1, the riverbed is composed of gravel and grasses. Ad-ditionally, the river’s course is meandering and its slope is gentle. Under such conditions, the water level tends to increase during floods and some-times the water overflows, and therefore the river channel and surrounding area retain water during a flood.
Fig. 3.21 Two-layered river
On the other hand, the river channel in Fig. 3.2 is designed to discharge water quickly and reduce the water level as much as possible. Then the
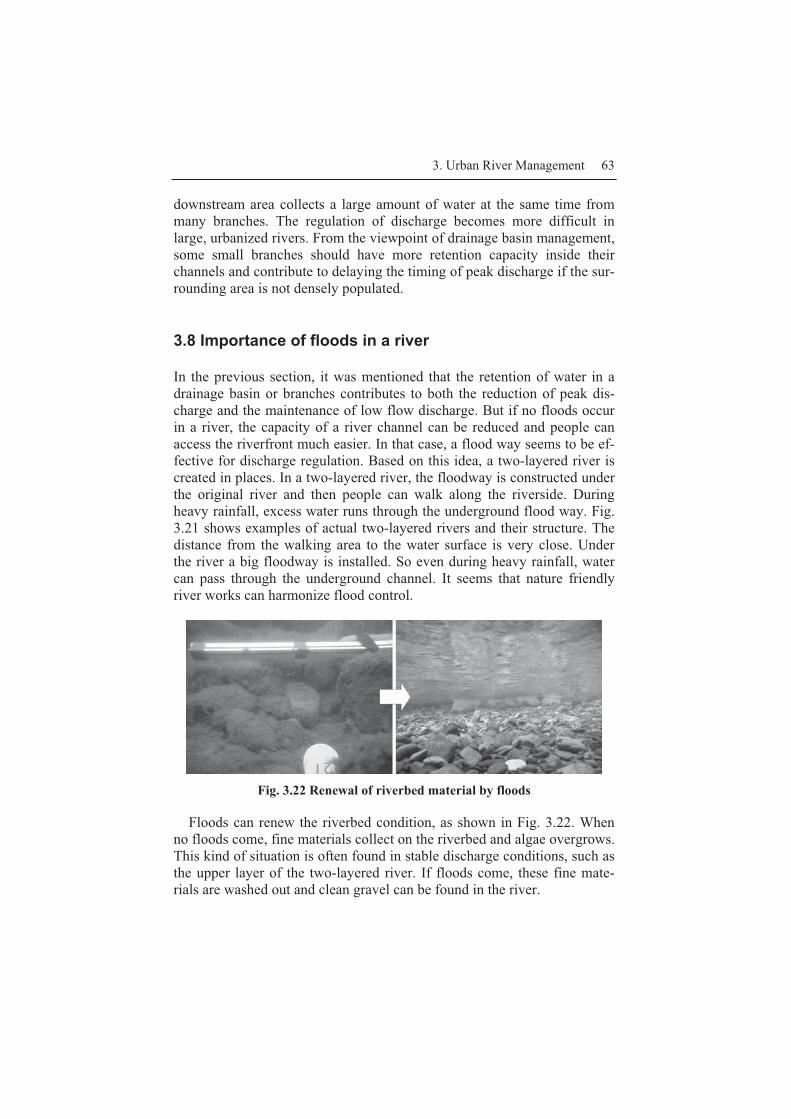
3. Urban River Management 63
downstream area collects a large amount of water at the same time from many branches. The regulation of discharge becomes more difficult in large, urbanized rivers. From the viewpoint of drainage basin management, some small branches should have more retention capacity inside their channels and contribute to delaying the timing of peak discharge if the sur-rounding area is not densely populated.
3.8 Importance of floods in a river
In the previous section, it was mentioned that the retention of water in a drainage basin or branches contributes to both the reduction of peak dis-charge and the maintenance of low flow discharge. But if no floods occur in a river, the capacity of a river channel can be reduced and people can access the riverfront much easier. In that case, a flood way seems to be ef-fective for discharge regulation. Based on this idea, a two-layered river is created in places. In a two-layered river, the floodway is constructed under the original river and then people can walk along the riverside. During heavy rainfall, excess water runs through the underground flood way. Fig. 3.21 shows examples of actual two-layered rivers and their structure. The distance from the walking area to the water surface is very close. Under the river a big floodway is installed. So even during heavy rainfall, water can pass through the underground channel. It seems that nature friendly river works can harmonize flood control.
Fig. 3.22 Renewal of riverbed material by floods
Floods can renew the riverbed condition, as shown in Fig. 3.22. When no floods come, fine materials collect on the riverbed and algae overgrows. This kind of situation is often found in stable discharge conditions, such as the upper layer of the two-layered river. If floods come, these fine mate-rials are washed out and clean gravel can be found in the river.

64 Takeyoshi Chibana
Another problem is the succession of river ecosystem. If there are no disturbances, those who can go ahead of the competition can thrive. Then the diversity in a river decreases. This situation can be explained by a very simple equation. This equation is called a Logistic Equation and is shown below:
)1(K�r�
dtd�
�� (1)
where “r” is the rate of increase, “N” is the number of individuals, and “K” is the carrying capacity.
This equation is used to predict the number of individuals. For example, if we take an area with no vegetation and put in one species, we can esti-mate how the area will be covered with vegetation. Based on this equation, the number of trees, for example, increases rapidly at first, but due to the second term (1-N/K), the increasing ratio will gradually decrease. Finally, the number of individuals will correspond to K. This equation is utilized for the case of one species, and does not account for interaction among several species.
However, if we consider competition among several species, the Lotka-Volterra Equation shown below is utilized:
)1(1
21111
1
K���r
dtd� ��
�� (2)
)1(2
12222
2
K���r
dtd� ��
�� (3)
The structure of the equation is almost the same as the Logistic Equa-tion, but the term �is a competition coefficient. The number of N2 affects the increasing ratio of N1 and vice versa. Then, the number of trees is si-mulated by using these equations. In the simulation, it was assumed that there were two species: pioneer (N1) and competitor (N2). The pioneer is the species that can grow rapidly even in a barren area. So the increasing ratio r1 is large. In the case of competitor, the increasing ratio r2 is not so large but they can go ahead of the competition. In the case of competition between these two species, the number of trees will change as shown in the left of Fig. 3.23. Initially, both two species increase, then the N1 species will decrease and ultimately will become extinct due to the competition. The N2 species then attains a stable number. This kind of competition is of-ten found in actual rivers without disturbances. Ultimately, the river chan-

3. Urban River Management 65
nel will be covered by the stronger species. This is called succession. Thus the diversity of the ecosystem is diminished.
However, if we assume disturbance as shown in the right side of Fig. 3.23, the trend becomes different. In that case, the pioneer species will be able to live for a long time and the competitive species will not be able to cover the whole area. As this simulation shows, several disturbances can retain the high diversity in natural conditions. This is also true in actual cases and if there are floods, then many species can live in the river. Thus, artificial floods are often caused by releasing water from a dam. The purpose is the improvement of the river environment’s condition and to stimulate the diversity of aquatic creatures. Another important purpose of the artificial flood is to restore river topography. Artificial floods can re-move fine deposited particles and gravel and create a sand beach at the ri-verside.
Fig. 3.23 The behavior of the Lotka-Volterra Equation
3.9 Perspectives on urban river management harmonizing with river ecosystem conservation
In this chapter, measures for river ecosystem conservation have been in-troduced on several scales. Ideally, a river without any artificial structures is the best condition for aquatic creatures, but this is impossible in urba-nized areas. In urban rivers, the design of revetments is quite important. In order to make local citizens take an interest in the river, some approaches to the riverfront are essential. Otherwise, people estimate the river condi-tion by focusing just on revetments. Anyway, the improvement of revet-ments is essential.
In order to mitigate the negative effect of revetments on aquatic crea-tures, we have to mimic natural bank conditions that are regionally specif-ic. The diversity of the revetment type in the flow direction is very impor-

66 Takeyoshi Chibana
tant, but is not often taken into account. Moreover, a prediction of topo-graphical change is necessary when revetments are installed.
For appropriate design of river channels, discharge regulation is an im-portant issue. However, we have to focus on the whole drainage basin for discharge management. Sometimes, two-layered rivers or dams are effec-tive countermeasures, but floods are also important events that sustain the diversity of aquatic creatures. The key point in discharge regulation is how and where storm water should be retained. Conservation of rice paddies and the installation of permeable pavement are important, but at the same time retention capacity inside a river channel should be improved. In some places, the capacity of the river channel can be increased in order to store water during floods and delay the timing of peak discharge.
4. Development of Coastal Urban Regions with Sustainable Topographical Environments
Shinji Sato
Department of Civil Engineering, The University of Tokyo 7-3-1, Hongo, Bunkyo-ku, Tokyo, 113-8656, Japan
4.1 Importance of Water Management for Human Beings
Water is one of the most important elements in the ecological system. Since the pre-historic age, human beings have tended to live near water due to the convenience in water usage for their daily needs. It is true that most of the ancient civilizations began in areas enriched with water re-sources. This implies that sustainable water management has been one of the essential keys in human society’s development. On the other hand, however, the history of this development is also one of struggle against natural disasters due to water. Besides all the privileges that we attain from water, we also have to remember the disastrous aspect of water and manage it well to achieve a safe and comfortable society.
Recently the world has experienced two historic natural disasters. The first was the Indian Ocean Tsunami on December 26, 2004, which devas-tated coastal settlements around the Indian Ocean and killed more than 200,000 people. The other was storm surge due to Hurricane Katrina on August 31, 2005, which inundated New Orleans and nearby areas in the United States. In Japan, frequent attacks of typhoons generate extraordi-nary floods, such as the Kurokura River Flood in August 2001 and the Ma-ruyama River Flood in October 2004. Heavy rainfall also triggers debris flows in mountainous region, carrying huge amounts of sediment together with the water. In order to utilize the benefits of water in human society

68 Shinji Sato
without suffering the damage that water can bring, such disastrous aspects of water behavior should be understood.
Japan is considered to be prone to various natural disasters, owing to its geographical and geological conditions. Fig.4.1 shows the number of deaths due to natural disasters in Japan over the past 60 years (Disaster Prevention White Paper 2007). The horizontal axis represents the time af-
Fig. 4.1. Number of deaths due to natural disasters in Japan
ter the end of the World War II and the vertical axis represents the number of deaths by the natural disasters. A large number of deaths can be seen during the post-war period. This is due to two possible reasons. The first is the frequent occurrence of large earthquakes and typhoons in this period. The second is the lack of disaster mitigation management, as well as of fi-nancial support for land management. Meanwhile, it should be noted that the post-war investment in disaster mitigation has possibly increased the safety level and successfully decreased the number of deaths. The details of the number of deaths due to various disasters (Disaster Prevention

4. Development of Coastal Urban Regions 69
White Paper 2007) indicates that earthquakes produce an extraordinary number of victims but their frequency is relatively low. It is also noted that the damage of earthquakes is more locally concentrated than other natural disasters. Meanwhile natural disasters due to wind, flood and snow are more frequent, although the number of deaths in any one event is not as high as those caused by an earthquake. Although the number of deaths due to wind, flood and snow disasters has decreased owing to post-war in-vestment in disaster mitigation, it still remains at a significant level.
4.2 Coastal Zone Management
As described above, waterfront areas have been among the first zones uti-lized for the development of cities. Among waterfront areas, coastal areas are of particular importance and many of the world’s mega-cities have de-veloped in the coastal zone, such as New York, Shanghai, Tokyo, Osaka and Nagoya. The coastal zone is unique and valuable in the sense that it serves as a buffer zone for various physical, chemical and biological processes among the atmospheric, the aquatic and the terrestrial zones. Various materials are transported within these zones, helping to maintain its sustainability. From an ecological perspective, the coastal zone is a unique and rich ecosystem with various fauna and flora. Without the coastal zone, some species would fail to maintain their life cycles. A typi-cal and famous example is the turtle, which cannot lay its eggs in the sand unless sandy beaches of a moderate size are preserved. In respect to hu-man activities, the coastal zone has many different uses, including tourism, industry and recreation. We have to remember that the environment in the coastal zone is also highly variable and fragile. Waves and currents vary greatly between storm and moderate conditions; winds and temperature can change significantly between day and night. In order to maintain the coastal zone as an attractive and safe zone, we need to develop technolo-gies for disaster mitigation, since the coastal zone is highly sensitive to even slight changes in the environment and is prone to natural hazards such as inundation and erosion by storm waves and tsunamis.
Human activities have increased in scope and scale in the last century. Significant anthropogenic impacts on the coastal zone are observed in many areas, such as sea level rise due to global climate change, erosion due to the imbalance in sediment budget and eutrophication due to the ac-cumulation of nutrients. It is essential to understand characteristics of ma-terial flow within coastal zones and develop technologies for utilization,
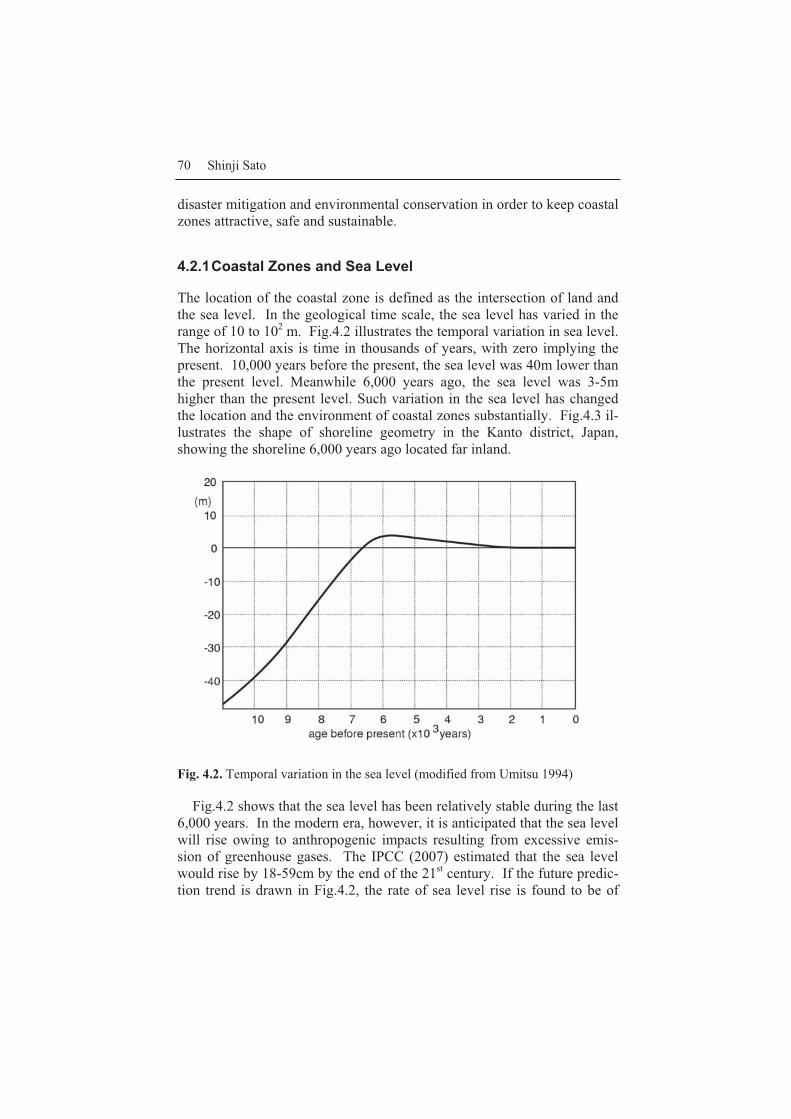
70 Shinji Sato
disaster mitigation and environmental conservation in order to keep coastal zones attractive, safe and sustainable.
4.2.1 Coastal Zones and Sea Level
The location of the coastal zone is defined as the intersection of land and the sea level. In the geological time scale, the sea level has varied in the range of 10 to 102 m. Fig.4.2 illustrates the temporal variation in sea level. The horizontal axis is time in thousands of years, with zero implying the present. 10,000 years before the present, the sea level was 40m lower than the present level. Meanwhile 6,000 years ago, the sea level was 3-5m higher than the present level. Such variation in the sea level has changed the location and the environment of coastal zones substantially. Fig.4.3 il-lustrates the shape of shoreline geometry in the Kanto district, Japan, showing the shoreline 6,000 years ago located far inland.
Fig. 4.2. Temporal variation in the sea level (modified from Umitsu 1994)
Fig.4.2 shows that the sea level has been relatively stable during the last 6,000 years. In the modern era, however, it is anticipated that the sea level will rise owing to anthropogenic impacts resulting from excessive emis-sion of greenhouse gases. The IPCC (2007) estimated that the sea level would rise by 18-59cm by the end of the 21st century. If the future predic-tion trend is drawn in Fig.4.2, the rate of sea level rise is found to be of

4. Development of Coastal Urban Regions 71
similar rate as 10,000 years ago. Establishment of a careful monitoring system and a precautious strategy is urgent.
In addition to the sea level rising, drastic changes in the coastal zone en-vironment have been observed due to rapid urbanization. Such changes are classified into two types: those by direct pressure of urbanization near large coastal cities mostly located in large bays and those observed on coasts facing the ocean owing to the rapid deformation of coastal topogra-phy. Typical examples will be discussed below.
Fig. 4.3. Shoreline geometries in Kanto area, Japan (extracted from Japan Associ-ation for Quaternary Research 1987)
4.2.2 Rapid Change in Coastal Environments due to Urbanization
Fig.4.4 shows the topography of the waterfront area of northern Tokyo Bay. The dark area in the upper part represents lowland below sea level. The lowland was created by the alluvial deposits of the old Tonegawa Riv-
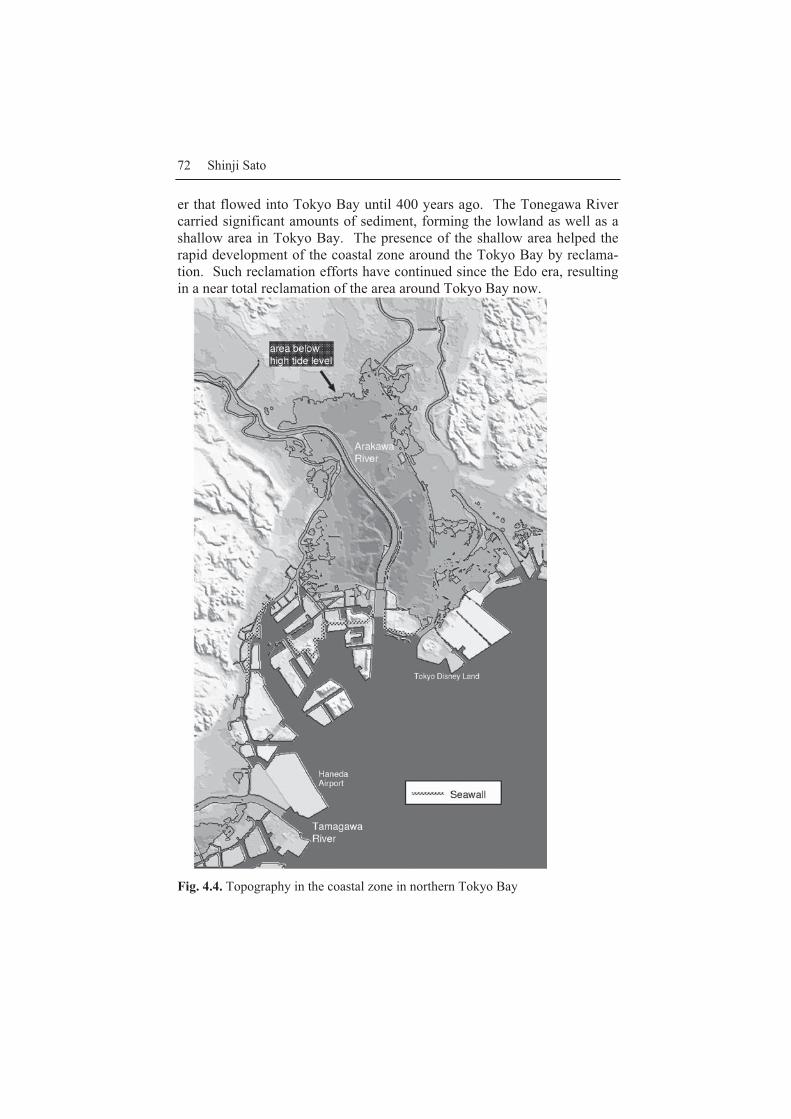
72 Shinji Sato
er that flowed into Tokyo Bay until 400 years ago. The Tonegawa River carried significant amounts of sediment, forming the lowland as well as a shallow area in Tokyo Bay. The presence of the shallow area helped the rapid development of the coastal zone around the Tokyo Bay by reclama-tion. Such reclamation efforts have continued since the Edo era, resulting in a near total reclamation of the area around Tokyo Bay now.
Fig. 4.4. Topography in the coastal zone in northern Tokyo Bay

4. Development of Coastal Urban Regions 73
A typical example of how urbanization changes the bay-front area is found in Fig.4.5, showing the coastal zone near the Tokyo Disneyland lo-cated at the mouth of the Edogawa River. The old picture was taken in 1947 and the new picture in 1997. Large areas have been reclaimed over these fifty years, including the land on which Tokyo Disneyland has been built. It should also be noted that the mouth of the Edogawa River is the river mouth of the old Tonegawa River. In the Edo era, some four hundred years ago, the government changed the route of the Tonegawa River in or-der to avoid flooding in Edo and to enhance water transport. The route was changed to an eastern route flowing into the Pacific Ocean. The route change successfully enhanced development of the waterfront area of Edo, and contributed to the modern urbanization of Tokyo as seen in Fig.4.5. However, the rapid development brought about two risks for the coastal zone; water quality degradation and a greater potential risk for storm surge.
Fig. 4.5. Comparison of the Edogawa River mouth in 1947 and 1997
Water quality degradation
In the shallow zone at the northern part of Tokyo Bay, reclamation was ac-complished using sediment dredged from the seabed of the shallow area. As a result, deep trenches were created, in which the seawater stayed with stratification. At the bottoms of the trenches, oxygen is depleted by the nutrient overload from urbanized areas as well as by the accumulation of detritus of phytoplankton. Sometimes the bottom water becomes anoxic with the production of hydrogen sulfide. The anoxic sea water is upwelled

74 Shinji Sato
by strong northern winds, mostly dominant in early autumn, producing milky blue sea water due to oxidization of hydrogen sulfide and killing fish and benthic animals on the shallow sea bed (Sasaki and Isobe 2000). The presence of anoxic water is observed in a wide area in Tokyo Bay ow-ing to rapid urbanization.
Risk of storm surge
We also have to pay attention to the possibility of disastrous events in the Tokyo Bay zone. For example, when a typhoon generates strong southern winds, the sea level will rise, especially at the northern end of the bay. This is the mechanism of storm surge caused by typhoons or strong winds.
Storm surge is an event where the sea level will be raised by a huge low-pressure system, such as typhoons and hurricanes. There are two me-chanisms for the sea level rising in the storm surge. The first mechanism develops because of low pressure in the atmosphere. Atmospheric pres-sure at the centre of the typhoon is usually lower by several tens hPa com-pared with the average atmospheric pressure. Thus the sea level will be raised in order to compensate for the imbalance in atmospheric pressure. The decrease in the atmospheric pressure by 1hPa will elevate the sea level by approximately 1 cm.
The second mechanism is related to the wind stress exerted on the sea surface. In order to balance the wind stress, the sea level should be ele-vated on the downdrift side of the wind. Consider a body of water in a bay exposed to wind as illustrated in Fig.4.6. The sea level rise �� at the end of the bay can be calculated by:
ghls
� ��
Fig. 4.6. Mechanism for storm surge
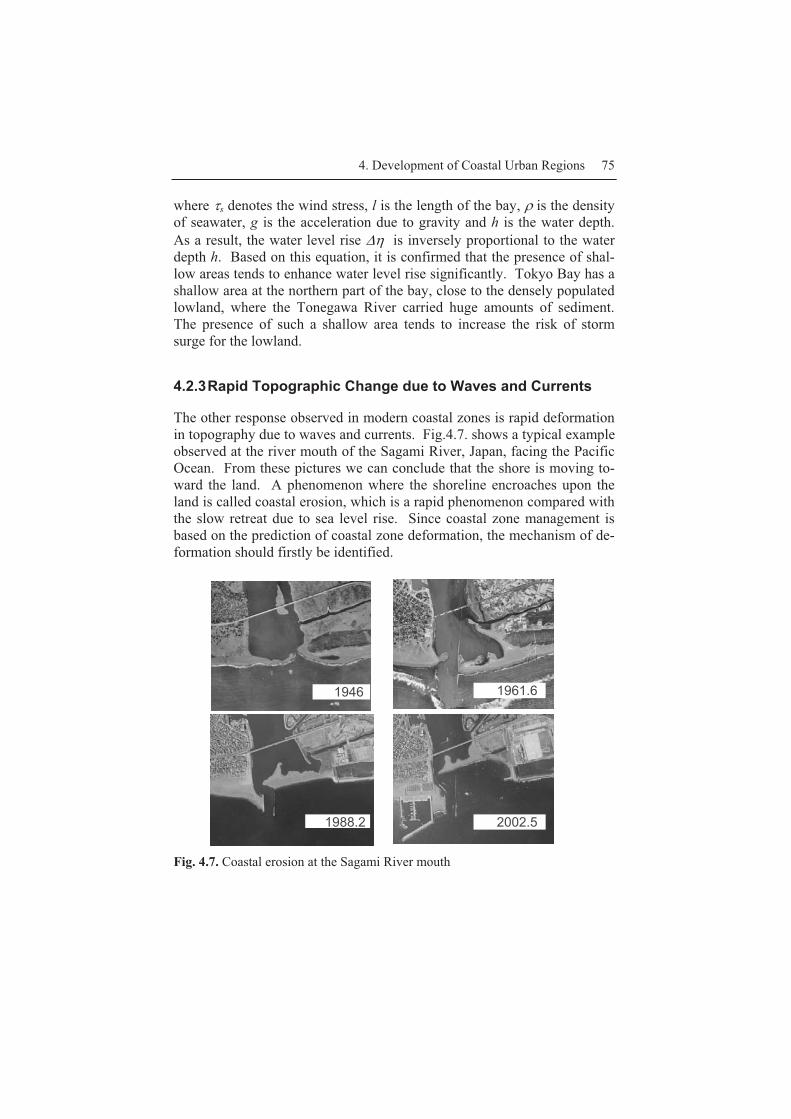
4. Development of Coastal Urban Regions 75
where s denotes the wind stress, l is the length of the bay, is the density of seawater, g is the acceleration due to gravity and h is the water depth. As a result, the water level rise �� is inversely proportional to the water depth h. Based on this equation, it is confirmed that the presence of shal-low areas tends to enhance water level rise significantly. Tokyo Bay has a shallow area at the northern part of the bay, close to the densely populated lowland, where the Tonegawa River carried huge amounts of sediment. The presence of such a shallow area tends to increase the risk of storm surge for the lowland.
4.2.3 Rapid Topographic Change due to Waves and Currents
The other response observed in modern coastal zones is rapid deformation in topography due to waves and currents. Fig.4.7. shows a typical example observed at the river mouth of the Sagami River, Japan, facing the Pacific Ocean. From these pictures we can conclude that the shore is moving to-ward the land. A phenomenon where the shoreline encroaches upon the land is called coastal erosion, which is a rapid phenomenon compared with the slow retreat due to sea level rise. Since coastal zone management is based on the prediction of coastal zone deformation, the mechanism of de-formation should firstly be identified.
Fig. 4.7. Coastal erosion at the Sagami River mouth
1946 1961.6
1988.2 2002.5
76 Shinji Sato
4.3 Prediction of Shoreline Deformation
Coastal zones are subject to chronic deterioration in addition to catastroph-ic events such as tsunamis and storm surge. One such chronic disaster is coastal erosion. The deformation of coastal topography can be caused by two mechanisms in terms of sediment movement: profile change due to cross-shore sediment movement and bathymetry change due to longshore sediment movement. Profile change is commonly caused by the varying directions of cross-shore movement of sediment by storm waves and mild waves. The shoreline will be eroded by storm waves since they transport more sediment from the shore to the sea. However, the eroded shore will gradually recover as successive mild waves carry sediment back to the shore. Such processes are repeated by the seasonal variation of waves and are mostly found to be reversible.
The change in the nearshore bathymetry in a large region is caused by longshore sediment transport. On the coast where the shoreline is aligned at an oblique angle to the dominant wave direction, longshore sediment transport will be dominant in the direction of the incident wave angle. In contrary to the variable direction of cross-shore transport, the direction of the longshore transport is less variable since the angle of dominant waves commonly varies only within a narrow range. Therefore, coastal deforma-tion due to longshore transport is considered to be an irreversible process in contrast to the reversible profile change due to cross-shore transport. The deformation in the nearshore bathymetry developed by the longshore transport is thus considered to be more important in the sense that it results in permanent deformation of coastal topography.
A shoreline model can predict the shoreline deformation due to the longshore transport. The model is based on the estimation of the longshore transport rate and several assumptions on the nearshore bathymetry change. Consider a beach with parallel depth contours exposed to oblique-ly incident waves as shown in Fig.4.8, where y is the alongshore coordi-nate and xs denotes the shoreline position. Among numerous formulas to estimate the longshore sand transport rate, the widely used CERC formula predicts the longshore sand transport rate by the following equation:
I = K Pl (1)
where I is the longshore sand transport rate expressed by the immersed weight of sediment. The relationship between the immersed weight trans-port rate and the volumetric transport rate is expressed by:

4. Development of Coastal Urban Regions 77
I = (s-) g (1-�v) Qy (2)
Fig. 4.8. Energy flux of oblique waves incident to coast with parallel depth con-tours
where s and are densities of sediment particles and sea water respective-ly, �v the void ratio of the sediment and Qy is the volumetric longshore sand transport rate including the volume of the void among sediment par-ticles.
On the right hand side of Equation (1), Pl represents the longshore com-ponent of the incident wave energy flux per unit length of the shore ex-pressed by:
Pl = 1/8 gHb2 cgb sin �b cos �b (3)
where Hb denotes the breaker height, cgb the group velocity at the breaking point and �b is the wave angle at the breaking point. The coefficient K (=0.77) has been calibrated by laboratory and field data (Komar and Inman 1970). The equation is based on the simple assumption that the work con-sumed by the transport of sediment in the longshore direction is propor-tional to the longshore component of energy flux of incident waves. Since the incident wave energy flux F at the breaking point is estimated by:
F = 1/8 g Hb2 cgb , (4)
the longshore component of the energy flux will be expressed by Fsin�b. Since the waves are obliquely incident at the breaking point, the energy
78 Shinji Sato
flux within two wave rays with spacing B will be incident to the shore of length B/cos�b. Therefore, the alongshore component Pl of the wave ener-gy flux incident to the unit length of shore will be expressed by Equation (3). On the other hand, the work required to transport a certain amount of sediment in the longshore direction would be proportional to I when the friction coefficient between the bed and the moving sediment particle is assumed to be constant, which leads to the relationship between I and Pl simply expressed by Equation (1).
Then, consider the nearshore bathymetry change due to the longshore sand transport. If the longshore sand transport rate Qy is constant along the shore, the nearshore bathymetry will be unchanged although sediment is transported. Such a condition is called dynamic equilibrium. However, as illustrated in Fig.4.9, the spatial variation in the longshore sand transport will result in the deformation of the coastal topography. In Fig.4.9, con-sider a narrow zone with alongshore length �y. Since the incoming sand volume within time �t is expressed by Qy�t and the outgoing sand volume by � tyyQQ yy ������ / , the sand volume loss over time �t will be-
come
tyy
Qy ���
��
(5)
By the conservation of the mass of sediment, this amount should be equal to the volume of the bathymetry change. Assuming that the cross-sectional profile of nearshore bathymetry moves horizontally only in paral-lel translation, the volume change due to the translation can be related to the change �xs in the shoreline position as:
yxh ss �� (6)
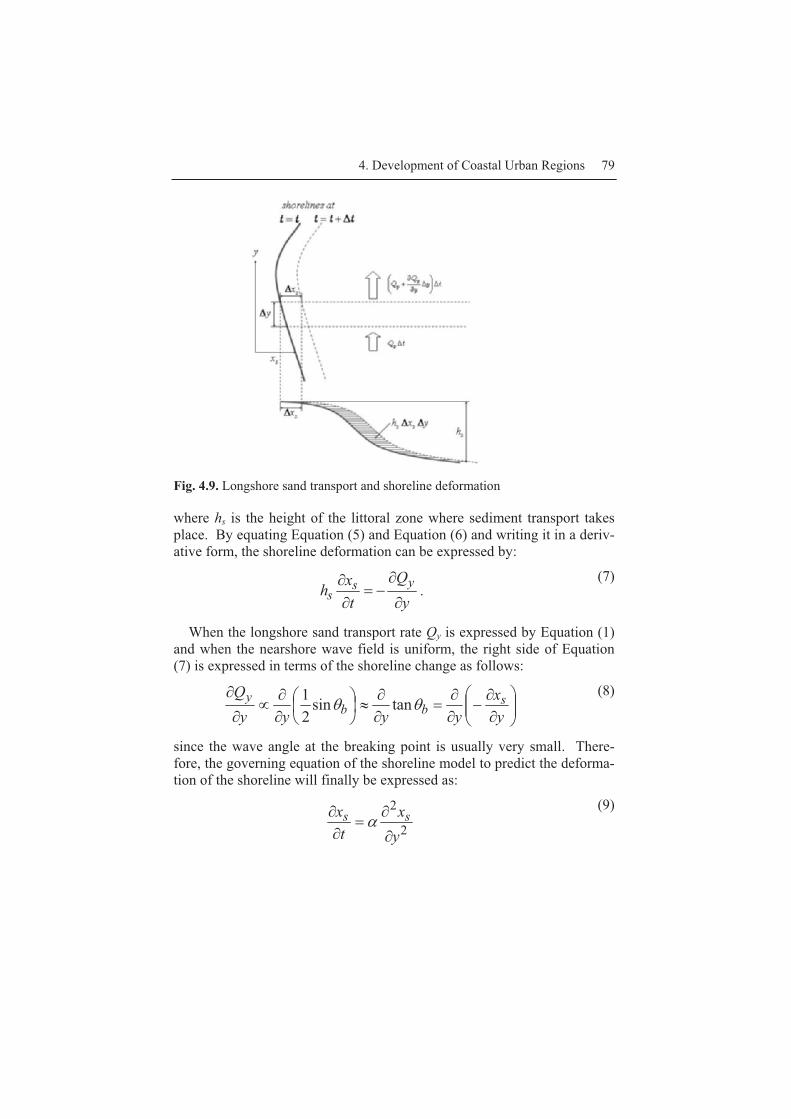
4. Development of Coastal Urban Regions 79
Fig. 4.9. Longshore sand transport and shoreline deformation
where hs is the height of the littoral zone where sediment transport takes place. By equating Equation (5) and Equation (6) and writing it in a deriv-ative form, the shoreline deformation can be expressed by:
yQ
txh ys
s �
���
��
. (7)
When the longshore sand transport rate Qy is expressed by Equation (1) and when the nearshore wave field is uniform, the right side of Equation (7) is expressed in terms of the shoreline change as follows:
���
����
���
���
���
����
���
��
��
�
yx
yyyyQ s
bby �� tansin
21
(8)
since the wave angle at the breaking point is usually very small. There-fore, the governing equation of the shoreline model to predict the deforma-tion of the shoreline will finally be expressed as:
2
2
yx
tx ss
�
��
�� �
(9)

80 Shinji Sato
where � denotes a parameter representing the wave height, the wave angle and the height of the littoral zone. Equation (9) indicates that the shoreline deformation is simulated by a one-dimensional diffusion equation.
4.4 Coastal Erosion and Its Countermeasures
Fig.4.10 illustrates the shoreline deformation near the river mouth com-puted by the shoreline model. Consider the deformation of the shoreline of an initially straight beach around a river mouth, where sediment is sup-plied by a constant rate. When the sediment supply is 300,000 m3 per year, the shoreline model predicts the formation of delta topography around the river mouth. The shape of the delta is dependent on the rate of sediment supply and the incident wave conditions. For a typical condition of incident wave height of 0.6m, the delta will gradually develop in 1000 years as shown in Fig.4.10. In 1000 years, the topography of the delta al-most reaches equilibrium where the longshore sand transport by waves al-most balances the sand supply from the river mouth. If the sediment supply from the river is 100,000 m3 per year, the convex shape of the delta will become smaller as shown in Fig.4.11. This is because the equilibrium shape of the delta is decided by the balance between the sand supply from the river and the longshore transport of sand by waves.
The dynamic response of coastal topography is revealed by considering the shoreline deformation near the river mouth. Fig.4.12 illustrates the shoreline deformation near the river mouth in 40 years starting from the shoreline at 1000 years in Fig.4.10. Since the sediment movement at the time of 1000 years nearly reaches equilibrium, the change in the shape of the shoreline is insignificant. In this situation, most of the sediment sup-plied from the river is efficiently transported longshore by the convex shape of the delta topography developed over 1000 years. On the other hand, in Fig.4.13, a rapid shoreline retreat is resulted when the sediment supply is decreased suddenly. In this figure, the sediment supply is as-sumed to decrease to 100,000 m3 per year suddenly at the time of the 1000th year. Then the shoreline starts to retreat rapidly from the region close to the river mouth as shown in Fig.4.13. The shoreline retreat in 20 years reaches as much as 50m. The speed of erosion can become very rap-id once sediment movement becomes unbalanced. Such rapid decrease in sediment supply from the river has been observed in many rivers in Japan, as well as in the world, owing to the rapid growth of human activities in the twentieth century.
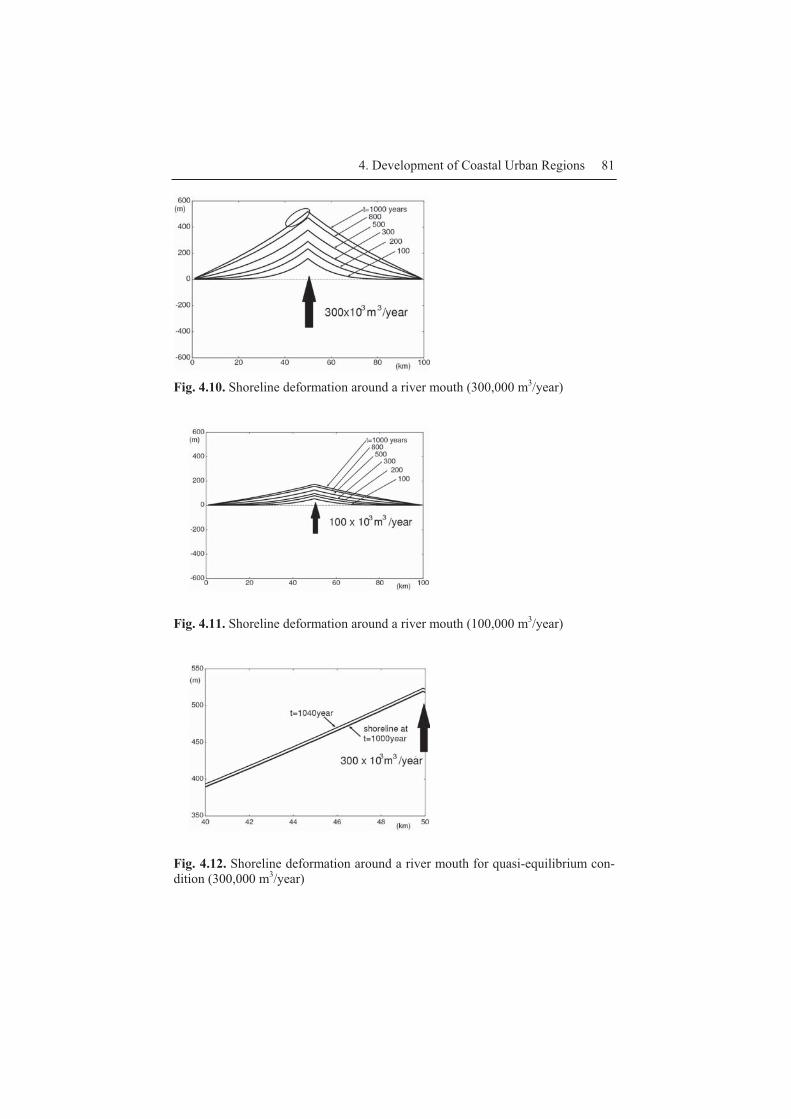
4. Development of Coastal Urban Regions 81
Fig. 4.10. Shoreline deformation around a river mouth (300,000 m3/year)
Fig. 4.11. Shoreline deformation around a river mouth (100,000 m3/year)
Fig. 4.12. Shoreline deformation around a river mouth for quasi-equilibrium con-dition (300,000 m3/year)
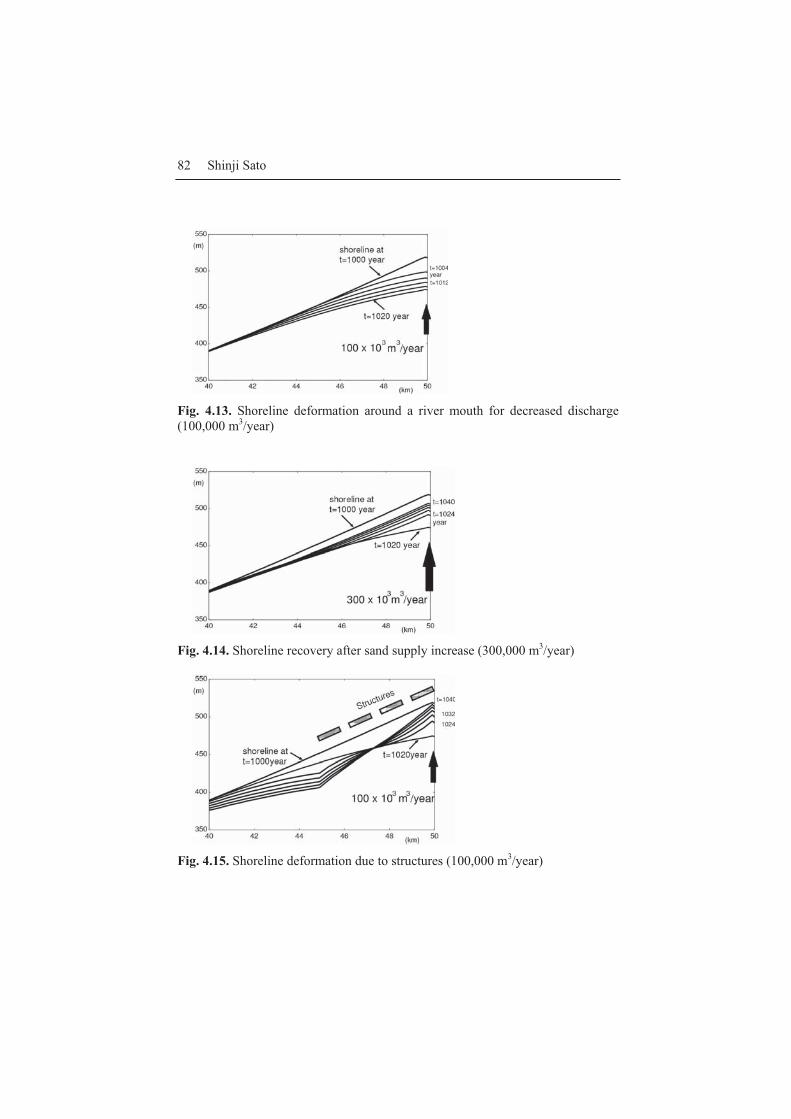
82 Shinji Sato
Fig. 4.13. Shoreline deformation around a river mouth for decreased discharge (100,000 m3/year)
Fig. 4.14. Shoreline recovery after sand supply increase (300,000 m3/year)
Fig. 4.15. Shoreline deformation due to structures (100,000 m3/year)
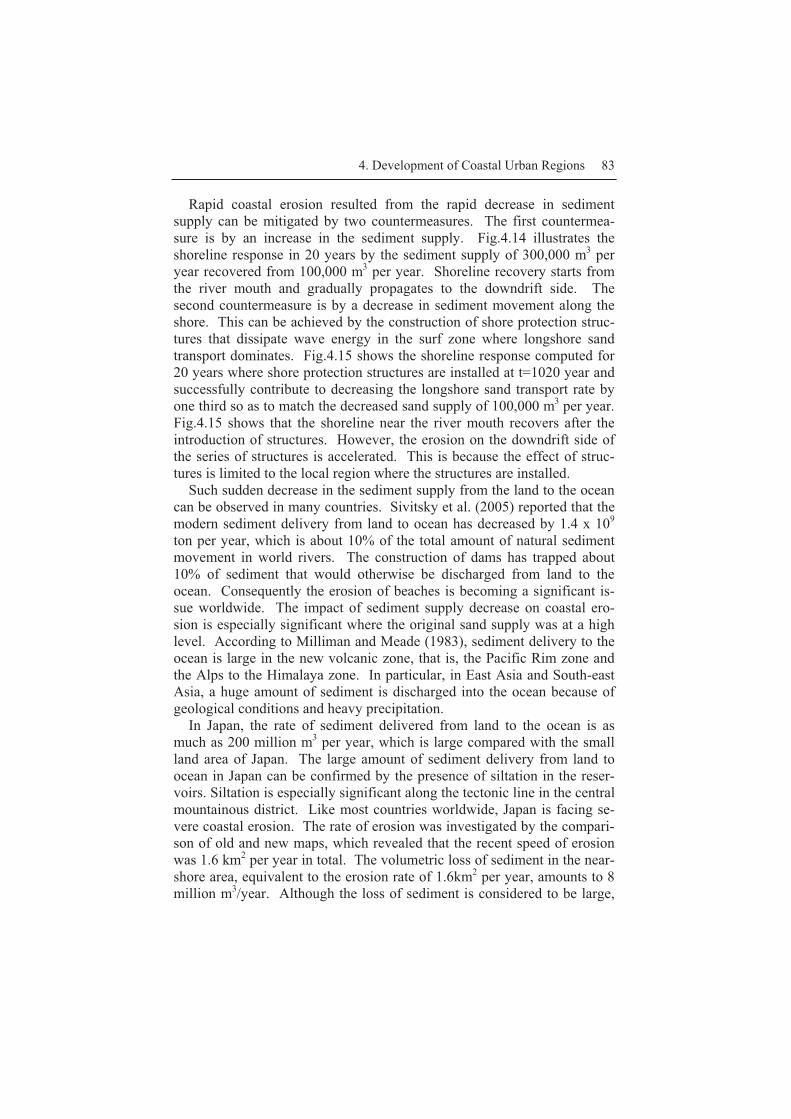
4. Development of Coastal Urban Regions 83
Rapid coastal erosion resulted from the rapid decrease in sediment supply can be mitigated by two countermeasures. The first countermea-sure is by an increase in the sediment supply. Fig.4.14 illustrates the shoreline response in 20 years by the sediment supply of 300,000 m3 per year recovered from 100,000 m3 per year. Shoreline recovery starts from the river mouth and gradually propagates to the downdrift side. The second countermeasure is by a decrease in sediment movement along the shore. This can be achieved by the construction of shore protection struc-tures that dissipate wave energy in the surf zone where longshore sand transport dominates. Fig.4.15 shows the shoreline response computed for 20 years where shore protection structures are installed at t=1020 year and successfully contribute to decreasing the longshore sand transport rate by one third so as to match the decreased sand supply of 100,000 m3 per year. Fig.4.15 shows that the shoreline near the river mouth recovers after the introduction of structures. However, the erosion on the downdrift side of the series of structures is accelerated. This is because the effect of struc-tures is limited to the local region where the structures are installed.
Such sudden decrease in the sediment supply from the land to the ocean can be observed in many countries. Sivitsky et al. (2005) reported that the modern sediment delivery from land to ocean has decreased by 1.4 x 10⁹
ton per year, which is about 10% of the total amount of natural sediment movement in world rivers. The construction of dams has trapped about 10% of sediment that would otherwise be discharged from land to the ocean. Consequently the erosion of beaches is becoming a significant is-sue worldwide. The impact of sediment supply decrease on coastal ero-sion is especially significant where the original sand supply was at a high level. According to Milliman and Meade (1983), sediment delivery to the ocean is large in the new volcanic zone, that is, the Pacific Rim zone and the Alps to the Himalaya zone. In particular, in East Asia and South-east Asia, a huge amount of sediment is discharged into the ocean because of geological conditions and heavy precipitation.
In Japan, the rate of sediment delivered from land to the ocean is as much as 200 million m3 per year, which is large compared with the small land area of Japan. The large amount of sediment delivery from land to ocean in Japan can be confirmed by the presence of siltation in the reser-voirs. Siltation is especially significant along the tectonic line in the central mountainous district. Like most countries worldwide, Japan is facing se-vere coastal erosion. The rate of erosion was investigated by the compari-son of old and new maps, which revealed that the recent speed of erosion was 1.6 km2 per year in total. The volumetric loss of sediment in the near-shore area, equivalent to the erosion rate of 1.6km2 per year, amounts to 8 million m3/year. Although the loss of sediment is considered to be large,
84 Shinji Sato
the amount is only 4% of the total sediment delivery in Japan. Therefore, mitigation countermeasures based on sediment movement control in the watershed is considered promising.
4.5 Future Visions
4.5.1 Structure or Nourishment?
Fig.4.14 and Fig.4.15 indicate that the construction of shore protection structures or the nourishment, artificial supply of sand to coast, can be considered as effective countermeasures to coastal erosion. However, the selection of countermeasures must be based on the social, natural and geo-logical conditions of each country. In Japan, for example, the rate of se-diment production from land to ocean is very large and the population is dense in the area very close to the shoreline. In the Unites States, on the other hand, sediment supply is relatively small especially on the east coast and the population concentration in the coastal zone is less significant. It is quite natural that optimum countermeasures to coastal erosion are dif-ferent depending on the situation.
Fig.4.16 shows the trend of total shore protection structures in Japan (Coast Statistics, Ministry of Land, Infrastructure and Transport, 1960-2002). Basically, shore protection was initiated by efforts to control waves and currents by structures. In the U.S., however, countermeasures by nou-rishment have increased and replaced those by structures since the 1960s. This is partly due to the increasing demand for the preservation of natural beaches and due to the natural conditions of relatively small sediment supply in the country. Nourishment can be easily applied since marine se-diment is mostly confined inside the nearshore area. Therefore coastal zone management in the sense of sustainable topography in the U.S. can be based on sand management without introducing structures. In the case of Japan, however, where sediment production is larger and the population is denser in the narrow plains close to the coast, huge amounts of sediment are required for the compensation of coastal erosion if only nourishment is considered as the countermeasure. This explains why the optimum shore protection method is different in Japan and in the U.S. However, even in Japan countermeasures to increase the sand supply to the coast should be considered in order to achieve long-term sustainability.

4. Development of Coastal Urban Regions 85
Fig. 4.16. Shore protection structures in Japan
4.5.2 Regional Sediment Management
In order to increase sediment supply from the land to the sea, sediment movement should be managed at the regional scale. Regional sediment management has been standard worldwide ever since the relationship be-tween coastal erosion and various anthropogenic impacts was recognized in the last 50 years. In Japan, as was described in the previous chapter, it is highly expected that mitigation countermeasures in the mountains may consequently lead to an increase in the sediment production from land to the ocean. Such activity has been initiated in the Tenryu River watershed, located in the central mountainous area in Japan. Sediment production in this area has historically been quite large but has decreased significantly due to the construction of a series of large dams, such as the Sakuma Dam in 1951 which led to severe coastal erosion starting from the river mouth.
Fig.4.17 shows the siltation of the reservoir of Sakuma Dam. The dam is located at point 0, and the original riverbed elevation is indicated by a thick solid line. It is noticed that siltation is progressing gradually and now it is almost approaching the dam. The rate of the siltation amounts to 1.3 million m3/year. Various countermeasures are being discussed in order
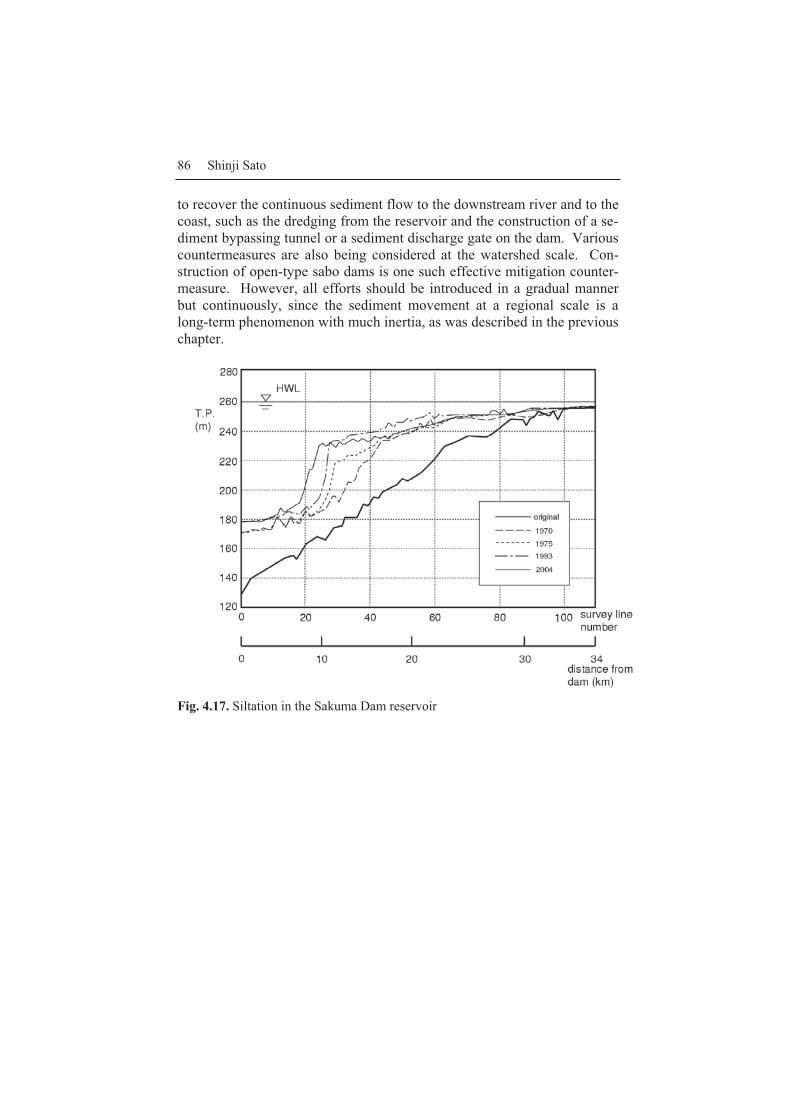
86 Shinji Sato
to recover the continuous sediment flow to the downstream river and to the coast, such as the dredging from the reservoir and the construction of a se-diment bypassing tunnel or a sediment discharge gate on the dam. Various countermeasures are also being considered at the watershed scale. Con-struction of open-type sabo dams is one such effective mitigation counter-measure. However, all efforts should be introduced in a gradual manner but continuously, since the sediment movement at a regional scale is a long-term phenomenon with much inertia, as was described in the previous chapter.
Fig. 4.17. Siltation in the Sakuma Dam reservoir

4. Development of Coastal Urban Regions 87
References
[1] IPCC (2007) WGI: Summary for Policymakers, Climate Change: The Physical Science Basis, http://www.ipcc.ch/
[2] Japanese Government: Disaster Prevention White Paper (2007) http://www.bousai.go.jp/hakusho/h19/index.htm [3] Japan Association for Quaternary Research(1987) Quaternary Maps of Japan, [4] Komar, P. and Inman, D.L.: Longshore sand transport on beaches, J. Geophys.
Res., Vol. 75, pp. 5914-5927. [5] Milliman, J.D. and Meade, R.H. (1983) World-wide delivery of river sediment
to the oceans, J. Geol., 91, 1-21 [6] Ministry of Land, Infrastructure and Transport: Coast Statistics, Japanese Gov-
ernment, 1960-2002. [7] Sasaki, J. and M. Isobe (2000) Development of a long-term predictive model
for baroclinic circulation and its application to Blue Tide phenomenon in Tokyo Bay, Proc. 27th Int. Conf. on Coastal Eng., Vol. 4, ASCE, pp. 3870-3883
[8] Syvitski, J.P.M., Vörösmarty, C.J., Kettner, A.J. and Green, P.(2005) Impact of humans on the flux of terrestrial sediments to the global coastal ocean, Science, Vol. 308, pp. 376-380
[9] Umitsu, M.(1994) Late Quaternary Environment and Landform Evolution of Riverine Coastal Lowlands, Kokin Shoin, 270p

Part II Material Flow and Risk
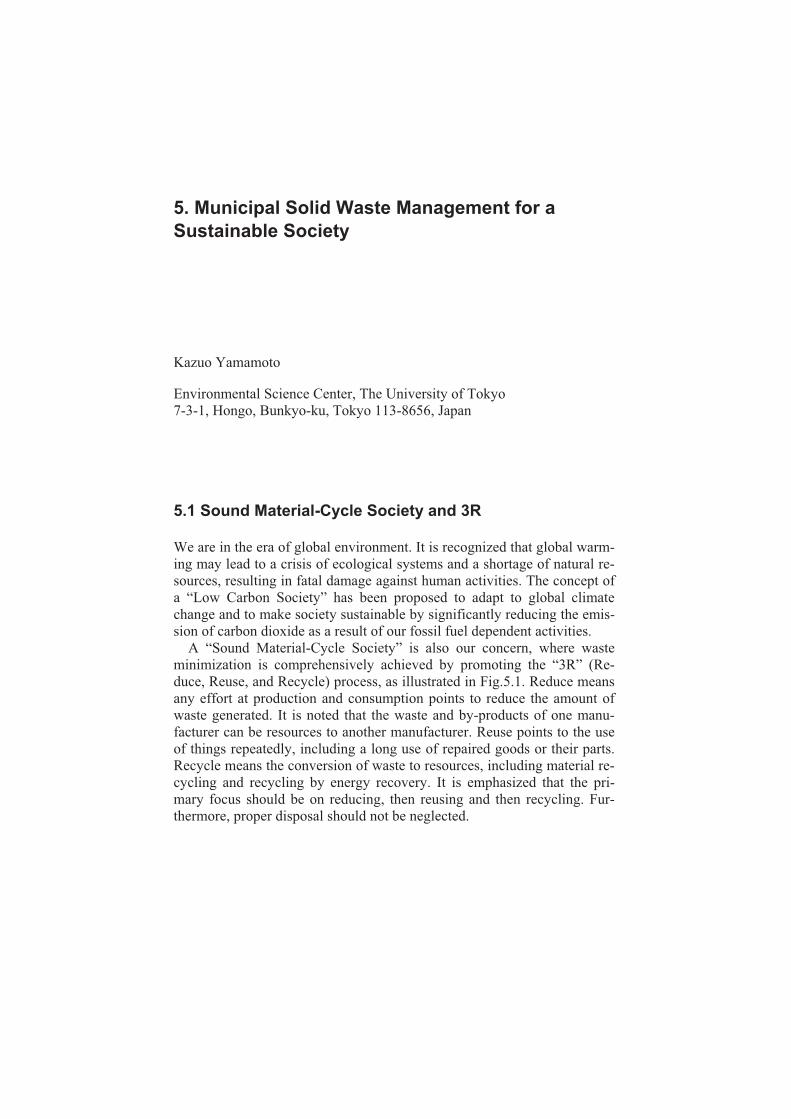
5. Municipal Solid Waste Management for a Sustainable Society
Kazuo Yamamoto
Environmental Science Center, The University of Tokyo 7-3-1, Hongo, Bunkyo-ku, Tokyo 113-8656, Japan
5.1 Sound Material-Cycle Society and 3R
We are in the era of global environment. It is recognized that global warm-ing may lead to a crisis of ecological systems and a shortage of natural re-sources, resulting in fatal damage against human activities. The concept of a “Low Carbon Society” has been proposed to adapt to global climate change and to make society sustainable by significantly reducing the emis-sion of carbon dioxide as a result of our fossil fuel dependent activities.
A “Sound Material-Cycle Society” is also our concern, where waste minimization is comprehensively achieved by promoting the “3R” (Re-duce, Reuse, and Recycle) process, as illustrated in Fig.5.1. Reduce means any effort at production and consumption points to reduce the amount of waste generated. It is noted that the waste and by-products of one manu-facturer can be resources to another manufacturer. Reuse points to the use of things repeatedly, including a long use of repaired goods or their parts. Recycle means the conversion of waste to resources, including material re-cycling and recycling by energy recovery. It is emphasized that the pri-mary focus should be on reducing, then reusing and then recycling. Fur-thermore, proper disposal should not be neglected.
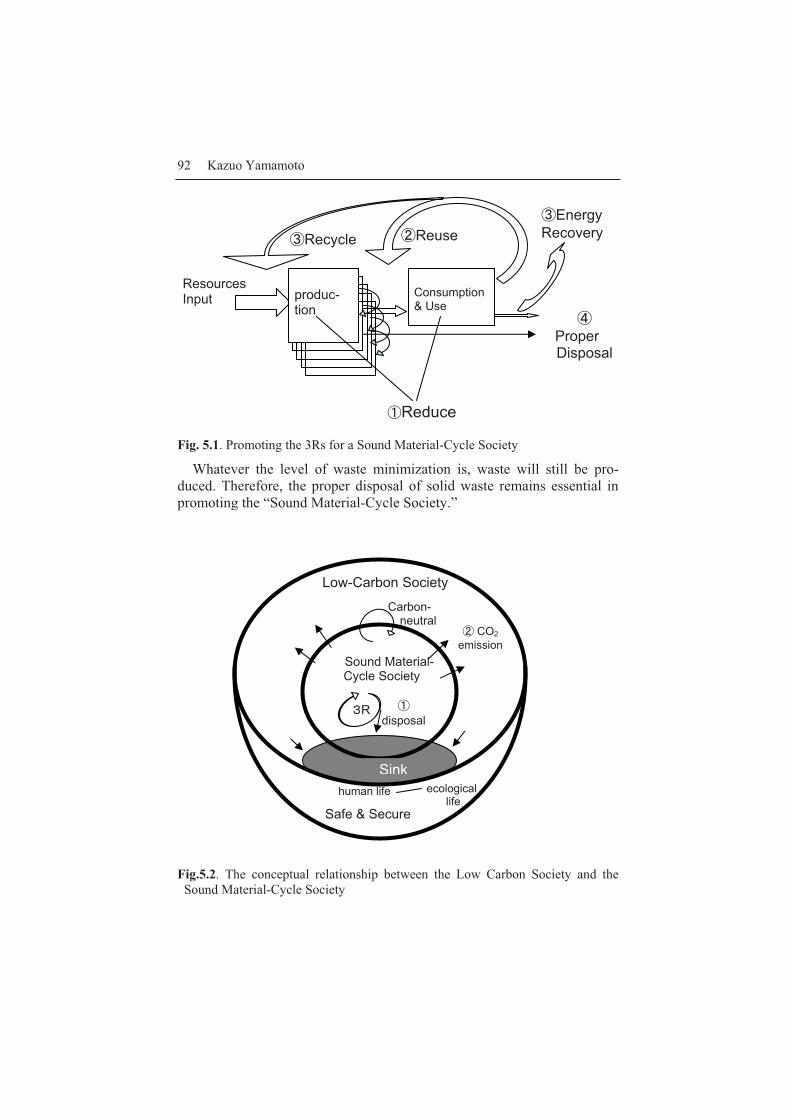
92 Kazuo Yamamoto
Fig. 5.1. Promoting the 3Rs for a Sound Material-Cycle Society
Whatever the level of waste minimization is, waste will still be pro-duced. Therefore, the proper disposal of solid waste remains essential in promoting the “Sound Material-Cycle Society.”
Fig.5.2. The conceptual relationship between the Low Carbon Society and the Sound Material-Cycle Society
DR E disposal
Safe & Secure
human life
Consumption & Use
FRecycle
GProper Disposal
produc-tion
HReuse
Resources Input
FEnergy Recovery
Low-Carbon Society
Sound Material-Cycle Society
Sink
H CO2 emission
Carbon- neutral
EReduce
ecological life

5. Municipal Solid Waste Management for a Sustainable Society 93
The 3R activities must contribute to establish the “Low Carbon Society” as well. Fig.5.2 depicts the conceptual relationship between the “Low Car-bon Society” and the “Sound Material-Cycle Society”. While it is neces-sary to establish the “Low Carbon Society” globally, the “Sound Material-Cycle Society” can be locally considered. Both the global and local soci-ety must be founded on the basis of safe and secure life of the society member
Waste minimization is usually targeted at the minimization of ‘disposal’ (Fig.5.2). If the boundary of a sound material-cycle society is the nation, for example Japan, the annual amount of ‘CO2 emission’ in Fig.5.2 is much larger in weight than that of ‘disposal’: the former was about 1,200 million tons/y while the latter was about 35 million tons/y as of FY2004 (Ministry of Environment, 2007). Too much effort to achieve so called ‘Zero Emissions’ of solid waste may result in further burden to the globe through an increase in the emission of gaseous wastes such as carbon diox-ide. Therefore, it is important to minimize waste considering the total emission outside.
Developing countries drive rapid growth of population and some of them are experiencing rapid economic growth also. These enlarge waste problems due to mass production, consumption and use of natural re-sources, and consequently lead to the environmental deterioration that de-veloped countries have already experienced. Although differences must be recognized in the situation of waste problems between developing and de-veloped countries, it is still worthwhile to consider some common issues from the lessons of the past and present problems encountered in devel-oped countries.
5.2 Municipal Solid Waste Management - Case of Japan
5.2.1 A brief summary of the modernization of municipal solid waste management
During the Edo period (1603-1868) in Japan, a nearly complete recycling system existed, as it was a typical feature of pre-industrial societies. For example, human excreta were valued as fertilizer; kitchen garbage was utilized as animal feed; straw was used after the rice harvest as fuel and raw materials for articles for daily use in farming households. Although the Edo city has densely populated, the surrounding rural area was capable

94 Kazuo Yamamoto
of recycling the waste produced in the Edo city and the cleansing of the city streets was well controlled by the Edo community.
After the Meiji Revolution (1868), industrialization eventually caused problems of waste disposal in urban areas like Tokyo. In 1900, the first waste management law (the Dirt Cleansing Law) was established to ensure sanitation in cities to prevent the spread of infectious diseases. In this law, it was clearly stated that incineration should be considered as much as pos-sible. Furthermore, the ash produced by the incineration was usually sold to farmers as fertilizer (Mizoiri 2007).This economic exchange became another incentive for the use of incineration as a modern sanitation tech-nique. This initiative formed the foundations for the establishment of a management system for municipal solid waste.
After World War II, rapid economic growth brought about a tremendous increase of municipal solid waste until the first oil shock crisis (1973). In 1954, the Public Cleansing Law was enacted, aiming at improvement of public health and the environment by establishing a municipal solid waste management system that focused on sanitary disposal of garbage and hu-man waste. However, the issue of solid waste generation was beyond the Law’s expectations and the various industrial activities had caused serious environmental pollution. This situation led to the creation of relevant laws and policies for environmental pollution control and waste management, introducing the “Polluter Pays Principle” (PPP) in which, in cases of pollu-tion, the polluter should pay the cost of the appropriate countermeasure or remediation.
As the waste generated from industrial sectors was much larger than that of municipal waste, it was recognized that the proper management of the industrial waste was of primary importance. Therefore, the Waste Man-agement Law replaced the Public Cleansing Law in 1970, clarifying the responsibilities of businesses on their industrial waste treatment, based on the PPP. In order to specify the responsibility of the waste generator, waste was classified into industrial and general waste.
Table 5.1 shows the up-to-date definition and classification of waste. Fig. 5.3 shows the changes in the amount of municipal solid waste gen-
erated in Japan. During the bubble economy (1985-1990), its generation significantly increased, then stabilized at around 50 million tons a year. In-dustrial waste generation stabilized at about 400 million tons a year in the 1990s. Recently, the 3R activities for the creation of a material-cycle ori-ented society made a turning point to reduce the municipal solid waste generation since 2000.
The modernization of municipal solid waste management progressed during the rapid economic growth period. For waste collection, for exam-ple, packer-trucks replaced manual collection. 24-hour continuous-loaded
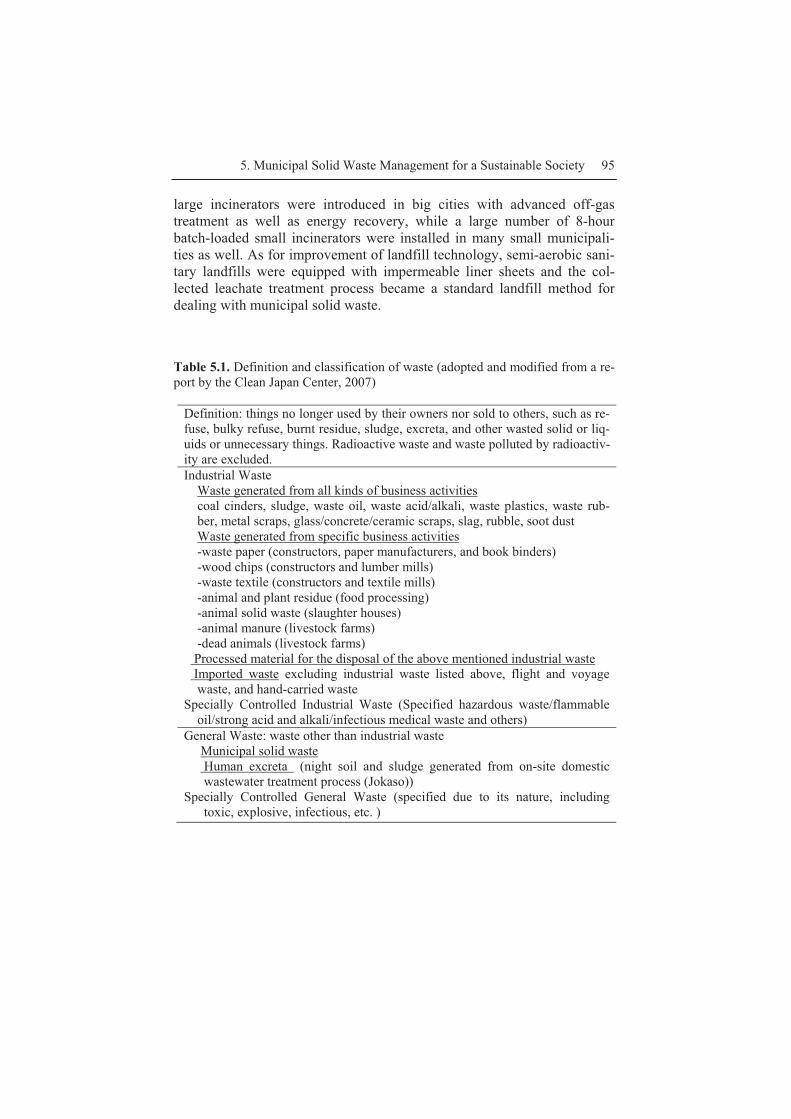
5. Municipal Solid Waste Management for a Sustainable Society 95
large incinerators were introduced in big cities with advanced off-gas treatment as well as energy recovery, while a large number of 8-hour batch-loaded small incinerators were installed in many small municipali-ties as well. As for improvement of landfill technology, semi-aerobic sani-tary landfills were equipped with impermeable liner sheets and the col-lected leachate treatment process became a standard landfill method for dealing with municipal solid waste. Table 5.1. Definition and classification of waste (adopted and modified from a re-port by the Clean Japan Center, 2007)
Definition: things no longer used by their owners nor sold to others, such as re-fuse, bulky refuse, burnt residue, sludge, excreta, and other wasted solid or liq-uids or unnecessary things. Radioactive waste and waste polluted by radioactiv-ity are excluded. Industrial Waste
Waste generated from all kinds of business activities coal cinders, sludge, waste oil, waste acid/alkali, waste plastics, waste rub-
ber, metal scraps, glass/concrete/ceramic scraps, slag, rubble, soot dust Waste generated from specific business activities -waste paper (constructors, paper manufacturers, and book binders) -wood chips (constructors and lumber mills) -waste textile (constructors and textile mills) -animal and plant residue (food processing) -animal solid waste (slaughter houses) -animal manure (livestock farms) -dead animals (livestock farms) Processed material for the disposal of the above mentioned industrial waste Imported waste excluding industrial waste listed above, flight and voyage
waste, and hand-carried waste Specially Controlled Industrial Waste (Specified hazardous waste/flammable
oil/strong acid and alkali/infectious medical waste and others) General Waste: waste other than industrial waste Municipal solid waste Human excreta (night soil and sludge generated from on-site domestic
wastewater treatment process (Jokaso)) Specially Controlled General Waste (specified due to its nature, including
toxic, explosive, infectious, etc. )

96 Kazuo Yamamoto
�
��
��
��
��
�
��
�� ���� ��� ��� �� ���� ��� ���� ��� ���� ����
?��(���I���
3��%���0
-1�5����� � 9
������� ����
����
Fig. 5.3. Changes in the amount of municipal solid waste (MSW) generated in Ja-
pan. Note: The figures for 1970 and before are calculated from the amount of the daily waste generation in the special cleansing districts based on the Public Cleansing Law. The data are adopted from a gov-ernmental report (Ministry of Environment, 2006).
Japan is among the countries with the highest incineration rates of mu-
nicipal solid waste, with levels of around 77% as of FY2004. Reasons in-clude a limited habitable land area (about 30% of the territory), and the high temperatures and humidity are non-preferable conditions for organic waste handling. Therefore, there has been a need in Japan for waste vol-ume reduction treatment that is both rapid and sanitary.
5.2.2 Public awareness and acceptance
An example for the social problems associated with waste management is Tokyo’s “Waste War” episode. In 1971, Koto Ward was the recipient of the new Yumenoshima landfill site. In previous years, neighbours of vari-ous landfill areas reported problems with increases in bird and insect popu-lations, mostly due to the presence of the uncovered waste piles during daily landfill operation. These antecedents created opposition to the pres-ence of a new landfill site and people became more sceptical about where this waste was originated. Therefore, Koto Ward refused to accept the solid waste from Suginami Ward, where residents opposed the construc-tion of a new incineration plant (Suginami Incineration Plant) to treat the waste originated in their own ward. It took nearly three years to compro-mise each other. As an outcome of this event, the problem of waste treat-
The 1st Oil ShockBubble economy
Rapid economic growth
3R activities
5. Municipal Solid Waste Management for a Sustainable Society 97
ment and disposal, associated with the “NIMBY” syndrome (Not In My Back Yard), became more obvious in society. People began to think about the enormous volume of waste generated and the necessity to introduce re-duction and recycling of waste.
Another example of the social problems created by waste disposal is the vicious circle of improper disposal, “NIMBY-ism,” and shortage of land-fill sites. The lifestyle based on mass production and mass consumption created an unexpected increase in waste volume during the high economic growth period and the consequent bubble economy period. This garbage boom, together with land limitations and its rocketing price, led to a crisis of the final disposal capacity in the country and led to so-called “illegal dumping.” Illegal dumping, the improper management of landfill sites as well, caused environmental deterioration, including groundwater contami-nation and soil pollution. Public awareness of this issue made people nerv-ous regarding the final disposal. Even though a well-controlled landfill fa-cility was planned, many local residents opposed it as a result of the “NIMBY” idea, which led to difficulty in finding a new landfill site. This again induced improper disposal, leading to a vicious circle.
In order to eliminate illegal dumping, regulatory measurers were strengthened several times by amending the Waste Management Law, mainly in the 1990s. The “Manifest” system was fully introduced to indus-trial waste, in which a document called ‘Manifest’ is used to identify all processing steps of the waste treatment until its final disposal, and the re-sponsibility of waste-generating businesses to control their waste output was strengthened throughout the treatment process, including collection, transportation, intermediate treatment and final disposal. The “Outline of the Action Plan towards the Eradication of Illegal Dumping” was publi-cized in 2004. The action plan includes improvement of public awareness against littered wastes in the neighbourhood, increasing transparency of the waste treatment system, human resource development supporting the system and so on. The establishment of the Illegal Dumping Hotline and a tracking GPS system are named as examples. The “Electronic Manifest system” for industrial waste has been enforced as well.
It is emphasized that the reduction of the final disposal is especially im-portant, in addition to the efforts to stop the vicious circle at all stages, such as enforcing stringent regulations against improper disposal, encour-aging good practices in final disposal businesses, gaining public accep-tance by employing secured landfill technology, and so on. In fact, if we compare the situation of the shortage of industrial waste landfill sites in FY1998 to that in FY2003, the nationwide average remaining lifetime for landfill sites rose from 3.3 years (FY1998) to 6.1 years (FY2003). The 1998 figure indicated a rather serious shortage of landfill sites for indus-

98 Kazuo Yamamoto
trial waste, compared to the landfill sites for municipal solid waste, which had 12.2 years of remaining lifetime (FY1998). The difference was mainly due to a significant reduction of the final disposal amount of industrial waste, from 58 million tons (FY1998) to 30 million tons (FY2003). Al-though industrial waste generation remained about the same at about 400 million tons, the 3R activities in the industrial sector contributed to the re-duction of the final disposal.
The reduction of waste through intermediate treatment is also essential. Incineration technology has a great contribution in this respect. The con-struction of incineration plants for municipal solid waste was practiced from the late 1950s until the 1980s. In the early 1980s, the dioxin problem raised public concern. After that, it became more difficult to get public ac-ceptance for the construction of a new incineration plant. National and lo-cal governments took effective action to cope with the dioxin problem by setting new regulations and guidelines for countermeasures against dioxin. Consequently, dioxin emissions all over Japan were drastically reduced, as shown in Fig. 5.4.
Nowadays, dioxin emissions from municipal solid waste incinerators are controlled to a minimal level. There is also attention to utilizing incinera-tion technology to recover energy from waste (Waste to Energy Technol-ogy) because a large part of municipal solid waste is biomass waste.
1997 1998 1999 2000 2001 2002 2003 2004 2005
Dioxins emission,g-TEQ/y
Industrial processesSmall waste-incinerator
Industrial waste incineratorMunicipal solid waste incinerator
Fiscal Year1997 1998 1999 2000 2001 2002 2003 2004 2005
Dioxins emission,g-TEQ/y
Industrial processesSmall waste-incinerator
Industrial waste incineratorMunicipal solid waste incinerator
Fiscal Year Fig. 5.4. Decrease in dioxins emission from all aver Japan (adopted and modified from the white paper, Ministry of Environment, 2007)
5. Municipal Solid Waste Management for a Sustainable Society 99
The case of illegal dumping on Teshima Island, Kagawa Prefecture shows a lesson of how costly it is to rehabilitate a damaged area once it is polluted. In 1978, a local company in Teshima got permission from the Kagawa prefectural government to operate as a disposal business for in-dustrial waste like sludge from paper mill factories and food processing waste, waste wood chips, and animal manure, which was to be used to make a recycled product for the cultivation of earthworms. Nevertheless, the company had illegally dumped hazardous ASR (automobile shredder dust), waste oil and sludge to its disposal site on the island from 1983 to 1990, which caused serious and fatal pollution. The amount of the illegal waste, containing lead, chromium, cadmium, PCBs (polychlorinated bi-phenyls), dioxins, and so on, was estimated about 560,000 m3. This illegal action was disclosed in 1990. The restoration cost was estimated about 45 billion yen, which was far beyond the capacity of the company to pay for without the help of public sector.
PCB waste treatment is another example of how difficult it can be to get public acceptance for waste disposal. After the ban on PCB and its produc-tion in 1974, the treatment of PCB waste was tried to be introduced, how-ever, it could not get public acceptance mainly due to people’s suspicions about secondary pollution through the exhaustion gas from the treatment facilities. Since then, a huge amount of PCBs have been just stocked and untreated for decades. The longer storage of PCBs creates a higher risk of unintentional spread of the PCBs into the environment due to the deteriora-tion of the storage conditions, accidental leakage and unexpected acci-dents. Public awareness of this negative legacy of PCB gave rise instead to total opposition against PCB waste treatment facilities.
The Law Concerning Special Measures Against PCB Waste was estab-lished in 2001 and five PCB waste treatment plants have been constructed since then, including the earliest plant in Kita-Kyushu, which started op-eration in 2004.
5.2.3 Legislative Scheme of Waste Management and 3R
Fig.5.5 summarizes the current legislative scheme for establishing a Sound Material-Cycle Society, in which proper waste management and the pro-motion of the 3Rs are essential.
The “Fundamental plan on the environment” set by the Cabinet council determines the master plan for achieving the Low Carbon Society, and is based on the “Fundamental Law on the Environment.” Under this master plan, the fundamental plan for establishing a Sound Material-Cycle Soci-ety also set by the Cabinet council based on the corresponding law, aims to
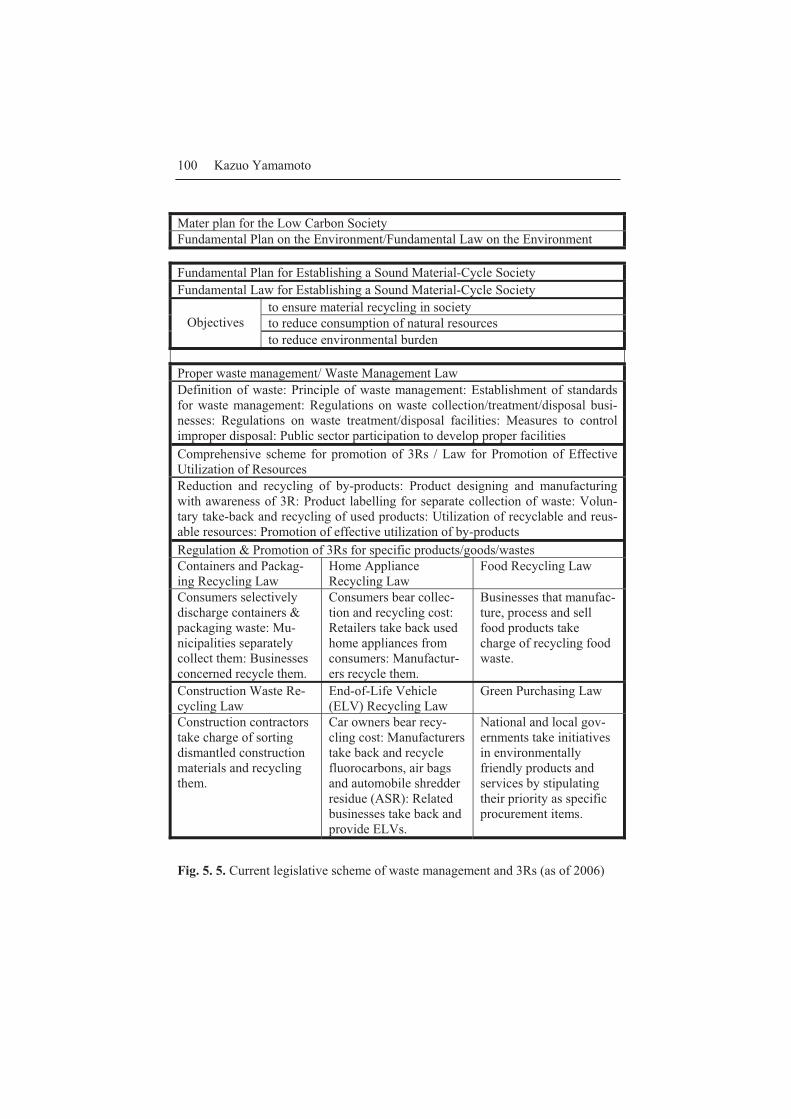
100 Kazuo Yamamoto
Mater plan for the Low Carbon SocietyFundamental Plan on the Environment/Fundamental Law on the Environment
Fundamental Plan for Establishing a Sound Material-Cycle Society Fundamental Law for Establishing a Sound Material-Cycle Society
Objectives
to ensure material recycling in societyto reduce consumption of natural resourcesto reduce environmental burden
Proper waste management/ Waste Management LawDefinition of waste: Principle of waste management: Establishment of standards for waste management: Regulations on waste collection/treatment/disposal busi-nesses: Regulations on waste treatment/disposal facilities: Measures to control improper disposal: Public sector participation to develop proper facilities Comprehensive scheme for promotion of 3Rs / Law for Promotion of Effective Utilization of Resources Reduction and recycling of by-products: Product designing and manufacturing with awareness of 3R: Product labelling for separate collection of waste: Volun-tary take-back and recycling of used products: Utilization of recyclable and reus-able resources: Promotion of effective utilization of by-productsRegulation & Promotion of 3Rs for specific products/goods/wastes Containers and Packag-ing Recycling Law
Home Appliance Recycling Law
Food Recycling Law
Consumers selectively discharge containers & packaging waste: Mu-nicipalities separately collect them: Businesses concerned recycle them.
Consumers bear collec-tion and recycling cost: Retailers take back used home appliances from consumers: Manufactur-ers recycle them.
Businesses that manufac-ture, process and sell food products take charge of recycling food waste.
Construction Waste Re-cycling Law
End-of-Life Vehicle (ELV) Recycling Law
Green Purchasing Law
Construction contractors take charge of sorting dismantled construction materials and recycling them.
Car owners bear recy-cling cost: Manufacturers take back and recycle fluorocarbons, air bags and automobile shredder residue (ASR): Related businesses take back and provide ELVs.
National and local gov-ernments take initiatives in environmentally friendly products and services by stipulating their priority as specific procurement items.
Fig. 5. 5. Current legislative scheme of waste management and 3Rs (as of 2006)

5. Municipal Solid Waste Management for a Sustainable Society 101
ensure material recycling, reduce consumption of natural resources and re-duce environmental burden. Circulative resources, including recyclable waste, are defined and the concept of EPR (Extended Producer Responsi-bility), i.e. an environmental policy that extends a producer’s responsibility for a product to the post-consumer stage of the product’s life cycle, is manifested in this law.
Two major parts of the fundamental laws are the Waste Management Law and the Law for Promotion of Effective Utilization of Resources, which highlight the comprehensive policies and practices for proper waste management and 3R implementation, respectively. Voluntary effort by businesses is also important to ensure them. Voluntary guidelines for waste treatment and recycling have been set by various industries. DfE (Design for Environment) is also strengthening the implementation of the 3Rs. A number of the guidelines of product assessment incorporating DfE are in-creasing. It is noted that CSR (Corporate Social Responsibility) is a key to establish corporate governance over waste management and related recy-cling activities. This also reduces the potential cost of future environmental restoration by avoiding the occurrences of unintentional illegal dumping and improper recycling.
Furthermore, a series of laws have been enacted to regulate and promote the 3Rs for specific products, goods, and wastes. The Container and Pack-aging Recycling Law, enforced in 2000 and amended in 2006, aims at re-ducing domestic waste by separately collecting waste containers and pack-aging, which accounts for about 60% in volume of the domestic waste. The Home Appliance Recycling Law, enforced in 2001, aims at promoting the proper recycling of television sets (cathode-ray tube type only), air conditioners, refrigerators, and washing machines, all of which are bulky and potentially hazardous.
The Food Recycling Law, enforced in 2001, aims to reduce and recycle food waste generated at food related industries, such as food manufactur-ing, food wholesaling, food retailing, and food service. The Construction Material Recycling Law, enforced in 2002, aims to promote sorting and recycling of dismantled construction waste, such as concrete mass, wood, and asphalt concrete mass. The End-of-Life Vehicle Recycling Law, en-forced in 2005, aims to promote the recycling and proper disposal of end-of-life vehicles (ELVs) by collecting and recycling air bags and ASR and by collecting and then destroying CFCs (Chlorofluorocarbons) from ELVs. The Green Purchasing Law, enforced in 2001, aims to ensure that national and local governments take the initiative in purchasing environmentally friendly products and services by stipulating their priority as specific pro-curement items.
102 Kazuo Yamamoto
This legislative scheme has succeeded in establishing the comprehen-sive implementation of 3R activities and proper waste management.
5.3 Sound Material-Cycle - Domestic or International?
5.3.1 Improper disposal of solid waste in developing countries
Proper waste management and 3R activities are pursued in both developed and developing countries. However, differences can be found in the meth-ods of their implementation reflecting the situation of developing coun-tries, where it must be taken into the consideration the improper solid waste disposal and the health, welfare and recycling economy of the waste-pickers surviving on unsanitary landfill sites.
The implementation of proper disposal methods is most important. The step-by-step introduction of proper management technologies at disposal sites is recommended. As in developing countries, the least economically costly methods of solid waste disposal are still practiced. There is a need for gradual and economical improvement in order to close open dumps and create sanitary landfills. Table 5.2 provides an idea of the necessary steps towards the creation of sanitary landfills, such as control facilities, leachate purification, daily soil cover, gas collection (methane), buffer zones and measurement of the incoming waste (in order to estimate the landfill ca-pacity left).
5.3.2 Transboundary movement of circulative resources
As the meaning of waste or circulative resources is relative, home appli-ance waste and circulative resources can be used to highlight the issue of the transboundary movement of waste and circulative resources. Japanese home appliances are exported to other countries as second-hand alterna-tives in some local markets outside of Japan. In fact, a significant amount of discarded home appliances was exported from Japan as shown in Fig. 5.6. It is noted that about 46% of the discarded television sets were ex-ported as second-hand products or usable materials in FY2005. In the case of TVs made with cathode-ray tubes, which contain a large amount of lead, this means the used television sets exported are potential hazardous waste when they are discarded again after their second life.

5. Municipal Solid Waste Management for a Sustainable Society 103
These products’ life is relatively short and they are mostly disposed of into open dumps without proper treatment. There must be the responsibil-ity of producers in “taking care of the disposal of the hazardous compo-nents contained in the waste.” On the other hand, the reuse of second-hand home appliances is not only economically preferable but also environmen-tally friendly in terms of the effective use of limited resources. This creates a controversial argument about whether a sound material-cycle system must lie in domestic or international. Table 5.2 Necessary components in the step-by-step improvement to sanitary landfill (cited from a JICA text (2005)) Operation & Facilities Necessary components in the step-by-step im-
provement of the level Level 1 Level 2 Level 3 Level 4
Control facilities � � � �
Measurement of incoming waste � � � �
Landfill equipment � � � �
Approach and on-site roads � � � �
Enclosing bunds � � �
Buffer zones � � �
Daily soil covering & gas venting � � �
Leachate circulation treat-ment � �
Mobile fence for litter pre-vention � �
Leachate purification �
Seepage control works �

104 Kazuo Yamamoto
�
���
�����
����
�����
����
����6������� �
3��)�� � ������
+�'%5��� ��� 1��/��50�(/����
�� ��
&6�������+�%���+�(�(��
,���� �(�+�%���+�(�(��
$3+���>������+�(�(��
Fig. 5.6. Destination of discarded home appliances in FY2005 (Data source: documents, Assessment of Home Appliance Recycling (HAR) System division of the Central Environmental Council (2007))
Another argument is raised about whether exporting circulating re-
sources that damage the domestic recycling industry is acceptable or not. This has happened in the case of PET (Polyethylene terephthalate) bottle recycling in Japan. The Japanese government has promoted the develop-ment of PET-to-PET bottle recycling by relevant private businesses with the high cost associated to technology and infrastructure development. In spite of this, a significant portion of PET bottle recycling has shifted to China, due to the economic benefits for municipalities that faced the deci-sion of paying the high costs associated with domestic recycling or selling the PET bottles to be exported to China. This damaged the bottle-to-bottle recycling businesses in Japan. From a different viewpoint, PET bottle re-cycling costs through the Japan Container and Packaging Recycling Asso-ciation have been drastically reduced, and were even reversed in 2006, which means the recycler paid money to get PET bottles, as shown in Fig.5.7. It is apparent that overseas market pressure led to a significant cost reduction in the domestic market.
The cost of the plastics other than PET bottles remains as high as 80,000 yen /ton (Fig.5.7). A similar situation could happen if the demand of waste plastic overseas is drastically increased in the near future.
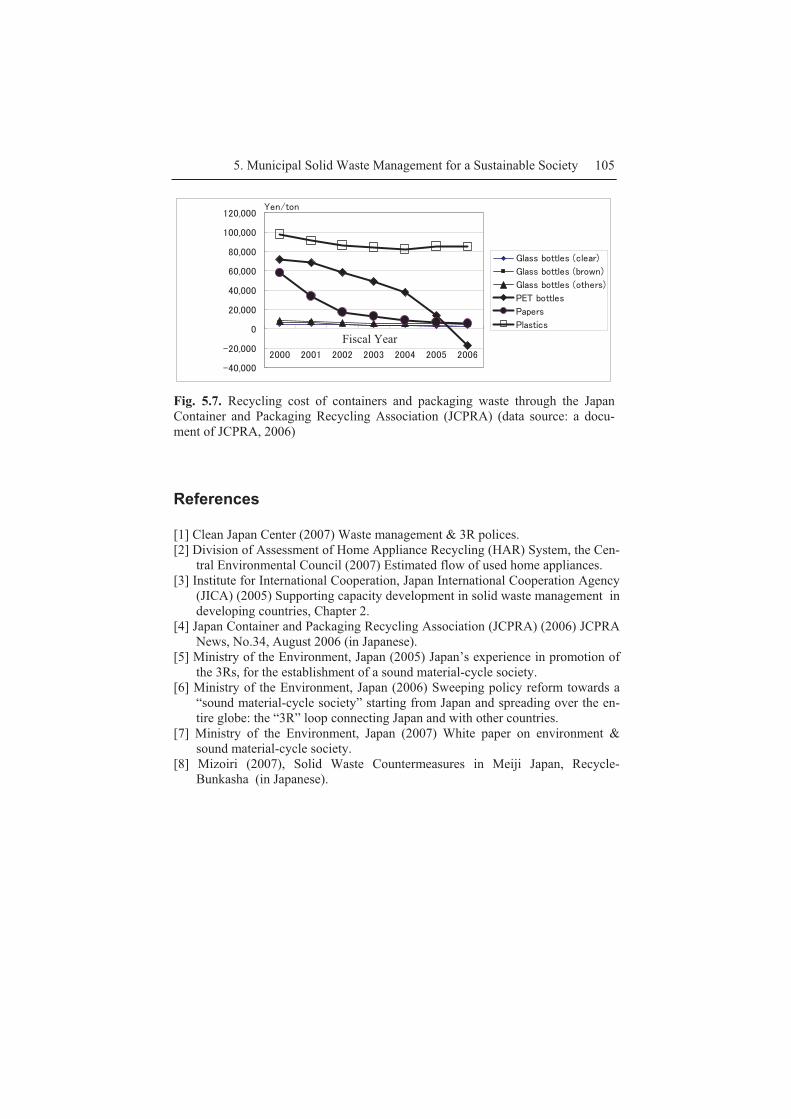
5. Municipal Solid Waste Management for a Sustainable Society 105
4��9���
4��9���
�
��9���
��9���
��9���
��9���
���9���
���9���
���� ���� ���� ���� ���� ��� ����
I��� ��
J������� �����(����"
J������� ��������>�"
J������� ������ /���"
�K���� ���
��!���
���� �(�
Fig. 5.7. Recycling cost of containers and packaging waste through the Japan Container and Packaging Recycling Association (JCPRA) (data source: a docu-ment of JCPRA, 2006)
References
[1] Clean Japan Center (2007) Waste management & 3R polices. [2] Division of Assessment of Home Appliance Recycling (HAR) System, the Cen-
tral Environmental Council (2007) Estimated flow of used home appliances. [3] Institute for International Cooperation, Japan International Cooperation Agency
(JICA) (2005) Supporting capacity development in solid waste management in developing countries, Chapter 2.
[4] Japan Container and Packaging Recycling Association (JCPRA) (2006) JCPRA News, No.34, August 2006 (in Japanese).
[5] Ministry of the Environment, Japan (2005) Japan’s experience in promotion of the 3Rs, for the establishment of a sound material-cycle society.
[6] Ministry of the Environment, Japan (2006) Sweeping policy reform towards a “sound material-cycle society” starting from Japan and spreading over the en-tire globe: the “3R” loop connecting Japan and with other countries.
[7] Ministry of the Environment, Japan (2007) White paper on environment & sound material-cycle society.
[8] Mizoiri (2007), Solid Waste Countermeasures in Meiji Japan, Recycle-Bunkasha (in Japanese).
Fiscal Year
6. Dismantlement of Buildings and Recycling of Construction Waste
Tsuyoshi Seike
Noriko Akita
Graduate School of Frontier Sciences, The University of Tokyo 5-1-5, Kashiwanoha, Kashiwa, Chiba, 277-8563, Japan
6.1 Introduction
When a building is constructed, repaired or dismantled, building materials are consumed and waste is generated. The construction stage is divided into the manufacturing stage of the building materials at each factory and the composition stage of the building materials at the construction site. The manufacturing stage has achieved some success in reducing and recycling waste through the efforts of individual factories. On the other hand, during the composition stage, the packaging and broken pieces of building mate-rials have usually been abandoned. Recently, major construction compa-nies and house builders have begun to work on reducing and recycling this waste.
The efforts of “effective utilization of resources” in these manufac-turing stages create a cost benefit, so it is advantageous for the factories and those who use the building materials. Therefore, to some degree, it is expected that effective utilization of resources in the manufacturing stage will continue to progress in the future. On the other hand, at the repair stage, considering effective utilization of resources is still uncommon. Because the amount of resources and waste is so small, it has not been seriously considered. However, effective utiliza-tion of resources in the repair stage is sure to become more important be-
108 Tsuyoshi Seike and Noriko Akita
cause it is thought that the number of the buildings that last a long time will increase in the future.
Above all, effective utilization of resources at the dismantlement stage is the most important. 50 tons of waste or more are produced from the dismantlement of one detached house and several thousand tons of waste are produced from the dismantlement of one building. Because a large quantity of waste is generated in the building dismantlement stage, it is important to promote effective utilization of resources by recycling and re-using waste produced by dismantlement.
6.2 Japanese Housing Conditions
6.2.1 Short service life of housing stock in Japan
The housing stock in Japan has a short life compared with that in other countries. Fig. 6.1 indicates the service life of Japanese housing stock compared with other countries. In 1998, the average service life of housing in Japan was 42 years, while in the US and France the averages were both around 80 years. In the United Kingdom, the average was over 100 years. Thus, the service life of housing stock in Japan is very short compared with other countries. This condition causes a variety of serious problems in Japan.
Although the service life of the housing stock in Japan in 1993 was about 30 years, it was estimated to be 50 years in 2003. The service life of housing stock in Japan is still short, but is increasing gradually. According to the depreciation assets used for taxes in Japan, the life of reinforced concrete (RC) or steel reinforced concrete (SRC) structures is calculated as 47 years (statutory useful life). The straight-line depreciation method is specified for the calculation of a house’s depreciation. The payment period by Japan housing Finance Agency for housing loans used to the fireproof building apartment owners amounts to a maximum of 35 years.
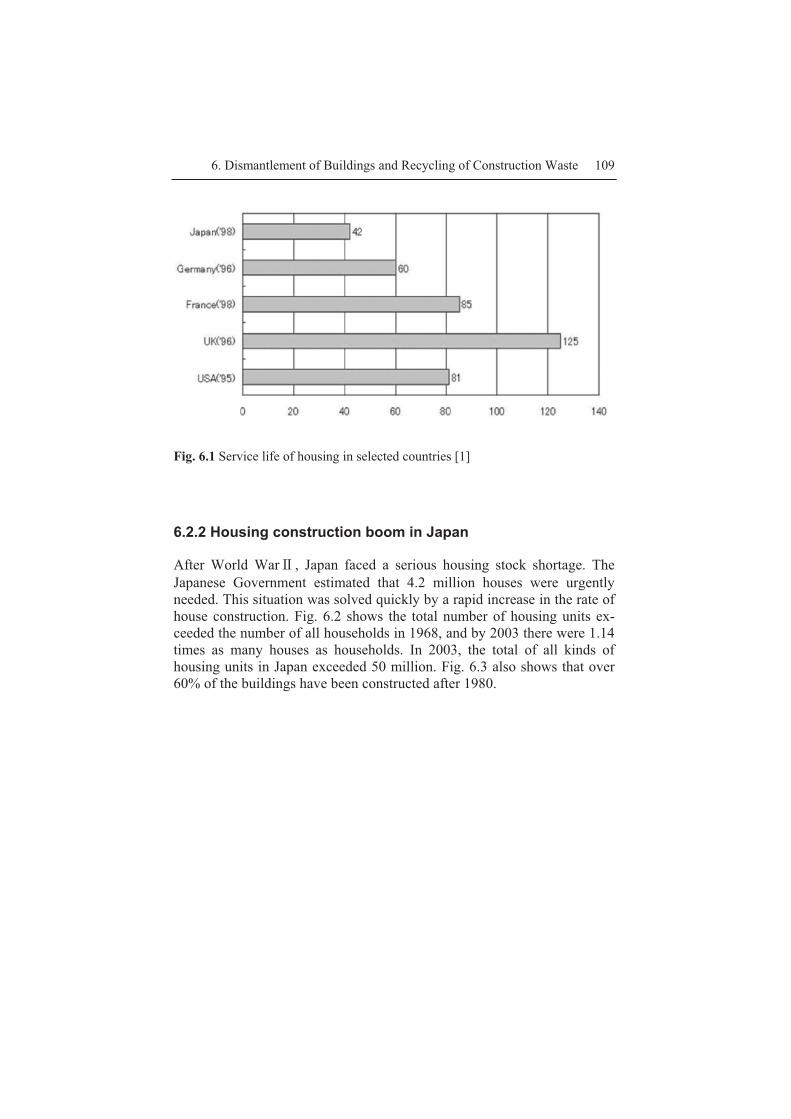
6. Dismantlement of Buildings and Recycling of Construction Waste 109
Fig. 6.1 Service life of housing in selected countries [1]
6.2.2 Housing construction boom in Japan
After World War�, Japan faced a serious housing stock shortage. The Japanese Government estimated that 4.2 million houses were urgently needed. This situation was solved quickly by a rapid increase in the rate of house construction. Fig. 6.2 shows the total number of housing units ex-ceeded the number of all households in 1968, and by 2003 there were 1.14 times as many houses as households. In 2003, the total of all kinds of housing units in Japan exceeded 50 million. Fig. 6.3 also shows that over 60% of the buildings have been constructed after 1980.
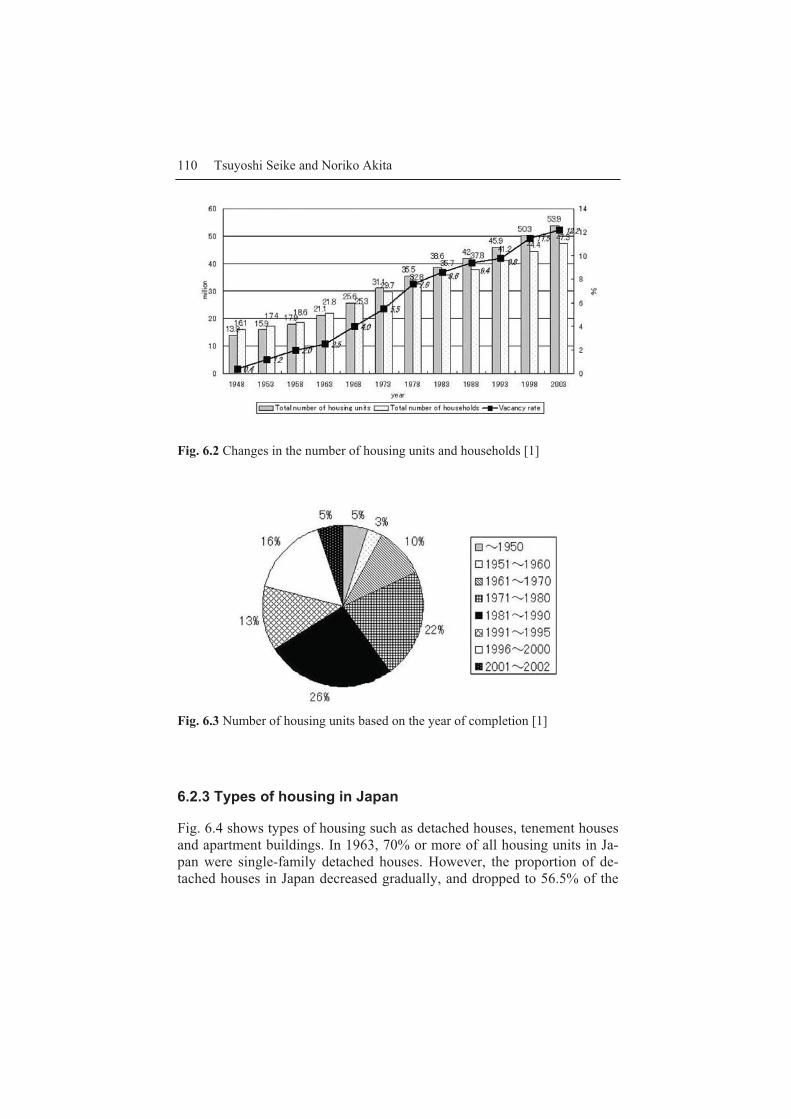
110 Tsuyoshi Seike and Noriko Akita
Fig. 6.2 Changes in the number of housing units and households [1]
Fig. 6.3 Number of housing units based on the year of completion [1]
6.2.3 Types of housing in Japan
Fig. 6.4 shows types of housing such as detached houses, tenement houses and apartment buildings. In 1963, 70% or more of all housing units in Ja-pan were single-family detached houses. However, the proportion of de-tached houses in Japan decreased gradually, and dropped to 56.5% of the
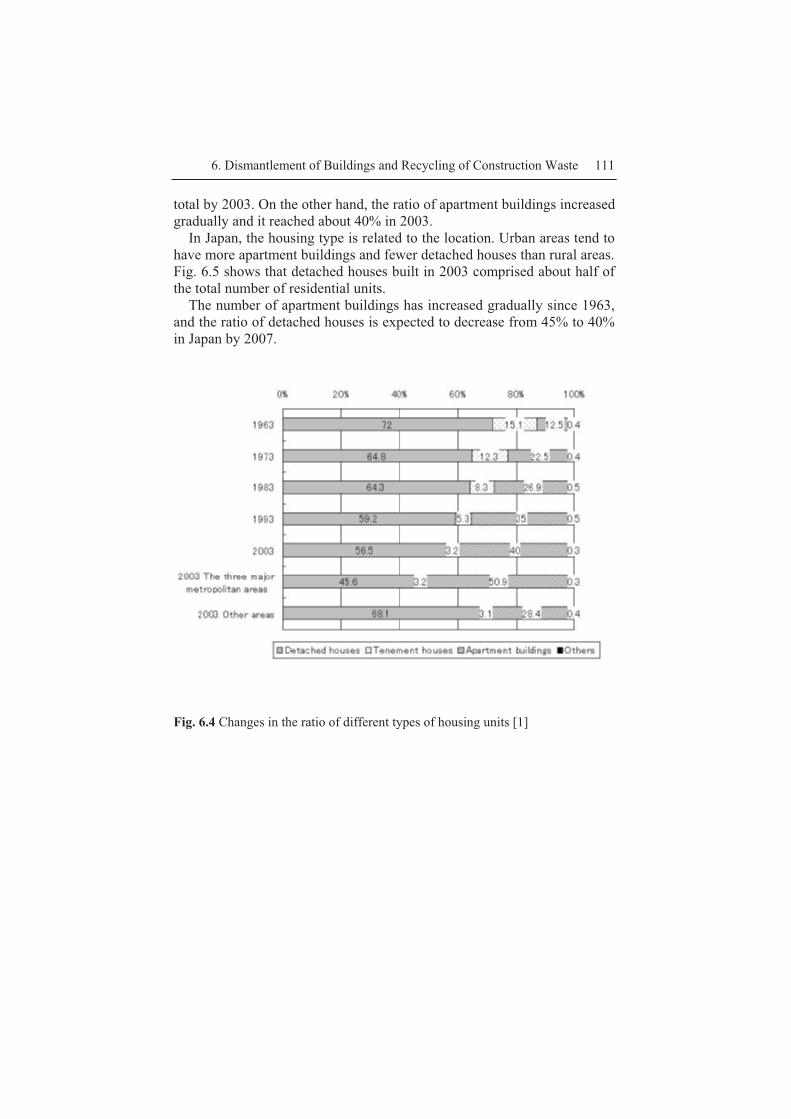
6. Dismantlement of Buildings and Recycling of Construction Waste 111
total by 2003. On the other hand, the ratio of apartment buildings increased gradually and it reached about 40% in 2003.
In Japan, the housing type is related to the location. Urban areas tend to have more apartment buildings and fewer detached houses than rural areas. Fig. 6.5 shows that detached houses built in 2003 comprised about half of the total number of residential units.
The number of apartment buildings has increased gradually since 1963, and the ratio of detached houses is expected to decrease from 45% to 40% in Japan by 2007.
Fig. 6.4 Changes in the ratio of different types of housing units [1]
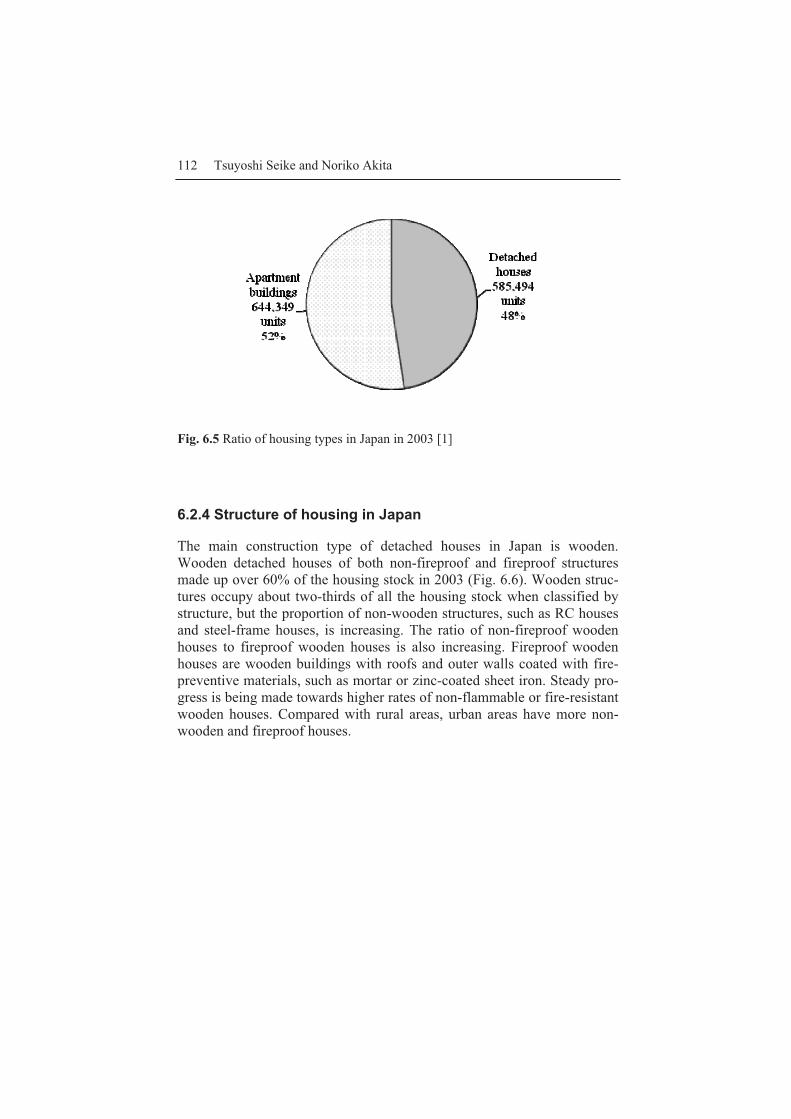
112 Tsuyoshi Seike and Noriko Akita
Fig. 6.5 Ratio of housing types in Japan in 2003 [1]
6.2.4 Structure of housing in Japan
The main construction type of detached houses in Japan is wooden. Wooden detached houses of both non-fireproof and fireproof structures made up over 60% of the housing stock in 2003 (Fig. 6.6). Wooden struc-tures occupy about two-thirds of all the housing stock when classified by structure, but the proportion of non-wooden structures, such as RC houses and steel-frame houses, is increasing. The ratio of non-fireproof wooden houses to fireproof wooden houses is also increasing. Fireproof wooden houses are wooden buildings with roofs and outer walls coated with fire-preventive materials, such as mortar or zinc-coated sheet iron. Steady pro-gress is being made towards higher rates of non-flammable or fire-resistant wooden houses. Compared with rural areas, urban areas have more non-wooden and fireproof houses.

6. Dismantlement of Buildings and Recycling of Construction Waste 113
Fig. 6.6 Changes in the percentages of types of wooden housing stock [1]
6.3 Status of Construction Waste in Japan
6.3.1 Current condition of construction waste in Japan
Waste derived from construction comprises about 20% of the total amount of industrial waste in Japan. Fig. 6.7 and Fig. 6.8 shows the exhaust ratio of industrial waste in Japan by industry and by type. Although construction waste is also generated from civil engineering projects such as roads and bridges, most construction waste is generated from the dismantlement of buildings. Therefore, it is necessary to control the process of dismantle-ment and promote the recycling of dismantlement waste. Fig. 6.9 shows the change in the amount of exhaust waste from construction according to fiscal year in Japan. The quantity of construction waste decreased from 100 million tons in 1995, to 82 million tons in 2002 and to 77 million tons in 2005, owing partly to the reduction of public utility works and de-creased housing construction starts. But the main reason for the decreasing amount of waste was the Construction Material Recycling Law of 2000. The recycling rates increased from 58% in 1995 to 92% in 2002 and 92% in 2005. The quantity of the final disposal of the waste was reduced from

114 Tsuyoshi Seike and Noriko Akita
about 42% (42 million tons) in 1995, to 8% (7 million tons) in 2002 and to 8% (6 million tons) in 2005.
���������� ����2
����������� ���2
����������� ��2
���������� ���2
����������� ���2
����������� ���2
����������� ���2
����������� ���2
���������� ���2
����������� ����2
����������� ����2
K��( ��(�!�>��95��9/�� ��� �>� ����%!!�� 35��(%� %��
)��� �%( ��� B������ �- ���
�%�!9!�!����� �!�!���!�� %( � )/���� ��
0����5 )�����(�9(������ �� ����!�� %( �
?�� � 7�6���5�9(�5��� ���� �'��
& /��� Fig. 6.7 Quantity of industrial wastes by industry [2]
��������� ���2
���������� ���2
���������� ���2
����������� ���2
���������� ���2
���������� ���2
����������� ��2
����������� ���2
���������� ����2
������������ ���2
�-�% 5�� �3������L� �� ��� ���� �3������L�'�(��%����
�,������ �0� ���>�� �� ����� �(�>�� ��
�1�� ���>�� �� �J�����M�(�����(� �3������M�!��� ����� %���
�& /����� %� �����>�� ���
Fig.6.8 Quantity of industrial wastes by type [2]

6. Dismantlement of Buildings and Recycling of Construction Waste 115
Fig.6.9 Final dumping and recycling rate of construction wastes [3]
6.3.2 Waste generated in the dismantlement process
When a house is dismantled, a huge amount of waste is generated. Fig. 6.10 shows the waste ratio and total waste amount for a RC apartment building. Most of the waste is concrete. However, with detached houses, half of the waste is concrete used for the foundation and basement, and wooden waste is only 20% of the total (Fig. 6.11). A variety of mixed waste such as glass, plastic, and ceramics are generated from house dis-mantlement. The mixed waste makes various problems of dismantlement and recycling. But the problem is not so severe for RC apartments because the waste is mostly concrete. However, in the case of detached wooden houses, the separation of waste is difficult because the types of waste are varied and complex. Even if the waste is impossible to recycle, it is neces-sary to separate all waste generated by dismantlement. Separation must be done onsite.

116 Tsuyoshi Seike and Noriko Akita
Fig.6.10 Waste output from a RC apartment building [4]
Fig.6.11 Waste output from a wooden detached house [4]
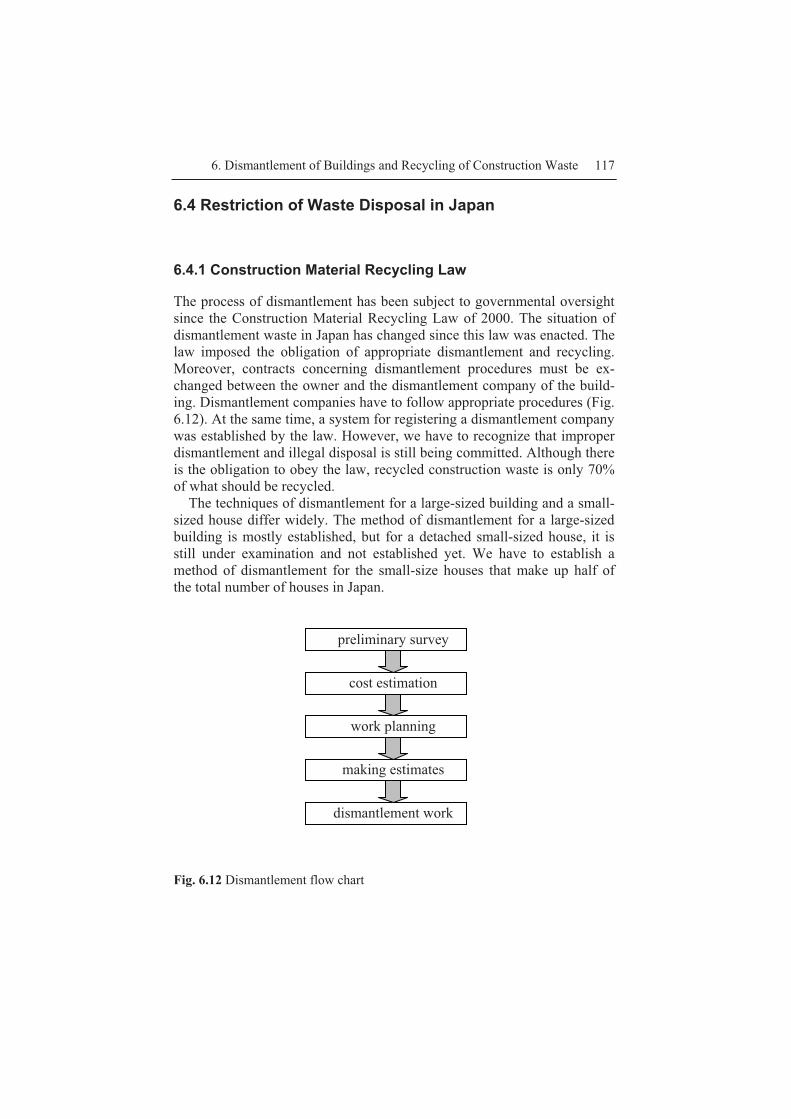
6. Dismantlement of Buildings and Recycling of Construction Waste 117
6.4 Restriction of Waste Disposal in Japan
6.4.1 Construction Material Recycling Law
The process of dismantlement has been subject to governmental oversight since the Construction Material Recycling Law of 2000. The situation of dismantlement waste in Japan has changed since this law was enacted. The law imposed the obligation of appropriate dismantlement and recycling. Moreover, contracts concerning dismantlement procedures must be ex-changed between the owner and the dismantlement company of the build-ing. Dismantlement companies have to follow appropriate procedures (Fig. 6.12). At the same time, a system for registering a dismantlement company was established by the law. However, we have to recognize that improper dismantlement and illegal disposal is still being committed. Although there is the obligation to obey the law, recycled construction waste is only 70% of what should be recycled.
The techniques of dismantlement for a large-sized building and a small-sized house differ widely. The method of dismantlement for a large-sized building is mostly established, but for a detached small-sized house, it is still under examination and not established yet. We have to establish a method of dismantlement for the small-size houses that make up half of the total number of houses in Japan.
Fig. 6.12 Dismantlement flow chart
preliminary survey
cost estimation
work planning
making estimates
dismantlement work

118 Tsuyoshi Seike and Noriko Akita
6.4.2 Proper procedure for dismantlement
Before the dismantlement construction starts, a preliminary survey is need that estimates the amount of materials, hazardous materials, etc. The next step is cost estimation. The cost includes making a temporary building cover preventing trouble to neighbourhoods and scaffolding for the dis-mantle work, all kinds of dismantlement works, waste collection, transpor-tation and so on. The dismantlement work process is described in the “work plan.” The work plan includes the dismantlement work process, the dismantlement technique and the material separation method. It also con-tains an explanation of the waste content to be seen by the former owner and the current owner. After this preparation period, making estimates and dismantlement works follow. Dismantlement works in Japan will be ex-plained in the following section.
In Japan, there are three important points to consider in the establish-ment of a proper dismantlement method. One is the establishment of a proper technique for dismantlement, the second is to promote making proper work plan, and the third is the establishment of a proper cost. After 2000, owners of the buildings have had to pay a much higher cost for dis-mantlement by the Law.
6.5 Procedure for dismantlement
6.5.1 Detached house dismantlement in Japan
First, lighting fixtures, unit baths, kitchen cabinets, built-in air condition-ing units, etc. are removed (Fig. 6.13). In general, the building materials consist of complex materials including wood, metals and plastics that are very troublesome to sort later on. The Construction Material Recycling Law makes it mandatory to dismantle building materials by hand (except when difficult for structural or technical reasons). However, in practice, building materials are often dismantled by machine together with the building frame, and they are then sorted without manual sorting.
Fig. 6.14 shows the removal of interior finishing materials like boards and ceilings. Fittings, interior wall materials, ceiling materials, floor mate-rials, etc. are dismantled. In many cases, except for wooden housing, wooden interior finishing materials are separated before dismantling by machine, while metal materials are separated after machine dismantlement.
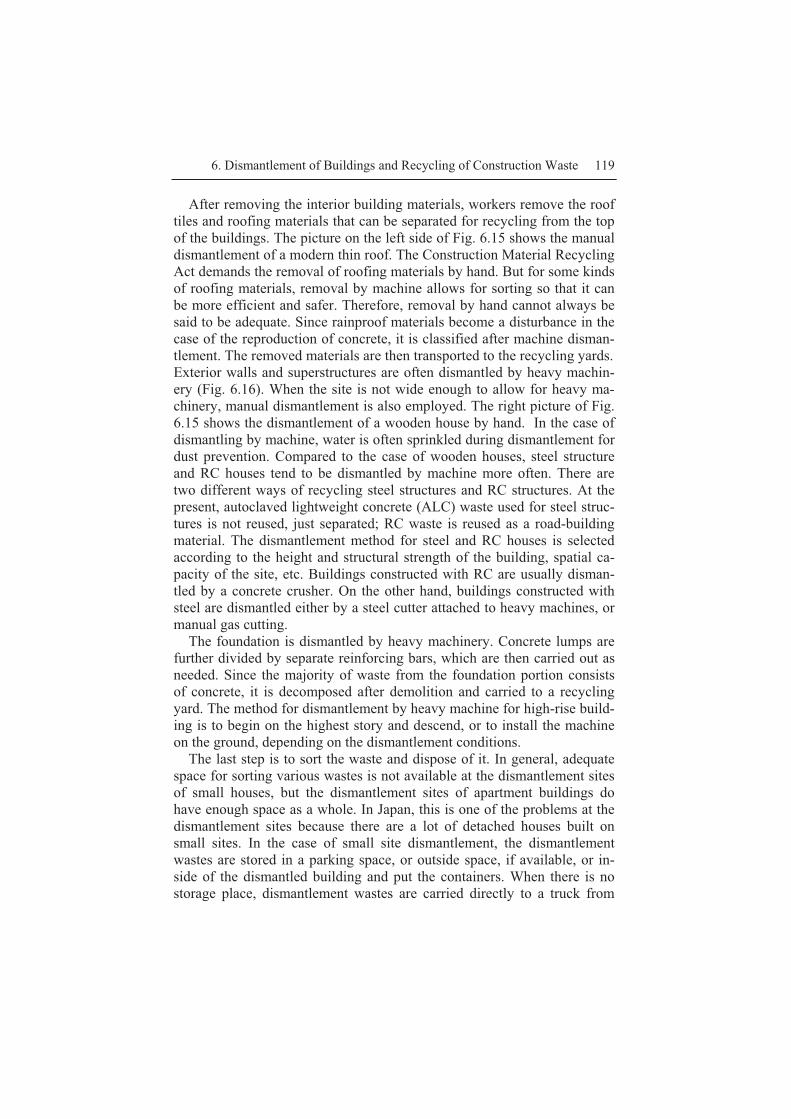
6. Dismantlement of Buildings and Recycling of Construction Waste 119
After removing the interior building materials, workers remove the roof tiles and roofing materials that can be separated for recycling from the top of the buildings. The picture on the left side of Fig. 6.15 shows the manual dismantlement of a modern thin roof. The Construction Material Recycling Act demands the removal of roofing materials by hand. But for some kinds of roofing materials, removal by machine allows for sorting so that it can be more efficient and safer. Therefore, removal by hand cannot always be said to be adequate. Since rainproof materials become a disturbance in the case of the reproduction of concrete, it is classified after machine disman-tlement. The removed materials are then transported to the recycling yards. Exterior walls and superstructures are often dismantled by heavy machin-ery (Fig. 6.16). When the site is not wide enough to allow for heavy ma-chinery, manual dismantlement is also employed. The right picture of Fig. 6.15 shows the dismantlement of a wooden house by hand. In the case of dismantling by machine, water is often sprinkled during dismantlement for dust prevention. Compared to the case of wooden houses, steel structure and RC houses tend to be dismantled by machine more often. There are two different ways of recycling steel structures and RC structures. At the present, autoclaved lightweight concrete (ALC) waste used for steel struc-tures is not reused, just separated; RC waste is reused as a road-building material. The dismantlement method for steel and RC houses is selected according to the height and structural strength of the building, spatial ca-pacity of the site, etc. Buildings constructed with RC are usually disman-tled by a concrete crusher. On the other hand, buildings constructed with steel are dismantled either by a steel cutter attached to heavy machines, or manual gas cutting.
The foundation is dismantled by heavy machinery. Concrete lumps are further divided by separate reinforcing bars, which are then carried out as needed. Since the majority of waste from the foundation portion consists of concrete, it is decomposed after demolition and carried to a recycling yard. The method for dismantlement by heavy machine for high-rise build-ing is to begin on the highest story and descend, or to install the machine on the ground, depending on the dismantlement conditions.
The last step is to sort the waste and dispose of it. In general, adequate space for sorting various wastes is not available at the dismantlement sites of small houses, but the dismantlement sites of apartment buildings do have enough space as a whole. In Japan, this is one of the problems at the dismantlement sites because there are a lot of detached houses built on small sites. In the case of small site dismantlement, the dismantlement wastes are stored in a parking space, or outside space, if available, or in-side of the dismantled building and put the containers. When there is no storage place, dismantlement wastes are carried directly to a truck from
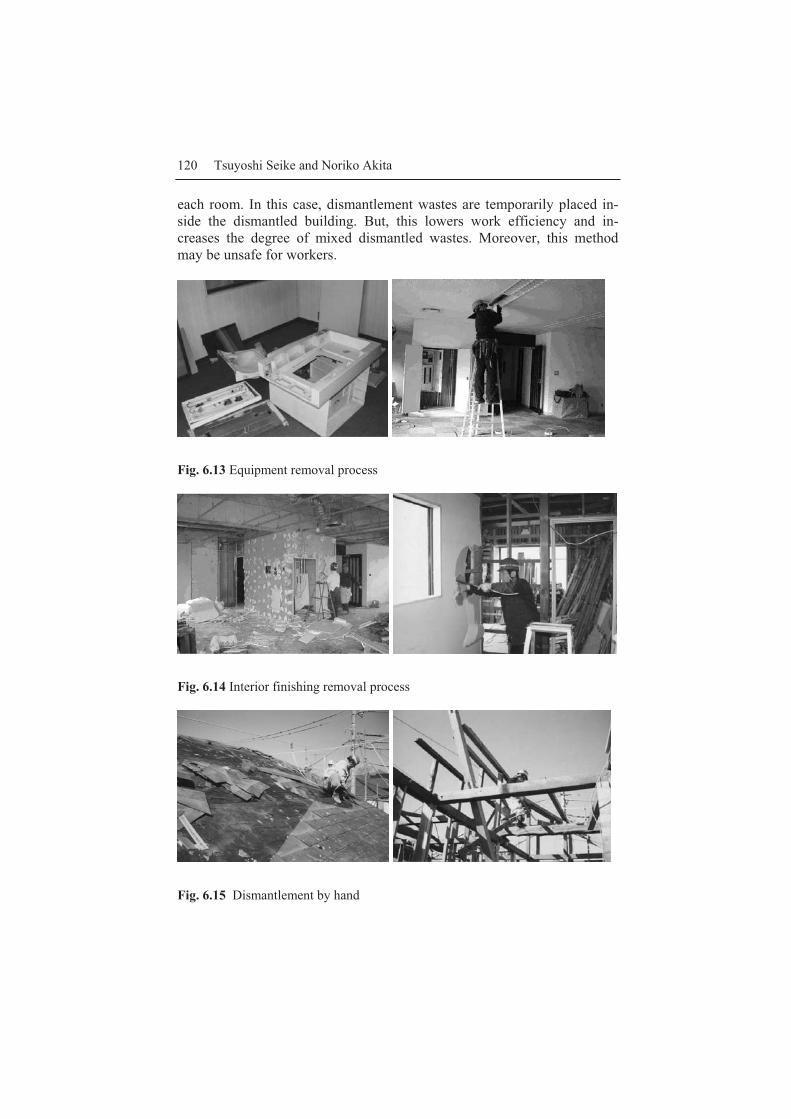
120 Tsuyoshi Seike and Noriko Akita
each room. In this case, dismantlement wastes are temporarily placed in-side the dismantled building. But, this lowers work efficiency and in-creases the degree of mixed dismantled wastes. Moreover, this method may be unsafe for workers.
Fig. 6.13 Equipment removal process
Fig. 6.14 Interior finishing removal process
Fig. 6.15 Dismantlement by hand
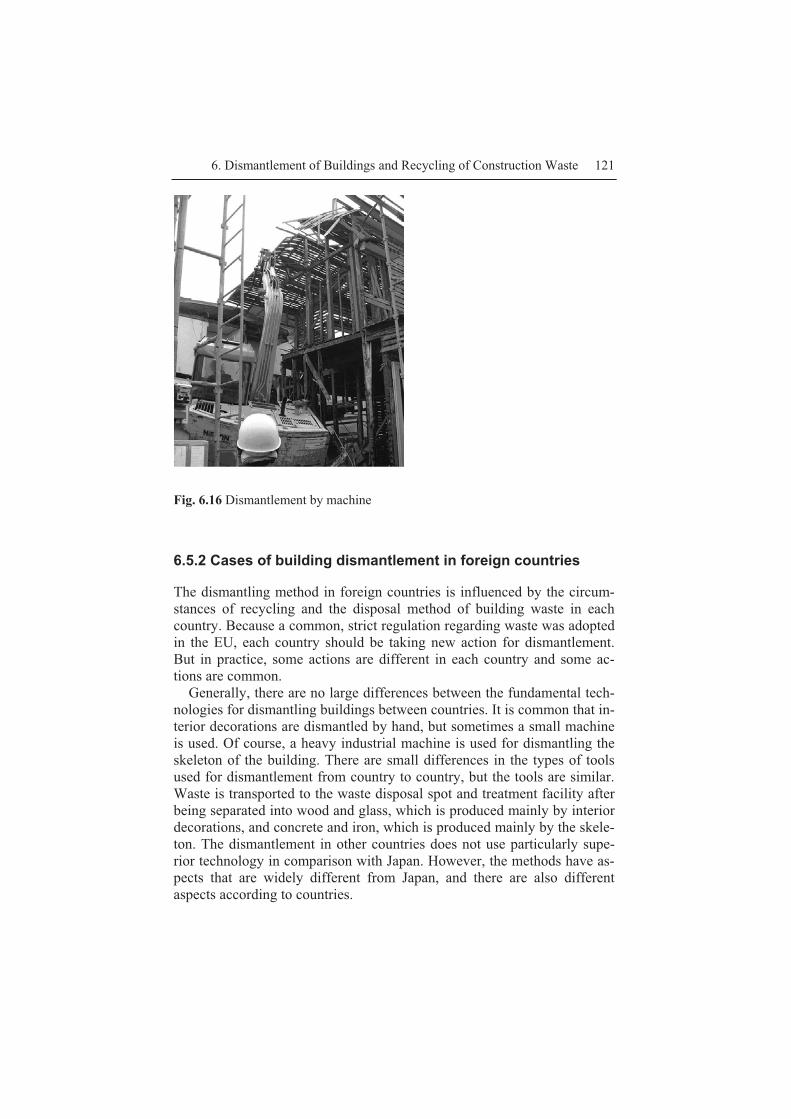
6. Dismantlement of Buildings and Recycling of Construction Waste 121
Fig. 6.16 Dismantlement by machine
6.5.2 Cases of building dismantlement in foreign countries
The dismantling method in foreign countries is influenced by the circum-stances of recycling and the disposal method of building waste in each country. Because a common, strict regulation regarding waste was adopted in the EU, each country should be taking new action for dismantlement. But in practice, some actions are different in each country and some ac-tions are common.
Generally, there are no large differences between the fundamental tech-nologies for dismantling buildings between countries. It is common that in-terior decorations are dismantled by hand, but sometimes a small machine is used. Of course, a heavy industrial machine is used for dismantling the skeleton of the building. There are small differences in the types of tools used for dismantlement from country to country, but the tools are similar. Waste is transported to the waste disposal spot and treatment facility after being separated into wood and glass, which is produced mainly by interior decorations, and concrete and iron, which is produced mainly by the skele-ton. The dismantlement in other countries does not use particularly supe-rior technology in comparison with Japan. However, the methods have as-pects that are widely different from Japan, and there are also different aspects according to countries.
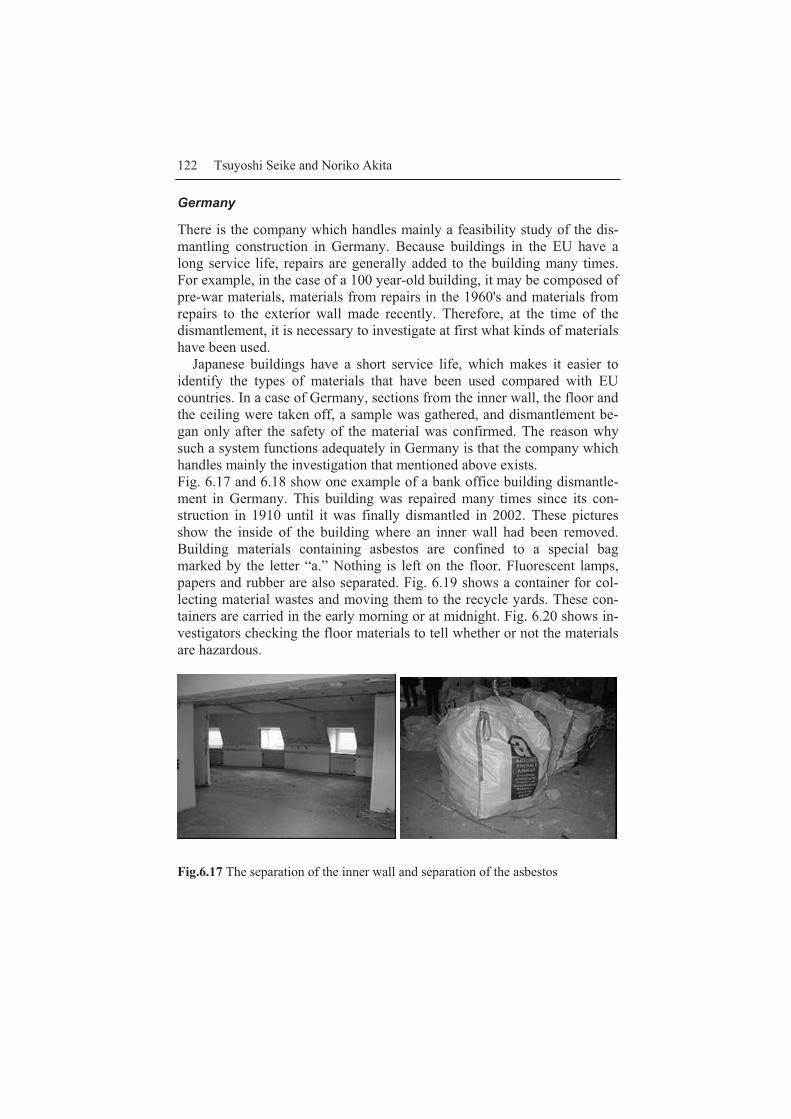
122 Tsuyoshi Seike and Noriko Akita
Germany
There is the company which handles mainly a feasibility study of the dis-mantling construction in Germany. Because buildings in the EU have a long service life, repairs are generally added to the building many times. For example, in the case of a 100 year-old building, it may be composed of pre-war materials, materials from repairs in the 1960's and materials from repairs to the exterior wall made recently. Therefore, at the time of the dismantlement, it is necessary to investigate at first what kinds of materials have been used.
Japanese buildings have a short service life, which makes it easier to identify the types of materials that have been used compared with EU countries. In a case of Germany, sections from the inner wall, the floor and the ceiling were taken off, a sample was gathered, and dismantlement be-gan only after the safety of the material was confirmed. The reason why such a system functions adequately in Germany is that the company which handles mainly the investigation that mentioned above exists. Fig. 6.17 and 6.18 show one example of a bank office building dismantle-ment in Germany. This building was repaired many times since its con-struction in 1910 until it was finally dismantled in 2002. These pictures show the inside of the building where an inner wall had been removed. Building materials containing asbestos are confined to a special bag marked by the letter “a.” Nothing is left on the floor. Fluorescent lamps, papers and rubber are also separated. Fig. 6.19 shows a container for col-lecting material wastes and moving them to the recycle yards. These con-tainers are carried in the early morning or at midnight. Fig. 6.20 shows in-vestigators checking the floor materials to tell whether or not the materials are hazardous.
Fig.6.17 The separation of the inner wall and separation of the asbestos

6. Dismantlement of Buildings and Recycling of Construction Waste 123
Fig. 6.18 Fluorescent lamps, paper and rubber are also separated
Fig. 6.19 Container for collecting material wastes
Fig. 6.20 Investigators checking the floor materials

124 Tsuyoshi Seike and Noriko Akita
France
In France, lead in paint used for interior decoration is becoming a social problem, and there is careful management of it at the time of the disman-tlement. There are specialized companies for the analysis and removal of lead paint. The companies undertake feasibility studies beforehand and draw a "P" on the wall to indicate where lead paint has been used. When a "P" is drawn on a repair area, a special procedure to confine or remove the lead is needed. When dismantling the building, carefully removing the parts with lead is necessary.
Fig. 6.21 shows a dismantlement site in France. A "P" has been drawn on the frame after an inner wall has been removed. The proper manage-ment of the toxic substance is taken strictly in France, and the business market of that purpose exists. As for asbestos, very intense management of it is already carried out in the EU, unlike Japan, where it has suddenly be-come a severe problem recently. In the aspect of the separation of the toxic substance, it may be said that the management of the French dismantling construction is carried out strictly from Japan.
The regulation parameters and methods for dismantling are different by country. Lead paint is distinguished in France because it is dangerous, but similar efforts are not taken in Germany and the U.K. From various stan-dards for dismantling, it is important to find a suitable method to be adopted by each country and for each case.
Fig. 6.21 A "P" on the wall indicates lead paint

6. Dismantlement of Buildings and Recycling of Construction Waste 125
United Kingdom
A process called “salvage” is undertaken at dismantling spots in United Kingdom (Fig. 6.22). This is the removal of stones from the decorations and old bricks from structures, when reuse is possible, before starting the main dismantling. The salvaged stones and old bricks are separated and brought to reuse markets or another construction site. Such an old materi-als are used for the new building to take the image of an old building over. It is also used for other buildings as old, tasteful building materials. Be-cause old building materials, including old bricks, are regarded as valuable in the U.K., every year about 3 million tons of recycled building materials are provided from building dismantling spots. There is a market for reuse materials, salvage takes place at dismantlement spots in United Kingdom..
Fig. 6. 22 British dismantling spot and “salvage”
6.6 Recycle and reuse
Germany
Fig. 6.23 shows a waste treatment facility near Munich. Separation work by the hand is taken to separate the materials which are different from the material of the specific recycling purpose at the first stage. After separat-ing wastes by hand, it will be separated by a machine. These steps are common all over the world.
In Japan, concrete and bricks are crushed and the pieces are used for road materials. But they are used for private gardens in Europe. Fig. 6.24 shows the specification of recycled inorganic materials which obtained in Germany It shows that using different qualities of recycled materials for

126 Tsuyoshi Seike and Noriko Akita
different places, and that the public sector must use these recycled materi-als. But they usually buy the poorer quality materials.
�
Fig. 6.23 Waste disposal and treatment facility in Germany
Fig. 6.24 A specification that obtained in Germany
China
The case of reuse and recycling in China is a little different from EU coun-tries. In Beijing, to gather soil and produce new bricks has been forbidden in order to protect farmland. The main problem in Beijing is the lack of building materials. So bricks are collected and reused from dismantlement sites. It is easy to find people who collect material resources in China. Fig. 6.25 shows a dismantlement site in Beijing. It shows that bricks are re-moved, and will be carried to a construction site or a used building materi-als market. Fig. 6.26 shows workers carrying building materials and a used building materials market in Beijing. Wooden materials such as beams and

6. Dismantlement of Buildings and Recycling of Construction Waste 127
panels are also collected from dismantlement site and are sold markets. Fig. 6.27 shows used floorboards at the used building materials market. In Japan, we do not reuse these low-quality materials, but China reuses such wood actively for lack of raw materials.
Fig. 6.25 Dismantlement site in Beijing
Fig. 6.26 Gathered and carried used building materials sold at the market
Fig. 6.27 Floorboards on sale at a building materials market in Beijing

128 Tsuyoshi Seike and Noriko Akita
6.7 Summary
There are some regulations about the use of recycled materials in Japan. However, recycled materials are used in Japan only when raw materials are scarce. We have no proper market or demand for recycled materials yet. This is the primary problem in Japan. Therefore, to promote construc-tion waste recycling in Japan, it is important to investigate the feasibility of a method and the cost of a recycle market.
The technologies for dismantlement and recycling have already been es-tablished, but a system for appropriate dismantlement and a recycling mar-ket has not matured yet. At the same time, it is important to offer ecologi-cal technologies to developing countries. Also, it is necessary for us to publicize good technologies of dismantling and recycling.
References
[1] Japanese Ministry of Internal Affairs and Communications: Housing and Land Survey (2003) [2] Japanese Ministry of Environment: waste disposal treatment, discharge and handling of industrial waste survey (2004) [3] Japanese Ministry of Land, Infrastructure and Transport: The Investi-gation into the actual conditions about by-products concerned with con-struction (2002) [4] Data from Seike Laboratory and Building Research Institute and pro-ject research (2002).

7. Holistic Approaches for Impact Assessment in Urban Environmental Management
Toshiya Aramaki
Department of Urban Engineering, The University of Tokyo 7-3-1, Hongo, Bunkyo-ku, Tokyo, 113-8656, Japan
7.1 Introduction
In order to create a better urban environment, various measures which aim to reduce environmental burdens and mitigate specific environmental im-pacts should be conducted. However these measures often shift environ-mental burdens to other areas or other fields, or create new burdens to the environment. Therefore, we need to grasp various environmental impacts which may be caused by these measures holistically, and choose appropri-ate measures for sustainable management of the urban environment. This chapter introduces several tools and approaches for a holistic assessment of the environmental impact of urban environmental management.
7.2 Metabolic and Material Flow Analysis
Urban areas consume a wide variety of resources, such as air, water, ener-gy, food and many other products to sustain their activities, then discharge them after use in the form of gas, waste heat, wastewater and solid waste. Due to the similarity to the processes of living organisms, this process has been called “Urban Metabolism.” “Urban Metabolism” is a widely used concept in the field of environmental management, and it is now recog-nized that inappropriate management of this metabolism causes environ-mental problems in urban areas such as air, water and soil pollution, urban
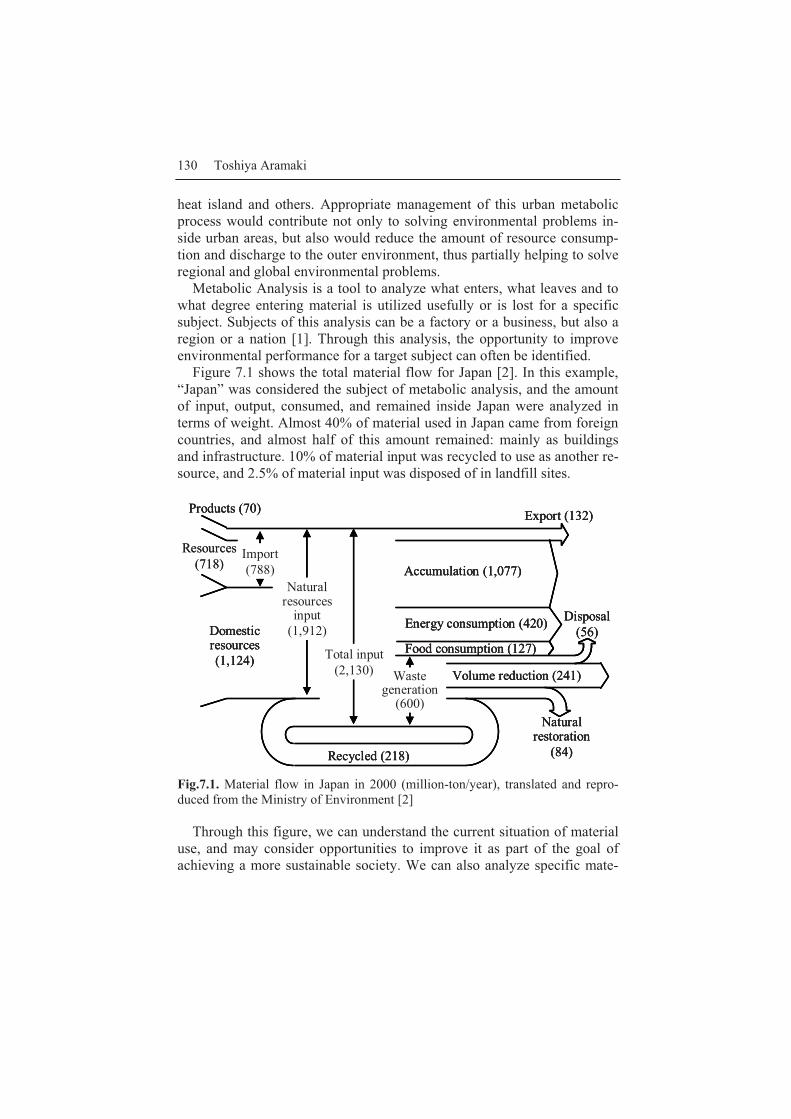
130 Toshiya Aramaki
heat island and others. Appropriate management of this urban metabolic process would contribute not only to solving environmental problems in-side urban areas, but also would reduce the amount of resource consump-tion and discharge to the outer environment, thus partially helping to solve regional and global environmental problems.
Metabolic Analysis is a tool to analyze what enters, what leaves and to what degree entering material is utilized usefully or is lost for a specific subject. Subjects of this analysis can be a factory or a business, but also a region or a nation [1]. Through this analysis, the opportunity to improve environmental performance for a target subject can often be identified.
Figure 7.1 shows the total material flow for Japan [2]. In this example, “Japan” was considered the subject of metabolic analysis, and the amount of input, output, consumed, and remained inside Japan were analyzed in terms of weight. Almost 40% of material used in Japan came from foreign countries, and almost half of this amount remained: mainly as buildings and infrastructure. 10% of material input was recycled to use as another re-source, and 2.5% of material input was disposed of in landfill sites.
Resources (718)
Products (70)
Domestic resources (1,124)
Recycled (218)
Accumulation (1,077)
Energy consumption (420)
Food consumption (127)
Export (132)
Volume reduction (241)
Disposal (56)
Natural restoration
(84)
Waste generation
(600)
Total input (2,130)
Natural resources
input(1,912)
Import (788)
Products (70)
Domestic resources (1,124)
Recycled (218)
Accumulation (1,077)
Energy consumption (420)
Food consumption (127)
Export (132)
Volume reduction (241)
Disposal (56)
Natural restoration
(84)
Waste generation
(600)
Total input (2,130)
Natural resources
input(1,912)
Import (788)
Fig.7.1. Material flow in Japan in 2000 (million-ton/year), translated and repro-duced from the Ministry of Environment [2]
Through this figure, we can understand the current situation of material use, and may consider opportunities to improve it as part of the goal of achieving a more sustainable society. We can also analyze specific mate-

7. Holistic Approaches for Impact Assessment 131
rials to understand the situation of each material precisely and to advance more concrete proposals for improving its flow.
When we focus on the flows not only across the boundaries of a subject, but also within a subject, then analyze these flows, it is called “Resource Flow Analysis” or “Material Flow Analysis (MFA).” Many studies to date have been focused on one element (atom) or one substance, such as metals and greenhouse gasses, as the target subject, then called “Elemental Flow Analysis” or “Substance Flow Analysis” [1]. “Material Flow Analysis” is an attractive tool for solid waste and wastewater management, with organ-ic and nutrient flows considered as the target areas. There have been sever-al studies to analyze organic and nutrient flows for discussing the influence of solid waste and wastewater management [3,4,5].
Figure 7.2 shows the estimated nitrogen flows in urban districts of Hai-phong city, the third largest city in Vietnam [6]. In this analysis, the nitro-gen flows related to solid waste and sanitation issues are focused, then eight components for nitrogen flows: agriculture, food factories, food mar-kets, households, solid waste collection, septic tanks for human excreta treatment, organic waste composting and landfills are selected. It indicates that food imports account for two-thirds of total nitrogen input to the target area. Raw materials to industry and the import of chemical fertilizer ac-count for more than 10% of the total nitrogen input. Regarding the nitro-gen output from the target area, direct disposal of septage to the environ-ment has the highest contribution with 20% of the total output. Discharge of seepage from septic tanks and grey water also made up a significant portion, around 15% of the total output. Food imports are hard to control in terms of nutrient management, but appropriate management of septage from septic tanks can be managed and is the most important issue as iden-tified through this analysis.
7.3 Induced environmental burdens and Life Cycle Assessment
If we install a treatment plant for septage, and remove nitrogen by denitri-fication or by composting the product, we can decrease discharge to the environment by a significant amount, as shown in Figure 7.2. However, construction and operation of a treatment plant may require a huge amount of energy and materials, such as cement and steel. In the process of min-ing, refining and transporting these inputs, we may discharge pollutants in-to the environment. This means that we may shift environmental burdens from local nitrogen pollution to other regional or global problems. Such a
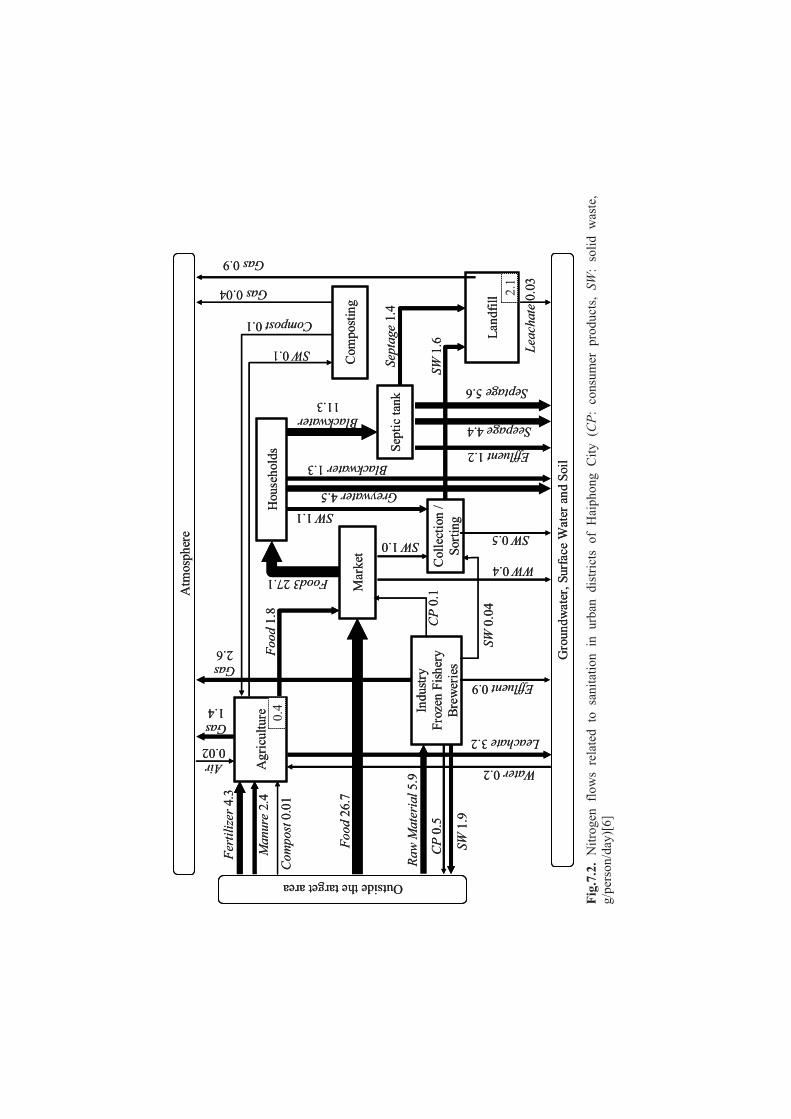
Agr
icul
ture
Mar
ket
Hou
seho
lds
Com
post
ing
Land
fill
Sept
ic ta
nk
Indu
stry
Froz
en F
isher
yBr
ewer
ies
Air 0.02
Gas 1.4
Gas 2.6
Leachate3.2
Effluent 0.9
SW 1
.9
WW0.4
SW 1.1
SW 1.0
Septage5.6
Effluent 1.2
Gas 0.04
Fert
ilize
r 4.3
Food
1.8
Food
26.
7
Raw
Mat
eria
l 5.9
CP
0.5
SW 0
.04
Sept
age
1.4
Atm
osph
ere
Gro
undw
ater
, Sur
face
Wat
er a
nd S
oil
CP
0.1
Leac
hate
0.03
Compost 0.1
Water 0.2
Man
ure
2.4
Col
lect
ion
/ So
rting
SW 0.1
SW0.5
SW 1
.6
Food3 27.1
Blackwater11.3
Greywater4.5
Blackwater1.3
Seepage4.4
Gas 0.9
Com
post
0.01
0.4
2.1
Outside the target area
Fi
g.7.
2. N
itrog
en f
low
s re
late
d to
san
itatio
n in
urb
an d
istri
cts
of H
aiph
ong
City
(C
P: c
onsu
mer
pro
duct
s, SW
: so
lid w
aste
, g/
pers
on/d
ay)[
6]

7. Holistic Approaches for Impact Assessment 133
induced environmental burdens are sometimes significant, so careful con-sideration is necessary when we plan to have such facilities.
Life Cycle Assessment (LCA) is a widely used tool for evaluating direct and induced environmental impacts associated with products and systems. The focus of LCA is on the entire life cycle of the product, i.e. from the extraction of the raw materials through the production of materials and components, then through the manufacture, transportation and use of the product and finally to the product’s disposal or possible recycling, as shown in Figure 7.3. The methodology of LCA contains four main phases: (i) Goal and Scope Definition, (ii) Inventory Analysis, (iii) Impact As-sessment, and (iv) Interpretation [7], as shown in Figure 7.4.
Consumption
Consumption
Consumption
Air emissions, water emissions, amount of landfill, resource consumption...
Production
Equipment
ProductsProduction
Production
Production
Parts
Energy
MaterialIncineration
Landfill
Recycle
Waste
Waste
Waste
Ash
Consumption
Consumption
Consumption
Air emissions, water emissions, amount of landfill, resource consumption...
Production
Equipment
ProductsProduction
Production
Production
Parts
Energy
MaterialIncineration
Landfill
Recycle
Waste
Waste
Waste
Ash
Fig.7.3. Life cycle of products and induced environmental burdens
Goal and scope definition
Inventory analysis
Impactanalysis
Interpretation
Goal and scope definition
Inventory analysis
Impactanalysis
Interpretation
Fig.7.4. Process of Life Cycle Assessment
In the first phase, the goal and intended use of the LCA, the scope of the assessment concerning system boundaries, functions and flows, the re-quired data quality, the technology and the assessment parameters are de-

134 Toshiya Aramaki
fined. Then, information on inputs (resources and intermediate products) and outputs (emissions, wastes) for all the processes in the target system is collected in the Life Cycle Inventory analysis (LCI). Life Cycle Impact Assessment (LCIA) is the phase where inventory data on inputs and out-puts are translated into indicators about potential impacts on the environ-ment, on human health, and on the availability of natural resources. Final-ly, the results of the LCI and LCIA are interpreted according to the goal of the study and sensitivity and uncertainty analyses are performed to qualify the results and the conclusions in the interpretation phase.
I would like to introduce one example of LCA application for municipal solid waste management [8]. Figure 7.5 shows the system boundary for the treatment systems of municipal solid waste in Sao Paulo for evaluating the environmental performance of direct landfill and incineration. It is as-sumed that they have a power generation facility in the incineration plant, and a leachate treatment facility in the landfill. Generated electricity in the incineration plant is assumed to be substituted for electricity from the power company, and power generation at the power company is also con-sidered within the boundary. According to this boundary, the life cycle in-ventory for treating one ton of waste of average composition has been es-timated in Table 7.1. Figure 7.6 shows the estimated impact on global warming, acidification and nutrient pollution by these two alternatives. These values are calculated from inventory results, and a set of impact po-tentials for each pollutant on target environmental issues such as Global Warming Potential (GWP) has been estimated.
Municipal solid waste, 1 ton
Incineration LandfillEnergy
Consumer
Power company
Leachatetreatment
Air emissions
Water emissions
Ash
Electricity Wastewater
Electricity
Municipal solid waste, 1 ton
Incineration LandfillEnergy
Consumer
Power company
Leachatetreatment
Air emissions
Water emissions
Ash
Electricity Wastewater
Electricity
Fig.7.5. System boundary for LCA on municipal solid waste treatment
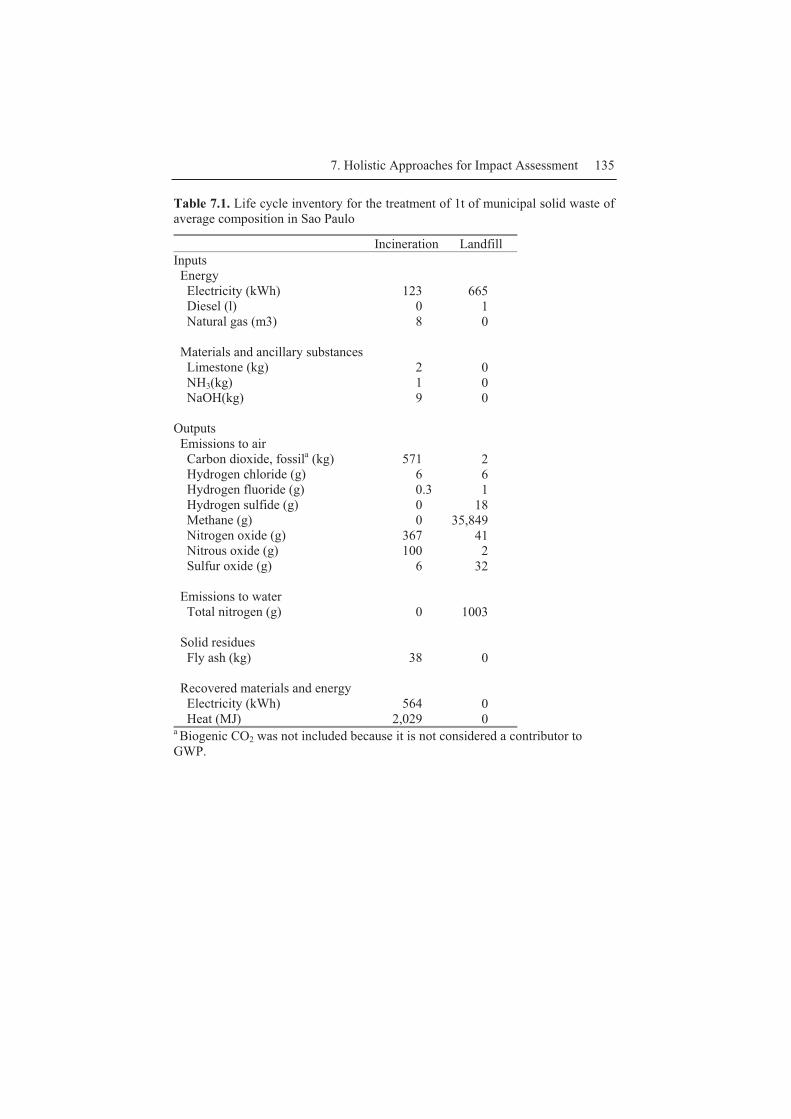
7. Holistic Approaches for Impact Assessment 135
Table 7.1. Life cycle inventory for the treatment of 1t of municipal solid waste of average composition in Sao Paulo
Incineration Landfill Inputs Energy
Electricity (kWh) Diesel (l) Natural gas (m3)
Materials and ancillary substances
Limestone (kg) NH3(kg) NaOH(kg)
Outputs Emissions to air
Carbon dioxide, fossila (kg) Hydrogen chloride (g) Hydrogen fluoride (g) Hydrogen sulfide (g) Methane (g) Nitrogen oxide (g) Nitrous oxide (g) Sulfur oxide (g)
Emissions to water
Total nitrogen (g) Solid residues
Fly ash (kg) Recovered materials and energy
Electricity (kWh) Heat (MJ)
123
0 8
2 1 9
571 6 0.3 0 0
367 100
6
0
38
564 2,029
665 1 0
0 0 0
2 6 1
18 35,849
41 2
32
1003
0
0 0
a Biogenic CO2 was not included because it is not considered a contributor to GWP.
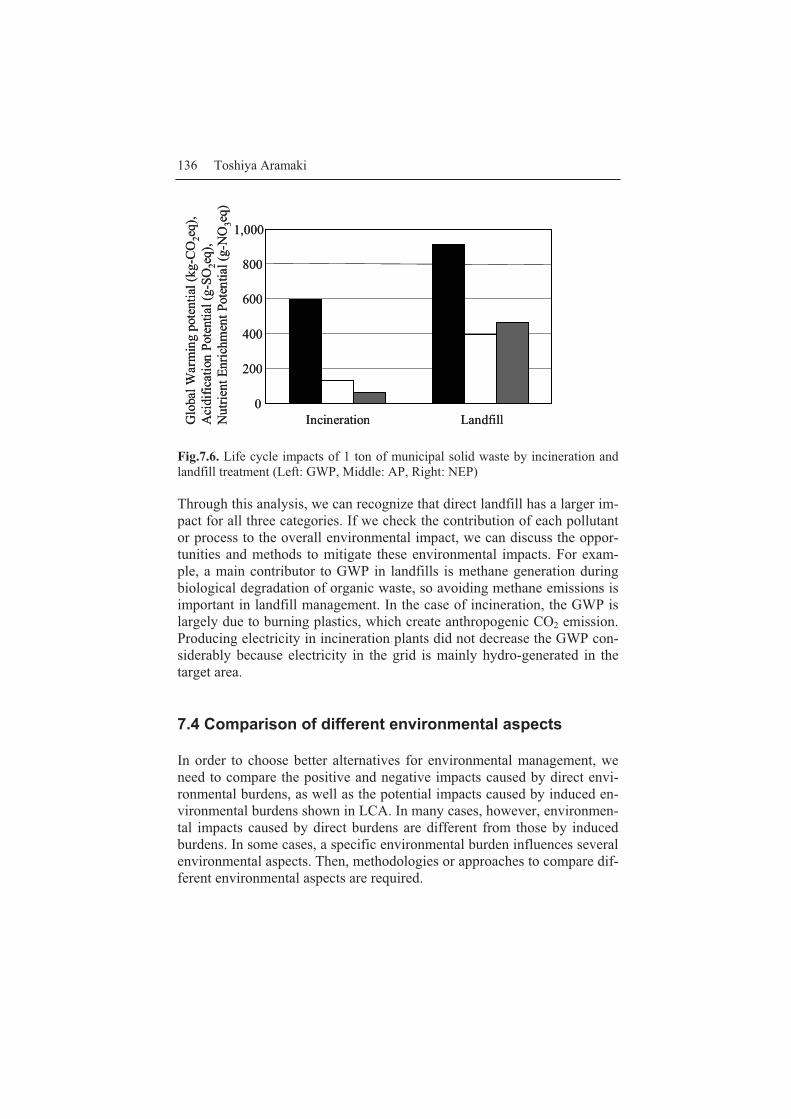
136 Toshiya Aramaki
Glo
bal W
arm
ing
pote
ntia
l (kg
-CO
2eq)
,A
cidi
ficat
ion
Pote
ntia
l (g-
SO2e
q),
Nut
rient
Enr
ichm
ent P
oten
tial (
g-N
O3e
q)
0
200
400
600
800
1,000
Incineration LandfillGlo
bal W
arm
ing
pote
ntia
l (kg
-CO
2eq)
,A
cidi
ficat
ion
Pote
ntia
l (g-
SO2e
q),
Nut
rient
Enr
ichm
ent P
oten
tial (
g-N
O3e
q)
0
200
400
600
800
1,000
Incineration Landfill
Fig.7.6. Life cycle impacts of 1 ton of municipal solid waste by incineration and landfill treatment (Left: GWP, Middle: AP, Right: NEP)
Through this analysis, we can recognize that direct landfill has a larger im-pact for all three categories. If we check the contribution of each pollutant or process to the overall environmental impact, we can discuss the oppor-tunities and methods to mitigate these environmental impacts. For exam-ple, a main contributor to GWP in landfills is methane generation during biological degradation of organic waste, so avoiding methane emissions is important in landfill management. In the case of incineration, the GWP is largely due to burning plastics, which create anthropogenic CO2 emission. Producing electricity in incineration plants did not decrease the GWP con-siderably because electricity in the grid is mainly hydro-generated in the target area.
7.4 Comparison of different environmental aspects
In order to choose better alternatives for environmental management, we need to compare the positive and negative impacts caused by direct envi-ronmental burdens, as well as the potential impacts caused by induced en-vironmental burdens shown in LCA. In many cases, however, environmen-tal impacts caused by direct burdens are different from those by induced burdens. In some cases, a specific environmental burden influences several environmental aspects. Then, methodologies or approaches to compare dif-ferent environmental aspects are required.

7. Holistic Approaches for Impact Assessment 137
In Life Cycle Impact Analysis, several methodologies have been devel-oped to integrate impacts in different environmental aspects into the same unit, then to compare different environmental aspects. For example, Eco-Indicator99 [9] and LIME [10] integrate different environmental impacts into a few targets for environmental management, called a safeguard sub-ject. The integration approach is shown in Figure 7.7. This approach is considered a “damage-oriented approach” because it is based on the rela-tionships how inputs and outputs influence on mid-point impact categories, and how mid-point impact affected to the safeguard subject
Use of non-renewable resources
Global warmingOzone depletionHuman toxicityEcosystem toxicityAcidificationEutrophicationOrganic pollution in
waterSmog, Noiseetc.
Fuels & energyRaw materials(Land)(Water)
Solid wasteAir: GHGs, NOX,
SOX, etc.Water: Acid, nitrates,
phosphates, etc.Waste heat
Inputs and outputs
Human healthEcosystemQuality of LifeEconomic lossetc.
Mid point impact categories
Safeguard subject (End point impact
categories)
Fig.7.7. Damage-oriented approach for Life Cycle Impact Assessment
Using this approach, we can compare the different impacts of various types of environmental management on the same safeguard subject. The installation of urban wastewater systems gives us one good example. In-stallation would mitigate some environmental impacts on received water bodies, such as reduction of the risk of infection with waterborne patho-gens for those who get in contact with contaminated water, but the con-struction and operation of these systems have been proven to cause many other kinds of environmental burdens, such as an increase in greenhouse gasses (GHGs), and in hazardous pollutants discharged to air, water and soil. Thus, there is a trade-off between the reduction of health risk by pa-thogens and the increase of health risk by induced environmental burdens.
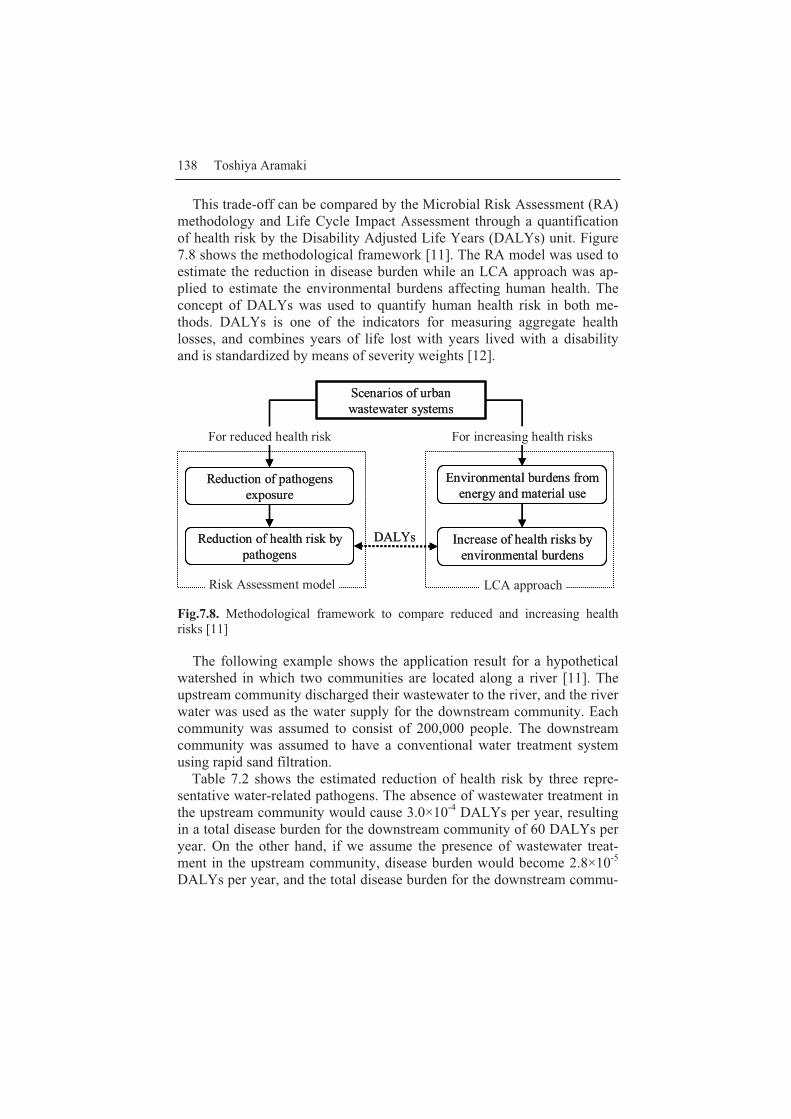
138 Toshiya Aramaki
This trade-off can be compared by the Microbial Risk Assessment (RA) methodology and Life Cycle Impact Assessment through a quantification of health risk by the Disability Adjusted Life Years (DALYs) unit. Figure 7.8 shows the methodological framework [11]. The RA model was used to estimate the reduction in disease burden while an LCA approach was ap-plied to estimate the environmental burdens affecting human health. The concept of DALYs was used to quantify human health risk in both me-thods. DALYs is one of the indicators for measuring aggregate health losses, and combines years of life lost with years lived with a disability and is standardized by means of severity weights [12].
Scenarios of urban wastewater systems
Reduction of pathogens exposure
Reduction of health risk by pathogens
For reduced health risk
Environmental burdens from energy and material use
Increase of health risks by environmental burdens
For increasing health risks
DALYs
Risk Assessment model LCA approach
Scenarios of urban wastewater systems
Reduction of pathogens exposure
Reduction of health risk by pathogens
For reduced health risk
Environmental burdens from energy and material use
Increase of health risks by environmental burdens
For increasing health risks
DALYs
Risk Assessment model LCA approach Fig.7.8. Methodological framework to compare reduced and increasing health risks [11]
The following example shows the application result for a hypothetical watershed in which two communities are located along a river [11]. The upstream community discharged their wastewater to the river, and the river water was used as the water supply for the downstream community. Each community was assumed to consist of 200,000 people. The downstream community was assumed to have a conventional water treatment system using rapid sand filtration.
Table 7.2 shows the estimated reduction of health risk by three repre-sentative water-related pathogens. The absence of wastewater treatment in the upstream community would cause 3.0×10⁻⁴ DALYs per year, resulting in a total disease burden for the downstream community of 60 DALYs per year. On the other hand, if we assume the presence of wastewater treat-ment in the upstream community, disease burden would become 2.8×10⁻⁵ DALYs per year, and the total disease burden for the downstream commu-
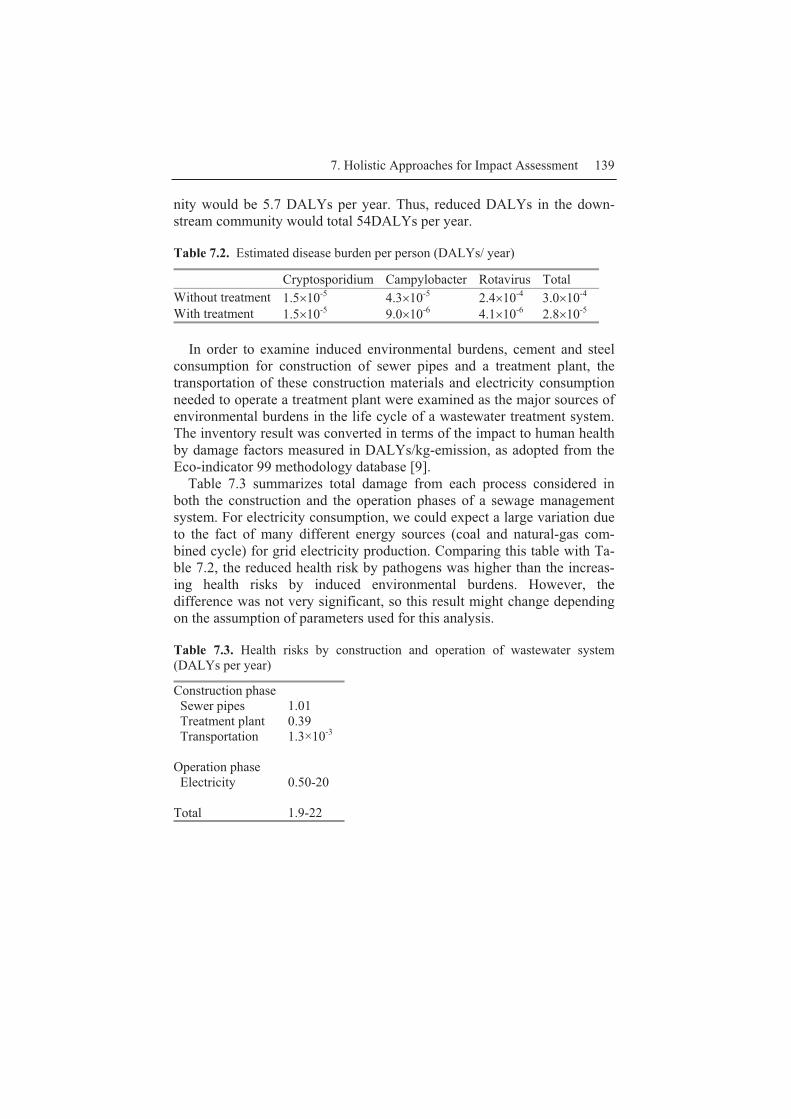
7. Holistic Approaches for Impact Assessment 139
nity would be 5.7 DALYs per year. Thus, reduced DALYs in the down-stream community would total 54DALYs per year.
Table 7.2. Estimated disease burden per person (DALYs/ year)
Cryptosporidium Campylobacter Rotavirus Total Without treatment 1.5�10-5 4.3�10-5 2.4�10-4 3.0�10-4 With treatment 1.5�10-5 9.0�10-6 4.1�10-6 2.8�10-5
In order to examine induced environmental burdens, cement and steel consumption for construction of sewer pipes and a treatment plant, the transportation of these construction materials and electricity consumption needed to operate a treatment plant were examined as the major sources of environmental burdens in the life cycle of a wastewater treatment system. The inventory result was converted in terms of the impact to human health by damage factors measured in DALYs/kg-emission, as adopted from the Eco-indicator 99 methodology database [9].
Table 7.3 summarizes total damage from each process considered in both the construction and the operation phases of a sewage management system. For electricity consumption, we could expect a large variation due to the fact of many different energy sources (coal and natural-gas com-bined cycle) for grid electricity production. Comparing this table with Ta-ble 7.2, the reduced health risk by pathogens was higher than the increas-ing health risks by induced environmental burdens. However, the difference was not very significant, so this result might change depending on the assumption of parameters used for this analysis.
Table 7.3. Health risks by construction and operation of wastewater system (DALYs per year)
Construction phase Sewer pipes Treatment plant Transportation
Operation phase Electricity
Total
1.01 0.39 1.3×10⁻³ 0.50-20 1.9-22
140 Toshiya Aramaki
7.5 Holistic assessment of various environmental aspects
We can compare different environmental aspects affecting the same target for environmental management, as in the above example. In many cases, however, we need to compare different environmental aspects relating to different targets of environmental management. For example, if water quality improvement in a nearby lake requires energy and resource con-sumption, then we need to compare improvement of quality of life (QoL) for nearby residents with the increasing global or regional human health impact and economic loss by induced environmental burdens.
There are basically two approaches to compare different targets of envi-ronmental management. One is to convert all aspects or targets of envi-ronmental management into a monetary value, then compare them. The other is direct weighting of different aspects or targets of environmental management, either by expert opinions or citizen preferences.
For the former approach, there are a variety of methods of estimating the economic value of the environment [13]. Basically these methods are categorized into revealed preference methods and stated preference me-thods. Revealed preference methods make use of the actual behavior of people, and include travel cost demand models, hedonic property value models. Stated preference methods draw their data from people’s res-ponses to hypothetical questions, so it can be widely applied for valuation of all environmental aspects. The Contingent Valuation Method (CVM) is one of the most frequently used methods among stated preference me-thods. An individual’s willingness to pay (WTP) for the improvement of environmental aspects can be elicited through questionnaire or interview surveys.
Figure 7.9 introduces you to one example of applying these economic valuation methods for the holistic assessment of environmental perfor-mance, in this case, lake water quality management [14]. Process steps on the left side of the figure show the approach of economic valuation of lake water quality improvement. After estimating the degree of water quality improvement by each measure using simulation models, the CVM for nearby residents was applied to obtain a monetary value of water quality improvement. Because the value of water quality is different in each lake or water body depending on how citizens use it or its importance to citi-zens, CVM is a suitable method for economic valuation considering target characteristics through a questionnaire survey of local citizens. Process steps on the right side of the figure show the approach of economic valua-tion of global warming caused by induced CO2 emission according to measures of water quality improvement. Life Cycle Inventory Analysis
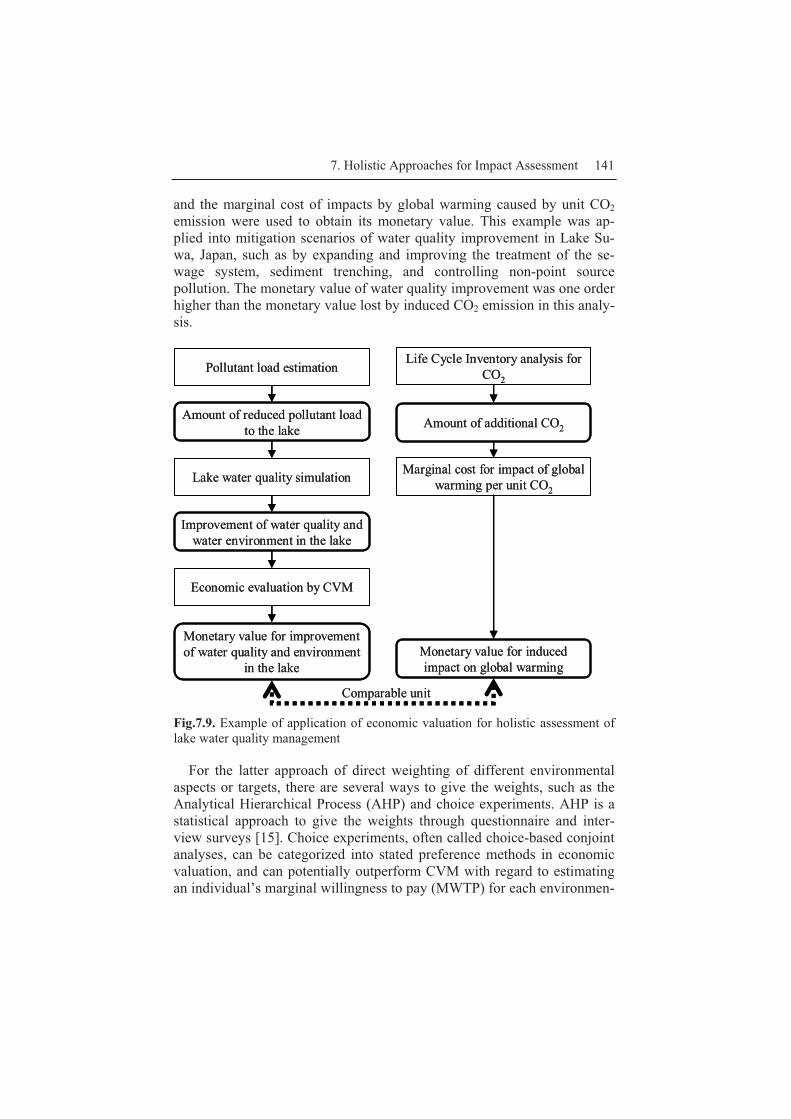
7. Holistic Approaches for Impact Assessment 141
and the marginal cost of impacts by global warming caused by unit CO2 emission were used to obtain its monetary value. This example was ap-plied into mitigation scenarios of water quality improvement in Lake Su-wa, Japan, such as by expanding and improving the treatment of the se-wage system, sediment trenching, and controlling non-point source pollution. The monetary value of water quality improvement was one order higher than the monetary value lost by induced CO2 emission in this analy-sis.
Amount of reduced pollutant load to the lake
Life Cycle Inventory analysis for CO2
Amount of additional CO2
Pollutant load estimation
Lake water quality simulation
Improvement of water quality and water environment in the lake
Economic evaluation by CVM
Monetary value for improvement of water quality and environment
in the lake
Marginal cost for impact of global warming per unit CO2
Monetary value for induced impact on global warming
Comparable unit
Amount of reduced pollutant load to the lake
Life Cycle Inventory analysis for CO2
Amount of additional CO2
Pollutant load estimation
Lake water quality simulation
Improvement of water quality and water environment in the lake
Economic evaluation by CVM
Monetary value for improvement of water quality and environment
in the lake
Marginal cost for impact of global warming per unit CO2
Monetary value for induced impact on global warming
Comparable unit Fig.7.9. Example of application of economic valuation for holistic assessment of lake water quality management
For the latter approach of direct weighting of different environmental aspects or targets, there are several ways to give the weights, such as the Analytical Hierarchical Process (AHP) and choice experiments. AHP is a statistical approach to give the weights through questionnaire and inter-view surveys [15]. Choice experiments, often called choice-based conjoint analyses, can be categorized into stated preference methods in economic valuation, and can potentially outperform CVM with regard to estimating an individual’s marginal willingness to pay (MWTP) for each environmen-

142 Toshiya Aramaki
tal impact. This can then be converted to the relative importance of the dif-ferent types of environmental aspects. In brief, a choice experiment asks individuals to choose the most preferred alternative in each choice set. Each alternative consists of several attributes and several choice sets are presented to each individual [16]. If one of the attributes has a monetary price, then it is possible to judge the respondents’ MWTPs for the other attributes on the basis of the responses.
Figure 7.10 shows the example of choice experiment applied in the ho-listic assessment of source separation, collection and treatment of munici-pal solid waste [17]. Five aspects were chosen, such as health impacts due
Cost
Preference for source separation
Capacity of final disposal site
Health impact by air pollution
Resource depletion
Global warming
Collection and treatment cost
Source separation or not
Amount of final disposal
SO2, NOx and PM emissions
Fossil fuel consumption
Greenhouse gas emissions
Remaining life years of
disposal site
Health damage in DALYs
Weighting by EPS method
Weighting by EPS method
Soci
al b
enef
its a
nd c
osts
Cho
ice
expe
rim
ent
Fig.7.10. Application of choice experiment for holistic assessment on municipal solid waste management.
to local air pollution, global warming, resource depletion, the capacity of the final disposal site, and people’s preference for source separation. Among these, the health impacts of local air pollution, the final disposal capacity and people’s preference for source separation were analyzed with costs by choice experiment. Next they were compared with each other, and finally their monetary values were estimated to compare global warming and resource depletion. This framework was applied to Kawasaki, Japan, and the choice experiment was carried out through questionnaires to the
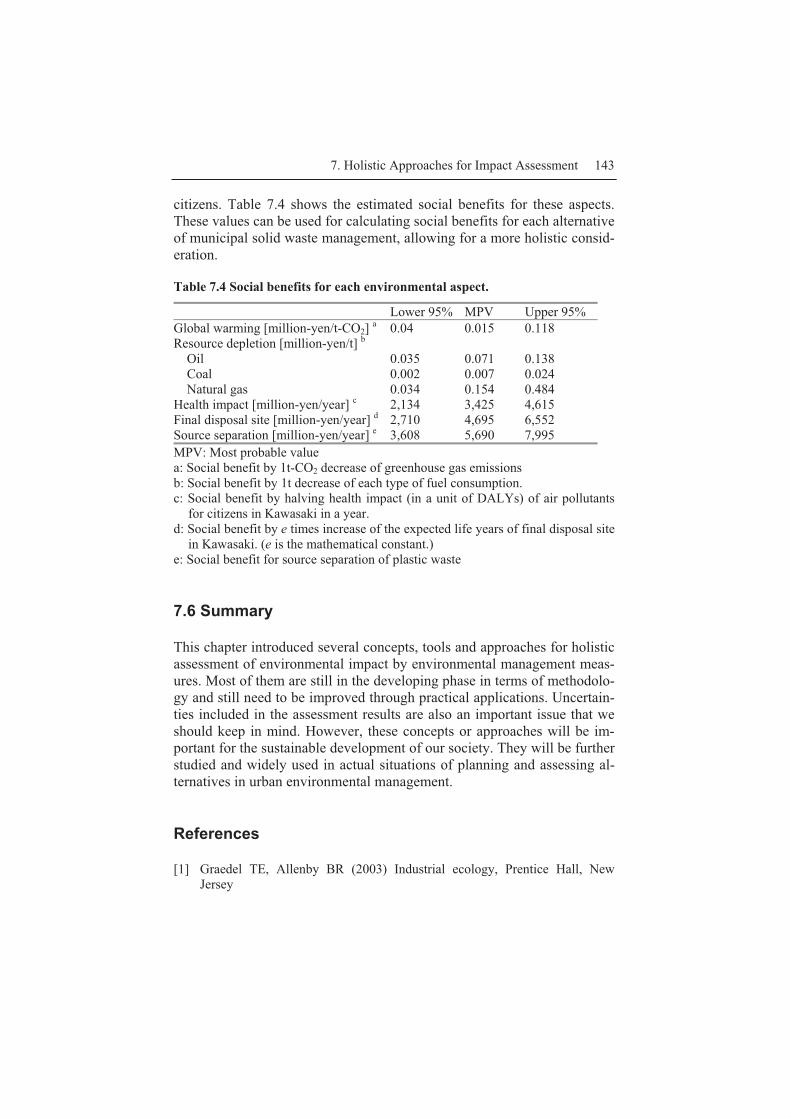
7. Holistic Approaches for Impact Assessment 143
citizens. Table 7.4 shows the estimated social benefits for these aspects. These values can be used for calculating social benefits for each alternative of municipal solid waste management, allowing for a more holistic consid-eration.
Table 7.4 Social benefits for each environmental aspect.
Lower 95% MPV Upper 95% Global warming [million-yen/t-CO2] a 0.04 0.015 0.118 Resource depletion [million-yen/t] b
Oil Coal Natural gas
0.035 0.002 0.034
0.071 0.007 0.154
0.138 0.024 0.484
Health impact [million-yen/year] c 2,134 3,425 4,615 Final disposal site [million-yen/year] d 2,710 4,695 6,552 Source separation [million-yen/year] e 3,608 5,690 7,995 MPV: Most probable value a: Social benefit by 1t-CO2 decrease of greenhouse gas emissions b: Social benefit by 1t decrease of each type of fuel consumption. c: Social benefit by halving health impact (in a unit of DALYs) of air pollutants
for citizens in Kawasaki in a year. d: Social benefit by e times increase of the expected life years of final disposal site
in Kawasaki. (e is the mathematical constant.) e: Social benefit for source separation of plastic waste
7.6 Summary
This chapter introduced several concepts, tools and approaches for holistic assessment of environmental impact by environmental management meas-ures. Most of them are still in the developing phase in terms of methodolo-gy and still need to be improved through practical applications. Uncertain-ties included in the assessment results are also an important issue that we should keep in mind. However, these concepts or approaches will be im-portant for the sustainable development of our society. They will be further studied and widely used in actual situations of planning and assessing al-ternatives in urban environmental management.
References
[1] Graedel TE, Allenby BR (2003) Industrial ecology, Prentice Hall, New Jersey
144 Toshiya Aramaki
[2] Ministry of Environment, Japan (2003) White paper on Sound material-cycle society (in Japanese), FY2003 edition
[3] Brunner PH, Rechberger H (2003) Practical handbook of material flow analysis, Lewis Publishers, New York
[4] Brunner PH, Baccini P (1992) Regional material management and environmental protection, Waste Management and Research, 10:203–212
[5] Binder C, Schertenleib R, Diaz JH, Bader HP, Baccini P (1997) Regional water balance as a tool for water management in developing countries, Water Resources Development, 13(1):5–20
[6] Aramaki T, Thuy NTT (2006) Estimation of nitrogen and phosphorus flows by Material Flow Analysis in Haiphong city, Vietnam, Proc. 34th Annual Meeting of Environmental Systems Research, Japan Society of Civil Engineers, pp 45-52
[7] Wenzel, H. (1997). Environmental assessment of products 1997-1998. Michael Hauschild and Leo Alting. London. Chapman & Hall
[8] Mendes MR, Aramaki T, Hanaki K (2004) Comparison of the environmental impact of incineration and landfilling in Sao Paulo City as determined by LCA, Resources, Conservation and Recycling, 41(1):47-63
[9] Goedkoop M and Spriensma R (2001) The Eco-indicator 99 – A damage oriented method for Life Cycle Assessment- methodology report. PRe Consultants B.V.
[10] Istubo N, Inaba A (2004) LIME -A Comprehensive Japanese LCIA Methodology based on Endpoint Modeling-, Proc. of the 6th International Conference on EcoBalance, pp 87-88
[11] Aramaki T, Galal M, Hanaki K (2006) Estimation of reduced and increasing health risks by installation of urban wastewater systems, Water Science and Technology, 53(9):247-252
[12] Murray CJL, Lopez AD (1996) The global burden of disease; a comprehensive assessment of mortality and disability from disease, injury, and risk factors in 1990 and projected to 2020, Global burden of disease and injury series, vol I, WHO/Harvard University Press
[13] Freeman III AM (2003) The measurement of environmental and resource values: Theory and Methods, Resources for the Future, Washington DC
[14] Inaba R, Nakatani J, Aramaki T, Hanaki K (2002) Integrated assessment of environmental improvement in Lake Suwa by multiple countermeasures and impact of global warming by additional CO2 Emission (in Japanese), J Japan Society on Water Environment, 25:635-640
[15] Saaty TL (1980) The Analytic Hierarchy Process: Planning, Priority Setting and Resource Allocation, McGraw-Hill
[16] Carlsson F, Martinsson P (2001) Do hypothetical and actual marginal willingness to pay differ in choice experiments? Application to the valuation of the environment, J Environmental Economics and Management, 41:179–192
[17] Nakatani J, Aramaki T, Hanaki K (2007) Integrated assessment based on cost-benefit analysis considering the preferences for multi-aspect impacts (in Japanese), Environmental Science, 20: in press

8. Risk Assessments in Urban Environment
Kensuke Fukushi
Integrated Research System for Sustainability Science, The University of Tokyo 7-3-1, Hongo, Bunkyo-ku, Tokyo, 113-8654, Japan
8.1 Introduction
Environmental engineering uses the concept of risk assessment to deter-mine risks of adverse effects on people caused by environmental contami-nation. The perception of risk is emphasized in this chapter and like con-ventional risk assessment, a basic concept used to decide environmental regulations or other legislation, there are many conflicts and inconsisten-cies that raise people’s perception of risk. In terms of decision making, the perceived risk is sometimes more important than scientifically determined risk. In order to study the perception of risk, social science, social psychol-ogy or other academic fields may be required.
There are many risks concerning urban air quality. Unlike water, foods or many other things, people cannot choose which air to breathe. That is why urban air quality has to be managed properly by the government. Risk caused by pollutants from vehicle exhaust is not that significant in terms of lethal toxicity. Although vehicle exhaust is the most dominant polluting source in the urban air environment, its carcinogenic risk is very low com-pared to that of smoking and its overall risk is less than that of traffic acci-dents.
Considering the relatively low risk nature of automobile exhaust, there might be hesitation in making efforts to solve urban air quality problems. However, good air quality is one of the most important livability aspects for people in an urban area. This is proved by the fact that poor air quality is one of the major complaints about the environment in Japan, along with

146 Kensuke Fukushi
odor and vibration/noise problems. These three complaints make up about 70% of the total environmental complaints in Japan. Odor is considered as human perception of air quality and such parameter may influence public opinion.
Perceptional and scientific determination of risk has to be investigated together. Unfortunately, however, these two concepts are often considered separately. Some examples of differences between actual risk and per-ceived risk are given below.
Table 8.1 illustrates the perceived risk ranking of certain actions. Re-searchers asked four groups of people to rank the risk of 30 activities and technologies. The four groups consisted of League of Women Voters (LOWV), college students regarded as the general public with a somewhat higher level of education, active club members regarded as environmental-ly conscious people, and risk assessment experts. The LOWV and college students ranked the risk of nuclear power the highest. People are obviously afraid of nuclear power. In reality, however, there have been no big acci-dents in Japan in the last five years. The death toll is only two. On the oth-er hand, many people have been killed by motor vehicles. The national po-lice office in Japan estimates that approximately 8,000 people are killed each year in traffic accidents. Experts ranked nuclear power 20th, a very low rank, while they ranked motor vehicles the highest. In Japan, the high-est cause of death is cancer. But for accidental deaths, traffic accidents are quite familiar for the most of people in urban society. As a whole, there is a wide discrepancy between how ordinary people and experts assess risk.
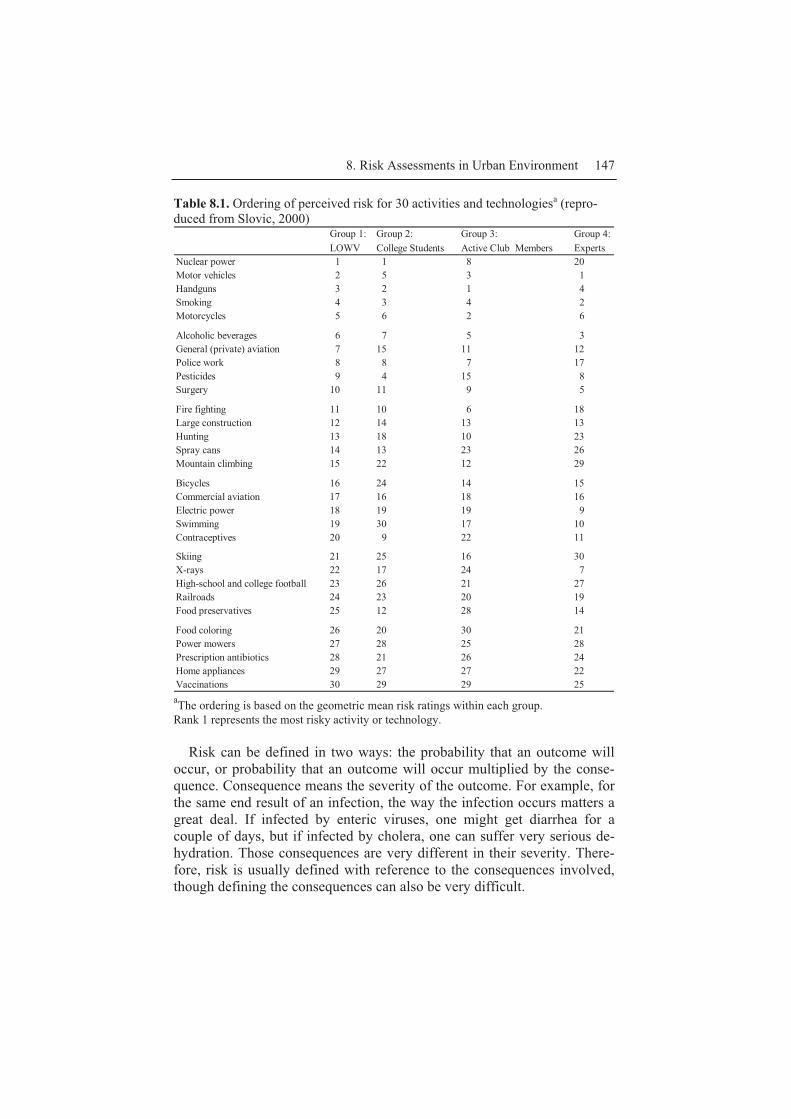
8. Risk Assessments in Urban Environment 147
Table 8.1. Ordering of perceived risk for 30 activities and technologiesa (repro-duced from Slovic, 2000)
Group 1: Group 2: Group 3: Group 4:LOWV College Students Active Club Members Experts
Nuclear power 1 1 8 20Motor vehicles 2 5 3 1Handguns 3 2 1 4Smoking 4 3 4 2Motorcycles 5 6 2 6
Alcoholic beverages 6 7 5 3General (private) aviation 7 15 11 12Police work 8 8 7 17Pesticides 9 4 15 8Surgery 10 11 9 5
Fire fighting 11 10 6 18Large construction 12 14 13 13Hunting 13 18 10 23Spray cans 14 13 23 26Mountain climbing 15 22 12 29
Bicycles 16 24 14 15Commercial aviation 17 16 18 16Electric power 18 19 19 9Swimming 19 30 17 10Contraceptives 20 9 22 11
Skiing 21 25 16 30X-rays 22 17 24 7High-school and college football 23 26 21 27Railroads 24 23 20 19Food preservatives 25 12 28 14
Food coloring 26 20 30 21Power mowers 27 28 25 28Prescription antibiotics 28 21 26 24Home appliances 29 27 27 22Vaccinations 30 29 29 25 aThe ordering is based on the geometric mean risk ratings within each group. Rank 1 represents the most risky activity or technology.
Risk can be defined in two ways: the probability that an outcome will occur, or probability that an outcome will occur multiplied by the conse-quence. Consequence means the severity of the outcome. For example, for the same end result of an infection, the way the infection occurs matters a great deal. If infected by enteric viruses, one might get diarrhea for a couple of days, but if infected by cholera, one can suffer very serious de-hydration. Those consequences are very different in their severity. There-fore, risk is usually defined with reference to the consequences involved, though defining the consequences can also be very difficult.
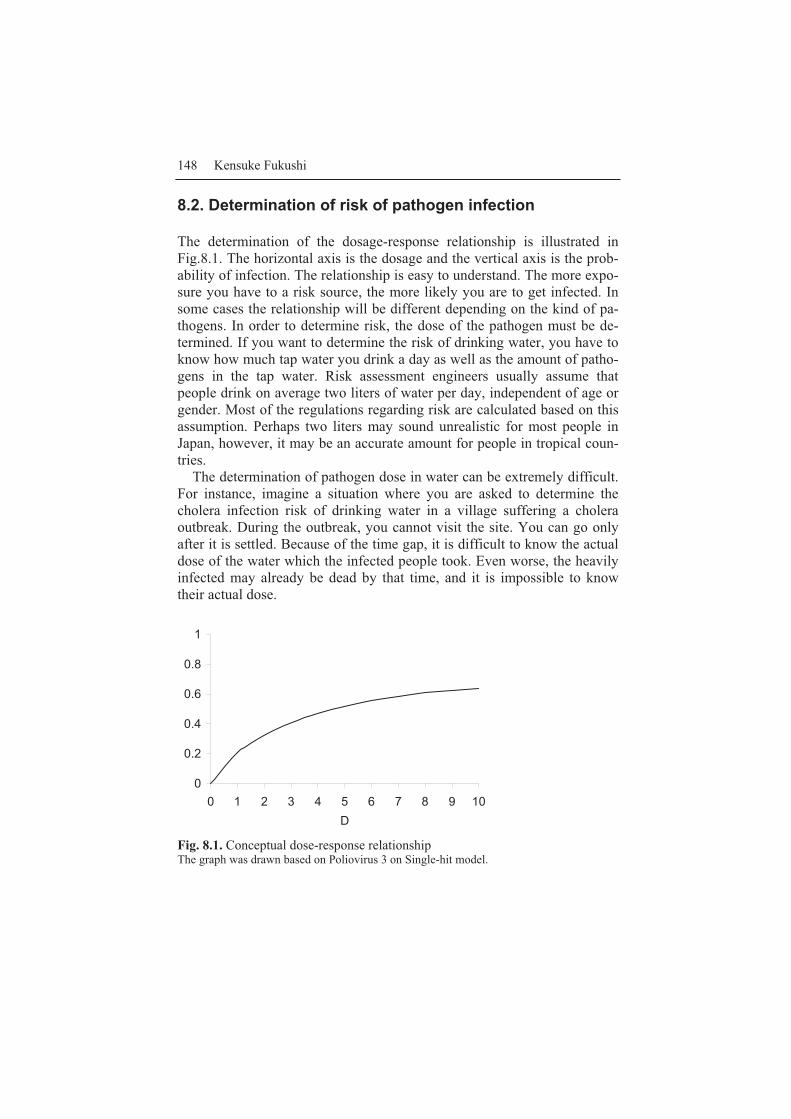
148 Kensuke Fukushi
8.2. Determination of risk of pathogen infection
The determination of the dosage-response relationship is illustrated in Fig.8.1. The horizontal axis is the dosage and the vertical axis is the prob-ability of infection. The relationship is easy to understand. The more expo-sure you have to a risk source, the more likely you are to get infected. In some cases the relationship will be different depending on the kind of pa-thogens. In order to determine risk, the dose of the pathogen must be de-termined. If you want to determine the risk of drinking water, you have to know how much tap water you drink a day as well as the amount of patho-gens in the tap water. Risk assessment engineers usually assume that people drink on average two liters of water per day, independent of age or gender. Most of the regulations regarding risk are calculated based on this assumption. Perhaps two liters may sound unrealistic for most people in Japan, however, it may be an accurate amount for people in tropical coun-tries.
The determination of pathogen dose in water can be extremely difficult. For instance, imagine a situation where you are asked to determine the cholera infection risk of drinking water in a village suffering a cholera outbreak. During the outbreak, you cannot visit the site. You can go only after it is settled. Because of the time gap, it is difficult to know the actual dose of the water which the infected people took. Even worse, the heavily infected may already be dead by that time, and it is impossible to know their actual dose.
0
0.2
0.4
0.6
0.8
1
0 1 2 3 4 5 6 7 8 9 10D
Fig. 8.1. Conceptual dose-response relationship The graph was drawn based on Poliovirus 3 on Single-hit model.
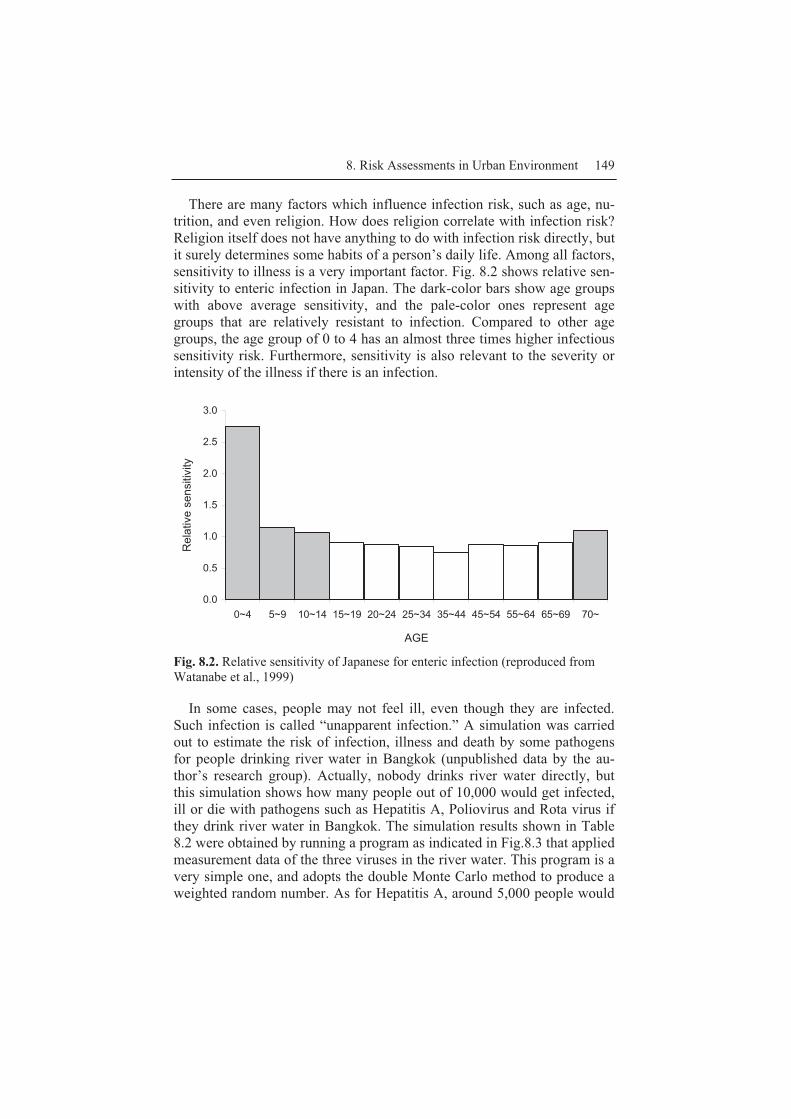
8. Risk Assessments in Urban Environment 149
There are many factors which influence infection risk, such as age, nu-trition, and even religion. How does religion correlate with infection risk? Religion itself does not have anything to do with infection risk directly, but it surely determines some habits of a person’s daily life. Among all factors, sensitivity to illness is a very important factor. Fig. 8.2 shows relative sen-sitivity to enteric infection in Japan. The dark-color bars show age groups with above average sensitivity, and the pale-color ones represent age groups that are relatively resistant to infection. Compared to other age groups, the age group of 0 to 4 has an almost three times higher infectious sensitivity risk. Furthermore, sensitivity is also relevant to the severity or intensity of the illness if there is an infection.
0.0
0.5
1.0
1.5
2.0
2.5
3.0
0~4 5~9 10~14 15~19 20~24 25~34 35~44 45~54 55~64 65~69 70~
AGE
Rel
ativ
e se
nsiti
vity
Fig. 8.2. Relative sensitivity of Japanese for enteric infection (reproduced from Watanabe et al., 1999)
In some cases, people may not feel ill, even though they are infected. Such infection is called “unapparent infection.” A simulation was carried out to estimate the risk of infection, illness and death by some pathogens for people drinking river water in Bangkok (unpublished data by the au-thor’s research group). Actually, nobody drinks river water directly, but this simulation shows how many people out of 10,000 would get infected, ill or die with pathogens such as Hepatitis A, Poliovirus and Rota virus if they drink river water in Bangkok. The simulation results shown in Table 8.2 were obtained by running a program as indicated in Fig.8.3 that applied measurement data of the three viruses in the river water. This program is a very simple one, and adopts the double Monte Carlo method to produce a weighted random number. As for Hepatitis A, around 5,000 people would
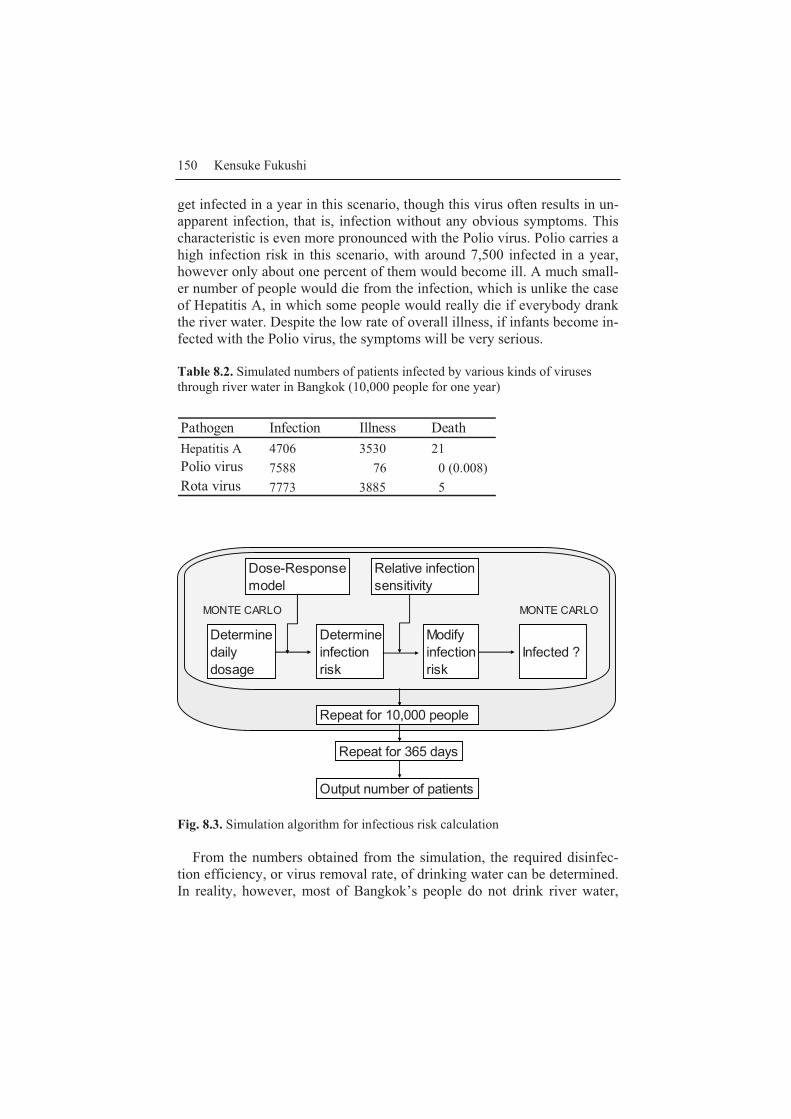
150 Kensuke Fukushi
get infected in a year in this scenario, though this virus often results in un-apparent infection, that is, infection without any obvious symptoms. This characteristic is even more pronounced with the Polio virus. Polio carries a high infection risk in this scenario, with around 7,500 infected in a year, however only about one percent of them would become ill. A much small-er number of people would die from the infection, which is unlike the case of Hepatitis A, in which some people would really die if everybody drank the river water. Despite the low rate of overall illness, if infants become in-fected with the Polio virus, the symptoms will be very serious. Table 8.2. Simulated numbers of patients infected by various kinds of viruses through river water in Bangkok (10,000 people for one year)
Pathogen Infection Illness DeathHepatitis A 4706 3530 21Polio virus 7588 76 0 (0.008)Rota virus 7773 3885 5
Fig. 8.3. Simulation algorithm for infectious risk calculation
From the numbers obtained from the simulation, the required disinfec-tion efficiency, or virus removal rate, of drinking water can be determined. In reality, however, most of Bangkok’s people do not drink river water,
Determine daily dosage
Determineinfection risk
Modify infection risk
Infected ?
MONTE CARLO MONTE CARLO
Dose-Response model
Relative infection sensitivity
Repeat for 10,000 people
Repeat for 365 days
Output number of patients

8. Risk Assessments in Urban Environment 151
even more; tap water, even though water officials declare that the water of Bangkok is safe.
8.3. Case of U.S. beef problem in Japan
This is another example of risk calculation concerning the conflict over the U.S. beef imports from the U.S. to Japan. Nakanishi (2004) calculated how serious or dangerous American beef is, and concluded that overall it is quite safe. Creutzfeldt-Jakob disease (CJD) is caused by abnormal prions from Bovine spongiform encephalopathy (BSE) infected cattle, which are a type of protein and can convert healthy brain cells into nonfunctional ones. As there is no method of curing this disease, it is a big fear for the general public. If people are infected, they first suffer brain-related ill-nesses, and then die. For American beef by 0.1% examination rate, the risk of infection of CJD was calculated at 1/12 billion by Nakanishi�2004�. Is this low or high? Judging from the U.S.’s Environmental Protection Agency’s acceptance level of lifetime risk being 10-7, and 10-4 for annual risk, the risk of 1 in 12 billion is extremely low. In case of Japanese beef by 100% examination, the risk is 1/60 trillion. This means that in the case of Japanese beef, we expect one case of CJD every 60,000 years. Even in the case of Japanese beef without any examination and without an attempt to eliminate the most risky portions of beef such as brains, the risk is 1 in 36 billion, which is also very low. What about the death risk of tap water in Japan? It is less than 1 in 3 billion (based on the fact that there has not been a single case of death obviously caused by tap water for the last 30 years in a population of 100 million), but this is still ten times more dan-gerous than eating Japanese beef.
Returning to the CJD risk, there is a natural occurrence of CJD disease at a 1 in 1 million probability, and this is independent of region, age, race, etc. Japan experiences around a hundred cases of CJD every year regard-less of the problem of BSE infected cattle. The facts mentioned above sup-port the position of U.S. officials and beef exporters. Japanese side, by knowing this conclusion from the risk calculation, still insists on complete (100%) examination of beef to confirm “zero risk.” A hundred percent ex-amination would decrease the risk by around ten times. This is not a big difference but there is still an emotional push for reducing this risk where possible. Risk perception is quite different from the scientifically, or logi-cally, determined risk. However, voice from public is very important for the government although they are illogical.
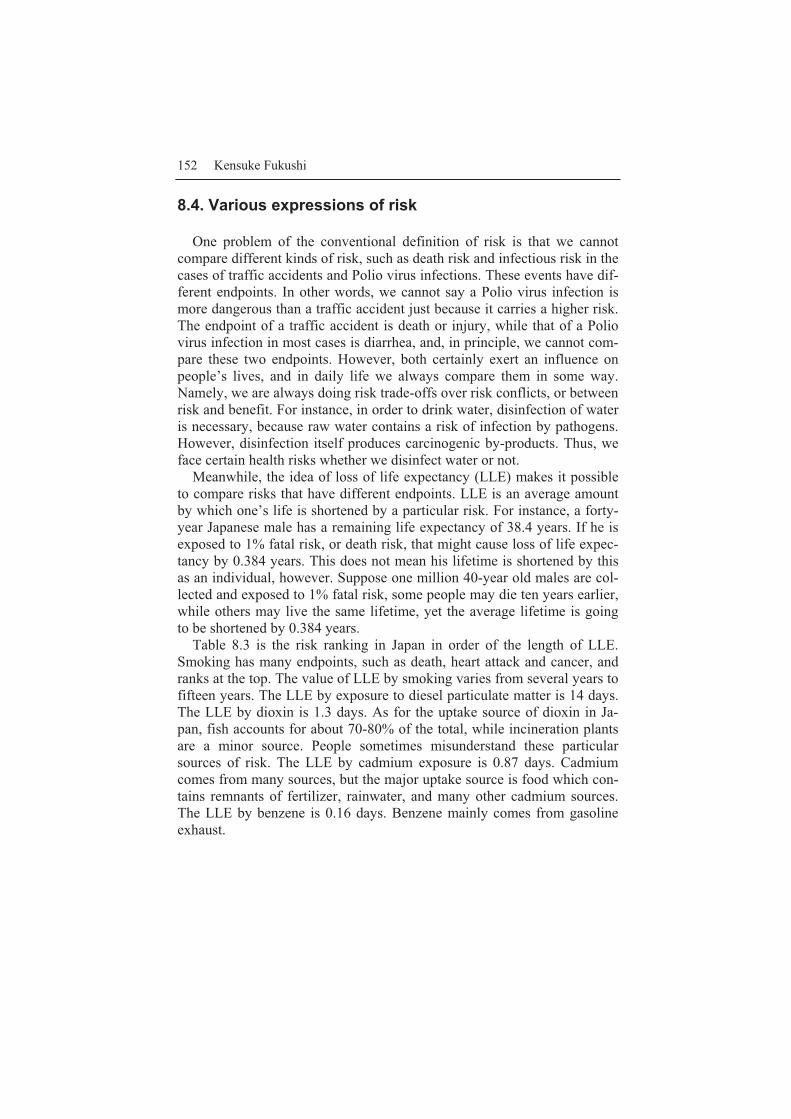
152 Kensuke Fukushi
8.4. Various expressions of risk
One problem of the conventional definition of risk is that we cannot compare different kinds of risk, such as death risk and infectious risk in the cases of traffic accidents and Polio virus infections. These events have dif-ferent endpoints. In other words, we cannot say a Polio virus infection is more dangerous than a traffic accident just because it carries a higher risk. The endpoint of a traffic accident is death or injury, while that of a Polio virus infection in most cases is diarrhea, and, in principle, we cannot com-pare these two endpoints. However, both certainly exert an influence on people’s lives, and in daily life we always compare them in some way. Namely, we are always doing risk trade-offs over risk conflicts, or between risk and benefit. For instance, in order to drink water, disinfection of water is necessary, because raw water contains a risk of infection by pathogens. However, disinfection itself produces carcinogenic by-products. Thus, we face certain health risks whether we disinfect water or not.
Meanwhile, the idea of loss of life expectancy (LLE) makes it possible to compare risks that have different endpoints. LLE is an average amount by which one’s life is shortened by a particular risk. For instance, a forty-year Japanese male has a remaining life expectancy of 38.4 years. If he is exposed to 1% fatal risk, or death risk, that might cause loss of life expec-tancy by 0.384 years. This does not mean his lifetime is shortened by this as an individual, however. Suppose one million 40-year old males are col-lected and exposed to 1% fatal risk, some people may die ten years earlier, while others may live the same lifetime, yet the average lifetime is going to be shortened by 0.384 years.
Table 8.3 is the risk ranking in Japan in order of the length of LLE. Smoking has many endpoints, such as death, heart attack and cancer, and ranks at the top. The value of LLE by smoking varies from several years to fifteen years. The LLE by exposure to diesel particulate matter is 14 days. The LLE by dioxin is 1.3 days. As for the uptake source of dioxin in Ja-pan, fish accounts for about 70-80% of the total, while incineration plants are a minor source. People sometimes misunderstand these particular sources of risk. The LLE by cadmium exposure is 0.87 days. Cadmium comes from many sources, but the major uptake source is food which con-tains remnants of fertilizer, rainwater, and many other cadmium sources. The LLE by benzene is 0.16 days. Benzene mainly comes from gasoline exhaust.

8. Risk Assessments in Urban Environment 153
Table 8.3. Loss of life expectancy (LLE) in Japan (modified from Nakanishi, 2004)
Incident LLESmoking (all) Several ~ 10+ yearsDiesel particulate 14 daysDioxins 1.3 daysCadmium 0.87 daysBenzene 0.16 days
Disability adjusted life years (DALY) is another expression of risk. This is employed by the World Health Organization (WHO) for assessing infec-tion risk. It is a measure of premature deaths and losses due to illnesses and disabilities in a population. DALY is calculated by the years of life lost (YLL) plus years lived with disability (YLD). YLL is actual lifetime shortened by some incident. YLD is relatively sensitive and difficult to de-termine. Judgment of degree of disability is determined by an expert group of medical doctors. For example, if you have a problem with your arm, like limited movement, a doctor will judge how much your life is hindered by the disability. In DALY, a life year for 1,000 healthy people has been set as equally valuable as one life year for, for example, 2,660 blind people, or 1,499 deaf people. It means those numbers of people have the same value of life. But who should decide the value of life? I believe it should not be the government, but possibly an individual or God. There-fore, the concept of valuing lives is sometimes considered problematic by the public.
Determining a value for quality of life is also problematic. Quality of life determines that one with a disability has a lower quality of life than a healthy person, but there is the similar problem of disagreement over how we judge it. As none of these expressions of risk, i.e., DALY or QOL, is supported by the public, it is difficult for a government or an international organization to use them to evaluate risk. Under the present circumstances, some people use LLE, and others use DALY. However, some scientists consider those sensitive discussions or philosophical things required in DALY as scientifically weak and avoid them. On the other hand, mathe-matically determined risk is of limited use in these sensitive discussions. Actually, there are some people who try to convert those mathematical risk values based on their own view, though I think this is the wrong approach.
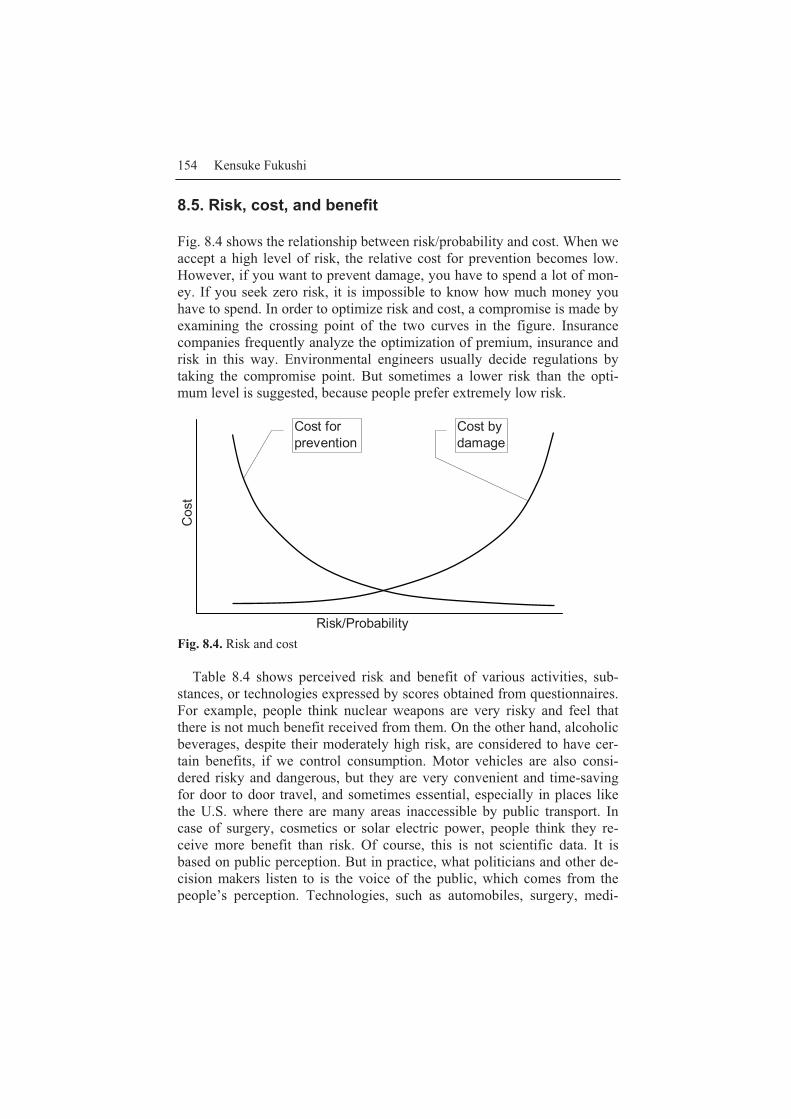
154 Kensuke Fukushi
8.5. Risk, cost, and benefit
Fig. 8.4 shows the relationship between risk/probability and cost. When we accept a high level of risk, the relative cost for prevention becomes low. However, if you want to prevent damage, you have to spend a lot of mon-ey. If you seek zero risk, it is impossible to know how much money you have to spend. In order to optimize risk and cost, a compromise is made by examining the crossing point of the two curves in the figure. Insurance companies frequently analyze the optimization of premium, insurance and risk in this way. Environmental engineers usually decide regulations by taking the compromise point. But sometimes a lower risk than the opti-mum level is suggested, because people prefer extremely low risk.
Risk/Probability
Cos
t
Cost for prevention
Cost by damage
Fig. 8.4. Risk and cost
Table 8.4 shows perceived risk and benefit of various activities, sub-stances, or technologies expressed by scores obtained from questionnaires. For example, people think nuclear weapons are very risky and feel that there is not much benefit received from them. On the other hand, alcoholic beverages, despite their moderately high risk, are considered to have cer-tain benefits, if we control consumption. Motor vehicles are also consi-dered risky and dangerous, but they are very convenient and time-saving for door to door travel, and sometimes essential, especially in places like the U.S. where there are many areas inaccessible by public transport. In case of surgery, cosmetics or solar electric power, people think they re-ceive more benefit than risk. Of course, this is not scientific data. It is based on public perception. But in practice, what politicians and other de-cision makers listen to is the voice of the public, which comes from the people’s perception. Technologies, such as automobiles, surgery, medi-
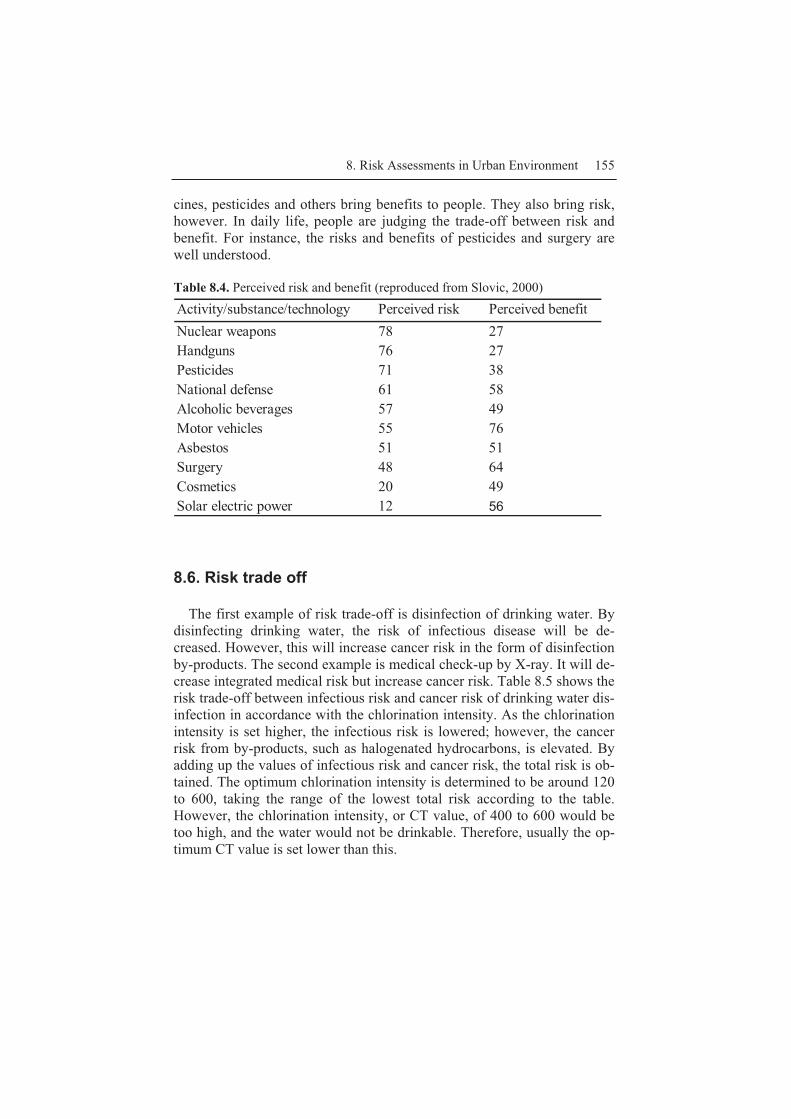
8. Risk Assessments in Urban Environment 155
cines, pesticides and others bring benefits to people. They also bring risk, however. In daily life, people are judging the trade-off between risk and benefit. For instance, the risks and benefits of pesticides and surgery are well understood. Table 8.4. Perceived risk and benefit (reproduced from Slovic, 2000)
Activity/substance/technology Perceived risk Perceived benefitNuclear weapons 78 27Handguns 76 27Pesticides 71 38National defense 61 58Alcoholic beverages 57 49Motor vehicles 55 76Asbestos 51 51Surgery 48 64Cosmetics 20 49Solar electric power 12 56
8.6. Risk trade off
The first example of risk trade-off is disinfection of drinking water. By disinfecting drinking water, the risk of infectious disease will be de-creased. However, this will increase cancer risk in the form of disinfection by-products. The second example is medical check-up by X-ray. It will de-crease integrated medical risk but increase cancer risk. Table 8.5 shows the risk trade-off between infectious risk and cancer risk of drinking water dis-infection in accordance with the chlorination intensity. As the chlorination intensity is set higher, the infectious risk is lowered; however, the cancer risk from by-products, such as halogenated hydrocarbons, is elevated. By adding up the values of infectious risk and cancer risk, the total risk is ob-tained. The optimum chlorination intensity is determined to be around 120 to 600, taking the range of the lowest total risk according to the table. However, the chlorination intensity, or CT value, of 400 to 600 would be too high, and the water would not be drinkable. Therefore, usually the op-timum CT value is set lower than this.
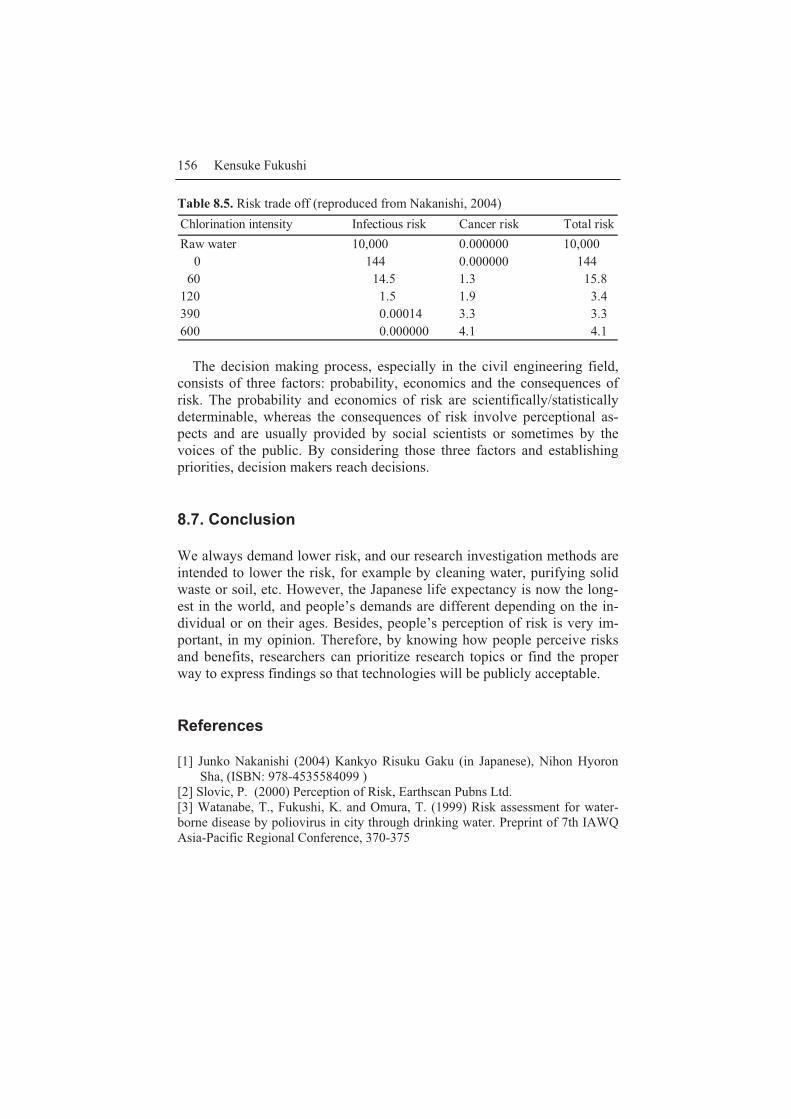
156 Kensuke Fukushi
Table 8.5. Risk trade off (reproduced from Nakanishi, 2004) Chlorination intensity Infectious risk Cancer risk Total riskRaw water 10,000 0.000000 10,000 0 144 0.000000 144 60 14.5 1.3 15.8120 1.5 1.9 3.4390 0.00014 3.3 3.3600 0.000000 4.1 4.1
The decision making process, especially in the civil engineering field,
consists of three factors: probability, economics and the consequences of risk. The probability and economics of risk are scientifically/statistically determinable, whereas the consequences of risk involve perceptional as-pects and are usually provided by social scientists or sometimes by the voices of the public. By considering those three factors and establishing priorities, decision makers reach decisions.
8.7. Conclusion
We always demand lower risk, and our research investigation methods are intended to lower the risk, for example by cleaning water, purifying solid waste or soil, etc. However, the Japanese life expectancy is now the long-est in the world, and people’s demands are different depending on the in-dividual or on their ages. Besides, people’s perception of risk is very im-portant, in my opinion. Therefore, by knowing how people perceive risks and benefits, researchers can prioritize research topics or find the proper way to express findings so that technologies will be publicly acceptable.
References
[1] Junko Nakanishi (2004) Kankyo Risuku Gaku (in Japanese), Nihon Hyoron Sha, (ISBN: 978-4535584099 )
[2] Slovic, P. (2000) Perception of Risk, Earthscan Pubns Ltd. [3] Watanabe, T., Fukushi, K. and Omura, T. (1999) Risk assessment for water-borne disease by poliovirus in city through drinking water. Preprint of 7th IAWQ Asia-Pacific Regional Conference, 370-375

9. Fate of Water-Related Pathogens in Urban Water Systems
Hiroyuki Katayama
Department of Urban Engineering, The University of Tokyo 7-3-1, Hongo, Bunkyo-ku, Tokyo, 113-8656, Japan
9.1 Introduction
Pathogens transmitted via water are some of the most important agents that raise infant mortality rates, which in turn causes high birth rates and a lack of liberty of women in some communities. The social impact of water-borne diseases is very large.
Infectious disease, including Black Death, has influenced human his-tory. For example, the Black Death outbreak in the 14th century in Euro-pean countries was estimated to result in a 25% reduction of the population (25 million deaths). The people at that time were unaware of the cause, due to the absence of any means to detect pathogens. We now know that the bacterium named Yersinia pestis, sometimes carried by fleas on rats or mice, was responsible for this fatal disease. The Spanish Influenza out-break in 1918 had a great impact on human society at that time and partly led to the termination of World War I. Disease control is sometimes a mili-tary concern.
Anthrax, which was used as a nuisance agent attacking the postal system in the U.S. in 2001, was the first microorganism that was proved to cause disease by Robert Koch and Louis Pasteur almost at the same time inde-pendently. In 1884, Koch found that Vibrio cholerae was the agent causing a cholera outbreak via water. Cholera is thought to have been an endemic in Indian countries, but was spread to the rest of the world in 19th century, causing many tragedies.
158 Hiroyuki Katayama
Pathogenic microorganisms are too small to be seen by the naked eye. The invention of the microscope led to the inception of a new branch of knowledge—‘microbiology’, which has been contributing to the elucida-tion of cause and remedy of infectious diseases since 19th century.
One of the most important roles of the water supply and sewerage sys-tems is to protect public health from waterborne pathogens.
This chapter explains the relation between the history of microbiology and the development of water-related infrastructure, followed by an expla-nation of the role of environmental engineering in the protection of public health.
9. 2 Basics of waterborne disease
9.2.1 Life cycle of pathogenic microorganisms
There are many types of pathogens in the world. Why do they exist? If we try to answer this question on an academic basis, we should think
about how they have survived so far in the world. In order to formulate ways to combat pathogens, the strategies adopted by the microbes for sur-vival are of special interest.
They have a life cycle, including a phase of increasing numbers and a phase of transmission to another host. They need to migrate to some “host” after multiplication; without this step their life cycle will remain incom-plete and the entire population may become extinct. As a result, pathogens are circulating in human society, causing diseases for people.
Medical doctors put emphasis on the diagnostic aspects of pathogens, including the mechanisms of infection or of interaction between the patho-gens and hosts. Environmental engineers, on the other hand, must deal with the route of infection. Environmental engineers aim at ensuring a clean environment where the risk of contamination by pathogens is low.
Different routes of infection, such as direct contact, oral uptake, inhala-tion, and through contact with animals, exist. For example, HIV is trans-mitted by sexual intercourse. Meanwhile, V. cholerae and the norovirus are spread through water and food. Pathogens of diseases like influenza may enter the body through inhalation. Insects such as the mosquito may be vectors of fatal diseases (Yellow fever, Malaria and others).

9. Fate of Water-Related Pathogens in Urban Water Systems 159
9.2.2 Water-related pathogens
Water related disease are categorized into five groups, namely waterborne diseases, water-habitat disease, water-washed diseases (caused by lack of water), water- based diseases and water-related, insect vector diseases.
Waterborne diseases
Waterborne diseases include Cholera, Typhoid, bacillary dysentery, infec-tious hepatitis, Giardiasis and diarrhoea caused by enteric viruses. These diseases are initiated by ingesting the causative agents in foods or water. The symptoms are dependent on the pathogenic agents, especially in the cases of poliovirus and hepatitis infection. Others are mostly diarrhoea causing agents, but other symptoms (nausea, vomiting, etc.) are also sometimes observed.
Water-habitat diseases
There are some pathogens that do not infect via faecal-oral infection route. These include opportunistic pathogens which are prevalent in the environ-ment and can grow outside of the host bodies, such as Aeromonas, Le-gionella, Mycobacterium, Pseudomonas and Acanthamoeba. Some of these pathogens are natural inhabitants of certain water environments.
Water-washed diseases
Water-washed diseases include Scabies, skin sepsis and ulcers, Dysenter-ies and Ascariasis. These diseases can be avoided easily by washing ones skin and hands with water. Therefore, these diseases may be related to wa-ter quantity rather than water quality.
Water-based diseases
Water-based diseases include Schistosomiasis, Dracunuliasis and Filariasis which can penetrate into the human body when a person walks in a puddle
160 Hiroyuki Katayama
with bare feet. These phenomena can happen in an area with a water short-age, for instance when young children in bare feet try to drink water in a dirty place. These diseases are also a water quantity issue.
Water-related insect vector disease
Water-related insect vector diseases include Yellow fever, Dengue fever, Bancroftian filariasis, Malaria and Onchocerciasis. These diseases are prevalent in tropical areas. These pathogenic agents can be controlled by management of the water environment, as was proved by Walter Reed dur-ing construction of the Panama Canal.
9.2.3 Pathogens of waterborne diseases
Among the five types of water-related diseases, the latter three are partly social and political problems, since they could be suppressed by simple water supply systems and basic education on public health. On the other hand, waterborne diseases and water-habitat diseases are more difficult problems from the viewpoint of environmental engineering.
The pathogens causing waterborne diseases are limited to those able to survive in an aqueous phase. In terms of the efficiency of infection from emission by one host to contact by a new host, the faecal-oral infection route is the most abundant. This infection route is illustrated in Fig. 9.1.
Pathogens are emitted in an order of 1010 particles or more in faeces from a patient per day. Most of them will die off in the environment, dif-fusing and decreasing their number. But only a small number of pathogens are needed for the next infection, depending on the type of pathogen. Sometimes only one unit of a pathogen can cause infection. Normally, since the conditions outside of a host body are not good for growth, the number of pathogens cannot increase in the environment.
The immune system of the body is working against pathogen infection. It is true that immune systems depend on the individual and their health condition. Minimizing the number of pathogens entering into the body is the most important part of health protection.
Due to increases in human density in urban areas, the pathways of the pathogens have most likely multiplied. Human society has developed vari-ous means of protection against infectious disease.
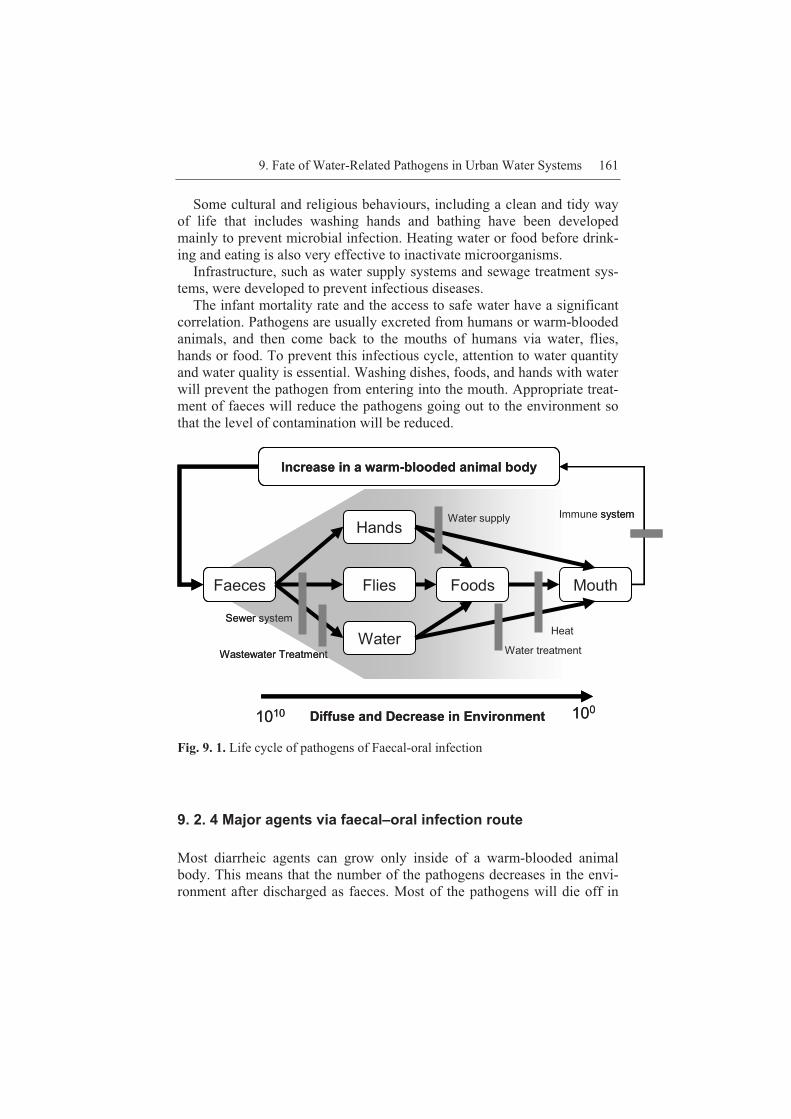
9. Fate of Water-Related Pathogens in Urban Water Systems 161
Some cultural and religious behaviours, including a clean and tidy way of life that includes washing hands and bathing have been developed mainly to prevent microbial infection. Heating water or food before drink-ing and eating is also very effective to inactivate microorganisms.
Infrastructure, such as water supply systems and sewage treatment sys-tems, were developed to prevent infectious diseases.
The infant mortality rate and the access to safe water have a significant correlation. Pathogens are usually excreted from humans or warm-blooded animals, and then come back to the mouths of humans via water, flies, hands or food. To prevent this infectious cycle, attention to water quantity and water quality is essential. Washing dishes, foods, and hands with water will prevent the pathogen from entering into the mouth. Appropriate treat-ment of faeces will reduce the pathogens going out to the environment so that the level of contamination will be reduced.
Fig. 9. 1. Life cycle of pathogens of Faecal-oral infection
9. 2. 4 Major agents via faecal–oral infection route
Most diarrheic agents can grow only inside of a warm-blooded animal body. This means that the number of the pathogens decreases in the envi-ronment after discharged as faeces. Most of the pathogens will die off in
Hands
Faeces Flies
Water
Foods Mouth
Increase in a warm-blooded animal body
Heat
1010 100
Sewer system
Wastewater Treatment
Water supply
Water treatment
Immune system
Diffuse and Decrease in Environment
Hands
Faeces Flies
Water
Foods Mouth
Increase in a warm-blooded animal body
Heat
1010 100
Sewer system
Wastewater Treatment
Water supply
Water treatment
Immune system
Diffuse and Decrease in Environment

162 Hiroyuki Katayama
the external environment, but a very few might be able to reach the mouth of their hosts.
There are three groups of the diarrheic agents (Table 9. 1): bacteria, vi-ruses and protozoa. Bacteria are classic waterborne pathogens. They grow in the body of worm-blooded animals and can be inactivated by chlorine. Coliforms or E. coli are excellent indicators of faecal pathogens.
The viruses are often associated with waterborne diseases; thus, they are of interest to environmental engineers. Viruses behave differently from E. coli since their sizes range 20-100 nm, which is much smaller than E. coli.
Protozoa have high tolerance against chlorine, a common disinfectant. E. coli is not a good indicator for presence of protozoa for this reason.
The classic bacterial agents have been well managed in developed coun-tries, yet emerging and re-emerging infectious diseases are still causing problems. As for waterborne diseases, emerging and re-emerging agents cause less severe diseases than classic ones in general, except for immuno-compromised people. The socio-economic impacts of infectious disease are still large.
Table 9.1. Features of pathogens to be considered in water management
Pathogens Resistance to chlorine Relative infectious dose (i) Bacteria Vibrio Cholerae Campylobacter jejuni Salmonella typhi Shigella spp.
Low Low Low Low
High High High High
(ii) Viruses: Adenovirus Norovirus Enterovirus Hepatitis A viruses Rotavirus
Moderate ? Moderate Moderate ?
Low Low Low Low Moderate
(iii) Protozoa Cryptosporidium spp. Giardia intestinalis
High High
Low Low
9. Fate of Water-Related Pathogens in Urban Water Systems 163
9. 3 History of Microbiology and Epidemiology
9.3.1 Water as an infectious route
John Snow studied Cholera outbreaks in London in the 19th century. He found that a shallow well was responsible for the high mortality of a street in London in 1849, and stopped the use of the pumping station.
He also compared the prevalence of cholera among different areas, and found that water service areas using downstream of the Thames River as the water source had cholera mortality rates eight times higher than the ar-eas upstream. He concluded that the river water and its consumption as drinking water were responsible for the cholera outbreak. This was the first time that water was identified as an infectious route.
9.3.2 Effect of water treatment
Altona and Hamburg, two neighbouring cities in Germany that both used the Elbe River as a water source, were found to have very different mortal-ity rates during an outbreak of Cholera in 1892. This was explained that Altona provided drinking water after slow sand filtration while Hamburg employed only sedimentation. In response, a sand filtration system was in-stalled in Hamburg to reduce the risk of infection.
In the middle of the 19th century, chlorination began to be used in hos-pitals for disinfection, and was then added to many public water supplies. The effectiveness of chlorination was widely known in the 20th century and is now employed worldwide.
Coliforms are microbes which co-exist with the faecal pathogens in the intestines of humans as well as other worm-blooded animals. Hence, the absence of coliforms in water indicates the absence of faecal pathogens.
Pipeline systems were also developed and used in water supply systems. Pipelines prevent pathogenic contamination during distribution due to positive pressure applied in the pipe to avoid intrusion of water from out-side.
164 Hiroyuki Katayama
9.3.3 Modern water supply system
In the 19th century, effective water treatment schemes to combat pathogens were established. The modern water supply system consists of the follow-ing factors: Coagulation using coagulant (Al, etc) to form floccules, sedi-mentation to settle the particle matters to the sediment, sand filtration, (rapid sand filtration is widely used in Japan) and chlorination. To ensure the safety, the absence of total coliforms, thermotolerant coliforms or E. coli is confirmed.
The wastewater treatment has not been considered in relation to infec-tious disease, but rather in terms of environmental issues. For example, Ja-pan started to build modern a water supply in the late 1880s, and covered 80% of the population in 1970. Coverage of wastewater treatment systems, which was only 16% of the population in 1970, increased to 69% in 2005. However, wastewater treatment plants also play an important role in pre-venting the waterborne diseases. The functions of water infrastructures (water supply, sewer system and wastewater treatment) are demonstrated in Fig 9. 1.
9. 4 Removal of Pathogens in Water
9.4.1 Removal efficiency in water purification methods
Role of water purification
The role of water purification is not only to decrease the number of patho-gens but also to enhance the effectiveness of disinfection. Removal of sus-pended solids in this treatment contributes to stable disinfection.
Rapid sand filtration
Rapid sand filtration is used around the world as a standard method of wa-ter treatment. During the treatment, approximately 99% of the pathogens are expected to be eliminated if properly operated. In the maintenance

9. Fate of Water-Related Pathogens in Urban Water Systems 165
stage, reverse washing of the sand is used to renew the clogging effect. Since the washed water contains accumulated pathogens including Crypto-sporidium, this water should not be recycled as source water.
Membrane filtration
Membrane filtration has become a popular water purification method. Ac-cording to the pore size, membranes are categorized as MF (micro filtra-tion), UF (ultra filtration), NF (nanofiltration) and RO (reverse osmosis fil-tration).
During operation, suspended solids in the source water will be rejected by the membrane, together with other impurities including organic matter and metals. Blocking such solids is good from the viewpoint of water qual-ity, but at the same time, this increases the need of maintenance to clear the membranes.
In Japan, the application of chlorine to finished water is mandatory. The most important targets in water treatment are protozoa such as Crypto-sporidium. Membrane filtration is a perfect barrier against Cryptosporid-ium.
Viruses are also removed by membrane filtration. UF, NF and RO have smaller pore sizes than the viruses and are therefore able to reject them. Viruses are not rejected perfectly by MF, which has a larger pore size than the viruses, yet they are removed with the cake layer that forms on the sur-face of the membrane (Otaki et al. 1998).
9.4.2 Disinfection
Chlorination
Chlorine is used worldwide due to its effectiveness as a disinfectant, resid-ual effect and availability. The residual effect is important because a part of the pipeline network of water supply sometimes has negative pressure, and thus, contamination by pathogens may occur. The growth of biofilm in the pipeline is suppressed by residual disinfectants.
The pH value of water should not exceed 8.0 for the efficiency of chlorination.
The reaction of chlorine is:

166 Hiroyuki Katayama
Cl2 + H2O � H+ + Cl- + HOCl (1)
HOCl � H+ + OCl- (2)
Equation (2) is dependent upon pH. At pH levels higher than 8.0, the
dissociated forms (OCl-) predominate, and at a lower pH, undissociated hypochlorous (HOCl) acid predominates. The dissociated forms have less disinfection efficiency due to the repulsive effect against the surface of mi-croorganisms which are normally slightly negatively charged.
Suspended solids, organic matter and ammonia in water also influence the effect of chlorination.
Disinfection by-products (Trihalomethane, Haloacetic acid etc.) are as-sociated with chlorine’s use. Chlorine dioxide and chloramines have been proposed as alternatives to chlorine in this regard. However, chlorine diox-ide is suspected to be carcinogenic, and it is not recommended as a disin-fectant. Chloramines are less effective in inactivation of microorganisms, and moreover, NDMA, a by-product of chloramines, has been found to be extremely toxic to humans. Therefore, the use of chloramines is also not recommended.
Last but not least, chlorine is not effective against protozoa like Crypto-sporidium.
Ozonation
Ozonation is effective for the removal of odour and colour of the water, which are the main reasons for the installation of water purification plants in Japan. Ozone is a strong oxidant creating many active species and re-sults in inactivation of microorganisms, though its mechanism has not been fully elucidated. Ozonation is effective against bacteria, protozoa and vi-ruses.
After ozonation, biological activated carbon filtration is usually applied, and some further reduction of pathogens is also expected.
Ultraviolet irradiation
UV light irradiation is one of the most effective disinfection methods against bacteria, viruses, and protozoa in source water and wastewater. UV
9. Fate of Water-Related Pathogens in Urban Water Systems 167
disinfection systems are easy to maintain, need no additional chemical in-puts and produce no hazardous by-products. Therefore, water treatment plants that utilize UV disinfection processes have increased in number in recent decades.
In the 1990s, Cryptosporidium was the most important pathogen tar-geted by the water treatment industry. The viability of Cryptosporidium oocysts had been examined by excystation, but in the late 1990s it was ex-amined by infection assay using the sensitive mouse or the specific cell line. The newer methods revealed that UV was very effective in inactivat-ing Cryptosporidium (Abbaszadegan et al. 1997).
Inactivation of microorganisms by UV irradiation is effected through the formation of lesions in the genomic DNA of the organisms. However, UV irradiation is not always perfect because some organisms are known to possess the ability to repair their DNA by mechanisms such as photoreac-tivation and dark repair. Cryptosporidium was tested for its abilities of photoreactivation, and it was found that Cryptosporidium had no such abil-ity (Oguma et al. 2001).
The Ministry of Health and Welfare, Japan, approved the use of UV ir-radiation as a barrier against Cryptosporidium for water supply systems in 2007.
How to select a disinfectant
The selection of a specific disinfection method often depends on the mode of water use and existing regulations. For instance, the photoreactivation potential of microbes would be concerned in the use of UV treatment where treated water may be exposed to sunlight. Again, in case of waste-water rich in organic matter, a high chlorine dose should not be used in or-der to avoid the emergence of toxic by-products. Government regulations often make it compulsory to use a certain technology. For example, in Ja-pan, residual chlorine in tap water is prescribed by regulations.

168 Hiroyuki Katayama
9. 5 Risk management
9.5.1 Indicator of pathogens
Chemical risk agents, such as cyanogens or trihalomethanes, are included in water on the order of ng/ml. This is quite a small value as concentration, but considering the number of particles, these values should be multiplied by Avogadro number (6.02 × 10²³). When related to microorganisms, the number of particles is directly reflected in the observation. In other words, the pathogens are discrete and not in a solution. This is the reason why the number of the pathogens in water varies.
Some chemical agents, such as organic mercury, accumulate in the body. The risk of pathogens, however, is not cumulative. Pathogens that are ingested will either: 1) infect the human, 2) be digested, or 3) simply pass through the stomach. In case of the risk assessment of drinking water, the number of pathogens taken in a day is used to calculate risk of infec-tion.
Since the number of pathogens is highly variable, it is not always reli-able to judge the water safety based on the inspection of pathogens. Meas-uring every kind of pathogen is not practical either.
As for source protection and water quality analysis, the most important aspect to consider is faecal contamination, especially human faecal con-tamination, of the water. Therefore, among the various water quality pa-rameters, those related to faecal contamination should be emphasized. Characteristics of the ideal faecal indicators are that they:
1. should be present in wastewater and in contaminated water 2. should be present in greater numbers than the pathogens 3. should not multiply in environment 4. should be more tolerant in the environment than pathogens 5. should present no health risk 6. should be easy to enumerate Among the various parameters, the total coliforms, thermotolerant coli-
forms and E. coli are used as indicators of faecal contamination worldwide because they are present in a great amount in faeces of warm-blooded animals including humans, are easily detectable, do not multiply in the normal environment and have a fate similar to most of pathogens.
As the principal indicator bacteria, Escherichia coli, thermotolerant coliforms (95% are E. coli) and faecal streptococci are recommended by

9. Fate of Water-Related Pathogens in Urban Water Systems 169
the World Health Organization (WHO, the webpage of its document is listed in the reference). Bacteriophages are considered to be promising vi-ral indicators.
9.5.2 Risk assessment
Risk assessment for a chemical agent consists of four steps: 1) Hazard identification, 2) Dose response assessment, 3) Exposure assessment and 4) Risk characterization.
Risk is calculated on the basis of the probability of the infection. Of course, the symptoms of the disease are very important. However, in mi-crobial risk analysis, infection is used as the target of the final hazard be-cause the symptoms are variable and, moreover, asymptomatic infection can cause a secondary infection. The risk of secondary infection is difficult to evaluate.
The microbial risk of infection can be calculated by exposure assess-ment and dose-response assessment. The easiest method of exposure as-sessment is to calculate the product of the concentration of the microorgan-ism and the amount of water consumed by people. However, the concentration of pathogenic microorganisms is highly variable because the number of particles in water is quite small compared to chemical agents of the same hazard level. Therefore, the estimated concentration does not al-ways represent the risk of infection.
Microbial doses are not cumulative, so the risk of infection has no rela-tion to the uptake in previous days. To compare with chemical agent risk, the microbial risk is usually shown as an annual risk of infection. In a normal case, the expected intake of pathogens is not so high. Therefore, the risk of infection is linear in relation to the intake of pathogens, which is proportional to the annual average (arithmetic mean value) of pathogens (Masago et al. 2006).
In the water supply systems, the concentration of pathogens is not so high, and one is not likely to be exposed to more than one particle of a cer-tain pathogen. Therefore, the possibility of infection due to one pathogenic agent is important, but this figure is not easily obtained from the challenge data. The challenge data are obtained by using volunteers as a host to pathogens, while a known amount of the pathogens are ingested to observe the probability of infection. This method has provided much informative data, yet it has been avoided in recent years due to ethical considerations.
The maximum concentration of the pathogens might be the most impor-tant factor in the annual risk of infection.
170 Hiroyuki Katayama
9.5.3 Risk management
The most normal approach is to regulate the maximum concentration of hazardous agents. However, the normal method is not practical in the case of pathogen control, because the water amount needed is too large to be monitored routinely. Instead, a treatment-based control approach may be effective.
Since an outbreak is an acute event, prevention of the accident is the first priority. Historically, outbreaks always have had some apparent causes, including absence of chlorination or an invasion of untreated wastewater. Prevention of the accident is important in developed countries as well. Countermeasure systems in case of an accident are also important for the public health sectors, as well as disclosure of the information that there has been an outbreak.
A multilateral approach is necessary to develop water safety against mi-crobial agents. Fig 9.2 describes how to select the monitoring point of fae-cal contamination in water. Hazardous analysis and control critical point (HACCP) is a useful approach, which addresses microbiological hazards as a means of prevention rather than finished product inspection. In the case of the water industry, the water safety process should consist of water quality analysis, source protection and minimum treatment requirements. In the water quality analysis stage, indicators (microbial indicators, turbid-ity, chlorine, etc.) should be monitored at an appropriate frequency. For source water quality analysis, the most important aspect is faecal contami-nation, especially human faecal contamination. Among water quality pa-rameters, those related to faecal contamination should be emphasized.
Pathogen analysis is expensive, dangerous for the inspectors and some-times impractical because the necessary techniques can be time consum-ing. Reliance is therefore placed on relatively simple and more rapid tests for the detection of certain intestinal bacteria which indicate that faecal contamination could be present.

9. Fate of Water-Related Pathogens in Urban Water Systems 171
Fig. 9.2. Monitoring point for management of microbial risk
9.6 Topics in recent health-related water microbiology
The classic waterborne diseases were well controlled by the water supply systems and the sewage systems built in developed countries in the 20th century. The basic strategy was to remove particles in the water, followed by disinfection by chlorine, and confirm the efficiency by analysing the presence/absence of coliforms. This worked quite well for the classic bac-terial pathogens, but is not successful enough for the protozoa or viruses, which are more tolerant to chlorine.
In the 1970s, the threat of viruses was taken seriously in the U.S. and European countries. However, viral infection via water was found only in small water supply systems of an accidental insufficient process, sporadic cases were not epidemiologically detected in large water supply systems. Consequently, no major countermeasures were employed in most coun-tries.
In 1980s, the disinfection by-products of chlorination were suspected to be carcinogenic. There have been arguments regarding the use of chlorine since then in developed countries, and some have ceased the use of chlo-rine in the water supply.
Upstream
By human, from human
Risk from drinking water
Risks via fishery
Recreational activityBarrier against Pathogens
Monitoring point
Water treatment
Wastewater treatment
Animals
Upstream
By human, from human
Risk from drinking water
Risks via fishery
Recreational activityBarrier against Pathogens
Monitoring point
Water treatmentWater treatment
Wastewater treatment
Wastewater treatment
Animals

172 Hiroyuki Katayama
In the 1990s, Cryptosporidium was of great concern. There was a large outbreak in Milwaukee, USA in 1993, resulting in more than 400,000 cases. In Japan, Ogose town suffered an outbreak of Cryptosporidium in 1996 and reported more than 8,000 cases, which is more than 70% of the population in the water supply service area. Cryptosporidium is highly tol-erant to chlorine and other chemical disinfectants. Cryptosporidium has a small diameter of 5 um, and can pass through sand filtration. Therefore, the risk of infection of Cryptosporidium is not reduced sufficiently by con-ventional water purification processes.
In the 2000s, norovirus was found abundant in the water environment (wastewater, river water, wells, seawater, etc). Some types of seafood (e.g., oysters) often contain this virus. This virus uses human as the sole host. It is highly tolerant to acidic pH, high temperature and chlorine doses (Keswick et al., 1985).
The risk of viral infection via water has become the topic of serious dis-cussions. Although water is not responsible for most of the outbreaks, wa-ter is a possible infection routes, and establishing safety procedures and processes is an urgent issue for waterworks. Some European countries, some states in the U.S. and South Africa have started to develop water quality standards regarding viruses in drinking water and recreational wa-ter.
References
[1] Abbaszadegan M, Hasan MN, Gerba CP, Roessler PF, Wilson BR, Kuennen R and Dellen EV (1997) The disinfection efficacy of a point-of-use water treatment system against bacteri-al, viral and protozoan waterborne pathogens. Wat Res 31: 574-582
[2] Keswick BH, Satterwhite TK, Johnson PC, DuPont HL, Secor SL, Bitsura JA, Gary GW and Hoff JC (1985). Inactivation of Norwalk virus in drinking water by chlorine. Appl Environ Microbiol 50: 261–264.
[3] Masago Y, Katayama H, Watanabe T, Haramoto E, Hashimoto A, Omura T, Hirata T and Ohgaki S (2006) Quantitative Risk Assessment of Noroviruses in Drinking Water Based on Qualitative Data in Japan. Environ Sci Technol 40: 7428-7433.
[4] Oguma K, Katayama H, Mitani H, Morita S, Hirata T and Ohgaki S (2001) Determination of pyrimidine dimers in Escherichia coli and Cryptosporidium parvum during ultraviolet light inactivation, photoreactivation and dark repair. Appl and Environ Microbiol 67: 4630-4637
[5] Otaki M, Yano K and Ohgaki S (1998) Virus Removal in Membrane Separation Process. Wat Sci and Tech 37(10): 107-116
[6] World Health Organization, Guidelines for drinking-water quality. (Training materials in wa-ter, sanitation and health) http://www.who.int/water_sanitation_health/dwq/en/

Part III Heat and Energy Management
10. Global Climate Change and Cities
Keisuke Hanaki
Department of Urban Engineering, The University of Tokyo 7-3-1, Hongo, Bunkyo-ku, Tokyo, 113-8656, Japan
10.1. Introduction
The development of the human life style and its impact on the environment has changed from the primitive era to the current, modern world. In the primitive era, nature was the enemy to overcome. Human beings were mostly exposed to stress by nature including extreme cold, disasters, floods, diseases and the threat of other animals (Fig. 10.1-a). Mostly, the history of human beings has been one of battling against nature. After the development of human society, humans started to form groups to live to-gether and establish their territories. Humans started to maintain safe envi-ronments and obtain food within this territory by cultivating crops and oth-ers. Human beings started to influence nature at this stage (Fig. 10.1-b), though overall human impact was still limited. After the industrial revolu-tion, the area needed for humans to develop their activities expanded be-cause more energy was consumed, more food was needed and people started to travel farther. As the land area utilized by humans expanded, so did population. As a result, each city or village began to have a larger zone of influence and the number of cities increased. Nowadays, the area of influence, or human impact, overlaps among cities (Fig. 10.1-c). Nature can be found in only limited places, and now it has to be preserved. Most natural areas are impacted by human activities and increased population. Such human influence is now called “environmental loading,” which in-cludes a wide variety of effects by human beings on nature. The emission of pollutants, the use of resources, threats to the ecosystem and land use changes are types of “environmental loading.”

176 Keisuke Hanaki
Human
ThreatNature
Human
ThreatNature
Primitiveera
Now
(a) Life exposed to the nature (b) Influence by humanactivities
(c) Expansion and overlapping of human influence
Humanutilization
Influencingzone
Nature
Humanutilization
Influencingzone
Nature
HumanHumanHumanHuman
HumanHumanHumanHumanNature
Fig. 10. 1. Relationship between human beings and nature.
Unlike communities in the old era, contemporary cities do not necessari-ly contain agricultural or industrial activity inside of them. Instead, cities depend on agriculture and industry outside the urban area. In order to be-come environmentally sound, cities should reduce their degrees of envi-ronmental loading, including energy and material consumption.
However, the reduction of environmental loading alone is not the objec-tive of urban management. Maintaining or even improving the quality of life (QOL) of people is the objective of societies in both developing and developed countries. Satisfaction of basic human needs (BHNs) such as safety, health and education is the main concern in least developed coun-tries. The goal in many newly industrialized countries is to improve the level of physical comfort among people, including better housing and higher automobile ownership rates. Many of these countries are expe-riencing significant environmental problems such as air pollution and wa-ter pollution. The QOL of people in developed countries is changing from physical comfort to mental satisfaction and to environmental conscious-ness.
Climate change, which is also called global warming, has become the most challenging problem for human beings to solve. Predicted serious climate change in the future is obviously brought about by human activi-ties, but this issue also restricts the activities of human beings, especially in urban areas. Urban areas are the major sources of greenhouse gases (GHG) such as carbon dioxide due to energy consumption and methane emission from solid waste landfills. Cities in developing countries are likely to be main contributors of GHG emissions in the near future. On the other hand, cities in developed countries are expected to become leaders in reducing levels of fossil fuel consumption.
10. Global Climate Change and Cities 177
10.2. Impact of climate change on urban activity
10.2.1. Factors determining vulnerability
Climate change causes not only temperature rise, but also a change in pre-cipitation. The sea level rises as the result of temperature rise. The impact of climate change on a system in a particular region is usually determined by three factors, namely system exposure, sensitivity to climate change and adaptability to climate change. An area’s level of system exposure de-scribes the intensity of climate change such as temperature or precipitation in the region. These are inputs of climate change. Sensitivity means how the system is influenced by the climate change. If we take the example of rice production in a particular area, system exposure would be the future temperature and precipitation change that potentially causes the problem. Sensitivity depends on whether that particular area is usually hot or dry. Rice production in dry areas is sensitive to future precipitation decrease. Adaptation is the capacity of farmers to change their cultivation practices or the species of rice. These factors determine vulnerability to climate change. Identifying vulnerable areas is important to prepare a strategy for dealing with future climate change.
Water resources are particularly vulnerable to the threat of climate change. Urban areas depend on large amounts of water for domestic as well as industrial purposes, and disruption of the supply of water could have significant consequences. The amount of available water is approx-imately calculated by deducting evaporation from precipitation. Tempera-ture rise increases evaporation whereas the change in levels of future pre-cipitation is still uncertain. Sensitivity of water management system depends on the balance between water demand and water resources. Popu-lation growth and industrial development increases sensitivity and vulne-rability. Storing water in reservoirs can increase adaptability. Megacities in developing countries located in dry regions will suffer the most from water shortages because of inherent water scarcity, climate change and demand increases.
Population growth is very rapid in some developing countries. Urban population growth rate in such countries is usually higher than the national population growth rate. Table 10.1 shows the top 10 large city regions in the world in 2000 and as projected for 2015 [1]. The growth rate of cities in developing countries in Asia is high. Seven of the top ten megacity re-gions in 2015 will be located in Asia. Such rapid growth can cause prob-

178 Keisuke Hanaki
lems such as poor infrastructure that cannot catch up with the tremendous rate of population growth.
Table 10.1. Population of top ten megacity regions.
2000 2015 (projection) Rank Agglomeration and
Country Population (millions)
Rank Agglomeration and Country
Population (millions)
1 Tokyo, Japan 34.5 1 Tokyo, Japan 35.5 2 Mexico City, Mex-
ico 18.1 2 Mumbai (Bombay),
India 21.9
3 New York, USA 17.8 3 Mexico City, Mex-ico
21.6
4 Sao Paulo, Brazil 17.1 4 Sao Paulo, Brazil 20.5 5 Mumbai (Bombay),
India 16.1 5 New York, USA 19.9
6 Shanghai, China 13.2 6 Delhi, India 18.6 7 Kolkata (Calcutta),
India 13.1 7 Shanghai, China 17.2
8 Delhi, India 12.4 8 Kolkata (Calcutta), India
17.0
9 Buenos Aires, Ar-gentina
11.8 9 Dhaka, Bangladesh 16.8
10 Los Angeles, USA 11.8 10 Jakarta, Indonesia 16.8 Data from the United Nations [1]
Such rapid population growth in large cities is due to the national growth rate and to the migration of people to urban areas. Migration from rural areas is occurring in developing countries at an extraordinary rate. This type of migration pattern still occurs in developed countries as well, as shown in Table 10.2. This trend also suggests that migration to urban areas will continue after 2030 in developing countries.
Table 10.2. Urban population percentage
1970 2000 2030 (projection)
World average 36.8 47.2 60.2 Developing region 25.1 40.4 56.4 Japan 71.2 78.8 84.8 China 17.4 35.8 59.5 Thailand 13.3 19.8 33.1 India 19.8 27.7 40.9
United Nations [1], Note: definition of urban population varies among countries.
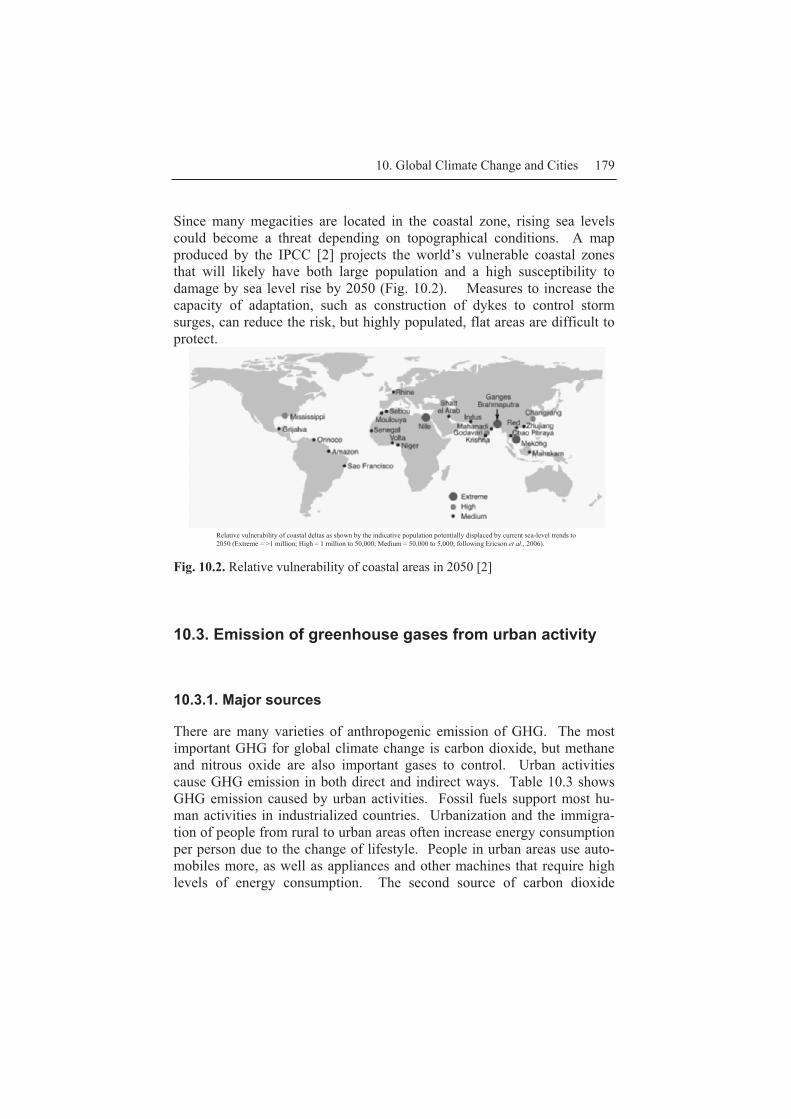
10. Global Climate Change and Cities 179
Since many megacities are located in the coastal zone, rising sea levels could become a threat depending on topographical conditions. A map produced by the IPCC [2] projects the world’s vulnerable coastal zones that will likely have both large population and a high susceptibility to damage by sea level rise by 2050 (Fig. 10.2). Measures to increase the capacity of adaptation, such as construction of dykes to control storm surges, can reduce the risk, but highly populated, flat areas are difficult to protect.
Relative vulnerability of coastal deltas as shown by the indicative population potentially displaced by current sea-level trends to2050 (Extreme = >1 million; High = 1 million to 50,000; Medium = 50,000 to 5,000; following Ericson et al., 2006).
Fig. 10.2. Relative vulnerability of coastal areas in 2050 [2]
10.3. Emission of greenhouse gases from urban activity
10.3.1. Major sources
There are many varieties of anthropogenic emission of GHG. The most important GHG for global climate change is carbon dioxide, but methane and nitrous oxide are also important gases to control. Urban activities cause GHG emission in both direct and indirect ways. Table 10.3 shows GHG emission caused by urban activities. Fossil fuels support most hu-man activities in industrialized countries. Urbanization and the immigra-tion of people from rural to urban areas often increase energy consumption per person due to the change of lifestyle. People in urban areas use auto-mobiles more, as well as appliances and other machines that require high levels of energy consumption. The second source of carbon dioxide
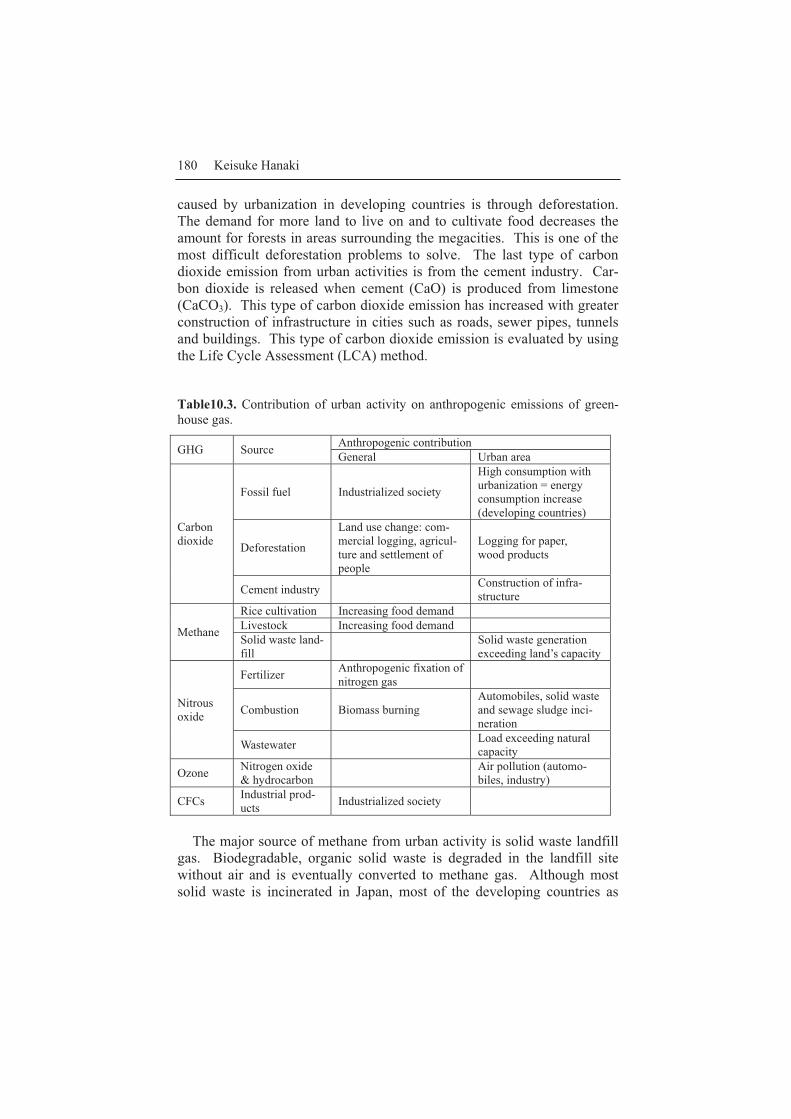
180 Keisuke Hanaki
caused by urbanization in developing countries is through deforestation. The demand for more land to live on and to cultivate food decreases the amount for forests in areas surrounding the megacities. This is one of the most difficult deforestation problems to solve. The last type of carbon dioxide emission from urban activities is from the cement industry. Car-bon dioxide is released when cement (CaO) is produced from limestone (CaCO3). This type of carbon dioxide emission has increased with greater construction of infrastructure in cities such as roads, sewer pipes, tunnels and buildings. This type of carbon dioxide emission is evaluated by using the Life Cycle Assessment (LCA) method.
Table10.3. Contribution of urban activity on anthropogenic emissions of green-house gas.
GHG Source Anthropogenic contribution General Urban area
Carbon dioxide
Fossil fuel Industrialized society
High consumption with urbanization = energy consumption increase (developing countries)
Deforestation
Land use change: com-mercial logging, agricul-ture and settlement of people
Logging for paper, wood products
Cement industry Construction of infra-structure
Methane
Rice cultivation Increasing food demand Livestock Increasing food demand Solid waste land-fill Solid waste generation
exceeding land’s capacity
Nitrous oxide
Fertilizer Anthropogenic fixation of nitrogen gas
Combustion Biomass burning Automobiles, solid waste and sewage sludge inci-neration
Wastewater Load exceeding natural capacity
Ozone Nitrogen oxide & hydrocarbon Air pollution (automo-
biles, industry)
CFCs Industrial prod-ucts Industrialized society
The major source of methane from urban activity is solid waste landfill
gas. Biodegradable, organic solid waste is degraded in the landfill site without air and is eventually converted to methane gas. Although most solid waste is incinerated in Japan, most of the developing countries as

10. Global Climate Change and Cities 181
well as some of the developed countries use landfills for solid waste dis-posal. Methane recovery at the landfill site and conversion to electricity is often done as a CDM (Clean Development Mechanism) project in devel-oping countries. Other methane sources are agricultural activities that are indirectly enhanced by urban food demand. Nitrous oxide is emitted in agricultural areas by microbial transformation that also takes place in wastewater treatment and in polluted water environments. The other phys-ical-chemical route is nitrous oxide emission with combustion. The cata-lysts of automobile exhaust gas and incineration of sewage sludge cause its emission in developed countries. Ozone is generated mainly due to auto-mobile air pollution in urban areas. Ozone is also a greenhouse gas, though quantification of its contribution to global warming is difficult due to its short life and heterogeneous spatial distribution.
Carbon dioxide emission is usually categorized into industrial, transpor-tation, commercial/office and household sectors. Total contribution of each sector to carbon dioxide emissions in Japan is: industrial, 45.5%, transportation, 19.9%, commercial/office, 18.4%, residential, 13.4%, and others, 2.8%. It should be noted that the industrial products are used most-ly in the urban areas. In other words, material consumption in urban areas induces industrial carbon dioxide emission.
3.4
19.9
13.0
18.4
45.1
37.0
-3.9
-10 0 10 20 30 40 50
GDP
CO2 increase from 1990 to 2005 (%)
Commercial/Office
Residential
Transportation
Industry
Total CO2
Population
Fig. 10.3. Change in sectors of carbon dioxide emissions in Japan from 1990 to 2005 (%)
Fig. 10.3 shows the recent trends of carbon dioxide emissions for each sector in Japan. Total carbon dioxide emissions in 2005 increased by
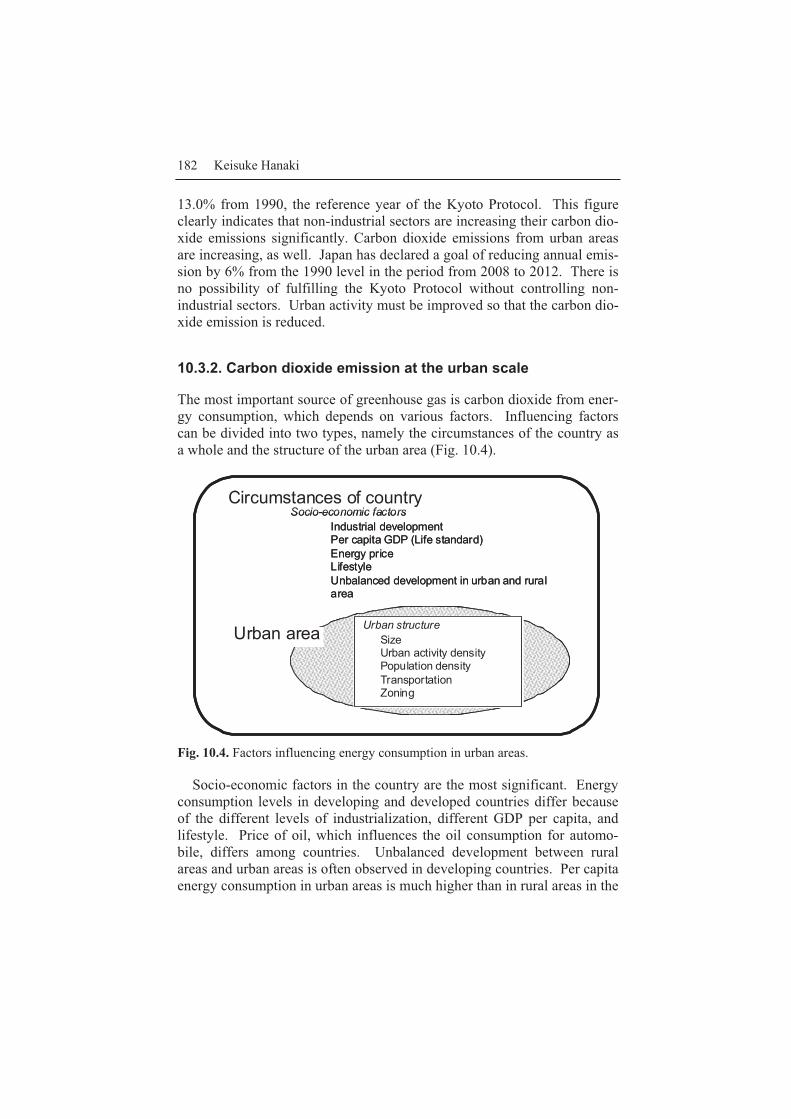
182 Keisuke Hanaki
13.0% from 1990, the reference year of the Kyoto Protocol. This figure clearly indicates that non-industrial sectors are increasing their carbon dio-xide emissions significantly. Carbon dioxide emissions from urban areas are increasing, as well. Japan has declared a goal of reducing annual emis-sion by 6% from the 1990 level in the period from 2008 to 2012. There is no possibility of fulfilling the Kyoto Protocol without controlling non-industrial sectors. Urban activity must be improved so that the carbon dio-xide emission is reduced.
10.3.2. Carbon dioxide emission at the urban scale
The most important source of greenhouse gas is carbon dioxide from ener-gy consumption, which depends on various factors. Influencing factors can be divided into two types, namely the circumstances of the country as a whole and the structure of the urban area (Fig. 10.4).
Industrial developmentPer capita GDP (Life standard)Energy priceLifestyleUnbalanced development in urban and rural area
Circumstances of country
Urban area
Socio-economic factors
SizeUrban activity densityPopulation densityTransportationZoning
Urban structure
Industrial developmentPer capita GDP (Life standard)Energy priceLifestyleUnbalanced development in urban and rural area
Circumstances of country
Urban area
Socio-economic factors
SizeUrban activity densityPopulation densityTransportationZoning
Urban structure
Fig. 10.4. Factors influencing energy consumption in urban areas.
Socio-economic factors in the country are the most significant. Energy consumption levels in developing and developed countries differ because of the different levels of industrialization, different GDP per capita, and lifestyle. Price of oil, which influences the oil consumption for automo-bile, differs among countries. Unbalanced development between rural areas and urban areas is often observed in developing countries. Per capita energy consumption in urban areas is much higher than in rural areas in the
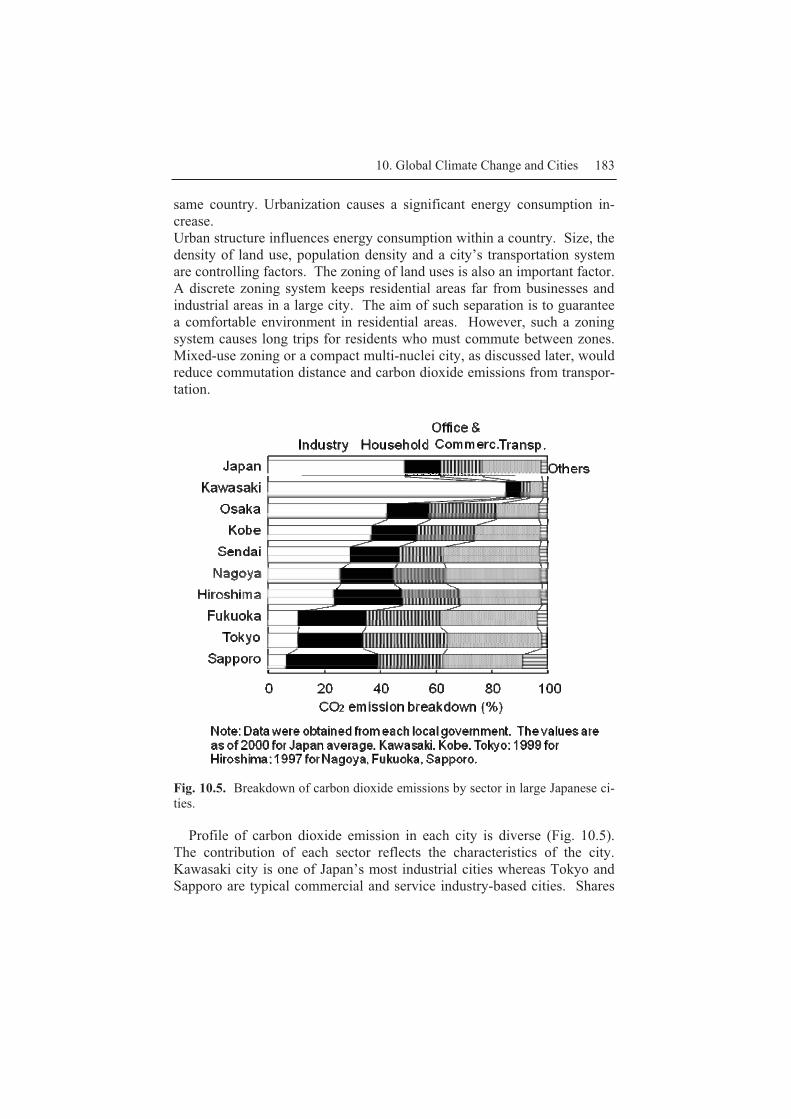
10. Global Climate Change and Cities 183
same country. Urbanization causes a significant energy consumption in-crease. Urban structure influences energy consumption within a country. Size, the density of land use, population density and a city’s transportation system are controlling factors. The zoning of land uses is also an important factor. A discrete zoning system keeps residential areas far from businesses and industrial areas in a large city. The aim of such separation is to guarantee a comfortable environment in residential areas. However, such a zoning system causes long trips for residents who must commute between zones. Mixed-use zoning or a compact multi-nuclei city, as discussed later, would reduce commutation distance and carbon dioxide emissions from transpor-tation.
Fig. 10.5. Breakdown of carbon dioxide emissions by sector in large Japanese ci-ties.
Profile of carbon dioxide emission in each city is diverse (Fig. 10.5). The contribution of each sector reflects the characteristics of the city. Kawasaki city is one of Japan’s most industrial cities whereas Tokyo and Sapporo are typical commercial and service industry-based cities. Shares

184 Keisuke Hanaki
of industrial carbon dioxide emission differ very much among these cities. Each of these large cities plans a carbon dioxide emission reduction strate-gy, but the scope should be different. For example, household and com-mercial/office sectors are a substantial part of Tokyo’s pattern of carbon dioxide emissions. The Tokyo Metropolitan Government has made a stra-tegic plan called the “Tokyo Climate Change Strategy” to reduce carbon dioxide mainly from offices, households and transportation [3].
7.07
5.33
4.55
5.69
7.31
7.54
7.50
8.42
22.20
9.87
0 5 10 15 20 25
JapanKawasaki
OsakaKobe
SendaiNagoya
HiroshimaFukuoka
TokyoSapporo 1.75
0.73
0.88
1.51
1.21
1.66
1.74
0.96
5.80
2.42
0 2 4 6
JapanKawasaki
OsakaKobe
SendaiNagoya
HiroshimaFukuoka
TokyoSapporo
Per capita CO2 emission (t-CO2/capita-year)
Per GDP CO2 emission (t-CO2/million Yen-year)
Fig. 10.6. Per person and per GDP carbon dioxide emission in large Japanese ci-ties.
Differences among cities are not only due to the differences in sectors. Fig. 10.6 shows that the per person emission of carbon dioxide in Kawasa-ki city is far greater than in other large cities. Per GDP emission in Kawa-saki is also much higher than in Tokyo. These high values do not mean that the Kawasaki is an energy-wasting city. The high amount of industrial activity in this city makes per capita and per GDP carbon dioxide emission much higher than the Japanese average. Other large cities show lower per capita and per GDP emission than the average value in Japan. This exam-ple shows that a simple comparison or ranking of the cities based on such values does not demonstrate energy or carbon dioxide efficiency for the urban area.
Fig. 10.7 shows per capita carbon dioxide emission in Beijing, Shanghai and Tokyo. The per capita average of carbon dioxide emissions in China is far smaller than in Japan, as is often mentioned. However, the emission totals of Beijing or Shanghai are already greater than Tokyo’s though the estimated values contain uncertain factors derived from energy and popu-lation statistics in China. There are possible reasons for the high emission
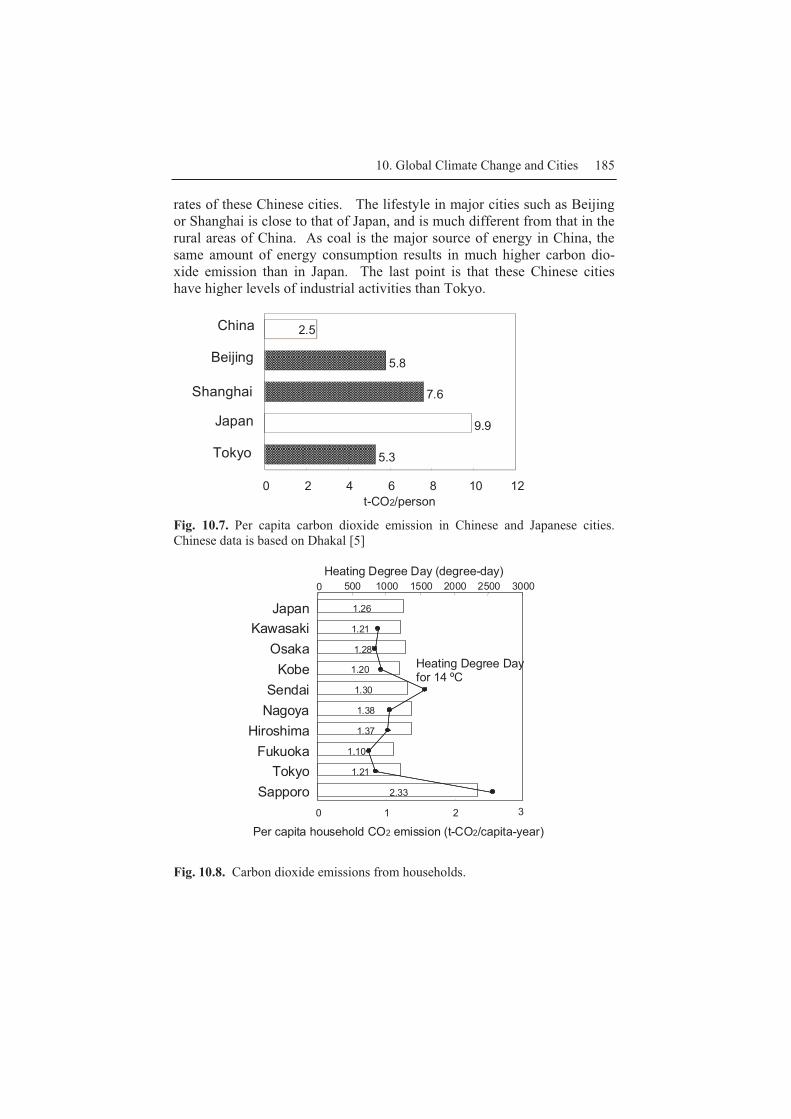
10. Global Climate Change and Cities 185
rates of these Chinese cities. The lifestyle in major cities such as Beijing or Shanghai is close to that of Japan, and is much different from that in the rural areas of China. As coal is the major source of energy in China, the same amount of energy consumption results in much higher carbon dio-xide emission than in Japan. The last point is that these Chinese cities have higher levels of industrial activities than Tokyo.
5.3
9.9
7.6
5.8
2.5
0 2 4 6 8 10 12t-CO2/person
China
Beijing
Japan
Shanghai
Tokyo
Fig. 10.7. Per capita carbon dioxide emission in Chinese and Japanese cities. Chinese data is based on Dhakal [5]
2.33
1.21
1.10
1.37
1.38
1.30
1.20
1.28
1.21
1.26
0 1 2
0 500 1000 1500 2000 2500 3000
3
JapanKawasaki
OsakaKobe
SendaiNagoya
HiroshimaFukuoka
TokyoSapporo
Heating Degree Day (degree-day)
Heating Degree Day for 14 ºC
Per capita household CO2 emission (t-CO2/capita-year)
Fig. 10.8. Carbon dioxide emissions from households.
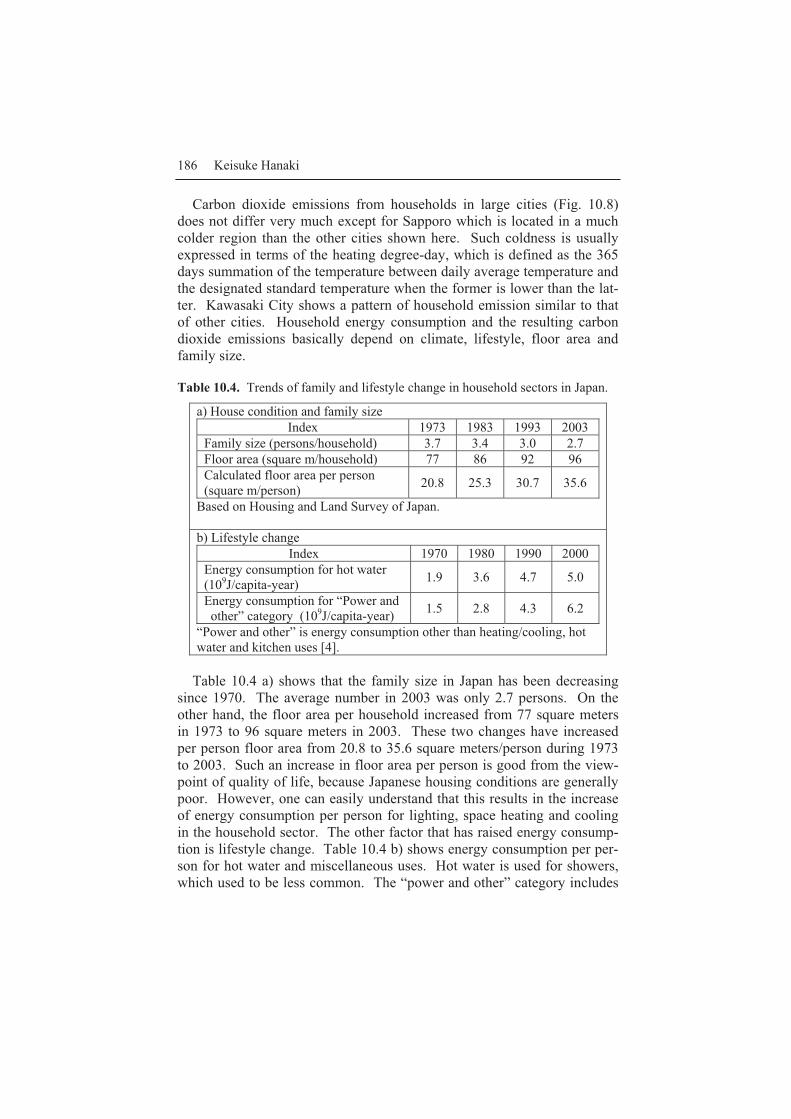
186 Keisuke Hanaki
Carbon dioxide emissions from households in large cities (Fig. 10.8) does not differ very much except for Sapporo which is located in a much colder region than the other cities shown here. Such coldness is usually expressed in terms of the heating degree-day, which is defined as the 365 days summation of the temperature between daily average temperature and the designated standard temperature when the former is lower than the lat-ter. Kawasaki City shows a pattern of household emission similar to that of other cities. Household energy consumption and the resulting carbon dioxide emissions basically depend on climate, lifestyle, floor area and family size.
Table 10.4. Trends of family and lifestyle change in household sectors in Japan.
a) House condition and family size Index 1973 1983 1993 2003
Family size (persons/household) 3.7 3.4 3.0 2.7 Floor area (square m/household) 77 86 92 96 Calculated floor area per person (square m/person) 20.8 25.3 30.7 35.6
Based on Housing and Land Survey of Japan. b) Lifestyle change
Index 1970 1980 1990 2000 Energy consumption for hot water (109J/capita-year) 1.9 3.6 4.7 5.0
Energy consumption for “Power and other” category (109J/capita-year) 1.5 2.8 4.3 6.2
“Power and other” is energy consumption other than heating/cooling, hot water and kitchen uses [4].
Table 10.4 a) shows that the family size in Japan has been decreasing
since 1970. The average number in 2003 was only 2.7 persons. On the other hand, the floor area per household increased from 77 square meters in 1973 to 96 square meters in 2003. These two changes have increased per person floor area from 20.8 to 35.6 square meters/person during 1973 to 2003. Such an increase in floor area per person is good from the view-point of quality of life, because Japanese housing conditions are generally poor. However, one can easily understand that this results in the increase of energy consumption per person for lighting, space heating and cooling in the household sector. The other factor that has raised energy consump-tion is lifestyle change. Table 10.4 b) shows energy consumption per per-son for hot water and miscellaneous uses. Hot water is used for showers, which used to be less common. The “power and other” category includes
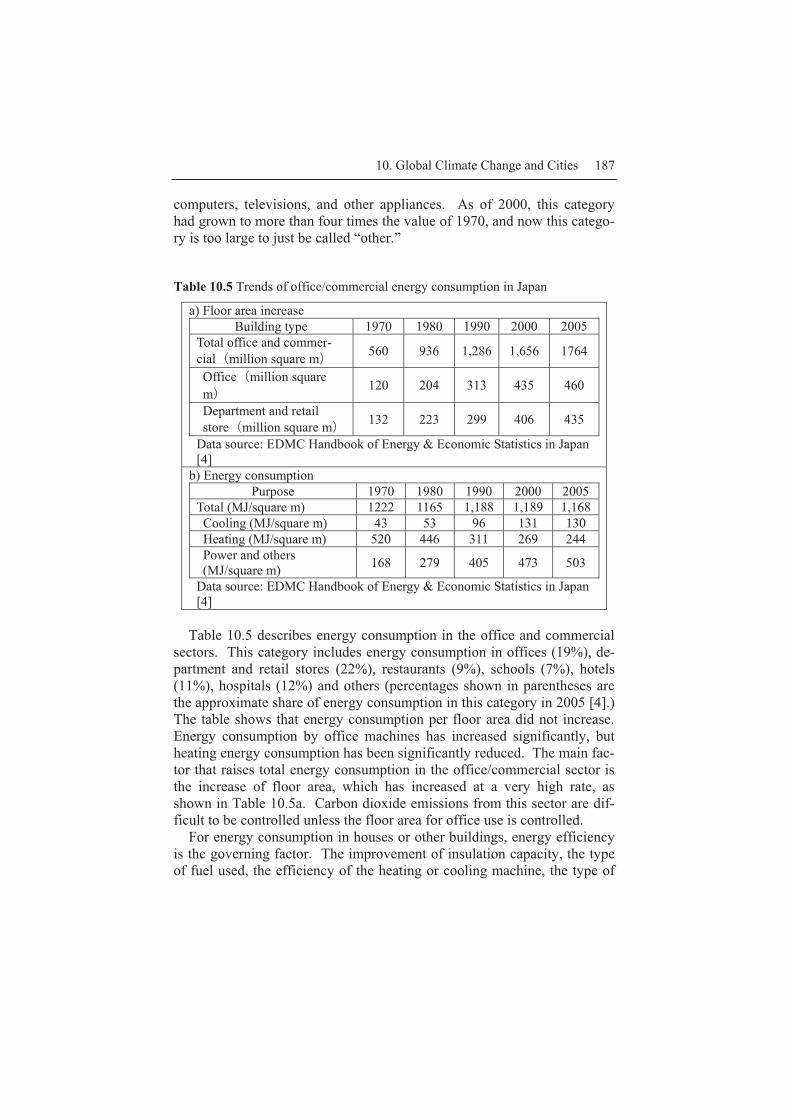
10. Global Climate Change and Cities 187
computers, televisions, and other appliances. As of 2000, this category had grown to more than four times the value of 1970, and now this catego-ry is too large to just be called “other.”
Table 10.5 Trends of office/commercial energy consumption in Japan
a) Floor area increase Building type 1970 1980 1990 2000 2005
Total office and commer-cial�million square m� 560 936 1,286 1,656 1764
Office�million square m�
120 204 313 435 460
Department and retail store�million square m� 132 223 299 406 435
Data source: EDMC Handbook of Energy & Economic Statistics in Japan [4]
b) Energy consumption Purpose 1970 1980 1990 2000 2005
Total (MJ/square m) 1222 1165 1,188 1,189 1,168 Cooling (MJ/square m) 43 53 96 131 130 Heating (MJ/square m) 520 446 311 269 244 Power and others (MJ/square m) 168 279 405 473 503
Data source: EDMC Handbook of Energy & Economic Statistics in Japan [4]
Table 10.5 describes energy consumption in the office and commercial
sectors. This category includes energy consumption in offices (19%), de-partment and retail stores (22%), restaurants (9%), schools (7%), hotels (11%), hospitals (12%) and others (percentages shown in parentheses are the approximate share of energy consumption in this category in 2005 [4].) The table shows that energy consumption per floor area did not increase. Energy consumption by office machines has increased significantly, but heating energy consumption has been significantly reduced. The main fac-tor that raises total energy consumption in the office/commercial sector is the increase of floor area, which has increased at a very high rate, as shown in Table 10.5a. Carbon dioxide emissions from this sector are dif-ficult to be controlled unless the floor area for office use is controlled.
For energy consumption in houses or other buildings, energy efficiency is the governing factor. The improvement of insulation capacity, the type of fuel used, the efficiency of the heating or cooling machine, the type of
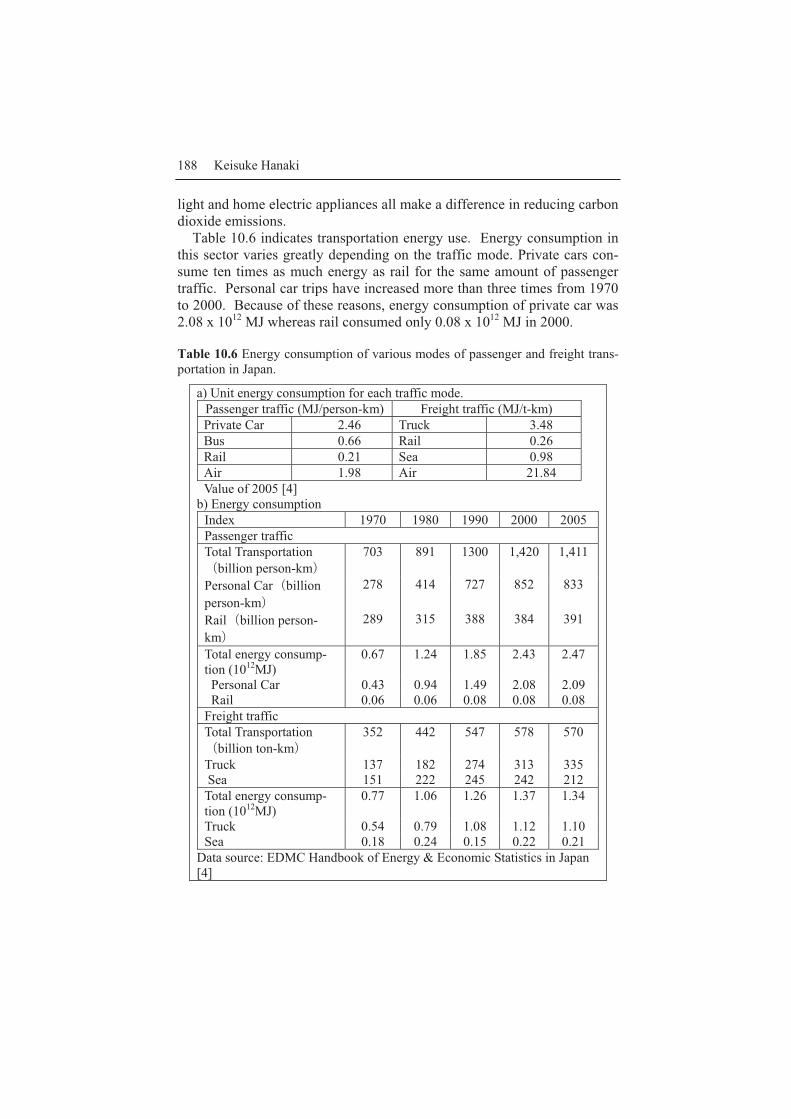
188 Keisuke Hanaki
light and home electric appliances all make a difference in reducing carbon dioxide emissions.
Table 10.6 indicates transportation energy use. Energy consumption in this sector varies greatly depending on the traffic mode. Private cars con-sume ten times as much energy as rail for the same amount of passenger traffic. Personal car trips have increased more than three times from 1970 to 2000. Because of these reasons, energy consumption of private car was 2.08 x 10¹² MJ whereas rail consumed only 0.08 x 10¹² MJ in 2000.
Table 10.6 Energy consumption of various modes of passenger and freight trans-portation in Japan.
a) Unit energy consumption for each traffic mode. Passenger traffic (MJ/person-km) Freight traffic (MJ/t-km) Private Car 2.46 Truck 3.48 Bus 0.66 Rail 0.26 Rail 0.21 Sea 0.98 Air 1.98 Air 21.84 Value of 2005 [4]
b) Energy consumption Index 1970 1980 1990 2000 2005 Passenger traffic Total Transportation�billion person-km�
703 891 1300 1,420 1,411
Personal Car�billion person-km�
278 414 727 852 833
Rail�billion person-km�
289 315 388 384 391
Total energy consump-tion (1012MJ)
0.67 1.24 1.85 2.43 2.47
Personal Car 0.43 0.94 1.49 2.08 2.09 Rail 0.06 0.06 0.08 0.08 0.08 Freight traffic Total Transportation�billion ton-km�
352 442 547 578 570
Truck 137 182 274 313 335 Sea 151 222 245 242 212 Total energy consump-tion (1012MJ)
0.77 1.06 1.26 1.37 1.34
Truck 0.54 0.79 1.08 1.12 1.10 Sea 0.18 0.24 0.15 0.22 0.21
Data source: EDMC Handbook of Energy & Economic Statistics in Japan [4]

10. Global Climate Change and Cities 189
Controlling the use of private automobiles is key in the control of car-bon dioxide emissions by the transportation sector. Such private vehicles bring flexible mobility to citizens and they have enabled the development of new residential areas in many countries. However, they in turn cause environmental problems such as air pollution and carbon dioxide emission. A shift in transportation mode from private car to public transportation, called modal shift, can significantly reduce carbon dioxide emissions, but public transportation system such as railways require a densely populated or compact urban structure.
10.4. Control of GHG emissions from urban activities
Three different types of countermeasures can be implemented in urban areas to reduce GHG emission. These are: (1) carbon dioxide reduction in the energy and heat supply, (2) carbon dioxide reduction through energy consumption saving, and (3) change of urban structure. These three as-pects should be combined together in order to achieve a substantial reduc-tion. Integration of two or three of them is necessary to achieve a signifi-cant reduction in carbon dioxide emissions.
10.4.1. Carbon dioxide reduction in energy and heat supply
Power utility has been paying effort of lowering carbon intensity of its generated electricity. The reduction in carbon intensity owes to the selec-tion of fuel source and energy conversion efficiency. Among the fossil fu-els, coal produces the largest amount of carbon dioxide followed by oil and then natural gas. Natural gas is the cleanest fossil fuel from the viewpoint of carbon dioxide emissions.
Carbon intensity of electricity varies with the time of day and the sea-son. It should be noted that the average carbon intensity of electricity de-pends on demand. Meeting peak demand of electricity requires fossil fuel power plants that are flexible to the demand change with time. On the oth-er hand, hydropower and nuclear power are major sources in the off-peak time. Therefore, carbon intensity in the peak time in summer is the highest throughout the year. Averaging the electricity demand in urban areas throughout the year can contribute to lowering the carbon intensity of power generation.
In addition to that, distributed electricity generation systems have the potential to reduce carbon dioxide in urban areas. One example is co-generation, in which electricity and heat are supplied simultaneously from
190 Keisuke Hanaki
city gas or oil. As conversion efficiency of fuel to electricity is usually 40 to 50%, more than half of fuel energy is wasted in power plants if it is not used. It should be noted that the implementation of cogeneration does not always reduce total carbon dioxide emissions. If the heat is not used prop-erly, carbon dioxide emissions from providing electricity can be higher than that of grid power which partly comes from renewable or atomic energy.
There are heat sources in urban areas that are not well utilized. Heat from solid waste incineration and heat from domestic sewage are potential heat sources. District heating systems are necessary to utilize these sources. This means that heat demand with high density is necessary to implement this system. However, many of the solid waste incineration plants and wastewater treatment plants are not located in the central busi-ness district. This is a problem of mismatched infrastructure locations.
10.4.2. Carbon dioxide reduction in energy saving
There are various countermeasures to reduce energy consumption in the non-industrial sector. These include building energy use/construction, energy-saving buildings, long-life buildings, automobile innovation (hybr-id vehicle, fuel cell vehicle), transportation system (traffic demand man-agement) and district heating in high density area with urban heat recov-ery. Many technologies developed in the building and transportation sectors should be implemented, along with proper management of energy demand. For example, automobile innovation and reduction of traffic de-mand should be done at the same time.
The mix of countermeasures implemented should depend on the type of city. The methods used in megacities are not necessarily effective in small cities. In large cities, efficient apartment houses can be promoted. De-tached houses, which have a large roof area, are suitable for photovoltaic cell installation. Cogeneration and district heating/cooling systems can be applied only to an appropriate area. Modal shift from automobile to train should be promoted in cities where the share of the rail is not high. In re-gion-core city, typically with a population of around several hundred thou-sand, railway systems can be implemented depending on the distribution of traffic demand. LRT (Light Rail Transit) is one option for public transpor-tation systems. In smaller cities or villages, the use of public transporta-tion is difficult from the viewpoint of business profit and even from the viewpoint of energy saving. Effective use of the automobile is the only method to reduce carbon dioxide emission in those settings.
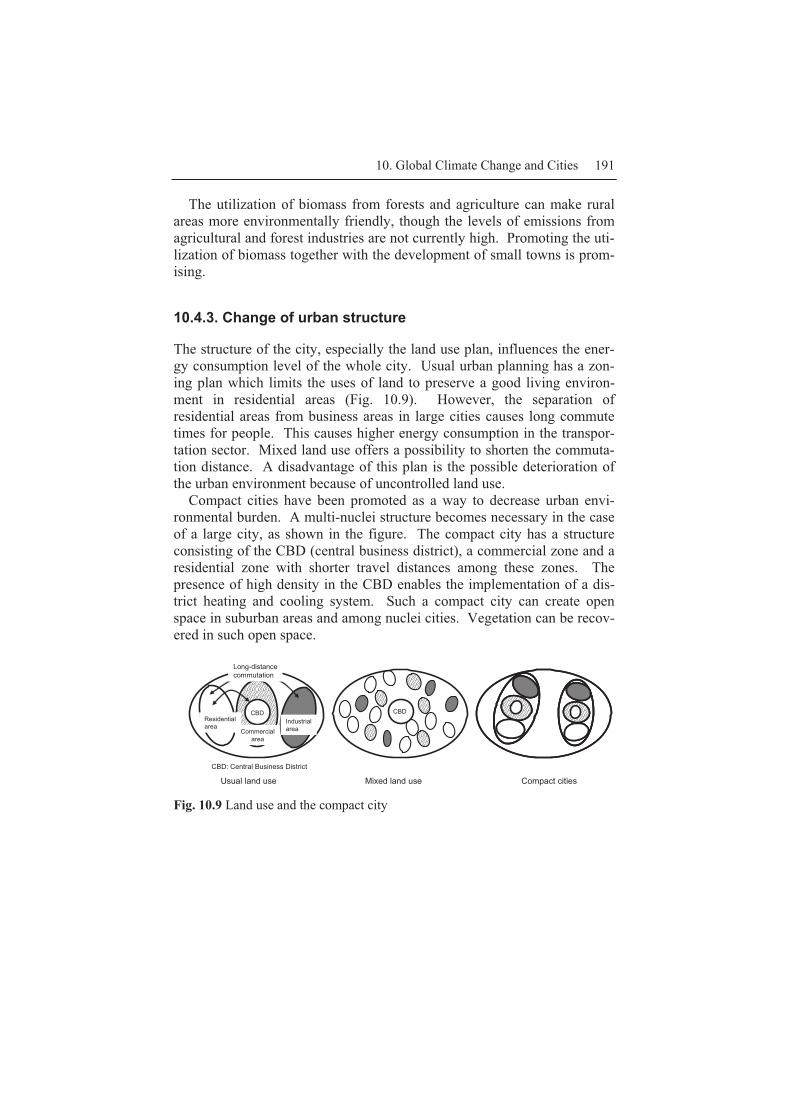
10. Global Climate Change and Cities 191
The utilization of biomass from forests and agriculture can make rural areas more environmentally friendly, though the levels of emissions from agricultural and forest industries are not currently high. Promoting the uti-lization of biomass together with the development of small towns is prom-ising.
10.4.3. Change of urban structure
The structure of the city, especially the land use plan, influences the ener-gy consumption level of the whole city. Usual urban planning has a zon-ing plan which limits the uses of land to preserve a good living environ-ment in residential areas (Fig. 10.9). However, the separation of residential areas from business areas in large cities causes long commute times for people. This causes higher energy consumption in the transpor-tation sector. Mixed land use offers a possibility to shorten the commuta-tion distance. A disadvantage of this plan is the possible deterioration of the urban environment because of uncontrolled land use.
Compact cities have been promoted as a way to decrease urban envi-ronmental burden. A multi-nuclei structure becomes necessary in the case of a large city, as shown in the figure. The compact city has a structure consisting of the CBD (central business district), a commercial zone and a residential zone with shorter travel distances among these zones. The presence of high density in the CBD enables the implementation of a dis-trict heating and cooling system. Such a compact city can create open space in suburban areas and among nuclei cities. Vegetation can be recov-ered in such open space.
Usual land use
Residentialarea
Commercialarea
Industrialarea
CBD CBD
Mixed land use Compact cities
Long-distancecommutation
CBD: Central Business District
Fig. 10.9 Land use and the compact city

192 Keisuke Hanaki
10.5. Direct and induced carbon dioxide emission
As mentioned earlier in section 3.2, a service-oriented city like Tokyo or Sapporo apparently emits a low amount of carbon dioxide per person, whereas an industrial city like Kawasaki emits a far higher level of carbon dioxide. However, service-oriented cities consume a large amount of goods that are produced elsewhere and emit carbon dioxide and other pol-lutants (Fig. 10.10). Such environmental loading is called induced loading or embodied loading in contrast with direct loading. For example, carbon dioxide from gasoline combustion from cars running in a city is direct car-bon dioxide emission, whereas carbon dioxide emission during the manu-facturing of the car is induced carbon dioxide emission. This induced car-bon dioxide emission is not taken into account in usual comparisons of carbon dioxide emission among cities.
Industry
Goods
Induced loading (CO2)Direct loading (CO2)
RawMaterials
CityIndustry
Goods
Induced loading (CO2)Direct loading (CO2)
RawMaterials
City
Fig. 10.10. Direct and induced emissions by urban activity.
Such induced environmental loading can be estimated at the city scale by analyzing the regional input/output table. Fig. 10.11 shows the direct and induced carbon dioxide emission in selected cities. Only 30% of the carbon dioxide emission arising from the activity of Tokyo is counted as direct emission. The remaining 70% of carbon dioxide is emitted in other cities in order to support the activities of Tokyo. Shanghai is a service city which also shows a low percentage of direct emission. Fukuoka and Kita-kyushu are located within the same prefecture, but their function is differ-ent. Kita-kyushu is an industrial city while Fukuoka is a commercial city. There is a strong contrast between the percentages of direct and induced emission between these two cities. An analysis of induced carbon dioxide reveals that there is a large degree of hidden environmental loading in
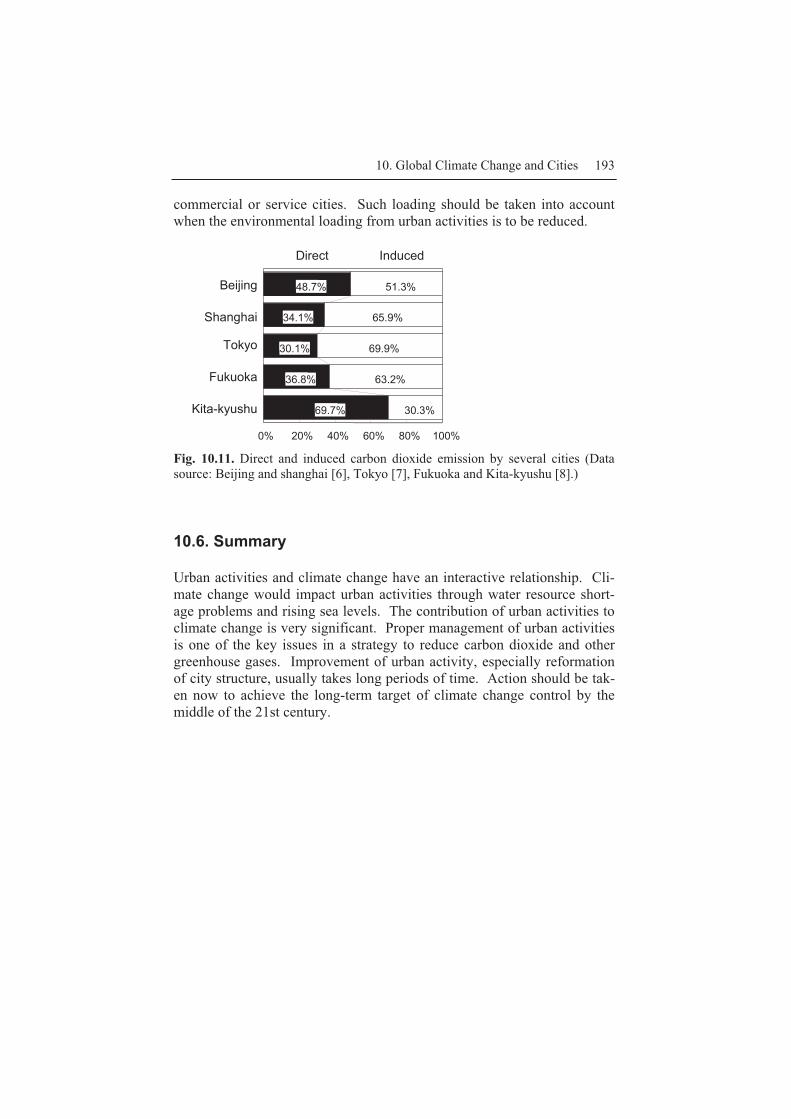
10. Global Climate Change and Cities 193
commercial or service cities. Such loading should be taken into account when the environmental loading from urban activities is to be reduced.
69.7%
36.8%
30.1%
34.1%
48.7%
30.3%
63.2%
69.9%
65.9%
51.3%
0% 20% 40% 60% 80% 100%
Beijing
Shanghai
Tokyo
Fukuoka
Kita-kyushu
Direct Induced
Fig. 10.11. Direct and induced carbon dioxide emission by several cities (Data source: Beijing and shanghai [6], Tokyo [7], Fukuoka and Kita-kyushu [8].)
10.6. Summary
Urban activities and climate change have an interactive relationship. Cli-mate change would impact urban activities through water resource short-age problems and rising sea levels. The contribution of urban activities to climate change is very significant. Proper management of urban activities is one of the key issues in a strategy to reduce carbon dioxide and other greenhouse gases. Improvement of urban activity, especially reformation of city structure, usually takes long periods of time. Action should be tak-en now to achieve the long-term target of climate change control by the middle of the 21st century.

194 Keisuke Hanaki
References
[1] United Nations Population Division World Urbanization Prospects: The 2005 Revision Population Database. Accessible at http://esa.un.org/unup/
[2] Intergovernmental Panel on Climate Change (2007), 4th Assessment Report (AR4) of Working Group 2, Climate Change Impacts, adaptation and vulne-rability.
[3] Tokyo Metropolitan Government (2007), “Tokyo Climate Change Strategy”, English version is available at https://www2.kankyo.metro.tokyo.jp/kouhou/env/english/index.html
[4] The Energy Conservation Center, EDMC Handbook of Energy & Economic Statistics in Japan, 2007 version and other year versions.
[5] Dhakal, S. (2004), Urban Energy Use and Greenhouse Gas Emissions in Asian Mega-Cities: Policies for a Sustainable Future, Institute for Global Environ-mental Strategies (IGES), Japan
[6] Shinji Kaneko, Hirofumi Nakayama, Libo Wuc (2003) "Comparative study on indirect energy demand, supply and corresponding CO2 emissions of Asian Mega-cities", Proc. International Workshop on Policy Integration Towards Sustainable Urban Energy Use for Cities in Asia, Institute for Global Envi-ronmental Strategies.
[7] Yoshida, Y., Ishitani, H. and Matsuhasi, R. (1998): Classifying CO2 emission from the viewpoint of LCA by reflecting the influence of regional activities, Journal of the Japan Institute of Energy, Vol. 77, No.11, 1054-1061 (in Japa-nese)
[8] Kanagawa, T., Kato, E. and Imura, H. (1992) Application of the input-output model to the analysis of urban energy consumption, Environmental Systems Research, Vol.20, 242-251 (in Japanese).

11. Japanese Strategies for Global Warming Issues and Energy Conservation in Buildings
Yuzo Sakamoto
Department of Architecture, The University of Tokyo 7-3-1, Hongo, Bunkyo-ku, Tokyo, 113-8656, Japan
11.1 Global Warming Issues and CO2 Emission
Global warming, which was called climate change in Chapter 10, is caused by anthropogenic actions. Gases causing global warming are called green house gases (GHG), and the most significant GHG is carbon dioxide (CO2). In fact, enormous amounts of CO2 have been emitted since the 19th century from the activities of human beings, for instance, industry, transportation and the utilization of buildings. Most scientists believe that the increase of CO2 concentration in the atmosphere causes global warming and that global warming and climate change will bring human beings many disasters and widespread damage, as was shown in Chapter 10. These problems are called “Global Warming Issues.”
A main topic regarding these problems is the global reduction of GHG, CO2 in particular, emitted into the atmosphere. Fig. 11.1 shows the share of CO2 emissions by country. The U.S.A. has the highest share of emissions, followed by China. Japan’s position is fourth in this respect. In December of 1997, the Japanese Government agreed to the Kyoto Protocol, an international treaty proposed by the Intergovernmental Panel on Climate Change of the United Nations, in order to define reduction percentages of CO2 emissions country by country. Consequently, the Japanese Diet ratified the Protocol in 2002. Thus, in Japan, energy conservation became very important, as CO2 emissions are mostly caused by energy consumption. However, even if Japan didn’t agree to the Kyoto Protocol,
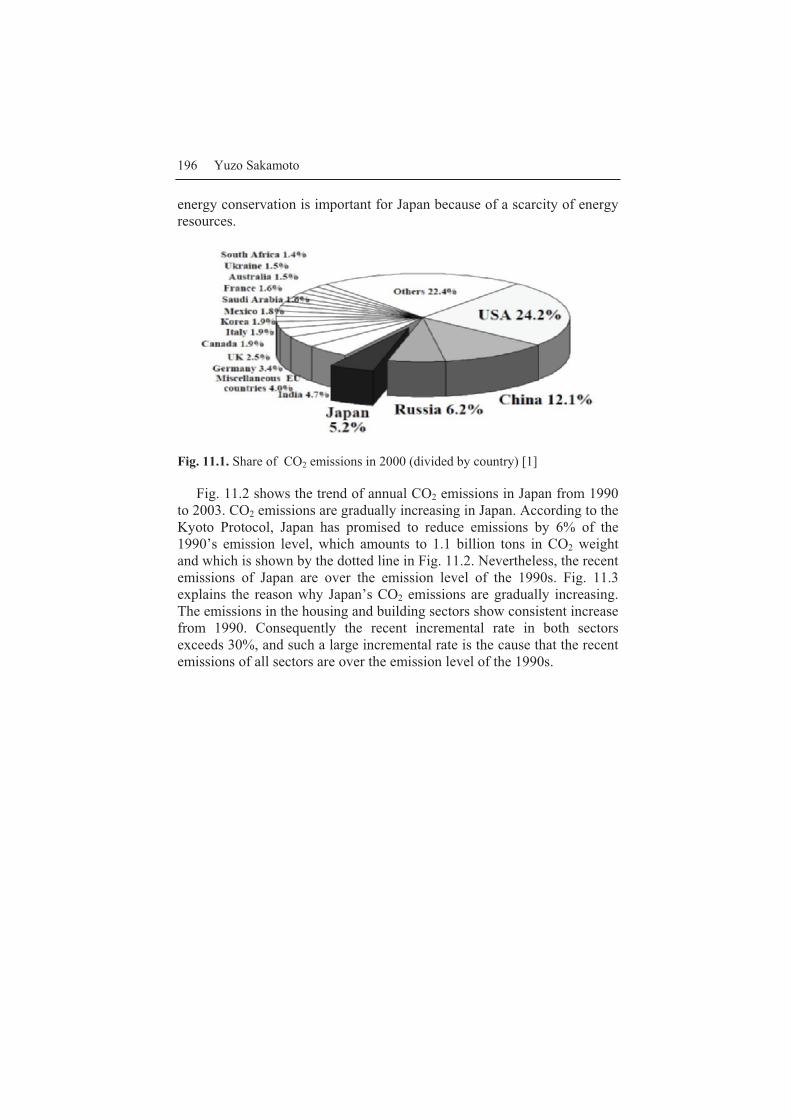
196 Yuzo Sakamoto
energy conservation is important for Japan because of a scarcity of energy resources.
Fig. 11.1. Share of CO2 emissions in 2000 (divided by country) [1]
Fig. 11.2 shows the trend of annual CO2 emissions in Japan from 1990 to 2003. CO2 emissions are gradually increasing in Japan. According to the Kyoto Protocol, Japan has promised to reduce emissions by 6% of the 1990’s emission level, which amounts to 1.1 billion tons in CO2 weight and which is shown by the dotted line in Fig. 11.2. Nevertheless, the recent emissions of Japan are over the emission level of the 1990s. Fig. 11.3 explains the reason why Japan’s CO2 emissions are gradually increasing. The emissions in the housing and building sectors show consistent increase from 1990. Consequently the recent incremental rate in both sectors exceeds 30%, and such a large incremental rate is the cause that the recent emissions of all sectors are over the emission level of the 1990s.
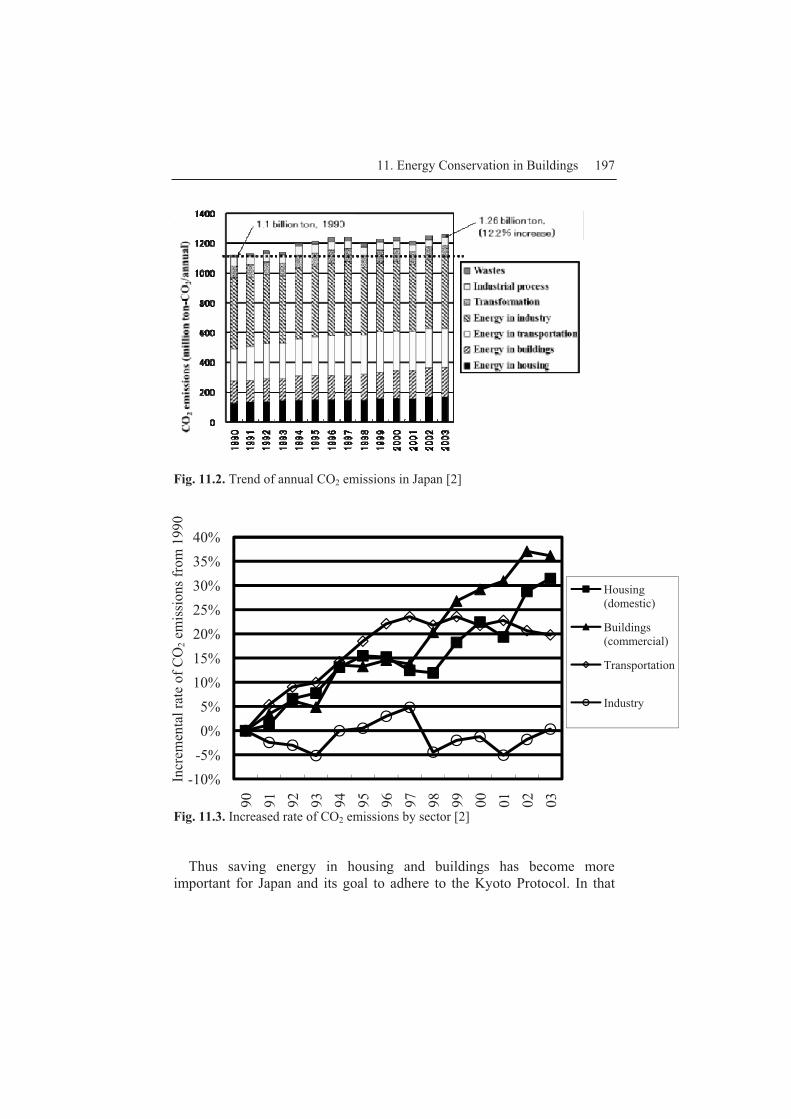
11. Energy Conservation in Buildings 197
Fig. 11.2. Trend of annual CO2 emissions in Japan [2]
-10%-5%0%5%
10%15%20%25%30%35%40%
990
991
992
993
994
995
996
997
998
999
000
001
002
003
Housing (domestic)
Buildings (commercial)
Transportation
Industry
Fig. 11.3. Increased rate of CO2 emissions by sector [2]
Thus saving energy in housing and buildings has become more important for Japan and its goal to adhere to the Kyoto Protocol. In that
Incr
emen
tal r
ate
of C
O2 e
mis
sion
s fro
m 1
990
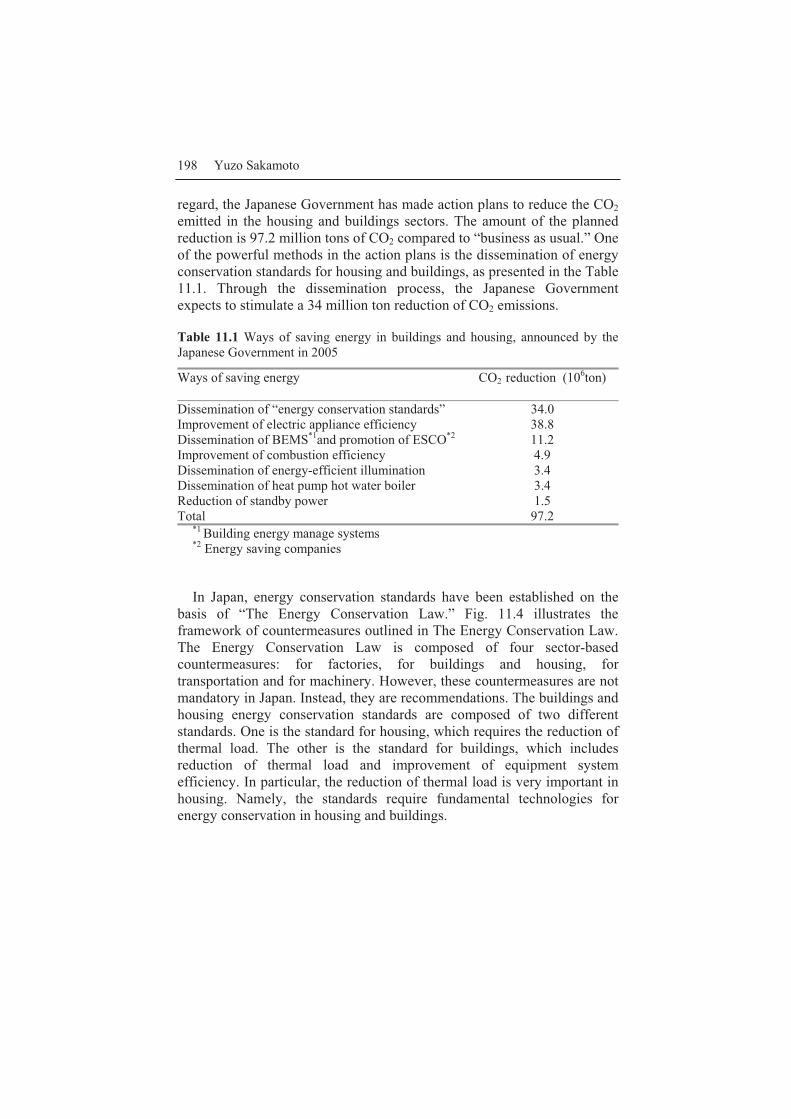
198 Yuzo Sakamoto
regard, the Japanese Government has made action plans to reduce the CO2 emitted in the housing and buildings sectors. The amount of the planned reduction is 97.2 million tons of CO2 compared to “business as usual.” One of the powerful methods in the action plans is the dissemination of energy conservation standards for housing and buildings, as presented in the Table 11.1. Through the dissemination process, the Japanese Government expects to stimulate a 34 million ton reduction of CO2 emissions.
Table 11.1 Ways of saving energy in buildings and housing, announced by the Japanese Government in 2005
Ways of saving energy CO2 reduction (106ton)
Dissemination of “energy conservation standards” 34.0 Improvement of electric appliance efficiency 38.8 Dissemination of BEMS*1and promotion of ESCO*2 11.2 Improvement of combustion efficiency 4.9 Dissemination of energy-efficient illumination 3.4 Dissemination of heat pump hot water boiler 3.4 Reduction of standby power 1.5 Total 97.2
*1 Building energy manage systems *2 Energy saving companies
In Japan, energy conservation standards have been established on the
basis of “The Energy Conservation Law.” Fig. 11.4 illustrates the framework of countermeasures outlined in The Energy Conservation Law. The Energy Conservation Law is composed of four sector-based countermeasures: for factories, for buildings and housing, for transportation and for machinery. However, these countermeasures are not mandatory in Japan. Instead, they are recommendations. The buildings and housing energy conservation standards are composed of two different standards. One is the standard for housing, which requires the reduction of thermal load. The other is the standard for buildings, which includes reduction of thermal load and improvement of equipment system efficiency. In particular, the reduction of thermal load is very important in housing. Namely, the standards require fundamental technologies for energy conservation in housing and buildings.
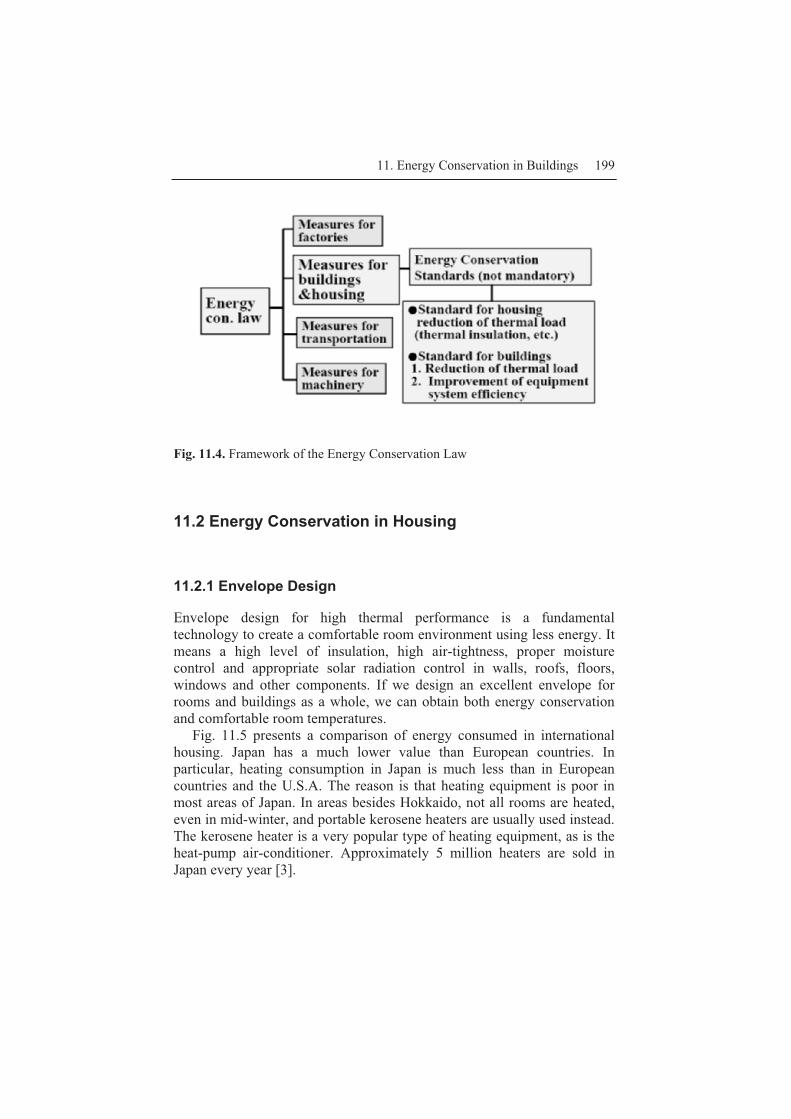
11. Energy Conservation in Buildings 199
Fig. 11.4. Framework of the Energy Conservation Law
11.2 Energy Conservation in Housing
11.2.1 Envelope Design
Envelope design for high thermal performance is a fundamental technology to create a comfortable room environment using less energy. It means a high level of insulation, high air-tightness, proper moisture control and appropriate solar radiation control in walls, roofs, floors, windows and other components. If we design an excellent envelope for rooms and buildings as a whole, we can obtain both energy conservation and comfortable room temperatures.
Fig. 11.5 presents a comparison of energy consumed in international housing. Japan has a much lower value than European countries. In particular, heating consumption in Japan is much less than in European countries and the U.S.A. The reason is that heating equipment is poor in most areas of Japan. In areas besides Hokkaido, not all rooms are heated, even in mid-winter, and portable kerosene heaters are usually used instead. The kerosene heater is a very popular type of heating equipment, as is the heat-pump air-conditioner. Approximately 5 million heaters are sold in Japan every year [3].

200 Yuzo Sakamoto
�
��
��
���
���
���
UK
Fran
ce
Ger
man
y
Swed
en
USA
Japa
n(w
hole
)
Hok
kaid
o
Others
Hot watersupplyAirconditioningHeating
Fig. 11.5. Comparison of energy consumption in international housing [4]
Fig. 11.6 shows traditional Japanese style housing. These types of homes are found sometimes all over Japan, but percentage of them is very small. Namely, the homes have large windows and many doors along with long eaves, which are characteristic of Japanese housing. The homes have
�Wood frame structure�Large openings(windows) and deep eaves�Continuity between indoors and outdoors
�Wood frame structure�Large openings(windows) and deep eaves�Continuity between indoors and outdoors
�Wood frame structure�Large openings(windows) and deep eaves�Continuity between indoors and outdoors
Fig. 11.6. Traditional Japanese style housing
Seco
ndar
y en
ergy
con
sum
ptio
n pe
r flo
or a
rea
(MJ/
m2 a)
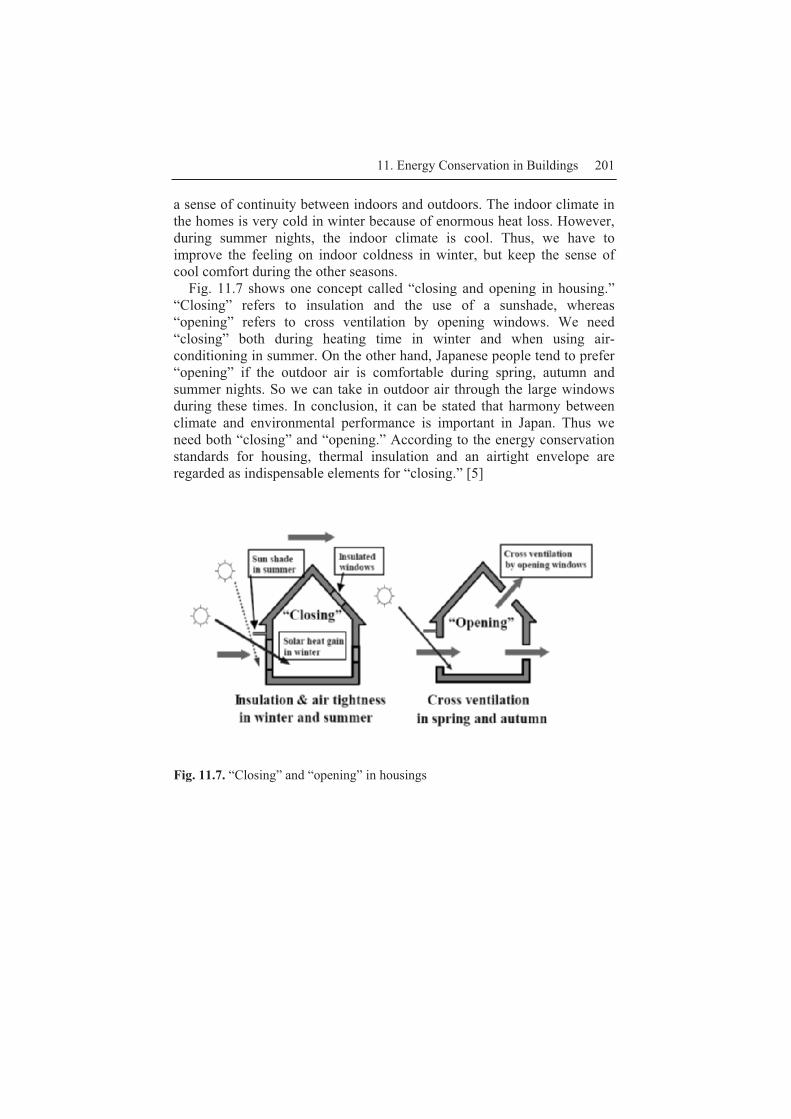
11. Energy Conservation in Buildings 201
a sense of continuity between indoors and outdoors. The indoor climate in the homes is very cold in winter because of enormous heat loss. However, during summer nights, the indoor climate is cool. Thus, we have to improve the feeling on indoor coldness in winter, but keep the sense of cool comfort during the other seasons.
Fig. 11.7 shows one concept called “closing and opening in housing.” “Closing” refers to insulation and the use of a sunshade, whereas “opening” refers to cross ventilation by opening windows. We need “closing” both during heating time in winter and when using air-conditioning in summer. On the other hand, Japanese people tend to prefer “opening” if the outdoor air is comfortable during spring, autumn and summer nights. So we can take in outdoor air through the large windows during these times. In conclusion, it can be stated that harmony between climate and environmental performance is important in Japan. Thus we need both “closing” and “opening.” According to the energy conservation standards for housing, thermal insulation and an airtight envelope are regarded as indispensable elements for “closing.” [5]
Fig. 11.7. “Closing” and “opening” in housings

202 Yuzo Sakamoto
Fig. 11.8. Definition of Q-value, used as an indicator for thermal insulation
Q-value, an indicator for thermal insulation, is introduced and defined by the equation shown in Fig. 11.8. According to this equation, the Q-value is calculated by dividing total heat loss by the total floor area, where total heat loss is composed of heat loss through building components and through ventilation. Thus the Q-value is very important and is a very sensitive indicator of thermal insulation performance, as shown in Fig. 11.9. The figure shows that a smaller Q-value corresponds to a smaller heating load in all cities. Therefore, in the energy conservation standards for housing, the criteria related to envelope insulation have been defined using Q-values. Fig. 11.9 also illustrates the criteria for the Q-value in the three standards and shows the differences of heating load among the different standards. Fig. 11.10 is another example, showing the influence of Q-value on the temperature difference between indoors and outdoors. The temperature difference is inversely proportional to the Q-value. So the temperature difference approaches 12K in the case of much solar heat gain, where the Q-value is 1.6W/(K).
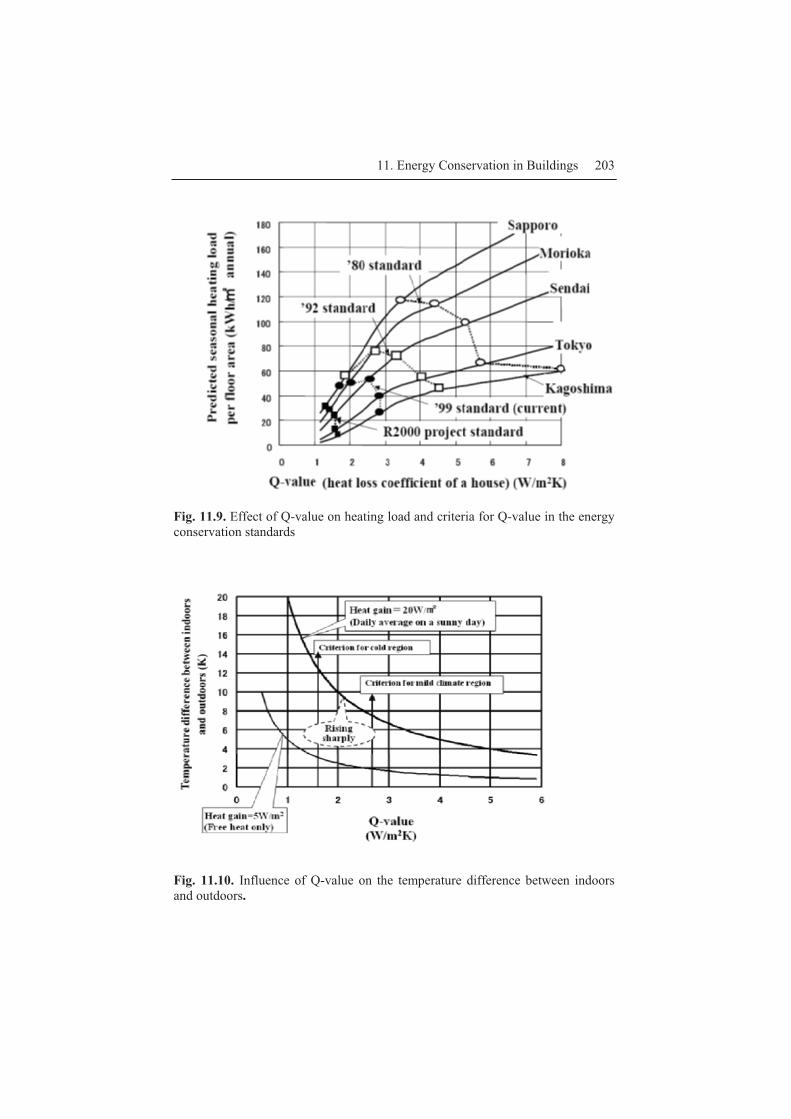
11. Energy Conservation in Buildings 203
Fig. 11.9. Effect of Q-value on heating load and criteria for Q-value in the energy conservation standards
Fig. 11.10. Influence of Q-value on the temperature difference between indoors and outdoors.
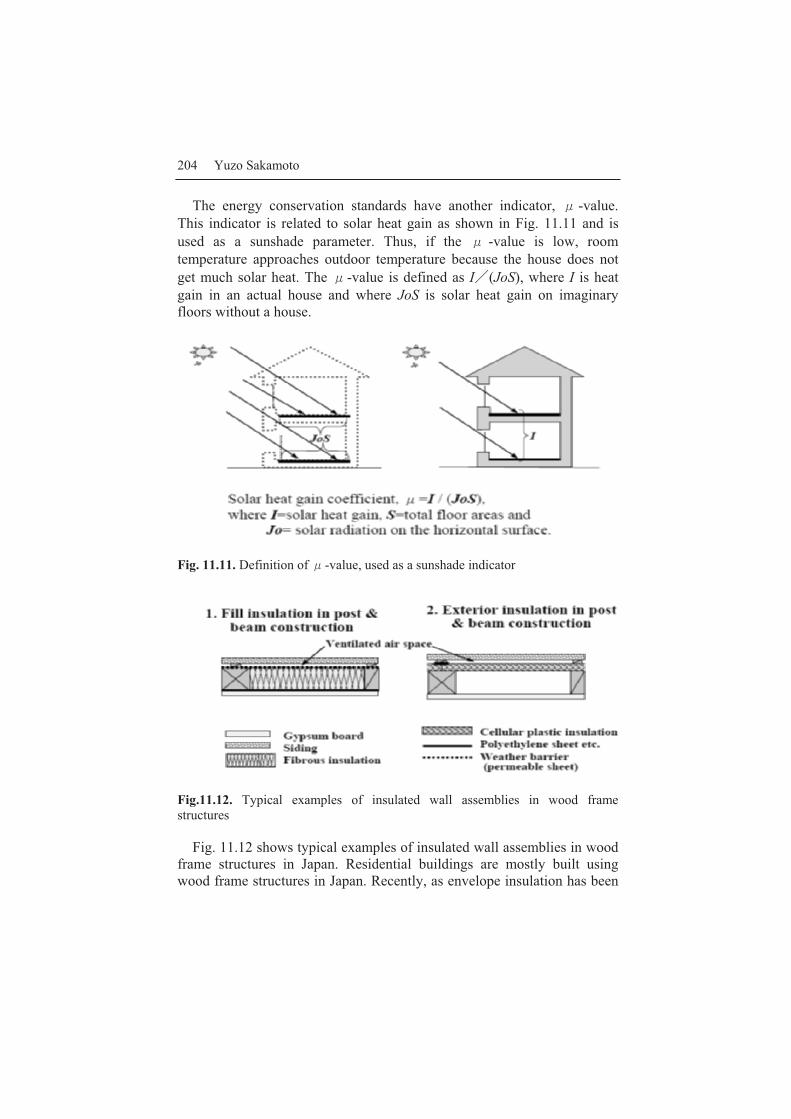
204 Yuzo Sakamoto
The energy conservation standards have another indicator, �-value. This indicator is related to solar heat gain as shown in Fig. 11.11 and is used as a sunshade parameter. Thus, if the � -value is low, room temperature approaches outdoor temperature because the house does not get much solar heat. The �-value is defined as I�(JoS), where I is heat gain in an actual house and where JoS is solar heat gain on imaginary floors without a house.
Fig. 11.11. Definition of �-value, used as a sunshade indicator
Fig.11.12. Typical examples of insulated wall assemblies in wood frame structures
Fig. 11.12 shows typical examples of insulated wall assemblies in wood frame structures in Japan. Residential buildings are mostly built using wood frame structures in Japan. Recently, as envelope insulation has been
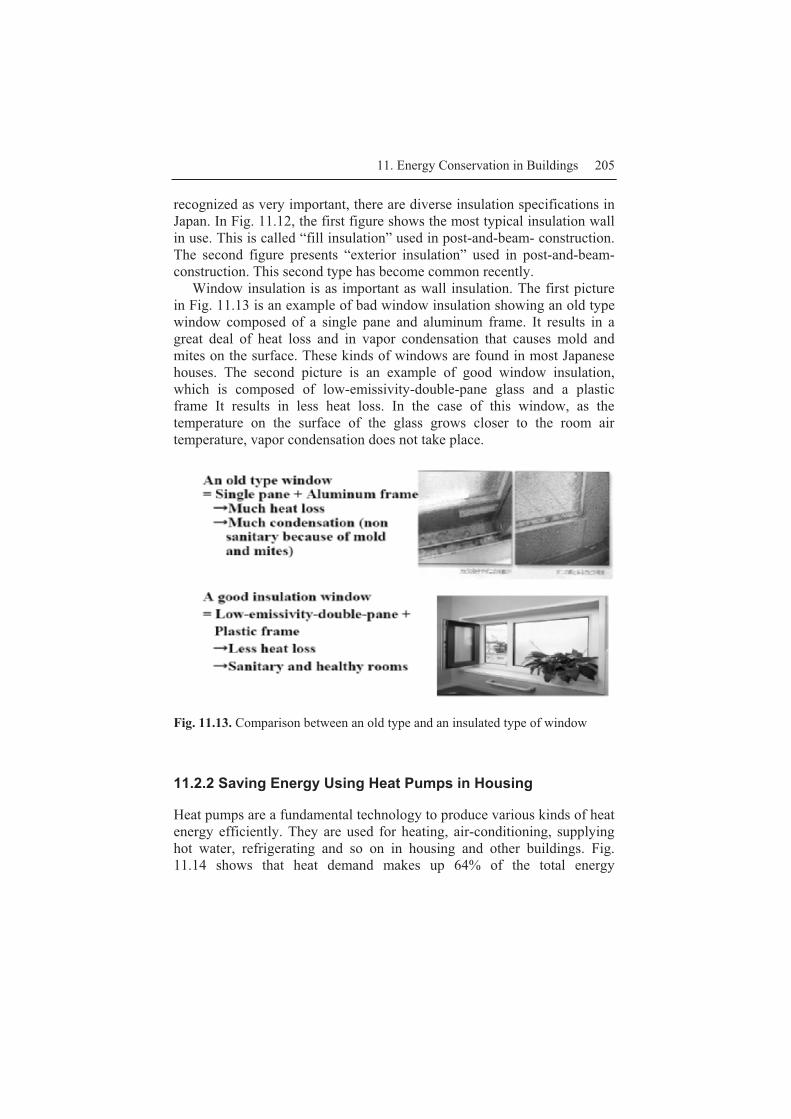
11. Energy Conservation in Buildings 205
recognized as very important, there are diverse insulation specifications in Japan. In Fig. 11.12, the first figure shows the most typical insulation wall in use. This is called “fill insulation” used in post-and-beam- construction. The second figure presents “exterior insulation” used in post-and-beam-construction. This second type has become common recently.
Window insulation is as important as wall insulation. The first picture in Fig. 11.13 is an example of bad window insulation showing an old type window composed of a single pane and aluminum frame. It results in a great deal of heat loss and in vapor condensation that causes mold and mites on the surface. These kinds of windows are found in most Japanese houses. The second picture is an example of good window insulation, which is composed of low-emissivity-double-pane glass and a plastic frame It results in less heat loss. In the case of this window, as the temperature on the surface of the glass grows closer to the room air temperature, vapor condensation does not take place.
Fig. 11.13. Comparison between an old type and an insulated type of window
11.2.2 Saving Energy Using Heat Pumps in Housing
Heat pumps are a fundamental technology to produce various kinds of heat energy efficiently. They are used for heating, air-conditioning, supplying hot water, refrigerating and so on in housing and other buildings. Fig. 11.14 shows that heat demand makes up 64% of the total energy

206 Yuzo Sakamoto
consumption in housing. A major part of the heat demand consists of supplying hot water.
Others36%
Cooking6%
Hot watersupply27%
Heating29%
Air conditioning 2%
Total [email protected]×1018J
Total heatdemand=64%
Fig. 11.14. Details of domestic energy consumption in Japan [6]
A heat pump is a machine that takes heat energy from a heat source and supplies that heat energy to a heat sink, as shown on the left of Fig. 11.15. The heat pumps works through mechanical force, which is usually provided by electric motors. A theoretical equation for the COP(coefficient of performance) of an ideal heat pump is formulated in terms of thermo-dynamics, as shown below in Fig. 11.15. COP is an indicator that shows the energy efficiency of a heat pump, and is defined as the ratio of output heat to the electric energy input. Three curves in the graph on the right indicate the COPs derived from that equation. The maximum values of COP among existent air-conditioners and hot-water-suppliers are also plotted on the graph. In addition, a dashed line on the graph presents the COP that is equivalent to 100% energy efficiency in a combustion boiler. The graph shows that the energy-efficiency of a heat pump is much higher than that of a combustion boiler in Japan.
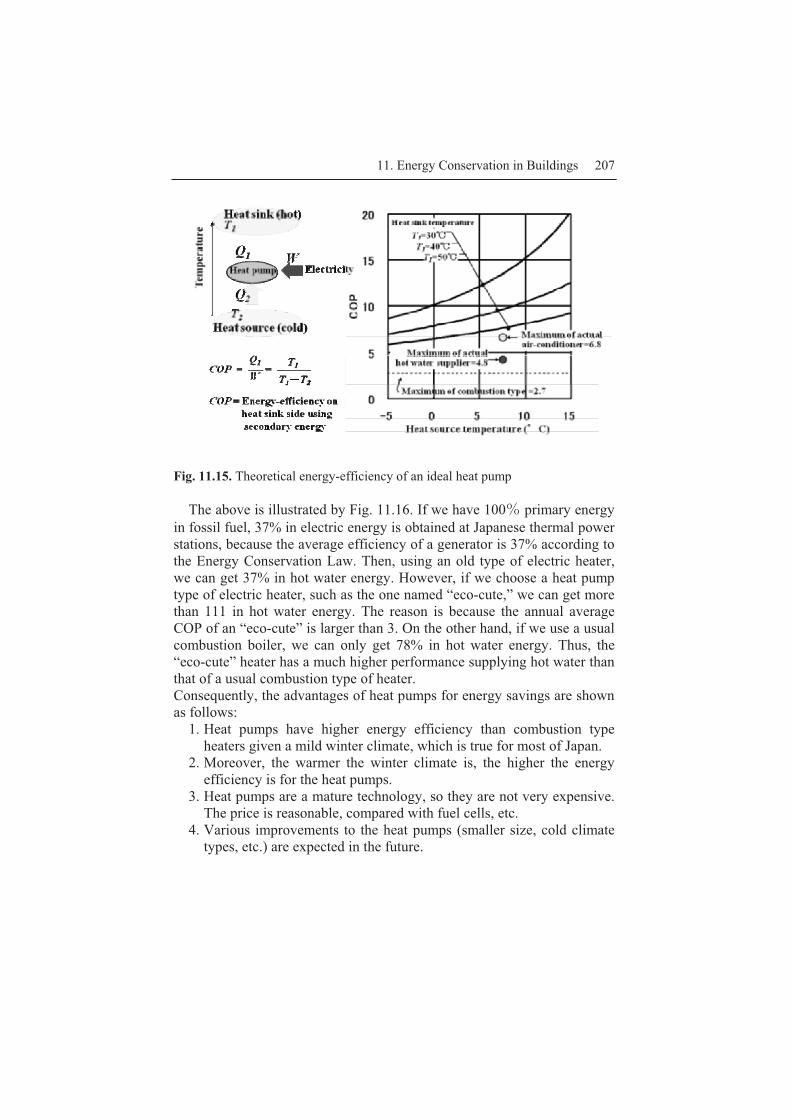
11. Energy Conservation in Buildings 207
Fig. 11.15. Theoretical energy-efficiency of an ideal heat pump
The above is illustrated by Fig. 11.16. If we have 100 primary energy in fossil fuel, 37% in electric energy is obtained at Japanese thermal power stations, because the average efficiency of a generator is 37% according to the Energy Conservation Law. Then, using an old type of electric heater, we can get 37% in hot water energy. However, if we choose a heat pump type of electric heater, such as the one named “eco-cute,” we can get more than 111 in hot water energy. The reason is because the annual average COP of an “eco-cute” is larger than 3. On the other hand, if we use a usual combustion boiler, we can only get 78% in hot water energy. Thus, the “eco-cute” heater has a much higher performance supplying hot water than that of a usual combustion type of heater. Consequently, the advantages of heat pumps for energy savings are shown as follows:
1. Heat pumps have higher energy efficiency than combustion type heaters given a mild winter climate, which is true for most of Japan.
2. Moreover, the warmer the winter climate is, the higher the energy efficiency is for the heat pumps.
3. Heat pumps are a mature technology, so they are not very expensive. The price is reasonable, compared with fuel cells, etc.
4. Various improvements to the heat pumps (smaller size, cold climate types, etc.) are expected in the future.
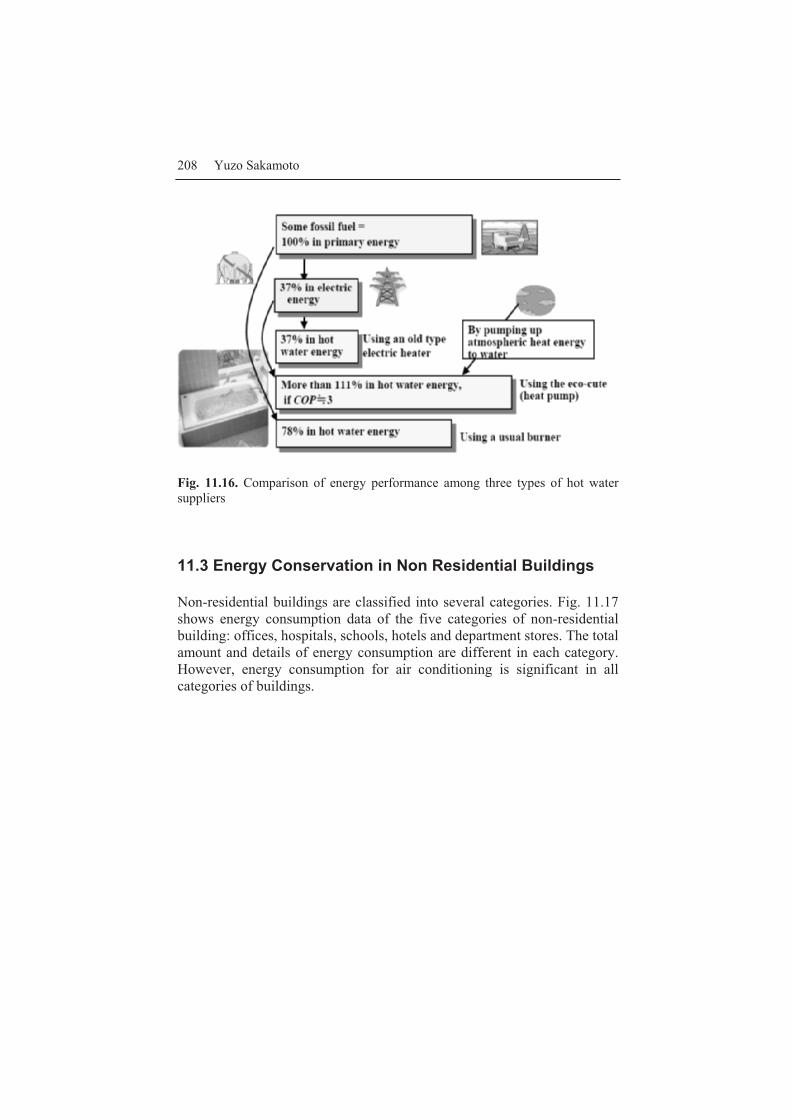
208 Yuzo Sakamoto
Fig. 11.16. Comparison of energy performance among three types of hot water suppliers
11.3 Energy Conservation in Non Residential Buildings
Non-residential buildings are classified into several categories. Fig. 11.17 shows energy consumption data of the five categories of non-residential building: offices, hospitals, schools, hotels and department stores. The total amount and details of energy consumption are different in each category. However, energy consumption for air conditioning is significant in all categories of buildings.

11. Energy Conservation in Buildings 209
Fig. 11.17. Energy consumption in five categories of non-residential buildings [7]
Fig. 11.18 shows three strategies to save energy in buildings: envelope design, equipment system efficiency and energy management. Under the present energy conservation standards, there are independent criteria for envelope design and for equipment. For envelope design, PAL (perimeter
Fig. 11.18. Three strategies to save energy in buildings

210 Yuzo Sakamoto
annual load) is an indicator to show annual thermal load; for equipment design, another indicator, CEC (coefficient of energy consumption), is used.
PAL is used to evaluate envelope insulation, sunshade of windows and building plans. However, passive technologies like cross ventilation and daylighting are not evaluated by PAL. CEC is composed of five kinds of CEC: CEC/AC for air-conditioning systems, CEC/V for ventilation systems, CEC/L for lighting systems, CEC/HW for hot water supply systems and CEC/EV for elevator systems. These CECs are the indicators for energy efficiency of the respective pieces of equipment.
The definitions of PAL and CEC are shown in Fig. 11.19. PAL is the annual perimeter thermal load divided by the perimeter floor area. The perimeter is illustrated in the figure. The criteria for PAL and CEC’s are listed in Table11.2.
Fig. 11.19. Definitions of energy performance indicators (PAL and five CECs)
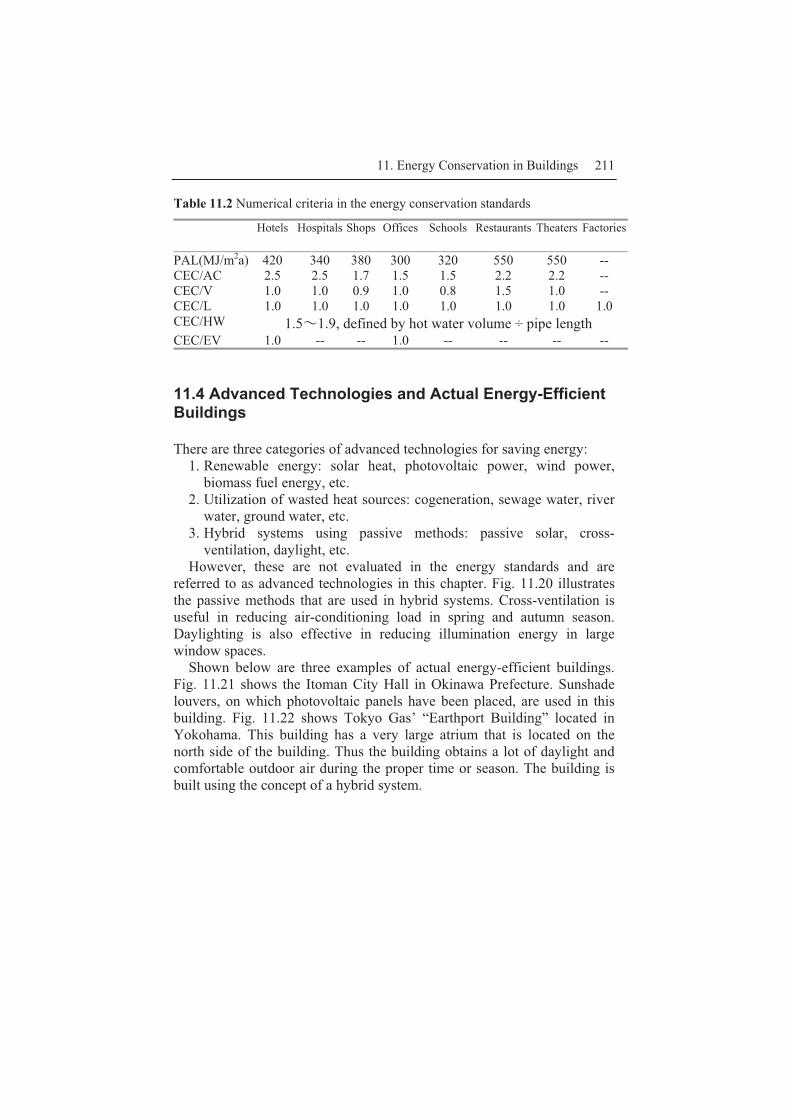
11. Energy Conservation in Buildings 211
Table 11.2 Numerical criteria in the energy conservation standards
Hotels Hospitals Shops Offices Schools Restaurants Theaters Factories
PAL(MJ/m2a) 420 340 380 300 320 550 550 -- CEC/AC 2.5 2.5 1.7 1.5 1.5 2.2 2.2 -- CEC/V 1.0 1.0 0.9 1.0 0.8 1.5 1.0 -- CEC/L 1.0 1.0 1.0 1.0 1.0 1.0 1.0 1.0 CEC/HW 1.5�1.9, defined by hot water volume ÷ pipe length CEC/EV 1.0 -- -- 1.0 -- -- -- --
11.4 Advanced Technologies and Actual Energy-Efficient Buildings
There are three categories of advanced technologies for saving energy: 1. Renewable energy: solar heat, photovoltaic power, wind power,
biomass fuel energy, etc. 2. Utilization of wasted heat sources: cogeneration, sewage water, river
water, ground water, etc. 3. Hybrid systems using passive methods: passive solar, cross-
ventilation, daylight, etc. However, these are not evaluated in the energy standards and are
referred to as advanced technologies in this chapter. Fig. 11.20 illustrates the passive methods that are used in hybrid systems. Cross-ventilation is useful in reducing air-conditioning load in spring and autumn season. Daylighting is also effective in reducing illumination energy in large window spaces.
Shown below are three examples of actual energy-efficient buildings. Fig. 11.21 shows the Itoman City Hall in Okinawa Prefecture. Sunshade louvers, on which photovoltaic panels have been placed, are used in this building. Fig. 11.22 shows Tokyo Gas’ “Earthport Building” located in Yokohama. This building has a very large atrium that is located on the north side of the building. Thus the building obtains a lot of daylight and comfortable outdoor air during the proper time or season. The building is built using the concept of a hybrid system.
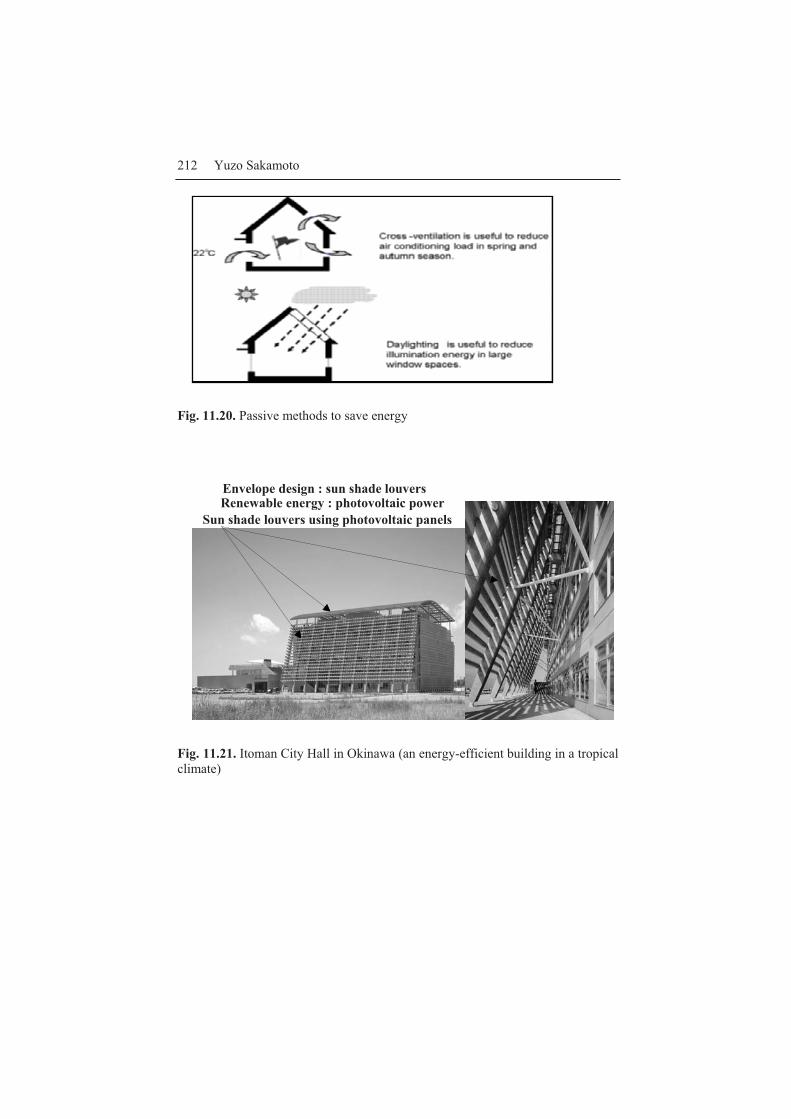
212 Yuzo Sakamoto
Fig. 11.20. Passive methods to save energy
Fig. 11.21. Itoman City Hall in Okinawa (an energy-efficient building in a tropical climate)
Renewable energy : photovoltaic powerEnvelope design : sun shade louvers
Sun shade louvers using photovoltaic panels
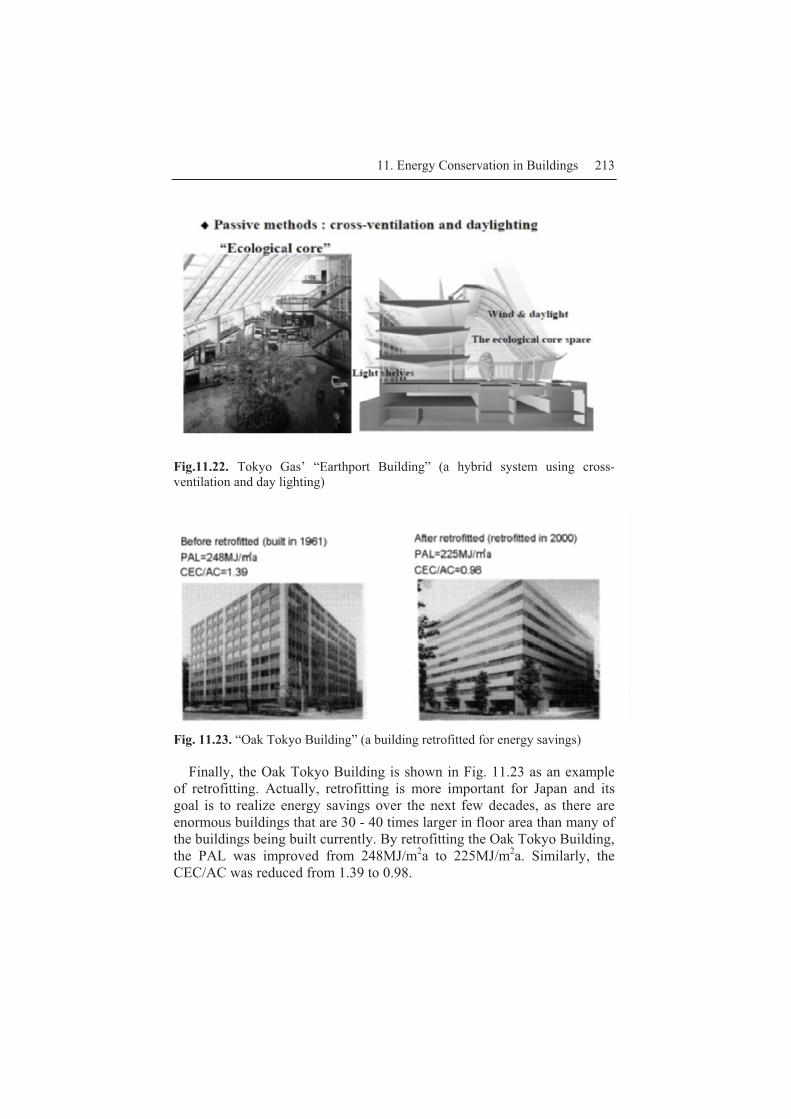
11. Energy Conservation in Buildings 213
Fig.11.22. Tokyo Gas’ “Earthport Building” (a hybrid system using cross-ventilation and day lighting)
Fig. 11.23. “Oak Tokyo Building” (a building retrofitted for energy savings)
Finally, the Oak Tokyo Building is shown in Fig. 11.23 as an example of retrofitting. Actually, retrofitting is more important for Japan and its goal is to realize energy savings over the next few decades, as there are enormous buildings that are 30 - 40 times larger in floor area than many of the buildings being built currently. By retrofitting the Oak Tokyo Building, the PAL was improved from 248MJ/m2a to 225MJ/m2a. Similarly, the CEC/AC was reduced from 1.39 to 0.98.

214 Yuzo Sakamoto
References
[1] Oak Ridge National Laboratory (2000) [2] Japan Center for Climate Change Actions (2005) [3] Japan Industrial Association of Gas and Kerosene Appliances (2005) [4] Institute for Building Energy Conservation, Japan (2002), “ A Guidebook
to the Energy Conservation Standards for Housing” (in Japanese) [5] Y.Sakamoto (1999), Energy Conservation Standards for Residential
Buildings, Revised for Japanese Next Generation, Proceedings of Fifth Canada-Japan Housing R&D Workshop, Charlottetown, 351-362,
[6] The Energy Conservation Center, Japan (2005) [7] Institute for Building Energy Conservation (2005) “ A Guidebook to the
Energy Conservation Standards for Buildings” (in Japanese)
12. Management of Urban Heat Environment
Yasunobu Ashie
Designated Visiting Researcher Courses, The University of Tokyo 7-3-1, Hongo, Bunkyo-ku, Tokyo, 113-8656, Japan�
12.1 The Urban Heat Island Mechanism and Its Effects
12.1.1 Urban heat islands
The urban heat island effect describes a phenomenon in which urban tem-peratures exceed those of areas outside the city, as shown in Figure 12.1. When contour lines of the temperatures are drawn on a horizontal plane, the resulting figure appears like an island in the middle of an ocean, hence the term “heat island.” The urban heat island effect was first observed in London in the 19th century [1], and there have since been numerous ob-servations of heat islands in cities around the globe. Urban heat islands are most prominent at night during clear weather with low winds. While urban heat islands are often considered to be a problem during summer months, it is actually often during the winter when the effect is most pronounced. Urban heat islands are often evaluated in terms of heat island intensity, which describes the maximum temperature difference between the urban and outlying regions. Urban heat islands typically exhibit a positive rela-tionship with population size [1]. In Japan, most major cities are located in coastal areas, and there are many cases where urban development extends to mountainous regions with different topographical conditions. Heat isl-and intensity in Japan is often generalized based on the quality of tempera-ture contours, but it is often difficult to accurately specify an outlying, non-urban location.

216 Yasunobu Ashie
12.1.2 Annual temperature trends
Figure 12.2 indicates annual temperature trends of several major world ci-ties. The temperature in Tokyo (Otemachi district) has increased 2.9 de-grees Celsius over the past 100 years. During this time, global temperature is estimated to have increased 0.7 degrees, which suggests that global warming in Tokyo is occurring at a speed of several times greater than that of the planet.
Fig.12.1. An urban heat island (Source: Lawrence Berkeley National Laboratory)

12. Management of Urban Heat Environment 217
Fig.12.2. Yearly average temperature for Tokyo and other world cities (Original drawing: Mikami, Partially edited)
While temperature change in New York and Paris is not exceptionally noticeable after 1950, in the case of Tokyo the temperature has been conti-nuously rising into the latter half of the 20th century. The reason for this difference is believed to stem from disparities in urban form and architec-ture found in Japanese and Western metropolises, as well as variations in the time periods of urban development.
12.1.3 Temperature distribution and winds in Tokyo
The distribution of summer temperatures and winds around Tokyo and the surrounding region is indicated in Figure 12.3[2]. The daytime peak tem-perature does not appear in the center of the city, but form a high-temperature region extending from the northern part of Tokyo’s 23-ward area to Saitama prefecture located further inland. In the 23-ward area, a southerly wind predominantly blows from Tokyo Bay. Due to a difference in temperature between the ocean wind and the temperature on land of a few degrees Celsius, the cooling effect of the ocean wind is believed to be influencing this temperature distribution. Naturally, the cooling effect of the ocean wind does not take effect when weather conditions are such that
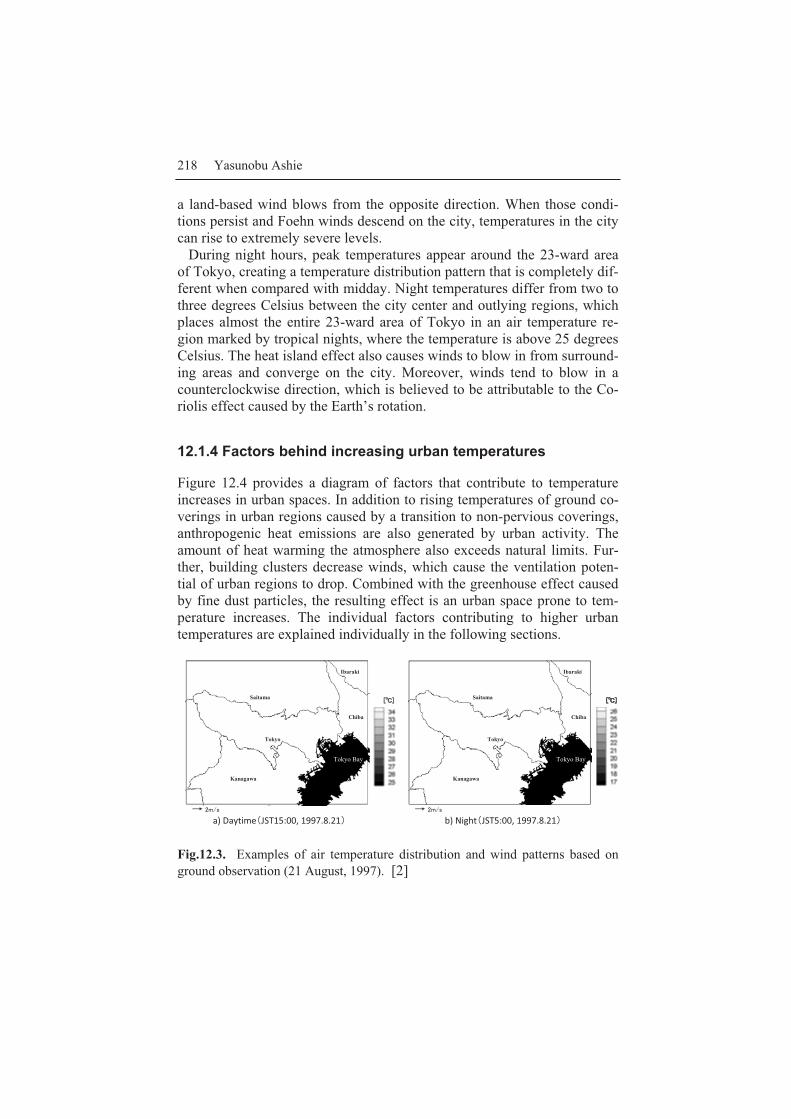
218 Yasunobu Ashie
a land-based wind blows from the opposite direction. When those condi-tions persist and Foehn winds descend on the city, temperatures in the city can rise to extremely severe levels. During night hours, peak temperatures appear around the 23-ward area of Tokyo, creating a temperature distribution pattern that is completely dif-ferent when compared with midday. Night temperatures differ from two to three degrees Celsius between the city center and outlying regions, which places almost the entire 23-ward area of Tokyo in an air temperature re-gion marked by tropical nights, where the temperature is above 25 degrees Celsius. The heat island effect also causes winds to blow in from surround-ing areas and converge on the city. Moreover, winds tend to blow in a counterclockwise direction, which is believed to be attributable to the Co-riolis effect caused by the Earth’s rotation.
12.1.4 Factors behind increasing urban temperatures
Figure 12.4 provides a diagram of factors that contribute to temperature increases in urban spaces. In addition to rising temperatures of ground co-verings in urban regions caused by a transition to non-pervious coverings, anthropogenic heat emissions are also generated by urban activity. The amount of heat warming the atmosphere also exceeds natural limits. Fur-ther, building clusters decrease winds, which cause the ventilation poten-tial of urban regions to drop. Combined with the greenhouse effect caused by fine dust particles, the resulting effect is an urban space prone to tem-perature increases. The individual factors contributing to higher urban temperatures are explained individually in the following sections.
Fig.12.3. Examples of air temperature distribution and wind patterns based on ground observation (21 August, 1997). [2]
Tokyo
Kanagawa
Saitama
Chiba
Ibaraki
Tokyo Bay
����
��NN����NN��
b) NightOJST5:00, 1997.8.21P����
��NN��
a) DaytimeOJST15:00, 1997.8.21P
Tokyo
Kanagawa
Saitama
Chiba
Ibaraki
Tokyo Bay

12. Management of Urban Heat Environment 219
Fig.12.4. Factors behind rising urban temperatures
Ground cover
Figure 12.5 indicates the breakdown of land usage within the 23 wards of Tokyo. With 56.6% for buildings and 21.1% for road purposes, buildings and roads account for 77.7% of the total. Since buildings and roads primar-ily consist of man-made materials like asphalt and concrete, the surface temperatures of these materials when exposed to sunlight in the middle of the day can rise up to 50 or 60 degrees Celsius. The added thermal mass of the houses and roads means that even at night, the urban surfaces still fail to cool significantly. Combining the land use ratios of forests, water, agri-culture, bare wilderness, and parks, the figure only amounts to around 13.8% for the whole 23 wards of Tokyo. Looking at the overall pattern of land usage in Tokyo, there is little chance for vaporization from such areas to cool the ground and other surfaces.
Anthropogenic heat emissions
The daily total of anthropogenic heat emissions (for an average day in Au-gust) generated from buildings, transportation systems and industrial facili-
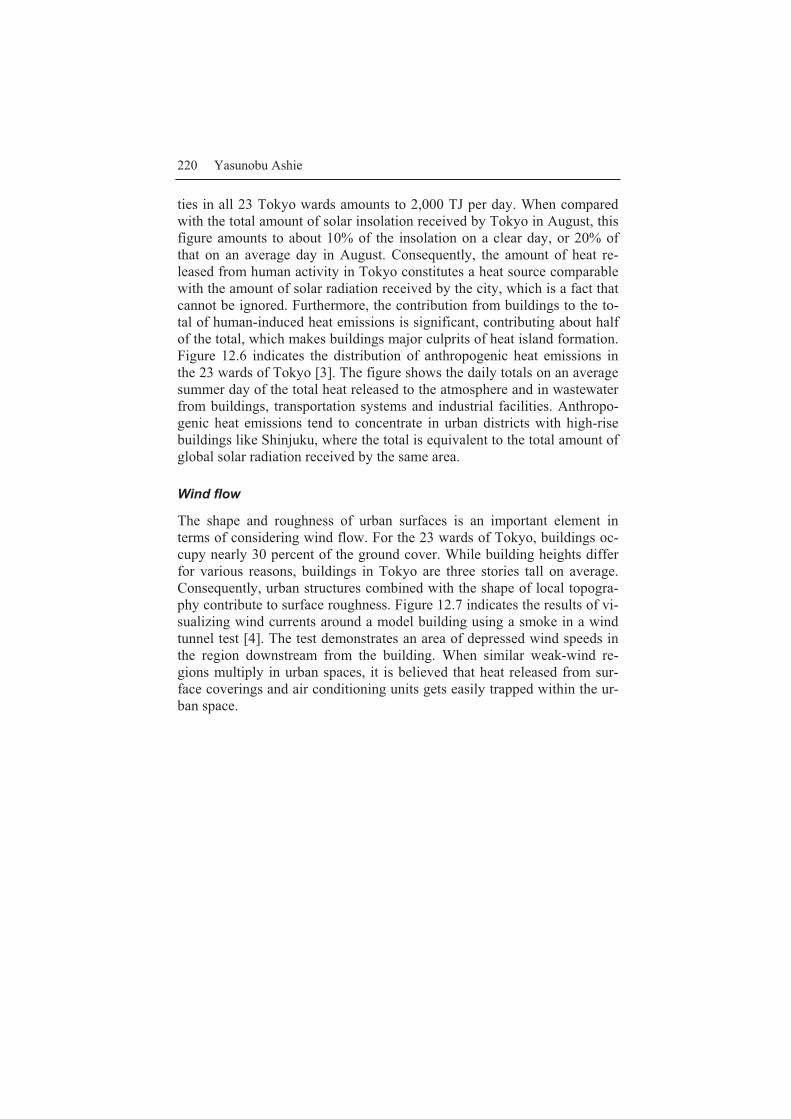
220 Yasunobu Ashie
ties in all 23 Tokyo wards amounts to 2,000 TJ per day. When compared with the total amount of solar insolation received by Tokyo in August, this figure amounts to about 10% of the insolation on a clear day, or 20% of that on an average day in August. Consequently, the amount of heat re-leased from human activity in Tokyo constitutes a heat source comparable with the amount of solar radiation received by the city, which is a fact that cannot be ignored. Furthermore, the contribution from buildings to the to-tal of human-induced heat emissions is significant, contributing about half of the total, which makes buildings major culprits of heat island formation. Figure 12.6 indicates the distribution of anthropogenic heat emissions in the 23 wards of Tokyo [3]. The figure shows the daily totals on an average summer day of the total heat released to the atmosphere and in wastewater from buildings, transportation systems and industrial facilities. Anthropo-genic heat emissions tend to concentrate in urban districts with high-rise buildings like Shinjuku, where the total is equivalent to the total amount of global solar radiation received by the same area.
Wind flow
The shape and roughness of urban surfaces is an important element in terms of considering wind flow. For the 23 wards of Tokyo, buildings oc-cupy nearly 30 percent of the ground cover. While building heights differ for various reasons, buildings in Tokyo are three stories tall on average. Consequently, urban structures combined with the shape of local topogra-phy contribute to surface roughness. Figure 12.7 indicates the results of vi-sualizing wind currents around a model building using a smoke in a wind tunnel test [4]. The test demonstrates an area of depressed wind speeds in the region downstream from the building. When similar weak-wind re-gions multiply in urban spaces, it is believed that heat released from sur-face coverings and air conditioning units gets easily trapped within the ur-ban space.
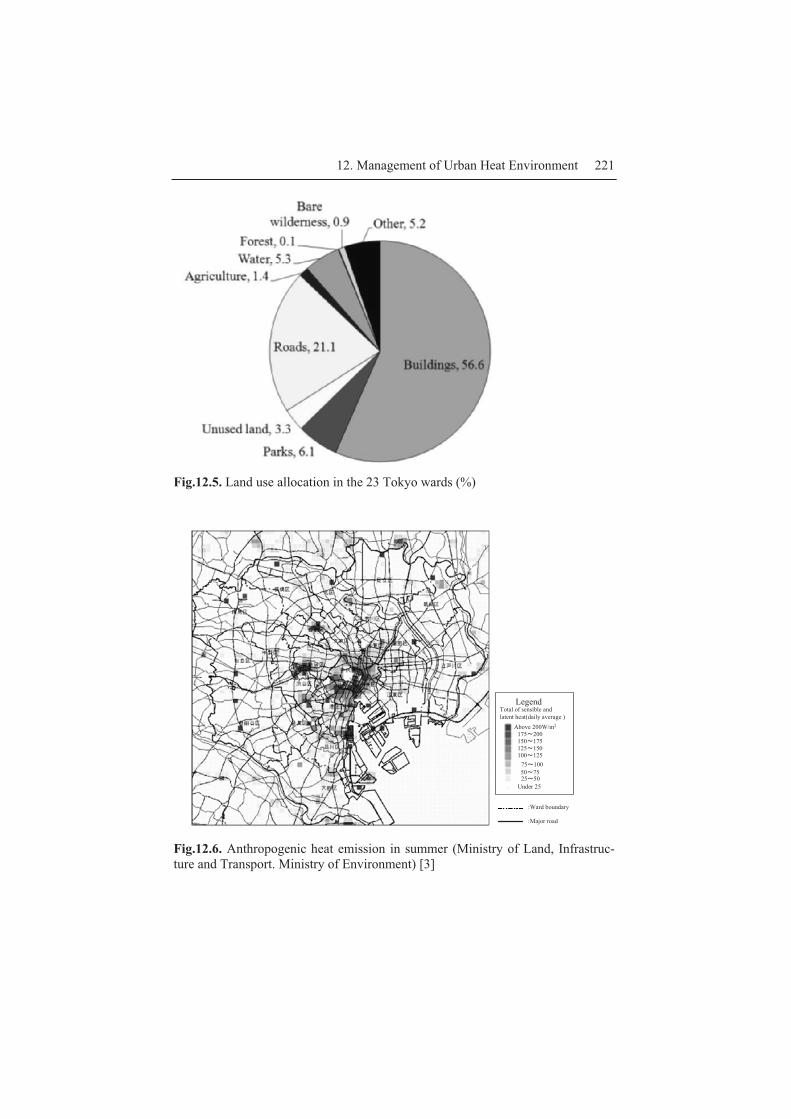
12. Management of Urban Heat Environment 221
Fig.12.5. Land use allocation in the 23 Tokyo wards (%)
LegendTotal of sensible and latent heat(daily average )
Above 200W/m2
175Q200150Q175125Q150100Q125
75Q10050Q7525Q50
Under 25
RWard boundary
RMajor road
Fig.12.6. Anthropogenic heat emission in summer (Ministry of Land, Infrastruc-ture and Transport. Ministry of Environment) [3]
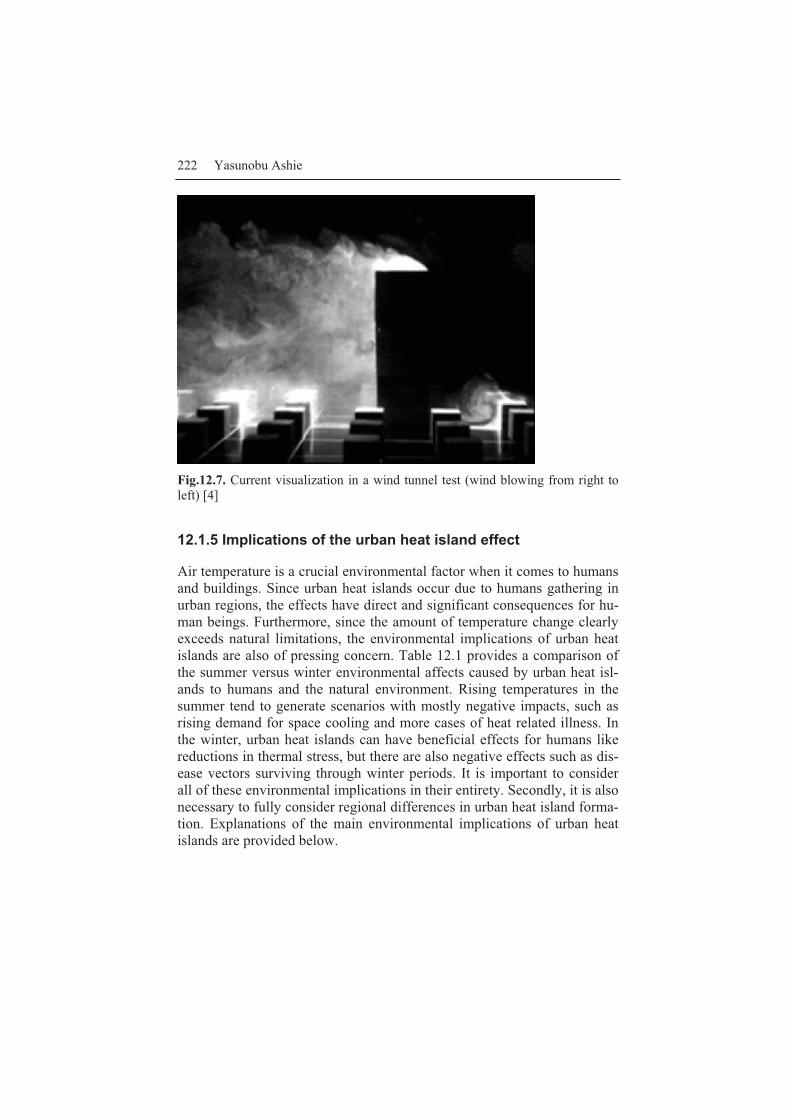
222 Yasunobu Ashie
Fig.12.7. Current visualization in a wind tunnel test (wind blowing from right to left) [4]
12.1.5 Implications of the urban heat island effect
Air temperature is a crucial environmental factor when it comes to humans and buildings. Since urban heat islands occur due to humans gathering in urban regions, the effects have direct and significant consequences for hu-man beings. Furthermore, since the amount of temperature change clearly exceeds natural limitations, the environmental implications of urban heat islands are also of pressing concern. Table 12.1 provides a comparison of the summer versus winter environmental affects caused by urban heat isl-ands to humans and the natural environment. Rising temperatures in the summer tend to generate scenarios with mostly negative impacts, such as rising demand for space cooling and more cases of heat related illness. In the winter, urban heat islands can have beneficial effects for humans like reductions in thermal stress, but there are also negative effects such as dis-ease vectors surviving through winter periods. It is important to consider all of these environmental implications in their entirety. Secondly, it is also necessary to fully consider regional differences in urban heat island forma-tion. Explanations of the main environmental implications of urban heat islands are provided below.
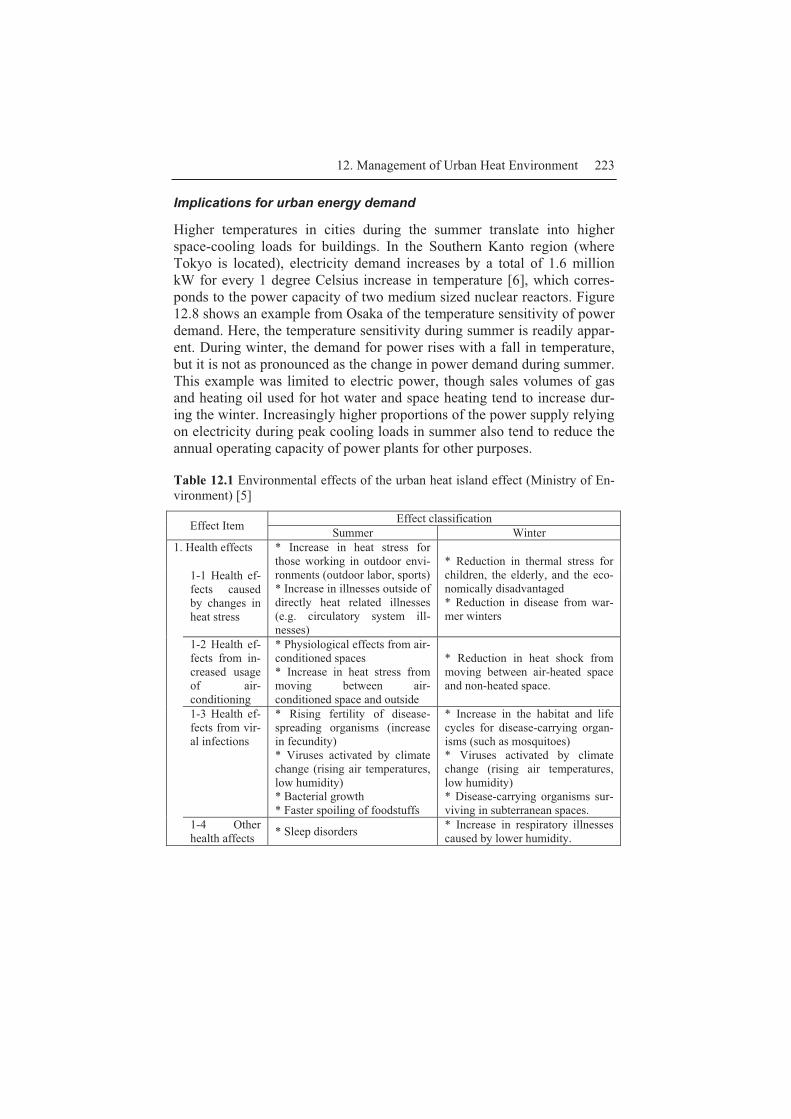
12. Management of Urban Heat Environment 223
Implications for urban energy demand
Higher temperatures in cities during the summer translate into higher space-cooling loads for buildings. In the Southern Kanto region (where Tokyo is located), electricity demand increases by a total of 1.6 million kW for every 1 degree Celsius increase in temperature [6], which corres-ponds to the power capacity of two medium sized nuclear reactors. Figure 12.8 shows an example from Osaka of the temperature sensitivity of power demand. Here, the temperature sensitivity during summer is readily appar-ent. During winter, the demand for power rises with a fall in temperature, but it is not as pronounced as the change in power demand during summer. This example was limited to electric power, though sales volumes of gas and heating oil used for hot water and space heating tend to increase dur-ing the winter. Increasingly higher proportions of the power supply relying on electricity during peak cooling loads in summer also tend to reduce the annual operating capacity of power plants for other purposes.
Table 12.1 Environmental effects of the urban heat island effect (Ministry of En-vironment) [5]
Effect Item Effect classification Summer Winter
1. Health effects
* Increase in heat stress for those working in outdoor envi-ronments (outdoor labor, sports)* Increase in illnesses outside of directly heat related illnesses (e.g. circulatory system ill-nesses)
* Reduction in thermal stress for children, the elderly, and the eco-nomically disadvantaged * Reduction in disease from war-mer winters
1-1 Health ef-fects caused by changes in heat stress
1-2 Health ef-fects from in-creased usage of air-conditioning
* Physiological effects from air-conditioned spaces * Increase in heat stress from moving between air-conditioned space and outside
* Reduction in heat shock from moving between air-heated space and non-heated space.
1-3 Health ef-fects from vir-al infections
* Rising fertility of disease-spreading organisms (increase in fecundity) * Viruses activated by climate change (rising air temperatures, low humidity) * Bacterial growth * Faster spoiling of foodstuffs
* Increase in the habitat and life cycles for disease-carrying organ-isms (such as mosquitoes) * Viruses activated by climate change (rising air temperatures, low humidity) * Disease-carrying organisms sur-viving in subterranean spaces.
1-4 Other health affects * Sleep disorders * Increase in respiratory illnesses
caused by lower humidity.
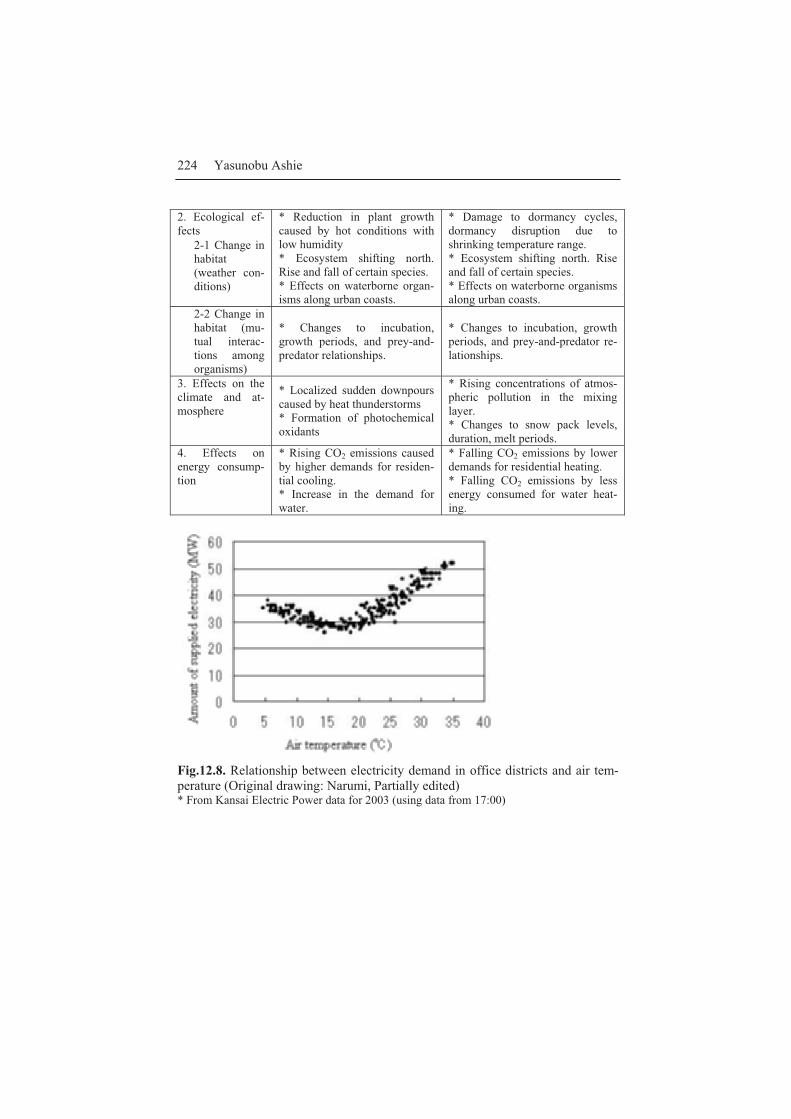
224 Yasunobu Ashie
2. Ecological ef-fects
* Reduction in plant growth caused by hot conditions with low humidity * Ecosystem shifting north. Rise and fall of certain species. * Effects on waterborne organ-isms along urban coasts.
* Damage to dormancy cycles, dormancy disruption due to shrinking temperature range. * Ecosystem shifting north. Rise and fall of certain species. * Effects on waterborne organisms along urban coasts.
2-1 Change in habitat (weather con-ditions)
2-2 Change in habitat (mu-tual interac-tions among organisms)
* Changes to incubation, growth periods, and prey-and-predator relationships.
* Changes to incubation, growth periods, and prey-and-predator re-lationships.
3. Effects on the climate and at-mosphere
* Localized sudden downpours caused by heat thunderstorms * Formation of photochemical oxidants
* Rising concentrations of atmos-pheric pollution in the mixing layer. * Changes to snow pack levels, duration, melt periods.
4. Effects on energy consump-tion
* Rising CO2 emissions caused by higher demands for residen-tial cooling. * Increase in the demand for water.
* Falling CO2 emissions by lower demands for residential heating. * Falling CO2 emissions by less energy consumed for water heat-ing.
Fig.12.8. Relationship between electricity demand in office districts and air tem-perature (Original drawing: Narumi, Partially edited) * From Kansai Electric Power data for 2003 (using data from 17:00)
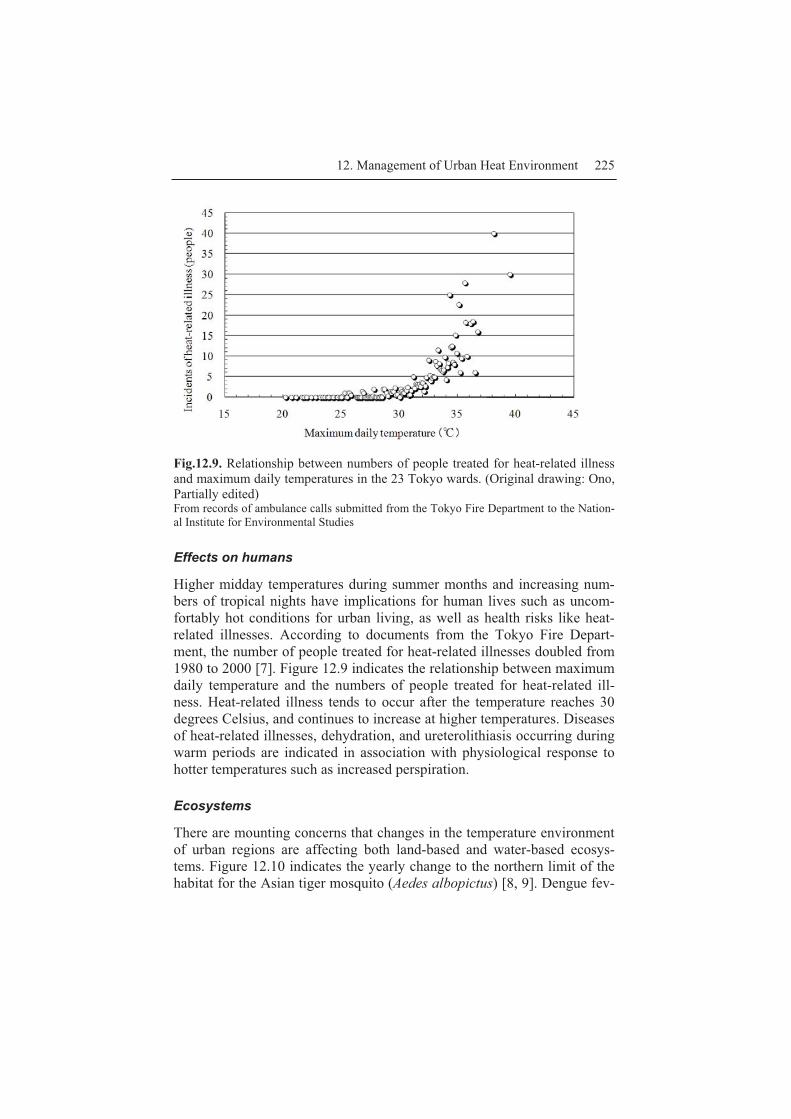
12. Management of Urban Heat Environment 225
Fig.12.9. Relationship between numbers of people treated for heat-related illness and maximum daily temperatures in the 23 Tokyo wards. (Original drawing: Ono, Partially edited) From records of ambulance calls submitted from the Tokyo Fire Department to the Nation-al Institute for Environmental Studies
Effects on humans
Higher midday temperatures during summer months and increasing num-bers of tropical nights have implications for human lives such as uncom-fortably hot conditions for urban living, as well as health risks like heat-related illnesses. According to documents from the Tokyo Fire Depart-ment, the number of people treated for heat-related illnesses doubled from 1980 to 2000 [7]. Figure 12.9 indicates the relationship between maximum daily temperature and the numbers of people treated for heat-related ill-ness. Heat-related illness tends to occur after the temperature reaches 30 degrees Celsius, and continues to increase at higher temperatures. Diseases of heat-related illnesses, dehydration, and ureterolithiasis occurring during warm periods are indicated in association with physiological response to hotter temperatures such as increased perspiration.
Ecosystems
There are mounting concerns that changes in the temperature environment of urban regions are affecting both land-based and water-based ecosys-tems. Figure 12.10 indicates the yearly change to the northern limit of the habitat for the Asian tiger mosquito (Aedes albopictus) [8, 9]. Dengue fev-
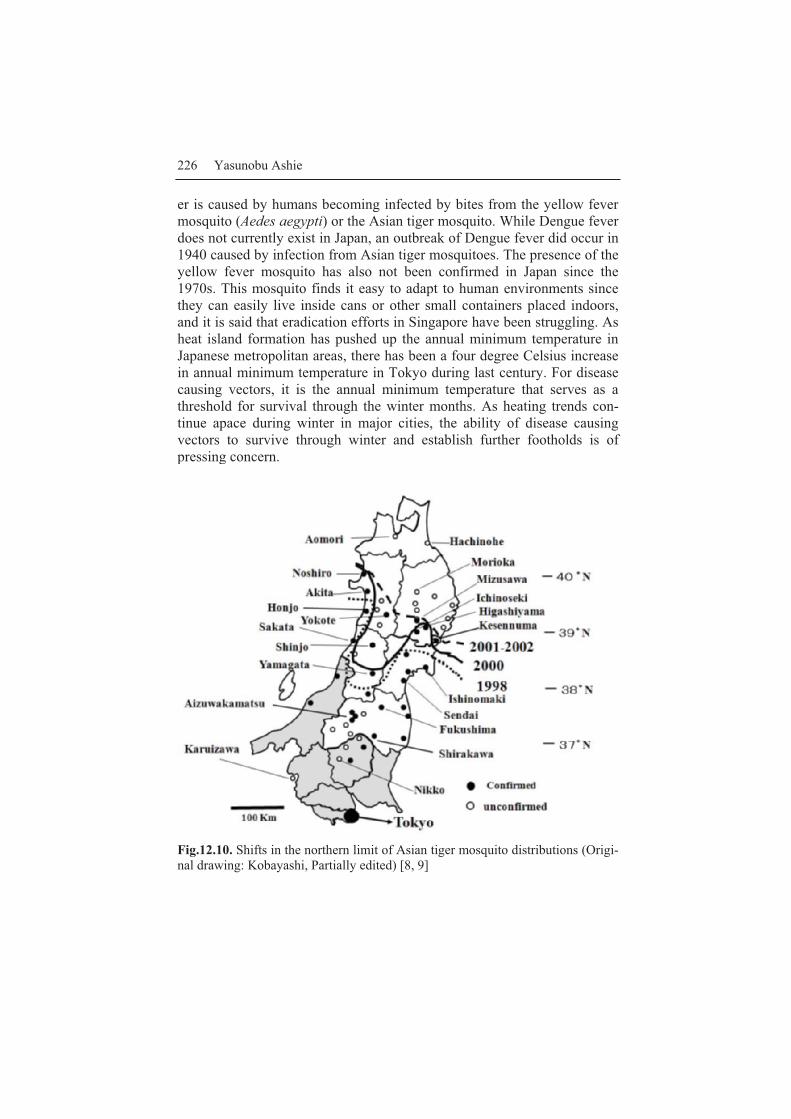
226 Yasunobu Ashie
er is caused by humans becoming infected by bites from the yellow fever mosquito (Aedes aegypti) or the Asian tiger mosquito. While Dengue fever does not currently exist in Japan, an outbreak of Dengue fever did occur in 1940 caused by infection from Asian tiger mosquitoes. The presence of the yellow fever mosquito has also not been confirmed in Japan since the 1970s. This mosquito finds it easy to adapt to human environments since they can easily live inside cans or other small containers placed indoors, and it is said that eradication efforts in Singapore have been struggling. As heat island formation has pushed up the annual minimum temperature in Japanese metropolitan areas, there has been a four degree Celsius increase in annual minimum temperature in Tokyo during last century. For disease causing vectors, it is the annual minimum temperature that serves as a threshold for survival through the winter months. As heating trends con-tinue apace during winter in major cities, the ability of disease causing vectors to survive through winter and establish further footholds is of pressing concern.
Fig.12.10. Shifts in the northern limit of Asian tiger mosquito distributions (Origi-nal drawing: Kobayashi, Partially edited) [8, 9]

12. Management of Urban Heat Environment 227
Fig.12.11. Numerical simulations methods at various scales
12.2 Countermeasures and their effects on urban heat islands
12.2.1 Urban environmental planning and heat island counter-measures
Figure 12.11 lists urban heat island countermeasures according to three different scales, which can be represented by national environmental plans,

228 Yasunobu Ashie
city environmental plans, and district environmental plans. Each plan ad-dresses different elements, which differ according to spatial scale. Conse-quently, it is important to select an appropriate numerical model adequate for assessing a particular heat island countermeasure. Numerical simula-tions provide effective methods for evaluating the effects of heat island countermeasures and clarifying the urban heat island phenomenon. Typical numerical models include the meso-scale model, the urban canopy model and CFD (Computational Fluid Dynamics) assessments. Table 12.2 pro-vides an explanation of how each model addresses aspects such as the de-finition of the urban structure, analytical resolution, region of analysis and primary input conditions.
Table 12.2 Numerical models used in heat island analysis
Model Conceptualization of urban structure
Reso-lution Region of analysis Primary input conditions
Meso-scale model
City treated as a continuous surface with roughness
Rough * Horizontal: Several 100 kilo-meters in all di-rections * Vertical: Several thousand to tens of thou-sands of meters
Physical properties (like heat conductivity, evapora-tion rates, roughness, and albedo levels) and anthro-pogenic heat emissions in-put for different land use types (built up areas, agri-cultural land, oceans and mountains)
Urban canopy model
Building clusters represented with average densities and heights
Mid-dle
* Horizontal: Several tens of ki-lometers in all di-rections * Vertical: Several hundreds to thousands of meters
Building cluster conditions (building-to-land ratios, building height, AC sys-tems) and physical proper-ties of land cover (heat conductivity, evaporation rates, albedo levels) input
CFD Building shape and placement are represented
Fine * Horizontal: Several hundreds of meters in all di-rections * Vertical: Several tens to several hundreds of meters
Shape and location (of buildings, roads, trees, etc.) as well as inputs for physi-cal properties of individual coverings (heat conductivi-ty, evaporation rates, roughness, albedo levels, etc.) and anthropogenic heat emissions
Generally, national environmental plans treat cities as the subject of the plan and investigate environmental problems over an expansive area asso-ciated with city placement, capital relocation or flows between cities. Me-so-scale models are suited for analysis at the national environmental plan level, and provide justification for environmental planning at the national
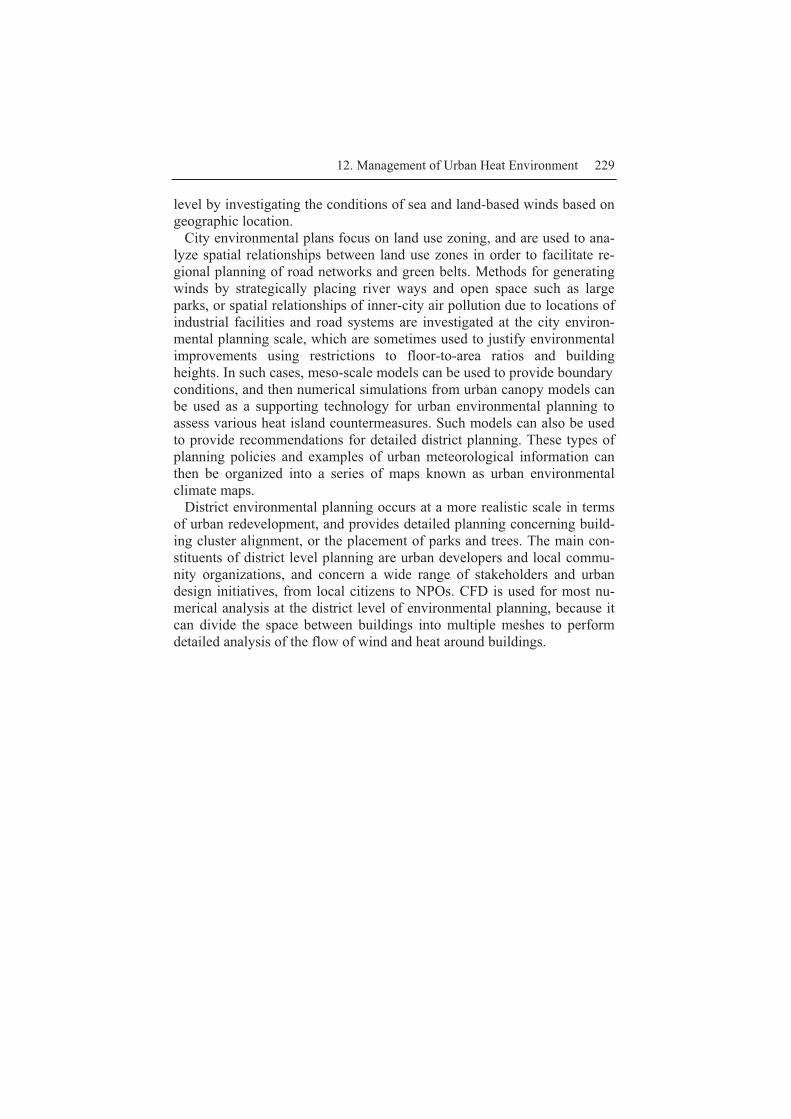
12. Management of Urban Heat Environment 229
level by investigating the conditions of sea and land-based winds based on geographic location. City environmental plans focus on land use zoning, and are used to ana-lyze spatial relationships between land use zones in order to facilitate re-gional planning of road networks and green belts. Methods for generating winds by strategically placing river ways and open space such as large parks, or spatial relationships of inner-city air pollution due to locations of industrial facilities and road systems are investigated at the city environ-mental planning scale, which are sometimes used to justify environmental improvements using restrictions to floor-to-area ratios and building heights. In such cases, meso-scale models can be used to provide boundary conditions, and then numerical simulations from urban canopy models can be used as a supporting technology for urban environmental planning to assess various heat island countermeasures. Such models can also be used to provide recommendations for detailed district planning. These types of planning policies and examples of urban meteorological information can then be organized into a series of maps known as urban environmental climate maps. District environmental planning occurs at a more realistic scale in terms of urban redevelopment, and provides detailed planning concerning build-ing cluster alignment, or the placement of parks and trees. The main con-stituents of district level planning are urban developers and local commu-nity organizations, and concern a wide range of stakeholders and urban design initiatives, from local citizens to NPOs. CFD is used for most nu-merical analysis at the district level of environmental planning, because it can divide the space between buildings into multiple meshes to perform detailed analysis of the flow of wind and heat around buildings.
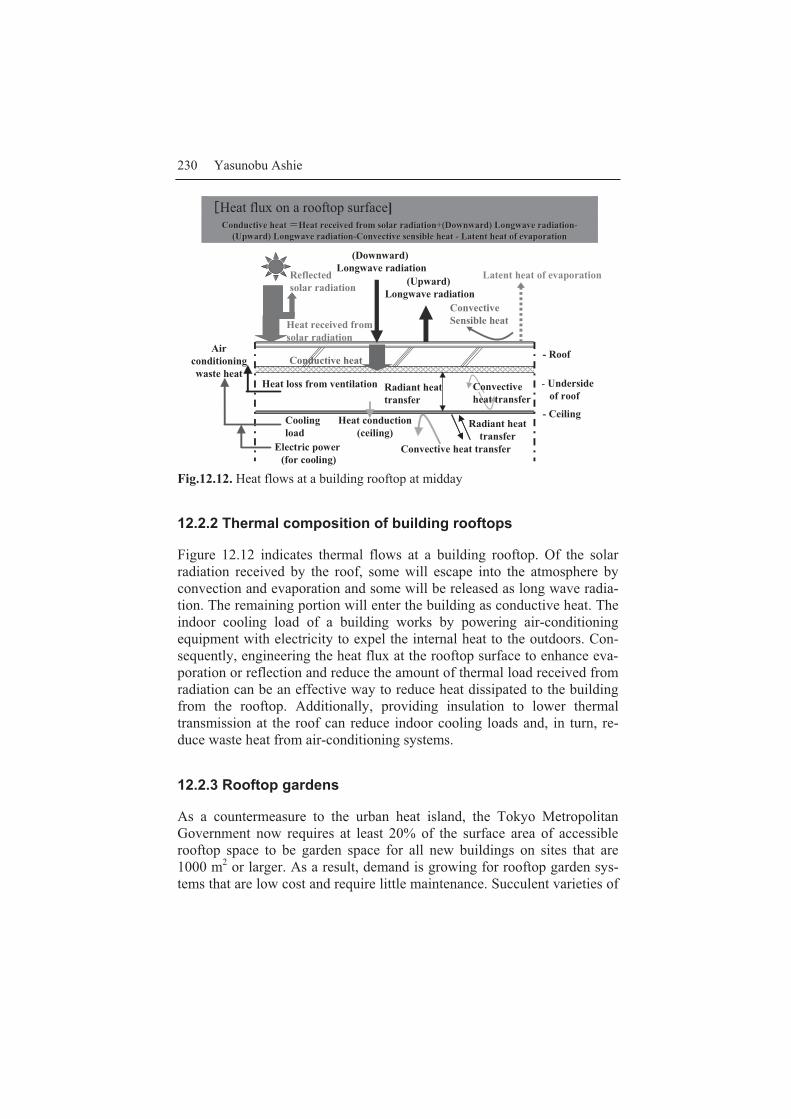
230 Yasunobu Ashie
Reflected solar radiation (Upward)
Longwave radiation
Latent heat of evaporation
Convective Sensible heat
Heat loss from ventilation
Conductive heat
Heat conduction (ceiling)
Convective heat transfer
Radiant heat transfer
Convective heat transfer
- Ceiling
- Underside of roof
- Roof
Radiant heat transfer
Conductive heat Conductive heat @@Heat received from solar Heat received from solar radiation+(Downwardradiation+(Downward) ) LongwaveLongwave radiationradiation--(Upward) (Upward) LongwaveLongwave radiationradiation--Convective sensible heat Convective sensible heat -- Latent heat of evaporationLatent heat of evaporation
Heat received from solar radiation
(Downward)Longwave radiation
�Heat flux on a rooftop surface]
Cooling load
Electric power (for cooling)
Air conditioning waste heat
Fig.12.12. Heat flows at a building rooftop at midday
12.2.2 Thermal composition of building rooftops
Figure 12.12 indicates thermal flows at a building rooftop. Of the solar radiation received by the roof, some will escape into the atmosphere by convection and evaporation and some will be released as long wave radia-tion. The remaining portion will enter the building as conductive heat. The indoor cooling load of a building works by powering air-conditioning equipment with electricity to expel the internal heat to the outdoors. Con-sequently, engineering the heat flux at the rooftop surface to enhance eva-poration or reflection and reduce the amount of thermal load received from radiation can be an effective way to reduce heat dissipated to the building from the rooftop. Additionally, providing insulation to lower thermal transmission at the roof can reduce indoor cooling loads and, in turn, re-duce waste heat from air-conditioning systems.
12.2.3 Rooftop gardens
As a countermeasure to the urban heat island, the Tokyo Metropolitan Government now requires at least 20% of the surface area of accessible rooftop space to be garden space for all new buildings on sites that are 1000 m2 or larger. As a result, demand is growing for rooftop garden sys-tems that are low cost and require little maintenance. Succulent varieties of
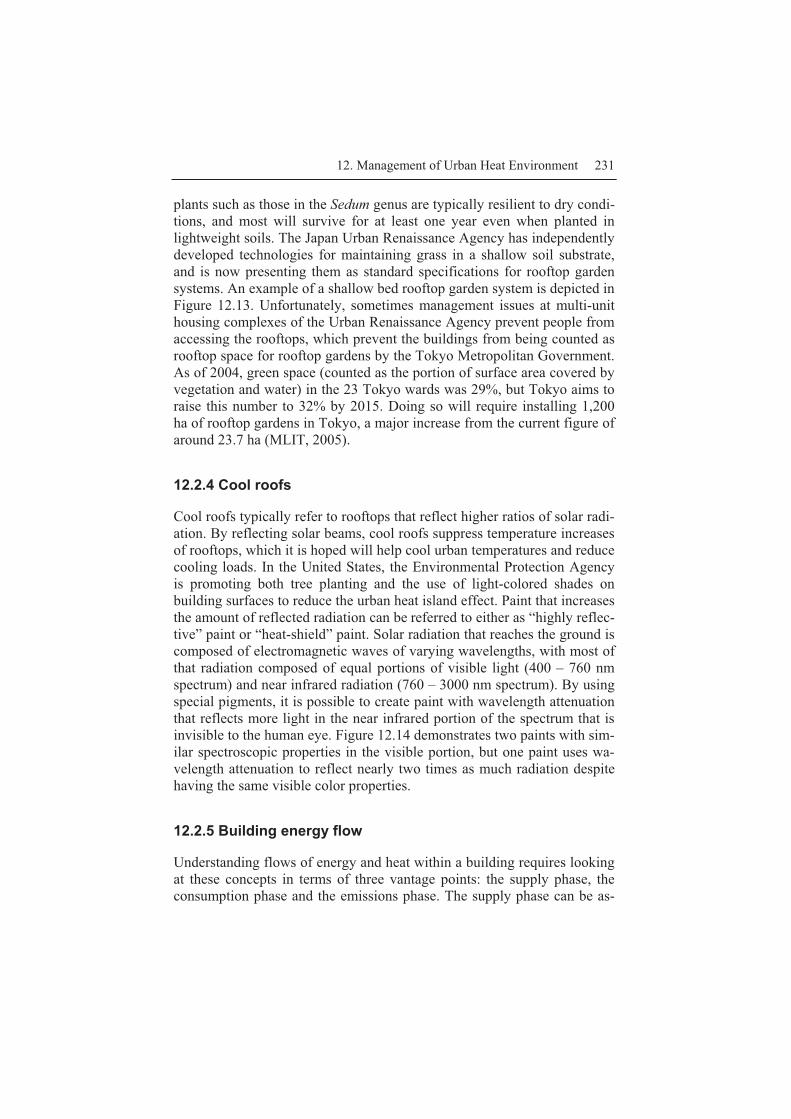
12. Management of Urban Heat Environment 231
plants such as those in the Sedum genus are typically resilient to dry condi-tions, and most will survive for at least one year even when planted in lightweight soils. The Japan Urban Renaissance Agency has independently developed technologies for maintaining grass in a shallow soil substrate, and is now presenting them as standard specifications for rooftop garden systems. An example of a shallow bed rooftop garden system is depicted in Figure 12.13. Unfortunately, sometimes management issues at multi-unit housing complexes of the Urban Renaissance Agency prevent people from accessing the rooftops, which prevent the buildings from being counted as rooftop space for rooftop gardens by the Tokyo Metropolitan Government. As of 2004, green space (counted as the portion of surface area covered by vegetation and water) in the 23 Tokyo wards was 29%, but Tokyo aims to raise this number to 32% by 2015. Doing so will require installing 1,200 ha of rooftop gardens in Tokyo, a major increase from the current figure of around 23.7 ha (MLIT, 2005).
12.2.4 Cool roofs
Cool roofs typically refer to rooftops that reflect higher ratios of solar radi-ation. By reflecting solar beams, cool roofs suppress temperature increases of rooftops, which it is hoped will help cool urban temperatures and reduce cooling loads. In the United States, the Environmental Protection Agency is promoting both tree planting and the use of light-colored shades on building surfaces to reduce the urban heat island effect. Paint that increases the amount of reflected radiation can be referred to either as “highly reflec-tive” paint or “heat-shield” paint. Solar radiation that reaches the ground is composed of electromagnetic waves of varying wavelengths, with most of that radiation composed of equal portions of visible light (400 – 760 nm spectrum) and near infrared radiation (760 – 3000 nm spectrum). By using special pigments, it is possible to create paint with wavelength attenuation that reflects more light in the near infrared portion of the spectrum that is invisible to the human eye. Figure 12.14 demonstrates two paints with sim-ilar spectroscopic properties in the visible portion, but one paint uses wa-velength attenuation to reflect nearly two times as much radiation despite having the same visible color properties.
12.2.5 Building energy flow
Understanding flows of energy and heat within a building requires looking at these concepts in terms of three vantage points: the supply phase, the consumption phase and the emissions phase. The supply phase can be as-
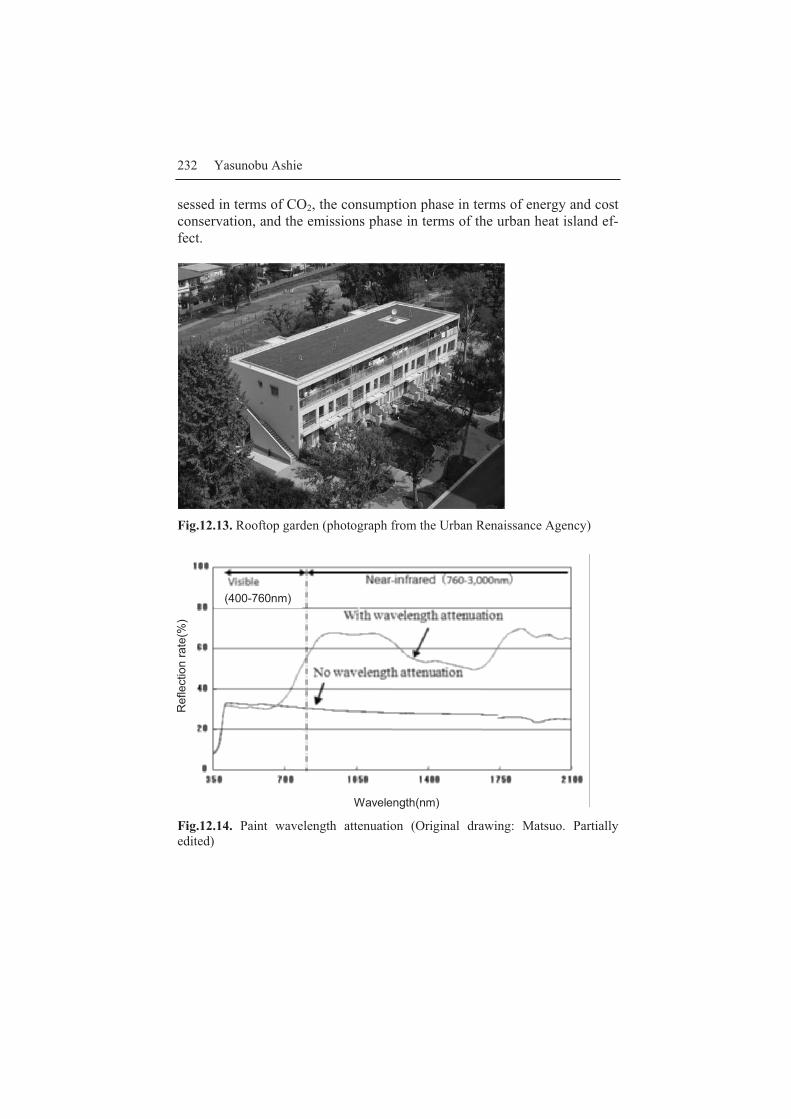
232 Yasunobu Ashie
sessed in terms of CO2, the consumption phase in terms of energy and cost conservation, and the emissions phase in terms of the urban heat island ef-fect.
Fig.12.13. Rooftop garden (photograph from the Urban Renaissance Agency)
Fig.12.14. Paint wavelength attenuation (Original drawing: Matsuo. Partially edited)
(400-760nm)
Wavelength(nm)
Ref
lect
ion
rate
(%)
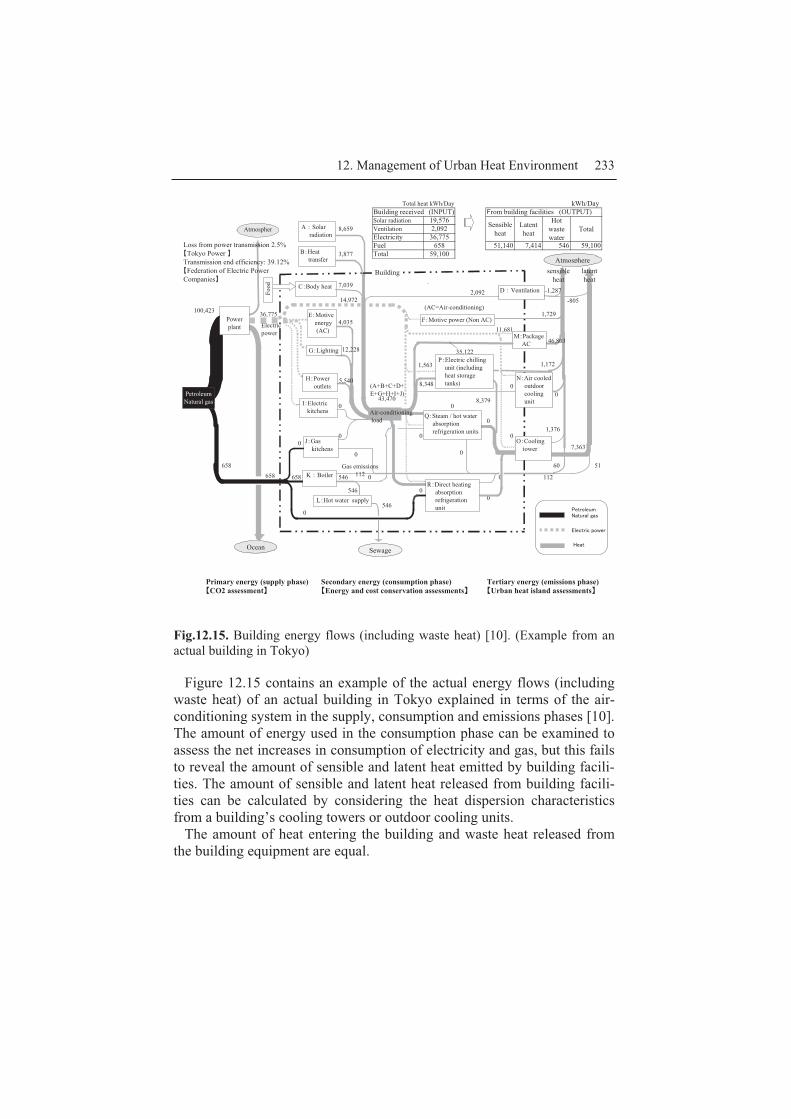
12. Management of Urban Heat Environment 233
Fig.12.15. Building energy flows (including waste heat) [10]. (Example from an actual building in Tokyo)
Figure 12.15 contains an example of the actual energy flows (including waste heat) of an actual building in Tokyo explained in terms of the air-conditioning system in the supply, consumption and emissions phases [10]. The amount of energy used in the consumption phase can be examined to assess the net increases in consumption of electricity and gas, but this fails to reveal the amount of sensible and latent heat emitted by building facili-ties. The amount of sensible and latent heat released from building facili-ties can be calculated by considering the heat dispersion characteristics from a building’s cooling towers or outdoor cooling units. The amount of heat entering the building and waste heat released from the building equipment are equal.
Total heat kWh/Day kWh/DayBuilding received (INPUT) ?rom building facilities (OUTPUT)
19,5768,659 2,092
36,775658 51,140 7,414 546 59,100
3,877 59,100
7,0392,092
14,972(AC=Air-conditioning)
4,03511,681
35,122
0
43,4700 0
0
0 0 00
0
658 60 51
658 546 0 0 112
546 00
5460
Primary energy (supply phase) Secondary energy (consumption phase) Tertiary energy (emissions phase)SCO2 assessmentT SEnergy and cost conservation assessmentsT SUrban heat island assessmentsT
Solar radiation Latentheat
VentilationElectricityFuelTotal
Sensibleheat
Hotwastewater
Total A�Solar radiation
E�Motive energy (AC)
B�Heat transfer
Ocean
Atmospher
L�Hot water supply
N�Air cooled outdoor cooling unit
Sewage
PetroleumNatural gas
Atmosphere
Building
Powerplant
C�Body heat
G�Lighting
(A+B+C+D+E+G+H+I+J)
�Fo
od
M�Package AC
100,423 36,775
12,228
5,540 H�Power outlets
I�Electric kitchens
J�Gas kitchens
Gas emissions112
F�Motive power (Non AC)
1,563
8,348
658
8,379
-1,287D�Ventilation-805
1,729
46,803
1,172
0
K�Boiler
07,363
O�Cooling tower
1,376
Electricpower
Air-conditioning load
P�Electric chilling unit (including heat storage tanks)
Q�Steam / hot water absorption refrigeration units
R�Direct heating absorption refrigeration unit
Loss from power transmission 2.5%�Tokyo Power �Transmission end efficiency: 39.12%�Federation of Electric PowerCompanies�
sensibleheat
latentheat
�� ����%�U� %����5��
K��( ��(�!�>��
$��

234 Yasunobu Ashie
Heat that enters a building
= Heat from the consumption of electricity and gas
+ heat transmitted to the building from radiation through windows, and absorbed by the building through ventilation
= amount of heat released from the building equipment
(1)
Since the heat a building absorbs from the surrounding environment is released as latent heat and not dispersed as sensible heat, building equip-ment operates on a similar principle as rooftop gardens. The amount of heat released from building equipment should be used in order to assess the performance of handling heat absorbed in such an environment.
12.2.6 Urban wind-passage and the heat island effect
The first skyscrapers appeared in the Kasumigaseki area of Tokyo in the 1960s. With them came the introduction of “building winds” as a social problem. “Building winds” is a phenomenon in which extremely strong winds confined to a small, localized area are generated due to wind strik-ing the face of a building, blowing downwards, and then wrapping around the sides of the building. As problems from building winds started to be-come more apparent, people started to actively seek solutions to address the problem by engineering the shapes of buildings or planting trees. Cur-rently, environmental assessments into the potential for wind-related ha-zards are performed when constructing buildings exceeding a certain size.
In recent years, urban redevelopment initiatives have sparked a resur-gence of skyscraper construction projects in urban cores. The Shiodome district built along the Tokyo Bay represents a typical development project, and is represented in an aerial view using digital data in Figure 12.16. As construction of groups of skyscrapers continues, it is believed that higher building densities will lead to lower wind speeds within the city. Consequently, cities are entering an era in which the on-going con-struction of skyscrapers is exacerbating the increase in urban temperatures, and where urban structures are believed to be behind problems associated with weaker wind environments. The creation of wind passage which can introduce sea breezes inside urban spaces must be an effective way to re-duce urban heat island in Tokyo Bay area.
12. Management of Urban Heat Environment 235
12.2.7 Evaluating urban environments with numerical simulations
Recently, vector-parallel supercomputers such as the Earth Simulator have been used to perform numerical simulations at the global scale, giving rise to a flurry of new research activity of various physical phenomena. Leve-raging this type of large-scale analytical capacity to study engineering is-sues at the scale of urban construction allows for the tackling of several environmental problems that have hitherto remained beyond the processing limitations of conventional computing resources. The cooling effect of ocean winds blowing into urban districts on sum-mer days is being looked at as a way to mitigate the urban heat island ef-fect. Urban areas contain enormous amounts of buildings, along with riv-ers, parks and open space. These spaces were represented with fine-scale meshes in a massive CFD analysis, that was performed using the Earth Simulator under the following conditions.
��Analysis region: 6 km (X: East - West) × 6 km (Y: North - South) ×
500 m (Z: Vertical) ��Computational grid size: 1,200 (X) × 1,200 (Y) × 100 (Z) ��Mesh cell width: Horizontal equal interval of 5 m, Vertical unequal
interval of 1 m � 10 m �� Input wind: power law, neutral conditions ��Wind speed ground boundary: Generalized log law ��Heat ground boundary: Temperature fixed for each land use, heat
transfer boundary ��20 nodes used (160 processors)

236 Yasunobu Ashie
Fig.12.16. Aerial view of Shidome area (using CAD CENTER digital data)
Fig.12.17. Example of urban temperature analysis using Earth Simulator [11]

12. Management of Urban Heat Environment 237
Figure 12.17 indicates the horizontal distribution of temperature at a height of 9.7 meters [11]. The wind direction is blowing as a southern wind, from the bottom of the image towards the top. Temperatures along the coast and above waterways appear clearly lower. This image demon-strates an example of analyzing urban temperatures where actual building positions are regenerated in detail, which would not be possible using a meso-scale model.

238 Yasunobu Ashie
References
[1] Landsberg HE (1981) The urban climate. Academic press [2] M. Moriyama: “Heat island countermeasures and technologies” (Hi-to airando
taisaku to gijutsu), Gakugei Shuppan Sha Co., Ltd. 2004.8 [3] Ministry of Land, Infrastructure and Transport / Ministry of the Environ-
ment: ”2003 Investigative report into restricting anthropogenic heat emissions as a countermeasure to the urban heat island effect in cities” (Heisei 15 nendo toshi ni okeru jinko-hainetsu yokusei ni yoru hi-to airando taisaku chosa ho-kokusho), 2004.3
[4] Y. Ashie, S. Yoon: Examination on the influence of the development of a high-rise building on air temperature distribution by means of floor-heated wind tunnel test (Yukamen wo kanetsu shita fudojikken ni yoru tatemono no kosoka ga kion bunpu ni oyobosu eikyo ni kan suru kento), Journal of Envi-ronmental Engineering, Architectural Institute of Japan, No. 579, 2004.5, 67-71
[5] Investigative committee on the environmental effects of urban heat islands � Center for Environmental Information Science: 2003 Activity report on inves-tigations into the environmental effects of the urban heat island effect, 2004.3
[6] Ministry of the Environment: 2000 Report on state of analysis and counter-measures of the urban heat island effect (expanded edition), 2001.10
[7] Cited in [6] above [8] Infectious Agents Surveillance Report, Vol.25, No.2 (No. 288) Infectious Dis-
ease Surveillance Center, 2004.2 [9] M. Kobayashi, N. Nihei and T. Kurihara: Analysis of northern distribution of
Aedes albopictus (Diptera Culicidae) in Japan by geographical information system. Journal Medical Entomology, 39(1), 2002, 4-11
[10] Y. ASHIE, M. TANAKA, T. YAMAMOTO: Order analysis on the exhaus-tion of building equipment considering the origin of natural and machinery system (Research on the thermal metabolism of large scale buildings Part 1) (Shizenkei oyobi kikikei no yurai wo koryo shita kenchikusetsubi no hainetsu no oda bunseki – daikibo tatemono no netsutaisha tokusei ni kansuru kenkyu Sono 1), Technical Journal of The Society of Heating, Air-Conditioning and Sanitary Engineers of Japan, 2004.9, 1059-1062
[11] T. KONO, Y. ASHIE, S. YOON, H. LI: CFD analysis of airflow and temper-ature at the urban scale by a 5 m resolution (Toshi-sukeru wo taisho toshita 5 m messhu kaizodo ni yoru fusoku / kionba no CFD kaiseki), 18th Symposium for the Japan Association of Wind Engineering, 2004.12, 117-120.

Index
3 3R(Reduce, Reuse, and Recycle), 91
A activated sludge process, 36 Analytical Hierarchical Process
(AHP), 141 anthropogenic heat, 219 Aqua Loop, 26 asbesto, 122, 124 available water resource, 29, 32
B bath, 4, 7
C carbon dioxide, 180, 181, 182, 186,
188, 190, 191 carrying capacity, 64 CASBEE, 12 CBD, 192 CEC (Coefficient of Energy
Consumption), 210 central water heating, 21 CFD, 229 chlorination, 165 choice experiments, 141 cholera, 163 circulative resources, 103 climate change, 176, 177, 194 coastal erosion, 75 coastal zone, 69 cold water, 6, 8 commercial/office, 181, 184 compact city, 192, 193 Construction Material Recycling
Law, 102, 113, 117, 118 construction waste, 113
Container and Packaging Recycling Law, 102
Contingent Valuation Method (CVM), 140
cool roof, 231 cooling tower, 7 COP (Coefficient of Performance),
206 Creutzfeldt-Jakob disease, 151 cross-shore sediment movement, 76 cross-ventilation, 211 Cryptosporidium, 166, 167 CSR (Corporate Social
Responsibility), 101
D DALY(Disability Adjusted Life
Years), 153 damage-oriented approach, 137 daylighting, 211 dengue fever, 226 department store, 7 DfE (Design for Environment), 101 Dining Kitchen(DK), 5, 6 dioxin, 98 direct loading, 193 Dirt Cleansing Law, 94 Disability Adjusted Life Years
(DALYs), 138 dismantlement of building, 107, 113 district heating system, 191 dose-response, 148
E Earth Simulator, 235 eco-cute, 207 economic value of the environment,
140 Edo period, 93 effective utilization of resources,
107

240
electricity demand, 223 electricity, 181, 190, 191 End-of-Life Vehicle Recycling Law,
102 Energy Conservation Law, 198 energy conservation standards, 198 energy consumption, 183, 187, 188,
189 envelope design, 199 envelope insulation, 204 environmental loading, 175, 176,
193, 194 exterior insulation, 205
F faecal–oral infection, 161 faucet, 19, 20 fill insulation, 205 filtration, 164 fish nest block, 55, 58 flow-rate, 10 Food Recycling Law, 102 Fundamental Law on the
Environment, 100
G gas boiler, 5, 6 global warming, 195 gray water, 24 Green Purchasing Law, 102 greenhouse gas(GHG), 176, 180,
181, 182, 190, 194, 195 ground cover, 219 groundwater, 31
H HASS 206, 11 hazardous material, 118 header-conduit piping, 22 heat pump, 205 heat source, 191 heat-related illness, 225 high-insulation bathtub, 17
Home Appliance Recycling Law, 102
hot water consumption in residences, 10
hot water, 9 hotel, 7 household, 181, 184, 186, 187 hybrid systems using passive
methods, 211
I illegal dumping, 97 incineration, 94, 98 indicator, 167 induced loading, 193 industrial waste, 113 Infectious disease, 157 infiltration facilities, 38 IPCC, 70
K kitchen, 5, 7, 20 KSI, 23 Kyoto Protocol, 182, 195
L landfill sites, 98 laundry, 7 lead paint, 124 Life Cycle Assessment (LCA), 133 Life Cycle Impact Assessment
(LCIA), 134 Life Cycle Inventory analysis (LCI),
134 LLE (Loss of Life Expectancy), 152 logistic equation, 64 longshore sediment movement, 76 Lotka-Volterra Equation, 64, 65 Low Carbon Society, 91 low-emissivity-double-pane glass,
205 LRT, 192

Index 241
M machine dismantlement, 119 Manifest system, 97 manual dismantlement, 119 manual sorting, 118 Material Flow Analysis (MFA), 131 meso-scale model, 228 Metabolic Analysis, 130 methane, 181 mixed waste, 115 monitoring, 170 municipal solid waste, 93
N natural disasters, 67 nature-friendly river works, 54, 56 NEXT21, 24 NIMBY (Not In My Back Yard)
syndrome, 97 Nitrous oxide, 181 norovirus, 172 nourishment, 84
O office, 7 Ozonation, 166
P PAL (Perimeter Annual Load), 209 passive method, 211 pathogen, 148, 157 PCB, 99 perceived risk, 146 permeable pavement, 62, 66 PET (Polyethylene Terephthalate),
104 pipe, 21 plastic frame, 205 Polluter Pays Principle (PPP), 94 Population, 177, 178, 196 preliminary survey, 118 Public Cleansing Law, 94
Q Q-value, 202
R rainwater harvesting, 39 rainwater use, 31 rainwater, 26 reclaimed wastewater, 40 regional sediment management, 85 relative sensitivity, 149 renewable energy, 211 Resource Flow Analysis, 131 restaurant, 7 retarding basin, 62 retrofitting, 213 revealed preference method, 140 revetment works, 49, 50, 51, 52, 53 risk assessment, 145, 169 risk management, 167 risk trade off, 155 rooftop garden, 230 route of infection, 158
S salvage, 125 sea level, 70 service life of housing, 108 sewage pipe, 23 sewage sludge, 43 sewerage system, 34, 35 SHASE Standard, 11 shore protection structures, 84 showerhead, 18 sitting toilet, 4 solid waste, 91 Sound Material-Cycle Society, 91 sound mimicking device, 17 squat toilet, 4 stated preference method, 140 stone masonry, 55 stone pitching, 55 storm surge, 73

242
T temperature, 10 toilet, 7 transboundary movement of waste,
103 transportation, 181, 183, 184, 189,
190, 191, 192 tropical night, 218 two-layered river, 63, 66 typhoon, 67
U ultraviolet irradiation, 166 urban canopy model, 229 urban heat island, 215 Urban Metabolism, 129 urban population, 30 urban structure, 190, 192 used building materials market, 127 utilization of wasted heat sources,
211
W Waste Management Law, 94 Waste War, 96 wastewater treatment plant, 35, 36 water balance, 29, 32, 33 water consumption in residences, 9 water quality degradation, 73 water recycling, 31 water saving closet, 16 water saving, 16 waterborne disease, 158, 159, 160 water-recycling, 24 willingness to pay (WTP), 140 window insulation, 205 wind-passage, 234 work plan, 118
Z Zero Emissions, 93
� �-value, 204
Related Documents