1 Urban Drainage System Analysis & Design Dr. Philip Bedient

Welcome message from author
This document is posted to help you gain knowledge. Please leave a comment to let me know what you think about it! Share it to your friends and learn new things together.
Transcript

1
Urban Drainage System Analysis & Design
Dr. Philip Bedient
2
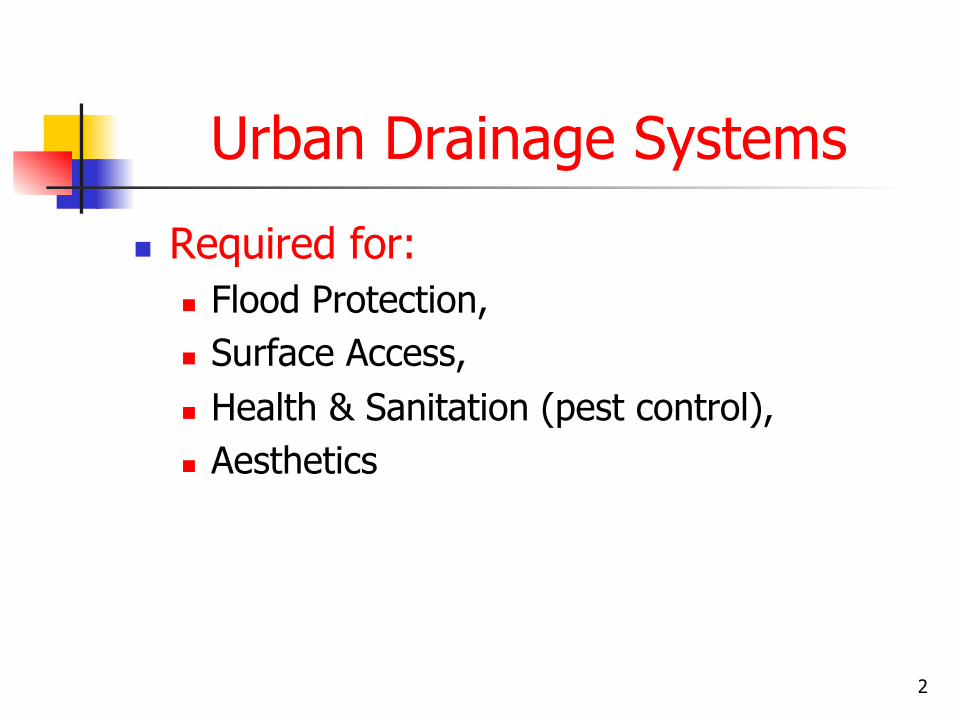
Urban Drainage Systems
n Required for: n Flood Protection, n Surface Access, n Health & Sanitation (pest control), n Aesthetics
3
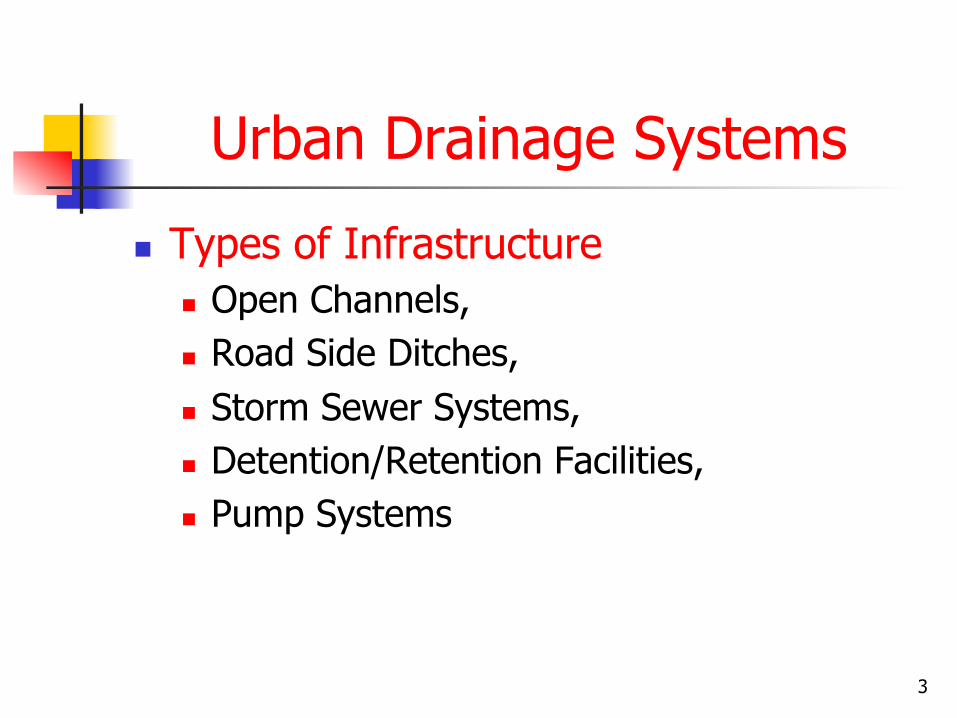
Urban Drainage Systems
n Types of Infrastructure n Open Channels, n Road Side Ditches, n Storm Sewer Systems, n Detention/Retention Facilities, n Pump Systems
4
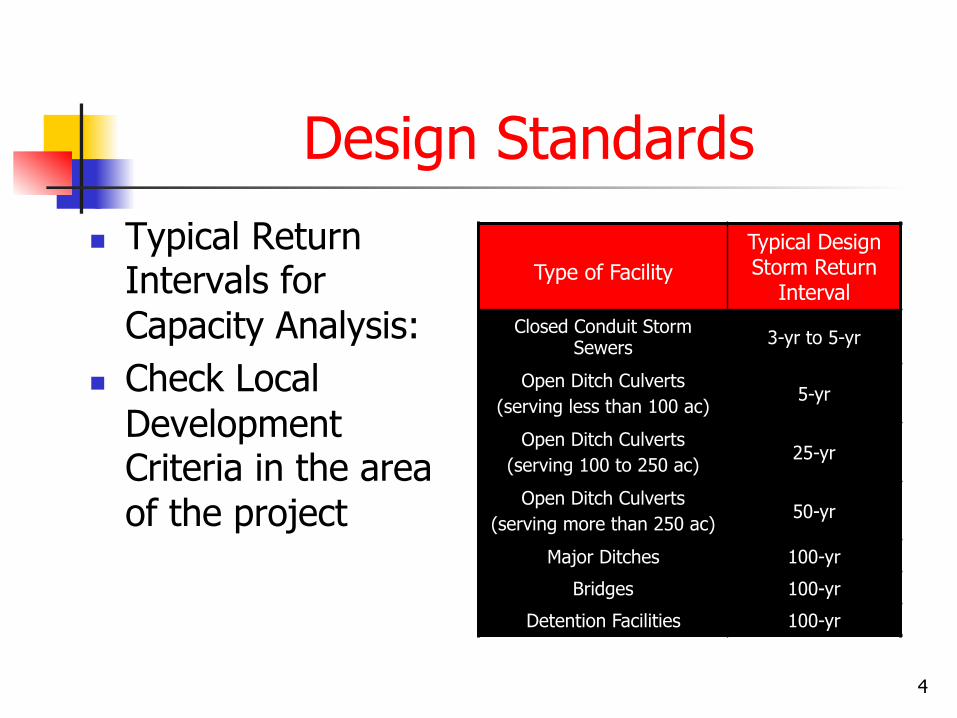
Design Standards
n Typical Return Intervals for Capacity Analysis:
n Check Local Development Criteria in the area of the project
Type of Facility
Typical Design Storm Return
Interval
Closed Conduit Storm Sewers 3-yr to 5-yr
Open Ditch Culverts (serving less than 100 ac)
5-yr
Open Ditch Culverts (serving 100 to 250 ac)
25-yr
Open Ditch Culverts (serving more than 250 ac)
50-yr
Major Ditches 100-yr
Bridges 100-yr
Detention Facilities 100-yr

5
Rational Method Analysis
n Rational Method: n Empirical Method n Applicable to sites < 200 ac
n Intended to model overland response, n Basins > 200 ac likely to have significant
channelization and hydrograph lag/attenuation, n Tends to overestimate peak flow for large
basins, so use is restricted to smaller ones. n Practically, typical basin sizes are 0.1 to 10 ac.

6
Rational Method Analysis
Q = C*I*A Where: Q = Peak Flow Rate (cfs) I = Design Storm Average Intensity (in/hr) A = Basin Area (ac) C = Rational Coefficient (ft3*hr/ac*in*sec)

7
Design Storm Intensity
n Function of: n Regulatory Design Return Interval, n Basin Time of Concentration, n Geographic Location
n Regulators will likely specify required return interval based upon proposed facility being designed.
8
Design Intensity Tables
n Should be provided by the local regulator in the area of your project,
n Following example tables are from Galveston County (Texas Gulf Coast).

9 Source: Brazoria County Drainage District No. 4 Design Manual
10
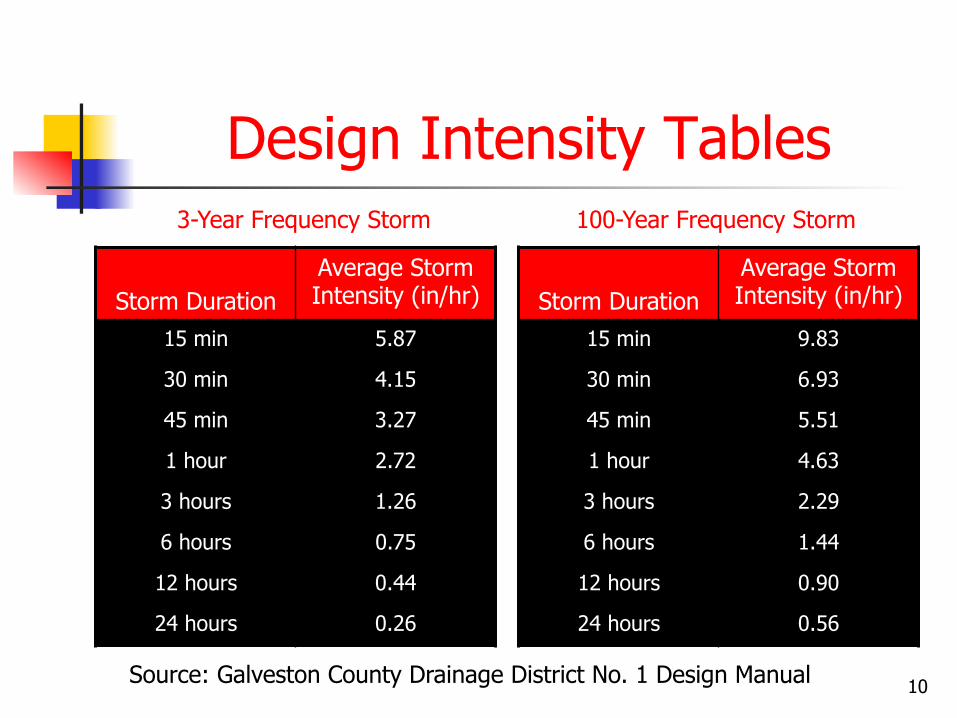
Design Intensity Tables
Storm Duration
Average Storm Intensity (in/hr)
15 min 5.87
30 min 4.15
45 min 3.27
1 hour 2.72
3 hours 1.26
6 hours 0.75
12 hours 0.44
24 hours 0.26
Storm Duration
Average Storm Intensity (in/hr)
15 min 9.83
30 min 6.93
45 min 5.51
1 hour 4.63
3 hours 2.29
6 hours 1.44
12 hours 0.90
24 hours 0.56
3-Year Frequency Storm 100-Year Frequency Storm
Source: Galveston County Drainage District No. 1 Design Manual

11
Design Intensity Equations
I = b/(Tc + d)e
Where: I = design storm average intensity (in/hr) Tc = basin time of concentration (min) b, d, & e are location and return interval specific

12
Design Intensity Equations
Storm Return Interval
b
d
e
3-year 77 11.9 0.782
5-year 66 7.6 0.739
25-year 85 7.6 0.727
50-year 88 7.6 0.704
100-year 85 7.8 0.690
Source: TxDOT Hydraulic Design Manual, values specific for Galveston County
13
Geographic Location
n Design storm intensities will vary from geographic location to location,
n Example, Houston’s rainfall patterns are different than Denver’s.
n Intensity Information can be provided as Intensity-Duration-Frequency (IDF) curves, Intensity Tables, or Intensity Equations.
14
Time of Concentration
n Defined as the time it takes a drop of water to travel from the most hydraulically remote part of the basin to the outfall.
n Can be estimated directly (overland method),
n Can be estimated indirectly (empirical method).
15
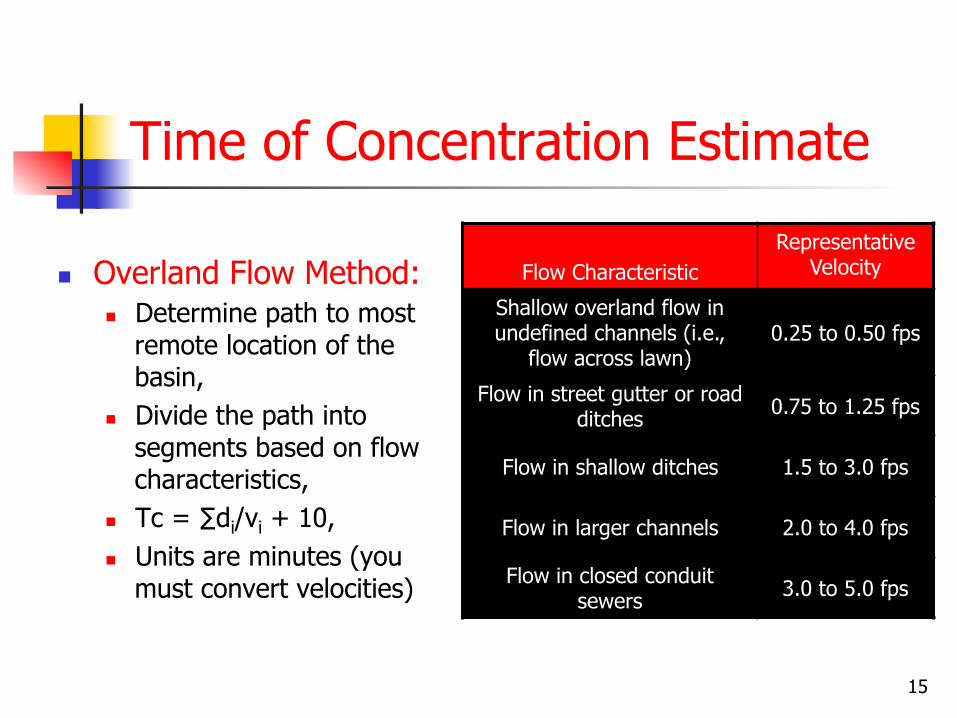
Time of Concentration Estimate
n Overland Flow Method: n Determine path to most
remote location of the basin,
n Divide the path into segments based on flow characteristics,
n Tc = ∑di/vi + 10, n Units are minutes (you
must convert velocities)
Flow Characteristic
Representative Velocity
Shallow overland flow in undefined channels (i.e.,
flow across lawn) 0.25 to 0.50 fps
Flow in street gutter or road ditches 0.75 to 1.25 fps
Flow in shallow ditches 1.5 to 3.0 fps
Flow in larger channels 2.0 to 4.0 fps
Flow in closed conduit sewers 3.0 to 5.0 fps

16
Overland Tc Example
P1
P2
P3
P4 P6
P5
P7
17
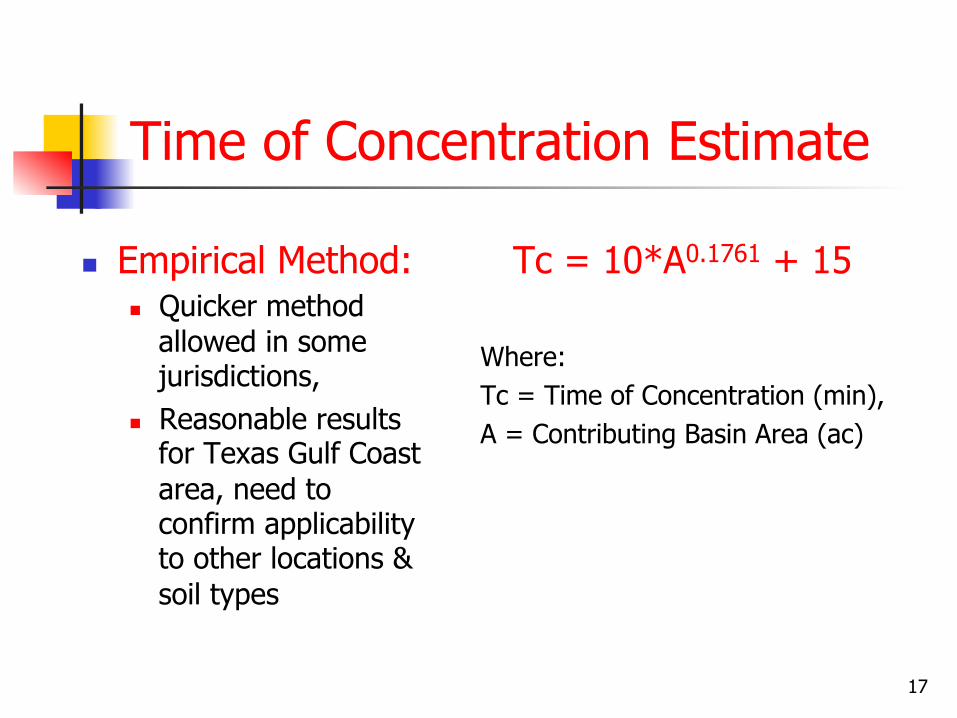
Time of Concentration Estimate
n Empirical Method: n Quicker method
allowed in some jurisdictions,
n Reasonable results for Texas Gulf Coast area, need to confirm applicability to other locations & soil types
Tc = 10*A0.1761 + 15 Where: Tc = Time of Concentration (min), A = Contributing Basin Area (ac)
18
Rational Coefficients
n Empirical Coefficient n Function of:
n Storm Return Interval n Land Use n Percent Surface Impermeability n Soil Type n Drainage Infrastructure
19
Rational Coefficients
n What does it mean? n The Rational Coefficient is a rating of the
basin’s capability to shed runoff. n Value ranges from 0.20 to 1.0. n It is proportional to percent
imperviousness, but not equal to it. n The larger the coefficient, the quicker it
drains
20
Rational Coefficients
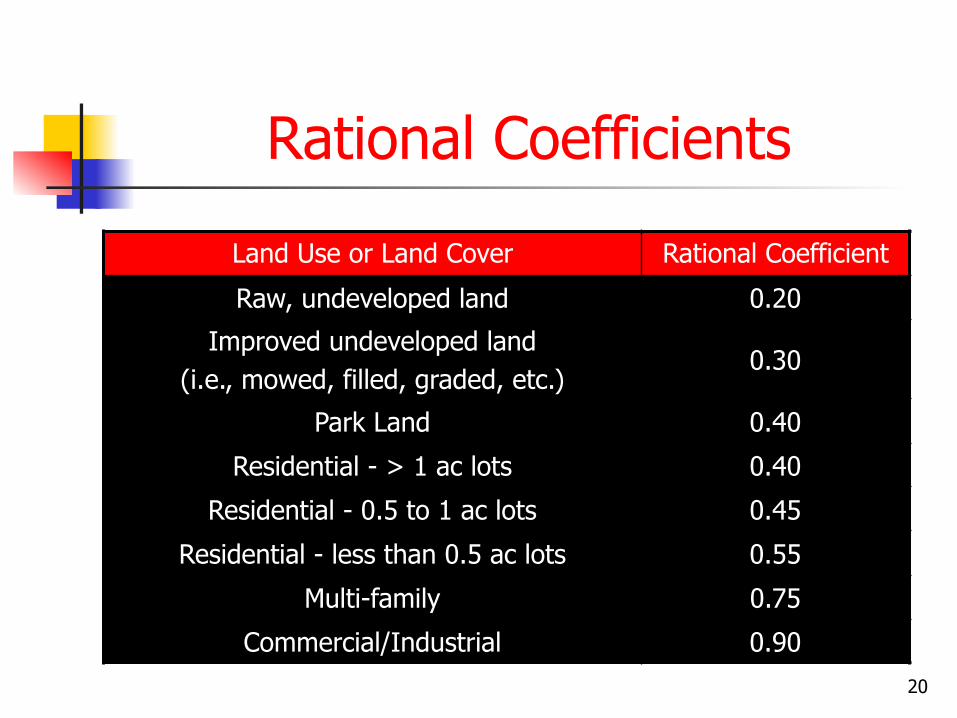
Land Use or Land Cover Rational Coefficient
Raw, undeveloped land 0.20
Improved undeveloped land (i.e., mowed, filled, graded, etc.)
0.30
Park Land 0.40
Residential - > 1 ac lots 0.40
Residential - 0.5 to 1 ac lots 0.45
Residential - less than 0.5 ac lots 0.55
Multi-family 0.75
Commercial/Industrial 0.90

21
Rational Coefficients
Can be approximated by:
C = 0.2 + 0.8*PI Where: C = Rational Coefficient PI = Percent Imperviousness (as a decimal)
Related Documents