Urban Diabetes Care and Outcomes Audit Report: 2007-2011 45 Urban Diabetes Care and Outcomes Audit Report: Aggregate Results from Urban Indian Health Organizations, 2007-2011 May 2012 Urban Indian Health Institute A Division of the Seattle Indian Health Board

Welcome message from author
This document is posted to help you gain knowledge. Please leave a comment to let me know what you think about it! Share it to your friends and learn new things together.
Transcript

Urban Diabetes Care and Outcomes Audi t Report : 2007-2011 45
Urban Diabetes Care and Outcomes Audit Report: Aggregate Results from Urban Indian Health Organizations, 2007-2011
May 2012Urban Indian Health InstituteA Division of the Seattle Indian Health Board

Urban Diabetes Care and Outcomes Audi t Report : 2007-2011
This report was prepared by Elizabeth Knaster, MPH, Michal Gutowski, BA, and Sarah Simpson, BA, BIS.
Recommended Citation:Urban Indian Health Institute, Seattle Indian Health Board. (2012). Urban Diabetes Care and Outcomes Audit Report: Aggregate Results from Urban Indian Health Organizations, 2007-2011. Seattle, WA: Urban Indian Health Institute.
i
The mission of the Urban Indian Health Institute is to support the health and well-being of urban Indian communities through information, scientific inquiry and technology.

Urban Diabetes Care and Outcomes Audi t Report : 2007-2011
ACKNOWLEDGEMENTS
Urban Indian Health InstituteA Division of the Seattle Indian Health Board
TABLE OF CONTENTS1
2
6
7
11
18
22
24
27
29
31
39
43
E X E C U T I V E S U M M A RY
I N T R O D U C T I O N
D I A B E T E S R E G I S T R I E S : U r b a n I n d i a n H e a l t h O r g a n i z a t i o n s
B E S T P R A C T I C E I : A d u l t We i g h t M a n a g e m e n t
B E S T P R A C T I C E I I : C a r d i o v a s c u l a r D i s e a s e
B E S T P R A C T I C E I I I : C h r o n i c K i d n e y D i s e a s e
B E S T P R A C T I C E I V: D e p r e s s i o n
B E S T P R A C T I C E V: E y e C a r e
B E S T P R A C T I C E V I : F o o t C a r e
B E S T P R A C T I C E V I I : O r a l H e a l t h
A P P E N D I X A
A P P E N D I X B
R E F E R E N C E S
Funding for this report was provided by the Indian Health Service Division of Diabetes Treatment and Prevention.
The Urban Indian Health Institute would like to thank the staff at the Urban Indian Health Organizations for the excellent work they do daily on behalf of their communities.
Please contact the Urban Indian Health Institute with
your comments by e-mailing [email protected], calling206-812-3030 or visiting us
online at www.uihi.org.
ii

Urban Diabetes Care and Outcomes Audi t Report : 2007-2011iii
Page intentionally left blank.

EXECUTIVE SUMMARY
Urban Diabetes Care and Outcomes Audi t Repor t : 2007 -2011 1
Introduction
The purpose of this report is to provide a description of the annual Indian Health Service (IHS) Diabetes
Care and Outcomes Audit data collected by participating IHS funded Urban Indian Health Organizations
(UIHOs). This report’s format is based on the IHS Diabetes Best Practice Guidelines, first developed in
2001 by a workgroup coordinated by the IHS Division of Diabetes Prevention and Treatment and most
recently updated in 2011. Included in the report are selected “key measures” from the Best Practice
Guidelines, with accompanying aggregated data from participating UIHOs for the years 2007-2011.
Methods
The data examined for this report were collected for the annual Diabetes Audit of medical records
performed at participating UIHOs from 2007 through 2011. The Diabetes Audit data collected and
submitted to IHS by participating UIHOs were provided to the Urban Indian Health Institute by the IHS
Division of Diabetes Prevention and Treatment for analysis and reporting purposes.
Results
In 2011, 31 urban facilities participated in the Diabetes Audit, representing over 3,500 urban American
Indian/Alaska Native (AI/AN) patients with diabetes nationwide. Some key findings for UIHOs include:
In 2007-2011, over two-thirds of audited urban patients with diabetes were morbidly obese or
obese. Fewer than 10% had a normal BMI (BMI< 25).
Tobacco use has remained stable over the five year period at around 30%, while the percentage
of tobacco users receiving cessation counseling has increased by 21%, to result in 69% of users
receiving counseling.
In 2011, 41% of patients assessed for blood pressure had mean blood pressure values
considered at goal (<130/80), exceeding the 2011 IHS GPRA goal for 39% to achieve blood
pressure control.
The percentage of patients with a current diagnosis of depression has remained around 29-33%
from 2007-2011; however, depression screening among patients without a current diagnosis of
depression has increased dramatically, from 46% in 2007 to 77% in 2011.
While two-thirds of patients received a foot exam in the past year, less than half received dental
and eye exams during the Audit period.
In 2011, over half of all patients (and 65% of patients age 65 and older) were assessed for kidney
disease, exceeding the 2011 GPRA goal for 35% of patients to be assessed for nephropathy.
Discussion
This report summarizes the performance of UIHO diabetes programs using Diabetes Audit data to track
select key measures. The majority of indicators have remained relatively stable during the past five years
with several notable improvements, including increases in tobacco cessation counseling and depression
screening. Others have reached or exceeded 2011 IHS GPRA goals, including goals for blood pressure
control, glycemic control and kidney disease assessment. These findings can be used to target specific
areas of operational need across UIHOs and to identify opportunities for improvements in data collection
and reporting. This report highlights areas of growth and continued success in providing diabetes care to
urban AI/ANs.

INTRODUCTION
2 Urban Diabetes Care and Outcomes Audi t Repor t : 2007 -2011
Background
Diabetes Mellitus is a major cause of chronic disease among American Indians and Alaska Natives
(AI/AN), and the prevalence of diabetes among AI/AN adults is more than twice that of non-Hispanic
white adults.1 In an effort to reduce the burden of diabetes among AI/ANs, Congress established the
Special Diabetes Program for Indians (SDPI) in 1998.2 This program provides funding specifically to aid
in the prevention and treatment of diabetes in AI/AN communities.
To gain a better understanding of the trends in diabetes services and outcomes among AI/ANs, Indian
health agencies nationwide conduct an annual medical chart review, also known as the Indian Health
Service (IHS) Diabetes Care and Outcomes Audit (or “Diabetes Audit”). Information collected by these
agencies is submitted to the IHS Division of Diabetes Treatment and Prevention (DDTP). This
information is used for diabetes surveillance and to help provide a clinical overview of the AI/AN
population who receive diabetes care and services through the Indian health system.
The Urban Indian Health Institute (UIHI) developed this report to provide a description of the annual
Diabetes Audit data collected by participating SDPI recipients that are part of the network of IHS-funded
Urban Indian Health Organizations (UIHOs).
Urban AI/ANs and Urban Indian Health Organizations
American Indians and Alaska Natives are a diverse and growing population. Over the past half-century,
AI/ANs have increasingly relocated from rural communities and reservations into urban centers, both by
choice as well as by forced relocation resulting from federal policy.3 Approximately 67% of AI/ANs
currently live in urban areas,4 and that number is growing. Despite this geographical shift, urban AI/ANs
have not always been included in the Indian health community, nor are they consistently recognized as a
minority population in local and national assessments.3 Data describing health and health care service
trends among urban AI/ANs are of great value in the ongoing effort to understand the strengths and
needs of the population.
UIHOs are private, non-profit corporations that serve AI/AN people in select cities with a range of health
and social services, from outreach and referral to full ambulatory care. UIHOs are funded in part under
Title V of the Indian Health Care Improvement Act and receive limited grants and contracts from the IHS.
UIHOs are located in 19 states serving individuals in approximately 100 U.S. counties, in which over 1.2
million AI/ANs reside.5 UIHOs provide traditional health care services, cultural activities and a culturally
appropriate environment for urban AI/ANs to receive health care. While the scope and delivery of health
care services vary among facilities, all receive SDPI funding to provide diabetes care.
This care is critical to AI/AN communities who experience a higher prevalence of diabetes, a greater
diabetes mortality rate and an earlier age of diabetes onset than the general U.S. population. This also is
true among urban AI/ANs, where 12% of AI/ANs in UIHO service areas report being told by a doctor that
they have diabetes compared with 8% of the general population.6 Poverty, limited access to care and
high mobility create challenges for diabetes patients trying to access and receive regular care. In all
UIHO service areas combined, significantly more AI/ANs (23%) live below the federal poverty level
compared with the general population (14%).7 And 74% of AI/ANs in the combined service area report
having medical insurance compared with 82% of the general population.6

INTRODUCTION
Urban Diabetes Care and Outcomes Audi t Repor t : 2007 -2011 3
IHS Best Practice Guidelines
This report’s format is based on the 2011 IHS Diabetes Best Practice Guidelines.8 First developed in
2001 by a workgroup coordinated by the IHS DDTP, Best Practices are based on the latest scientific
research as well as diabetes success stories and experiences within AI/AN communities. The IHS
Diabetes Best Practices offer guidance to diabetes programs on providing effective services to AI/ANs.
The Best Practices are focused on both clinical (e.g. weight management) and community (e.g. school
health) settings. Each Best Practice includes guidelines for implementation; key recommendations;
information about program planning and evaluation; and additional tools and resources. More about IHS
Best Practices can be found here: http://www.diabetes.ihs.gov/index.cfm?module=toolsBestPractices.
Methods
Data Collection
The data for this report were obtained from the IHS Diabetes Care and Outcomes Audit performed at
UIHOs that receive SDPI funding. The IHS Diabetes Audit is based on consensus-derived standards of
care, also known as the IHS Standards of Care for Patients with Type 2 Diabetes.9 These standards
were first developed in 1986, and are regularly reviewed and updated by the IHS DDTP. Using the Audit,
health facilities can assess their performance on a number of key measures relevant to the health of
people with diabetes, including demographic characteristics, vital statistics, examinations, educational
services, therapy services, immunizations and laboratory data.
Each UIHO maintains a registry for all patients diagnosed with diabetes. Each year UIHOs submit data
from AI/AN patients in the registry who received diabetes health care services and had at least one
primary care visit during the past 12 months. UIHOs are instructed to exclude any patient who meets any
of the following criteria: received primarily referral or contract care paid by IHS, arranged other health
care services with non-IHS monies, received most of their primary care at another IHS or tribal facility,
lived in a jail or nursing home and received care at those institutions, attended a dialysis unit (if on-site
dialysis was not available), had gestational diabetes, had pre-diabetes only, or had moved, died or was
not reachable after three contact attempts in 12 months.
Some facilities audit 100% of diabetic AI/AN patients’ medical records who meet eligibility criteria, while
other facilities use a systematic random sampling scheme to provide estimates.10 To conduct an audit,
data for patients with diabetes are collected at each facility via manual chart review or by extracting data
from electronic health record systems. For the manual audit, patient information from medical records is
used to complete an audit form and entered into a central database via the IHS WebAudit Data Entry
tool. For the electronic audit, data are extracted from an electronic health record system directly into a
data file, usually via the IHS Resource Patient Management System (RPMS), which is then uploaded to
a central database via the WebAudit’s upload tool. RPMS is an integrated electronic system for the
management of clinical and administrative information used by IHS.
Starting in 2008, all participating facilities submitted their data via a secure web application (the
WebAudit) directly to the IHS DDTP. In previous years, some facilities submitted data to their local IHS
Area Office, which then submitted to the IHS DDTP. Partly as a result of this change, more urban
facilities are represented in this national report starting in 2008, although they may have collected and
submitted data to their local office in previous years. More information about the WebAudit can be found
here: http://www.ihs.gov/MedicalPrograms/Diabetes/index.cfm?module=resourcesAudit.

INTRODUCTION
4 Urban Diabetes Care and Outcomes Audi t Repor t : 2007 -2011
Data Analysis
The data examined for this report were collected for the annual Diabetes Audit of medical records
performed at participating UIHOs from 2007 through 2011. Percentages shown are computed as a
proportion of all audited records, unless otherwise specified. Patients with missing values (indicated as
“not tested or no valid result” or “not documented”) for a particular measure are included in the
denominator. Several measures included in this report were calculated by the IHS DDTP and were not
directly reported from the facilities. Statistical tests to compare changes in rates over time were not
performed. Because some facilities audit a random sample of their patients with diabetes, a weighting
procedure was applied to calculate accurate estimations of Diabetes Audit statistics. This is necessary
when combining data from multiple sites and when not all patients are audited. Stata version 10.1 (Stata
Corp., College Station, Texas) was used to perform all statistical analyses.
Limitations
This analysis has several limitations. First, only a selection of patients with diabetes is included in the
IHS Diabetes Audit each year. This limits the ability to examine trends using these data, as the patient
population may be different from year-to-year. Any changes in patient outcomes (e.g. lab values) seen
over the years may be a result of changes in the patient population that is audited each year and not
necessarily a result of the programs themselves. Provided that patient selection was random, as outlined
in the Audit instructions, the patients audited should be representative of the entire population of patients
at each facility and there should not be any bias or large effect on the results due to sampling.
Second, the amount of missing information for select variables should be considered in the interpretation
of these findings. In our analyses, all percentages are computed as a proportion of all audited records,
unless otherwise specified. Some measures have a high portion of missing values; this can affect the
results. Reducing the amount of missing data at each site will improve the quality of future reports. The
proportion of missing data for a given facility may be related to the scope of health care services offered
at a facility. For example, not all facilities provide clinical services and might have challenges capturing
data from referrals. Specifically, the availability of laboratory-related services may be either lacking or
provided off-site, and retrieving follow up laboratory values may pose challenges.
Third, there are limited demographic data available for registry patients. The Audit does not collect
information on socioeconomic indicators such as education, income, employment status or mobility.
Understanding the baseline distribution of these variables and changes over time could provide important
information concerning the audited population.
Finally, while the Diabetes Audit provides a description of the progress of the urban SDPI programs,
there may be important indicators not captured by these systems that better represent their challenges
and strengths. Identifying and collecting these additional indicators may provide a more detailed
understanding of how UIHOs are doing in meeting goals. Examples of potential indicators include family
stability, drug reduction, diet changes, personal goal setting and cultural connectedness.

INTRODUCTION
Urban Diabetes Care and Outcomes Audi t Repor t : 2007 -2011 5
Report Content
This report uses Diabetes Audit data to track the performance of UIHO diabetes programs in the context
of seven clinical Best Practices using select key measures. Since the Diabetes Audit primarily focuses on
clinical care outcomes rather than community outcomes, this report provides information about clinical
Best Practices only.
The following information is included in the report:
Description of the Best Practice topic and its relevance to diabetes: A brief description of the
clinical Best Practice is included at the beginning of each section to provide background on the
topic’s relevance to diabetes care and diabetes disease outcomes.
Key clinical practice recommendations: A list of the major clinical recommendations in each
Best Practice topic area is included in this report. More in-depth information for each can be
found in the Best Practice guidelines.
Key measures and comparisons: Measures were selected by the IHS workgroup for each Best
Practice topic area as important indicators that can be used to measure a diabetes program’s
progress and outcomes. When Diabetes Audit data can be used to evaluate these measures, a
graph of aggregate urban data is presented, along with a brief description of the results. Other
sources of data are needed to measure progress on those key measures not analyzable with
Audit data. For one Best Practice topic, an “alternative key measure” is presented graphically
using Diabetes Audit data. This alternative measure is based on the key clinical
recommendations and offers an additional tracking opportunity. When applicable, 2011 IHS
Government Performance Results Act (GPRA) Goals11 and Healthy People 2020 (HP2020)
Objectives12 also were included. These are provided to help describe the UIHO patient population
as it compares with national benchmarks. Please note that official GPRA results are prepared
and distributed by the IHS Planning and Evaluation office.
Appendix A contains data tables from the urban programs over the past five years (2007-2011).
Appendix B contains background information about GPRA and HP2020.
For questions or comments about this Diabetes Audit Report please contact the UIHI at (206) 812-3030
or email [email protected].

DIABETES REGISTRIES: Urban Indian Health Organizations
6 Urban Diabetes Care and Outcomes Audi t Repor t : 2007 -2011
The following graph displays the number of urban facilities reporting each year, the number of patients
audited and the number of patients included in the diabetes registries from all participating facilities.
FIGURE 1
2007 2008 2009 2010 2011
Total number in Registries* 2,575 3,658 3,657 3,849 3,512
Number of Patients Audited^ 1,156 1,788 1,970 2,132 2,432
Percent of Patients Audited+ 45% 49% 54% 55% 69%
Number of Facilities# 22 30 31 30 31
0
500
1,000
1,500
2,000
2,500
3,000
3,500
4,000
4,500
Patients in UIHO Diabetes Registries: 2007 - 2011
* Sum of all patients in each registry
^ Sum of all patients in Audit
+ Number of patients audited/number of patients in registry
# Number of Urban Indian Health Organizations participating. Data from IHS demonstration sites not included.
Description of Graphic: In 2011, 31 UIHOs participated in the Diabetes Audit. For all
sites combined, Audit information was collected from 2,432 patients, 69% of all
patients in diabetes registries at these facilities. The number of patients audited from
the UIHO registries has more than doubled in the last five years, with 1,156 patients
audited in 2007 to 2,432 in 2011. This increase may be attributable in part to changes
in the data submission process; starting in 2008, all facilities submitted data via a
secure web application directly to the IHS DDTP.

BEST PRACTICE I: Adult Weight Management
Urban Diabetes Care and Outcomes Audi t Repor t : 2007 -2011 7
Individuals who are overweight or obese have a substantially higher risk of developing diabetes.
Overweight and obesity also can lead to poor health outcomes in individuals with diabetes by increasing
insulin resistance and raising blood glucose levels. Diet and exercise together provide the best approach
for weight loss and maintenance. Modest weight loss amounts of as little as 5% have been shown to help
prevent diabetes, reduce insulin resistance and improve health indicators (triglycerides, blood glucose,
HDL cholesterol and blood pressure).13 On a community level, changes in physical and food
environments provide more opportunities to eat healthy foods and to be physically active on a daily
basis.14
Key Clinical Practice Recommendations Related to Adult Weight Management
Ensure providers have a full understanding of the complexity of obesity prevention and care.
Assess for overweight, obesity and overall cardiometabolic risk.
Provide nutrition approaches to treat overweight and obesity, and reduce cardiometabolic risk.
Implement a systematic approach to increasing daily physical activity.
Provide behavior change approaches to treat overweight and obesity, and reduce
cardiometabolic risk.
Provide medications and supplements as appropriate.
Consider weight loss surgery as appropriate.
Provide long-term support to address weight loss maintenance.

BEST PRACTICE I: Adult Weight Management
8 Urban Diabetes Care and Outcomes Audi t Repor t : 2007 -2011
Measures Used for Tracking Adult Weight Management
KEY MEASURE 1: Percent of diabetes patients with a documented assessment for overweight or
obesity in the past 12 months.
Obtaining measures of a patient’s height and weight can help determine individual risk profiles
due to overweight/obesity. Regular measures of height and weight can be used to set goals for
future weight loss and weight maintenance, and are crucial to successful diabetes care and
management.
FIGURE 2
21% 21% 23% 24% 23%
48% 46%47% 46% 46%
22% 21%22% 21% 22%
7% 7%7% 7% 7%
0%
20%
40%
60%
80%
100%
2007 2008 2009 2010 2011
Body Mass Index among Audited Urban Patients with Diabetes
Morbidly Obese (BMI 40+) Obese (BMI 30-39) Overweight (BMI 25-29) Normal (BMI<25)
Description of Graphic: Approximately 95-98% of audited urban patients had a
record of being assessed for overweight/obesity from 2007-2011. In 2011, 7% of
individuals had a normal BMI (<25); 22% were overweight (BMI 25-29); 46%
were obese (BMI 30-39); and 23% were considered morbidly obese (BMI 40+).
These rates are similar to those from previous years.

BEST PRACTICE I: Adult Weight Management
Urban Diabetes Care and Outcomes Audi t Repor t : 2007 -2011 9
KEY MEASURE 2: Percent of diabetes patients with documented nutrition and physical activity
education by a Registered Dietitian (RD) or other provider in the past 12 months.
Nutrition education provided by a Registered Dietitian or other professional can help patients learn specific methods to safely reduce their caloric intake and make other dietary changes. Dietary changes alone can lead to moderate weight loss, which in turn can significantly improve health outcomes among people with diabetes.
FIGURE 3
52%49%
55%
61%56%
0%
20%
40%
60%
80%
100%
2007 2008 2009 2010 2011
Nutrition and Physical Activity Education among Audited Urban Patients with Diabetes
Description of Graphic: In 2011, over half (56%) of audited urban patients had a
record of receiving both nutrition and physical activity education, similar to previous
years. Sixty-five percent received nutrition instruction from a Registered Dietitian or
other provider and 62% received physical activity education in 2011 (data not
shown).
KEY MEASURE 3: Percent of all participants who achieved both their nutritional goal(s) and physical
activity goal(s) in the past 12 months.
This key measure is not analyzable using current IHS Diabetes Audit data.
KEY MEASURE 4: Percent of all participants who achieved their weight loss goal in the past 12
months.
This key measure is not analyzable using current IHS Diabetes Audit data.

BEST PRACTICE I: Adult Weight Management
10 Urban Diabetes Care and Outcomes Audi t Repor t : 2007 -2011
KEY MEASURE 5: Percent of diabetes patients who had, in addition to measurement of body weight,
body mass index (BMI) and blood pressure, documented laboratory measures of cardiometabolic risk
including all of the following in past 12 months:
Non-HDL-cholesterol
Triglycerides
LDL- and HDL-cholesterol
Fasting glucose
Hemoglobin A1c (HbA1c)
FIGURE 4
67%62% 66% 66% 66%
0%
20%
40%
60%
80%
100%
2007 2008 2009 2010 2011
Cardiometabolic Risk Assessed among Audited Urban Patients with Diabetes*
* Does not include fasting glucose.
Description of Graphic: During 2007-2011, 62-67% of audited urban patients had
documented laboratory measures of cardiometabolic risk (e.g. blood lipids, HbA1c,
etc.) in the past year in addition to measurement of body weight, BMI and blood
pressure. In this five year time period, 75-82% received an HDL assessment; 73-
78% received an LDL assessment; 76-82% received a triglycerides assessment;
76-81% received a cholesterol assessment and 93-94% received an HbA1c
assessment (data not shown).

BEST PRACTICE II: Cardiovascular Disease
Urban Diabetes Care and Outcomes Audi t Repor t : 2007 -2011 11
Cardiovascular disease (CVD) is the leading cause of death in the United States, and risk of death from
CVD worsens with high blood pressure, cigarette smoking and diabetes.15 Adults with diabetes have
heart disease death rates about two to four times higher than adults without diabetes.16 CVD is the
number one killer of AI/AN adults.17 The risk of developing and dying from CVD would be substantially
reduced if major improvements were made in diet and physical activity, control of high blood pressure
and cholesterol, smoking cessation and appropriate aspirin use.18
Key Clinical Practice Recommendations Related to Cardiovascular Disease
Lifestyle Management
Assess smoking status, provide counseling and implement a smoking cessation program.
Assess lifestyle factors and provide medical nutrition therapy (MNT).
Assess BMI and assist with weight management.
Assess activity levels and recommend physical activity.
Behavioral Health
Assess emotional health and provide indicated services.
Clinical Management
Assess and treat high blood pressure (hypertension) to appropriate targets.
Assess and treat lipids to appropriate targets.
Assess and treat albuminuria to appropriate targets.
Assess and treat blood glucose to appropriate targets.
Provide aspirin and antiplatelet therapy for appropriate individuals.
Assess and treat anemia related to chronic kidney disease to appropriate targets.
Identify and treat sleep apnea.

BEST PRACTICE II: Cardiovascular Disease
12 Urban Diabetes Care and Outcomes Audi t Repor t : 2007 -2011
Measures Used for Tracking Cardiovascular Disease
KEY MEASURE 1: Percent of diabetes patients with documented smoking status in the past 12
months.
KEY MEASURE 2: Percent of diabetes patients who smoke who received tobacco cessation
intervention(s) in the past 12 months.
One of the key clinical recommendations related to cardiovascular disease is to assess tobacco
use and to provide cessation counseling when needed. Smoking is a significant risk factor for CVD
and smoking cessation counseling has been shown to be a cost-effective and safe intervention.
FIGURE 5
32% 29% 31% 29% 30%
57% 59%64%
72% 69%
0%
20%
40%
60%
80%
100%
2007 2008 2009 2010 2011
Current Tobacco Use and Cessation Counseling among Audited Urban Patients with Diabetes
Report Current Tobacco Use Tobacco Users Receiving Counseling and/or Referral
Description of Graphic: Thirty percent of audited urban patients with diabetes
reported current tobacco use in 2011, similar to previous years. Over the five year
period, there was an increase in the percentage of tobacco users receiving cessation
counseling or referrals, with 57% of tobacco users receiving counseling in 2007
compared with 69% in 2011, a 21% increase. While there is no record in the
Diabetes Audit of the number of patients that quit using tobacco, it may be inferred
from the constant rates of tobacco use over the five-year period that few patients are
quitting.

BEST PRACTICE II: Cardiovascular Disease
Urban Diabetes Care and Outcomes Audi t Repor t : 2007 -2011 13
KEY MEASURE 3: Percent of diabetes patients who smoke who quit smoking in the past 12 months.
This key measure is not analyzable using current IHS Diabetes Audit data.
KEY MEASURE 4: Percent of diabetes patients who had most recent blood pressure in the past 12
months at target.
Reduction of blood pressure through medication and/or lifestyle changes is a key intervention for patients with diabetes and hypertension. Blood pressure should be assessed at each visit to determine if it is being adequately controlled with current interventions.
FIGURE 6
41% 37%41% 46%
41%
30% 30% 28% 30% 30%
15% 16% 17% 17% 19%
0%
20%
40%
60%
80%
100%
2007 2008 2009 2010 2011
Mean Blood Pressure Categories* among Audited Urban Patients with Diabetes
At Goal: <130/80 Borderline: 130/80 - <140/<90 High: ≥ 140/90
HP2020Objective
2011 GPRA
Goal
* Average of last three blood pressures for 2007-09. Average of last two or three blood pressures for 2010-11.
2011 IHS GPRA Goal: 39% of patients with diabetes achieve blood pressure control.
HP2020 Objective: 57% of diabetes patients achieve blood pressure control.
Description of Graphic: In 2011, 41% of all audited urban patients assessed for
blood pressure had mean blood pressure values less than 130/80 (considered at
goal), a slight decrease from 2010 but similar to 2007-2009 Audit years. This
exceeds the 2011 IHS GPRA goal for 39% of patients to achieve blood pressure
control, but has not yet reached the HP2020 objective for 57% of patients to have
controlled blood pressure. Additionally, in 2011 30% of patients had blood pressures
considered borderline hypertension (between 130/80 and 140/90) and 19% had high
mean blood pressures (≥140/90), similar to previous Audit years. Several years of
Audit data during this time period had a high percentage (>10%) of missing data,
with 14% of patients missing blood pressure information in 2007; 16% in 2008 and
13% in 2009. This missing data may affect the results of this analysis.

BEST PRACTICE II: Cardiovascular Disease
14 Urban Diabetes Care and Outcomes Audi t Repor t : 2007 -2011
KEY MEASURE 5: Percent of diabetes patients with documented cardiovascular disease (CVD) or
hypertension education in the past 12 months.
This key measure is not analyzable using current IHS Diabetes Audit data.
KEY MEASURE 6: Percent of diabetes patients who had most recent lipid measurements in the past
12 months at target.
One key clinical Best Practice recommendation related to cardiovascular disease is to measure, evaluate and treat lipids. Lipids, or fats carried in the blood, include total cholesterol, LDL and HDL cholesterol, and triglycerides. While cholesterol is necessary for life, too much can clog arteries and contribute to heart disease. Total cholesterol is a measure of all the cholesterol in the blood, while low-density lipoprotein (LDL) cholesterol is one type (the “bad” type). Triglycerides are another type of lipid that can contribute to cardiovascular disease when levels are too high.
FIGURE 7
198 192204 205
195
181 182 179 179 179
98 100 98 97 98
0
50
100
150
200
250
2007 2008 2009 2010 2011
(mg
/dl)
Mean Blood Lipid Values among Audited Urban Patients with Diabetes
Mean Triglyceride Mean Total Cholesterol Mean LDL Cholesterol
Description of Graphic: Mean total cholesterol, LDL cholesterol and triglyceride
were not notably different over the past five years. Total cholesterol should ideally be
less than 200 mg/dl, and mean total cholesterol values have been below this level
(ranging from 179 to 182 mg/dl) throughout the five-year period. Mean LDL
cholesterol values have remained at or less than 100 mg/dl, considered the cut-off
for ideal LDL cholesterol. Ideal triglyceride values are less than 150 mg/dl; however,
mean triglyceride values have remained above 150 mg/dl this during the time period,
ranging from 192 to 205 mg/dl. All five years of Audit data during this time period
had a high percentage (>10%) of missing blood lipid data. In 2011, 24% of audited
patients were missing information about total cholesterol, 27% were missing
information about LDL cholesterol and 24% were missing information about
triglycerides. This missing data may affect the results of this analysis.
BEST PRACTICE II: Cardiovascular Disease
Urban Diabetes Care and Outcomes Audi t Repor t : 2007 -2011 15
FIGURE 8
78% 76% 76% 73% 73%
0%
20%
40%
60%
80%
100%
2007 2008 2009 2010 2011
LDL Cholesterol Assessed among Audited Urban Patients with Diabetes
2011 GPRA
Goal
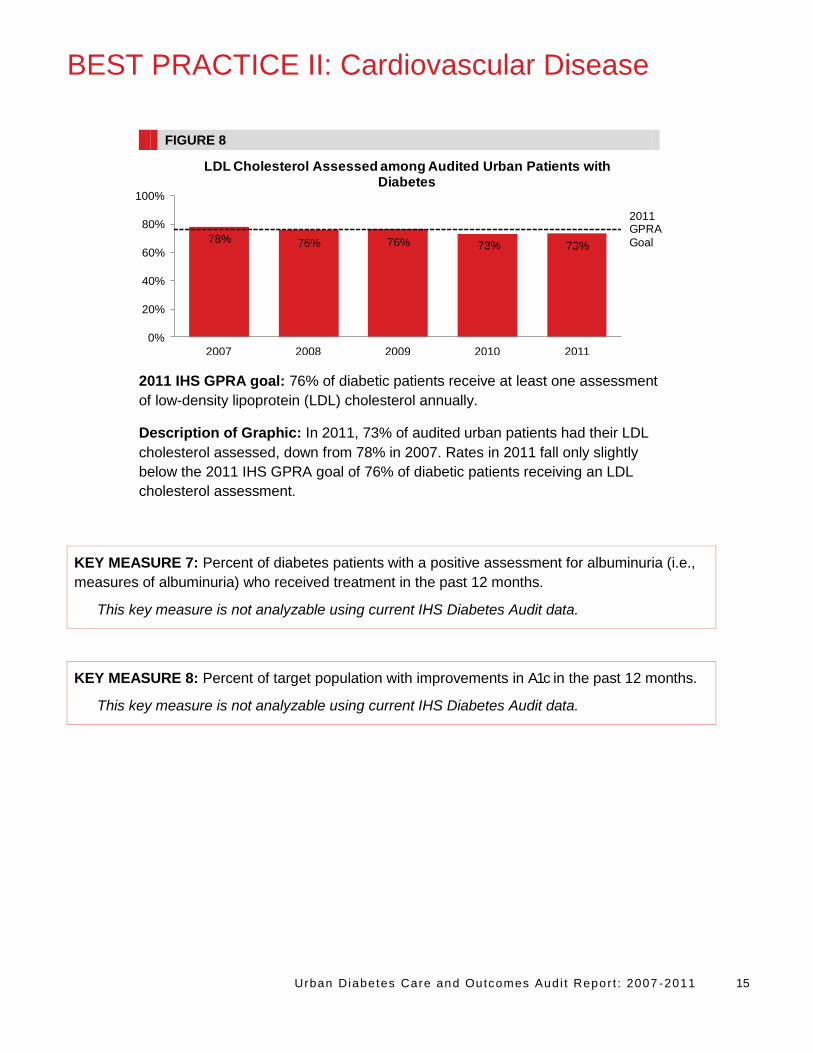
2011 IHS GPRA goal: 76% of diabetic patients receive at least one assessment
of low-density lipoprotein (LDL) cholesterol annually.
Description of Graphic: In 2011, 73% of audited urban patients had their LDL
cholesterol assessed, down from 78% in 2007. Rates in 2011 fall only slightly
below the 2011 IHS GPRA goal of 76% of diabetic patients receiving an LDL
cholesterol assessment.
KEY MEASURE 7: Percent of diabetes patients with a positive assessment for albuminuria (i.e.,
measures of albuminuria) who received treatment in the past 12 months.
This key measure is not analyzable using current IHS Diabetes Audit data.
KEY MEASURE 8: Percent of target population with improvements in A1c in the past 12 months.
This key measure is not analyzable using current IHS Diabetes Audit data.

BEST PRACTICE II: Cardiovascular Disease
16 Urban Diabetes Care and Outcomes Audi t Repor t : 2007 -2011
ALTERNATIVE MEASURE 1: Percentage of diabetes patients with ideal glycemic control (A1c
<7.0%).
Hemoglobin A1c is a long-term measure of a patient’s blood glucose level. It is used to assess the amount of glucose (sugar) that is circulating in the blood over a period of weeks or months. The American Diabetes Association recommends most patients with diabetes maintain their A1c level at less than 7.0% for successful diabetes management and to prevent vascular complications due to diabetes.19
FIGURE 9
40% 40% 39%35% 37%37% 36% 37% 38% 37%
17% 18% 17%20% 19%
0%
20%
40%
60%
80%
100%
2007 2008 2009 2010 2011
Mean Hemoglobin A1c Categories among Audited Urban Patients with Diabetes
<7.0% 7.0-9.5% >9.5%
HP2020 Objective
(for <7.0%)
2011 GPRA Goal (for
<7.0%)
2011 IHS GPRA goal: 36% of diabetic patients show recommended glycemic control
(hemoglobin A1c < 7.0%).
2011 IHS GPRA goal: 20% (or less) of diabetic patients have evidence of poor glycemic
control (hemoglobin A1c > 9.5%).*
HP2020 Objective: 58.9% of diabetes patients show recommended glycemic control
(hemoglobin A1c < 7.0%).
HP2020 Objective: 14.6% of diabetes patients have evidence of poor glycemic control
(hemoglobin A1c > 9.0%).*
Description of Graphic: In 2011, 37% of audited patients with diabetes showed
recommended glycemic control (A1c < 7.0%), similar to previous years. This meets the
2011 IHS GPRA goal to have 36% of diabetes patients with hemoglobin A1c values less
than 7.0%, but is below the HP2020 objective for 59% of patients to have A1c values less
than 7.0%. Similar to previous years, 19% of audited patients had evidence of poor
glycemic control (A1c>9.5%), which meets the 2011 IHS GPRA goal for 20% or less of
diabetes patients to have hemoglobin A1c values greater than 9.5%, but is below the
HP2020 objective for only 15% of diabetes to have evidence of poor glycemic control.
* Not shown on graph.

BEST PRACTICE II: Cardiovascular Disease
Urban Diabetes Care and Outcomes Audi t Repor t : 2007 -2011 17
FIGURE 10
94% 93% 93% 93% 94%
0%
20%
40%
60%
80%
100%
2007 2008 2009 2010 2011
Hemoglobin A1c Assessed among Audited Urban Patients with Diabetes
Description of Graphic: In 2011, 94% of audited patients had a record of a
recent A1c assessment. These rates were relatively stable over this time period.

BEST PRACTICE III: Chronic Kidney Disease
18 Urban Diabetes Care and Outcomes Audi t Repor t : 2007 -2011
Chronic Kidney Disease (CKD) is the loss of kidney function, where blood vessels in the kidneys are
damaged over time and hinder the kidney’s ability to filter blood, increasing waste in the body’s blood
supply.20 If CKD is not treated it can progress to kidney failure or end stage renal disease (ESRD), which
can decrease quality of life and lead to premature death.21 Diabetes is the leading cause of kidney
disease and kidney failure, accounting for 44% of all new cases of kidney failure in 2008.16 The threat to
those afflicted and their families is great, but CKD also affects allocation of resources: 25% of the
Medicare budget is used to treat CKD and ESRD.22 Fortunately, CKD and most health conditions related
to diabetes can be managed with diet, exercise and a combination of medications that can help lower
and stabilize blood glucose and blood pressure levels.16
Key Clinical Practice Recommendations Related to Chronic Kidney Disease
Perform screening for early detection of chronic kidney disease (CKD) using both a urine albumin
to creatinine ratio (UACR) and GFR.
Provide interventions to delay or prevent chronic kidney disease (CKD):
o Assess CKD risk factors in patients with diabetes.
o Initiate or intensify treatment in patients at risk for CKD.
Control glucose.
Treat hypertension.
Target is < 130/80 for most patients, but should be individualized.
Use an ACE inhibitor or ARB whenever possible.
o Reduce associated CVD risks.
o Provide kidney disease education.

BEST PRACTICE III: Chronic Kidney Disease
Urban Diabetes Care and Outcomes Audi t Repor t : 2007 -2011 19
Measures Used for Tracking Chronic Kidney Disease
KEY MEASURE 1: Percent of individuals with diabetes who were screened for CKD in the past 12
months as evidenced by both urine albumin to creatinine ratio (UACR) and GFR.
Serious kidney damage can be prevented or delayed if caught early, and there are common laboratory tests available to monitor kidney function. It is recommended that the eGFR be assessed each year in patients with diabetes. In Figures 11 and 12, only 2011 data are presented due to changes in how the information is collected in the Audit.
FIGURE 11
58%64% 65%
0%
20%
40%
60%
80%
100%
Age 18-44 years Age 45-64 years Age 65+ years
Kidney Function Assessment (eGFR and any Urinary Protein Testing) by Age, 2011
2011 GPRA
Goal
2011 IHS GPRA goal: 35% of diabetes patients are assessed for poor kidney
function (eGFR and quantitative urinary protein assessment).
Description of Graphic: In 2011, over half of urban audited patients with
diabetes were assessed for kidney disease. Fifty-eight percent of individuals age
18-44, 64% of individuals age 45-64 and 65% of individuals age 65 and older had
both a calculated GFR and any urinary protein testing. This exceeds the 2011
GPRA goal for 35% of diabetes patients to be assessed for nephropathy.

BEST PRACTICE III: Chronic Kidney Disease
20 Urban Diabetes Care and Outcomes Audi t Repor t : 2007 -2011
FIGURE 12
2% 8%
24%
0%
20%
40%
60%
80%
100%
Age 18-44 years Age 45-64 years Age 65+ years
Kidney Disease (eGFR <60) by Age, 2011
Description of Graphic: In 2011, the percent of urban audited patients with signs
of kidney disease (eGFR<60 ml/min) increased with age, where 2% of individuals
age 18-44, 8% of individuals age 45-64 and 24% of individuals age 65 and older
had an eGFR of less than 60 ml/min.
KEY MEASURE 2: Percent of individuals with diabetes who had most recent BP at < 130/80 in the
past 12 months (or have comorbidities that dictate a higher target).
See Best Practice II Cardiovascular Disease, Key Measure 4, pg 13 for a similar measure.

BEST PRACTICE III: Chronic Kidney Disease
Urban Diabetes Care and Outcomes Audi t Repor t : 2007 -2011 21
KEY MEASURE 3: Percent of individuals with diabetes and hypertension who are treated with an
angiotensin converting enzyme (ACE) inhibitor or angiotensin II receptor blocker (ARB) (or have a
documented allergy/intolerance) in the past 12 months.
Controlling blood pressure is an important means of reducing a patient’s risk for kidney disease. Over time, high blood pressure damages small vessels in the kidneys, which are critical to filtering the body’s waste products and regulating fluid levels. ACE Inhibitors and ARBs have been shown to protect kidneys more than other types of medication for hypertension.19
FIGURE 13
72% 70%74% 74% 73%
85% 86% 85% 82% 83%
2007 2008 2009 2010 2011
0%
20%
40%
60%
80%
100%
Hypertension and Use of ACE Inhibitors/ARBs among Audited Urban Patients with Diabetes
Patients with Hypertension ACE Inhibitor/ARB Use among Patients with Hypertension
Description of Graphic: During 2007-2011, 70-74% of audited urban patients
had a diagnosis of hypertension or were on medication to control blood pressure.
Among patients with hypertension, 82-86% had documentation of taking an ACE
Inhibitor or ARB during the past year. These numbers, however, should be
interpreted with caution. Because the Audit question used to assess hypertension
allows the reporter to respond affirmatively if there is a diagnosis or a record of
medication, these estimates may overestimate the burden of hypertension in the
community if patients were using the medication for prevention of kidney disease
rather than treatment of hypertension.

BEST PRACTICE IV: Depression
22 Urban Diabetes Care and Outcomes Audi t Repor t : 2007 -2011
Although diabetes is associated with an increased risk of depression, depression remains undiagnosed
and untreated in about two-thirds of patients who have both conditions.23 The comorbidity of depression
and diabetes is particularly challenging, as the debilitating effects of depression may influence an
individual’s ability to successfully manage diabetes. Recent studies have suggested that AI/ANs with
depression and diabetes have worse glycemic control than AI/ANs with diabetes alone.24 People who are
at high risk for developing diabetes may have unmet medical and mental health care needs. Helping
these patients address their health concerns, such as high blood pressure, high cholesterol and weight
problems, could alter or slow their progression to diabetes and improve their quality of life and mental
health.25 Routine depression screening for people with diabetes is recommended, as well as long-term
monitoring of depression patients for diabetes or its risk factors.
Key Clinical Practice Recommendations Related to Depression
For Your Patients with Diabetes
Educate providers on how to screen for and treat depression.
Screen for depression among patients with diabetes.
Provide depression care and treatment.
Recognize when to refer patients for specialist mental health care.
For Your Health Care System
Commit to improving depression care in people with diabetes.
Dedicate funds to improve depression care in people with diabetes.
Coordinate depression care between behavioral and primary care settings.
Design and implement an education program for the community and help patients connect to
community resources.

BEST PRACTICE IV: Depression
Urban Diabetes Care and Outcomes Audi t Repor t : 2007 -2011 23
Measures Used for Tracking Depression
KEY MEASURE 1: Percentage of diabetes patients who were screened for depression in the past 12
months.
Simple screening tools are available to identify patients who may be at risk for depression. These can be incorporated into a clinic’s system of care.
FIGURE 14
33% 31% 32%29%
32%
46%
55%
68% 67%
77%
0%
20%
40%
60%
80%
100%
2007 2008 2009 2010 2011
Depression Diagnosis and Screening among Audited Urban Patients with Diabetes
Diagnosed with Depression
Depression Screening among those without Current Diagnosis
Description of Graphic: In 2011, 32% of audited urban patients had a current
diagnosis of depression, similar to previous years. Depression screening among
patients without a current depression diagnosis has consistently increased each
year, from 46% in 2007 to 77% in 2011.
KEY MEASURE 2: Percentage of diabetes patients with documented depression that received
treatment for depression in the past 12 months.
This key measure is not analyzable using current IHS Diabetes Audit data.

BEST PRACTICE V: Eye Care
24 Urban Diabetes Care and Outcomes Audi t Repor t : 2007 -2011
Diabetes is the leading cause of new cases of blindness among adults aged 20-74 years old.16 Diabetes
can increase complications with diabetic retinopathy (DR), cataracts, glaucoma and even disrupt brain
functions associated with vision that lead to vision loss and blindness.26 Since initial eye damage can
occur without symptoms, regular vision screenings and patient education on the importance of regular
exams can reduce the risk of vision loss from diabetes.27
Key Clinical Practice Recommendations Related to Eye Care
Provide a DR education component in all diabetes education programs for patients and family.
Adhere to the evidence-based accepted standards of care for DR surveillance and use a
qualifying examination for DR surveillance:
o Dilated eye examination by an optometrist or ophthalmologist.
o Qualifying photographic retinal examination.
Dilated seven standard field stereoscopic examination (Early Treatment Diabetic
Retinopathy Study (ETDRS) photos).
Other photographic method formally validated to ETDRS.
Recognize early when to refer patient for consideration of treatment.
Monitor risk factors and treatments.
Provide ophthalmology referral for all cases determined to be at risk for vision loss and possible
candidates for treatment and provide visual rehabilitation for patients with vision loss.

BEST PRACTICE V: Eye Care
Urban Diabetes Care and Outcomes Audi t Repor t : 2007 -2011 25
Measures Used for Tracking Eye Care
KEY MEASURE 1: Percentage of diabetes patients with a documented qualifying eye exam in the
past 12 months.
Through early detection and treatment, serious vision loss from diabetes can be reduced. Patients with diabetes should receive an examination for retinopathy soon after diagnosis and annually from then on.
FIGURE 15
45% 45% 43%39% 42%
0%
20%
40%
60%
80%
100%
2007 2008 2009 2010 2011
Eye Exam in Past Year among Audited Urban Patients with Diabetes
HP2020 Objective
2011 GPRA Goal
2011 IHS GPRA goal: 50.1% of diabetes patients receive an annual eye exam.
This includes patients that have a documented visit for a qualified retinal evaluation
or documentation of refusing such an exam.
HP2020 Objective: 58.7% of diabetes patients receive an annual eye exam.
Description of Graphic: From 2007-2011, 39-45% of urban audited patients with
diabetes had a record of receiving a qualifying eye exam in the past year. In all five
years, the percentage of patients receiving this exam is below both the 2011 GPRA
goal (50% of patients receive an annual eye exam) and the HP2020 Objective
(59% of patients receive an annual eye exam). Access to specialty care,
recognized as a serious problem for urban AI/ANs, may be a factor in obtaining an
eye exam. Additionally, these figures may underestimate the number of patients
that received eye exams if patients received exams outside the UIHOs that were
not documented in patient records.

BEST PRACTICE V: Eye Care
26 Urban Diabetes Care and Outcomes Audi t Repor t : 2007 -2011
KEY MEASURE 2: Percentage of diabetes patients identified as needing retinal treatment (such
as retinal laser treatment, intravitreal injection of anti-vascular endothelial growth factor (VEGF) or
steroid medications, or vitrectomy procedure) who received it in the past 12 months.
This key measure is not analyzable using current IHS Diabetes Audit data.

BEST PRACTICE VI: Foot Care
Urban Diabetes Care and Outcomes Audi t Repor t : 2007 -2011 27
Approximately 40% of patients with diabetes have acute foot problems such as numbness, pain, burning
and reduced feeling in the feet and legs.28 Foot ulcers and amputation are common complications from
diabetes, yet are fully treatable when identified early. A reliable foot care screening test can detect at
least 90% of people at risk, and patient education, when coupled with regular comprehensive foot care
programs, can reduce amputation rates by 45% to 85%.16 Foot complications can be managed and
avoided with lifestyle changes in combination with medication that help stabilize glucose levels, blood
pressure and lipids.
Key Clinical Practice Recommendations Related to Foot Care
For Your Patients with Diabetes
Conduct an annual foot examination in all patients with diabetes regardless of risk status.
Provide risk-appropriate foot care self-management education.
Recognize when it is appropriate to refer for or provide podiatry care.
Provide expertise in footwear selection and footwear modification to ensure safe ambulation and
exercise.
Recognize when to refer patients for vascular assessment and augmentation procedures.
In addition, for people with diabetes-related foot complications, diagnose and treat foot ulcers,
and diagnose and treat neuropathic foot pain.
For Your Health Care System
Develop a team approach to diabetes care that includes foot care.
Train clinic staff and field health personnel to perform and document foot risk assessments and
risk-specific foot care education.
Cascade clinic foot care objectives into clinics’ annual performance plans.
Develop a mechanism for providing basic podiatry care.
Develop clear mechanisms for referring patients to home care, field health workers, podiatry care,
footwear specialists and surgery.

BEST PRACTICE VI: Foot Care
28 Urban Diabetes Care and Outcomes Audi t Repor t : 2007 -2011
Measures Used for Tracking Foot Care
KEY MEASURE 1: Percent of diabetes patients with documented foot exams in the past 12 months.
A trained provider can assess for reduced sensation, physical abnormalities and vascular flow during a foot exam. Finding early signs of reduced circulation or other risks facilitates timely intervention. Education about proper self-care, podiatry care, proper footwear and referrals all can help reduce the chances of serious complications.
FIGURE 16
71% 69% 67% 67% 66%
0%
20%
40%
60%
80%
100%
2007 2008 2009 2010 2011
Foot Exam in Past Year among Audited Urban Patients with Diabetes
HP2020Objective
HP2020 Objective: 74.8% of diabetes patients receive at least one annual foot
exam.
Description of Graphic: In 2011, 66% of audited urban patients had a record of a
foot exam in the past year, a slight decrease from 2007. This falls below the
HP2020 Objective for 75% of diabetes patients to receive a foot exam each year.
KEY MEASURE 2: Percent of diabetes patients with documented risk-appropriate foot care
education in the past 12 months.
This key measure is not analyzable using current IHS Diabetes Audit data.
KEY MEASURE 3: Percent of diabetes patients with foot ulcers who received treatment in the last 12 months.
This key measure is not analyzable using current IHS Diabetes Audit data.

BEST PRACTICE VII: Oral Health
Urban Diabetes Care and Outcomes Audi t Repor t : 2007 -2011 29
Poorly controlled glucose levels can lead to periodontal disease, tooth decay, infections and other
serious oral health problems.29 Infection and inflammation associated with periodontitis also can increase
risk for diabetes complications such as cardiovascular disease, coronary artery disease and chronic
kidney disease.30 Oral health education and regular oral evaluations can prevent, detect and treat
periodontal disease and dental caries early.30
Key Clinical Practice Recommendations Related to Oral Health
Primary care and dental care team members provide patient education to prevent and reduce
adverse oral health outcomes.
Primary care team members evaluate for the presence of periodontal disease and refer for dental
examination/treatment as needed.
Dentist conducts a risk assessment and comprehensive annual dental examination including
prevention, early detection, and treatment of periodontal disease and caries in all patients with
diabetes.
Establish priorities for dental treatment and oral health education for people with diabetes.
Provide dental treatment and periodontal therapy, including:
o Conducting annual dental examinations and cleanings.
o Restoring caries in all people with diabetes.
o Providing recalls (follow-up visits) to maintain periodontal and dental health.
Measures Used for Tracking Oral Health
KEY MEASURE 1: Percent of diabetes patients who had documented dental-related patient
education in the past 12 months.
This key measure is not analyzable using current IHS Diabetes Audit data.

BEST PRACTICE VII: Oral Health
30 Urban Diabetes Care and Outcomes Audi t Repor t : 2007 -2011
KEY MEASURE 2: Percent of diabetes patients who had a documented dental exam in the past 12
months.
Primary care providers play a role in ensuring patients with diabetes receive regular dental exams. A systematic method of documenting patients’ reports of dental exams can be maintained and can help providers to encourage patients to follow through on needed exams.
FIGURE 17
27% 27% 29% 27% 28%
0%
20%
40%
60%
80%
100%
2007 2008 2009 2010 2011
Dental Exam in Past Year among Audited Urban Patients with Diabetes
HP2020Objective
HP2020 Objective: 61.2% of diabetes patients receive an annual dental exam.
Description of Graphic: In 2007-2011, 27-29% of audited urban patients had a
record of a recent dental exam. This is lower than the HP2020 Objective for 61% of
diabetes patients to receive a dental exam each year. However, these figures may
underestimate the number of patients that received dental exams if patients
received exams outside the UIHOs that were not documented in patient records.
Additionally, access to care may be a significant factor in a patient’s ability to
obtain dental services.
KEY MEASURE 3: Percent of diabetes patients identified as needing dental treatment (cleaning and
caries) who received it in the past 12 months.
This key measure is not analyzable using current IHS Diabetes Audit data.

APPENDIX A
Urban Diabetes Care and Outcomes Audi t Repor t : 2007 -2011 31
The following tables display urban aggregate data for the years 2007-2011. Both raw numbers and
weighted percents are included. Because percents are rounded, the total may not add up to 100%.
Year
No. charts audited
No. %+ No. %+ No. %+ No. %+ No. %+
Sex
Male 451 41% 697 40% 779 41% 852 40% 972 40%
Female 705 59% 1,091 60% 1,191 59% 1,280 60% 1,460 60%
Age
< 18 years 3 0% 8 0% 5 0% 8 1% 3 0%
18-44 years 324 27% 497 28% 563 28% 608 28% 677 28%
45-64 years 637 56% 988 55% 1,095 56% 1,193 56% 1,389 56%
> 65 years 190 17% 295 16% 307 16% 323 16% 363 16%
Diabetes Duration
< 5 years 454 41% 693 39% 703 35% 829 39% 931 38%
5 – 9 years 300 24% 453 24% 468 25% 506 26% 636 26%
> 10 years 312 27% 465 26% 527 28% 591 29% 717 28%
Not documented 90 7% 177 11% 272 13% 206 7% 148 8%
Diabetes Type
Type 1 29 3% 49 3% 36 2% 46 2% 47 2%
Type 2 1,125 97% 1,736 97% 1,934 98% 2,086 98% 2,384 98%
1,156 1,788 1,970 2,132 2,432
Table 1. Demographics of Audited Patients with Diabetes, 2007-2011
2007 2008 2009 2010 2011
+ Weighted Estimate

APPENDIX A
32 Urban Diabetes Care and Outcomes Audi t Repor t : 2007 -2011
Year
No. charts audited
No. %+ No. %+ No. %+ No. %+ No. %+
Body Mass Index (BMI)*
< 25 75 7% 133 7% 134 7% 139 7% 155 7%
25 - 29 260 22% 377 21% 443 22% 447 21% 542 22%
30 - 40 541 48% 818 46% 918 47% 970 46% 1,121 46%
> 40 247 21% 396 21% 438 23% 524 24% 577 23%
Not tested or no valid result 33 2% 64 5% 37 2% 52 2% 37 2%
Hypertension^
Yes 804 72% 1,248 70% 1,433 74% 1,528 74% 1,778 73%
No 348 28% 528 29% 537 26% 604 26% 654 27%
Not tested or no valid result 4 0% 12 1% 0 0% 0 0% 0 0%
Blood Pressure (mmHg)
<130/<80 442 41% 666 37% 795 41% 968 46% 988 41%
130/80 - <140/<90 328 30% 505 30% 514 28% 608 30% 750 30%
140+/90+ 169 15% 309 16% 331 17% 393 17% 451 19%
Not tested or no valid result 217 14% 308 16% 330 13% 163 7% 243 10%
2,4321,156 1,788 1,970 2,132
Table 2. Vital Statistics of Audited Patients with Diabetes, 2007-2011
2007 2008 2009 2010 2011
+ Weighted Estimate
*Weight in kilograms/(height in meters)2; normal < 25, overweight 25-29, obese ≥30
^Documented diagnosis or taking prescription medication

APPENDIX A
Urban Diabetes Care and Outcomes Audi t Repor t : 2007 -2011 33
Year
No. charts audited
No. %+ No. %+ No. %+ No. %+ No. %+
Eye Exam
Yes 534 45% 856 45% 886 43% 901 39% 998 42%
No 606 54% 877 51% 1,039 54% 1,166 58% 1,366 55%
Refused 16 1% 40 3% 45 2% 64 3% 68 3%
Not documented 0 0% 15 1% 0 0% 1 0% 0 0%
Foot Exam
Yes 789 71% 1,210 69% 1,257 67% 1,379 67% 1,626 66%
No 350 28% 557 30% 695 32% 735 32% 789 34%
Refused 15 1% 13 1% 18 1% 17 1% 17 1%
Not documented 2 0% 8 1% 0 0% 1 0% 0 0%
Dental Exam
Yes 372 27% 535 27% 621 29% 612 27% 710 28%
No 759 72% 1,160 67% 1,269 67% 1,432 70% 1,632 69%
Refused 24 1% 70 4% 80 4% 86 4% 90 3%
Not documented 1 0% 23 2% 0 0% 2 0% 0 0%
Table 3. Exams in Past Year among Audited Patients with Diabetes, 2007-2011
2007 2008 2009 2010 2011
2,4321,156 1,788 1,970 2,132
+ Weighted Estimate

APPENDIX A
34 Urban Diabetes Care and Outcomes Audi t Repor t : 2007 -2011
Year
No. charts audited
No. %+ No. %+ No. %+ No. %+ No. %+
Diet Instruction
By registered dietitian only 215 18% 336 20% 326 17% 376 19% 340 16%
By other staff only 426 36% 652 32% 789 36% 942 42% 1,024 41%
By both RD and other 166 10% 187 7% 229 11% 273 13% 249 9%
No diet instruction 338 34% 581 38% 575 32% 493 25% 769 33%
Refused 10 1% 25 2% 51 4% 47 1% 50 2%
Not documented 1 0% 7 1% 0 0% 1 0% 0 0%
Exercise Instruction
Yes 745 59% 1,099 56% 1,269 61% 1,467 67% 1,511 62%
No 394 40% 655 42% 667 37% 621 32% 844 36%
Refused 16 1% 24 2% 34 2% 43 1% 76 2%
Not documented 1 0% 10 1% 0 0% 1 0% 1 0%
Diabetes Education (other)
Yes 920 79% 1,317 70% 1,483 71% 1,693 79% 1,909 77%
No 226 21% 433 28% 449 25% 400 20% 483 22%
Refused 10 1% 26 2% 38 3% 38 1% 40 2%
Not documented 0 0% 12 1% 0 0% 1 0% 0 0%
Table 4. Diabetes Education among Audited Patients with Diabetes, 2007-2011
2007 2008 2009 2010 2011
2,4321,156 1,788 1,970 2,132
+ Weighted Estimate

APPENDIX A
Urban Diabetes Care and Outcomes Audi t Repor t : 2007 -2011 35
Year
No. charts audited
No. %+ No. %+ No. %+ No. %+ No. %+
Influenza Vaccine in Past Year
Yes 633 56% 1,099 60% 1,191 60% 1,122 55% 1,360 56%
No 451 39% 557 32% 639 33% 889 40% 909 38%
Refused 70 6% 118 7% 140 7% 119 5% 163 6%
Not tested or no valid result 2 0% 14 1% 0 0% 2 0% 0 0%
Pneumococcal Vaccine Ever
Yes 682 60% 1,103 62% 1,277 65% 1,351 64% 1,640 67%
No 437 37% 615 34% 618 31% 711 32% 704 30%
Refused 35 3% 51 3% 75 4% 68 3% 87 3%
Not tested or no valid result 2 0% 19 1% 0 0% 2 0% 1 0%
Td Vaccine in Past 10 Years
Yes 671 63% 1,090 63% 1,207 64% 1,311 66% 1,582 63%
No 463 36% 657 35% 733 34% 780 33% 779 34%
Refused 16 1% 23 1% 30 1% 39 1% 69 2%
Not tested or no valid result 6 0% 18 1% 0 0% 2 0% 2 0%
TB Status (PPD)
Positive, INH complete 69 5% 66 3% 82 4% 65 3% 87 3%
Positive, not treated 56 5% 78 4% 93 5% 67 3% 106 5%
Negative, up to date 349 27% 482 22% 509 23% 497 22% 592 22%
Negative, outdated 60 5% 65 4% 74 3% 96 4% 116 4%
Negative, date unknown 17 1% 24 1% 58 3% 108 3% 22 1%
Status unknown 605 57% 1,044 64% 1,154 62% 1,299 66% 1,473 63%
Not tested or no valid result 0 0% 29 2% 0 0% 0 0% 36 2%
Table 5. Immunizations among Audited Patients with Diabetes, 2007-2011
2007 2008 2009 2010 2011
2,4321,156 1,788 1,970 2,132
+ Weighted Estimate
Year
No. charts audited
No. %+ No. %+ No. %+ No. %+ No. %+
Labs Done in Past Year
A1c 1,048 94% 1,647 93% 1,806 93% 1,957 93% 2,282 94%
Total cholestrol 911 81% 1,363 78% 1,484 78% 1,577 76% 1,907 76%
LDL cholesterol 863 78% 1,317 76% 1,475 76% 1,542 73% 1,851 73%
Triglycerides 918 82% 1,365 79% 1,501 79% 1,570 76% 1,911 76%
Table 6. Laboratory Services among Audited Patients with Diabetes, 2007-2011
2007 2008 2009 2010 2011
2,4321,156 1,788 1,970 2,132
+ Weighted Estimate

APPENDIX A
36 Urban Diabetes Care and Outcomes Audi t Repor t : 2007 -2011
Year
No. charts audited
No. %+ No. %+ No. %+ No. %+ No. %+
A1c (%)
<7.0 454 40% 706 40% 742 39% 775 35% 904 37%
7.0 – 9.5 396 37% 626 36% 700 37% 764 38% 907 37%
> 9.5 198 17% 315 18% 364 17% 418 20% 471 19%
Not tested or no valid result 108 6% 141 7% 164 7% 175 7% 150 6%
Mean A1c+
Total Cholesterol (mg/dl)
< 200 628 57% 937 56% 1,046 57% 1,167 58% 1,434 57%
200 – 239 207 18% 283 15% 296 14% 272 12% 332 14%
> 240 76 6% 143 8% 142 6% 138 6% 141 6%
Not tested or no valid result 245 19% 425 22% 486 22% 555 24% 525 24%
Mean total cholesterol+
LDL Cholesterol (mg/dl)
< 100 469 44% 690 41% 800 43% 841 41% 1,053 42%
100 – 129 252 22% 375 22% 417 21% 459 22% 547 22%
130 – 160 101 8% 174 9% 187 9% 177 8% 174 7%
> 160 38 3% 78 4% 71 3% 65 3% 77 3%
Not tested or no valid result 296 22% 471 24% 495 24% 590 27% 581 27%
Mean LDL cholesterol+
Triglyceride (mg/dl)
< 150 405 37% 622 37% 665 36% 717 35% 893 35%
150 – 199 190 18% 284 17% 342 18% 336 15% 377 15%
200 – 400 261 23% 365 21% 380 20% 418 20% 529 21%
> 400 62 5% 94 5% 114 6% 99 5% 112 5%
Not tested or no valid result 238 18% 423 21% 469 21% 562 24% 521 24%
Mean triglyceride+195
Table 7. Laboratory Results among Audited Patients with Diabetes, 2007-2011
2007 2008 2009 2010 2011
179
98 100
7.8
198 192 204 205
181
1,156
7.9
2,132
98
1,788
8.0
1,970
98
7.9 8.0
182 179
2,432
97
179
+ Weighted Estimate

APPENDIX A
Urban Diabetes Care and Outcomes Audi t Repor t : 2007 -2011 37
Year
No. charts audited
No. %+ No. %+ No. %+ No. %+ No. %+
Diabetes Treatment
Diet/Exercise alone 142 9% 174 8% 214 8% 214 8% 284 10%
Oral/Injectible agent only 647 55% 1,031 56% 1,106 56% 1,154 53% 1,293 52%
Insulin only 122 13% 232 16% 208 13% 253 15% 277 14%
Insulin and Oral/Injectible agent 208 20% 325 20% 399 21% 445 21% 540 23%
Refused/Unknown 28 1% 26 1% 24 1% 66 4% 33 1%
Not documented 9 1% 0 0% 19 1% 0 0% 5 0%
Chronic Aspirin*
Yes 747 72% 1,210 74% 1,251 68% 1,296 64% 1,546 65%
No/Refused 369 28% 485 25% 631 32% 745 36% 785 35%
Not documented 0 0% 14 1% 0 0% 0 0% 4 0%
Lipid Lowering Agent
Yes 613 57% 953 55% 1,048 57% 1,077 54% 1,352 56%
No/Refused 542 43% 818 44% 922 43% 1,055 46% 1,080 44%
Not documented 1 0% 17 1% 0 0% 0 0% 0 0%
ACE Inhibitor/ARBs
Yes 773 72% 1,262 71% 1,388 72% 1,471 69% 1,681 69%
No/Refused 382 28% 513 28% 582 28% 661 31% 748 31%
Not documented 1 0% 13 1% 0 0% 0 0% 3 0%
Table 8. Use of Standard Therapies among Audited Patients with Diabetes, 2007-2011
2007 2008 2009 2010 2011
2,4321,156 1,788 1,970 2,132
+ Weighted Estimate
*Among patients 30 years and older
APPENDIX A
38 Urban Diabetes Care and Outcomes Audi t Repor t : 2007 -2011
Year
No. charts audited
No. %+ No. %+ No. %+ No. %+ No. %+
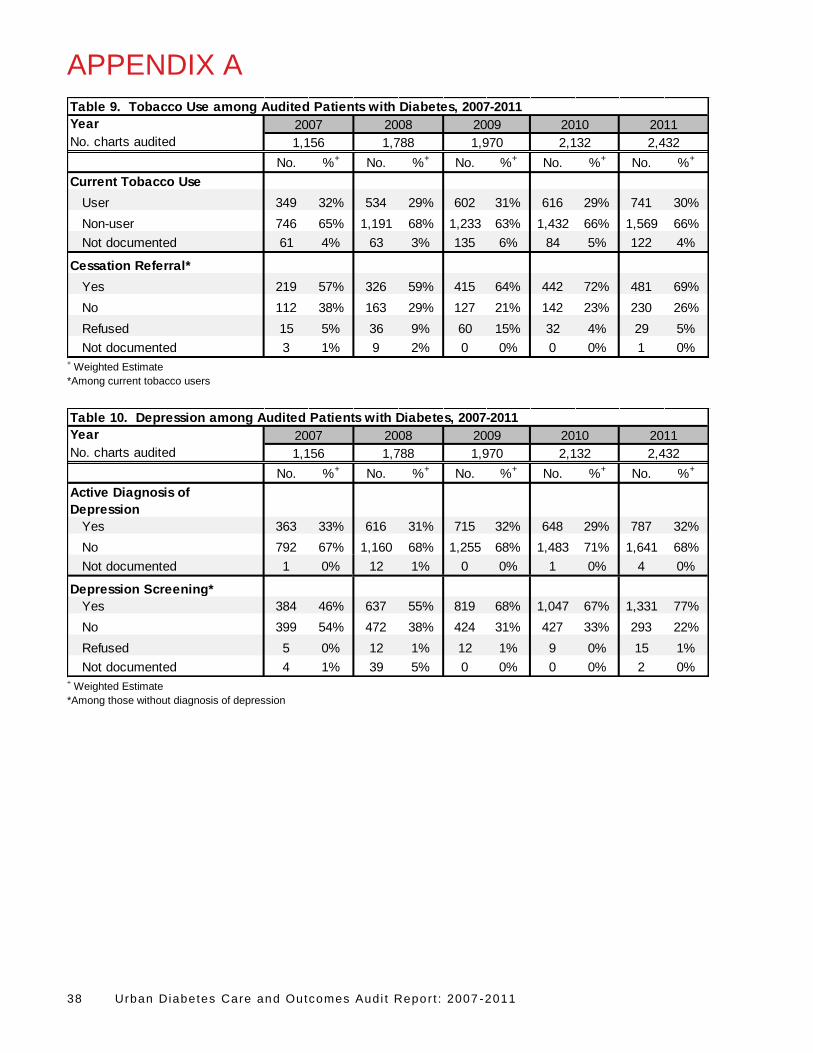
Current Tobacco Use
User 349 32% 534 29% 602 31% 616 29% 741 30%
Non-user 746 65% 1,191 68% 1,233 63% 1,432 66% 1,569 66%
Not documented 61 4% 63 3% 135 6% 84 5% 122 4%
Cessation Referral*
Yes 219 57% 326 59% 415 64% 442 72% 481 69%
No 112 38% 163 29% 127 21% 142 23% 230 26%
Refused 15 5% 36 9% 60 15% 32 4% 29 5%
Not documented 3 1% 9 2% 0 0% 0 0% 1 0%
2,4321,156 1,788 1,970 2,132
Table 9. Tobacco Use among Audited Patients with Diabetes, 2007-2011
2007 2008 2009 2010 2011
+ Weighted Estimate
*Among current tobacco users
Year
No. charts audited
No. %+ No. %+ No. %+ No. %+ No. %+
Active Diagnosis of
Depression
Yes 363 33% 616 31% 715 32% 648 29% 787 32%
No 792 67% 1,160 68% 1,255 68% 1,483 71% 1,641 68%
Not documented 1 0% 12 1% 0 0% 1 0% 4 0%
Depression Screening*
Yes 384 46% 637 55% 819 68% 1,047 67% 1,331 77%
No 399 54% 472 38% 424 31% 427 33% 293 22%
Refused 5 0% 12 1% 12 1% 9 0% 15 1%
Not documented 4 1% 39 5% 0 0% 0 0% 2 0%
2,4321,156 1,788 1,970 2,132
Table 10. Depression among Audited Patients with Diabetes, 2007-2011
2007 2008 2009 2010 2011
+ Weighted Estimate
*Among those without diagnosis of depression

APPENDIX B
Urban Diabetes Care and Outcomes Audi t Repor t : 2007 -2011 39
Comparison to National Standards: GPRA and Healthy People 2010
Comparing the urban aggregate results to national goals may provide important information about
progress toward providing diabetes-related services and achieving specific health outcomes. The table
below presents urban aggregate results as they compare with IHS GPRA Goals and HP targets.
Year 2007 2008 2009 2010 2011
2011 IHS
GPRA
Goal
HP2020
Objective
No. charts audited 1,156 1,788 1,970 2,132 2,432
%+ %+ %+ %+ %+
A1c < 7.0% 40.0% 40.1% 39.1% 34.8% 36.7% 36.0% 58.9%
A1c > 9.5% (lower is better) 17.1% 17.5% 17.3% 20.3% 19.5% 20.0% 14.6%
Blood pressure (mmHg) <130/80 41.3% 37.5% 41.5% 45.6% 41.0% 39.0% 57.0%
LDL cholesterol assessed 78.1% 75.9% 76.5% 73.1% 73.5% 76.0%
Retinopathy assessment
(eye exam)44.9% 45.3% 43.2% 39.1% 41.6% 50.1% 58.7%
Foot exam 71.0% 68.6% 66.9% 67.2% 65.6% 74.8%
Dental exam 26.6% 27.3% 29.3% 26.8% 27.6% 61.2%
Table 11. Selected Indicators by Year Compared with 2011 IHS GPRA Goals and HP2020 Targets
+Weighted estimate
Government Performance Results Act (GPRA)
Passed in 1993, the Government Performance Results Act (GPRA) was designed to address a broad
range of concerns regarding government accountability and performance in the management of
government-funded public needs projects. The general purpose of GPRA is to improve the confidence of
Americans in the Federal government by holding Federal agencies accountable for achieving program
results.11 IHS reports on a range of health topics for GPRA, including diabetes.
In 2011, there were six GPRA goals related to diabetes and two additional diabetes measures that are
reported to Congress. These measures are intended to gauge progress toward improving diabetes care
and related services. Please note that official GPRA results are prepared and distributed by the IHS
Planning and Evaluation office. For more information about the IHS GPRA targets and measurements,
visit: http://www.ihs.gov/NonMedicalPrograms/quality/index.cfm?module=gpra_list.

APPENDIX B
40 Urban Diabetes Care and Outcomes Audi t Repor t : 2007 -2011
GPRA Indicators for Diabetes and Definitions Target
Poor Glycemic Control
Last recorded hemoglobin A1c > 9.5% 20%
Ideal Glycemic Control
Last recorded hemoglobin A1c < 7.0% 36%
Blood Pressure Control
Mean of last three recorded blood pressures <130/<80mmHg 39%
Assessed for Dyslipidemia
Low density lipoprotein (LDL) cholesterol tested in preceding 12 months 76%
Assessed for Nephropathy
Both an estimated glomeruler filtration rate (eGFR) and a quantitative urinary protein
assessment in preceding 12 months
35%
Assessed for Retinopathy
Retinal exam documented in the preceding 12 months 50.1%
Health People 2020
Healthy People 2020 (HP2020) is a national health promotion and disease prevention initiative
established by the U.S. Department of Health and Human Services. HP2020 was designed to measure
health-related outcomes and progress over time and was developed through a broad consultation
process, built on scientific knowledge and other government health initiatives pursued over the past two
decades. HP2020 Objectives are action statements toward which the nation, communities, institutions
and local groups can work.
HP2020 provides science-based, 10-year national objectives for improving the health of all Americans.
HP2020 identifies 42 major focus areas including one that addresses diabetes. The diabetes focus area
and its goals to reduce disease and improve the quality of life are further detailed within 16 objectives,
five of which can be tracked using data from the Diabetes Audit.
Healthy People 2020 goals and objectives have been released and are now available. For more
information, visit www.healthypeople.gov.

APPENDIX B
Urban Diabetes Care and Outcomes Audi t Repor t : 2007 -2011 41
HP2020 Focus Area Objectives and Definitions Target
D-1. New cases of diabetes
Reduce the annual number of new cases of diagnosed diabetes in the population.
7.2 new cases per
1,000 population
aged 18 to 84 years
D-2 Diabetes-related deaths*
Reduce the death rate among the population with diabetes.
D-2.1 Reduce the rate of all-cause mortality among the population with diabetes. N/A
D-2.2 Reduce the rate of cardiovascular disease deaths in persons with diagnosed
diabetes. N/A
D-3 Diabetes deaths
Reduce the diabetes death rate.
65.8 deaths per
100,000 population
D-4 Lower extremity amputations^
Reduce the rate of lower extremity amputations in persons with diagnosed diabetes. N/A
D-5 Glycemic control
Improve glycemic control among the population with diagnosed diabetes.
D-5.1 Reduce the proportion of the diabetic population with an A1c value greater than
9%. 14.6%
D-5.2 Increase the proportion of the diabetic population with an A1c value less than 7%. 58.9%
D-6 Lipid control*
Improve lipid control among persons with diagnosed diabetes. N/A
D-7 Blood pressure control
Increase the proportion of the population with diagnosed diabetes whose blood
pressure is under control.
57.0%
D-8 Annual dental examinations
Increase the proportion of persons with diagnosed diabetes who have at least an
annual dental examination.
61.2%
D-9 Annual foot examinations
Increase the proportion of adults with diabetes who have at least an annual foot
examination.
74.8%
D-10 Annual dilated eye examinations
Increase the proportion of adults with diabetes who have an annual dilated eye
examination.
58.7%
D-11 Glycosylated hemoglobin measurement
Increase the proportion of adults with diabetes who have a glycosylated hemoglobin
measurement at least twice a year.
71.1%
D-12 Annual urinary microalbumin measurement
Increase the proportion of persons with diagnosed diabetes who obtain an annual
urinary microalbumin measurement.
37.0%
D-13 Self-blood glucose-monitoring
Increase the proportion of adults with diabetes who perform self-blood glucose-
monitoring at least once daily.
70.4%

APPENDIX B
42 Urban Diabetes Care and Outcomes Audi t Repor t : 2007 -2011
D-14 Diabetes education
Increase the proportion of persons with diagnosed diabetes who receive formal
diabetes education.
62.5%
D-15 Diagnosed diabetes
Increase the proportion of persons with diabetes whose condition has been diagnosed. 80.1%
D-16 Prevention behaviors among persons with pre-diabetes
Increase prevention behaviors in persons at high risk for diabetes with pre-diabetes.
D-16.1 Increase the proportion of persons at high risk for diabetes with pre-diabetes
who report increasing their levels of physical activity. 49.1%
D-16.2 Increase the proportion of persons at high risk for diabetes with pre-diabetes
who report trying to lose weight. 55.0%
* Developmental objective; these objectives do not have targets.
^ This measure is being tracked for informational purposes only. If warranted, a target will be set during the decade.

REFERENCES
Urban Diabetes Care and Outcomes Audi t Repor t : 2007 -2011 43
1. Pleis JR, Lucas JW, Ward BW. (2009). Summary health statistics for U.S. adults: National Health Interview Survey, 2008. Vital and Health Statistics, 10(242), 1-157.
2. Wilson C, Gilliland S, Cullen T, et al. (2005). Diabetes outcomes in the Indian Health System during the era of the Special Diabetes Program for Indians and the Government Performance and Results Act. American Journal of Public Health, 95(9), 1518-1522.
3. Forquera R. (2001). Issue Brief: Urban Indian Health. Washington, DC: Kaiser Family Foundation. 4. U.S. Census Bureau. (2000). 2000 Census Summary File 1 (SF 1) 100% Data. 5. U.S. Census Bureau. (2010). 2010 Census Summary File 1 (SF 1) 100% Data. 6. Centers for Disease Control and Prevention (CDC). (2005-2010). Behavioral Risk Factor Surveillance System
Survey Data. U.S. Department of Health and Human Services, Centers for Disease Control and Prevention. 7. U.S. Census Bureau. (2005-2009). 2009 American Community Survey Five-Year Estimates. 8. Indian Health Service Division of Diabetes Treatment and Prevention. (2011). 2011 Revised Indian Health
Diabetes Best Practices. Retrieved from http://www.ihs.gov/MedicalPrograms/Diabetes/index.cfm?module=toolsBPList.
9. Indian Health Service Division of Diabetes Treatment and Prevention. (2009). Indian Health Service Standards of Care for Adults with Type 2 Diabetes. Albuquerque, NM: U.S. Department of Health and Human Services.
10. Indian Health Service Division of Diabetes Treatment and Prevention. (2012). Audit 2012: IHS Diabetes Care and Outcomes Audit for Quality Assurance and Quality Improvement. Albuquerque, NM: U.S. Department of Health and Human Services.
11. U.S. Department of Labor. (2011). Government Performance and Results Act Goals. Retrieved from http://www.doleta.gov/performance/goals/gpra.cfm.
12. U.S. Department of Health and Human Services. (2011). Healthy People 2020 Summary of Objectives - Diabetes. Retrieved from http://www.healthypeople.gov/2020/topicsobjectives2020/pdfs/Diabetes.pdf.
13. Franz M, Powers A, Leontos C, et al. (2010). The evidence for medical nutrition therapy for type 1 and type 2 diabetes in adults. Journal of American Dietetic Association, 10, 1852-1889.
14. Keener D, Goodman K, Lowry A, Zaro S, Kettel Khan L. (2009). Recommended Community Strategies and Measurements to Prevent Obesity in the United States: Implementation and Measurement Guide. Atlanta, GA: U.S. Department of Health and Human Services, Centers for Disease Control and Prevention.
15. Xu J, Kochanek KD, Murphy SL, Tejada-Vera B. (2010). Deaths: Final data for 2007. National Vital Statistics Reports, 58(19), 1-15.
16. Centers for Disease Control and Prevention (CDC). (2011). National Diabetes Fact Sheet: National Estimates and General Information on Diabetes and Prediabetes in the United States. Atlanta, GA: U.S. Department of Health and Human Services, Centers for Disease Control and Prevention.
17. Indian Health Service Division of Diabetes Treatment and Prevention. (2008). Special Diabetes Program for Indians: Reducing the Risk of Cardiovascular Disease. Retrieved from http://www.ihs.gov/MedicalPrograms/Diabetes/HomeDocs/Resources/FactSheets/ClinicalOutcomesCVD08.pdf.
18. U.S. Preventive Services Task Force. (2009). Aspirin for the Prevention of Cardiovascular Disease: Recommendation Statement. Retrieved from http://www.uspreventiveservicestaskforce.org/uspstf09/aspirincvd/aspcvdrs.htm.
19. American Diabetes Association (ADA). (2010). Standards of Medical Care in Diabetes - 2010. Diabetes Care, 33(Supplement 1), S11-S61.
20. National Institute of Diabetics and Digestive and Kidney Diseases. (2010). Patients and Public: About Kidney Disease. Retrieved from http://nkdep.nih.gov/patients/kidney_disease_information.htm.
21. Indian Health Service Division of Diabetes Treatment and Prevention. (2011). Indian Health Diabetes Best Practice: Screening for Chronic Kidney Disease. Albuquerque, NM: U.S. Department of Health and Human Services.
22. Friedman E, Friedman A. (2006). Payment for donor kidneys: Pros and cons. Kidney International, 69, 960-962. 23. Katon W. (2008). The comorbidity of diabetes mellitus and depression. The American Journal of Medicine,
121(11 Suppl 2), S8-S15. 24. Calhoun D, Beals J, Carter EA, et al. (2010). Relationship between glycemic control and depression among
American Indians in the Strong Heart Study. Journal of Diabetes Complications, 24(4), 217-222. 25. Grandy S, Chapman R, Fox K. (2008). Quality of life and depression of people living with type 2 diabetes
mellitus and those at low and high risk for type 2 diabetes: Findings from the Study to Help Improve Early Evaluation and Management of Risk Factors Leading to Diabetes (SHIELDS). International Journal of Clinical Practice, 64(4), 562-568.

REFERENCES
44 Urban Diabetes Care and Outcomes Audi t Repor t : 2007 -2011
26. Indian Health Service Division of Diabetes Treatment and Prevention. (2011). Indian Health Diabetes Best Practice: Eye Care. Albuquerque, NM: U.S. Department of Health and Human Services.
27. Taylor H, Vu H, McCarty C, Keefe J. (2004). The need for routine eye examinations. Investigations in Ophthalmology and Visual Science, 45, 2539-2542.
28. Lauterbach S, Kostev K, Kohlmann T. (2010). Prevalence of diabetic foot syndrome and its risk factors in the UK. Journal of Wound Care, 19(8), 333-337.
29. American Diabetes Association (ADA). (2011). Diabetes and Oral Health Problems. Retrieved from http://www.diabetes.org/living-with-diabetes/treatment-and-care/oral-health-and-hygiene/diabetes-and-oral.html.
30. Indian Health Service Division of Diabetes Treatment and Prevention. (2011). Indian Health Diabetes Best Practice: Oral Health Care. Albuquerque, NM: U.S. Department of Health and Human Services.

Urban Diabetes Care and Outcomes Audi t Report : 2007-2011 45
Page intentionally left blank.

Urban Diabetes Care and Outcomes Audi t Report : 2007-2011
Related Documents