INTERNATIONAL JOURNAL OF CLIMATOLOGY Int. J. Climatol. 27: 1875–1885 (2007) Published online 18 June 2007 in Wiley InterScience (www.interscience.wiley.com) DOI: 10.1002/joc.1523 Urban climatology in arid regions: current research in the Negev desert D. Pearlmutter, a * P. Berliner a and E. Shaviv b a J. Blaustein Institutes for Desert Research, Ben-Gurion University of the Negev, Sede-Boqer Campus 84990 Israel b Faculty of Architecture and Town Planning, Technion-Israel Institute of Technology, Haifa 32000, Israel Abstract: Desert cities provide climatologists with circumstances that can be qualitatively different from those encountered in more temperate environs. These distinctions are expressed in the balance of heat and moisture between a dry atmosphere and an urbanized terrain, and they are experienced by city dwellers in urban outdoor spaces. But, while such places are characterized by harsh thermal extremes, they also present unique opportunities for microclimatic enhancement. This potential has motivated a series of studies in the arid Negev region of Israel, beginning with a measurement campaign showing that a dense urban fabric can provide significant thermal benefits due to protection from solar radiation, which is dominant within the overall energy exchange. To generalize these findings, an innovative modelling approach – using an open-air, scaled urban array – was used to study variations in urban geometry under realistic radiative loading and boundary-layer turbulence. The surface energy budget above this small-scale urban canopy was found to be similar to observed energy exchange patterns of actual cities. Measurements within the scaled urban canyons served as input to a pedestrian-centred energy exchange model, and a semi-empirical model was also developed for predicting pedestrian energy exchange and thermal discomfort as a function of urban attributes and meteorological data for a given land-use area. This integrated modelling approach revealed that increased urban density, while serving to increase radiative trapping and storage of heat within the urban fabric, also reduces pedestrian thermal stress during the critical daytime hours. This ‘cool island’ effect is enabled by the high thermal inertia of the built-up area, and the sharp diurnal fluctuations that are peculiar to a hot–arid climate. Its impact is contingent, however, upon the orientation of the street canyon in question – increasing as street-axis orientation approaches north–south and becoming negligible in the east–west direction. Copyright 2007 Royal Meteorological Society KEY WORDS arid regions; urban microclimate; human comfort; scale modelling; street design Received 15 September 2006; Revised 6 February 2007; Accepted 13 February 2007 INTRODUCTION Although about one-third of the earth’s land surface is covered by desert, arid regions have not often been the focus of urban climate research. This may seem natural, since deserts tend to be sparsely populated, and most of the major cities are indeed located in more temperate climatic zones. In recent decades, however, this balance has begun to shift: in the year 2000, the population of ‘drylands,’ which encompass not only deserts but also adjacent areas threatened by desertification, constituted over a third of humanity, with nearly 45% of this population already living in cities – and, in keeping with global trends, the proportion is expected to reach over 50% by 2010, and 60% by 2030 (Millenium Ecosystem Assessment, 2005). * Correspondence to: D. Pearlmutter, J. Blaustein Institutes for Desert Research, Ben-Gurion University of the Negev, Sede-Boqer Campus 84990 Israel. E-mail: [email protected] Sustaining an acceptable quality of life for this growing population may depend, to a critical extent, on our understanding of the climatic modifications induced by urbanization. It is imperative, then, to firstly recognize the qualitative differences between arid and non-arid environments: (1) Aridity is most commonly defined by a low ratio of precipitation (P) to potential evapotranspiration (PET). Characteristic threshold values of P/PET are 0.2–0.5 for semi-arid, 0.03–0.2 for arid, and below this for hyperarid regions (Bruins and Berliner, 1998). When dry sub-humid regions are included under the broader definition of ‘drylands,’ such arid or potentially arid zones account for over 40% of the world’s land area and contain over a third of its population (most of which will be urban in the coming decades). The daytime levels of relative humidity in an arid region may be significantly lower than what is experienced in surrounding non-arid areas. Copyright 2007 Royal Meteorological Society

Welcome message from author
This document is posted to help you gain knowledge. Please leave a comment to let me know what you think about it! Share it to your friends and learn new things together.
Transcript
INTERNATIONAL JOURNAL OF CLIMATOLOGYInt. J. Climatol. 27: 1875–1885 (2007)Published online 18 June 2007 in Wiley InterScience(www.interscience.wiley.com) DOI: 10.1002/joc.1523
Urban climatology in arid regions: current research in theNegev desert
D. Pearlmutter,a* P. Berlinera and E. Shavivb
a J. Blaustein Institutes for Desert Research, Ben-Gurion University of the Negev, Sede-Boqer Campus 84990 Israelb Faculty of Architecture and Town Planning, Technion-Israel Institute of Technology, Haifa 32000, Israel
Abstract:
Desert cities provide climatologists with circumstances that can be qualitatively different from those encountered in moretemperate environs. These distinctions are expressed in the balance of heat and moisture between a dry atmosphere andan urbanized terrain, and they are experienced by city dwellers in urban outdoor spaces. But, while such places arecharacterized by harsh thermal extremes, they also present unique opportunities for microclimatic enhancement.
This potential has motivated a series of studies in the arid Negev region of Israel, beginning with a measurement campaignshowing that a dense urban fabric can provide significant thermal benefits due to protection from solar radiation, whichis dominant within the overall energy exchange. To generalize these findings, an innovative modelling approach – usingan open-air, scaled urban array – was used to study variations in urban geometry under realistic radiative loading andboundary-layer turbulence. The surface energy budget above this small-scale urban canopy was found to be similar toobserved energy exchange patterns of actual cities.
Measurements within the scaled urban canyons served as input to a pedestrian-centred energy exchange model, and asemi-empirical model was also developed for predicting pedestrian energy exchange and thermal discomfort as a functionof urban attributes and meteorological data for a given land-use area.
This integrated modelling approach revealed that increased urban density, while serving to increase radiative trapping andstorage of heat within the urban fabric, also reduces pedestrian thermal stress during the critical daytime hours. This ‘coolisland’ effect is enabled by the high thermal inertia of the built-up area, and the sharp diurnal fluctuations that are peculiarto a hot–arid climate. Its impact is contingent, however, upon the orientation of the street canyon in question – increasingas street-axis orientation approaches north–south and becoming negligible in the east–west direction. Copyright 2007Royal Meteorological Society
KEY WORDS arid regions; urban microclimate; human comfort; scale modelling; street design
Received 15 September 2006; Revised 6 February 2007; Accepted 13 February 2007
INTRODUCTION
Although about one-third of the earth’s land surface iscovered by desert, arid regions have not often been thefocus of urban climate research. This may seem natural,since deserts tend to be sparsely populated, and most ofthe major cities are indeed located in more temperateclimatic zones. In recent decades, however, this balancehas begun to shift: in the year 2000, the population of‘drylands,’ which encompass not only deserts but alsoadjacent areas threatened by desertification, constitutedover a third of humanity, with nearly 45% of thispopulation already living in cities – and, in keeping withglobal trends, the proportion is expected to reach over50% by 2010, and 60% by 2030 (Millenium EcosystemAssessment, 2005).
* Correspondence to: D. Pearlmutter, J. Blaustein Institutes for DesertResearch, Ben-Gurion University of the Negev, Sede-Boqer Campus84990 Israel. E-mail: [email protected]
Sustaining an acceptable quality of life for this growingpopulation may depend, to a critical extent, on ourunderstanding of the climatic modifications induced byurbanization. It is imperative, then, to firstly recognizethe qualitative differences between arid and non-aridenvironments:
(1) Aridity is most commonly defined by a low ratioof precipitation (P) to potential evapotranspiration(PET). Characteristic threshold values of P/PET are0.2–0.5 for semi-arid, 0.03–0.2 for arid, and belowthis for hyperarid regions (Bruins and Berliner,1998). When dry sub-humid regions are includedunder the broader definition of ‘drylands,’ such aridor potentially arid zones account for over 40% ofthe world’s land area and contain over a third ofits population (most of which will be urban in thecoming decades). The daytime levels of relativehumidity in an arid region may be significantly lowerthan what is experienced in surrounding non-aridareas.
Copyright 2007 Royal Meteorological Society
1876 D. PEARLMUTTER, P. BERLINER AND E. SHAVIV
(2) Atmospheric conditions in most deserts are domi-nated by clear skies and intense radiative exchanges.Extraordinary solar gains by day are balanced bynocturnal long-wave losses, resulting in a pattern ofthermal extremes over the daily and seasonal cycles.
(3) A scarcity of moisture is most often reflected insparse vegetation, which substantially changes thecharacteristics of the natural terrain surroundingdesert cities. High albedo, strong winds, unstableor encrusted soils, and frequent sand or dust stormstypify arid-region landscapes.
A number of consequences arise, for planners as wellas urban climatologists, from these order-of-magnitudevariations in regional climate. From an urban energybalance point of view, the proportion of surface heatloss due to evaporation tends to be considerably smallerthan in temperate or humid regions. In the desert cityof Mexicali (in northern Mexico, at 32 °N latitude), thelatent heat loss component was found by Garcia-Cuetoet al. (2003) to account for only slightly over 10% ofthe net radiation income, and this component was foundto be less than 5% by Oke et al. (1999) in Mexico City(though, in the latter case, this is due more to the absenceof vegetation and moisture sources within the large citycentre than to the aridity of the regional climate). Thismay be compared with a daytime range of 25–35%typically recorded for North American sub-urban areas,including in desert cities such as Tucson, Arizona. Thelatter case indicates that local urban landscape irrigationresults in a significant modification of the urban energybalance, and when absent can result in significantly lowerproportions of latent heat loss – as illustrated by lowerlevels recorded during an irrigation ban, and by the10% daytime rate measured in a light industrial areaof Vancouver, which is located in a much wetter region(Grimmond and Oke, 1999).
In a dry desert terrain, cities may be more highlyvegetated than their surroundings – reversing the typi-cal urban scenario in which a relative lack of transpiringvegetation and available moisture, as well as soil ‘water-proofing,’ are counted among the causes of the urbanheat island (UHI). Evidence for the type of ‘cool island’effect, which this might cause, has been found in Phoenix,Arizona, but predominantly as a daytime phenomenonrather than a nocturnal one (Brazel et al., 2000; 2003).Other studies in the American southwest (Comrie, 2000)and in the Middle East (Nasrallah et al., 1990; Sofer andPotchter, 2006) have provided in-depth analyses of theheat island characteristics in arid-zone cities, and shownthat local-scale features – especially involving vegetationdensity and water bodies – can significantly modify thestructure and timing of the UHI.
From the point of view of an urban inhabitant atground level, the special attributes of an arid environmenthave added significance. Owing to the high intensity ofsolar radiation and high daytime temperatures, thermalcomfort conditions within the urban canopy may beuncharacteristically harsh. But, given the low humidity,
sharp diurnal temperature fluctuations, and frequencyof strong winds, they may also be uncharacteristic intheir potential for improvement through responsive urbandesign.
This potential has been underlined by the experimentalresults of several recent studies (Ali-Toudert et al., 2005;Johansson, 2006), indicating that a compactly built urbanenvironment can have advantages for pedestrian comfortunder hot–dry conditions.
It is this possibility – of creating ‘cool islands,’ whichis expressed in terms of overall pedestrian thermalcomfort, rather than in terms of temperature alone, whichhas motivated a series of studies in the arid Negev regionof southern Israel. The premise for these investigations isthat, by easing harsh outdoor conditions, it is possible tomake streets more amenable for pedestrians. This wouldnot only improve the quality of the urban environmentin arid regions but could also contribute indirectly toenvironmental quality in a larger sense, by lesseningthe ever-increasing dependence on energy-intensive air-conditioned vehicles and interior spaces.
URBAN CLIMATE STUDIES IN THE NEGEVDESERT
Research in the arid Negev region of southern Israel wasinitiated with the aim of developing a predictive modelthat could be applied by architects in the design of newurban spaces, enabling them to compare different urbandesign options (i.e. street proportions and orientation)in terms of their microclimatic ‘quality’ – as expressedby the level of thermal comfort that the space could beexpected to provide.
Urban field studies
The integrated effect of urban surface geometry on pedes-trian thermal comfort in the Negev desert was firstaddressed in a field study by Pearlmutter et al. (1999). Anextensive measurement campaign was conducted withina residential area (in the city of Dimona, 31°N latitudeand 600 m elevation) composed of low-rise, high-densityrow house buildings and attached walled courtyards, witha grid of narrow pedestrian streets dividing the rows.Building height and street width were both approximately3 m, yielding a height/width (H/W) ratio of 1.0. Microcli-matic variables were monitored within two perpendicularstreets, whose axes were approximately east–west andnorth–south, respectively, and were compared with fullyexposed conditions above the contiguous flat roofs.
The study’s results showed that relatively warm airis indeed found within the narrow pedestrian streetsduring the peak hours of a summer day, and windspeed is systematically reduced in the constricted spaces.However, more telling was the pattern of overall thermalstress that was revealed when calculating the overallenergy balance of a pedestrian: despite any observedincrease in air temperature or reduction in wind speed,a pedestrian inevitably absorbed less thermal energy
Copyright 2007 Royal Meteorological Society Int. J. Climatol. 27: 1875–1885 (2007)DOI: 10.1002/joc
URBAN CLIMATOLOGY IN ARID REGIONS 1877
in a compact street canyon than when standing in theopen, regardless of street orientation. This is naturally afunction of direct shading from the intense desert sun,though contributing factors include reductions in diffusesky radiation from the sky and in long-wave radiationemitted from paved surfaces – which are heated by thesun to temperatures far higher than any vertical wall.Only at night, when thermal discomfort is less of aconcern, was relative warming observed due to restrictedairflow and radiant emission from building mass due tothe lower sky view factor.
The monitoring study thus provided direct evidence ofclimatic modification in a dense urban fabric under aridconditions – but it also highlighted some of the inher-ent limitations of conventional research methods. Owingto the complexity of actual cities, it is impractical todirectly measure the effects of systematic variations inurban features such as street canyon geometry. Mathe-matical modelling, on the other hand, offers the flexibilityto evaluate a wide range of urban configurations, thoughnumerical models generally rely on simplified expres-sions of the energetic processes involved. In particular,the challenge remains of establishing the linkage betweenmicroclimatic variations within the canopy and ‘ambient’conditions in the overlying urban boundary layer – whichis essential to much urban climate modelling (Taha andBornstein, 1999; Masson et al., 2002).
Therefore, physical hardware modelling is still con-sidered a valuable tool for characterizing the effects ofdetailed urban features and for validating the predictionsmade by mathematical models. Since hardware modellingtechniques typically isolate a particular process, however,such as airflow in a wind tunnel, they cannot replicate thecomplex interactions with other processes such as radi-ation and heat storage or the linkages between canopy-layer climate and the atmosphere above.
Open-air physical modelling
These limitations were addressed in the development ofan open-air, scale-modelled urban fabric, which allowsfor the simultaneous observation of different microcli-matic parameters under actual climatic conditions, andover a wide range of physical configurations. The modelis composed of 20 × 20 cm hollow concrete blocksarranged in rows on bare loess soil, representing scaledschematic buildings. Together with the linear spacesbetween them, these block rows represent a texturedurban ‘surface’ which was used to quantify urban energyexchanges at two levels: (1) between an urban surfaceand the atmosphere, as represented by climatic measure-ments in the inertial sub-layer (ISL) above the urbancanopy (Pearlmutter et al., 2005) and (2) between apedestrian and the urban environment, as represented byclimatic data measured within the urban canopy layer(UCL) in scaled street canyons of varying geometry(Pearlmutter et al., 2006).
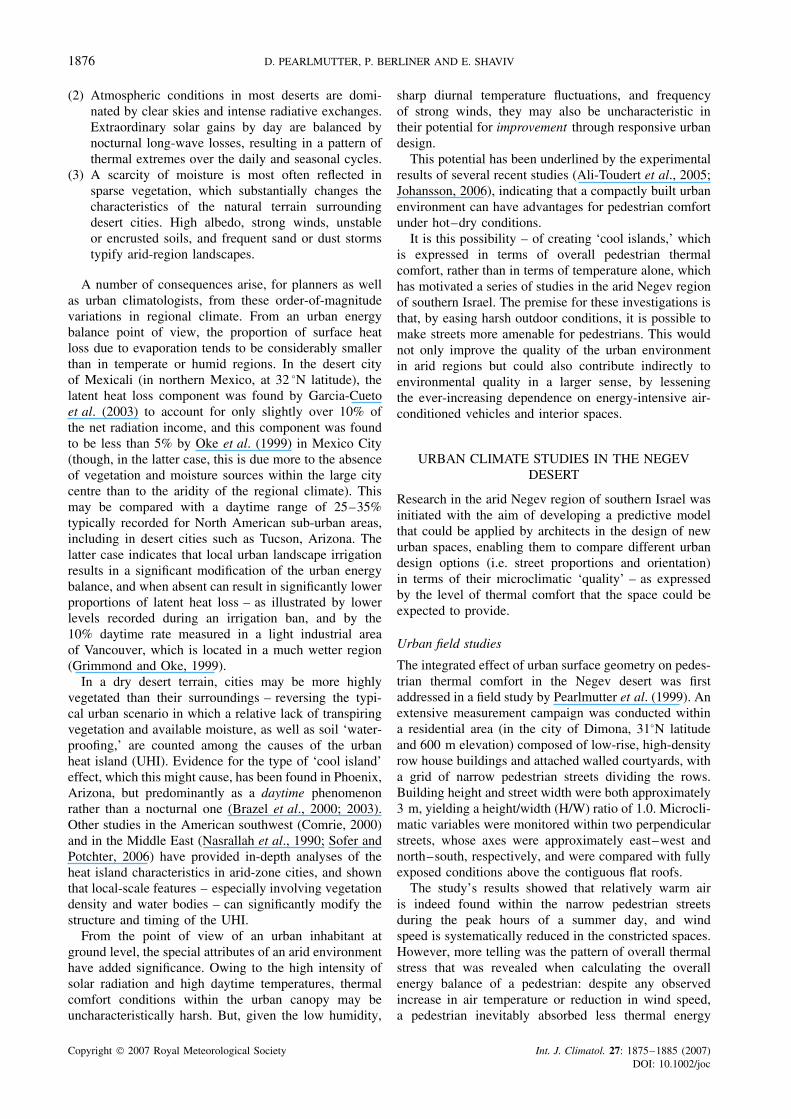
In order to achieve this, the physical model wasconceived with two general components (Figures 1–2).
The upwind section is a regular array of block rows,uniform in their height and spacing, whose linear axesare aligned in a direction perpendicular to the prevailingnorthwesterly wind. This array provides a sufficientupwind fetch for the adaptation of wind flow to the‘urban-like’ roughness, and generates an ISL above theurban canopy in which the measured surface-atmosphereenergy balance is representative of an actual urbansituation. Downwind of this regular array is the centralpart of the scale model, consisting of ‘street canyons,’which vary in their local geometry and within whichmicroclimatic measurements were taken. Each streetcanyon is defined in section by its vertical (concreteblock) wall facets and horizontal (compacted soil) groundfacet, whose albedos are similar to those of common localmaterials.
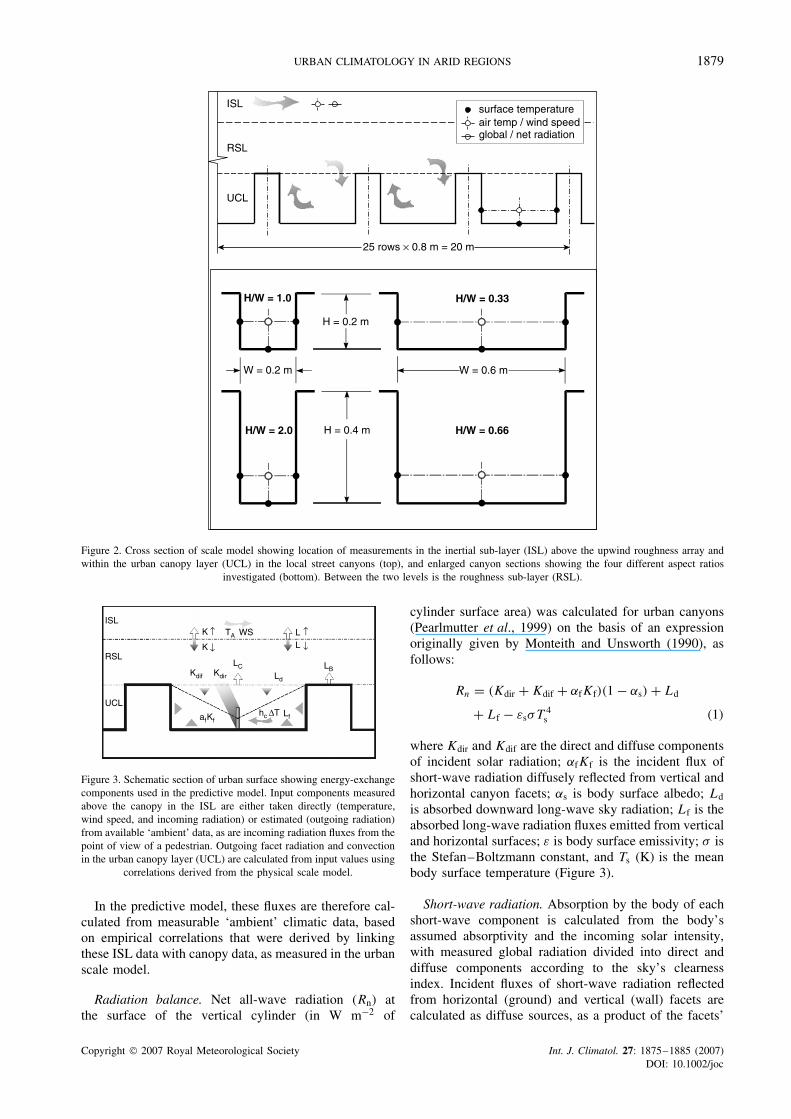
The surface geometry of the upwind roughness arrayis described by its frontal area density (the ratio betweenthe windward building facade area and horizontal groundarea), which was 0.2 for a single-height array and 0.4when building height was doubled. For local variationsin street canyon geometry, model configurations com-pared included single-height streets with H/W ratios of0.33 and 1.0, and double-height streets with H/W = 0.66and 2.0. For each of these four sectional proportions,street axis orientations included north–south (‘N–S’),east–west (‘E–W’) northwest–southeast (‘PARAL’) andnortheast–southwest (‘PERP’), the latter pair represent-ing canyons whose axes are parallel and perpendicular,respectively, to the prevailing northwesterly wind.
Microclimatic variables were measured within themodel urban canopy as input for describing the thermalenvironment experienced by a pedestrian in each streetcanyon, and above the upwind roughness array fordescribing ‘ambient’ conditions within the constant-fluxISL above the canopy (Figures 1–2).
The similarity of the scale model to a realistic urbanscenario was validated in a number of ways, indicatingthat the scale model is capable of reproducing thermody-namic processes, which are analogous to those occurringat full scale.
Firstly, the model’s overall thermal inertia, as deter-mined by its surface heat capacity as well as its dis-tribution of thermal mass between building and groundsurfaces, was quantified and found to be similar to thatof the high-density low-rise neighbourhood studied ear-lier by Pearlmutter et al. (1999). To verify aerodynamicsimilarity at the level of the urban surface, vertical pro-files of wind speed were measured above the scaledcanopy and an ISL (which is characterized by a semi-logarithmic profile) was identified at a height rangingbetween two and five times the canopy height. On thebasis of the measurements within this layer, the relativeproportions and diurnal patterns of overall urban surfacefluxes were found to be highly representative of thoseobserved above actual cities (Pearlmutter et al., 2005).Finally, ground and wall surface temperatures and pedes-trian energy exchange patterns within the scaled streets
Copyright 2007 Royal Meteorological Society Int. J. Climatol. 27: 1875–1885 (2007)DOI: 10.1002/joc
1878 D. PEARLMUTTER, P. BERLINER AND E. SHAVIV
Figure 1. Experimental layout showing the upwind roughness array and area of local street canyons (top), including location of measurements(bottom).
were compared with their full-scale urban counterpartsand found to be highly similar (Pearlmutter et al., 2006).
Modelling of pedestrian energy exchange
While such detailed descriptions of street-level microcli-mate are difficult to attain for existing urban settings (andall the more so for urban design projects, which have yetto be realized), climatic data representing the prevailing,or ‘ambient’ meteorological conditions (i.e. solar radia-tion, air temperature, humidity, and wind speed) abovean urban area of given land-use and density are muchmore readily obtainable. Thus, data from within and fromabove the scale-modelled street array were combinedin a semi-empirical model, which allows the predictionof pedestrian energy exchange within street canyons of
given geometry based on ambient conditions above theurban canopy.
In this way, data measured in the physical model wereused both directly, and indirectly through empirical cor-relations, to calculate the energy balance of a cylindricalbody representing a pedestrian in the street (Figure 3).The exposure of a pedestrian to direct (Kdir) and dif-fuse (Kdif) short-wave radiation, as well as long-wave skyradiation (Ld), may be readily calculated from measuredclimatic data at a given urban site if the geometry of aplanned space is known. However, the fluxes of short-wave radiation reflected from canyons based on theirsurface albedo (αf Kf ), and long-wave radiation emittedfrom these facets based on their radiant surface tempera-tures (Lf), as well as convection based on air temperatureand wind speed (hc�T ), are considered unknown.
Copyright 2007 Royal Meteorological Society Int. J. Climatol. 27: 1875–1885 (2007)DOI: 10.1002/joc
URBAN CLIMATOLOGY IN ARID REGIONS 1879
UCL
RSL
ISL
25 rows × 0.8 m = 20 m
surface temperatureair temp / wind speedglobal / net radiation
H/W = 0.33
H/W = 0.66H/W = 2.0
H/W = 1.0
H = 0.2 m
H = 0.4 m
W = 0.6 mW = 0.2 m
Figure 2. Cross section of scale model showing location of measurements in the inertial sub-layer (ISL) above the upwind roughness array andwithin the urban canopy layer (UCL) in the local street canyons (top), and enlarged canyon sections showing the four different aspect ratios
investigated (bottom). Between the two levels is the roughness sub-layer (RSL).
LBLd
RSL
UCL
ISL
Lf
LL
afKf
LCKdif Kdir
hc ∆T
TA
K
K ↑
↑
↑
↑
WS
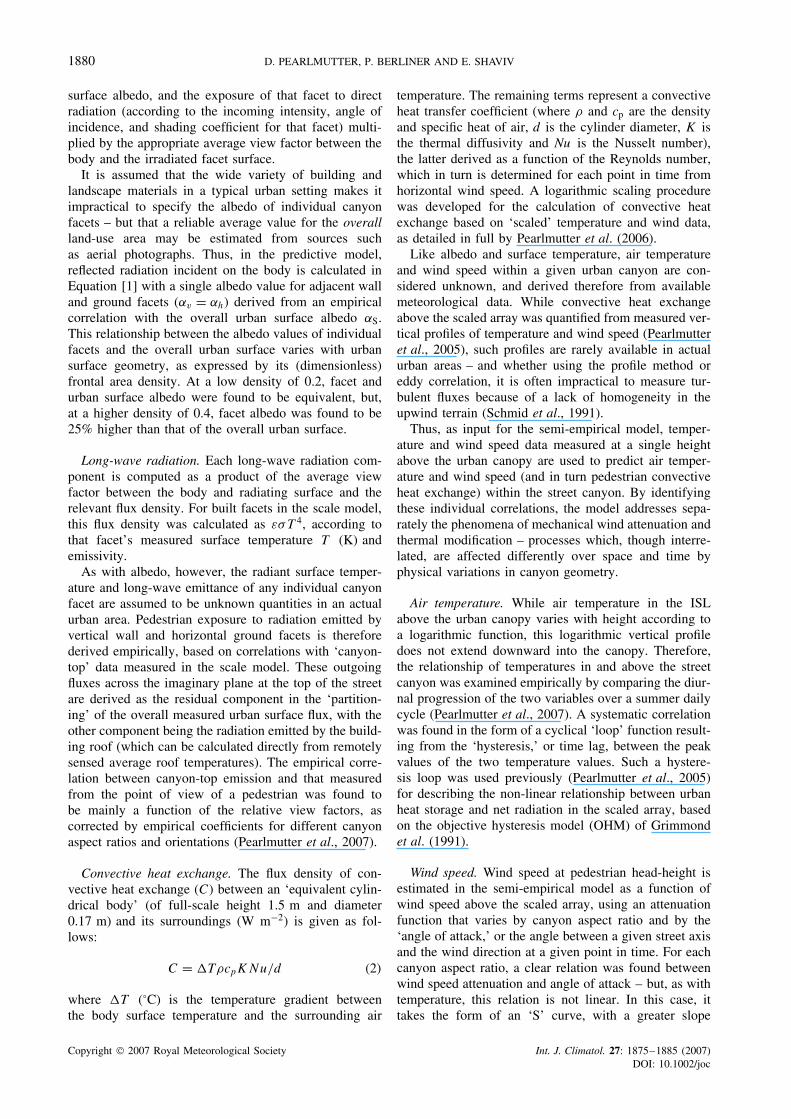
Figure 3. Schematic section of urban surface showing energy-exchangecomponents used in the predictive model. Input components measuredabove the canopy in the ISL are either taken directly (temperature,wind speed, and incoming radiation) or estimated (outgoing radiation)from available ‘ambient’ data, as are incoming radiation fluxes from thepoint of view of a pedestrian. Outgoing facet radiation and convectionin the urban canopy layer (UCL) are calculated from input values using
correlations derived from the physical scale model.
In the predictive model, these fluxes are therefore cal-culated from measurable ‘ambient’ climatic data, basedon empirical correlations that were derived by linkingthese ISL data with canopy data, as measured in the urbanscale model.
Radiation balance. Net all-wave radiation (Rn) atthe surface of the vertical cylinder (in W m−2 of
cylinder surface area) was calculated for urban canyons(Pearlmutter et al., 1999) on the basis of an expressionoriginally given by Monteith and Unsworth (1990), asfollows:
Rn = (Kdir + Kdif + αfKf)(1 − αs) + Ld
+ Lf − εsσT 4s (1)
where Kdir and Kdif are the direct and diffuse componentsof incident solar radiation; αfKf is the incident flux ofshort-wave radiation diffusely reflected from vertical andhorizontal canyon facets; αs is body surface albedo; Ld
is absorbed downward long-wave sky radiation; Lf is theabsorbed long-wave radiation fluxes emitted from verticaland horizontal surfaces; ε is body surface emissivity; σ isthe Stefan–Boltzmann constant, and Ts (K) is the meanbody surface temperature (Figure 3).
Short-wave radiation. Absorption by the body of eachshort-wave component is calculated from the body’sassumed absorptivity and the incoming solar intensity,with measured global radiation divided into direct anddiffuse components according to the sky’s clearnessindex. Incident fluxes of short-wave radiation reflectedfrom horizontal (ground) and vertical (wall) facets arecalculated as diffuse sources, as a product of the facets’
Copyright 2007 Royal Meteorological Society Int. J. Climatol. 27: 1875–1885 (2007)DOI: 10.1002/joc
1880 D. PEARLMUTTER, P. BERLINER AND E. SHAVIV
surface albedo, and the exposure of that facet to directradiation (according to the incoming intensity, angle ofincidence, and shading coefficient for that facet) multi-plied by the appropriate average view factor between thebody and the irradiated facet surface.
It is assumed that the wide variety of building andlandscape materials in a typical urban setting makes itimpractical to specify the albedo of individual canyonfacets – but that a reliable average value for the overallland-use area may be estimated from sources suchas aerial photographs. Thus, in the predictive model,reflected radiation incident on the body is calculated inEquation [1] with a single albedo value for adjacent walland ground facets (αv = αh) derived from an empiricalcorrelation with the overall urban surface albedo αS.This relationship between the albedo values of individualfacets and the overall urban surface varies with urbansurface geometry, as expressed by its (dimensionless)frontal area density. At a low density of 0.2, facet andurban surface albedo were found to be equivalent, but,at a higher density of 0.4, facet albedo was found to be25% higher than that of the overall urban surface.
Long-wave radiation. Each long-wave radiation com-ponent is computed as a product of the average viewfactor between the body and radiating surface and therelevant flux density. For built facets in the scale model,this flux density was calculated as εσT 4, according tothat facet’s measured surface temperature T (K) andemissivity.
As with albedo, however, the radiant surface temper-ature and long-wave emittance of any individual canyonfacet are assumed to be unknown quantities in an actualurban area. Pedestrian exposure to radiation emitted byvertical wall and horizontal ground facets is thereforederived empirically, based on correlations with ‘canyon-top’ data measured in the scale model. These outgoingfluxes across the imaginary plane at the top of the streetare derived as the residual component in the ‘partition-ing’ of the overall measured urban surface flux, with theother component being the radiation emitted by the build-ing roof (which can be calculated directly from remotelysensed average roof temperatures). The empirical corre-lation between canyon-top emission and that measuredfrom the point of view of a pedestrian was found tobe mainly a function of the relative view factors, ascorrected by empirical coefficients for different canyonaspect ratios and orientations (Pearlmutter et al., 2007).
Convective heat exchange. The flux density of con-vective heat exchange (C) between an ‘equivalent cylin-drical body’ (of full-scale height 1.5 m and diameter0.17 m) and its surroundings (W m−2) is given as fol-lows:
C = �TρcpKNu/d (2)
where �T (°C) is the temperature gradient betweenthe body surface temperature and the surrounding air
temperature. The remaining terms represent a convectiveheat transfer coefficient (where ρ and cp are the densityand specific heat of air, d is the cylinder diameter, K isthe thermal diffusivity and Nu is the Nusselt number),the latter derived as a function of the Reynolds number,which in turn is determined for each point in time fromhorizontal wind speed. A logarithmic scaling procedurewas developed for the calculation of convective heatexchange based on ‘scaled’ temperature and wind data,as detailed in full by Pearlmutter et al. (2006).
Like albedo and surface temperature, air temperatureand wind speed within a given urban canyon are con-sidered unknown, and derived therefore from availablemeteorological data. While convective heat exchangeabove the scaled array was quantified from measured ver-tical profiles of temperature and wind speed (Pearlmutteret al., 2005), such profiles are rarely available in actualurban areas – and whether using the profile method oreddy correlation, it is often impractical to measure tur-bulent fluxes because of a lack of homogeneity in theupwind terrain (Schmid et al., 1991).
Thus, as input for the semi-empirical model, temper-ature and wind speed data measured at a single heightabove the urban canopy are used to predict air temper-ature and wind speed (and in turn pedestrian convectiveheat exchange) within the street canyon. By identifyingthese individual correlations, the model addresses sepa-rately the phenomena of mechanical wind attenuation andthermal modification – processes which, though interre-lated, are affected differently over space and time byphysical variations in canyon geometry.
Air temperature. While air temperature in the ISLabove the urban canopy varies with height according toa logarithmic function, this logarithmic vertical profiledoes not extend downward into the canopy. Therefore,the relationship of temperatures in and above the streetcanyon was examined empirically by comparing the diur-nal progression of the two variables over a summer dailycycle (Pearlmutter et al., 2007). A systematic correlationwas found in the form of a cyclical ‘loop’ function result-ing from the ‘hysteresis,’ or time lag, between the peakvalues of the two temperature values. Such a hystere-sis loop was used previously (Pearlmutter et al., 2005)for describing the non-linear relationship between urbanheat storage and net radiation in the scaled array, basedon the objective hysteresis model (OHM) of Grimmondet al. (1991).
Wind speed. Wind speed at pedestrian head-height isestimated in the semi-empirical model as a function ofwind speed above the scaled array, using an attenuationfunction that varies by canyon aspect ratio and by the‘angle of attack,’ or the angle between a given street axisand the wind direction at a given point in time. For eachcanyon aspect ratio, a clear relation was found betweenwind speed attenuation and angle of attack – but, as withtemperature, this relation is not linear. In this case, ittakes the form of an ‘S’ curve, with a greater slope
Copyright 2007 Royal Meteorological Society Int. J. Climatol. 27: 1875–1885 (2007)DOI: 10.1002/joc
URBAN CLIMATOLOGY IN ARID REGIONS 1881
at intermediate oblique angles than at near-parallel ornear-perpendicular ones. This general function was foundto follow a logistic distribution, while for each canyonaspect ratio the predicted attenuation was derived fromthis general curve by applying a best-fit relation, whichexpresses the initial attenuation for along-canyon flowand the sensitivity of attenuation to increasing attackangle (Pearlmutter et al., 2007).
It was found that the semi-empirical model pro-vides accurate predictions of overall pedestrian energyexchange, deviating by less than 20 W m−2 (or under10%) from values directly measured in the scaledcanyons. In this way, a reliable form of ‘linkage’ wasmade between boundary-layer urban energy exchangeat the scale of a local land-use area, and canopy-layerenergy exchange at the micro-scale level of a pedestrianin the street.
URBAN GEOMETRY AND THERMAL STRESS
In order to express this linkage in terms that are morerelevant to planners, the prediction of pedestrian energyexchange was refined using a biometeorological comfortmodel. The well-known index of thermal stress (ITS)developed by Givoni (1963, 1976) was selected for itsdual benefits: firstly, it combines bodily heat exchangesby radiation and convection with the effects of humidityand evaporative heat loss and, secondly, its results allowfor a correlation between physiological energy exchangeand thermal sensation, which is a more direct measureof human thermal comfort. While the ITS has not been
used extensively in urban studies, it is a comprehensivephysiological index relating directly to physical energyexchange (Vogt et al., 1981; Auluciems and Szokolay,1997).
The ITS is based on the assumption that, under warmconditions, the human body attempts to maintain thermalequilibrium with the environment through evaporativecooling, particularly by the production of sweat – andthat the required rate of sweating may serve as an indi-cation of the overall thermal stress to which the body issubjected. The body regulates sweat secretion at a raterequired to offset both internal metabolic heat produc-tion (which can be considered a constant for a particularlevel of activity), and heat gain from the environmentdue radiation and convection. The one additional environ-mental variable that must be accounted for is the mois-ture content, or humidity, of the surrounding air, whichdetermines the efficiency at which evaporative coolingis generated by sweat secretion. The calculated index,then, expresses the equivalent latent heat (in total watts,accounting for the surface area of the body) of the sweatthat must be secreted in order to maintain equilibriumthrough evaporation, and input to the model consists bothof the radiative and convective fluxes described previ-ously, and of the relative humidity, which determines theefficiency of evaporative heat loss (a detailed descriptionof the model is given by Pearlmutter et al., (2007)).
In a series of empirical experiments carried out byGivoni (1963), values of ITS were correlated with subjec-tive thermal sensation, as perceived by test groups sub-jected to carefully monitored conditions. In these studies,
N-S PERP
0
3
6
9
12
15
18
21
24
0.33 1.0 2.0 0.66 2.0 0.66 1.0 0.66 1.0
4-comfortable 5-warm 6-hot 7-very hot
ho
ur
400 W
4 5 Thermal Sensation Scale:
4
44 4 4 4 4 4 4 4 4 4 4 4 4 4 4 44 4 4 4 4 4 4 4 4 4 4 4 4 4 4 44 4 4 4 4 4 4 4 4 4 4 4 4 4 4 44 4 4 4 4 4 4 4 4 4 4 4 4 4 4 44 4 4 4 4 4 4 4
44 4 4 4 4 4 4
4 4 4 4 4 4 4 44
4 4 4 4 4 4 4
4 4 4 4 4 4 4 4 4 4 4 4 4 4 4
44 4 4 4 4 4 4 4 4 4 4 4 4 4 4 44 4 4 4 4 4 4 4 4 4 4 4 4 4 4 44 4 4 4 4 4 4 4 4 4 4 4 4 4 4 44 4 4 4 4 4 4 4 4 4 4 4 4 4 4 44 4 4 4 4 4 4 4 4 4 4 4 4 4 4 4
4 4 4 4 4 4 4 4 4 4 4 4 4 4 44 4 4 4 4 4 4 4 4 4 4 4 4 4 4
4 555
56 7 7 7 7 5 5 4 7 6 5 4 7 7 5 4
66 5 5 4 4 4 6 4 4 4 6 4 4 4
45
6 6 6 66 6 6 66 6
4 4 45 46 6 57 7 67 7 6
4 4 45 46 6 67 7 67 7
5 4 4 46 47 7 57 7 67 7 7
7 7 7 77 7 7 7 7 7 6 4 7 7 7 7 7 75 5
7 7 7 57
77 7 7 77 7 7 7
0.66 0.33 1.0 0.33 2.0 0.33 2.0
E-W PARAL
160 280
76
6
7 7 7 7 7 7 7 7 767 7 5
67 6 7 6 6
4 644
4 4 5 4 6 44 4 4
6
45
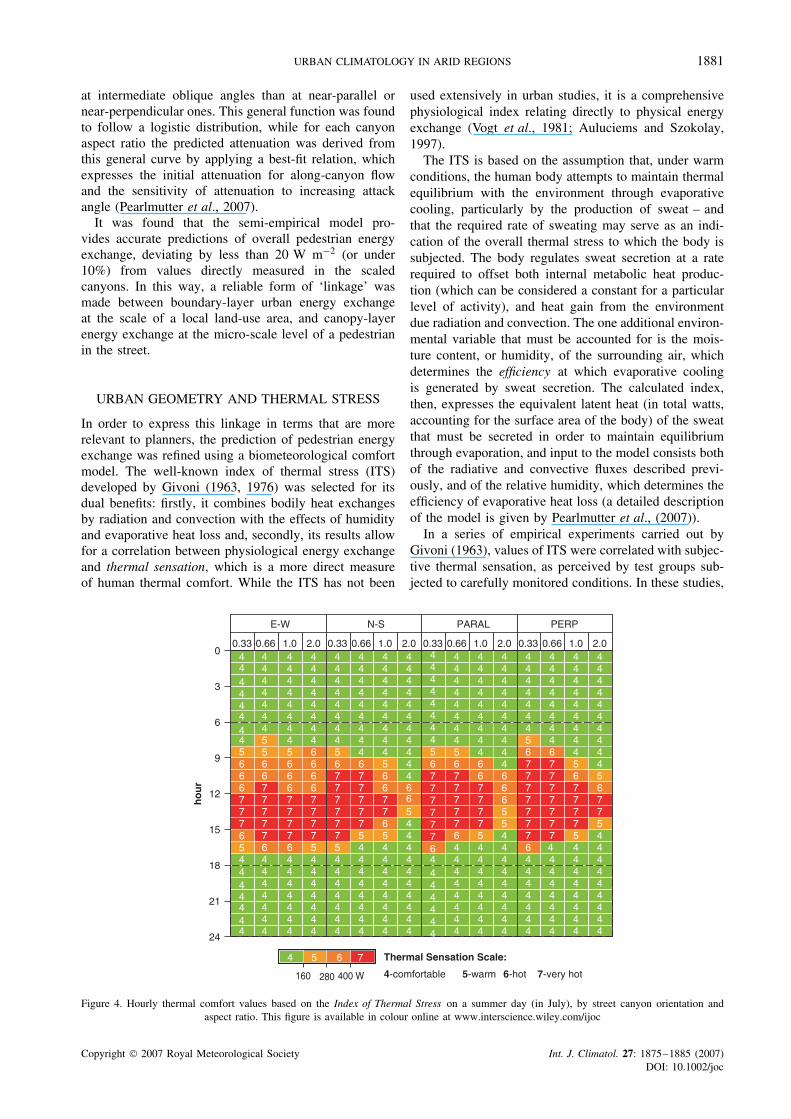
Figure 4. Hourly thermal comfort values based on the Index of Thermal Stress on a summer day (in July), by street canyon orientation andaspect ratio. This figure is available in colour online at www.interscience.wiley.com/ijoc
Copyright 2007 Royal Meteorological Society Int. J. Climatol. 27: 1875–1885 (2007)DOI: 10.1002/joc
1882 D. PEARLMUTTER, P. BERLINER AND E. SHAVIV
subjects were exposed to varying thermal stimuli in a con-trolled indoor environment and their responses – charac-terized by evaluations ranging from ‘comfortable’ (num-ber 4 on a cold-to-hot scale of 0 to 7) to ‘very hot’ – werecompared with simultaneous physiological and climaticobservations. The resulting correlation between thermalsensation and thermal stress, based on approximately100 individuals in a number of different series, indi-cated that a limit to comfort may be found at anITS value of approximately 160 W, with the thresholdsfor ‘warm’ and ‘hot’ conditions occurring at succes-sive increments of about 120 W each (Pearlmutter et al.,2007). Using these threshold values, it was possible torepresent the results of the present energy-exchange mod-elling in terms of thermal sensation categories (comfort-able, warm, hot, and very hot) during the hours of asummer day (Figure 4).
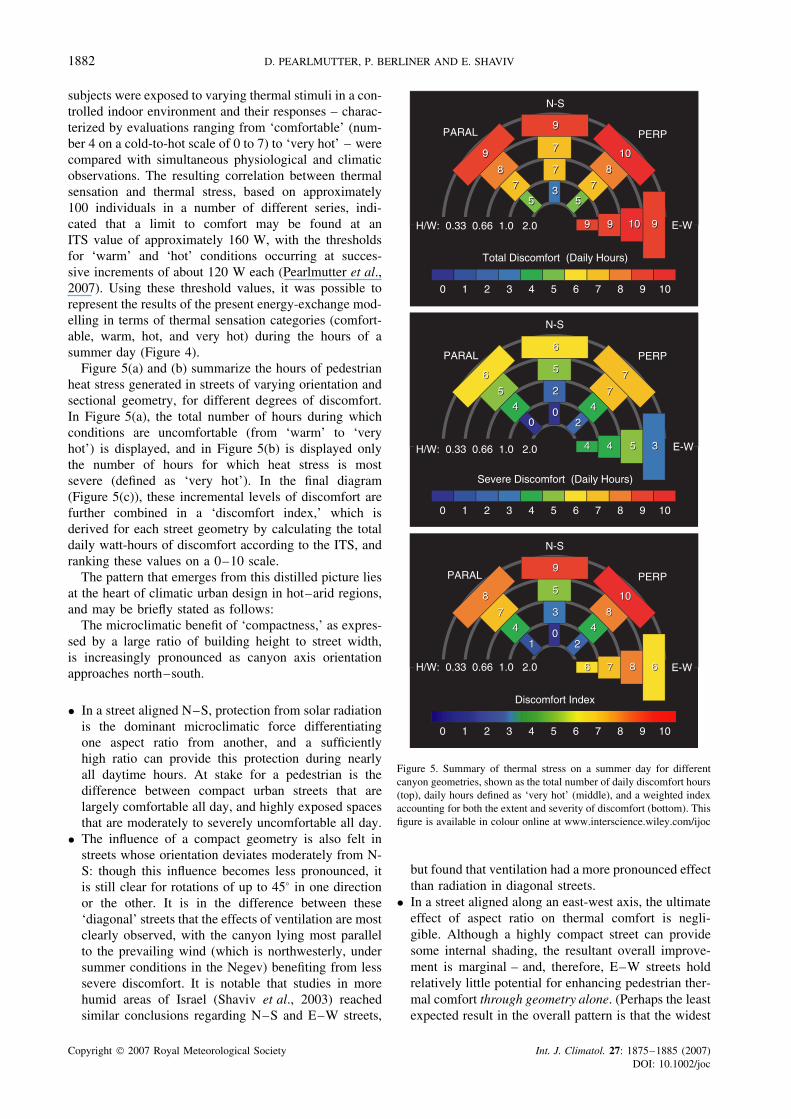
Figure 5(a) and (b) summarize the hours of pedestrianheat stress generated in streets of varying orientation andsectional geometry, for different degrees of discomfort.In Figure 5(a), the total number of hours during whichconditions are uncomfortable (from ‘warm’ to ‘veryhot’) is displayed, and in Figure 5(b) is displayed onlythe number of hours for which heat stress is mostsevere (defined as ‘very hot’). In the final diagram(Figure 5(c)), these incremental levels of discomfort arefurther combined in a ‘discomfort index,’ which isderived for each street geometry by calculating the totaldaily watt-hours of discomfort according to the ITS, andranking these values on a 0–10 scale.
The pattern that emerges from this distilled picture liesat the heart of climatic urban design in hot–arid regions,and may be briefly stated as follows:
The microclimatic benefit of ‘compactness,’ as expres-sed by a large ratio of building height to street width,is increasingly pronounced as canyon axis orientationapproaches north–south.
• In a street aligned N–S, protection from solar radiationis the dominant microclimatic force differentiatingone aspect ratio from another, and a sufficientlyhigh ratio can provide this protection during nearlyall daytime hours. At stake for a pedestrian is thedifference between compact urban streets that arelargely comfortable all day, and highly exposed spacesthat are moderately to severely uncomfortable all day.
• The influence of a compact geometry is also felt instreets whose orientation deviates moderately from N-S: though this influence becomes less pronounced, itis still clear for rotations of up to 45° in one directionor the other. It is in the difference between these‘diagonal’ streets that the effects of ventilation are mostclearly observed, with the canyon lying most parallelto the prevailing wind (which is northwesterly, undersummer conditions in the Negev) benefiting from lesssevere discomfort. It is notable that studies in morehumid areas of Israel (Shaviv et al., 2003) reachedsimilar conclusions regarding N–S and E–W streets,
H/W: 0.33 0.66 1.0 2.0
PARAL
N-S
PERP
E-W
Total Discomfort (Daily Hours)
7
10
35 5
7 7
7
9 99 10
8
9
9
8 7
10
35 5
7 7
7
9 99 10
8
9
9
8
0 1 2 3 4 5 6 7 8 9 10
PARAL
N-S
PERP
E-W
Severe Discomfort (Daily Hours)
PARAL
N-S
PERP
E-W
Discomfort Index
2
7
00 2
4 4
5
4 34 5
7
6
6
5 2
7
00 2
4 4
5
4 34 5
7
6
6
5
3
10
01 2
4 4
5
6 67 8
8
9
8
7 3
10
01 2
4 4
5
6 67 8
8
9
8
7
H/W: 0.33 0.66 1.0 2.0
H/W: 0.33 0.66 1.0 2.0
0 1 2 3 4 5 6 7 8 9 10
0 1 2 3 4 5 6 7 8 9 10
Figure 5. Summary of thermal stress on a summer day for differentcanyon geometries, shown as the total number of daily discomfort hours(top), daily hours defined as ‘very hot’ (middle), and a weighted indexaccounting for both the extent and severity of discomfort (bottom). Thisfigure is available in colour online at www.interscience.wiley.com/ijoc
but found that ventilation had a more pronounced effectthan radiation in diagonal streets.
• In a street aligned along an east-west axis, the ultimateeffect of aspect ratio on thermal comfort is negli-gible. Although a highly compact street can providesome internal shading, the resultant overall improve-ment is marginal – and, therefore, E–W streets holdrelatively little potential for enhancing pedestrian ther-mal comfort through geometry alone. (Perhaps the leastexpected result in the overall pattern is that the widest
Copyright 2007 Royal Meteorological Society Int. J. Climatol. 27: 1875–1885 (2007)DOI: 10.1002/joc
URBAN CLIMATOLOGY IN ARID REGIONS 1883
east-west street, which might be thought to suffer dou-bly due to its orientation and aspect ratio, is in factthe most mildly uncomfortable configuration in thisdirection.)
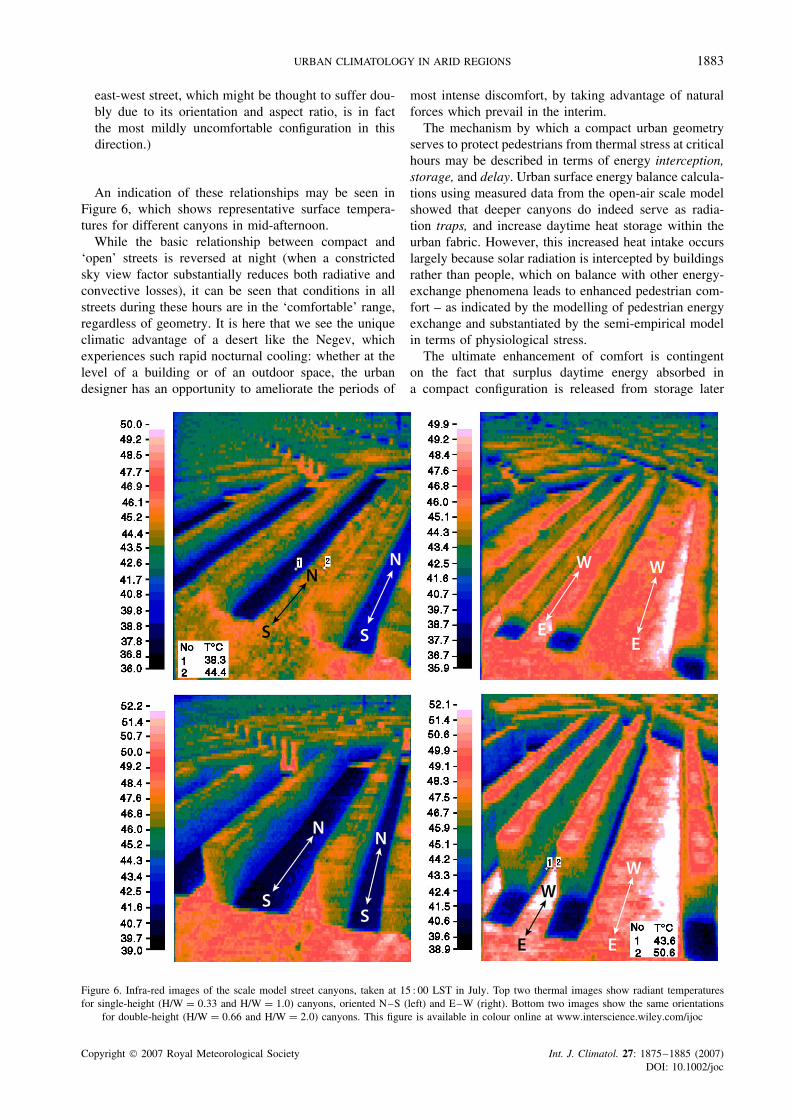
An indication of these relationships may be seen inFigure 6, which shows representative surface tempera-tures for different canyons in mid-afternoon.
While the basic relationship between compact and‘open’ streets is reversed at night (when a constrictedsky view factor substantially reduces both radiative andconvective losses), it can be seen that conditions in allstreets during these hours are in the ‘comfortable’ range,regardless of geometry. It is here that we see the uniqueclimatic advantage of a desert like the Negev, whichexperiences such rapid nocturnal cooling: whether at thelevel of a building or of an outdoor space, the urbandesigner has an opportunity to ameliorate the periods of
most intense discomfort, by taking advantage of naturalforces which prevail in the interim.
The mechanism by which a compact urban geometryserves to protect pedestrians from thermal stress at criticalhours may be described in terms of energy interception,storage, and delay. Urban surface energy balance calcula-tions using measured data from the open-air scale modelshowed that deeper canyons do indeed serve as radia-tion traps, and increase daytime heat storage within theurban fabric. However, this increased heat intake occurslargely because solar radiation is intercepted by buildingsrather than people, which on balance with other energy-exchange phenomena leads to enhanced pedestrian com-fort – as indicated by the modelling of pedestrian energyexchange and substantiated by the semi-empirical modelin terms of physiological stress.
The ultimate enhancement of comfort is contingenton the fact that surplus daytime energy absorbed ina compact configuration is released from storage later
Figure 6. Infra-red images of the scale model street canyons, taken at 15 : 00 LST in July. Top two thermal images show radiant temperaturesfor single-height (H/W = 0.33 and H/W = 1.0) canyons, oriented N–S (left) and E–W (right). Bottom two images show the same orientations
for double-height (H/W = 0.66 and H/W = 2.0) canyons. This figure is available in colour online at www.interscience.wiley.com/ijoc
Copyright 2007 Royal Meteorological Society Int. J. Climatol. 27: 1875–1885 (2007)DOI: 10.1002/joc
1884 D. PEARLMUTTER, P. BERLINER AND E. SHAVIV
in the day, when ambient air is considerably cooler.The efficiency of such a thermal time-lag mechanismis dependent, of course, on the thermal properties ofthe building fabric, particularly its heat storage capacityand resulting thermal ‘inertia.’ Just as internal thermalmass has often been described as an essential ingredientfor indoor passive climatization of buildings in aridregions, it may be reasoned that ‘external mass’ is arequired element in urban design strategies that seek tomoderate outdoor thermal stress through compact streetgeometry. In practical application, thermal mass may beprovided both internally and externally through the useof a common ‘sandwich’-type wall section (combining aheavyweight inner block material, an intermediate layerof thermal insulation, and an outer layer of plasteredblocks or stone facing).
It should also be emphasized that many arid regionsalso experience harsh conditions in winter, though lowtemperatures may be accompanied by a high proportionof clear days and abundant solar radiation. Additionaldata from the Negev studies have shown that, in winter,the dominant microclimatic variable affecting thermalcomfort is the attenuation of chilling winds. In addition,though, it was found that an east–west street of compactproportions can result in excessive overall pedestrian heatloss due to overshadowing, whereas this heat loss (atleast in midday) is dramatically reduced in a N–S streetof the same proportions, which is open to the south. (Amore direct argument against compact E–W streets, ofcourse, would be the inevitable overshadowing of actualbuildings – which may benefit from solar exposure ofsouth-facing elements for passive or active heating.)
When taken together, these findings from the summerand winter seasons highlight the potential advantages ofa climatically ‘selective’ urban fabric – combining rel-atively compact streets in most orientations, especiallynorth–south, with less-constricted E–W streets. It is sug-gested that the evolution of such a pattern could, in fact,enhance pedestrian comfort as well as energy efficiencyin many new or redeveloping parts of desert cities. At thesame time, it should be stressed that these basic relation-ships – and climate-related objectives in general – canonly be realized within the multifaceted process of devel-opment that occurs in any real city or town (Mills, 2006).Decisions concerning the compactness of a city mustalways be viewed in a broader context, considering thelong-term sustainability of the trends (such as daily com-muting and sub-urban sprawl) that they will undoubtedlyinfluence. The plurality of competing motivations thatimpinge on urban density also makes it crucial to con-sider a plurality of means – paying attention to the detailsof urban design, as well as the overall pattern.
CHALLENGES FOR ONGOING RESEARCH
The research described in the preceding text has focusedon aspects of urban climatology in arid regions, which arenarrowly focused in their level of complexity and scale.
Among the many issues for possible future investigation,the following are all issues that build naturally upon onthe findings to date:
• Irregular geometries – Beyond the basic descriptorsof aspect ratio and orientation, additional features ofurban form could be analyzed for their effect on micro-climate and outdoor comfort (asymmetrical canyons,changing pedestrian locations, varying building height,non-rectilinear roof shapes, etc.)
• Material properties – The analysis thus far has treatedconventional heavyweight urban construction, which istypical to the Negev region; modifications induced bylightweight buildings or unconventional ground coverremain to be addressed. The influence of variations infacet albedo was evaluated in general terms and foundto be minor.
• Vegetation and water bodies – There is no doubt thattrees and vegetative ground cover have a transforminginfluence on local climate, due not only to evapo-transpiration but also to their impact on radiation andsensible heat fluxes. The measurement and modellingof these impacts remains a significant challenge, asdoes the analysis of evaporative effects from bodiesof water, both on adjacent areas and those fartherdownwind. Initial results from ongoing studies haveshown tangible reductions in street-level air tempera-ture resulting from surface evaporation, and it appearsthat proportional latent heat loss is directly related tothe area of the evaporating surface relative to that ofthe three-dimensional urban surface.
• Upscaling – The mesoscale effects of geometrical andother urban features is similarly a persistent challengethat confronts researchers, and these effects may provecritical for understanding the development of heatislands and for properly describing urban terrestrialsurfaces in larger-scale models.
• Downscaling – Variations within the volume of anurban space, as determined by complex flow patternsand radiative exchanges, have practical significance foroutdoor comfort. The influence of urban design alsoextends to individual buildings, with serious implica-tions for interior climatization and energy consump-tion.
• Subjective thermal preferences – Ultimately, the phys-ical data produced by urban climatology must begauged in terms of its relevance to human needs andpreferences. In-depth analyses of behavioral responsesto microclimate – under a wide range of outdoor con-ditions – are essential for validating theoretical com-fort models, though such validation has so far provedelusive.
REFERENCES
Ali-Toudert F, Djenane M, Bensalem R, Mayer H. 2005. Outdoorthermal comfort in the old desert city of Beni-Isguen, Algeria.Climate Research 28: 243–256.
Auluciems A, Szokolay SV. 1997. Thermal Comfort. PLEA Interna-tional and University of Queensland: Brisbane, Australia.
Copyright 2007 Royal Meteorological Society Int. J. Climatol. 27: 1875–1885 (2007)DOI: 10.1002/joc
URBAN CLIMATOLOGY IN ARID REGIONS 1885
Brazel A, Selover N, Vose R, Heisler G. 2000. The tale of twoclimates–Baltimore and phoenix urban LTER sites. ClimateResearch 15: 123–135.
Brazel A, Grossman-Clarke S, Zehnder JA, Hedquist BC. 2003.Observations and MM5 simulations of the urban heat island inPhoeniz, Arizona, USA with a modified land cover scheme. InProceedings of Fifth International Conference on Urban Climate,Lodz, Poland, September 2003; 37–40.
Bruins HJ, Berliner PR. 1998. Aridity, climatic variability anddesertification. The Arid Frontier: Interactive Management ofEnvironment and Development. Bruins HJ, Lithwick H (eds)Kluwer: Dordrecht; 97–116.
Comrie AC. 2000. Mapping a wind-modified urban heat island inTucson, Arizona. Bulletin of the American Meteorological Society81(10): 2417–2431.
Garcia-Cueto R, Jauregui E, Tejeda A. 2003. Urban/rural energybalance observations in a desert city in northern Mexico. InProceedings of Fifth International Conference on Urban Climate,Lodz, Poland, September 2003; 177–180.
Givoni B. 1963. Estimation of the effect of climate on man–develop-ment of a New Thermal Index, Ph.D. Thesis, Technion–IsraelInstitute of Technology.
Givoni B. 1976. Man, Climate and Architecture. Van NostrandReinhold: New York.
Grimmond CSB, Cleugh HA, Oke TR. 1991. An objective urban heatstorage model and its comparison with other schemes. AtmosphericEnvironment 25B: 311–326.
Johansson E. 2006. Influence of urban geometry on outdoor thermalcomfort in a hot dry climate: A study in Fez, Morocco. Building andEnvironment 41: 1326–1338.
Masson V, Grimmond CSB, Oke TR. 2002. Evaluation of the TownEnergy Balance (TEB) scheme with direct measurements fromdry districts in two cities. Journal of Applied Meteorology 41:1011–1026.
Millennium Ecosystem Assessment. 2005. Ecosystems and HumanWell-being: Desertification Synthesis. World Resources Institute:Washington, DC.
Mills G. 2006. Progress toward sustainable settlements: a role for urbanclimatology. Theoretical and Applied Climatology 84: 69–76, DOI10.1007/s00704-005-0145-0.
Monteith JL, Unsworth M. 1990. Principles of Environmental Physics.Edward Arnold: London.
Nasrallah HA, Brazel AJ, Balling RC. 1990. Analysis of the KuwaitCity urban heat island. International Journal of Climatology 10:401–405.
Oke TR, Spronken-Smith RA, Jauregui E, Grimmond CSB. 1999. Theenergy balance of central Mexico City during the dry season.Atmospheric Environment 33: 3919–3930.
Pearlmutter D, Bitan A, Berliner P. 1999. Microclimatic analysis of‘compact’ urban canyons in an arid zone. Atmospheric Environment33: 4143–4150.
Pearlmutter D, Berliner P, Shaviv E. 2005. Evaluation of urban surfaceenergy fluxes using an open-air scale model. Journal of AppliedMeteorology 44(4): 532–545.
Pearlmutter D, Berliner P, Shaviv E. 2006. Physical modelling ofpedestrian energy exchange within the urban canopy. Building andEnvironment 41(6): 783–795.
Pearlmutter D, Berliner P, Shaviv E. 2007. Integrated modelling ofpedestrian energy exchange and thermal comfort in urban streetcanyons. Building and Environment 42(6): 2396–2409.
Schmid HP, Cleugh HA, Grimmond CSB, Oke TR. 1991. Spatialvariability of energy fluxes in suburban terrain. Boundary-LayerMeteorology 54: 249–276.
Shaviv E, Yezioro A, Capeluto IG. 2003. Climatic and Energy Aspectsof Urban Design in the Hot-Humid Region of Israel (in Hebrew).Ministry of National Infrastructures and Technion Research andDevelopment Foundation Ltd. 296.
Sofer M, Potchter O. 2006. The urban heat island of a city in an aridzone: the case of Eilat, Israel. Theoretical and Applied Climatology85: 81–88, DOI 10.1007/s00704-005-0181-9.
Taha H, Bornstein R. 1999. Urbanization of meteorological models andimplications on simulated heat islands and air quality. InternationalConference on Urban Climatology (ICB-ICUC ‘99). MacquarieUniversity: Sydney, Australia.
Vogt JJ, Candas V, Libert JP, Daull F. 1981. Required sweat rateas an index of thermal strain in industry. In Bioengineering,Thermal Physiology and Comfort, Cena K, Clark JA (eds). Elesvier:Amsterdam; 99–110.
Copyright 2007 Royal Meteorological Society Int. J. Climatol. 27: 1875–1885 (2007)DOI: 10.1002/joc
Related Documents


![Climatology [Autosaved]](https://static.cupdf.com/doc/110x72/577cd2e91a28ab9e78964bc6/climatology-autosaved.jpg)


