Urban aerosols harbor diverse and dynamic bacterial populations Eoin L. Brodie, Todd Z. DeSantis, Jordan P. Moberg Parker, Ingrid X. Zubietta, Yvette M. Piceno, and Gary L. Andersen* Ecology Department, Earth Sciences Division, Lawrence Berkeley National Laboratory, Berkeley, CA 94720 Edited by Steven E. Lindow, University of California, Berkeley, CA, and approved November 7, 2006 (received for review September 20, 2006) Considering the importance of its potential implications for human health, agricultural productivity, and ecosystem stability, surpris- ingly little is known regarding the composition or dynamics of the atmosphere’s microbial inhabitants. Using a custom high-density DNA microarray, we detected and monitored bacterial populations in two U.S. cities over 17 weeks. These urban aerosols contained at least 1,800 diverse bacterial types, a richness approaching that of some soil bacterial communities. We also reveal the consistent presence of bacterial families with pathogenic members including environmental relatives of select agents of bioterrorism signifi- cance. Finally, using multivariate regression techniques, we dem- onstrate that temporal and meteorological influences can be stron- ger factors than location in shaping the biological composition of the air we breathe. 16S rRNA biosurveillance aerobiology microarray climate change L ow levels of moisture and nutrients combined with high levels of UV radiation make the earth’s atmosphere an extreme environment for microbial life. Little is known regarding the atmospheric microbial composition and how it varies by location or meteorological conditions. Plant canopies for example, are known to be significant sources of bacterial aerosols with upward flux of bacteria positively impacted by temperature and wind speed (1). Aerosols created at the surface of aquatic systems are known to concentrate and carry bacteria through the liquid–air interface (2, 3). The relationship between environmental con- ditions and bacterial aerial dispersal indicates that climate change could potentially alter the microbial composition of downwind areas, resulting in increased health risk from patho- gens or allergenic components of unclassified environmental bacteria. For instance, the last decade has seen a dramatic increase in the amount of desertification and a concomitant increase in upper atmospheric particulates (4). In sub-Saharan regions of Africa, dust storms have been associated with regional outbreaks of meningococcal meningitis caused by the bacterium Neisseria meningitidis (5). Since the 1970s, El Nino weather events have coincided with increased f lux of African Dust across the Atlantic (4) that, in turn, has been linked to coral reef disease (6) and increased exacerbations of pediatric asthma (7) in the Caribbean. Therefore, as particles from dust storms shield bacterial and fungal passengers from the inactivating effects of UV exposure, global transport of dust will have more far- reaching affects than impaired visibility. The consequences of natural environmental variation such as meteorological shifts, combined with anthropogenic influences such as land use changes, may alter atmospheric microbial composition. To monitor the effects of climate change on aerosol microbial composition, it first is necessary to establish baselines that acknowledge the current microbial components and how they fluctuate naturally. However, the potential heter- ogeneity, both spatial and temporal, in species composition coupled with low microbial biomass ensures this is not a facile task. Natural shifts in bacterial composition also have implications for atmospheric pathogen monitoring systems, such as the Department of Homeland Security effort to monitor major U.S. cites for intentional release of biowarfare agents (www.ostp.gov/ html/10-20-03%20jhm%20BioSecurity%202003.pdf). Many such pathogens and other closely related bacteria with undefined pathogenicity already are endemic to the locations that are being monitored (8) and so may interfere with detection networks (9), but little is known regarding the frequency or variability of their occurrence. Most aerobiology studies to date (e.g., refs. 10–12), have used culture-based methods for determining microbial composition. Although some studies recently have applied culture-independent techniques (e.g., refs. 13 and 14), little is known of what constitutes the breadth of diversity of ‘‘typical’’ organisms in the atmosphere (as opposed to those capable of growth in laboratory media) and what influences their compo- sition. To address these methodological limitations and to augment our view of aerosol microbial diversity and dynamics, we have designed a microarray (PhyloChip) for the comprehen- sive identification of both bacterial and archaeal organisms. We target the variation in the 16S rRNA gene, possessed by all prokaryotes, to capture the broad range of microbial diversity that may be present in the atmosphere. This tool allows bacteria and archaea to be identified and monitored in any type of sample without the need for microbial cultivation. The two greatest obstacles to designing a 16S rRNA gene- based microarray to identify individual organisms in a complex environmental mixture are natural sequence diversity and po- tential cross-hybridization. Sequence diversity is an issue as we sample new and distinctive environments such as the atmo- sphere. There may be many undocumented organisms with 16S rRNA gene sequences that are similar, but not identical, to the sequences that were used for array design. Microarrays based on single sequence-specific hybridizations (single probes) may be ineffective in detecting such environmental sequences with one or several polymorphisms. To overcome this obstacle, we have designed a minimum of 11 different, short oligonucleotide probes for each taxonomic grouping, allowing for the failure of one or more probes. On the other hand, nonspecific cross- hybridization is an issue when an abundant 16S rRNA gene shares sufficient sequence similarity to nontargeted probes, such that a weak but detectable signal is obtained. We have found that the perfect match (PM)-mismatch (MM) probe pair approach effectively minimizes the influence of cross-hybridization. Widely used on expression arrays as a control for nonspecific binding (15), the central nucleotide is replaced with any of the Author contributions: E.L.B. and T.Z.D. contributed equally to this work; E.L.B., T.Z.D., and G.L.A. designed research; E.L.B., T.Z.D., J.P.M.P., I.X.Z., and Y.M.P. performed research; E.L.B., T.Z.D., Y.M.P., and G.L.A. analyzed data; and E.L.B., T.Z.D., and G.L.A. wrote the paper. The authors declare no conflict of interest. This article is a PNAS direct submission. Freely available online through the PNAS open access option. Data deposition: The sequences reported in this paper have been deposited in the GenBank database (accession nos. DQ129237–DQ129666, DQ236245–DQ236250, and DQ515230 – DQ515231). *To whom correspondence should be addressed. E-mail: [email protected]. This article contains supporting information online at www.pnas.org/cgi/content/full/ 0608255104/DC1. www.pnas.orgcgidoi10.1073pnas.0608255104 PNAS January 2, 2007 vol. 104 no. 1 299 –304 MICROBIOLOGY

Welcome message from author
This document is posted to help you gain knowledge. Please leave a comment to let me know what you think about it! Share it to your friends and learn new things together.
Transcript
Urban aerosols harbor diverse and dynamicbacterial populationsEoin L. Brodie, Todd Z. DeSantis, Jordan P. Moberg Parker, Ingrid X. Zubietta, Yvette M. Piceno, and Gary L. Andersen*
Ecology Department, Earth Sciences Division, Lawrence Berkeley National Laboratory, Berkeley, CA 94720
Edited by Steven E. Lindow, University of California, Berkeley, CA, and approved November 7, 2006 (received for review September 20, 2006)
Considering the importance of its potential implications for humanhealth, agricultural productivity, and ecosystem stability, surpris-ingly little is known regarding the composition or dynamics of theatmosphere’s microbial inhabitants. Using a custom high-densityDNA microarray, we detected and monitored bacterial populationsin two U.S. cities over 17 weeks. These urban aerosols contained atleast 1,800 diverse bacterial types, a richness approaching that ofsome soil bacterial communities. We also reveal the consistentpresence of bacterial families with pathogenic members includingenvironmental relatives of select agents of bioterrorism signifi-cance. Finally, using multivariate regression techniques, we dem-onstrate that temporal and meteorological influences can be stron-ger factors than location in shaping the biological composition ofthe air we breathe.
16S rRNA ! biosurveillance ! aerobiology ! microarray ! climate change
Low levels of moisture and nutrients combined with high levelsof UV radiation make the earth’s atmosphere an extreme
environment for microbial life. Little is known regarding theatmospheric microbial composition and how it varies by locationor meteorological conditions. Plant canopies for example, areknown to be significant sources of bacterial aerosols with upwardflux of bacteria positively impacted by temperature and windspeed (1). Aerosols created at the surface of aquatic systems areknown to concentrate and carry bacteria through the liquid–airinterface (2, 3). The relationship between environmental con-ditions and bacterial aerial dispersal indicates that climatechange could potentially alter the microbial composition ofdownwind areas, resulting in increased health risk from patho-gens or allergenic components of unclassified environmentalbacteria. For instance, the last decade has seen a dramaticincrease in the amount of desertification and a concomitantincrease in upper atmospheric particulates (4). In sub-Saharanregions of Africa, dust storms have been associated with regionaloutbreaks of meningococcal meningitis caused by the bacteriumNeisseria meningitidis (5). Since the 1970s, El Nino weatherevents have coincided with increased flux of African Dust acrossthe Atlantic (4) that, in turn, has been linked to coral reef disease(6) and increased exacerbations of pediatric asthma (7) in theCaribbean. Therefore, as particles from dust storms shieldbacterial and fungal passengers from the inactivating effects ofUV exposure, global transport of dust will have more far-reaching affects than impaired visibility.
The consequences of natural environmental variation such asmeteorological shifts, combined with anthropogenic influencessuch as land use changes, may alter atmospheric microbialcomposition. To monitor the effects of climate change onaerosol microbial composition, it first is necessary to establishbaselines that acknowledge the current microbial componentsand how they fluctuate naturally. However, the potential heter-ogeneity, both spatial and temporal, in species compositioncoupled with low microbial biomass ensures this is not a faciletask.
Natural shifts in bacterial composition also have implicationsfor atmospheric pathogen monitoring systems, such as theDepartment of Homeland Security effort to monitor major U.S.
cites for intentional release of biowarfare agents (www.ostp.gov/html/10-20-03%20jhm%20BioSecurity%202003.pdf). Manysuch pathogens and other closely related bacteria with undefinedpathogenicity already are endemic to the locations that are beingmonitored (8) and so may interfere with detection networks (9),but little is known regarding the frequency or variability of theiroccurrence. Most aerobiology studies to date (e.g., refs. 10–12),have used culture-based methods for determining microbialcomposition. Although some studies recently have appliedculture-independent techniques (e.g., refs. 13 and 14), little isknown of what constitutes the breadth of diversity of ‘‘typical’’organisms in the atmosphere (as opposed to those capable ofgrowth in laboratory media) and what influences their compo-sition. To address these methodological limitations and toaugment our view of aerosol microbial diversity and dynamics,we have designed a microarray (PhyloChip) for the comprehen-sive identification of both bacterial and archaeal organisms. Wetarget the variation in the 16S rRNA gene, possessed by allprokaryotes, to capture the broad range of microbial diversitythat may be present in the atmosphere. This tool allows bacteriaand archaea to be identified and monitored in any type of samplewithout the need for microbial cultivation.
The two greatest obstacles to designing a 16S rRNA gene-based microarray to identify individual organisms in a complexenvironmental mixture are natural sequence diversity and po-tential cross-hybridization. Sequence diversity is an issue as wesample new and distinctive environments such as the atmo-sphere. There may be many undocumented organisms with 16SrRNA gene sequences that are similar, but not identical, to thesequences that were used for array design. Microarrays based onsingle sequence-specific hybridizations (single probes) may beineffective in detecting such environmental sequences with oneor several polymorphisms. To overcome this obstacle, we havedesigned a minimum of 11 different, short oligonucleotideprobes for each taxonomic grouping, allowing for the failure ofone or more probes. On the other hand, nonspecific cross-hybridization is an issue when an abundant 16S rRNA geneshares sufficient sequence similarity to nontargeted probes, suchthat a weak but detectable signal is obtained. We have found thatthe perfect match (PM)-mismatch (MM) probe pair approacheffectively minimizes the inf luence of cross-hybridization.Widely used on expression arrays as a control for nonspecificbinding (15), the central nucleotide is replaced with any of the
Author contributions: E.L.B. and T.Z.D. contributed equally to this work; E.L.B., T.Z.D., andG.L.A. designed research; E.L.B., T.Z.D., J.P.M.P., I.X.Z., and Y.M.P. performed research;E.L.B., T.Z.D., Y.M.P., and G.L.A. analyzed data; and E.L.B., T.Z.D., and G.L.A. wrote thepaper.
The authors declare no conflict of interest.
This article is a PNAS direct submission.
Freely available online through the PNAS open access option.
Data deposition: The sequences reported in this paper have been deposited in the GenBankdatabase (accession nos. DQ129237–DQ129666, DQ236245–DQ236250, and DQ515230–DQ515231).
*To whom correspondence should be addressed. E-mail: [email protected].
This article contains supporting information online at www.pnas.org/cgi/content/full/0608255104/DC1.
www.pnas.org"cgi"doi"10.1073"pnas.0608255104 PNAS ! January 2, 2007 ! vol. 104 ! no. 1 ! 299–304
MIC
ROBI
OLO
GY
three nonmatching bases so that the increased hybridizationintensity signal of the PM over the paired MM indicates asequence-specific, positive hybridization. By requiring multiplePM-MM probe pairs to have a positive interaction, we substan-tially increase the chance that the hybridization signal is due toa predicted target sequence.
We grouped known 16S rRNA gene sequences !600 bp intodistinct taxa such that a set of at least 11 probes that were specificto the taxon could be chosen. The resulting 8,935 taxa (8,741 ofwhich are represented on the PhyloChip), each containing "3%sequence divergence, represented all 121 demarcated bacterialand archaeal orders [supporting information (SI) Table 2]. Fora majority of the taxa represented on the PhyloChip (5,737,65%), probes were designed from regions of gene sequences thathave been identified only within a given taxon. For 1,198 taxa(14%), no probe-level sequence could be identified that was notshared with other groups of 16S rRNA gene sequences, althoughthe gene sequence as a whole was distinctive. For these taxo-nomic groupings, a set of at least 11 probes was designed to acombination of regions on the 16S rRNA gene that takentogether as a whole did not exist in any other taxa. For theremaining 1,806 taxa (21%), a set of probes were selected tominimize the number of putative cross-reactive taxa. Althoughmore than half of the probes in this group have a hybridization
potential to one outside sequence, this sequence was typicallyfrom a phylogenetically similar taxon. For all three probe setgroupings, the advantage of the hybridization approach is thatmultiple taxa can be identified simultaneously by targetingunique regions or combinations of sequence.
To assess the bacterial composition of environmental aerosolsand how it changes over time and with location, we examinedoutdoor air collected at multiple locations in two cities, Austinand San Antonio, TX. These cities are part of the U.S. mul-tiagency biosurveillance effort that use aerosol collectors toconcentrate airborne particulate matter in search of pathogensthat potentially could be indicative of a bioterrorism threat. Foreither city, aerosol monitors were used to draw in air and passit through filters designed to collect submicrometer particulatesfor a 24-h period. The samplers were placed immediately adja-cent to six Environmental Protection Agency air quality moni-toring stations located throughout the urban area of each city,and the filter eluents were pooled for each day before amplifi-cation of the 16S rRNA gene products from the extracted DNA.Although PCR amplification may introduce some bias in termsof quantitative assessment of an organism’s abundance due tofactors such as preferential amplification (16, 17), the extremelylow bacterial biomass in aerosol samples necessitate such anapproach. Amplified products from 4 days within a 7-day period
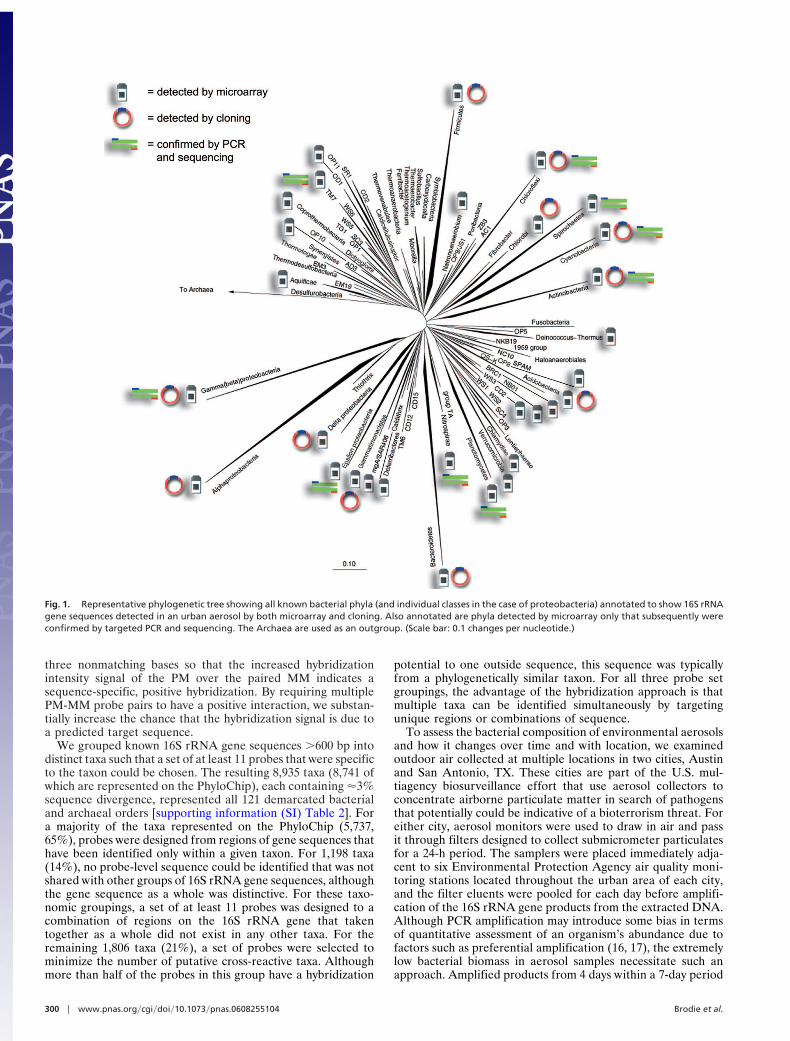
Fig. 1. Representative phylogenetic tree showing all known bacterial phyla (and individual classes in the case of proteobacteria) annotated to show 16S rRNAgene sequences detected in an urban aerosol by both microarray and cloning. Also annotated are phyla detected by microarray only that subsequently wereconfirmed by targeted PCR and sequencing. The Archaea are used as an outgroup. (Scale bar: 0.1 changes per nucleotide.)
300 ! www.pnas.org"cgi"doi"10.1073"pnas.0608255104 Brodie et al.

were pooled into a single sample representing 1 week, and 17consecutive weekly samples beginning May 2003 were analyzedfrom both cities for bacterial composition.
Results and DiscussionPhyloChip results for one sample, representing bacteria recov-ered from outdoor air at San Antonio from the week of July14–20 (calendar week 29), 2003, were compared with clonelibrary sequence results from the same pool of amplified 16SrRNA gene products (Fig. 1). A conservative comparison of thePhyloChip and cloning approaches was made at a taxonomiclevel below family and above species classification (see SIMaterials and Methods), termed ‘‘subfamily’’ for clarity. Thisdemonstrated that the PhyloChip correctly detected 90% ofcloned subfamilies (SI Table 3) and additionally detected almost2.5-fold more diversity at the phylum level (Fig. 1). We subse-quently have confirmed many of these PhyloChip-only hits(which include known pathogenic genera), by cluster-specificPCR and sequencing (Fig. 1 and SI Table 4). The most commonsequences in the air clone library (35%) were Bacilli most similarto the species Bacillus bataviensis (previously isolated from soilin a disused hay field) (18) and another Bacillus sp. associatedwith biodeterioration of mural paintings (19), suggesting dis-persal through aerosolization. The diversity of the remainingclone sequences was quite high, with a majority of the clonesrepresenting distinctive 16S rRNA gene sequences (SI Fig. 4).
Because of the relative dearth of information regarding aero-sol bacterial diversity, we compared the diversity detected in thisaerosol sample by cloning with that found in a farm soil from aprevious study (20). Soils are considered to be highly diversemicrobial habitats with an estimate of up to 1 million distinctgenomes per gram (21). Rarefaction analysis revealed a similarlevel of diversity (at the 16S rRNA gene biomarker level) in theaerosol and soil samples (Fig. 2). Predicted estimates of richness(Chao1 and ACE) indicated between 1,500 and 1,800 16S rRNAphylotypes (by using a 99% identity cutoff) in the aerosol sample(SI Fig. 5). However, because both ACE and Chao1 richnessprediction curves were nonasymptotic, this is likely to be anunderestimate because of insufficient clone sampling, a commonproblem when assessing environmental microbial diversity byusing cloning approaches.
Microbial communities are characteristically dynamic, and itis expected that aerosol communities are no exception, consid-ering the turbulent and well mixed nature of the atmosphere.Using a Latin Square type study containing mixtures of ampli-
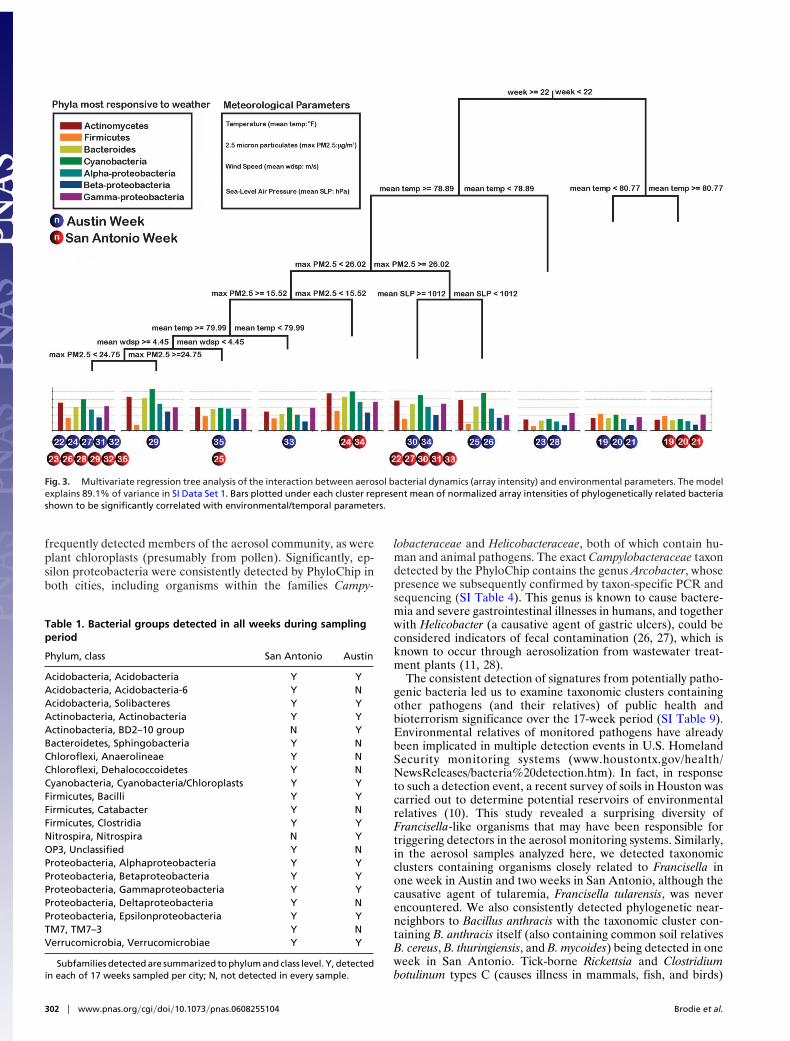
cons from diverse bacterial species applied to the PhyloChips inrotating concentrations (SI Table 5), we tested the ability of thePhyloChip to track 16S rRNA amplicon dynamics quantitatively.This demonstrated a strong linear relationship, spanning fiveorders of magnitude between PhyloChip intensities and quan-tities of bacterial 16S rRNA gene signatures applied to Phylo-Chips (SI Fig. 6). Having determined the potential of thePhyloChip for detecting changes in biomarker quantities, weanalyzed intensity data for the two cities over the 17-week periodof the study. We also collated a range of meteorological param-eters to investigate whether local weather conditions could becorrelated with the observed fluctuations in aerosol bacterialpopulations. Using multivariate regression tree analysis (22, 23),we examined such correlations, with tree topology and splittingparameters suggesting that sample location (in this case twogeographically proximate cities) was less of a factor in explainingthe variability of aerosol bacterial composition than temporal ormeteorological influences (Fig. 3). The week of the year at whicha sample was taken proved to be a stronger predictor ofcommunity composition with samples taken after the first threeweeks in May (weeks 19–21) clustering separately from thosetaken before this, regardless of city sampled. Unsurprisingly,sample week was observed to correlate with weather conditions(SI Table 6). For both cities, week was positively correlated withtemperature, air pressure, and visibility, whereas negativelycorrelated with wind speed and particulate matter. It is impor-tant to note from the composition of the PhyloChip generatedtree clusters that the clone library ‘‘snapshot’’ taken during week29 in San Antonio was representative of only approximatelyone-third of the samples collected (11 of 34 weeks clustered atthis node). Therefore, caution should be used in interpretingsnapshot analyses in such dynamic systems. Underlying thesechanges in bacterial community composition was a differentialabundance of biomarkers for many spore-forming bacteria suchas Actinomycetes and Firmicutes. Indeed, most of the taxa withsignificant correlations to weather conditions were Actinomy-cetes, which showed positive correlations with temperature (SITable 7). Warmer temperatures may result in increased desic-cation of soil/plant-based bacteria, leading to spore dispersal oraerosolization. Additionally, alpha-proteobacteria such as phyl-losphere-inhabiting Sphingomonas spp (24). were correlatedwith sea-level pressure, week, and temperature (Fig. 3 and SITable 7). These and other alpha-proteobacteria are typicallyoligotrophic and also may originate from freshwater and marineecosystems (3) in addition to plant surfaces. The most significantcorrelation between any PhyloChip intensity pattern and anenvironmental/temporal variable was between the gamma-proteobacterium Pseudomonas oleovorans and week (r # 0.83,P # 2.1 $ 10%5). Real-time quantitative PCR of the samegenomic DNA pools used for PhyloChip PCRs demonstratedthat changes in PhyloChip intensity were representative of thedynamics of this organism (SI Fig. 7).
Despite the variable nature of the aerosol bacterial popula-tion, we detected some groups of organisms in every sample overthe 17-week period (summarized in Table 1, with completedetails in SI Table 8). Between the two cities, more types ofbacteria consistently were detected in San Antonio aerosolsamples (80 subfamilies) compared with Austin (43 subfamilies),although there was significant overlap in the consistent 16SrRNA signatures between the two cities. Many of these organ-isms (e.g., Acidobacteria and Verrucomicrobia) are major com-ponents of the soil microbiota and may be particle-associated.Sphingomonas species also were detected consistently, psychro-tolerant strains of which have been detected in dust and airsamples from the Antarctic (25). Notably, other bacteria con-sistently detected were spore formers such as the endospore-forming Bacilli and Clostridia and the exospore-forming Acti-nomycetes. Cyanobacteria such as Plectonema were also
Fig. 2. Rarefaction curves comparing bacterial diversity in a Minnesota farmsoil (20) and the urban aerosol in this study. (Inset) Complete rarefaction curvefor 1,874 sequences from the Minnesota farm soil library.
Brodie et al. PNAS ! January 2, 2007 ! vol. 104 ! no. 1 ! 301
MIC
ROBI
OLO
GY
frequently detected members of the aerosol community, as wereplant chloroplasts (presumably from pollen). Significantly, ep-silon proteobacteria were consistently detected by PhyloChip inboth cities, including organisms within the families Campy-
lobacteraceae and Helicobacteraceae, both of which contain hu-man and animal pathogens. The exact Campylobacteraceae taxondetected by the PhyloChip contains the genus Arcobacter, whosepresence we subsequently confirmed by taxon-specific PCR andsequencing (SI Table 4). This genus is known to cause bactere-mia and severe gastrointestinal illnesses in humans, and togetherwith Helicobacter (a causative agent of gastric ulcers), could beconsidered indicators of fecal contamination (26, 27), which isknown to occur through aerosolization from wastewater treat-ment plants (11, 28).
The consistent detection of signatures from potentially patho-genic bacteria led us to examine taxonomic clusters containingother pathogens (and their relatives) of public health andbioterrorism significance over the 17-week period (SI Table 9).Environmental relatives of monitored pathogens have alreadybeen implicated in multiple detection events in U.S. HomelandSecurity monitoring systems (www.houstontx.gov/health/NewsReleases/bacteria%20detection.htm). In fact, in responseto such a detection event, a recent survey of soils in Houston wascarried out to determine potential reservoirs of environmentalrelatives (10). This study revealed a surprising diversity ofFrancisella-like organisms that may have been responsible fortriggering detectors in the aerosol monitoring systems. Similarly,in the aerosol samples analyzed here, we detected taxonomicclusters containing organisms closely related to Francisella inone week in Austin and two weeks in San Antonio, although thecausative agent of tularemia, Francisella tularensis, was neverencountered. We also consistently detected phylogenetic near-neighbors to Bacillus anthracis with the taxonomic cluster con-taining B. anthracis itself (also containing common soil relativesB. cereus, B. thuringiensis, and B. mycoides) being detected in oneweek in San Antonio. Tick-borne Rickettsia and Clostridiumbotulinum types C (causes illness in mammals, fish, and birds)
Fig. 3. Multivariate regression tree analysis of the interaction between aerosol bacterial dynamics (array intensity) and environmental parameters. The modelexplains 89.1% of variance in SI Data Set 1. Bars plotted under each cluster represent mean of normalized array intensities of phylogenetically related bacteriashown to be significantly correlated with environmental/temporal parameters.
Table 1. Bacterial groups detected in all weeks during samplingperiod
Phylum, class San Antonio Austin
Acidobacteria, Acidobacteria Y YAcidobacteria, Acidobacteria-6 Y NAcidobacteria, Solibacteres Y YActinobacteria, Actinobacteria Y YActinobacteria, BD2–10 group N YBacteroidetes, Sphingobacteria Y NChloroflexi, Anaerolineae Y NChloroflexi, Dehalococcoidetes Y NCyanobacteria, Cyanobacteria/Chloroplasts Y YFirmicutes, Bacilli Y YFirmicutes, Catabacter Y NFirmicutes, Clostridia Y YNitrospira, Nitrospira N YOP3, Unclassified Y NProteobacteria, Alphaproteobacteria Y YProteobacteria, Betaproteobacteria Y YProteobacteria, Gammaproteobacteria Y YProteobacteria, Deltaproteobacteria Y NProteobacteria, Epsilonproteobacteria Y YTM7, TM7–3 Y NVerrucomicrobia, Verrucomicrobiae Y Y
Subfamilies detected are summarized to phylum and class level. Y, detectedin each of 17 weeks sampled per city; N, not detected in every sample.
302 ! www.pnas.org"cgi"doi"10.1073"pnas.0608255104 Brodie et al.
and G (rarely illness causing) also were detected regularly, aswere Burkholderia mallei and Bu. pseudomallei, which causeglanders and melioidosis respectively. Other select agents such asYersinia pestis and Brucella spp. (melitensis, suis, and abortus)were never encountered. The frequent occurrence of environ-mental relatives of bacteria targeted by biosurveillance efforts inurban aerosols makes prediction of natural occurrences ofendemic pathogens or their uncharacterized environmental rel-atives critical for the implementation of a robust biosurveillancenetwork.
This study represents a comprehensive molecular analysis ofairborne bacterial composition and dynamics. We have demon-strated that the atmosphere contains a diverse assemblage ofmicroorganisms probably representing the amalgamation ofnumerous point sources. The composition of this habitat varieswidely and may be subject to climatic regulation. A global-scalestudy of this uncharacterized ecosystem is necessary to deter-mine baselines for bioaerosol transport patterns. Such data willenable an understanding of future anthropogenic impacts in-cluding pollution, bioterrorism, and climate change in alteringthe biological composition of the air we breathe.
Materials and MethodsSample Collection and Pooling. Air samples were collected by usingan air filtration collection system under vacuum located withinsix Environmental Protection Agency air quality network sites inboth San Antonio and Austin. Approximately 10 liters of air perminute were collected on a Celanex polyethylene terephthalate,1.0-!m filter (Calanese, Dallas, TX). Samples were collecteddaily over a 24-h period. Sample filters were washed in 10 mlbuffer (0.1 M sodium phosphate/10 mM EDTA, pH 7.4/0.01%Tween-20), and the suspension was stored frozen until extracted.Samples were collected from 4 May to 29 August 2003. Sampledates were divided according to a 52-week calendar year startingJanuary 1, 2003, with each Monday-to-Sunday cycle constitutinga full week. Samples from four randomly chosen days within eachsample week were extracted. Each date chosen for extractionconsisted of a 0.6-ml filter wash from each of the six samplingsites for that city (San Antonio or Austin) combined into a ‘‘daypool’’ before extraction. In total, for each week, 24 filters weresampled.
DNA Extraction and 16S rRNA Gene Amplification. The ‘‘day pools’’were centrifuged at 16,000 $ g for 25 min, and the pellets wereresuspended in 400 !l of 100 mM sodium phosphate buffer (pH8). DNA extraction was performed as described in DeSantis etal. (29), but only a single bead-beating velocity and duration wasused (6.5 m!s%1 for 45 s). DNA was quantified by using aPicoGreen fluorescence assay according to the manufacturer’srecommended protocol (Invitrogen, Carlsbad, CA). 16S rRNAgene amplification was performed according to standard pro-cedures as outlined in SI Materials and Methods.
PhyloChip Processing, Scanning, Probe Set Scoring, and Normaliza-tion. The pooled PCR product was spiked with known concen-trations of synthetic 16S rRNA gene fragments and non-16SrRNA gene fragments as internal standards for normalizationwith quantities ranging from 5.02 $ 108 and 7.29 $ 1010
molecules applied to the final hybridization mix (SI Table 10).Target fragmentation, biotin labeling, PhyloChip hybridization,scanning, and staining were as described by Brodie et al. (30),and background subtraction, noise calculation, and detectionand quantification criteria were essentially as reported in Brodieet al. (30), with some minor exceptions. These exceptions wereas follows: For a probe pair to be considered positive, thedifference in intensity between the PM and MM probes must beat least 130 times the squared noise value (N). A taxon wasconsidered present in the sample when 92% or more of its
assigned probe pairs for its corresponding probe set werepositive (positive fraction ! # 0.92). This was determined basedon empirical data from clone library analyses. Hybridizationintensity (referred to as intensity) was calculated in arbitraryunits for each probe set as the trimmed average (maximum andminimum values removed before averaging) of the PM minusMM intensity differences across the probe pairs in a given probeset. All intensities &1 were shifted to 1 to avoid errors insubsequent logarithmic transformations. When summarizingPhyloChip results to the subfamily, the probe set producing thehighest intensity was used.
Validation of PhyloChip Detection of Airborne Bacteria by Comparisonwith Clone Library. To compare the diversity of bacteria detectedwith PhyloChips to a known standard, one sample week was chosenfor cloning and sequencing and replicate PhyloChip analysis. Onelarge pool of SSU amplicons (96 reactions, 50 !l per reaction) fromSan Antonio week 29 was made. One milliliter of the pooled PCRproduct was gel-purified, and 768 clones were sequenced at theDOE Joint Genome Institute (Walnut Creek, CA) by standardmethods. An aliquot of this same pooled PCR product also washybridized to a PhyloChip (three replicate PhyloChips performed).Subfamilies containing a taxon scored as present in all threePhyloChip replicates were recorded. Individual cloned rRNA geneswere sequenced from each terminus, assembled by using Phred andPhrap (31–33), and were required to pass quality tests of Phred 20(base call error probability &10%2.0) to be included in the compar-ison. Chimeric sequences were removed after Bellerophon (34)analysis, and similarity of clones to PhyloChip taxa was calculatedwith DNADIST (35) measurement of homology (DNAML-F84)over 1,287 conserved columns identified by using the Lane mask(36). Sequences were assigned to a taxonomic node by using asliding scale of similarity threshold (37). These steps are describedin detail in SI Materials and Methods, and a full comparison betweenclone and PhyloChip analysis is available in SI Table 3.
Validation of PhyloChip-Detected Subfamilies Not Supported by theClone Library. Primers targeting sequences within particular taxa/subfamilies were generated by using ARB’s probe design feature(38) and based on regions targeted by PhyloChip probes or wereobtained from published literature (SI Table 4). Primer qualitycontrol was carried out by using Primer3 (39).
Quantitative Detection of Changes in 16S rRNA Gene Concentration inHeterogeneous Solutions. To determine whether changes in 16SrRNA gene concentration could be detected by using thePhyloChip, various quantities of distinct rRNA gene types werehybridized to the PhyloChip in rotating combinations. We choseenvironmental organisms, organisms involved in bioremedia-tion, and a pathogen of biodefense relevance. 16S rRNA geneswere amplified from each of the organisms shown in SI Table 5.Then each of these nine distinct 16S rRNA gene standards wastested once in each concentration category, spanning five ordersof magnitude (0 molecules, 6 $ 107, 1.44 $ 108, 3.46 $ 108,8.30 $ 108, 1.99 $ 109, 4.78 $ 109, 2.75 $ 1010, 6.61 $ 1010, and1.59 $ 1011) with concentrations of individual 16S rRNA genetypes rotating between PhyloChips such that each PhyloChipcontained the same total of 16S rRNA gene molecules. This issimilar to a Latin Square design, although with a 9 $ 11 formatmatrix.
Real-Time Quantitative PCR Confirmation of PhyloChip-ObservedShifts in Taxon Abundance. A taxon (no. 9389) consisting only oftwo sequences of Pseudomonas oleovorans that correlated wellwith environmental variables was chosen for quantitative PCRconfirmation of PhyloChip-observed quantitative shifts. Primersfor this taxon were designed by using the ARB (38) probe matchfunction to determine unique priming sites based on regions
Brodie et al. PNAS ! January 2, 2007 ! vol. 104 ! no. 1 ! 303
MIC
ROBI
OLO
GY
detected by PhyloChip probes. These regions then were imputedinto Primer3 (39) to choose optimal oligonucleotide primers forPCR. Primer quality was assessed further by using BeaconDesigner v3.0 (Premier BioSoft, CA). Primers 9389F2 (CGAC-TACCTGGACTGACACT) and 9389R2 (CACCGGCAG-TCTCCTTAGAG) were chosen to amplify a 436-bp fragment.Validation of primer specificity and reaction conditions areavailable in SI Materials and Methods.
Statistical Analyses. All statistical operations were performed inthe R software environment (ref. 40; www.R-project.org). Foreach day of aerosol sampling, 15 factors including humidity,wind, temperature, precipitation, pressure, particulate matter,and week of year were recorded from the U.S. National ClimaticData Center (www.ncdc.noaa.gov) or the Texas Natural Re-source Conservation Commission (www.tceq.state.tx.us). Theweekly mean, minimum, maximum, and range of values werecalculated for each factor from the collected data. The changesin ln(intensity) for each PhyloChip taxon considered present inthe study was tested for correlation against the environmentalconditions. The resulting P values were adjusted by using thestep-up false discovery rate controlling procedure (41).
Multivariate regression tree analysis (22, 23) was carried outby using the package ‘‘mvpart’’ within the ‘‘R’’ statistical pro-gramming environment. A Bray-Curtis-based distance matrixwas created by using the function ‘‘gdist.’’ The Bray-Curtismeasure of dissimilarity is generally regarded as a good measureof ecological distance when dealing with ‘‘species’’ abundance, orin this case, array probe-set intensity, because it allows fornonlinear responses to environmental gradients (22, 42). Large
trees were calculated with splitting based on information gainand then pruned (from 13 to 10 nodes) based on 100 cross-validations to a complexity parameter of 0.025286, where cross-validation relative error had reached a plateau.
Before clone library rarefaction analysis, a distance matrix(DNAML homology) of clone sequences, was created by usingan online tool at http://greengenes.lbl.gov/cgi-bin/nph-distance"matrix.cgi (43) after alignment of the sequences byusing the NAST aligner (http://greengenes.lbl.gov/NAST) (44).DOTUR (45) was used to generate rarefaction curves, Chao1,and ACE richness predictions and rank-abundance curves. Near-est neighbor joining was used with 1,000 iterations for boot-strapping.
We thank Dr. Phil Hugenholtz and Dr. Paul Richardson of the JointGenome Institute for clone library sequencing; Susannah Green Tringefor providing the soil 16S rRNA gene sequences; Sonya Murray forexpert technical assistance; John Coates, Lisa Alvarez-Cohen (both ofUniversity of California, Berkeley, CA), Hoi-Ying Holman, Terry Hazen(both of Lawrence Berkeley National Laboratory), and Arthur Fried-lander (U.S. Army Medical Research Institute of Infectious Diseases,Frederick, MD) for the generous gifts of bacterial cultures or DNA; andSue Lynch, Terry Hazen, Jill Banfield, Tamas Torok, and two anony-mous reviewers for helpful suggestions and comments on the manuscript.This work was performed under the auspices of the U.S. Department ofEnergy by the University of California, Lawrence Berkeley NationalLaboratory, under Contract DE-AC02-05CH11231 and was supported inpart by Department of Homeland Security Grant HSSCHQ04X00037and the Climate Change Research Division, Biological and Environ-mental Research, Office of Science, U.S. Department of Energy. Com-putational support was provided through the Virtual Institute forMicrobial Stress and Survival.
1. Lindemann J, Upper CD (1985) Appl Environ Microbiol 50:1229–1232.2. Baylor ER, Peters V, Baylor MB (1977) Science 197:763–764.3. Aller JY, Kuznetsova MR, Jahns CJ, Kemp PF (2005) J Aerosol Sci 36:801–812.4. Shinn EA, Griffin DW, Seba DB (2003) Arch Environ Health 58:498–504.5. World Health Organization (2003) Meningococcal Meningitis Fact Sheet (World
Health Org, Geneva).6. Shinn EA, Smith GW, Prospero JM, Betzer P, Hayes ML, Garrison V, Barber
RT (2000) Geophys Res Lett 27:3029–3032.7. Gyan K, Henry W, Lacaille S, Laloo A, Lamsee-Ebanks C, McKay S, Antoine
RM, Monteil MA (2005) Int J Biometeorol 49:371–376.8. Anda P, del Pozo JS, Garcia JMD, Escudero R, Pena FJG, Velasco MCL,
Sellek RE, Chillaron MRJ, Serrano LPS, Navarro JFM (2001) Emerg Infect Dis7:575–582.
9. Barns SM, Grow CC, Okinaka RT, Keim P, Kuske CR (2005) Appl EnvironMicrobiol 71:5494–5500.
10. Bauer H, Fuerhacker M, Zibuschka F, Schmid H, Puxbaum H (2002) Water Res36:3965–3970.
11. Griffin DW (2004) Aerobiologia 20:135–140.12. Lee T, Grinshpun SA, Martuzevicius D, Adhikari A, Crawford CM, Luo J,
Reponen T (2006) Indoor Air 16:37–47.13. Hughes KA, McCartney HA, Lachlan-Cope TA, Pearce DA (2004) Cell Mol
Biol 50:537–542.14. Maron PA, Lejon DPH, Carvalho E, Bizet K, Lemanceau P, Ranjard L, Mougel
C (2005) Atmos Environ 39:3687–3695.15. Mei R, Hubbell E, Bekiranov S, Mittmann M, Christians FC, Shen M-M, Lu
G, Fang J, Liu W-M, Ryder T, et al. (2003) Proc Natl Acad Sci USA100:11237–11242.
16. Polz MF, Cavanaugh CM (1998) Appl Environ Microbiol 64:3724–3730.17. Lueders T, Friedrich MW (2003) Appl Environ Microbiol 69:320–326.18. Heyrman J, Vanparys B, Logan NA, Balcaen A, Rodriguez-Diaz M, Felske A,
De Vos P (2004) Int J Syst Evol Microbiol 54:47–57.19. Heyrman J, Balcaen A, Rodriguez-Diaz M, Logan NA, Swings J, De Vos P
(2003) Int J Syst Evol Microbiol 53:459–463.20. Tringe SG, von Mering C, Kobayashi A, Salamov AA, Chen K, Chang HW,
Podar M, Short JM, Mathur EJ, Detter, JC, et al. (2005) Science 308:554–557.21. Gans J, Wolinsky M, Dunbar J (2005) Science 309:1387–1390.22. De’Ath G (2002) Ecology 83:1105–1117.
23. Larsen DR, Speckman PL (2004) Biometrics 60:543–549.24. Kim H, Nishiyama W, Kunito T, Senoo K, Kawahara K, Murakami K, Oyaizu
H (1998) J Appl Microbiol 85:731–736.25. Busse HJ, Denner EBM, Buczolits S, Salkinoja-Salonen M, Bennasar A,
Kampfer P (2003) Int J Syst Evol Microbiol 53:1253–1260.26. Wesley IV, Wells SJ, Harmon KM, Green A, Schroeder-Tucker L, Glover M,
Siddique I (2000) Appl Environ Microbiol 66:1994–2000.27. Engberg J, On SLW, Harrington CS, Gerner-Smidt P (2000) J Clin Microbiol
38:286–291.28. Hughes KA (2003) Atmos Environ 37:3147–3155.29. DeSantis TZ, Stone CE, Murray SR, Moberg JP, Andersen GL (2005) FEMS
Microbiol Lett 245:271–278.30. Brodie EL, DeSantis TZ, Joyner DC, Baek S, Larsen JT, Andersen GL, Hazen
TC, Richardson PM, Herman DJ, Tokunaga TK, et al. (2006) Appl EnvironMicrobiol 72:6288–6298.
31. Ewing B, Hillier L, Wendl MC, Green P (1998) Genome Res 8:175–185.32. Ewing B, Green P (1998) Genome Res 8:186–194.33. Gordon D, Abajian C, Green P (1998) Genome Res 8:195–202.34. Huber T, Faulkner G, Hugenholtz P (2004) Bioinformatics 20:2317–2319.35. Felsenstein J (1989) Cladistics 5:164–166.36. Lane DJ (1991) in Nucleic Acid Techniques in Bacterial Systematics, eds
Stackebrandt E, Goodfellow M (Wiley, New York), pp 115–175.37. Schloss PD, Handelsman J (2004) Microbiol Mol Biol Rev 68:686–691.38. Ludwig W, Strunk O, Westram R, Richter L, Meier H, Yadhukumar, Buchner
A, Lai T, Steppi S, Jobb G, et al. (2004) Nucleic Acids Res 32:1363–1371.39. Rozen S, Skaletsky H (2000) in Bioinformatics Methods and Protocols: Methods
in Molecular Biology, eds Krawetz S, Misener S (Humana, Totowa, NJ), pp365–386.
40. R Development Core Team (2005) R: A Language and Environment forStatistical Computing (R Found Stat Comput, Vienna).
41. Benjamini Y, Hochberg Y (1995) J R Stat Soc B 57:289–300.42. Faith DP, Minchin PR, Belbin L (1987) Vegetatio 69:57–68.43. DeSantis TZ, Hugenholtz P, Larsen N, Rojas M, Brodie EL, Keller K, Huber
T, Dalevi D, Hu P, Andersen GL (2006) Appl Environ Microbiol 72:5069–5072.44. DeSantis TZ, Hugenholtz P, Keller K, Brodie EL, Larsen N, Piceno YM, Phan
R, Andersen GL (2006) Nucleic Acids Res 34:W394–W399.45. Schloss PD, Handelsman J (2005) Appl Environ Microbiol 71:1501–1506.
304 ! www.pnas.org"cgi"doi"10.1073"pnas.0608255104 Brodie et al.
Related Documents