Uranium mobility and accumulation along the Rio Paguate, Jackpile Mine in Laguna Pueblo, NM† Johanna M. Blake, ‡ * a Cherie L. De Vore, b Sumant Avasarala, b Abdul-Mehdi Ali, c Claudia Roldan, a Fenton Bowers, d Michael N. Spilde, c Kateryna Artyushkova, e Matthew F. Kirk, f Eric Peterson, g Lucia Rodriguez-Freire b and Jos ´ e M. Cerrato * b The mobility and accumulation of uranium (U) along the Rio Paguate, adjacent to the Jackpile Mine, in Laguna Pueblo, New Mexico was investigated using aqueous chemistry, electron microprobe, X-ray diffraction and spectroscopy analyses. Given that it is not common to identify elevated concentrations of U in surface water sources, the Rio Paguate is a unique site that concerns the Laguna Pueblo community. This study aims to better understand the solid chemistry of abandoned mine waste sediments from the Jackpile Mine and identify key hydrogeological and geochemical processes that affect the fate of U along the Rio Paguate. Solid analyses using X-ray fluorescence determined that sediments located in the Jackpile Mine contain ranges of 320 to 9200 mg kg 1 U. The presence of coffinite, a U(IV)-bearing mineral, was identified by X-ray diffraction analyses in abandoned mine waste solids exposed to several decades of weathering and oxidation. The dissolution of these U-bearing minerals from abandoned mine wastes could contribute to U mobility during rain events. The U concentration in surface waters sampled closest to mine wastes are highest during the southwestern monsoon season. Samples collected from September 2014 to August 2016 showed higher U concentrations in surface water adjacent to the Jackpile Mine (35.3 to 772 mgL 1 ) compared with those at a wetland 4.5 kilometers downstream of the mine (5.77 to 110 mgL 1 ). Sediments co-located in the stream bed and bank along the reach between the mine and wetland had low U concentrations (range 1–5 mg kg 1 ) compared to concentrations in wetland sediments with higher organic matter (14–15%) and U concentrations (2–21 mg kg 1 ). Approximately 10% of the total U in wetland sediments was amenable to complexation with 1 mM sodium bicarbonate in batch experiments; a decrease of U concentration in solution was observed over time in these experiments likely due to re-association with sediments in the reactor. The findings from this study provide new insights about how hydrologic events may affect the reactivity of U present in mine waste solids exposed to surface oxidizing conditions, and the influence of organic-rich sediments on U accumulation in the Rio Paguate. Environmental impact Uranium mobility and accumulation in the environment can affect surface water and sediment chemistry. Here, we investigated the mobility of uranium in water and accumulation on sediments along the Rio Paguate and within a wetland and reservoir 5 km south of the Jackpile Mine. Main ndings of the study suggest that ore and mine waste from surcial locations of the Jackpile Mine are the source of uranium in the surface water. Additionally, the concentration of uranium in the Rio Paguate varies seasonally, with higher concentrations during the southwestern monsoon season. The uranium concentration in surface water decreases downstream of the mine and adsorption of uranium to organic-containing sediments in a wetland 5 km downstream contributes to this decrease. These results have important implications to better understand the mobility and accumulation of uranium in the environment. a Department of Chemistry, MSC03 2060, University of New Mexico, Albuquerque, New Mexico 87131, USA. E-mail: [email protected] b Department of Civil Engineering, MSC01 1070, University of New Mexico, Albuquerque, New Mexico 87131, USA. E-mail: [email protected] c Department of Earth and Planetary Sciences, MSC03 2040, University of New Mexico, Albuquerque, New Mexico 87131, USA d Department of Nuclear Engineering, MSC01 1120, University of New Mexico, Albuquerque, New Mexico 87131, USA e Department of Chemical and Biological Engineering, MSC01 1120, University of New Mexico, Albuquerque, New Mexico 87131, USA f Department of Geology, Kansas State University, 108 Thompson Hall, Manhattan, KS 66506-3201, USA g Department of Chemical and Biological Engineering, Center for Microengineered Materials, University of New Mexico, MSC 01 1120, Albuquerque, New Mexico 87131, USA † Electronic supplementary information (ESI) available. See DOI: 10.1039/c6em00612d ‡ Present address: U.S. Geological Survey, 6700 Edith Blvd., NE Albuquerque, New Mexico 87113, USA. Cite this: Environ. Sci.: Processes Impacts, 2017, 19, 605 Received 15th November 2016 Accepted 5th March 2017 DOI: 10.1039/c6em00612d rsc.li/process-impacts This journal is © The Royal Society of Chemistry 2017 Environ. Sci.: Processes Impacts, 2017, 19, 605–621 | 605 Environmental Science Processes & Impacts PAPER Published on 06 March 2017. Downloaded by UNITED STATES GEOLOGICAL SURVEY on 12/12/2017 17:07:30. View Article Online View Journal | View Issue

Welcome message from author
This document is posted to help you gain knowledge. Please leave a comment to let me know what you think about it! Share it to your friends and learn new things together.
Transcript
EnvironmentalScienceProcesses & Impacts
PAPER
Publ
ishe
d on
06
Mar
ch 2
017.
Dow
nloa
ded
by U
NIT
ED S
TATE
S G
EOLO
GIC
AL
SUR
VEY
on
12/1
2/20
17 1
7:07
:30.
View Article OnlineView Journal | View Issue
Uranium mobility
aDepartment of Chemistry, MSC03 2060, U
New Mexico 87131, USA. E-mail: jmtblake@bDepartment of Civil Engineering, MSC0
Albuquerque, New Mexico 87131, USA. E-mcDepartment of Earth and Planetary Scien
Mexico, Albuquerque, New Mexico 87131, UdDepartment of Nuclear Engineering, MSC
Albuquerque, New Mexico 87131, USAeDepartment of Chemical and Biological En
New Mexico, Albuquerque, New Mexico 871
Cite this: Environ. Sci.: ProcessesImpacts, 2017, 19, 605
Received 15th November 2016Accepted 5th March 2017
DOI: 10.1039/c6em00612d
rsc.li/process-impacts
This journal is © The Royal Society of C
and accumulation along the RioPaguate, Jackpile Mine in Laguna Pueblo, NM†
Johanna M. Blake, ‡*a Cherie L. De Vore,b Sumant Avasarala,b Abdul-Mehdi Ali,c
Claudia Roldan,a Fenton Bowers,d Michael N. Spilde,c Kateryna Artyushkova,e
Matthew F. Kirk,f Eric Peterson,g Lucia Rodriguez-Freire b and Jose M. Cerrato*b
The mobility and accumulation of uranium (U) along the Rio Paguate, adjacent to the Jackpile Mine, in Laguna
Pueblo, New Mexico was investigated using aqueous chemistry, electron microprobe, X-ray diffraction and
spectroscopy analyses. Given that it is not common to identify elevated concentrations of U in surface water
sources, the Rio Paguate is a unique site that concerns the Laguna Pueblo community. This study aims to
better understand the solid chemistry of abandoned mine waste sediments from the Jackpile Mine and
identify key hydrogeological and geochemical processes that affect the fate of U along the Rio Paguate.
Solid analyses using X-ray fluorescence determined that sediments located in the Jackpile Mine contain
ranges of 320 to 9200 mg kg�1 U. The presence of coffinite, a U(IV)-bearing mineral, was identified by X-ray
diffraction analyses in abandoned mine waste solids exposed to several decades of weathering and
oxidation. The dissolution of these U-bearing minerals from abandoned mine wastes could contribute to U
mobility during rain events. The U concentration in surface waters sampled closest to mine wastes are
highest during the southwestern monsoon season. Samples collected from September 2014 to August 2016
showed higher U concentrations in surface water adjacent to the Jackpile Mine (35.3 to 772 mg L�1)
compared with those at a wetland 4.5 kilometers downstream of the mine (5.77 to 110 mg L�1). Sediments
co-located in the stream bed and bank along the reach between the mine and wetland had low U
concentrations (range 1–5 mg kg�1) compared to concentrations in wetland sediments with higher organic
matter (14–15%) and U concentrations (2–21 mg kg�1). Approximately 10% of the total U in wetland
sediments was amenable to complexation with 1 mM sodium bicarbonate in batch experiments; a decrease
of U concentration in solution was observed over time in these experiments likely due to re-association with
sediments in the reactor. The findings from this study provide new insights about how hydrologic events
may affect the reactivity of U present in mine waste solids exposed to surface oxidizing conditions, and the
influence of organic-rich sediments on U accumulation in the Rio Paguate.
Environmental impact
Uraniummobility and accumulation in the environment can affect surface water and sediment chemistry. Here, we investigated the mobility of uranium in water andaccumulation on sediments along the Rio Paguate and within a wetland and reservoir 5 km south of the Jackpile Mine. Main ndings of the study suggest that ore andmine waste from surcial locations of the Jackpile Mine are the source of uranium in the surface water. Additionally, the concentration of uranium in the Rio Paguatevaries seasonally, with higher concentrations during the southwestern monsoon season. The uranium concentration in surface water decreases downstream of themine and adsorption of uranium to organic-containing sediments in a wetland 5 km downstream contributes to this decrease. These results have importantimplications to better understand the mobility and accumulation of uranium in the environment.
niversity of New Mexico, Albuquerque,
usgs.gov
1 1070, University of New Mexico,
ail: [email protected]
ces, MSC03 2040, University of New
SA
01 1120, University of New Mexico,
gineering, MSC01 1120, University of
31, USA
fDepartment of Geology, Kansas State University, 108 Thompson Hall, Manhattan,
KS 66506-3201, USAgDepartment of Chemical and Biological Engineering, Center for Microengineered
Materials, University of New Mexico, MSC 01 1120, Albuquerque, New Mexico
87131, USA
† Electronic supplementary information (ESI) available. See DOI:10.1039/c6em00612d
‡ Present address: U.S. Geological Survey, 6700 Edith Blvd., NE Albuquerque,New Mexico 87113, USA.
hemistry 2017 Environ. Sci.: Processes Impacts, 2017, 19, 605–621 | 605
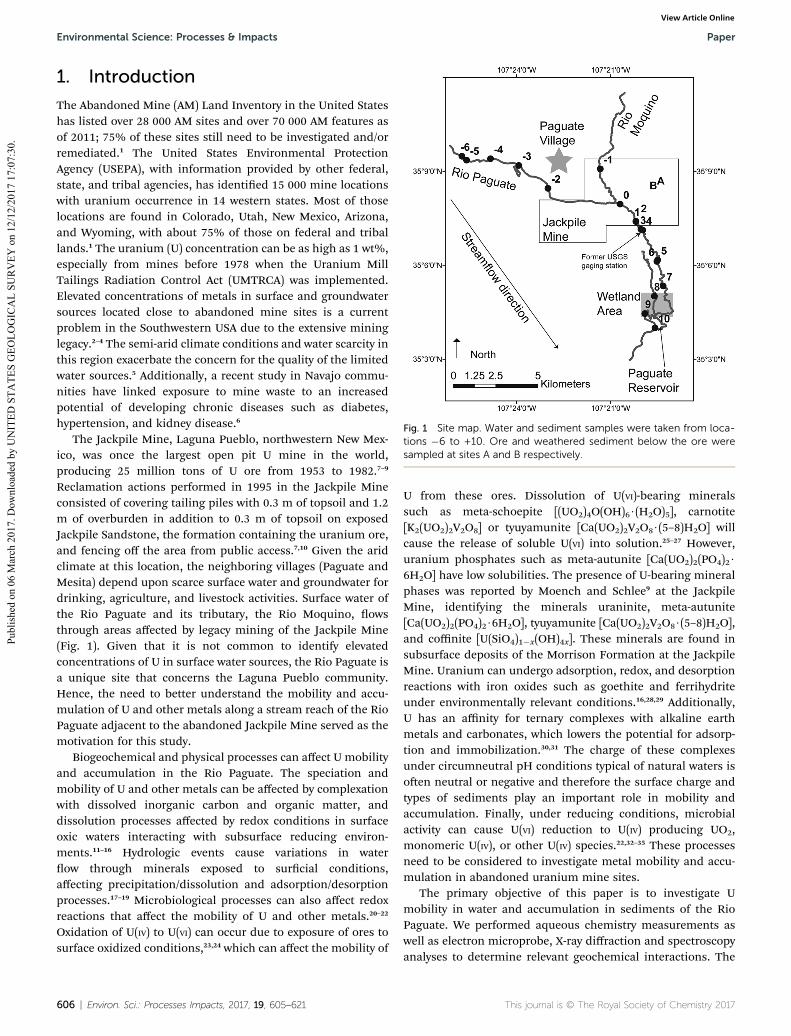
Fig. 1 Site map. Water and sediment samples were taken from loca-tions �6 to +10. Ore and weathered sediment below the ore weresampled at sites A and B respectively.
Environmental Science: Processes & Impacts Paper
Publ
ishe
d on
06
Mar
ch 2
017.
Dow
nloa
ded
by U
NIT
ED S
TATE
S G
EOLO
GIC
AL
SUR
VEY
on
12/1
2/20
17 1
7:07
:30.
View Article Online
1. Introduction
The Abandoned Mine (AM) Land Inventory in the United Stateshas listed over 28 000 AM sites and over 70 000 AM features asof 2011; 75% of these sites still need to be investigated and/orremediated.1 The United States Environmental ProtectionAgency (USEPA), with information provided by other federal,state, and tribal agencies, has identied 15 000 mine locationswith uranium occurrence in 14 western states. Most of thoselocations are found in Colorado, Utah, New Mexico, Arizona,and Wyoming, with about 75% of those on federal and triballands.1 The uranium (U) concentration can be as high as 1 wt%,especially from mines before 1978 when the Uranium MillTailings Radiation Control Act (UMTRCA) was implemented.Elevated concentrations of metals in surface and groundwatersources located close to abandoned mine sites is a currentproblem in the Southwestern USA due to the extensive mininglegacy.2–4 The semi-arid climate conditions and water scarcity inthis region exacerbate the concern for the quality of the limitedwater sources.5 Additionally, a recent study in Navajo commu-nities have linked exposure to mine waste to an increasedpotential of developing chronic diseases such as diabetes,hypertension, and kidney disease.6
The Jackpile Mine, Laguna Pueblo, northwestern New Mex-ico, was once the largest open pit U mine in the world,producing 25 million tons of U ore from 1953 to 1982.7–9
Reclamation actions performed in 1995 in the Jackpile Mineconsisted of covering tailing piles with 0.3 m of topsoil and 1.2m of overburden in addition to 0.3 m of topsoil on exposedJackpile Sandstone, the formation containing the uranium ore,and fencing off the area from public access.7,10 Given the aridclimate at this location, the neighboring villages (Paguate andMesita) depend upon scarce surface water and groundwater fordrinking, agriculture, and livestock activities. Surface water ofthe Rio Paguate and its tributary, the Rio Moquino, owsthrough areas affected by legacy mining of the Jackpile Mine(Fig. 1). Given that it is not common to identify elevatedconcentrations of U in surface water sources, the Rio Paguate isa unique site that concerns the Laguna Pueblo community.Hence, the need to better understand the mobility and accu-mulation of U and other metals along a stream reach of the RioPaguate adjacent to the abandoned Jackpile Mine served as themotivation for this study.
Biogeochemical and physical processes can affect U mobilityand accumulation in the Rio Paguate. The speciation andmobility of U and other metals can be affected by complexationwith dissolved inorganic carbon and organic matter, anddissolution processes affected by redox conditions in surfaceoxic waters interacting with subsurface reducing environ-ments.11–16 Hydrologic events cause variations in waterow through minerals exposed to surcial conditions,affecting precipitation/dissolution and adsorption/desorptionprocesses.17–19 Microbiological processes can also affect redoxreactions that affect the mobility of U and other metals.20–22
Oxidation of U(IV) to U(VI) can occur due to exposure of ores tosurface oxidized conditions,23,24 which can affect the mobility of
606 | Environ. Sci.: Processes Impacts, 2017, 19, 605–621
U from these ores. Dissolution of U(VI)-bearing mineralssuch as meta-schoepite [(UO2)4O(OH)6$(H2O)5], carnotite[K2(UO2)2V2O8] or tyuyamunite [Ca(UO2)2V2O8$(5–8)H2O] willcause the release of soluble U(VI) into solution.25–27 However,uranium phosphates such as meta-autunite [Ca(UO2)2(PO4)2$6H2O] have low solubilities. The presence of U-bearing mineralphases was reported by Moench and Schlee9 at the JackpileMine, identifying the minerals uraninite, meta-autunite[Ca(UO2)2(PO4)2$6H2O], tyuyamunite [Ca(UO2)2V2O8$(5–8)H2O],and coffinite [U(SiO4)1�x(OH)4x]. These minerals are found insubsurface deposits of the Morrison Formation at the JackpileMine. Uranium can undergo adsorption, redox, and desorptionreactions with iron oxides such as goethite and ferrihydriteunder environmentally relevant conditions.16,28,29 Additionally,U has an affinity for ternary complexes with alkaline earthmetals and carbonates, which lowers the potential for adsorp-tion and immobilization.30,31 The charge of these complexesunder circumneutral pH conditions typical of natural waters isoen neutral or negative and therefore the surface charge andtypes of sediments play an important role in mobility andaccumulation. Finally, under reducing conditions, microbialactivity can cause U(VI) reduction to U(IV) producing UO2,monomeric U(IV), or other U(IV) species.22,32–35 These processesneed to be considered to investigate metal mobility and accu-mulation in abandoned uranium mine sites.
The primary objective of this paper is to investigate Umobility in water and accumulation in sediments of the RioPaguate. We performed aqueous chemistry measurements aswell as electron microprobe, X-ray diffraction and spectroscopyanalyses to determine relevant geochemical interactions. The
This journal is © The Royal Society of Chemistry 2017
Paper Environmental Science: Processes & Impacts
Publ
ishe
d on
06
Mar
ch 2
017.
Dow
nloa
ded
by U
NIT
ED S
TATE
S G
EOLO
GIC
AL
SUR
VEY
on
12/1
2/20
17 1
7:07
:30.
View Article Online
specic objectives are: (a) determine the chemical compositionof abandoned ores at the Jackpile Mine and adjacent areas inthe Rio Paguate; (b) assess the uctuations of U and co-occur-ring metal concentrations in aqueous and sediment samplesalong a reach of the Rio Paguate; and, (c) investigate the accu-mulation and distribution of U in sediments along the RioPaguate. This interdisciplinary work seeks to better understandhow the complex interaction betweenmine waste solids, surfacewater quality, and river sediments affects the fate of U. Thendings from this study provide new insights about howhydrologic events may affect the reactivity of U present in minewaste solids exposed to surface oxidizing conditions, and theinuence of organic-rich sediments on U accumulation in theRio Paguate. This information has relevant implications for thedevelopment of risk assessment and remediation strategiesrelevant to decision makers and communities dealing withmining legacy issues.
2. Study area
The Jackpile Mine is located in the Grants-Laguna District, whereU deposits are present in Jurassic and Cretaceous strata. TheJackpile Sandstone, found in the uppermost part of the BrushyBasin Shale Member of the Jurassic Morrison Formation, is thedominant ore bearing unit.9,36,37 The source of the uranium couldbe volcanic glasses which were altered aer deposition.38 Roughly
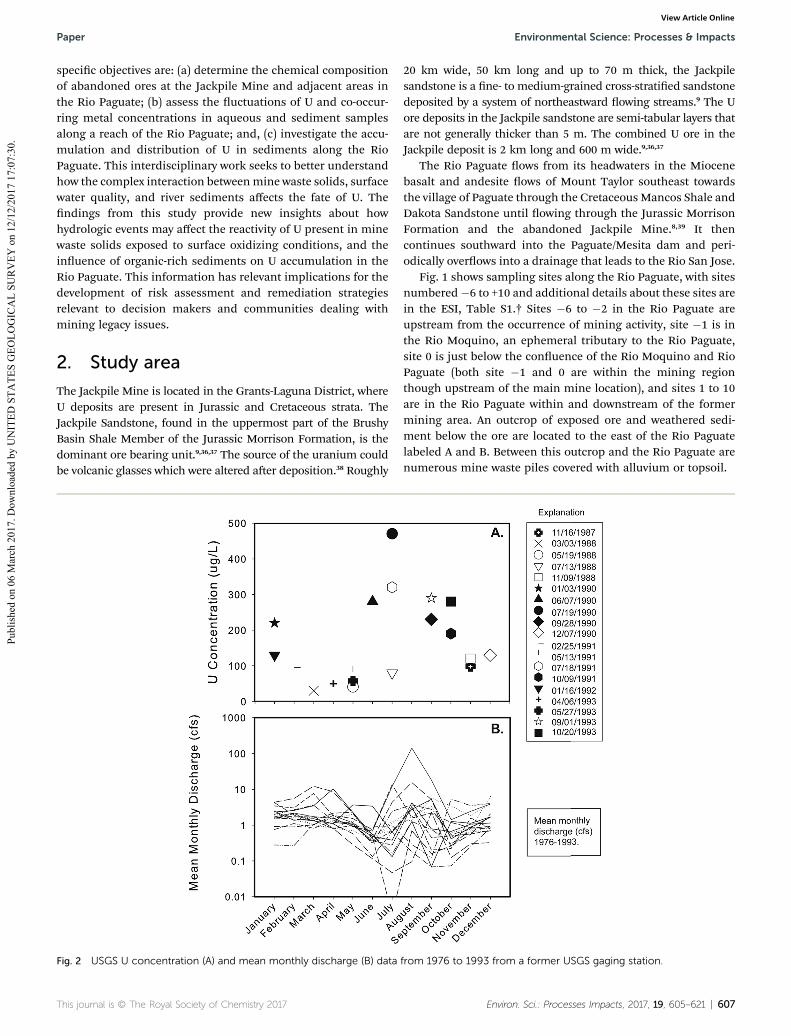
Fig. 2 USGS U concentration (A) and mean monthly discharge (B) data
This journal is © The Royal Society of Chemistry 2017
20 km wide, 50 km long and up to 70 m thick, the Jackpilesandstone is a ne- to medium-grained cross-stratied sandstonedeposited by a system of northeastward owing streams.9 The Uore deposits in the Jackpile sandstone are semi-tabular layers thatare not generally thicker than 5 m. The combined U ore in theJackpile deposit is 2 km long and 600 m wide.9,36,37
The Rio Paguate ows from its headwaters in the Miocenebasalt and andesite ows of Mount Taylor southeast towardsthe village of Paguate through the Cretaceous Mancos Shale andDakota Sandstone until owing through the Jurassic MorrisonFormation and the abandoned Jackpile Mine.8,39 It thencontinues southward into the Paguate/Mesita dam and peri-odically overows into a drainage that leads to the Rio San Jose.
Fig. 1 shows sampling sites along the Rio Paguate, with sitesnumbered�6 to +10 and additional details about these sites arein the ESI, Table S1.† Sites �6 to �2 in the Rio Paguate areupstream from the occurrence of mining activity, site �1 is inthe Rio Moquino, an ephemeral tributary to the Rio Paguate,site 0 is just below the conuence of the Rio Moquino and RioPaguate (both site �1 and 0 are within the mining regionthough upstream of the main mine location), and sites 1 to 10are in the Rio Paguate within and downstream of the formermining area. An outcrop of exposed ore and weathered sedi-ment below the ore are located to the east of the Rio Paguatelabeled A and B. Between this outcrop and the Rio Paguate arenumerous mine waste piles covered with alluvium or topsoil.
from 1976 to 1993 from a former USGS gaging station.
Environ. Sci.: Processes Impacts, 2017, 19, 605–621 | 607
Environmental Science: Processes & Impacts Paper
Publ
ishe
d on
06
Mar
ch 2
017.
Dow
nloa
ded
by U
NIT
ED S
TATE
S G
EOLO
GIC
AL
SUR
VEY
on
12/1
2/20
17 1
7:07
:30.
View Article Online
The United States Geological Survey (USGS) maintaineda discharge gaging station along the Rio Paguate (35�0700900,�107�1905700) (Fig. 1) from 1976 to 1993, measuring dischargeand U concentrations (as well as other constituents). Asa reference, Fig. 2a illustrates the U concentration reported byUSGS from the gaging station site (located near site 1 and 2, thisstudy) and Fig. 2b shows the discharge data from the Rio Pag-uate from 1976 to 1993.40 The Jackpile Mine was in operationfrom 1953 to 1982; therefore the data collected from the gagingstation report 6 years of active mining followed by 11 years ofmining closure. The gage was not in operation during thereclamation of the site which started in 1995. The lowest Uconcentrations measured by the USGS were sampled in March1988 (30 mg L�1) and May 1988 (41 mg L�1) while the highest Uconcentrations measured by the USGS were sampled in July1990 (470 mg L�1) and July 1991 (320 mg L�1). These data havesimilar variation in concentration during the year compared tothe data collected in this study. Additionally, the U concentra-tions from these historic data appear to have a relationship withdischarge, an observation that is seen in this study and will bediscussed later in the manuscript. The USGS U concentrationswere measured by extraction or direct uorimetry, neutronactivation, or ICP-MS.
3. Materials and methods3.1 Water and sediment sampling
Forty-three surface water samples were collected at a total of 17locations at various dates along the Rio Paguate from theheadwaters to the Paguate/Mesita dam (Fig. 1 and Table S1†).One sample was collected in September 2014, 11 samples inNovember 2014, 10 samples in February 2015, 4 samples inMarch 2015, 1 sample in June 2015, 4 samples in August 2015, 4samples in September 2015, 3 samples in May, 2016, 2 samplesin June and July 2016, and only one sample in August 2016 dueto the low water level along the river. The authors were requiredto have an escort from Laguna Pueblo Environmental andNatural Resources Department while conducting sampling.Staff escort time constraints reduced the number of possiblesampling locations during certain sampling events; thereforeefforts were made to sample across a reasonable distribution ofsites at each sampling event. Two hundred and y milliliterswere collected for each sample using trace metal grade nitricacid (HNO3, 67–70% by mass) cleaned polypropylene (PP) Nal-gene bottles. Each bottle was rinsed with surface water threetimes before the nal sample was collected with zero head spacewhen possible. The width of the Rio Paguate and Rio Moquinoranges from 1.5 m to 6 m across and therefore grab sampleswere collected rather than integrated samples. Hyporheic zonewaters were sampled 8 cm and 15 cm below the sediment–waterinterface at site 1 using a polyvinyl chloride (PVC) pipe, PPtubing, and 50 mL syringes. Field parameters were measuredwith a Thermo Scientic Orion Star A329 pH/temp/conductivityprobe. Samples were placed on ice in a cooler for transport tothe laboratory for immediate processing and preservation. Allwater samples were ltered with 0.45 mm Whatman lters anda subset of waters was ltered with 0.22 mm lters in the
608 | Environ. Sci.: Processes Impacts, 2017, 19, 605–621
laboratory. Samples for analysis by Inductively Coupled Plasmawere preserved to a pH # 2 with ultrapure nitric acid by addingbetween 0.5 and 1 mL to each sample. The hyporheic zonewaters and related surface waters were analyzed as total water(unltered and digested with ultrapure nitric acid), less than0.45 mm, and less than 0.22 mm. Lab blanks and two qualitycontrol (QC) standards were used during analysis, one ata concentration of 25% of the highest calibration standard andone at a concentration of 75% of the highest calibration stan-dard. The latter QC standard (75% of the highest calibrationstandard) was checked every 15 samples to monitor potentialinstrument dri.
A total of eighty sediment samples were collected witha hand trowel (cleaned between each use with DI water) andplaced in gallon plastic bags for transport to the laboratory at:an ore outcrop (site A, Fig. 1); weathered sediment below the ore(site B, Fig. 1); and, in the stream bank and stream bed at sites�6 to 10 with repeat sediments collected at sites 1 to 10. Sedi-ment cores of the hyporheic zone were collected in 1 1/14 inchPVC pipes at site 1. Sediments were dried overnight in an ovenat 80 �C prior to use. Homogenized sediment samples weredigested in duplicate for analysis using 1 gram of sediment andaqua regia [2 mL HNO3 and 6 mL hydrochloric acid (HCl, 34–37% by mass, trace metal grade)]. The extracted solution fromthe sediment digestion was measured as described in the nextsubsection to determine extractable elemental concentrationamenable to reaction with aqua regia. The grain size in thestream bank and bed ranged from silt/clay to sand.
3.2 Solution chemistry analyses
Major elemental contents of ltered and acidied watersamples and acid digested sediments were analyzed usinga PerkinElmer Optima 5300DV Inductively Coupled Plasma-Optical Emission Spectrometer (ICP-OES). A PerkinElmer Nex-ION 300D (Dynamic Reaction Cell) Inductively Coupled Plasma-Mass Spectrometer (ICP-MS) was used for trace element (U, Cr,Pb, As) analysis. A ThermoFisher Scientic Ion Chromatogram(ICS-1100) was used to analyze 0.45 mm ltered, un-acidiedwater samples for anion concentration. Total Organic Carbon(TOC) was measured on a subset of 0.45 mm ltered, un-acidi-ed water samples using a Tekmar-Dohrmann Phoenix 8000TOC analyzer, which uses the UV-persulfate method.
3.3 Solid characterization analyses
Bulk sediment analysis was performed using X-ray uorescencewith a Rigaku ZSX with a rhodium X-ray tube that can beoperated from 200 to 4000 watts (End window, Rh-anode, 4 kW,60 kV) that delivers rapid quantitative determination of majorand minor atomic elements, from beryllium (Be) throughuranium (U), in a wide variety of sample types with minimalstandards. The soware is ZSX Primus II that performs bothqualitative and quantitative analysis. X-ray diffraction (XRD)was performed on the ore sample (location A), stream bedsediments from site 1 and site 9 using a Rigaku Smart Lab X-raydiffraction (XRD) using Cu Ka radiation with a scintillationdetector and a graphite monochromator, to obtain information
This journal is © The Royal Society of Chemistry 2017
Paper Environmental Science: Processes & Impacts
Publ
ishe
d on
06
Mar
ch 2
017.
Dow
nloa
ded
by U
NIT
ED S
TATE
S G
EOLO
GIC
AL
SUR
VEY
on
12/1
2/20
17 1
7:07
:30.
View Article Online
on the crystallinity, mineral structure, and normalized approx-imate percent amount of mineral phases present in the sedi-ment samples. The XRD data were analyzed using Jade®soware. An X-ray Photoelectron Spectrometer (XPS) was usedto acquire the near surface (<10 nm) elemental composition andoxidation states. A monochromatic Al source was used at 150 Wpower to obtain Fe 3p high resolution spectra from top �4 nmof the surface. Au reference powder was used to calibrate thespectra. Shirley background was used to process the spectra.Quantication utilized sensitivity factors that were provided bythe manufacturer. A 70% Gaussian/30% Lorentzian (GL (30))line shape was used for the curve ttings. Constraints used incurve tting were in correspondence with our previous study.2
Qualitative X-ray mapping of epoxy-mounted polished oresamples was performed on a JEOL 8200 electron microprobe.Maps were acquired at 20 kV accelerating voltage and 30 nAbeam current utilizing stage mapping at 2 mm steps (pixel) and100 ms dwell time per pixel. The K-a X-ray lines for Mg, P, S, K,Ca, Ti, V, and Fe; the L-a line of As; and the M-a line of U weremapped on 5 separate wavelength dispersive spectrometers (2passes per map area) simultaneously with the K-a lines for Aland Si on an energy dispersive spectrometer. A backscatteredelectron image was also acquired on each map area. The JEOLsoware utilizes a “free shape map” process in which undesir-able areas, such as epoxy, may be excluded from the overallmap; therefore map sizes varied according to the size of parti-cles mapped. Loss on ignition was performed to determine theorganic matter content in sediments by heating porcelaincrucibles in a muffle furnace at 550 �C for one hour, cooling,and weighing empty crucibles.
3.4 Laboratory batch experiments
These experiments were performed to evaluate the reaction of Uin sediments from site 9 with bicarbonate (a natural complex-ant) at pH and alkalinity values relevant to those observed in theRio Paguate. Other investigations have performed bicarbonateextractions to evaluate U amenable to complexation.2,41,42 Sedi-ments were dried overnight in an oven at 80 �C prior to use.These wetland samples (site 9) from February 2015 were sievedwith a US Standard #230mesh (63 mm) to analyze themobility ofU in ne sediments. Triplicate sediment samples (2 g each) wereweighed in 50 mL centrifuge tubes for reaction at pH 8.3 with:(a) 50 mL 1 mM HCO3
�; and, (b) 50 mL 18 MU DI water.Centrifuge tubes were placed on a rotator, with 6 mL sub-sampled each time at times 0.5, 1, 2, 4, 6, and 24 h. Sampleswere then ltered and diluted for analysis of U and other metalconcentrations using ICP-MS. The nal calculations ofconcentration took into account the change in volume overtime.
3.5 Extraction and amplication of DNA, and analysis ofsequencing data
Sediment and water samples collected from site 1 during theMarch sampling event were processed for microbial communityanalysis. Sediment was scooped into a sterile centrifuge tubeusing a ame sterilized spatula. Microorganisms in water were
This journal is © The Royal Society of Chemistry 2017
concentrated by ltering the water sample through a sterilemixed cellulose-ester lter membrane with 0.22 mm pores.Samples were stored in the eld on ice in a cooler and wereimmediately frozen (�20 �C) in the lab within 8 hours aercollection, which is acceptable as per the results in Lauber et al.(2010).43 Total community DNA was extracted from the sedi-ment and the water lter using an UltraClean® Soil DNAIsolation Kit (MO BIO).44 We contracted MR DNA® laboratory toamplify and sequence 16S rRNA genes in the samples. Thelaboratory amplied DNA over 30 cycles of PCR using the Hot-StarTaq Plus Master Mix Kit (Qiagen) under the followingconditions: 94 �C for 3 minutes, followed by 28 cycles of 94 �Cfor 30 seconds, 53 �C for 40 seconds and 72 �C for 1 minute.Following the nal cycle, the reaction sequence included anelongation step at 72 �C for 5 minutes. Reaction mixtures useduniversal primers 519F (GTGCCAGCMGCCGCGGTAA) and 806R(GGACTACVSGGGTATCTAAT) to cover the variable region V4 ofthe 16S rRNA gene.45
Aer amplication, the laboratory veried amplicationsuccess using electrophoresis, pooled samples together in equalproportions, and puried using calibrated Ampure XP beads.The pooled and puried PCR product was used to preparea DNA library by following the Illumina TruSeq DNA librarypreparation protocol. Paired-end 2 � 250 sequencing was per-formed on an Illumina MiSeq system following manufacturerguidelines.
We processed sequencing data using QIIME v. 1.8.0.46 Werst split samples according to barcodes and ltered thesequences to remove low-quality reads (script: split_librar-ies.py). Next, we generated operational taxonomic unit (OTU)tables at 97% similarity and evaluated taxonomy with uclust(script: pick_de_novo_otus.py). The method used the Green-genes reference dataset release 13_8;47 and assigned the mostdetailed lineage description shared by at least 90% of thesequences within each OTU. Lastly, we removed singletons andcreated taxonomy tables (scripts: lter_otus_from_otu_table.py,summarize_taxa_through_plots.py).
4. Results and discussion4.1 Solid analysis
Elevated concentrations of U were observed in the ore collectedfrom the Jackpile Mine (Table 1). The ore (location A, Fig. 1) hasthe highest concentration of U (9300 mg kg�1 or �1 wt%)measured by XRF, followed by the two sediment samples belowthe ore (location B, Fig. 1) (1400 and 320 mg kg�1). Thesesamples below the ore are weathered deposits with variablesediment distribution and geochemical concentrations, butprovide insight into the concentrations of U from these types ofdeposits. However, U concentrations were below detection limit(BDL) of the XRF (60 mg kg�1) in stream bed and bank sedi-ments collected from the Rio Paguate.
The presence of other co-occurring elements such as iron(Fe), phosphorus (P), sulfur (S), and vanadium (V) was alsodetermined within these samples. These elements are impor-tant considering their ability to form secondary minerals thatcould be associated with U, and a summary of their
Environ. Sci.: Processes Impacts, 2017, 19, 605–621 | 609
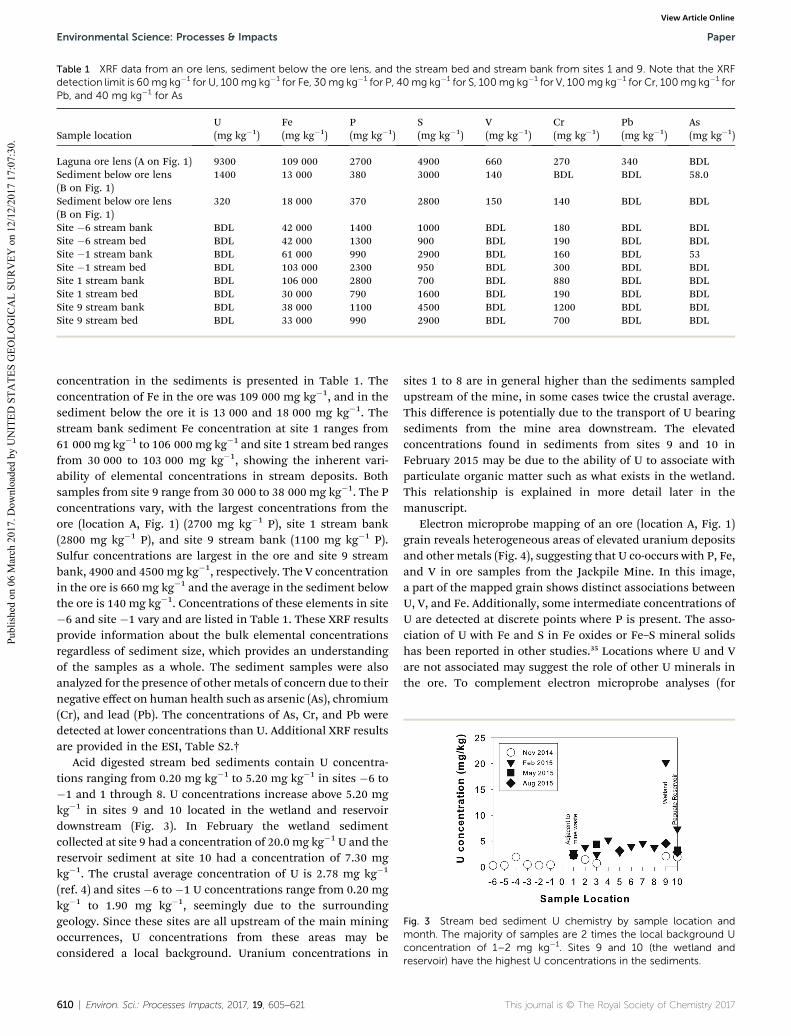
Table 1 XRF data from an ore lens, sediment below the ore lens, and the stream bed and stream bank from sites 1 and 9. Note that the XRFdetection limit is 60mg kg�1 for U, 100mg kg�1 for Fe, 30mg kg�1 for P, 40mg kg�1 for S, 100mg kg�1 for V, 100mg kg�1 for Cr, 100mg kg�1 forPb, and 40 mg kg�1 for As
Sample locationU(mg kg�1)
Fe(mg kg�1)
P(mg kg�1)
S(mg kg�1)
V(mg kg�1)
Cr(mg kg�1)
Pb(mg kg�1)
As(mg kg�1)
Laguna ore lens (A on Fig. 1) 9300 109 000 2700 4900 660 270 340 BDLSediment below ore lens(B on Fig. 1)
1400 13 000 380 3000 140 BDL BDL 58.0
Sediment below ore lens(B on Fig. 1)
320 18 000 370 2800 150 140 BDL BDL
Site �6 stream bank BDL 42 000 1400 1000 BDL 180 BDL BDLSite �6 stream bed BDL 42 000 1300 900 BDL 190 BDL BDLSite �1 stream bank BDL 61 000 990 2900 BDL 160 BDL 53Site �1 stream bed BDL 103 000 2300 950 BDL 300 BDL BDLSite 1 stream bank BDL 106 000 2800 700 BDL 880 BDL BDLSite 1 stream bed BDL 30 000 790 1600 BDL 190 BDL BDLSite 9 stream bank BDL 38 000 1100 4500 BDL 1200 BDL BDLSite 9 stream bed BDL 33 000 990 2900 BDL 700 BDL BDL
Fig. 3 Stream bed sediment U chemistry by sample location andmonth. The majority of samples are 2 times the local background Uconcentration of 1–2 mg kg�1. Sites 9 and 10 (the wetland and
Environmental Science: Processes & Impacts Paper
Publ
ishe
d on
06
Mar
ch 2
017.
Dow
nloa
ded
by U
NIT
ED S
TATE
S G
EOLO
GIC
AL
SUR
VEY
on
12/1
2/20
17 1
7:07
:30.
View Article Online
concentration in the sediments is presented in Table 1. Theconcentration of Fe in the ore was 109 000 mg kg�1, and in thesediment below the ore it is 13 000 and 18 000 mg kg�1. Thestream bank sediment Fe concentration at site 1 ranges from61 000mg kg�1 to 106 000mg kg�1 and site 1 stream bed rangesfrom 30 000 to 103 000 mg kg�1, showing the inherent vari-ability of elemental concentrations in stream deposits. Bothsamples from site 9 range from 30 000 to 38 000 mg kg�1. The Pconcentrations vary, with the largest concentrations from theore (location A, Fig. 1) (2700 mg kg�1 P), site 1 stream bank(2800 mg kg�1 P), and site 9 stream bank (1100 mg kg�1 P).Sulfur concentrations are largest in the ore and site 9 streambank, 4900 and 4500 mg kg�1, respectively. The V concentrationin the ore is 660 mg kg�1 and the average in the sediment belowthe ore is 140 mg kg�1. Concentrations of these elements in site�6 and site �1 vary and are listed in Table 1. These XRF resultsprovide information about the bulk elemental concentrationsregardless of sediment size, which provides an understandingof the samples as a whole. The sediment samples were alsoanalyzed for the presence of other metals of concern due to theirnegative effect on human health such as arsenic (As), chromium(Cr), and lead (Pb). The concentrations of As, Cr, and Pb weredetected at lower concentrations than U. Additional XRF resultsare provided in the ESI, Table S2.†
Acid digested stream bed sediments contain U concentra-tions ranging from 0.20 mg kg�1 to 5.20 mg kg�1 in sites �6 to�1 and 1 through 8. U concentrations increase above 5.20 mgkg�1 in sites 9 and 10 located in the wetland and reservoirdownstream (Fig. 3). In February the wetland sedimentcollected at site 9 had a concentration of 20.0 mg kg�1 U and thereservoir sediment at site 10 had a concentration of 7.30 mgkg�1. The crustal average concentration of U is 2.78 mg kg�1
(ref. 4) and sites �6 to �1 U concentrations range from 0.20 mgkg�1 to 1.90 mg kg�1, seemingly due to the surroundinggeology. Since these sites are all upstream of the main miningoccurrences, U concentrations from these areas may beconsidered a local background. Uranium concentrations in
610 | Environ. Sci.: Processes Impacts, 2017, 19, 605–621
sites 1 to 8 are in general higher than the sediments sampledupstream of the mine, in some cases twice the crustal average.This difference is potentially due to the transport of U bearingsediments from the mine area downstream. The elevatedconcentrations found in sediments from sites 9 and 10 inFebruary 2015 may be due to the ability of U to associate withparticulate organic matter such as what exists in the wetland.This relationship is explained in more detail later in themanuscript.
Electron microprobe mapping of an ore (location A, Fig. 1)grain reveals heterogeneous areas of elevated uranium depositsand other metals (Fig. 4), suggesting that U co-occurs with P, Fe,and V in ore samples from the Jackpile Mine. In this image,a part of the mapped grain shows distinct associations betweenU, V, and Fe. Additionally, some intermediate concentrations ofU are detected at discrete points where P is present. The asso-ciation of U with Fe and S in Fe oxides or Fe–S mineral solidshas been reported in other studies.35 Locations where U and Vare not associated may suggest the role of other U minerals inthe ore. To complement electron microprobe analyses (for
reservoir) have the highest U concentrations in the sediments.
This journal is © The Royal Society of Chemistry 2017
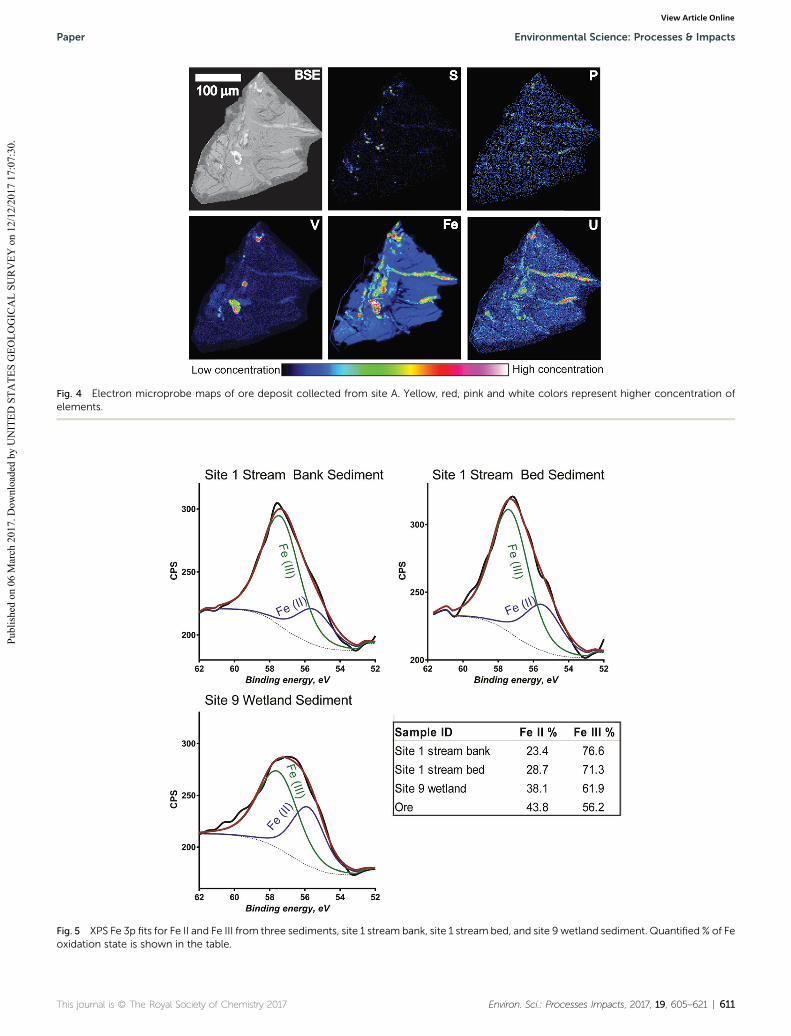
Fig. 4 Electron microprobe maps of ore deposit collected from site A. Yellow, red, pink and white colors represent higher concentration ofelements.
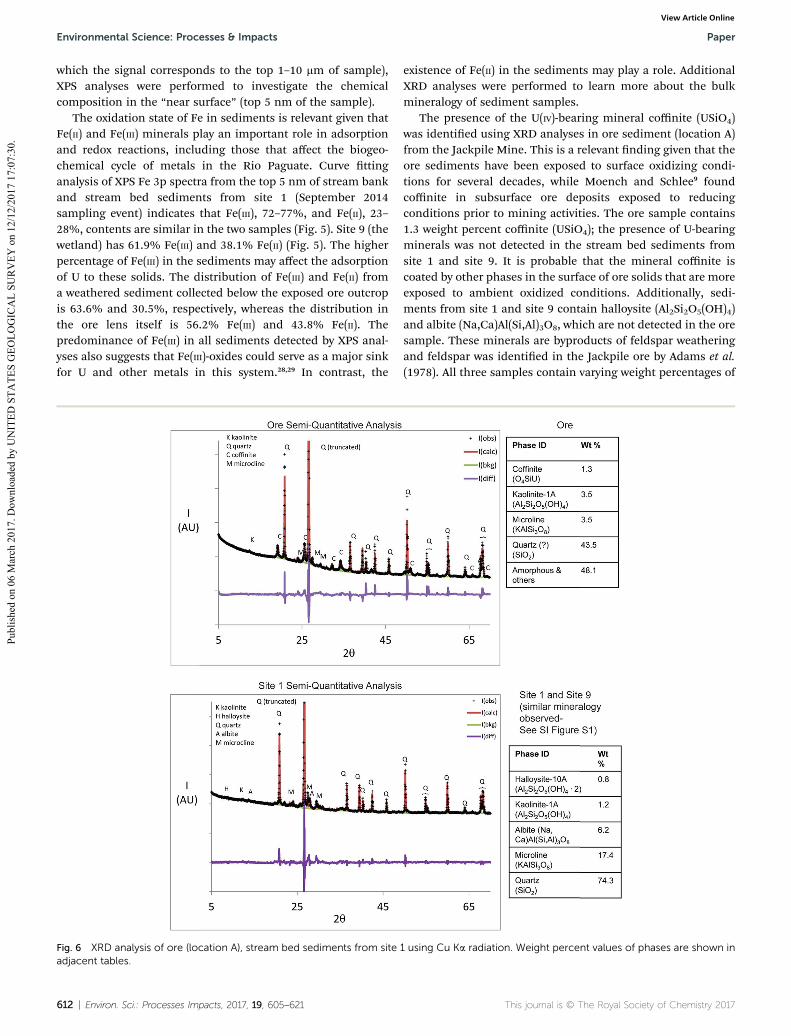
Fig. 5 XPS Fe 3p fits for Fe II and Fe III from three sediments, site 1 stream bank, site 1 stream bed, and site 9 wetland sediment. Quantified % of Feoxidation state is shown in the table.
This journal is © The Royal Society of Chemistry 2017 Environ. Sci.: Processes Impacts, 2017, 19, 605–621 | 611
Paper Environmental Science: Processes & Impacts
Publ
ishe
d on
06
Mar
ch 2
017.
Dow
nloa
ded
by U
NIT
ED S
TATE
S G
EOLO
GIC
AL
SUR
VEY
on
12/1
2/20
17 1
7:07
:30.
View Article Online
Environmental Science: Processes & Impacts Paper
Publ
ishe
d on
06
Mar
ch 2
017.
Dow
nloa
ded
by U
NIT
ED S
TATE
S G
EOLO
GIC
AL
SUR
VEY
on
12/1
2/20
17 1
7:07
:30.
View Article Online
which the signal corresponds to the top 1–10 mm of sample),XPS analyses were performed to investigate the chemicalcomposition in the “near surface” (top 5 nm of the sample).
The oxidation state of Fe in sediments is relevant given thatFe(II) and Fe(III) minerals play an important role in adsorptionand redox reactions, including those that affect the biogeo-chemical cycle of metals in the Rio Paguate. Curve ttinganalysis of XPS Fe 3p spectra from the top 5 nm of stream bankand stream bed sediments from site 1 (September 2014sampling event) indicates that Fe(III), 72–77%, and Fe(II), 23–28%, contents are similar in the two samples (Fig. 5). Site 9 (thewetland) has 61.9% Fe(III) and 38.1% Fe(II) (Fig. 5). The higherpercentage of Fe(III) in the sediments may affect the adsorptionof U to these solids. The distribution of Fe(III) and Fe(II) froma weathered sediment collected below the exposed ore outcropis 63.6% and 30.5%, respectively, whereas the distribution inthe ore lens itself is 56.2% Fe(III) and 43.8% Fe(II). Thepredominance of Fe(III) in all sediments detected by XPS anal-yses also suggests that Fe(III)-oxides could serve as a major sinkfor U and other metals in this system.28,29 In contrast, the
Fig. 6 XRD analysis of ore (location A), stream bed sediments from siteadjacent tables.
612 | Environ. Sci.: Processes Impacts, 2017, 19, 605–621
existence of Fe(II) in the sediments may play a role. AdditionalXRD analyses were performed to learn more about the bulkmineralogy of sediment samples.
The presence of the U(IV)-bearing mineral coffinite (USiO4)was identied using XRD analyses in ore sediment (location A)from the Jackpile Mine. This is a relevant nding given that theore sediments have been exposed to surface oxidizing condi-tions for several decades, while Moench and Schlee9 foundcoffinite in subsurface ore deposits exposed to reducingconditions prior to mining activities. The ore sample contains1.3 weight percent coffinite (USiO4); the presence of U-bearingminerals was not detected in the stream bed sediments fromsite 1 and site 9. It is probable that the mineral coffinite iscoated by other phases in the surface of ore solids that are moreexposed to ambient oxidized conditions. Additionally, sedi-ments from site 1 and site 9 contain halloysite (Al2Si2O5(OH)4)and albite (Na,Ca)Al(Si,Al)3O8, which are not detected in the oresample. These minerals are byproducts of feldspar weatheringand feldspar was identied in the Jackpile ore by Adams et al.(1978). All three samples contain varying weight percentages of
1 using Cu Ka radiation. Weight percent values of phases are shown in
This journal is © The Royal Society of Chemistry 2017
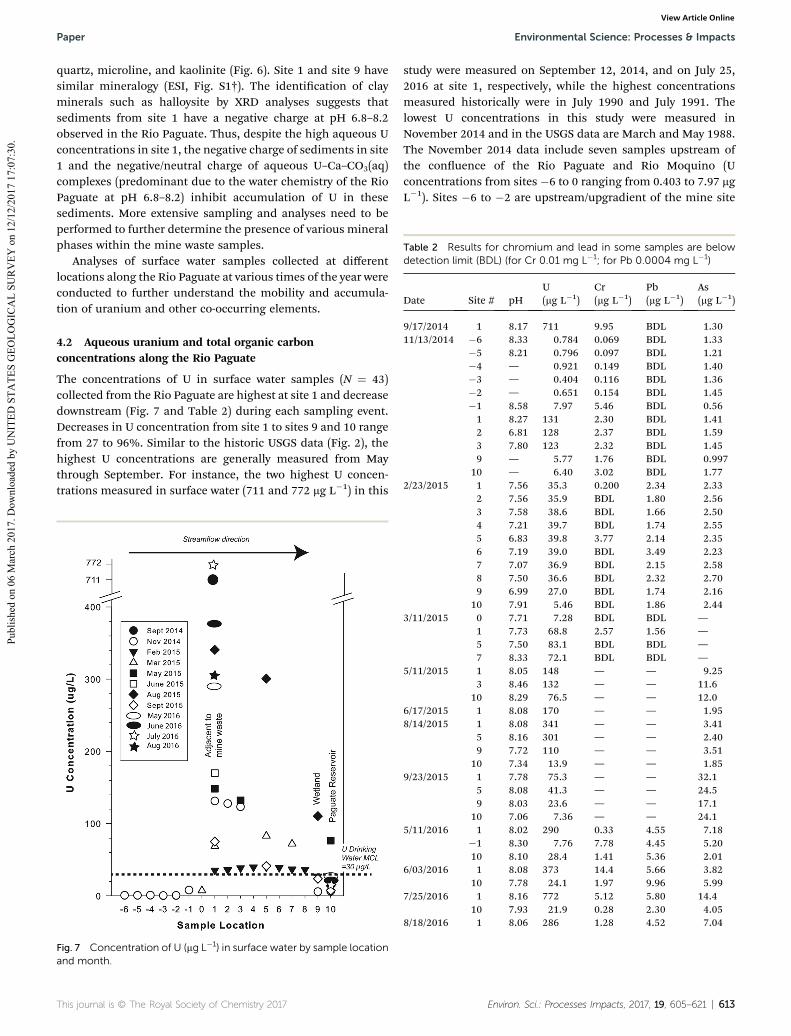
Table 2 Results for chromium and lead in some samples are belowdetection limit (BDL) (for Cr 0.01 mg L�1; for Pb 0.0004 mg L�1)
Date Site # pHU(mg L�1)
Cr(mg L�1)
Pb(mg L�1)
As(mg L�1)
9/17/2014 1 8.17 711 9.95 BDL 1.3011/13/2014 �6 8.33 0.784 0.069 BDL 1.33
�5 8.21 0.796 0.097 BDL 1.21�4 — 0.921 0.149 BDL 1.40�3 — 0.404 0.116 BDL 1.36�2 — 0.651 0.154 BDL 1.45�1 8.58 7.97 5.46 BDL 0.561 8.27 131 2.30 BDL 1.412 6.81 128 2.37 BDL 1.593 7.80 123 2.32 BDL 1.459 — 5.77 1.76 BDL 0.997
10 — 6.40 3.02 BDL 1.772/23/2015 1 7.56 35.3 0.200 2.34 2.33
2 7.56 35.9 BDL 1.80 2.56
Paper Environmental Science: Processes & Impacts
Publ
ishe
d on
06
Mar
ch 2
017.
Dow
nloa
ded
by U
NIT
ED S
TATE
S G
EOLO
GIC
AL
SUR
VEY
on
12/1
2/20
17 1
7:07
:30.
View Article Online
quartz, microline, and kaolinite (Fig. 6). Site 1 and site 9 havesimilar mineralogy (ESI, Fig. S1†). The identication of clayminerals such as halloysite by XRD analyses suggests thatsediments from site 1 have a negative charge at pH 6.8–8.2observed in the Rio Paguate. Thus, despite the high aqueous Uconcentrations in site 1, the negative charge of sediments in site1 and the negative/neutral charge of aqueous U–Ca–CO3(aq)complexes (predominant due to the water chemistry of the RioPaguate at pH 6.8–8.2) inhibit accumulation of U in thesesediments. More extensive sampling and analyses need to beperformed to further determine the presence of various mineralphases within the mine waste samples.
Analyses of surface water samples collected at differentlocations along the Rio Paguate at various times of the year wereconducted to further understand the mobility and accumula-tion of uranium and other co-occurring elements.
4.2 Aqueous uranium and total organic carbonconcentrations along the Rio Paguate
The concentrations of U in surface water samples (N ¼ 43)collected from the Rio Paguate are highest at site 1 and decreasedownstream (Fig. 7 and Table 2) during each sampling event.Decreases in U concentration from site 1 to sites 9 and 10 rangefrom 27 to 96%. Similar to the historic USGS data (Fig. 2), thehighest U concentrations are generally measured from Maythrough September. For instance, the two highest U concen-trations measured in surface water (711 and 772 mg L�1) in this
Fig. 7 Concentration of U (mg L�1) in surface water by sample locationand month.
This journal is © The Royal Society of Chemistry 2017
study were measured on September 12, 2014, and on July 25,2016 at site 1, respectively, while the highest concentrationsmeasured historically were in July 1990 and July 1991. Thelowest U concentrations in this study were measured inNovember 2014 and in the USGS data are March and May 1988.The November 2014 data include seven samples upstream ofthe conuence of the Rio Paguate and Rio Moquino (Uconcentrations from sites �6 to 0 ranging from 0.403 to 7.97 mgL�1). Sites �6 to �2 are upstream/upgradient of the mine site
3 7.58 38.6 BDL 1.66 2.504 7.21 39.7 BDL 1.74 2.555 6.83 39.8 3.77 2.14 2.356 7.19 39.0 BDL 3.49 2.237 7.07 36.9 BDL 2.15 2.588 7.50 36.6 BDL 2.32 2.709 6.99 27.0 BDL 1.74 2.16
10 7.91 5.46 BDL 1.86 2.443/11/2015 0 7.71 7.28 BDL BDL —
1 7.73 68.8 2.57 1.56 —5 7.50 83.1 BDL BDL —7 8.33 72.1 BDL BDL —
5/11/2015 1 8.05 148 — — 9.253 8.46 132 — — 11.6
10 8.29 76.5 — — 12.06/17/2015 1 8.08 170 — — 1.958/14/2015 1 8.08 341 — — 3.41
5 8.16 301 — — 2.409 7.72 110 — — 3.51
10 7.34 13.9 — — 1.859/23/2015 1 7.78 75.3 — — 32.1
5 8.08 41.3 — — 24.59 8.03 23.6 — — 17.1
10 7.06 7.36 — — 24.15/11/2016 1 8.02 290 0.33 4.55 7.18
�1 8.30 7.76 7.78 4.45 5.2010 8.10 28.4 1.41 5.36 2.01
6/03/2016 1 8.08 373 14.4 5.66 3.8210 7.78 24.1 1.97 9.96 5.99
7/25/2016 1 8.16 772 5.12 5.80 14.410 7.93 21.9 0.28 2.30 4.05
8/18/2016 1 8.06 286 1.28 4.52 7.04
Environ. Sci.: Processes Impacts, 2017, 19, 605–621 | 613
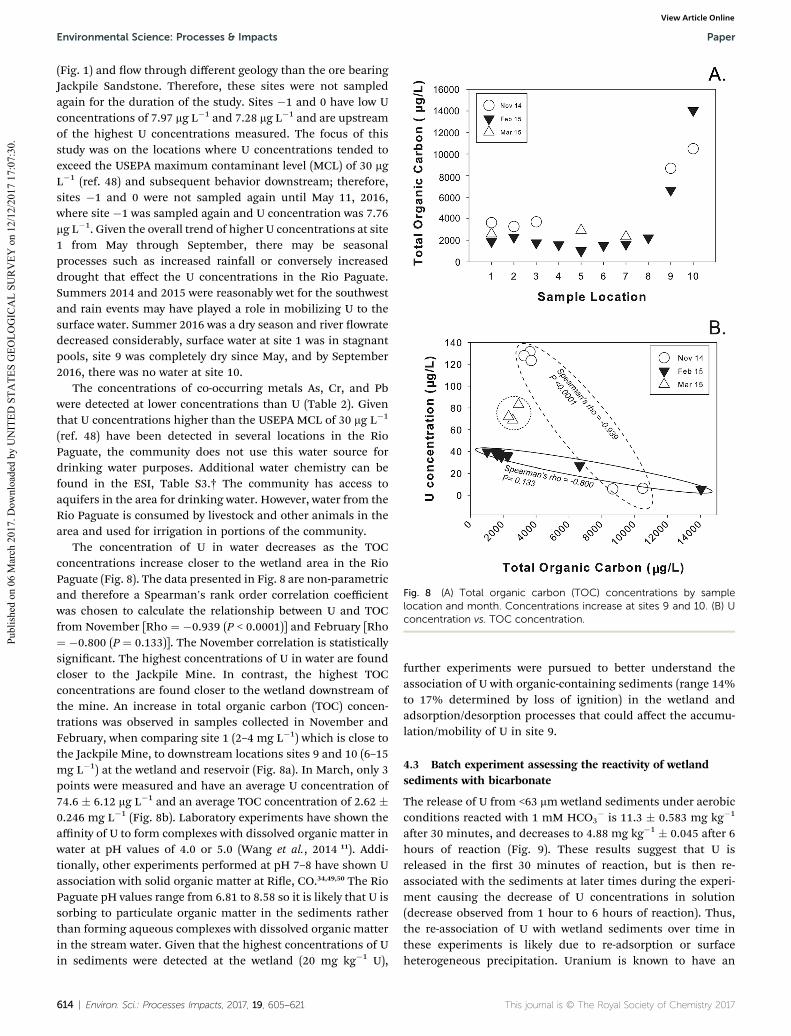
Fig. 8 (A) Total organic carbon (TOC) concentrations by samplelocation and month. Concentrations increase at sites 9 and 10. (B) Uconcentration vs. TOC concentration.
Environmental Science: Processes & Impacts Paper
Publ
ishe
d on
06
Mar
ch 2
017.
Dow
nloa
ded
by U
NIT
ED S
TATE
S G
EOLO
GIC
AL
SUR
VEY
on
12/1
2/20
17 1
7:07
:30.
View Article Online
(Fig. 1) and ow through different geology than the ore bearingJackpile Sandstone. Therefore, these sites were not sampledagain for the duration of the study. Sites �1 and 0 have low Uconcentrations of 7.97 mg L�1 and 7.28 mg L�1 and are upstreamof the highest U concentrations measured. The focus of thisstudy was on the locations where U concentrations tended toexceed the USEPA maximum contaminant level (MCL) of 30 mgL�1 (ref. 48) and subsequent behavior downstream; therefore,sites �1 and 0 were not sampled again until May 11, 2016,where site �1 was sampled again and U concentration was 7.76mg L�1. Given the overall trend of higher U concentrations at site1 from May through September, there may be seasonalprocesses such as increased rainfall or conversely increaseddrought that effect the U concentrations in the Rio Paguate.Summers 2014 and 2015 were reasonably wet for the southwestand rain events may have played a role in mobilizing U to thesurface water. Summer 2016 was a dry season and river owratedecreased considerably, surface water at site 1 was in stagnantpools, site 9 was completely dry since May, and by September2016, there was no water at site 10.
The concentrations of co-occurring metals As, Cr, and Pbwere detected at lower concentrations than U (Table 2). Giventhat U concentrations higher than the USEPA MCL of 30 mg L�1
(ref. 48) have been detected in several locations in the RioPaguate, the community does not use this water source fordrinking water purposes. Additional water chemistry can befound in the ESI, Table S3.† The community has access toaquifers in the area for drinking water. However, water from theRio Paguate is consumed by livestock and other animals in thearea and used for irrigation in portions of the community.
The concentration of U in water decreases as the TOCconcentrations increase closer to the wetland area in the RioPaguate (Fig. 8). The data presented in Fig. 8 are non-parametricand therefore a Spearman's rank order correlation coefficientwas chosen to calculate the relationship between U and TOCfrom November [Rho ¼ �0.939 (P < 0.0001)] and February [Rho¼ �0.800 (P ¼ 0.133)]. The November correlation is statisticallysignicant. The highest concentrations of U in water are foundcloser to the Jackpile Mine. In contrast, the highest TOCconcentrations are found closer to the wetland downstream ofthe mine. An increase in total organic carbon (TOC) concen-trations was observed in samples collected in November andFebruary, when comparing site 1 (2–4 mg L�1) which is close tothe Jackpile Mine, to downstream locations sites 9 and 10 (6–15mg L�1) at the wetland and reservoir (Fig. 8a). In March, only 3points were measured and have an average U concentration of74.6 � 6.12 mg L�1 and an average TOC concentration of 2.62 �0.246 mg L�1 (Fig. 8b). Laboratory experiments have shown theaffinity of U to form complexes with dissolved organic matter inwater at pH values of 4.0 or 5.0 (Wang et al., 2014 11). Addi-tionally, other experiments performed at pH 7–8 have shown Uassociation with solid organic matter at Rie, CO.34,49,50 The RioPaguate pH values range from 6.81 to 8.58 so it is likely that U issorbing to particulate organic matter in the sediments ratherthan forming aqueous complexes with dissolved organic matterin the stream water. Given that the highest concentrations of Uin sediments were detected at the wetland (20 mg kg�1 U),
614 | Environ. Sci.: Processes Impacts, 2017, 19, 605–621
further experiments were pursued to better understand theassociation of U with organic-containing sediments (range 14%to 17% determined by loss of ignition) in the wetland andadsorption/desorption processes that could affect the accumu-lation/mobility of U in site 9.
4.3 Batch experiment assessing the reactivity of wetlandsediments with bicarbonate
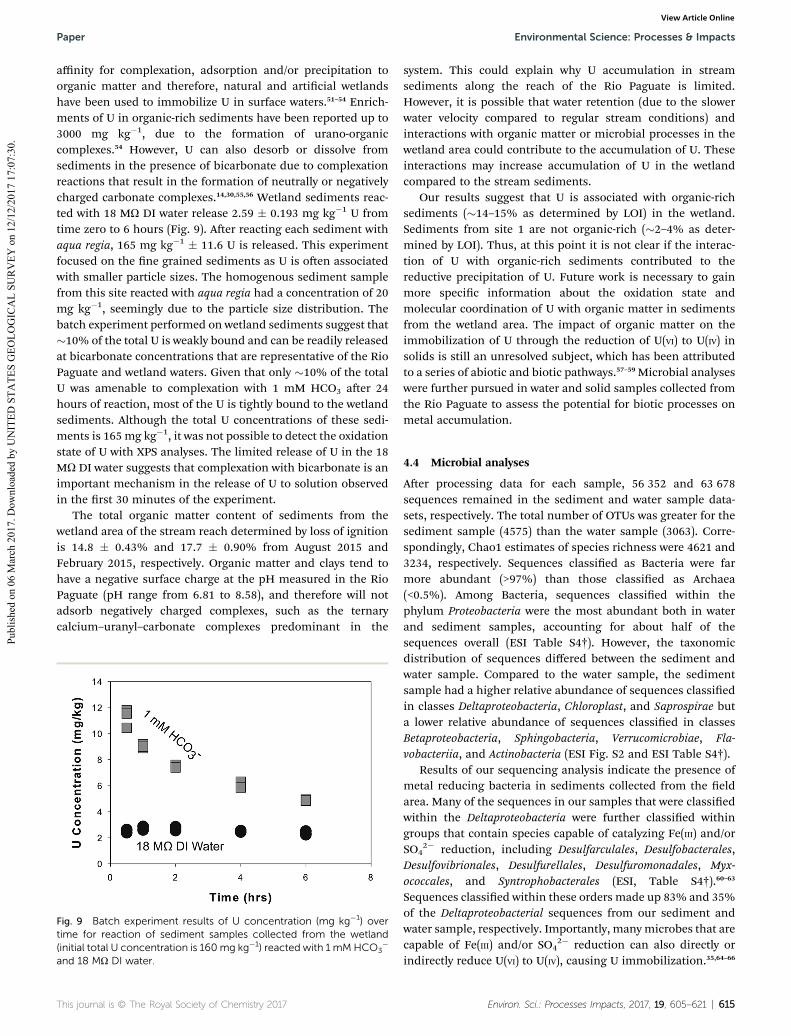
The release of U from <63 mm wetland sediments under aerobicconditions reacted with 1 mM HCO3
� is 11.3 � 0.583 mg kg�1
aer 30 minutes, and decreases to 4.88 mg kg�1 � 0.045 aer 6hours of reaction (Fig. 9). These results suggest that U isreleased in the rst 30 minutes of reaction, but is then re-associated with the sediments at later times during the experi-ment causing the decrease of U concentrations in solution(decrease observed from 1 hour to 6 hours of reaction). Thus,the re-association of U with wetland sediments over time inthese experiments is likely due to re-adsorption or surfaceheterogeneous precipitation. Uranium is known to have an
This journal is © The Royal Society of Chemistry 2017
Paper Environmental Science: Processes & Impacts
Publ
ishe
d on
06
Mar
ch 2
017.
Dow
nloa
ded
by U
NIT
ED S
TATE
S G
EOLO
GIC
AL
SUR
VEY
on
12/1
2/20
17 1
7:07
:30.
View Article Online
affinity for complexation, adsorption and/or precipitation toorganic matter and therefore, natural and articial wetlandshave been used to immobilize U in surface waters.51–54 Enrich-ments of U in organic-rich sediments have been reported up to3000 mg kg�1, due to the formation of urano-organiccomplexes.54 However, U can also desorb or dissolve fromsediments in the presence of bicarbonate due to complexationreactions that result in the formation of neutrally or negativelycharged carbonate complexes.14,30,55,56 Wetland sediments reac-ted with 18 MU DI water release 2.59 � 0.193 mg kg�1 U fromtime zero to 6 hours (Fig. 9). Aer reacting each sediment withaqua regia, 165 mg kg�1 � 11.6 U is released. This experimentfocused on the ne grained sediments as U is oen associatedwith smaller particle sizes. The homogenous sediment samplefrom this site reacted with aqua regia had a concentration of 20mg kg�1, seemingly due to the particle size distribution. Thebatch experiment performed on wetland sediments suggest that�10% of the total U is weakly bound and can be readily releasedat bicarbonate concentrations that are representative of the RioPaguate and wetland waters. Given that only �10% of the totalU was amenable to complexation with 1 mM HCO3 aer 24hours of reaction, most of the U is tightly bound to the wetlandsediments. Although the total U concentrations of these sedi-ments is 165 mg kg�1, it was not possible to detect the oxidationstate of U with XPS analyses. The limited release of U in the 18MU DI water suggests that complexation with bicarbonate is animportant mechanism in the release of U to solution observedin the rst 30 minutes of the experiment.
The total organic matter content of sediments from thewetland area of the stream reach determined by loss of ignitionis 14.8 � 0.43% and 17.7 � 0.90% from August 2015 andFebruary 2015, respectively. Organic matter and clays tend tohave a negative surface charge at the pH measured in the RioPaguate (pH range from 6.81 to 8.58), and therefore will notadsorb negatively charged complexes, such as the ternarycalcium–uranyl–carbonate complexes predominant in the
Fig. 9 Batch experiment results of U concentration (mg kg�1) overtime for reaction of sediment samples collected from the wetland(initial total U concentration is 160mg kg�1) reacted with 1 mMHCO3
�
and 18 MU DI water.
This journal is © The Royal Society of Chemistry 2017
system. This could explain why U accumulation in streamsediments along the reach of the Rio Paguate is limited.However, it is possible that water retention (due to the slowerwater velocity compared to regular stream conditions) andinteractions with organic matter or microbial processes in thewetland area could contribute to the accumulation of U. Theseinteractions may increase accumulation of U in the wetlandcompared to the stream sediments.
Our results suggest that U is associated with organic-richsediments (�14–15% as determined by LOI) in the wetland.Sediments from site 1 are not organic-rich (�2–4% as deter-mined by LOI). Thus, at this point it is not clear if the interac-tion of U with organic-rich sediments contributed to thereductive precipitation of U. Future work is necessary to gainmore specic information about the oxidation state andmolecular coordination of U with organic matter in sedimentsfrom the wetland area. The impact of organic matter on theimmobilization of U through the reduction of U(VI) to U(IV) insolids is still an unresolved subject, which has been attributedto a series of abiotic and biotic pathways.57–59 Microbial analyseswere further pursued in water and solid samples collected fromthe Rio Paguate to assess the potential for biotic processes onmetal accumulation.
4.4 Microbial analyses
Aer processing data for each sample, 56 352 and 63 678sequences remained in the sediment and water sample data-sets, respectively. The total number of OTUs was greater for thesediment sample (4575) than the water sample (3063). Corre-spondingly, Chao1 estimates of species richness were 4621 and3234, respectively. Sequences classied as Bacteria were farmore abundant (>97%) than those classied as Archaea(<0.5%). Among Bacteria, sequences classied within thephylum Proteobacteria were the most abundant both in waterand sediment samples, accounting for about half of thesequences overall (ESI Table S4†). However, the taxonomicdistribution of sequences differed between the sediment andwater sample. Compared to the water sample, the sedimentsample had a higher relative abundance of sequences classiedin classes Deltaproteobacteria, Chloroplast, and Saprospirae buta lower relative abundance of sequences classied in classesBetaproteobacteria, Sphingobacteria, Verrucomicrobiae, Fla-vobacteriia, and Actinobacteria (ESI Fig. S2 and ESI Table S4†).
Results of our sequencing analysis indicate the presence ofmetal reducing bacteria in sediments collected from the eldarea. Many of the sequences in our samples that were classiedwithin the Deltaproteobacteria were further classied withingroups that contain species capable of catalyzing Fe(III) and/orSO4
2� reduction, including Desulfarculales, Desulfobacterales,Desulfovibrionales, Desulfurellales, Desulfuromonadales, Myx-ococcales, and Syntrophobacterales (ESI, Table S4†).60–63
Sequences classied within these orders made up 83% and 35%of the Deltaproteobacterial sequences from our sediment andwater sample, respectively. Importantly, many microbes that arecapable of Fe(III) and/or SO4
2� reduction can also directly orindirectly reduce U(VI) to U(IV), causing U immobilization.35,64–66
Environ. Sci.: Processes Impacts, 2017, 19, 605–621 | 615
Environmental Science: Processes & Impacts Paper
Publ
ishe
d on
06
Mar
ch 2
017.
Dow
nloa
ded
by U
NIT
ED S
TATE
S G
EOLO
GIC
AL
SUR
VEY
on
12/1
2/20
17 1
7:07
:30.
View Article Online
Given the nding of these species, the populations likelyhave an effect on the interaction of U between sediments andwater in the environment at this site. These data provide initialinformation about microbial populations of the Rio Paguate,which is valuable in understanding this complex system. Byidentifying the microbial species present, we learn about thepotential processes that attribute to the mobility or accumula-tion of U in the Rio Paguate. Further study of the biologicalcomponent in this system will enable the understanding ofmicrobial interactions coupled with geochemical processes.Additional research needs to be conducted to investigate thedistribution and function of these microbial populations toassess the effect of microbial activity on U mobility in this site.The mobility and accumulation of U was further investigated byanalyzing sediment and water samples obtained from thehyporheic zone.
4.5 Analyses of water and sediment samples from thehyporheic zone in the Rio Paguate and the role of localgeology
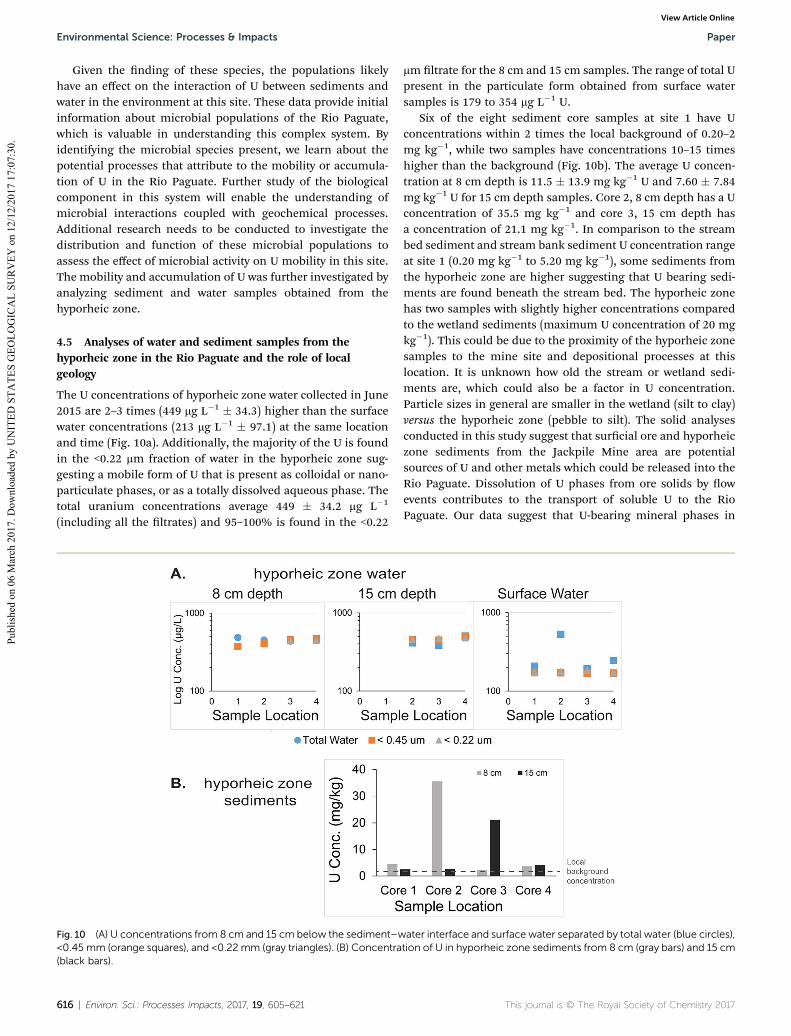
The U concentrations of hyporheic zone water collected in June2015 are 2–3 times (449 mg L�1 � 34.3) higher than the surfacewater concentrations (213 mg L�1 � 97.1) at the same locationand time (Fig. 10a). Additionally, the majority of the U is foundin the <0.22 mm fraction of water in the hyporheic zone sug-gesting a mobile form of U that is present as colloidal or nano-particulate phases, or as a totally dissolved aqueous phase. Thetotal uranium concentrations average 449 � 34.2 mg L�1
(including all the ltrates) and 95–100% is found in the <0.22
Fig. 10 (A) U concentrations from 8 cm and 15 cm below the sediment–w<0.45 mm (orange squares), and <0.22 mm (gray triangles). (B) Concentra(black bars).
616 | Environ. Sci.: Processes Impacts, 2017, 19, 605–621
mm ltrate for the 8 cm and 15 cm samples. The range of total Upresent in the particulate form obtained from surface watersamples is 179 to 354 mg L�1 U.
Six of the eight sediment core samples at site 1 have Uconcentrations within 2 times the local background of 0.20–2mg kg�1, while two samples have concentrations 10–15 timeshigher than the background (Fig. 10b). The average U concen-tration at 8 cm depth is 11.5 � 13.9 mg kg�1 U and 7.60 � 7.84mg kg�1 U for 15 cm depth samples. Core 2, 8 cm depth has a Uconcentration of 35.5 mg kg�1 and core 3, 15 cm depth hasa concentration of 21.1 mg kg�1. In comparison to the streambed sediment and stream bank sediment U concentration rangeat site 1 (0.20 mg kg�1 to 5.20 mg kg�1), some sediments fromthe hyporheic zone are higher suggesting that U bearing sedi-ments are found beneath the stream bed. The hyporheic zonehas two samples with slightly higher concentrations comparedto the wetland sediments (maximum U concentration of 20 mgkg�1). This could be due to the proximity of the hyporheic zonesamples to the mine site and depositional processes at thislocation. It is unknown how old the stream or wetland sedi-ments are, which could also be a factor in U concentration.Particle sizes in general are smaller in the wetland (silt to clay)versus the hyporheic zone (pebble to silt). The solid analysesconducted in this study suggest that surcial ore and hyporheiczone sediments from the Jackpile Mine area are potentialsources of U and other metals which could be released into theRio Paguate. Dissolution of U phases from ore solids by owevents contributes to the transport of soluble U to the RioPaguate. Our data suggest that U-bearing mineral phases in
ater interface and surface water separated by total water (blue circles),tion of U in hyporheic zone sediments from 8 cm (gray bars) and 15 cm
This journal is © The Royal Society of Chemistry 2017
Paper Environmental Science: Processes & Impacts
Publ
ishe
d on
06
Mar
ch 2
017.
Dow
nloa
ded
by U
NIT
ED S
TATE
S G
EOLO
GIC
AL
SUR
VEY
on
12/1
2/20
17 1
7:07
:30.
View Article Online
abandoned mine wastes from the Jackpile Mine, identied inthis study using electron microprobe and XRD analyses, areamenable to dissolution during rain events.
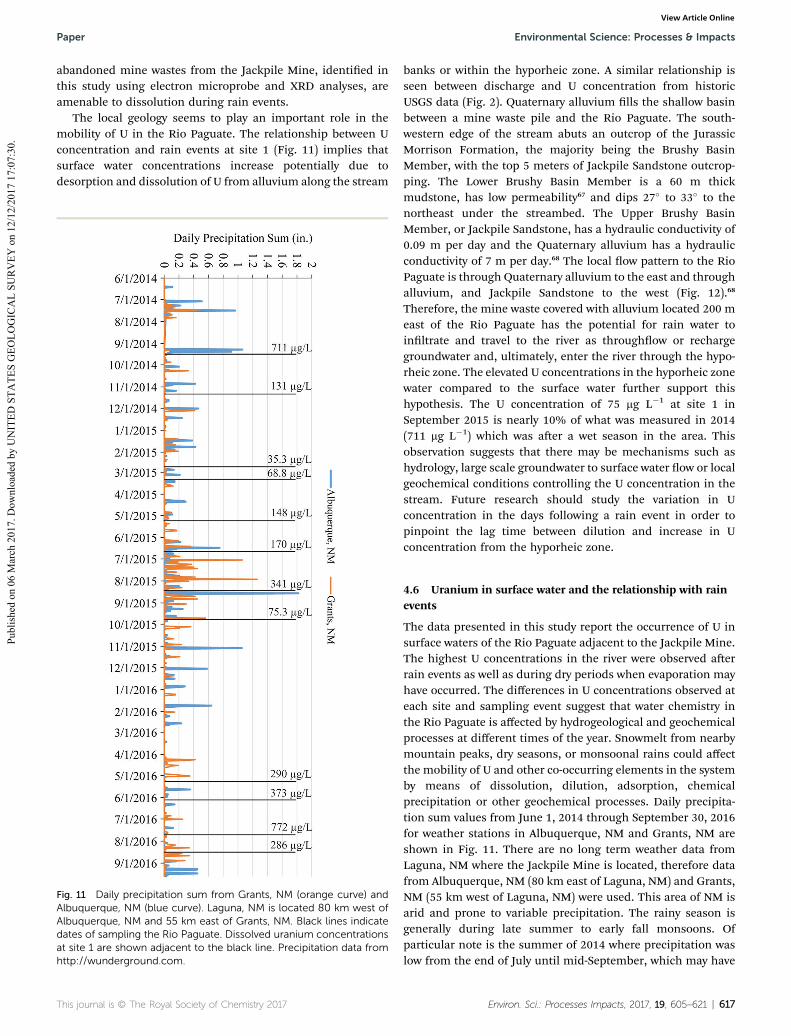
The local geology seems to play an important role in themobility of U in the Rio Paguate. The relationship between Uconcentration and rain events at site 1 (Fig. 11) implies thatsurface water concentrations increase potentially due todesorption and dissolution of U from alluvium along the stream
Fig. 11 Daily precipitation sum from Grants, NM (orange curve) andAlbuquerque, NM (blue curve). Laguna, NM is located 80 km west ofAlbuquerque, NM and 55 km east of Grants, NM. Black lines indicatedates of sampling the Rio Paguate. Dissolved uranium concentrationsat site 1 are shown adjacent to the black line. Precipitation data fromhttp://wunderground.com.
This journal is © The Royal Society of Chemistry 2017
banks or within the hyporheic zone. A similar relationship isseen between discharge and U concentration from historicUSGS data (Fig. 2). Quaternary alluvium lls the shallow basinbetween a mine waste pile and the Rio Paguate. The south-western edge of the stream abuts an outcrop of the JurassicMorrison Formation, the majority being the Brushy BasinMember, with the top 5 meters of Jackpile Sandstone outcrop-ping. The Lower Brushy Basin Member is a 60 m thickmudstone, has low permeability67 and dips 27� to 33� to thenortheast under the streambed. The Upper Brushy BasinMember, or Jackpile Sandstone, has a hydraulic conductivity of0.09 m per day and the Quaternary alluvium has a hydraulicconductivity of 7 m per day.68 The local ow pattern to the RioPaguate is through Quaternary alluvium to the east and throughalluvium, and Jackpile Sandstone to the west (Fig. 12).68
Therefore, the mine waste covered with alluvium located 200 meast of the Rio Paguate has the potential for rain water toinltrate and travel to the river as throughow or rechargegroundwater and, ultimately, enter the river through the hypo-rheic zone. The elevated U concentrations in the hyporheic zonewater compared to the surface water further support thishypothesis. The U concentration of 75 mg L�1 at site 1 inSeptember 2015 is nearly 10% of what was measured in 2014(711 mg L�1) which was aer a wet season in the area. Thisobservation suggests that there may be mechanisms such ashydrology, large scale groundwater to surface water ow or localgeochemical conditions controlling the U concentration in thestream. Future research should study the variation in Uconcentration in the days following a rain event in order topinpoint the lag time between dilution and increase in Uconcentration from the hyporheic zone.
4.6 Uranium in surface water and the relationship with rainevents
The data presented in this study report the occurrence of U insurface waters of the Rio Paguate adjacent to the Jackpile Mine.The highest U concentrations in the river were observed aerrain events as well as during dry periods when evaporation mayhave occurred. The differences in U concentrations observed ateach site and sampling event suggest that water chemistry inthe Rio Paguate is affected by hydrogeological and geochemicalprocesses at different times of the year. Snowmelt from nearbymountain peaks, dry seasons, or monsoonal rains could affectthe mobility of U and other co-occurring elements in the systemby means of dissolution, dilution, adsorption, chemicalprecipitation or other geochemical processes. Daily precipita-tion sum values from June 1, 2014 through September 30, 2016for weather stations in Albuquerque, NM and Grants, NM areshown in Fig. 11. There are no long term weather data fromLaguna, NM where the Jackpile Mine is located, therefore datafrom Albuquerque, NM (80 km east of Laguna, NM) and Grants,NM (55 km west of Laguna, NM) were used. This area of NM isarid and prone to variable precipitation. The rainy season isgenerally during late summer to early fall monsoons. Ofparticular note is the summer of 2014 where precipitation waslow from the end of July until mid-September, which may have
Environ. Sci.: Processes Impacts, 2017, 19, 605–621 | 617
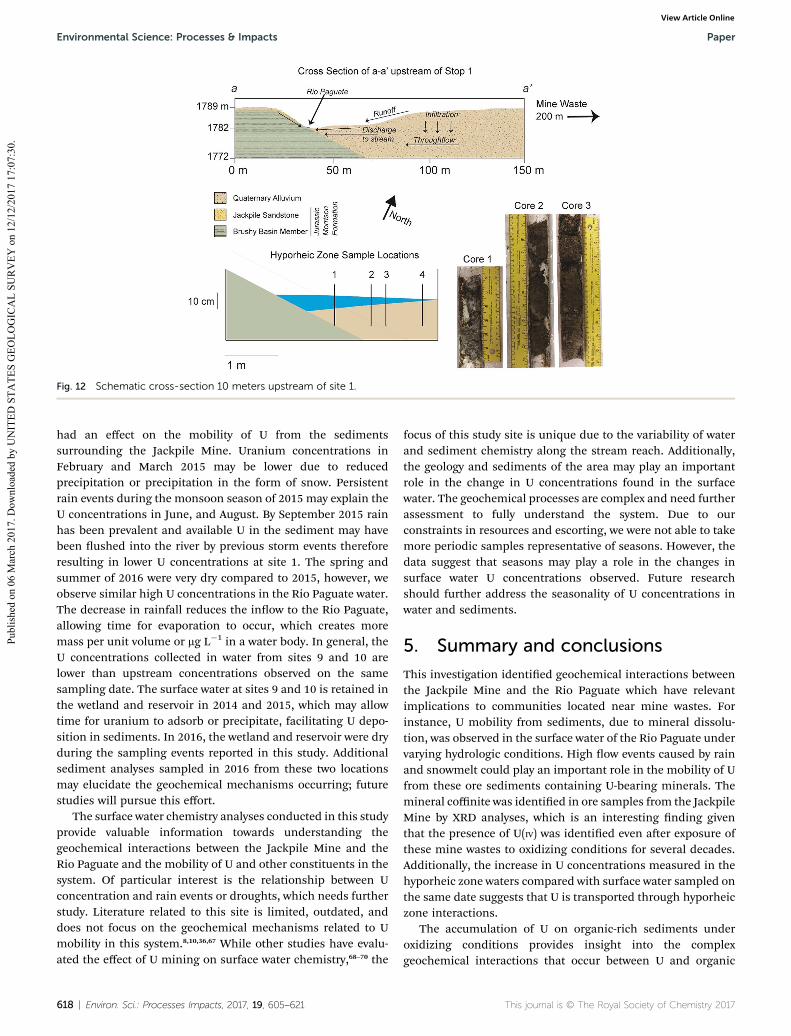
Fig. 12 Schematic cross-section 10 meters upstream of site 1.
Environmental Science: Processes & Impacts Paper
Publ
ishe
d on
06
Mar
ch 2
017.
Dow
nloa
ded
by U
NIT
ED S
TATE
S G
EOLO
GIC
AL
SUR
VEY
on
12/1
2/20
17 1
7:07
:30.
View Article Online
had an effect on the mobility of U from the sedimentssurrounding the Jackpile Mine. Uranium concentrations inFebruary and March 2015 may be lower due to reducedprecipitation or precipitation in the form of snow. Persistentrain events during the monsoon season of 2015 may explain theU concentrations in June, and August. By September 2015 rainhas been prevalent and available U in the sediment may havebeen ushed into the river by previous storm events thereforeresulting in lower U concentrations at site 1. The spring andsummer of 2016 were very dry compared to 2015, however, weobserve similar high U concentrations in the Rio Paguate water.The decrease in rainfall reduces the inow to the Rio Paguate,allowing time for evaporation to occur, which creates moremass per unit volume or mg L�1 in a water body. In general, theU concentrations collected in water from sites 9 and 10 arelower than upstream concentrations observed on the samesampling date. The surface water at sites 9 and 10 is retained inthe wetland and reservoir in 2014 and 2015, which may allowtime for uranium to adsorb or precipitate, facilitating U depo-sition in sediments. In 2016, the wetland and reservoir were dryduring the sampling events reported in this study. Additionalsediment analyses sampled in 2016 from these two locationsmay elucidate the geochemical mechanisms occurring; futurestudies will pursue this effort.
The surface water chemistry analyses conducted in this studyprovide valuable information towards understanding thegeochemical interactions between the Jackpile Mine and theRio Paguate and the mobility of U and other constituents in thesystem. Of particular interest is the relationship between Uconcentration and rain events or droughts, which needs furtherstudy. Literature related to this site is limited, outdated, anddoes not focus on the geochemical mechanisms related to Umobility in this system.8,10,36,67 While other studies have evalu-ated the effect of U mining on surface water chemistry,68–70 the
618 | Environ. Sci.: Processes Impacts, 2017, 19, 605–621
focus of this study site is unique due to the variability of waterand sediment chemistry along the stream reach. Additionally,the geology and sediments of the area may play an importantrole in the change in U concentrations found in the surfacewater. The geochemical processes are complex and need furtherassessment to fully understand the system. Due to ourconstraints in resources and escorting, we were not able to takemore periodic samples representative of seasons. However, thedata suggest that seasons may play a role in the changes insurface water U concentrations observed. Future researchshould further address the seasonality of U concentrations inwater and sediments.
5. Summary and conclusions
This investigation identied geochemical interactions betweenthe Jackpile Mine and the Rio Paguate which have relevantimplications to communities located near mine wastes. Forinstance, U mobility from sediments, due to mineral dissolu-tion, was observed in the surface water of the Rio Paguate undervarying hydrologic conditions. High ow events caused by rainand snowmelt could play an important role in the mobility of Ufrom these ore sediments containing U-bearing minerals. Themineral coffinite was identied in ore samples from the JackpileMine by XRD analyses, which is an interesting nding giventhat the presence of U(IV) was identied even aer exposure ofthese mine wastes to oxidizing conditions for several decades.Additionally, the increase in U concentrations measured in thehyporheic zone waters compared with surface water sampled onthe same date suggests that U is transported through hyporheiczone interactions.
The accumulation of U on organic-rich sediments underoxidizing conditions provides insight into the complexgeochemical interactions that occur between U and organic
This journal is © The Royal Society of Chemistry 2017
Paper Environmental Science: Processes & Impacts
Publ
ishe
d on
06
Mar
ch 2
017.
Dow
nloa
ded
by U
NIT
ED S
TATE
S G
EOLO
GIC
AL
SUR
VEY
on
12/1
2/20
17 1
7:07
:30.
View Article Online
matter. The increase in hydraulic retention combined with thelower sediment particle sizes and the organic content in thewetland potentially enhances U accumulation. It is worthnoting that the stream discharge and sediment characteristicsdiffer from the main channel of the stream to the wetland areawhere ow rate is lower, facilitating the contact time betweenwater and sediments due to the hydraulic retention in thewetland. The presence of metal reducing bacteria identied inwater and sediments collected near the Jackpile Mine providesa dataset to build upon for further understanding of the rolemicrobial activity plays in U mobility.
Through the integration of tools from different disciplines,this study contributes new insights about how the complexinteraction between mine wastes, stream sediments, andsurface water of the Rio Paguate affects U mobility and accu-mulation. The knowledge gained in this study has relevantimplications for stakeholders and land managers dealing withmining legacy issues. Future studies are needed to answerunresolved questions about hyporheic zone interactions,microbial activity, and the larger role of organic-rich sedimentsin systems affected by mining activities.
Acknowledgements
The authors thank the members of the Laguna Pueblo, formerGovernor Richard Luarkie, current Governor Virgil Siow, andthe Pueblo Council for their support. The authors would like toacknowledge the existing partnership with the Pueblo ofLaguna Environment and Natural Resources Department.Special thanks to Loren Arkie, Vince Rodriguez, Sabin Chavez,Deborah Anyaibe, Dorothy Beecher, Cherylin Atcitty, andGregory Jojola for their assistance in the eld and knowledge ofthe area. Additionally, we thank Paul Robinson and Chris Shueyfrom the Southwest Research and Information Center. Fundingfor this research was provided by the National Science Foun-dation under New Mexico EPSCoR (Grant Number #IIA-1301346) and CREST (Grant Number 1345169). Any opinions,ndings, and conclusions or recommendations expressed inthis publication are those of the author(s) and do not neces-sarily reect the views of the National Science Foundation.
References
1 US Bureau of Land Management, Abandoned Mine Lands: ANew Legacy, US Dept. of the Interior, Bureau of LandManagement, 2013, Publication Number BLM/WO/GI-13/007-3720.
2 J. M. Blake, S. Avasarala, K. Artyushkova, A.-M. S. Ali,A. J. Brearley, C. Shuey, W. P. Robinson, C. Nez, S. ill,J. Lewis, C. Hirani, J. S. L. Pacheco and J. M. Cerrato,Environ. Sci. Technol., 2015, 49, 8506–8514.
3 S. D. Kamp and S. J. Morrison, Groundwater Monit. Rem.,2014, 34, 68–78.
4 USEPA, Technical Report on Technologically EnhancedNaturally Occurring Radioactive Materials from UraniumMining Volume 1: Mining and Reclamation Background, U.S.
This journal is © The Royal Society of Chemistry 2017
Environmental Protection Agency, Office of Radiation andIndoor Air, 2008, EPA 402-R-08-005.
5 R. Seager, M. Ting, C. Li, N. Naik, B. Cook, J. Nakamura andH. Liu, Nat. Clim. Change, 2013, 3, 482–486.
6 L. Hund, E. J. Bedrick, C. Miller, G. Huerta, T. Nez,S. Ramone, C. Shuey, M. Cajero and J. Lewis, J. Roy. Stat.Soc., 2015, 178(4), 1069–1091.
7 USEPA, NPL Site narrative for Jackpile-Paguate UraniumMine,http://semspub.epa.gov/work/06/300064.pdf, lastupdated 12/6/2013.
8 J. T. Nash, Econ. Geol., 1968, 63, 737–750.9 R. H. Moench and J. S. Schlee, Geology and uranium depositsof the Laguna district, US Government Printing Office, NewMexico, 1967.
10 US Bureau of Land Management, Jackpile Paguate uraniummine reclamation project: environmental impact statement,US Dept. of the Interior, Bureau of Land Management,Albuquerque District Office: Bureau of Indian Affairs,Albuquerque Area Office, 1985.
11 Y. Wang, A. Bagnoud, E. Suvorova, E. McGivney, L. Chesaux,V. Phrommavanh, M. Descostes and R. Bernier-Latmani,Environ. Sci. Technol., 2014, 48, 10062–10070.
12 J. M. Zachara, P. E. Long, J. Bargar, J. A. Davis, P. Fox,J. K. Fredrickson, M. D. Freshley, A. E. Konopka, C. Liu,J. P. McKinley, M. L. Rockhold, K. H. Williams andS. B. Yabusaki, J. Contam. Hydrol., 2013, 147, 45–72.
13 B. D. Stewart, M. A. Mayes and S. Fendorf, Environ. Sci.Technol., 2010, 44, 928–934.
14 K. U. Ulrich, E. S. Ilton, H. Veeramani, J. O. Sharp, R. Bernier-Latmani, E. J. Schoeld, J. R. Bargar and D. E. Giammar,Geochim. Cosmochim. Acta, 2009, 73, 6065–6083.
15 N. P. Qafoku, J. M. Zachara, C. X. Liu, P. L. Gassman,O. S. Qafoku and S. C. Smith, Environ. Sci. Technol., 2005,39, 3157–3165.
16 D. E. Giammar and J. G. Hering, Environ. Sci. Technol., 2001,35, 3332–3337.
17 P. Byrne, I. Reid and P. J. Wood, Environ. Monit. Assess., 2013,185, 2817–2832.
18 G. Olivie-Lauquet, G. Gruau, A. Dia, C. Riou, A. Jaffrezic andO. Henin, Water Res., 2001, 35, 943–952.
19 M. C. Moncur, C. J. Ptacek, M. Hayashi, D. W. Blowes andS. J. Birks, Appl. Geochem., 2014, 41, 176–188.
20 L. Newsome, K. Morris and J. R. Lloyd, Chem. Geol., 2014,363, 164–184.
21 G. M. Gadd, Geoderma, 2004, 122, 109–119.22 R. T. Anderson, H. A. Vrionis, I. Ortiz-Bernad, C. T. Resch,
P. E. Long, R. Dayvault, K. Karp, S. Marutzky,D. R. Metzler, A. Peacock, D. C. White, M. Lowe andD. R. Lovley, Appl. Environ. Microbiol., 2003, 69, 5884–5891.
23 R. Schueneman, A. Khaskelis, D. Eastwood, W. Van Ooij andL. Burggraf, J. Nucl. Mater., 2003, 323, 8–17.
24 R. J. Finch and R. C. Ewing, J. Nucl. Mater., 1992, 190, 133–156.
25 P. C. Burns, Can. Mineral., 2005, 43, 1839–1894.26 D. Gorman-Lewis, P. C. Burns and J. B. Fein, J. Chem.
Thermodyn., 2008, 40, 335–352.
Environ. Sci.: Processes Impacts, 2017, 19, 605–621 | 619
Environmental Science: Processes & Impacts Paper
Publ
ishe
d on
06
Mar
ch 2
017.
Dow
nloa
ded
by U
NIT
ED S
TATE
S G
EOLO
GIC
AL
SUR
VEY
on
12/1
2/20
17 1
7:07
:30.
View Article Online
27 T. K. Tokunaga, Y. Kim, J. Wan and L. Yang, Environ. Sci.Technol., 2012, 46, 7471–7477.
28 M. S. Massey, J. S. Lezama-Pacheco, M. E. Jones, E. S. Ilton,J. M. Cerrato, J. R. Bargar and S. Fendorf, Geochim.Cosmochim. Acta, 2014, 142, 166–185.
29 P. S. Nico, B. D. Stewart and S. Fendorf, Environ. Sci. Technol.,2009, 43, 7391–7396.
30 W. Dong and S. C. Brooks, Environ. Sci. Technol., 2006, 40,4689–4695.
31 W. Dong and S. C. Brooks, Environ. Sci. Technol., 2008, 42,1979–1983.
32 K. E. Fletcher, M. I. Boyanov, S. H. Thomas, Q. Z. Wu,K. M. Kemner and F. E. Loffler, Environ. Sci. Technol., 2010,44, 4705–4709.
33 T. Borch, R. Kretzschmar, A. Kappler, P. V. Cappellen,M. Ginder-Vogel, A. Voegelin and K. Campbell, Environ.Sci. Technol., 2010, 44, 15–23.
34 K. M. Campbell, R. K. Kukkadapu, N. Qafoku, A. D. Peacock,E. Lesher, K. H. Williams, J. R. Bargar, M. J. Wilkins,L. Figueroa and J. Ranville, Appl. Geochem., 2012, 27, 1499–1511.
35 J. R. Bargar, K. H. Williams, K. M. Campbell, P. E. Long,J. E. Stubbs, E. I. Suvorova, J. S. Lezama-Pacheco,D. S. Alessi, M. Stylo, S. M. Webb, J. A. Davis,D. E. Giammar, L. Y. Blue and R. Bernier-Latmani, Proc.Natl. Acad. Sci. U. S. A., 2013, 110, 4506–4511.
36 D. W. Risser, P. A. Davis, J. A. Baldwin and D. P. McAda, USGeological Surey Water Resources Investigation Report, 1984,vol. 84, p. 26.
37 C. H. Maxwell, Mesozoic Stratigraphy of the Laguna-GrantsRegion, New Mexico Geological Society Guidebook, 33rd FieldConference, Albuquerque Country, 1982, vol. 2.
38 S. S. Adams, H. S. Curtis, P. L. Hafen and H. Salek-Nejad,Econ. Geol., 1978, 73, 1635–1654.
39 U. S. Geological Survey, Mineral Resource Online Data,http://mrdata.usgs.gov/geology/state/map.html, accessedNovember 10, 2016.
40 U. S. Geological Survey, 08349800 Rio Paguate Below JackpileMine near Laguna, NM, https://waterdata.usgs.gov/nwis/inventory?agency_code¼USGS&site_no¼08349800, 2017,accessed January 14, 2017.
41 D. L. Stoliker, K. M. Campbell, P. M. Fox, D. M. Singer,N. Kaviani, M. Carey, N. E. Peck, J. R. Bargar, D. B. Kentand J. A. Davis, Environ. Sci. Technol., 2013, 47, 9225–9232.
42 D. S. Alessi, B. Uster, H. Veeramani, E. I. Suvorova,J. S. Lezama-Pacheco, J. E. Stubbs, J. R. Bargar andR. Bernier-Latmani, Environ. Sci. Technol., 2012, 46, 6150–6157.
43 C. L. Lauber, N. Zhou, J. I. Gordon, R. Knight and N. Fierer,FEMS Microbiol. Lett., 2010, 307, 80–86.
44 M. F. Kirk, B. H. Wilson, K. A. Marquart, L. H. Zeglin,D. S. Vinson and T. M. Flynn, Front. Microbiol., 2015, 6,DOI: 10.3389/fmicb.2015.01287.
45 C. Wuchter, E. Banning, T. J. Mincer, N. J. Drenzek andM. J. L. Coolen, Front. Microbiol., 2013, 4, DOI: 10.3389/fmicb.2013.00367.
620 | Environ. Sci.: Processes Impacts, 2017, 19, 605–621
46 J. G. Caporaso, J. Kuczynski, J. Stombaugh, K. Bittinger,F. D. Bushman, E. K. Costello, N. Fierer, A. G. Pena,J. K. Goodrich, J. I. Gordon, G. A. Huttley, S. T. Kelley,D. Knights, J. E. Koenig, R. E. Ley, C. A. Lozupone,D. McDonald, B. D. Muegge, M. Pirrung, J. Reeder,J. R. Sevinsky, P. J. Tumbaugh, W. A. Walters, J. Widmann,T. Yatsunenko, J. Zaneveld and R. Knight, Nat. Methods,2010, 7, 335–336.
47 D. McDonald, M. N. Price, J. Goodrich, E. P. Nawrocki,T. Z. DeSantis, A. Probst, G. L. Andersen, R. Knight andP. Hugenholtz, ISME J., 2012, 6, 610–618.
48 USEPA, Radionuclides Rule: A Quick Reference Guide, 2001,EPA 816-F-01-003.
49 N. Janot, J. S. Lezama Pacheco, D. Q. Pham, T. M. O'Brien,D. Hausladen, V. Noel, F. Lallier, K. Maher, S. Fendorf andK. H. Williams, Environ. Sci. Technol., 2015, 50,46–53.
50 N. P. Qafoku, B. N. Gartman, R. K. Kukkadapu, B. W. Arey,K. H. Williams, P. J. Mouser, S. M. Heald, J. R. Bargar,N. Janot and S. Yabusaki, Appl. Geochem., 2014, 42,77–85.
51 E. R. Gilson, S. Huang, P. G. Koster van Groos,K. G. Scheckel, O. Qafoku, A. D. Peacock, D. I. Kaplan andP. R. Jaffe, Environ. Sci. Technol., 2015, 49, 12214–12222.
52 D. Li, J. C. Seaman, H.-S. Chang, P. R. Jaffe, P. K. van Groos,D.-T. Jiang, N. Chen, J. Lin, Z. Arthur and Y. Pan, J. Environ.Radioact., 2014, 131, 40–46.
53 A. Schoner, C. Noubactep, G. Buchel and M. Sauter, Chem.Erde-Geochem., 2009, 69, 91–107.
54 J. Otton, Surcial uranium deposits: summary and conclusions,International Atomic Energy Agency, 1984.
55 P. E. Long, K. H. Williams, J. A. Davis, P. M. Fox,M. J. Wilkins, S. B. Yabusaki, Y. Fang, S. R. Waichler,E. S. Berman and M. Gupta, Geochim. Cosmochim. Acta,2015, 150, 106–124.
56 M. Duff and C. Amrhein, Soil Sci. Soc. Am. J., 1996, 60, 1393–1400.
57 S. A. Cumberland, G. Douglas, K. Grice and J. W. Moreau,Earth-Sci. Rev., 2016, 159, 160–185.
58 D. Li, D. I. Kaplan, H.-S. Chang, J. C. Seaman, P. R. Jaffe,P. Koster van Groos, K. G. Scheckel, C. U. Segre, N. Chen,D.-T. Jiang, M. Newville and A. Lanzirotti, Environ. Sci.Technol., 2015, 49, 2823–2832.
59 A. E. Ray, J. R. Bargar, V. Sivaswamy, A. C. Dohnalkova,Y. Fujita, B. M. Peyton and T. S. Magnuson, Geochim.Cosmochim. Acta, 2011, 75, 2684–2695.
60 E. Rosenberg, E. F. DeLong, S. Lory, E. Stackebrandt andF. Thompson, The Prokaryotes: Actinobacteria, Springer,Berlin Heidelberg, 2014.
61 G. Garrity, D. Brenner, N. Krieg and J. Staley, Bergey's Manualof Systematic Bacteriology, 2005, pp. 1059–1144.
62 N. Treude, D. Rosencrantz, W. Liesack and S. Schnell, FEMSMicrobiol. Ecol., 2003, 44, 261–269.
63 D. J. Lonergan, H. L. Jenter, J. D. Coates, E. Phillips,T. M. Schmidt and D. R. Lovley, J. Bacteriol., 1996, 178,2402–2408.
This journal is © The Royal Society of Chemistry 2017
Paper Environmental Science: Processes & Impacts
Publ
ishe
d on
06
Mar
ch 2
017.
Dow
nloa
ded
by U
NIT
ED S
TATE
S G
EOLO
GIC
AL
SUR
VEY
on
12/1
2/20
17 1
7:07
:30.
View Article Online
64 L. R. McGuinness, M. J. Wilkins, K. H. Williams, P. E. Longand L. J. Kerkhof, PLoS One, 2015, 10, e0137270.
65 E. Cardenas, W.-M. Wu, M. B. Leigh, J. Carley, S. Carroll,T. Gentry, J. Luo, D. Watson, B. Gu and M. Ginder-Vogel,Appl. Environ. Microbiol., 2010, 76, 6778–6786.
66 J. D. Wall and L. R. Krumholz, Annu. Rev. Microbiol., 2006, 60,149–166.
67 K. Maher, J. R. Bargar and G. E. Brown, Inorg. Chem., 2013,52, 3510–3532.
This journal is © The Royal Society of Chemistry 2017
68 H. H. Zehner, Hydrology and water-quality monitoringconsiderations, Jackpile uranium mine northwestern NewMexico, U.S. Geological Survey, Water-ResourcesInvestigations Report 85-4226, 1985.
69 C. de Carvalho Filho, R. Moreira, B. Guimaraes, V. Ferreira,L. Auler, H. Palmieri, A. Oliveira and P. Dutra, Environ. EarthSci., 2016, 75, 1–14.
70 A. Neiva, P. Carvalho, I. Antunes, M. Silva, A. Santos,M. C. Pinto and P. Cunha, J. Geochem. Explor., 2014, 136,102–117.
Environ. Sci.: Processes Impacts, 2017, 19, 605–621 | 621
Related Documents