Journal of Applied Phycology 16: 181–194, 2004. C 2004 Kluwer Academic Publishers. Printed in the Netherlands. 181 Uptake kinetics and assimilation of phosphorus by Catenella nipae and Ulva lactuca can be used to indicate ambient phosphate availability John W. Runcie 1,2,∗ , Raymond J. Ritchie 1 and Anthony W.D. Larkum 1 1 School of Biological Sciences, University of Sydney, NSW 2006, Australia; 2 Present address: Institute for Water and Environmental Resource Management, University of Technology, Sydney, Westbourne Street, Gore Hill, NSW 2065, Australia ∗ Author for correspondence (e-mail: [email protected]; fax +61-2-9514-4079) Received 26 February 2004; accepted 23 March 2004 Key words: Catenella nipae, compartmental analysis, efflux, nutrient deficient, phosphorus, trichloroacetic acid, Ulva lactuca, uptake kinetics Abstract Uptake, assimilation and compartmentation of phosphate were studied in the opportunist green macroalga Ulva lactuca and the estuarine red algal epiphyte Catenella nipae. The Michaelis–Menten model was used to describe up- take rates of inorganic phosphate (P i ) at different concentrations. Maximum uptake rates (V max ) of P-starved material exceeded V max of P-enriched material; this difference was greater for C. nipae. Uptake and allocation of phosphorus (P) to internal pools was measured using trichloroacetic acid (TCA) extracts and 32 P. Both species demonstrated similar assimilation paths: when P-enriched, most 32 P accumulated as free phosphate. When unenriched, 32 P was rapidly assimilated into the TCA-insoluble pool. C. nipae consistently assimilated more 32 P into this pool than U. lactuca, indicating C. nipae has a greater P-storage capacity. In both species, 32 P release data showed two internal compartments with very different biological half-lives. The rapidly exchanging compartment had a short half-life of ≈2 to 12 min, while the slowly exchanging compartment had a much longer half-life of 12 days in P-starved C. nipae or 4 days in P-starved U. lactuca. In both species, the slowly exchanging compartment accounted for more than 90% of total tissue. U. lactuca and C. nipae responded differently to high external P i . U. lactuca rapidly took up P i , transferring this P i into tissue phosphate and TCA-soluble P in a few hours (≈90% of total P). C. nipae took up P i at lower rates and stored much of this P in less mobile TCA-insoluble forms. Long-term storage of refractory forms of P makes C. nipae a useful bioindicator of the prevailing conditions of P i availability over at least the previous 7 days, whereas the P-status of U. lactuca may reflect conditions over no more than the previous few hours or days. C. nipae is a more useful bioindicator for P status of estuarine and marine waters than U. lactuca. Abbreviations: ASW, artificial seawater; DW, dry weight; φ, flux; FW, fresh weight; K m , half saturation concentra- tion; PAR, photosynthetically active radiation (400–700 nm); P, phosphorus; P i , inorganic phosphorus; N i , inorganic nitrogen; V max , maximum uptake rate Introduction Macroalgae have been used as indicators of ambient water quality in numerous studies as they not only pro- vide intrinsic biological relevance to a program of water quality assessment but also provide considerably more temporal resolution than water sample analysis alone (Horrocks et al., 1995; Fong et al., 1998; Dennison and Abal, 1999). Analysis of phosphorus (P) content in macroalgal tissue is one of many methods that have been used to infer concentrations of ambient phospho- rus in the water column (e.g. Lyngby et al., 1999). The technique has the advantage that collection, storage and analysis of algal samples is straightforward and re- quires minimal specialised equipment. The P content of a macroalga is largely dependent on its capacity to take up and store P over time, and this can vary markedly between species and as such, an understanding of these

Welcome message from author
This document is posted to help you gain knowledge. Please leave a comment to let me know what you think about it! Share it to your friends and learn new things together.
Transcript
Journal of Applied Phycology 16: 181–194, 2004.C© 2004 Kluwer Academic Publishers. Printed in the Netherlands.
181
Uptake kinetics and assimilation of phosphorus by Catenella nipae andUlva lactuca can be used to indicate ambient phosphate availability
John W. Runcie1,2,∗, Raymond J. Ritchie1 and Anthony W.D. Larkum1
1School of Biological Sciences, University of Sydney, NSW 2006, Australia; 2Present address: Institute for Waterand Environmental Resource Management, University of Technology, Sydney, Westbourne Street, Gore Hill, NSW2065, Australia∗Author for correspondence (e-mail: [email protected]; fax +61-2-9514-4079)
Received 26 February 2004; accepted 23 March 2004
Key words: Catenella nipae, compartmental analysis, efflux, nutrient deficient, phosphorus, trichloroacetic acid,Ulva lactuca, uptake kinetics
Abstract
Uptake, assimilation and compartmentation of phosphate were studied in the opportunist green macroalga Ulvalactuca and the estuarine red algal epiphyte Catenella nipae. The Michaelis–Menten model was used to describe up-take rates of inorganic phosphate (Pi) at different concentrations. Maximum uptake rates (Vmax) of P-starved materialexceeded Vmax of P-enriched material; this difference was greater for C. nipae. Uptake and allocation of phosphorus(P) to internal pools was measured using trichloroacetic acid (TCA) extracts and 32P. Both species demonstratedsimilar assimilation paths: when P-enriched, most 32P accumulated as free phosphate. When unenriched, 32P wasrapidly assimilated into the TCA-insoluble pool. C. nipae consistently assimilated more 32P into this pool than U.lactuca, indicating C. nipae has a greater P-storage capacity. In both species, 32P release data showed two internalcompartments with very different biological half-lives. The rapidly exchanging compartment had a short half-lifeof ≈2 to 12 min, while the slowly exchanging compartment had a much longer half-life of 12 days in P-starved C.nipae or 4 days in P-starved U. lactuca. In both species, the slowly exchanging compartment accounted for morethan 90% of total tissue. U. lactuca and C. nipae responded differently to high external Pi. U. lactuca rapidly tookup Pi, transferring this Pi into tissue phosphate and TCA-soluble P in a few hours (≈90% of total P). C. nipae tookup Pi at lower rates and stored much of this P in less mobile TCA-insoluble forms. Long-term storage of refractoryforms of P makes C. nipae a useful bioindicator of the prevailing conditions of Pi availability over at least theprevious 7 days, whereas the P-status of U. lactuca may reflect conditions over no more than the previous few hoursor days. C. nipae is a more useful bioindicator for P status of estuarine and marine waters than U. lactuca.
Abbreviations: ASW, artificial seawater; DW, dry weight; φ, flux; FW, fresh weight; Km, half saturation concentra-tion; PAR, photosynthetically active radiation (400–700 nm); P, phosphorus; Pi, inorganic phosphorus; Ni, inorganicnitrogen; Vmax, maximum uptake rate
Introduction
Macroalgae have been used as indicators of ambientwater quality in numerous studies as they not only pro-vide intrinsic biological relevance to a program of waterquality assessment but also provide considerably moretemporal resolution than water sample analysis alone(Horrocks et al., 1995; Fong et al., 1998; Dennisonand Abal, 1999). Analysis of phosphorus (P) content
in macroalgal tissue is one of many methods that havebeen used to infer concentrations of ambient phospho-rus in the water column (e.g. Lyngby et al., 1999). Thetechnique has the advantage that collection, storageand analysis of algal samples is straightforward and re-quires minimal specialised equipment. The P content ofa macroalga is largely dependent on its capacity to takeup and store P over time, and this can vary markedlybetween species and as such, an understanding of these
182
physiological responses to inorganic P (Pi) in a bathingmedium is essential if we are to derive a meaningfulinterpretation of algal P tissue content. In this studywe examined influx, efflux and assimilation of Pi as or-thophosphate in two species of morphologically differ-ent macroalgae, and interpret these physiological char-acteristics in terms of their previous exposure to Pi.
Plants (and algae) exposed to oligotrophic condi-tions eventually experience low internal P concentra-tions and in response to this develop a capacity forincreased P uptake via activation of extracellular phos-phatase enzymes to mobilise organic phosphates andbound phosphates (Lee, 2000; Hernandez et al., 2002)and special high affinity transporters to take up phos-phate (Smith et al., 2000; Rausch and Bucher, 2002).Algae take up phosphorus from the environment pri-marily in the form of soluble inorganic phosphate or or-thophosphate (Pi). Phosphate uptake by macroalgae isusually saturable (Wallentinus, 1984), and a rectangu-lar hyperbola model (the Michaelis–Menten model) isoften used to describe uptake where a single transporterbecomes saturated at some high concentration, oftenconsiderably above that observed in seawater or even ineutrophic estuaries (Harrison et al., 1989; Berges et al.,1994). This model provides two parameters: Vmax—themaximum rate of ion uptake, and Km—the ion concen-tration at which uptake rate proceeds at half the max-imum rate. The affinity (A) of a transport system maythen be derived from the parameter Vmax/Km (Harrisonet al., 1989; Berges et al., 1994).
In contrast to uptake, efflux of P from algae tothe surrounding medium has been reported as con-stant and independent of external phosphate concentra-tions (Lean and White, 1983; Istvanovics and Herodek,1995). By using exponential decay models to describethe time course of 32P release one can infer the sizesof, and fluxes associated with, internal P-containingcompartments (Wen et al., 1997) (where a compart-ment is defined as an assemblage of P-containingcompounds behaving in a kinetically homogeneousmanner (Anderson, 1983)). A two-compartment modelcan be used to distinguish rapidly and slowly exchang-ing compartments. While most compartmental analysisstudies have studied unicellular algae (Istvanovics andHerodek, 1995; Wen et al., 1997), little or no researchhas investigated inter-compartment flux of phosphorusin macroalgae.
In addition to compartmental analysis, extractionand quantification of compounds that are soluble andinsoluble in trichloroacetic acid (TCA) provides fur-ther insight into patterns of incorporation of P within
algae (Kulaev, 1979; Runcie and Larkum, 2001). TheTCA extraction technique enables identification of apool consisting of relatively labile P-containing com-ponents such as lipids, sugars, nucleotides, and shortchain polyphosphates in addition to soluble phosphate.This is called the TCA-soluble fraction, and in terms ofkinetics this pool is analogous to the rapidly exchang-ing compartment. In contrast, the TCA-insoluble poolrepresents less mobile P-containing components suchas nucleic acids, longer chain polyphosphates and prob-ably phosphoproteins (Miyata and Hattori, 1986) andis analogous to the slowly exchanging compartment.
The kinetics of Pi flux into and out of an alga isinfluenced by the extent to which the internal P poolsare already filled—the capacity to rapidly convert Pi
to polyphosphate compounds imparts a Pi consumerthe capacity to sustain high uptake rates (Wagner andFaulkner, 2001). If an alga has been previously sub-jected to high levels of ambient Pi, then its capacityfor rapid uptake and assimilation is low. In compari-son, an alga that has been in a P-poor environment foran extended period will demonstrate rapid rates of Pi
influx and assimilation. Thus, we can infer from the ki-netics of Pi influx and assimilation of algae incubatedin medium with known P content the results of identi-cal experiments performed on field-collected material,and from this comparison determine whether the field-collected material has been exposed to an environmentwith higher or lower ambient P.
Ulva lactuca is a cosmopolitan opportunist widelyused in nutrient uptake (Lundberg et al., 1989;Pedersen and Borum, 1997) and bioindicator studies(e.g. Fong et al., 1998). It is able to rapidly take upnutrients (Runcie et al., 2003) and is often found in eu-trophic marine and estuarine environments. Catenellanipae (Gigartinales, Rhodophyta) is a widespread,conspicuous and easily identifiable intertidal epiphytein Indo-Pacific temperate and tropical estuaries, andhas been used to trace anthropogenic N (Dennison andAbal, 1999). It can survive in both low and high lightenvironments, tolerates periods of regular emersionand has a capacity for inorganic nitrogen uptake thatis considerably lower than that of U. lactuca (Runcieet al., 2003). This study characterises both the kineticsof P flux into and out of P-enriched and P-starved U.lactuca and C. nipae, and their capacity for P storage.We firstly used U. lactuca as a comparative benchmarkbecause of its cosmopolitan nature and the abundanceof literature describing the species and then appliedthe same techniques to C. nipae. The aim of the studywas to use the kinetic and storage characteristics of
183
the cultured material to interpret the P status of field-collected algae and thereby indicate ambient P avail-ability in estuarine waters.
Methods
Sample collection and pre-treatment
U. lactuca L. and C. nipae Zanardini were collectedfrom marine habitats in the Sydney region(NSW, Australia) between July 1998 and May 1999.Intertidal U. lactuca was collected near MaroubraBeach (33◦57′S, 151◦14′30′′ E) and C. nipae (epiphyticon mangrove pneumatophores) was collected fromMooney Mooney on the estuary of the HawkesburyRiver (33◦31′S, 151◦12′E). Dissolved Pi concen-trations of 0.45 µm filtered seawater collected atMaroubra and Mooney Mooney over the courseof experimentation were consistently less than0.5 µM PO3−
4 . The algae were either used the sameday or maintained in static P-enriched or P-free media.During these incubations, U. lactuca was constantlyimmersed in seawater with constant stirring, whileC. nipae was alternately incubated in recirculatedseawater (6 h) and then exposed to air (6 h) every12 h in order to simulate the tidal cycle. Pumpsmaintained water movement. U. lactuca was exposedto 120 µmol quanta m−2 s−1 while C. nipae received30 µmol quanta m−2 s−1 (Karsten et al., 1995); lightwas provided by Phillips cool white fluorescent tubesset to a 16:8 light:dark cycle. These irradiances weresimilar to approximate irradiances experienced bythese species in natural immersed (U. lactuca) andshaded (C. nipae) conditions. Medium for holdingmaterial prior to experimentation was made usingoceanic seawater with low phosphate concentration(0.23 ± 0.1 µM) supplemented with P-free f/2growth medium (Stein, 1973) and dissolved inorganicnitrogen (N) (30–50 µM NH4NO3), this mediumwas regularly replaced during incubations. All glass-and plastic-ware was acid-washed (≈10% HCl).All water-soluble orthophosphate species are herecollectively referred to as phosphate.
Prior to commencing uptake experiments the algaewere carefully cleaned in P-free artificial seawater(ASW; Ritchie, 1988) to remove debris and epiphyticmaterial, cut into pieces of a similar size, then exposedto high irradiance (450 µmol quanta m−2 s−1 PAR) forat least 10 min before addition of phosphate stock. Thiswashing and cleaning pre-treatment was essential forobtaining consistent results. Although epiphytic mate-
rial was removed from the thalli, no antibacterial agentwas used as on a mass basis the proportion of P removedfrom the medium by bacteria would be negligible.
Measurements of phosphate uptake kinetics usingunlabelled P
Twelve algal samples (∼0.5 g fresh weight (g FW))freshly collected from the field were prepared as de-scribed and placed in 50-mL beakers with 24 mLP-free ASW with constant shaking at ∼450 µmolquanta m−2 s−1 PAR (metal halide lamp directedthrough a water bath). On commencing the uptakeexperiment, aliquots of phosphate stock (added asNa2HPO4) were added to beakers to make a rangeof initial phosphate concentrations. The maximumphosphate concentrations were 20 µM (U. lactuca)or 5 µM (C. nipae). One milliliter samples of themedium were removed at 0, 6, 12 and 18 minafter addition. Uptake rates were calculated fromthe decline in phosphate in the bathing medium(Harrison et al., 1989); experimental medium was as-sayed for phosphate using an aspirated flow technique(Technicon Multilyzer, Technicon Industries, USA;American Public Health Association, 1998).
Measurements of phosphate influx kineticsusing 32P tracer
U. lactuca and C. nipae were incubated for 17–18 and13–14 days, respectively, in P-free f/2 medium andP-enriched medium (initial medium phosphate con-centrations: U. lactuca, 50 µM; C. nipae, 20 µM)with Ni additions (U. lactuca: 500 µM NH4NO3, C.nipae: 150 µM NH4NO3; Pedersen and Borum, 1997;Runcie et al., 2003). The medium was replaced regu-larly throughout the incubation period. On the day ofexperimentation, algae were also collected from thefield. Both field-collected and incubated thalli werethen cleaned, weighed (∼0.05 g FW), and exposedto medium in clear 2-mL tubes with 50 µmol quantam−2 s−1 PAR and a range of labelled phosphate concen-trations with a maximum concentration of 90 µM ra-diolabelled phosphate (32P: Australian Radioisotopes,Lucas Heights, NSW, Australia) (≈1 kBq) for 12 min.Medium (0.5 ml) was sampled 30 s (to account forlosses by adsorption) and 12 min after commencing theincubation. Medium and rinsed tissue samples (withadditional unlabelled medium to make up to a stan-dard aqueous volume of 200 µL) were counted us-ing liquid scintillation techniques (scintillant Beckman
184
Ready-Solv, Beckman Instruments, USA; scintillationcounter Packard 1600 TR, Packard Instruments, USA).
Measurements of phosphate assimilation
Assimilation was assessed in a two-stage experi-ment. Firstly, internal pools of freshly field-collected,P-enriched and P-starved algae were compared usingunlabelled P techniques. Here, U. lactuca and C. ni-pae were incubated for 13–15 days, and 18 days, re-spectively, in low (1.0 µM: “unenriched”) and high(30 µM: “enriched”) phosphate media with ∼40 µMNH4NO3, f/2 enrichment and 20 µmol quanta m−2 s−1
PAR (Phillips cool white fluorescent tubes). The P-content of these samples was assessed using a scaled-up version of the digestion techniques of Runcie andLarkum (2001): samples were blotted dry, weighed andextracted using trichloroacetic acid (TCA) and sepa-rated into tissue phosphate, TCA-soluble and TCA-insoluble pools. Reactive phosphate in these pools wasassayed using manual methods (Parsons et al., 1984)so that corrections could be made for absorption bypigment in extracts (Runcie and Larkum, 2001).
Secondly, influx of 32Pi by the remaining algae asdescribed was also compared over a 60 min periodby exposing replicate algal samples (∼0.05 g FW) tosmall volumes (<2 ml) of labelled medium (10 µM)for 0, 6, 12, 30 and 60 min intervals. The mediumwas sampled directly after commencing the incuba-tion and at the end of each interval, when three tis-sue samples were quickly removed from the medium,washed and frozen at −20◦ C for later TCA extrac-tion (Runcie and Larkum, 2001). Each experiment wasrepeated, and as results at each time point were notsignificantly different, data from replicate experimentswere pooled (Student’s t-test; Snedecor and Cochran,1980).
In addition to these measurements, additional mate-rial incubated in 32Pi for 1 (U. lactuca) or 2 (C. nipae)weeks was also extracted with TCA to determine thespecific activity of each fraction.
Measurements of efflux of 32P-labelled solutes
Freshly collected U. lactuca was incubated in ASW(250 µM NH4NO3, f/2) with low (0.5 µM: “P-poor”)and high (200 µM: “P-enriched”) concentrations of la-belled phosphate. 32Pi and non-labelled phosphate so-lutions were combined prior to addition to the media. U.lactuca was gently agitated at 60 µmol quanta m−2s−1
PAR (cool white light), 12:12 L:D for 7 days with
occasional replacement of medium, and C. nipae wasimmersed in ASW medium for alternate 6-hourly in-tervals at 30 µmol quanta m−2 s−1 PAR, 12:12 L:D for14–15 days. After the incubation period, a subsampleof this material was frozen for later TCA treatment(Runcie and Larkum, 2001) in order to provide anestimate of the relative allocation of 32Pi to differentpools within the algae. The remaining samples werethen carefully blotted and placed in 10 ml ASW (0.5or 200 µM unlabelled Pi) with gentle agitation. Irra-diance was 10 µmol quanta m−2 s−1 PAR (cool whitelight). After 30 s, the tissue sample was removed fromthe medium, swiftly shaken and transferred to another10 mL fresh ASW for a further 30 s incubation. Incuba-tion intervals were gradually increased from 30 s to 30min. Aliquots of the incubation medium immediatelyprior to the efflux experiment, each 10 mL volume, andalgal material were counted using liquid scintillationtechniques.
Measurements of P release from the cell wall
The holding capacity of cell wall material for phosphatewas estimated in the following way. Freshly collectedalgal material was repeatedly immersed in 90% ethanoland then a dilute solution of Triton X-100: water for48 h, thus removing the biological membranes leavinga relatively intact cell wall matrix (Ritchie and Larkum,1982). Ethanol was removed by washing in ASW thensoaking for 90 min in ASW with vigorous shaking.Material was then immersed in medium with labelledphosphate (1 µM) for 2 h (this brief incubation intervalensured minimal bacterial colonisation of the cell wall).Measurement of labelled P release from the cell wallwas determined using the same methods as for livematerial.
Data analysis
Uptake and influx rates were plotted against meanmedium concentration for each treatment. Nonlinearleast squares methods were used to fit linear and expo-nential models to the data (Ritchie and Prvan, 1996) us-ing commercially available software (Microcal Origin,SigmaPlot). Where parameter estimates of replicateexperiments were not significantly different (Tukey’stest), the mean parameter value was reported. The cor-relation coefficient (r ) for each treatment was calcu-lated using pooled data (Snedecor and Cochran, 1980).The variability of Vmax/Km values was determined bypropagating errors from Vmax and Km.
185
In the P release experiment, total radioactivity in al-gal material prior to incubation in unlabelled mediumwas calculated by adding the radioactivity of the mate-rial at the end of the experiment with the total radioac-tivity released to the unlabelled medium. Decliningtissue radioactivity was plotted against time. A doubleexponential decay model was fitted to the data, and rateconstants for intercompartment transfer and excretion,relative compartment sizes and fluxes were calculatedaccording to Wen et al. (1997). Half-lives were cal-culated according to Atkins (1969). Curve fitting wasconducted by nonlinear least squares on 1/y2 weighteddata (DiCera, 1992) and estimates of error for each pa-rameter were obtained. Although attempts were madeto fit a more complex model with two exponential de-cay functions and a constant, the fitted parameters werenot significantly different to zero so the model wasabandoned. Values of P content of unlabelled materialfrom previous experiments were determined by per-chloric/nitric acid digestion (Allen, 1974), and thesevalues were used to calculate total tissue P content(non-radioactive P and 32P). Final non-radioactive con-tent of algal material was estimated from both theinferred quantities of Pi removed from media dur-ing the course of the experiment, and the assumedconstant levels of phosphate carried over from beforethe beginning of the experiment. Estimates of signifi-cance are reported at the p < 0.05 level unless statedotherwise.
Results
Phosphate uptake and influx
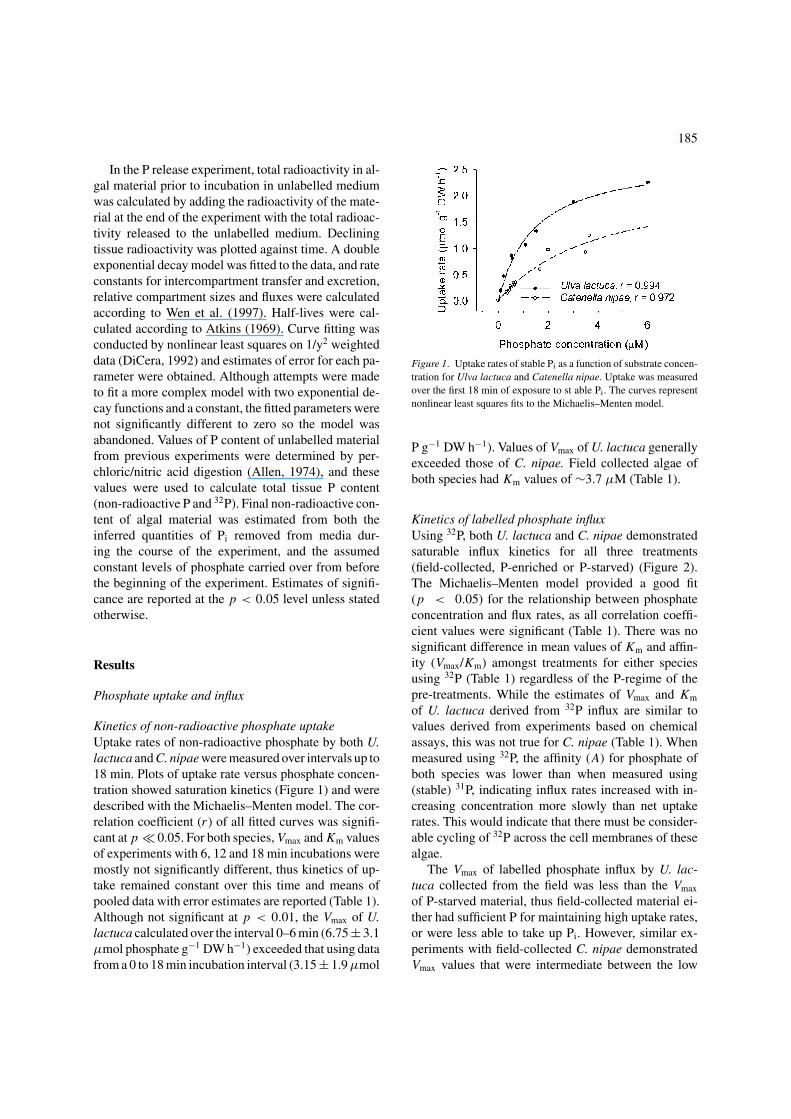
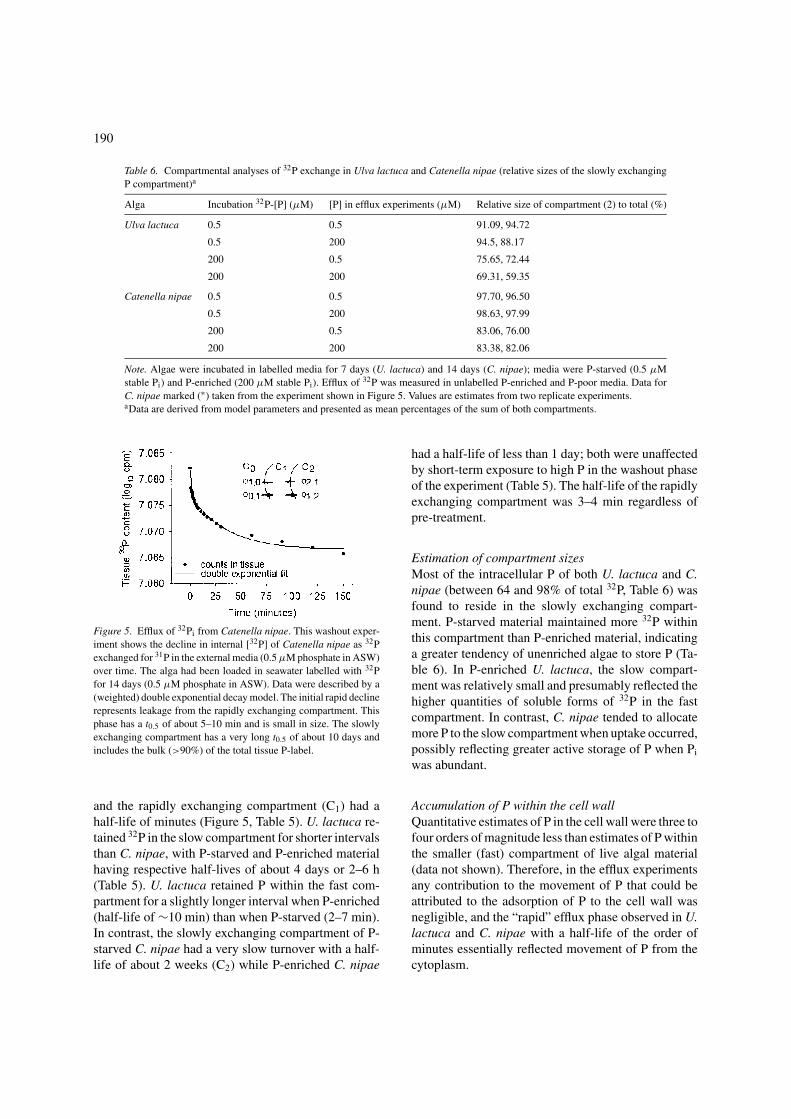
Kinetics of non-radioactive phosphate uptakeUptake rates of non-radioactive phosphate by both U.lactuca and C. nipae were measured over intervals up to18 min. Plots of uptake rate versus phosphate concen-tration showed saturation kinetics (Figure 1) and weredescribed with the Michaelis–Menten model. The cor-relation coefficient (r ) of all fitted curves was signifi-cant at p � 0.05. For both species, Vmax and Km valuesof experiments with 6, 12 and 18 min incubations weremostly not significantly different, thus kinetics of up-take remained constant over this time and means ofpooled data with error estimates are reported (Table 1).Although not significant at p < 0.01, the Vmax of U.lactuca calculated over the interval 0–6 min (6.75 ± 3.1µmol phosphate g−1 DW h−1) exceeded that using datafrom a 0 to 18 min incubation interval (3.15 ± 1.9 µmol
Figure 1. Uptake rates of stable Pi as a function of substrate concen-tration for Ulva lactuca and Catenella nipae. Uptake was measuredover the first 18 min of exposure to st able Pi. The curves representnonlinear least squares fits to the Michaelis–Menten model.
P g−1 DW h−1). Values of Vmax of U. lactuca generallyexceeded those of C. nipae. Field collected algae ofboth species had Km values of ∼3.7 µM (Table 1).
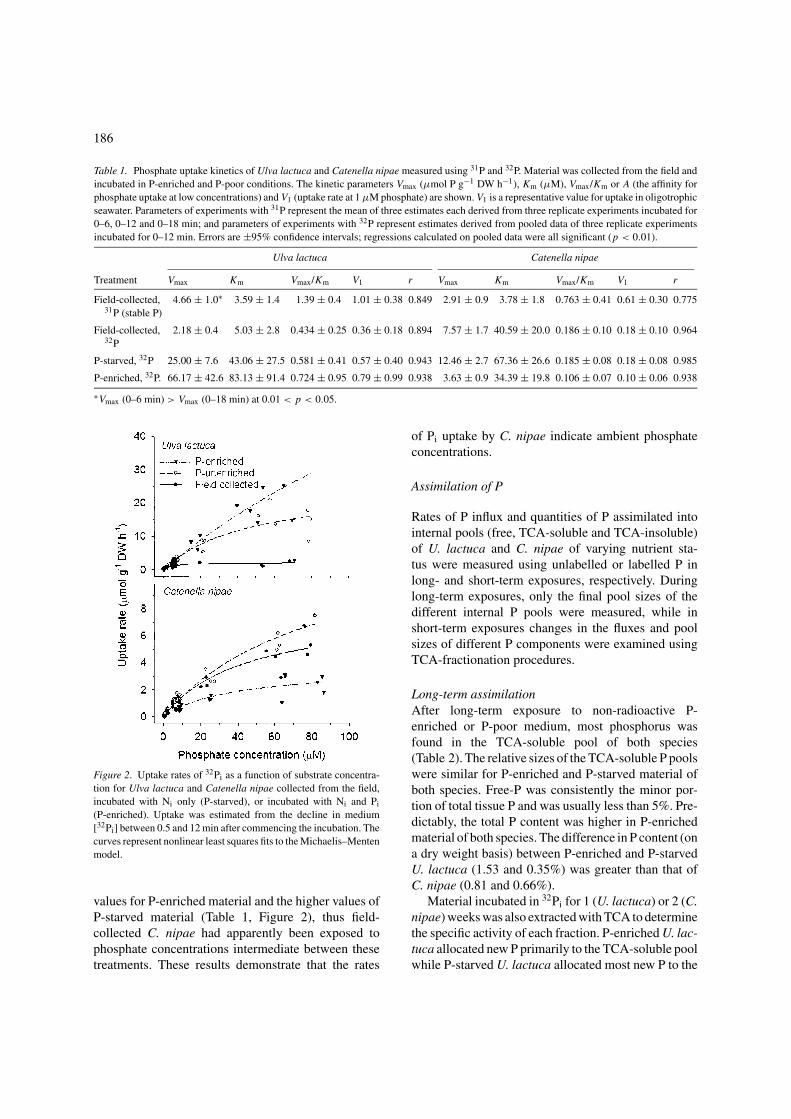
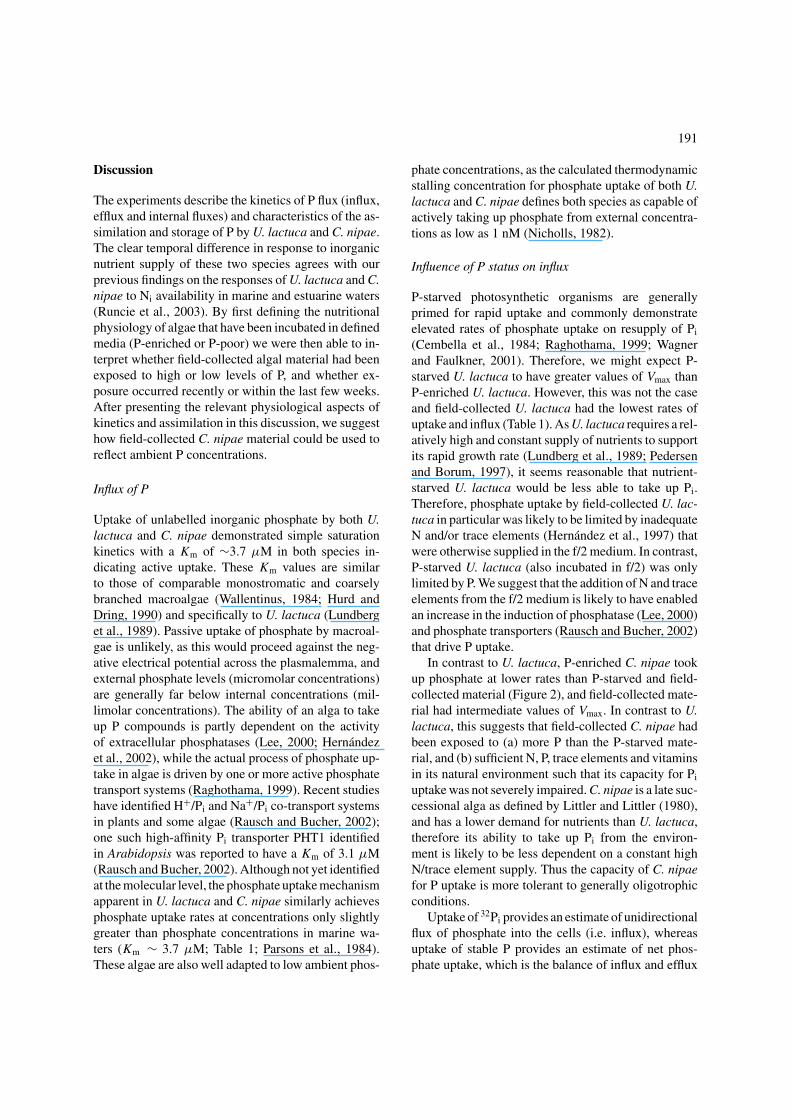
Kinetics of labelled phosphate influxUsing 32P, both U. lactuca and C. nipae demonstratedsaturable influx kinetics for all three treatments(field-collected, P-enriched or P-starved) (Figure 2).The Michaelis–Menten model provided a good fit(p < 0.05) for the relationship between phosphateconcentration and flux rates, as all correlation coeffi-cient values were significant (Table 1). There was nosignificant difference in mean values of Km and affin-ity (Vmax/Km) amongst treatments for either speciesusing 32P (Table 1) regardless of the P-regime of thepre-treatments. While the estimates of Vmax and Km
of U. lactuca derived from 32P influx are similar tovalues derived from experiments based on chemicalassays, this was not true for C. nipae (Table 1). Whenmeasured using 32P, the affinity (A) for phosphate ofboth species was lower than when measured using(stable) 31P, indicating influx rates increased with in-creasing concentration more slowly than net uptakerates. This would indicate that there must be consider-able cycling of 32P across the cell membranes of thesealgae.
The Vmax of labelled phosphate influx by U. lac-tuca collected from the field was less than the Vmax
of P-starved material, thus field-collected material ei-ther had sufficient P for maintaining high uptake rates,or were less able to take up Pi. However, similar ex-periments with field-collected C. nipae demonstratedVmax values that were intermediate between the low
186
Table 1. Phosphate uptake kinetics of Ulva lactuca and Catenella nipae measured using 31P and 32P. Material was collected from the field andincubated in P-enriched and P-poor conditions. The kinetic parameters Vmax (µmol P g−1 DW h−1), Km (µM), Vmax/Km or A (the affinity forphosphate uptake at low concentrations) and V1 (uptake rate at 1 µM phosphate) are shown. V1 is a representative value for uptake in oligotrophicseawater. Parameters of experiments with 31P represent the mean of three estimates each derived from three replicate experiments incubated for0–6, 0–12 and 0–18 min; and parameters of experiments with 32P represent estimates derived from pooled data of three replicate experimentsincubated for 0–12 min. Errors are ±95% confidence intervals; regressions calculated on pooled data were all significant (p < 0.01).
Ulva lactuca Catenella nipae
Treatment Vmax Km Vmax/Km V1 r Vmax Km Vmax/Km V1 r
Field-collected, 4.66 ± 1.0∗ 3.59 ± 1.4 1.39 ± 0.4 1.01 ± 0.38 0.849 2.91 ± 0.9 3.78 ± 1.8 0.763 ± 0.41 0.61 ± 0.30 0.77531P (stable P)
Field-collected, 2.18 ± 0.4 5.03 ± 2.8 0.434 ± 0.25 0.36 ± 0.18 0.894 7.57 ± 1.7 40.59 ± 20.0 0.186 ± 0.10 0.18 ± 0.10 0.96432P
P-starved, 32P 25.00 ± 7.6 43.06 ± 27.5 0.581 ± 0.41 0.57 ± 0.40 0.943 12.46 ± 2.7 67.36 ± 26.6 0.185 ± 0.08 0.18 ± 0.08 0.985
P-enriched, 32P. 66.17 ± 42.6 83.13 ± 91.4 0.724 ± 0.95 0.79 ± 0.99 0.938 3.63 ± 0.9 34.39 ± 19.8 0.106 ± 0.07 0.10 ± 0.06 0.938
∗Vmax (0–6 min) > Vmax (0–18 min) at 0.01 < p < 0.05.
Figure 2. Uptake rates of 32Pi as a function of substrate concentra-tion for Ulva lactuca and Catenella nipae collected from the field,incubated with Ni only (P-starved), or incubated with Ni and Pi
(P-enriched). Uptake was estimated from the decline in medium[32Pi] between 0.5 and 12 min after commencing the incubation. Thecurves represent nonlinear least squares fits to the Michaelis–Mentenmodel.
values for P-enriched material and the higher values ofP-starved material (Table 1, Figure 2), thus field-collected C. nipae had apparently been exposed tophosphate concentrations intermediate between thesetreatments. These results demonstrate that the rates
of Pi uptake by C. nipae indicate ambient phosphateconcentrations.
Assimilation of P
Rates of P influx and quantities of P assimilated intointernal pools (free, TCA-soluble and TCA-insoluble)of U. lactuca and C. nipae of varying nutrient sta-tus were measured using unlabelled or labelled P inlong- and short-term exposures, respectively. Duringlong-term exposures, only the final pool sizes of thedifferent internal P pools were measured, while inshort-term exposures changes in the fluxes and poolsizes of different P components were examined usingTCA-fractionation procedures.
Long-term assimilationAfter long-term exposure to non-radioactive P-enriched or P-poor medium, most phosphorus wasfound in the TCA-soluble pool of both species(Table 2). The relative sizes of the TCA-soluble P poolswere similar for P-enriched and P-starved material ofboth species. Free-P was consistently the minor por-tion of total tissue P and was usually less than 5%. Pre-dictably, the total P content was higher in P-enrichedmaterial of both species. The difference in P content (ona dry weight basis) between P-enriched and P-starvedU. lactuca (1.53 and 0.35%) was greater than that ofC. nipae (0.81 and 0.66%).
Material incubated in 32Pi for 1 (U. lactuca) or 2 (C.nipae) weeks was also extracted with TCA to determinethe specific activity of each fraction. P-enriched U. lac-tuca allocated new P primarily to the TCA-soluble poolwhile P-starved U. lactuca allocated most new P to the
187
Table 2. Long-term allocation of 31P by Ulva lactuca and Catenella nipae incubated in P-enriched or P-poor media. TCA-soluble P compounds were extracted with trichloroacetic acid; material was incubated for 14 days (U. lactuca) or 18 days (C.nipae). Values are in µmol P g−1 DW with ±95% confidence limits (n = 3). Percentages of the total tissue P are also shown.
Alga Treatment Free phosphate TCA-soluble P TCA-insoluble P Total-P
Ulva lactuca P-starved 4.2 ± 1.38 93.6 ± 12.5 14.5 ± 6.9 112 ± 14
3.8 ± 1.3% 84 ± 15% 13 ± 6.4%
P-enriched 40.0 ± 9.72 430 ± 75.7 23.3 ± 6.9 494 ± 77
8.1 ± 2.3% 87 ± 20% 4.7 ± 1.6%
Catenella nipae P-starved 7.4 ± 2.8 149 ± 4.2 56 ± 25 213 ± 26
3.5 ± 1.4% 70 ± 8.8% 26 ± 12%
P-enriched 7.1 ± 1.38 153 ± 50 101 ± 31 261 ± 592.7 ± 0.81% 59 ± 23% 39 ± 15%
Table 3. Medium-term allocation of 32P by Ulva lactuca and Catenella nipae incubated in P-enriched or P-poor medium. 32Pi wasallocated over a 7-day (U. lactuca) or 14-day (C. nipae) period to free phosphate, TCA-soluble and TCA-insoluble compounds.Values are cpm (106×) with ±95% confidence limits, n = 6. Percentages of the total 32P counts in the tissues are shown ±95%confidence limits.
Alga Treatment Free phosphate TCA-soluble P TCA-insoluble P Total-P
Ulva lactuca P-starved 2.57 ± 1.06 2.17 ± 1.13 4.39 ± 1.10 9.13 ± 1.90
28 ± 13% 24 ± 13% 48 ± 16%
P-enriched 2.65 ± 0.55 7.50 ± 1.71 0.28 ± 0.081 10.4 ± 1.80
25 ± 6.9% 72 ± 21% 2.7 ± 0.9%
Catenella nipae P-starved 0.055 ± 0.00018 0.097 ± 0.039 0.23 ± 0.027 0.38 ± 0.047
14 ± 1.8% 26 ± 11% 61 ± 10%
P-enriched 0.47 ± 0.14 0.88 ± 0.10 3.49 ± 1.34 4.84 ± 1.35
9.7 ± 4.0% 18 ± 5.5% 72 ± 34%
TCA-insoluble pool (Table 3). A similar proportion oflabel was incorporated into the free phosphate poolregardless of treatment. In contrast to U. lactuca, bothP-enriched and P-starved C. nipae allocated new Pto each pool in similar proportions (Table 3), and P-starved C. nipae took up 12 times more labelled phos-phate than P-enriched C. nipae.
Disparities in the percentages of chemically as-sayed phosphate (Table 2) and 32P-labelled P in eachof the three fractions (Table 3) show that a large por-tion of the TCA-soluble and TCA-insoluble fractionsmust turn over very slowly. This disparity suggests that32P had not fully reached isotopic equilibrium in theTCA-soluble and TCA-insoluble fractions, otherwisemeasurements of the relative proportions of eachpool using radioactive and non-radioactive techniqueswould have been similar. Hence, 32P labelling of themore slowly exchanging compounds in the TCA-insoluble pool would have been least complete, andconsequently the free-P pool would be overestimated.
These conclusions were confirmed by the kinetic ex-change experiments (see later).
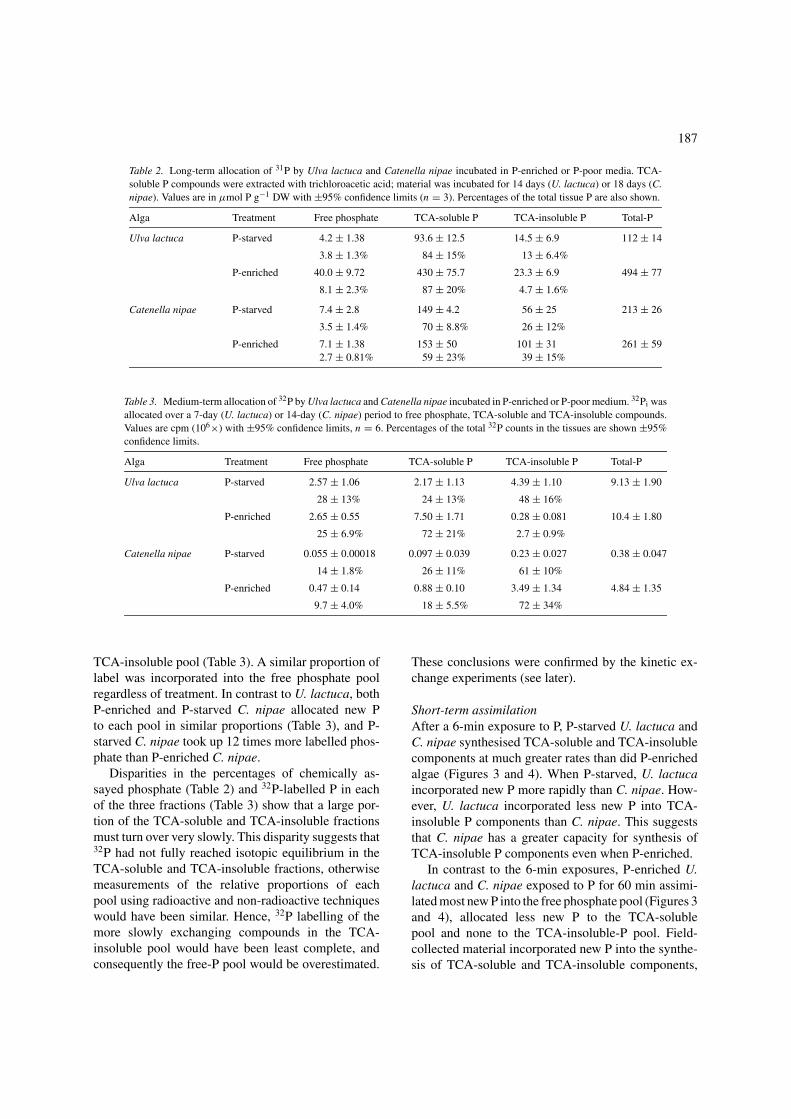
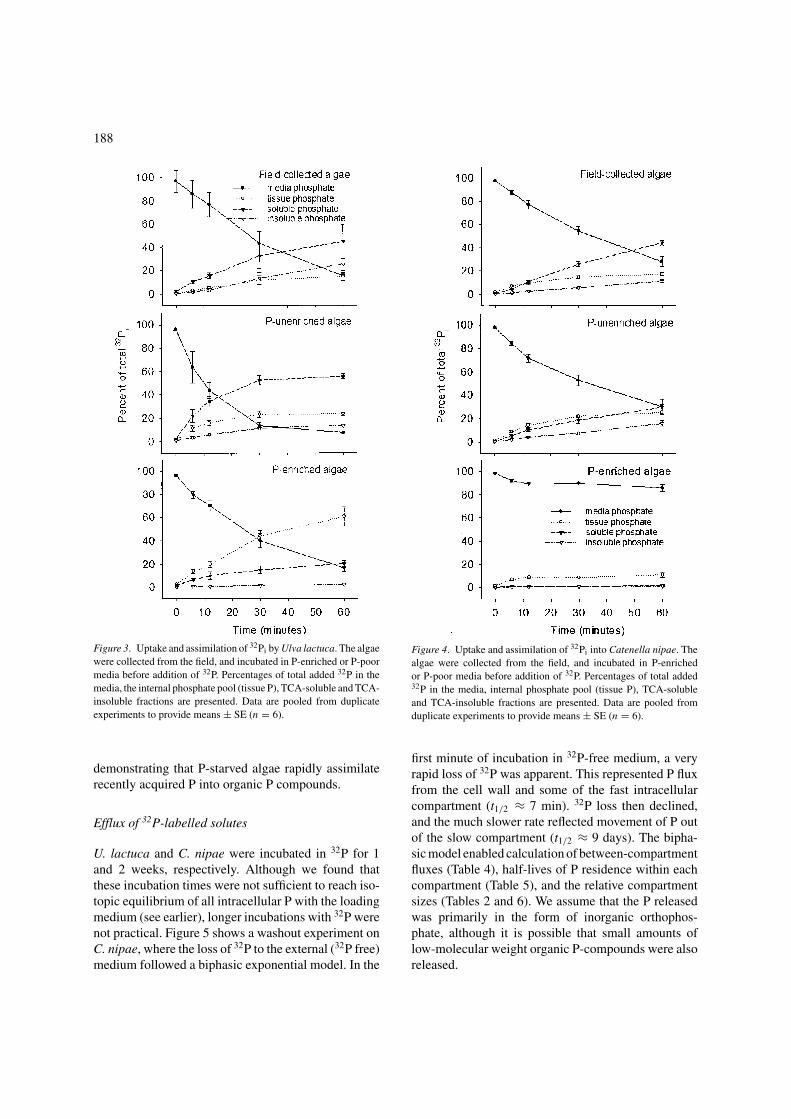
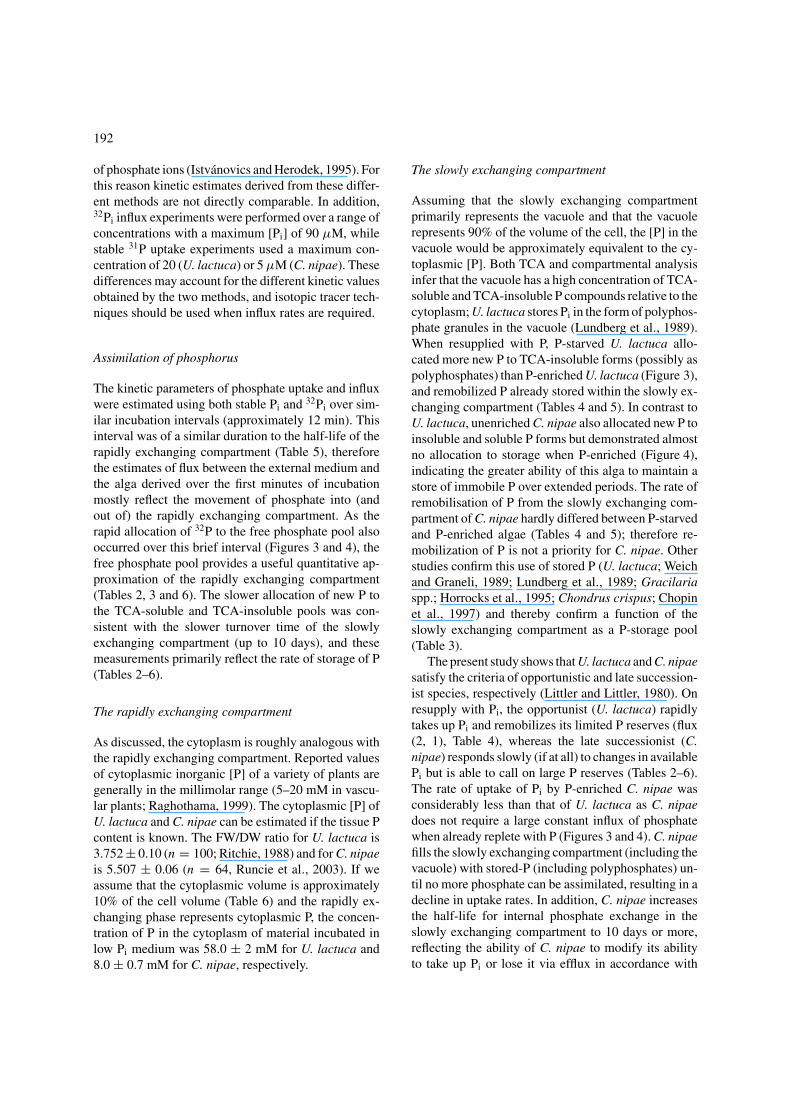
Short-term assimilationAfter a 6-min exposure to P, P-starved U. lactuca andC. nipae synthesised TCA-soluble and TCA-insolublecomponents at much greater rates than did P-enrichedalgae (Figures 3 and 4). When P-starved, U. lactucaincorporated new P more rapidly than C. nipae. How-ever, U. lactuca incorporated less new P into TCA-insoluble P components than C. nipae. This suggeststhat C. nipae has a greater capacity for synthesis ofTCA-insoluble P components even when P-enriched.
In contrast to the 6-min exposures, P-enriched U.lactuca and C. nipae exposed to P for 60 min assimi-lated most new P into the free phosphate pool (Figures 3and 4), allocated less new P to the TCA-solublepool and none to the TCA-insoluble-P pool. Field-collected material incorporated new P into the synthe-sis of TCA-soluble and TCA-insoluble components,
188
Figure 3. Uptake and assimilation of 32Pi by Ulva lactuca. The algaewere collected from the field, and incubated in P-enriched or P-poormedia before addition of 32P. Percentages of total added 32P in themedia, the internal phosphate pool (tissue P), TCA-soluble and TCA-insoluble fractions are presented. Data are pooled from duplicateexperiments to provide means ± SE (n = 6).
demonstrating that P-starved algae rapidly assimilaterecently acquired P into organic P compounds.
Efflux of 32P-labelled solutes
U. lactuca and C. nipae were incubated in 32P for 1and 2 weeks, respectively. Although we found thatthese incubation times were not sufficient to reach iso-topic equilibrium of all intracellular P with the loadingmedium (see earlier), longer incubations with 32P werenot practical. Figure 5 shows a washout experiment onC. nipae, where the loss of 32P to the external (32P free)medium followed a biphasic exponential model. In the
Figure 4. Uptake and assimilation of 32Pi into Catenella nipae. Thealgae were collected from the field, and incubated in P-enrichedor P-poor media before addition of 32P. Percentages of total added32P in the media, internal phosphate pool (tissue P), TCA-solubleand TCA-insoluble fractions are presented. Data are pooled fromduplicate experiments to provide means ± SE (n = 6).
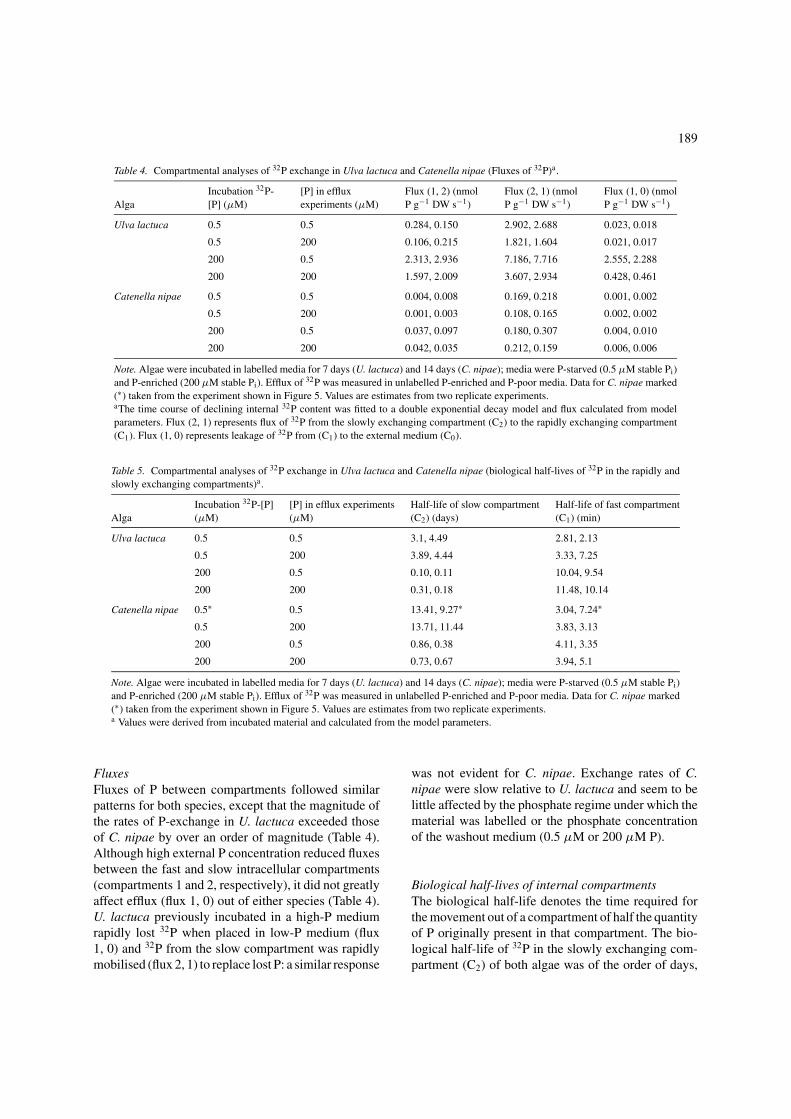
first minute of incubation in 32P-free medium, a veryrapid loss of 32P was apparent. This represented P fluxfrom the cell wall and some of the fast intracellularcompartment (t1/2 ≈ 7 min). 32P loss then declined,and the much slower rate reflected movement of P outof the slow compartment (t1/2 ≈ 9 days). The bipha-sic model enabled calculation of between-compartmentfluxes (Table 4), half-lives of P residence within eachcompartment (Table 5), and the relative compartmentsizes (Tables 2 and 6). We assume that the P releasedwas primarily in the form of inorganic orthophos-phate, although it is possible that small amounts oflow-molecular weight organic P-compounds were alsoreleased.
189
Table 4. Compartmental analyses of 32P exchange in Ulva lactuca and Catenella nipae (Fluxes of 32P)a.
Incubation 32P- [P] in efflux Flux (1, 2) (nmol Flux (2, 1) (nmol Flux (1, 0) (nmolAlga [P] (µM) experiments (µM) P g−1 DW s−1) P g−1 DW s−1) P g−1 DW s−1)
Ulva lactuca 0.5 0.5 0.284, 0.150 2.902, 2.688 0.023, 0.018
0.5 200 0.106, 0.215 1.821, 1.604 0.021, 0.017
200 0.5 2.313, 2.936 7.186, 7.716 2.555, 2.288
200 200 1.597, 2.009 3.607, 2.934 0.428, 0.461
Catenella nipae 0.5 0.5 0.004, 0.008 0.169, 0.218 0.001, 0.002
0.5 200 0.001, 0.003 0.108, 0.165 0.002, 0.002
200 0.5 0.037, 0.097 0.180, 0.307 0.004, 0.010
200 200 0.042, 0.035 0.212, 0.159 0.006, 0.006
Note. Algae were incubated in labelled media for 7 days (U. lactuca) and 14 days (C. nipae); media were P-starved (0.5 µM stable Pi)and P-enriched (200 µM stable Pi). Efflux of 32P was measured in unlabelled P-enriched and P-poor media. Data for C. nipae marked(∗) taken from the experiment shown in Figure 5. Values are estimates from two replicate experiments.aThe time course of declining internal 32P content was fitted to a double exponential decay model and flux calculated from modelparameters. Flux (2, 1) represents flux of 32P from the slowly exchanging compartment (C2) to the rapidly exchanging compartment(C1). Flux (1, 0) represents leakage of 32P from (C1) to the external medium (C0).
Table 5. Compartmental analyses of 32P exchange in Ulva lactuca and Catenella nipae (biological half-lives of 32P in the rapidly andslowly exchanging compartments)a.
Incubation 32P-[P] [P] in efflux experiments Half-life of slow compartment Half-life of fast compartmentAlga (µM) (µM) (C2) (days) (C1) (min)
Ulva lactuca 0.5 0.5 3.1, 4.49 2.81, 2.13
0.5 200 3.89, 4.44 3.33, 7.25
200 0.5 0.10, 0.11 10.04, 9.54
200 200 0.31, 0.18 11.48, 10.14
Catenella nipae 0.5∗ 0.5 13.41, 9.27∗ 3.04, 7.24∗
0.5 200 13.71, 11.44 3.83, 3.13
200 0.5 0.86, 0.38 4.11, 3.35
200 200 0.73, 0.67 3.94, 5.1
Note. Algae were incubated in labelled media for 7 days (U. lactuca) and 14 days (C. nipae); media were P-starved (0.5 µM stable Pi)and P-enriched (200 µM stable Pi). Efflux of 32P was measured in unlabelled P-enriched and P-poor media. Data for C. nipae marked(∗) taken from the experiment shown in Figure 5. Values are estimates from two replicate experiments.a Values were derived from incubated material and calculated from the model parameters.
FluxesFluxes of P between compartments followed similarpatterns for both species, except that the magnitude ofthe rates of P-exchange in U. lactuca exceeded thoseof C. nipae by over an order of magnitude (Table 4).Although high external P concentration reduced fluxesbetween the fast and slow intracellular compartments(compartments 1 and 2, respectively), it did not greatlyaffect efflux (flux 1, 0) out of either species (Table 4).U. lactuca previously incubated in a high-P mediumrapidly lost 32P when placed in low-P medium (flux1, 0) and 32P from the slow compartment was rapidlymobilised (flux 2, 1) to replace lost P: a similar response
was not evident for C. nipae. Exchange rates of C.nipae were slow relative to U. lactuca and seem to belittle affected by the phosphate regime under which thematerial was labelled or the phosphate concentrationof the washout medium (0.5 µM or 200 µM P).
Biological half-lives of internal compartmentsThe biological half-life denotes the time required forthe movement out of a compartment of half the quantityof P originally present in that compartment. The bio-logical half-life of 32P in the slowly exchanging com-partment (C2) of both algae was of the order of days,
190
Table 6. Compartmental analyses of 32P exchange in Ulva lactuca and Catenella nipae (relative sizes of the slowly exchangingP compartment)a
Alga Incubation 32P-[P] (µM) [P] in efflux experiments (µM) Relative size of compartment (2) to total (%)
Ulva lactuca 0.5 0.5 91.09, 94.72
0.5 200 94.5, 88.17
200 0.5 75.65, 72.44
200 200 69.31, 59.35
Catenella nipae 0.5 0.5 97.70, 96.50
0.5 200 98.63, 97.99
200 0.5 83.06, 76.00
200 200 83.38, 82.06
Note. Algae were incubated in labelled media for 7 days (U. lactuca) and 14 days (C. nipae); media were P-starved (0.5 µMstable Pi) and P-enriched (200 µM stable Pi). Efflux of 32P was measured in unlabelled P-enriched and P-poor media. Data forC. nipae marked (∗) taken from the experiment shown in Figure 5. Values are estimates from two replicate experiments.aData are derived from model parameters and presented as mean percentages of the sum of both compartments.
Figure 5. Efflux of 32Pi from Catenella nipae. This washout exper-iment shows the decline in internal [32P] of Catenella nipae as 32Pexchanged for 31P in the external media (0.5 µM phosphate in ASW)over time. The alga had been loaded in seawater labelled with 32Pfor 14 days (0.5 µM phosphate in ASW). Data were described by a(weighted) double exponential decay model. The initial rapid declinerepresents leakage from the rapidly exchanging compartment. Thisphase has a t0.5 of about 5–10 min and is small in size. The slowlyexchanging compartment has a very long t0.5 of about 10 days andincludes the bulk (>90%) of the total tissue P-label.
and the rapidly exchanging compartment (C1) had ahalf-life of minutes (Figure 5, Table 5). U. lactuca re-tained 32P in the slow compartment for shorter intervalsthan C. nipae, with P-starved and P-enriched materialhaving respective half-lives of about 4 days or 2–6 h(Table 5). U. lactuca retained P within the fast com-partment for a slightly longer interval when P-enriched(half-life of ∼10 min) than when P-starved (2–7 min).In contrast, the slowly exchanging compartment of P-starved C. nipae had a very slow turnover with a half-life of about 2 weeks (C2) while P-enriched C. nipae
had a half-life of less than 1 day; both were unaffectedby short-term exposure to high P in the washout phaseof the experiment (Table 5). The half-life of the rapidlyexchanging compartment was 3–4 min regardless ofpre-treatment.
Estimation of compartment sizesMost of the intracellular P of both U. lactuca and C.nipae (between 64 and 98% of total 32P, Table 6) wasfound to reside in the slowly exchanging compart-ment. P-starved material maintained more 32P withinthis compartment than P-enriched material, indicatinga greater tendency of unenriched algae to store P (Ta-ble 6). In P-enriched U. lactuca, the slow compart-ment was relatively small and presumably reflected thehigher quantities of soluble forms of 32P in the fastcompartment. In contrast, C. nipae tended to allocatemore P to the slow compartment when uptake occurred,possibly reflecting greater active storage of P when Pi
was abundant.
Accumulation of P within the cell wallQuantitative estimates of P in the cell wall were three tofour orders of magnitude less than estimates of P withinthe smaller (fast) compartment of live algal material(data not shown). Therefore, in the efflux experimentsany contribution to the movement of P that could beattributed to the adsorption of P to the cell wall wasnegligible, and the “rapid” efflux phase observed in U.lactuca and C. nipae with a half-life of the order ofminutes essentially reflected movement of P from thecytoplasm.
191
Discussion
The experiments describe the kinetics of P flux (influx,efflux and internal fluxes) and characteristics of the as-similation and storage of P by U. lactuca and C. nipae.The clear temporal difference in response to inorganicnutrient supply of these two species agrees with ourprevious findings on the responses of U. lactuca and C.nipae to Ni availability in marine and estuarine waters(Runcie et al., 2003). By first defining the nutritionalphysiology of algae that have been incubated in definedmedia (P-enriched or P-poor) we were then able to in-terpret whether field-collected algal material had beenexposed to high or low levels of P, and whether ex-posure occurred recently or within the last few weeks.After presenting the relevant physiological aspects ofkinetics and assimilation in this discussion, we suggesthow field-collected C. nipae material could be used toreflect ambient P concentrations.
Influx of P
Uptake of unlabelled inorganic phosphate by both U.lactuca and C. nipae demonstrated simple saturationkinetics with a Km of ∼3.7 µM in both species in-dicating active uptake. These Km values are similarto those of comparable monostromatic and coarselybranched macroalgae (Wallentinus, 1984; Hurd andDring, 1990) and specifically to U. lactuca (Lundberget al., 1989). Passive uptake of phosphate by macroal-gae is unlikely, as this would proceed against the neg-ative electrical potential across the plasmalemma, andexternal phosphate levels (micromolar concentrations)are generally far below internal concentrations (mil-limolar concentrations). The ability of an alga to takeup P compounds is partly dependent on the activityof extracellular phosphatases (Lee, 2000; Hernandezet al., 2002), while the actual process of phosphate up-take in algae is driven by one or more active phosphatetransport systems (Raghothama, 1999). Recent studieshave identified H+/Pi and Na+/Pi co-transport systemsin plants and some algae (Rausch and Bucher, 2002);one such high-affinity Pi transporter PHT1 identifiedin Arabidopsis was reported to have a Km of 3.1 µM(Rausch and Bucher, 2002). Although not yet identifiedat the molecular level, the phosphate uptake mechanismapparent in U. lactuca and C. nipae similarly achievesphosphate uptake rates at concentrations only slightlygreater than phosphate concentrations in marine wa-ters (Km ∼ 3.7 µM; Table 1; Parsons et al., 1984).These algae are also well adapted to low ambient phos-
phate concentrations, as the calculated thermodynamicstalling concentration for phosphate uptake of both U.lactuca and C. nipae defines both species as capable ofactively taking up phosphate from external concentra-tions as low as 1 nM (Nicholls, 1982).
Influence of P status on influx
P-starved photosynthetic organisms are generallyprimed for rapid uptake and commonly demonstrateelevated rates of phosphate uptake on resupply of Pi
(Cembella et al., 1984; Raghothama, 1999; Wagnerand Faulkner, 2001). Therefore, we might expect P-starved U. lactuca to have greater values of Vmax thanP-enriched U. lactuca. However, this was not the caseand field-collected U. lactuca had the lowest rates ofuptake and influx (Table 1). As U. lactuca requires a rel-atively high and constant supply of nutrients to supportits rapid growth rate (Lundberg et al., 1989; Pedersenand Borum, 1997), it seems reasonable that nutrient-starved U. lactuca would be less able to take up Pi.Therefore, phosphate uptake by field-collected U. lac-tuca in particular was likely to be limited by inadequateN and/or trace elements (Hernandez et al., 1997) thatwere otherwise supplied in the f/2 medium. In contrast,P-starved U. lactuca (also incubated in f/2) was onlylimited by P. We suggest that the addition of N and traceelements from the f/2 medium is likely to have enabledan increase in the induction of phosphatase (Lee, 2000)and phosphate transporters (Rausch and Bucher, 2002)that drive P uptake.
In contrast to U. lactuca, P-enriched C. nipae tookup phosphate at lower rates than P-starved and field-collected material (Figure 2), and field-collected mate-rial had intermediate values of Vmax. In contrast to U.lactuca, this suggests that field-collected C. nipae hadbeen exposed to (a) more P than the P-starved mate-rial, and (b) sufficient N, P, trace elements and vitaminsin its natural environment such that its capacity for Pi
uptake was not severely impaired. C. nipae is a late suc-cessional alga as defined by Littler and Littler (1980),and has a lower demand for nutrients than U. lactuca,therefore its ability to take up Pi from the environ-ment is likely to be less dependent on a constant highN/trace element supply. Thus the capacity of C. nipaefor P uptake is more tolerant to generally oligotrophicconditions.
Uptake of 32Pi provides an estimate of unidirectionalflux of phosphate into the cells (i.e. influx), whereasuptake of stable P provides an estimate of net phos-phate uptake, which is the balance of influx and efflux
192
of phosphate ions (Istvanovics and Herodek, 1995). Forthis reason kinetic estimates derived from these differ-ent methods are not directly comparable. In addition,32Pi influx experiments were performed over a range ofconcentrations with a maximum [Pi] of 90 µM, whilestable 31P uptake experiments used a maximum con-centration of 20 (U. lactuca) or 5 µM (C. nipae). Thesedifferences may account for the different kinetic valuesobtained by the two methods, and isotopic tracer tech-niques should be used when influx rates are required.
Assimilation of phosphorus
The kinetic parameters of phosphate uptake and influxwere estimated using both stable Pi and 32Pi over sim-ilar incubation intervals (approximately 12 min). Thisinterval was of a similar duration to the half-life of therapidly exchanging compartment (Table 5), thereforethe estimates of flux between the external medium andthe alga derived over the first minutes of incubationmostly reflect the movement of phosphate into (andout of) the rapidly exchanging compartment. As therapid allocation of 32P to the free phosphate pool alsooccurred over this brief interval (Figures 3 and 4), thefree phosphate pool provides a useful quantitative ap-proximation of the rapidly exchanging compartment(Tables 2, 3 and 6). The slower allocation of new P tothe TCA-soluble and TCA-insoluble pools was con-sistent with the slower turnover time of the slowlyexchanging compartment (up to 10 days), and thesemeasurements primarily reflect the rate of storage of P(Tables 2–6).
The rapidly exchanging compartment
As discussed, the cytoplasm is roughly analogous withthe rapidly exchanging compartment. Reported valuesof cytoplasmic inorganic [P] of a variety of plants aregenerally in the millimolar range (5–20 mM in vascu-lar plants; Raghothama, 1999). The cytoplasmic [P] ofU. lactuca and C. nipae can be estimated if the tissue Pcontent is known. The FW/DW ratio for U. lactuca is3.752 ± 0.10 (n = 100; Ritchie, 1988) and for C. nipaeis 5.507 ± 0.06 (n = 64, Runcie et al., 2003). If weassume that the cytoplasmic volume is approximately10% of the cell volume (Table 6) and the rapidly ex-changing phase represents cytoplasmic P, the concen-tration of P in the cytoplasm of material incubated inlow Pi medium was 58.0 ± 2 mM for U. lactuca and8.0 ± 0.7 mM for C. nipae, respectively.
The slowly exchanging compartment
Assuming that the slowly exchanging compartmentprimarily represents the vacuole and that the vacuolerepresents 90% of the volume of the cell, the [P] in thevacuole would be approximately equivalent to the cy-toplasmic [P]. Both TCA and compartmental analysisinfer that the vacuole has a high concentration of TCA-soluble and TCA-insoluble P compounds relative to thecytoplasm; U. lactuca stores Pi in the form of polyphos-phate granules in the vacuole (Lundberg et al., 1989).When resupplied with P, P-starved U. lactuca allo-cated more new P to TCA-insoluble forms (possibly aspolyphosphates) than P-enriched U. lactuca (Figure 3),and remobilized P already stored within the slowly ex-changing compartment (Tables 4 and 5). In contrast toU. lactuca, unenriched C. nipae also allocated new P toinsoluble and soluble P forms but demonstrated almostno allocation to storage when P-enriched (Figure 4),indicating the greater ability of this alga to maintain astore of immobile P over extended periods. The rate ofremobilisation of P from the slowly exchanging com-partment of C. nipae hardly differed between P-starvedand P-enriched algae (Tables 4 and 5); therefore re-mobilization of P is not a priority for C. nipae. Otherstudies confirm this use of stored P (U. lactuca; Weichand Graneli, 1989; Lundberg et al., 1989; Gracilariaspp.; Horrocks et al., 1995; Chondrus crispus; Chopinet al., 1997) and thereby confirm a function of theslowly exchanging compartment as a P-storage pool(Table 3).
The present study shows that U. lactuca and C. nipaesatisfy the criteria of opportunistic and late succession-ist species, respectively (Littler and Littler, 1980). Onresupply with Pi, the opportunist (U. lactuca) rapidlytakes up Pi and remobilizes its limited P reserves (flux(2, 1), Table 4), whereas the late successionist (C.nipae) responds slowly (if at all) to changes in availablePi but is able to call on large P reserves (Tables 2–6).The rate of uptake of Pi by P-enriched C. nipae wasconsiderably less than that of U. lactuca as C. nipaedoes not require a large constant influx of phosphatewhen already replete with P (Figures 3 and 4). C. nipaefills the slowly exchanging compartment (including thevacuole) with stored-P (including polyphosphates) un-til no more phosphate can be assimilated, resulting in adecline in uptake rates. In addition, C. nipae increasesthe half-life for internal phosphate exchange in theslowly exchanging compartment to 10 days or more,reflecting the ability of C. nipae to modify its abilityto take up Pi or lose it via efflux in accordance with
193
ambient Pi concentrations and the status of internal Ppools. In contrast, the slowly exchanging compartmentof P-starved U. lactuca has a maximum half-life ofonly 4 days. Hence the size of the internal P pools ofC. nipae can be used to indicate the P content of ambi-ent waters over the last 10 days, compared with 4 daysfor U. lactuca. The examination of internal pools andtheir residence times provides an indication of P avail-ability over much longer periods than that provided byphosphatase activity, and is therefore better suited tolonger term monitoring.
Use of C. nipae and U. lactuca as indicator species
While U. lactuca may be suitable for short-term stud-ies of the order of a few days or less, C. nipae isbetter suited to reflecting ambient P over longer in-tervals of up to 2 weeks. By examining the slowlyexchanging compartment and/or the TCA-insolublepool of field-collected C. nipae the investigator canquickly estimate whether Pi was abundant or not atthe site of collection over the past week. Such an ap-plication would be useful in a routine eutrophicationmonitoring program where material collected in situor deployed in the field can be collected and later ex-amined (Horrocks et al., 1995; Dennison and Abal,1999). An advantage of using the TCA fractionationmethod (in order to examine non-labelled P) is thatsamples simply require fixing and preservation (freez-ing) soon after collection. An additional advantageis that while the TCA-insoluble fraction is directlyrelated to long-term storage of P, it is relatively in-sensitive to recent flushes of P that would increasethe P content of the rapidly exchanging compartment.Examination of both refractory and mobile P poolswithin C. nipae would provide information indicatingambient concentrations of Pi both in the recent (a fewdays) and more distant (weeks) past.
Acknowledgements
This research represents part of a doctoral disserta-tion by JWR; financial support was provided by theAustralian Research Council and the NSW Environ-ment Protection Authority.
References
Allen SE (1974) Chemical Analyses of Ecological Materials.Blackwell Scientific, Oxford, UK.
American Public Health Association (APHA) 1998. Standard Meth-ods for the Examination of Water and Wastewater. AmericanPublic Health Association, Washington, DC, USA.
Anderson DH (1983) Compartmental Modelling and Tracer Kinetics.Springer-Verlag, Berlin.
Atkins GL (1969) Multicompartment Models for Biological Sys-tems. Methuen, London.
Berges JA, Montagnes DJS, Hurd CL, Harrison PJ (1994) Fittingecological and physiological data to rectangular hyperbolae—a comparison of methods using Monte Carlo simulations. Mar.Ecol. Progr. Ser. 114: 175–183.
Cembella AD, Antia ND, Harrison PJ (1984) The utilisation of inor-ganic and organic phosphorus compounds as nutrients by eukary-otic microalgae: A multidisciplinary perspective, Part 2. CRCCrit. Rev. Microbiol. 11: 13–81.
Chopin T, Lehmal H, Halcrow K (1997) Polyphosphates in the redmacroalga Chondrus crispus (Rhodophyceae). New Phytol. 135:587–594.
Dennison WC, Abal EG (1999) Moreton Bay Study, a Scientific Basisfor the Healthy Waterways Campaign. The South East Queens-land Regional Water Quality Management Strategy Team, Bris-bane, 243 pp.
Fong P, Boyer KE, Zedler JB (1998) Developing an indicator of nu-trient enrichment in coastal estuaries and lagoons using tissuenitrogen content of the opportunistic alga, Enteromorpha intesti-nalis (L.) Link. J. Exp. Mar. Biol. Ecol. 231: 63–79.
Harrison PJ, Parslow JS, Conway HL (1989) Determination of nu-trient uptake kinetic parameters: A comparison of methods. Mar.Ecol. Progr. Ser. 52: 301–312.
Hernandez I, Christmas M, Yelloly JM, Whitton BA (1997) Fac-tors affecting surface alkaline phosphatase activity in the brownalga Fucus spiralis at a North Sea intertidal site (Tyne Sands,Scotland). J. Phycol. 33: 569–575.
Hernandez I, Niell FX, Whitton BA (2002) Phosphatase activity ofbenthic marine algae. An overview. J. Appl. Phycol. 14: 475–487.
Horrocks JL, Stewart GR, Dennison WC (1995) Tissue nutrient con-tent of Gracilaria spp. (Rhodophyta) and water quality along anestuarine gradient. Mar. Freshwater Res. 46: 975–983.
Hurd CL, Dring MJ (1990) Phosphate uptake by intertidal algae inrelation to zonation and season. Mar. Biol. 107: 281–290.
Istvanovics V, Herodek S (1995) Estimation of net uptake and leak-age rates of orthophosphate from 32P-uptake kinetics by a linearforce-flow model. Limnol. Oceanogr. 40: 17–32.
Karsten U, Barrow KD, Mostaert AS, King RJ (1995) The os-motic significance of the heteroside floridoside in the man-grove alga Catenella nipae (Rhodophyta: Gigartinales) in EasternAustralia. Estuarine. Coastal Shelf Sci. 40: 239–247.
Kulaev IS (1979) The Biochemistry of Inorganic Polyphosphates.John Wiley, New York.
Lean DRS, White E (1983) Chemical and radiotracer measurementsof phosphorus uptake by lake plankton. Can. J. Fish. Aquat. Sci.40: 147–155.
Lee T-M (2000) Phosphate starvation induction of acid phosphatasein Ulva lactuca L. (Ulvales, Chlorophyta). Bot. Bull. Acad. Sinica41: 19–23.
Littler MM, Littler DS (1980) The evolution of thallus form andsurvival strategies in benthic marine macroalgae: field and labo-ratory tests of a functional form model. Am. Nat. 116: 25–44.
Lundberg P, Weich ERG, Jensen P, Vogel HJ (1989) Phosphorus-31 and nitrogen-15 NMR studies of the uptake of phosphorus
194
and nitrogen compounds in the marine macroalgae Ulva lactuca.Plant Physiol. 89: 1380–1387.
Lyngby JE, Mortensen S, Ahrensberg N (1999) Bioassessment tech-niques for monitoring of eutrophication and nutrient limitationin coastal ecosystems. Marine Pollut. Bull. 39: 212–223.
Miyata K, Hattori A (1986) A. simple fractionation method for de-termination of phosphorus compounds in phytoplankton: Ap-plication to natural populations of phytoplankton in summersurface waters of Tokyo Bay. J. Oceanogr. Soc. Jpn. 42:255–265.
Nicholls DG (1982) Bioenergetics. Academic Press, London.Parsons TR, Maita Y, Lalli CM (1984) A Manual of Chemical
and Biological Methods for Seawater Analysis. Pergamon Press,Oxford.
Pedersen MF, Borum J (1997) Nutrient control of estuarinemacroalgae—growth strategy and the balance between nitrogenrequirements and uptake. Mar. Ecol. Progr. Ser. 161: 155–163.
Raghothama KG (1999) Phosphate acquisition. Ann. Rev. PlantPhysiol. Plant Mol. Biol. 50: 665–693.
Rausch C, Bucher M (2002) Molecular mechanisms of phosphatetransport in plants. Planta. 216: 23–37.
Ritchie RJ (1988) The ionic relations of Ulva lactuca. J. PlantPhysiol. 133: 183–192.
Ritchie RJ, Larkum AWD (1982) Cation exchange properties of thecell walls of Enteromorpha intestinalis (Ulvales, Chlorophyta).J. Exp. Bot. 33: 125–139.
Ritchie RJ, Prvan T (1996) A simulation study on designing experi-ments to measure the Km of Michaelis–Menten kinetics curves.J. Theor. Biol. 178: 239–254.
Runcie JW, Larkum AWD (2001) Estimating internal phos-phorus pools in macroalgae using radioactive phosphorusand trichloroacetic acid extracts. Anal. Biochem. 297: 191–192.
Runcie JW, Ritchie RJ, Larkum AWD (2003) Uptake kinetics andassimilation of inorganic nitrogen by Catenella nipae and Ulvalactuca. Aquat. Bot. 76: 155–174.
Snedecor GW, Cochran WG (1980) Statistical Methods, 7th ed. IowaState University Press, Iowa.
Stein JR (1973) Handbook of Phycological Methods. CambridgeUniversity Press, Cambridge.
Wagner F, Falkner G (2001) Phosphate limitation. In Rai LC, GaurJP (eds), Algal Adaptation to Environmental Stresses. Springer,Heidelberg, New York, pp. 65–110.
Wallentinus I (1984) Comparisons of nutrient uptake rates for Balticmacroalgae with different thallus morphologies. Mar. Biol. 80:215–225.
Weich RG, Graneli E (1989) Extracellular alkaline phosphataseactivity in Ulva lactuca. J. Exp. Mar. Biol. Ecol. 129: 33–44.
Wen YH, Alain V, Henry PR (1997) Allometric scaling of com-partmental fluxes of phosphorus in freshwater algae. Limnol.Oceanogr. 42: 45–56.
Related Documents


