JUNE 1997 1083 M C ANELLY ET AL. q 1997 American Meteorological Society Upscale Evolution of MCSs: Doppler Radar Analysis and Analytical Investigation RAY L. MCANELLY,JASON E. NACHAMKIN,WILLIAM R. COTTON, AND MELVILLE E. NICHOLLS Department of Atmospheric Science, Colorado State University, Fort Collins, Colorado (Manuscript received 5 March 1996, in final form 24 September 1996) ABSTRACT The development of two small mesoscale convective systems (MCSs) in northeastern Colorado is investigated via dual-Doppler radar analysis. The first system developed from several initially isolated cumulonimbi, which gradually coalesced into a minimal MCS with relatively little stratiform precipitation. The second system de- veloped more rapidly along an axis of convection and generated a more extensive and persistent stratiform echo and MCS cloud shield. In both systems, the volumetric precipitation rate exhibited an early meso-b-scale convective cycle (a maximum and subsequent minimum), followed by reintensification into a modest mature stage. This sequence is similar to that noted previously in the developing stage of larger MCSs by McAnelly and Cotton. They speculated that the early meso-b convective cycle is a characteristic feature of development in many MCSs that is dynamically linked to a rather abrupt transition toward mature stage structure. This study presents kinematic evidence in support of this hypothesis for these cases, as derived from dual-Doppler radar analyses over several-hour periods. Mature stage MCS characteristics such as deepened low- to midlevel convergence and mesoscale descent developed fairly rapidly, about 1 h after the early meso-b convective maximum. The dynamic linkage between the meso-b convective cycle and evolution toward mature structure is examined with a simple analytical model of the linearized atmospheric response to prescribed heating. Heating functions that approximate the temporal and spatial characteristics of the meso-b convective cycle are prescribed. The solutions show that the cycle forces a response within and near the thermally forced region that is consistent with the observed kinematic evolution in the MCSs. The initial response to an intensifying convective ensemble is a self-suppressing mechanism that partially explains the weakening after a meso-b convective maximum. A lagged response then favors reintensification and areal growth of the weakened ensemble. A conceptual model of MCS development is proposed whereby the early meso-b convective cycle and the response to it are hy- pothesized to act as a generalized forcing–feedback mechanism that helps explain the upscale growth of a convective ensemble into an organized MCS. 1. Introduction In a study of the radar-inferred precipitation evolution of mesoscale convective complexes (MCCs; Maddox 1980), McAnelly and Cotton (1992; hereafter MC92) identified a characteristic meso-b-scale burst or cycle of convective precipitation that is superimposed early on the meso-a-scale growth–decay life cycle in many systems (Fig. 1). They hypothesized that the cycle could be dynamically linked to a relatively rapid upscale evo- lution of many MCCs and mesoscale convective systems (MCSs) in general. Prior to this evolution, the early system is characterized by an ensemble of multiple con- vective cells and/or multicell clusters, each dominated by relatively independent, convective-scale circulations. The term ‘‘upscale evolution’’ is defined here as the development of organized mesoscale circulations and a Corresponding author address: Ray L. McAnelly, Dept. of At- mospheric Science, Colorado State University, Fort Collins, CO 80523-1371. E-mail: [email protected] unifying stratiform echo on scales comparable to the entire convective ensemble and its common cirrus can- opy. MC92 based their hypothesis on the fairly abrupt development of mature stage features following such a meso-b convective cycle, as reported in observed cases and evident in simulated cases of MCSs that they cited in the literature. Mature stage features indicating an MCS having evolved upscale include deepened low- level convergence into midlevels, organized mesoscale outflow aloft, descending rear inflow, and a surface me- sohigh and wake low. MC92 suggested that gravity wave dynamics played a prominant role in this evolu- tion. The idea that MCSs develop as a self-organizing sys- tem through forced gravity wave mechanisms has been explored in detail by Raymond (1983, 1984, 1986, 1987). His linearized models with parameterized con- vective effects have had some success in simulating propagation speeds and other observed aspects of MCSs. Some of his solutions indicate a sequence of convective development that evinces the b-scale con- vective cycle: growth of an initial advective instability mode, its weakening, and subsequent growth of a prop-

Welcome message from author
This document is posted to help you gain knowledge. Please leave a comment to let me know what you think about it! Share it to your friends and learn new things together.
Transcript
JUNE 1997 1083M C A N E L L Y E T A L .
q 1997 American Meteorological Society
Upscale Evolution of MCSs: Doppler Radar Analysis and Analytical Investigation
RAY L. MCANELLY, JASON E. NACHAMKIN, WILLIAM R. COTTON, AND MELVILLE E. NICHOLLS
Department of Atmospheric Science, Colorado State University, Fort Collins, Colorado
(Manuscript received 5 March 1996, in final form 24 September 1996)
ABSTRACT
The development of two small mesoscale convective systems (MCSs) in northeastern Colorado is investigatedvia dual-Doppler radar analysis. The first system developed from several initially isolated cumulonimbi, whichgradually coalesced into a minimal MCS with relatively little stratiform precipitation. The second system de-veloped more rapidly along an axis of convection and generated a more extensive and persistent stratiform echoand MCS cloud shield. In both systems, the volumetric precipitation rate exhibited an early meso-b-scaleconvective cycle (a maximum and subsequent minimum), followed by reintensification into a modest maturestage. This sequence is similar to that noted previously in the developing stage of larger MCSs by McAnellyand Cotton. They speculated that the early meso-b convective cycle is a characteristic feature of developmentin many MCSs that is dynamically linked to a rather abrupt transition toward mature stage structure. This studypresents kinematic evidence in support of this hypothesis for these cases, as derived from dual-Doppler radaranalyses over several-hour periods. Mature stage MCS characteristics such as deepened low- to midlevelconvergence and mesoscale descent developed fairly rapidly, about 1 h after the early meso-b convectivemaximum.
The dynamic linkage between the meso-b convective cycle and evolution toward mature structure is examinedwith a simple analytical model of the linearized atmospheric response to prescribed heating. Heating functionsthat approximate the temporal and spatial characteristics of the meso-b convective cycle are prescribed. Thesolutions show that the cycle forces a response within and near the thermally forced region that is consistentwith the observed kinematic evolution in the MCSs. The initial response to an intensifying convective ensembleis a self-suppressing mechanism that partially explains the weakening after a meso-b convective maximum. Alagged response then favors reintensification and areal growth of the weakened ensemble. A conceptual modelof MCS development is proposed whereby the early meso-b convective cycle and the response to it are hy-pothesized to act as a generalized forcing–feedback mechanism that helps explain the upscale growth of aconvective ensemble into an organized MCS.
1. Introduction
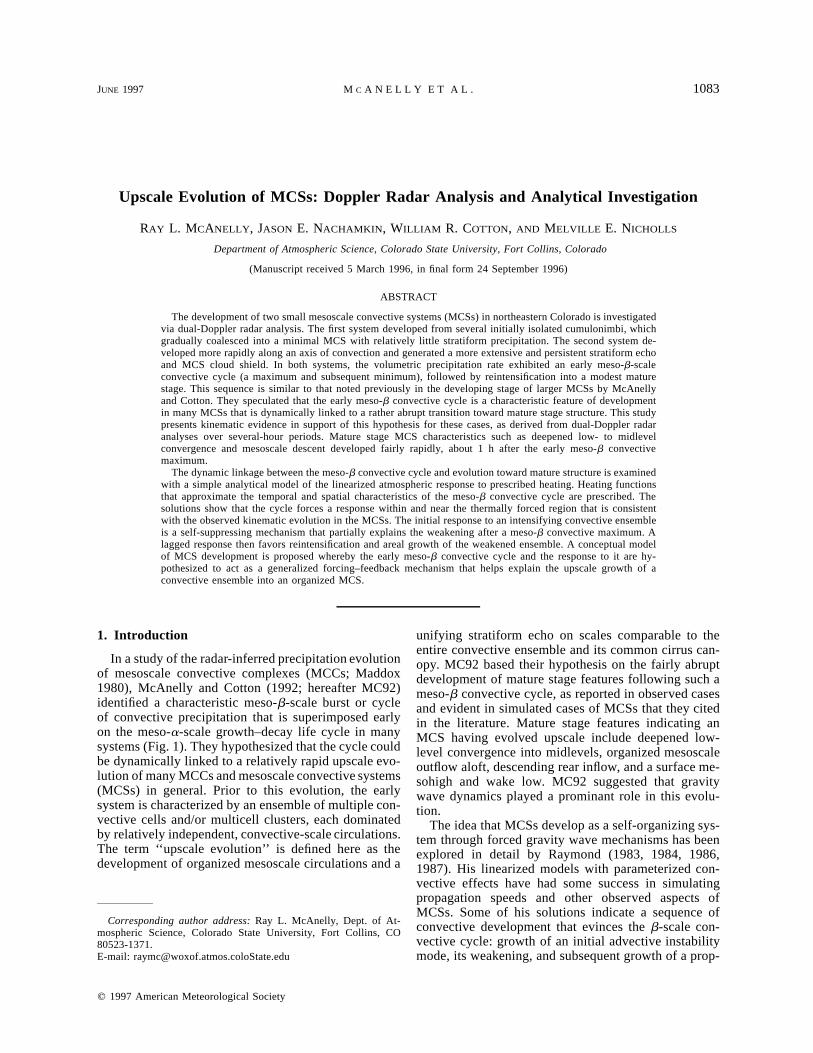
In a study of the radar-inferred precipitation evolutionof mesoscale convective complexes (MCCs; Maddox1980), McAnelly and Cotton (1992; hereafter MC92)identified a characteristic meso-b-scale burst or cycleof convective precipitation that is superimposed earlyon the meso-a-scale growth–decay life cycle in manysystems (Fig. 1). They hypothesized that the cycle couldbe dynamically linked to a relatively rapid upscale evo-lution of many MCCs and mesoscale convective systems(MCSs) in general. Prior to this evolution, the earlysystem is characterized by an ensemble of multiple con-vective cells and/or multicell clusters, each dominatedby relatively independent, convective-scale circulations.The term ‘‘upscale evolution’’ is defined here as thedevelopment of organized mesoscale circulations and a
Corresponding author address: Ray L. McAnelly, Dept. of At-mospheric Science, Colorado State University, Fort Collins, CO80523-1371.E-mail: [email protected]
unifying stratiform echo on scales comparable to theentire convective ensemble and its common cirrus can-opy. MC92 based their hypothesis on the fairly abruptdevelopment of mature stage features following such ameso-b convective cycle, as reported in observed casesand evident in simulated cases of MCSs that they citedin the literature. Mature stage features indicating anMCS having evolved upscale include deepened low-level convergence into midlevels, organized mesoscaleoutflow aloft, descending rear inflow, and a surface me-sohigh and wake low. MC92 suggested that gravitywave dynamics played a prominant role in this evolu-tion.
The idea that MCSs develop as a self-organizing sys-tem through forced gravity wave mechanisms has beenexplored in detail by Raymond (1983, 1984, 1986,1987). His linearized models with parameterized con-vective effects have had some success in simulatingpropagation speeds and other observed aspects ofMCSs. Some of his solutions indicate a sequence ofconvective development that evinces the b-scale con-vective cycle: growth of an initial advective instabilitymode, its weakening, and subsequent growth of a prop-
1084 VOLUME 125M O N T H L Y W E A T H E R R E V I E W
FIG. 1. Generalized MCC precipitation lifecycle, in terms of vol-umetric rain rate due to convective, stratiform, and total echo (VC,VS, and VT, respectively). An early meso-b-scale convective cycle(labeled bMX and bMN) is superimposed on the growth stage of themeso-a-scale lifecycle. Lifecycle benchmarks based on infrared sat-ellite imagery are also indicated. From McAnelly and Cotton (1992).
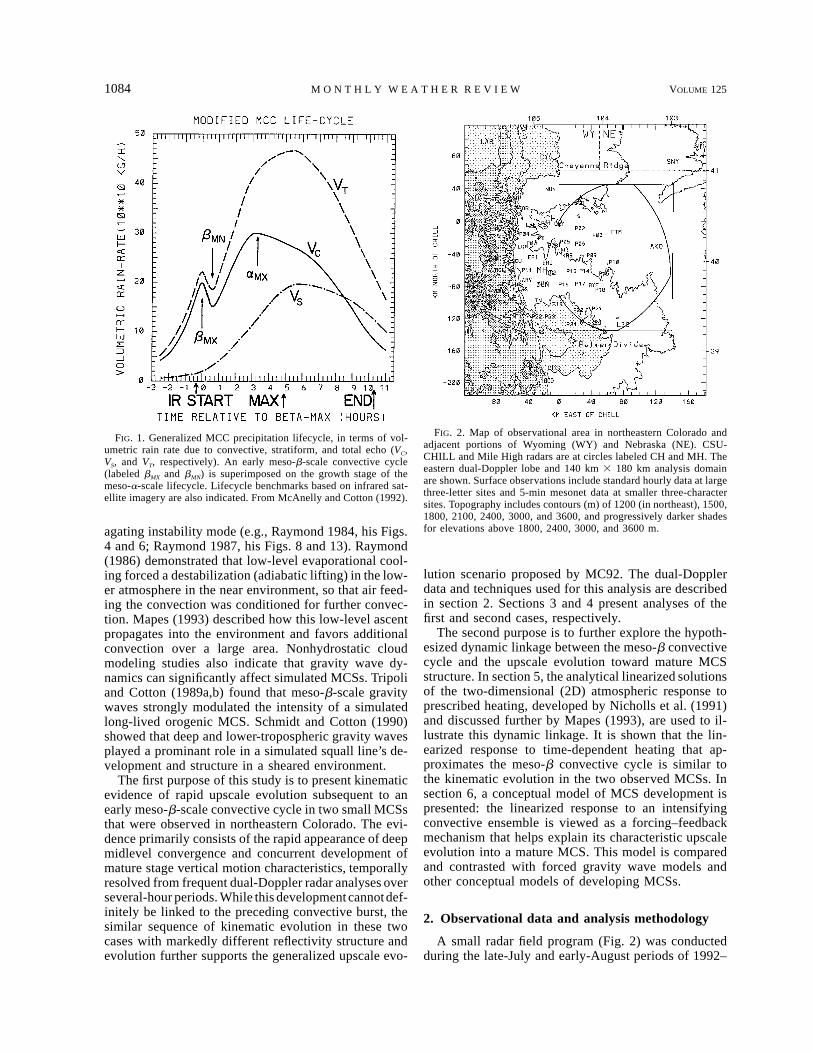
FIG. 2. Map of observational area in northeastern Colorado andadjacent portions of Wyoming (WY) and Nebraska (NE). CSU-CHILL and Mile High radars are at circles labeled CH and MH. Theeastern dual-Doppler lobe and 140 km 3 180 km analysis domainare shown. Surface observations include standard hourly data at largethree-letter sites and 5-min mesonet data at smaller three-charactersites. Topography includes contours (m) of 1200 (in northeast), 1500,1800, 2100, 2400, 3000, and 3600, and progressively darker shadesfor elevations above 1800, 2400, 3000, and 3600 m.agating instability mode (e.g., Raymond 1984, his Figs.
4 and 6; Raymond 1987, his Figs. 8 and 13). Raymond(1986) demonstrated that low-level evaporational cool-ing forced a destabilization (adiabatic lifting) in the low-er atmosphere in the near environment, so that air feed-ing the convection was conditioned for further convec-tion. Mapes (1993) described how this low-level ascentpropagates into the environment and favors additionalconvection over a large area. Nonhydrostatic cloudmodeling studies also indicate that gravity wave dy-namics can significantly affect simulated MCSs. Tripoliand Cotton (1989a,b) found that meso-b-scale gravitywaves strongly modulated the intensity of a simulatedlong-lived orogenic MCS. Schmidt and Cotton (1990)showed that deep and lower-tropospheric gravity wavesplayed a prominant role in a simulated squall line’s de-velopment and structure in a sheared environment.
The first purpose of this study is to present kinematicevidence of rapid upscale evolution subsequent to anearly meso-b-scale convective cycle in two small MCSsthat were observed in northeastern Colorado. The evi-dence primarily consists of the rapid appearance of deepmidlevel convergence and concurrent development ofmature stage vertical motion characteristics, temporallyresolved from frequent dual-Doppler radar analyses overseveral-hour periods. While this development cannotdef-initely be linked to the preceding convective burst, thesimilar sequence of kinematic evolution in these twocases with markedly different reflectivity structure andevolution further supports the generalized upscale evo-
lution scenario proposed by MC92. The dual-Dopplerdata and techniques used for this analysis are describedin section 2. Sections 3 and 4 present analyses of thefirst and second cases, respectively.
The second purpose is to further explore the hypoth-esized dynamic linkage between the meso-b convectivecycle and the upscale evolution toward mature MCSstructure. In section 5, the analytical linearized solutionsof the two-dimensional (2D) atmospheric response toprescribed heating, developed by Nicholls et al. (1991)and discussed further by Mapes (1993), are used to il-lustrate this dynamic linkage. It is shown that the lin-earized response to time-dependent heating that ap-proximates the meso-b convective cycle is similar tothe kinematic evolution in the two observed MCSs. Insection 6, a conceptual model of MCS development ispresented: the linearized response to an intensifyingconvective ensemble is viewed as a forcing–feedbackmechanism that helps explain its characteristic upscaleevolution into a mature MCS. This model is comparedand contrasted with forced gravity wave models andother conceptual models of developing MCSs.
2. Observational data and analysis methodology
A small radar field program (Fig. 2) was conductedduring the late-July and early-August periods of 1992–
JUNE 1997 1085M C A N E L L Y E T A L .
94, supported by the CSU-CHILL radar facility (Rut-ledge et al. 1993) near Greeley, Colorado. The objectivewas to collect dual-Doppler radar data on the growthstages of MCSs. Presented here are analyses for a casefrom 1992 and another from 1993. The other radar forthe 1992–93 seasons was Mile High Radar (MHR; Pratteet al. 1991), a semi-operational NEXRAD prototypenear Denver, operated by the National Center for At-mospheric Research (NCAR). During operational pe-riods, CSU-CHILL collected full 3608 volume scansevery 6 min, synchronized with similar volume scansby MHR. Although MHR was on a rather long, 64-kmnorth–south baseline with CSU-CHILL, successfuldual-Doppler analyses using data from these radars hasbeen performed on many convective storm systems(e.g., Kennedy and Rutledge 1995).
Both CSU-CHILL and MHR are S-band radars withapproximately 18 beamwidths. Volume scans for CSU-CHILL consisted of 16 constant-elevation scans fromapproximately 0.58 to 26.58, while MHR had 11 scansfrom 0.58 to 228. Both radars collected data to approx-imately 150 km at 225 or 300 m gate spacing. The longbaseline and 150-km range provided dual-Doppler cov-erage over large analysis lobes (defined liberally by a208 beam-crossing angle), so that convection developinginto MCSs remained in coverage over extended periods,and the 6-min volume scans provided excellent temporalresolution of this development. For both cases, the 140km 3 180 km analysis domain covered the entire easterndual-Doppler lobe (Fig. 2). This domain is over the HighPlains well to the east of the Rocky Mountains, with amean elevation about the same as the radars, about 1500m. A detrimental aspect of this large-area emphasis isthat vertical resolution becomes very degraded at max-imum ranges: the beamwidth exceeds 2.5 km, the lowest2.5 km AGL lies completely below the lowest beamcenter, and sampling through the entire storm depth islimited to as few as four or five scans. However, mostof the analysis is at more favorable, better resolved rang-es, and our focus on midlevel mesoscale motions makesthe degraded resolution at far ranges more acceptablethan if the focus was on convective scales.
Data processing relied on the well-known softwarepackages RDSS, SPRINT, and CEDRIC (Oye and Carbone1981; Miller et al. 1986; Mohr et al. 1986, respectively)developed at NCAR. Reflectivity and radial velocitydata for each radar were edited and unfolded in radarcoordinates and interpolated to a Cartesian grid overthis domain, from 2.5 km MSL (;1 km AGL) to 15km MSL, with horizontal and vertical grid spacing of1.5 and 0.5 km, respectively. Other details of the dual-Doppler synthesis procedure are nearly identical to thosedescribed in Nachamkin et al. (1994). Important aspectsto note here are that horizontal wind components werefiltered so that features smaller than 4Dx (6 km) werestrongly damped and that the iterative derivation of thewind components accounted for particle fall speed (as-suming ice and liquid, respectively, above and below
the freezing level of 4.85 km in both cases) and utilizeda downward integration of the continuity equation forderiving vertical motion. Upward integration and vari-ational techniques were not suitable due to a deep un-sampled surface-based layer over much of the domain.
Many of the dual-Doppler results are presented astime–height cross sections, based on vertical profiles ofhorizontally averaged or areally integrated variables ateach analysis time, over the several-hour analysis pe-riod, with no temporal smoothing. This method effec-tively averages out much of the convective-scale vari-ability within the system, as well as random error. Re-maining are important aspects of mesoscale evolution,as resolved from 23 dual-Doppler analyses at nominal12-min intervals in the first case, and from 10 analysesat #24-min intervals in the second case. Such time–height analyses are made over the entire MCS echo andseparately over its convective and stratiform portions,where that distinction is based on threshold values ofvertically integrated liquid water (VIL).
The precipitation analyses for the two MCSs wereperformed in slightly different ways as discussed later,but were both derived from gridded reflectivity fieldswith methods used by MC92. The Marshall–Palmer re-lation was used to convert reflectivity Z to rain rate R(a reflectivity–liquid water concentration relation basedon the same assumptions was used in calulating VIL).No attempt was made to improve estimates of R withrain gauge data or with alternate Z–R relations that maybe more suitable (particularly for convection). As dis-cussed by MC92, however, random error in R is largelyeliminated in its areal integration over the echoes ofinterest to derive volumetric rain rate V, and despiteremaining biases in V, trends in its time series reliablyindicate mesoscale intensity trends of the MCS.
3. Analysis of 11–12 August 1992 MCS
a. System overview
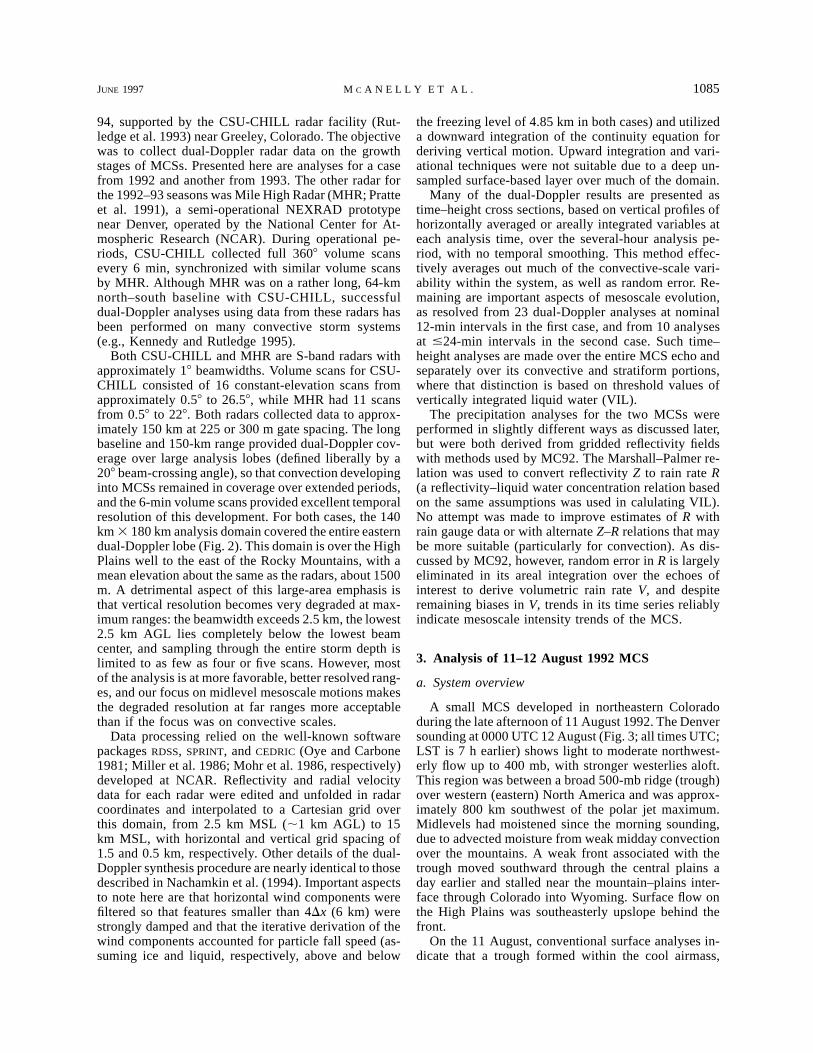
A small MCS developed in northeastern Coloradoduring the late afternoon of 11 August 1992. The Denversounding at 0000 UTC 12 August (Fig. 3; all times UTC;LST is 7 h earlier) shows light to moderate northwest-erly flow up to 400 mb, with stronger westerlies aloft.This region was between a broad 500-mb ridge (trough)over western (eastern) North America and was approx-imately 800 km southwest of the polar jet maximum.Midlevels had moistened since the morning sounding,due to advected moisture from weak midday convectionover the mountains. A weak front associated with thetrough moved southward through the central plains aday earlier and stalled near the mountain–plains inter-face through Colorado into Wyoming. Surface flow onthe High Plains was southeasterly upslope behind thefront.
On the 11 August, conventional surface analyses in-dicate that a trough formed within the cool airmass,
1086 VOLUME 125M O N T H L Y W E A T H E R R E V I E W
FIG. 3. Skew T–logp diagram for Denver sounding at 0000 UTC12 August 1992. Temperature and dewpoint profiles include originalsounding (solid lines connecting indicated mandatory and significantlevel data); a modified boundary layer (ue 5 354 K) below 770 mb(dashed); an altered sounding (section 5c) due to deep troposphericdescent (dash–dotted); and an altered sounding due to low- to mid-level ascent and mid- to upper-level descent (dotted). Wind barbsindicate reported winds (barb—5 m s21). Hodograph origin is (u, v)5 (0,0); tick mark interval is 5 m s21. Winds are indicated (labeled)every 0.5-km (2-km) AGL (station elevation 1611 m). Asterisk in-dicates storm motion.
extending northeastward from east of Denver acrosswestern Nebraska. Conventional surface and mesonetwinds on the plains (sites in Fig. 2) were southeasterlyto the southeast of this trough and were northerly ornortheasterly to the northwest. The sounding in Fig. 3was within these low-level northerlies. Values of ue $354 K were observed on both sides of the surface trough.Parcels lifted from the modified boundary layer (ue 5354 K) in Fig. 3 produce a convective available potentialenergy (CAPE) of 2315 J kg21.
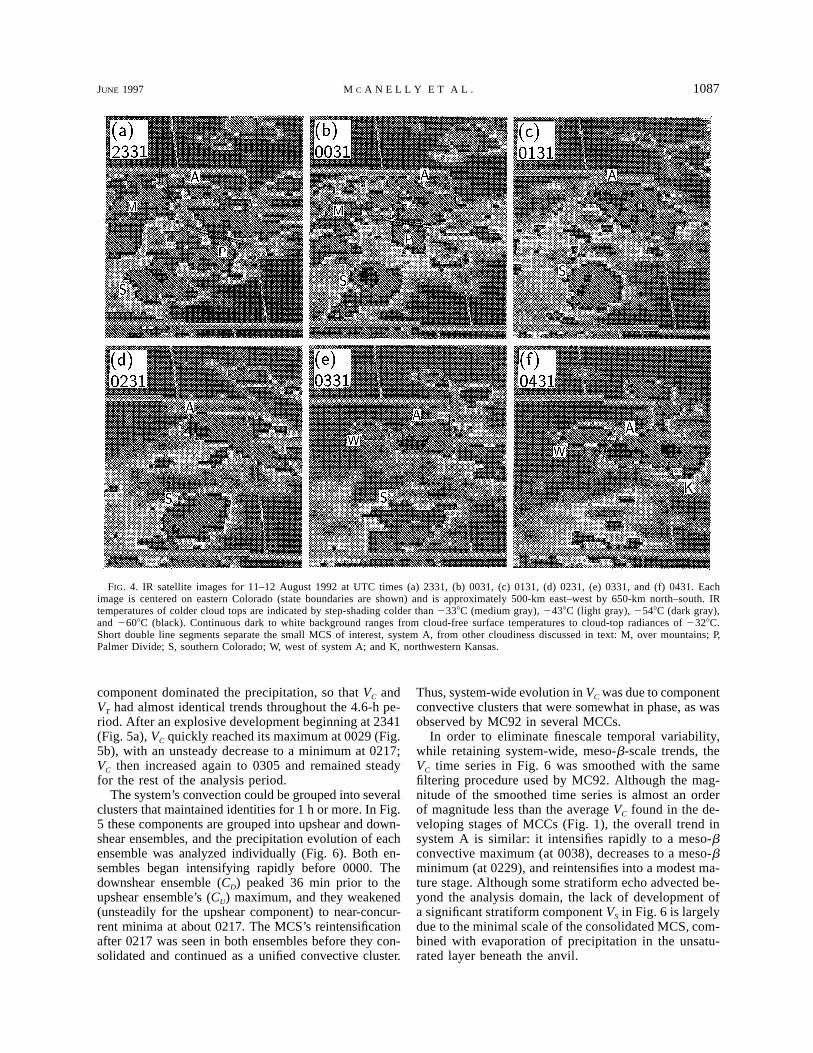
Deep convection initiated in northeastern Coloradowell east of the high terrain. Several isolated cumulo-nimbi originated over a large area, probably aided bybroad convergence associated with the surface troughbut not in any apparent alignment with it. Infrared (IR)satellite imagery shows that the individual anvils of thiswidespread convection consolidated into a small butunified MCS (system A) by 0131 (Figs. 4a–c). Duringthis development, adjacent convective activity weak-
ened over the mountains to the west and over the PalmerDivide to the south, leaving system A and another smallMCS well to the south as the only significant convectiveactivity in Colorado.
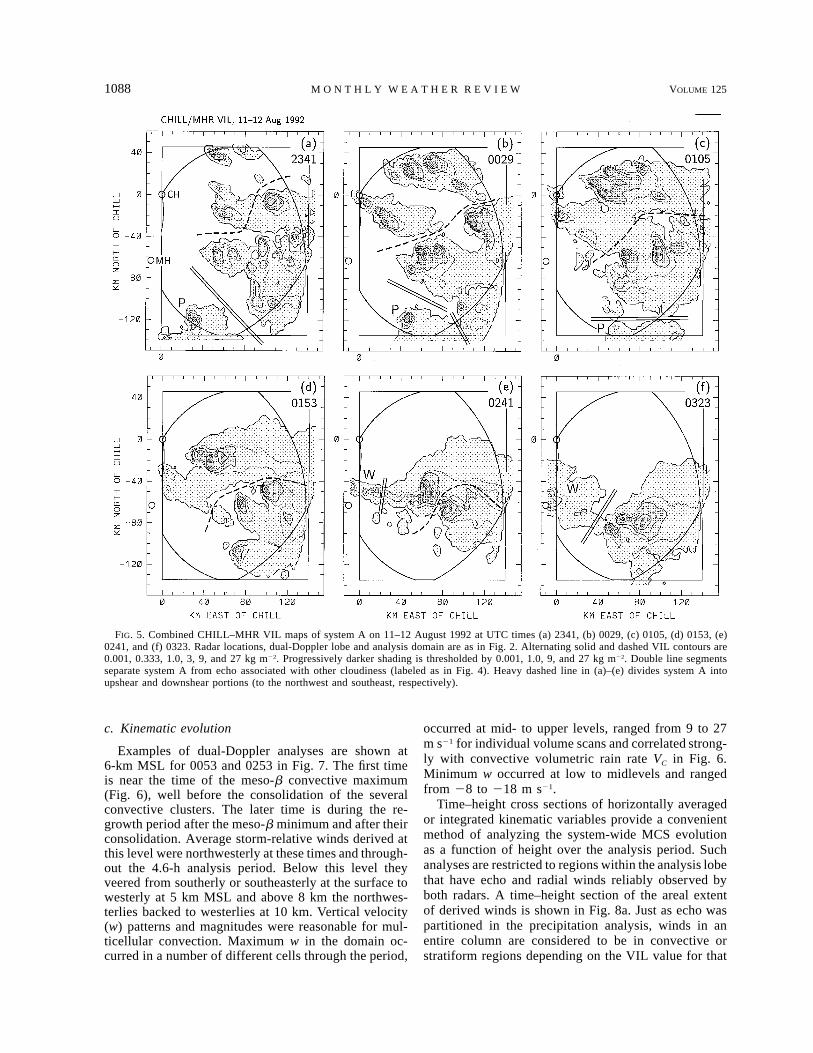
Radar shows that the initial widespread convectionconsolidated into four multicell clusters by 0029 (Fig.5b); these are individually apparent in the concurrentIR image as well (Fig. 4b). These clusters retained theiridentities through and beyond the development of theunified MCS cloud shield (Figs. 5c,d). While the west-ernmost cluster weakened and later reintensified as aseparate entity (Figs. 4e,f and 5e,f), the remaining clus-ters gradually consolidated into a single dominant clus-ter, which persisted past the last dual-Doppler analysisat 0353. After system A moved southeastward out ofthe analysis area, it eventually merged into the westflank of intensifying convection in northwestern Kansas(Fig. 4f), which developed into a larger MCS that dom-inated nocturnal convection over the plains.
Individual cell movement was generally to the southor southeast during system A’s evolution, with new cellsoccasionally developing on the western flanks of themulticell clusters. Overall MCS motion was determinedto be from 3478 at 5.2 m s21. While all of its significantconvection was within the dual-Doppler lobe throughoutthe analysis period, some of the upper-level anvil (Fig.4) and associated stratiform echo (Fig. 5) advected be-yond the eastern edge of the analysis domain.
b. Precipitation evolution
Dual-Doppler analyses were performed for 23 volumescans over a 4.6-h period from 2317 to 0353. These areat nominal 12-min intervals, with two slightly longerintervals due to power and equipment failures. The pre-cipitation analysis for system A is derived from the fullsequence of reflectivity fields in these analyses, whereeach gridded value is the maximum from either radar.To avoid underestimation of VIL at ranges where thelowest one or more grid levels were unobserved (belowthe beam center of either radar’s lowest scan), the re-flectivity value (including no-echo) at the lowest ob-served level in a column was extended down to the firstlevel. These fields were converted to rain-rate and liquidwater concentration fields, and VIL was calculated overthe depth of the analysis domain.
The total volumetric rain-rate (VT) time series for sys-tem A (excluding the non-MCS echo in Fig. 5) and forits convective and stratiform components (VC and VS,respectively) are shown in Fig. 6. These are based onrain-rate fields at 4-km MSL and on a convective–strat-iform VIL threshold of 2.5 kg m22. Comparison withtime series derived at other lower-tropospheric levels,using alternate VIL thresholds or comparable reflectiv-ity thresholds (i.e., ;35 dBZ) for convective–stratiformclassification, or based on different Z–R relations,showed little effect on their trends. Since relatively littlestratiform echo developed in this case, the convective
JUNE 1997 1087M C A N E L L Y E T A L .
FIG. 4. IR satellite images for 11–12 August 1992 at UTC times (a) 2331, (b) 0031, (c) 0131, (d) 0231, (e) 0331, and (f) 0431. Eachimage is centered on eastern Colorado (state boundaries are shown) and is approximately 500-km east–west by 650-km north–south. IRtemperatures of colder cloud tops are indicated by step-shading colder than 2338C (medium gray), 2438C (light gray), 2548C (dark gray),and 2608C (black). Continuous dark to white background ranges from cloud-free surface temperatures to cloud-top radiances of 2328C.Short double line segments separate the small MCS of interest, system A, from other cloudiness discussed in text: M, over mountains; P,Palmer Divide; S, southern Colorado; W, west of system A; and K, northwestern Kansas.
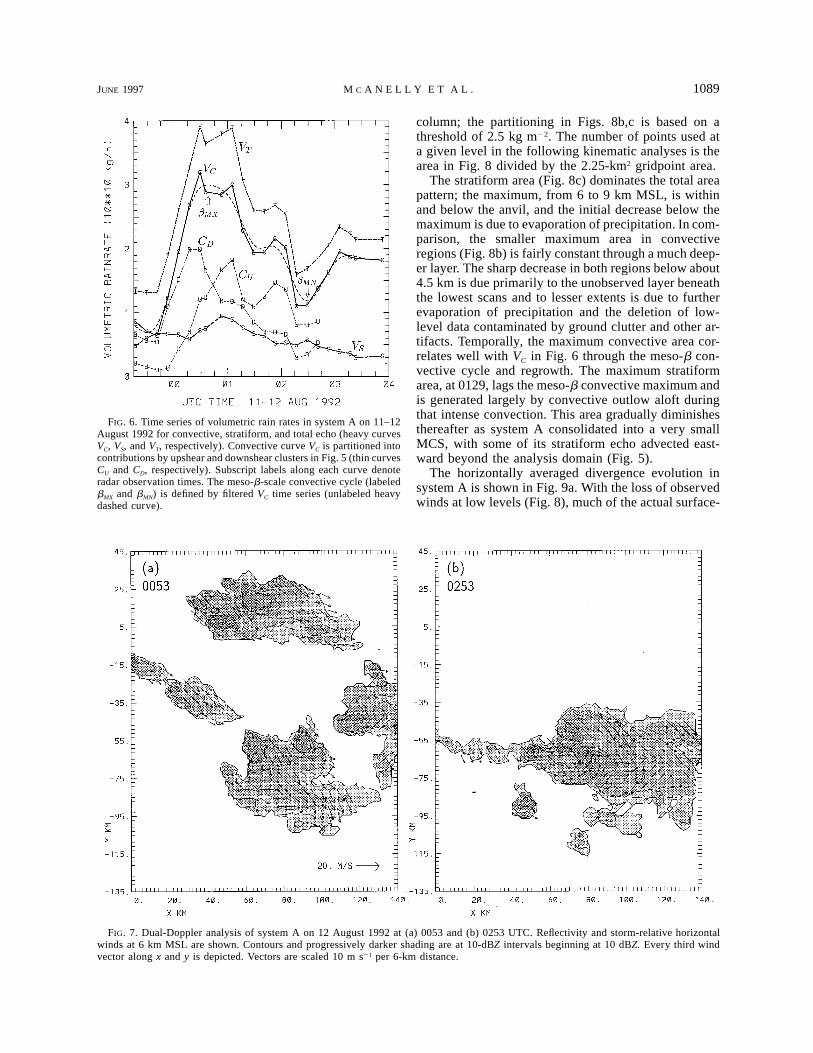
component dominated the precipitation, so that VC andVT had almost identical trends throughout the 4.6-h pe-riod. After an explosive development beginning at 2341(Fig. 5a), VC quickly reached its maximum at 0029 (Fig.5b), with an unsteady decrease to a minimum at 0217;VC then increased again to 0305 and remained steadyfor the rest of the analysis period.
The system’s convection could be grouped into severalclusters that maintained identities for 1 h or more. In Fig.5 these components are grouped into upshear and down-shear ensembles, and the precipitation evolution of eachensemble was analyzed individually (Fig. 6). Both en-sembles began intensifying rapidly before 0000. Thedownshear ensemble (CD) peaked 36 min prior to theupshear ensemble’s (CU) maximum, and they weakened(unsteadily for the upshear component) to near-concur-rent minima at about 0217. The MCS’s reintensificationafter 0217 was seen in both ensembles before they con-solidated and continued as a unified convective cluster.
Thus, system-wide evolution in VC was due to componentconvective clusters that were somewhat in phase, as wasobserved by MC92 in several MCCs.
In order to eliminate finescale temporal variability,while retaining system-wide, meso-b-scale trends, theVC time series in Fig. 6 was smoothed with the samefiltering procedure used by MC92. Although the mag-nitude of the smoothed time series is almost an orderof magnitude less than the average VC found in the de-veloping stages of MCCs (Fig. 1), the overall trend insystem A is similar: it intensifies rapidly to a meso-bconvective maximum (at 0038), decreases to a meso-bminimum (at 0229), and reintensifies into a modest ma-ture stage. Although some stratiform echo advected be-yond the analysis domain, the lack of development ofa significant stratiform component VS in Fig. 6 is largelydue to the minimal scale of the consolidated MCS, com-bined with evaporation of precipitation in the unsatu-rated layer beneath the anvil.
1088 VOLUME 125M O N T H L Y W E A T H E R R E V I E W
FIG. 5. Combined CHILL–MHR VIL maps of system A on 11–12 August 1992 at UTC times (a) 2341, (b) 0029, (c) 0105, (d) 0153, (e)0241, and (f) 0323. Radar locations, dual-Doppler lobe and analysis domain are as in Fig. 2. Alternating solid and dashed VIL contours are0.001, 0.333, 1.0, 3, 9, and 27 kg m22. Progressively darker shading is thresholded by 0.001, 1.0, 9, and 27 kg m22. Double line segmentsseparate system A from echo associated with other cloudiness (labeled as in Fig. 4). Heavy dashed line in (a)–(e) divides system A intoupshear and downshear portions (to the northwest and southeast, respectively).
c. Kinematic evolution
Examples of dual-Doppler analyses are shown at6-km MSL for 0053 and 0253 in Fig. 7. The first timeis near the time of the meso-b convective maximum(Fig. 6), well before the consolidation of the severalconvective clusters. The later time is during the re-growth period after the meso-b minimum and after theirconsolidation. Average storm-relative winds derived atthis level were northwesterly at these times and through-out the 4.6-h analysis period. Below this level theyveered from southerly or southeasterly at the surface towesterly at 5 km MSL and above 8 km the northwes-terlies backed to westerlies at 10 km. Vertical velocity(w) patterns and magnitudes were reasonable for mul-ticellular convection. Maximum w in the domain oc-curred in a number of different cells through the period,
occurred at mid- to upper levels, ranged from 9 to 27m s21 for individual volume scans and correlated strong-ly with convective volumetric rain rate VC in Fig. 6.Minimum w occurred at low to midlevels and rangedfrom 28 to 218 m s21.
Time–height cross sections of horizontally averagedor integrated kinematic variables provide a convenientmethod of analyzing the system-wide MCS evolutionas a function of height over the analysis period. Suchanalyses are restricted to regions within the analysis lobethat have echo and radial winds reliably observed byboth radars. A time–height section of the areal extentof derived winds is shown in Fig. 8a. Just as echo waspartitioned in the precipitation analysis, winds in anentire column are considered to be in convective orstratiform regions depending on the VIL value for that
JUNE 1997 1089M C A N E L L Y E T A L .
FIG. 6. Time series of volumetric rain rates in system A on 11–12August 1992 for convective, stratiform, and total echo (heavy curvesVC, VS, and VT, respectively). Convective curve VC is partitioned intocontributions by upshear and downshear clusters in Fig. 5 (thin curvesCU and CD, respectively). Subscript labels along each curve denoteradar observation times. The meso-b-scale convective cycle (labeledbMX and bMN) is defined by filtered VC time series (unlabeled heavydashed curve).
FIG. 7. Dual-Doppler analysis of system A on 12 August 1992 at (a) 0053 and (b) 0253 UTC. Reflectivity and storm-relative horizontalwinds at 6 km MSL are shown. Contours and progressively darker shading are at 10-dBZ intervals beginning at 10 dBZ. Every third windvector along x and y is depicted. Vectors are scaled 10 m s21 per 6-km distance.
column; the partitioning in Figs. 8b,c is based on athreshold of 2.5 kg m22. The number of points used ata given level in the following kinematic analyses is thearea in Fig. 8 divided by the 2.25-km2 gridpoint area.
The stratiform area (Fig. 8c) dominates the total areapattern; the maximum, from 6 to 9 km MSL, is withinand below the anvil, and the initial decrease below themaximum is due to evaporation of precipitation. In com-parison, the smaller maximum area in convectiveregions (Fig. 8b) is fairly constant through a much deep-er layer. The sharp decrease in both regions below about4.5 km is due primarily to the unobserved layer beneaththe lowest scans and to lesser extents is due to furtherevaporation of precipitation and the deletion of low-level data contaminated by ground clutter and other ar-tifacts. Temporally, the maximum convective area cor-relates well with VC in Fig. 6 through the meso-b con-vective cycle and regrowth. The maximum stratiformarea, at 0129, lags the meso-b convective maximum andis generated largely by convective outlow aloft duringthat intense convection. This area gradually diminishesthereafter as system A consolidated into a very smallMCS, with some of its stratiform echo advected east-ward beyond the analysis domain (Fig. 5).
The horizontally averaged divergence evolution insystem A is shown in Fig. 9a. With the loss of observedwinds at low levels (Fig. 8), much of the actual surface-
1090 VOLUME 125M O N T H L Y W E A T H E R R E V I E W
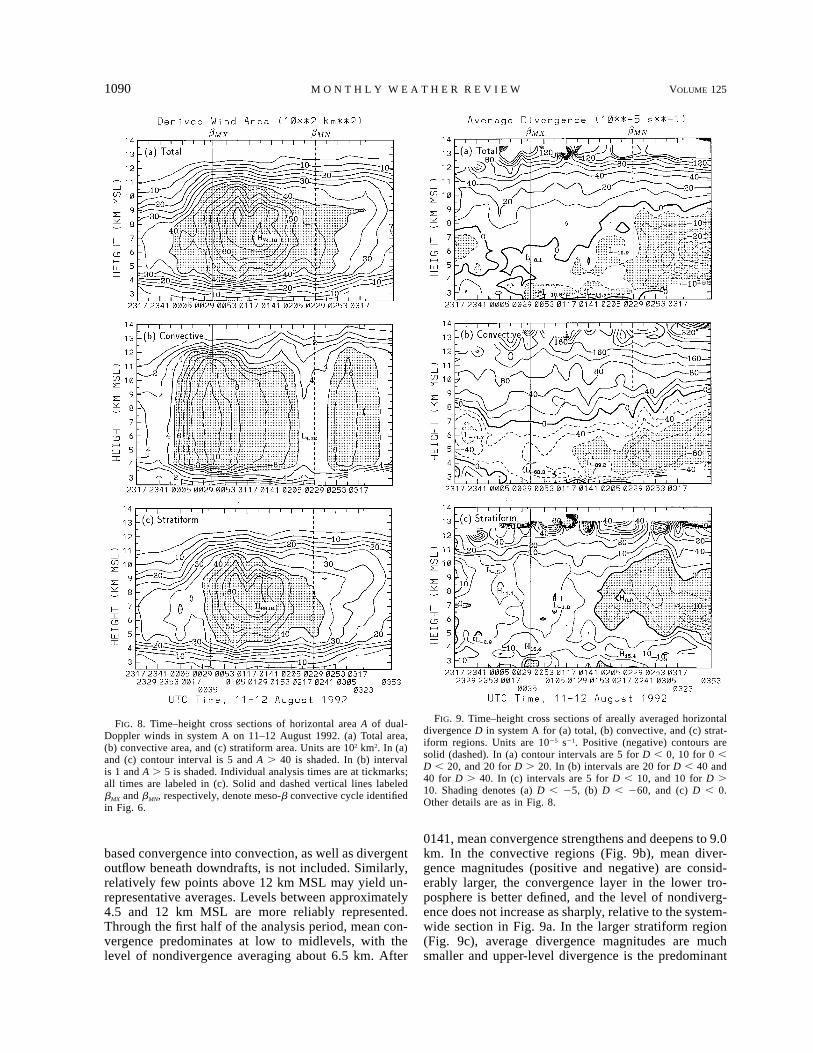
FIG. 8. Time–height cross sections of horizontal area A of dual-Doppler winds in system A on 11–12 August 1992. (a) Total area,(b) convective area, and (c) stratiform area. Units are 102 km2. In (a)and (c) contour interval is 5 and A . 40 is shaded. In (b) intervalis 1 and A . 5 is shaded. Individual analysis times are at tickmarks;all times are labeled in (c). Solid and dashed vertical lines labeledbMX and bMN, respectively, denote meso-b convective cycle identifiedin Fig. 6.
FIG. 9. Time–height cross sections of areally averaged horizontaldivergence D in system A for (a) total, (b) convective, and (c) strat-iform regions. Units are 1025 s21. Positive (negative) contours aresolid (dashed). In (a) contour intervals are 5 for D , 0, 10 for 0 ,D , 20, and 20 for D . 20. In (b) intervals are 20 for D , 40 and40 for D . 40. In (c) intervals are 5 for D , 10, and 10 for D .10. Shading denotes (a) D , 25, (b) D , 260, and (c) D , 0.Other details are as in Fig. 8.
based convergence into convection, as well as divergentoutflow beneath downdrafts, is not included. Similarly,relatively few points above 12 km MSL may yield un-representative averages. Levels between approximately4.5 and 12 km MSL are more reliably represented.Through the first half of the analysis period, mean con-vergence predominates at low to midlevels, with thelevel of nondivergence averaging about 6.5 km. After
0141, mean convergence strengthens and deepens to 9.0km. In the convective regions (Fig. 9b), mean diver-gence magnitudes (positive and negative) are consid-erably larger, the convergence layer in the lower tro-posphere is better defined, and the level of nondiverg-ence does not increase as sharply, relative to the system-wide section in Fig. 9a. In the larger stratiform region(Fig. 9c), average divergence magnitudes are muchsmaller and upper-level divergence is the predominant
JUNE 1997 1091M C A N E L L Y E T A L .
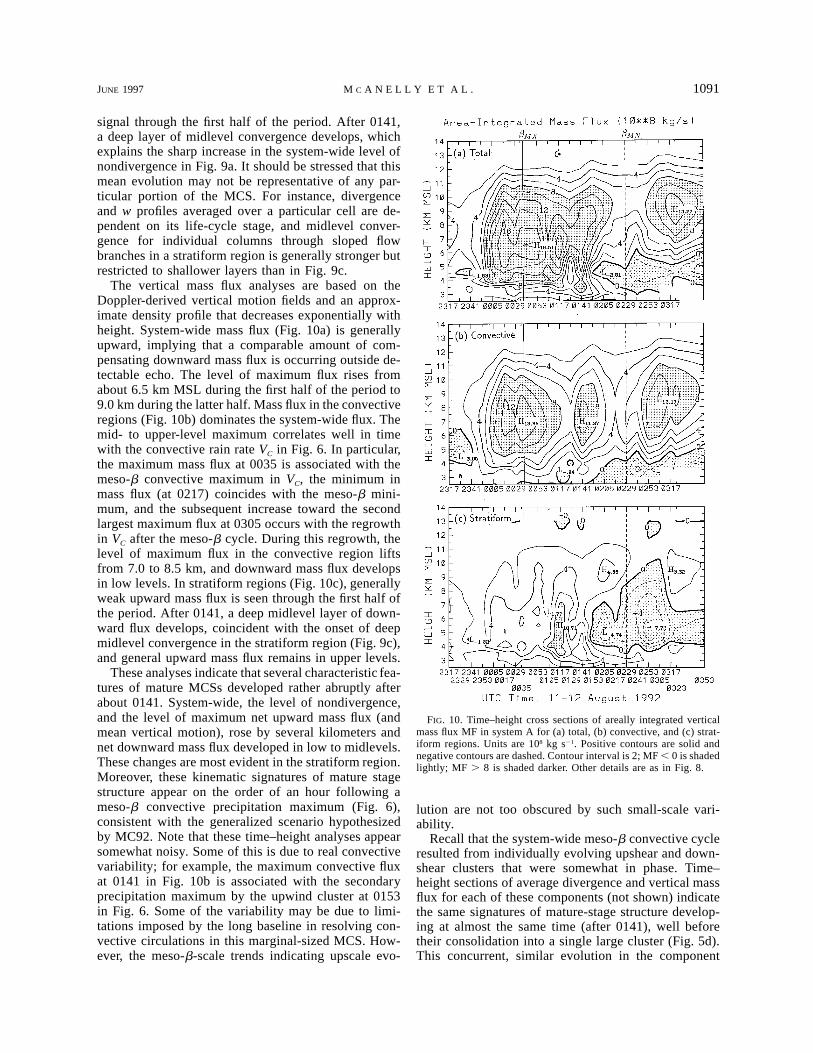
FIG. 10. Time–height cross sections of areally integrated verticalmass flux MF in system A for (a) total, (b) convective, and (c) strat-iform regions. Units are 108 kg s21. Positive contours are solid andnegative contours are dashed. Contour interval is 2; MF , 0 is shadedlightly; MF . 8 is shaded darker. Other details are as in Fig. 8.
signal through the first half of the period. After 0141,a deep layer of midlevel convergence develops, whichexplains the sharp increase in the system-wide level ofnondivergence in Fig. 9a. It should be stressed that thismean evolution may not be representative of any par-ticular portion of the MCS. For instance, divergenceand w profiles averaged over a particular cell are de-pendent on its life-cycle stage, and midlevel conver-gence for individual columns through sloped flowbranches in a stratiform region is generally stronger butrestricted to shallower layers than in Fig. 9c.
The vertical mass flux analyses are based on theDoppler-derived vertical motion fields and an approx-imate density profile that decreases exponentially withheight. System-wide mass flux (Fig. 10a) is generallyupward, implying that a comparable amount of com-pensating downward mass flux is occurring outside de-tectable echo. The level of maximum flux rises fromabout 6.5 km MSL during the first half of the period to9.0 km during the latter half. Mass flux in the convectiveregions (Fig. 10b) dominates the system-wide flux. Themid- to upper-level maximum correlates well in timewith the convective rain rate VC in Fig. 6. In particular,the maximum mass flux at 0035 is associated with themeso-b convective maximum in VC, the minimum inmass flux (at 0217) coincides with the meso-b mini-mum, and the subsequent increase toward the secondlargest maximum flux at 0305 occurs with the regrowthin VC after the meso-b cycle. During this regrowth, thelevel of maximum flux in the convective region liftsfrom 7.0 to 8.5 km, and downward mass flux developsin low levels. In stratiform regions (Fig. 10c), generallyweak upward mass flux is seen through the first half ofthe period. After 0141, a deep midlevel layer of down-ward flux develops, coincident with the onset of deepmidlevel convergence in the stratiform region (Fig. 9c),and general upward mass flux remains in upper levels.
These analyses indicate that several characteristic fea-tures of mature MCSs developed rather abruptly afterabout 0141. System-wide, the level of nondivergence,and the level of maximum net upward mass flux (andmean vertical motion), rose by several kilometers andnet downward mass flux developed in low to midlevels.These changes are most evident in the stratiform region.Moreover, these kinematic signatures of mature stagestructure appear on the order of an hour following ameso-b convective precipitation maximum (Fig. 6),consistent with the generalized scenario hypothesizedby MC92. Note that these time–height analyses appearsomewhat noisy. Some of this is due to real convectivevariability; for example, the maximum convective fluxat 0141 in Fig. 10b is associated with the secondaryprecipitation maximum by the upwind cluster at 0153in Fig. 6. Some of the variability may be due to limi-tations imposed by the long baseline in resolving con-vective circulations in this marginal-sized MCS. How-ever, the meso-b-scale trends indicating upscale evo-
lution are not too obscured by such small-scale vari-ability.
Recall that the system-wide meso-b convective cycleresulted from individually evolving upshear and down-shear clusters that were somewhat in phase. Time–height sections of average divergence and vertical massflux for each of these components (not shown) indicatethe same signatures of mature-stage structure develop-ing at almost the same time (after 0141), well beforetheir consolidation into a single large cluster (Fig. 5d).This concurrent, similar evolution in the component
1092 VOLUME 125M O N T H L Y W E A T H E R R E V I E W
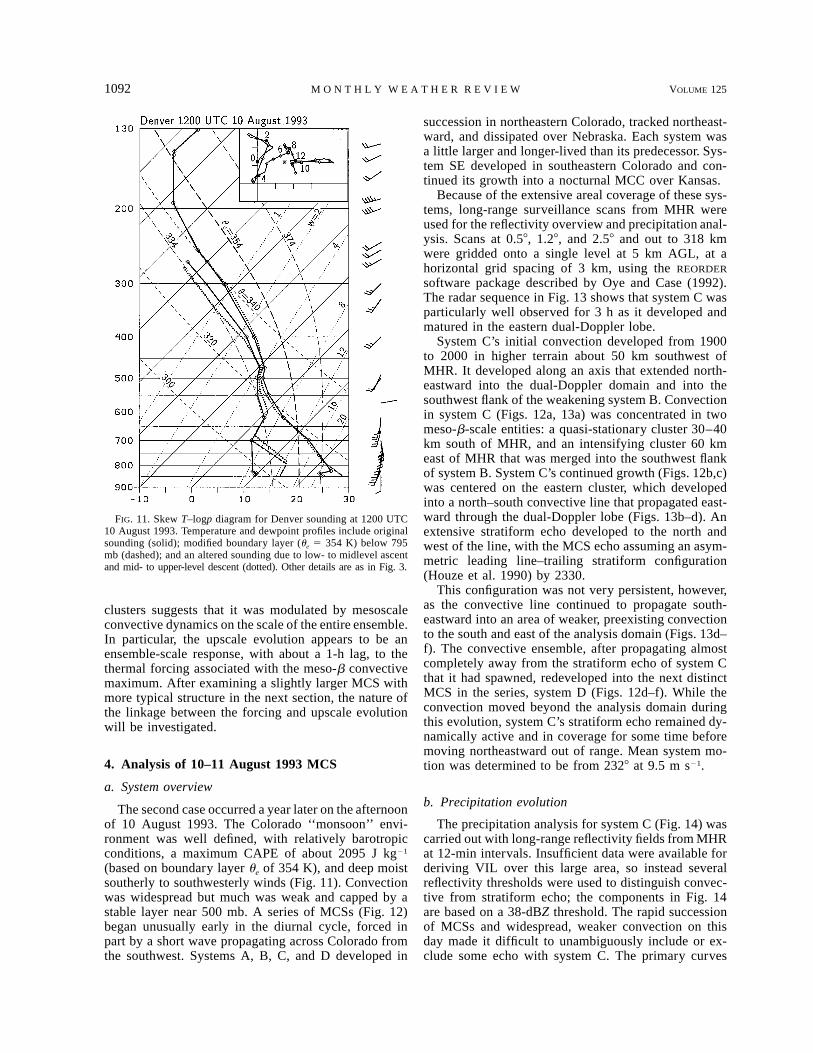
FIG. 11. Skew T–logp diagram for Denver sounding at 1200 UTC10 August 1993. Temperature and dewpoint profiles include originalsounding (solid); modified boundary layer (ue 5 354 K) below 795mb (dashed); and an altered sounding due to low- to midlevel ascentand mid- to upper-level descent (dotted). Other details are as in Fig. 3.
clusters suggests that it was modulated by mesoscaleconvective dynamics on the scale of the entire ensemble.In particular, the upscale evolution appears to be anensemble-scale response, with about a 1-h lag, to thethermal forcing associated with the meso-b convectivemaximum. After examining a slightly larger MCS withmore typical structure in the next section, the nature ofthe linkage between the forcing and upscale evolutionwill be investigated.
4. Analysis of 10–11 August 1993 MCS
a. System overview
The second case occurred a year later on the afternoonof 10 August 1993. The Colorado ‘‘monsoon’’ envi-ronment was well defined, with relatively barotropicconditions, a maximum CAPE of about 2095 J kg21
(based on boundary layer ue of 354 K), and deep moistsoutherly to southwesterly winds (Fig. 11). Convectionwas widespread but much was weak and capped by astable layer near 500 mb. A series of MCSs (Fig. 12)began unusually early in the diurnal cycle, forced inpart by a short wave propagating across Colorado fromthe southwest. Systems A, B, C, and D developed in
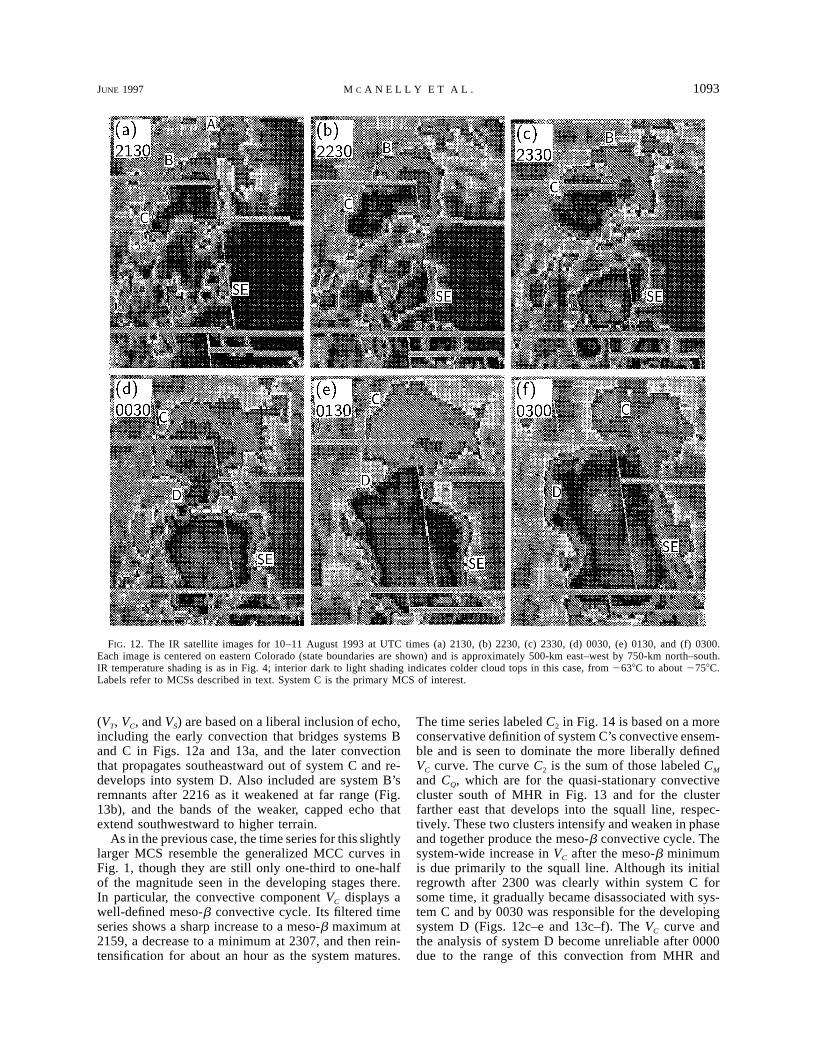
succession in northeastern Colorado, tracked northeast-ward, and dissipated over Nebraska. Each system wasa little larger and longer-lived than its predecessor. Sys-tem SE developed in southeastern Colorado and con-tinued its growth into a nocturnal MCC over Kansas.
Because of the extensive areal coverage of these sys-tems, long-range surveillance scans from MHR wereused for the reflectivity overview and precipitation anal-ysis. Scans at 0.58, 1.28, and 2.58 and out to 318 kmwere gridded onto a single level at 5 km AGL, at ahorizontal grid spacing of 3 km, using the REORDER
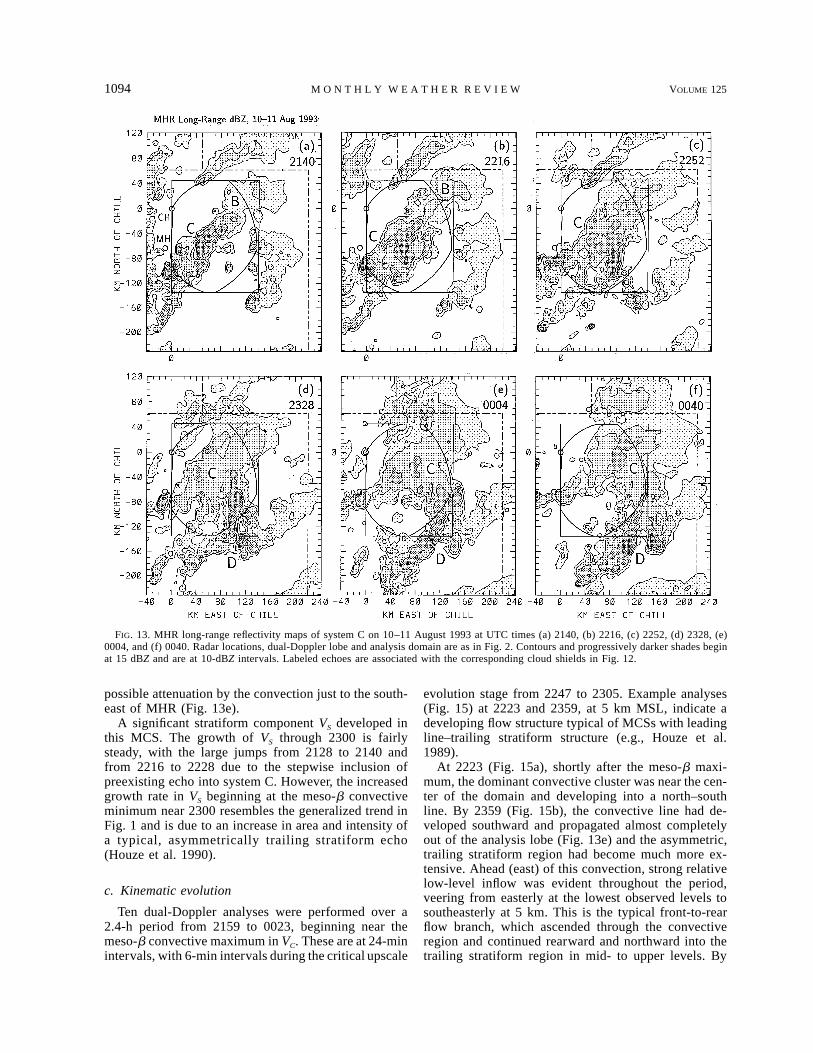
software package described by Oye and Case (1992).The radar sequence in Fig. 13 shows that system C wasparticularly well observed for 3 h as it developed andmatured in the eastern dual-Doppler lobe.
System C’s initial convection developed from 1900to 2000 in higher terrain about 50 km southwest ofMHR. It developed along an axis that extended north-eastward into the dual-Doppler domain and into thesouthwest flank of the weakening system B. Convectionin system C (Figs. 12a, 13a) was concentrated in twomeso-b-scale entities: a quasi-stationary cluster 30–40km south of MHR, and an intensifying cluster 60 kmeast of MHR that was merged into the southwest flankof system B. System C’s continued growth (Figs. 12b,c)was centered on the eastern cluster, which developedinto a north–south convective line that propagated east-ward through the dual-Doppler lobe (Figs. 13b–d). Anextensive stratiform echo developed to the north andwest of the line, with the MCS echo assuming an asym-metric leading line–trailing stratiform configuration(Houze et al. 1990) by 2330.
This configuration was not very persistent, however,as the convective line continued to propagate south-eastward into an area of weaker, preexisting convectionto the south and east of the analysis domain (Figs. 13d–f). The convective ensemble, after propagating almostcompletely away from the stratiform echo of system Cthat it had spawned, redeveloped into the next distinctMCS in the series, system D (Figs. 12d–f). While theconvection moved beyond the analysis domain duringthis evolution, system C’s stratiform echo remained dy-namically active and in coverage for some time beforemoving northeastward out of range. Mean system mo-tion was determined to be from 2328 at 9.5 m s21.
b. Precipitation evolution
The precipitation analysis for system C (Fig. 14) wascarried out with long-range reflectivity fields from MHRat 12-min intervals. Insufficient data were available forderiving VIL over this large area, so instead severalreflectivity thresholds were used to distinguish convec-tive from stratiform echo; the components in Fig. 14are based on a 38-dBZ threshold. The rapid successionof MCSs and widespread, weaker convection on thisday made it difficult to unambiguously include or ex-clude some echo with system C. The primary curves
JUNE 1997 1093M C A N E L L Y E T A L .
FIG. 12. The IR satellite images for 10–11 August 1993 at UTC times (a) 2130, (b) 2230, (c) 2330, (d) 0030, (e) 0130, and (f) 0300.Each image is centered on eastern Colorado (state boundaries are shown) and is approximately 500-km east–west by 750-km north–south.IR temperature shading is as in Fig. 4; interior dark to light shading indicates colder cloud tops in this case, from 2638C to about 2758C.Labels refer to MCSs described in text. System C is the primary MCS of interest.
(VT, VC, and VS) are based on a liberal inclusion of echo,including the early convection that bridges systems Band C in Figs. 12a and 13a, and the later convectionthat propagates southeastward out of system C and re-develops into system D. Also included are system B’sremnants after 2216 as it weakened at far range (Fig.13b), and the bands of the weaker, capped echo thatextend southwestward to higher terrain.
As in the previous case, the time series for this slightlylarger MCS resemble the generalized MCC curves inFig. 1, though they are still only one-third to one-halfof the magnitude seen in the developing stages there.In particular, the convective component VC displays awell-defined meso-b convective cycle. Its filtered timeseries shows a sharp increase to a meso-b maximum at2159, a decrease to a minimum at 2307, and then rein-tensification for about an hour as the system matures.
The time series labeled C2 in Fig. 14 is based on a moreconservative definition of system C’s convective ensem-ble and is seen to dominate the more liberally definedVC curve. The curve C2 is the sum of those labeled CM
and CQ, which are for the quasi-stationary convectivecluster south of MHR in Fig. 13 and for the clusterfarther east that develops into the squall line, respec-tively. These two clusters intensify and weaken in phaseand together produce the meso-b convective cycle. Thesystem-wide increase in VC after the meso-b minimumis due primarily to the squall line. Although its initialregrowth after 2300 was clearly within system C forsome time, it gradually became disassociated with sys-tem C and by 0030 was responsible for the developingsystem D (Figs. 12c–e and 13c–f). The VC curve andthe analysis of system D become unreliable after 0000due to the range of this convection from MHR and
1094 VOLUME 125M O N T H L Y W E A T H E R R E V I E W
FIG. 13. MHR long-range reflectivity maps of system C on 10–11 August 1993 at UTC times (a) 2140, (b) 2216, (c) 2252, (d) 2328, (e)0004, and (f) 0040. Radar locations, dual-Doppler lobe and analysis domain are as in Fig. 2. Contours and progressively darker shades beginat 15 dBZ and are at 10-dBZ intervals. Labeled echoes are associated with the corresponding cloud shields in Fig. 12.
possible attenuation by the convection just to the south-east of MHR (Fig. 13e).
A significant stratiform component VS developed inthis MCS. The growth of VS through 2300 is fairlysteady, with the large jumps from 2128 to 2140 andfrom 2216 to 2228 due to the stepwise inclusion ofpreexisting echo into system C. However, the increasedgrowth rate in VS beginning at the meso-b convectiveminimum near 2300 resembles the generalized trend inFig. 1 and is due to an increase in area and intensity ofa typical, asymmetrically trailing stratiform echo(Houze et al. 1990).
c. Kinematic evolution
Ten dual-Doppler analyses were performed over a2.4-h period from 2159 to 0023, beginning near themeso-b convective maximum in VC. These are at 24-minintervals, with 6-min intervals during the critical upscale
evolution stage from 2247 to 2305. Example analyses(Fig. 15) at 2223 and 2359, at 5 km MSL, indicate adeveloping flow structure typical of MCSs with leadingline–trailing stratiform structure (e.g., Houze et al.1989).
At 2223 (Fig. 15a), shortly after the meso-b maxi-mum, the dominant convective cluster was near the cen-ter of the domain and developing into a north–southline. By 2359 (Fig. 15b), the convective line had de-veloped southward and propagated almost completelyout of the analysis lobe (Fig. 13e) and the asymmetric,trailing stratiform region had become much more ex-tensive. Ahead (east) of this convection, strong relativelow-level inflow was evident throughout the period,veering from easterly at the lowest observed levels tosoutheasterly at 5 km. This is the typical front-to-rearflow branch, which ascended through the convectiveregion and continued rearward and northward into thetrailing stratiform region in mid- to upper levels. By
JUNE 1997 1095M C A N E L L Y E T A L .
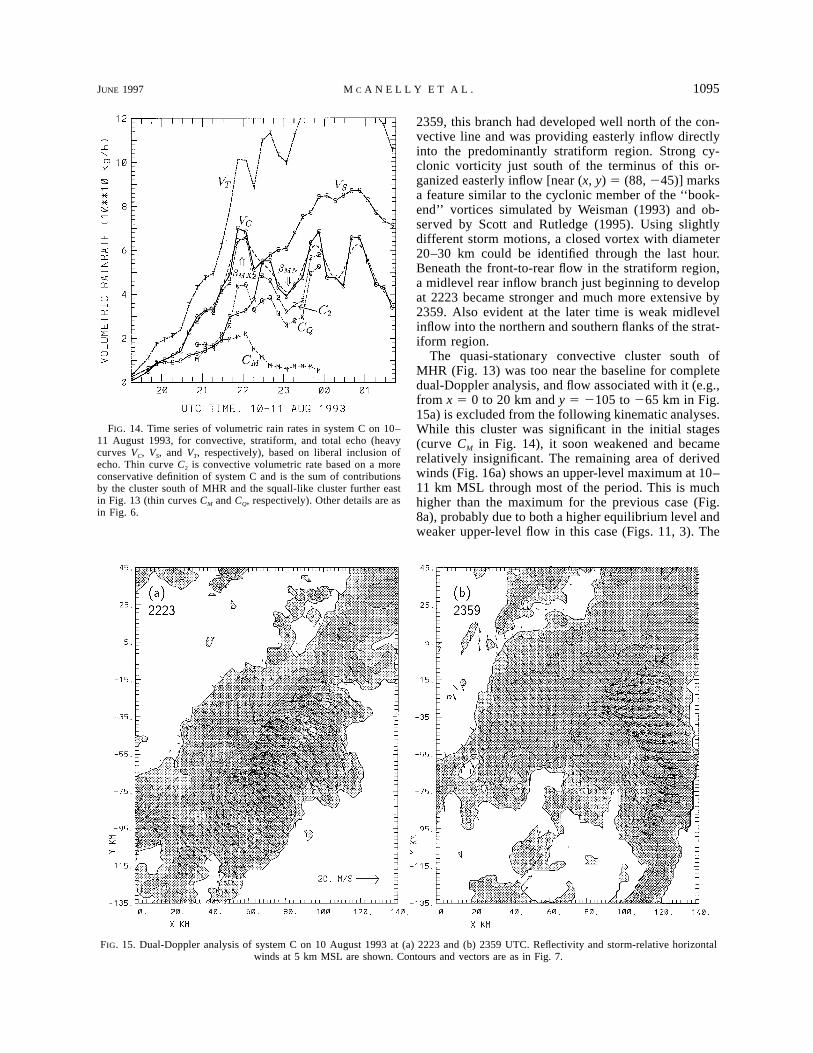
FIG. 14. Time series of volumetric rain rates in system C on 10–11 August 1993, for convective, stratiform, and total echo (heavycurves VC, VS, and VT, respectively), based on liberal inclusion ofecho. Thin curve C2 is convective volumetric rate based on a moreconservative definition of system C and is the sum of contributionsby the cluster south of MHR and the squall-like cluster further eastin Fig. 13 (thin curves CM and CQ, respectively). Other details are asin Fig. 6.
FIG. 15. Dual-Doppler analysis of system C on 10 August 1993 at (a) 2223 and (b) 2359 UTC. Reflectivity and storm-relative horizontalwinds at 5 km MSL are shown. Contours and vectors are as in Fig. 7.
2359, this branch had developed well north of the con-vective line and was providing easterly inflow directlyinto the predominantly stratiform region. Strong cy-clonic vorticity just south of the terminus of this or-ganized easterly inflow [near (x, y) 5 (88, 245)] marksa feature similar to the cyclonic member of the ‘‘book-end’’ vortices simulated by Weisman (1993) and ob-served by Scott and Rutledge (1995). Using slightlydifferent storm motions, a closed vortex with diameter20–30 km could be identified through the last hour.Beneath the front-to-rear flow in the stratiform region,a midlevel rear inflow branch just beginning to developat 2223 became stronger and much more extensive by2359. Also evident at the later time is weak midlevelinflow into the northern and southern flanks of the strat-iform region.
The quasi-stationary convective cluster south ofMHR (Fig. 13) was too near the baseline for completedual-Doppler analysis, and flow associated with it (e.g.,from x 5 0 to 20 km and y 5 2105 to 265 km in Fig.15a) is excluded from the following kinematic analyses.While this cluster was significant in the initial stages(curve CM in Fig. 14), it soon weakened and becamerelatively insignificant. The remaining area of derivedwinds (Fig. 16a) shows an upper-level maximum at 10–11 km MSL through most of the period. This is muchhigher than the maximum for the previous case (Fig.8a), probably due to both a higher equilibrium level andweaker upper-level flow in this case (Figs. 11, 3). The
1096 VOLUME 125M O N T H L Y W E A T H E R R E V I E W
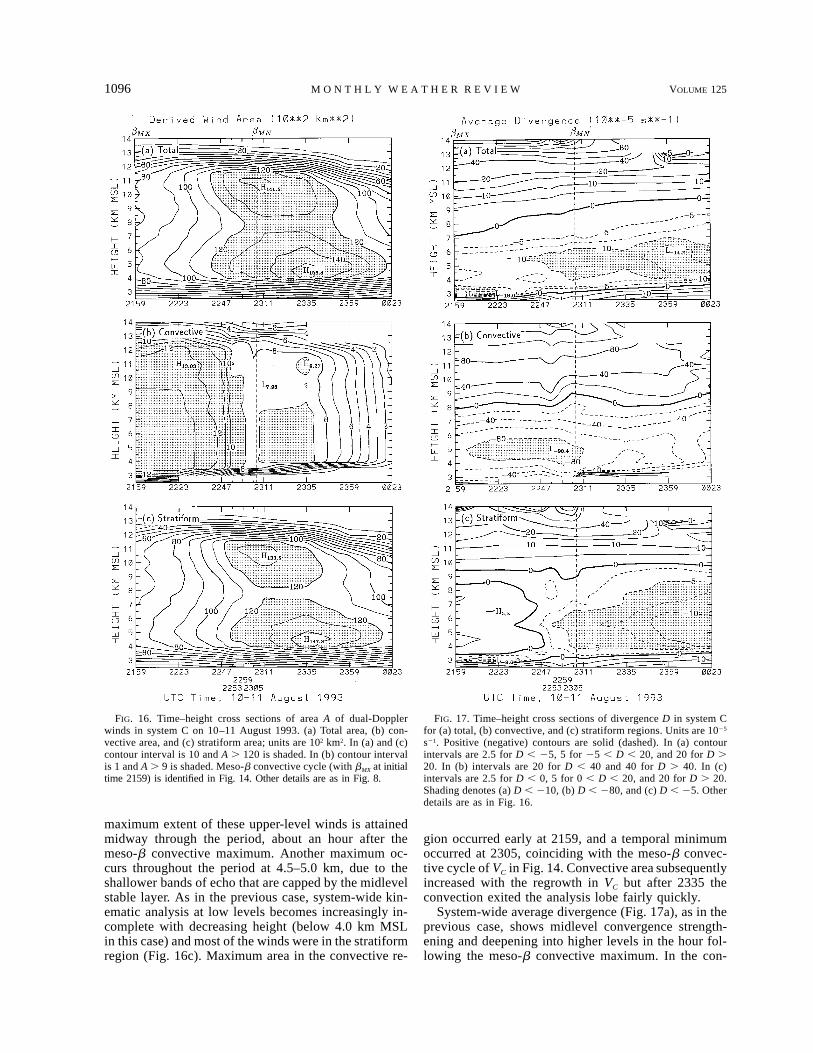
FIG. 16. Time–height cross sections of area A of dual-Dopplerwinds in system C on 10–11 August 1993. (a) Total area, (b) con-vective area, and (c) stratiform area; units are 102 km2. In (a) and (c)contour interval is 10 and A . 120 is shaded. In (b) contour intervalis 1 and A . 9 is shaded. Meso-b convective cycle (with bMX at initialtime 2159) is identified in Fig. 14. Other details are as in Fig. 8.
FIG. 17. Time–height cross sections of divergence D in system Cfor (a) total, (b) convective, and (c) stratiform regions. Units are 1025
s21. Positive (negative) contours are solid (dashed). In (a) contourintervals are 2.5 for D , 25, 5 for 25 , D , 20, and 20 for D .20. In (b) intervals are 20 for D , 40 and 40 for D . 40. In (c)intervals are 2.5 for D , 0, 5 for 0 , D , 20, and 20 for D . 20.Shading denotes (a) D , 210, (b) D , 280, and (c) D , 25. Otherdetails are as in Fig. 16.
maximum extent of these upper-level winds is attainedmidway through the period, about an hour after themeso-b convective maximum. Another maximum oc-curs throughout the period at 4.5–5.0 km, due to theshallower bands of echo that are capped by the midlevelstable layer. As in the previous case, system-wide kin-ematic analysis at low levels becomes increasingly in-complete with decreasing height (below 4.0 km MSLin this case) and most of the winds were in the stratiformregion (Fig. 16c). Maximum area in the convective re-
gion occurred early at 2159, and a temporal minimumoccurred at 2305, coinciding with the meso-b convec-tive cycle of VC in Fig. 14. Convective area subsequentlyincreased with the regrowth in VC but after 2335 theconvection exited the analysis lobe fairly quickly.
System-wide average divergence (Fig. 17a), as in theprevious case, shows midlevel convergence strength-ening and deepening into higher levels in the hour fol-lowing the meso-b convective maximum. In the con-
JUNE 1997 1097M C A N E L L Y E T A L .
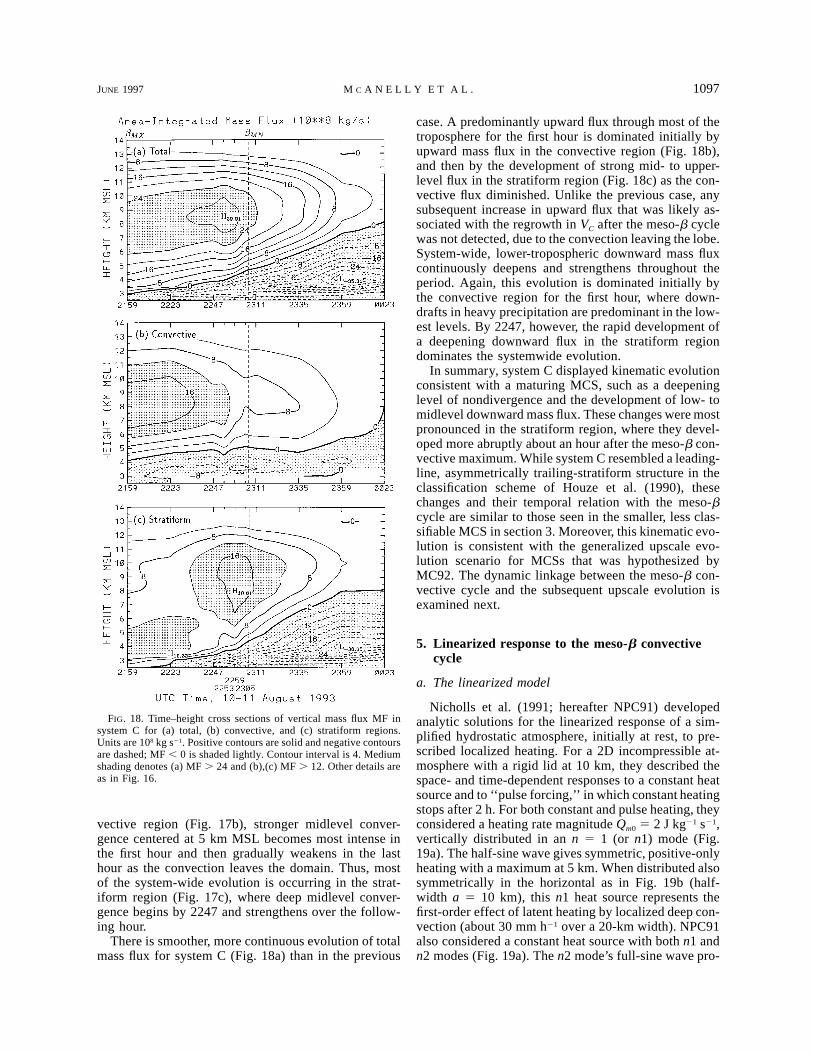
FIG. 18. Time–height cross sections of vertical mass flux MF insystem C for (a) total, (b) convective, and (c) stratiform regions.Units are 108 kg s21. Positive contours are solid and negative contoursare dashed; MF , 0 is shaded lightly. Contour interval is 4. Mediumshading denotes (a) MF . 24 and (b),(c) MF . 12. Other details areas in Fig. 16.
vective region (Fig. 17b), stronger midlevel conver-gence centered at 5 km MSL becomes most intense inthe first hour and then gradually weakens in the lasthour as the convection leaves the domain. Thus, mostof the system-wide evolution is occurring in the strat-iform region (Fig. 17c), where deep midlevel conver-gence begins by 2247 and strengthens over the follow-ing hour.
There is smoother, more continuous evolution of totalmass flux for system C (Fig. 18a) than in the previous
case. A predominantly upward flux through most of thetroposphere for the first hour is dominated initially byupward mass flux in the convective region (Fig. 18b),and then by the development of strong mid- to upper-level flux in the stratiform region (Fig. 18c) as the con-vective flux diminished. Unlike the previous case, anysubsequent increase in upward flux that was likely as-sociated with the regrowth in VC after the meso-b cyclewas not detected, due to the convection leaving the lobe.System-wide, lower-tropospheric downward mass fluxcontinuously deepens and strengthens throughout theperiod. Again, this evolution is dominated initially bythe convective region for the first hour, where down-drafts in heavy precipitation are predominant in the low-est levels. By 2247, however, the rapid development ofa deepening downward flux in the stratiform regiondominates the systemwide evolution.
In summary, system C displayed kinematic evolutionconsistent with a maturing MCS, such as a deepeninglevel of nondivergence and the development of low- tomidlevel downward mass flux. These changes were mostpronounced in the stratiform region, where they devel-oped more abruptly about an hour after the meso-b con-vective maximum. While system C resembled a leading-line, asymmetrically trailing-stratiform structure in theclassification scheme of Houze et al. (1990), thesechanges and their temporal relation with the meso-bcycle are similar to those seen in the smaller, less clas-sifiable MCS in section 3. Moreover, this kinematic evo-lution is consistent with the generalized upscale evo-lution scenario for MCSs that was hypothesized byMC92. The dynamic linkage between the meso-b con-vective cycle and the subsequent upscale evolution isexamined next.
5. Linearized response to the meso-b convectivecycle
a. The linearized model
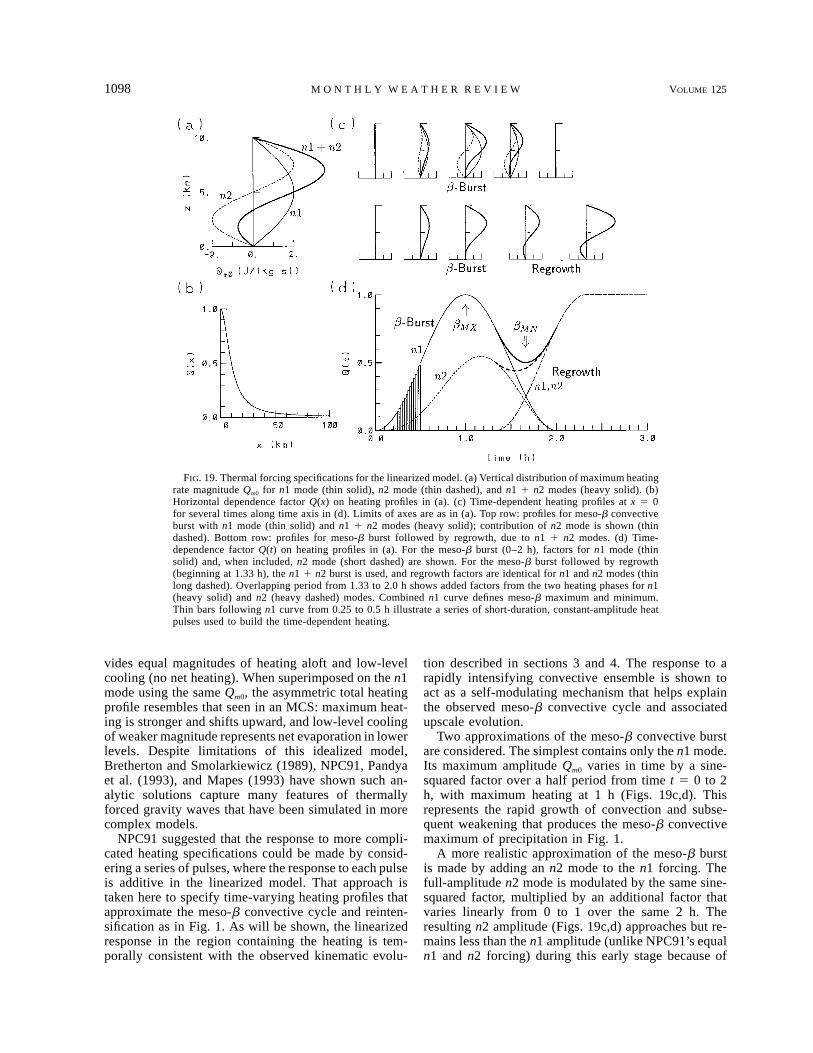
Nicholls et al. (1991; hereafter NPC91) developedanalytic solutions for the linearized response of a sim-plified hydrostatic atmosphere, initially at rest, to pre-scribed localized heating. For a 2D incompressible at-mosphere with a rigid lid at 10 km, they described thespace- and time-dependent responses to a constant heatsource and to ‘‘pulse forcing,’’ in which constant heatingstops after 2 h. For both constant and pulse heating, theyconsidered a heating rate magnitude Qm0 5 2 J kg21 s21,vertically distributed in an n 5 1 (or n1) mode (Fig.19a). The half-sine wave gives symmetric, positive-onlyheating with a maximum at 5 km. When distributed alsosymmetrically in the horizontal as in Fig. 19b (half-width a 5 10 km), this n1 heat source represents thefirst-order effect of latent heating by localized deep con-vection (about 30 mm h21 over a 20-km width). NPC91also considered a constant heat source with both n1 andn2 modes (Fig. 19a). The n2 mode’s full-sine wave pro-
1098 VOLUME 125M O N T H L Y W E A T H E R R E V I E W
FIG. 19. Thermal forcing specifications for the linearized model. (a) Vertical distribution of maximum heatingrate magnitude Qm0 for n1 mode (thin solid), n2 mode (thin dashed), and n1 1 n2 modes (heavy solid). (b)Horizontal dependence factor Q(x) on heating profiles in (a). (c) Time-dependent heating profiles at x 5 0for several times along time axis in (d). Limits of axes are as in (a). Top row: profiles for meso-b convectiveburst with n1 mode (thin solid) and n1 1 n2 modes (heavy solid); contribution of n2 mode is shown (thindashed). Bottom row: profiles for meso-b burst followed by regrowth, due to n1 1 n2 modes. (d) Time-dependence factor Q(t) on heating profiles in (a). For the meso-b burst (0–2 h), factors for n1 mode (thinsolid) and, when included, n2 mode (short dashed) are shown. For the meso-b burst followed by regrowth(beginning at 1.33 h), the n1 1 n2 burst is used, and regrowth factors are identical for n1 and n2 modes (thinlong dashed). Overlapping period from 1.33 to 2.0 h shows added factors from the two heating phases for n1(heavy solid) and n2 (heavy dashed) modes. Combined n1 curve defines meso-b maximum and minimum.Thin bars following n1 curve from 0.25 to 0.5 h illustrate a series of short-duration, constant-amplitude heatpulses used to build the time-dependent heating.
vides equal magnitudes of heating aloft and low-levelcooling (no net heating). When superimposed on the n1mode using the same Qm0, the asymmetric total heatingprofile resembles that seen in an MCS: maximum heat-ing is stronger and shifts upward, and low-level coolingof weaker magnitude represents net evaporation in lowerlevels. Despite limitations of this idealized model,Bretherton and Smolarkiewicz (1989), NPC91, Pandyaet al. (1993), and Mapes (1993) have shown such an-alytic solutions capture many features of thermallyforced gravity waves that have been simulated in morecomplex models.
NPC91 suggested that the response to more compli-cated heating specifications could be made by consid-ering a series of pulses, where the response to each pulseis additive in the linearized model. That approach istaken here to specify time-varying heating profiles thatapproximate the meso-b convective cycle and reinten-sification as in Fig. 1. As will be shown, the linearizedresponse in the region containing the heating is tem-porally consistent with the observed kinematic evolu-
tion described in sections 3 and 4. The response to arapidly intensifying convective ensemble is shown toact as a self-modulating mechanism that helps explainthe observed meso-b convective cycle and associatedupscale evolution.
Two approximations of the meso-b convective burstare considered. The simplest contains only the n1 mode.Its maximum amplitude Qm0 varies in time by a sine-squared factor over a half period from time t 5 0 to 2h, with maximum heating at 1 h (Figs. 19c,d). Thisrepresents the rapid growth of convection and subse-quent weakening that produces the meso-b convectivemaximum of precipitation in Fig. 1.
A more realistic approximation of the meso-b burstis made by adding an n2 mode to the n1 forcing. Thefull-amplitude n2 mode is modulated by the same sine-squared factor, multiplied by an additional factor thatvaries linearly from 0 to 1 over the same 2 h. Theresulting n2 amplitude (Figs. 19c,d) approaches but re-mains less than the n1 amplitude (unlike NPC91’s equaln1 and n2 forcing) during this early stage because of
JUNE 1997 1099M C A N E L L Y E T A L .
the predominance of convective over stratiform pro-cesses; however, increasing relative n2 amplitude ac-counts for increasing influence by a developing strati-form region. The smaller n2 amplitude is similar to then1 1 n2 forcing considered by Mapes (1993), whoshowed that the important effects of the n2 mode occureven with no net low-level cooling (e.g., at t 5 1 h inFig. 19c). To the extent that low-level cooling might bemore associated with convective than stratiform rainduring this stage, note that the n2 maximum lags then1 maximum by ;10 min, which is comparable to themicrophysical and hydrometeor fallout timescale asso-ciated with maximum condensation in convection andsubsequent low-level evaporational cooling.
A third scenario involves regrowth of the system fol-lowing the meso-b convective burst. The regrowth con-tains n1 and n2 modes, both modulated identically bya sine-squared factor over a quarter-wave period begin-ning at t 5 1.33 h and reaching a steady maximum att 5 2.33 h (Fig. 19d). When considered with the meso-b burst containing n1 and n2 modes, the net heatingprofile varies as shown in the second row of Fig. 19c.The superimposed n1 modes from the meso-b burst andregrowth produce a meso-b cycle with a maximum andminimum at 1 h and 1.67 h, respectively, followed byreintensification to steady maximum heating at 2.33 h.The amplitude of the superimposed n2 modes equalsthe n1 amplitude by 2 h. This evolution approximatesthe meso-b convective cycle and subsequent regrowthin Fig. 1, including the increasing influence of stratiformprecipitation in a maturing MCS.
The prescribed heating for each of these modes andperiods is built with a series of short-duration heat pulsesthat follow the time-dependent amplitude (e.g., Fig.19d). The analytical solutions of NPC91 (for wind com-ponents u and w, pressure and buoyancy) apply to eachshort-duration pulse and are added to give the responseto any of the prescribed heating scenarios as functionsof (x,z,t). These responses are first shown, for u and w,over a large, 500-km horizontal domain in order to com-pare with the results of NPC91. All variables used inthe solutions are the same as used by them (e.g., buoy-ancy frequency, heating half-width, and constant densityvalue) except Qm0 5 2 J kg21 s21 in all solutions here,whereas they halved this value in their solutions for n11 n2 forcing. As in NPC91, the heating is centered atx 5 0 and the response is symmetric in the x direction.
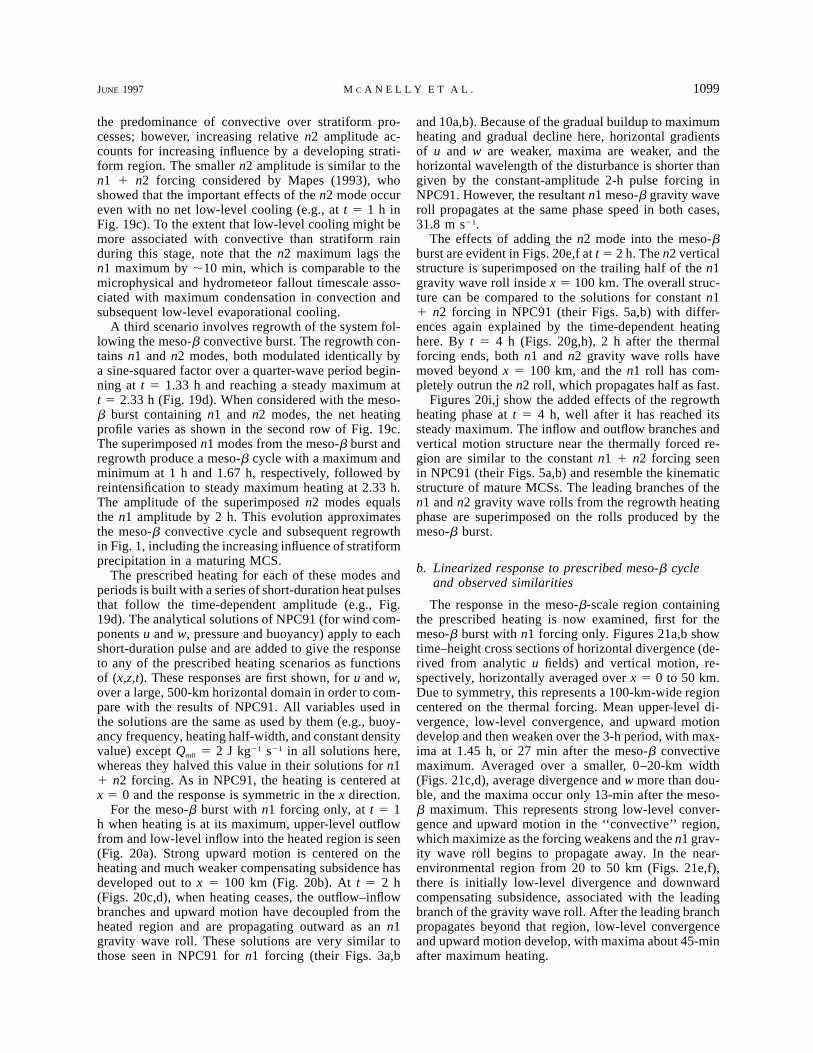
For the meso-b burst with n1 forcing only, at t 5 1h when heating is at its maximum, upper-level outflowfrom and low-level inflow into the heated region is seen(Fig. 20a). Strong upward motion is centered on theheating and much weaker compensating subsidence hasdeveloped out to x 5 100 km (Fig. 20b). At t 5 2 h(Figs. 20c,d), when heating ceases, the outflow–inflowbranches and upward motion have decoupled from theheated region and are propagating outward as an n1gravity wave roll. These solutions are very similar tothose seen in NPC91 for n1 forcing (their Figs. 3a,b
and 10a,b). Because of the gradual buildup to maximumheating and gradual decline here, horizontal gradientsof u and w are weaker, maxima are weaker, and thehorizontal wavelength of the disturbance is shorter thangiven by the constant-amplitude 2-h pulse forcing inNPC91. However, the resultant n1 meso-b gravity waveroll propagates at the same phase speed in both cases,31.8 m s21.
The effects of adding the n2 mode into the meso-bburst are evident in Figs. 20e,f at t 5 2 h. The n2 verticalstructure is superimposed on the trailing half of the n1gravity wave roll inside x 5 100 km. The overall struc-ture can be compared to the solutions for constant n11 n2 forcing in NPC91 (their Figs. 5a,b) with differ-ences again explained by the time-dependent heatinghere. By t 5 4 h (Figs. 20g,h), 2 h after the thermalforcing ends, both n1 and n2 gravity wave rolls havemoved beyond x 5 100 km, and the n1 roll has com-pletely outrun the n2 roll, which propagates half as fast.
Figures 20i,j show the added effects of the regrowthheating phase at t 5 4 h, well after it has reached itssteady maximum. The inflow and outflow branches andvertical motion structure near the thermally forced re-gion are similar to the constant n1 1 n2 forcing seenin NPC91 (their Figs. 5a,b) and resemble the kinematicstructure of mature MCSs. The leading branches of then1 and n2 gravity wave rolls from the regrowth heatingphase are superimposed on the rolls produced by themeso-b burst.
b. Linearized response to prescribed meso-b cycleand observed similarities
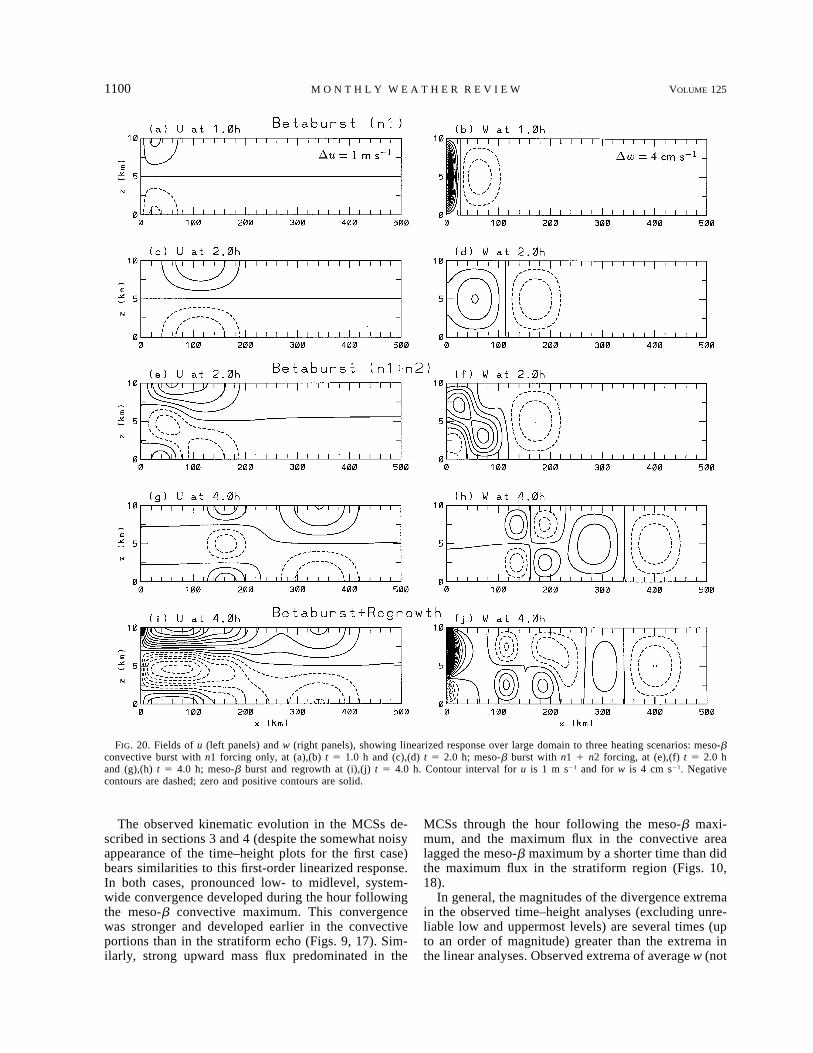
The response in the meso-b-scale region containingthe prescribed heating is now examined, first for themeso-b burst with n1 forcing only. Figures 21a,b showtime–height cross sections of horizontal divergence (de-rived from analytic u fields) and vertical motion, re-spectively, horizontally averaged over x 5 0 to 50 km.Due to symmetry, this represents a 100-km-wide regioncentered on the thermal forcing. Mean upper-level di-vergence, low-level convergence, and upward motiondevelop and then weaken over the 3-h period, with max-ima at 1.45 h, or 27 min after the meso-b convectivemaximum. Averaged over a smaller, 0–20-km width(Figs. 21c,d), average divergence and w more than dou-ble, and the maxima occur only 13-min after the meso-b maximum. This represents strong low-level conver-gence and upward motion in the ‘‘convective’’ region,which maximize as the forcing weakens and the n1 grav-ity wave roll begins to propagate away. In the near-environmental region from 20 to 50 km (Figs. 21e,f),there is initially low-level divergence and downwardcompensating subsidence, associated with the leadingbranch of the gravity wave roll. After the leading branchpropagates beyond that region, low-level convergenceand upward motion develop, with maxima about 45-minafter maximum heating.
1100 VOLUME 125M O N T H L Y W E A T H E R R E V I E W
FIG. 20. Fields of u (left panels) and w (right panels), showing linearized response over large domain to three heating scenarios: meso-bconvective burst with n1 forcing only, at (a),(b) t 5 1.0 h and (c),(d) t 5 2.0 h; meso-b burst with n1 1 n2 forcing, at (e),(f) t 5 2.0 hand (g),(h) t 5 4.0 h; meso-b burst and regrowth at (i),(j) t 5 4.0 h. Contour interval for u is 1 m s21 and for w is 4 cm s21. Negativecontours are dashed; zero and positive contours are solid.
The observed kinematic evolution in the MCSs de-scribed in sections 3 and 4 (despite the somewhat noisyappearance of the time–height plots for the first case)bears similarities to this first-order linearized response.In both cases, pronounced low- to midlevel, system-wide convergence developed during the hour followingthe meso-b convective maximum. This convergencewas stronger and developed earlier in the convectiveportions than in the stratiform echo (Figs. 9, 17). Sim-ilarly, strong upward mass flux predominated in the
MCSs through the hour following the meso-b maxi-mum, and the maximum flux in the convective arealagged the meso-b maximum by a shorter time than didthe maximum flux in the stratiform region (Figs. 10,18).
In general, the magnitudes of the divergence extremain the observed time–height analyses (excluding unre-liable low and uppermost levels) are several times (upto an order of magnitude) greater than the extrema inthe linear analyses. Observed extrema of average w (not
JUNE 1997 1101M C A N E L L Y E T A L .
FIG. 21. Time–height cross sections of average horizontal divergence D (left panels) and w (right panels) over three averaging widths,showing evolving response to meso-b convective burst with n1 forcing. Average response over (a),(b) 0–50-km ‘‘total’’ region, (c),(d) 0–20-km ‘‘convective’’ region, and (e),(f) 20–50-km near-environmental region. Contour interval for D is 1 3 1025 s21 and for w is 2 cm s21.Negative contours are dashed; zero and positive contours are solid.
shown, but their patterns are similar to the mass fluxanalyses) are greater than those in the linear solutionsby similar factors. Several reasons could account forthese differences. First, while NPC91 equated their net(2D integrated) n1 heating to a reasonable convectiverain rate of 30 mm h21 over a 20-km width,1 that neglectscondensate storage aloft, or excess net condensationover precipitation. Through an MCS’s development, thestorage rate can equal or exceed precipitation rate; toaccount for both the same rain rate and storage rate, Qm0
should be doubled or more, which would increase thelinearized response proportionately. Second, the obser-vations are restricted to echo and are thus biased towardmore dynamic regions; the inclusion of intervening andadjacent no-echo regions in the horizontal averageswould likely reduce the observed magnitudes. Third,whereas the model includes only the linearized responseto prescribed heating, the observations include the non-linear, nonhydrostatic dynamics (i.e., deep convection)that generate much of the diabatic heating, in addition
1 An assumed length of 50 km for the 2D heating gives R 5 30mm h21 over 1000 km2, and V 5 3 3 1010 kg h21. These values arecomparable to the maximum observed convective area and VC in thefirst MCS (Figs. 8b, 6) and up to a factor of 2 smaller than those inthe second MCS (Figs. 16b, 14).
to some approximation of the linearized response to thatheating. Despite such uncertainties, similarities in theobserved and model evolution suggest that the obser-vational analyses reflect this linearized response.
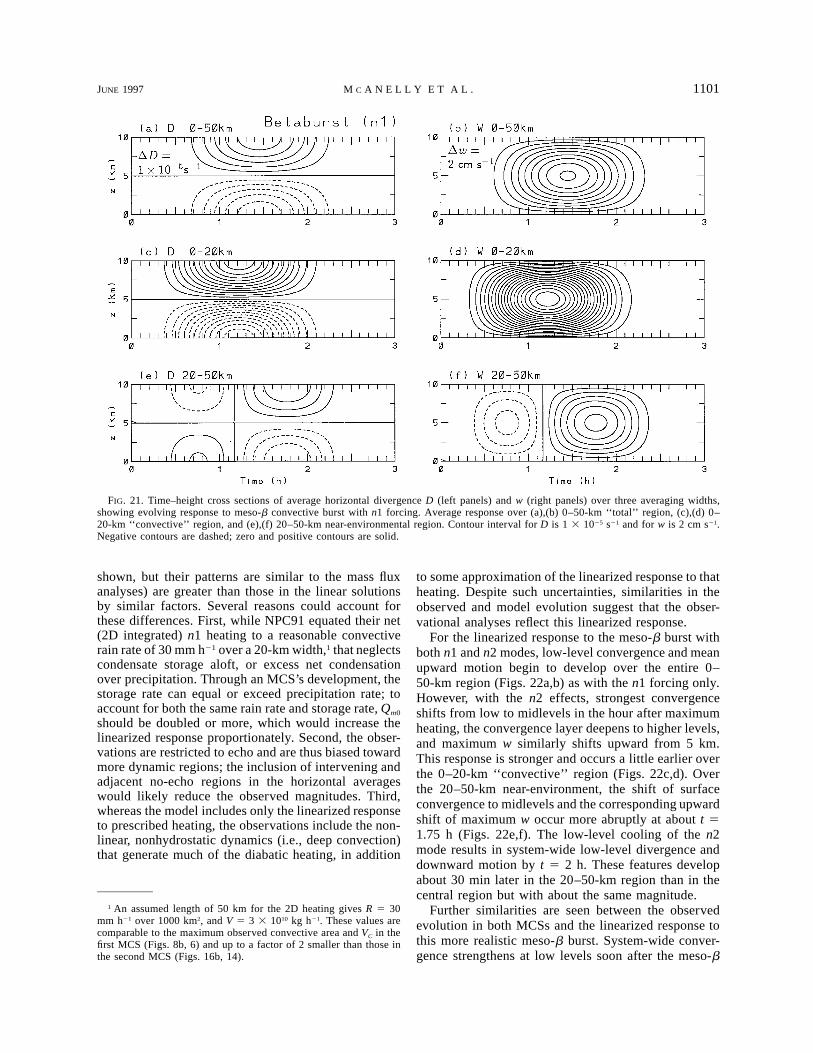
For the linearized response to the meso-b burst withboth n1 and n2 modes, low-level convergence and meanupward motion begin to develop over the entire 0–50-km region (Figs. 22a,b) as with the n1 forcing only.However, with the n2 effects, strongest convergenceshifts from low to midlevels in the hour after maximumheating, the convergence layer deepens to higher levels,and maximum w similarly shifts upward from 5 km.This response is stronger and occurs a little earlier overthe 0–20-km ‘‘convective’’ region (Figs. 22c,d). Overthe 20–50-km near-environment, the shift of surfaceconvergence to midlevels and the corresponding upwardshift of maximum w occur more abruptly at about t 51.75 h (Figs. 22e,f). The low-level cooling of the n2mode results in system-wide low-level divergence anddownward motion by t 5 2 h. These features developabout 30 min later in the 20–50-km region than in thecentral region but with about the same magnitude.
Further similarities are seen between the observedevolution in both MCSs and the linearized response tothis more realistic meso-b burst. System-wide conver-gence strengthens at low levels soon after the meso-b
1102 VOLUME 125M O N T H L Y W E A T H E R R E V I E W
FIG. 22. Same as in Fig. 21 except showing response to meso-b convective burst with n1 1 n2 forcing. Contour interval for D is 2 31025 s21 and for w is 4 cm s21.
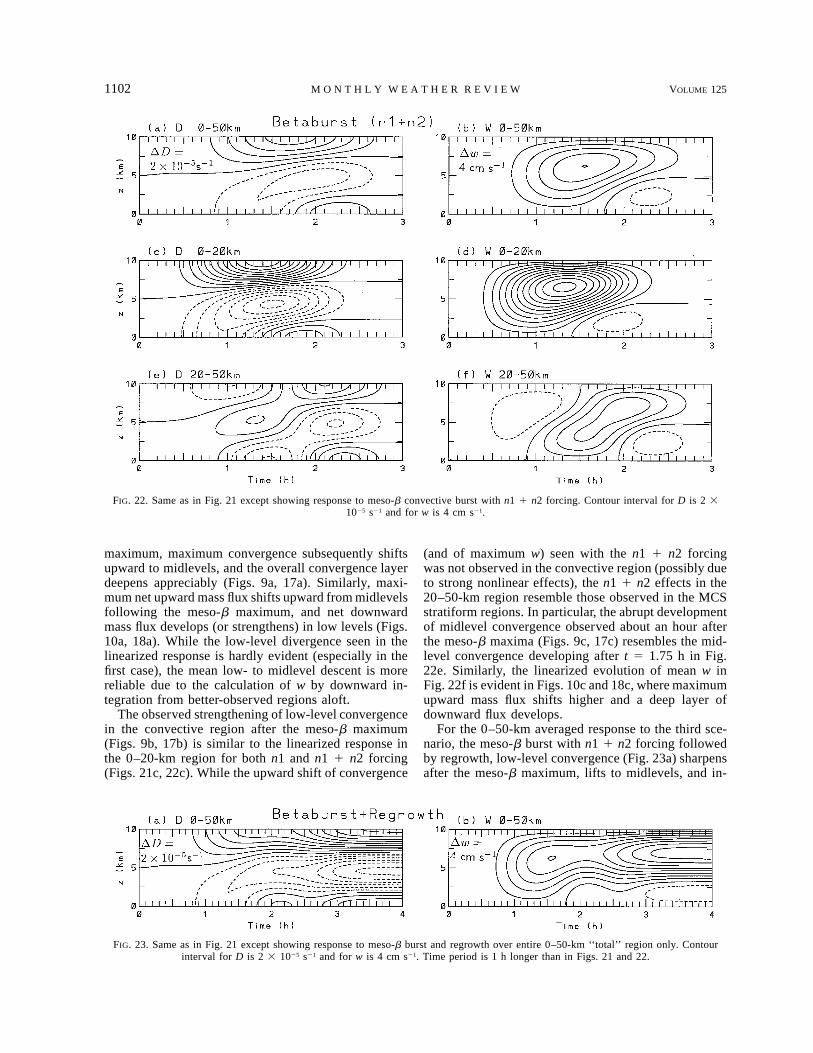
FIG. 23. Same as in Fig. 21 except showing response to meso-b burst and regrowth over entire 0–50-km ‘‘total’’ region only. Contourinterval for D is 2 3 1025 s21 and for w is 4 cm s21. Time period is 1 h longer than in Figs. 21 and 22.
maximum, maximum convergence subsequently shiftsupward to midlevels, and the overall convergence layerdeepens appreciably (Figs. 9a, 17a). Similarly, maxi-mum net upward mass flux shifts upward from midlevelsfollowing the meso-b maximum, and net downwardmass flux develops (or strengthens) in low levels (Figs.10a, 18a). While the low-level divergence seen in thelinearized response is hardly evident (especially in thefirst case), the mean low- to midlevel descent is morereliable due to the calculation of w by downward in-tegration from better-observed regions aloft.
The observed strengthening of low-level convergencein the convective region after the meso-b maximum(Figs. 9b, 17b) is similar to the linearized response inthe 0–20-km region for both n1 and n1 1 n2 forcing(Figs. 21c, 22c). While the upward shift of convergence
(and of maximum w) seen with the n1 1 n2 forcingwas not observed in the convective region (possibly dueto strong nonlinear effects), the n1 1 n2 effects in the20–50-km region resemble those observed in the MCSstratiform regions. In particular, the abrupt developmentof midlevel convergence observed about an hour afterthe meso-b maxima (Figs. 9c, 17c) resembles the mid-level convergence developing after t 5 1.75 h in Fig.22e. Similarly, the linearized evolution of mean w inFig. 22f is evident in Figs. 10c and 18c, where maximumupward mass flux shifts higher and a deep layer ofdownward flux develops.
For the 0–50-km averaged response to the third sce-nario, the meso-b burst with n1 1 n2 forcing followedby regrowth, low-level convergence (Fig. 23a) sharpensafter the meso-b maximum, lifts to midlevels, and in-
JUNE 1997 1103M C A N E L L Y E T A L .
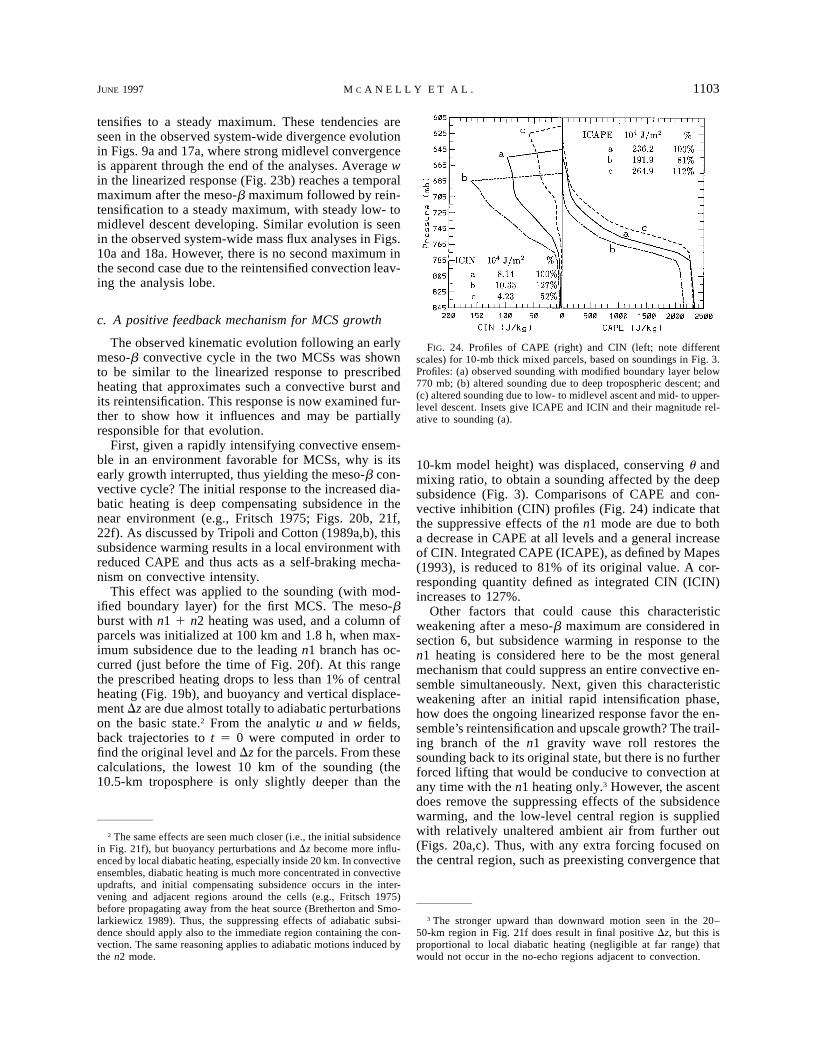
FIG. 24. Profiles of CAPE (right) and CIN (left; note differentscales) for 10-mb thick mixed parcels, based on soundings in Fig. 3.Profiles: (a) observed sounding with modified boundary layer below770 mb; (b) altered sounding due to deep tropospheric descent; and(c) altered sounding due to low- to midlevel ascent and mid- to upper-level descent. Insets give ICAPE and ICIN and their magnitude rel-ative to sounding (a).
tensifies to a steady maximum. These tendencies areseen in the observed system-wide divergence evolutionin Figs. 9a and 17a, where strong midlevel convergenceis apparent through the end of the analyses. Average win the linearized response (Fig. 23b) reaches a temporalmaximum after the meso-b maximum followed by rein-tensification to a steady maximum, with steady low- tomidlevel descent developing. Similar evolution is seenin the observed system-wide mass flux analyses in Figs.10a and 18a. However, there is no second maximum inthe second case due to the reintensified convection leav-ing the analysis lobe.
c. A positive feedback mechanism for MCS growth
The observed kinematic evolution following an earlymeso-b convective cycle in the two MCSs was shownto be similar to the linearized response to prescribedheating that approximates such a convective burst andits reintensification. This response is now examined fur-ther to show how it influences and may be partiallyresponsible for that evolution.
First, given a rapidly intensifying convective ensem-ble in an environment favorable for MCSs, why is itsearly growth interrupted, thus yielding the meso-b con-vective cycle? The initial response to the increased dia-batic heating is deep compensating subsidence in thenear environment (e.g., Fritsch 1975; Figs. 20b, 21f,22f). As discussed by Tripoli and Cotton (1989a,b), thissubsidence warming results in a local environment withreduced CAPE and thus acts as a self-braking mecha-nism on convective intensity.
This effect was applied to the sounding (with mod-ified boundary layer) for the first MCS. The meso-bburst with n1 1 n2 heating was used, and a column ofparcels was initialized at 100 km and 1.8 h, when max-imum subsidence due to the leading n1 branch has oc-curred (just before the time of Fig. 20f). At this rangethe prescribed heating drops to less than 1% of centralheating (Fig. 19b), and buoyancy and vertical displace-ment Dz are due almost totally to adiabatic perturbationson the basic state.2 From the analytic u and w fields,back trajectories to t 5 0 were computed in order tofind the original level and Dz for the parcels. From thesecalculations, the lowest 10 km of the sounding (the10.5-km troposphere is only slightly deeper than the
2 The same effects are seen much closer (i.e., the initial subsidencein Fig. 21f), but buoyancy perturbations and Dz become more influ-enced by local diabatic heating, especially inside 20 km. In convectiveensembles, diabatic heating is much more concentrated in convectiveupdrafts, and initial compensating subsidence occurs in the inter-vening and adjacent regions around the cells (e.g., Fritsch 1975)before propagating away from the heat source (Bretherton and Smo-larkiewicz 1989). Thus, the suppressing effects of adiabatic subsi-dence should apply also to the immediate region containing the con-vection. The same reasoning applies to adiabatic motions induced bythe n2 mode.
10-km model height) was displaced, conserving u andmixing ratio, to obtain a sounding affected by the deepsubsidence (Fig. 3). Comparisons of CAPE and con-vective inhibition (CIN) profiles (Fig. 24) indicate thatthe suppressive effects of the n1 mode are due to botha decrease in CAPE at all levels and a general increaseof CIN. Integrated CAPE (ICAPE), as defined by Mapes(1993), is reduced to 81% of its original value. A cor-responding quantity defined as integrated CIN (ICIN)increases to 127%.
Other factors that could cause this characteristicweakening after a meso-b maximum are considered insection 6, but subsidence warming in response to then1 heating is considered here to be the most generalmechanism that could suppress an entire convective en-semble simultaneously. Next, given this characteristicweakening after an initial rapid intensification phase,how does the ongoing linearized response favor the en-semble’s reintensification and upscale growth? The trail-ing branch of the n1 gravity wave roll restores thesounding back to its original state, but there is no furtherforced lifting that would be conducive to convection atany time with the n1 heating only.3 However, the ascentdoes remove the suppressing effects of the subsidencewarming, and the low-level central region is suppliedwith relatively unaltered ambient air from further out(Figs. 20a,c). Thus, with any extra forcing focused onthe central region, such as preexisting convergence that
3 The stronger upward than downward motion seen in the 20–50-km region in Fig. 21f does result in final positive Dz, but this isproportional to local diabatic heating (negligible at far range) thatwould not occur in the no-echo regions adjacent to convection.
1104 VOLUME 125M O N T H L Y W E A T H E R R E V I E W
might help initiate a convective ensemble in the firstplace, the ensemble could reintensify.
The response to the meso-b burst with n1 and n2modes is more interesting in that it provides that extraforcing. There is a transient state where low-level par-cels are forced above their equilibrium level (becomingnegatively buoyant) before descending to their final lev-el. Maximum displacement is reached after passage ofthe leading, low-level upward branch of the n2 gravitywave roll, that is, at about x 5 40 km at 2 h in Fig. 20fand at 160 km at 4 h in Fig. 20h. This upward branchis ‘‘compensating ascent’’ for the n2 mode’s thermallyforced, low-level descent in the central region. The tran-sient, negative buoyancy perturbation is then restoredby the trailing low-level descent of the n2 roll.
Mapes (1993) identified important consequences ofsuch boundary layer ascent resulting from heating sce-narios similar to those considered by NPC91 (i.e., con-stant heating and ‘‘pulse forcing’’). The ascent deepensthe boundary layer, resulting in an increase of ICAPE.Also, the ascent destabilizes the lower atmosphere andallows convection to be triggered more easily. Althougha contra-acting transient descent aloft stabilizes upperlevels and reduces ICAPE, Mapes described how itsnegative influence on convection is marginal comparedto the positive influences below. He argued that thesethermally forced effects by an MCS favor additionaldeep convection in its mesoscale vicinity and thus helpexplain the gregarious nature of tropical convection.
The same reasoning is invoked here, on space andtimescales closer to the parent ensemble than consideredby Mapes (1993), to explain how these effects favor theupscale evolution of the parent convection into an or-ganized MCS in the first place. The observed soundingswere modified based on back trajectories from a columnat 100 km and at 2.9 h, when maximum low-level liftinghas occurred due to both the trailing n1 upward branchand the leading low-level n2 branch (between the timesof Figs. 20f,h). Extrema of Dz reach about 1(2) 270m at 2.5 (7.5) km AGL. The altered soundings (Figs.3, 11) show the features described by Mapes: a deepenedboundary layer, low-level destabilization, and stabili-zation aloft. Profiles of CAPE and CIN (Fig. 24) confirmthat the favorable effects in lower levels outweigh un-favorable effects aloft: CAPE is increased above thewell-mixed layer and CIN decreases. ICAPE increasesto 112% of its original value, and ICIN decreases to52%. The change from the earlier suppressed state iseven greater.
In the tropical atmosphere considered by Mapes(1993), with its lower level of free convection and lessCIN, forcing of this magnitude might directly triggerfurther convection. In midlatitudes too, however, theforcing would certainly precondition the atmosphere forfurther convection (e.g., Crook and Moncrieff 1988),even if additional lifting by other mechansisms (e.g.,cold pool outflows) was generally required for its ac-tivation.
This transient effect occurs earliest close to the centralregion and propagates outward with the n2 phase speedbut with slightly less magnitude than illustrated above.This is because a low-level parcel, say at 40 km in Fig.20f, has achieved maximum ascent due to the leadingn2 branch, but the column has not yet benefited fromthe entire ascending n1 branch (cf. with Fig. 20d). Thus,after an ensemble undergoes a strong meso-b-scale con-vective burst with both n1- and n2-like thermal forcing,destabilized low-level air with increased ICAPE is madeavailable to the ensemble for convective reintensifica-tion. This response maximizes at about t 5 1.5 h at x5 20 km for air drawn into the 0–20-km convectiveregion and at about 2.0 h for the 20–50-km surroundingenvironment (Fig. 22f) or about 0.5 and 1.0 h, respec-tively, after the meso-b convective maximum. This pro-vides a positive feedback mechanism for convectivereintensification that is consistent with the generalizedtimescale of the observed meso-b cycle and regrowthin Fig. 1. This transient effect is qualitatively similar tothe abruptly halted heating scenario of Mapes (1993,his Fig. 6), where the mechanism is illustrated at a latertime and farther distance from the source (i.e., after then1 gravity wave roll outruns the n2 roll, as in Figs.20g,h).
As in Mapes (1993), this response to idealized heatingwas confirmed with simulations using a fully compress-ible, nonhydrostatic numerical model. Two- and three-dimensional (3D) versions of the Regional AtmosphericModelling System (RAMS, described in NPC91) wereused, initialized horizontally homogeneous with a con-vectively unstable troposphere and a deep stratosphericlayer. A single thunderstorm, triggered by a warm bub-ble, was simulated. The response in the near environ-ment showed outward-propagating zones of low- tomidlevel convergence and upward displacements. Max-imum Dz at a range of 75 km was approximately 200–300 m in 2D and 50–75 m in 3D. Additional thermalforcing by an ensemble of nearly in-phase cells couldeasily induce lifting several times these values.
Consider now the third heating scenario, the meso-bcycle followed by regrowth, where the regrowth phasein the original source region is a plausible consequenceof a positive feedback forced by the meso-b burst itself.Instead of a descending low-level n2 branch restoringthe parcels to their near-original level (e.g., at ;100 kmin Fig. 20h), an additional wave of low-level lifting isinduced by the regrowth heating phase (see combinedn2 curve in Fig. 19d and low-level ascent centers inFig. 20j near x 5 190 and 120 km). Since the regrowthheating reaches a steady maximum, this effect is similarto the constant heating scenario of Mapes (1993, hisFig. 3). Like the first wave of low-level ascent, thissecond wave also propagates at the n2 phase speed andproduces a quasi-steady level of maximum forced Dz(up to 360 m). This occurs by 3 h at x 5 40 km andspreads to x 5 100 km by 4 h. Thus, if the weakenedensemble does reintensify after the meso-b convective
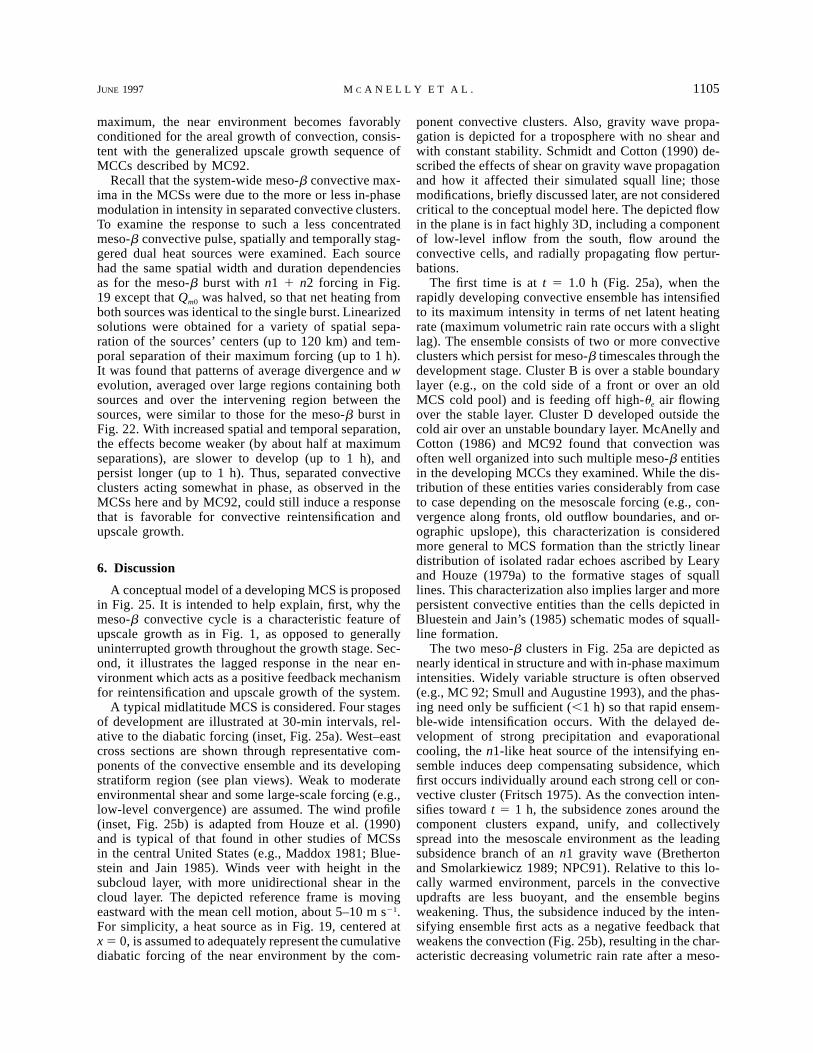
JUNE 1997 1105M C A N E L L Y E T A L .
maximum, the near environment becomes favorablyconditioned for the areal growth of convection, consis-tent with the generalized upscale growth sequence ofMCCs described by MC92.
Recall that the system-wide meso-b convective max-ima in the MCSs were due to the more or less in-phasemodulation in intensity in separated convective clusters.To examine the response to such a less concentratedmeso-b convective pulse, spatially and temporally stag-gered dual heat sources were examined. Each sourcehad the same spatial width and duration dependenciesas for the meso-b burst with n1 1 n2 forcing in Fig.19 except that Qm0 was halved, so that net heating fromboth sources was identical to the single burst. Linearizedsolutions were obtained for a variety of spatial sepa-ration of the sources’ centers (up to 120 km) and tem-poral separation of their maximum forcing (up to 1 h).It was found that patterns of average divergence and wevolution, averaged over large regions containing bothsources and over the intervening region between thesources, were similar to those for the meso-b burst inFig. 22. With increased spatial and temporal separation,the effects become weaker (by about half at maximumseparations), are slower to develop (up to 1 h), andpersist longer (up to 1 h). Thus, separated convectiveclusters acting somewhat in phase, as observed in theMCSs here and by MC92, could still induce a responsethat is favorable for convective reintensification andupscale growth.
6. Discussion
A conceptual model of a developing MCS is proposedin Fig. 25. It is intended to help explain, first, why themeso-b convective cycle is a characteristic feature ofupscale growth as in Fig. 1, as opposed to generallyuninterrupted growth throughout the growth stage. Sec-ond, it illustrates the lagged response in the near en-vironment which acts as a positive feedback mechanismfor reintensification and upscale growth of the system.
A typical midlatitude MCS is considered. Four stagesof development are illustrated at 30-min intervals, rel-ative to the diabatic forcing (inset, Fig. 25a). West–eastcross sections are shown through representative com-ponents of the convective ensemble and its developingstratiform region (see plan views). Weak to moderateenvironmental shear and some large-scale forcing (e.g.,low-level convergence) are assumed. The wind profile(inset, Fig. 25b) is adapted from Houze et al. (1990)and is typical of that found in other studies of MCSsin the central United States (e.g., Maddox 1981; Blue-stein and Jain 1985). Winds veer with height in thesubcloud layer, with more unidirectional shear in thecloud layer. The depicted reference frame is movingeastward with the mean cell motion, about 5–10 m s21.For simplicity, a heat source as in Fig. 19, centered atx 5 0, is assumed to adequately represent the cumulativediabatic forcing of the near environment by the com-
ponent convective clusters. Also, gravity wave propa-gation is depicted for a troposphere with no shear andwith constant stability. Schmidt and Cotton (1990) de-scribed the effects of shear on gravity wave propagationand how it affected their simulated squall line; thosemodifications, briefly discussed later, are not consideredcritical to the conceptual model here. The depicted flowin the plane is in fact highly 3D, including a componentof low-level inflow from the south, flow around theconvective cells, and radially propagating flow pertur-bations.
The first time is at t 5 1.0 h (Fig. 25a), when therapidly developing convective ensemble has intensifiedto its maximum intensity in terms of net latent heatingrate (maximum volumetric rain rate occurs with a slightlag). The ensemble consists of two or more convectiveclusters which persist for meso-b timescales through thedevelopment stage. Cluster B is over a stable boundarylayer (e.g., on the cold side of a front or over an oldMCS cold pool) and is feeding off high-ue air flowingover the stable layer. Cluster D developed outside thecold air over an unstable boundary layer. McAnelly andCotton (1986) and MC92 found that convection wasoften well organized into such multiple meso-b entitiesin the developing MCCs they examined. While the dis-tribution of these entities varies considerably from caseto case depending on the mesoscale forcing (e.g., con-vergence along fronts, old outflow boundaries, and or-ographic upslope), this characterization is consideredmore general to MCS formation than the strictly lineardistribution of isolated radar echoes ascribed by Learyand Houze (1979a) to the formative stages of squalllines. This characterization also implies larger and morepersistent convective entities than the cells depicted inBluestein and Jain’s (1985) schematic modes of squall-line formation.
The two meso-b clusters in Fig. 25a are depicted asnearly identical in structure and with in-phase maximumintensities. Widely variable structure is often observed(e.g., MC 92; Smull and Augustine 1993), and the phas-ing need only be sufficient (,1 h) so that rapid ensem-ble-wide intensification occurs. With the delayed de-velopment of strong precipitation and evaporationalcooling, the n1-like heat source of the intensifying en-semble induces deep compensating subsidence, whichfirst occurs individually around each strong cell or con-vective cluster (Fritsch 1975). As the convection inten-sifies toward t 5 1 h, the subsidence zones around thecomponent clusters expand, unify, and collectivelyspread into the mesoscale environment as the leadingsubsidence branch of an n1 gravity wave (Brethertonand Smolarkiewicz 1989; NPC91). Relative to this lo-cally warmed environment, parcels in the convectiveupdrafts are less buoyant, and the ensemble beginsweakening. Thus, the subsidence induced by the inten-sifying ensemble first acts as a negative feedback thatweakens the convection (Fig. 25b), resulting in the char-acteristic decreasing volumetric rain rate after a meso-
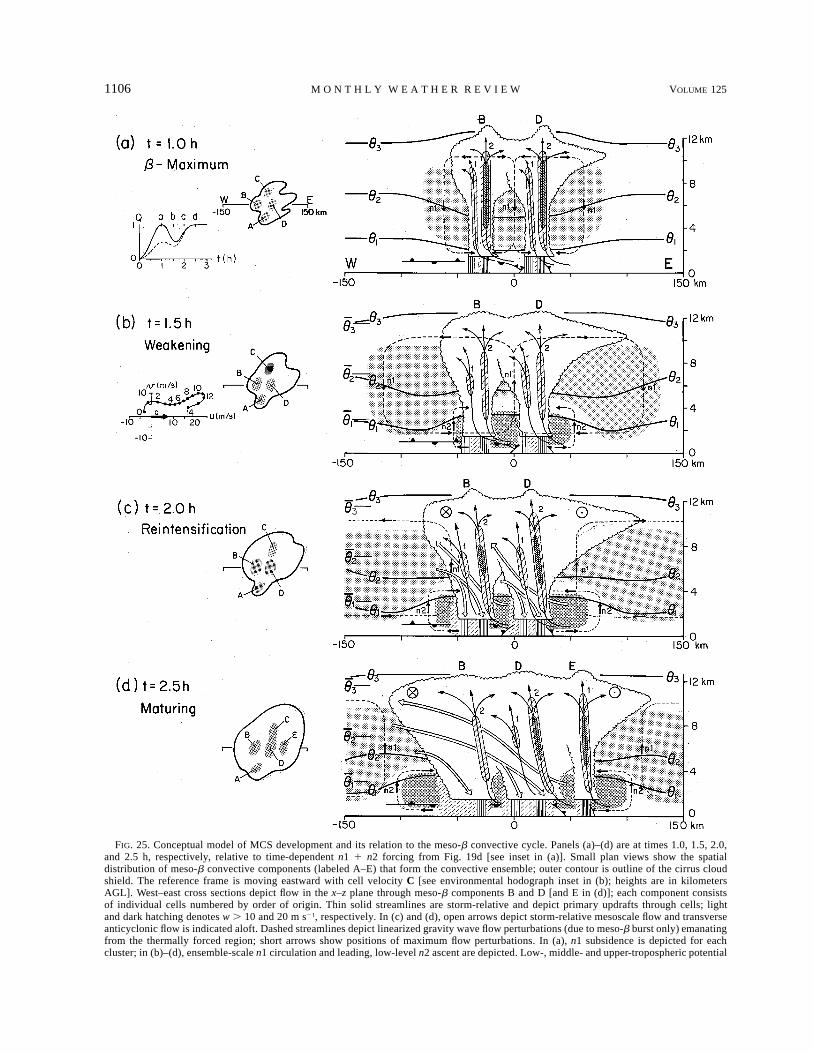
1106 VOLUME 125M O N T H L Y W E A T H E R R E V I E W
FIG. 25. Conceptual model of MCS development and its relation to the meso-b convective cycle. Panels (a)–(d) are at times 1.0, 1.5, 2.0,and 2.5 h, respectively, relative to time-dependent n1 1 n2 forcing from Fig. 19d [see inset in (a)]. Small plan views show the spatialdistribution of meso-b convective components (labeled A–E) that form the convective ensemble; outer contour is outline of the cirrus cloudshield. The reference frame is moving eastward with cell velocity C [see environmental hodograph inset in (b); heights are in kilometersAGL]. West–east cross sections depict flow in the x–z plane through meso-b components B and D [and E in (d)]; each component consistsof individual cells numbered by order of origin. Thin solid streamlines are storm-relative and depict primary updrafts through cells; lightand dark hatching denotes w . 10 and 20 m s21, respectively. In (c) and (d), open arrows depict storm-relative mesoscale flow and transverseanticyclonic flow is indicated aloft. Dashed streamlines depict linearized gravity wave flow perturbations (due to meso-b burst only) emanatingfrom the thermally forced region; short arrows show positions of maximum flow perturbations. In (a), n1 subsidence is depicted for eachcluster; in (b)–(d), ensemble-scale n1 circulation and leading, low-level n2 ascent are depicted. Low-, middle- and upper-tropospheric potential
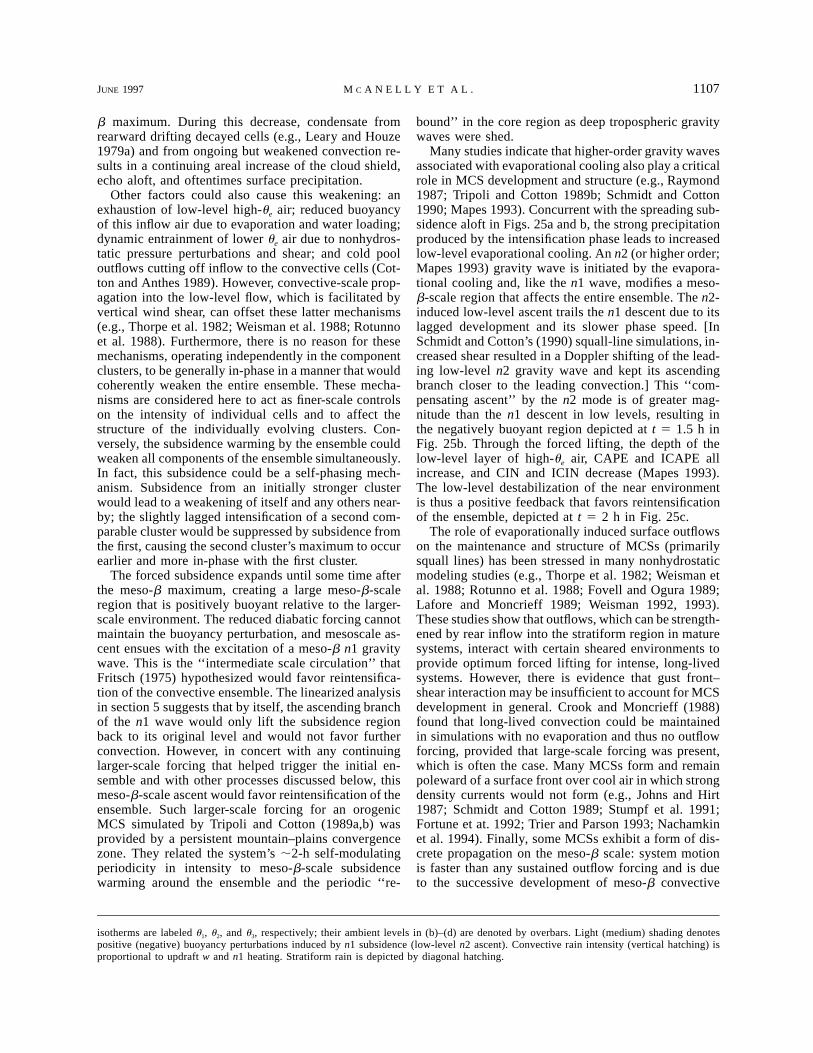
JUNE 1997 1107M C A N E L L Y E T A L .
isotherms are labeled u1, u2, and u3, respectively; their ambient levels in (b)–(d) are denoted by overbars. Light (medium) shading denotespositive (negative) buoyancy perturbations induced by n1 subsidence (low-level n2 ascent). Convective rain intensity (vertical hatching) isproportional to updraft w and n1 heating. Stratiform rain is depicted by diagonal hatching.
b maximum. During this decrease, condensate fromrearward drifting decayed cells (e.g., Leary and Houze1979a) and from ongoing but weakened convection re-sults in a continuing areal increase of the cloud shield,echo aloft, and oftentimes surface precipitation.
Other factors could also cause this weakening: anexhaustion of low-level high-ue air; reduced buoyancyof this inflow air due to evaporation and water loading;dynamic entrainment of lower ue air due to nonhydros-tatic pressure perturbations and shear; and cold pooloutflows cutting off inflow to the convective cells (Cot-ton and Anthes 1989). However, convective-scale prop-agation into the low-level flow, which is facilitated byvertical wind shear, can offset these latter mechanisms(e.g., Thorpe et al. 1982; Weisman et al. 1988; Rotunnoet al. 1988). Furthermore, there is no reason for thesemechanisms, operating independently in the componentclusters, to be generally in-phase in a manner that wouldcoherently weaken the entire ensemble. These mecha-nisms are considered here to act as finer-scale controlson the intensity of individual cells and to affect thestructure of the individually evolving clusters. Con-versely, the subsidence warming by the ensemble couldweaken all components of the ensemble simultaneously.In fact, this subsidence could be a self-phasing mech-anism. Subsidence from an initially stronger clusterwould lead to a weakening of itself and any others near-by; the slightly lagged intensification of a second com-parable cluster would be suppressed by subsidence fromthe first, causing the second cluster’s maximum to occurearlier and more in-phase with the first cluster.
The forced subsidence expands until some time afterthe meso-b maximum, creating a large meso-b-scaleregion that is positively buoyant relative to the larger-scale environment. The reduced diabatic forcing cannotmaintain the buoyancy perturbation, and mesoscale as-cent ensues with the excitation of a meso-b n1 gravitywave. This is the ‘‘intermediate scale circulation’’ thatFritsch (1975) hypothesized would favor reintensifica-tion of the convective ensemble. The linearized analysisin section 5 suggests that by itself, the ascending branchof the n1 wave would only lift the subsidence regionback to its original level and would not favor furtherconvection. However, in concert with any continuinglarger-scale forcing that helped trigger the initial en-semble and with other processes discussed below, thismeso-b-scale ascent would favor reintensification of theensemble. Such larger-scale forcing for an orogenicMCS simulated by Tripoli and Cotton (1989a,b) wasprovided by a persistent mountain–plains convergencezone. They related the system’s ;2-h self-modulatingperiodicity in intensity to meso-b-scale subsidencewarming around the ensemble and the periodic ‘‘re-
bound’’ in the core region as deep tropospheric gravitywaves were shed.
Many studies indicate that higher-order gravity wavesassociated with evaporational cooling also play a criticalrole in MCS development and structure (e.g., Raymond1987; Tripoli and Cotton 1989b; Schmidt and Cotton1990; Mapes 1993). Concurrent with the spreading sub-sidence aloft in Figs. 25a and b, the strong precipitationproduced by the intensification phase leads to increasedlow-level evaporational cooling. An n2 (or higher order;Mapes 1993) gravity wave is initiated by the evapora-tional cooling and, like the n1 wave, modifies a meso-b-scale region that affects the entire ensemble. The n2-induced low-level ascent trails the n1 descent due to itslagged development and its slower phase speed. [InSchmidt and Cotton’s (1990) squall-line simulations, in-creased shear resulted in a Doppler shifting of the lead-ing low-level n2 gravity wave and kept its ascendingbranch closer to the leading convection.] This ‘‘com-pensating ascent’’ by the n2 mode is of greater mag-nitude than the n1 descent in low levels, resulting inthe negatively buoyant region depicted at t 5 1.5 h inFig. 25b. Through the forced lifting, the depth of thelow-level layer of high-ue air, CAPE and ICAPE allincrease, and CIN and ICIN decrease (Mapes 1993).The low-level destabilization of the near environmentis thus a positive feedback that favors reintensificationof the ensemble, depicted at t 5 2 h in Fig. 25c.
The role of evaporationally induced surface outflowson the maintenance and structure of MCSs (primarilysquall lines) has been stressed in many nonhydrostaticmodeling studies (e.g., Thorpe et al. 1982; Weisman etal. 1988; Rotunno et al. 1988; Fovell and Ogura 1989;Lafore and Moncrieff 1989; Weisman 1992, 1993).These studies show that outflows, which can be strength-ened by rear inflow into the stratiform region in maturesystems, interact with certain sheared environments toprovide optimum forced lifting for intense, long-livedsystems. However, there is evidence that gust front–shear interaction may be insufficient to account for MCSdevelopment in general. Crook and Moncrieff (1988)found that long-lived convection could be maintainedin simulations with no evaporation and thus no outflowforcing, provided that large-scale forcing was present,which is often the case. Many MCSs form and remainpoleward of a surface front over cool air in which strongdensity currents would not form (e.g., Johns and Hirt1987; Schmidt and Cotton 1989; Stumpf et al. 1991;Fortune et at. 1992; Trier and Parson 1993; Nachamkinet al. 1994). Finally, some MCSs exhibit a form of dis-crete propagation on the meso-b scale: system motionis faster than any sustained outflow forcing and is dueto the successive development of meso-b convective
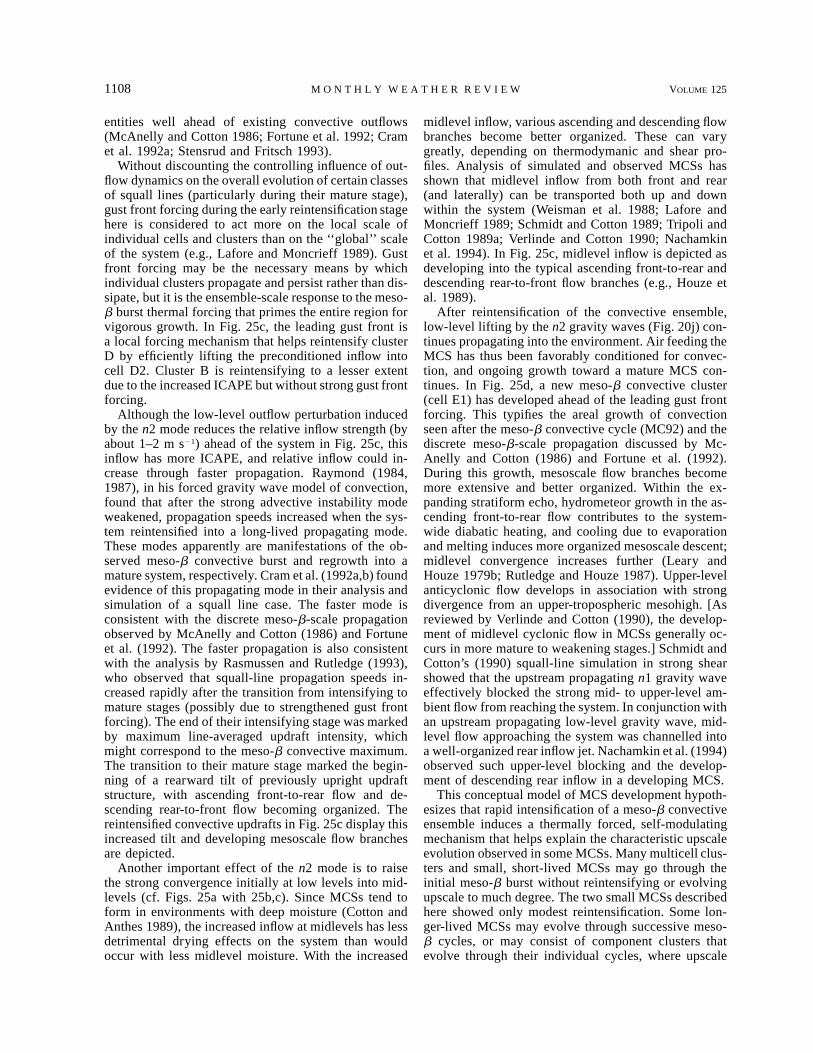
1108 VOLUME 125M O N T H L Y W E A T H E R R E V I E W
entities well ahead of existing convective outflows(McAnelly and Cotton 1986; Fortune et al. 1992; Cramet al. 1992a; Stensrud and Fritsch 1993).
Without discounting the controlling influence of out-flow dynamics on the overall evolution of certain classesof squall lines (particularly during their mature stage),gust front forcing during the early reintensification stagehere is considered to act more on the local scale ofindividual cells and clusters than on the ‘‘global’’ scaleof the system (e.g., Lafore and Moncrieff 1989). Gustfront forcing may be the necessary means by whichindividual clusters propagate and persist rather than dis-sipate, but it is the ensemble-scale response to the meso-b burst thermal forcing that primes the entire region forvigorous growth. In Fig. 25c, the leading gust front isa local forcing mechanism that helps reintensify clusterD by efficiently lifting the preconditioned inflow intocell D2. Cluster B is reintensifying to a lesser extentdue to the increased ICAPE but without strong gust frontforcing.
Although the low-level outflow perturbation inducedby the n2 mode reduces the relative inflow strength (byabout 1–2 m s21) ahead of the system in Fig. 25c, thisinflow has more ICAPE, and relative inflow could in-crease through faster propagation. Raymond (1984,1987), in his forced gravity wave model of convection,found that after the strong advective instability modeweakened, propagation speeds increased when the sys-tem reintensified into a long-lived propagating mode.These modes apparently are manifestations of the ob-served meso-b convective burst and regrowth into amature system, respectively. Cram et al. (1992a,b) foundevidence of this propagating mode in their analysis andsimulation of a squall line case. The faster mode isconsistent with the discrete meso-b-scale propagationobserved by McAnelly and Cotton (1986) and Fortuneet al. (1992). The faster propagation is also consistentwith the analysis by Rasmussen and Rutledge (1993),who observed that squall-line propagation speeds in-creased rapidly after the transition from intensifying tomature stages (possibly due to strengthened gust frontforcing). The end of their intensifying stage was markedby maximum line-averaged updraft intensity, whichmight correspond to the meso-b convective maximum.The transition to their mature stage marked the begin-ning of a rearward tilt of previously upright updraftstructure, with ascending front-to-rear flow and de-scending rear-to-front flow becoming organized. Thereintensified convective updrafts in Fig. 25c display thisincreased tilt and developing mesoscale flow branchesare depicted.
Another important effect of the n2 mode is to raisethe strong convergence initially at low levels into mid-levels (cf. Figs. 25a with 25b,c). Since MCSs tend toform in environments with deep moisture (Cotton andAnthes 1989), the increased inflow at midlevels has lessdetrimental drying effects on the system than wouldoccur with less midlevel moisture. With the increased
midlevel inflow, various ascending and descending flowbranches become better organized. These can varygreatly, depending on thermodymanic and shear pro-files. Analysis of simulated and observed MCSs hasshown that midlevel inflow from both front and rear(and laterally) can be transported both up and downwithin the system (Weisman et al. 1988; Lafore andMoncrieff 1989; Schmidt and Cotton 1989; Tripoli andCotton 1989a; Verlinde and Cotton 1990; Nachamkinet al. 1994). In Fig. 25c, midlevel inflow is depicted asdeveloping into the typical ascending front-to-rear anddescending rear-to-front flow branches (e.g., Houze etal. 1989).
After reintensification of the convective ensemble,low-level lifting by the n2 gravity waves (Fig. 20j) con-tinues propagating into the environment. Air feeding theMCS has thus been favorably conditioned for convec-tion, and ongoing growth toward a mature MCS con-tinues. In Fig. 25d, a new meso-b convective cluster(cell E1) has developed ahead of the leading gust frontforcing. This typifies the areal growth of convectionseen after the meso-b convective cycle (MC92) and thediscrete meso-b-scale propagation discussed by Mc-Anelly and Cotton (1986) and Fortune et al. (1992).During this growth, mesoscale flow branches becomemore extensive and better organized. Within the ex-panding stratiform echo, hydrometeor growth in the as-cending front-to-rear flow contributes to the system-wide diabatic heating, and cooling due to evaporationand melting induces more organized mesoscale descent;midlevel convergence increases further (Leary andHouze 1979b; Rutledge and Houze 1987). Upper-levelanticyclonic flow develops in association with strongdivergence from an upper-tropospheric mesohigh. [Asreviewed by Verlinde and Cotton (1990), the develop-ment of midlevel cyclonic flow in MCSs generally oc-curs in more mature to weakening stages.] Schmidt andCotton’s (1990) squall-line simulation in strong shearshowed that the upstream propagating n1 gravity waveeffectively blocked the strong mid- to upper-level am-bient flow from reaching the system. In conjunction withan upstream propagating low-level gravity wave, mid-level flow approaching the system was channelled intoa well-organized rear inflow jet. Nachamkin et al. (1994)observed such upper-level blocking and the develop-ment of descending rear inflow in a developing MCS.
This conceptual model of MCS development hypoth-esizes that rapid intensification of a meso-b convectiveensemble induces a thermally forced, self-modulatingmechanism that helps explain the characteristic upscaleevolution observed in some MCSs. Many multicell clus-ters and small, short-lived MCSs may go through theinitial meso-b burst without reintensifying or evolvingupscale to much degree. The two small MCSs describedhere showed only modest reintensification. Some lon-ger-lived MCSs may evolve through successive meso-b cycles, or may consist of component clusters thatevolve through their individual cycles, where upscale
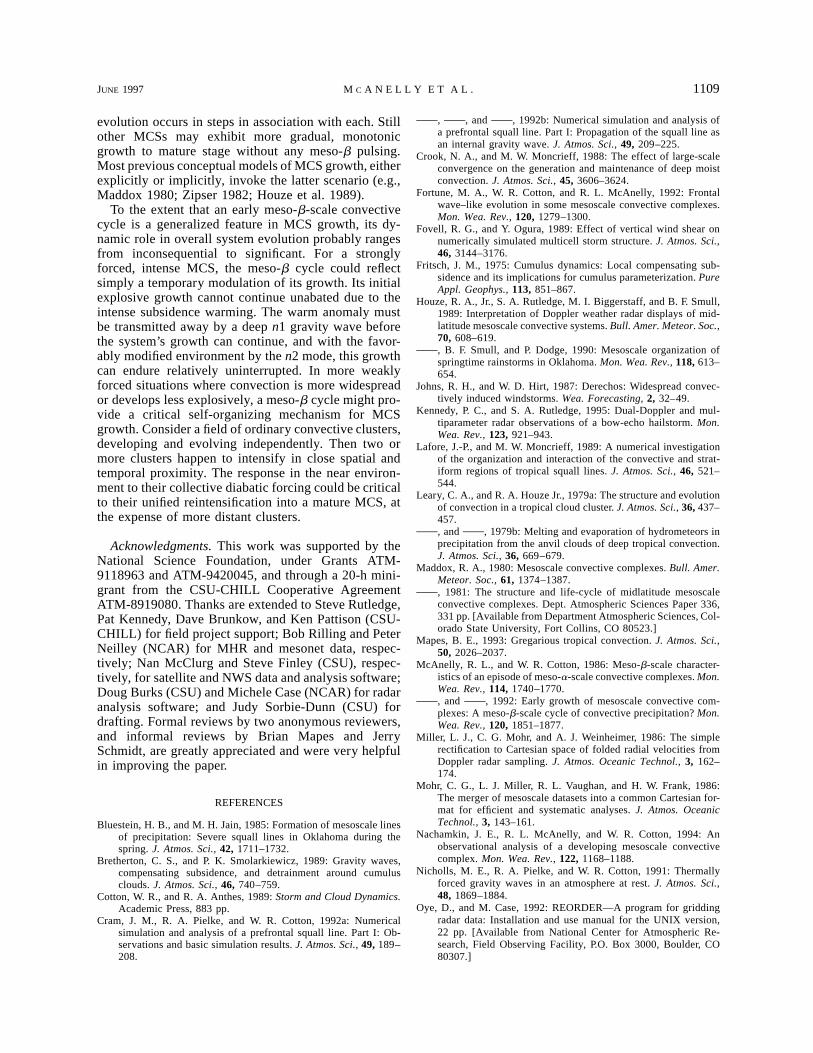
JUNE 1997 1109M C A N E L L Y E T A L .
evolution occurs in steps in association with each. Stillother MCSs may exhibit more gradual, monotonicgrowth to mature stage without any meso-b pulsing.Most previous conceptual models of MCS growth, eitherexplicitly or implicitly, invoke the latter scenario (e.g.,Maddox 1980; Zipser 1982; Houze et al. 1989).
To the extent that an early meso-b-scale convectivecycle is a generalized feature in MCS growth, its dy-namic role in overall system evolution probably rangesfrom inconsequential to significant. For a stronglyforced, intense MCS, the meso-b cycle could reflectsimply a temporary modulation of its growth. Its initialexplosive growth cannot continue unabated due to theintense subsidence warming. The warm anomaly mustbe transmitted away by a deep n1 gravity wave beforethe system’s growth can continue, and with the favor-ably modified environment by the n2 mode, this growthcan endure relatively uninterrupted. In more weaklyforced situations where convection is more widespreador develops less explosively, a meso-b cycle might pro-vide a critical self-organizing mechanism for MCSgrowth. Consider a field of ordinary convective clusters,developing and evolving independently. Then two ormore clusters happen to intensify in close spatial andtemporal proximity. The response in the near environ-ment to their collective diabatic forcing could be criticalto their unified reintensification into a mature MCS, atthe expense of more distant clusters.
Acknowledgments. This work was supported by theNational Science Foundation, under Grants ATM-9118963 and ATM-9420045, and through a 20-h mini-grant from the CSU-CHILL Cooperative AgreementATM-8919080. Thanks are extended to Steve Rutledge,Pat Kennedy, Dave Brunkow, and Ken Pattison (CSU-CHILL) for field project support; Bob Rilling and PeterNeilley (NCAR) for MHR and mesonet data, respec-tively; Nan McClurg and Steve Finley (CSU), respec-tively, for satellite and NWS data and analysis software;Doug Burks (CSU) and Michele Case (NCAR) for radaranalysis software; and Judy Sorbie-Dunn (CSU) fordrafting. Formal reviews by two anonymous reviewers,and informal reviews by Brian Mapes and JerrySchmidt, are greatly appreciated and were very helpfulin improving the paper.
REFERENCES
Bluestein, H. B., and M. H. Jain, 1985: Formation of mesoscale linesof precipitation: Severe squall lines in Oklahoma during thespring. J. Atmos. Sci., 42, 1711–1732.
Bretherton, C. S., and P. K. Smolarkiewicz, 1989: Gravity waves,compensating subsidence, and detrainment around cumulusclouds. J. Atmos. Sci., 46, 740–759.
Cotton, W. R., and R. A. Anthes, 1989: Storm and Cloud Dynamics.Academic Press, 883 pp.
Cram, J. M., R. A. Pielke, and W. R. Cotton, 1992a: Numericalsimulation and analysis of a prefrontal squall line. Part I: Ob-servations and basic simulation results. J. Atmos. Sci., 49, 189–208.
, , and , 1992b: Numerical simulation and analysis ofa prefrontal squall line. Part I: Propagation of the squall line asan internal gravity wave. J. Atmos. Sci., 49, 209–225.
Crook, N. A., and M. W. Moncrieff, 1988: The effect of large-scaleconvergence on the generation and maintenance of deep moistconvection. J. Atmos. Sci., 45, 3606–3624.
Fortune, M. A., W. R. Cotton, and R. L. McAnelly, 1992: Frontalwave–like evolution in some mesoscale convective complexes.Mon. Wea. Rev., 120, 1279–1300.
Fovell, R. G., and Y. Ogura, 1989: Effect of vertical wind shear onnumerically simulated multicell storm structure. J. Atmos. Sci.,46, 3144–3176.
Fritsch, J. M., 1975: Cumulus dynamics: Local compensating sub-sidence and its implications for cumulus parameterization. PureAppl. Geophys., 113, 851–867.
Houze, R. A., Jr., S. A. Rutledge, M. I. Biggerstaff, and B. F. Smull,1989: Interpretation of Doppler weather radar displays of mid-latitude mesoscale convective systems. Bull. Amer. Meteor. Soc.,70, 608–619., B. F. Smull, and P. Dodge, 1990: Mesoscale organization ofspringtime rainstorms in Oklahoma. Mon. Wea. Rev., 118, 613–654.
Johns, R. H., and W. D. Hirt, 1987: Derechos: Widespread convec-tively induced windstorms. Wea. Forecasting, 2, 32–49.
Kennedy, P. C., and S. A. Rutledge, 1995: Dual-Doppler and mul-tiparameter radar observations of a bow-echo hailstorm. Mon.Wea. Rev., 123, 921–943.
Lafore, J.-P., and M. W. Moncrieff, 1989: A numerical investigationof the organization and interaction of the convective and strat-iform regions of tropical squall lines. J. Atmos. Sci., 46, 521–544.
Leary, C. A., and R. A. Houze Jr., 1979a: The structure and evolutionof convection in a tropical cloud cluster. J. Atmos. Sci., 36, 437–457., and , 1979b: Melting and evaporation of hydrometeors inprecipitation from the anvil clouds of deep tropical convection.J. Atmos. Sci., 36, 669–679.
Maddox, R. A., 1980: Mesoscale convective complexes. Bull. Amer.Meteor. Soc., 61, 1374–1387., 1981: The structure and life-cycle of midlatitude mesoscaleconvective complexes. Dept. Atmospheric Sciences Paper 336,331 pp. [Available from Department Atmospheric Sciences, Col-orado State University, Fort Collins, CO 80523.]
Mapes, B. E., 1993: Gregarious tropical convection. J. Atmos. Sci.,50, 2026–2037.
McAnelly, R. L., and W. R. Cotton, 1986: Meso-b-scale character-istics of an episode of meso-a-scale convective complexes. Mon.Wea. Rev., 114, 1740–1770., and , 1992: Early growth of mesoscale convective com-plexes: A meso-b-scale cycle of convective precipitation? Mon.Wea. Rev., 120, 1851–1877.
Miller, L. J., C. G. Mohr, and A. J. Weinheimer, 1986: The simplerectification to Cartesian space of folded radial velocities fromDoppler radar sampling. J. Atmos. Oceanic Technol., 3, 162–174.
Mohr, C. G., L. J. Miller, R. L. Vaughan, and H. W. Frank, 1986:The merger of mesoscale datasets into a common Cartesian for-mat for efficient and systematic analyses. J. Atmos. OceanicTechnol., 3, 143–161.
Nachamkin, J. E., R. L. McAnelly, and W. R. Cotton, 1994: Anobservational analysis of a developing mesoscale convectivecomplex. Mon. Wea. Rev., 122, 1168–1188.
Nicholls, M. E., R. A. Pielke, and W. R. Cotton, 1991: Thermallyforced gravity waves in an atmosphere at rest. J. Atmos. Sci.,48, 1869–1884.
Oye, D., and M. Case, 1992: REORDER—A program for griddingradar data: Installation and use manual for the UNIX version,22 pp. [Available from National Center for Atmospheric Re-search, Field Observing Facility, P.O. Box 3000, Boulder, CO80307.]
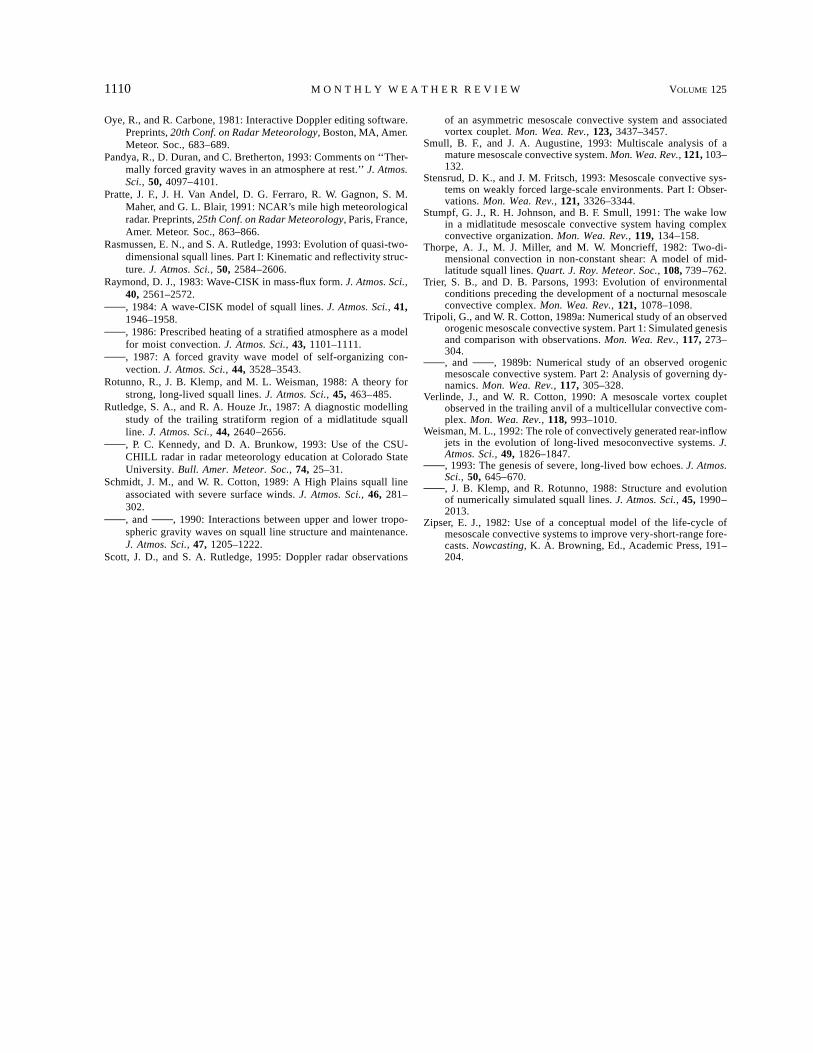
1110 VOLUME 125M O N T H L Y W E A T H E R R E V I E W
Oye, R., and R. Carbone, 1981: Interactive Doppler editing software.Preprints, 20th Conf. on Radar Meteorology, Boston, MA, Amer.Meteor. Soc., 683–689.
Pandya, R., D. Duran, and C. Bretherton, 1993: Comments on ‘‘Ther-mally forced gravity waves in an atmosphere at rest.’’ J. Atmos.Sci., 50, 4097–4101.
Pratte, J. F., J. H. Van Andel, D. G. Ferraro, R. W. Gagnon, S. M.Maher, and G. L. Blair, 1991: NCAR’s mile high meteorologicalradar. Preprints, 25th Conf. on Radar Meteorology, Paris, France,Amer. Meteor. Soc., 863–866.
Rasmussen, E. N., and S. A. Rutledge, 1993: Evolution of quasi-two-dimensional squall lines. Part I: Kinematic and reflectivity struc-ture. J. Atmos. Sci., 50, 2584–2606.
Raymond, D. J., 1983: Wave-CISK in mass-flux form. J. Atmos. Sci.,40, 2561–2572., 1984: A wave-CISK model of squall lines. J. Atmos. Sci., 41,1946–1958., 1986: Prescribed heating of a stratified atmosphere as a modelfor moist convection. J. Atmos. Sci., 43, 1101–1111., 1987: A forced gravity wave model of self-organizing con-vection. J. Atmos. Sci., 44, 3528–3543.
Rotunno, R., J. B. Klemp, and M. L. Weisman, 1988: A theory forstrong, long-lived squall lines. J. Atmos. Sci., 45, 463–485.
Rutledge, S. A., and R. A. Houze Jr., 1987: A diagnostic modellingstudy of the trailing stratiform region of a midlatitude squallline. J. Atmos. Sci., 44, 2640–2656., P. C. Kennedy, and D. A. Brunkow, 1993: Use of the CSU-CHILL radar in radar meteorology education at Colorado StateUniversity. Bull. Amer. Meteor. Soc., 74, 25–31.
Schmidt, J. M., and W. R. Cotton, 1989: A High Plains squall lineassociated with severe surface winds. J. Atmos. Sci., 46, 281–302., and , 1990: Interactions between upper and lower tropo-spheric gravity waves on squall line structure and maintenance.J. Atmos. Sci., 47, 1205–1222.
Scott, J. D., and S. A. Rutledge, 1995: Doppler radar observations
of an asymmetric mesoscale convective system and associatedvortex couplet. Mon. Wea. Rev., 123, 3437–3457.
Smull, B. F., and J. A. Augustine, 1993: Multiscale analysis of amature mesoscale convective system. Mon. Wea. Rev., 121, 103–132.
Stensrud, D. K., and J. M. Fritsch, 1993: Mesoscale convective sys-tems on weakly forced large-scale environments. Part I: Obser-vations. Mon. Wea. Rev., 121, 3326–3344.
Stumpf, G. J., R. H. Johnson, and B. F. Smull, 1991: The wake lowin a midlatitude mesoscale convective system having complexconvective organization. Mon. Wea. Rev., 119, 134–158.
Thorpe, A. J., M. J. Miller, and M. W. Moncrieff, 1982: Two-di-mensional convection in non-constant shear: A model of mid-latitude squall lines. Quart. J. Roy. Meteor. Soc., 108, 739–762.
Trier, S. B., and D. B. Parsons, 1993: Evolution of environmentalconditions preceding the development of a nocturnal mesoscaleconvective complex. Mon. Wea. Rev., 121, 1078–1098.
Tripoli, G., and W. R. Cotton, 1989a: Numerical study of an observedorogenic mesoscale convective system. Part 1: Simulated genesisand comparison with observations. Mon. Wea. Rev., 117, 273–304., and , 1989b: Numerical study of an observed orogenicmesoscale convective system. Part 2: Analysis of governing dy-namics. Mon. Wea. Rev., 117, 305–328.
Verlinde, J., and W. R. Cotton, 1990: A mesoscale vortex coupletobserved in the trailing anvil of a multicellular convective com-plex. Mon. Wea. Rev., 118, 993–1010.
Weisman, M. L., 1992: The role of convectively generated rear-inflowjets in the evolution of long-lived mesoconvective systems. J.Atmos. Sci., 49, 1826–1847., 1993: The genesis of severe, long-lived bow echoes. J. Atmos.Sci., 50, 645–670., J. B. Klemp, and R. Rotunno, 1988: Structure and evolutionof numerically simulated squall lines. J. Atmos. Sci., 45, 1990–2013.
Zipser, E. J., 1982: Use of a conceptual model of the life-cycle ofmesoscale convective systems to improve very-short-range fore-casts. Nowcasting, K. A. Browning, Ed., Academic Press, 191–204.
Related Documents