Upriver Migration and Energetics • Timing • Patterns • Speed • Energetics • Hell’s Gate Slide and Fishway

Welcome message from author
This document is posted to help you gain knowledge. Please leave a comment to let me know what you think about it! Share it to your friends and learn new things together.
Transcript
Upriver Migration and Energetics
• Timing • Patterns • Speed • Energetics • Hell’s Gate
Slide and Fishway
But before we dive into the details, let’s take a moment to consider the athletic performance accomplished by at least some populations…
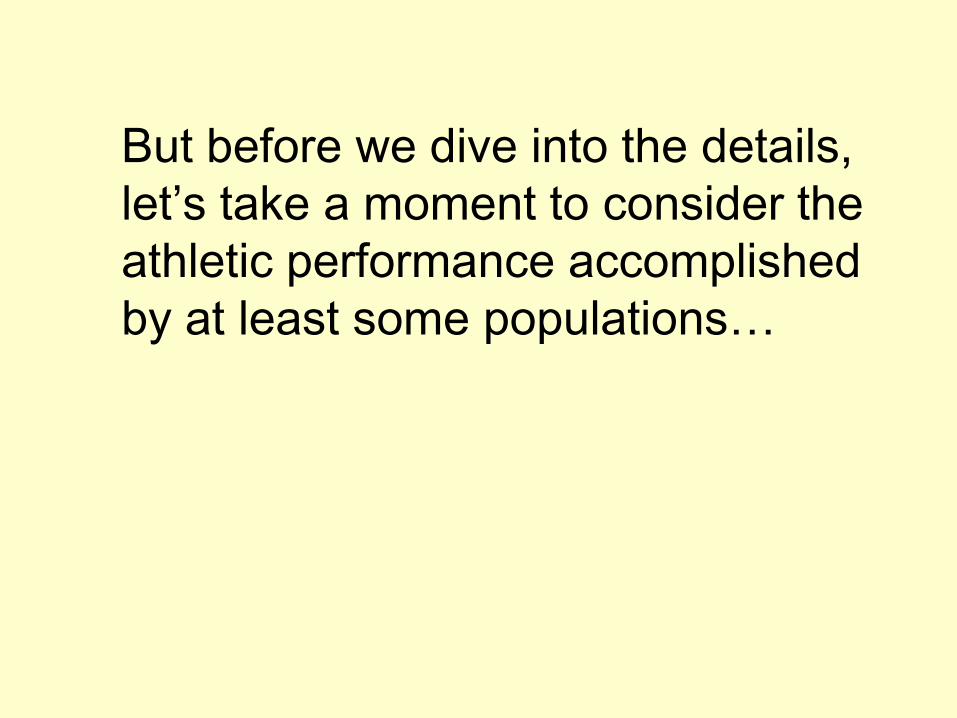
The Salmon of the Yukon River C.H. Gilbert. 1922. Bulletin U.S. Bureau of Fisheries 38: 317-332.
“As regards the rate at which [Chinook salmon] ascend the river, we have more reliable and complete data for the Yukon than have been secured in any other stream. Records were obtained of their first appearance at a large number of localities. … The first king salmon to reach Dawson in the middle of July, 1920, had been traveling against a consistently rapid current for 29 days, at the rate of 52 miles per day, and during this period, as always within the river, had taken no food.”
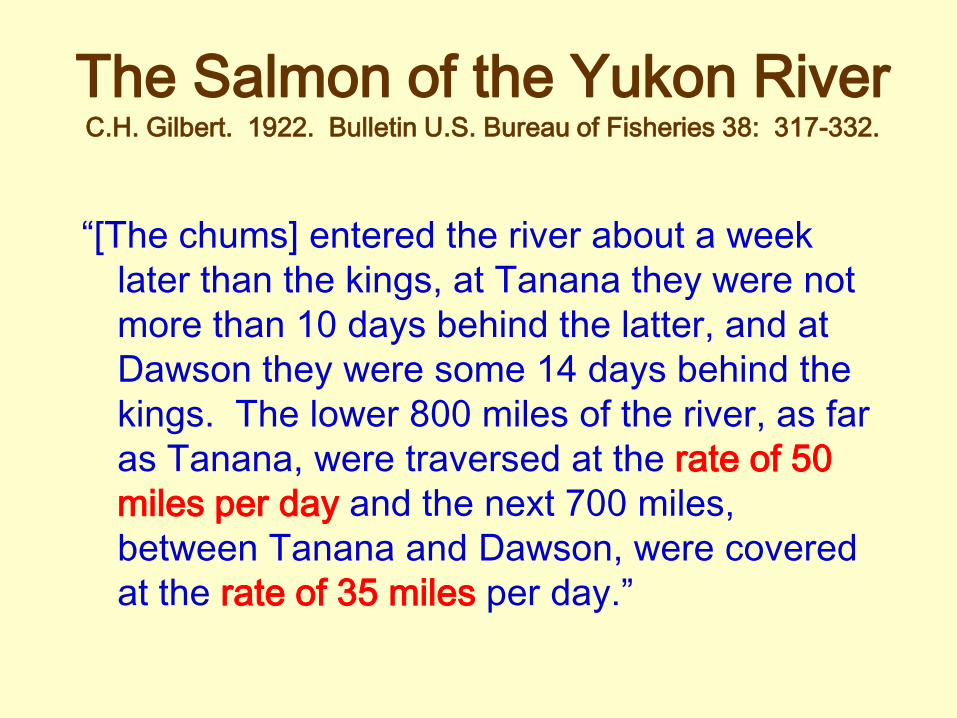
The Salmon of the Yukon River C.H. Gilbert. 1922. Bulletin U.S. Bureau of Fisheries 38: 317-332.
“[The chums] entered the river about a week later than the kings, at Tanana they were not more than 10 days behind the latter, and at Dawson they were some 14 days behind the kings. The lower 800 miles of the river, as far as Tanana, were traversed at the rate of 50 miles per day and the next 700 miles, between Tanana and Dawson, were covered at the rate of 35 miles per day.”
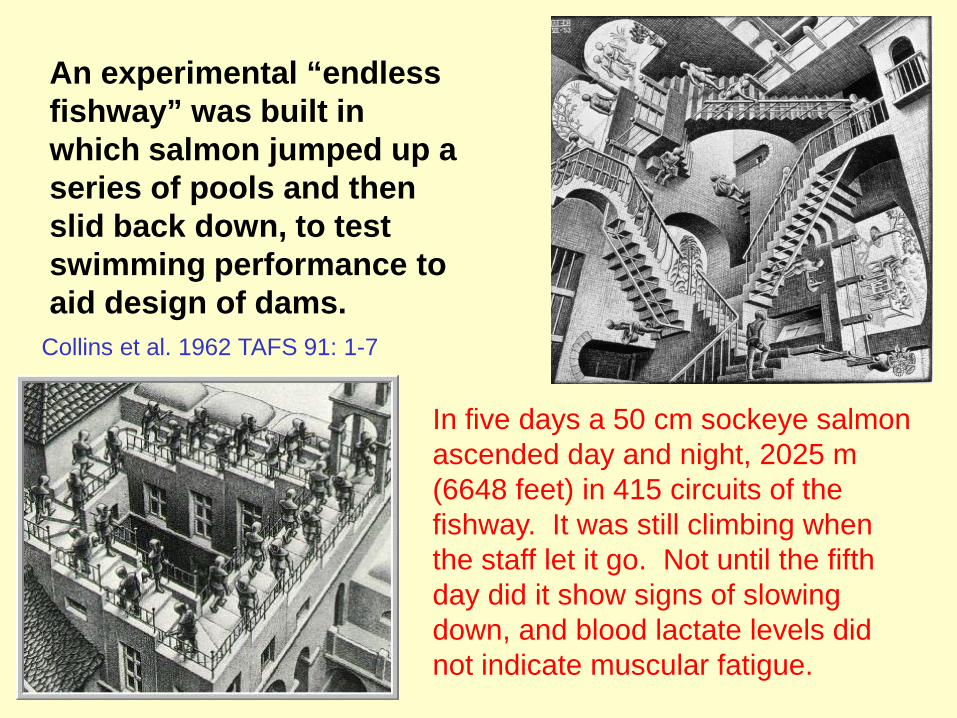
Collins et al. 1962 TAFS 91: 1-7
An experimental “endless fishway” was built in which salmon jumped up a series of pools and then slid back down, to test swimming performance to aid design of dams.
In five days a 50 cm sockeye salmon ascended day and night, 2025 m (6648 feet) in 415 circuits of the fishway. It was still climbing when the staff let it go. Not until the fifth day did it show signs of slowing down, and blood lactate levels did not indicate muscular fatigue.
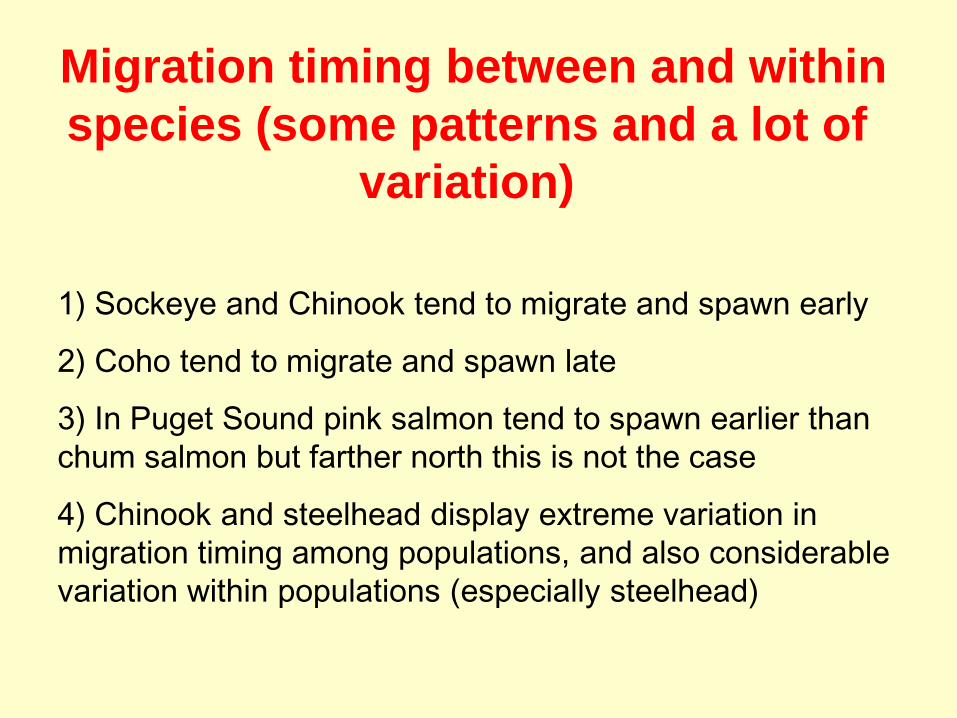
Migration timing between and within species (some patterns and a lot of
variation)
1) Sockeye and Chinook tend to migrate and spawn early
2) Coho tend to migrate and spawn late
3) In Puget Sound pink salmon tend to spawn earlier than chum salmon but farther north this is not the case
4) Chinook and steelhead display extreme variation in migration timing among populations, and also considerable variation within populations (especially steelhead)
-
500
1,000
1,500
2,000
2,500
3,000
3,500
8-Jun 8-Jul 7-Aug 6-Sep 6-Oct
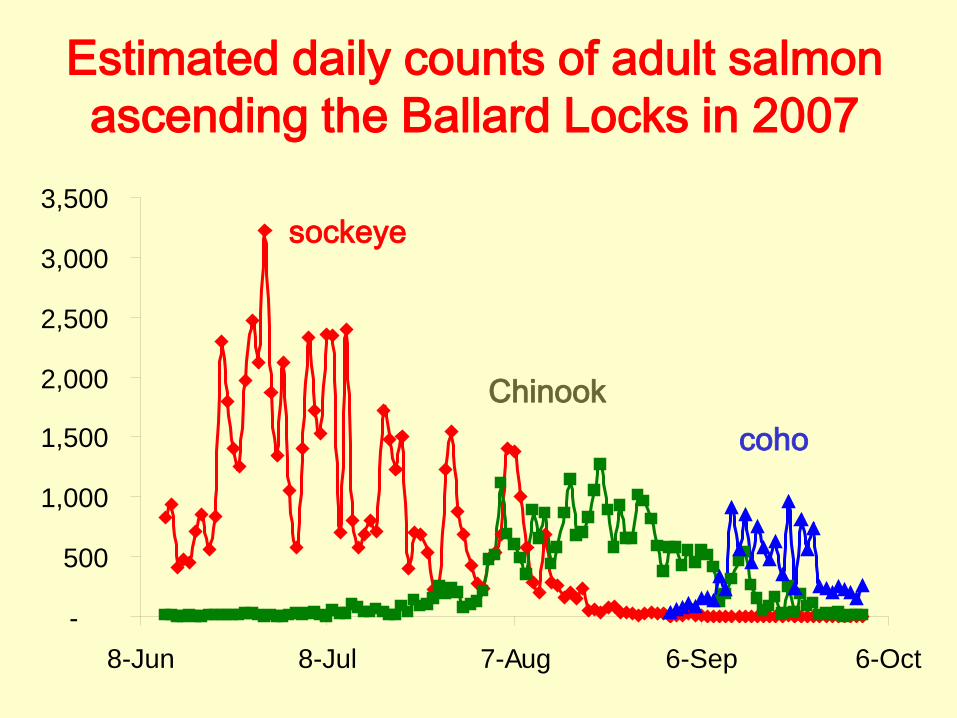
Estimated daily counts of adult salmon ascending the Ballard Locks in 2007
sockeye
Chinook coho
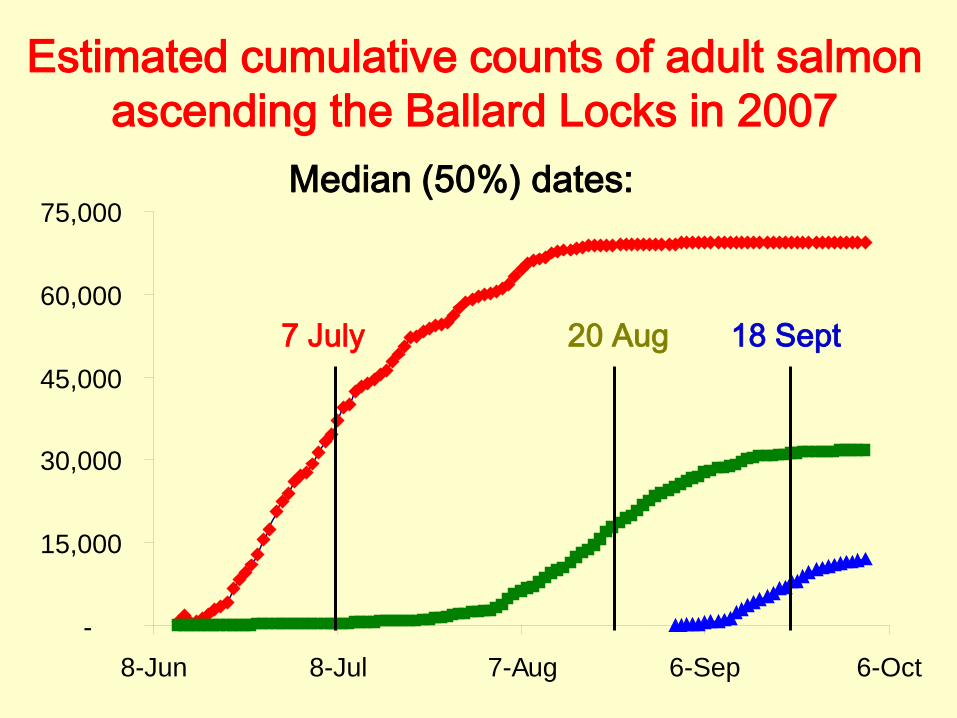
Estimated cumulative counts of adult salmon ascending the Ballard Locks in 2007
-
15,000
30,000
45,000
60,000
75,000
8-Jun 8-Jul 7-Aug 6-Sep 6-Oct
Median (50%) dates:
7 July 20 Aug 18 Sept
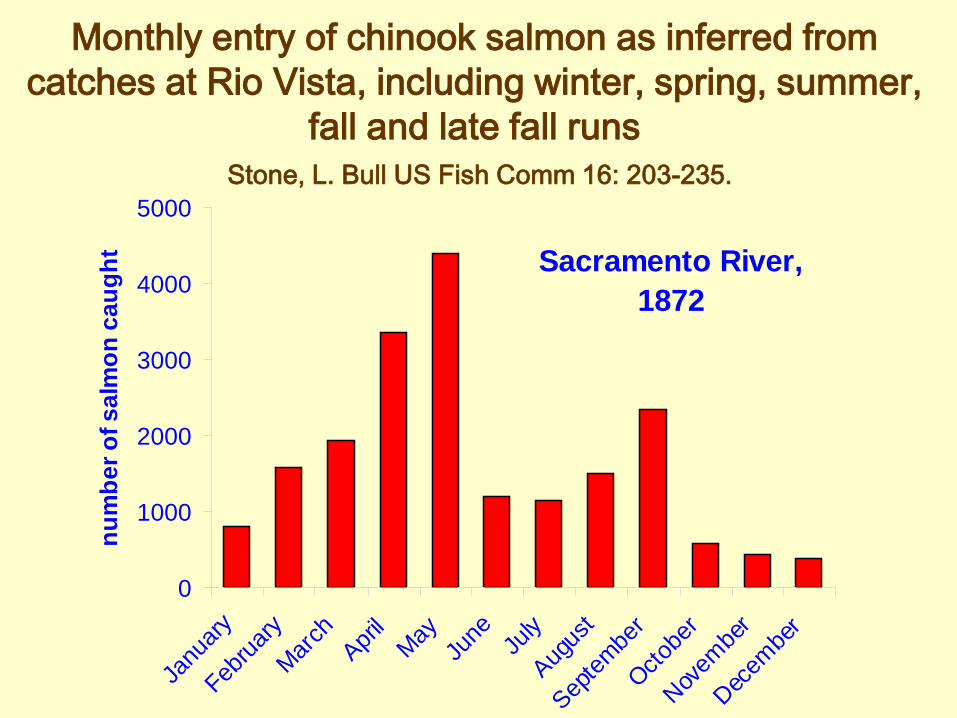
Monthly entry of chinook salmon as inferred from catches at Rio Vista, including winter, spring, summer,
fall and late fall runs Stone, L. Bull US Fish Comm 16: 203-235.
0
1000
2000
3000
4000
5000
Janu
ary
Februa
ryMarc
hApri
lMay
June Ju
ly
Augus
t
Septem
ber
Octobe
r
Novem
ber
Decem
ber
num
ber o
f sal
mon
cau
ght Sacramento River,
1872
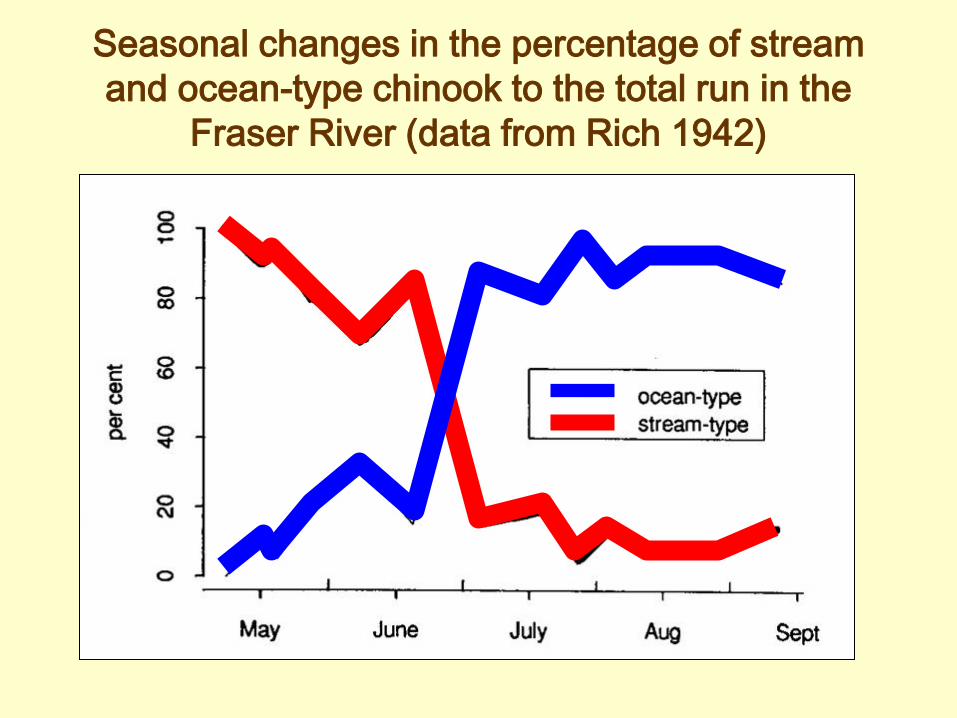
Seasonal changes in the percentage of stream and ocean-type chinook to the total run in the
Fraser River (data from Rich 1942)
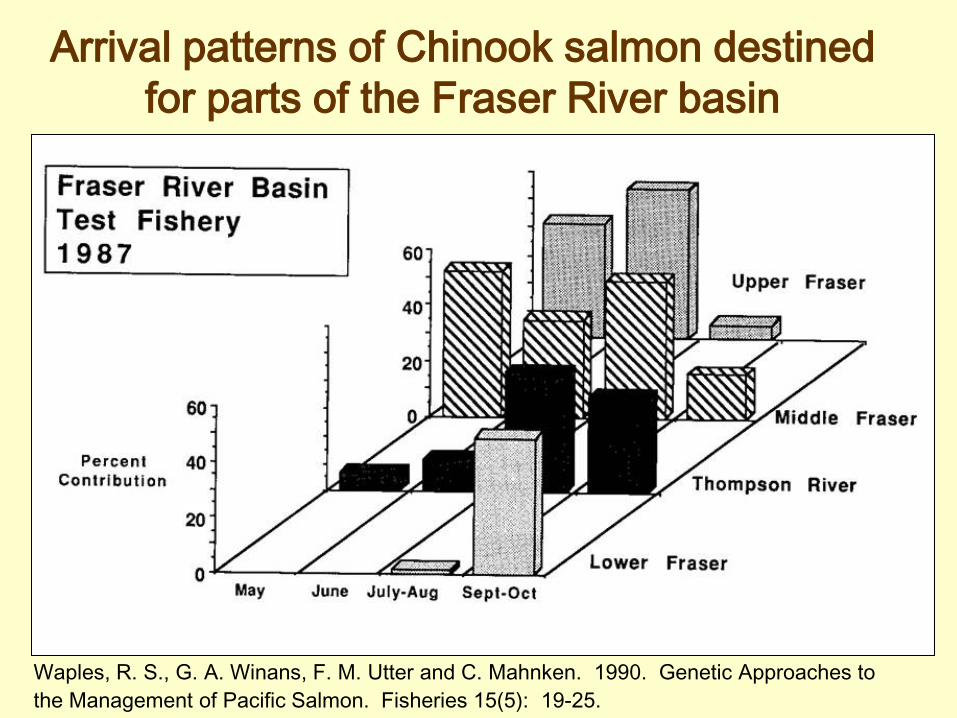
Arrival patterns of Chinook salmon destined for parts of the Fraser River basin
Waples, R. S., G. A. Winans, F. M. Utter and C. Mahnken. 1990. Genetic Approaches to the Management of Pacific Salmon. Fisheries 15(5): 19-25.
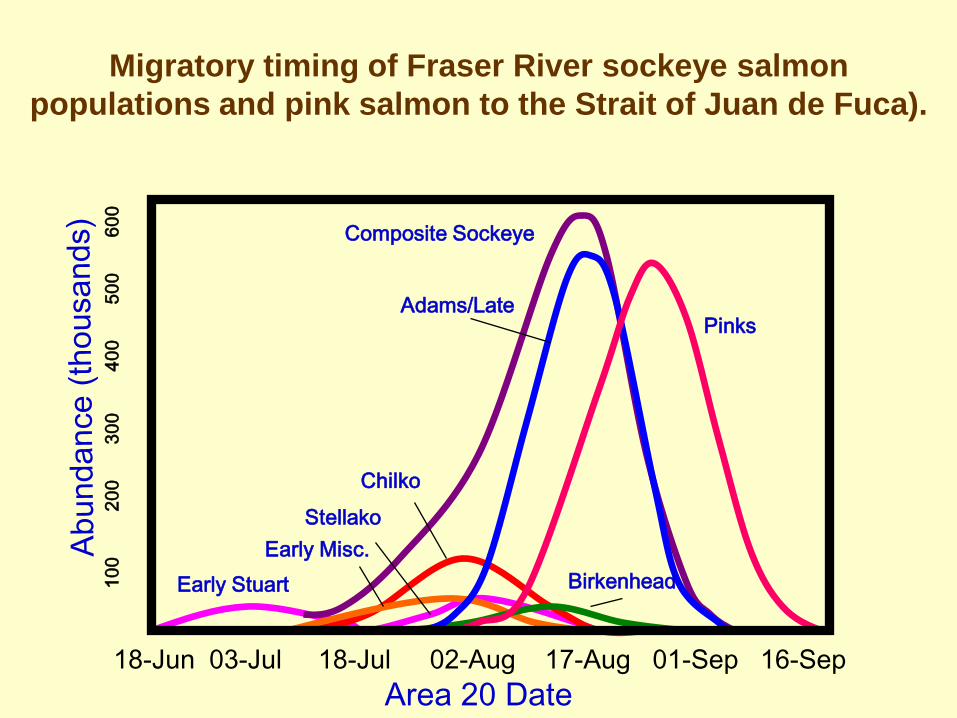
Migratory timing of Fraser River sockeye salmon populations and pink salmon to the Strait of Juan de Fuca).
Area 20 Date
Early Stuart Early Misc.
Stellako Chilko
Adams/Late
Composite Sockeye
Pinks
Birkenhead
18-Jun 03-Jul 18-Jul 02-Aug 17-Aug 01-Sep 16-Sep
100
200
300
400
500
600
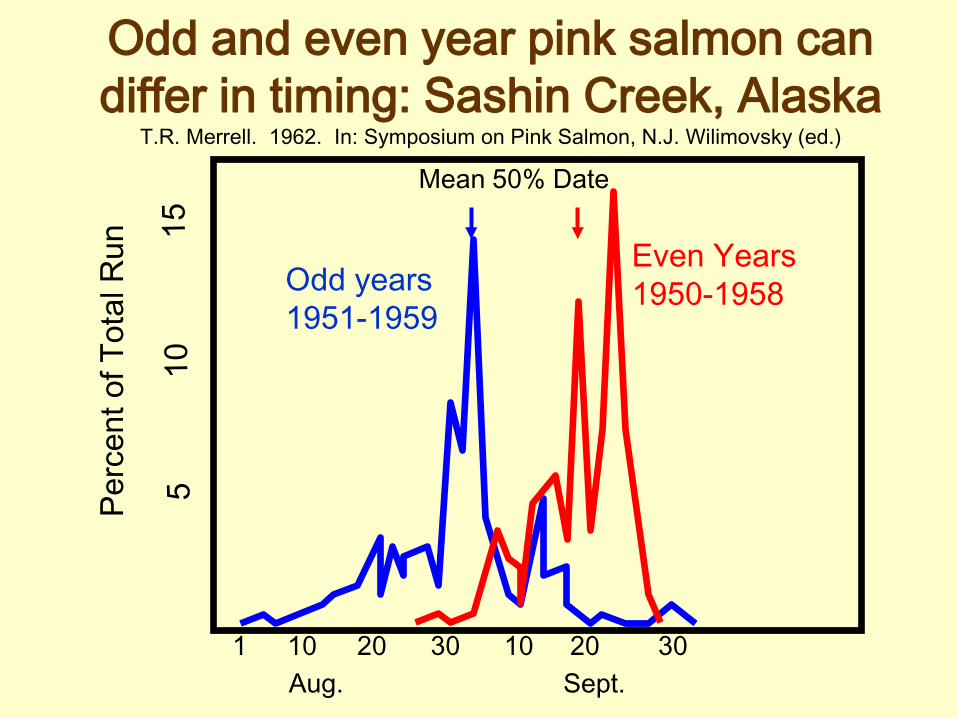
Odd and even year pink salmon can differ in timing: Sashin Creek, Alaska
T.R. Merrell. 1962. In: Symposium on Pink Salmon, N.J. Wilimovsky (ed.)
Perc
ent o
f Tot
al R
un
Mean 50% Date
1 10 20 30 10 20 30 Aug. Sept.
Odd years 1951-1959
Even Years 1950-1958
0
20
40
60
80
Dec Jan Feb March April May June
Ripe
Spent
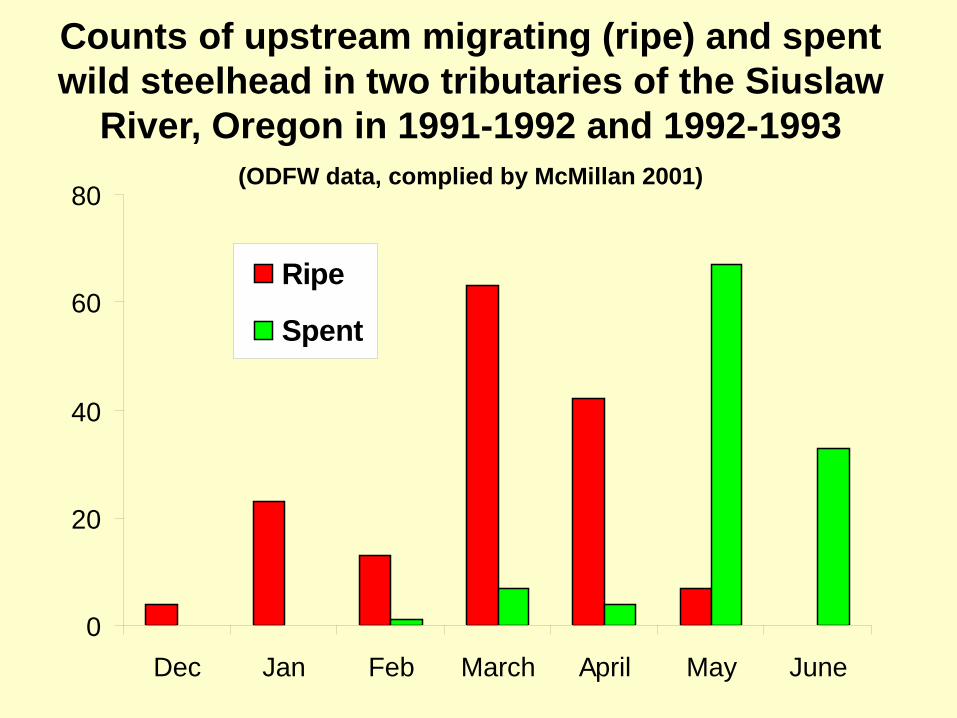
Counts of upstream migrating (ripe) and spent wild steelhead in two tributaries of the Siuslaw
River, Oregon in 1991-1992 and 1992-1993 (ODFW data, complied by McMillan 2001)
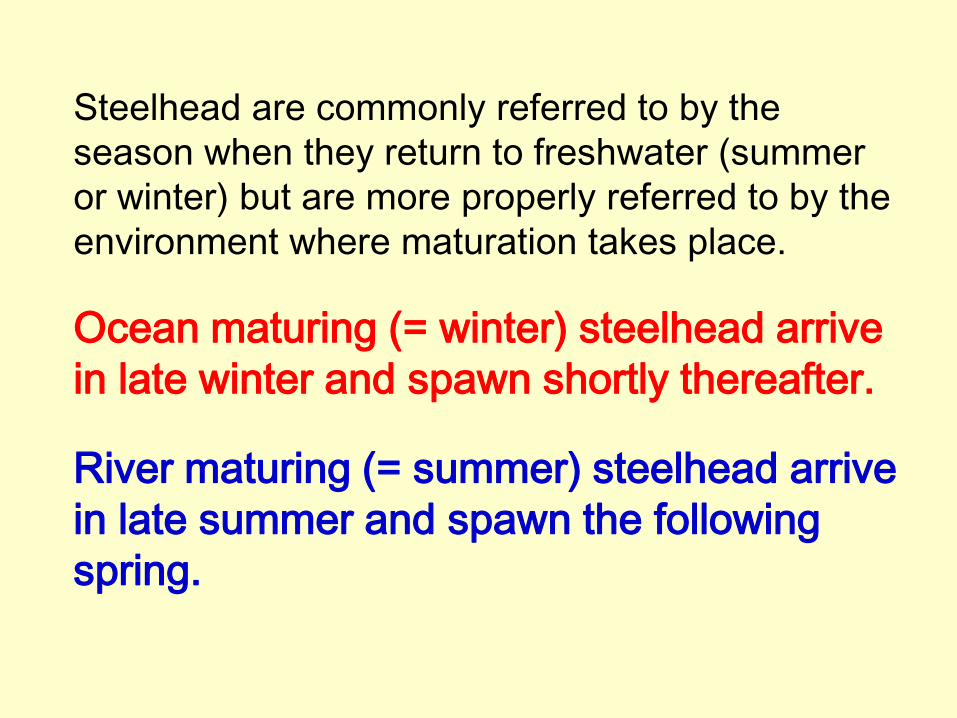
Steelhead are commonly referred to by the season when they return to freshwater (summer or winter) but are more properly referred to by the environment where maturation takes place. Ocean maturing (= winter) steelhead arrive in late winter and spawn shortly thereafter. River maturing (= summer) steelhead arrive in late summer and spawn the following spring.
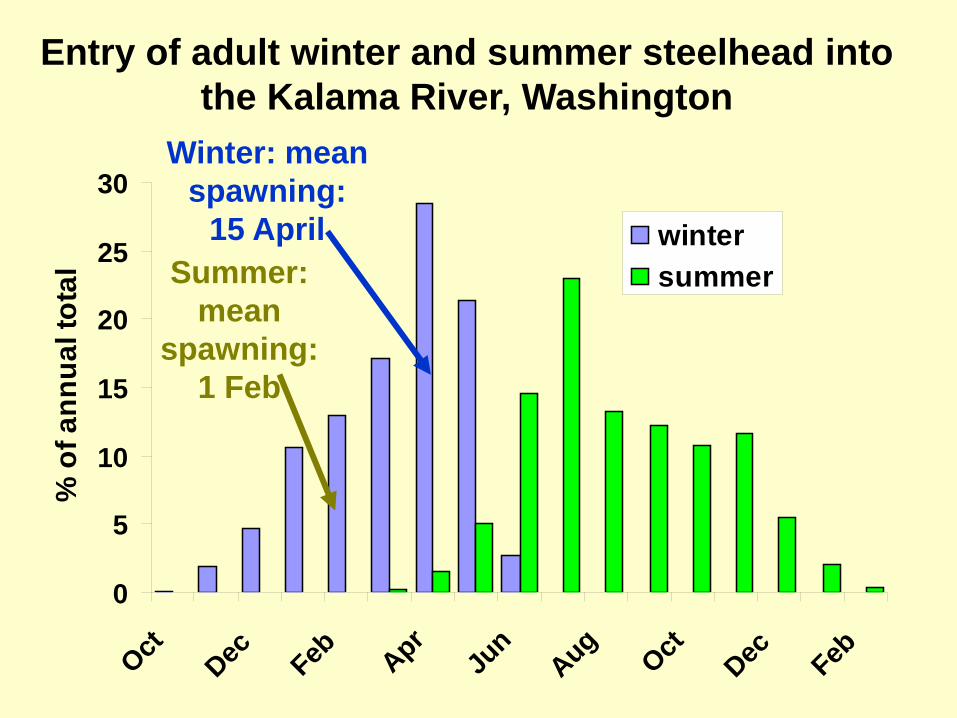
0
5
10
15
20
25
30
OctDec Feb Apr
Jun
AugOct
Dec Feb
% o
f ann
ual t
otal
winter summer
Entry of adult winter and summer steelhead into the Kalama River, Washington
Winter: mean spawning:
15 April Summer:
mean spawning:
1 Feb
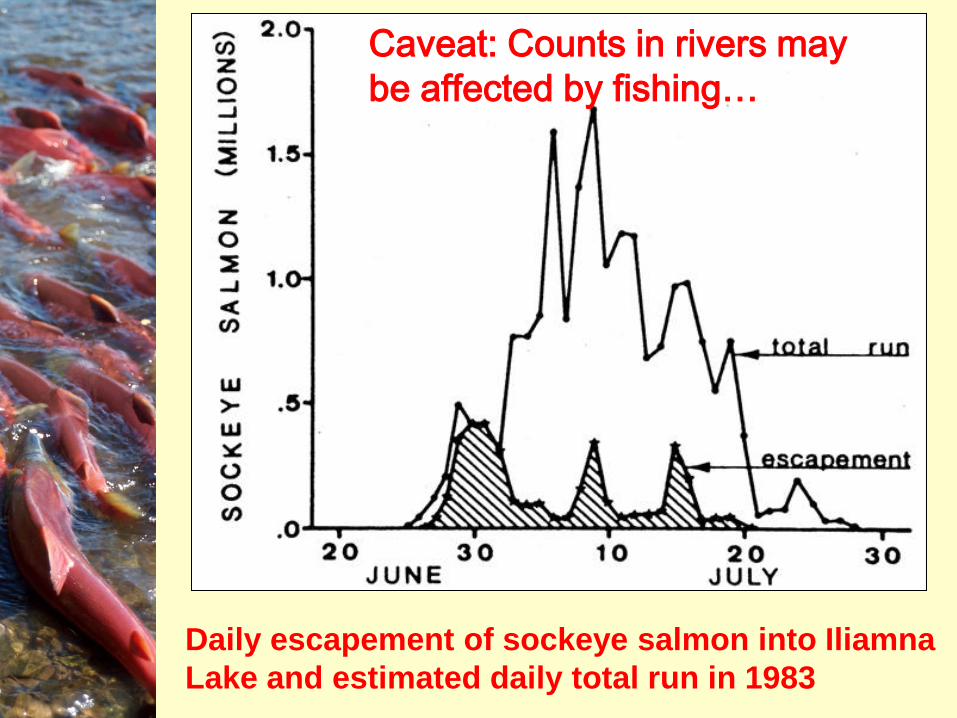
Daily escapement of sockeye salmon into Iliamna Lake and estimated daily total run in 1983
Caveat: Counts in rivers may be affected by fishing…
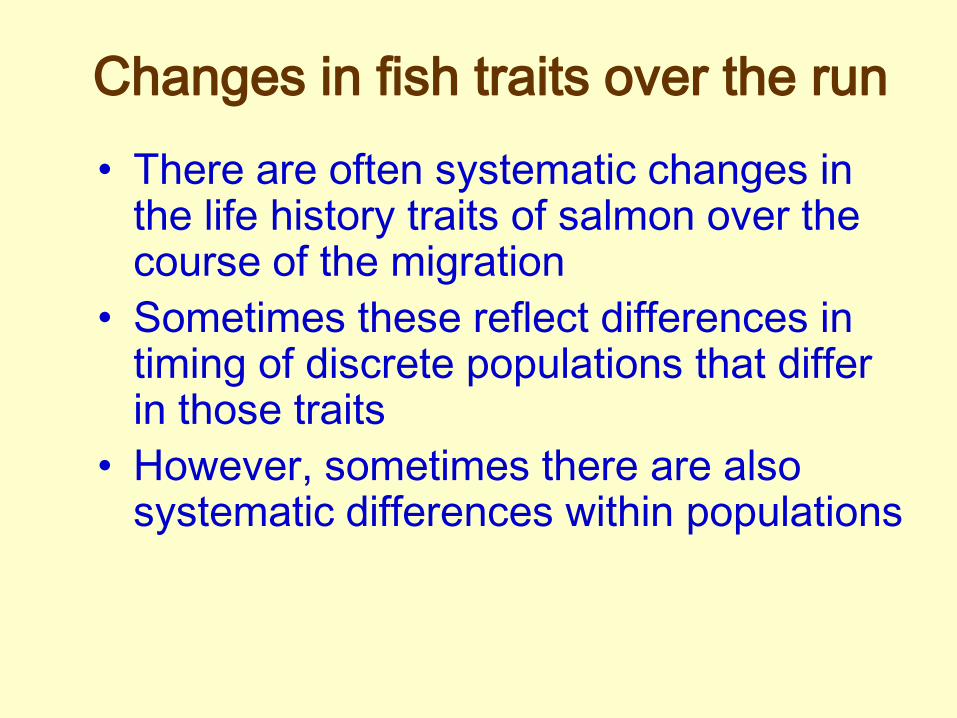
Changes in fish traits over the run • There are often systematic changes in
the life history traits of salmon over the course of the migration
• Sometimes these reflect differences in timing of discrete populations that differ in those traits
• However, sometimes there are also systematic differences within populations
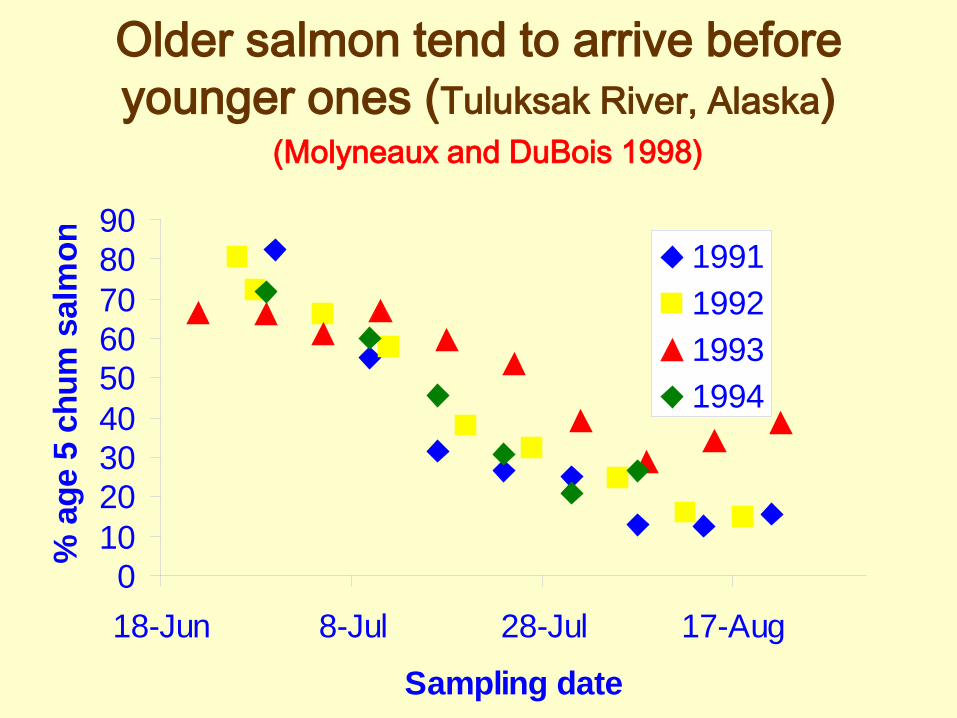
Older salmon tend to arrive before younger ones (Tuluksak River, Alaska)
0102030405060708090
18-Jun 8-Jul 28-Jul 17-Aug
Sampling date
% a
ge 5
chu
m s
alm
on 1991199219931994
(Molyneaux and DuBois 1998)
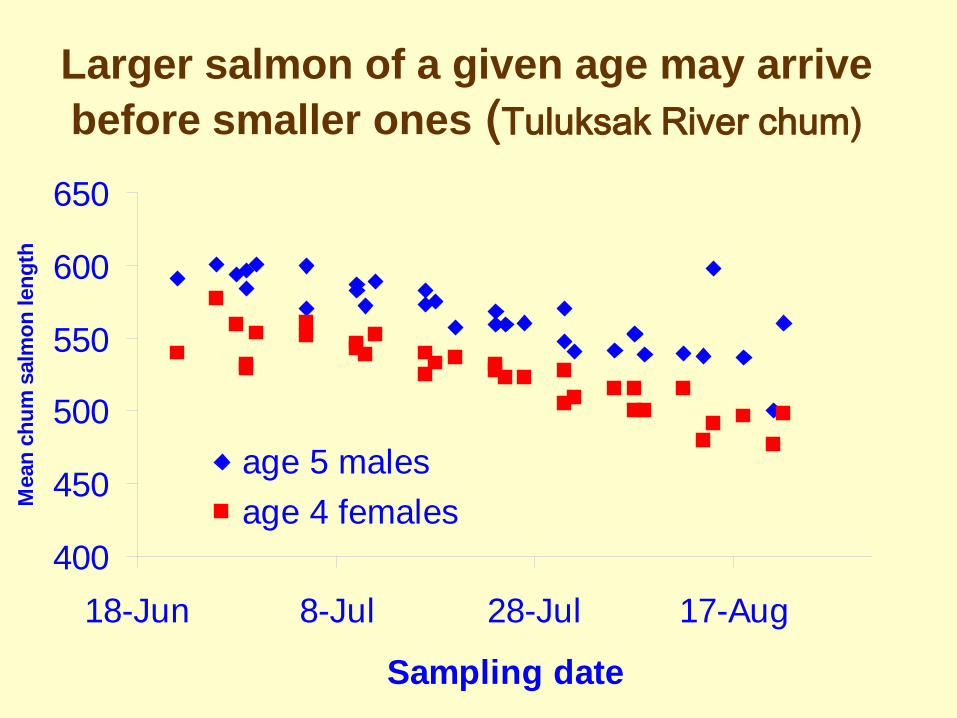
Larger salmon of a given age may arrive before smaller ones (Tuluksak River chum)
400
450
500
550
600
650
18-Jun 8-Jul 28-Jul 17-Aug
Sampling date
Mea
n ch
um s
alm
on le
ngth
age 5 malesage 4 females
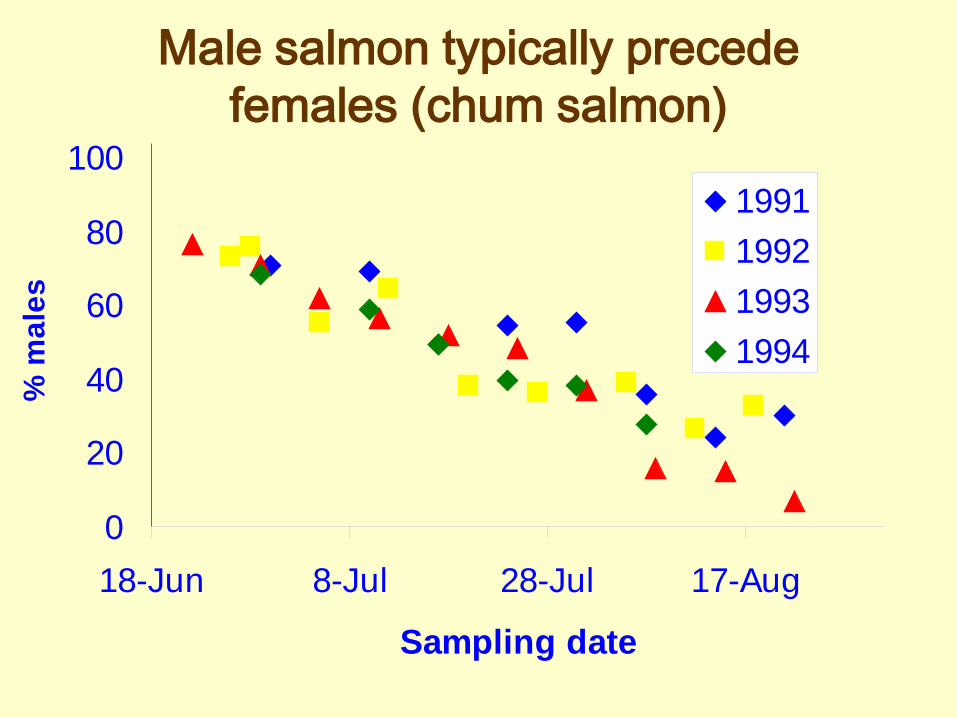
Male salmon typically precede females (chum salmon)
0
20
40
60
80
100
18-Jun 8-Jul 28-Jul 17-Aug
Sampling date
% m
ales
1991199219931994
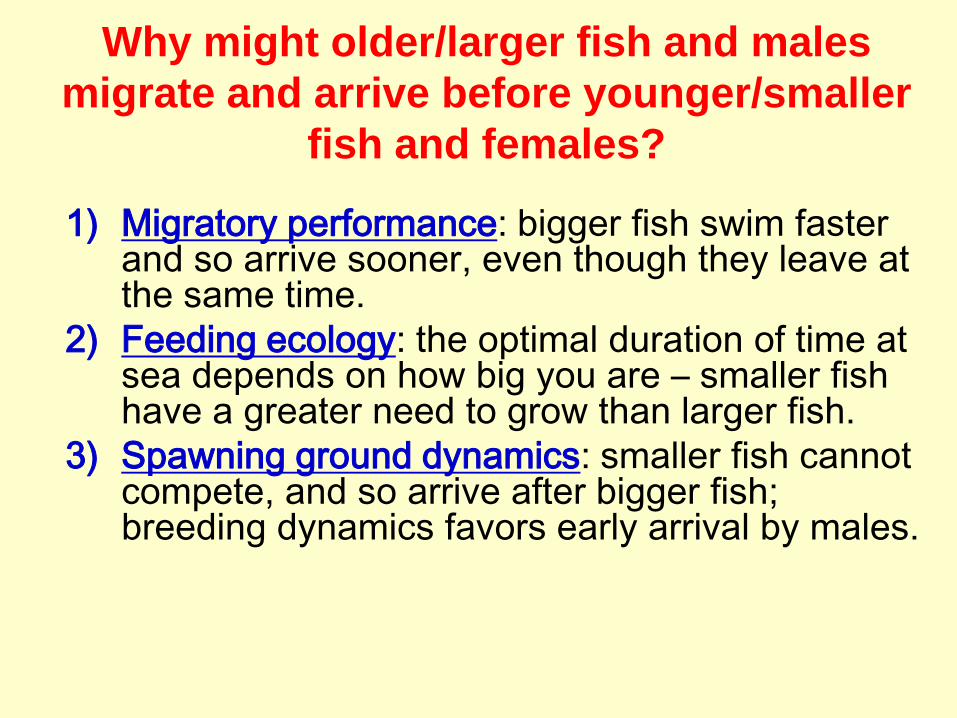
Why might older/larger fish and males migrate and arrive before younger/smaller
fish and females?
1) Migratory performance: bigger fish swim faster and so arrive sooner, even though they leave at the same time.
2) Feeding ecology: the optimal duration of time at sea depends on how big you are – smaller fish have a greater need to grow than larger fish.
3) Spawning ground dynamics: smaller fish cannot compete, and so arrive after bigger fish; breeding dynamics favors early arrival by males.

What time of day do salmon migrate upstream?
Primarily at night: kokanee
Lorz and Northcote 1965
Primarily in the day: Sockeye, chinook, steelhead
Columbia River
At night if the water is clear, in the day if turbid: Atlantic salmon
Hellawell et al. 1974
At night in moderate flows, in the day on floods: Atlantic salmon
Potter 1988
Slightly more at night than during the day: Atlantic salmon Brown trout
Allan 1966
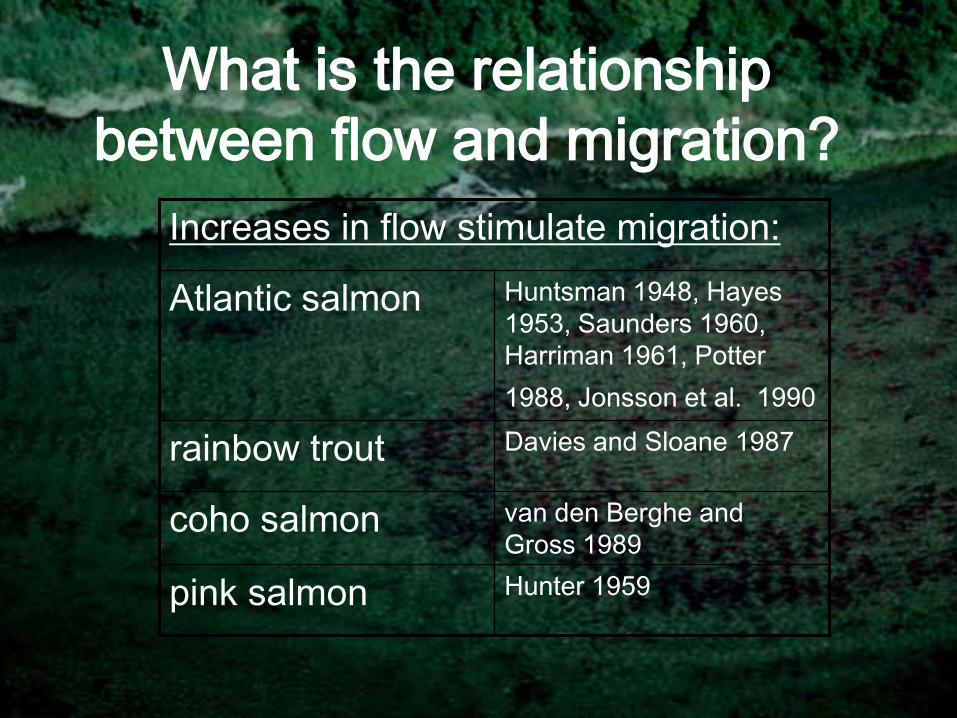
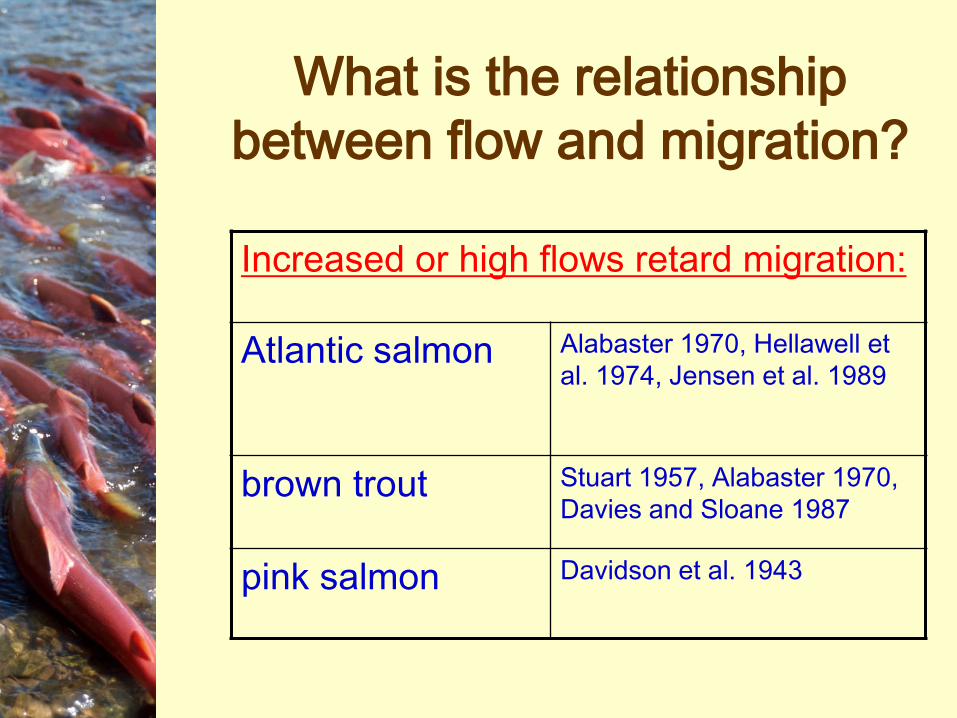
What is the relationship between flow and migration?
Increases in flow stimulate migration:
Atlantic salmon Huntsman 1948, Hayes 1953, Saunders 1960, Harriman 1961, Potter 1988, Jonsson et al. 1990
rainbow trout Davies and Sloane 1987
coho salmon van den Berghe and Gross 1989
pink salmon Hunter 1959
What is the relationship between flow and migration?
Increased or high flows retard migration:
Atlantic salmon Alabaster 1970, Hellawell et al. 1974, Jensen et al. 1989
brown trout Stuart 1957, Alabaster 1970, Davies and Sloane 1987
pink salmon Davidson et al. 1943

Relationship between pink salmon migration and flow in Hooknose Creek, AK
August September October November
1952 1200
900
600
300
200
150
100
50
0
Hunter (1959) JFRBC
flow fish
“normalized” fish run

Salmon movement can occur without pulses of stream flow: Skutz Falls, B.C.
Oct.21 22 23 24 25 26 27 28 29 Nov. 5 6
1400 1200 1000 800 600 400 200
25 20 15 10 5
Neave (1943) JFRBC
flow
fish
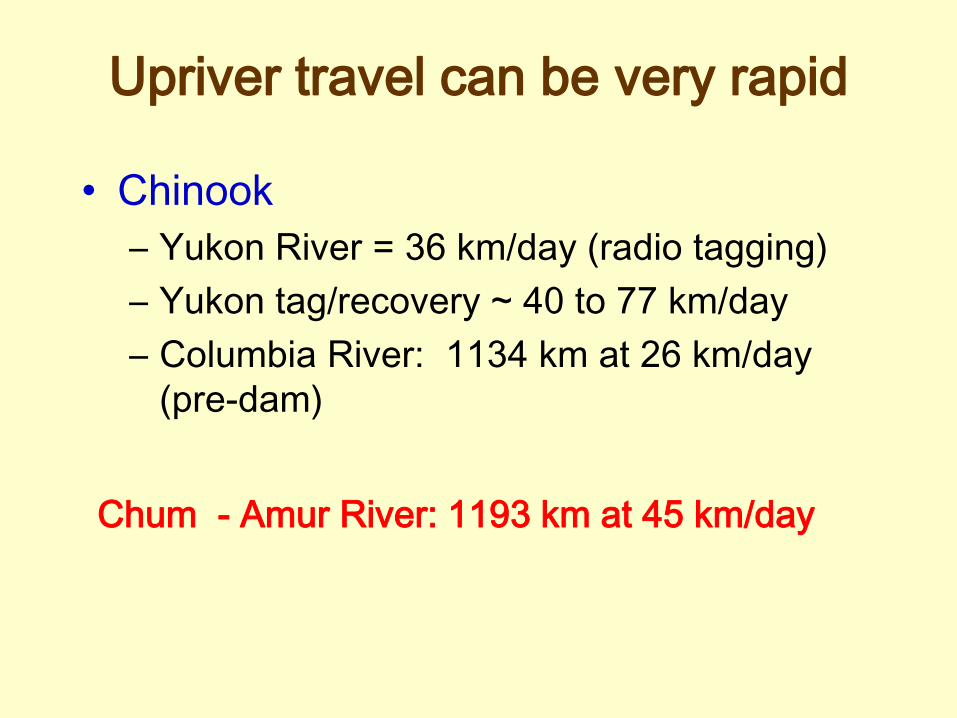
Upriver travel can be very rapid
• Chinook – Yukon River = 36 km/day (radio tagging) – Yukon tag/recovery ~ 40 to 77 km/day – Columbia River: 1134 km at 26 km/day
(pre-dam)
Chum - Amur River: 1193 km at 45 km/day
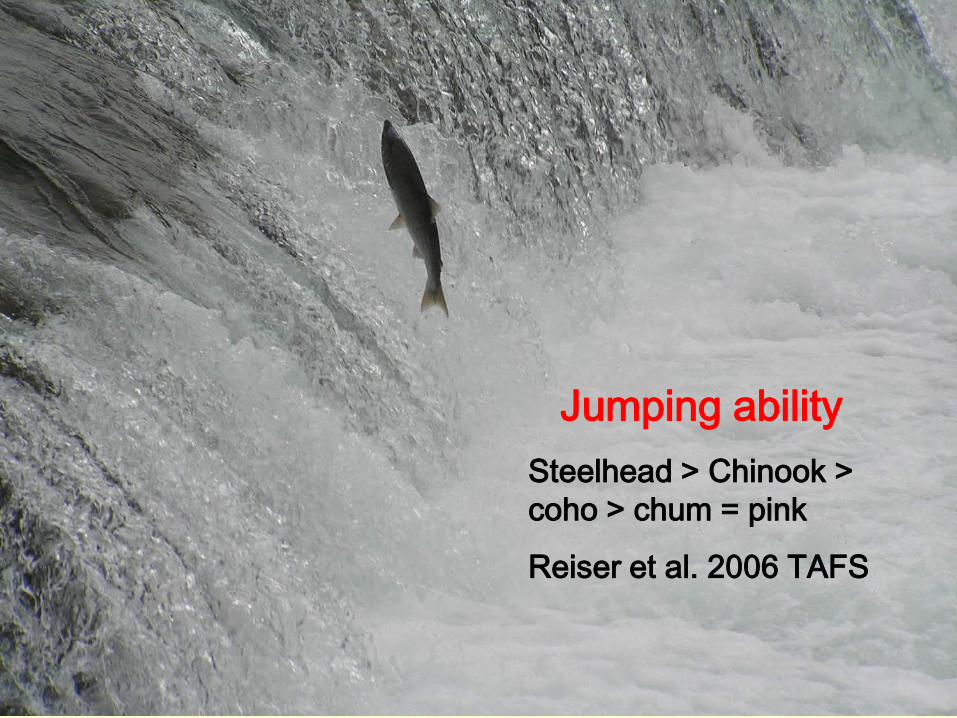
Jumping ability Steelhead > Chinook > coho > chum = pink
Reiser et al. 2006 TAFS
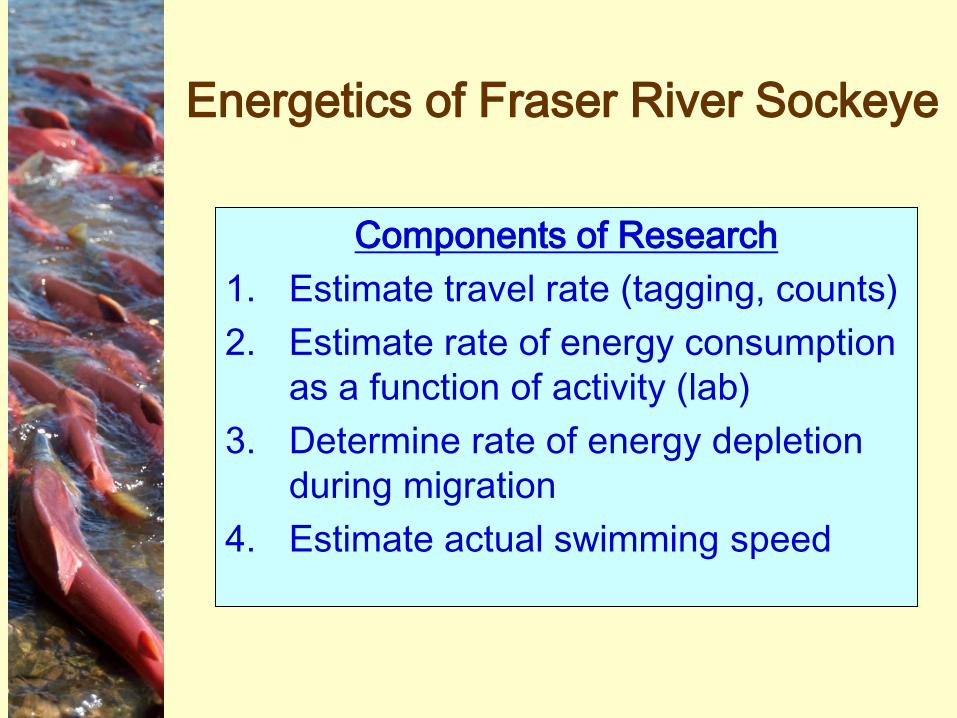
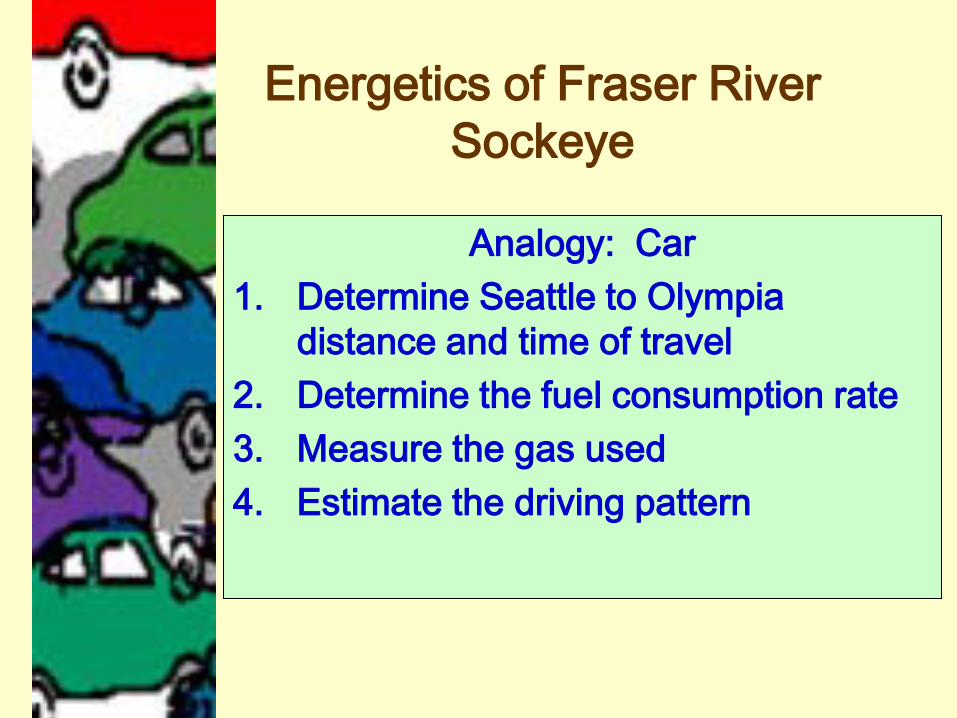
Energetics of Fraser River Sockeye
Components of Research 1. Estimate travel rate (tagging, counts) 2. Estimate rate of energy consumption
as a function of activity (lab) 3. Determine rate of energy depletion
during migration 4. Estimate actual swimming speed
Energetics of Fraser River Sockeye
Analogy: Car 1. Determine Seattle to Olympia
distance and time of travel 2. Determine the fuel consumption rate 3. Measure the gas used 4. Estimate the driving pattern
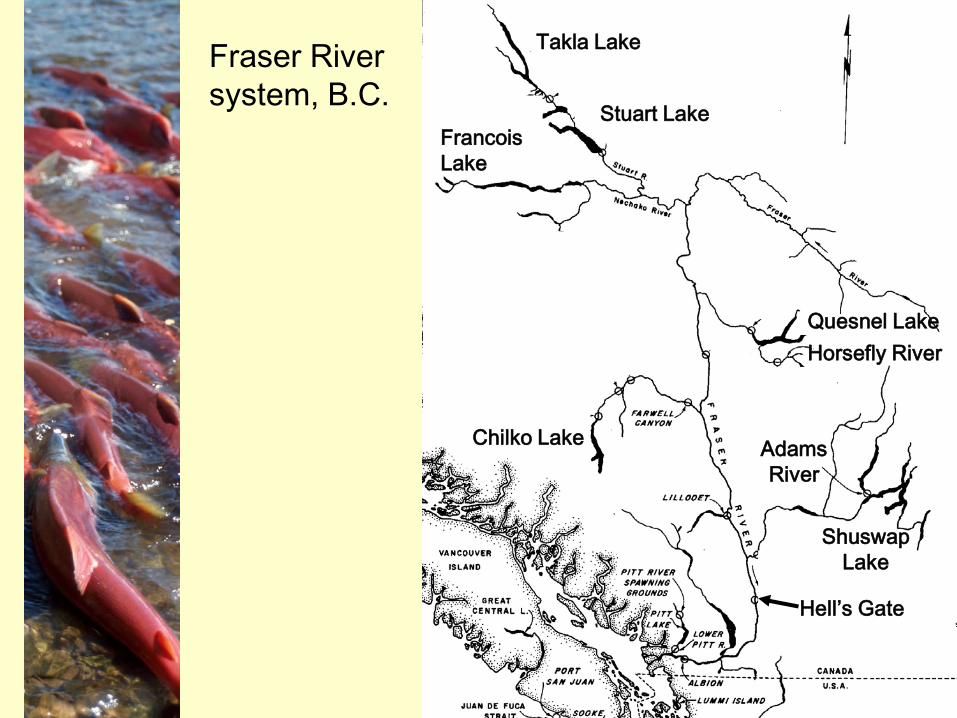
Takla Lake
Stuart Lake Francois Lake
Quesnel Lake Horsefly River
Chilko Lake Adams River
Shuswap Lake
Hell’s Gate
Fraser River system, B.C.
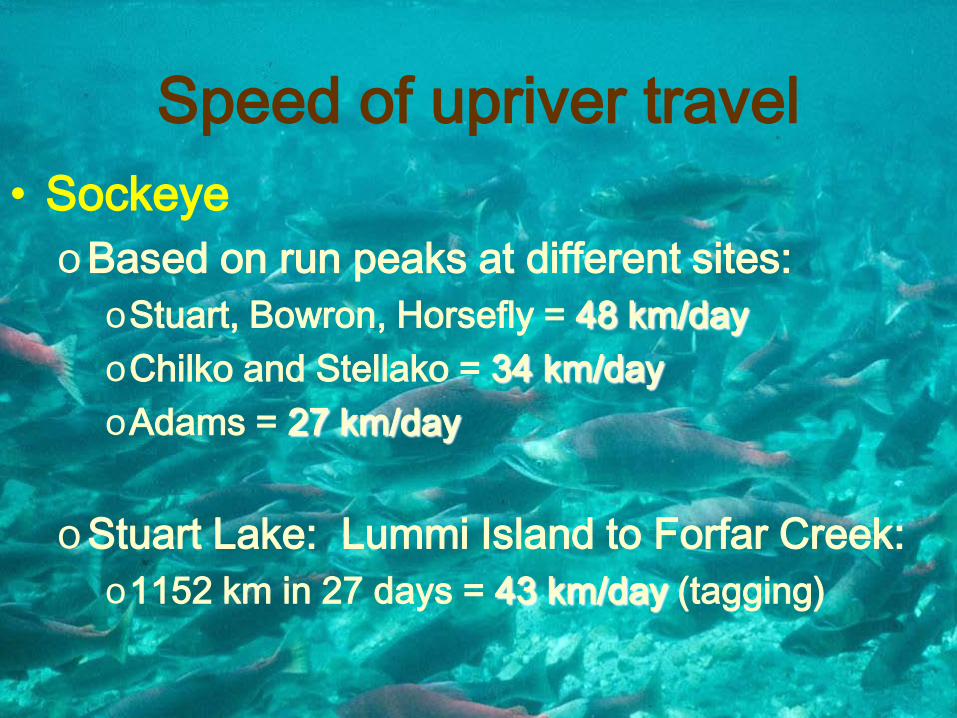
Speed of upriver travel • Sockeye
o Based on run peaks at different sites: oStuart, Bowron, Horsefly = 48 km/day oChilko and Stellako = 34 km/day oAdams = 27 km/day
o Stuart Lake: Lummi Island to Forfar Creek:
o1152 km in 27 days = 43 km/day (tagging)
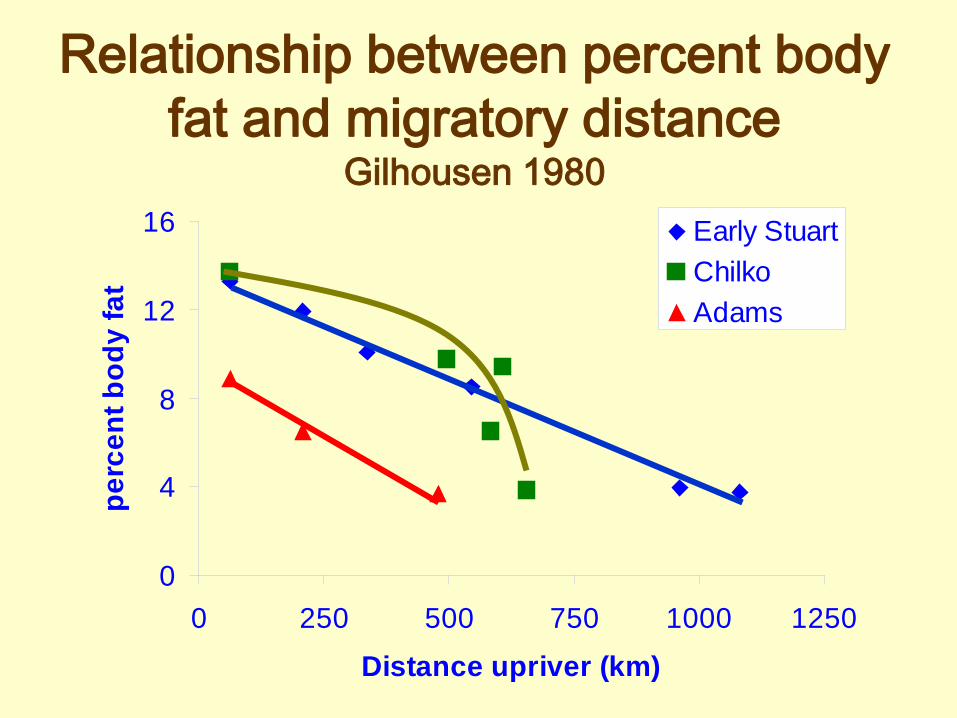
Relationship between percent body fat and migratory distance
Gilhousen 1980
0
4
8
12
16
0 250 500 750 1000 1250
Distance upriver (km)
perc
ent b
ody
fat
Early StuartChilkoAdams
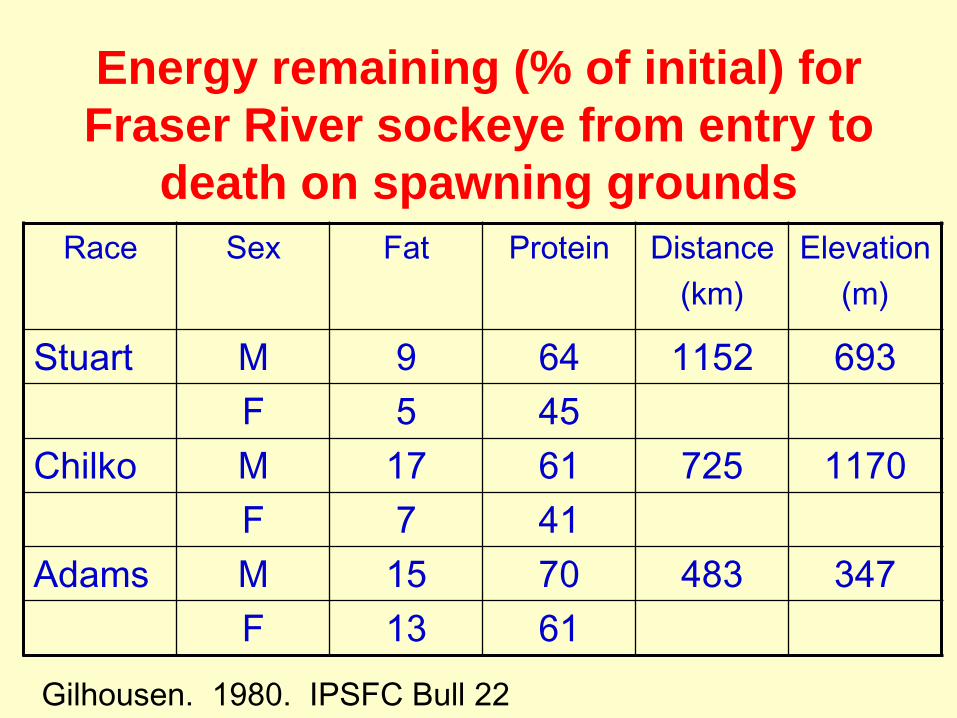
Energy remaining (% of initial) for Fraser River sockeye from entry to
death on spawning grounds Race Sex Fat Protein Distance
(km) Elevation
(m)
Stuart M 9 64 1152 693 F 5 45
Chilko M 17 61 725 1170 F 7 41
Adams M 15 70 483 347 F 13 61
Gilhousen. 1980. IPSFC Bull 22
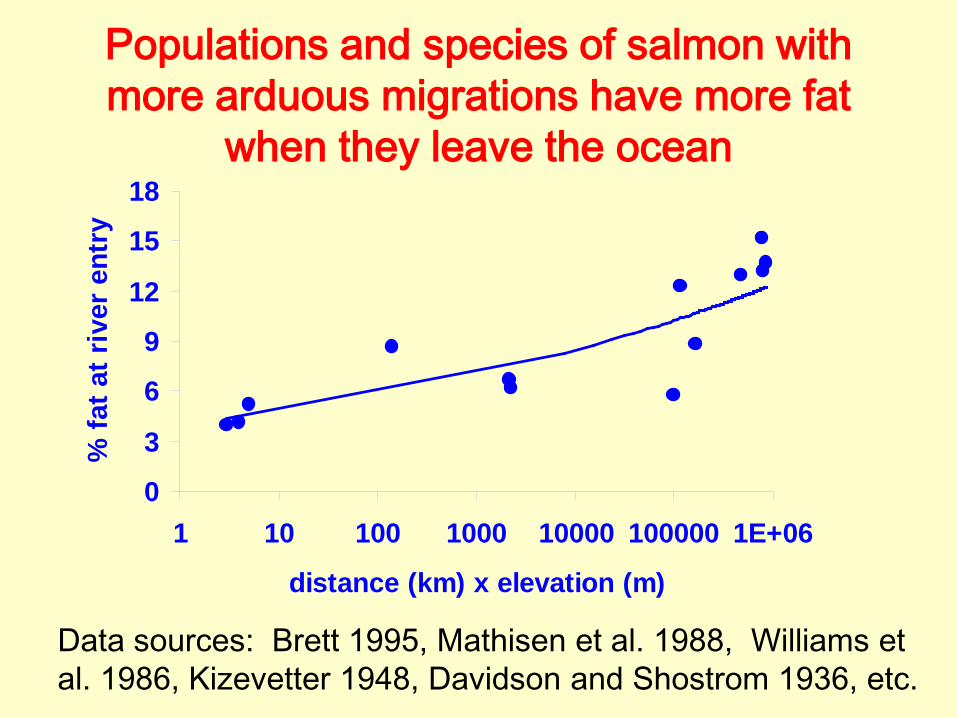
Populations and species of salmon with more arduous migrations have more fat
when they leave the ocean
0
3
6
9
12
15
18
1 10 100 1000 10000 100000 1E+06
distance (km) x elevation (m)
% fa
t at r
iver
ent
ry
Data sources: Brett 1995, Mathisen et al. 1988, Williams et al. 1986, Kizevetter 1948, Davidson and Shostrom 1936, etc.
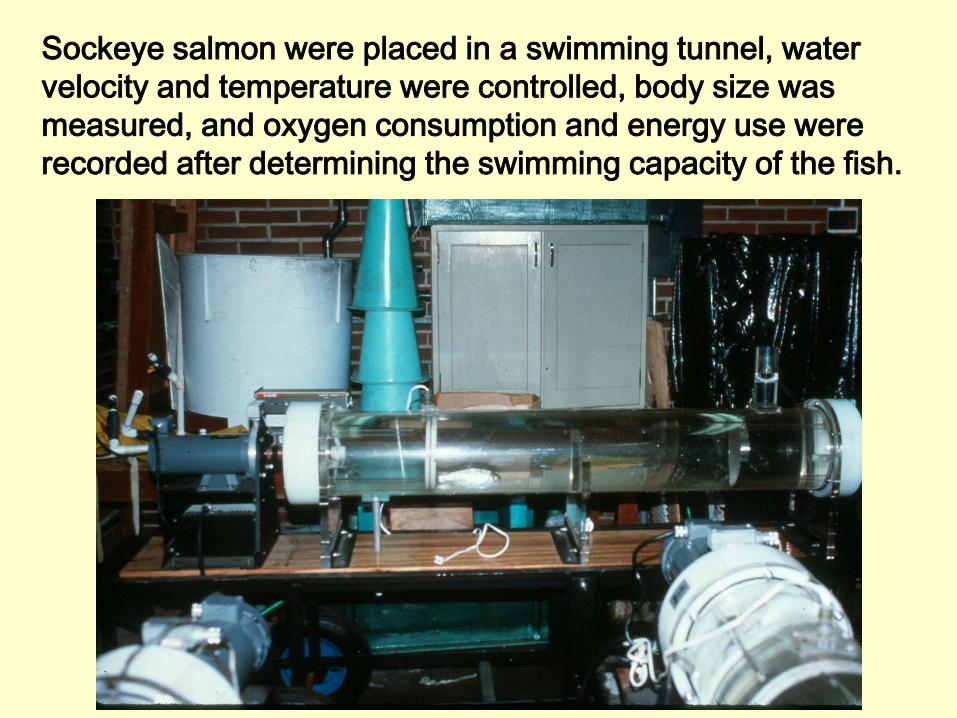
Sockeye salmon were placed in a swimming tunnel, water velocity and temperature were controlled, body size was measured, and oxygen consumption and energy use were recorded after determining the swimming capacity of the fish.
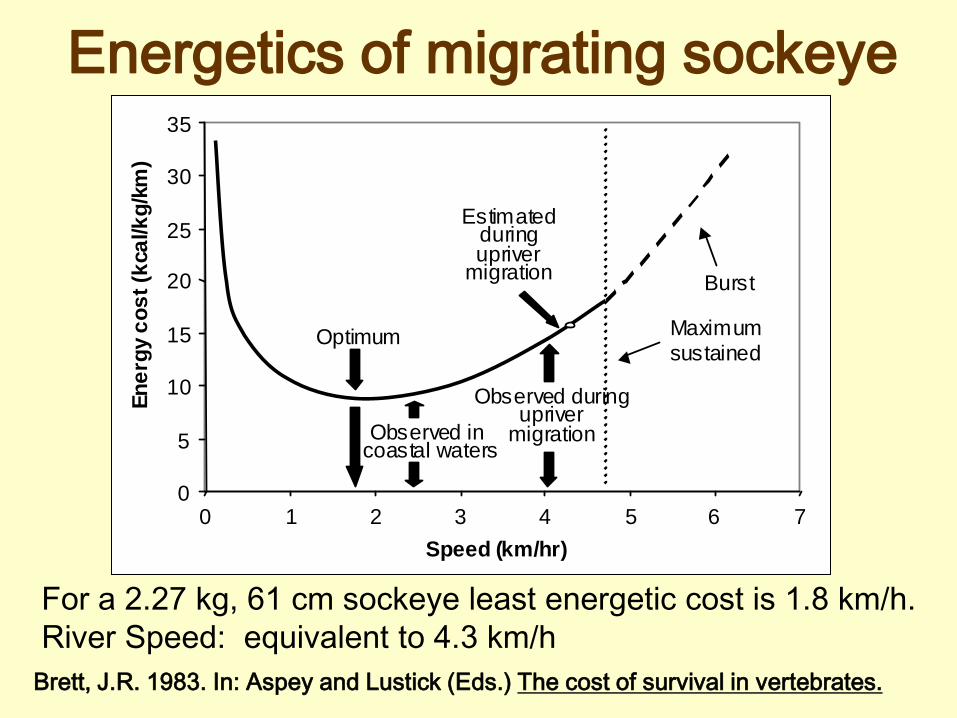
Energetics of migrating sockeye
0
5
10
15
20
25
30
35
0 1 2 3 4 5 6 7Speed (km/hr)
Ener
gy c
ost (
kcal
/kg/
km)
Optimum
Observed in coastal waters
Estimatedduringupriver
migration
Maximumsustained
Burst
Observed duringupriver
migration
For a 2.27 kg, 61 cm sockeye least energetic cost is 1.8 km/h. River Speed: equivalent to 4.3 km/h
Brett, J.R. 1983. In: Aspey and Lustick (Eds.) The cost of survival in vertebrates.
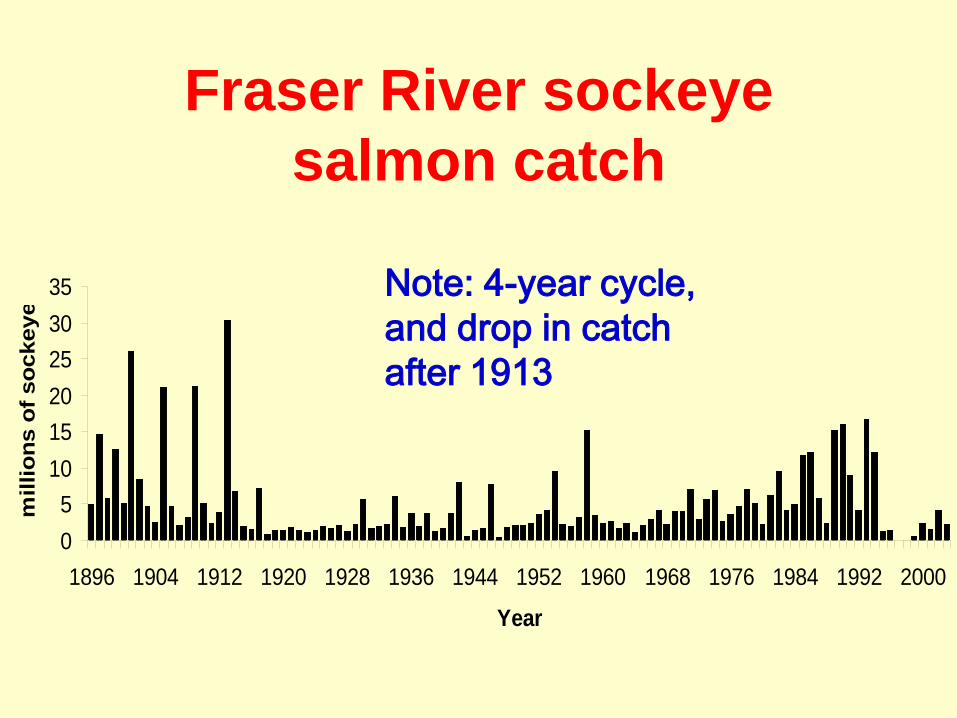
Fraser River sockeye salmon catch
05
101520253035
1896 1904 1912 1920 1928 1936 1944 1952 1960 1968 1976 1984 1992 2000
Year
mill
ions
of s
ocke
ye
Note: 4-year cycle, and drop in catch after 1913
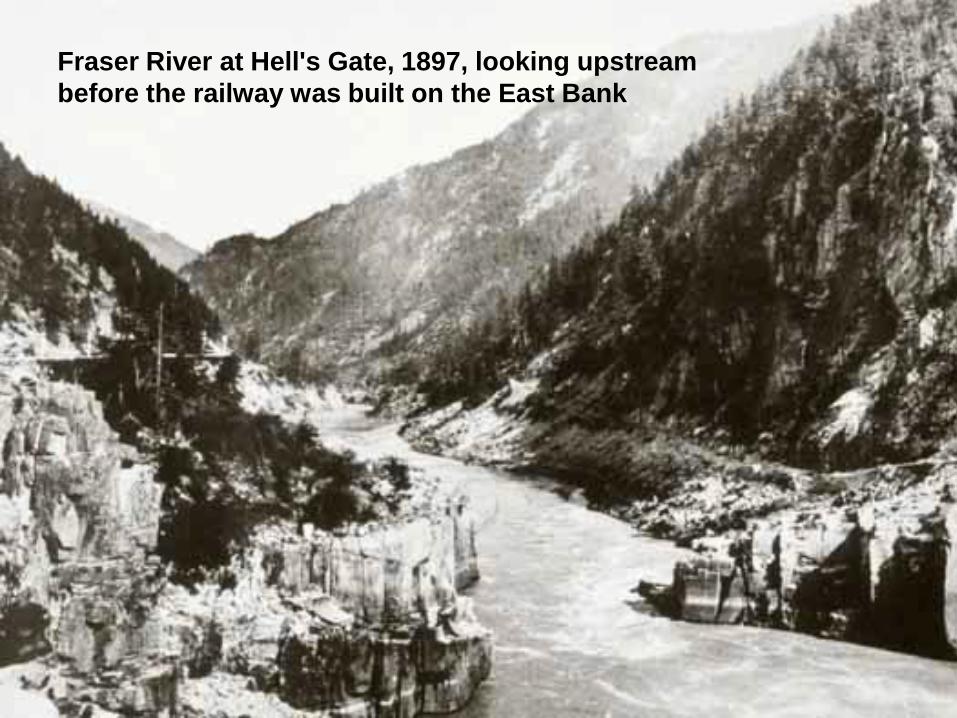
Fraser River at Hell's Gate, 1897, looking upstream before the railway was built on the East Bank
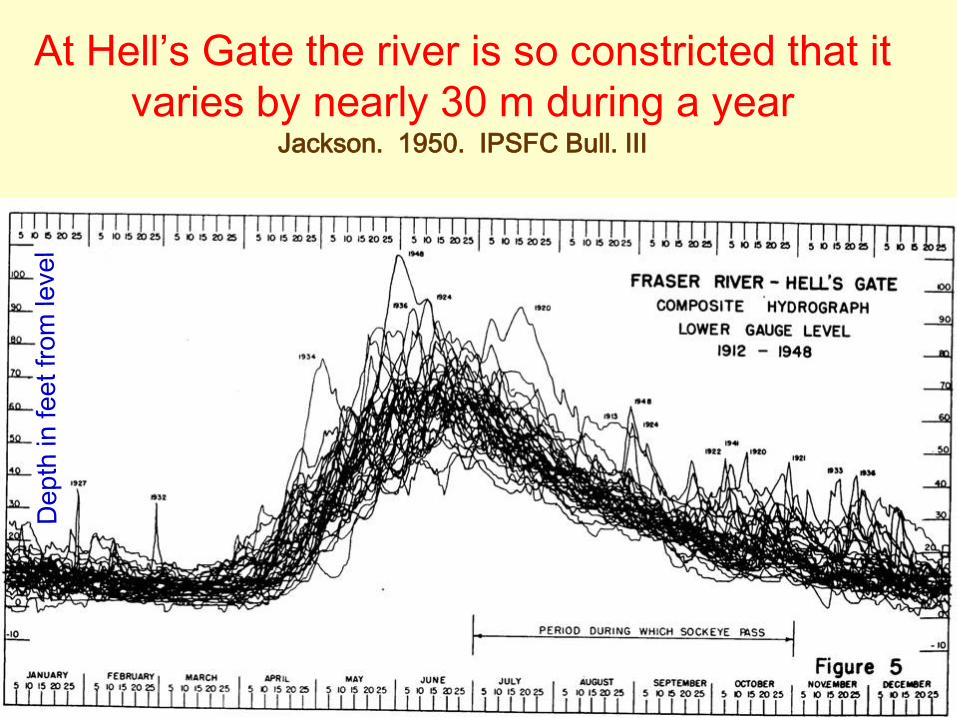
At Hell’s Gate the river is so constricted that it varies by nearly 30 m during a year
Jackson. 1950. IPSFC Bull. III

Hell’s Gate • The Fraser River was probably always
hard for salmon to ascend at Hell’s Gate (and other locations).
• 1913 - dumping of rock material from railway construction virtually blocked passage of fish; millions died unspawned
• 1914 Feb. 23: a huge rockslide, caused by Canadian Northern Railway tunneling, again greatly restricted flows
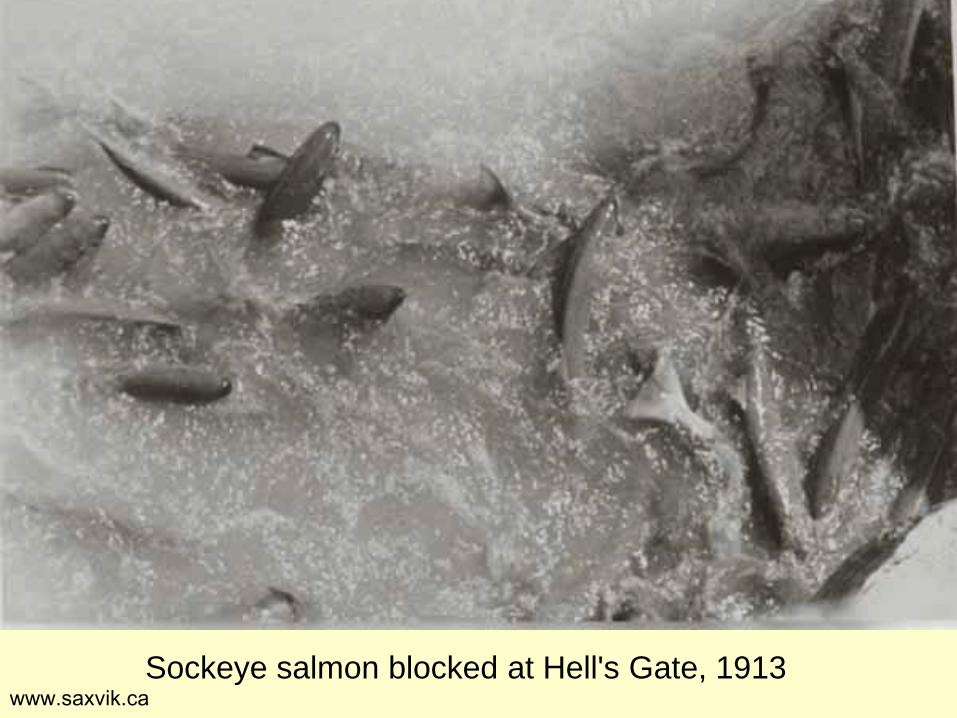
Sockeye salmon blocked at Hell's Gate, 1913 www.saxvik.ca
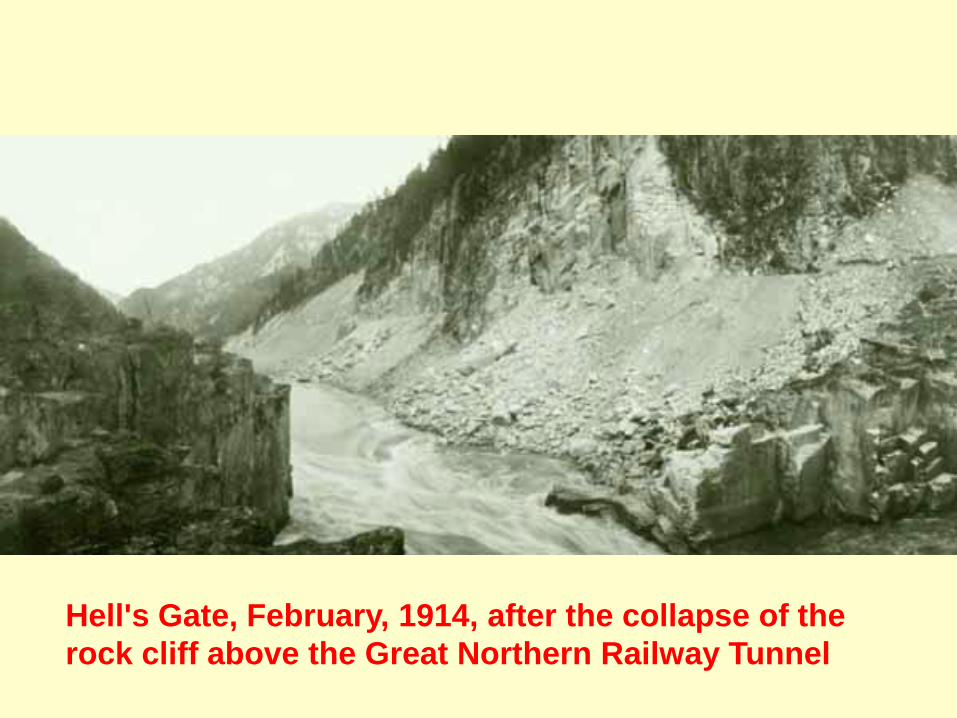
Hell's Gate, February, 1914, after the collapse of the rock cliff above the Great Northern Railway Tunnel

Hell’s Gate: 1915 • After the slide it was virtually impassable to
fish from levels 25 to 40 feet and difficult from 10 to 60.
• Vertical drop: 9 feet (after rocks removed). • Velocity: 5.0 to 6.75 meters per second
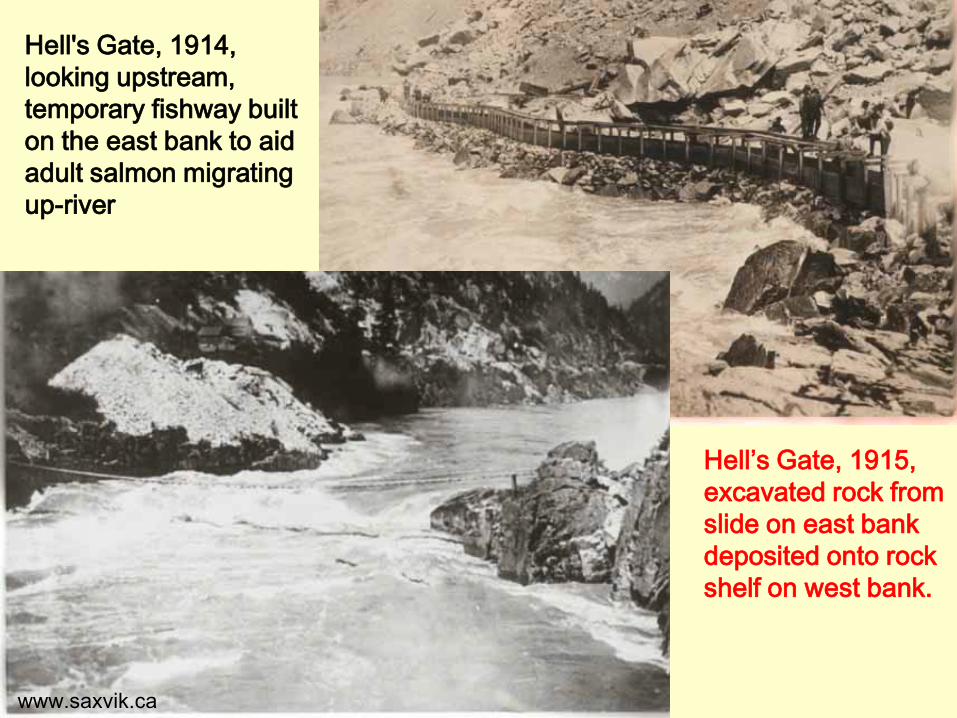
Hell’s Gate, 1915, excavated rock from slide on east bank deposited onto rock shelf on west bank.
Hell's Gate, 1914, looking upstream, temporary fishway built on the east bank to aid adult salmon migrating up-river
www.saxvik.ca
Hell’s Gate
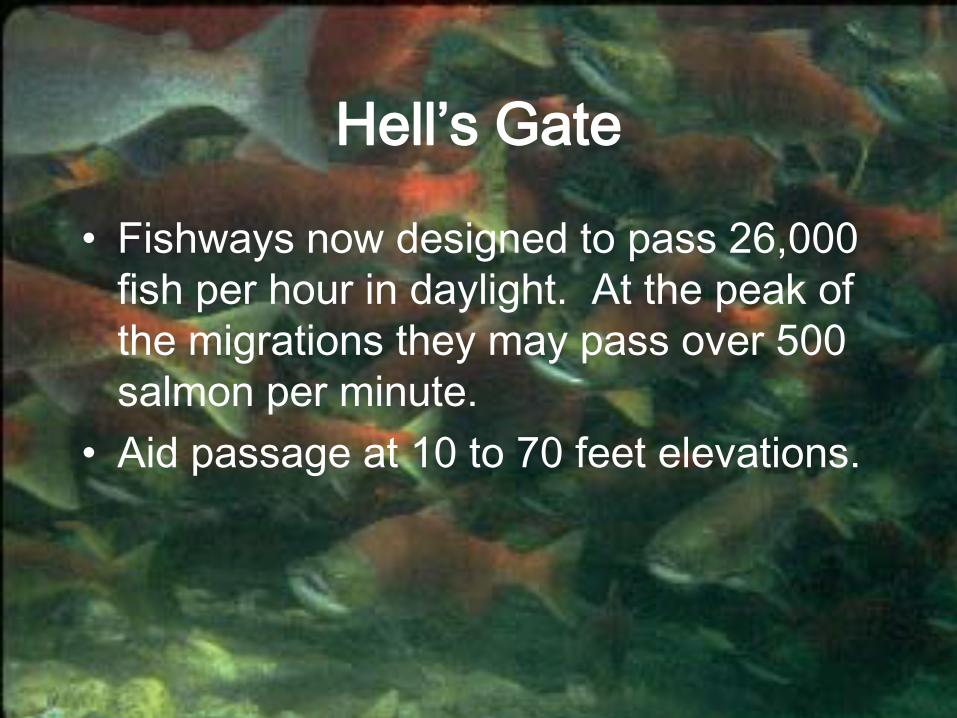
• Fishways now designed to pass 26,000 fish per hour in daylight. At the peak of the migrations they may pass over 500 salmon per minute.
• Aid passage at 10 to 70 feet elevations.

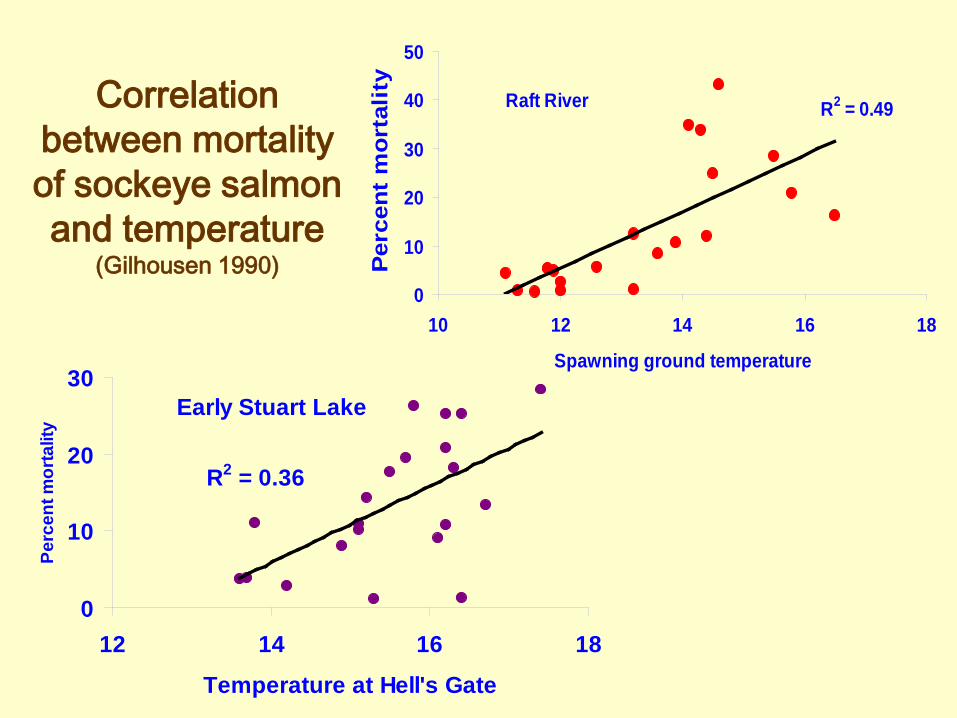
Correlation between mortality of sockeye salmon and temperature
(Gilhousen 1990)
R2 = 0.49
0
10
20
30
40
50
10 12 14 16 18
Spawning ground temperatureP
erce
nt m
orta
lity
Raft River
R2 = 0.36
0
10
20
30
12 14 16 18
Temperature at Hell's Gate
Perc
ent m
orta
lity
Early Stuart Lake
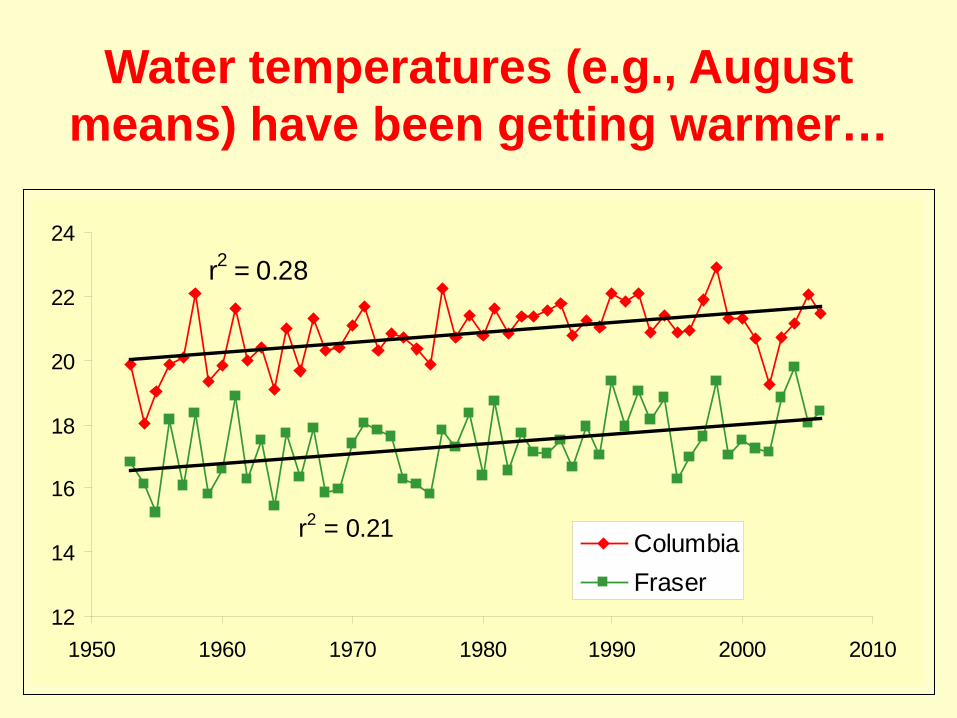
r2 = 0.28
r2 = 0.21
12
14
16
18
20
22
24
1950 1960 1970 1980 1990 2000 2010
ColumbiaFraser
Water temperatures (e.g., August means) have been getting warmer…
Med
ian
mig
ratio
n da
te
1940 1960 1980 2000
175
180
185
190
r2=0.43, p<0.0001
One response by salmon has been to avoid the warmer water. Columbia River sockeye are migrating earlier than in the past; steelhead are migrating later.
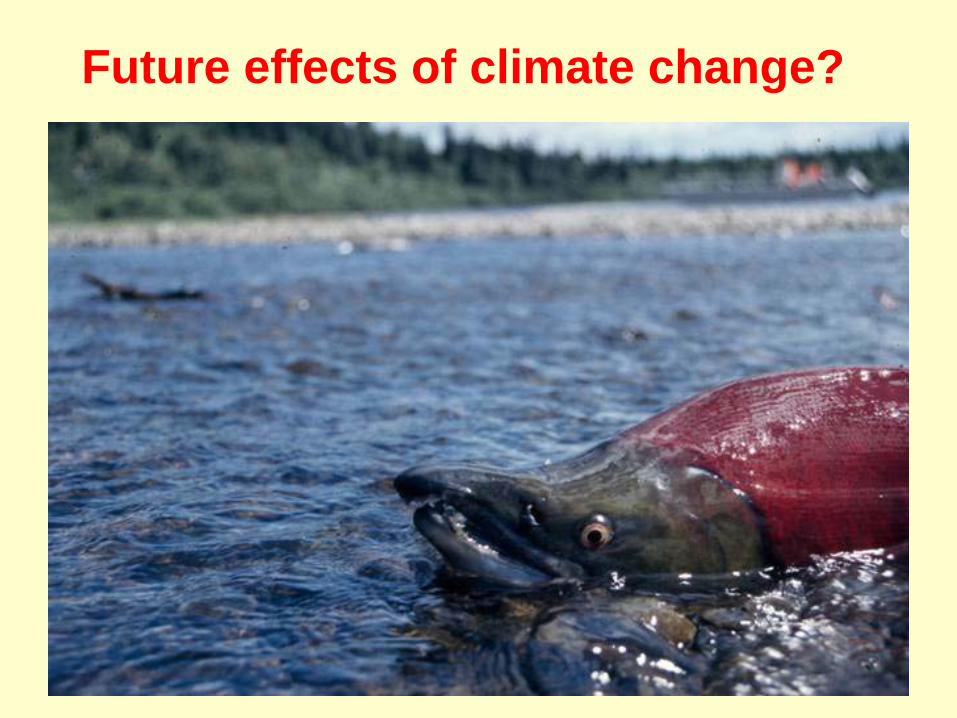
Future effects of climate change?

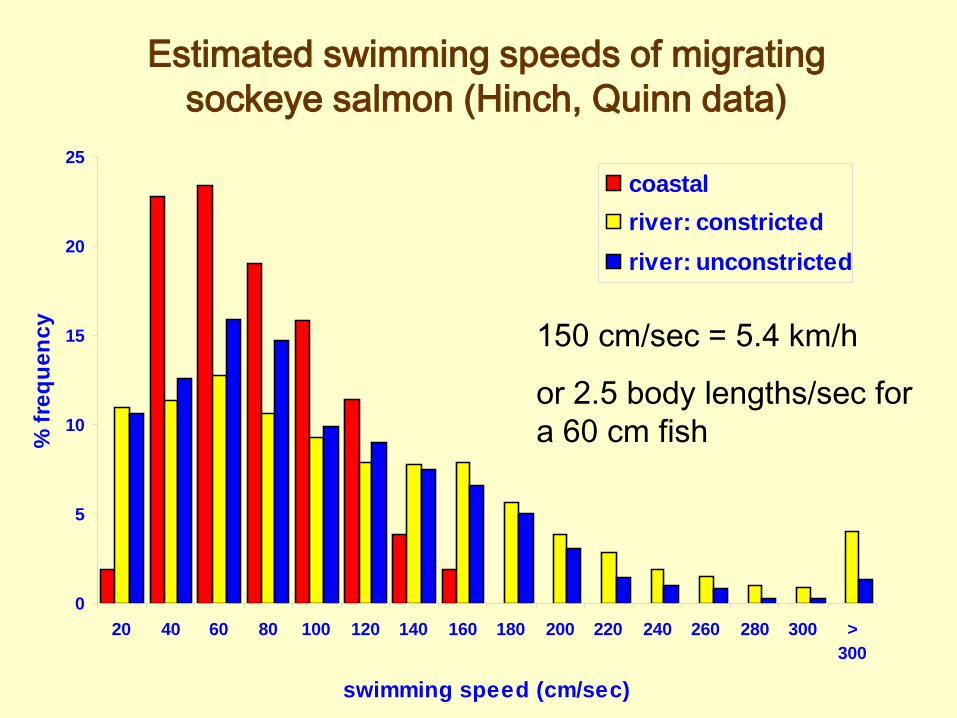
Estimated swimming speeds of migrating sockeye salmon (Hinch, Quinn data)
0
5
10
15
20
25
20 40 60 80 100 120 140 160 180 200 220 240 260 280 300 >300
swimming speed (cm/sec)
% fr
eque
ncy
coastalriver: constrictedriver: unconstricted
150 cm/sec = 5.4 km/h
or 2.5 body lengths/sec for a 60 cm fish
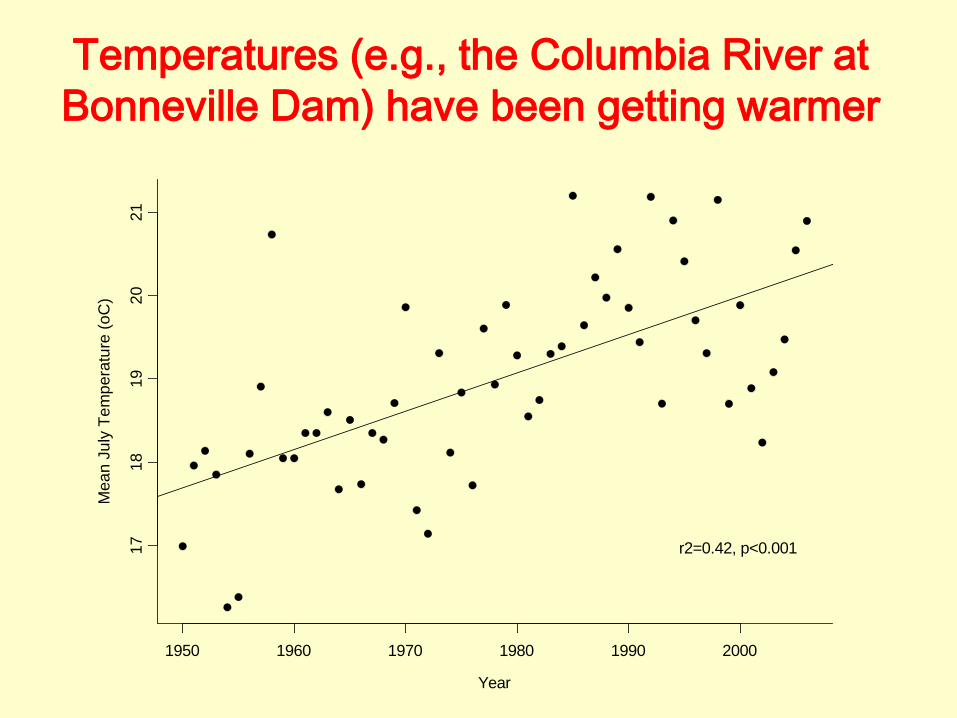
Year
Mea
n Ju
ly T
empe
ratu
re (o
C)
1950 1960 1970 1980 1990 2000
1718
1920
21
r2=0.42, p<0.001
Temperatures (e.g., the Columbia River at Bonneville Dam) have been getting warmer
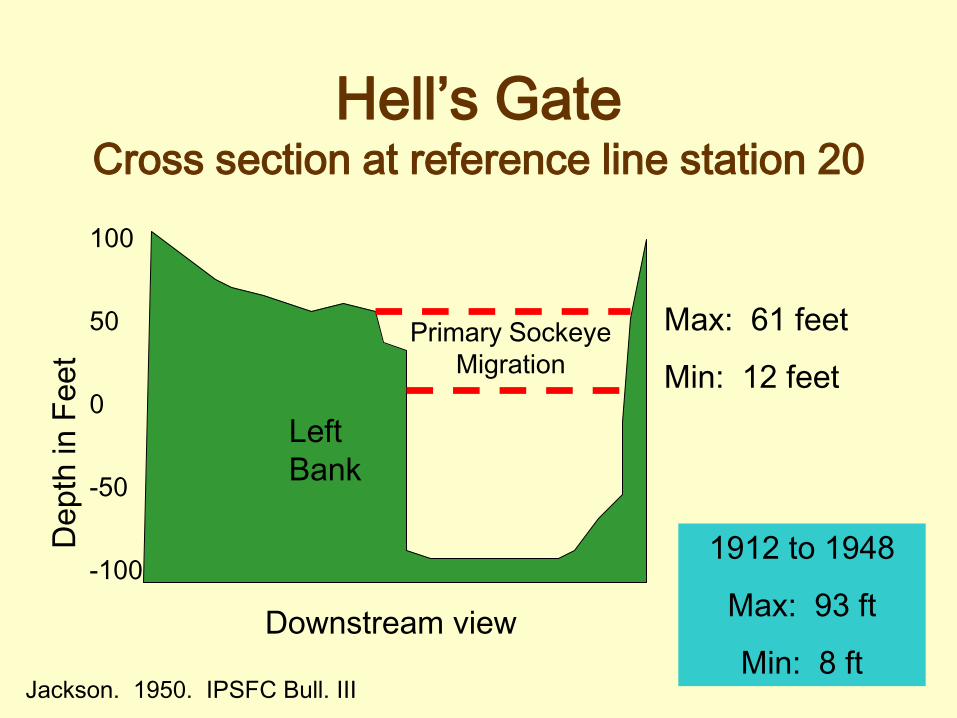
Hell’s Gate Cross section at reference line station 20
Primary Sockeye Migration
Left Bank
Downstream view
Dep
th in
Fee
t
100 50 0 -50 -100
Jackson. 1950. IPSFC Bull. III
Max: 61 feet
Min: 12 feet
1912 to 1948
Max: 93 ft
Min: 8 ft
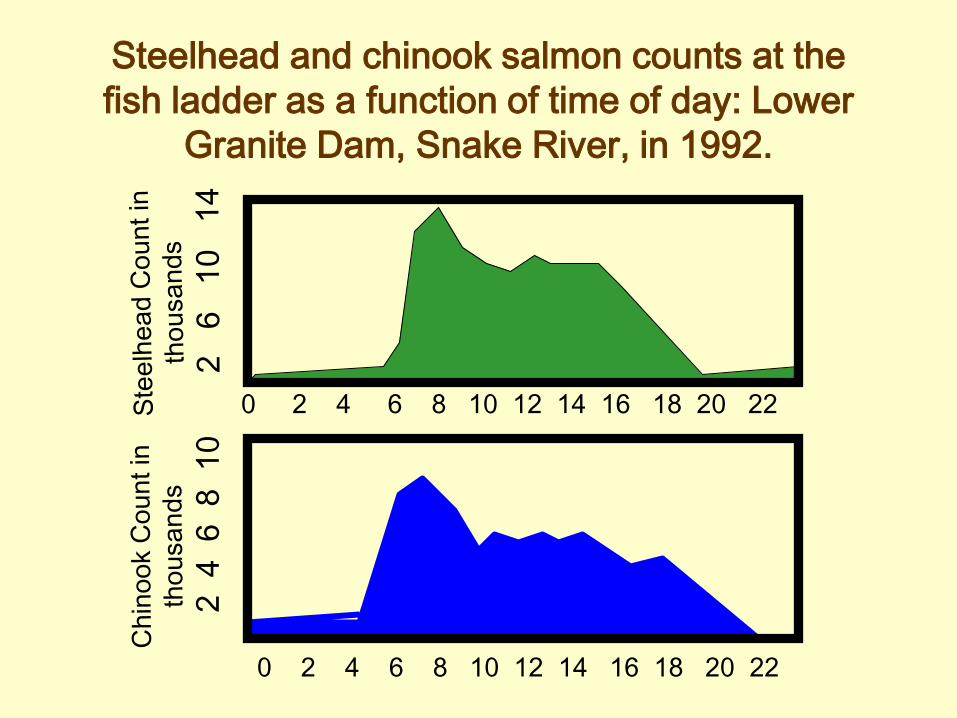
Steelhead and chinook salmon counts at the fish ladder as a function of time of day: Lower
Granite Dam, Snake River, in 1992.
0 2 4 6 8 10 12 14 16 18 20 22
0 2 4 6 8 10 12 14 16 18 20 22
2 4
6 8
10

Mid
-day
4 8 12 16 20 24 Hour of the day
Hayes (1953) B.F.R.B.C.
Timing of Atlantic salmon ascending the Le Havre River, Nova Scotia
Related Documents