TIhe help of the district general manager, the director of public health, and members of the department of public health medicine, Central Nottinghamshire Health Authority, is gratefully acknowledged. 1 Black 1). Itequal2tttes in health: report of1 zaorking group. London: HMlSO, 1980. 2 Whitchcad MN. Ihe, health divide: inequalities in health in the 1980s. Lonidon: Health Education Authority, 1987. 3 Hutchinson A, Fov C, Sandhu B. Comparison of two scores for allocating resouirccs to doctors in deprived areas. BAM,7 1989;299:1142-4. 4 H A Annual Public Health Rcports [computer programme]. IBM Format. Version 1.1. Bristol: Health Care Evaluation Unit; Bristol University, 1990. 5 Smith GD. Second thoughts on the Jarman index. BM1J 1991;302:359-60. 6 'Falbot RJ. Underprivileged areas and health care planning: implications of use of Jarman indicators ot' urhan deprivation. B.JM 1991;302:383-6. 7 'I'ownsctd P, Simpson D, Tibbs N. Inequalities in health in the city of Bristol: a preliminary review of statistical evidence. Int 7 Health Servz 1985;15: 637-63. 8 Carstairs V, Morris R. Deprivation mortality and resource allocation. CtommunitvlMedicine 1989;11:364-72. 9 Leavy R, Wood J. Does the underpriv-ileged area index work? JfIM 1985;291:709-1 1. 10 Charlton J, Lakhani A. Is the Jarman underprivileged area scorc valid? BMI] 1985;290:1715-6. 11 Brenner IH. Mortality and the national economy. Laneet 1979;ii:568-73. 12 Crombic 1K, Kenicer MIB, Smith WCS, Tunstall-Pedoe HD. Unemployment, socioensironmental factors, and coronary heart disease in Scotland. [rIHeartj 1989;61:172-7. 13 Cttrtis SE. ttse of sursvey data and small area statistics to assess the link hctwcen individual morbidity and ncighbourhood deprisation. Epidetmiol Conm- tunlltis fHealth 1990;44:62-8. 14 Dcpartment of Health and Social Security. Fittalrepttrt b\ tite NHS lanagerment Board o-fthe reviezv o>f the resourcee allocation .rtrrnula. London: HMSO, 1988. 15 Carstairs V. ttiltiple deprivation and health state. Communitys Medicine 198 1;3:4-13. 16 Mass N, Chin S. Relatiotn betwcen all cause stanidardised mortalitv ratios and two inidiccs otf deprivation at regionial and district level in England. 7 Epidemiol Commrnunitvy Ifealthl 1989;43:191-9. 17 Nottinghamshirc Count\ C(otuncil )epartment of Planning and Trainsportation. .Sinall area population esniizaiis 1989. Nottinlham: 'Thc County CouIcil, 199). P'opulation bulletin.' 18 Irving 1). Idetii afination of' utzder privileged areas: measuring the need for .N'HS services in the commn itv. London: London School of Economics, 1983. T'echnical papcr'). 19 ITionsend P. Phillimore P. Beattie A. Ilealth and deprivation: inequality and the north. London: Crroom Helm, 1988. 20) l)uguid G, Grant R. Areas of special teed in Scotland. Edinburgh: HMISO, 1983. 21 Department of- the Environment. Inzfcormation Note 2. Urban deprivation. London: HMSO, 1983. 22 Noittinghamshire (ount Ci'uncil )epartmentof'llanningaild 'ransportation. Nottinghanishire ward unemplievnient estimates: 1990 ,an-Dec. Nottingham: 'I'he County Cotincil, 1990, 1991. (Employment bulletin.' 23 Blaiid M. AnI inltroduction toi medical statistics. Oxf'ord: Oxford University PIress, 1987. 24 Thunhurst C. 'I'hc analysis of small area statistics and planning for health. T'Ihe Statiistiitan 1985;34:93-1()6. 25 Carr-Hill R, Shcldon 'T. Designing a deprivation payment for general practitioncrs: the UPA 8 woildcrland. BR1M7 1991;302:393-6. 26 Hart N. Inequalities in health: the individual versus the environment. 7ournal if the Royal Statistical Society A 1986;149:228-46. 27 West P. Iliequalities? Social class differentials in health in British south. Soc Sci Aled 1988;27:291-6. 28 Carstairs V -Morris R. Dcprivation and health. Bf1 j 1989;299:1462. 29 1991) Labour force surv eN preliminary results. Employment (azette 1991;99(4): 175-96. 30 P'issaridcs C, \'adswortli J. Wlho are the uneniplcsed? London; London School of Ecoitomics, 199(1 Centre for Economic Performance discussion papcr No 12. 31 Yuen P. Balarajan R. Unemployment and pattcrns of consultation with the gencral practitioner. 1A1.17 1989;298:1212-4. 32 Moser K Goldblatt P1 Pox A, Jones D. Unemployment and mortality: comparisoii ot the 1971 and 1981 longitudinal study census samples. BM1I 987;294:86-90). .Ac ceptcd 12juls' 1991: Pepartment of Geriatrics, (University of Uppsala, 2r Uppsala, Sweden Einar T Skarfors, MD, - consultant K Ingemar Selinus, MSC, statistician Hans 0 Lithell, MD, professor Correspondence to: Dr Skarfors. BMJ_ 1991;303:755-60 Risk factors for developing non-insulin dependent diabetes: a 10 year follow up of men in Uppsala/( Einar TjSkarfors, K Ingemar elinus, Hans OLLithell Abstract Objective-To analyse anthropometric and meta- bolic characteristics as risk factors for development of non-insulin dependent diabetes mellitus in middle aged normoglycaemic men. Design-Prospective population study based on data collected in a health survey and follow up 10 years later. Setting-Uppsala, a middle sized city in Sweden. Subjects-2322 men aged 47-53, of whom 1860 attended the follow up 7-14 years later, at which time they were aged 56-64. Main outcome measures - Incidence of non-insulin dependent diabetes. Results-In a multivariate logistic regression analysis, variations of 1 SD from the mean of the group that remained euglycaemic were used to calculate odds ratios and 95% confidence intervals. Blood glucose concentration 60 minutes after the start of an intravenous glucose tolerance test (odds ratio=5-93, 95% confidence interval 3-05 to 11-5), fasting serum insulin concentration (2-12, 1-54 to 2.93), acute insulin increment at an intravenous glucose tolerance test (1-71, 1 21 to 2 43), body mass index (1-41, 1-01 to 1-97), and systolic blood pressure (1-23, 0 97 to 1.56) were independent predictors of diabetes. In addition, the use of antihypertensive drugs at follow up (selective or unselective 13 blocking agents, thiazides, or hydralazine) was an independent risk factor (1.70, 1-11 to 2 60). Conclusions -Metabolic and anthropometric characteristics associated with or reflecting insulin resistance as well as a poor acute insulin response to glucose challenge were important predictors of future diabetes in middle aged men. Antihypertensive drugs were found to constitute a further, iatrogenic risk factor. Introduction That obesity is one of the predisposing factors for non-insulin dependent diabetes mellitus has been shown in several prospective population studies. '` Hereditary factors as expressed by a history of diabetes in close relatives also seem to be important.69 During the past decade criteria for impaired glucose tolerance and non-insulin dependent diabetes have been set using the oral glucose tolerance test. In the early 1976s the intravenous glucose tolerance test seemed a likely tool for diagnosing diabetes, but no criteria for using it to diagnose non-insulin dependent diabetes have been proposed. A low insulin concentration soon after glucose injection is found in normoglycaemic relatives of patients with non-insulin dependent diabetes and also in patients with impaired glucose tolerance or non- insulin dependent diabetes.'°"I It has been suggested that people with a low early insulin response are at risk of developing non-insulin dependent diabetes,'2 but this has not been confirmed in prospective studies. Impaired insulin action (insulin resistance) is a pre- cursor of non-insulin dependent diabetes in Pima Indians and Mexican-Americans'3-'6 and white European women. 17 During 1970-3 the intravenous glucose tolerance test was used in a large population based survey in Uppsala, Sweden, to characterise glucose metabolism in middle aged men. The present study aims to investigate the incidence of non-insulin dependent diabetes during an observation period of about 10 years in these men and BMJ VOLUME 303 28 SEPTEMBER 1991 755 on 24 February 2022 by guest. Protected by copyright. http://www.bmj.com/ BMJ: first published as 10.1136/bmj.303.6805.755 on 28 September 1991. Downloaded from

Welcome message from author
This document is posted to help you gain knowledge. Please leave a comment to let me know what you think about it! Share it to your friends and learn new things together.
Transcript
TIhe help of the district general manager, the director ofpublic health, and members of the department of publichealth medicine, Central Nottinghamshire Health Authority,is gratefully acknowledged.
1 Black 1). Itequal2tttes in health: report of1 zaorking group. London: HMlSO,1980.
2 Whitchcad MN. Ihe, health divide: inequalities in health in the 1980s. Lonidon:Health Education Authority, 1987.
3 Hutchinson A, Fov C, Sandhu B. Comparison of two scores for allocatingresouirccs to doctors in deprived areas. BAM,7 1989;299:1142-4.
4 H A Annual Public Health Rcports [computer programme]. IBM Format.Version 1.1. Bristol: Health Care Evaluation Unit; Bristol University, 1990.
5 Smith GD. Second thoughts on the Jarman index. BM1J 1991;302:359-60.6 'Falbot RJ. Underprivileged areas and health care planning: implications of use
of Jarman indicators ot' urhan deprivation. B.JM 1991;302:383-6.7 'I'ownsctd P, Simpson D, Tibbs N. Inequalities in health in the city of Bristol:
a preliminary review of statistical evidence. Int 7 Health Servz 1985;15:637-63.
8 Carstairs V, Morris R. Deprivation mortality and resource allocation.CtommunitvlMedicine 1989;11:364-72.
9 Leavy R, Wood J. Does the underpriv-ileged area index work? JfIM1985;291:709-1 1.
10 Charlton J, Lakhani A. Is the Jarman underprivileged area scorc valid? BMI]1985;290:1715-6.
11 Brenner IH. Mortality and the national economy. Laneet 1979;ii:568-73.12 Crombic 1K, Kenicer MIB, Smith WCS, Tunstall-Pedoe HD. Unemployment,
socioensironmental factors, and coronary heart disease in Scotland.[rIHeartj 1989;61:172-7.
13 Cttrtis SE. ttse of sursvey data and small area statistics to assess the link hctwcenindividual morbidity and ncighbourhood deprisation. Epidetmiol Conm-tunlltis fHealth 1990;44:62-8.
14 Dcpartment of Health and Social Security. Fittalrepttrt b\ titeNHS lanagermentBoard o-fthe reviezv o>f the resourcee allocation.rtrrnula. London: HMSO, 1988.
15 Carstairs V. ttiltiple deprivation and health state. Communitys Medicine198 1;3:4-13.
16 Mass N, Chin S. Relatiotn betwcen all cause stanidardised mortalitv ratios and
two inidiccs otf deprivation at regionial and district level in England.7 Epidemiol Commrnunitvy Ifealthl 1989;43:191-9.
17 Nottinghamshirc Count\ C(otuncil )epartment of Planning and Trainsportation..Sinall area population esniizaiis 1989. Nottinlham: 'Thc County CouIcil,199). P'opulation bulletin.'
18 Irving 1). Idetii afination of' utzder privileged areas: measuring the need for .N'HSservices in the commn itv. London: London School of Economics, 1983.T'echnical papcr').
19 ITionsend P. Phillimore P. Beattie A. Ilealth and deprivation: inequality and thenorth. London: Crroom Helm, 1988.
20) l)uguid G, Grant R. Areas of special teed in Scotland. Edinburgh: HMISO,1983.
21 Department of- the Environment. Inzfcormation Note 2. Urban deprivation.London: HMSO, 1983.
22 Noittinghamshire (ount Ci'uncil )epartmentof'llanningaild 'ransportation.Nottinghanishire ward unemplievnient estimates: 1990 ,an-Dec. Nottingham:'I'he County Cotincil, 1990, 1991. (Employment bulletin.'
23 Blaiid M. AnI inltroduction toi medical statistics. Oxf'ord: Oxford University PIress,1987.
24 Thunhurst C. 'I'hc analysis of small area statistics and planning for health. T'IheStatiistiitan 1985;34:93-1()6.
25 Carr-Hill R, Shcldon 'T. Designing a deprivation payment for generalpractitioncrs: the UPA 8 woildcrland. BR1M7 1991;302:393-6.
26 Hart N. Inequalities in health: the individual versus the environment. 7ournalif the Royal Statistical Society A 1986;149:228-46.
27 West P. Iliequalities? Social class differentials in health in British south. SocSciAled 1988;27:291-6.
28 Carstairs V -Morris R. Dcprivation and health. Bf1 j 1989;299:1462.29 1991) Labour force surv eN preliminary results. Employment (azette 1991;99(4):
175-96.30 P'issaridcs C, \'adswortli J. Wlho are the uneniplcsed? London; London School
of Ecoitomics, 199(1 Centre for Economic Performance discussion papcr No12.
31 Yuen P. Balarajan R. Unemployment and pattcrns of consultation with thegencral practitioner. 1A1.17 1989;298:1212-4.
32 Moser K Goldblatt P1 Pox A, Jones D. Unemployment and mortality:comparisoii ot the 1971 and 1981 longitudinal study census samples. BM1I987;294:86-90).
.Ac ceptcd 12juls' 1991:
Pepartment of Geriatrics,(University of Uppsala,
2r Uppsala, SwedenEinar T Skarfors, MD, -consultantK Ingemar Selinus, MSC,statisticianHans 0 Lithell, MD, professor
Correspondence to:Dr Skarfors.
BMJ_ 1991;303:755-60
Risk factors for developing non-insulin dependent diabetes: a 10year follow up of men in Uppsala/(Einar TjSkarfors, K Ingemar elinus, Hans OLLithell
AbstractObjective-To analyse anthropometric and meta-
bolic characteristics as risk factors for developmentof non-insulin dependent diabetes mellitus in middleaged normoglycaemic men.Design-Prospective population study based on
data collected in a health survey and follow up 10years later.Setting-Uppsala, a middle sized city in Sweden.Subjects-2322 men aged 47-53, of whom 1860
attended the follow up 7-14 years later, at which timethey were aged 56-64.Main outcome measures- Incidence ofnon-insulin
dependent diabetes.Results-In a multivariate logistic regression
analysis, variations of 1 SD from the mean of thegroup that remained euglycaemic were used tocalculate odds ratios and 95% confidence intervals.Blood glucose concentration 60 minutes after thestart of an intravenous glucose tolerance test (oddsratio=5-93, 95% confidence interval 3-05 to 11-5),fasting serum insulin concentration (2-12, 1-54 to2.93), acute insulin increment at an intravenousglucose tolerance test (1-71, 1 21 to 2 43), body massindex (1-41, 1-01 to 1-97), and systolic blood pressure(1-23, 0 97 to 1.56) were independent predictors ofdiabetes. In addition, the use of antihypertensivedrugs at follow up (selective or unselective 13 blockingagents, thiazides, or hydralazine) was an independentrisk factor (1.70, 1-11 to 2 60).
Conclusions -Metabolic and anthropometriccharacteristics associated with or reflecting insulinresistance as well as a poor acute insulin response toglucose challenge were important predictors offuture diabetes in middle aged men. Antihypertensive
drugs were found to constitute a further, iatrogenicrisk factor.
IntroductionThat obesity is one of the predisposing factors for
non-insulin dependent diabetes mellitus has beenshown in several prospective population studies. '`Hereditary factors as expressed by a history of diabetesin close relatives also seem to be important.69
During the past decade criteria for impaired glucosetolerance and non-insulin dependent diabetes havebeen set using the oral glucose tolerance test. In theearly 1976s the intravenous glucose tolerance testseemed a likely tool for diagnosing diabetes, but nocriteria for using it to diagnose non-insulin dependentdiabetes have been proposed.A low insulin concentration soon after glucose
injection is found in normoglycaemic relatives ofpatients with non-insulin dependent diabetes and alsoin patients with impaired glucose tolerance or non-insulin dependent diabetes.'°"I It has been suggestedthat people with a low early insulin response are at riskof developing non-insulin dependent diabetes,'2 butthis has not been confirmed in prospective studies.Impaired insulin action (insulin resistance) is a pre-cursor of non-insulin dependent diabetes in PimaIndians and Mexican-Americans'3-'6 and whiteEuropean women. 17
During 1970-3 the intravenous glucose tolerance testwas used in a large population based survey in Uppsala,Sweden, to characterise glucose metabolism in middleaged men. The present study aims to investigate theincidence of non-insulin dependent diabetes during anobservation period of about 10 years in these men and
BMJ VOLUME 303 28 SEPTEMBER 1991 755
on 24 February 2022 by guest. P
rotected by copyright.http://w
ww
.bmj.com
/B
MJ: first published as 10.1136/bm
j.303.6805.755 on 28 Septem
ber 1991. Dow
nloaded from
to find the risk factors for non-insulin dependentdiabetes by using metabolic features, anthropometricmeasures, history of diabetes among relatives, and,especially, insulin concentrations at intravenousglucose tolerance test. Observations that diabetes isoverrepresented among treated hypertensive men'"and women'" prompted us to evaluate hypertensivedrugs as a risk factor for non-insulin dependentdiabetes.
MethodsSUBJECTS
Between 1970 and 1973 the health of 2841 men born1920-4 and resident in Uppsala was surveyed. In all,2322 (81-7%) attended. The survey aimed to identifyrisk factors for cardiovascular disease in middleaged men and to select individuals at high risk fortreatment,2") and it used an intravenous glucosetolerance test to characterise the participants withregard to glucose metabolism and insulin values."I '2
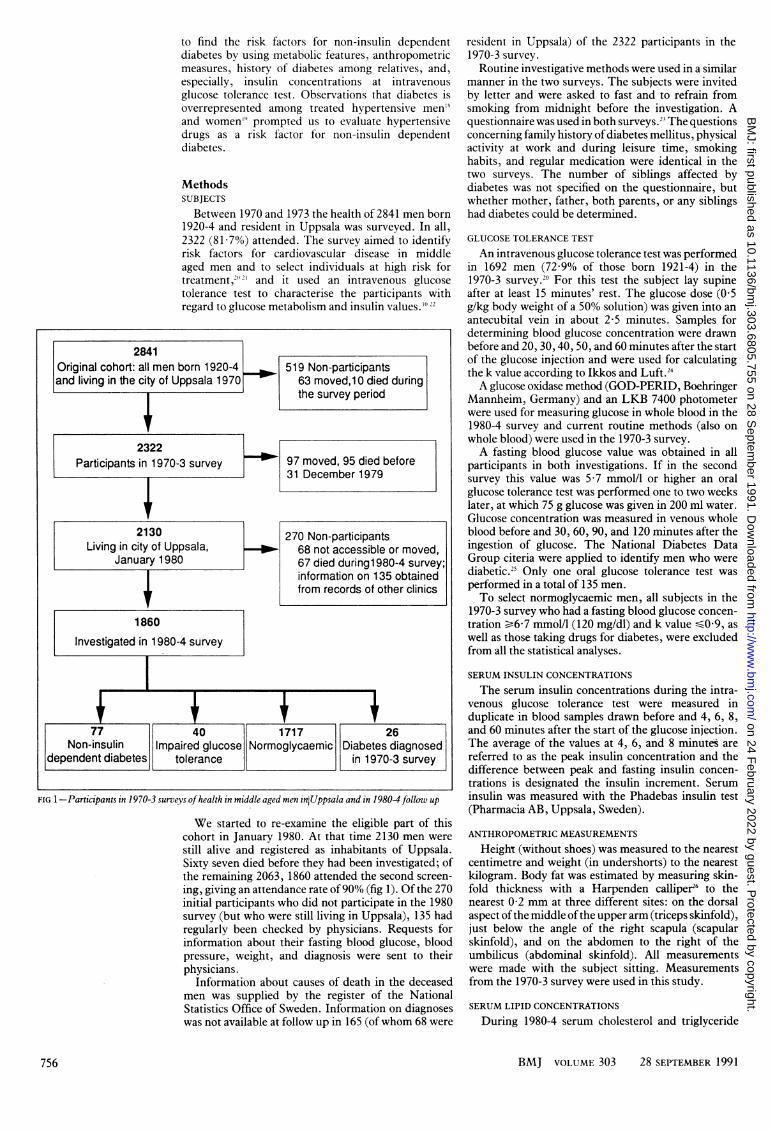
2841Original cohort: all men born 1920-4 _ 519 Non-participantsand living in the city of Uppsala 1970 63 moved,10 died during
the survey period
2322Participants in 1970-3 survey +-1 97 moved, 95 died before
| 31 December 1979
1860
Investigated in 1980-4 survey
7 40 1717 26Non-insulin Impaired glucose Normoglycaemic Diabetes diagnosed
dependent diabetes tolerance in 1970-3 survey
FIG 1-Participants in 1970-3 surveys ofhealth in middle aged men iniUppsala and in 19804 follow up
We started to re-examine the eligible part of thiscohort in January 1980. At that time 2130 men were
still alive and registered as inhabitants of Uppsala.Sixty seven died before they had been investigated; ofthe remaining 2063, 1860 attended the second screen-
ing, giving an attendance rate of90% (fig 1). Of the 270initial participants who did not participate in the 1980survey (but who were still living in Uppsala), 135 hadregularly been checked by physicians. Requests forinformation about their fasting blood glucose, bloodpressure, weight, and diagnosis were sent to theirphysicians.
Information about causes of death in the deceasedmen was supplied by the register of the NationalStatistics Office of Sweden. Information on diagnoseswas not available at follow up in 165 (ofwhom 68 were
resident in Uppsala) of the 2322 participants in the1970-3 survey.Routine investigative methods were used in a similar
manner in the two surveys. The subjects were invitedby letter and were asked to fast and to refrain fromsmoking from midnight before the investigation. Aquestionnaire was used in both surveys.2' The questionsconcerning family history ofdiabetes mellitus, physicalactivity at work and during leisure time, smokinghabits, and regular medication were identical in thetwo surveys. The number of siblings affected bydiabetes was not specified on the questionnaire, butwhether mother, father, both parents, or any siblingshad diabetes could be determined.
GLUCOSE TOLERANCE TEST
An intravenous glucose tolerance test was performedin 1692 men (7299% of those born 1921-4) in the1970-3 survey.20 For this test the subject lay supineafter at least 15 minutes' rest. The glucose dose (0 5g/kg body weight of a 50% solution) was given into anantecubital vein in about 2-5 minutes. Samples fordetermining blood glucose concentration were drawnbefore and 20, 30, 40, 50, and 60 minutes after the startof the glucose injection and were used for calculatingthe k value according to Ikkos and Luft.2'A glucose oxidase method (GOD-PERID, Boehringer
Mannheim, Germany) and an LKB 7400 photometerwere used for measuring glucose in whole blood in the1980-4 survey and current routine methods (also onwhole blood) were used in the 1970-3 survey.A fasting blood glucose value was obtained in all
participants in both investigations. If in the secondsurvey this value was 5 7 mmol/l or higher an oralglucose tolerance test was performed one to two weekslater, at which 75 g glucose was given in 200 ml water.Glucose concentration was measured in venous wholeblood before and 30, 60, 90, and 120 minutes after theingestion of glucose. The National Diabetes DataGroup citeria were applied to identify men who werediabetic.25 Only one oral glucose tolerance test wasperformed in a total of 135 men.To select normoglycaemic men, all subjects in the
1970-3 survey who had a fasting blood glucose concen-tration -6-7 mmol/l (120 mg/dl) and k value -0 9, aswell as those taking drugs for diabetes, were excludedfrom all the statistical analyses.
SERUM INSULIN CONCENTRATIONS
The serum insulin concentrations during the intra-venous glucose tolerance test were measured induplicate in blood samples drawn before and 4, 6, 8,and 60 minutes after the start of the glucose injection.The average of the values at 4, 6, and 8 minutes arereferred to as the peak insulin concentration and thedifference between peak and fasting insulin concen-trations is designated the insulin increment. Seruminsulin was measured with the Phadebas insulin test(Pharmacia AB, Uppsala, Sweden).
ANTHROPOMETRIC MEASUREMENTS
Height (without shoes) was measured to the nearestcentimetre and weight (in undershorts) to the nearestkilogram. Body fat was estimated by measuring skin-fold thickness with a Harpenden calliper26 to thenearest 0 2 mm at three different sites: on the dorsalaspect ofthe middle ofthe upper arm (triceps skinfold),just below the angle of the right scapula (scapularskinfold), and on the abdomen to the right of theumbilicus (abdominal skinfold). All measurementswere made with the subject sitting. Measurementsfrom the 1970-3 survey were used in this study.
SERUM LIPID CONCENTRATIONS
During 1980-4 serum cholesterol and triglyceride
BMJ VOLUME 303 28 SEPTEMBER 1991
270 Non-participants68 not accessible or moved,67 died during 1 980-4 survey;information on 135 obtainedfrom records of other clinics
756
on 24 February 2022 by guest. P
rotected by copyright.http://w
ww
.bmj.com
/B
MJ: first published as 10.1136/bm
j.303.6805.755 on 28 Septem
ber 1991. Dow
nloaded from
concentrations were measured in a Technicon auto-analyser type JJ27 both on samples from the secondsurvey and on serum samples that had been stored inliquid nitrogen since 1970-3. The concentration ofcholesterol in high density lipoprotein was assayed inthe supernatant after very low and low density lipo-proteins had been precipitated with a solution ofheparin and manganese chloride.28 Other bloodanalyses (serum urate, calcium, albumin, andphosphate concentrations) were performed by themethods in use at the time of the first survey at thedepartment of clinical chemistry of the UniversityHospital, Uppsala."
STATISTICS
A stepwise logistic regression program,BMDPLR, was used to test the importance of somevariables that were univariately associated with thedevelopment of diabetes-namely, supine systolic anddiastolic blood pressures, subscapular skinfoldmeasurement, fasting glucose concentration andglucose concentration at 60 minutes, fasting insulinconcentration and insulin concentration at 60 minutes,the k value of the intravenous glucose tolerance test,body mass index, insulin to glucose ratio (fasting and at60 minutes), peak insulin value, insulin increment,serum triglyceride concentration, and family historyfor diabetes mellitus. Antihypertensive drugs being
TABLE I-Family history of diabetes and development of diabetes inmiddle aged Swedish men (10 years' observation)
No of close relatives No (%) developingwith diabetes Total diabetes
None 1488 51 (3-4)1 251 17 (6 8)
2 or more 55 9 (16-4)
Total 1794 77
TABLE II-Body mass index and incidence ofdiabetes in Swedish men
Bodv mass index No (%) with(kg/rm) Total diabetes
<22-99 496 7 (1 4)23-00- 474 10 (2 1)25-00- 427 15 (3-5)27-00- 224 11 (4-9)29-00- 107 14(13-1)
>31-00 66 20(30-3)
Total 1794 77
TABLE III-Baseline characteristics ofmen who remained nornoglycaemic and those who developed diabetes
p ValueDeveloped (95% confidence interval)
Variable Normoglvcaemic diabetes for difference between means
Mean (SD) blood glucose at 60 minutes (mmol/l) 10-9 (2-8) 15-6 (3-0) <0-0001 (-5-5 to -3-9)(n= 1341) (n= 50)
Mean (SD) fasting serum insulin (mU/1) 12-4 (6-9) 21-1 (11-9) <0-0001 (- 10-7 to -6-8)(n= 1354) (n= 52)
Mean (SD) insulin increment (mU/I) 59-8 (47-6) 33-5 (35-1) <0-0002 (12-4 to 40-2)(n= 1262) (n=46)
Mean (SD) body mass index (kg/m') 24-73 (2-93) 28-57 (4-03) <0-0001 (-4-6 to -3-1)(n= 1679) (n=69)
Mean (SD) systolic blood pressure (mm Hg) 131-6 (16-7) 144-6 (24-1) <0-0001 (- 17-2 to -8-9)(n= 1679) (n=69)
Mean (SD) insulin at 60 minutes (mU/1) 27-1 (17-1) 47-0 (21-8) <0-0001 (-24-8 to - 15*2)(n= 1350) (n=52)
Mean (SD) abdominal skinfold (mm) 19-5 (9-3) 28-4 (9-8) <0-0001 (- 12-1 to 5-5)(n= 1025) (n=32)
Mean (SD) heart rate (beats/min) 68-2 (10-3) 72-9 (10-8) <0-0002 (-7-2 to 2-2)(n= 1679) (n=69)
Mean (SD) diastolic blood pressure (mm Hg) 82-7 (10-5) 91-5 (12-9) <0-0001 (11 4 to -6-3)(n= 1679) (n=69)
Mean (SD) serum triglycerides (mmolUl) 2-05 (1-14) 3-15(2-15) <0-0001( 1-38 to -0-81)(n= 1679) (n=69)
Mean (SD) serum cholesterol (mmol/l) 6-47(1-23) 6-72 (1-28) 0-10 (-0-55 to0-05)(n= 1679) (n=69)
Mean (SD) serum high density lipoprotein (mmol/l) 1-17 (0-32) 1-08 (0-26) 0-047 (0-00 to 0-18)(n= 1367) (n= 51)
taken at follow up (t blockers, thiazides, andhydralazine) were also added.The odds of an event is defined as p/(l- p), where p
is the probability of the event (the risk). The product[Pt/(lP1)] [l P2)/P2] is the odds ratio, where Piis the probability of developing diabetes when, forexample, the subject has a supine systolic bloodpressure equal to the mean and P2 is the probability ofdeveloping diabetes when the subject has a bloodpressure-I SD from the mean. One SD was added tothe mean when the normoglycaemic group had a lowermean than the group that developed diabetes and 1 SDwas subtracted from the mean when the mean of thenormoglycaemic group was higher. Default values forinclusion and exclusion of variables and for tolerance(0-15, 0-10, and 0-0001) were used in the BMDPLRprogram.29 Interaction of pairs of risk factors wastested but did not yield significant results.
ResultsINCIDENCE OF NON-INSULIN DEPENDENT DIABETES
The mean observation time was 10-2 years (SD 1-3(range 7-0-14-3) years). Seventy seven of the 1834 menwho were normoglycaemic in the 1970-3 survey (4-2%)were found in the 1980-4 survey to have developeddiabetes. This is close to the values reported previouslyin Swedish men.3 However, the screening techniqueused in the present survey underestimates the frequencyof diabetes and impaired glucose tolerance as somediabetic men may have a fasting blood glucose con-centration <5 7 mmol/l. We identified only 40 subjectswith impaired glucose tolerance, which is half thenumber expected with the prevalence of4-3% found inthe Swedish survey of men of similar age.3 These40 subjects were excluded from the statistical analyses.
Diagnoses of 202 of the 270 non-participants in the1980-4 survey obtained from the records of otherclinics or physicians or, in the case of the deceased,from the death register showed that 10 (5 0%) haddeveloped clinical diabetes before the follow up.
Seventeen men (22%) with diabetes (diagnosed inthe 1980-4 survey) were treated with sulphonylurea orbiguanide; none were treated with insulin. Twentynine (38%) were taking antihypertensive drugs. Thirtysix (47%) were not aware of their metabolic aberration-that is, they replied negatively to the question "Doyou have diabetes?" in the questionnaire. Fewer (31;40%) knew that they were diabetic, and 10 (13%) statedthat they did not know.
VARIABLES RELATED TO DIABETES
Table I shows that the incidence ofdiabetes increasedfrom 3% in men who had no close relatives withdiabetes to 16% in those with two or more. Among menwho did not develop diabetes, 16-3% (280/1717) had aparent or sibling with the disease, compared with33-8% (26/77) among those who did develop diabetes.
Table II shows that the incidence of diabetes in-creased from 1 4% to 30 3%-a factor of 22-from thelowest to the highest grouping for body mass index.Sixty of the 77 subjects who developed diabetes (79%)had a body mass index in the 1970-3 survey of sr25 1kg/M2, which is classed as overweight30 and alsoequalled the mean body mass index in the wholecohort. The most overweight group (body mass index)31 *0 kg/m2) consisted ofonly 66 subjects (3 7% of thecohort) but accounted for almost a third of men withdiabetes.
Table III compares anthropometric and metabolicdata from the 1970-3 survey in men who in the 1980-4survey had developed diabetes and those who had not.The body mass index was 16% higher, systolic bloodpressure was 10% higher, fasting insulin concentrationwas 70% higher, blood glucose concentration at 60
BMJ VOLUME 303 28 SEPTEMBER 1991 757
on 24 February 2022 by guest. P
rotected by copyright.http://w
ww
.bmj.com
/B
MJ: first published as 10.1136/bm
j.303.6805.755 on 28 Septem
ber 1991. Dow
nloaded from
minutes was 43% higher, and the insulin incrementwas 44% lower in the men who developed diabetes thanin the men who remained normoglycaemic. Those whoknew in the second survey that they were diabetic hadlower k values for blood glucose (0-98 v 1 20, p<0 05)and lower concentrations of high density lipoproteincholesterol (0-94 v 1-13 mmol/l, p<0 01) in the firstsurvey than those who did not know that they werediabetic.
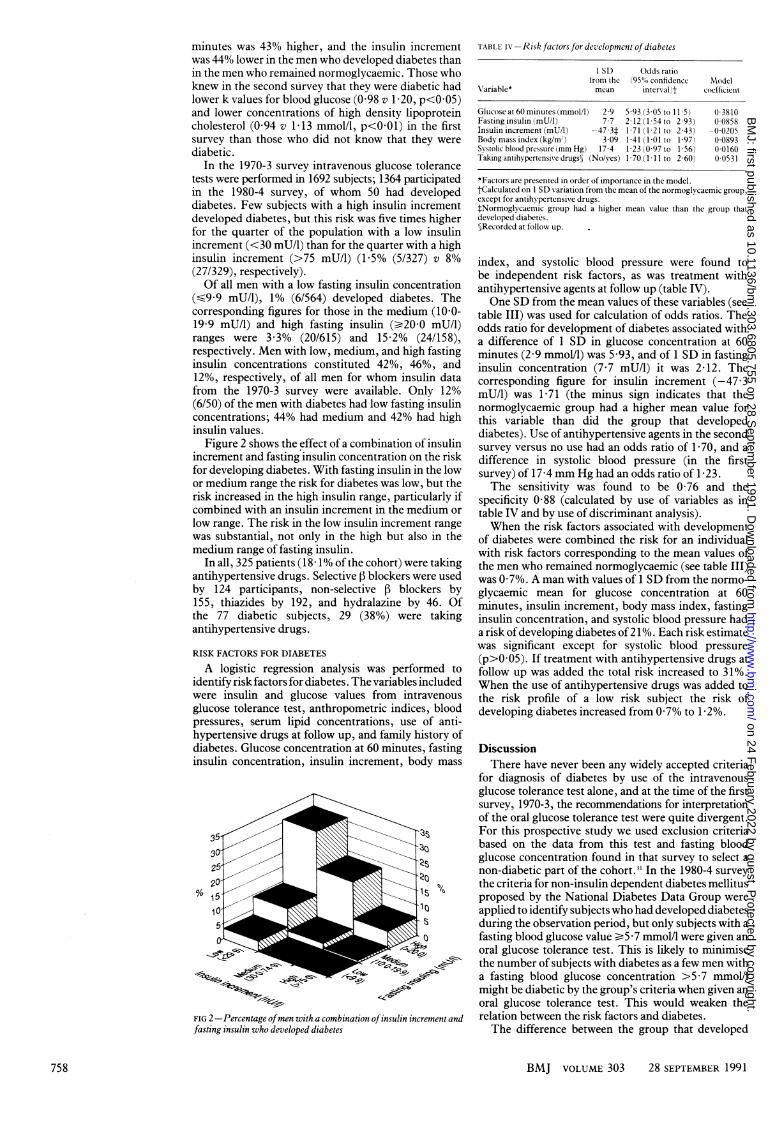
In the 1970-3 survey intravenous glucose tolerancetests were performed in 1692 subjects; 1364 participatedin the 1980-4 survey, of whom 50 had developeddiabetes. Few subjects with a high insulin incrementdeveloped diabetes, but this risk was five times higherfor the quarter of the population with a low insulinincrement (<30 mU/l) than for the quarter with a highinsulin increment (>75 mU/l) (1-5% (5/327) v 8%(27/329), respectively).Of all men with a low fasting insulin concentration
(ss9-9 mU/l), 1% (6/564) developed diabetes. Thecorresponding figures for those in the medium (10-0-19 9 mU/l) and high fasting insulin (,e20-0 mU/l)ranges were 3-3% (20/615) and 15 2% (24/158),respectively. Men with low, medium, and high fastinginsulin concentrations constituted 42%, 46%, and12%, respectively, of all men for whom insulin datafrom the 1970-3 survey were available. Only 12%(6/50) of the men with diabetes had low fasting insulinconcentrations; 44% had medium and 42% had highinsulin values.
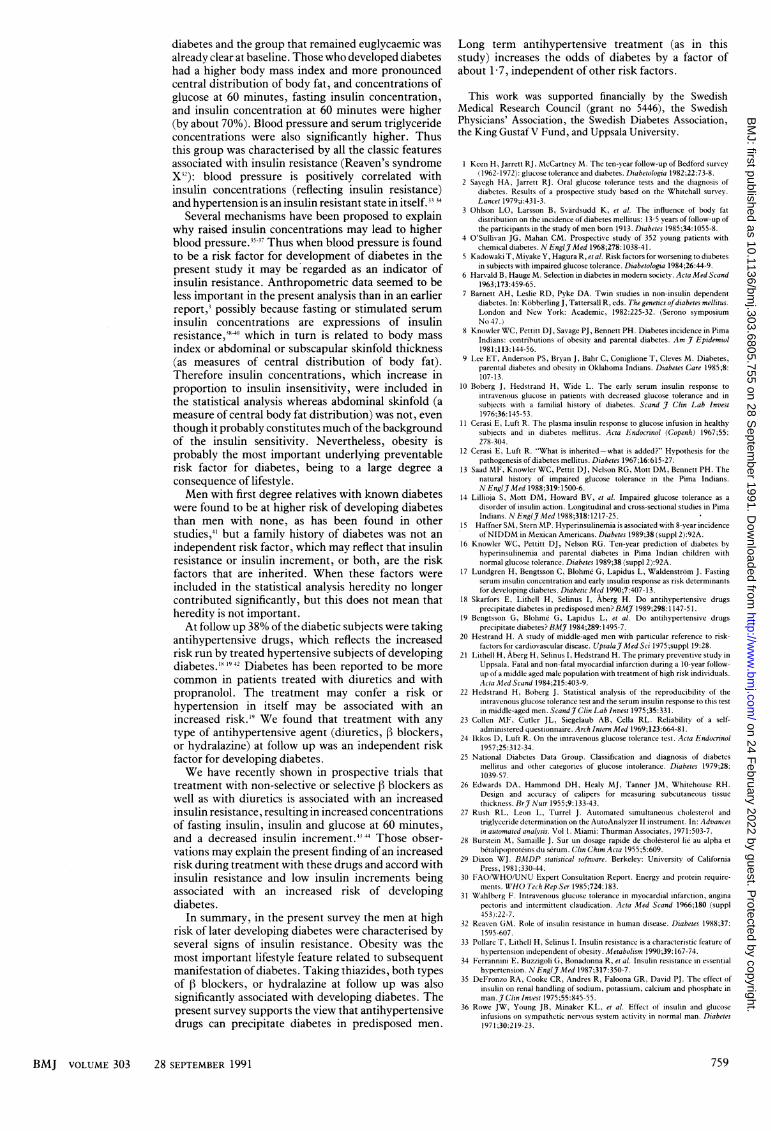
Figure 2 shows the effect of a combination of insulinincrement and fasting insulin concentration on the riskfor developing diabetes. With fasting insulin in the lowor medium range the risk for diabetes was low, but therisk increased in the high insulin range, particularly ifcombined with an insulin increment in the medium orlow range. The risk in the low insulin increment rangewas substantial, not only in the high but also in themedium range of fasting insulin.
In all, 325 patients (18 1% of the cohort) were takingantihypertensive drugs. Selective 13 blockers were usedby 124 participants, non-selective f3 blockers by155, thiazides by 192, and hydralazine by 46. Ofthe 77 diabetic subjects, 29 (38%) were takingantihypertensive drugs.
RISK FACTORS FOR DIABETES
A logistic regression analysis was performed toidentify risk factors for diabetes. The variables includedwere insulin and glucose values from intravenousglucose tolerance test, anthropometric indices, bloodpressures, serum lipid concentrations, use of anti-hypertensive drugs at follow up, and family history ofdiabetes. Glucose concentration at 60 minutes, fastinginsulin concentration, insulin increment, body mass
FIG 2 -Percentage ofmen with a combination ofinsulin increment andfasting insulin who developed diabetes
TABLE Ix -Risk factorsfor development ofdiabetes
I SD Odds ratiofrom the (95"0'o confidencc Modcl
Variable* mean interval)t Coefficient
Glucoseat60minutes(mmoll1) 2-9 5-93 (305 to 11 5) 0-3810Fasting insulin (mU/I) 77 2 12(1 54to 293) 00858Insulin increment (mU/l) -47-3t 1 71 1 21 to 2-43) -0-0205Bodymassindex (kg/mr) 3-09 1 41(1-01 to 1 97) 0 0893Svstolic blood pressure (mm Hg) 17 4 1-23 (0 97 to 1 56) 0-0160Taking antihypertensive drugs) (No/yles) 1 70 (1 11 to 2 60) 0 0531
*Factors are presented in order of importance in the model.tCalculated on 1 SD variation from the mean of the normoglycaemic group,except for antihvpertensive drugs.tNormoglvcaemic group had a higher mean value than the group thatdeveloped diabetes.5Recorded at follosw up.
index, and systolic blood pressure were found tobe independent risk factors, as was treatment withantihypertensive agents at follow up (table IV).One SD from the mean values of these variables (see
table III) was used for calculation of odds ratios. Theodds ratio for development of diabetes associated witha difference of 1 SD in glucose concentration at 60minutes (2-9 mmol/l) was 5 93, and of 1 SD in fastinginsulin concentration (7 7 mU/l) it was 2-12. Thecorresponding figure for insulin increment (-47 3mU/l) was 1-71 (the minus sign indicates that thenormoglycaemic group had a higher mean value forthis variable than did the group that developeddiabetes). Use of antihypertensive agents in the secondsurvey versus no use had an odds ratio of 1 70, and adifference in systolic blood pressure (in the firstsurvey) of 17-4 mm Hg had an odds ratio of 1-23.The sensitivity was found to be 0 76 and the
specificity 0-88 (calculated by use of variables as intable IV and by use of discriminant analysis).When the risk factors associated with development
of diabetes were combined the risk for an individualwith risk factors corresponding to the mean values ofthe men who remained normoglycaemic (see table III)was 0-7%. A man with values of 1 SD from the normo-glycaemic mean for glucose concentration at 60minutes, insulin increment, body mass index, fastinginsulin concentration, and systolic blood pressure hada risk ofdeveloping diabetes of21%. Each risk estimatewas significant except for systolic blood pressure(p>005). If treatment with antihypertensive drugs atfollow up was added the total risk increased to 31%.When the use of antihypertensive drugs was added tothe risk profile of a low risk subject the risk ofdeveloping diabetes increased from 0 7% to 1-2%.
DiscussionThere have never been any widely accepted criteria
for diagnosis of diabetes by use of the intravenousglucose tolerance test alone, and at the time of the firstsurvey, 1970-3, the recommendations for interpretationof the oral glucose tolerance test were quite divergent.For this prospective study we used exclusion criteriabased on the data from this test and fasting bloodglucose concentration found in that survey to select anon-diabetic part of the cohort.3 In the 1980-4 surveythe criteria for non-insulin dependent diabetes mellitusproposed by the National Diabetes Data Group wereapplied to identify subjects who had developed diabetesduring the observation period, but only subjects with afasting blood glucose value e5 -7 mmol/l were given anoral glucose tolerance test. This is likely to minimisethe number of subjects with diabetes as a few men witha fasting blood glucose concentration >5 7 mmol/Imight be diabetic by the group's criteria when given anoral glucose tolerance test. This would weaken therelation between the risk factors and diabetes.The difference between the group that developed
BMJ VOLUME 303 28 SEPTEMBER 1991
2.1'
758
on 24 February 2022 by guest. P
rotected by copyright.http://w
ww
.bmj.com
/B
MJ: first published as 10.1136/bm
j.303.6805.755 on 28 Septem
ber 1991. Dow
nloaded from
diabetes and the group that remained euglycaemic wasalready clear at baseline. Those who developed diabeteshad a higher body mass index and more pronouncedcentral distribution of body fat, and concentrations ofglucose at 60 minutes, fasting insulin concentration,and insulin concentration at 60 minutes were higher(by about 70%). Blood pressure and serum triglycerideconcentrations were also significantly higher. Thusthis group was characterised by all the classic featuresassociated with insulin resistance (Reaven's syndromeX32): blood pressure is positively correlated withinsulin concentrations (reflecting insulin resistance)and hypertension is an insulin resistant state in itself.3334
Several mechanisms have been proposed to explainwhy raised insulin concentrations may lead to higherblood pressure.'537 Thus when blood pressure is foundto be a risk factor for development of diabetes in thepresent study it may be regarded as an indicator ofinsulin resistance. Anthropometric data seemed to beless important in the present analysis than in an earlierreport,3 possibly because fasting or stimulated seruminsulin concentrations are expressions of insulinresistance,34" which in turn is related to body massindex or abdominal or subscapular skinfold thickness(as measures of central distribution of body fat).Therefore insulin concentrations, which increase inproportion to insulin insensitivity, were included inthe statistical analysis whereas abdominal skinfold (ameasure of central body fat distribution) was not, eventhough it probably constitutes much of the backgroundof the insulin sensitivity. Nevertheless, obesity isprobably the most important underlying preventablerisk factor for diabetes, being to a large degree aconsequence of lifestyle.Men with first degree relatives with known diabetes
were found to be at higher risk of developing diabetesthan men with none, as has been found in otherstudies,4' but a family history of diabetes was not anindependent risk factor, which may reflect that insulinresistance or insulin increment, or both, are the riskfactors that are inherited. When these factors wereincluded in the statistical analysis heredity no longercontributed significantly, but this does not mean thatheredity is not imnortant.
At follow up 38% of the diabetic subjects were takingantihypertensive drugs, which reflects the increasedrisk run by treated hypertensive subjects of developingdiabetes.'9 1942 Diabetes has been reported to be morecommon in patients treated with diuretics and withpropranolol. The treatment may confer a risk orhypertension in itself may be associated with anincreased risk.'9 We found that treatment with anytype of antihypertensive agent (diuretics, I3 blockers,or hydralazine) at follow up was an independent riskfactor for developing diabetes.We have recently shown in prospective trials that
treatment with non-selective or selective 1i blockers aswell as with diuretics is associated with an increasedinsulin resistance, resulting in increased concentrationsof fasting insulin, insulin and glucose at 60 minutes,and a decreased insulin increment.43 ' Those obser-vations may explain the present finding of an increasedrisk during treatment with these drugs and accord withinsulin resistance and low insulin increments beingassociated with an increased risk of developingdiabetes.
In summary, in the present survey the men at highrisk of later developing diabetes were characterised byseveral signs of insulin resistance. Obesity was themost important lifestyle feature related to subsequentmanifestation of diabetes. Taking thiazides, both typesof [i blockers, or hydralazine at follow up was alsosignificantly associated with developing diabetes. Thepresent survey supports the view that antihypertensivedrugs can precipitate diabetes in predisposed men.
Long term antihypertensive treatment (as in thisstudy) increases the odds of diabetes by a factor ofabout I 7, independent of other risk factors.
This work was supported financially by the SwedishMedical Research Council (grant no 5446), the SwedishPhysicians' Association, the Swedish Diabetes Association,the King GustafV Fund, and Uppsala University.
1 Keen H, Jarrett RJ, McCartney Mt. The ten-year follow-up of Bedford survey(1962-1972): glucose tolerance and diabetes. Diabetologia 1982;22:73-8.
2 Savegh HA, Jarrett RJ. Oral glucose tolerance tests and the diagnosis ofdiabetes. Results of a prospective study based on the Whitehall survey.Lancet 1979;i:431-3.
3 Ohlson LO, Larsson B, Svardsudd K, et al. The influence of body fatdistribution on the incidence of diabetes mellitus: 13-5 years of follow-up ofthe participants in the study of men born 1913. Diabetes 1985;34:1055-8.
4 O'Sullivan JG, Mahan CM. Prospective study of 352 young patients withchemical diabetes. N EnglJ7 Med 1968;278:1038-41.
5 Kadowaki T, Miyake Y, Hagura R, et al. Risk factors for worsening to diabetesin subjects with impaired glucose tolerance. Diabetologia 1984;26:44-9.
6 Harvald B, Hauge M. Selection in diabetes in modern society. Acta Med Scand1963;173:459-65.
7 Barnett AH, Leslie RD, Pyke DA. Twin studies in non-insulin dependentdiabetes. In: Kobberling J, Tattersall R, eds. The genetics ofdiabetes mellitus.London and New York: Academic, 1982:225-32. (Serono symposiumNo 47.)
8 Knowler WC, Pettitt DJ, Savage PJ, Bennett PH. Diabetes incidence in PimaIndians: contributions of obesity and parental diabetes. Am J Epidemiol1981;113:144-56.
9 Lee ET, Anderson PS, Bryan J, Bahr C, Coniglione T, Cleves M. Diabetes,parental diabetes and obesity in Oklahoma Indians. Diabetes Care 1985;8:107- 13.
10 Boberg J, Hedstrand H, Wide L. The early serum insulin response tointrasenous glucose in patients with decreased glucose tolerance and insubjects with a familial histor- of diabetes. Scand J Clin Lab Invest1976;36: 145-53.
11 Cerasi E, Luft R. The plasma insulin response to glucose infusion in healthysubjects and in diabetes mellitus. Acta Endocrinol (Copenh) 1967;55:278-304.
12 Cerasi E, Luft R. "What is inherited-what is added?" Hypothesis for thepathogenesis of diabetes mellitus. Diabetes 1967;16:615-27.
13 Saad MF, Knowler WC, Pettit DJ, Nelson RG, Mott DM, Bennett PH. Thenatural history of impaired glucose tolerance in the Pima Indians.N EnglJ Med 1988;319:1500-6.
14 Lillioja S, Mott DM, Howard BV, et al. Impaired glucose tolerance as adisorder of insulin action. Longitudinal and cross-sectional studies in PimaIndians. N EnglJ Med 1988;318:1217-25.
15 Haffner SM, Stern MP. Hyperinsulinemia is associated with 8-year incidenceof NIDIDM in Mexican Americans. Diabetes 1989;38 (suppl 2):92A.
16 Knowler WC, Pettitt DJ, Nelson RG. Ten-year prediction of diabetes byhyperinsulinemia and parental diabetes in Pima Indian children withnormal glucose tolerance. Diabetes 1989;38 (suppl 2):92A.
17 Lundgren H, Bengtsson C, Blohme G, Lapidus L, Waldenstrom J. Fastingserum insulin concentration and early insulin response as risk determinantsfor developing diabetes. Diabetic Med 1990;7:407-13.
18 Skarfors E, Lithell H, Selinus I, Aberg H. Do antihypertensive drugsprecipitate diabetes in predisposed men? BMJ 1989;298:1147-51.
19 Bengtsson G, Blohme G, Lapidus L, et al. Do antihypertensive drugsprecipitate diabetes? BMJ7 1984;289:1495-7.
20 Hestrand H. A study of middle-aged men with particular reference to risk-factors for cardiovascular disease. UpsalaJ Med Sci 1975;suppl 19:28.
21 Lithell H, Aberg H, Selinus I, Hedstrand H. The primary preventive study inUppsala. Fatal and non-fatal myocardial infarction during a 10-year follow-up of a middle aged male population with treatment of high risk individuals..4cta Med Scand 1984;215:403-9.
22 Hedstrand H, Boberg J. Statistical analysis of the reproducibility of theintravenous glucose tolerance test and the serum insulin response to this testin middle-aged men. Scandj_ Clin Lab Invest 1975;35:331.
23 Collen MF, Cutler JL, Siegelaub AB, Cella RL. Reliability of a self-administered questionnaire. Arch Intern Med 1969;123:664-8 1.
24 Ikkos D, Luft R. On the intravenous glucose tolerance test. Acta Endocrinol1957;25:312-34.
25 National Diabetes Data Group. Classification and diagnosis of diabetesmellitus and other categories of glucose intolerance. Diabetes 1979;28:1039-57.
26 Edwards DA, Hammond DH, Healy MJ, Tanner JM, Whitehouse RH.Design and accuracy of calipers for measuring subcutaneous tissuethickness. BrJ Nutr 1955;9:133-43.
27 Rush RL, Leon L, Turrel J. Automated simultaneous cholesterol andtriglyceride determination on the AutoAnalyzer II instrument. In: Advancesin automated analysis. Vol 1. Miami: Thurman Associates, 1971:503-7.
28 Burstein M, Samaille J. Sur un dosage rapide de cholesterol lie au alpha etbetalipoproteins du serum. Clin Chim Acta 1955;5:609.
29 Dixon WJ. BMDP statistical software. Berkeley: University of CaliforniaPress, 1981;330-44.
30 FAOIWHO/UNU Expert Consultation Report. Energy and protein require-ments. WHHO Tech Rep Ser 1985;724:183.
31 Wahlberg F. Intravenous glucose tolerance in myocardial infarction, anginapectoris and intermittent claudication. Acta Med Scand 1966;180 (suppl453):22-7.
32 Reaven GMI. Role of insulin resistance in human disease. DDiabetes 1988;37:1595-607.
33 Pollare T, Lithell H, Selinus I. Insulin resistance is a characteristic feature ofhypertension independent of obesity. Metabolism 1990;39:167-74.
34 Ferrannini E, Buzzigoli G, Bonadonna R, et al. Insulin resistance in essentialhypertension. N Englj Med 1987;317:350-7.
35 DeFronzo RA, Cooke CR, Andres R, Faloona GR, David PJ. The effect ofinsulin on renal handling of sodium, potassium, calcium and phosphate inman. 7 Clin Invest 1975;55:845-55.
36 Rowe JW, Young JB, Minaker KL, et al. Effect of insulin and glucoseinfusions on sympathetic nervous system activity in normal man. Dz)abetes1971;30:219-23.
BMJ VOLUME 303 28 SEPTEMBER 1991 759
on 24 February 2022 by guest. P
rotected by copyright.http://w
ww
.bmj.com
/B
MJ: first published as 10.1136/bm
j.303.6805.755 on 28 Septem
ber 1991. Dow
nloaded from
37 Hilton PJ. Cellular sodium transport in essential hypertension. N Engl 7Mcd1986;314:222-5.
38 Nagulesparan MN1, Savage PJ. Unger R, Bennett PH. A simplified method tisingsomatostatiii to assess in vivo insulin resistance over a range of' obesitY.Diabetes 1979;28:980-3.
39 Luft R, WX'ajngot A, Efenidic S. On the pathogenesis of maturitv onset diahetes.Diabetes Care 198X ;4:58-63.
41) DeFroiuzo RA. The triumvirate: beta-cell, muscle, liver. A collusionresponsible fotr NI DDMNI. Diabetes 1988;37:667-87.
41 Haffner SMS, Stern MP, Hazuda Hi', Mitchell BC, Patterson JK. Increasedinsulin concentrations in nondiabetic offspring of diabetic parents..VEng7l71ed 1988;319:1297-391.
42 Lundgren H, B1iirkman L, Keiding 1', Ltulndmark S, Bengtssoni C. D)iabetes inpatients with hypertension receiving pharmacological treatmnent. 1.3171988;297: 1512.
43 Pollare T, Lithell H, Selinus I, Berne C. Sensitivity to insulin during trcatmentwith atenolol and metoprolol: a randomised, double blind study of'et'l'ects Oilcarbohydrate and lipoprotein metabolism in hypertensive patients. BAt]1989;298: 1152-7.
44 Pollare T, LithclIH, Berne C. A comparison of'the effects ofhvdrohlorthiazideand captopril on gltucose and lipid metabolism in patients with hypertension.NEngIjA.ted 1989;321:868-71.
(.Accepted 47ulv 1991)
Psychiatric Unit, CentreHospitalier Universitairede Liege, DomaineUniversitaire du SartTilman (B35), B-4000Liege, BelgiumMarc Ansseau, MD, seniorpsychiatristBenoit Troisfontaines, MD,psychiatristPatrick Papart, MD, residentRemy von Frenckell, PHD,senior statistician
Correspondence andrequests for reprints to: DrAnsseau.
BMJ 1991;303:760-1
Compulsive personality aspredictor of response toserotoninergic antidepressants
Marc Ansseau, Benoit Troisfontaines,Patrick Papart, Remy von Frenckell
A large body of evidence suggests that serotoninergicantidepressants such as clomipramine, fluvoxamine,and fluoxetine are the most effective pharmacologicaltreatments of obsessive-compulsive disorders.'The classic biochemical theory of major depressionhypothesises disturbances in serotoninergic orcatecholaminergic neurotransmission, or both. Untilnow, however, no specific symptoms have been clearlyshown to orient with a selective antidepressant.2 Inaddition to the depressive disorder, the underlyingpersonality may be assessed as a possible aid to thetherapeutic decision. Compulsive personality usuallypre-exists in patients developing obsessive-compulsivedisorder.'We hypothesised that patients with a major depres-
sive episode and an underlying compulsive personalitywould preferentially have serotoninergic depressionand hence respond to a serotoninergic antidepressantsuch as fluvoxamine.4
Patients, methods, and resultsWe studied 46 outpatients who fulfilled DSM-III
criteria (Diagnostic and Statistical Manual of MentalDisorders, Third Edition) for a major depressive episode3and who also scored higher than 17 on the first 17 itemsof the Hamilton depression scale. The patients wereamong consecutive referrals to our department fromgeneral practitioners. Twenty two of the 46 patientshad an underlying compulsive personality (DSM-IIIcriteria)3 as manifested by at least four of the followingfive features: restricted ability to express warm andtender emotions; perfectionism; insistence that othersmust submit to his or her way of doing things;excessive devotion to work and productivity; in-decisiveness. The other 24 patients did not have acompulsive personality (only one or no compulsivefeature).The two study groups did not differ significantly in
age (mean 46-8 years (range 28-63) v 413 years (22-64)), sex (12 men, 10 women v 12 men, 12 women),weight, duration of current depressive episode,previous treatment, medical or psychiatric history, orbaseline level of depressive symptoms. The studylasted eight weeks and included assessments at baselineand after two, four, and eight weeks of treatment withthe 24 item Hamilton depression scale and a subscalefor endogenomorphic depression. All side effects wererecorded. The initial dose of fluvoxamine was 100 mgat bedtime, which could be increased to 200 mg fromthe third week. Other psychotropic drugs wereexcluded except for a low dose benzodiazepine anxioly-tic or hypnotic, or both, if needed. The protocol was
approved by the ethics committee of the universitymedical school and all patients gave informed consent.
Statistical analysis was by X2 test with the Yatescorrection for small samples, one way analysis ofvariance, and two way analysis of variance (compulsivev non-compulsive, four replications) with repeatedmeasures. End point data in drop outs did not changethe conclusions and are not reported.Ten patients dropped out of the study because of
lack of efficacy of the treatment or side effects (threepatients in the compulsive group, seven in the non-compulsive group; (x2=0-84 p=0-36). To see whethercompleting the study could be prognostic an analysis ofvariance was performed on the basal Hamilton totalscore. This two way analysis (completer v non-completer, compulsive v non-compulsive) showed nosignificant effect or interaction. The same analysis ofvariance was performed on age, and this model also didnot reach significance.
40
E 30-0
co"05° 200r- N < g Non-compulsive
CL20
ECZ 10
Compulsive
00 2 4 8
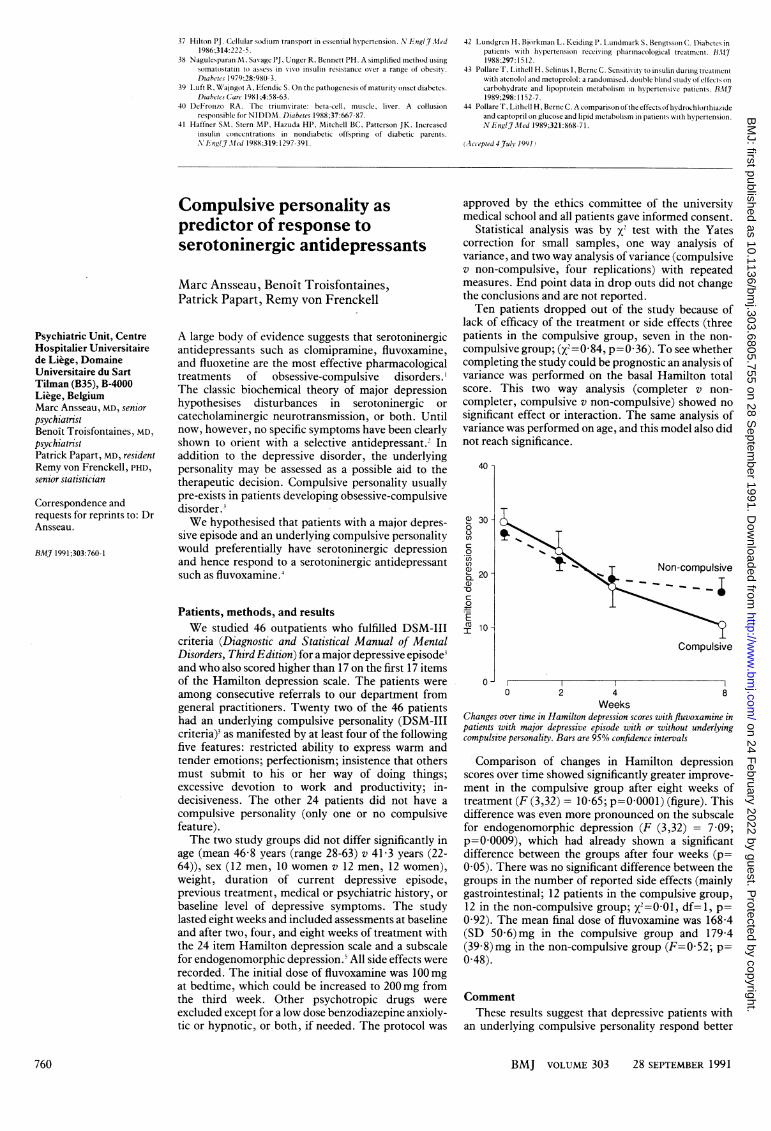
WeeksChanges over time in Hamilton depression scores with fluvoxamine inpatients with major depressive episode with or without underlyingcompulsive personality. Bars are 95% confidence intervals
Comparison of changes in Hamilton depressionscores over time showed significantly greater improve-ment in the compulsive group after eight weeks oftreatment (F (3,32) = 10-65; p=00001) (figure). Thisdifference was even more pronounced on the subscalefor endogenomorphic depression (F (3,32) = 7 09;p=00009), which had already shown a significantdifference between the groups after four weeks (p=0-05). There was no significant difference between thegroups in the number of reported side effects (mainlygastrointestinal; 12 patients in the compulsive group,12 in the non-compulsive group; x2=0 01 df=1, p=0 92). The mean final dose of fluvoxamine was 168-4(SD 50 6)mg in the compulsive group and 179 4(39-8)mg in the non-compulsive group (F=0-52; p=0 48).
CommentThese results suggest that depressive patients with
an underlying compulsive personality respond better
760 BMJ VOLUME 303 28 SEPTEMBER 1991
on 24 February 2022 by guest. P
rotected by copyright.http://w
ww
.bmj.com
/B
MJ: first published as 10.1136/bm
j.303.6805.755 on 28 Septem
ber 1991. Dow
nloaded from
Related Documents