UPPER YELLOWSTONE RIVER PHYSICAL FEATURES INVENTORY REPORT GARDINER TO SPRINGDALE OCTOBER, 1998 PREPARED FOR THE UPPER YELLOWSTONE RIVER TASK FORCE AND PARK CONSERVATION DISTRICT BY U.S.D.A. NATURAL RESOURCES CONSERVATION SERVICE AND MONTANA DEPARTMENT OF ENVIRONMENTAL QUALITY HELENA, MONTANA

Welcome message from author
This document is posted to help you gain knowledge. Please leave a comment to let me know what you think about it! Share it to your friends and learn new things together.
Transcript

UUPPPPEERR YYEELLLLOOWWSSTTOONNEE RRIIVVEERRPPHHYYSSIICCAALL FFEEAATTUURREESS IINNVVEENNTTOORRYY
RREEPPOORRTT
GARDINER TO SPRINGDALE
OCTOBER, 1998
PREPARED FOR THEUPPER YELLOWSTONE RIVER TASK FORCE
AND PARK CONSERVATION DISTRICT
BYU.S.D.A. NATURAL RESOURCES CONSERVATION SERVICE
AND MONTANA DEPARTMENT OF ENVIRONMENTAL QUALITY
HELENA, MONTANA

2
TABLE OF CONTENTS .PageINTRODUCTION...................................................................................… ....5
INVENTORY METHODS AND PROCEDURES...............................… ...6
PHYSICAL FEATURES.....................................................................… … .… … … … .… 7
WATER QUALITY ...........................................................................… … … … … … … ....8
BED MATERIAL SIZE DISTRIBUTION........................................… … … … … … … ...8
PHOTOGRAPHY..........................................................................… … … … … … .....… ...9
INVENTORY FINDINGS......................................................................… … 9 SEGMENT SUMMARIES and MAPS
SEGMENT 0.......................................................................................… … … … … … … … 10
Map of Segment 0
SEGMENT 1.......................................................................................… … … … … … … … .10
Map of Upper portion of Segment 1
Map of Lower portion of Segment 1
SEGMENT 2.......................................................................................… … … … … … … … ..10
Map of Upper portion of Segment 2
Map of Lower portion of Segment 2
SEGMENT 3.......................................................................................… … … … … … … … ..11
Map of Segment 3
SEGMENT 4......................................................................................… .… … … … … ..… … 11
Map of Segment 4
SEGMENT 5.......................................................................................… … … … … … ..… … .12
Map of Upper portion of Segment 5
Map of Middle portion of Segment 5
Map of Lower portion of Segment 5
SEGMENT 6.........................................................................................… … … … … … … … 12
3
Map of Upper portion of Segment 6
Map of Middle portion of Segment 6
Map of Lower portion of Segment 6
SEGMENT 7.......................................................................................… … … … … … … … … 12
Map of Upper portion of Segment 7
Map of Lower portion of Segment 7
SEGMENT 8.......................................................................................… … … … … … … … … .13
Map of Upper portion of Segment 8
Map of Lower portion of Segment 8
SEGMENT 9.......................................................................................… … … … … … … … … .13
Map of Segment 9
SEGMENT 10....................................................................................... … … … … … … … ..… 13
Map of Segment 10
SEGMENT 11.....................................................................................… … … … … … ..,… … ..14
Map of Upper portion of Segment 11
Map of Lower portion of Segment 11
SEGMENT 12.....................................................................................… … … … … … … … … .14
Map of Upper portion of Segment 12
Map of Lower portion of Segment 12
SEGMENT 13...................................................................................… … … … … … … … … … 15
Map of Upper portion of Segment 13
Map of Middle portion of Segment 13
Map of Lower portion of Segment 13
WATER QUALITY............................................................................… … … … ,… … … … … .15
BED MATERIAL SIZE DISTRIBUTION........................................… … … … ,… … … … … 17

4
CONCLUSION.........................................................................................… … .18
TABLES
TABLE 1, SUMMARY BY SEGMENT (1998
TABLE 2, SUMMARY BY LEFT AND RIGHT BANK PER SEGMENT (1998
TABLE 3, COMPARISON OF 1987 TO 1998 PHYSICAL FEATURES BY SEGMENT
TABLE 4, COMPARISON OF 1987 TO 1998 PHYSICAL FEATURES BY REACH
TABLE 5, YELLOWSTONE RIVER WATER QUALITY LAB ANALYSIS, 1998
TABLE 6, STATISTICAL SUMMARY W.Q. ANALYSIS U.S.G.S. @CORWIN SPRINGS GAGING STATION...........................12
TABLE 7, STATISTICAL SUMMARY W.Q. ANALYSIS U.S.G.S. @ LIVINGSTON GAGING STATION......................................13
TABLE 8, BED MATERIAL SIZE DISTRIBUTION BY REACH
TABLE 9, VALLEY SLOPE
APPENDICES:
APPENDIX A PHYSICAL FEATURES DATA FORM
APPENDIX B BEDLOAD SIZE DATA FORM
APPENDIX C LIST OF PARTICIPANTS
APPENDIX D TASK FORCE MISSION AND MEMBERS
FIGURES:
FIGURE 1, 1998 PROJECT AREA MAP
FIGURE 2, 1987 SURVEY LOCATIION
5
INTRODUCTION
This report summarizes a physical features inventory conducted in 1998 at the request ofthe Governor’s Upper Yellowstone River Task Force (UYTF). The USDA NaturalResources Conservation Service was requested to organize and coordinate the inventoryby the Park Conservation District, (Park CD), and the UYTF. The report will assist theUYTF and its partners to, “ develop a shared understanding of the issues and uses thatimpact the Upper Yellowstone River .... for the purpose of encouraging a comprehensiveapproach to actions taken along the river to ensure that its integrity remains intact whilebalancing the needs of communities and landowners to protect property”. •
A physical features inventory of the Yellowstone River between Gardiner and Livingston,Montana, was conducted by the Water Quality Bureau of the Montana Department ofHealth and Environmental Sciences (now the Montana Department of EnvironmentalQuality), in September of 1987. The findings were presented in a report titled,“Yellowstone River Inventory Reach II, Gardiner to Livingston”, in December of 1989.The report summarized the quantity and condition of streambanks, channel alterations, andother structural aspects of the river. Four distinct reaches were identified and the resultswere summarized accordingly. Sections describing the history, hydrology,geomorphology, soils, water quality, fisheries, water use and reservations, and landownership and land use are a part of the 1989 report. Please refer to the original 1989report for a discussion of these topics. Data from the 1987 inventory is presented withinthis report for purposes of comparing quantitative change in specific features over theeleven year period.
The stated purpose of the 1998 inventory was to collect resource information indicatingthe degree of physical feature change in the river since the previous 1987 inventory in atimely and consistent manner. The information will be used as an initial screening tool toevaluate priorities and to guide further analysis planned by the UYTF in order to carry outtheir stated goal of conducting a cumulative effects study. It is also to serve as aneducational/informational tool to raise visibility of the UYTF and an awareness of UYTFactivities. A third purpose is to educate participants in methods and procedurestransferable to other watersheds in Montana.
The information collected can serve to indicate the relative degree of change observed formost of the features identified in the 1987 report. In order to establish a baseline for theremainder of the Yellowstone River in Park County, the 1998 inventory was extended tothe Springdale Bridge near the Park County line.
Additional, ‘new’ information categories collected were water quality samples at ninepoints along the river, cobble size distribution, and the presence of floodplain alterations.
• Executive Order 17-97, Governor Marc Raciot, dated November 5, 1997.

6
Please refer to the appropriate sections of this report for a discussion of these inventoryattributes.
A little over 96 miles of main and side channels were inventoried. The total inventory wasbroken into 14 segments based primarily on length and accessibility. The upper 10segments were compiled individually and then broken into reaches comparable to the fourreaches utilized in the 1987 inventory. The four segments from the Interstate Bridgesabove Livingston to the Springdale Bridge were broken into two reaches for purposes ofcomparison.
It is only with the cooperation and active participation of the UYTF, private citizens, andmany local, state and federal agencies who assisted in this effort that the task wassuccessfully completed over a three day period in April of 1998. Thanks are extended toall who participated or who otherwise supported the project. The success of such projectsis largely due to the faith which local leaders place in community-based decision making.Participants of the survey are listed in Appendix C.
INVENTORY METHODS AND PROCEDURES
The 1998 inventory of the Upper Yellowstone River was completed on April 22 and 23.Eight teams of two to four people inventoried one of eleven assigned segments andrecorded specific physical features. Drift boats were provided and crewed by local guideservice operators who donated their time and equipment. Segments from the mouth of theGardiner River to the Gardiner Airport (0) and through Yankee Jim Canyon (3) werewalked and/or driven in consideration of safety issues. The segment through Livingstonfrom the Park Clinic Access Site to Mayor’s Landing (10) was walked. Each team wasassigned a ‘team leader’ who was responsible to oversee notetaking and delineation offeatures. One team was assigned to each segment, however, three multi-channelsegments, (7,8 and 12) were floated with two teams. Teams were assigned to the left orright braids to improve accuracy and efficiency. Information for the multi-channel reacheswas then compiled onto the 134 aerial photos that were provided by the MontanaDepartment of Transportation.
Prior to the actual inventory, participants were instructed in the methodology andprocedures to be used to denote features. Classroom instruction was given in thecategories of physical features assessment, water quality sampling, bedload size sampling,and photography. An equal amount of on-stream training for each topic followed at a sitenear the City Park in Livingston.
Training was also provided in Rapid Bioassessment Protocol, commonly used to samplemacroinvertibrates (aquatic bugs) as an educational element. Macroinvertibrates were notsampled as part of the 1998 inventory due to time constraints and the cost of sampleanalysis.

7
PHYSICAL FEATURES:
Examples from the 1987 inventory were reviewed to insure as much consistency aspossible. The 1987 aerial photos for each respective segment were carried during theinventory to assist in the comparison of recorded features and changes that may havetaken place in channel condition and location. Feature types were recorded by codedirectly on low elevation aerial photography , (scale = 200 feet/inch), provided by theMontana Department of Transportation, (flown 3/30/98). Linear features were measureddirectly on the photos using a 6” ruler. Non-linear features were counted. All featuretypes were also recorded by photo number on a spreadsheet using a consecutivenumbering system going downstream. Left and right banks were distinguished forfeatures not extending the entire width of the channel. Comments for each feature wererecorded in notebooks as needed to explain unusual circumstances or any other pertinentinformation. Each team prepared a synopsis of their observations at the end of each dayfor the segment observed. A summary of each team’s observations begins on page 4.All data entries were checked for completeness and scale following the inventory, andcorrections were made as appropriate.
Feature definitions and codes used in the 1998 inventory :Feature definitions and codes were selected to assure consistency with the previousinventory.
Stream Channel Change (SC)- perennial channel area created since 1987, > 25 lf lateralmovement. (length)
Channel AlterationsBlanket Rock Riprap (BRR) - man-placed rock. (length)Rock Jetty (RJ) - man placed rock oriented 900 or more to bank. (number)Car Bodies (CB)- intact cars within normal high-water (bankfull) mark. (number)Rock Barb (RB)- man placed rock oriented less than 900 to bank. (number)Other Alterations (OA)- alterations to channel not covered above, i.e. bridges, pilings,etc. (number)
Bank ConditionEroding Bank (EB) - unstable bank zone actively contributing sediment to channelduring normal bankfull flow events. generally up to 10 ft. in height. (length and height)Bank Mass Wasting (BMW) - very unstable bank zone actively contributing sediment thefull height of bank during normal bankfull flow events. Generally over 10 ft. in height.(length and height)Unvegetated Non-Eroding Bank (UNV) - Stable banks not supporting vegetation.(length and height)
8
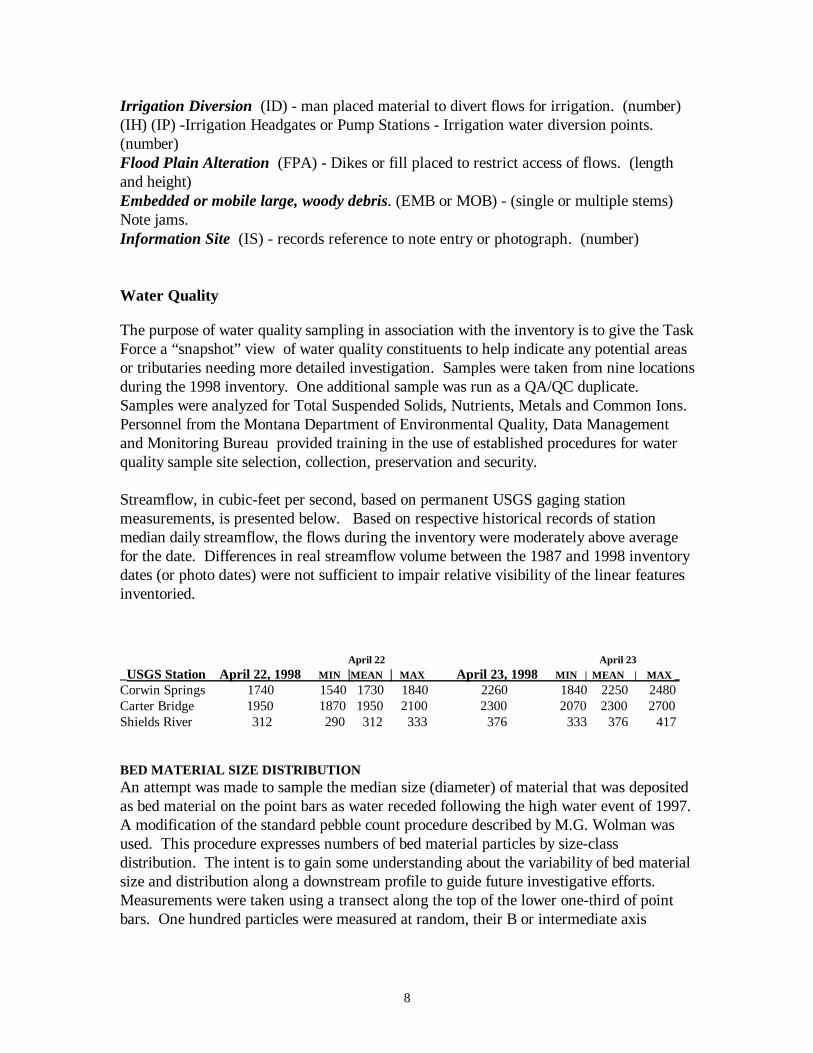
Irrigation Diversion (ID) - man placed material to divert flows for irrigation. (number)(IH) (IP) -Irrigation Headgates or Pump Stations - Irrigation water diversion points.(number)Flood Plain Alteration (FPA) - Dikes or fill placed to restrict access of flows. (lengthand height)Embedded or mobile large, woody debris. (EMB or MOB) - (single or multiple stems)Note jams.Information Site (IS) - records reference to note entry or photograph. (number)
Water Quality
The purpose of water quality sampling in association with the inventory is to give the TaskForce a “snapshot” view of water quality constituents to help indicate any potential areasor tributaries needing more detailed investigation. Samples were taken from nine locationsduring the 1998 inventory. One additional sample was run as a QA/QC duplicate.Samples were analyzed for Total Suspended Solids, Nutrients, Metals and Common Ions.Personnel from the Montana Department of Environmental Quality, Data Managementand Monitoring Bureau provided training in the use of established procedures for waterquality sample site selection, collection, preservation and security.
Streamflow, in cubic-feet per second, based on permanent USGS gaging stationmeasurements, is presented below. Based on respective historical records of stationmedian daily streamflow, the flows during the inventory were moderately above averagefor the date. Differences in real streamflow volume between the 1987 and 1998 inventorydates (or photo dates) were not sufficient to impair relative visibility of the linear featuresinventoried.
April 22 April 23_USGS Station April 22, 1998 MIN |MEAN | MAX April 23, 1998 MIN | MEAN | MAX _Corwin Springs 1740 1540 1730 1840 2260 1840 2250 2480Carter Bridge 1950 1870 1950 2100 2300 2070 2300 2700Shields River 312 290 312 333 376 333 376 417
BED MATERIAL SIZE DISTRIBUTIONAn attempt was made to sample the median size (diameter) of material that was depositedas bed material on the point bars as water receded following the high water event of 1997.A modification of the standard pebble count procedure described by M.G. Wolman wasused. This procedure expresses numbers of bed material particles by size-classdistribution. The intent is to gain some understanding about the variability of bed materialsize and distribution along a downstream profile to guide future investigative efforts.Measurements were taken using a transect along the top of the lower one-third of pointbars. One hundred particles were measured at random, their B or intermediate axis

9
measured and recorded on the sample form. Calculations were then made to determinethe median or D50 particle size.
PHOTOGRAPHYTeams were provided with 100 ASA Ektachrome slide film. Over 500 slides were taken.Participants were instructed to use the photography to illustrate common conditions,unique circumstances, stable features, possible reference sites, and to serve as a basis forestablishment of permanent photo points from which change can be visibly ascertainedover time. All slides taken are maintained on file at the Park Conservation District offices.The location and nature of each frame taken was recorded in a segment notebook. Thelocation was also noted on the respective aerial photographs for future reference. For thepurposes of this electronic document representative photos of features within eachsegment are included. Select this text for a listing of all photos included.
INVENTORY FINDINGS
PHYSICAL FEATURESA number of the features inventoried appear to have increased considerably while othershave shown no major change or, in a few cases actually declined. Table 1 itemizesinventory results by each of the 14 segments inventoried. Table 2 summarizes results byleft and right bank for each segment. Table 3 provides a comparison of the 1987 and1998 inventories using the original reach classification. Table 4 provides the samecomparison for selected features, but is segregated by the 14 segments used in 1998 for afiner comparison. Narrative findings are presented by segment. Comments are taken fromsegment summaries provided by each team.
General observations on the inventory were that the unvegetated non-eroding bank (UNV)feature did not prove to be a useful category as it proved difficult to interpret, particularlywith respect to continuity with the 1987 inventory. As it was agreed this category shouldgenerally be disregarded, these observations do not appear on the photos appearing in thisdocument. Scour caused by back-to-back years of flooding removed much of the aboveground vegetation, however, roots and sprouts appear viable to recover. Debris countsproved difficult to track so a rating system (using a scale of 1-10) was developedfollowing the inventory to characterize the relative amount of large woody debrisdeposited as flood waters receded. The 1998 aerial photos were used as an aid in thiseffort.
Main and side channel bank length for the segments between Livingston and Springdalewas measured using an electronic planimeter. Only those primary side channels exhibitingfeatures of perennial flow such as well defined, vegetated islands and flow paths wereincluded. No spring creek or tributaries were measured. For consistency, measurementsfrom the 1987 inventory were used to calculate total bank length for segments 1 to 9.

10
The measurement of linear features using two un-rectified aerial photo flights precludesthe use of the linear data in an absolute sense. Checks for scale accuracy on both flightsyielded small errors, however, this information should be used in a relative sense only.
Segment 0 - Mouth of Gardiner River to McConnell accessSegment length is 19,625 lf. Gradient is 0.43 percent. This segment is characterized byrelatively steep stream gradient and boulder sized bed material. No cobble sizemeasurements were taken since no true point bars were observed in this section. Thechannel is entrenched within steep, little vegetated, valley walls and bedrock outcrops.Bank stability is relatively good as few modifications to the channel or streambanks werenoted. The majority of bank erosion occurs on the left bank, due primarily to slope anddrainage modifications caused by the old railroad right-of-way. Effects of scour on thenarrow band of riparian vegetation appears to be temporary as regrowth has already begunto occur. The upper portion is surrounded by relatively dense development encroachingto the edge of the terrace, although well above the flood plain. No major changes wereobserved relative to the 1987 inventory.
The Gardiner Waste Water Treatment Plant discharges treated water to the river under aNPDES permit.
In general, this segment is very stable.
Segment 1 - McConnell access to Corwin SpringsSimilar to Segment 0 in character for the first several miles. Length is 24,450 lf. Valleyslope is 0.20 percent. Channel character changes as the grade decreases. Homes anddevelopment begins to encroach more closely on the river. The channel is less entrenched.More mass wasting begins to occur as soils and natural bank armor decreases in sizethrough the flatter stretches. A few areas of bedload deposition were noted. Onestreamside debris dump (mostly metal) was observed. The riprap observed was placedprimarily for protection of highway fill. No major changes occurred relative to the 1987inventory.
In general, this segment is fairly stable during normal flows. Most of the unstable featuresnoted appear accelerated by high water as the river has little floodplain available in whichto dissipate energy.
Segment 2 - Corwin Springs access to Yankee Jim accessThe stream is still somewhat entrenched and is similar to segment 1. Length is 31,005 lf.Valley slope is 0.24 percent. Long , 20 to 30 feet high mass wasting banks are thepredominate erosional feature along this segment. A scarcity of adequate woody riparianplants at the toe of low to moderately high banks may contribute to the problem as mayeffects of the bridge at Corwin Springs. Bank alterations to protect developments increaseover upper segments. Some of the efforts appear to be unsuccessful, particularly the pastuse of car bodies. Additional rock riprap has been added. This segment has the second

11
highest number of car bodies in the river, although now five less than recorded for thissegment in 1987.
In general, this is the first segment where bank protection efforts become very evident,mostly in a few developed areas, yet the river is still fairly natural overall.
Segment 3 - Yankee Jim access to Carbella accessLength is 18,700 lf. Valley slope is 0.27 percent. Much of this segment is characterizedby steep, narrow, and well armored canyon walls. The main feature is the significantlength of rip-rap placed to protect highway fill material. One or two small slumps areassociated with the old railroad grade. Few erosional areas were observed. Although highwater has scoured much of the above ground woody riparian vegetation, the combinationof large boulders, bedrock and resprouting vegetation appear sufficient to preventexcessive bank erosion.
The mouth of Yankee Jim Canyon represents the end of Reach 1 used in the 1987inventory. Below this point, the valley opens up, grade is less and channel width becomesgreater.
Other than about 500 lf of riprap, (apparently due to scale differences between photos),there has been practically no change in physical features. The main change observed is inthe lower mile or so where substantial homesite development has occurred in upland areas.Tom Miner Creek has added a relatively large amount of sediment during high waterrunoff as evidenced by the debris fan at the mouth. One livestock confinement areaadjacent to the river was noted.
Segment 4 - Carbella access to gravel pit accessLength is 36,720 lf. Valley slope is 0.07 percent. This segment has relatively few channeland bank alterations. The channel down to a mile or so above Point of Rocks ischaracterized by a singular, stable channel with good woody vegetation growing along thebanks. Below this point, it is less confined; grade flattens and the stream becomes widerwith resulting deposition of bedload and sediment. Below the highway bridge, thechannel type is extremely braided. An associated moderate amount of channel change hasoccurred creating large mid-channel bars. Eroding banks have more than doubled since1987. These features appear the result of recent flood events. The majority of erosionalfeatures are located in this lower section. Practically no alterations have occurred since1987. A relatively small amount of large woody debris has accumulated in this section.
12
Segment 5 - Gravel pit access to Emigrant access
Length is 68,690 lf. Valley slope is 0.09 percent. This segment represents thepredominant appearance of the valley section of the river; the stream alternating betweensections of confined, singular channel with fairly stable conditions and sections of multipleside channels braiding across the wider floodplain until confined by more erosion resistantlarger bed and bank material. The first major irrigation diversion point occurs here.Change in the number and extent of alterations has not been significant, however a fewsmall areas of bank protection appear to have failed. Bank riprap accounts for about 7%of total bank length. The majority of alterations were placed to protect roads and homes.Fairly extensive channel changes (2400 lf) have occurred apparently as a result of theflooding. The number of actively eroding banks has more than doubled as well, to about20% of total bank length. The multi-channel areas have trapped a moderate amount oflarge woody debris.
A significant number of new homes have been built adjacent to the river. 14 new homeswithin 200 feet of the river were counted.
Segment 6 - Emigrant access to Lock Leven accessLength of the channel segment is 61,575 l f. Valley slope is 0.24 percent. The braidedconditions continue similar to segment 5 for several miles downstream of the EmigrantBridge. The bulk of noted channel change and erosion occurs in this section. About 14%of the channel banks are eroding, again primarily in the several miles below the bridge.This is not a lot different than in 1987. A relatively large amount of woody debris occursin this area.
Not much change in the amount of rock riprap was recorded. Most bank protection hasbeen placed to protect the highway and pasture land. About 2% of bank length isarmored. However, the amount of channel change (12%), is significant and likelyrepresents the loss of some bank previously counted as rip rapped.
The lower section of this reach is characterized by a singular, channel confined betweenbanks made up of large cobble material. Participants noted that juniper bank vegetationwas robust for the most part and withstood flooding well. A significant number of newhomesites and development has occurred on uplands in the lower portion of this segment.
Segment 7 - Lock Leven access to Pine Creek BridgeThis segment length is 34,050 lf. Valley slope is 0.23 percent. Participants noted thereach is fairly uniform in grade and entrenchment. The upper three-fourths of the reach issingle channel. Banks are fairly stable where vegetation is adequate to protect them.About 8% of total bank length is armored. A considerable amount (4445’) of rockriprap and 35 rock barbs/jetties have been placed since the previous inventory primarily toprotect agricultural land. Present unstable banks are relatively uncommon (5%) although

13
one large mass waste bank occurs below Mallards Rest fishing access. Large woodydebris was noted primarily in the braided areas above Pine Creek Bridge.
Segment 8 - Pine Creek Bridge to Carters BridgeThis segment length is 41,170 lf. Valley slope is 0.29 percent. This section contained thegreatest overall bank and channel features recorded. Below Pine Creek Bridge are locatedlong, high mass wasting banks. This segment contains the greatest percent of suchfeatures, (8.3%). About 16% of the bank length has rock riprap placed. Some of theoriginal riprap has failed and is now categorized as eroding bank. The channel has movedits full width in several places. About 8800 lf of channel movement section was noted.There is now about double the amount of eroding bank (EB &BMW), or 33% of totalbank length. About 62 more rock barb and jetty structures were counted than present in1987. 6 car bodies are no longer present. Although dikes and other features that modifythe flood plain were not recorded earlier, there are now about 9000 lf of dikes in placealong the west (left) side of this segment. Channel and bank changes are accompanied bya dramatic increase noted on the photos of newly developed, large point and mid channelgravel bars. D50 size of the bar material is 5 size classes smaller than measured in theprevious segment 7, possibly indicating less gradient and preventing this smaller materialfrom passing through the section.This segment also contained the greatest number of large woody debris stems.
Segment 9 - Carters Bridge to Park Clinic accessSegment length is 23460 lf. Valley slope is 0.26 percent The stream begins to come intocontact with the town where extensive alterations have been made to the west (left) sideof the channel. This segment contains the second greatest amount - 26%, of banksprotected by riprap. About 2,765 feet of rock bank protection and 14 rock barb/jettystructures have been added since 1987. About 20% of the west bank channel length hasbeen diked to protect developed areas. The eastern bank of this segment is largely stable,although little flood plain is available. Stability is controlled by the steep and rocky slopesof Livingston Peak.
The large number of cars once found in this segment (53), are now down to only 2observed.
A mile downstream of Carter Bridge and again immediately upstream of the InterstateBridge, extensive deposition has occurred, creating large mid channel gravel bars. TheInterstate Bridge is the limit of the 1987 inventory
Segment 10 - Park Clinic to Mayor’s Landing accessSegment length is 11,024 lf. Valley slope is 0.23 percent. This segment is similar to 9except that after the Interstate, more floodplain is available on the east (right) bank. Aninteresting feature here is that a relatively new earth dike makes up about 71% of the leftbank length. The segment contains the greatest percent of banks protected with rock,

14
about 28%. The feature is mainly associated with the dikes. Several old dumps and debrispiles were noted along the route, also.
The channel aspect is much the same as the previous reach with extensive aggredationtaking place. At the lower end of this short reach, the channel location and grade is againcontrolled by erosion resistant rock outcrops on the right (east) bank and a sill across theriverbed.
Segment 11 - Mayor’s Landing access to Shields River Bridge accessSegment length is 38,016 lf. Valley gradient is 0.20 percent. Although no records areavailable for comparison, it appears that flooding caused significant change in stability andchannel configuration. 10,300 lf or about 13.5% of bank length is protected with placedrock. About 13% of the banks are actively eroding or wasting material into the river.
Immediately downstream of the landing is an old landfill adjacent to the river. Some carand other debris was observed on an actively eroding bank here.
It was noted that the railroad and highway bridge fills create effective floodplain blockagesthat impede the passage of flood flows through this section without greatly increasing thevelocity of flood waters. Downstream of the bridge, quite a bit of deposition hasoccurred. The left (north) bank of the stream is bordered by relatively new homedevelopment.. A significant amount of bank mass wasting on the high banks is occurringand may threaten these homes if accelerated. Much of the balance of the left (north) bankis fringed with development. Channel movement is controlled by bedrock outcrops.
The Shields River Bridge fill material also creates the same conditions as those for theupper bridges.
Segment 12 - Shields River Bridge access to Pig Farm access (private)The segment length is 48,656 lf. Valley gradient is 0.16 percent. Debris accumulation issignificant in the upper 7/8ths of this segment, both gravel material and large woodydebris. Over 30% of the banks were put in an erosional category. Participants noted thatwhile even well vegetated banks had been damaged, those with good diverse woodyvegetation were damaged less extensively. Long, wide mid channel bars have developedcreating diverse stages of side channel development. Some of the side channels are over200 ft wide. Participants noted that historic evidence of these very dynamic channelchanging conditions can be seen on the photos. A fair amount of bank protectionactivities have taken place. About 9% of bank length has had rock protection placed inaddition to 32 rock jetty/barb structures.
The mouth of the Shields River has deposited a lot of debris and gravel in the channel,evidence of a significant amount of bedload movement.

15
The lower 1/8 of the segment has changed little through this entrenched section, althoughsome of the high bank toes have been scoured of vegetation. Bedrock outcrops and sillsin the streambed maintain the single channel conditions.
Segment 13 - Pig Farm access to Springdale accessSegment length is 54,468 lf. Valley slope is 0.18 percent. This upper 1/3rd of thissegment continues with a single channel. Bedrock control gives a pool and drop sequenceto the river. Much of the banks are stable with good vegetation and large rock material.The flood plain is narrow and confined.
The lower 2/3rds again shows evidence of gradient change with the stream becomingwider and meandering in a braided pattern. Extensive deposition and lateral movementhas occurred. Large areas of woody and gravel debris are found. The river comes incontact with the interstate and railroad corridor resulting in quite a bit of mostly successfulplacement of large rock to protect these facilities. About 12% of the banks have beentreated in this manner. As in the previous two segments, the left (north) bank is largelybedrock material. The inventory ended at the access below the Springdale Bridge
WATER QUALITY
A detailed analysis of the samples is not presented here as the information is not sufficient,however several areas are identified for more detailed study. The samples showed noexceedences of state water quality standards. Several upper river samples do havesomewhat elevated levels of nitrate + nitrite. Ammonia levels in the first two samplesalso appear higher than expected for well aerated surface waters. Further analysis of thisarea may be useful to document the origin(s) of these forms of nitrogen.
In a downstream direction constituents either increase due to concentration or decreasedue to dilution pretty much as expected.
Suspended sediment and turbidity have been identified as the major causes of pollution inthe Upper Yellowstone. Previous studies have identified four drainages in YellowstoneNational Park as the primary sources of sediment loads: the Lamar-Tower drainage; theYellowstone River from Lake to Tower; Soda Butte Creek; and the Gardiner River.Suspended solids levels measured during the April inventory do not reflect the elevatedlevels commonly measured during high flow events.
Several tributaries to the Yellowstone have been identified that contribute significantamounts of heavy metals to the river from abandoned mines. Soda Butte, Daisy andFisher Creeks have been prioritized as high for future reclamation work.
Total suspended sediment levels measured during the 1998 inventory fluctuated slightlydownriver and likely indicate some additional sources of sediment are found along theriver or in tributaries. The Shields River Mouth station, (#513) showed a significantlyhigher TSS level, (51.3 mg/l), than levels found in the Yellowstone River above that point,(<20.0 mg/l). Several metals also showed elevated levels contained within waters of the

16
Shields River. While much of the Shields River geology and soils are different than theYellowstone, additional monitoring work to identify potential sources of sediment andmetals appears to be warranted.
Lab analysis results are presented in Table 5 on page 14. The U.S.Geological Surveysampled water quality at gaging stations near Corwin Springs, MT and near Livingston,MT for a number of years. For purposes of comparison, Tables 6 and 7 list statistics forselected constituents at these two stations. Water quality sampling at the stations wasdiscontinued in 1994.
The U.S.G.S. began a full scale National Water-Quality Assessment (NAWQA) Programon the Yellowstone River system in Wyoming and Montana in 1997. Intensive waterquality and biological data collection is scheduled to begin in 1999. At least two studysites are proposed in Park County. For more information on the study schedule, scope ofwork and purpose, please contact the U.S.G.S. (307)778-2931; Internet:http://wyoming.usgs.gov/YELL/yell.html.
Table 6 STATISTICAL SUMMARY OF SELECTED WATER QUALITY DATA COLLECTED FROM OCT. 1969 TO SEPT. 1992 AT USGS GAGING STATION - CORWIN SPRINGS, MT
WATERQUALITYCONSTITUENT
SAMPLE SIZE MAXIMUM MINIMUM MEAN
AMMONIA, mg/l 25 0.37 0.00 0.085NITRATE + NITRATE
, mg/l21 1.90 <0.10 0.263
CALCIUM, mg/l 33 23.0 7.9 14.918MAGNESIUM, mg/l 33 7.10 2.70 4.891SODIUM, mg/l 33 28.00 5.60 17.621POTASSIUM, mg/l 10 5.90 1.50 3.530CHLORIDE, mg/l 34 22.00 2.10 9.944SULFATE, mg/l 43 81.00 7.50 32.160BORON, mg/l 17 0.65 0.06 0.335IRON, mg/l 3 0.160 0.024 ---
pH, units 42 8.70 6.40 7.49SPECIFICCONDUCT-ANCE,
us/cm
64 432.00 80.00 214.23
SUSPENDEDSEDMT,
mg/l
48 975 3 119
SUSPENDEDSEDMT, tons/day
48 35800 6.6 n/a
HARDNESS, mg/l 29 82 1 55.3WATER TEMP. 0C 76 19.5 0.0 n/aData provided by U.S. Geological Survey, WRD, 301 South Park Ave., Helena, MT

17
TABLE 7 STATISTICAL SUMMARY OF SELECTED WATER QUALITY DATA COLLECTED FROM OCT. 1969 TO
SEPT. 1992 AT USGS GAGING STATION - LIVINGSTON, MTWATERQUALITYCONSTITUENT
SAMPLE SIZE MAXIMUM MINIMUM MEAN
AMMONIA, mg/l 92 0.53 <0.01 0.073NITRATE + NITRATE
, mg/l223 1.20 <0.05 0.149
CALCIUM, mg/l 259 35.00 8.60 19.610MAGNESIUM, mg/l 259 11.00 2.00 6.211SODIUM, mg/l 258 30.00 4.90 15.989POTASSIUM, mg/l 259 6.70 1.10 3.849CHLORIDE, mg/l 259 20.00 1.00 8.160SULFATE, mg/l 259 55.00 3.00 26.833
IRON, mg/l 193 0.33 <0.001 0.040BORON, mg/l 39 0.423 0.05i 0.269
pH, units 253 8.9 6.40 n/aSPECIFICCONDUCT-ANCE,
us/cm
253 382 83 228
SUSPENDEDSEDMT,
mg/l
103 643 2 41
SUSPENDEDSEDMT, tons/day
144 18100 7.3 n/a
HARDNESS, mg/l 231 130 32 74WATER TEMP. 0C 253 20.0 0.0 n/aData provided by U. S. Geological Survey, WRD, 301 South Park Ave., Helena, MT
In general, the waters of the Upper Yellowstone are of relatively good quality. TheYellowstone River is classified as a B-1 use classification under the Montana WaterQuality Act. Waters classified as B-1 are suitable for drinking, culinary and foodprocessing purposes following conventional treatment; bathing, swimming and recreation;growth and propagation of salmonid fishes and associated aquatic life, waterfowl andfurbearers; and agricultural and industrial water supply uses.
BED MATERIAL SIZE DISTRIBUTION
Findings indicate that factors other than channel slope may play a role in size distributionof bed material. The sampling procedure was chosen as a means to depict the mediansize of bedload material moved during flooding events. In reality, this procedure mayhave only sampled material deposited as flood flows receded. Due to the complexity ofthe stream, and the difficulty in locating true point bar features, it is likely that moresophisticated procedures to describe and understand bedload movement will be required.
Table 8 shows the median particle size determined through the transect method. Table 9gives valley slope for the segments inventoried. Figure 2 illustrates the variation in size

18
over the length of the river. A regression analysis showed no correlation of particle size toslope class using this data
CONCLUSION
Based on our observations, it is apparent that the Yellowstone River has undergoneconsiderable changes in several segments since the 1987 inventory was performed. Inparticular, segments 7, 8, and 9 have experienced a number of bank protection treatmentsin an effort to mitigate channel changes. All segments in the middle and lower sections ofthe study area have a relatively high percentage of eroding banks. The changes appearlargely due to the effects of and in reaction to the high water events, which occurred in1996 and 1997. Analysis of gage data at Livingston shows that there has been a 6 percentincrease in annual flow in the ten year period following 1987, as compared to the ten yearperiod preceding 1987. This increase in flow is partially due to the large amount of openarea created as a result of the 1988 fires in Yellowstone National Park and adjacent areasin the watershed.
In terms of vegetative health on the stream banks, 1987 had the lowest flow in the twentyyear period analyzed at 66 percent of average, with 1985 being 82 percent of average, and1986 being 111 percent of average. As a result, streambank vegetation in the three yearperiod prior to the 1987 inventory was minimally stressed by high flows. In contrast, the1995 flow was 102 percent of average, the 1996 flow was 141 percent of average, and the1997 flow was 163 percent of average, giving the streambank vegetation little chance forrecovery prior to the 1998 inventory.
The purpose of this inventory was to quantify physical changes to the river in the studyarea. It is recommended that the impacts of these changes be studied further, particularlythe long-term impacts to the river and its associated values, ie. aquatic life, riparian andfloodplain functions, upland land uses, and economics. A detailed hydrologic study is alsoplanned which may help to explain some of the changes and offer some prediction as totheir effect on these resources.
Nearly all obstructions in the flood plain such as bridges and abutment fills were observedto have an impact on the function of the channel’s transport of sediment and bedload. It isrecommended that any studies to evaluate floodplain function also evaluate ways tomitigate such impacts.

19
APPENDIX C 1998 Survey Participants
THANKS TO:
Task Force Members Natural Resource Conservation Service Montana Dept. of Env. QualityRoy Aserlind Joe Carleton Randy ApfelbeckJohn Bailey Ron Hoagland Bob BukantisShaunda Hildebrand Mike Garsjo Stuart LehmanTom LaneRod SiringEllen Woodbury
Montana Dept. FWPJoel TohtzTim Weiss
U.S. Army C.O.EDoug McDonald
Montana Dept. NaturalResourcesDaveAmmanKarl ChristiansMary VandenboschMindy Gauthier
Warren KelloggLarry MurphyTom PickLinda PetersonTony RolfesChuck RoloffWendy WilliamsScott Zimmerman
U.S. Forest ServiceScott Schuler
Consulting FirmsChandler and Assoc.Inter-fluve, Inc.Perri Phillips
Yellowstone RiverOutfitters and GuidesTom ColemanJim FrancisJohn GreenDave HandleTom HarmsKatherine HoweKim LaytonRichard Parks
Montana Dept. ofTransportation
Jan Langel

20
APPENDIX D TASK FORCE MISSION AND MEMBERS
What is the Upper Yellowstone River Task Force? Created by Governor Racicot to address problemsarising from the large floods of 1996 and 1997, the Upper Yellowstone River Task Force is a structurednon-regulatory organization that works to accomplish its important mission in a consensus-buildingmanner, that stresses education, cooperation, broad-based community involvement and voluntaryparticipation.
The members of the Task Force represent a wide cross-section of citizens and local, state and federalagency representatives working to, “develop a shared understanding of the issues and uses that impact theupper Yellowstone River… for the purpose of encouraging a comprehensive approach to actions takenalong the upper Yellowstone River so as to ensure that its integrity remains intact while balancing theneeds and communities and landowners to protect property”.
Those wishing more detailed information regarding any aspect of the Task Force and its activities areencouraged to contact John Bailey, Chair (406-222-1673) or Liz Galli-Noble, Coordinator (406-222-2899). Mailing address: Upper Yellowstone River Task Force, 5242 Highway 89 South, Livingston, MT59047.
Listed below are the current Task Force members:
Officio:
John BaileyChair
Mike AtwoodVice Chair
Roy AserlindCitizen Member
Martin DavisPark Conservation District
Michelle GoodwineCitizen Member
Steve WoodhullPlanning DepartmentCity of Livingston
Tom LaneCitizen Member
Jerry O’HairCitizen Member

21
Brant OswaldCitizen Member
Rod SiringCitizen Member
Bob WiltshireCitizen Member
Ellen WoodburyPark CountyPlanning Department
Ex-Officio:
Stuart ColemanU.S. Park ServiceYellowstone Nat’l Park
Stuart LehmanMT Dept. Environmental Quality, Helena
John LoganUS Forest ServiceGardiner District
Joel MarshikMT Dept. of Transportation, Helena
Terri MarceronU.S. Forest ServiceLivingston District
Laurence SirokyMT Dept. of Natural Resource, Helena
Allan SteinleU.S. Army Corps of Engineers, Helena
Related Documents