Upper Owyhee River TMDL Five-Year Review Hawk Stone Department of Environmental Quality Boise Regional Office 1445 N. Orchard Boise, Idaho, 83706

Welcome message from author
This document is posted to help you gain knowledge. Please leave a comment to let me know what you think about it! Share it to your friends and learn new things together.
Transcript

Upper Owyhee River
TMDL Five-Year Review
Hawk Stone
Department of Environmental Quality
Boise Regional Office
1445 N. Orchard
Boise, Idaho, 83706

Upper Owyhee River Five Year Review • June 2009
ii
Upper Owyhee River Five Year Review • June 2009
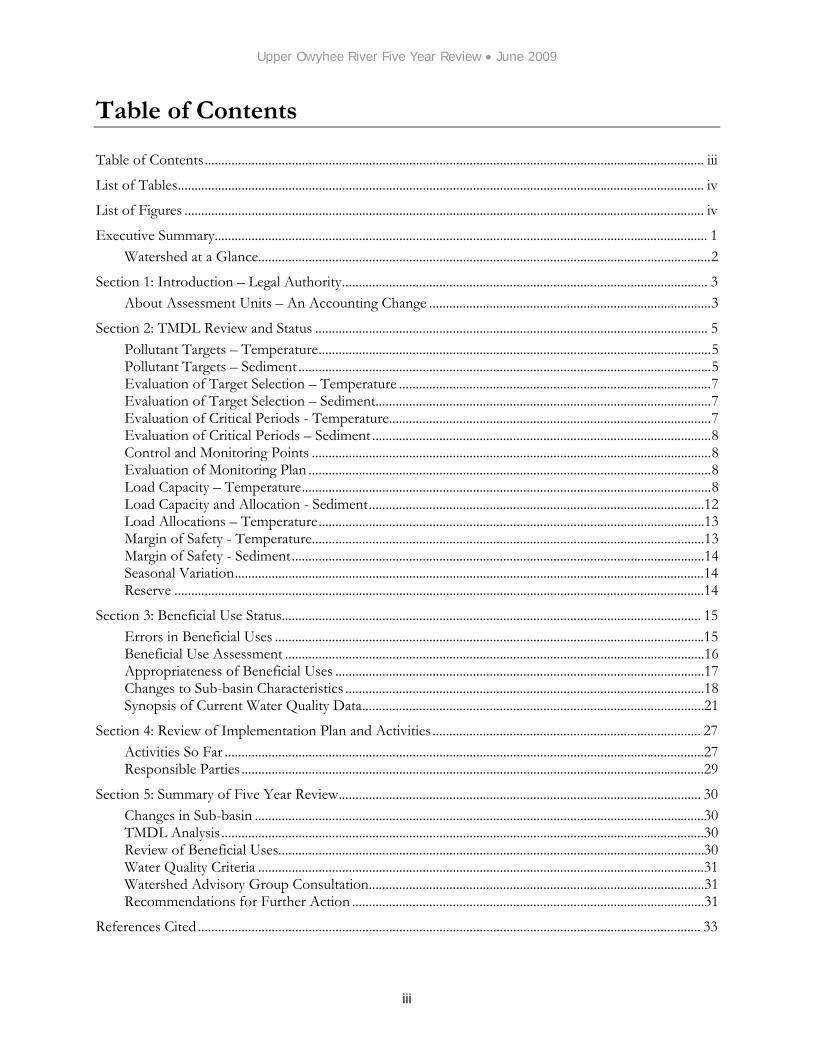
Table of Contents
Table of Contents..................................................................................................................................................... iii
List of Tables............................................................................................................................................................. iv
List of Figures ........................................................................................................................................................... iv
Executive Summary................................................................................................................................................... 1 Watershed at a Glance.......................................................................................................................................2
Section 1: Introduction – Legal Authority............................................................................................................. 3 About Assessment Units – An Accounting Change ....................................................................................3
Section 2: TMDL Review and Status ..................................................................................................................... 5 Pollutant Targets – Temperature.....................................................................................................................5 Pollutant Targets – Sediment ...........................................................................................................................5 Evaluation of Target Selection – Temperature .............................................................................................7 Evaluation of Target Selection – Sediment....................................................................................................7 Evaluation of Critical Periods - Temperature................................................................................................7 Evaluation of Critical Periods – Sediment .....................................................................................................8 Control and Monitoring Points .......................................................................................................................8 Evaluation of Monitoring Plan ........................................................................................................................8 Load Capacity – Temperature..........................................................................................................................8 Load Capacity and Allocation - Sediment....................................................................................................12 Load Allocations – Temperature...................................................................................................................13 Margin of Safety - Temperature.....................................................................................................................13 Margin of Safety - Sediment...........................................................................................................................14 Seasonal Variation............................................................................................................................................14 Reserve ..............................................................................................................................................................14
Section 3: Beneficial Use Status............................................................................................................................. 15 Errors in Beneficial Uses ................................................................................................................................15 Beneficial Use Assessment .............................................................................................................................16 Appropriateness of Beneficial Uses ..............................................................................................................17 Changes to Sub-basin Characteristics ...........................................................................................................18 Synopsis of Current Water Quality Data......................................................................................................21
Section 4: Review of Implementation Plan and Activities ................................................................................ 27 Activities So Far ...............................................................................................................................................27 Responsible Parties ..........................................................................................................................................29
Section 5: Summary of Five Year Review............................................................................................................ 30 Changes in Sub-basin ......................................................................................................................................30 TMDL Analysis................................................................................................................................................30 Review of Beneficial Uses...............................................................................................................................30 Water Quality Criteria .....................................................................................................................................31 Watershed Advisory Group Consultation....................................................................................................31 Recommendations for Further Action .........................................................................................................31
References Cited ...................................................................................................................................................... 33
iii

Upper Owyhee River Five Year Review • June 2009
List of Tables
Table 1. Status of Assessment Units with Temperature or Sediment TMDLs. ......................................1 Table 2. Summary of Watershed ....................................................................................................................2 Table 3. Heat Load Capacity for Support of Beneficial Uses ....................................................................9 Table 4. Shade Requirements to Achieve Load Capacities.......................................................................10 Table 5. Sediment Load Capacity and Allocation Required to Attain 50mg/l Susp. Sediment..........12 Table 6. Sediment Load Capacity and Allocation Required to Attain 80 mg/l Susp. Sediment.........13 Table 7. Percent Fines Load Capacity and Allocation...............................................................................13 Table 8. Reservoir Turbidity Load Capacity and Allocation ....................................................................13 Table 9. Beneficial Uses of TMDL Water Bodies .....................................................................................15 Table 10. BURP Monitoring Data ...............................................................................................................21 Table 11. BLM Greenline Monitoring Data ...............................................................................................22 Table 12. Physical Water Quality Parameters .............................................................................................25 Table 13 Proper Functioning Condition Results ........................................................................................28 Table 14. Parties Responsible for TMDL Implementation......................................................................29
List of Figures
Front Cover: Owyhee River at Juniper Creek (Hawk Stone, November 2008) Figure 1. Location of Sub-Basin. ....................................................................................................................4 Figure 2. Watershed Map.................................................................................................................................6 Figure 3. Steps for Determining Support Status of Beneficial Uses in Wadeable Streams .................17 Figure 4: Owyhee River Wilderness ..............................................................................................................19 Figure 5: Pole Creek Wilderness....................................................................................................................20 Figure 6. Nickel Creek Temperature Logger ..............................................................................................22 Figure 7. Pole Creek Temperature Logger..................................................................................................23 Figure 8. East Fork Red Canyon (Lower) Temperature Logger..............................................................23 Figure 9. East Fork Red Canyon (Upper) Temperature Logger..............................................................24 Figure 10. Red Canyon Creek (Lower) Temperature Logger...................................................................24 Figure 11. West Fork Red Canyon Creek Temperature Logger ..............................................................25
iv
Upper Owyhee River Five Year Review • June 2009
Executive Summary
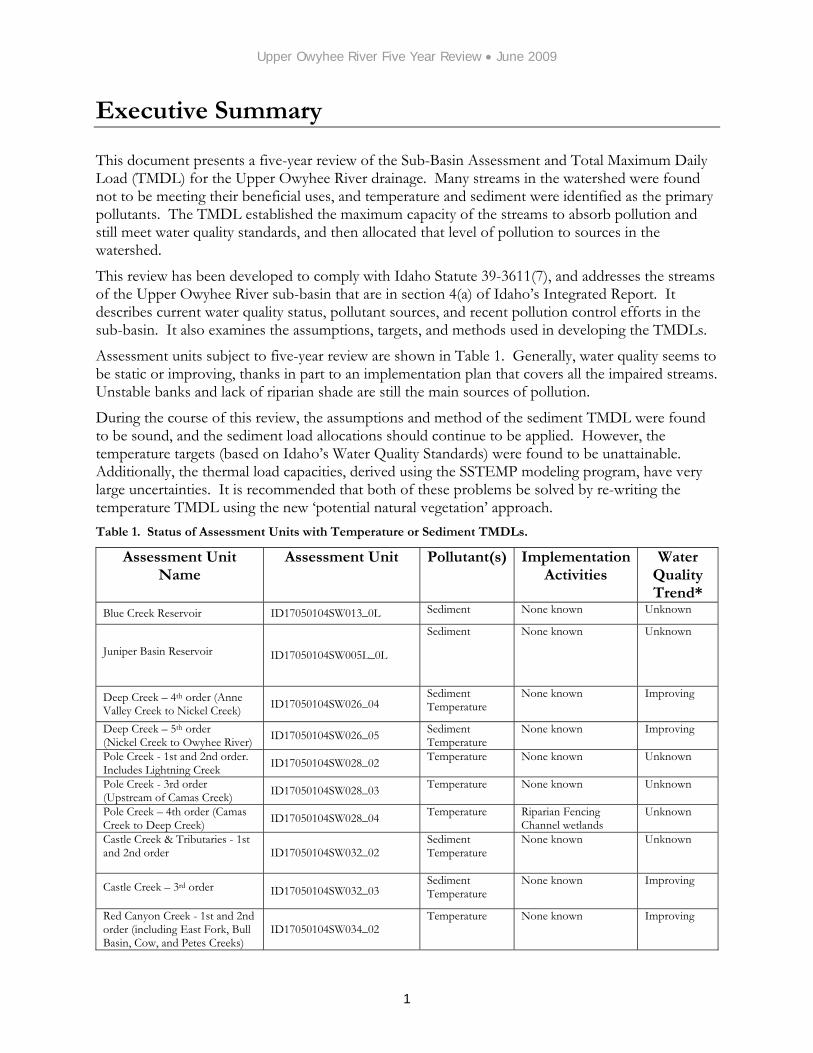
This document presents a five-year review of the Sub-Basin Assessment and Total Maximum Daily Load (TMDL) for the Upper Owyhee River drainage. Many streams in the watershed were found not to be meeting their beneficial uses, and temperature and sediment were identified as the primary pollutants. The TMDL established the maximum capacity of the streams to absorb pollution and still meet water quality standards, and then allocated that level of pollution to sources in the watershed.
This review has been developed to comply with Idaho Statute 39-3611(7), and addresses the streams of the Upper Owyhee River sub-basin that are in section 4(a) of Idaho’s Integrated Report. It describes current water quality status, pollutant sources, and recent pollution control efforts in the sub-basin. It also examines the assumptions, targets, and methods used in developing the TMDLs.
Assessment units subject to five-year review are shown in Table 1. Generally, water quality seems to be static or improving, thanks in part to an implementation plan that covers all the impaired streams. Unstable banks and lack of riparian shade are still the main sources of pollution.
During the course of this review, the assumptions and method of the sediment TMDL were found to be sound, and the sediment load allocations should continue to be applied. However, the temperature targets (based on Idaho’s Water Quality Standards) were found to be unattainable. Additionally, the thermal load capacities, derived using the SSTEMP modeling program, have very large uncertainties. It is recommended that both of these problems be solved by re-writing the temperature TMDL using the new ‘potential natural vegetation’ approach. Table 1. Status of Assessment Units with Temperature or Sediment TMDLs.
Assessment Unit Name
Assessment Unit Pollutant(s) Implementation Activities
Water Quality Trend*
Blue Creek Reservoir ID17050104SW013_0L Sediment None known Unknown
Juniper Basin Reservoir ID17050104SW005L_0L
Sediment None known Unknown
Deep Creek – 4th order (Anne Valley Creek to Nickel Creek) ID17050104SW026_04
Sediment Temperature
None known Improving
Deep Creek – 5th order (Nickel Creek to Owyhee River) ID17050104SW026_05 Sediment
Temperature None known Improving
Pole Creek - 1st and 2nd order. Includes Lightning Creek ID17050104SW028_02 Temperature None known Unknown
Pole Creek - 3rd order (Upstream of Camas Creek) ID17050104SW028_03 Temperature None known Unknown
Pole Creek – 4th order (Camas Creek to Deep Creek) ID17050104SW028_04 Temperature Riparian Fencing
Channel wetlands Unknown
Castle Creek & Tributaries - 1st and 2nd order
ID17050104SW032_02 Sediment Temperature
None known Unknown
Castle Creek – 3rd order ID17050104SW032_03 Sediment Temperature
None known Improving
Red Canyon Creek - 1st and 2nd order (including East Fork, Bull Basin, Cow, and Petes Creeks)
ID17050104SW034_02 Temperature None known Improving
1

Upper Owyhee River Five Year Review • June 2009
Assessment Unit Name
Assessment Unit Pollutant(s) Implementation Activities
Water Quality Trend*
Red Canyon Creek - 3rd order ID17050104SW034_03 Temperature None known Improving
Red Canyon Creek - 4th order ID17050104SW034_04 Temperature None known Unknown
Nickel Creek & tributaries – 1st and 2nd order (Includes Wilson, Little Thomas, Little Smith, and the upper sections of Smith and Thomas Creeks)
ID17050104SW031_02
Sediment
None known Static
Nickel, Thomas & Smith Creeks - third order sections ID17050104SW031_03 Sediment
None known Static
Nickel Creek – 4th order (Between Thomas and Deep Creeks)
ID17050104SW031_04 Sediment None known Static
* as determined by BURP and Riparian PFC monitoring
Watershed at a Glance Table 2. Summary of Watershed
Approved TMDLs Pollutants Within Watershed Assessment Units Going From 4a to 2
Temperature (10 AUs)
Sediment (9 AUs)
Temperature
Sediment
none
Implementation Plans Assessment Units Going from 3 to 5
ID17050104SW031_04
ID17050104SW012_03*
ID17050104SW025_03*
ID17050104SW024_02*
Estimated Percent of Watershed in 4a or 5
Upper Owyhee Watershed TMDL Implementation Plan for Agriculture, completed October 2004
Implementation Actions
Riparian Fencing on Camas Creek
Channel wetland ponds on Camas Creek
40%
* as a result of BURP monitoring
2
Upper Owyhee River Five Year Review • June 2009
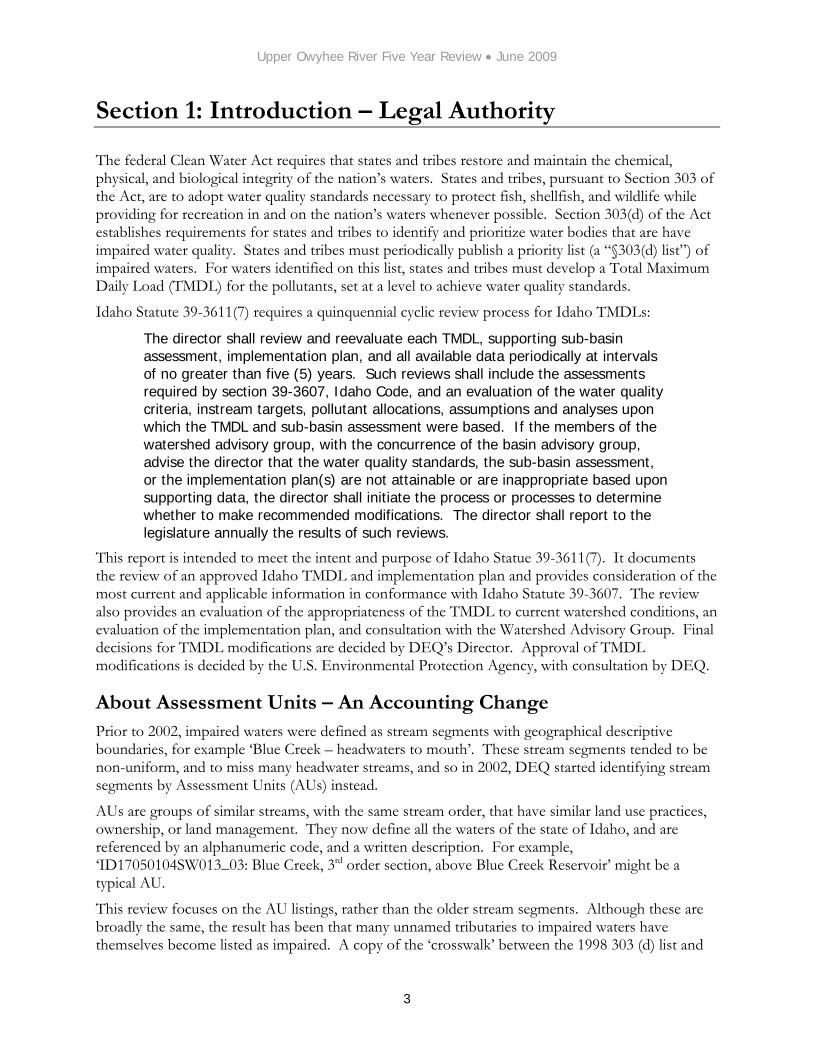
Section 1: Introduction – Legal Authority
The federal Clean Water Act requires that states and tribes restore and maintain the chemical, physical, and biological integrity of the nation’s waters. States and tribes, pursuant to Section 303 of the Act, are to adopt water quality standards necessary to protect fish, shellfish, and wildlife while providing for recreation in and on the nation’s waters whenever possible. Section 303(d) of the Act establishes requirements for states and tribes to identify and prioritize water bodies that are have impaired water quality. States and tribes must periodically publish a priority list (a “§303(d) list”) of impaired waters. For waters identified on this list, states and tribes must develop a Total Maximum Daily Load (TMDL) for the pollutants, set at a level to achieve water quality standards.
Idaho Statute 39-3611(7) requires a quinquennial cyclic review process for Idaho TMDLs:
The director shall review and reevaluate each TMDL, supporting sub-basin assessment, implementation plan, and all available data periodically at intervals of no greater than five (5) years. Such reviews shall include the assessments required by section 39-3607, Idaho Code, and an evaluation of the water quality criteria, instream targets, pollutant allocations, assumptions and analyses upon which the TMDL and sub-basin assessment were based. If the members of the watershed advisory group, with the concurrence of the basin advisory group, advise the director that the water quality standards, the sub-basin assessment, or the implementation plan(s) are not attainable or are inappropriate based upon supporting data, the director shall initiate the process or processes to determine whether to make recommended modifications. The director shall report to the legislature annually the results of such reviews.
This report is intended to meet the intent and purpose of Idaho Statue 39-3611(7). It documents the review of an approved Idaho TMDL and implementation plan and provides consideration of the most current and applicable information in conformance with Idaho Statute 39-3607. The review also provides an evaluation of the appropriateness of the TMDL to current watershed conditions, an evaluation of the implementation plan, and consultation with the Watershed Advisory Group. Final decisions for TMDL modifications are decided by DEQ’s Director. Approval of TMDL modifications is decided by the U.S. Environmental Protection Agency, with consultation by DEQ.
About Assessment Units – An Accounting Change Prior to 2002, impaired waters were defined as stream segments with geographical descriptive boundaries, for example ‘Blue Creek – headwaters to mouth’. These stream segments tended to be non-uniform, and to miss many headwater streams, and so in 2002, DEQ started identifying stream segments by Assessment Units (AUs) instead.
AUs are groups of similar streams, with the same stream order, that have similar land use practices, ownership, or land management. They now define all the waters of the state of Idaho, and are referenced by an alphanumeric code, and a written description. For example, ‘ID17050104SW013_03: Blue Creek, 3rd order section, above Blue Creek Reservoir’ might be a typical AU.
This review focuses on the AU listings, rather than the older stream segments. Although these are broadly the same, the result has been that many unnamed tributaries to impaired waters have themselves become listed as impaired. A copy of the ‘crosswalk’ between the 1998 303 (d) list and
3

Upper Owyhee River Five Year Review • June 2009
the 2002 Section 5 “impaired waters” category in the Integrated Report is available from the DEQ website at www.deq.state.id.us/water/data_reports/surface_water/monitoring/2002.cfm#2002final
Figure 1. Location of Sub-Basin.
4
Upper Owyhee River Five Year Review • June 2009
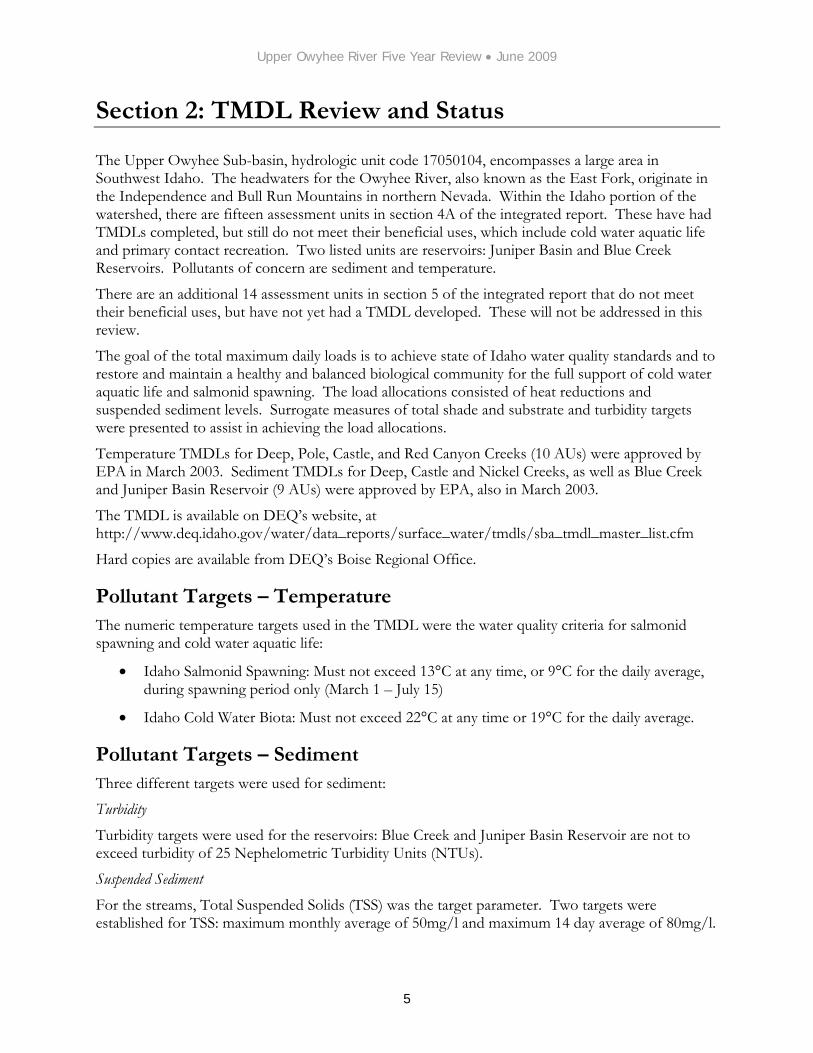
Section 2: TMDL Review and Status
The Upper Owyhee Sub-basin, hydrologic unit code 17050104, encompasses a large area in Southwest Idaho. The headwaters for the Owyhee River, also known as the East Fork, originate in the Independence and Bull Run Mountains in northern Nevada. Within the Idaho portion of the watershed, there are fifteen assessment units in section 4A of the integrated report. These have had TMDLs completed, but still do not meet their beneficial uses, which include cold water aquatic life and primary contact recreation. Two listed units are reservoirs: Juniper Basin and Blue Creek Reservoirs. Pollutants of concern are sediment and temperature.
There are an additional 14 assessment units in section 5 of the integrated report that do not meet their beneficial uses, but have not yet had a TMDL developed. These will not be addressed in this review.
The goal of the total maximum daily loads is to achieve state of Idaho water quality standards and to restore and maintain a healthy and balanced biological community for the full support of cold water aquatic life and salmonid spawning. The load allocations consisted of heat reductions and suspended sediment levels. Surrogate measures of total shade and substrate and turbidity targets were presented to assist in achieving the load allocations.
Temperature TMDLs for Deep, Pole, Castle, and Red Canyon Creeks (10 AUs) were approved by EPA in March 2003. Sediment TMDLs for Deep, Castle and Nickel Creeks, as well as Blue Creek and Juniper Basin Reservoir (9 AUs) were approved by EPA, also in March 2003.
The TMDL is available on DEQ’s website, at http://www.deq.idaho.gov/water/data_reports/surface_water/tmdls/sba_tmdl_master_list.cfm
Hard copies are available from DEQ’s Boise Regional Office.
Pollutant Targets – Temperature The numeric temperature targets used in the TMDL were the water quality criteria for salmonid spawning and cold water aquatic life:
• Idaho Salmonid Spawning: Must not exceed 13°C at any time, or 9°C for the daily average, during spawning period only (March 1 – July 15)
• Idaho Cold Water Biota: Must not exceed 22°C at any time or 19°C for the daily average.
Pollutant Targets – Sediment Three different targets were used for sediment:
Turbidity Turbidity targets were used for the reservoirs: Blue Creek and Juniper Basin Reservoir are not to exceed turbidity of 25 Nephelometric Turbidity Units (NTUs).
Suspended Sediment For the streams, Total Suspended Solids (TSS) was the target parameter. Two targets were established for TSS: maximum monthly average of 50mg/l and maximum 14 day average of 80mg/l.
5

Upper Owyhee River Five Year Review • June 2009
Substrate Targets relating to the composition of the stream bed were also chosen for the above impaired streams. Riffle areas of the stream substrate are not to exceed 30% fine particles (<6mm).
Figure 2. Watershed Map
6

Upper Owyhee River Five Year Review • June 2009
Evaluation of Target Selection – Temperature
The impaired stream reaches were not compared to reference streams, but rather to statewide temperature criteria. Unfortunately, the hot, dry summers and low water levels of many Owyhee County streams mean that it is likely that even a reference-condition stream would violate these criteria. For example, DEQ uses Little Jacks Creek as a desert reference site for its Beneficial Use Reconnaissance Program (BURP) monitoring, and yet temperatures exceed criteria for the entire summer (Idaho Fish and Game, 2001).
This implies that the water quality standards may not be well correlated with the support of beneficial uses in this watershed. The water quality criteria targets were used in the TMDL because DEQ had not yet developed its Potential Natural Vegetation approach, which uses the ‘natural background’ clause of the standards. That method is explained towards the end of this review.
Evaluation of Target Selection – Sediment
Turbidity Most literature values indicate that turbidity levels above 25 NTUs impair beneficial uses (Lloyd 1987, Sigler et al. 1984 and Bash, Berman and Bolton 2001). For this reason, these turbidity targets are appropriate for the TMDL.
Suspended Sediment The choice of the suspended sediment targets was guided by other TMDLs that have been written in southwest Idaho. The values of 80mg/l and 50mg/l were used in the Lower Boise and Bruneau River TMDLs. A more watershed-specific approach was discussed in the TMDL, but there were too many unknown variables for it to be practicable. The Bruneau River system is very similar to the Owyhee River system, and so these targets provide a good estimate for protecting beneficial uses.
Substrate An Idaho State University study (Relyea, Minshall, and Danehy 2000) linked certain biological indicator species with characteristics of the stream morphology. Specifically, the study showed that when the substrate exceeded 30% fine particles, the community structure started to include sediment-tolerant stoneflies. This provides a direct link between the Cold Water Aquatic Life use and a sediment target. As such, this is a very appropriate target for the substrate.
Evaluation of Critical Periods - Temperature
The salmonid spawning critical period in the TMDL is March 1 – July 15. These dates were specified in the Water Quality Standards at the time the document was written. This section of the standards has been updated, and now says that the critical period is to be determined on a watershed basis by “knowledge of local fisheries biologists, published literature, records of the Idaho Department of Fish and Game, and other appropriate records” (250.02f). Idaho Fish and Game have not provided any information to suggest that this critical period is not appropriate.
The cold water aquatic life critical period in the TMDL is July 1 – August 31. This is the hottest part of the year, and if the streams were to meet the standard during this time, they would certainly meet it year round.
7

Upper Owyhee River Five Year Review • June 2009
Evaluation of Critical Periods – Sediment
The sediment targets apply year-round, and do not have critical periods.
Control and Monitoring Points The monitoring points used in the TMDL were established in the Upper Owyhee Monitoring Plan (Ingham 2001). Most streams in the watershed have very limited access, and so the sites identified in 2001 tend to be the only practical options. As such, they are the best available sites.
Evaluation of Monitoring Plan
DEQ monitoring is limited to sporadic Beneficial Use Reconnaissance Program (BURP) visits. The Bureau of Land Management (BLM) gathers riparian Proper Functioning Condition (PFC) data every few years. Given the long timeframes of many implementation activities, and the high cost of monitoring, infrequent BURP and PFC visits are appropriate to detect gross changes in water quality.
Load Capacity – Temperature A computer model called SSTEMP was used to estimate the load capacity. This model has 28 data inputs and yields a prediction of stream temperature. Table xx shows the maximum incident solar radiation that would satisfy each water quality target.
8

Upper Owyhee River Five Year Review • June 2009
Table 3. Heat Load Capacity for Support of Beneficial Uses (taken from the TMDL)
The model was then used to back-calculate the amount of shading required on each creek to meet water quality standards. Shading is an easier variable to measure, and is the only practical way to reduce water temperatures. As the amount of shade increases, the amount of heat exchange to the water body decreases.
9
Upper Owyhee River Five Year Review • June 2009
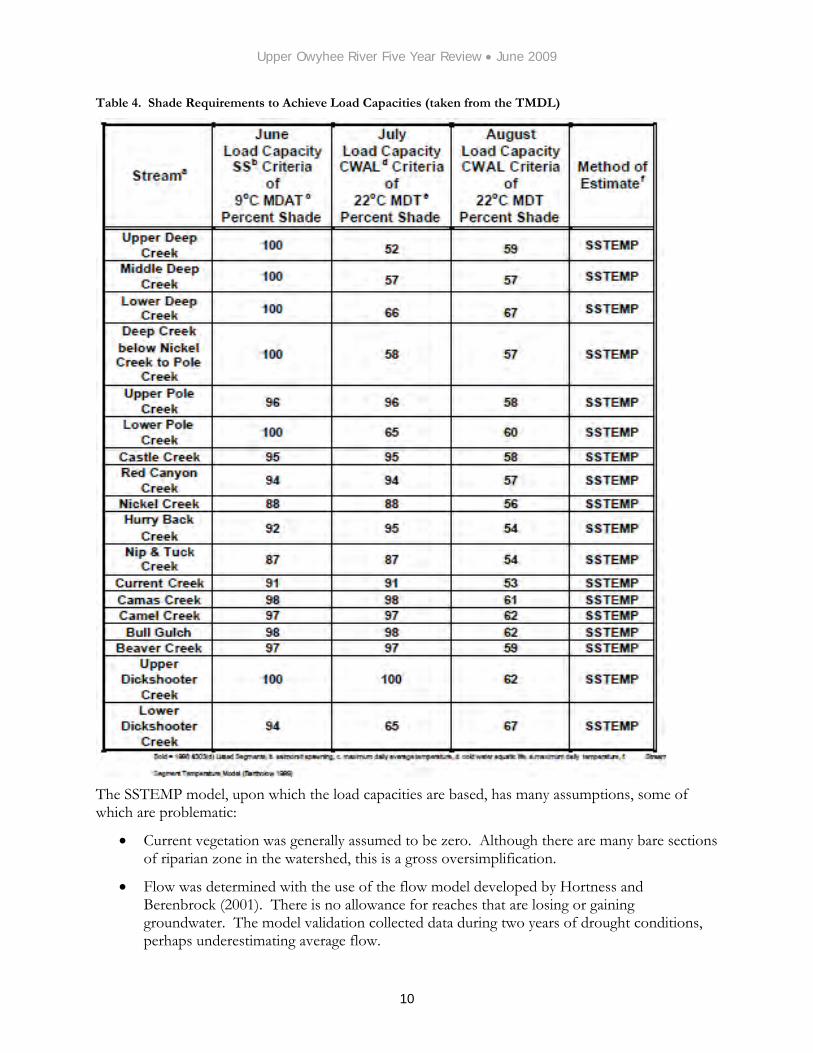
Table 4. Shade Requirements to Achieve Load Capacities (taken from the TMDL)
The SSTEMP model, upon which the load capacities are based, has many assumptions, some of which are problematic:
• Current vegetation was generally assumed to be zero. Although there are many bare sections of riparian zone in the watershed, this is a gross oversimplification.
• Flow was determined with the use of the flow model developed by Hortness and Berenbrock (2001). There is no allowance for reaches that are losing or gaining groundwater. The model validation collected data during two years of drought conditions, perhaps underestimating average flow.
10
Upper Owyhee River Five Year Review • June 2009
• Accretion Temperature: This is the expected ground water temperature, and was set at 8.3°C for all headwater streams. That value was determined by using the average yearly temperature at the Boise Airport.
• Latitude: 42 degrees was used for all segments. This is the lowest latitude of the study area, and is therefore slightly conservative.
• Dams in the watershed were not figured into the model. This is a problematic assumption because Blue and Squaw Creek Reservoirs may have a large impact on water temperatures in Blue Creek.
• Width/depth ratio was set to 25 for all streams, based on the limited BURP data. However, BURP sites tend to be in the most accessible (open) parts of the stream, and so might indicate an artificially high width/depth ratio.
• Streambed roughness (Manning's n) was set to 0.035. The substrate varies from sand-silt to large boulders, and the gradient can vary from 1-6%. It is not clear whether this is a reasonable assumption, nor from where it was derived. Certainly, the substrate in the watershed varies hugely.
• Air temperature in June was calculated from measurements taken in Boise. A formula using elevation and adiabatic lapse rate was then used to compensate for air temperature differences between Boise and Owyhee.
• Air temperatures in July and August were recorded by a single data logger installed near the confluence of Castle and Deep Creeks, at an elevation of about 5000 feet.
• Relative humidity was set at 61.2% for the months of June, July, and August, and was based on data gathered in Boise ID, and compensated for elevation. This assumption seems very high for the dry desert air of Owyhee County.
• Wind Speeds were obtained from the National Weather Service in Boise, Idaho and averaged for June, July, and August. It is unknown how well this value compares with the wind speed on the plains of southern Owyhee County.
• 'Percent sunny days' was determined to be 76%, based on measurements taken in Boise. The Owyhee desert is often sunnier than Boise, and so this estimate may be low.
• The dust coefficient was at 6 units (the middle value) for entire run of the model. It is unknown how reasonable this assumption is.
• Ground reflectivity was set at 15 and represents flat ground and rock. The high value was selected because of the area’s bare soils, silt, and sand. This is probably a reasonable assumption.
• Segment azimuth was determined from USGS 7.5-minute topographic maps. General designations of 0° or 45° were used, since most streams have a general directional flow. This ignores the meandering nature of most streams, but captures the average direction.
• Topographic attitude was determined from USGS 7.5 minute topographic maps, and was usually set at 45°, reflecting the steepness of the canyons. In many incidences, this value then converted to a topographic shading factor of 35%. For the streams that do not have steep canyons, the value was set at 10°. Canyon walls are variable, and no allowance was
11
Upper Owyhee River Five Year Review • June 2009
made for the width of the canyon bottom. Also, the position of the stream within the canyon bottom makes a large difference to topographic shading.
• Vegetation height was set as 10 feet. Most of the riparian woody vegetation in the Upper Owyhee Watershed is willows (Salix sp.), and most of these are low lying shrubs with a canopy height between 7 and 15 feet. This is an accurate characterization of the vegetation, and hence is a reasonable assumption.
• Vegetation offset is the distance from the center of the water body to the main trunk of the vegetation. This input value was set at 20 feet, because little information was available to assist with providing an accurate estimate. This value is very important to calculating vegetative shade.
• Vegetation density was set at 90%, following the suggestion of Bartholow, the model-builder. This seems rather high for Owyhee streams.
The above assumptions engender a healthy skepticism about the SSTEMP model. There are a great many unknowns that call the output into question. These concerns can be somewhat alleviated by considering the results of the model validation performed on July and August temperature data.
On nine data points (a rather small number), the model performed fairly well, predicting the temperature within 10%. However, with such a small sample size, it is impossible to know whether this was luck or genuine accuracy. It is possible that the errors in the assumptions cancel one another out, but with so many sources of variation, more monitoring of actual stream conditions would provide better confidence in the load capacities.
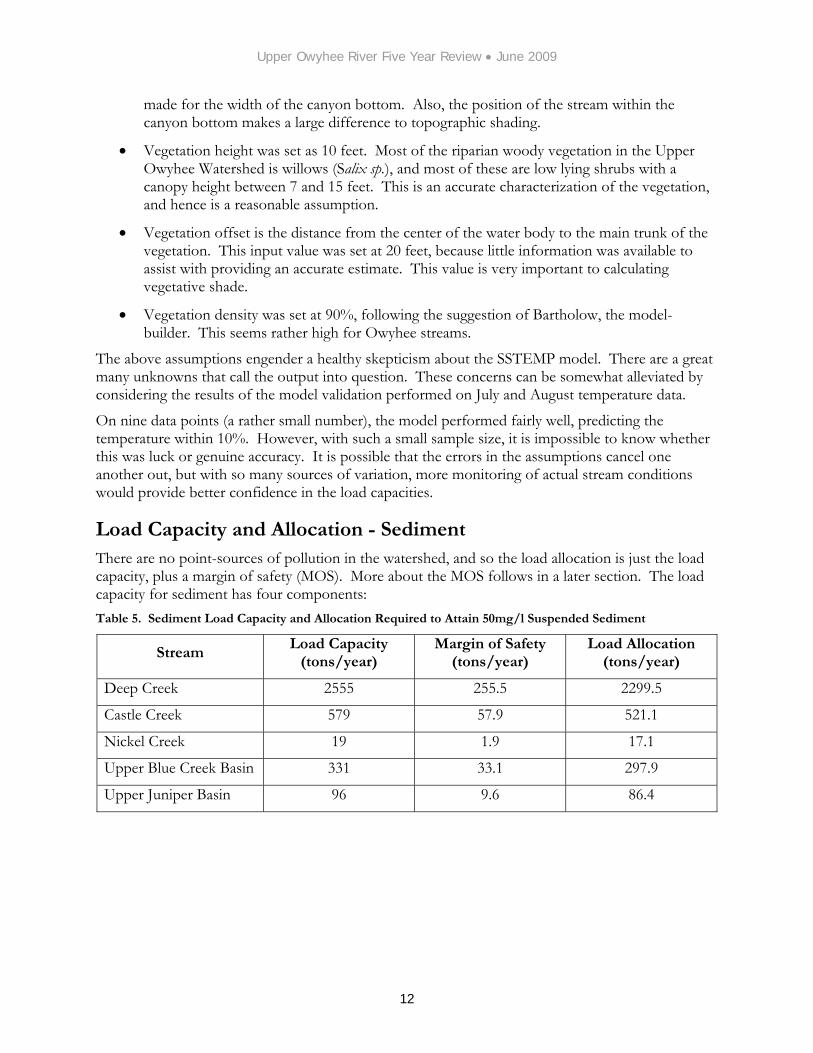
Load Capacity and Allocation - Sediment There are no point-sources of pollution in the watershed, and so the load allocation is just the load capacity, plus a margin of safety (MOS). More about the MOS follows in a later section. The load capacity for sediment has four components: Table 5. Sediment Load Capacity and Allocation Required to Attain 50mg/l Suspended Sediment
Stream Load Capacity
(tons/year) Margin of Safety
(tons/year) Load Allocation
(tons/year)
Deep Creek 2555 255.5 2299.5
Castle Creek 579 57.9 521.1
Nickel Creek 19 1.9 17.1
Upper Blue Creek Basin 331 33.1 297.9
Upper Juniper Basin 96 9.6 86.4
12

Upper Owyhee River Five Year Review • June 2009
Table 6. Sediment Load Capacity and Allocation Required to Attain 80 mg/l Suspended Sediment
Stream Load Capacity
(tons/year) Margin of Safety
(tons/year) Load Allocation
(tons/year)
Deep Creek 4088 408.8 3679.2
Castle Creek 927 92.7 834.3
Nickel Creek 31 3.1 27.9
Upper Blue Creek Basin 530 53 477
Upper Juniper Basin 154 15.4 138.6
Table 7. Percent Fines Load Capacity and Allocation
Stream Load Capacity Margin of Safety Load Allocation
Deep Creek 30% 3% 27%
Castle Creek 30% 3% 27%
Nickel Creek 30% 3% 27%
Percent Fines is a surrogate for sediment loading. Table 8. Reservoir Turbidity Load Capacity and Allocation
Stream Load Capacity
(NTUs) Margin of Safety
(NTUs) Load Allocation
(NTUs)
Blue Creek Reservoir 25 2.5 22.5
Juniper Basin Reservoir 25 2.5 22.5
Load Allocations – Temperature The load allocations and load capacities for temperature are identical (see above), because there are no point sources in the watershed, and the margin of safety is implicit in the conservative study assumptions.
Current data (see later) indicate that the temperature allocations have not been met yet. It is worth noting that 100% shade targets are impossible to reach in a normal, functioning stream.
Margin of Safety - Temperature A margin of safety is included in the load allocations to ensure that water quality goals will be met even though there is uncertainty in the loading capacities. Margins of safety can be implicit, based on conservative study assumptions, or they can be explicit percentages.
The margin of safety for the temperature TMDLs was implicit in the conservative assumptions used in the SSTEMP model. Furthermore, future geomorphological changes are likely to reduce water temperatures:
• Enhanced streambank vegetation promotes bank stability and can raise water table levels. Increased hyporheic flow conditions will reduce stream water temperatures.
13
Upper Owyhee River Five Year Review • June 2009
• Reestablished floodplains will permit greater sinuosity, more pools, and narrower, deeper streams. Most warming is caused by incident solar radiation, and so deeper water stays cooler.
• Lastly, reduced sediments can be expected to increase pool depth and pool frequency. Again, deeper water stays cooler.
Margin of Safety - Sediment The calculations of the sediment load capacities involved many uncertainties, regarding such factors as upland erosion, natural load conditions, and expected erosion rates. In these circumstances, and in the absence of a conservative study design, an explicit margin of safety of 10% was subtracted from the load capacity. This follows the design of the Bruneau River TMDL.
Seasonal Variation The TMDL applies the Salmonid Spawning criteria to the month of June, and the Cold Water Aquatic Life criteria to July and August. If the load allocation were met in these months, it would certainly be met during the rest of the year.
Reserve For temperature, the entire load allocation is assigned to the current primary land use, rangeland.
For sediment, the entire load allocation is assigned to the current primary land use, rangeland.
None of the pollutant loads are allocated to a reserve.
14

Upper Owyhee River Five Year Review • June 2009
Section 3: Beneficial Use Status
Idaho water quality standards require that surface waters of the state be protected for beneficial uses, wherever attainable (IDAPA 58.01.02.050.02). These beneficial uses are interpreted as existing uses, designated uses, and presumed uses. The Water Body Assessment Guidance, second edition (Grafe et al. 2002) gives a detailed description of beneficial use identification for use assessment purposes.
Existing uses under the Clean Water Act are “those uses actually attained in the water body on or after November 28, 1975, whether or not they are included in the water quality standards.” Designated uses are specifically listed for water bodies in Idaho in tables in the Idaho water quality standards (see IDAPA 58.01.02.003.27 and .02.109-.02.160 in addition to citations for existing and presumed uses).
Absent information on existing uses, DEQ presumes that most waters in the state will support cold water aquatic life and either primary or secondary contact recreation (IDAPA 58.01.02.101.01). To protect these so-called “presumed uses,” DEQ applies the numeric cold water aquatic life criteria and primary or secondary contact recreation criteria to undesignated waters.
The following table lists the beneficial uses of the water bodies included in the TMDL. All information was taken from EPA’s Assessment Database in January 2009. Table 9. Beneficial Uses of TMDL Water Bodies
Assessment Unit (all begin ID17050104SW…)
Beneficial Uses
Use Type Use Support
Blue Creek Reservoir 013_0L CWAL Presumed NFS Juniper Basin Reservoir 005L_0L CWAL Presumed NFS Deep Creek – 4th order 026_04 CWAL Presumed NFS
Deep Creek - Nickel Creek to mouth 026_05 CWAL SS SCR
Presumed Presumed Presumed
NFS NFS FS
Pole Creek - 1st and 2nd order 028_02 CWAL Presumed NFS Pole Creek - 3rd order 028_03 CWAL Presumed NFS Pole Creek – 4th order 028_04 CWAL Presumed NFS Castle Creek - 1st and 2nd order 032_02 CWAL Presumed NFS Castle Creek – 3rd order 032_03 CWAL Presumed NFS Red Canyon Creek - 1st and 2nd order 034_02 CWAL Designated NFS
Red Canyon Creek - 3rd order 034_03 CWAL PCR
Designated Designated
NFS FS
Red Canyon Creek - 4th order 034_04 CWAL Designated NFS Nickel Creek - source to mouth 031_02 CWAL Presumed NFS
Nickel, Thomas & Smith Creeks - third order sections 031_03
CWAL SS SCR
Presumed Presumed Presumed
NFS NFS FS
Nickel Creek – 4th order 031_04 None Listed None Listed None Listed Legend: PCR/SCR = Primary/Secondary Contact Recreation. CWAL = Cold Water Aquatic Life. SS = Salmonid Spawning. (N)FS = (Not) Fully Supporting.
Errors in Beneficial Uses There are several errors in the above table. Despite the remoteness of many of the streams, most of them certainly receive some recreational use by hikers, hunters, and anglers. The Secondary Contact Recreation use should apply to all of these streams, and further monitoring will confirm whether the
15
Upper Owyhee River Five Year Review • June 2009
use is met or not. As stated in the TMDL (page 31), Primary Contact Recreation should apply to the two reservoirs, and is fully supported.
The TMDL recommended that all of the above streams be designated for the Salmonid Spawning beneficial use. However, except for Red Canyon and Smith Creeks, there do not appear to be data to support this action. DEQ assessment guidance indicates that when a stream is not fully supporting its cold water aquatic life use, it cannot support salmonid spawning either, and so the following changes will be made:
1. Remove SS as a use for ID17050104SW026_05 (Deep Creek)
2. Add SS as an existing use for ID17050104SW031_03 (Smith Creek) and ID17050104SW034 (Red Canyon Creek). This use is not fully supported.
It is a mystery why Nickel Creek (4th order) does not have any beneficial uses. It should be associated with Cold Water Aquatic Life and Secondary Contact Recreation, which are presumed to exist. The TMDL states that the former use is not fully supported, while the latter is fully supported.
The omission of these items was an oversight. They should have been updated to reflect the TMDL analysis as soon as EPA approved that document.
Beneficial Use Assessment Beneficial uses are protected by a set of criteria, which include narrative criteria for pollutants such as sediment and nutrients and numeric criteria for pollutants such as bacteria, dissolved oxygen, pH, ammonia, temperature, and turbidity (IDAPA 58.01.02.250). Figure 3 provides an outline of the stream assessment process for determining support status of the beneficial uses of cold water aquatic life, salmonid spawning, and contact recreation. It is taken directly from the Water Body Assessment Guidance, Second Addition (Grafe et al. 2002).
16

Upper Owyhee River Five Year Review • June 2009
Figure 3. Steps for Determining Support Status of Beneficial Uses in Wadeable Streams
Appropriateness of Beneficial Uses The TMDL recommended that all stream assessment units have a Salmonid Spawning (SS) use. This is appropriate, because trout have been found in every stream:
Deep Creek: BLM 1999, Allen 1993
Red Canyon Creek: Allen 1993
Nickel Creek: BLM 1982
Castle Creek: BLM 1999
Pole Creek: BLM 1999.
17

Upper Owyhee River Five Year Review • June 2009
The TMDL also recommended that all the streams be protected for Cold Water Aquatic Life (CWAL). This is appropriate, because any stream that has SS as a use would also have a CWAL as a use. CWAL is also the default use that the State believes most streams should attain.
The Reservoirs have CWAL associated as a use, because of a trout-stocking event in Blue Creek Reservoir in 2000. It is not clear how appropriate this use is, especially for Juniper Basin Reservoir. However, once a use is listed, it is very hard to remove.
Primary Contact or Secondary Contact Recreation uses apply to many of the assessment units. Although they are remote, water-based recreation (camping, hiking, wading, and fishing) does occur on most of the streams. The Reservoirs are large enough for primary contact recreation, and the TMDL recommended they be associated with that use.
Further assessments of beneficial uses are not necessary until the North and Middle Fork Owyhee Potential Natural Vegetation TMDL is completed.
Changes to Sub-basin Characteristics The sub-basin has experienced little change since the original TMDL was written.
Wilderness
On March 30, 2009, the Owyhee Public Lands Management Act (“Owyhee Initiative”) was signed into law. Senator Mike Crapo’s website enumerates many of the
“Benefits of the Owyhee Public Lands Management Act:
• Resolution of decades-old public lands conflicts and certainty for various user groups. • Better enforcement and prevention of indiscriminate off-road/off-trail travel by motorized
vehicles. • Designation of over 517,000 acres of wilderness, including 55,000 acres of cow-free
wilderness. • Designation of nearly 315 miles of wild and scenic rivers. • Establishment of a coordinated Science Review to address management issues affecting
public and private rangelands in Owyhee County. • Establishment of a Research and Conservation Center in Owyhee County for collaborative
research projects. • Preservation of outstanding recreational opportunities.”
Source: http://crapo.senate.gov/issues/documents/Summary.4.14.08.doc
In the Upper Owyhee subbasin particularly, the following changes have been made as a result of the Act:
• Upper Deep Creek is released from Wilderness Study Area (WSA) status.
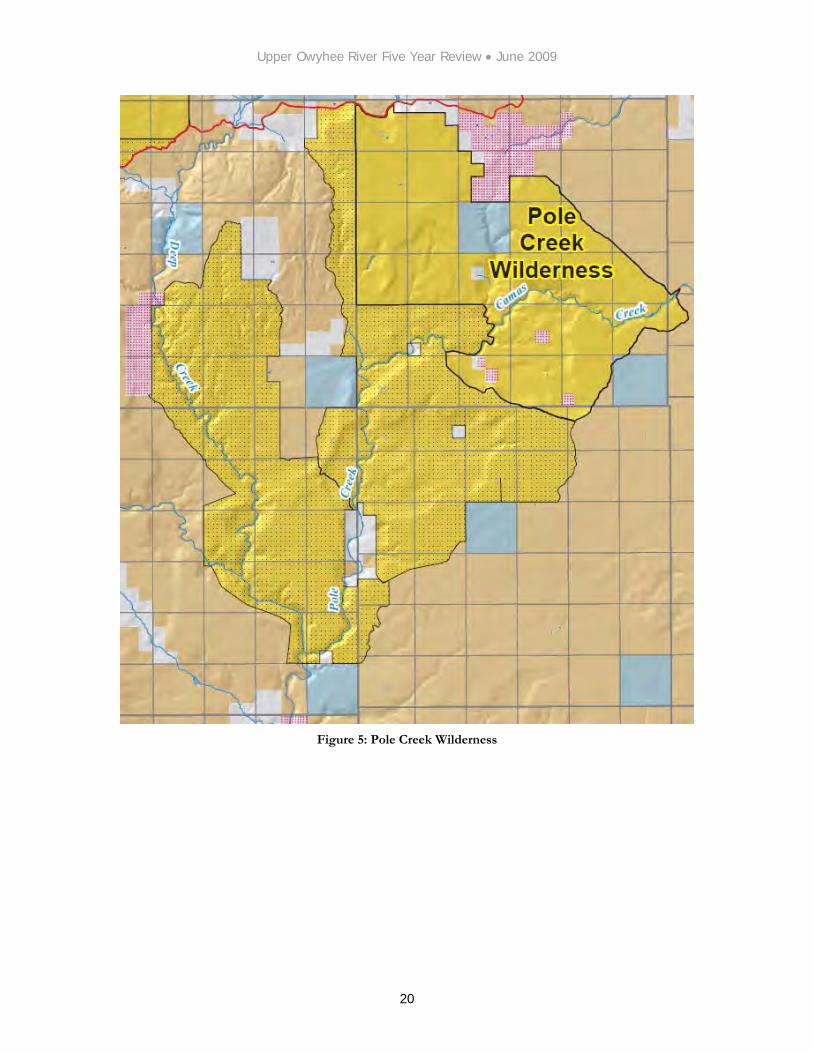
• Most of Pole Creek is released from WSA status. Camas Creek (middle section), and a few miles of Pole Creek (upstream of the confluence with Camas) is now in the new Pole Creek Wilderness.
• Current Creek, from Indian Meadows to Mud Flat Road is now in the new North Fork Owyhee Wilderness.
18

Upper Owyhee River Five Year Review • June 2009
• Lower Deep Creek (from near Beaver Creek to the Owyhee River), and most of Dickshooter Creek are in the new Owyhee River Wilderness.
• Lower Battle Creek (Lower Battle Creek crossing to the Owyhee River) is included in the Owyhee River Wilderness.
• Lower Red Canyon is included in Owyhee River Wilderness. Upper Red Canyon is released from WSA status.
• The only grazing change will be that the isthmus between Deep and Battle Creeks (approximately 36 square miles) will be ungrazed.
• Battle, Deep, Dickshooter, and Red Canyon Creeks, and the Owyhee River, will be generally Wild or Recreational Rivers when they flow through wilderness.
Figure 4: Owyhee River Wilderness
19
Upper Owyhee River Five Year Review • June 2009
Figure 5: Pole Creek Wilderness
20
Upper Owyhee River Five Year Review • June 2009
Synopsis of Current Water Quality Data
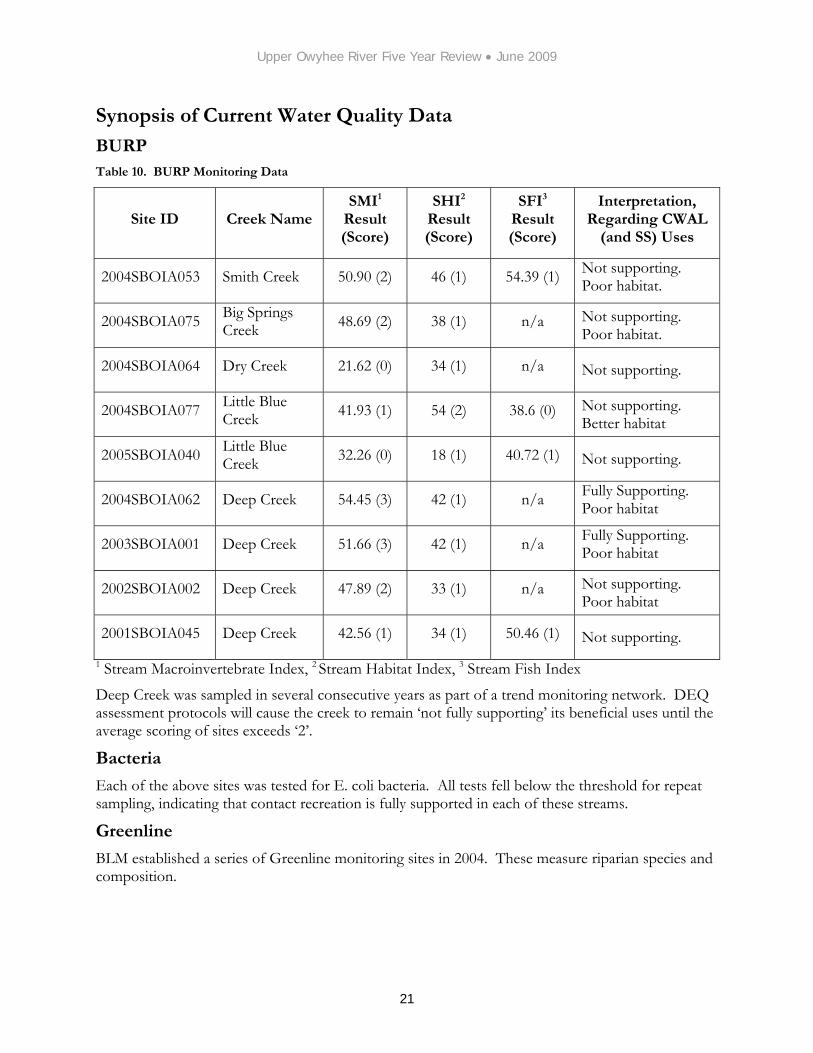
BURP Table 10. BURP Monitoring Data
Site ID Creek Name SMI1
Result (Score)
SHI2 Result (Score)
SFI3 Result (Score)
Interpretation, Regarding CWAL
(and SS) Uses
2004SBOIA053 Smith Creek 50.90 (2) 46 (1) 54.39 (1) Not supporting. Poor habitat.
2004SBOIA075 Big Springs Creek 48.69 (2) 38 (1) n/a Not supporting.
Poor habitat.
2004SBOIA064 Dry Creek 21.62 (0) 34 (1) n/a Not supporting.
2004SBOIA077 Little Blue Creek 41.93 (1) 54 (2) 38.6 (0) Not supporting.
Better habitat
2005SBOIA040 Little Blue Creek 32.26 (0) 18 (1) 40.72 (1) Not supporting.
2004SBOIA062 Deep Creek 54.45 (3) 42 (1) n/a Fully Supporting. Poor habitat
2003SBOIA001 Deep Creek 51.66 (3) 42 (1) n/a Fully Supporting. Poor habitat
2002SBOIA002 Deep Creek 47.89 (2) 33 (1) n/a Not supporting. Poor habitat
2001SBOIA045 Deep Creek 42.56 (1) 34 (1) 50.46 (1) Not supporting. 1 Stream Macroinvertebrate Index, 2 Stream Habitat Index, 3 Stream Fish Index
Deep Creek was sampled in several consecutive years as part of a trend monitoring network. DEQ assessment protocols will cause the creek to remain ‘not fully supporting’ its beneficial uses until the average scoring of sites exceeds ‘2’.
Bacteria
Each of the above sites was tested for E. coli bacteria. All tests fell below the threshold for repeat sampling, indicating that contact recreation is fully supported in each of these streams.
Greenline
BLM established a series of Greenline monitoring sites in 2004. These measure riparian species and composition.
21
Upper Owyhee River Five Year Review • June 2009
Table 11. BLM Greenline Monitoring Data
Stream Location Conclusion
Deep Creek Just below Castle Creek Banks 88% stable, only 46% vegetated. Young vegetation, much bare ground.
Castle Creek 2 miles upstream of Skunk Creek Banks 52% stable, 78% vegetated. Mostly grass riparian.
WF Red Canyon Upstream of EF 73% stable banks, 58% vegetated. 27% bare rock in riparian, 15% rose/grass.
EF Red Canyon Upstream of WF 55% stable, 70% vegetated. Riparian is mostly grass and bare rock. All vegetation younger than 2 years old.
Red Canyon Creek
Just downstream from EF/WF Confluence
95% stable, 96% vegetated. Riparian is mostly forbs and rock. More than half the vegetation is older than 10 years.
Please see Figure 2 for a map of these areas.
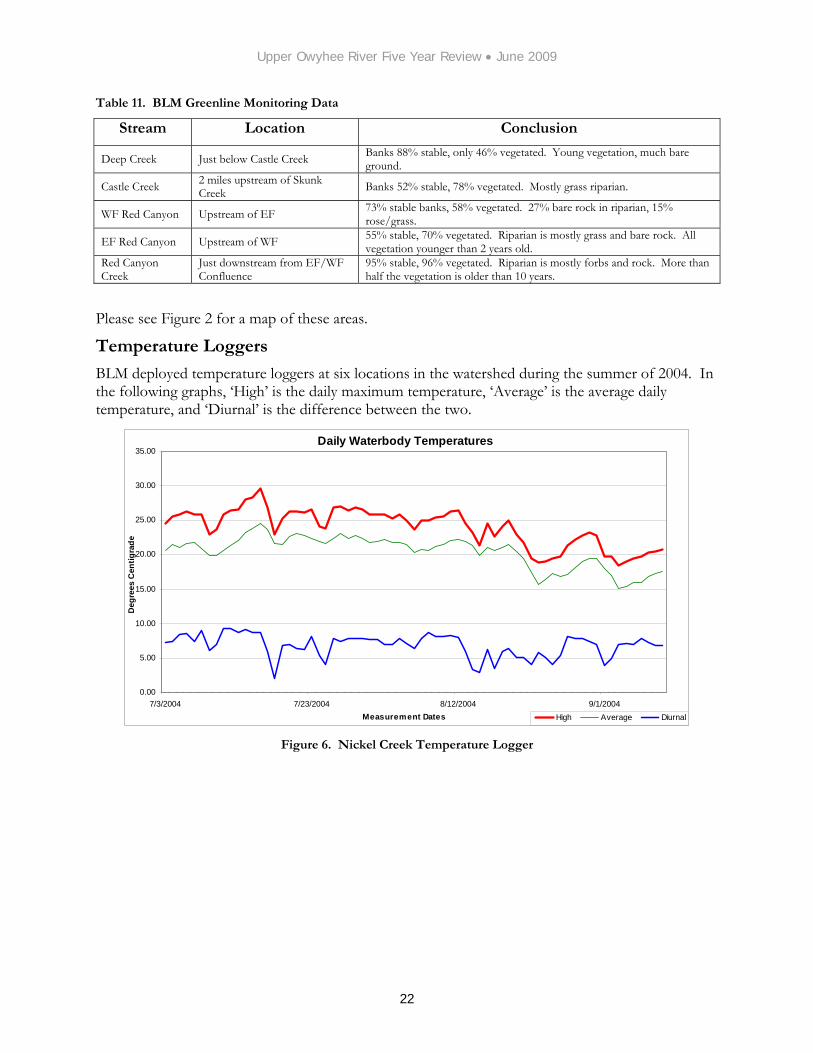
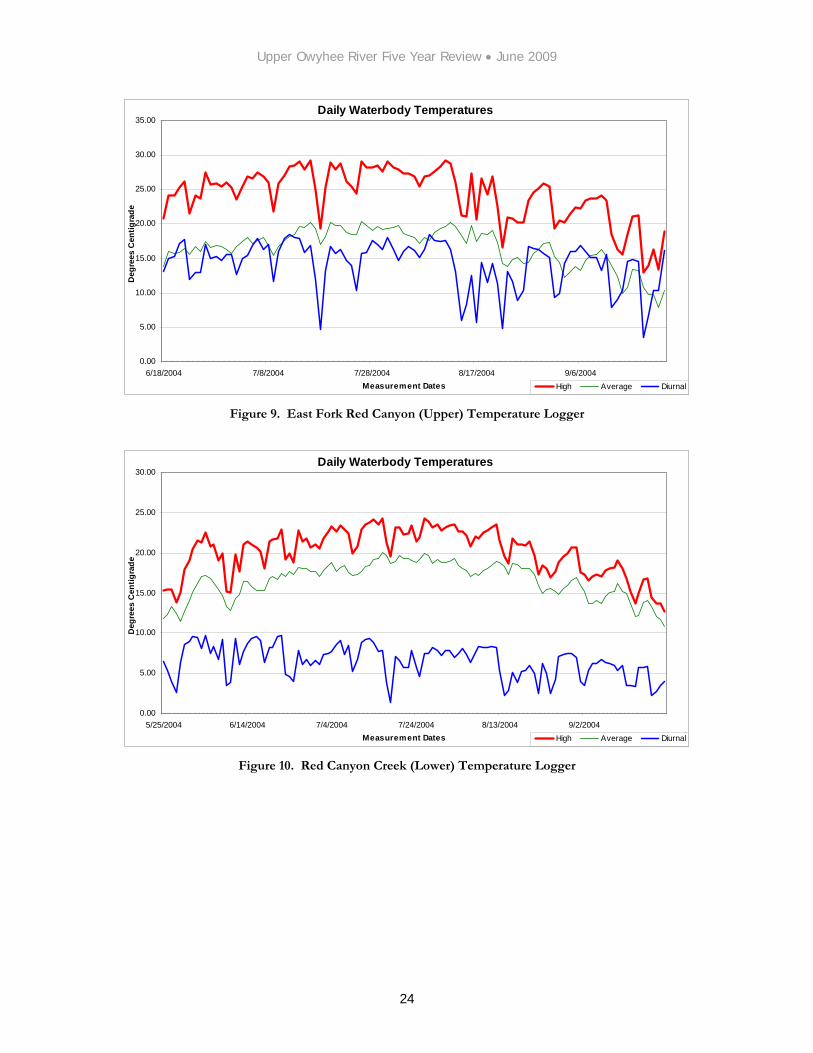
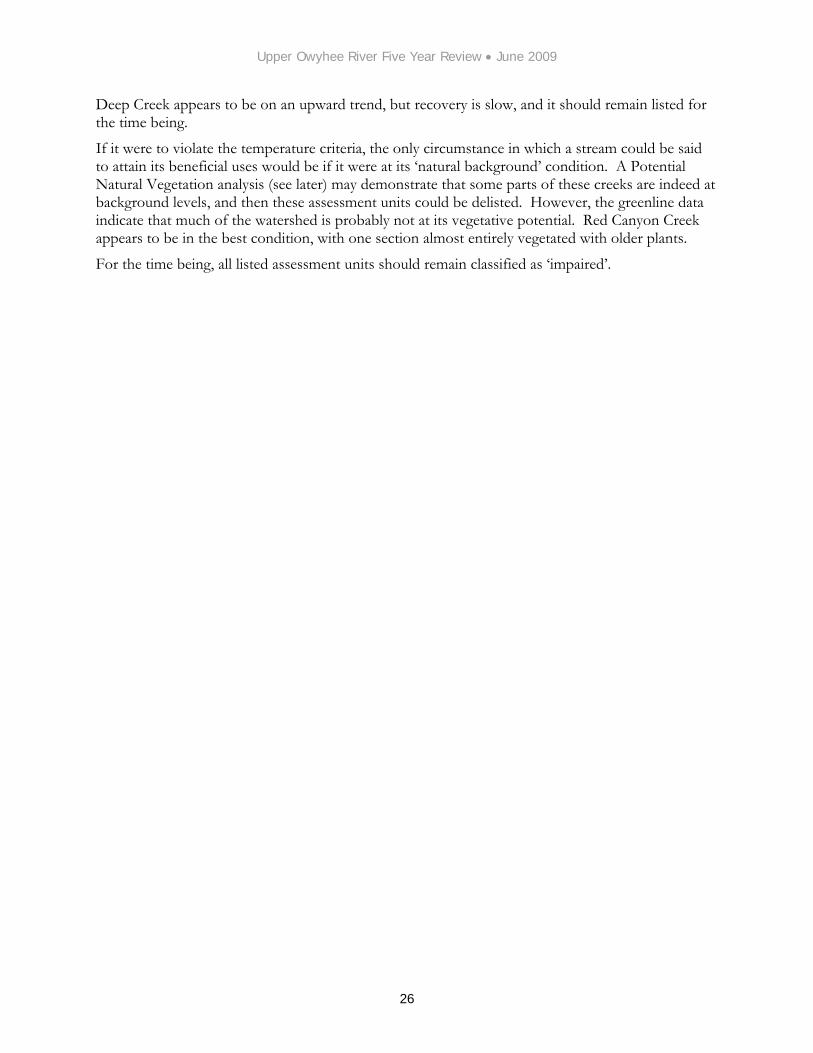
Temperature Loggers
BLM deployed temperature loggers at six locations in the watershed during the summer of 2004. In the following graphs, ‘High’ is the daily maximum temperature, ‘Average’ is the average daily temperature, and ‘Diurnal’ is the difference between the two.
Daily Waterbody Temperatures
0.00
5.00
10.00
15.00
20.00
25.00
30.00
35.00
7/3/2004 7/23/2004 8/12/2004 9/1/2004Measurement Dates
Deg
rees
Cen
tigra
de
High Average Diurnal Figure 6. Nickel Creek Temperature Logger
22

Upper Owyhee River Five Year Review • June 2009
Daily Waterbody Temperatures
0.00
5.00
10.00
15.00
20.00
25.00
30.00
7/2/2004 7/22/2004 8/11/2004Measurement Dates
Deg
rees
Cen
tigra
de
High Average Diurnal Figure 7. Pole Creek Temperature Logger
Daily Waterbody Temperatures
0.00
5.00
10.00
15.00
20.00
25.00
30.00
35.00
6/18/2004 7/8/2004 7/28/2004 8/17/2004 9/6/2004Measurement Dates
Deg
rees
Cen
tigra
de
High Average Diurnal Figure 8. East Fork Red Canyon (Lower) Temperature Logger
23
Upper Owyhee River Five Year Review • June 2009
Daily Waterbody Temperatures
0.00
5.00
10.00
15.00
20.00
25.00
30.00
35.00
6/18/2004 7/8/2004 7/28/2004 8/17/2004 9/6/2004Measurement Dates
Deg
rees
Cen
tigra
de
High Average Diurnal Figure 9. East Fork Red Canyon (Upper) Temperature Logger
Daily Waterbody Temperatures
0.00
5.00
10.00
15.00
20.00
25.00
30.00
5/25/2004 6/14/2004 7/4/2004 7/24/2004 8/13/2004 9/2/2004Measurement Dates
Deg
rees
Cen
tigra
de
High Average Diurnal Figure 10. Red Canyon Creek (Lower) Temperature Logger
24

Upper Owyhee River Five Year Review • June 2009
Daily Waterbody Temperatures
0.00
5.00
10.00
15.00
20.00
25.00
30.00
6/17/2004 7/7/2004 7/27/2004Measurement Dates
Deg
rees
Cen
tigra
de
High Average Diurnal Figure 11. West Fork Red Canyon Creek Temperature Logger
Physical Data
Four measurements of physical water quality parameters were taken with a Quanta unit during the summer 2004 greenline monitoring. Table 12. Physical Water Quality Parameters
Creek Date Temp. (C)D.O.
(mg/l) pH Cond. (μS)
WF Red Canyon Creek 6/30/04 13.12 9.49 7.85 50
EF Red Canyon Creek 6/30/04 16.9 9.31 8.32 50
Deep Creek 7/15/04 23.2 8.55 8.7 132
WF Red Canyon Creek 8/4/04 12.0 9.9 8.4 50
These results are only single measurements, and are not very informative. However, the cool temperature of WF Red Canyon Creek is notable.
There are no current sediment data available.
Summary
All streams still exceed the temperature criteria. Aside from a heat spike in September (perhaps caused by the stream running dry) East Fork of Red Canyon Creek is quite close to meeting the Cold Water criterion. The Quanta measurements indicate that West Fork Red Canyon Creek may have fairly cool water. Red Canyon Creek has Salmonid Spawning as an existing use, but even this relatively cool stream does not meet the associated temperature criterion of 9°C.
BURP data indicate that Little Blue, Big Springs, and Dry Creeks should be listed for not supporting their beneficial uses. Smith Creek, as part of the headwaters of Nickel Creek, should remain listed.
25
Upper Owyhee River Five Year Review • June 2009
Deep Creek appears to be on an upward trend, but recovery is slow, and it should remain listed for the time being.
If it were to violate the temperature criteria, the only circumstance in which a stream could be said to attain its beneficial uses would be if it were at its ‘natural background’ condition. A Potential
t ta
Natural Vegetation analysis (see later) may demonstrate that some parts of these creeks are indeed abackground levels, and then these assessment units could be delisted. However, the greenline daindicate that much of the watershed is probably not at its vegetative potential. Red Canyon Creek appears to be in the best condition, with one section almost entirely vegetated with older plants.
For the time being, all listed assessment units should remain classified as ‘impaired’.
26
Upper Owyhee River Five Year Review • June 2009
Section 4: Review of Implementation Plan and Activities
The implementation plan was drafted by the land management agencies, and mainly written by the Idaho Association of Soil Conservation Districts (IASCD).
The following activities were supposed to happen:
• IASCD: Develop conservation plans with private agricultural landowners.
• IASCD: Assist private agricultural landowners to implement conservation plan components.
• IASCD: Monitor conservation implementation progress and evaluate effect on vegetation and channel shape.
• Idaho Soil Conservation Commission (ISCC): Install “reference reach” transects to define potential and capability of shading of stream channels.
• BLM: Conduct greenline monitoring to evaluate community composition
• BLM: Collect bacteria data
• BLM: Complete allotment assessments for grazing
• BLM: Prepare water quality restoration plans for listed streams
• BLM: Issue new grazing permits that include BMPs
• BLM: Monitor BLM effectiveness
• IDL: Revise grazing management plans for listed streams
• IDL: Monitor and review grazing operations
Activities So Far So far, a riparian assessment of the Upper Owyhee Watershed was conducted in the summer of 2003 by the ISCC and the IASCD. The assessment included an inventory of the privately owned 303(d) listed stream segments as well as unlisted stream segments. The surveys showed that upland areas above streams have minimal impact on riparian function and stream conditions. This was a poorly understood variable in the design of the sediment TMDL.
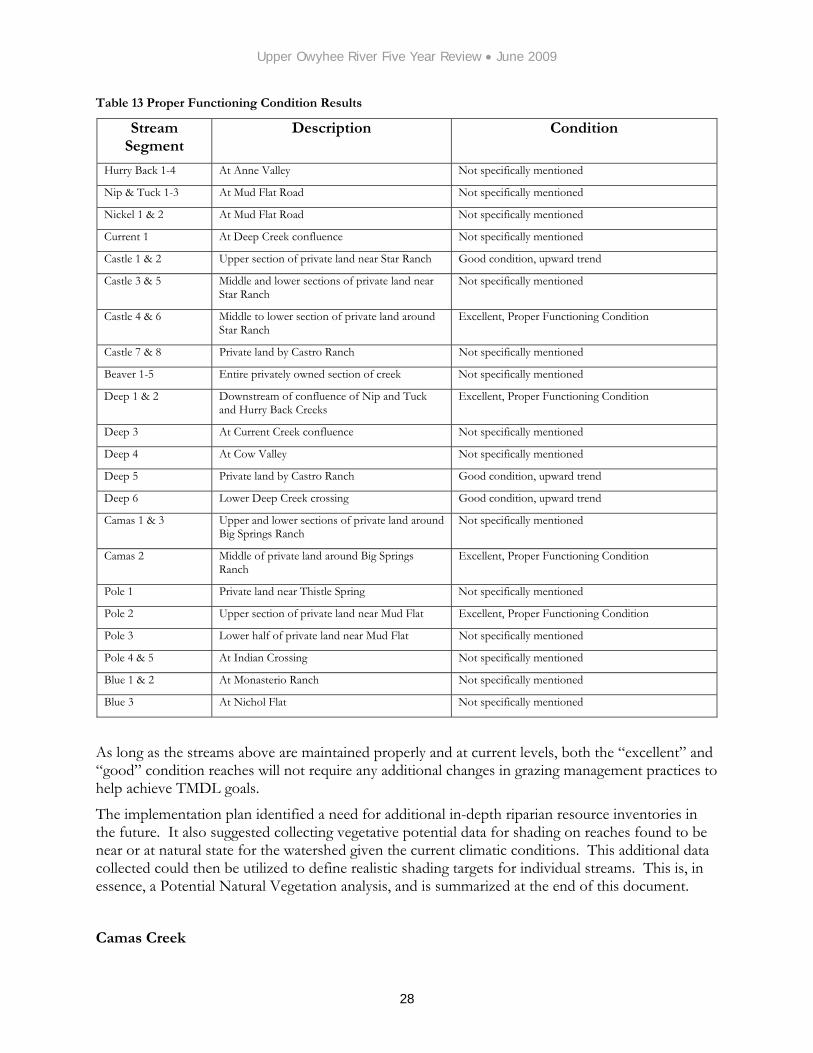
During this assessment, riparian Proper Functioning Condition (PFC) monitoring, along with other data collection, was completed on private lands:
27
Upper Owyhee River Five Year Review • June 2009
Table 13 Proper Functioning Condition Results
Stream Segment
Description Condition
Hurry Back 1-4 At Anne Valley Not specifically mentioned
Nip & Tuck 1-3 At Mud Flat Road Not specifically mentioned
Nickel 1 & 2 At Mud Flat Road Not specifically mentioned
Current 1 At Deep Creek confluence Not specifically mentioned
Castle 1 & 2 Upper section of private land near Star Ranch Good condition, upward trend
Castle 3 & 5 Middle and lower sections of private land near Star Ranch
Not specifically mentioned
Castle 4 & 6 Middle to lower section of private land around Star Ranch
Excellent, Proper Functioning Condition
Castle 7 & 8 Private land by Castro Ranch Not specifically mentioned
Beaver 1-5 Entire privately owned section of creek Not specifically mentioned
Deep 1 & 2 Downstream of confluence of Nip and Tuck and Hurry Back Creeks
Excellent, Proper Functioning Condition
Deep 3 At Current Creek confluence Not specifically mentioned
Deep 4 At Cow Valley Not specifically mentioned
Deep 5 Private land by Castro Ranch Good condition, upward trend
Deep 6 Lower Deep Creek crossing Good condition, upward trend
Camas 1 & 3 Upper and lower sections of private land around Big Springs Ranch
Not specifically mentioned
Camas 2 Middle of private land around Big Springs Ranch
Excellent, Proper Functioning Condition
Pole 1 Private land near Thistle Spring Not specifically mentioned
Pole 2 Upper section of private land near Mud Flat Excellent, Proper Functioning Condition
Pole 3 Lower half of private land near Mud Flat Not specifically mentioned
Pole 4 & 5 At Indian Crossing Not specifically mentioned
Blue 1 & 2 At Monasterio Ranch Not specifically mentioned
Blue 3 At Nichol Flat Not specifically mentioned
As long as the streams above are maintained properly and at current levels, both the “excellent” and “good” condition reaches will not require any additional changes in grazing management practices to help achieve TMDL goals.
The implementation plan identified a need for additional in-depth riparian resource inventories in the future. It also suggested collecting vegetative potential data for shading on reaches found to be near or at natural state for the watershed given the current climatic conditions. This additional data collected could then be utilized to define realistic shading targets for individual streams. This is, in essence, a Potential Natural Vegetation analysis, and is summarized at the end of this document.
Camas Creek
28

Upper Owyhee River Five Year Review • June 2009
Some best management practices (BMPs) were installed on Camas Creek:
12 off-channel retention ponds were built to restore the wetland area along the creek.
6,248 feet of riparian fencing were installed.
These changes should help decrease the water temperatures and sediment levels in the creek.
Responsible Parties Table 14. Parties Responsible for TMDL Implementation
Designated Management Agency Resource Responsibility Type of Involvement (regulatory, funding, assistance etc.)
BLM Federal Lands Regulatory IASCD/ISCC Private Lands Assistance DEQ Streams Funding
29
Upper Owyhee River Five Year Review • June 2009
Section 5: Summary of Five Year Review
Data were requested from the BLM, IDFG, and IASCD in December 2008. BLM and IDFG data were received in January 2009. WAG input was requested in January 2009, and data will be incorporated as they become available. Relevant data might include temperature and riparian ‘proper functioning condition’ information, as well as updates on implementation activities.
Changes in Sub-basin The main change to the subbasin has been the passage of the Owyhee Initiative. It is too early to tell what the effect on water quality will be. At a minimum, it is reasonable to assume that water quality will improve in the non-grazed areas of the wilderness.
TMDL Analysis The assumptions used in the sediment TMDL are generally valid, and the original load allocations should continue to be applied. However, the temperature TMDL analysis is not appropriate to this watershed. Originally, the targets for full support of beneficial uses were the temperature criteria in the water quality standards. These criteria are not appropriate for the sparsely flowing desert streams of the Upper Owyhee River watershed. A pristine stream in this area would probably still violate water quality criteria at certain times of the year.
The targets chosen were the only ones available at the time, but DEQ has developed a better approach, called ‘Potential Natural Vegetation’, which compares a stream to its own potential, instead of an inflexible criterion.
The temperature load allocations are not appropriate, because they are based upon the attempt of a computer model to meet an impossible target. For example, virtually all of Deep Creek requires 100% shading, and this target was chosen only because it was the maximum output of the model. It is not clear whether, even with full shade, the water temperatures would meet the criteria.
Review of Beneficial Uses
• The beneficial uses in this watershed are generally appropriate. Cold water aquatic life, salmonid spawning, and contact recreation uses should apply to all stream assessment units. The reservoirs appropriately have contact recreation uses, but cold water aquatic life may be less suitable.
• Some additions to the beneficial uses are recommended, mostly involving adding contact recreation and salmonid spawning uses to many of the assessment units. These additions were recommended in the TMDL, and were omitted by mistake.
• Beneficial uses are generally not met, as evidenced by the BURP scores. Deep Creek appears to be improving, and in a few years, will probably functionally meet its beneficial uses.
30
Upper Owyhee River Five Year Review • June 2009
Water Quality Criteria
• The relevant water quality criteria have not changed since the TMDL was written. Although the temperature criteria are problematic when applied to this watershed, they are statewide, and as such, unlikely to be altered.
• Red Canyon Creek does seem to show a slight improving trend in temperature.
Watershed Advisory Group Consultation Members of the original WAG were contacted (where possible) and offered an opportunity to continue their service. DEQ is grateful for the assistance of the following individuals who agreed to serve on the WAG:
Mr. John Crum, Shoshone-Paiute Tribe
Mr. Peter Jackson Jr., Rancher/Landowner
Mr. Rich Jackson, BLM
Mr. Duane LaFayette, Idaho Association of Soil Conservation Districts
Mr. Larry Meredith, Recreational Industry
Ms. Brenda Richards, Owyhee County
Mr. Dick Rogers, Environmental Representative
In addition to reviewing a draft of this document, several members of the WAG met in Murphy in April.
Recommendations for Further Action Monitoring should continue on Deep Creek at least every five years to document the improvement of that assessment unit.
The reservoirs should be monitored for turbidity to see if they have improved since the TMDL was written. A suspended sediment monitoring regime should be implemented for the sediment-impaired streams.
Potential Natural Vegetation – A New Method
Since this TMDL was written, DEQ has developed a new way of analyzing thermal pollution, which relies on the ‘Natural Background’ clause of the Water Quality Standards:
‘09. Natural Background Conditions as Criteria. When natural background conditions exceed any applicable water quality criteria set forth in Sections 210, 250, 251, 252, or 253, the applicable water quality criteria shall not apply; instead, there shall be no lowering of water quality from natural background conditions…’
The method, known as ‘potential natural vegetation’ is applicable to watersheds where the main excess thermal load is caused by removal of riparian shading, as is the case in the Upper Owyhee River. It uses ‘shading’ as a surrogate for temperature, and the TMDL target would be the level of shading expected in a reference stream with similar vegetative potential.
31

Upper Owyhee River Five Year Review • June 2009
PNV has several stages:
1) The existing shading of the stream is estimated using aerial photography. a. These estimates are ground-checked using a solar pathfinder. b. These shade measurements are converted into ‘incident solar radiation’,
measured in kWh/m2/day. 2) The target shade (the reference, or ‘natural background’ condition) is derived from
‘effective shade curves’ developed for similar vegetation types in Idaho. a. The effective shade curves are developed using knowledge of local plants,
riparian conditions, and similar systems. b. The incident solar radiation for this reference condition is calculated.
3) The existing and target conditions are compared. a. Where the existing shade is less than the target shade, it means that the excess
incident solar radiation is heating the water above natural background levels. b. The difference between the existing and target shade indicates the increase in
shading needed to meet the target. c. Implementation efforts can be directed to areas with the biggest difference
between existing and target shade. d. A new assessment of riparian coverage can be made every time a new aerial
photograph is taken.
It is recommended that the temperature TMDLs be re-written using the PNV approach. This will more closely reflect the local natural conditions, and help pinpoint implementation activities, thereby ensuring the greatest improvement in water quality.
The existing, criteria-based TMDL would remain in place until EPA approves any new version. A PNV temperature TMDL could be completed by December 2009.
32

Upper Owyhee River Five Year Review • June 2009
References Cited
Allen, DB, BJ Flatter, K Fite 1993. Redband Trout Population and Habitat Inventory in Owyhee County, Idaho. BLM Challenge Cost Share Project ID013-435001-25-9Z. Idaho Department of Fish and Game, Boise, ID.
Bartholow, J 2002. Stream Segment Temperature Model (SSTEMP)
Bash JS, CH Berman, SM Bolton 2001. Final Research Report Research Project T1803, Task 42 Effects of Turbidity and Suspended Solids on Salmonids
Crapo, Mike, US Senator. Webpage accessed April 2009 http://crapo.senate.gov/issues/documents/Summary.4.14.08.doc
Clean Water Act (Federal water pollution control act), 33 U.S.C. § 1251-1387. 1972.
Grafe, CS, CA Mebane, MJ McIntyre, DA Essig, DH Brandt, and DT Mosier. 2002. The Idaho Department of Environmental Quality water body assessment guidance, second edition-final. Department of Environmental Quality. Boise, ID.
Hortness, JE, and Berenbrock C, 2001, Estimating monthly and annual streamflow statistics at ungaged sites in Idaho: U.S. Geological Survey Water-Resources Investigations Report 01-4093
Idaho Code § 39.3611. Development and implementation of total maximum daily load or equivalent processes.
Idaho DEQ, 2000. Bruneau River Sub Basin Assessment and Total Maximum Daily Load.
IDAPA 58.01.02. Idaho water quality standards and wastewater treatment requirements.
Ingham, MJ, 2000. Upper Owyhee Watershed Monitoring Plan. Idaho DEQ, Boise ID.
Ingham, MJ, 2002. Upper Owyhee Watershed Sub-Basin Assessment and Total Maximum Daily Load. Idaho DEQ, Boise ID
Lloyd DS 1987. Turbidity as a Water Quality Standard for Salmonid Habitats in Alaska. North American Journal of Fisheries Management
Relyea CD, GW Minshall, RJ Danehy, 2000. Stream insects as bioindicators of fine sediment. Proceeding Watershed, 2000
Schill, D, E Mamer, S Elle 2001. Idaho Fish and Game Report Number 02-05; Redband Trout Beneficial Use Assessment, Annual Progress Report for the 2001 Cooperative Study Agreement.
Sigler, JW, TC Bjorn, FH Forest, 1984. Effects of chronic turbidity on density and growth of steelhead and coho salmon. Transcription of the American Fisheries Society, Vol. 113:142-150
Upper Owyhee Watershed TMDL Implementation Plan for Agriculture. Idaho Soil Conservation Commission and Idaho Association of Soil Conservation Districts, October 2004
Water Quality Act of 1987, Public Law 100-4. 1987.
33
Related Documents