Upper Mississippi River Water Quality: The States’ Approaches to Clean Water Act Monitoring, Assessment, and Impairment Decisions January 2004 Upper Mississippi River Basin Association

Welcome message from author
This document is posted to help you gain knowledge. Please leave a comment to let me know what you think about it! Share it to your friends and learn new things together.
Transcript
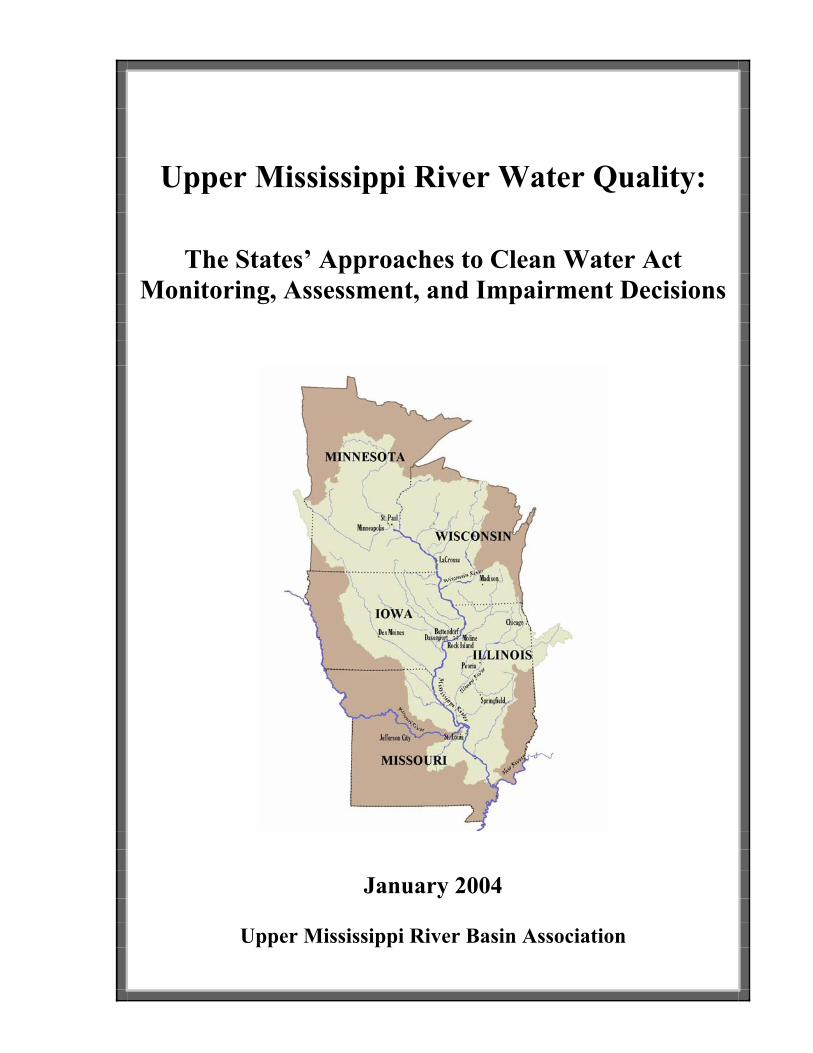
Upper Mississippi River Water Quality:
The States’ Approaches to Clean Water Act
Monitoring, Assessment, and Impairment Decisions
January 2004
Upper Mississippi River Basin Association

Upper Mississippi River Basin Association 415 Hamm Building, 408 St. Peter Street St. Paul, Minnesota 55102 651-224-2880 (phone) 651-223-5815 (fax) www.umrba.org
The Upper Mississippi River Basin Association (UMRBA) is a regional interstate organization formed in 1981 by the Governors of Illinois, Iowa, Minnesota, Missouri, and Wisconsin to help coordinate the states’ river-related programs.
Upper Mississippi River Water Quality:
The States’ Approaches to Clean Water Act Monitoring, Assessment, and Impairment Decisions
January 2004
Prepared by the Staff and Water Quality Task Force of the Upper Mississippi River Basin Association under
Federal Clean Water Act §104(b)(3) Grant CP 97570701.
Funding provided through the U.S. Environmental Protection Agency, Region 5.
This report is available on the Internet at www.umrba.org/wq/wq2002rpt.pdf

Upper Mississippi River Basin Association Water Quality Task Force Members and Participants
The following list includes those state and federal agency participants and UMRBA staff who were involved with the Water Quality Task Force from 2001 to 2003 during development of this report. Illinois Environmental Protection Agency
Gary Eicken Gregg Good Matt Short Bruce Yurdin
Iowa Department of Natural Resources
Marian Maas John Olson Jack Riessen Mary Skopec
Minnesota Pollution Control Agency
Marvin Hora Louise Hotka Sylvia McCollor Norman Senjem
Missouri Department of Natural Resources
Stacia Bax Sharon Clifford Joe Dom John Ford Becky Shannon Scott Totten Chris Zell
Wisconsin Department of Natural Resources
Bruce Baker James Baumann Lisa Helmuth John Sullivan Linda Talbot
U.S. Environmental Protection Agency, Region 5
Bill Franz Tim Henry Pete Redmon Dave Werbach
U.S. Environmental Protection Agency, Region 7
Larry Shepard UMRBA Staff
Marjorie Daniels Megan Finnessy Barb Naramore Keri Simonson Jon Steadland Holly Stoerker

Table of Contents
Chapter 1. Introduction ..................................................................................................................... 1 Chapter 2. Monitoring and Data....................................................................................................... 3
Federal Water Quality Monitoring Programs.............................................................................. 3 State Water Quality Monitoring Programs.................................................................................. 5 Summary ..................................................................................................................................... 11
Chapter 3. Water Quality Standards and Assessment Reaches..................................................... 15 Chapter 4. 305(b) Water Quality Assessments ................................................................................ 21
Water Quality Standards ............................................................................................................. 21 State 305(b) Assessment Procedures........................................................................................... 24 UMR Water Quality Assessments............................................................................................... 28 Summary and Conclusions .......................................................................................................... 33
Chapter 5. 303(d) Impaired Waters Lists ........................................................................................ 41
Illinois.......................................................................................................................................... 42 Iowa............................................................................................................................................. 44 Minnesota .................................................................................................................................... 45 Missouri....................................................................................................................................... 46 Wisconsin .................................................................................................................................... 47 Summary ..................................................................................................................................... 47
Chapter 6. Conclusions ...................................................................................................................... 59
Monitoring Data .......................................................................................................................... 59 Data Sharing ................................................................................................................................ 60 Numeric Criteria.......................................................................................................................... 61 Inconsistencies Among the States ............................................................................................... 62 Significance of Differences ......................................................................................................... 62 Potential For Enhanced Consistency ........................................................................................... 63 Limitations................................................................................................................................... 64 Total Maximum Daily Loads (TMDLs)...................................................................................... 64
References ............................................................................................................................................ 67 Related Web Sites ................................................................................................................................ 73
List of Maps Map 1. Water Quality Standards and Assessment Reaches ................................................................. 16 Map 2. Major Designated Uses ............................................................................................................ 22 Map 3. Aquatic Life Use Support Levels............................................................................................. 26 Map 4. Impaired Waters on 303(d) Lists.............................................................................................. 48
i

List of Figures Figure 1. Illinois Intensive Basin Survey Units ................................................................................ 7
Figure 2. Major Basins in Minnesota ................................................................................................ 9
List of Tables Table 1. Illinois Ambient Water Quality Monitoring Network: Great River Boundary
Monitoring on the UMR .................................................................................................... 6
Table 2. Minnesota Milestone Sites: Interstate Portions of the UMR ............................................ 9
Table 3. States’ Use of Outside Data Sources for UMR 2002 Assessments and Listings............... 13
Table 4. Upper Mississippi River Assessment and Standards Reaches........................................... 15
Table 5. Minimum Set of Interstate Assessment Reaches for the UMR.......................................... 20
Table 6. Major Designated Uses on the UMR ................................................................................. 24
Table 7. Aquatic Life Use Support on the UMR ............................................................................. 25
Table 8. Use Support on the UMR in Illinois .................................................................................. 29
Table 9. Use Support on the UMR in Iowa...................................................................................... 30
Table 10. Use Support on the Interstate UMR in Minnesota ............................................................. 31
Table 11. Use Support on the UMR in Missouri ............................................................................... 32
Table 12. Use Support on the UMR in Wisconsin............................................................................. 33
Table 13. Aquatic Life: Criteria for Determining Degree of Use Support ....................................... 36
Table 14. Public Water Supply/Drinking Water: Criteria for Determining Degree of Use Support............................................................................................................................... 37
Table 15. Primary Contact Recreation/Whole Body Contact Recreation/Swimming: Criteria for Determining Degree of Use Support.................................................................................. 38
Table 16. Fish Consumption: Criteria for Determining Degree of Use Support .............................. 39
Table 17. Irrigation and Livestock & Wildlife Watering: Criteria for Determining Degree of Use Support........................................................................................................................ 39
Table 18. Industrial: Criteria for Determining Degree of Use Support ............................................ 40
Table 19. Secondary Contact/Boating: Criteria for Determining Degree of Use Support............................................................................................................................... 40
Table 20. General Use: Criteria for Determining Degree of Use Support ........................................ 40
Table 21. Upper Mississippi River 303(d) Impaired Listings Summary ........................................... 42
Table 22. Upper Mississippi River State Fish Consumption Advisories (FCA) ............................... 50
Table 23. Upper Mississippi River 303(d) List Priority Ranking...................................................... 51
Table 24. Water Quality Standards Applicable to the UMR ............................................................. 54
Table 25. Narrative Water Quality Standards .................................................................................... 56
ii

Chapter 1
Introduction
As part of the third largest river system in the world, the Upper Mississippi River (UMR) is defined as that portion of the Mississippi River above the mouth of the Ohio River. This report is concerned with the interstate portion of the UMR — i.e., the river between the St. Croix and Ohio Rivers.1 The interstate UMR forms the boundary between the five states of Illinois, Iowa, Minnesota, Missouri, and Wisconsin, and is the only waterbody recognized by Congress as both “a nationally significant ecosystem and a nationally significant commercial navigation system.”2 A vital drinking water source, the UMR is also valued for its commercial navigation system, biological abundance and diversity, support for various industrial activities, recreational opportunities, and tourism activity. Water quality is critical to many of the river’s diverse uses and is influenced by a range of both point and nonpoint pollution sources throughout the basin. These sources include natural processes, industrial and municipal point sources, and nonpoint sources from rural and urban landscapes. A system of locks and dams on the river between Minneapolis and St. Louis creates a series of impoundments, significantly altering the way in which the river processes and transports pollutants. Land use patterns in the surrounding watershed are significant factors in determining the delivery of pollutants to the river. Adding to the water quality management challenges inherent in the Upper Mississippi River’s size and diversity is the river’s status as a boundary among its five states. For both inter- and intrastate waters in the United States, the
Clean Water Act (CWA) is the cornerstone of water quality protection. According to Section 101 of the CWA, the statute’s objective is to restore and maintain the chemical, physical, and biological integrity of our nation’s surface waters. Since 1972, the CWA has been the umbrella for establishing water quality standards, controlling sources of water pollution, tracking water quality changes over time, and identifying problem areas in need of additional protection.
1 Even where specific reference is not made to the
interstate UMR, the reader may assume that the portion of the river entirely within Minnesota is not being discussed. Also of note, the state of Missouri borders both the Upper Mississippi and the Lower Mississippi River. However, this report considers only that portion of the Mississippi River in Missouri that is upstream of the Ohio River.
2 Section 1103 of the Water Resources Development Act of 1986, P.L. 99-662.
Under the CWA, the U.S. Environmental Protection Agency (EPA) and the states are jointly responsible for protecting, maintaining, and restoring water quality. In general, states designate specific uses for their waters, establish standards designed to protect those uses, control various pollution sources through both regulatory and non-regulatory measures, and monitor and assess water quality on an ongoing basis. States must submit biennial water quality assessment reports under Section 305(b) of the CWA and lists of impaired waters under Section 303(d), and then take appropriate actions to protect and restore those impaired waters. EPA has a largely oversight role, establishing minimum national standards and other elements of the framework within which the states implement their Clean Water Act authorities. This includes review and approval authority over the states’ 303(d) impaired waters lists. Interstate waters pose a particular challenge for EPA and the states. This is inherent in a system that is designed to establish a national framework, while providing the states with the flexibility to implement that framework in a manner that meets their individual needs and circumstances. Water, of course, does not recognize political boundaries; and the decisions of one state may have implications for another. In addition, different approaches among states on shared waterbodies can give rise to public concern and confusion. To address this, the CWA includes provisions for interstate consultation and coordination regarding specific actions in several
1

instances. Moreover, Section 103 of the CWA offers the following general guidance, directing EPA to:
encourage cooperative activities by the State for the prevention, reduction, and elimination of pollution, encourage the enactment of improved and, so far as practicable, uniform State laws relating to the prevention, reduction, and elimination of pollution; and encourage compacts between States for the prevention and control of pollution.
Recognizing the importance of the Upper Mississippi River as a major regional and national resource, the five UMR states joined with U.S. EPA Regions 5 and 7 in launching an Upper Mississippi River Water Quality Coordination Project, beginning in October 2001. The Upper Mississippi River Basin Association (UMRBA), an organization formed by the five states to coordinate a wide range of river-related programs and policies, took the lead in implementing this two-year project, working through a standing UMRBA Water Quality Task Force. Task Force members include representatives of the relevant water quality agencies — i.e., the Illinois Environmental Protection Agency, Iowa Department of Natural Resources, Minnesota Pollution Control Agency, Missouri Department of Natural Resources, Wisconsin Department of Natural Resources, and U.S. Environmental Protection Agency Regions 5 and 7. Historically, water quality coordination among the UMR states has been largely limited to data sharing and has not extended to consultation on 305(b) assessments or 303(d) impaired waters lists.3 The UMRBA coordination project was designed to identify and explain the approaches each state takes to protecting water quality on the UMR, from designating uses for the river to monitoring and preparation of 305(b) assessments
and 303(d) impaired waters lists. Particular attention was paid to analyzing differences among the states, with the goal of explaining the bases of those differences, identifying potential opportunities to enhance consistency, and establishing a foundation for future coordination efforts. As this report explains, many of the inconsistencies among the states’ UMR assessments and listings are the result of differences in data interpretation and utilization, river functions and uses, and state water quality standards.
3 In March 2002, the Upper Mississippi River
Conservation Committee, an organization of state and federal field level resource personnel, released an Upper Mississippi River Water Quality Assessment that compiled approximately 20 years of UMR water quality data and analyzed those data for spatial and temporal trends.
In addition to describing and comparing the states’ water quality monitoring, 305(b) assessments, and 303(d) lists as they pertain to the Upper Mississippi River, this report presents the UMRBA Water Quality Task Force’s recommendations regarding future UMR water quality protection and coordination efforts. It is important to note that this project was undertaken during a period of uncertainty and transition in the approach to water quality planning and management. In particular, in July 2000, EPA issued a new rule for listing impaired waters and developing TMDLs. However, implementation of the rule was delayed, and the rule was ultimately withdrawn in March 2003. EPA has not yet published a revised rule. Moreover, in November 2001, EPA issued guidance for integrating the development and submission of Section 305(b) water quality assessments and Section 303(d) impaired waters lists. The integrated report guidance was optional for the 2002 reporting cycle, and none of the five UMR states fully employed the guidance for its 2002 submittals. In addition, the threat of litigation related to UMR water quality, including the petition filed in February 2003 by the Ozark Chapter of the Sierra Club, adds another dimension to the environment in which interstate discussions are unfolding.
2

Chapter 2
Monitoring and Data
Water quality monitoring on the Upper Mississippi River is conducted by a number of different agencies, largely because it serves a variety of different purposes. Water quality monitoring data are needed to characterize water quality and identify trends, to assess specific water quality problems, to determine whether water quality standards are being met, to help design and evaluate effectiveness of river management actions, and to determine compliance with regulations. To meet these diverse needs, water quality monitoring efforts may be conducted on a continuous basis or on an as-needed or seasonal basis. Water quality monitoring also involves the collection and analysis of different types of data, including chemical, physical, and biological data. Chemical monitoring is used to assess levels of constituents such as dissolved oxygen, suspended sediments, nutrients, metals, oils, and pesticides. Physical monitoring assesses general conditions such as temperature, flow, water color, turbidity, transparency, type of river bed substrate, and the condition of streambanks and lake shores. Biological monitoring is used to assess abundance and diversity of aquatic plant and animal life and to test the effects of changed water conditions on aquatic organisms. Water quality monitoring is fundamental to states’ responsibilities under the Clean Water Act. In particular, monitoring is critical to the water quality assessments required by Section 305(b) and the determination of whether a waterbody is impaired required by Section 303(d). The following sections describe both federal and state water quality monitoring efforts that provide the primary data used for 305(b) assessments and 303(d) listings on the Upper Mississippi River. FEDERAL WATER QUALITY MONITORING PROGRAMS The federal agencies with the most prominent roles in water quality monitoring are the U.S. Environmental Protection Agency (EPA) and the
U.S. Geological Survey (USGS). Their water quality monitoring programs with applicability to the Upper Mississippi River are described below. In addition, the U.S. Fish and Wildlife Service and the U.S. Army Corps of Engineers may undertake limited water quality monitoring. However, their monitoring is specifically designed to support their own projects or activities and is not widely used by states for Clean Water Act-related purposes. U.S. Environmental Protection Agency The U.S. Environmental Protection Agency conducts very limited water quality monitoring of its own. Rather, under the Clean Water Act (CWA), U.S. EPA provides grants that help states and tribes establish and maintain their water quality monitoring programs. In particular, under the CWA Section 106(e), to be eligible for U.S. EPA water quality management grant funds, state water quality programs must include “the establishment and operation of appropriate devices, methods, systems, and procedures necessary to monitor and to compile and analyze data on … the quality of navigable waters.” Federal regulations at 40 C.F.R. 130.4(b) contain a general description of state monitoring program content and describe the purposes for which the programs are to be designed. In March 2003, U.S. EPA published Elements of a State Water Monitoring and Assessment Program, which recommends 10 basic elements of a state water monitoring program and will serve as the basis in the future for helping U.S. EPA and the states determine whether a monitoring program meets the prerequisites of the CWA. Though U.S. EPA itself does not routinely monitor water quality, the agency has created a web-enabled data system to store and manage water quality data. STORET (STOrage and RETrieval system) includes data collected by federal agencies, state and local agencies, Indian tribes, volunteers, universities, and other private organizations. STORET contains biological,
3
chemical and physical data from both surface and groundwater, including information on where, why, and when the sample was taken, the medium sampled, sampling and analytic methods, the laboratory used for analysis, quality control checks, and the monitoring organization. Each state is responsible for entering its data into the STORET system, which is accessible to any agency or individual. U.S. Geological Survey The U.S. Geological Survey conducts water quality monitoring under a variety of programs, three of which are directly relevant to the Upper Mississippi River: Long Term Resource Monitoring Program, National Stream Quality Accounting Network, and National Water Quality Assessment. In addition, USGS launched the National Water Information System (NWIS) in 2001. NWIS is a storage and retrieval system for water data collected by USGS at 1.5 million surface and groundwater sites across the country. It includes both water quality and streamflow data from 1896 to the present. Long Term Resource Monitoring Program The Long Term Resource Monitoring Program (LTRMP) was authorized by Congress in 1986 as part of the Upper Mississippi River System Environmental Management Program. The program was designed primarily to support natural resource programs by developing a better understanding of the UMR ecosystem and monitoring long term ecological changes. Key monitoring parameters include fish, macroinvertebrates, aquatic vegetation, and water quality. The USGS Upper Midwest Environmental Sciences Center administers the program, with funding from the U.S. Army Corps of Engineers. However, USGS has a cooperative agreement with each state on the Upper Mississippi River (UMR), whereby state natural resource employees run the LTRMP field stations. There are five such field stations on the UMR, at Lake City, Minnesota; Onalaska, Wisconsin; Bellevue, Iowa; Brighton, Illinois; and Jackson, Missouri. From these stations, water quality monitoring is done in four navigation pools (Pools 4, 8, 13, and 26) and on the Open River reach below St. Louis (river miles
29-80). The current water quality monitoring design combines fixed site sampling, at approximately 120 main channel and tributaries sites, with stratified random sampling across entire pools. Data are collected on 25 variables, including conductivity, dissolved oxygen, turbidity, temperature, and pH, which are typically measured in situ; and parameters such as total suspended solids, volatile suspended solids, nitrogen, phosphorus, and ammonia, among other chemical constituents, which are measured by laboratory analyses. National Stream Quality Accounting Network The purpose of the National Stream Quality Accounting Network (NASQAN) is to develop a long-term baseline water chemistry data set that is systematically collected throughout the nation. NASQAN, which began in 1974, went through a major redesign in 1995 and now focuses water quality monitoring on the nation’s largest rivers, including the Mississippi River. Of the 41 nationwide monitoring stations, 3 are on the Upper Mississippi River, at Clinton, Iowa; Thebes, Illinois; and Grafton, Illinois. Sampling focuses on chemical and sediment concentrations, particularly the variation in concentrations between high and low flows and different seasons. Though a five-year (2002-2005) special study phase was initiated in 2001, sampling remains unchanged on the UMR. National Water Quality Assessment
The National Water Quality Assessment (NAWQA) program began in 1991 with the objective of developing “long-term consistent and comparable information on streams, groundwater, and aquatic ecosystems to support sound management and policy decisions.” Chemical, biological and physical water quality data are systematically collected nationwide on a rotating basin approach. Parameters include chemical concentrations in water, bed sediment, and aquatic organism tissues for about 500 chemical constituents; daily stream flow; nutrient samples; and pesticide samples. The Upper Mississippi River Basin north of the Twin Cities is one of NAWQA’s 42 study units. That study unit utilizes a monitoring station at Hastings, Minnesota.
4

STATE WATER QUALITY MONITORING PROGRAMS The following sections describe the water quality monitoring programs, related to the Clean Water Act, in each of the five UMR states, and the approach each state uses for monitoring the water quality of the UMR specifically. In addition, if states utilize data other than their own for 305(b) assessments and 303(d) listings on the UMR, those data sources are also identified. Illinois The Illinois EPA Bureau of Water uses a combination of a statewide ambient fixed site monitoring network and a five-year rotating basin schedule to monitor and assess streams. The Ambient Water Quality Monitoring Network (AWQMN), established in 1977, is a statewide long-term monitoring network. Its objectives include identifying long-term resource quality trends for biological, chemical, and physical parameters; identifying new or existing water quality problems; determining the effectiveness of water quality pollution control programs; and acting as a trigger mechanism for special studies or other appropriate actions. As of 2001, AWQMN included 213 stations statewide, each of which is sampled for a minimum of 55 parameters. Chemical parameters including ammonia, chlorine, cyanide, metals, nitrate, non-priority organics, PCBs, pesticides, and sulfates, are sampled every 6 weeks. In addition, a subset of 30 stations is sampled for chlorophyll and 35 for pesticides. The Great River Boundary monitoring program is a subset of the AWQMN consisting of 11 active
sites on the Upper Mississippi River and one on the Wabash River. Because these waters are interstate boundaries and may require different monitoring techniques due to their large size, monitoring may differ from other AWQMN sites. The 11 stations located on the UMR are sampled quarterly for the core chemical parameters monitored at all AWQMN sites. In 2001, macroinvertebrate sampling was added at a number of the UMR sites. Most of the UMR stations were established in 1999, although some were located near historical sampling points. (See Table 1.) The 11 stations are at approximately 50-mile intervals, with the 8 stations above St. Louis located at locks and dams and the 3 stations below St. Louis sampled from boat ramps. An Intensive Basin Survey program is conducted through a joint effort with the Illinois Department of Natural Resources. Surveys use a targeted monitoring approach conducted on a 5-year cycle covering 33 basins. Stations are selected to include historic sites for trends, along with locations within 305(b) assessment reaches. Approximately 100 sites will be monitored annually through 2006. Data include fish and macroinvertebrate communities, water and sediment chemistry, and instream habitat. Although most of Illinois drains into the Mississippi River, 5 of the 33 watersheds consist primarily of direct tributaries to the Upper Mississippi River. (See Figure 1.) These include the Mississippi North Central, Central, South Central, and South, which are scheduled to be assessed in 2005, and the Mississippi North scheduled for assessment in 2006.
5

Table 1 Illinois Ambient Water Quality Monitoring Network
Great River Boundary Monitoring on the UMR
Water Quality Station Code
IEPA
USGS
Years of Record
Illinois County
Reach/ Station Description
M 13 - 1999- Jo Davies
Lock and Dam 11 at RM 583, 2 mi NE of Dubuque, IA
M 12 - 1999- Whiteside Lock and Dam 13 at RM 522.5, 1.5 mi NE of Fulton
M 04* 05420500 1967-99 Whiteside Rt 136 Bridge at Fulton
M 02 - 1999- Rock Island Lock and Dam 15 at RM 482.9, Arsenal Island
L 04 - 1999- Mercer Lock and Dam 17 at RM 437, 2 mi NW of New Boston
K 22 - 1999- Hancock Lock and Dam 19 at RM 364, E edge of Keokuk, IA
K 04* 05474500 1972-99 Hancock Keokuk, IA
K 17 - 1999- Adams Lock and Dam 21 at RM 325, 0.75 mi SW of Quincy
K 21 - 1999- Pike Lock and Dam 24 at RM 273.5, Clarksville, MO
J 05* 05587555 1989-95 Jersey RM 214.6 near Elsah (Grafton, IL)
J 98 - 1999- Madison Lock and Dam 26 at RM 200.8, 1 mi S of Alton
J 83* 05587550 1975-89 Madison Lock and Dam 26
J 36 - 1999- Monroe RM 162.2, upstream of the Meramec R. confluence
I 05 - 1999- Randolph RM 111, Chester, 1 mi upstream of highway bridge
I 84 07022000 1983-95 1999-
Alexander RM 44 in Thebes at the ferry landing, 0.75 mi W of Rt 3
* Inactive site.
6

Figure 1 Illinois Intensive Basin Survey Units
Mississippi North River Basin
Mississippi River North Central Basin
Mississippi Central River Basin
Mississippi South Central River Basin
Mississippi South River Basin
Illinois’ Fish Contaminant Monitoring Program is a cooperative program of the Illinois EPA and the state’s Departments of Natural Resources, Public Health, and Agriculture. Fish samples collected from rivers, inland lakes, and Lake Michigan are analyzed for approximately 50 parameters, including organochlorine compounds and mercury. In 2002, fish tissue data was collected from five different areas on the UMR: Pools 13, 16, 18, 19 and 20. Illinois EPA relies heavily on its own water quality monitoring data for developing its 305(b) assessment and identifying impaired waters. Illinois’ neighbor states of Iowa and Missouri have little, if any, UMR water quality data to share with Illinois. Although there are three USGS NASQAN sites on the Illinois stretch of
the UMR (Clinton, IA; Grafton, IL; and Thebes, IL), Illinois EPA does not find the NASQAN data to be particularly useful for making impairment decisions. In particular, the NASQAN data are analyzed by USGS for dissolved parameters, whereas all Illinois standards, with the exception of dissolved iron, are based on totals rather than dissolved form. Though Illinois reviews USGS LTRMP data, it is not used for Clean Water Act reporting due to a variety of difficulties. In particular, Illinois EPA staff report difficulty in identifying LTRMP sampling locations and uncertainty regarding appropriate data aggregation methods. In addition, LTRMP data qualifiers for some parameters limit the ability to apply the data to state water quality standards.
7

Iowa Iowa’s Ambient Monitoring Program, a cooperative venture of the Iowa Department of Natural Resources (DNR) and the University of Iowa Hygienic Laboratory, has conducted routine statewide monitoring of water quality since the early 1980s. Until 1999, most of the monitoring was limited to only 16 locations. However, four years ago the program was significantly expanded to include 79 fixed sites statewide that are sampled monthly for 94 chemical, physical, and biological parameters. In addition to data from its fixed station water quality monitoring network, Iowa DNR relies on a variety of other data sources in preparing its Section 305(b) report and Section 303(d) list. Examples include data from water quality monitoring done by other agencies, such as the U.S. Geological Survey and U.S. Army Corps of Engineers; special studies; beach and lake monitoring conducted by Iowa State University; fish tissue analysis done by U.S. EPA and Iowa universities; reports from pollutant-caused fish kills; data from public water suppliers; and volunteer monitoring. Although Iowa’s statewide Ambient Monitoring Program was significantly expanded in 1999, it does not include any sites on the Upper Mississippi River. Therefore the state must rely entirely on other data sources for assessing the Upper Mississippi River in its 305(b) assessments and 303(d) lists. Different combinations of data are used for evaluating each of Iowa’s 14 UMR reaches. Examples of some of those data sources include the following: Iowa DNR participates in U.S. EPA Region 7’s Regional Ambient Fish Tissue (RAFT) Monitoring Program, which samples fish tissue for 19 pesticides and 4 toxic metals. Approximately 20 sites are sampled each year. An additional 10 sites are part of the RAFT trend monitoring and are sampled every other year. Three of these trend sites are on the UMR.
Iowa DNR uses USGS NASQAN data from the monitoring station at Clinton, Iowa; and special reports such as Ecological Status and Trends of
the Upper Mississippi River System 1998: A Report of the Long Term Resource Monitoring Program.
Iowa DNR uses data from adjacent states, including water quality monitoring data from Illinois EPA sites near Keokuk, Iowa and Camanche, Iowa. In addition, a 1997 Wisconsin DNR study, linking low dissolved oxygen levels to zebra mussels, has been used by Iowa DNR to assess six of its more northerly UMR reaches. Until relatively recently, Iowa DNR used data from Wisconsin DNR’s ambient station near Lynxville. However, due to accessibility problems with STORET, those data were not used by Iowa DNR in 2000 or 2002.
Data from special studies conducted by private companies are also used by Iowa DNR. In 2000 and 2001, the Archer Daniels Midland (ADM) corn processing plant in Clinton, Iowa conducted research on “slime” found in local fishermen’s nets in Pool 14. The studies confirmed that ADM was meeting its National Pollution Discharge Elimination System (NPDES) permit discharge criteria, though ultimately the facility was found to be the major source of the “slime.” In addition, prior to 1998, the Aluminum Company of America (ALCOA) tested for PCBs at 5 fish contaminant monitoring sites in Pool 15. Iowa DNR uses these data for fish consumption advisories.
Iowa DNR uses data from the Long Term Resource Monitoring Program, managed by USGS, for UMR tributary streams, such as Rock Creek and Elk River. However, Iowa DNR has not formally reviewed the LTRMP data for Pool 13 and thus has not used these data for its UMR assessments or listings.
Minnesota The Minnesota Pollution Control Agency (PCA) surface water monitoring program is implemented on a major basin/watershed approach. This basin concept, adopted in 1995, organizes monitoring, assessment, and planning on the basis of the state’s ten major drainage basins. Two of those basins are related to the Mississippi River. The “Upper Mississippi” includes the headwaters at Lake Itasca, south to the confluence of the St.
8

Croix River. The “Lower Mississippi” includes the 137-mile interstate portion of the river, south of the confluence with the St. Croix River to the Minnesota-Iowa border. (See Figure 2.) For its 305(b) and 303(d) assessments, the Minnesota Pollution Control Agency relies primarily on data from what it calls “condition”
monitoring, which is monitoring designed to assess status and trends, rather than investigate specific problems or the effectiveness of remedial actions. PCA’s condition monitoring includes routine chemical monitoring at 80 fixed stations throughout the state. These “Milestone” stations include 3 sites on the Mississippi River border with Wisconsin. (See Table 2.)
Table 2
Minnesota Milestone Sites Interstate Portions of the UMR
Station
(River Mile) Length of
Record
Site Description UM-738 1974 - present Lock and Dam 5, 3 miles southeast of Minneiska, Minnesota UM-714 1962 - present Lock and Dam 6, Trempealeau, Wisconsin UM-698 1958 - present Below US-14 Bridge, La Crosse, Wisconsin
Figure 2
Major Basins in Minnesota
9
In addition, in 1996, Minnesota PCA initiated a biological monitoring program at randomly selected stations. This statistically-based monitoring, which complements the Milestone monitoring, focuses on fish, macroinvertebrates, and habitat measures, plus flow and basic water chemistry, at approximately 55 sites in each of the state’s 10 basins. Monitoring has thus far begun in 4 of the 10 basins. Minnesota’s “Upper Mississippi River Basin” is one of the four. For its Upper Mississippi River assessments, Minnesota PCA reviews data from its own monitoring programs, as well as data from the LTRMP (Pools 4, 5, 8, and some areas of Pools 7 and 9), and Wisconsin DNR (accessed through STORET and consultation with Wisconsin DNR staff). In addition, data from the Twin Cities Metropolitan Council’s river monitoring program are also used to assess the UMR. Only one of the Metropolitan Council sites (river mile 796.9 above Lock and Dam 3) is on the interstate portion of the river. Finally, data from Minnesota DNR’s Fish Contaminants Monitoring program are used by Minnesota PCA for its UMR 303(d) listing decisions. These are the same data used by the Minnesota Department of Health to issue Fish Consumption Advisories. PCA uses fish consumption advisories in assessing impaired waters for its 303(d) list, but does not use them for use support determinations in its 305(b) report. Missouri The Missouri Department of Natural Resources (DNR) and USGS cooperatively conduct a fixed station network for water quality monitoring (Ambient Water Quality Network). The Missouri Water Quality Report, 2002 describes the objective of this network as being “to better characterize background or reference water quality conditions to better understand daily flow event and seasonal water quality variations and their underlying processes, to assess time trends, and to check for compliance with water quality standards.” There are currently 63 statewide fixed station sites that are sampled 6 to 12 times a year. One of those sites (the NASQAN station near Grafton, Illinois) is on the UMR. Parameters
include nutrient ions, temperature, pH, dissolved oxygen, suspended solids, and heavy metals. The Missouri DNR also does routine monitoring of public drinking water supplies for both bacteria and trace contaminants. In addition, sediment quality monitoring data is done on a five-year rotating basis at 25 fixed sites throughout the state. In addition to fixed site monitoring, Missouri DNR conducts 10-15 special studies each year, cooperates with the Missouri Department of Conservation in a biological monitoring program involving fish and aquatic invertebrate sampling, and measures levels of bioaccumulative toxins in fish at 15 sites statewide. For its 305(b) assessments and 303(d) listings on the Upper Mississippi River, Missouri DNR uses data from USGS NASQAN stations at Thebes, Illinois and Grafton, Illinois; and fish tissue data from the U.S. Fish and Wildlife Service and U.S. EPA’s Regional Ambient Fish Tissue (RAFT) Monitoring Program. Missouri DNR has not been using data from the Long Term Resource Monitoring Program. However, DNR staff expect this to change because the recent release of LTRMP data on CD has enhanced its availability. Wisconsin Wisconsin’s surface water monitoring program includes baseline monitoring, as well as a variety of special project monitoring. The strategy for baseline monitoring of nonwadeable streams involves monitoring a total of 180 sites statewide over a 5-year period. While no baseline monitoring, as part of the statewide program, is conducted on the 231 miles of the Upper Mississippi River in Wisconsin, Wisconsin DNR conducts some routine water quality monitoring at three lock and dam sites. Samples are collected quarterly for low-level metals and biannually for triazine analysis at Lock and Dam 3 and Lock and Dam 4. A long-term ambient monitoring site at Lock and Dam 9 has recently been reactivated and will collect monthly data for nutrients, suspended solids, chlorophyll, and bacteria. In addition, the Wisconsin Department of Natural Resources analyzes both PCBs and mercury in fish samples as part of the statewide fish
10

contaminant monitoring program. During calendar years 2000-2001, over 1200 fish samples were collected at 150 sites statewide. In contrast to other Wisconsin waterbodies, there is an abundance of water quality data on the Upper Mississippi River, though much of it is not directly used for Clean Water Act reporting. Special studies and monitoring which Wisconsin DNR has undertaken on the UMR include: Suspended sediment contaminant analysis at Lock and Dams 3 and 4 during spring and fall periods, since 1987. Contaminant analyses include nutrients, heavy metals, and PCBs.
Light penetration monitoring at Lock and Dams 8 and 9, done biweekly to monthly from May to October, since 1988.
Fall benthic invertebrate monitoring in portions of Pools 2 and 3 in coordination with Minnesota agencies and in Pools 4-11 in coordination with the U.S. Fish and Wildlife Service.
General limnologic and hydraulic data collection in support of habitat project planning and evaluation.
Receiving water evaluations to assess the effects of proposed or permitted wastewater discharges.
Special contaminant investigations including: the impact of the 1993 Flood on bed and suspended contaminant concentrations on the UMR, PCB remediation at the Corps of Engineers’ Service Base at Fountain City, low-level PCB sampling at Lock and Dam 3, and tributyltin sampling in marinas at La Crosse.
Compliance monitoring associated with water quality certifications issued for federal or private dredging projects.
Special studies related to impacts of zebra mussels, Weaver Bottoms Resource Analysis Program, wild celery studies in Pool 8, spill response monitoring, animal waste runoff, discharges of contaminated groundwater, water level management practices, and fish collections for consumption advisories.
For its 305(b) assessments of the UMR, Wisconsin DNR primarily utilizes data from its own field work and studies and data from the LTRMP field station at Onalaska. UMR 303(d) listing decisions are based on numerous additional sources, including a USGS contaminant survey, U.S. EPA mercury monitoring, Minnesota PCA STORET data, Minnesota Department of Health fish contaminant data, and sediment contaminant data from the U.S. Army Corps of Engineers. Upper Mississippi River Conservation Committee In March 2002, the Upper Mississippi River Conservation Committee (UMRCC), an organization comprised of state and federal technical experts from environmental and natural agencies, prepared the Upper Mississippi River Water Quality Assessment. The report’s primary objectives were to “increase coordination and cooperation among monitoring agencies, develop a unified database of relevant water quality information, and to use these data to produce a systemic assessment of the water quality of the UMR.” The report compiles water quality data collected by state and federal agencies from the last two decades. Two databases were created. The first includes field and laboratory inorganic chemistry data collected near or in the river’s main channel. The second includes UMR fish contaminant data on polychlorinated biphenyls (PCBs), chlordane, and mercury. SUMMARY The five Upper Mississippi River states employ a variety of approaches to water quality monitoring and data collection on the river. Illinois EPA uses a series of 11 ambient monitoring sites, spaced at approximate 50-mile intervals, while Iowa DNR and Missouri DNR have no state sites on the river. Wisconsin DNR conducts a wide variety of special studies on the Upper Mississippi River and conducts routine water quality monitoring at Lock and Dam 3, 4, and 9. The most extensive federal water quality monitoring effort on the Upper Mississippi River is the Long Term Resource Monitoring Program administered by the USGS Upper Midwest
11

Environmental Sciences Center. Five LTRMP field stations on the UMR are the base of operations for sampling at approximately 120 main channel and tributary sites. Of particular interest is the extent to which states seek out and use data from sources other than their own monitoring activities and special studies. For purposes of determining whether a waterbody is impaired and should be included on a state’s 303(d) list, U.S. EPA regulations require states to “assemble and evaluate all existing and readily available water quality-related data and information.” In its 2002 Consolidated Assessment and Listing Methodology, U.S. EPA provides the example of an interstate waterbody noting that, “if a state shares a waterbody with another state, it must consider existing and readily available data from the state that shares the waterbody.” In response to this requirement, states often explicitly address their use of outside data sources in their guidance manuals governing monitoring and assessments under the Clean Water Act. For example, Minnesota PCA’s April 2002 manual describes the state’s use of outside data, citing Wisconsin DNR, Metropolitan Council Environmental Services, and USGS among its outside data sources. Illinois EPA’s Water Quality Monitoring Strategy for 2002-2006 indicates that, because water monitoring is costly, “to augment the monitoring coverage in the future, the Agency will place greater reliance on the data collected by other agencies or entities that have demonstrated the ability to collect quality data .…” On the Upper Mississippi River, states generally utilize USGS data from NASQAN sites, if they
exist on their reach of the river. However, USGS water quality data from the Long Term Resource Monitoring program are not as widely used. While this may well change in the future, as the data become more accessible and the states enhance their familiarity with it, neither Missouri DNR nor Iowa DNR used LTRMP data for their 2002 assessments or listing decisions. Although Illinois EPA reviewed LTRMP data for its 2002 assessment, that data did not form a basis for its 303(d) listing decisions on the UMR. In contrast, Minnesota PCA and Wisconsin DNR more fully utilized LTRMP water quality data in the 2002 reporting cycle. The extent to which the states consider data from neighboring states when preparing their assessments and listing for the Upper Mississippi River also varies widely. Iowa DNR relies heavily on data from other sources, including Illinois EPA and Wisconsin DNR, because it collects no UMR ambient data of its own. In contrast, Illinois EPA, which has 11 monitoring sites on the Upper Mississippi River, uses its own data sources, in combination with USGS data, with little additional data available from Missouri DNR or Iowa DNR. Wisconsin DNR and Minnesota PCA frequently exchange and utilize each other’s data and information. Table 3 summarizes the states’ use of outside data sources, including data from other states and USGS. The distinction is made between “reviewing” or considering such data and whether it was used as a basis for the state’s 303(d) listing decisions on the UMR. In some instances states may review outside data, yet not use it as a basis for listings.
12

Table 3 States’ Use of Outside Data Sources
for UMR 2002 Assessments and Listings
Other States’ Data
USGS Long Term Resource Monitoring Program (LTRMP)
USGS National Stream Quality Accounting
Network (NASQAN)1
Review Data2
Utilize Data3
Review Data2
Utilize Data3
Review Data2
Utilize Data3
Illinois No No Yes No Yes No
Iowa Yes Yes No No Yes Yes
Minnesota Yes No Yes Yes NA NA
Missouri No No No No Yes Yes
Wisconsin Yes Yes Yes Yes NA NA 1 NA = Not Applicable. There are no NASQAN sites on the Upper Mississippi River in Minnesota or Wisconsin. 2 Review Data = In preparing 305(b) assessments and 303(d) listings for the UMR, did the state review data from this outside source?
3 Utilize Data = Did this outside data source form any part of the basis for the state’s 2002 impairment decision on the UMR?
13

14

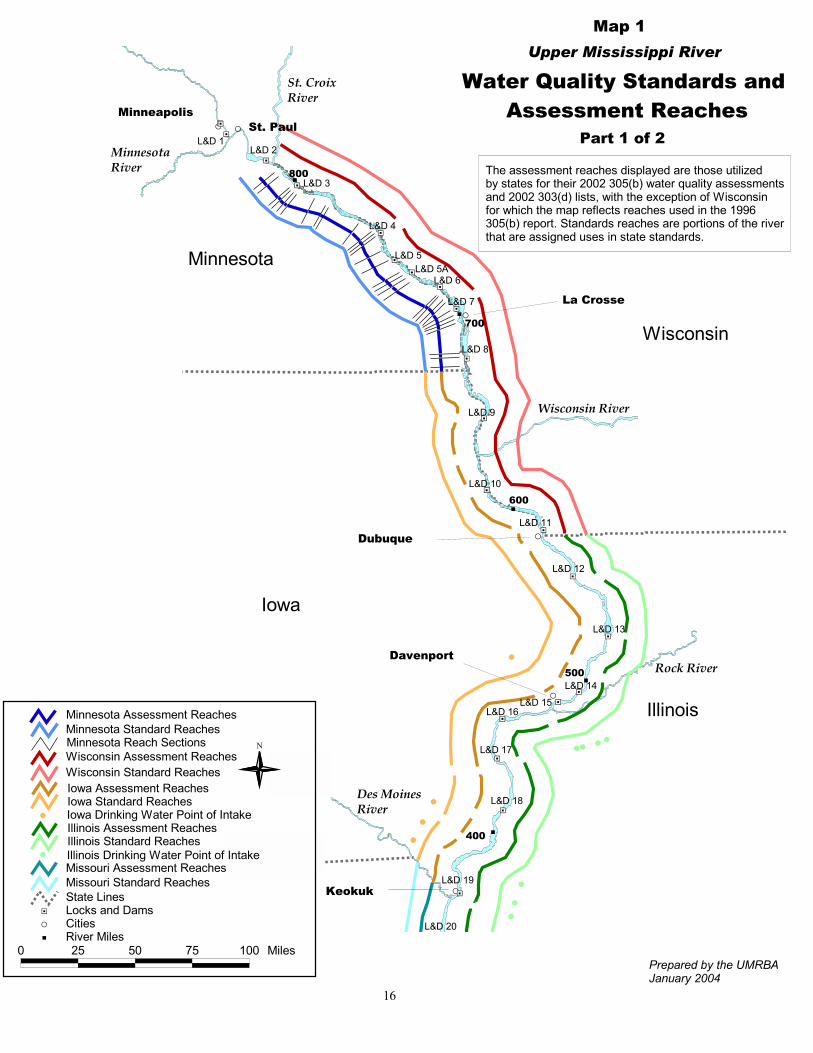
Chapter 3
Water Quality Standards and Assessment Reaches Due to the size and complexity of some waterbodies, states often subdivide them into multiple reaches for the purpose of establishing standards and/or assessing water quality. This chapter provides a brief overview of how the five Upper Mississippi River states have subdivided the UMR for the purposes of standards and assessments (see Map 1). States establish standards for a waterbody, or a reach, by first designating one or more uses that it should support. These designations then link to the numeric and/or narrative criteria the state has established to protect those uses. Examples of common designated uses include aquatic life, drinking water, and primary contact recreation (e.g., swimming). Criteria to protect those uses might include a minimum dissolved oxygen level, a maximum arsenic concentration, or a prohibition on “aesthetically objectionable” conditions. A water quality standard is simply the combination of a designated use and the numeric and narrative criteria the state has established to protect that use. For a large waterbody like the Upper Mississippi River, a state may treat the entire waterbody as a single unit when establishing standards, in which case there would be one “standards reach” applicable to the entire waterbody. Alternatively, a state may subdivide the waterbody into different
portions, in which case there would be multiple standards reaches. For assessment purposes, states may also subdivide large waterbodies, using data from different locations to assess conditions on different portions of a waterbody. Limiting the spatial extrapolation of data is one technique used to help ensure that the data are representative of actual conditions on the reach to which they are applied. States may also subdivide large waterbodies for assessment purposes at points where there are significant geomorphological changes that may influence water quality conditions. In addition, “assessment reaches” also break where there are changes in applicable standards. It is important to note that, in assessing the UMR, the states are generally relying on data from the main channel and closely connected areas and do not typically address backwaters and other isolated portions of the river system. The following sections of this chapter describe how each of the five Upper Mississippi River states delineates both standards and assessment reaches on the river. Table 4 shows the number of standards and assessment reaches that each state employs on the UMR:
Table 4
Upper Mississippi River Assessment and Standards Reaches
Miles of UMR
Number of UMR Standards Reaches
Number of UMR Assessment Reaches
Illinois 698 11 15 Iowa 313 32 14 Minnesota 139 1 31 Missouri 366 2 2 Wisconsin 230 1 3
1 Illinois also applies drinking water standards at the intake points of its 12 UMR public water supplies. 2 Iowa also applies drinking water standards at the intake points of its 4 UMR public water supplies.
15
%U
%U
%U
%U
%U
S S
S
S
S
S
#
#
#
#
####
#
##
%[
%[
%[
%[
%[
%[
%[
%[
%[
%[
%[
%[
%[
%[%[
%[
%[
%[
%[
%[%[%[
%[
Keokuk
Dubuque
St. Paul
La Crosse
Davenport
Minnesota
Wisconsin
Iowa
Illinois
MinneapolisSt. Croix River
Minnesota River
Des MoinesRiver
Wisconsin River
Rock River
400
500
600
700
800L&D 3
L&D 4
L&D 5
L&D 7
L&D 6
L&D 8
L&D 9
L&D 16
L&D 18
L&D 19
L&D 20
L&D 10
L&D 11
L&D 12
L&D 13
L&D 17
L&D 2L&D 1
L&D 5A
L&D 14L&D 15
Upper Mississippi River
Part 1 of 2
Water Quality Standards and Assessment Reaches
Map 1
The assessment reaches displayed are those utilized by states for their 2002 305(b) water quality assessments and 2002 303(d) lists, with the exception of Wisconsin for which the map reflects reaches used in the 1996 305(b) report. Standards reaches are portions of the river that are assigned uses in state standards.
Prepared by the UMRBAJanuary 2004
Minnesota Standard Reaches
Iowa Assessment Reaches
Illinois Assessment Reaches
Missouri Standard Reaches
%[
Minnesota Reach Sections
Iowa Standard Reaches
Illinois Standard Reaches
State LinesLocks and DamsCitiesSRiver Miles%U
Minnesota Assessment Reaches
Wisconsin Assessment Reaches
Missouri Assessment Reaches
Wisconsin Standard Reaches
N
Illinois Drinking Water Point of Intake#
Iowa Drinking Water Point of Intake#
0 25 50 75 100 Miles
16

%U
%U
%U
%U
%U
S
S
S
S
#
#
#
#
##
#
#
#
#
#
%[
%[
%[
%[
%[
%[
%[
%[
%[
Cairo
Keokuk
St. Louis
Cape Girardeau
Missouri
Des MoinesRiver
Illinois River
Kaskaskia River
Ohio River
Missouri River
0
100
200
300
400
rLock 27
L&D 18
L&D 19
L&D 20
L&D 21
L&D 22
L&D 24
L&D 25L&D 26
Illinois
Prepared by the UMRBAJanuary 2004
The assessment reaches displayed are those utilized by states for their 2002 305(b) water quality assessments and 2002 303(d) lists, with the exception of Wisconsin for which the map reflects reaches used in the 1996 305(b) report. Standards reaches are portions of the riverthat are assigned uses in state standards.
Water Quality Standards and Assessment Reaches
Part 2 of 2
Upper Mississippi RiverMap 1
r Chain of Rocks Canal, at Lock 27, is also a separate assessment reach.
Minnesota Standard Reaches
Iowa Assessment Reaches
Illinois Assessment Reaches
Missouri Standard Reaches
%[
Iowa Standard Reaches
Illinois Standard Reaches
State LinesLocks and DamsCitiesSRiver Miles%U
Minnesota Assessment Reaches
Wisconsin Assessment Reaches
Missouri Assessment Reaches
Wisconsin Standard Reaches
N
Illinois Drinking Water Point of Intake#
Iowa Drinking Water Point of Intake#
0 25 50 75 100 Miles
17

ILLINOIS Illinois treats its entire length of the Upper Mississippi River as a single unit for the purpose of establishing water quality standards. The state applies two designated uses to this single standards reach: General Use and Public & Food Processing Water Supply. However, Illinois only applies its standards for Public & Food Processing Water Supply to the actual withdrawal locations for potable water supplies and food processing. Thus, Illinois has a single standards reach for the river that relates to its General Use standards. In addition, there are 12 specific public water supply intakes to which it also applies its drinking water standards. For assessment purposes, the Illinois Environmental Protection Agency uses 15 reaches on the UMR, with the reaches breaking primarily at locks and dams, tributaries, and immediately above population centers. One reach, for the Chain of Rocks Canal, essentially runs parallel to a longer reach on the main channel of the river. On large rivers such as the Upper Mississippi, Illinois typically limits the extrapolation of monitoring data for the assessment of aquatic life to within 50 miles upstream and downstream from the monitoring location. Illinois has 11 UMR monitoring sites under its Ambient Water Quality Monitoring Network. Its UMR assessment reaches average 47 miles in length. IOWA Iowa breaks the UMR into three segments in its water quality standards, and designates all three reaches for aquatic life and primary contact recreation uses. In addition, Iowa also designates the locations of four municipal water supply intakes on the UMR for drinking water use. The Iowa Department of Natural Resources employs 14 assessment reaches on the UMR. Four of these assessment units are associated with the designated drinking water intakes and encompass areas upstream of the intakes. Beyond the divisions that correspond to these shifts in designated use, Iowa DNR subdivides the UMR for assessment purposes based largely on hydrologic considerations. More specifically,
most of the assessment reaches are determined by the location of major tributaries and the boundaries of eight-digit hydrologic unit code watersheds. Other factors include the locations of locks and dams, point source impairments, and fish tissue monitoring stations. Iowa’s UMR assessment reaches average 22 miles in length. MINNESOTA Minnesota treats its entire interstate portion of the Upper Mississippi River as a single unit in its water quality standards. Thus, there is a single standards reach for the river below the St. Croix. This portion of the river is designated for 5 uses — i.e., aquatic life and recreation, industrial use and cooling, agricultural use, aesthetics and navigation, and other uses. The Minnesota Pollution Control Agency uses 31 assessment reaches for the interstate UMR, the most of the five states. In keeping with its statewide practice, Minnesota PCA’s UMR assessment reaches typically run from one tributary to another. There are also breaks associated with other morphological factors, including locks and dams and watershed boundaries. On smaller rivers in the state, this approach generally results in assessment reaches of under 20 miles. On the UMR, the assessment reaches average 4.5 miles in length. Three of Minnesota’s UMR assessment reaches are on portions of Lake Pepin. In addition, Minnesota PCA also evaluates Lake Pepin in its entirety for trophic status as part of the agency’s statewide lakes assessment. MISSOURI Missouri’s water quality standards divide the Upper Mississippi River into two reaches. The portion above the mouth of the Missouri River, which is 166 miles long, is designated for aquatic life (including fish consumption), drinking water, whole body contact recreation, boating, industrial use, and livestock and wildlife watering. Downstream of the Missouri River, the remaining 195 miles of the UMR are designated for all of these same uses, except for whole body contact recreation. In addition, this downstream portion of the UMR in Missouri is also designated for irrigation. Missouri DNR’s two assessment
18

reaches on the UMR correspond to the two standards reaches. This report does not address the portion of the Mississippi River in Missouri that is below the mouth of the Ohio River, and thus not considered part of the UMR. WISCONSIN Wisconsin treats its entire length of the Upper Mississippi River as a single unit in its water quality standards. In its 1996 305(b) report, the Wisconsin Department of Natural Resources divided the river into three reaches for assessment purposes. None of Wisconsin’s 305(b) reports since 1996 have provided details on UMR use support levels; thus, more recent assessment reach information for the river is not available. SUMMARY Standards Reaches — Three of the five UMR states (Illinois, Minnesota, and Wisconsin) have one standards reach for their portion of the Upper Mississippi River. In contrast, Iowa and Missouri have three and two standards reaches, respectively, on the UMR.
Assessment Reaches — The number and size of assessment reaches on the Upper Mississippi River vary widely among the states. Minnesota has the least amount of river mileage, but the greatest number of assessment reaches. Minnesota PCA uses 31 reaches, averaging 4.5 miles, to assess the interstate portion of the UMR. In contrast, Missouri uses only 3 assessment reaches for the river, 2 of which are on the Upper Mississippi River (i.e., north of the Ohio River). The two UMR reaches in Missouri average 180 miles in length. In an effort to harmonize state approaches to assessing the UMR, the Upper Mississippi River Basin Association Water Quality Task Force proposed an agreement that would establish a set of minimum interstate assessment reaches for use in preparing 305(b) water quality assessments and 303(d) listings for the UMR. As a result, in October 2003, the five states’ water quality management agencies executed a Memorandum of Understanding agreeing to use the 13 reaches defined by the Upper Mississippi River Conservation Committee’s Water Quality Technical Section, in its March 2002 Upper Mississippi River Water Quality Assessment. (See Table 5.)
19

Table 5 Minimum Set of Interstate Assessment Reaches
for the UMR Hydrologic Unit Code
(HUC)
HUC Name
Starting River Mile
Ending River Mile
Segment Length (mile)
Segment Description
07040001 Rush-Vermillion 811.5 763.4 48.1 St. Croix River to Chippewa River 07040003 Buffalo-
Whitewater 763.4 714.2 49.2 Chippewa River to Lock and
Dam 6 07040006 LaCrosse-Pine 714.2 693.7 20.5 Lock and Dam 6 to Root River 07060001 Coon-Yellow 693.7 630.7 63.0 Root River to Wisconsin River 07060003 Grant-Maquoketa 630.7 583.0 47.7 Wisconsin River to Lock and
Dam 11 07060005 Apple-Plum 583.0 522.5 60.5 Lock and Dam 11 to Lock and
Dam 13 07080101 Copperas-Duck 522.5 434.0 88.5 Lock and Dam 13 to Iowa River 07080104 Flint-Henderson 434.0 361.4 72.6 Iowa River to Des Moines River 07110001 Bear-Wyaconda 361.4 324.9 36.5 Des Moines River to Lock and
Dam 21 07110004 The Sny 324.9 236.7 88.2 Lock and Dam 21 to Cuivre River 07110009 Peruque-Piasa 236.7 195.7 41.0 Cuivre River to Missouri River 07140101 Cahokia-Joachim 195.7 118.0 77.7 Missouri River to Kaskaskia River 07140105 Upper Miss.-
Cape Girardeau 118.0 0 118.0 Kaskaskia River to Ohio River
20

Chapter 4
305(b) Water Quality Assessments
Under Section 305(b) of the Clean Water Act, states are required to submit biennial water quality assessment reports to the U.S. Environmental Protection Agency. These reports are intended to provide an overall perspective on water quality conditions in each state. More specifically, Section 305(b) directs the states to describe the quality of their surface waters, analyze the extent to which aquatic life and recreation use are protected, estimate the costs and benefits associated with protecting those uses, and describe the impact of non-point source pollutants. EPA uses the individual state 305(b) assessments to prepare a national report, which the agency submits to Congress. In addition to presenting something of a snapshot of current water quality conditions and providing insight into the progress the states are making in protecting their surface waters, states use their 305(b) assessments of use support as a substantial basis for their 303(d) lists of impaired waters. Impaired waters are those waters identified by a state as not meeting the applicable water quality standards. States are then responsible for developing total maximum daily loads designed to bring the impaired waters into compliance with water quality standards. While related, the results of the 305(b) assessment and 303(d) listing processes are not necessarily identical. In 2001 and 2002, U.S. EPA issued guidance seeking to better integrate 305(b) assessments and 303(d) lists through a consolidated reporting process. However, because of timing issues, the 5 UMR states largely applied the traditional, separate assessment and listing practices for the 2002 cycle. WATER QUALITY STANDARDS A 305(b) report is based largely on a state’s assessment of the extent to which its surface waters are meeting the water quality standards that the state has established. Under Section 303 of the CWA, states must establish standards for all of their surface waters. Standards are comprised of designated uses, narrative and numeric criteria to protect these uses, and antidegradation policies to prevent deterioration
of high-quality waters. States must review their standards every three years and revise them as necessary, with both the original standards and revisions being subject to EPA approval. The designated uses of a waterbody identify the type of functions it does or is expected to serve. The “fishable” and “swimmable” goals of the Clean Water Act generally lead states to designate all waters for aquatic life protection and recreation unless those uses are proven to be unattainable (CWA §101(a)(2)). In addition, Section 303(c)(2)(A) also requires states to “consider” all uses in their designations. Thus, aquatic life and recreation uses are effectively placed in a higher tier than other uses such as industrial and irrigation uses. The exception is the public water supply use, which is primarily driven by the presence or absence of water supply intakes on a waterbody. This explains why there is greater emphasis upon aquatic life, recreation, and public water supply uses by EPA and the states and why this report treats them as “major” designated uses. Table 6 and Map 2 show the major designated uses that the five states have assigned to the Upper Mississippi River. Numeric and narrative criteria are designed to protect each type of use. A numeric criterion is expressed as a concentration of a pollutant or value of a physical parameter, such as a minimum dissolved oxygen level or a maximum arsenic concentration. Meeting or exceeding the level established in the criterion supports the specified beneficial use. Narrative criteria are statements prohibiting unacceptable conditions in or upon a waterbody (e.g., waters of the state must be free from “aesthetically objectionable” conditions.). Narrative criteria serve as a “safety net” for waterbodies not designated for specific uses or to protect designated waterbodies against pollutants for which a state has not adopted pollutant-specific numeric criteria. Theoretically, if the numeric and narrative criteria are met, then the designated uses should be protected. Tables 24 and 25 (in Chapter 5) display numeric and narrative criteria applicable to the Upper Mississippi River.
21

%U
%U
%U
%U
%U
S S
S
S
S
S
#
#
#
#
%[
%[
%[
%[
%[
%[
%[
%[
%[
%[
%[
%[
%[
%[%[
%[
%[
%[
%[
%[%[%[
%[
400
500
600
700
800
Keokuk
Dubuque
St. Paul
La Crosse
Davenport
Minneapolis
Des MoinesRiver
Rock River
Wisconsin River
St. CroixRiver
Minnesota River
MinnesotaWisconsin
Iowa
Illinois
L&D 3
L&D 4
L&D 5
L&D 7L&D 6
L&D 8
L&D 9
L&D 16
L&D 18
L&D 19
L&D 20
L&D 10
L&D 11
L&D 12
L&D 13
L&D 17
L&D 2
L&D 1
L&D 15L&D 14
L&D 5A
State Lines
%U River MilesS Cities%[ Locks and Dams
0 25 50 75 100 Miles
Aquatic LifeContact RecreationDrinking Water
N
#
Part 1 of 2Major Designated Uses
Upper Mississippi River
Prepared by the UMRBAJanuary 2004
Reaches are labeled to identify the major designated uses as used by the states for their 2002 305(b) water quality assessments, with the exception of Wisconsin for which themap reflects the designated uses in the 1996 305(b) report
Map 2
22

%U
%U
%U
%U
%U
S
S
S
S
#
#
%[
%[
%[
%[
%[
%[
%[
%[
%[
0
100
200
300
400
Cairo
Keokuk
St. Louis
Cape Girardeau
Missouri River
KaskaskiaRiver
OhioRiver
IllinoisRiver
Missouri
Illinois
Lock 27
L&D 19
L&D 20
L&D 21
L&D 22
L&D 24
L&D 25L&D 26
Prepared by the UMRBAJanuary 2004
Reaches are labeled to identify the major designated uses as used by the states for their 2002 305(b) water quality assessments, with the exception of Wisconsin for which the map reflects the designated uses in the 1996 305(b) report.
Map 2
Part 2 of 2Major Designated Uses
Upper Mississippi River
23
State Lines
%U River MilesS Cities%[ Locks and Dams
0 25 50 75 100 Miles
Aquatic LifeContact RecreationDrinking Water
N
#

Table 6 Major Designated Uses on the UMR
Aquatic
Life Contact
Recreation Drinking
Water Illinois Entire UMR X X X
Minnesota Border – Iowa River X X Davenport water intake X
Iowa River to Skunk River X X Burlington water intake X
Skunk River to Missouri Border X X Fort Madison water intake X
Iowa
Keokuk water intake X Minnesota Entire UMR X X
Iowa border to Missouri River X X X Missouri Missouri River to Ohio River X X
Wisconsin Entire UMR X X STATE 305(b) ASSESSMENT PROCEDURES EPA encourages states to assess as many waterbodies as resources permit when preparing their 305(b) reports. EPA guidelines issued in 1997 suggest that states organize their 305(b) assessments under a standardized set of designated use categories. These categories include aquatic life, swimming (also referred to as primary contact recreation), secondary contact, drinking water, fish consumption, and shellfishing. States are not required to assess each waterbody or reach for all designated uses, and many states have established their own designated use categories. States assess their water quality in terms of the degree to which each of the designated uses of those waters is attained or supported. EPA’s 2002 guidance on integrated water quality monitoring and assessment encourages states to use the following five use support categories: attaining water quality standards with no use threatened;
attaining some designated uses, no use threatened but insufficient data is available to determine a threatened attainment status;
insufficient data to determine if any designated use is attained;
impaired or threatened for one or more designated use but no TMDL required; and
water quality standards not attained, assessment units impaired or threatened with a TMDL required.
However, none of the five UMR states employs EPA’s recommended categories in their entirety, nor do the states all use a common alternative set. However, there is enough consistency in their approach that their use support categories can be translated into a common set of categories. Therefore, for this report, the following five general categories are employed: full support; full support, but threatened; partial support; non-support; and not assessed.
Fully supporting reaches completely attain the designated use being assessed. Fully supporting but threatened reaches fully support the designated use, but there is a clear and imminent threat to the waters’ being able to maintain their current levels. Partially supporting reaches incompletely attain the designated use being assessed, whereas reaches with a not supporting
24
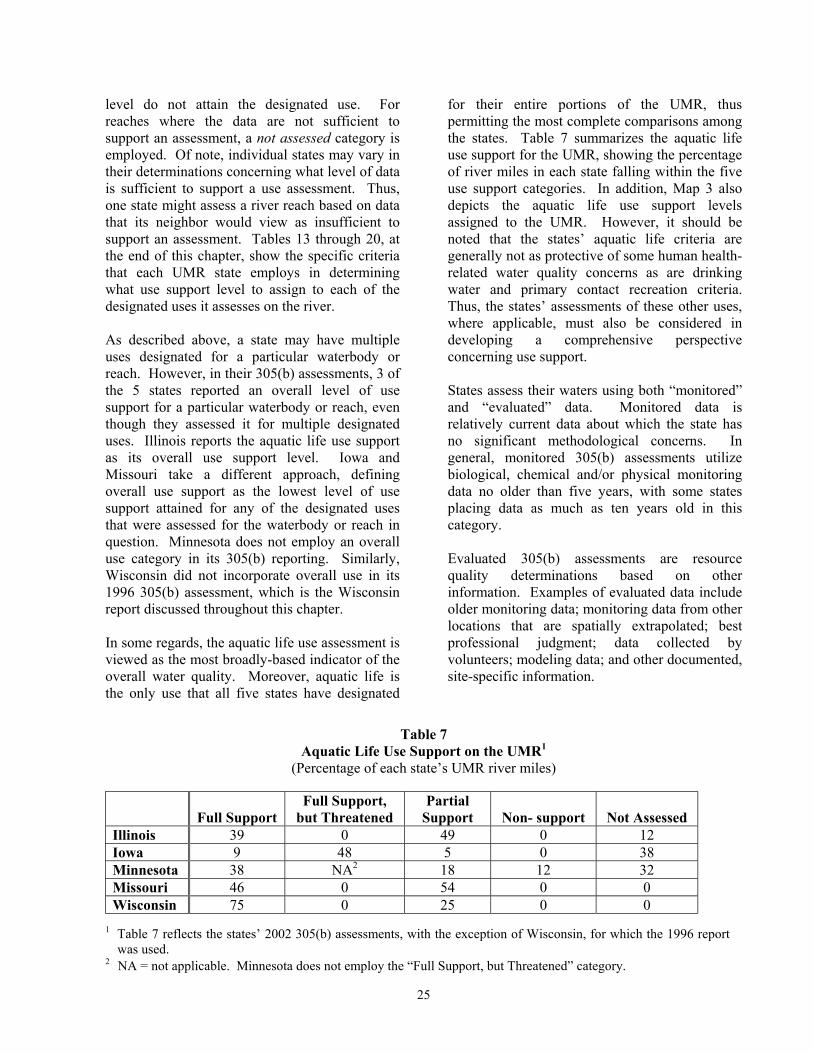
level do not attain the designated use. For reaches where the data are not sufficient to support an assessment, a not assessed category is employed. Of note, individual states may vary in their determinations concerning what level of data is sufficient to support a use assessment. Thus, one state might assess a river reach based on data that its neighbor would view as insufficient to support an assessment. Tables 13 through 20, at the end of this chapter, show the specific criteria that each UMR state employs in determining what use support level to assign to each of the designated uses it assesses on the river. As described above, a state may have multiple uses designated for a particular waterbody or reach. However, in their 305(b) assessments, 3 of the 5 states reported an overall level of use support for a particular waterbody or reach, even though they assessed it for multiple designated uses. Illinois reports the aquatic life use support as its overall use support level. Iowa and Missouri take a different approach, defining overall use support as the lowest level of use support attained for any of the designated uses that were assessed for the waterbody or reach in question. Minnesota does not employ an overall use category in its 305(b) reporting. Similarly, Wisconsin did not incorporate overall use in its 1996 305(b) assessment, which is the Wisconsin report discussed throughout this chapter. In some regards, the aquatic life use assessment is viewed as the most broadly-based indicator of the overall water quality. Moreover, aquatic life is the only use that all five states have designated
for their entire portions of the UMR, thus permitting the most complete comparisons among the states. Table 7 summarizes the aquatic life use support for the UMR, showing the percentage of river miles in each state falling within the five use support categories. In addition, Map 3 also depicts the aquatic life use support levels assigned to the UMR. However, it should be noted that the states’ aquatic life criteria are generally not as protective of some human health-related water quality concerns as are drinking water and primary contact recreation criteria. Thus, the states’ assessments of these other uses, where applicable, must also be considered in developing a comprehensive perspective concerning use support. States assess their waters using both “monitored” and “evaluated” data. Monitored data is relatively current data about which the state has no significant methodological concerns. In general, monitored 305(b) assessments utilize biological, chemical and/or physical monitoring data no older than five years, with some states placing data as much as ten years old in this category. Evaluated 305(b) assessments are resource quality determinations based on other information. Examples of evaluated data include older monitoring data; monitoring data from other locations that are spatially extrapolated; best professional judgment; data collected by volunteers; modeling data; and other documented, site-specific information.
Table 7 Aquatic Life Use Support on the UMR1
(Percentage of each state’s UMR river miles)
Full Support Full Support,
but Threatened Partial
Support
Non- support
Not Assessed Illinois 39 0 49 0 12 Iowa 9 48 5 0 38 Minnesota 38 NA2 18 12 32 Missouri 46 0 54 0 0 Wisconsin 75 0 25 0 0
1 Table 7 reflects the states’ 2002 305(b) assessments, with the exception of Wisconsin, for which the 1996 report
was used. 2 NA = not applicable. Minnesota does not employ the “Full Support, but Threatened” category.
25

Prepared by the UMRBAJanuary 2004
Upper Mississippi RiverAquatic Life Use Support Levels
Map 3
Part 1 of 2
Reaches coded to identify state decisions for the 2002 305(b) water quality assessement use support levels, with the exception of Wisconsin for which the map reflects the 1996 305(b) report.
Minnesota Reach SectionsState Lines
N
0 25 50 75 100 Miles
Partially-SupportedNot SupportedNot Assessed
Fully-Supported/ThreatenedFully-Supported
%U River MilesS Cities%[ Locks and Dams
%U
%U
%U
%U
%U
S S
S
S
S
S
%[
%[
%[
%[
%[
%[
%[
%[
%[
%[
%[
%[
%[
%[
%[%[
%[
%[
%[
%[
%[%[%[
%[
Keokuk
Dubuque
St. Paul
La Crosse
Davenport
Minneapolis
400
500
600
700
800
St. Croix River
Minnesota River
Wisconsin River
Rock River
Des MoinesRiver
Minnesota Wisconsin
Iowa
Illinois
L&D 3
L&D 4
L&D 5
L&D 7
L&D 6
L&D 8
L&D 9
L&D 16
L&D 18
L&D 19
L&D 20
L&D 10
L&D 11
L&D 12
L&D 13
L&D 17
L&D 2
L&D 1
L&D 5A
L&D 14L&D 15
26

%U
%U
%U
%U
%U
S
S
S
S
%[
%[
%[
%[
%[
%[
%[
%[
Cairo
Keokuk
St. Louis
Cape Girardeau
0
100
200
300
400
Illinois River
Missouri River
Ohio River
MissouriIllinois
r
Kaskaskia River
Lock 27
L&D 19
L&D 20
L&D 21
L&D 22
L&D 24
L&D 25L&D 26
%U River MilesS Cities%[ Locks and Dams
Fully-SupportedFully-Supported/Threatened
Not AssessedNot SupportedPartially-Supported
0 25 50 75 100 Miles
N
State Lines
Chain of Rocks Canal, at Lock 27, is assessedseparately and was determined to be partiallysupporting aquatic life. Prepared by the UMRBA
January 2004
r
27
Reaches coded to identify state decisions for the 2002 305(b) water quality assessement use support levels, with the exception of Wisconsin for which the map reflects the 1996 305(b) report.
Upper Mississippi RiverAquatic Life Use Support Levels
Map 3
Part 2 of 2

UMR WATER QUALITY ASSESSMENTS The following sections summarize the five Upper Mississippi River states’ 305(b) water quality assessment reports for the 2002 reporting cycle, with the exception of Wisconsin, for which the 1996 assessment is discussed. Illinois Illinois employs several beneficial use categories, some of which apply to nearly all waters of the state, including the Upper Mississippi River, and some of which are waterbody-specific. The designated uses that apply to the UMR and most other waterbodies include public water supply and 6 other uses grouped together as “General Use.” The “General Use” category, as reflected in Illinois’ water quality standards, is designed to protect for aquatic life, wildlife, agricultural, primary contact, secondary contact, and industrial uses. Thus, in effect, there are 7 designated uses assigned to the Upper Mississippi River in Illinois. In general, the uses assessed for Section 305(b) purposes by the Illinois Environmental Protection Agency include aquatic life, primary contact, secondary contact, public water supply, fish consumption (though this is not a separate designated use category under Illinois’ water quality standards), and indigenous aquatic life. However, the indigenous aquatic life use is only assigned to Lake Calumet and about 80 miles of canals and streams in northeastern Illinois. In addition, the secondary contact use is only assessed for lakes. Thus, only 4 of these uses (i.e., aquatic life, primary contact, public water supply, and fish consumption) are assessed on the UMR for the state’s Section 305(b) report. Also of note, Illinois applies its drinking water standards to the points of intake for existing water supplies. There are 12 public water supplies on the UMR in Illinois, serving the communities of East Moline, Moline, Rock Island Arsenal, Rock Island, Nauvoo, Hamilton, Warsaw, Quincy, Alton, Granite City, East St. Louis, and Chester. In its 2002 305(b) report, Illinois EPA assessed 4 reaches of the UMR for public water supply. These 4 reaches covered the intake points and areas immediately upstream of 9 of Illinois’ 12 public supplies.
In assessing the aquatic life use for wadeable streams, the state relies more heavily on biological than chemical data, but does use both types of data. According to Illinois EPA’s 2002 305(b) report, the “emphasis on biological data (fish and macroinvertebrates) over chemical data provides a direct measure of aquatic community health, facilitates detection of cumulative impacts from multiple stressors, and provides a direct measurement of the Clean Water Act … ‘fishable’ goal.” However, due to the lack of bioindices available for use on large floodplain rivers, Illinois EPA relies on chemical data in assessing the Upper Mississippi River for the aquatic life use. The public water supply use is assessed solely based on ambient nitrate and atrazine data. While Illinois drinking water standards apply to the point of intake, Illinois EPA generally assesses areas 20 miles upstream of intakes in determining support for the drinking water use. Primary contact recreation is assessed using both fecal coliform bacteria and total suspended solids data. Fish consumption use is assessed by comparing waterbody-specific fish tissue contaminant data with the health protection values for various chemicals established under the Protocol for a Uniform Great Lakes Sport Fish Consumption Advisory. Illinois employs the following categories in assessing support for designated uses: full support; full support, but threatened; partial support; non-support; and not assessed. According to Illinois EPA’s 2002 305(b) report, aquatic life use results are “considered to be the most comprehensive reflection of overall resource quality.” In terms of aquatic life use on the 15 UMR assessment reaches, the five most northerly reaches of the UMR are assessed as fully supporting, as is the most southerly reach. Seven central and southern reaches are assessed as partially supporting, and two reaches in the southern third of Illinois were not assessed for aquatic life use support in the state’s 2002 305(b) report. Water quality concerns on the partially supported reaches are associated with a range of factors, including priority organics, metals, nutrients, siltation, organic enrichment, habitat alteration, and suspended solids. The results of Illinois EPA’s 2002 305(b) assessment of the Upper Mississippi River are summarized in Table 8.
28

Table 8 Use Support on the UMR in Illinois1
(Percentage of Illinois’ 698 UMR river miles)
Designated Use Full
Support Full Support,
but Threatened Partial
Support
Non-support
Not Assessed Aquatic Life 39 0 49 0 12 Drinking Water2 29 0 0 0 71 Primary Contact 18 0 12 0 70 Secondary Contact 0 0 0 0 100 Fish Consumption 0 0 100 0 0
1 For several UMR reaches, Illinois’ 2002 305(b) report does not have a use support entry for each designated use.
According to Illinois EPA staff, lack of an entry indicates that the use was not assessed for the reach in question. This interpretation is reflected in this table.
2 As with all of Illinois’ other designated uses, the drinking water use support figures were calculated based on the full
698 miles of the UMR in the state. However, while the entire UMR is designated for drinking water in Illinois, the state only applies its drinking water standards to the 12 existing intake points and only assesses specific areas upstream of the intakes for drinking water support. Thus, while Illinois assessed just 4 reaches totaling 29 percent of its UMR miles for drinking water support, these reaches covered the areas upstream of 9 of the state’s 12 public water supplies on the river.
Iowa Iowa assigns one or more of the following three uses to selected designated use waters: aquatic life, drinking water, and primary contact recreation. In addition, Iowa has a general use category designed to protect all surface waters for a variety of other potential uses, including livestock and wildlife watering; noncontact recreation; irrigation; and industrial, agricultural, domestic, and other incidental water withdrawal uses. As part of its antidegradation policy, selected waters may also be designated as high quality or high quality resource to further protect their special characteristics. Iowa further divides the aquatic life use into the following subcategories: significant resource warmwater, limited resource warmwater, cold water aquatic life, and lakes and wetlands. The state applies the aquatic life (significant resource warmwater) and primary contact recreation uses to the entire Upper Mississippi River within its borders. In addition, four points on the UMR are designated for drinking water use. These correspond to intakes serving the communities of Davenport, Burlington, Fort Madison, and Keokuk. Reaches immediately above these intakes may be assessed for the drinking water use. Iowa DNR also assesses the UMR for fish consumption as part of its aquatic life use.
Statewide, the Iowa Department of Natural Resources assesses aquatic life use support for purposes of Section 305(b), based on stream biological monitoring and ambient chemical water quality monitoring, in addition to fish kill reports. However, in assessing the Upper Mississippi River for aquatic life, the state relies almost entirely upon ambient chemical monitoring and does not use biological data. Data on toxics and nitrate are employed in determining use support for drinking water, while primary contact recreation is evaluated using fecal coliform data. Support for fish consumption is determined based on fish tissue data and consumption advisories issued by Iowa DNR’s Fisheries Bureau. In assessing its waters for Section 305(b) purposes, Iowa recognizes the following levels of use support: full support; full support, but threatened; partial support; non-support; and not assessed. Of Iowa’s 14 assessment reaches on the UMR, the six most northern reaches are described in Iowa DNR’s 2002 305(b) report as fully supporting, but threatened, due to concern with the aquatic life use. This assessment is based in part on low dissolved oxygen levels, potentially associated with instances of high zebra mussel populations. The next reach, south of Lock and Dam 13, is the only partially supported reach on
29

Table 9 Use Support on the UMR in Iowa
(Percentage of Iowa’s 313 UMR river miles)1
Designated Use Full
Support Full Support, but
Threatened Partial
Support
Non-support
Not Assessed Aquatic Life 9 48 5 0 38
Drinking Water1 0 0 0 37 63 Primary Contact 6 0 0 0 94
Fish Consumption 61 0 0 0 39 1 The drinking water use support figures were calculated for the 77 miles of the UMR in Iowa that are subject to
assessment for public water supply. These reaches are associated with the 4 points of water withdrawal that are designated as a source of public water supply. All other use support figures were calculated for the entire length of the UMR in Iowa. Iowa DNR staff provided several clarifications to the state’s 2002 305(b) report and this table reflects those modifications.
Iowa’s stretch of the UMR. This assessment is also based on aquatic life limitations, in this instance associated with a point source discharge that appears to promote the growth of slime. North of Lock and Dam 14 and south of Locks and Dams 15 and 18 are three fully supported reaches. Two of the reaches assessed for drinking water use, in the Davenport and Keokuk areas, are both reported as not supporting, due to arsenic levels. There are two reaches that Iowa DNR did not assess for any designated uses, due to lack of data. In addition, most of the UMR in Iowa was not assessed for primary contact recreation, due to lack of fecal coliform data. Table 9 provides more detail on the use support levels Iowa DNR assigned to its designated uses on the UMR. Minnesota Minnesota recognizes the following seven designated use categories: aquatic life and recreation, drinking water, industrial use and cooling, agricultural use, aesthetics and navigation, other uses, and limited resource value waters. Minnesota’s aquatic life and recreation use is further divided into the following subclasses: cold water fisheries and trout waters; cool and warm water fisheries (also protected as a source of drinking water); cool and warm water fisheries (not protected for drinking water); indigenous fish and associated aquatic community; and wetlands. The recreation
component of the aquatic life and recreation use covers primary contact. Also of note, Minnesota subdivides its agricultural use designation between irrigation and livestock and wildlife watering. The entire interstate portion of the UMR in Minnesota is designated for aquatic life and recreation (cool and warm water fisheries, not protected for drinking water), industrial use and cooling, agricultural use, aesthetics and navigation, and other uses. While Minnesota designates the interstate UMR for five uses, only the aquatic life (cool and warm water fisheries) and recreation (swimming) use is assessed on the river. The Minnesota Pollution Control Agency (PCA) reports its assessment of aquatic life separately from its assessment of recreation, even though the two are elements of the same designated use in Minnesota. Support for aquatic life is determined primarily based on conventional and toxic pollutant monitoring data. In addition, the state has made increased use of biological monitoring on smaller rivers and streams in recent years, but has not yet developed an index of biological integrity (IBI) for the interstate UMR. Minnesota PCA relies on fecal coliform data in assessing support for recreation. Interagency professional judgment teams for each of Minnesota’s major basins advise Minnesota PCA on how best to use available data in making its 305(b) assessments and 303(d) impairment decisions.
30

Table 10
Use Support on the Interstate UMR in Minnesota1 (Percentage of Minnesota’s 139 UMR river miles)
Designated Use2 Full Support Partial Support Non-support Not Assessed Aquatic Life 38 18 12 32 Recreation (Swimming)3 16 4 0 80
1 Several UMR assessment reaches were omitted from Minnesota’s 2002 report. Minnesota PCA staff advised that
these reaches were not assessed. This table reflects that interpretation, as well as other clarifications offered by agency staff. Also note that this table does not include 305(b) assessment results on the intrastate portion of the UMR in Minnesota, upstream of the confluence with the St. Croix River.
2 Aquatic life and recreation is a single designated use in Minnesota. However, in its 2002 305(b) report, Minnesota PCA identifies use support levels separately for aquatic life and swimming. The state does not assess its other four designated uses on the UMR.
3 Minnesota PCA also evaluates the Lake Pepin portion of the UMR for swimming as part of its lake assessment program. In assessing lakes for swimming, the agency focuses on nutrient-driven eutrophication problems, as indicated by phosphorous and chlorophyll-a levels and transparency. Lake Pepin is listed as not supporting swimming in the lakes section of Minnesota PCA’s 2002 report. The three river reaches corresponding to Lake Pepin were not assessed for swimming use (i.e., fecal coliform) as part of the agency’s rivers and streams assessment.
Minnesota employs the following levels of use support in assessing its waters: full support, partial support, non-support, and not assessed. As is reflected in Map 3, there is not a strong spatial pattern to the aquatic life use support levels on the UMR in Minnesota PCA’s 2002 305(b) report. The longest stretch of fully supporting reaches is less than 30 miles in length, extending from the lower portion of Lake Pepin to the Zumbro River. Factors reported as causing partial and non-support of aquatic life include turbidity and ammonia. Approximately one-third of the interstate Upper Mississippi River in Minnesota was not assessed for aquatic life use support. Table 10 summarizes the results of Minnesota PCA’s 2002 305(b) assessment for the interstate portion of the UMR. Missouri Missouri employs the following categories in designating uses for its waters: aquatic life (includes fish consumption), drinking water, whole body contact recreation (i.e., primary contact), industrial use, boating, irrigation, and livestock and wildlife watering, The aquatic life use is further subdivided as follows: warm water
fishery, cool water fishery, and cold water fishery. While fish consumption is part of the aquatic life designation, it is generally assessed and reported on separately. The entire UMR in Missouri is designated for aquatic life (warm water fishery), drinking water, industrial use, boating, and livestock and wildlife watering. In addition, the reach between the Missouri and Ohio Rivers is designated for irrigation and the reach between the Iowa border and the Missouri River is designated for whole body contact recreation. Missouri is the only state that does not designate its entire stretch of the UMR for primary contact recreation. The Missouri Department of Natural Resources bases its aquatic life use assessments, for purposes of Section 305(b), on conventional and toxic pollutant monitoring data, biological data, and toxicity testing. Missouri is in the initial stages of an effort to establish biological indicators for the Mississippi and Missouri Rivers, but has not yet developed biocriteria for its big rivers. The agency uses a range of physical indicators and chemical data, including data on nutrients, toxics, iron, manganese, and total dissolved solids, to assess support of the
31

Table 11 Use Support on the UMR in Missouri
(Percentage of Missouri’s 366 UMR river miles)1
Designated Use Full
Support Full Support,
but Threatened Partial
Support
Non-support
Not Assessed Aquatic Life 46 0 54 0 0 Drinking Water 100 0 0 0 0 Whole Body Contact 100 0 0 0 0 Fish Consumption 46 54 0 0 0 Boating 100 0 0 0 0 Industrial Use 100 0 0 0 0 Irrigation 100 0 0 0 0 Livestock and Wildlife Watering
100 0 0 0 0
1 The whole body contact use support figures were calculated for the 166 miles of the UMR in Missouri that are
designated for whole body contact. The irrigation support figures were calculated for the 195 miles of the UMR that Missouri designated for irrigation. All other use support figures were calculated for the entire length of the UMR in Missouri. The table does not reflect Missouri’s 305(b) assessment of the Lower Mississippi River between the Ohio River and the Arkansas state line.
drinking water use. Support for whole body contact recreation is determined based on fecal coliform data. Support for fish consumption is based on fish tissue contamination data, as well as water and sediment data. The irrigation and livestock and wildlife watering uses are assessed based on boron and cobalt levels. Missouri does not have numeric criteria for its boating and industrial use designations. Missouri DNR’s levels of use support for Section 305(b) purposes are as follows: full support; full support, but threatened; partial support; non-support; and not assessed. In its 2002 305(b) report, Missouri DNR assesses its northern reach of the UMR as fully supporting all designated uses. The southern reach of the UMR is assessed as partially supporting aquatic life, and fish consumption is fully supported but threatened on this reach. Table 11 summarizes the state’s 2002 305(b) assessment of the Upper Mississippi River. Wisconsin According to Wisconsin’s 2002 305(b) assessment, the state recognizes the following designated uses: fish and other aquatic life, recreational use, public health and welfare,
wildlife, Outstanding Resource Waters, and Exceptional Resource Waters. All surface waters in the state are designated for some level of fish and aquatic life as well as for public health and welfare, and wildlife. Waterbodies that serve as a drinking water source receive a special designation under public health and welfare. Wisconsin divides the fish and aquatic life use into the following categories: cold water communities, warm water sport fish, warm water forage fish, limited forage fish, and limited aquatic life. The Wisconsin Department of Natural Resources’ 2002 Section 305(b) assessment does not identify the Upper Mississippi River’s designated uses or levels of use support. Thus, for the purpose of this report, we have used Wisconsin’s 1996 305(b) assessment, the most recent year for which there is specific information on the UMR. The 1996 report showed the entire length of the river in Wisconsin as designated for aquatic life, swimming, fish consumption, and general use (i.e., agriculture, wildlife, industrial use, etc.).4 4 Although boating is also designated on the UMR in
Wisconsin’s 1996 305(b) report, according to Wisconsin DNR staff this designation was inaccurate and should not have been included in the state’s report.
32

Table 12 Use Support on the UMR in Wisconsin1
(Percentage of Wisconsin’s 230 UMR river miles)
Designated Use Full
Support Full Support,
but Threatened Partial
Support2 Non-support Not Assessed Aquatic Life 75 0 25 (MOD) 0 0
Swimming 0 0 75 (MIN) 25 (MOD) 0 0
Fish Consumption 0 53 22 (MIN) 25 (MOD) 0 0
General Use 0 0 100 (MIN) 0 0 1 This table is based on Wisconsin DNR’s 1996 305(b) report, the most recent assessment that identifies specific use
support levels on the UMR. 2 MIN = minor impairment. MOD = moderate impairment. The agency employed the following levels of use support: full support; full support, but threatened; partial support; non-support; and not assessed. Within the partial support category, Wisconsin DNR further indicated whether the degree of impairment was minor or moderate. In 1996, the most northerly of Wisconsin’s three UMR assessment reaches was reported as partially supporting aquatic life use, with moderate impairment attributed to fish kills and low flow. The remaining two downstream reaches were assessed as fully supporting aquatic life use. Factors affecting the state’s 305(b) assessment of the river for other uses included PCBs, fish consumption advisories, bacteria, algae, and mercury. Table 12 summarizes the 1996 report’s assessments for all designated uses on the UMR. SUMMARY AND CONCLUSIONS Designated Uses There is quite a bit of commonality among the five Upper Mississippi River states in terms of the uses they have designated for the river. Moreover, the differences that do exist are perhaps not as significant as they may first appear. Of note, all five states designate the UMR for aquatic life. In addition, all of the UMR, except for the portion in Missouri between the Missouri and Ohio Rivers, is designated for primary contact recreation. Missouri attributes its decision not to designate this lower portion of the
UMR for primary contact to high levels of boat traffic and dangerous currents. The greatest apparent inconsistency among the states is perhaps with regard to drinking water use designations. Illinois and Missouri both designate their entire lengths of UMR for public water supply, though Illinois limits its drinking water assessments to areas approximately 20 miles upstream of existing intakes and applies its standards to the point of intake. In contrast, Iowa designates only those portions of the UMR where there is an existing public intake. However, like Illinois, Iowa assesses areas upstream of its intakes in determining support for the drinking water use. Minnesota and Wisconsin do not have any existing public water supplies on the interstate UMR, and do not designate any portion of the interstate river for drinking water. However, personnel from Minnesota and Wisconsin both note that lack of a current drinking water designation does not necessarily preclude designating a waterbody for drinking water use in the future. Criteria for Determining Use Support The states employ a variety of criteria in determining the degree of support for various designated uses. These criteria are generally developed by the states for statewide application, though some are designed for specific waterbodies and types of waterbodies. With
33

regard to use support criteria, important distinctions among the states include differences in the relevant water quality criteria, what constitutes a violation of those criteria, and the role of professional judgment. The states are probably most similar in their approach to determining use support for primary contact recreation. All five currently base their primary contact assessments on fecal coliform levels, and generally reflect the federal standard of 200 organisms/100 ml. However, the states have different triggers for the number of samples and the levels of exceedance associated with different levels of use support. Moreover, differences in statistical guidelines, data standards, applicability during storm events, and approaches to using best professional judgment also influence the states’ assessments of primary contact recreation. The distinctions among the states are perhaps greater when it comes to assessing other uses. For example, in assessing for aquatic life, Illinois, Iowa, Minnesota, and Missouri all have specific thresholds for chronic exceedances of the state’s standards for conventional pollutants and toxics. In contrast, Wisconsin relies on best professional judgment in assessing fish, water, and sediment contaminant data. In their 2002 305(b) reports, Minnesota and Missouri both describe ongoing efforts to establish bioindicators for large rivers, including the UMR. However, none of the five states actively used bioindicators in its most recent 305(b) UMR assessment. U.S. EPA supports the incorporation of bioindicators into state water quality standards. Through its Environmental Monitoring and Assessment Program (EMAP), U.S. EPA is supporting efforts to identify bioindicators and other measures of ecological health for Great Rivers. In assessing drinking water, Illinois considers nitrate and atrazine, while Iowa examines various toxics as well as nitrate. Missouri looks at a range of drinking water indicators, including nitrate, toxics, iron, manganese, and total dissolved solids.
Also of note is the variability among the states in the use of the “fully supporting but threatened” category. Minnesota no longer uses this category, citing concern that placing a waterbody in this category engenders an expectation that the waterbody would be placed on the state’s 303(d) impaired waters list. Minnesota PCA staff have said this category was useful for identifying potentially declining waterbodies, but that the unintended linkage to 303(d) undermined its utility. While Illinois and Missouri officially retain the fully supporting but threatened category, a review of their most recent 305(b) reports suggests that they are not actively using the category. State agency staff confirm that this is the case, and cite similar concerns to those expressed by Minnesota. Iowa is the only UMR state to have used the fully supporting but threatened category in its most recent 305(b) assessment of the river. This category is not included in EPA’s 2001 guidance on integrating 305(b) assessments and 303(d) impaired waters lists. Comparing State Assessments Drawing comparisons among the states’ 305(b) assessments of the UMR can be difficult due to differences in their designated uses for the river; the assessment reaches they use; and more significantly, their criteria for determining use support. In terms of the percentage of their UMR miles assessed as fully supporting the aquatic life use category, the states range from a low of 9 percent (Iowa) to a high of 75 percent (Wisconsin). In their Section 305(b) reports, only Iowa and Minnesota report any portion of the UMR as not supporting one of its designated uses. In the case of Iowa, the non-support is associated with arsenic levels on two reaches of the river that are designated for drinking water use. Of note, the raw water from the UMR in these areas meets the maximum contaminant level established under the Safe Drinking Water Act for finished water, but violates Iowa’s more stringent CWA standard for water that is used as a public water supply. Minnesota’s 305(b) report identifies 6 reaches of the UMR as not supporting aquatic life. The
34

Minnesota PCA cited turbidity, ammonia, and fecal coliform as factors in these assessments. Also of note, Wisconsin is the only state to assess more than 50 percent of its UMR river miles as fully supporting aquatic life. However, as described earlier, Wisconsin’s UMR assessment is from its 1996 305(b) report and relied heavily on best professional judgment. Among the states reporting specific figures in 2002, the percentage of the UMR fully supporting aquatic life ranged from 9 percent in Iowa to 46 percent in Missouri. Illinois and Missouri, the only states other than Iowa to designate the UMR for drinking water, report all of their portions of the river as either fully supporting or not assessed for drinking water. Non-Assessment Substantial portions of the Upper Mississippi River were not assessed for all designated uses. Missouri and Wisconsin are the only states that reported having assessed their entire length of the
UMR for all of the uses they had designated for the river. Even in those two states, the lack of relevant monitoring data may limit the rigor and comprehensiveness of those assessments for some uses. Among the other states, the percentage of UMR miles that were not assessed for aquatic life ranged from a low of 12 percent in Illinois to a high of 38 percent in Iowa. Illinois assessed the areas upstream of 9 of its 12 public water supplies for drinking water support, while Iowa assessed the areas upstream of 2 of its 4 public water supplies. Primary contact recreation appears to be the least completely assessed major use on the UMR. Seventy percent of the UMR in Illinois was not assessed for primary contact. The comparable figures in Minnesota and Iowa were 80 percent and 94 percent. According to state 305(b) reports and agency staff, the failure to fully assess the entire river for all designated uses is directly attributable to insufficient data. The unassessed and incompletely assessed portions of the UMR are another factor limiting comparability of the states’ 305(b) river assessments.
35

Table 13
Aquatic Life: Criteria for Determining Degree of Use Support
(Includes only those states that assess this use on the UMR)
Full Full/Threatened Partial Not Supported
Illinois
Conventional pollutants: <10% of samples exceed standards Toxic pollutants: <1 violation of acute standards; or <11% of samples exceed chronic standards and sample means do not exceed standards If <10 samples <5 years old: <1 violation for all pollutants; 0 violations of acute toxics
Conventional pollutants: 11-25% of samples exceed standards Toxic pollutants: 2 violations of acute standards; or >11% of samples exceed chronic standards and sample means do not exceed standards If <10 samples <5 years old: 2 violations for all pollutants; <1 violation of acute toxics
Conventional pollutants: >25% of samples exceed standards Toxic pollutants: >3 violations of acute standards; or >11% of samples exceed chronic standards and sample means exceed standards If <10 samples <5 years old: >3 violations for all pollutants; >2 violation of acute toxics
Iowa Conventional pollutants: <10% of samples exceed criteria Toxic pollutants: no violations of acute or chronic criteria in grab samples Fish kills: no pollutant-caused fish kills in most recent 3-year period
Toxic pollutants: <1 violation of acute or chronic criteria if grab samples are collected at least quarterly
Conventional pollutants: 11-25% of samples exceed criteria
Fish kills: 1 pollutant-caused fish kill in most recent 3-year period
Conventional pollutants: >25% of samples exceed criteria Toxic pollutants: >1 violation of acute or chronic criteria if grab samples are collected at least quarterly Fish kills: >1 pollutant-caused fish kill in most recent 3-year period
Minnesota
Conventional pollutants: <10% of samples exceed chronic standard Toxic pollutants: <1 sample in 3 years or <2.8% of samples exceed chronic standard, and no samples in 3 years exceed maximum standard
Not applicable Conventional pollutants: 10-25% of samples exceed chronic standard
Conventional pollutants: >25% of samples exceed chronic standard Toxic pollutants: >2 samples in 3 years or >2.8% of samples exceed chronic standard; or 1 exceedance of the maximum standard in 3 years
Missouri
Toxic pollutants: <1 exceedance of acute criterion in 3 years; <10% of all samples exceed chronic criterion Conventional pollutants: <10% of all samples exceed criterion Toxicity testing: No statistically significant deviation from controls in chronic test endpoints in at least two representative species
Toxic pollutants: >1 exceedance of acute criterion in 3 years; <10% of all samples exceed chronic criterion Conventional pollutants: 10-25% of all samples exceed criterion
Toxic pollutants: >10% of all samples exceed chronic criterion Conventional pollutants: >25% of all samples exceed criterion Toxicity testing: Statistically significant mortality in at least one of two representative test species
Wisconsin Best Professional Judgment: Considerations include fish, water, and sediment contaminant data.
36
Not applicable = state does not employ category in assessing support for this use.

Table 14 Public Water Supply/Drinking Water:
Criteria for Determining Degree of Use Support (Includes only those states that assess this use on the UMR)
Full Full/Threatened Partial Not Supported
Illinois
Raw Water Nitrate: <20% of samples >10.0 ppm and mean level is <5.0 ppm Atrazine: <20% of samples >3.0 ppb and mean level is <1.5 ppb
Raw Water Nitrate: >20% of samples >10.0 ppm and mean level is >5.0 ppm Atrazine: >20% of samples >3.0 ppb and mean level is >1.5 ppb
Closure to use as a drinking water resource – cannot be treated to allow for use
Iowa Raw Water Toxics: All levels of toxic metals or pesticides are < HHC or MCLs Nitrate: All levels of nitrate are < MCL
Finished Water No drinking water supply closures or advisories in effect; water not treated beyond reasonable levels
Raw Water Toxics: Average levels of toxic metals or pesticides < HHC or MCLs, but one or more samples > MCL Nitrate: <15% of samples violate the MCL; or trend analysis shows a significant increase in contaminant levels
Finished Water Some drinking water use restrictions have occurred and/or the potential for adverse impacts to source water quality exists
Raw Water Toxics: not applicable Nitrate: 15-25% of samples violate the MCL in the current or previous biennial reporting period
Finished Water 1 drinking water advisory lasting <30 days per year, or other problems not requiring closure but affecting treatment costs
Raw Water Toxics: Average level of toxic metals or pesticides > MCLs Nitrate: >25% of samples exceed the MCL in the current or previous biennial reporting period
Finished Water >1 drinking water supply advisory lasting >30 days per year, or >1 drinking water supply closure per year
Missouri
Raw Water Toxics: Mean values do not exceed water quality criteria or MCLs Nutrients: Low levels of nutrients, no history of taste or odor problems due to algae Iron, manganese, & total dissolved solids: Mean values do not exceed water quality criteria
Finished Water Toxics: No MCLs or water quality criteria exceeded or significant taste and odor problems using only conventional treatment (sedimentation-disinfection)
Raw Water Toxics: Chemical use patterns in watershed are similar to watersheds with non-attainment Nutrients: No taste and odor problems known, but nutrient or algae levels similar to waterbodies with taste and odor problems Iron, manganese, & total dissolved solids: Mean values do not exceed water quality criteria, but time trends suggest mean may be exceeded in future
Finished Water Toxics: Chemical use patterns in watershed are similar to watersheds not in full attainment
Raw Water Toxics: Additional treatment needed to meet MCLs or water quality criteria Nutrients: Supply has infrequent taste and odor problems
Raw Water Toxics: One or more contaminants have mean values in excess of water quality criteria or MCLs Nutrients: Frequent taste and odor problems, or supply causes infrequent gastrointestinal problems in users Iron, manganese, & total dissolved solids: Mean values exceed water quality criteria
Finished Water Toxics: At least one contaminant has annual average exceeding MCL or water quality criterion, or supply has been closed during the past 2 years due to contamination of raw water entering the plant
37
HHC = human health criteria ppb = parts per billion MCL = maximum contaminant level ppm = parts per million Not applicable = state does not employ category for this contaminant and use.

Table 15
Primary Contact Recreation/Whole Body Contact Recreation/Swimming: Criteria for Determining Degree of Use Support
(Includes only those states that assess this use on the UMR) Full Full/Threatened Partial Not Supported
Illinois
Geometric mean of all samples <200 orgs/100 ml, and <10% of all samples >400 orgs/100 ml when TSS concentration for that station is <50th percentile
Geometric mean of all samples >200 orgs/100 ml, or >10% & <25% of all samples >400 orgs/ 100 ml when TSS concentration for that station is <50th percentile
Geometric mean of all samples >200 orgs/100 ml, or >25% of all samples >400 orgs/100 ml when TSS concentration for that station is <50th percentile
Iowa Geometric mean of samples <200 orgs/100 ml and <10% of samples >400 orgs/100 ml No swimming area closures in effect during the biennial reporting period
Not applicable Geometric mean of samples <200 orgs/100 ml, but >10% of samples >400 orgs/100 ml. One swimming area closure of less than one week’s duration during the biennial reporting period
Geometric mean of samples >200 orgs/100 ml. More than one swimming area closure, or one swimming area closure of more than one week’s duration during the biennial reporting period
Minnesota
<10% of samples >200 orgs/100 ml; or >10% of samples >200 orgs/ 100 ml, but no months where monthly geometric mean >200 orgs/100 ml and <10% of samples from full data set over 10 years >2000 orgs/100 ml
Not applicable >10% of samples >200 orgs/100 ml and either 1-2 months where monthly geometric mean >200 orgs /100 ml or 10-25% of samples from full data set over 10 years >2000 orgs/100 ml
>10% of samples >200 orgs/100 ml and either >2 months where monthly geometric mean >200 orgs/ 100 ml or >25% of samples from full data set over 10 years >2000 orgs/100 ml
Missouri
Geometric mean for samples collected during the recreation season and at times not influenced by storm water flows <200 orgs/ 100 ml
Geometric mean of samples collected during the recreation season and at times not influenced by storm water flows >200 orgs/ 100 ml
Wisconsin Best Professional Judgment: Considerations include fecal coliform bacteria concentrations and presence of nonpoint source pollution.
38
Not applicable = state does not employ category in assessing support for this use. orgs/ml = number of fecal coliform organisms per milliliter of water TSS = total suspended solids
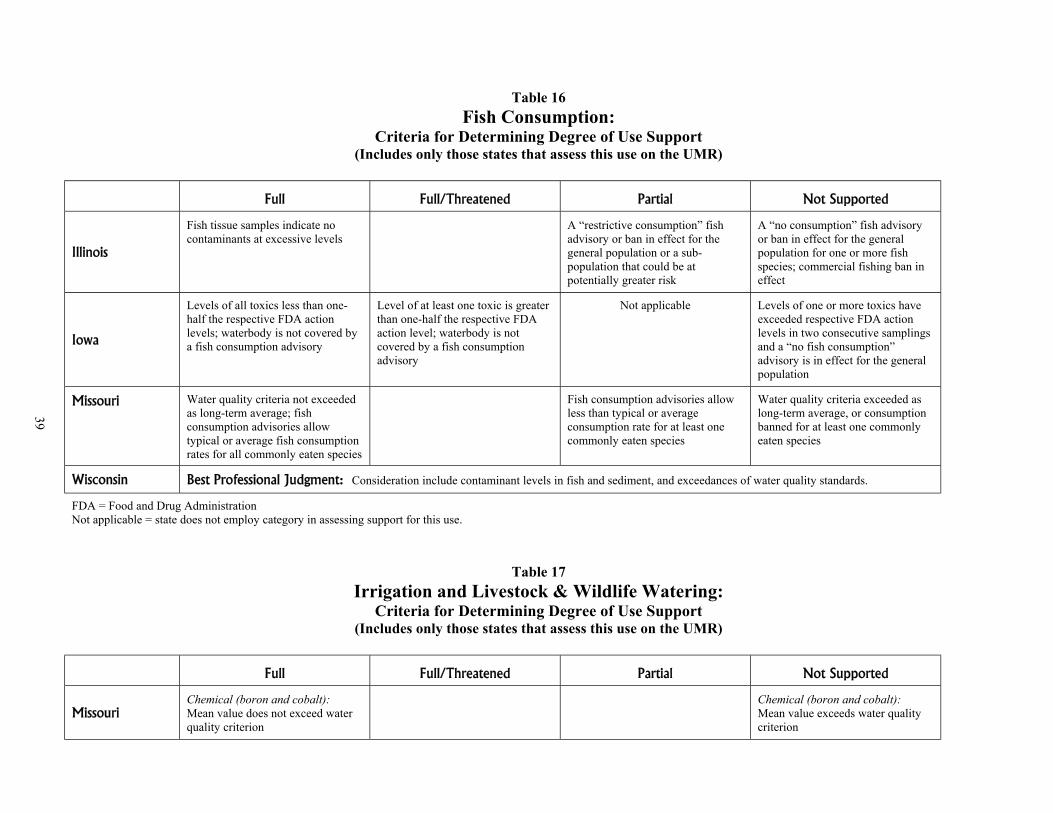
Table 16
Fish Consumption: Criteria for Determining Degree of Use Support
(Includes only those states that assess this use on the UMR) Full Full/Threatened Partial Not Supported
Illinois
Fish tissue samples indicate no contaminants at excessive levels
A “restrictive consumption” fish advisory or ban in effect for the general population or a sub-population that could be at potentially greater risk
A “no consumption” fish advisory or ban in effect for the general population for one or more fish species; commercial fishing ban in effect
Iowa
Levels of all toxics less than one-half the respective FDA action levels; waterbody is not covered by a fish consumption advisory
Level of at least one toxic is greater than one-half the respective FDA action level; waterbody is not covered by a fish consumption advisory
Not applicable Levels of one or more toxics have exceeded respective FDA action levels in two consecutive samplings and a “no fish consumption” advisory is in effect for the general population
Missouri Water quality criteria not exceeded as long-term average; fish consumption advisories allow typical or average fish consumption rates for all commonly eaten species
Fish consumption advisories allow less than typical or average consumption rate for at least one commonly eaten species
Water quality criteria exceeded as long-term average, or consumption banned for at least one commonly eaten species
Wisconsin Best Professional Judgment: Consideration include contaminant levels in fish and sediment, and exceedances of water quality standards.
FDA = Food and Drug Administration Not applicable = state does not employ category in assessing support for this use.
Table 17 Irrigation and Livestock & Wildlife Watering:
Criteria for Determining Degree of Use Support (Includes only those states that assess this use on the UMR)
Full Full/Threatened Partial Not Supported
Missouri Chemical (boron and cobalt): Mean value does not exceed water quality criterion
Chemical (boron and cobalt): Mean value exceeds water quality criterion
39

Table 18
Industrial: Criteria for Determining Degree of Use Support
(Includes only those states that assess this use on the UMR) Full Full/Threatened Partial Not Supported
Missouri Unknown
Table 19 Secondary Contact/Boating:
Criteria for Determining Degree of Use Support (Includes only those states that assess this use on the UMR)
Full Full/Threatened Partial Not Supported
Missouri Unknown
40
Table 20 General Use:
Criteria for Determining Degree of Use Support (Includes only those states that assess this use on the UMR)
Wisconsin Best Professional Judgment: Considerations include exceedance of water quality standards.

Chapter 5
303(d) Impaired Waters Lists
Section 303(d) of the Clean Water Act requires states to develop lists of impaired waters, assign a priority ranking to those waterbodies, and develop total maximum daily loads (TMDLs) for them. Impaired waters are those waterbodies that do not meet the water quality standards set for them by the states. Thus, a state’s 303(d) impaired waters list will typically identify the pollutant that is causing the impairment, triggering it to be “listed.” In addition, states may, but are not required to, identify the source of the impairment. To exclude a waterbody that was included on a previous 303(d) list, a state must demonstrate “good cause.” (40 CFR 130.7(b)(6)(iv)). Good cause may include more recent or accurate data, more sophisticated water quality monitoring data, flaws in the original analysis that led to the listing, or changes in conditions. While there is an obvious relationship between 305(b) assessments and 303(d) listings, the results of the two decision-making processes are not necessarily identical. For instance, waterbodies that are listed under 303(d) as “impaired” are not always synonymous with those that have been assessed under 305(b) as “not supporting” or “partially supporting” their designated uses. In part, the difference is inherent in the purposes of these two evaluations. The 305(b) assessment is intended to provide a description of the overall quality of a state’s waters. In contrast, the 303(d) list triggers a regulatory process involving development of a TMDL. Thus a state may use different types of data for the two evaluations, often utilizing more localized or site-specific data for the 303(d) listing and rejecting data used in its 305(b) assessment for 303(d) listing purposes. Also reflecting their relationshiop to the TMDL process, 303(d) lists are often subject to a state’s
official rule-making process, with its attendant requirements for public hearings. EPA is seeking to better integrate the development and submission of 305(b) water quality reports and 303(d) lists of impaired waters. In November 2001, EPA issued guidance for integrating the two, and in July 2002 published the first edition of a “Consolidated Assessment and Listing Methodology.” While the integrated report guidance was optional for the 2002 reporting cycle, none of the five UMR states fully employed the guidance for its 2002 submittal. While both 305(b) assessments and 303(d) lists must be submitted to EPA, only the 303(d) list is subject to EPA approval. In general, the states’ 303(d) lists must be submitted to EPA on April 1 of every even-numbered year. However, in March 2000, EPA issued a rule removing the requirement for the 2000 list. In addition, EPA extended the 2002 deadline from April to October 1, 2002. EPA then has 30 days in which to either approve or disapprove the list submitted by the state. If EPA disapproves the list, EPA has 30 days to establish a new list. The following sections, including Table 21 and Map 4, summarize the five UMR states’ 303(d) listings for the Mississippi River, as reflected in the 2002 lists they submitted to EPA. Using the lists as submitted allows comparisons among states to be made, irrespective of whatever changes EPA may make based on its own judgments, particularly with regard to interstate issues on the Mississippi River. In addition, as a practical matter, EPA approval and/or revision of some states’ 2002 lists was still pending as of June 2003 when this report was drafted.
41

Table 21 Upper Mississippi River 303(d) Impaired Listings Summary
Number of UMR
Assessment Reaches1
Number of UMR Reaches
Listed as Impaired
Pollutants Causing
Impairments on the UMR (# of reaches)
Sources of Impairment (# of reaches)
Illinois 15 15
PCBs (15) Priority organics (5) Siltation (4) Organic enrichment (3) Habitat alteration (3) Suspended solids (3) Nutrients (2) Flow alteration (1) Metals (1) Pathogens (1) Phosphorus (1) Nitrates (1) Total Ammonia-N (1)
Unknown (14) Agriculture (4) Hydromodification (4) Industrial point source
pollution (3) Municipal point source
pollution (3) Agriculture crop-related
sources (3) Agriculture non-irrigated
crop production (3) Urban runoff/storm
sewers (2)
Iowa 14 3 Arsenic (2) Organic enrichment (1)
Iowa does not identify sources
Minnesota 31 and
Lake Pepin2
31 and
Lake Pepin2
PCBs (31) Mercury (31) Turbidity (6) Ammonia (3) Fecal coliform (2) Nutrients (Lake Pepin)
Non-point source pollution (from 305(b) assessment)
Missouri 2 5 mile stretch near Herculaneum
Lead (5 mile stretch) Zinc (5 mile stretch)
Herculaneum Smelter (5 mile stretch)
Wisconsin 33 34 Mercury (3) PCBs (3) Not identified
1 Includes only those river reaches north of the Ohio River that border another state. 2 Minnesota uses 31 reaches to assess the interstate portion of the Mississippi River as a stream/river. In addition
Lake Pepin is assessed and listed as a “lake.” 3 The number of assessment reaches in Wisconsin is based on the state’s 1996 305(b) report. However, Wisconsin’s
proposed 2002 303(d) list has the entire UMR listed as one reach. 4 Entire UMR is listed as impaired for PCBs and mercury. Fountain City Bay area, which had previously been
separately listed for PCB sediment contamination, was delisted in 2002. ILLINOIS When Illinois EPA determines any one of a waterbody’s designated uses to be partially or non-supported, that waterbody and that specific designated use are considered “impaired.” For impaired waterbodies, Illinois EPA then identifies
potential “causes” of impairment of the designated uses. Thus, Illinois employs a two-step process. The first decision, regarding whether a waterbody is impaired, considers only parameters for which the state has defined standards or biological data. However, to then identify the cause of the impairment, Illinois EPA
42

has developed a set of guidelines, which include a combination of standards, criteria, statistically derived values, and procedures. In its 2002 303(d) list, Illinois EPA lists all 15 of its Mississippi River reaches as impaired. In particular, PCBs are identified as the cause of impairment for all 15 reaches, due to PCB contamination of fish tissue at specific sites. Of the 5 UMR states, Illinois has by far the greatest number of pollutants identified as causing impairment of the UMR. (See Table 21.) Of the 15 UMR reaches, the lower two reaches (124 total miles) and the upper 5 reaches (194 total miles) are listed exclusively for PCBs. However, the 380 miles in the central 8 reaches are listed for a variety of other pollutants in addition to PCBs, including priority organics, organic enrichment, flow alteration, habitat alteration, nutrients, siltation, metals, pathogens, total ammonia-N, phosphorous, nitrates, and suspended solids. The abundance of impairment causes in these 8 reaches is explained, at least in part, by changes in Illinois EPA’s assessment methodologies over time. In particular, its determination of aquatic life use impairment on some Mississippi River reaches is approximately 10 years old and based on a water quality index originally developed by U.S. EPA, but no longer used by Illinois EPA. While Illinois EPA now labels these older assessments as “evaluated,” the pollutants identified using the old index have been carried forward due to a lack of more recent data. The reach consisting of the 24 miles of the UMR downstream of the Illinois River confluence is particularly unique. It has 8 pollutants causing impairment, far more causes than are listed for any of Illinois’ other UMR reaches. In addition, it is the only Illinois UMR reach listed for metals, phosphorus, ammonia, and nitrates. According to Illinois EPA staff, the metals listing is for either copper (20 µg/L) or iron (1000 µg/L), which exceeded the criteria in Illinois’ water quality index used for its 1988 305(b) report, upon which the aquatic life use assessment for this reach was based. Illinois EPA staff explain that these metals would not be listed if the impairment decision had been based on Illinois’ new standards.
Other than PCBs, the most frequently cited cause of impairment on the UMR in Illinois is “priority organics.” In particular, 5 Illinois UMR reaches, totaling nearly 300 miles, are listed for “priority organics.” According to Illinois EPA staff, the priority organics impairment reflects fish consumption advisories issued for those reaches of the UMR based on chlordane contamination of fish tissue. However, the 2003 Illinois Department of Natural Resources’ fish consumption advisory for the Mississippi River identifies only PCB contamination and no longer bases the advisory on chlordane contamination. Fish consumption advisories in Illinois are updated more frequently than the assessments upon which the 303(d) listings are based, thus accounting for the discrepancy. “Nutrients” is listed as the cause of impairment on 2 UMR reaches immediately north of the Missouri River confluence. Reportedly, these nutrient listings are tied to total phosphorous, based on a criterion that was part of the 1988 water quality index no longer used by the state for listing decisions. However, specific nutrients, including phosphorous, total ammonia-N, and nitrates, are also listed as causes of impairment for one of those reaches. Siltation is listed as a cause of impairment on 4 Illinois UMR reaches, generally located between the Cuivre and Kaskaskia Rivers. Three of those reaches, the exception being the 18-mile reach north of the Illinois River, are also listed for suspended solids. Illinois EPA uses “confidence levels” to describe how confident it is that the identified potential cause is, in fact, contributing to impairment of the waterbody. Level 3 indicates high confidence, Level 2 indicates moderate confidence, and Level 1 indicates low confidence. The 14 PCB impairments on the UMR have been assigned the highest, or Level 3, confidence level. The one reach listed for pathogens has a medium, or Level 2, confidence associated with that cause of impairment. However, all remaining causes of impairment on the UMR have no assigned confidence level. While EPA does not require states to identify the source of impairments for waterbodies on their
43

303(d) lists, Illinois is one of 3 UMR states that includes source information. “Unknown” sources are cited for 14 of Illinois’ 15 UMR reaches, the exception being the Chain of Rocks canal. For the Chain of Rocks and 3 other reaches clustered near St. Louis, Illinois EPA has identified a variety of known impairment sources, including industrial and municipal point sources, combined sewer overflows, urban runoff, hydrologic modification, and various types of agricultural nonpoint sources. TMDL Development All 15 UMR reaches in Illinois are considered “medium priority” in the state’s prioritization for TMDL development. Illinois EPA prioritizes its 303(d) list using a watershed-based, 3 step system. The first step is based on use designations, with impairments affecting drinking water assigned the highest priority. The second step considers the confidence level assigned to the potential causes of impairment, with the highest level (Level 3) prompting a higher priority. The third step takes into account the severity of pollution, based on the number of causes of impairment, with a greater number triggering a higher priority. Following these 3 steps, Illinois EPA may also consider other factors, such as a waterbody’s potential for improvement, the degree of public support, and source water protection for waterbody improvement. Within each of the three priority categories (High, Medium, Low), certain waterbodies will generally be considered low priority. Illinois EPA has 8 criteria for defining which are low priority waters and thus not likely to be appropriate candidates for TMDLs. As described in Illinois’ 2002 Section 303(d) list, one of those criteria is “303(d) listed waters that are interstate waters — e.g., Mississippi River, Ohio River, Lake Michigan, and others. In these waters, the Illinois EPA will continue to work closely with other states and USEPA in addressing issues related to Section 303(d) requirements. USEPA is expected to take a lead role in coordinating the state efforts.” Thus, although 15 Mississippi River reaches are on Illinois’ “medium priority” list, they are considered low priority compared to other Illinois waterbodies of medium priority.
IOWA For its 2002 303(d) list, Iowa DNR lists 3 of its 14 Upper Mississippi River reaches as impaired. Two reaches are listed for arsenic impairment of the drinking water use and one reach is listed for organic enrichment of the aquatic life use. The 2 arsenic listings are related to the Keokuk and Davenport water supplies. Both are based on “non-support” of the designated drinking water use, due to violations of the state’s human health criterion for arsenic (0.18 µg/l). The organic enrichment impairment, on the 16-mile reach downstream of Lock and Dam 13 at Clinton, is due to growth of slime in the heavily-industrialized Beaver Slough portion of this river reach. The slime growth, which is attributed to an Archer Daniels Midland corn-processing facility, constitutes a violation of Iowa’s narrative criteria regarding “aesthetically objectionable conditions.” In addition, it renders substrates unfit for colonization of benthic macroinvertebrates, thus preventing this river reach from fully supporting its designated Class B aquatic life uses. Of particular note with regard to Iowa’s 303(d) list is the impact of the state’s “credible data” law, enacted in 2000 (2001 Iowa Code, Section 455B.194, subsection 1). As defined by that law, “credible data” is “scientifically valid chemical, physical, or biological monitoring data collected under a scientifically accepted sampling and analysis plan, including quality control and quality assurance procedures.” Iowa DNR is required to use “credible data” when developing water quality standards, developing statewide water quality inventories or assessments, determining its 303(d) list, determining support of designated uses, determining any degradation of a water of the state, and establishing TMDLs. Notably, 305(b) reports and the establishment of designated uses or other water classifications are specifically exempted from the requirements for credible data. Thus, a broader array of data may be used for 305(b) assessments than for 303(d) listings. In its documentation of the methodology for developing its 2002 303(d) list, Iowa DNR explains that “incorporation of requirements of
44

the credible data law will have significant impacts on Iowa’s 2002 Section 303(d) list.” With regard to the Mississippi River, the credible data law appears to, at least partially, account for changes in 2 listings. In 1998, Iowa listed the 17-mile reach just north of the Missouri state line and the 11-mile reach near Davenport for “indicator bacteria.” These impairments were not included in the state’s 2002 list. However, both reaches remain listed in 2002 for arsenic impairment. Iowa DNR attributes both indicator bacteria delistings to lack of “sufficient credible data needed to support a Section 303(d) listing.” In the case of the delisting for the southernmost reach, Iowa DNR specifically indicates that the water quality monitoring data from the Illinois EPA monitoring station at Keokuk is insufficient, under Iowa’s 303(d) listing methodology, to support the listing. In particular, too few samples (<10) were available from Illinois EPA to develop an assessment that Iowa DNR considers adequate for purposes of Section 303(d) listing. TMDL Development Iowa DNR considers TMDL development on the Upper Mississippi River a “medium” priority, defined as “waters where sufficient water quality information exists to understand and analyze causes and effects of the problems; however, opportunities are not immediately available to correct or substantially improve water quality; or waters where local support for TMDL development is expected but not known.” Iowa’s prioritization and scheduling of TMDL development is based on several factors, including the severity of the pollution and the designated uses of the waterbody, as required by EPA. In addition, a 2001 consent decree resulting from TMDL litigation in Iowa affects the scheduling of TMDLs. MINNESOTA In its 2002 list of 303(d) impaired waters, Minnesota PCA lists all 31 of its interstate reaches of the Mississippi River as impaired. In particular, all 31 reaches are listed for PCBs and mercury, based on the issuance of fish consumption advisories by the Minnesota Department of Health. Minnesota PCA considers fish consumption advisories as indications of
impairment if they limit consumption to less than one meal per week, for any member of the population (i.e., >.2 ppm mercury or PCB in fish tissue). Fish consumption advisories are not used by Minnesota PCA in its 305(b) assessments, and the agency considers the acceptability of fish for human consumption separately from aquatic life use support. Thus, many Mississippi River reaches may be identified as fully or partially supporting aquatic life, even though they are listed as impaired due to fish consumption advisories. Nine of the 31 UMR reaches are listed for other pollutants, in addition to PCBs. In particular, 6 of the 31 reaches are listed for turbidity. Four of these reaches are clustered in a 16-mile area of the river near Red Wing. The other two reaches listed for turbidity comprise a 15-mile stretch downstream of the Root River. Minnesota is the only UMR state that has a standard for turbidity (25 nephelometric turbidity units (NTU) for class 2B waters). In addition, Minnesota PCA uses total suspended solids (TSS) values as a surrogate for turbidity, at sites where there are an inadequate number of turbidity values. Three of the 31 Minnesota UMR reaches are listed for ammonia, including 2 reaches by La Crosse, Wisconsin and a one-mile reach near the Cannon River. In addition, 2 reaches are listed for fecal coliform, one near La Crosse and one downstream of the Whitewater River. Minnesota PCA also lists Lake Pepin for “excess nutrients,” affecting its use for swimming. Lake Pepin, a particularly wide 25-mile stretch of the Mississippi River south of Red Wing, constitutes roughly 3 of the 31 UMR river reaches assessed by Minnesota PCA as part of its river and stream assessment. However, PCA also assesses Lake Pepin separately as a lake, and its impairment listing for nutrients is based on that lake assessment. The process for assessing Minnesota lakes for impairment due to eutrophication is based on the state’s narrative water quality criteria and assessment factors related to excess algae or plant growth. For most lakes, PCA uses eutrophication guidelines, based on eco-regions, which consider total phosphorous, chlorophyll-a concentrations, and secchi disk readings. However, because Lake Pepin is considered a
45

reservoir lake, it is not necessarily subject to the same assessment procedures. TMDL Development Minnesota PCA has not assigned priority rankings to waterbodies on its 2002 303(d) list, but intends to develop a ranking process for use in the 2004 cycle. Rather, all impairments listed in 2002 have estimated start and completion dates for developing the TMDL. Start dates for the 31 UMR reaches range from 2002 to 2007. The Lake Pepin eutrophication TMDL for phosphorous is scheduled to begin in 2003. Rather than developing individual TMDLs for each pollutant on each of the state’s impaired stream segments or lakes, Minnesota PCA intends to develop “regional” TMDLs where appropriate. These will involve establishing a single TMDL for a particular pollutant across multiple waterbodies in a given area. In particular, fecal coliform, turbidity, and eutrophication are each candidates for the regional TMDL approach, given that each pollutant can be traced to similar sources in an area. Minnesota’s first regional TMDL was the “Lower Mississippi” regional TMDL for fecal coliform, released to the public in August 2002 and approved by EPA in November 2002. It covers 20 individual stream reaches in southeastern Minnesota listed as impaired for swimming by fecal coliform, including 2 reaches of the Mississippi River.5 In addition, the UMR mercury impairments due to fish consumption advisories will also likely be addressed in a regional TMDL. Given that most of the mercury in Minnesota waters is attributed to atmospheric deposition, Minnesota PCA is
considering developing a statewide mercury TMDL.
5 The two UMR reaches in the Lower Mississippi
River regional TMDL for fecal coliform are not the same two reaches that are listed for fecal coliform impairment on Minnesota’s 2002 303(d) list. Assessment unit 07040003-510 (Whitewater River to Lock and Dam 5 Minneiska) was first listed for fecal coliform in 2002, subsequent to development of the regional TMDL. The two reaches included in the regional TMDL correspond to Assessment units 07040006-502 (La Crosse River to Pine Creek) and 07060001-501 (Root River to Coon Creek), the latter of which is not listed for fecal coliform in 2002.
MISSOURI In 2002, the only portion of the Mississippi River listed as impaired on Missouri’s 303(d) list is a 5-mile stretch near Herculaneum, Missouri. This localized area is listed for lead and zinc impairment, attributed to runoff from the Herculaneum Smelter. The listing of these metals is related to impairment of the warm water aquatic life and fish consumption uses designated for the river. In particular, zinc levels in Mississippi River sediments immediately downstream of the smelter are above values commonly reported as toxic to aquatic life. In addition, high lead levels have been found in the tissue of fish downstream of the smelter. The Missouri Department of Health and Senior Services has also discovered elevated blood lead levels in children living near the smelter. Missouri’s water quality standards do not contain numeric criteria for metals in sediment. Thus, the high lead and zinc levels near Herculaneum represent a violation of the state’s narrative criteria that state “waters shall be free from substances or conditions in sufficient amounts to result in toxicity to human, animal or aquatic life” (10 CSR 20-7.013(3)(D)) and “concentrations of [contaminants] in bottom sediments or waters shall not harm benthic organisms and shall not accumulate through the food chain in harmful concentrations, nor shall state and federal maximum fish tissue levels for fish consumption be exceeded.” (10 CSR 20-7.031(4)(B)(1)) In 1998, Missouri listed its entire stretch of the Mississippi River for “habitat loss” due to “channelization.” Missouri DNR’s draft 2002 303(d), released for public comment in June 2002, also proposed that listing. However, the “habitat loss” impairment on the Mississippi River was not ultimately included in the 2002 303(d) list Missouri submitted to EPA. In general, Missouri DNR uses data quality codes to rate the degree of assurance in data accuracy, based on both the amount and kind of data. There are 4 data quality levels, with Level One indicating the least assurance and Level Four the
46

greatest assurance. In general, only Level Two or higher data are used to select waterbodies for the Missouri 303(d) list, unless the problem can be accurately characterized by Level One data (i.e., where sample variances of key water quality constituents are low enough to offset the small sample size). All waterbodies excluded from the 303(d) list due to inadequate data receive high priority for additional monitoring, although Missouri DNR does not routinely monitor the Mississippi River as part of its current water quality monitoring program. TMDL Development The 5-mile impairment near Herculaneum is new to Missouri’s 303(d) list in 2002 and there is currently no TMDL planned. However, the reach has been identified for “high priority analysis” by Missouri DNR. Missouri DNR’s priority ranking criteria for TMDL development assign either a high or medium priority to actual impairments (in contrast to those that are threatened or not well documented). The “degree of treatability” is then used to differentiate between those of high priority and those of medium priority. High priority may also be given to impairments related to human health and waters with multiple use impairments. Missouri’s 303(d) list does not identify the TMDL priority rank for waterbodies on the list. WISCONSIN In 2002, Wisconsin listed the entire length of the Upper Mississippi River for PCBs and mercury, citing fish consumption advisories as the impairment. Although Wisconsin recently issued a general statewide fish consumption advisory for mercury and a PCB advisory is also in effect on the UMR, the river was originally listed in 1998 for PCB and mercury impairment based on water quality standard exceedances, in addition to the PCB fish consumption advisory. While the entire river is listed for PCBs and mercury, a small area in Fountain City Bay had also been included in previous lists for aquatic toxicity impairment related to PCB sediment contamination. In 2002, Wisconsin DNR proposed that the Fountain City Bay area be delisted. Sediments in Fountain City Bay,
contaminated as a result of the use of PCB-laden waste oils at the U.S. Army Corps of Engineers boat yard, were removed from the river bed and bank. The remediation project was completed in 2000. Wisconsin DNR categorizes impaired waters according to 7 factors causing impairment, including point source dominated, nonpoint source dominated, point source and nonpoint source combined, contaminated sediment waters, atmospheric deposition dominated, habitat/physical impaired, and other factors. As described in the Wisconsin Water Quality Assessment Report to Congress 2002, “other factors” primarily include “large waters, involving basins or multibasin areas, which may be impaired as a result of several different categories of impairment or there are uncertainties regarding the cause of impairment.” The Mississippi River is assigned to this “other” category, noting it as “TBD.” TMDL Development The Mississippi River is identified as a medium priority on Wisconsin’s 2002 303(d) list. Medium priority indicates “a water where work may or may not be ongoing, but TMDL completion is planned for 2005 or 2006.” SUMMARY Each of the five states bordering the Upper Mississippi River included at least some portion of the river on its 303(d) list in 2002. However, the listing approaches vary considerably among the states, resulting in significant differences in UMR listings. For example, 3 states (Minnesota, Wisconsin, and Illinois) list the entire river as impaired for at least one use, while Iowa and Missouri list only a few short reaches. (See Map 4.) There is also considerable variety in the number and types of pollutants states identify as the cause of impairment. (See Table 21.) For instance, Illinois lists the Mississippi River for 13 different causes of impairment. In contrast, Missouri, Iowa, and Wisconsin each list only 2 pollutants. These differences can be attributed to a number of factors, including differences among the states’ water quality standards and criteria (see Table 24), methodologies for including
47

%U
%U
%U
%U
%U
S S
S
S
S
S
%[
%[
%[
%[
%[
%[
%[
%[
%[
%[
%[
%[
%[
%[%[
%[
%[
%[
%[
%[%[%[
%[
Keokuk
Dubuque
St. Paul
La Crosse
Davenport
PCBs, Mercury
Turbidity
Des MoinesRiver
Rock River
Wisconsin River
Minnesota River
400
500
600
700
800
Minneapolis
TurbidityTurbidity,Ammonia
TurbidityFecal ColiformAll Minnesota Reaches are listed for PCBs and Mercury. Lake Pepin is alsolisted for "excess nutrients." Ammonia
TurbidityTurbidity
Organic Enrichment
Arsenic
Arsenic
WisconsinMinnesota
Iowa
Illinois
St. CroixRiver
PCBs
PCBs
PCBs
PCBs
PCBs, Priority Organics, Organic Enrichment, Pathogens
PCBs
Ammonia,Fecal Coliform
L&D 3
L&D 4
L&D 5
L&D 7
L&D 6
L&D 8
L&D 9
L&D 16
L&D 18
L&D 19
L&D 20
L&D 10
L&D 11
L&D 12
L&D 13
L&D 17
L&D 2
L&D 1
L&D 5A
L&D 14L&D 15
Area in Fountain City Bay delisted for PCBs.
Upper Mississippi RiverImpaired Waters on 303(d) Lists
Part 1 of 2
Map 4
Reaches are coded to identify impairments on the states' 303(d) lists submitted to EPA in 2002.
Minnesota Reach SectionsNot ListedImpaired
%U River MilesS UMR Cities%[ Locks and Dams
State Lines
N
0 25 50 75 100 MilesPrepared by the UMRBAJanuary 2004
48
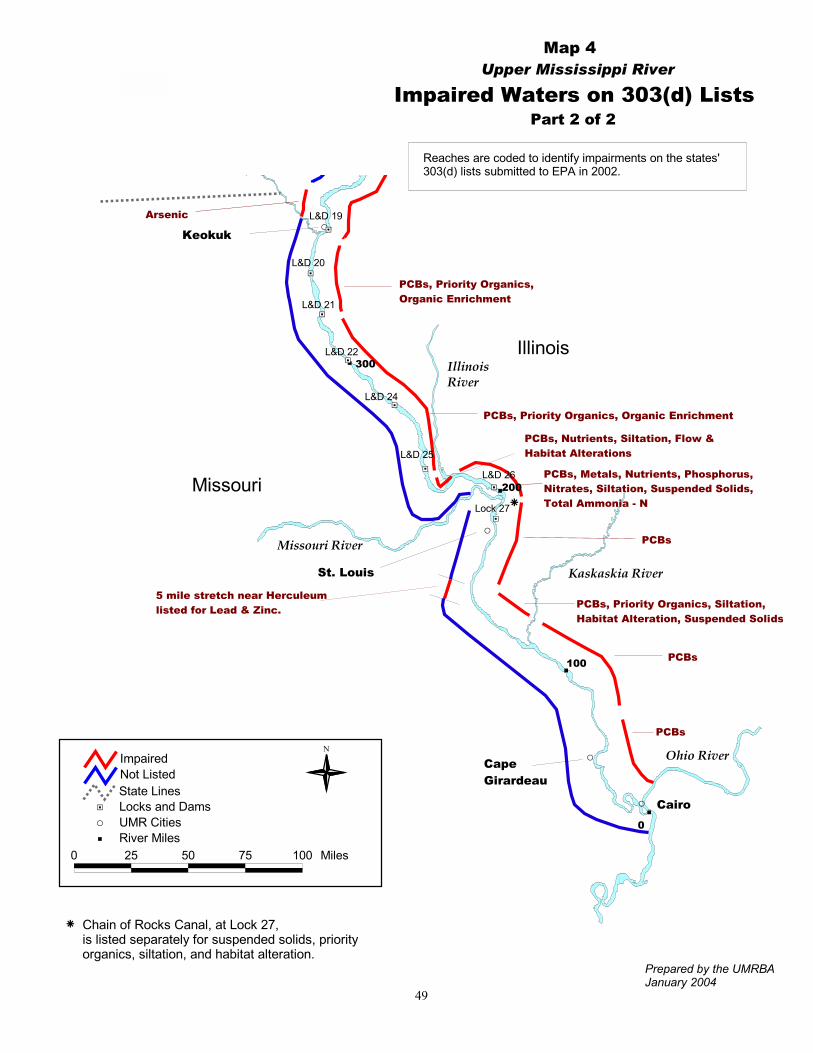
Prepared by the UMRBAJanuary 2004
%U
%U
%U
%U
S
S
S
S
%[
%[
%[
%[
%[
%[
%[
%[
Cairo
Keokuk
St. Louis
Cape Girardeau
Missouri RiverKaskaskia River
Ohio River
IllinoisRiver
0
100
200
300
Arsenic
Missouri
Illinois
PCBs, Priority Organics, Organic EnrichmentPCBs, Nutrients, Siltation, Flow &Habitat Alterations
PCBs, Metals, Nutrients, Phosphorus, Nitrates, Siltation, Suspended Solids,Total Ammonia - N
PCBs
PCBs, Priority Organics, Siltation,Habitat Alteration, Suspended Solids
PCBs
PCBs
5 mile stretch near Herculeumlisted for Lead & Zinc.
PCBs, Priority Organics, Organic Enrichment
rLock 27
L&D 19
L&D 20
L&D 21
L&D 22
L&D 24
L&D 25L&D 26
Chain of Rocks Canal, at Lock 27, is listed separately for suspended solids, priorityorganics, siltation, and habitat alteration.
r
0 25 50 75 100 Miles
N
State LinesLocks and Dams%[
UMR CitiesS
River Miles%U
ImpairedNot Listed
49
Upper Mississippi RiverImpaired Waters on 303(d) Lists
Part 2 of 2
Map 4
Reaches are coded to identify impairments on the states' 303(d) lists submitted to EPA in 2002.
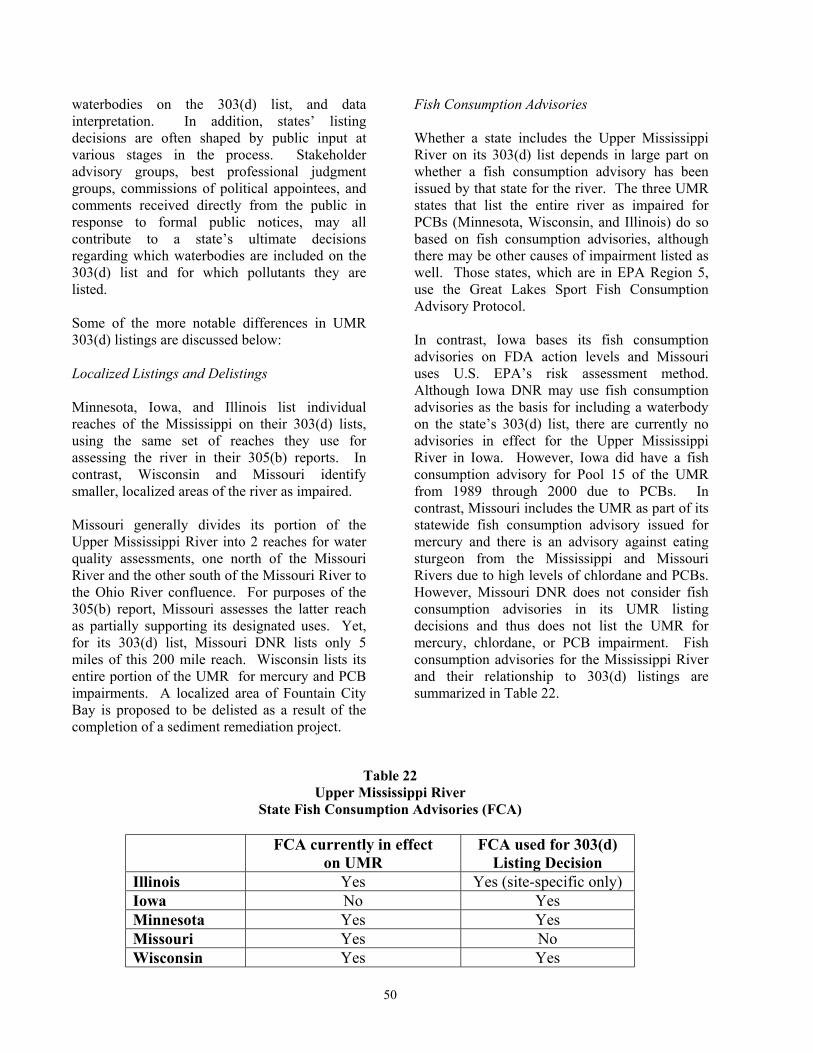
waterbodies on the 303(d) list, and data interpretation. In addition, states’ listing decisions are often shaped by public input at various stages in the process. Stakeholder advisory groups, best professional judgment groups, commissions of political appointees, and comments received directly from the public in response to formal public notices, may all contribute to a state’s ultimate decisions regarding which waterbodies are included on the 303(d) list and for which pollutants they are listed. Some of the more notable differences in UMR 303(d) listings are discussed below: Localized Listings and Delistings Minnesota, Iowa, and Illinois list individual reaches of the Mississippi on their 303(d) lists, using the same set of reaches they use for assessing the river in their 305(b) reports. In contrast, Wisconsin and Missouri identify smaller, localized areas of the river as impaired. Missouri generally divides its portion of the Upper Mississippi River into 2 reaches for water quality assessments, one north of the Missouri River and the other south of the Missouri River to the Ohio River confluence. For purposes of the 305(b) report, Missouri assesses the latter reach as partially supporting its designated uses. Yet, for its 303(d) list, Missouri DNR lists only 5 miles of this 200 mile reach. Wisconsin lists its entire portion of the UMR for mercury and PCB impairments. A localized area of Fountain City Bay is proposed to be delisted as a result of the completion of a sediment remediation project.
Fish Consumption Advisories Whether a state includes the Upper Mississippi River on its 303(d) list depends in large part on whether a fish consumption advisory has been issued by that state for the river. The three UMR states that list the entire river as impaired for PCBs (Minnesota, Wisconsin, and Illinois) do so based on fish consumption advisories, although there may be other causes of impairment listed as well. Those states, which are in EPA Region 5, use the Great Lakes Sport Fish Consumption Advisory Protocol. In contrast, Iowa bases its fish consumption advisories on FDA action levels and Missouri uses U.S. EPA’s risk assessment method. Although Iowa DNR may use fish consumption advisories as the basis for including a waterbody on the state’s 303(d) list, there are currently no advisories in effect for the Upper Mississippi River in Iowa. However, Iowa did have a fish consumption advisory for Pool 15 of the UMR from 1989 through 2000 due to PCBs. In contrast, Missouri includes the UMR as part of its statewide fish consumption advisory issued for mercury and there is an advisory against eating sturgeon from the Mississippi and Missouri Rivers due to high levels of chlordane and PCBs. However, Missouri DNR does not consider fish consumption advisories in its UMR listing decisions and thus does not list the UMR for mercury, chlordane, or PCB impairment. Fish consumption advisories for the Mississippi River and their relationship to 303(d) listings are summarized in Table 22.
Table 22
Upper Mississippi River State Fish Consumption Advisories (FCA)
FCA currently in effect
on UMR FCA used for 303(d)
Listing Decision Illinois Yes Yes (site-specific only) Iowa No Yes Minnesota Yes Yes Missouri Yes No Wisconsin Yes Yes
50

Table 23 Upper Mississippi River
303(d) List Priority Ranking
Illinois “Low” priority within “medium” priority category Iowa Medium
Minnesota
Rankings not assigned. TMDLs are scheduled to begin for UMR reaches between 2002 and 2007. A regional TMDL for fecal coliform was completed in November 2002.
Missouri “High Priority for Analysis” (TMDL rank not identified) Wisconsin Medium
Priority Rankings and TMDL Section 303(d) of the Clean Water Act requires states to establish a priority ranking for waters on their list of impaired waters, “taking into account the severity of the pollution and the uses to be made of such waters.” The way in which states take these factors into account differs. In addition, states may employ additional factors related to data sufficiency and confidence, public support, and the potential for improvement in water quality. Whether the rankings are directly related to scheduling of TMDLs may also vary among states. Thus, the relative priorities that the states assign to their waterbody listings are not directly comparable among states. (See Table 23.) Polychlorinated biphenyls (PCBs) Three states list the entire Upper Mississippi River as impaired due to PCBs (Minnesota, Wisconsin, and Illinois). The listings in Minnesota and Illinois are based on fish consumption advisories, reflecting elevated PCB levels in fish tissue. In contrast, Wisconsin’s PCB listing is based on both a fish consumption advisory and water quality standards exceedances. Thus, although all states but Missouri have PCB water quality criteria related to protection of aquatic life, those criteria are only resulting in PCB listings on the Upper Mississippi River in Wisconsin. Mercury Wisconsin and Minnesota are the only states that specifically list the UMR as being impaired by mercury. Wisconsin DNR based its original 1998
mercury impairment decision on water quality standard exceedances, although there is now a statewide fish consumption advisory for mercury as well. Minnesota PCA bases its mercury impairment decision on fish consumption advisories. Illinois and Missouri have also issued general statewide fish consumption advisories for mercury. However, these states do not separately list individual waterbodies for mercury impairment, unless they have actual fish tissue data, from that waterbody, showing mercury contamination. Pathogens/Fecal Coliform Bacteria Two UMR states (Minnesota and Illinois) list portions of the Mississippi River for fecal coliform impairment. Minnesota PCA lists a 1.7-mile reach downstream of the La Crosse River and a 4.4-mile reach downstream of the Whitewater River. Illinois lists an 86-mile reach between Lock and Dam 17 and 19. Given that all 5 UMR states have the same criteria for fecal coliform bacteria (200 organisms per 100 ml), the differences in border states’ listings for those reaches is largely a function of different data requirements and observations. In part, the difference between Illinois and Iowa’s fecal coliform listings is due to state-specific differences in the time period over which data are considered for the assessment. Iowa uses only the two most recent years of data for fecal coliform, whereas Illinois uses the most recent five years of data. Illinois EPA’s water quality monitoring data, which Iowa DNR used to develop its assessment for the UMR, did not contain sufficient data for the years 2000 and 2001 for Iowa DNR to assess the primary contact recreation use.
51

Wisconsin considers multiple years of data and relies upon best professional judgment for fecal coliform impairment decisions. Wisconsin DNR has not seen exceedances of the fecal coliform criteria at its UMR mainstem monitoring sites, nor in data collected by La Crosse County. Nutrients Three states list some portion of the Upper Mississippi River as impaired by nutrients. However, the way in which nutrients listings on the UMR are determined and reflected on the states’ 303(d) lists varies widely. Minnesota’s UMR nutrient listing is reflected not in its streams and rivers listings, but in its lakes listing. In particular, Minnesota lists Lake Pepin as impaired for “excess nutrients,” based on the state’s narrative criterion related to excess algae growth. For Lake Pepin, the main cause cited is phosphorous. Iowa also bases its listing of a 16-mile reach near Clinton on a narrative criterion protecting Iowa’s waters from “aesthetically objectionable conditions.” This impairment, which has variously been listed as either “nutrients” or “organic enrichment,” is due to slime growth on substrates and on the nets of commercial fishermen. Missouri also bases its nutrient listings on narrative criteria, related to color and bottom sediments. However, Missouri DNR does not apply these criteria to large river systems that are deep and turbid, and thus has no basis for considering nutrient impairment of the Mississippi River. In contrast, Illinois’ listing of 2 UMR reaches for “nutrient” impairment is reportedly based on a 1988 water quality index, which used a combination of standards and numeric criteria to assess aquatic life use. That index is no longer used by the state for new listing decisions. However, on its 2002 list, Illinois EPA identified three specific nutrients (phosphorous, total ammonia-N, and nitrates) as the cause of impairment for another of Illinois’ Mississippi River reaches. To provide consistency in assigning those causes, Illinois EPA uses numeric statistical guidelines and standards.
Sedimentation-Related Parameters Minnesota and Illinois are the only UMR states that list the river as impaired based on sedimentation-related causes such as turbidity, siltation, or suspended solids. Minnesota is the only state that has a turbidity criteria (25 nephelometric turbidity units (NTU)), upon which it has based its listings for aquatic life impairment of 6 individual river reaches totaling 30 miles. While Illinois’ water quality standards do not have a numeric criteria for turbidity, the guidelines that Illinois EPA uses for identifying potential causes of impairment utilize quantitative guidelines. In particular, the guidelines for identifying siltation or suspended solids as the cause of impairment are based on total suspended solids exceeding 116 mg/l in at least one sample. In 2002, Illinois listed 4 Mississippi River reaches as impaired due to siltation, with 3 of those also listed for suspended solids. The siltation and suspended solids causes are not equally attributed to these reaches because some of the siltation causes are an artifact of an older assessment guideline that relied solely on best professional judgment. The absence of sedimentation-related Mississippi River impairments on the other states’ 303(d) lists can be attributed to a variety of factors. For example, in its Public Participation Responsiveness Summary for the Section 303(d) List of Impaired Waters, Iowa DNR explains that it did not list the Upper Mississippi River for suspended sediment, sedimentation, or turbidity because the problems associated with those parameters do not constitute violations of numeric or narrative criteria in Iowa’s water quality standards. In particular, the state’s narrative criteria most relevant to nonpoint source-related problems requires that waters be free from materials producing “aesthetically objectionable conditions.” However, Iowa DNR does not believe that sedimentation- and turbidity-related impacts in the UMR constitute an “aesthetically objectionable condition” that would qualify as a violation of the criterion. Iowa DNR also more generally notes that state water quality standards fail to recognize the products of erosion as “pollutants.” Finally, Iowa DNR describes the difficulty in listing the UMR for sediment, given the river’s structural alterations. “While the
52
literature on water quality of the Upper Mississippi River often refers to impacts of siltation/sedimentation, this literature does not identify tools for assessing whether the impacts observed are different than would be expected given the development of this river system for commercial navigation by the U.S. Army Corps of Engineers as authorized by the U.S. Congress. The degree to which these federally-mandated alterations contribute to impacts of sediment and turbidity on the UMR must be quantified before states can begin to determine whether the impacts observed are other than those expected as the result of the intentional alteration of the hydrology of the UMR system.” Ammonia Illinois and Minnesota both list ammonia as a cause of impairment on the Upper Mississippi River. In the case of Illinois, ammonia was listed as a potential cause in the second step of Illinois’ listing process. Thus, while there is a numeric water quality standard for total ammonia-N (15 mg/l), impairment was not determined based on exceedance of the standard. Rather ammonia was judged to be a cause of impairment on one 25-mile reach of the river using the guidelines for assigning potential cause, after the aquatic life use was determined to be impaired on that reach. Illinois EPA’s guideline for identifying total ammonia-N as a potential cause of impairment is that it is exceeds 0.41 mg/l in at least one sample. In contrast, Minnesota’s ammonia standard for Class 2B Waters (Aquatic Life and Recreation) is 0.04 mg/l. To include a waterbody on its 303(d) list for ammonia impairment, Minnesota PCA requires a minimum of 5 data points, with at least 2 exceedances in a 3 year period. Minnesota’s UMR ammonia listings on its 2002 list are carry-overs from its 1998 list and are not based on more recent data. Arsenic Iowa is the only state that lists the Upper Mississippi River for impairment due to arsenic. In particular, Iowa DNR identifies arsenic as impairing drinking water uses in 2 relatively short reaches of the Mississippi River. These Iowa impairments are based on ambient water quality
monitoring data provided by Illinois EPA. However, Illinois does not list these same areas of the river as impaired for arsenic, because its criterion for arsenic in waters used for public water supply is much less restrictive. In particular, Illinois’ criterion (50 µg/l) is based on the national maximum contaminant level for finished water that was in effect prior to U.S. EPA’s changing the standard to 10 µg/l in January 2001. In contrast, Iowa’s criterion (0.18 µg/l) is a human health number the state has established based on the potential intake of arsenic from consuming water or fish. Habitat and Flow Alterations Illinois is the only state that lists the Upper Mississippi River as impaired for habitat and/or flow alterations, identifying these factors as causes of impairment on 8 reaches totaling 380 miles. Illinois EPA assigns habitat and/or flow alteration as a cause of impairment on the Upper Mississippi River based on best professional judgment. Other UMR states do not list the river for flow or habitat alteration, nor do they have specific criteria for determining flow or habitat alteration. For example, Minnesota’s narrative standards for assessing impairment of biological communities and aquatic habitat allow for consideration of measures of the fish community, aquatic invertebrate community, aquatic plant community, and habitat quality, such as physical or hydrological alterations of the stream bed. However, at this time, the guidance developed by Minnesota PCA is based on indices of biotic integrity for fish communities only. Missouri DNR’s draft 2002 303(d) list, released for public comment in June 2002, had proposed that the entire stretch of the Mississippi River in Missouri be listed for “habitat loss” due to “channelization.” The proposed listing was based on one of the narrative criteria in Missouri’s Water Quality Standards (10 CSR 20-7.031), which states that “waters shall be free from physical, chemical or hydrologic changes that would impair the natural biological community.” However, the “habitat loss” impairment on the Mississippi River was not ultimately included in the 2002 303(d) list Missouri submitted to EPA.
53
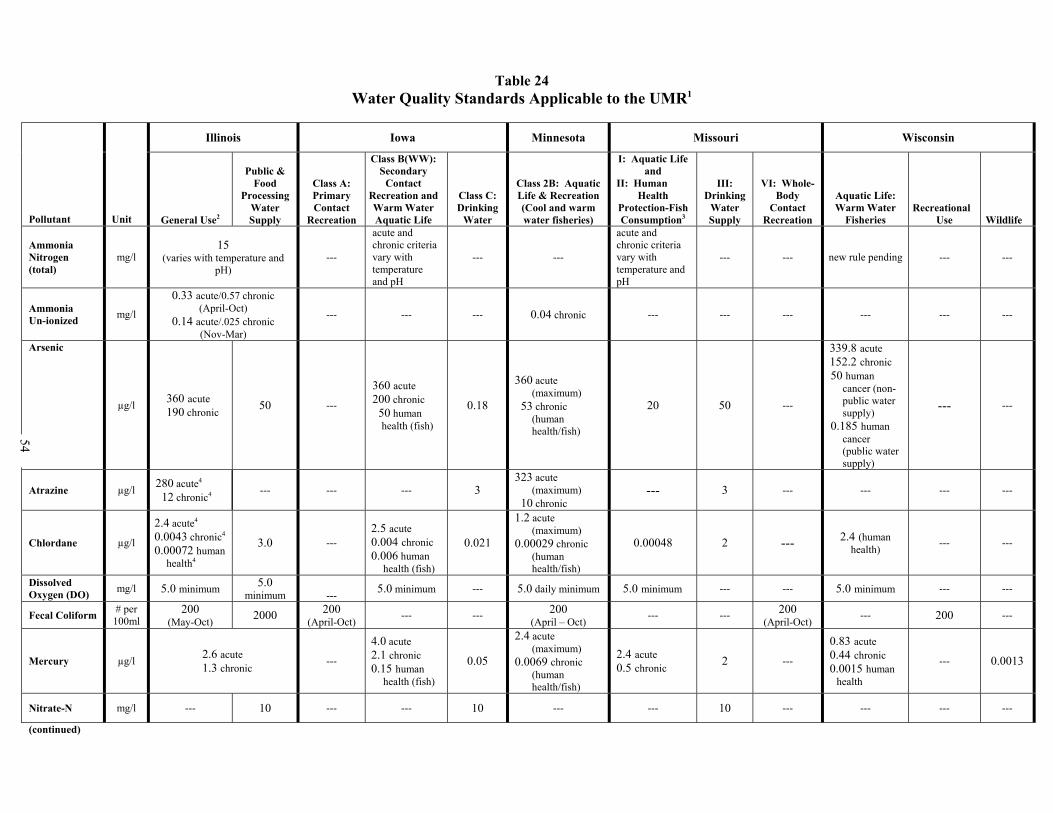
Table 24 Water Quality Standards Applicable to the UMR1
Illinois Iowa Minnesota Missouri Wisconsin
Pollutant Unit General Use2
Public & Food
Processing Water Supply
Class A: Primary Contact
Recreation
Class B(WW): Secondary
Contact Recreation and Warm Water Aquatic Life
Class C: Drinking
Water
Class 2B: Aquatic Life & Recreation (Cool and warm water fisheries)
I: Aquatic Life and
II: Human Health
Protection-Fish Consumption3
III: Drinking
Water Supply
VI: Whole-Body
Contact Recreation
Aquatic Life: Warm Water
Fisheries Recreational
Use Wildlife
Ammonia Nitrogen (total)
mg/l 15
(varies with temperature and pH)
---
acute and chronic criteria vary with temperature and pH
--- ---
acute and chronic criteria vary with temperature and pH
--- --- new rule pending --- ---
Ammonia Un-ionized mg/l
0.33 acute/0.57 chronic (April-Oct)
0.14 acute/.025 chronic (Nov-Mar)
--- --- --- 0.04 chronic --- --- --- --- --- ---
Arsenic
µg/l 360 acute 190 chronic 50 ---
360 acute 200 chronic 50 human
health (fish)
0.18
360 acute (maximum)
53 chronic (human health/fish)
20 50 ---
339.8 acute 152.2 chronic 50 human
cancer (non-public water supply)
0.185 human cancer (public water supply)
--- ---
Atrazine µg/l 280 acute4 12 chronic4
--- --- --- 3 323 acute
(maximum) 10 chronic
--- 3 --- --- --- ---
Chlordane µg/l
2.4 acute4 0.0043 chronic4 0.00072 human
health4
3.0 --- 2.5 acute 0.004 chronic 0.006 human
health (fish)
0.021
1.2 acute (maximum)
0.00029 chronic (human health/fish)
0.00048 2 --- 2.4 (human health) --- ---
Dissolved Oxygen (DO) mg/l 5.0 minimum 5.0
minimum --- 5.0 minimum --- 5.0 daily minimum 5.0 minimum --- --- 5.0 minimum --- ---
Fecal Coliform # per 100ml
200 (May-Oct) 2000 200
(April-Oct) --- --- 200 (April – Oct) --- --- 200
(April-Oct) --- 200 ---
Mercury µg/l 2.6 acute 1.3 chronic ---
4.0 acute 2.1 chronic 0.15 human
health (fish) 0.05
2.4 acute (maximum)
0.0069 chronic (human health/fish)
2.4 acute 0.5 chronic 2 ---
0.83 acute 0.44 chronic 0.0015 human
health --- 0.0013
Nitrate-N mg/l --- 10 --- --- 10 --- --- 10 --- --- --- ---
(continued)
54

Table 24
Water Quality Standards Applicable to the UMR1 (continued)
Illinois Iowa Minnesota Missouri Wisconsin
Pollutant Unit General Use2
Public & Food
Processing Water Supply
Class A: Primary Contact
Recreation
Class B(WW): Secondary
Contact Recreation and Warm Water Aquatic Life
Class C: Drinking
Water
Class 2B: Aquatic Life & Recreation (Cool and warm water fisheries)
I: Aquatic Life and
II: Human Health
Protection-Fish Consumption3
III: Drinking
Water Supply
VI: Whole-Body
Contact Recreation
Aquatic Life: Warm Water
Fisheries Recreational
Use Wildlife
PCBs ng/l 0.015 --- --- 2000 acute 14 chronic 0.4 human
health (fish)
1.7
1000 acute (maximum)
0.029 chronic (human health/fish)
0.045 --- --- 0.01 (human health) --- 0.12
Phosphorous mg/l
0.05 (for certain reservoirs and
lakes; and streams at point they enter those reservoirs or lakes)
--- --- --- --- --- --- --- --- --- ---
Turbidity NTU --- No point source discharge can increase turbidity by more than 25 NTU 25 --- ---
Key 55
mg/l = milligrams per liter ml = milliliters ng/l = nanograms per liter NTU = nephelometric turbidity units µg/l = micrograms per liter
1 The pollutants and the states’ use categories included in Table 24 reflect only those of particular relevance to Upper Mississippi River listing decisions in 2002. 2 As provided in Illinois’ Administrative Code, “General Use” standards protect for aquatic life, wildlife, agricultural, primary contact, secondary contact, and most industrial uses. 3 Missouri has a single designated use category for protection of warm water aquatic life and human health (fish consumption). However, pollutant criteria are specified for one or the other of these uses (i.e., Class I or II). Of the pollutants listed, the chlordane and PCB criteria are Class II and the remainder are Class I.
4 Derived criteria (i.e., Illinois Administrative Code sets forth procedures to be used to derive toxicity criteria for parameters for which standards are not specified in regulation.)
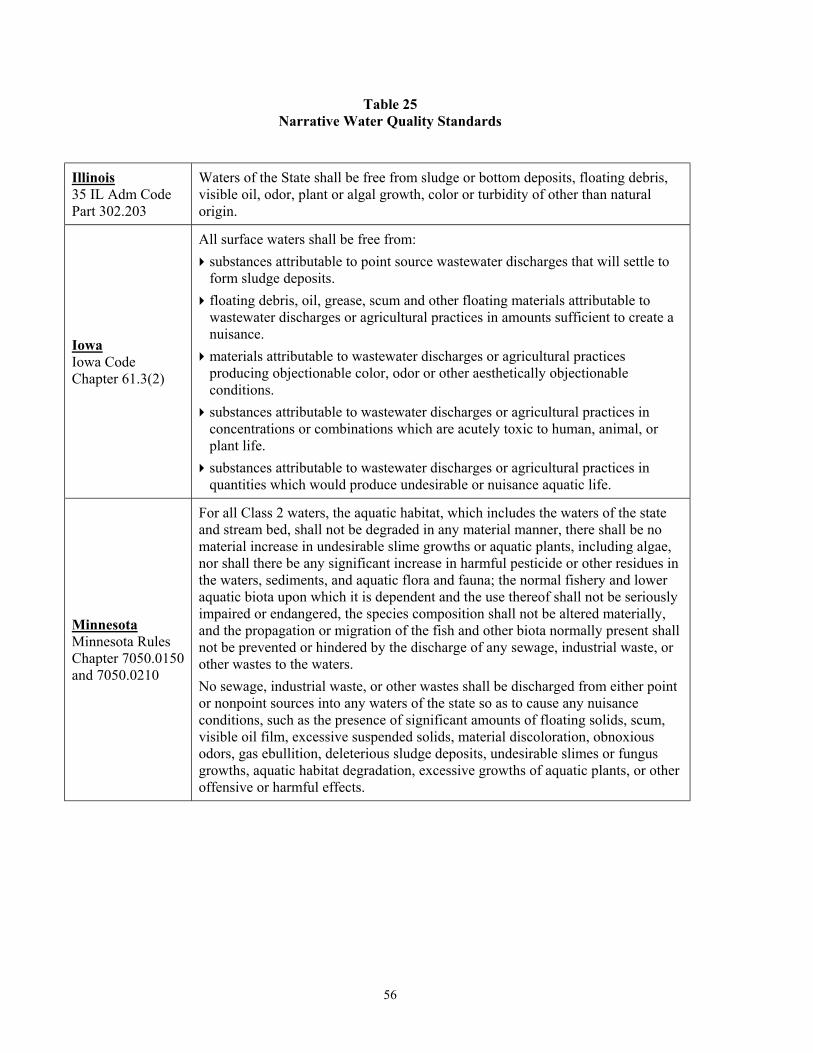
Table 25 Narrative Water Quality Standards
Illinois 35 IL Adm Code Part 302.203
Waters of the State shall be free from sludge or bottom deposits, floating debris, visible oil, odor, plant or algal growth, color or turbidity of other than natural origin.
Iowa Iowa Code Chapter 61.3(2)
All surface waters shall be free from: substances attributable to point source wastewater discharges that will settle to form sludge deposits. floating debris, oil, grease, scum and other floating materials attributable to wastewater discharges or agricultural practices in amounts sufficient to create a nuisance. materials attributable to wastewater discharges or agricultural practices producing objectionable color, odor or other aesthetically objectionable conditions. substances attributable to wastewater discharges or agricultural practices in concentrations or combinations which are acutely toxic to human, animal, or plant life. substances attributable to wastewater discharges or agricultural practices in quantities which would produce undesirable or nuisance aquatic life.
Minnesota Minnesota Rules Chapter 7050.0150 and 7050.0210
For all Class 2 waters, the aquatic habitat, which includes the waters of the state and stream bed, shall not be degraded in any material manner, there shall be no material increase in undesirable slime growths or aquatic plants, including algae, nor shall there be any significant increase in harmful pesticide or other residues in the waters, sediments, and aquatic flora and fauna; the normal fishery and lower aquatic biota upon which it is dependent and the use thereof shall not be seriously impaired or endangered, the species composition shall not be altered materially, and the propagation or migration of the fish and other biota normally present shall not be prevented or hindered by the discharge of any sewage, industrial waste, or other wastes to the waters. No sewage, industrial waste, or other wastes shall be discharged from either point or nonpoint sources into any waters of the state so as to cause any nuisance conditions, such as the presence of significant amounts of floating solids, scum, visible oil film, excessive suspended solids, material discoloration, obnoxious odors, gas ebullition, deleterious sludge deposits, undesirable slimes or fungus growths, aquatic habitat degradation, excessive growths of aquatic plants, or other offensive or harmful effects.
56

Missouri 10 CSR 20–7.031(3)
Waters shall be free from: substances in sufficient amounts to cause the formation of putrescent, unsightly or harmful bottom deposits or prevent full maintenance of beneficial uses; oil, scum and floating debris in sufficient amounts to be unsightly or prevent full maintenance of beneficial uses; substances in sufficient amounts to cause unsightly color or turbidity, offensive odor or prevent full maintenance of beneficial uses; substances or conditions in sufficient amounts to result in toxicity to human, animal or aquatic life; physical, chemical or hydrologic changes that would impair the natural biological community; used tires, car bodies, appliances, demolition debris, used vehicles or equipment and solid waste.
Wisconsin Wisconsin Administrative Code NR 102.04
Substances that will cause objectionable deposits on the shore or in the bed of a body of water, shall not be present in such amounts as to interfere with public rights in waters of the state. Floating or submerged debris, oil, scum or other material shall not be present in such amounts as to interfere with public rights in waters of the state. Materials producing color, odor, taste or unsightliness shall not be present in such amounts as to interfere with public rights in waters of the state. Substances in concentrations or combinations which are toxic or harmful to humans shall not be present in amounts found to be of public health significance, nor shall substances be present in amounts which are acutely harmful to animal, plant or aquatic life.
57

58

Chapter 6
Conclusions
The following conclusions were developed by the UMRBA Water Quality Task Force based on its discussions during the course of its Water Quality Coordination Project, which culminated in this report. MONITORING DATA
Water quality monitoring data on the Upper Mississippi River are currently inadequate for assessing use support and impairments. There are deficiencies in the amount of data, number of monitoring stations, and spatial coverage of existing monitoring. These shortcomings are the combined result of a variety of factors, including the challenges associated with assessing large rivers, data suitability, limited resources, lack of priority, and lack of a comprehensive water quality monitoring strategy.
Challenges of assessing large rivers — Large floodplain ecosystems, such as the Upper Mississippi River, are particularly difficult to assess due to their sheer size and the complexity of the riverine structure. Variations in main channel, side channel, and backwater conditions are abundant. Due to dilution in a river of this size, many localized water quality phenomena cannot be detected without intensive monitoring and, in many instances, contaminants are present in concentrations below current analytical detection limits. Furthermore, the ability to extrapolate site-specific data to larger river reaches is limited. In addition, developing contaminant-specific, biological and nutrient criteria for large rivers is challenging due to the size and complexity of the aquatic environment. Suitability of data — While water quality monitoring is being conducted and special studies undertaken on many areas of the river, the resulting data are not always particularly well-suited for Clean Water Act reporting needs, i.e. for determining use support under Section 305(b), identifying impaired reaches under Section 303(d), or developing TMDLs. In particular, there is a growing body of monitoring data and analysis related to biological and ecological functions and problems on the river. While useful for its intended natural resource
management purposes, this information can be difficult to relate to state water quality standards other than, in some instances, aquatic life standards. Limited resources — State and federal water quality monitoring programs are seriously underfunded, affecting the spatial coverage of the data, range of parameters monitored, and ability to collect data with appropriate frequency and quality assurance. While inadequate funding has certainly limited water quality monitoring on the Upper Mississippi River, this is, in fact, a widely recognized and significant nationwide problem. Lack of priority — Statewide water quality monitoring programs generally emphasize interior streams and lakes, with relatively little attention to border waterbodies, such as the Upper Mississippi River. In part, this can be attributed to the states’ sobering recognition that limited resources need to be focused on waterbodies where monitoring can have its largest impact and for which the state has a unique interest. As a large, complex, federally managed and shared border river, the Upper Mississippi River is often not among the states’ top priorities. Lack of water quality monitoring strategy — There is currently no comprehensive strategy for
59

monitoring water quality use support and impairment on the Upper Mississippi River. Although some states have established monitoring sites on the river and the USGS Long Term Resource Monitoring Program collects water quality data at its five UMR field stations, there is no integrated or coordinated systemwide
strategy for water quality monitoring. The Upper Mississippi River Conservation Committee’s Water Quality Technical Section is among those who have identified the need for enhanced coordination of state, federal, and local water quality monitoring efforts, with special attention to those areas where limited data are available.
DATA SHARING
The extent to which states utilize Upper Mississippi River water quality data from other sources varies considerably. Even when a state reviews data from outside its own water quality program, the data may not ultimately be used in making the state’s use support or impairment decisions. Reasons for limited interstate and interagency data sharing and utilization include data accessibility, admissibility, applicability, and availability, as well as time limitations.
Data accessibility — Data from state and local water quality monitoring programs is often difficult to access by outside parties. While U.S. EPA’s STORET system was designed to make water quality data from a variety of sources nationwide broadly accessible, states report a number of problems with using STORET, since it was redesigned in 1999. Thus, neighboring states’ data must often be alternatively obtained directly through personal contacts with staff in those adjacent states. Accessibility also appears to have been a problem for some states with regard to data from the Long Term Resource Monitoring Program (LTRMP). However, USGS is working with states to coordinate improvements to the current query tool used for accessing LTRMP data, and is considering development of a web-enabled browser for water quality data. Discussions regarding possible training sessions on accessing the data are also underway. Data admissibility and applicability — While some states do, in fact, review outside data sources when preparing their 303(d) lists or 305(b) reports, they may reject the data as being unsuitable or noncompliant with their rules or guidance related to data. Although outside data sources, per se, are not precluded, their use may
be effectively constrained by requirements related to data age, sampling frequency, or other monitoring and analysis protocols. In addition, the types of parameters may not be relevant for determining use support or impairment under the state’s standards (e.g. dissolved versus total metals). Lack of data — In some cases, there simply may not be data available, other than what the state itself collects. For example, Illinois’ use of water quality data from other sources is limited because Illinois’ neighbor states (Iowa and Missouri) collect little data on the Upper Mississippi River. Time limitations — The biennial Clean Water Act reporting cycle can limit states’ ability to seek out and adequately evaluate all available data. In states where preparation of the 303(d) list is subject to the state rule-making process, that 2-year timeframe is effectively shortened. Gathering and analysis of “existing and readily available” data collected by other than designated state water quality agencies can require considerable time and effort. Illinois is seeking to streamline the process by limiting the outside data used for its 303(d) listings to useful data collected under jointly signed Quality Assurance Project Plans.
60

NUMERIC CRITERIA
Existing chemical and physical numeric criteria are not sufficient to fully assess Upper Mississippi River ecosystem health. Additional tools are required, including large river biocriteria, indicators of nonpoint source impairments, and numeric criteria embodied in standards.
Large river biocriteria — Although many states use biocriteria to assess streams and wadeable rivers, the states have yet to develop and adopt biocriteria appropriate for assessing large floodplain river systems like the Upper Mississippi River. Given that the Upper Mississippi River has been designated for aquatic life use by all five states, the absence of suitable biocriteria is a significant shortcoming. This is particularly an issue with regard to nutrient criteria, given that biological response to elevated nutrient levels in large rivers is inadequately understood. Information from the USGS Long Term Resource Monitoring Program and EPA’s Environmental Monitoring and Assessment Program effort may provide a foundation for future efforts. Indicators of nonpoint source impairment — While nonpoint source pollution is widely recognized as the primary threat to the water quality of the Upper Mississippi River, there currently are no generally-accepted numeric indicators of impairment due to sedimentation or turbidity. Relating sedimentation and turbidity to impairment of the aquatic life use is particularly challenging. Listing criteria used for small streams, such as percent of streambed covered by silt, are not appropriate for large rivers. In addition, given the vast spatial and temporal scales underlying changes in the Mississippi River, it is difficult to distinguish natural processes from human influence for the purpose of making impairment decisions. Developing indicators of impairment due to sediment will require, among other things, further definition of
the biological impacts of sedimentation and turbidity. In that regard, work underway by the UMRCC Water Quality Technical Section to define criteria to protect submersed aquatic vegetation will be quite helpful. Numeric criteria for nutrients are also limited, though closer to development than sediment criteria. In addition, there are some new pesticides for which states do not yet have criteria. Numeric criteria in standards — States’ water quality standards often include narrative criteria that could be or, in some cases, are used for determining impairments. However, narrative criteria do not generally provide as clear and defensible of a basis for state impairment decisions as do numeric criteria. Therefore, narrative standards are much less frequently used by either states or U.S. EPA. In addition, narrative standards afford only non-specific targets for implementing TMDLs, in those instances where they are used as a basis for impairment decisions. Moreover, the courts have traditionally substantially limited U.S. EPA’s discretion to interpret state narrative standards. Incorporating biocriteria and expanded numeric criteria for sediment and nutrients into state standards would facilitate a more comprehensive approach to assessing and protecting water quality on the Upper Mississippi River. However, developing numeric criteria for sediment, in particular, will be extremely challenging, given the need to recognize the differences between sediment transport in natural and impounded river systems.
61
INCONSISTENCIES AMONG THE STATES
There are a variety of inconsistencies among the five states’ 305(b) assessments and 303(d) impairment lists for the Upper Mississippi River. These inconsistencies are the result of differences in data interpretation and utilization, river functions and uses, and state water quality standards.
Data interpretation and utilization — Differences among the states’ water quality assessments and listings on the Upper Mississippi River are due, in part, to differences in how they use data to make these determinations. Their protocols and processes may reflect different parameters, trigger points, statistical guidelines, use of fish consumption advisories, reliance on best professional judgment, etc. In addition, states may differ in the extent to which they use data to list or delist localized impairments. River uses — The character and function of the Upper Mississippi River vary from north to south and bank to bank. To some extent, these differences are reflected in the designated uses that states assign to the river. Thus, although all
five states designate the Upper Mississippi River for aquatic life use, there are differences in where and how drinking water and recreation uses are designated. State standards — In so far as water quality standards serve as the fundamental basis for assessments and listings, differences among state standards account, in part, for the inconsistencies in Upper Mississippi River 305(b) assessments and 303(d) listings. While the designated use categories states employ in their standards vary, there are more significant differences in the narrative and numeric criteria established to protect those uses and in the way in which those criteria are interpreted and implemented.
SIGNIFICANCE OF DIFFERENCES
Some of the differences on the Upper Mississippi River among the states’ standards, 305(b) assessments, and 303(d) listings are explainable and appropriate. However, the fundamental question of whether the states’ differences, in reality, lead to unequal levels of protection has yet to be determined.
Differences among the states in their implementation of the Clean Water Act are not necessarily problematic. Indeed, the Clean Water Act explicitly confers broad latitude upon the states. While federal regulations require a state to “ensure that its water quality standards provide for the attainment and maintenance of the water quality standards of downstream waters,”
uniformity of standards and listing decisions is not necessarily the objective. Thus, state actions on shared waterbodies should be consistent with this requirement, but need not be identical. Whether the differences on the Upper Mississippi River among the five states’ water quality standards afford differing levels of protection requires further evaluation.
62

POTENTIAL FOR ENHANCED CONSISTENCY
Enhanced consistency and coordination of water quality management on the Upper Mississippi River is both necessary and possible. Indeed, the UMRBA Water Quality Task Force and UMRCC Water Quality Technical Section have both helped to make important progress on interstate issues. Yet many coordination challenges remain. In the short-term, potential areas of emphasis include assessment reaches, interstate consultations on 305(b) assessments and 303(d) listings, fish consumption advisories, and water quality monitoring strategies.
Assessment reaches — Currently, each of the five states divides the Upper Mississippi River into different segments for the purpose of assessments and listing decisions. Utilizing the same set of minimum interstate assessment reaches would be the first step toward harmonizing state approaches. Toward that end, the states have executed a Memorandum of Understanding defining a set of 13 reaches on the upper river, between the mouth of the Ohio River and the mouth of the St. Croix River, based on USGS Hydrologic Unit Codes. Utilizing the same minimum set of assessment reaches in the future will facilitate consistency among the states in their Clean Water Act reporting, help to focus interstate discussions on more substantive water quality issues, provide a basis for future water quality monitoring strategies, and improve public understanding of water quality issues on the Upper Mississippi River. Interstate Consultations — While there are a variety of reasons why states’ 305(b) assessments and 303(d) listings differ on the Upper Mississippi River, at least some of those differences could potentially be eliminated if an interstate consultation process is established. Such consultations would provide an opportunity for staff in state environmental protection agencies, who are responsible for preparing the states’ assessments and listings, to collectively review available data, seek consistent interpretation of data, and coordinate their respective determinations. While such consultations will not necessarily result in
uniformity on the Upper Mississippi River, they will help to explain the bases for the differences that may, in fact, still emerge. Fish Consumption Advisories — Fish consumption advisories on the Upper Mississippi River vary from state to state. In general, there are differences in methodologies for sampling and analyzing contaminant concentrations in fish, the fish tissue concentrations that trigger state advisories, and how the advisories are used in state 303(d) listing decisions. Of particular note, the UMR states in U.S. EPA Region 5 use the Great Lakes Sport Fish Consumption Advisory Protocol for their fish advisories on the river, while in Region 7, Iowa uses the FDA action levels and Missouri uses U.S. EPA’s risk assessment method. Yet there is potential for enhanced consistency, particularly on the Upper Mississippi River. Monitoring strategy — The need for a comprehensive strategy to monitor water quality use support and impairment on the Upper Mississippi River is widely recognized. Despite the fact that states currently devote differing levels of resources to water quality monitoring on the Upper Mississippi River, there is certainly potential, at a minimum, to enhance coordination of those efforts. Furthermore, a long term comprehensive strategy for water quality monitoring could provide the foundation for ultimately expanding monitoring efforts on the Upper Mississippi River, as well as maximizing the effectiveness of existing efforts.
63

LIMITATIONS
Despite the potential for enhanced consistency, there are limitations to achieving uniformity in water quality standards, 305(b) assessments, and 303(d) listing decisions on the Upper Mississippi River. Constraints include intrastate consistency considerations, state law and regulation, and time and resources.
Intrastate consistency — There is often an inherent tension between inter- and intrastate consistency. A state’s interest in maintaining congruent water quality standards and bases for use support and impairment decisions statewide may be at odds with efforts to achieve interstate consistency on a shared waterbody, such as the Upper Mississippi River. State law and regulation — The latitude afforded to state environmental protection agencies in fulfilling their Clean Water Act assessment and listing responsibilities may be limited by state law or administrative process. In particular, when a state’s 303(d) listing decisions are subject to the state rule-making process or when state statutes, like Iowa’s credible data law, prescribe evaluation methodologies, there may be limited opportunities for the agency to align its
methodologies and decisions with those of neighboring states. Time and resources — Developing consistent assessments and listings for the Upper Mississippi River, in concert with neighboring states, will undoubtedly require more effort than individual states and U.S. EPA currently devote to this particular waterbody. The time available in a 2-year reporting cycle is one of the limiting factors, constraining what can reasonably be expected to be achieved. In addition, special efforts on the Upper Mississippi River must compete with other priorities, many of which are set for the states by U.S. EPA. Thus, enhanced interstate coordination efforts on the Upper Mississippi River will require additional funding and/or a readjustment of existing priorities.
TOTAL MAXIMUM DAILY LOADS (TMDLS)
Developing TMDLs on interstate waters such as the Upper Mississippi River will be a significant challenge due to scientific complexity, differences in state standards and impairment listings, political and policy implications, lack of resources and priority, and the absence of a mechanism for interstate coordination.
Scientific complexity — The large spatial extent and geomorphic diversity of the Upper Mississippi River watershed contributes to the scientific complexity of developing TMDLs, particularly with regard to modeling. If distant downstream impacts, such as hypoxia in the Gulf of Mexico, are the target of the TMDL, those complexities are even more challenging.
Differences in state standards and impairment listings — Identifying the target for an Upper Mississippi River TMDL is currently challenging due to differences in state standards and impairment listings. Given those differences, it is not always obvious for which pollutant and numeric standard the TMDL would allocate source loads.
64

Political and policy implications — When sources of pollutants quite distant from the impacted area are expected to reduce their loadings as part of a TMDL, political and policy concerns may arise. This is also true for sources in other political jurisdictions, regardless of their distance from the area of impairment. While such issues can be problematic for TMDL development in any watershed, the vast size and interstate setting of the Upper Mississippi River magnify these concerns. Lack of resources and priority — Given the significant scientific, modeling, political, and coordination challenges associated with developing TMDLs on the Upper Mississippi River, additional resources and an enhanced level of priority will be required. In particular, U.S. EPA will need to exercise leadership that extends beyond the review and approval role it performs with regard to TMDLs in general.
Mechanism for Interstate Coordination — There is no mechanism currently available for coordinating development of TMDLs on the Upper Mississippi River. Nor do U.S. EPA’s 1992 regulations, which currently govern TMDLs, address the unique challenges of TMDLs on interstate waters. States are willing to work together on the Upper Mississippi River, but look to U.S. EPA for leadership. At the same time, it is inappropriate and unrealistic for U.S. EPA itself to unilaterally establish TMDLs. Yet simply requiring states through regulation to “consult” or “jointly develop” TMDLs is insufficient and does not fulfill U.S. EPA’s unique responsibilities for interstate waters. Rather, what must be established on the Upper Mississippi River is a cooperative process led by U.S. EPA, but involving all key players in a coordinated effort.
65

66

References
In addition to the documents and personal communications identified below, material from the web sites listed on pages 73-75 was also used in preparation of this report.
Baumann, James. Special Assistant to Bureau Director, Bureau of Watershed Management,
Department of Natural Resources. (Personal communication) Brinsmade, Elizabeth. Minnesota Pollution Control Agency. (Personal communication) Carlson, Gale. Chief of Assessment, Section for Environmental Public Health, Missouri
Department of Health and Senior Services. (Personal communication) Clean Water Act. Title 33, Water Pollution Prevention and Control, Federal Water Pollution
Control Act (33 U.S.C.A. §§ 1251 to 1387). Clifford, Sharon. TMDL Coordinator, Water Pollution Control Program, Missouri Department of
Natural Resources. (Personal communication) Ford, John. Environmental Specialist, Water Pollution Control Program, Missouri Department of
Natural Resources. (Personal communication) General Accounting Office. January 2002. Water Quality: Inconsistent State Approaches
Complicate Nation’s Efforts to Identify Its Most Polluted Waters. Report to Congressional Requesters.
General Accounting Office. January 2003. Water Quality, Improved EPA Guidance and Support
Can Help States Develop Standards That Better Target Cleanup Efforts. Report to Chairman, Subcommittee on Water Resources and Environment, Committee on Transportation and Infrastructure, House of Representatives.
Good, Gregg. Illinois Environmental Protection Agency. (Personal communication) Hotka, Louise. Monitoring Coordinator, Lakes and Streams Unit, Minnesota Pollution Control
Agency. (Personal communication) Illinois Administrative Code. Title 35: Environmental Protection, Subtitle C: Water Pollution,
Chapter 1: Pollution Control Board. Illinois Environmental Protection Agency. December 2001. Determining Resource Quality and
Potential Reasons for Impairment of Illinois Streams, Inland Lakes and Lake Michigan. Bureau of Water.
Illinois Environmental Protection Agency. July 2002. Illinois Water Quality Report 2002 (Clean
Water Act, Section 305(b) Report). Bureau of Water.
67

Illinois Environmental Protection Agency. August 2002. Water Monitoring Strategy 2002- 2006.
Bureau of Water. Illinois Environmental Protection Agency. 2002. Draft Section 303(d) List. Bureau of Water. Iowa Department of Natural Resources. March 2000. Iowa Water Monitoring Plan 2000.
Environmental Services Division. Iowa Department of Natural Resources. August 2002. Excerpts from the Summary of Section
305(b) Assessments Developed for Mississippi River Waterbody Segments. Water Quality Bureau.
Iowa Department of Natural Resources. August 2002. Methodology for Developing Iowa’s 2002
Section 303(d) List of Impaired Waters. Water Quality Bureau. Iowa Department of Natural Resources. Iowa’s 2002 303(d) List. Water Quality Bureau. Iowa Department of Natural Resources. No date. Waterbody specific rationale for those
waterbodies and impairments on the 1998 303(d) list, but not included on the 2002 303(d) list. Iowa Department of Natural Resources. December 2002. Public Participation Responsiveness
Summary for the Section 303(d) List of Impaired Waters. Environmental Services Division. Iowa Administrative Rules, Chapter 61: Water Quality Standards. Markus, Howard. Minnesota Pollution Control Agency. (Personal communication) McCollor, Sylvia. Minnesota Pollution Control Agency. (Personal communication) Minnesota Pollution Control Agency. April 2002. Guidance Manual for Assessing the Quality of
Minnesota Surface Water For Determination of Impairment. 305(b) and 303(d) List. Environmental Outcomes Division.
Minnesota Pollution Control Agency. March 2003. Minnesota’s Impaired Waters, Report to the
Legislature, including Appendices. Minnesota Pollution Control Agency. 2002 Minnesota Water Quality: Surface Water Section.
Report to the Congress of the United States. Water Years 2000-01. Minnesota Pollution Control Agency. October 2002. Regional Total Maximum Daily Load
Evaluation of Fecal Coliform Bacteria Impairments in the Lower Mississippi River Basin in Minnesota.
Minnesota Pollution Control Agency. January 2003. Guidance Manual for Assessing the Quality
of Minnesota Surface Waters for the Determination of Impairment. 305(b) Report and 303(d) List.
68

Minnesota Pollution Control Agency. 2003. Final MPCA 2002 CWA 303(d) TMDL List. Environmental Outcomes Division.
Minnesota Rules. Chapter 7050 MN Pollution Control Agency, Waters of the State. Missouri Code of State Regulations, Title 10: Department of Natural Resources, Division 20:
Clean Water Commission, Chapter 7: Water Quality. Missouri Department of Natural Resources. March 2001. Methodology for the Development of the
2002 Section 303(d) List in Missouri. Water Pollution Control Program. Missouri Department of Natural Resources. December 2001. Missouri Water Quality Report,
2002. Water Pollution Control Program. Missouri Department of Natural Resources. June 7, 2002. Public Notice of Proposed Final
Missouri Section 303(d) List. Water Pollution Control Program. Missouri Department of Natural Resources. August 2002. Total Maximum Daily Load
Information Sheet: Mississippi River. Water Pollution Control Program. Office of Inspector General. September 27, 2001. Inconsistencies in States’ Listings of Impaired
Waterbodies May Delay TMDL Development and Implementation. Water Audit Report No. 10018-2000-P-1225.
National Research Council. 2002. Opportunities to Improve the U.S. Geological Survey National
Water Quality Assessment Program. National Academy Press, Washington, D.C. Olson, John. Environmental Specialist Senior, Water Resources Section, Iowa Department of
Natural Resources. (Personal communication) Risberg, Jeff. Minnesota Pollution Control Agency. (Personal communication) Senjem, Norman. Mississippi River Basin Coordinator, Minnesota Pollution Control Agency.
(Personal communication) Short, Matt. Environmental Protection Specialist, Surface Water Section, Division of Water
Pollution Control, Illinois Environmental Protection Agency. (Personal communication) Sullivan, John. Mississippi River Water Quality Specialist, Wisconsin Department of Natural
Resources. (Personal communication) Talbot, Linda. Bureau of Watershed Management, Wisconsin Department of Natural Resources.
(Personal communication) Upper Mississippi River Conservation Committee, Water Quality Section. March 2002. Upper
Mississippi River Water Quality Asssessment.
69
U.S. Army Corps of Engineers. December 1997. Appendix A: The Long Term Resource Monitoring Program. An Evaluation of the Upper Mississippi River System Environmental Management Program. Mississippi Valley Division.
U. S. Environmental Protection Agency. September 1997. Guidelines for Preparation of the
Comprehensive State Water Quality Assessments (305(b) Reports) and Electronic Updates: Report Contents. Office of Water, Office of Science and Technology.
U. S. Environmental Protection Agency. July 2002. Consolidated Assessment and Listing
Methodology, First Edition. Office of Wetlands, Oceans and Watersheds. U. S. Environmental Protection Agency. May 2002. Draft Strategy for Water Quality Standards
and Criteria. Office of Water, Office of Science and Technology. U. S. Environmental Protection Agency. November 19, 2001. 2002 Integrated Water Quality
Monitoring and Assessment Report Guidance. Office of Wetlands, Oceans and Watersheds. U. S. Environmental Protection Agency. 2002. National Recommended Water Quality Criteria.
Office of Water, Office of Science and Technology. U.S. Environmental Protection Agency, Region 5. 2002. State of the Waters Report.
http://www.epa.gov/R5water/sotw2002.htm#SOTW2002 U. S. Environmental Protection Agency. March 2003. Elements of a State Water Monitoring and
Assessment Program. Assessment and Watershed Protection Division. Office of Wetlands, Oceans and Watershed.
U.S. Environmental Protection Agency, Region 7. April 29, 2003. Letter to Jim Hull, Missouri
Department of Natural Resources from Leo Alderman, Region 7 EPA, with Enclosures. U. S. Environmental Protection Agency. National Water Quality Standards Database.
http://www.epa.gov/wqsdatabase U.S. Environmental Protection Agency. Overview of Current Total Maximum Daily Load – TMDL
– Program and Regulations, http://www.epa.gov/owow/tmdl.overviewfs.html U.S. Geological Survey. Long Term Resource Monitoring Program Spatial Data Query and
Visualization Tool. Upper Midwest Environmental Sciences Center. http://www.umesc.usgs.gov/spatial-tech/dolsen_5001309.html
U.S. Geological Survey. NWIS Web Data for the Nation. http://waterdata.usgs.gov/nwis U.S. Geological Survey. Water Resources Data Missouri, Water Year 2002. U.S. Geological Survey. Water Resources of Missouri. http://mo.water.usgs.gov Wisconsin Administrative Code: Chapter NR 102 – Water Quality Standards for Wisconsin
Surface Waters.
70

Wisconsin Department of Natural Resources. 1996 Addendum. Wisconsin Water Quality
Assessment Report. Wisconsin Department of Natural Resources. 2000. Wisconsin Water Quality Assessment Report
to Congress. Division of Water. Wisconsin Department of Natural Resources. February 2001. WDNR Technical Guidance,
Monitoring and Model Selection for TMDL Development. Bureau of Watershed Management. Wisconsin Department of Natural Resources. 2002. Wisconsin Water Quality Report to Congress,
2002. Division of Water. Wisconsin Department of Natural Resources. 2002. Wisconsin’s 303(d) Strategy. Division of
Water. Wisconsin Department of Natural Resources. Proposed Changes to Wisconsin’s 2002 Impaired
Water’s List. Division of Water. Wisconsin Department of Natural Resources. 2002. Choose Wisely: A Health Guide for Eating
Fish in Wisconsin.
71

72
Related Web Sites Illinois
Illinois Environmental Protection Agency, Bureau of Water http://www.epa.state.il.us/water/
Water Quality Standards http://www.epa.state.il.us/water/water-quality-standards/index.html
305(b) Assessment http://www.epa.state.il.us/water/water-quality/index.html
303(d) Impaired Waters http://www.epa.state.il.us/water/tmdl/303d-list.html
Total Maximum Daily Loads (TMDLs) http://www.epa.state.il.us/water/tmdl/index.html
Drinking Water/Public Water Supply http://www.epa.state.il.us/water/index-pws.html
Fish Consumption Advisories http://www.idph.state.il.us/envhealth/fishadv/fishadvisory03.htm
Iowa
Iowa Department of Natural Resources, Water Quality Bureau http://www.state.ia.us/epd/wtrq/wtrqbur.htm
Water Quality Standards http://www.state.ia.us/epd/wtresrce/wquality/files2/chapter61.pdf
305(b) Assessment http://www.iowadnr.com/water/tmdlwqa/wqa/305b.html
303(d) Impaired Waters http://www.iowadnr.com/water/tmdlwqa/wqa/303d.html
Total Maximum Daily Loads (TMDLs) http://www.iowadnr.com/water/tmdlwqa/index.html
Drinking Water/Public Water Supply http://www.state.ia.us/epd/wtrsuply/wtrsup.htm
Minnesota
Minnesota Pollution Control Agency (Water)
http://www.pca.state.mn.us/water/index.html Water Quality Standards
http://www.pca.state.mn.us/water/standards/rulechange.html 305(b) Assessment
http://www.pca.state.mn.us/water/basins/305briver.html 303(d) Impaired Waters
http://www.pca.state.mn.us/water/tmdl.html#tmdl Total Maximum Daily Loads (TMDLs)
http://www.pca.state.mn.us/water/tmdl.html Drinking Water/Public Water Supply
http://www.health.state.mn.us/divs/eh/water/index.html Fish Consumption Advisories
http://www.health.state.mn.us/divs/eh/fish/index.html
73

Missouri Missouri Department of Natural Resources, Water Pollution Control Program
http://www.dnr.state.mo.us/wpscd/wpcp/homewpcp.htm Water Quality Standards
http://www.dnr.state.mo.us/wpscd/wpcp/wqstandards/wq_standard_hm.htm 303(d) Impaired Waters
http://www.dnr.state.mo.us/wpscd/wpcp/wpc-tmdl.htm Total Maximum Daily Loads (TMDLs)
http://www.dnr.state.mo.us/wpscd/wpcp/wpc-tmdl.htm Drinking Water/Public Water Supply
http://www.dnr.state.mo.us/wpscd/pdwp/homepdwp.htm Fish Consumption Advisories
http://www.dhss.state.mo.us/ehcdp/02FishAdvisory.pdf Wisconsin
Wisconsin Department of Natural Resources, Bureau of Watershed Management
http://www.dnr.state.wi.us/org/water/wm/ Water Quality Standards
http://www.dnr.state.wi.us/org/water/wm/wqs/index.htm 305(b) Assessment
http://www.dnr.state.wi.us/org/water/wm/watersummary/Waterqualityassessment.html 303(d) Impaired Waters
http://www.dnr.state.wi.us/org/water/wm/wqs/303d/303d.html Total Maximum Daily Loads (TMDLs)
http://www.dnr.state.wi.us/org/water/wm/wqs/303d/index.html Drinking Water/Public Water Supply
http://www.dnr.state.wi.us/org/water/dwg/ Fish Consumption Advisories
http://www.dnr.state.wi.us/org/water/fhp/fish/advisories/Index.htm
U.S. Environmental Protection Agency
Office of Water http://www.epa.gov/OW/index.html
EPA Mississippi River Basin http://www.epa.gov/msbasin/
Region 5 http://www.epa.gov/region5/water/
Region 7 http://www.epa.gov/region7/water
STORET http://www.epa.gov/STORET/
Environmental Monitoring and Assessment Program (EMAP) http://www.epa.gov/emap/index.html
Water Quality Standards Database http://www.epa.gov/wqsdatabase/
Water Quality Monitoring and Assessment http://www.epa.gov/owow/monitoring/
74
U.S. Environmental Protection Agency (continued) Total Maximum Daily Load (TMDL)
http://www.epa.gov/owow/tmdl/ Ground Water and Drinking Water
www.epa.gov/safewater/ Fish Advisories
www.epa.gov/OST/fishadvice/ U.S. Geological Survey
Water Quality Information http://water.usgs.gov/owq/
National Water Information System (NWIS) http://waterdata.usgs.gov/nwis
National Water Quality Assessment Program (NAWQA) http://water.usgs.gov/nawqa/
Long Term Resource Monitoring Program (LTRMP) http://www.umesc.usgs.gov/ltrmp.html
75

Upper Mississippi River Basin Association 415 Hamm Building, 408 St. Peter Street St. Paul, Minnesota 55102 651-224-2880 (phone) 651-223-5815 (fax) www.umrba.org
Related Documents