Updated Emission Inventories from Industrial Sector in Thailand for 2013 Narisara Thongboonchoo, Wattanachai Chawalitchaichan Department of Chemical Engineering, Faculty of Engineering, King Mongkut’s Institute of Technology Ladkrabang, Bangkok, Thailand International Meeting on Land Use and Emissions in South/Southeast Asia Ho Chi Minh City, Vietnam, October 17‐19th, 2016

Welcome message from author
This document is posted to help you gain knowledge. Please leave a comment to let me know what you think about it! Share it to your friends and learn new things together.
Transcript
Updated Emission Inventories fromIndustrial Sector in Thailand for 2013Narisara Thongboonchoo, Wattanachai Chawalitchaichan
Department of Chemical Engineering, Faculty of Engineering, King Mongkut’s Institute of Technology Ladkrabang, Bangkok, Thailand
International Meeting on Land Use and Emissions in South/Southeast AsiaHo Chi Minh City, Vietnam, October 17‐19th, 2016
2
Outline
3
4
Introduction & Previous work1
2 Objectives and Scope of Work
3
Methodology3
4 Results
Conclusions5
3
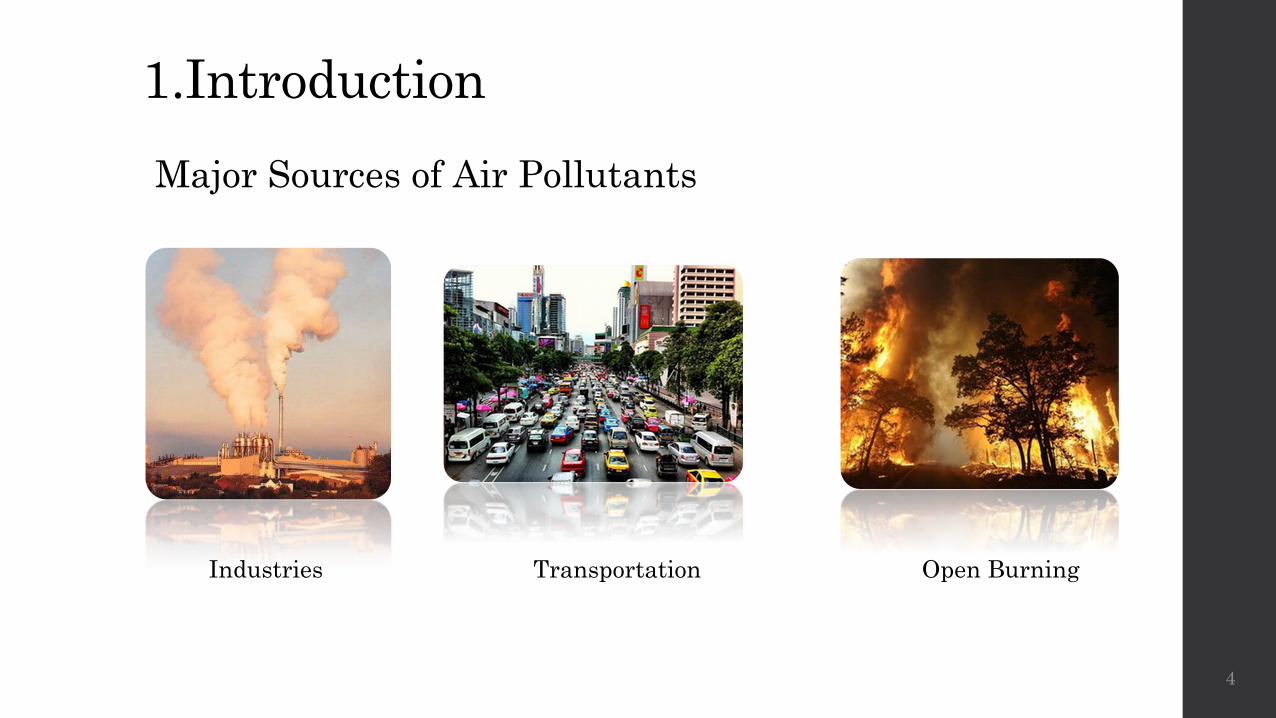
1.Introduction
4
Major Sources of Air Pollutants
Industries Transportation Open Burning
1. Previous Work on Emission Inventory
5
6
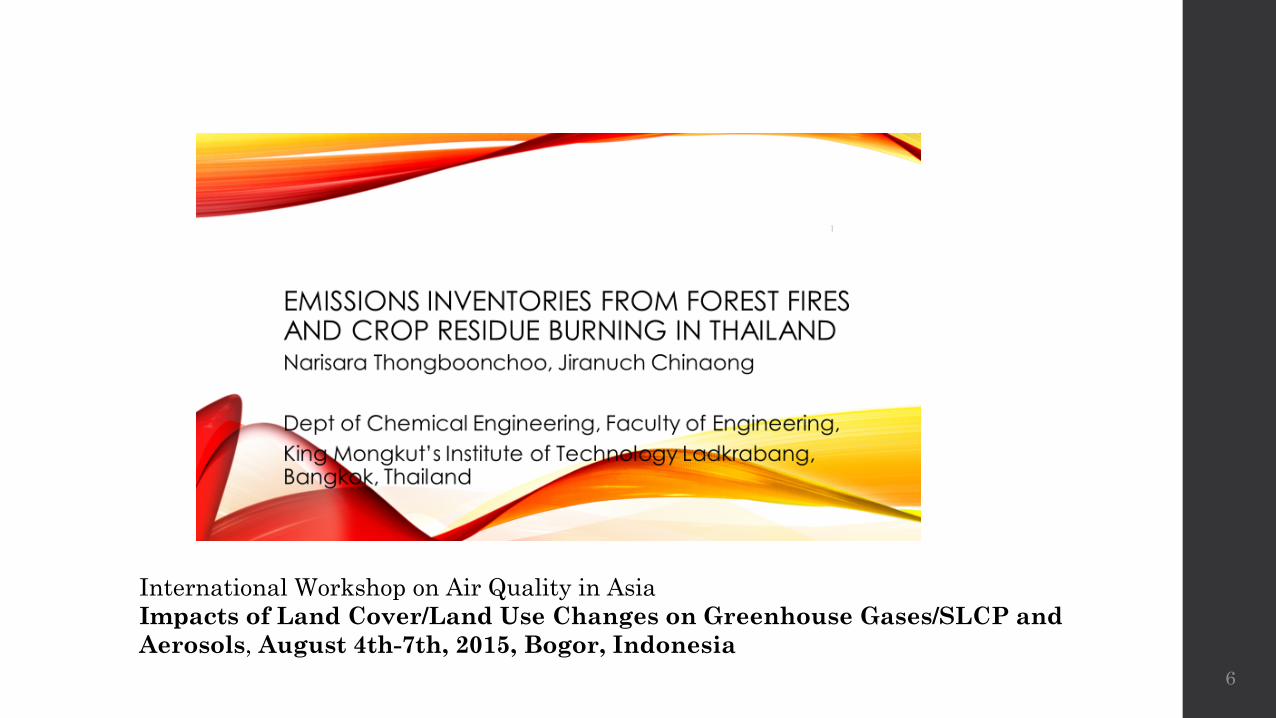
International Workshop on Air Quality in AsiaImpacts of Land Cover/Land Use Changes on Greenhouse Gases/SLCP and Aerosols, August 4th-7th, 2015, Bogor, Indonesia

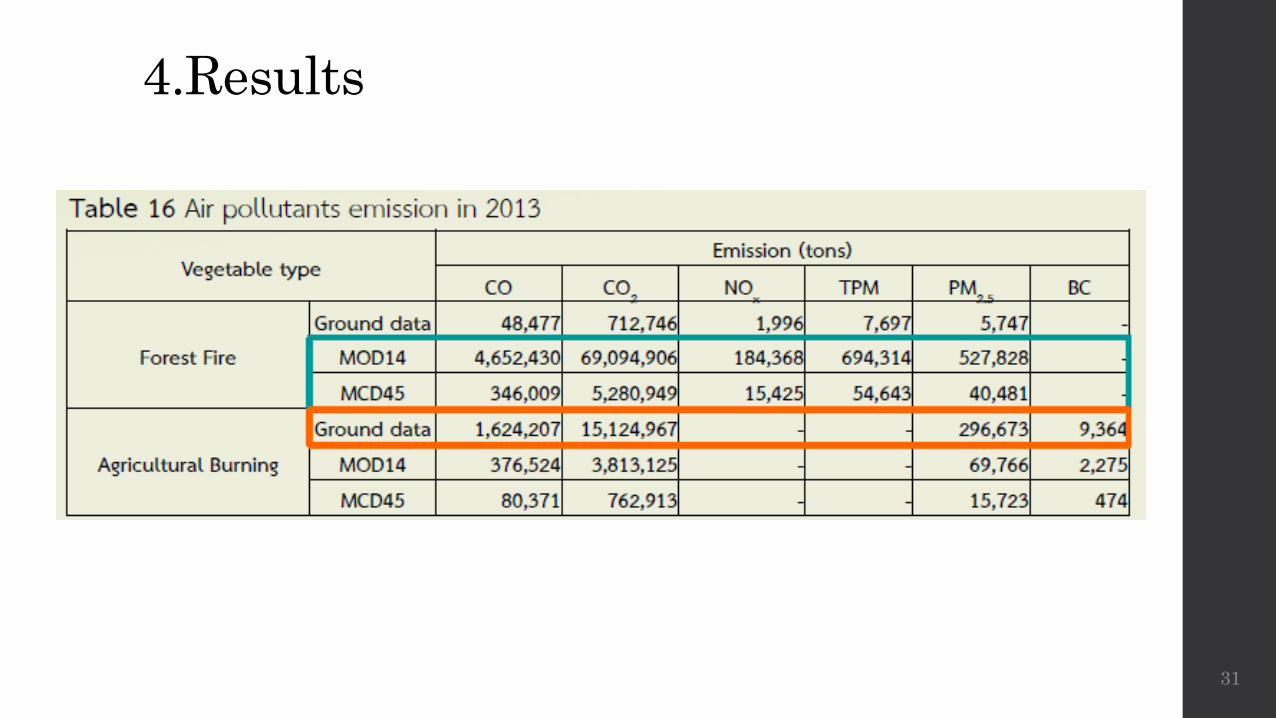
Estimate air pollutants emission from biomass open burning in agricultural area and forest fire by using the Satellite based and ground report fire data for year 2010-2013.
CO
PM2.5
CO2
NOx
TPM
BC
7
Objectives
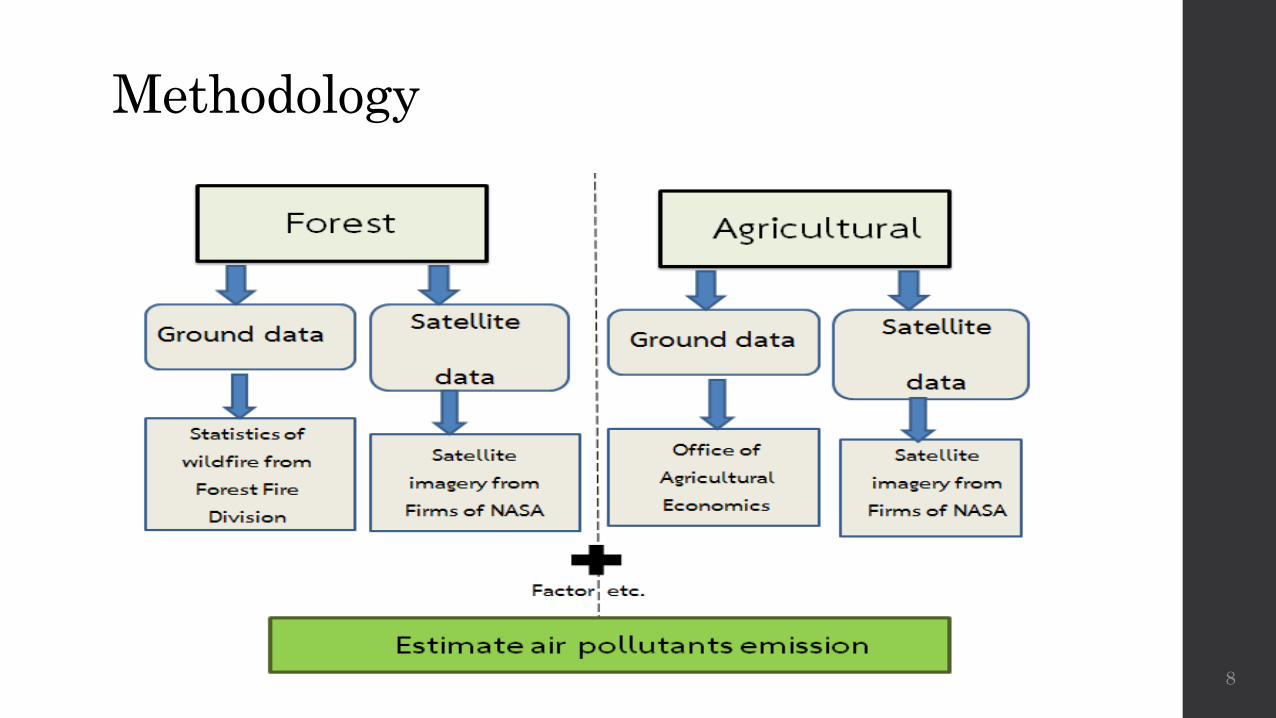
Methodology
8
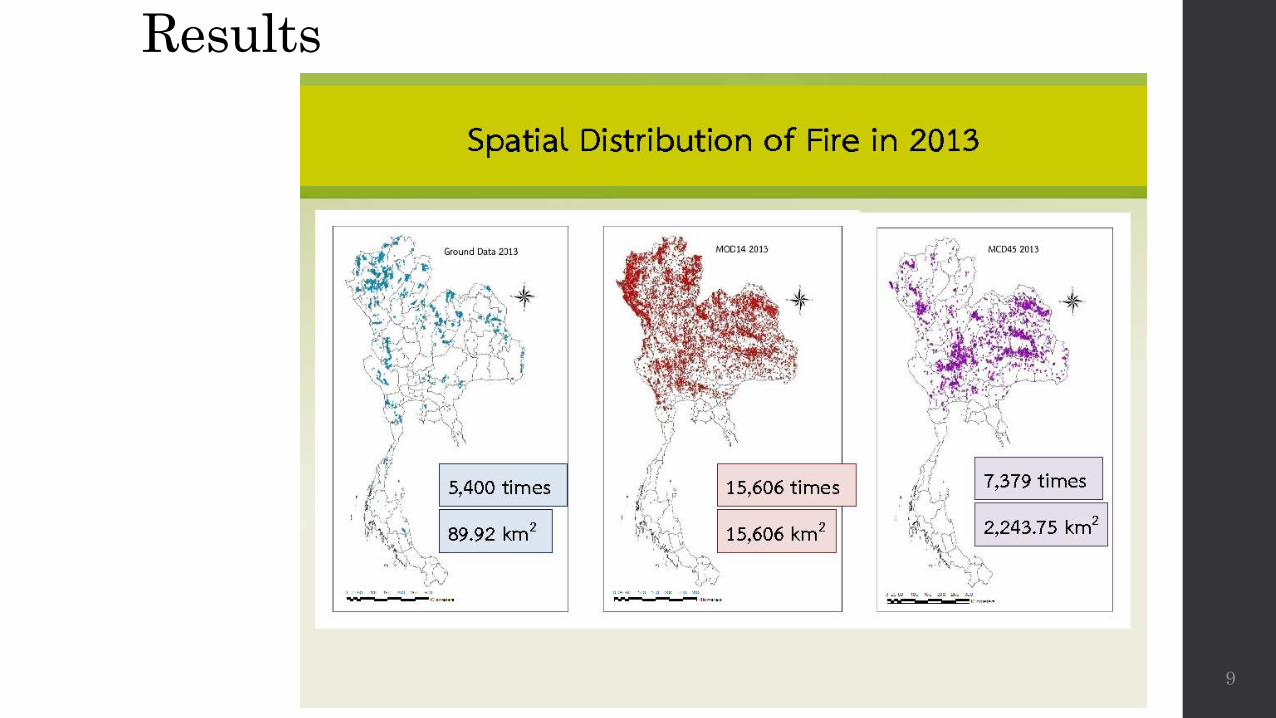
Results
9
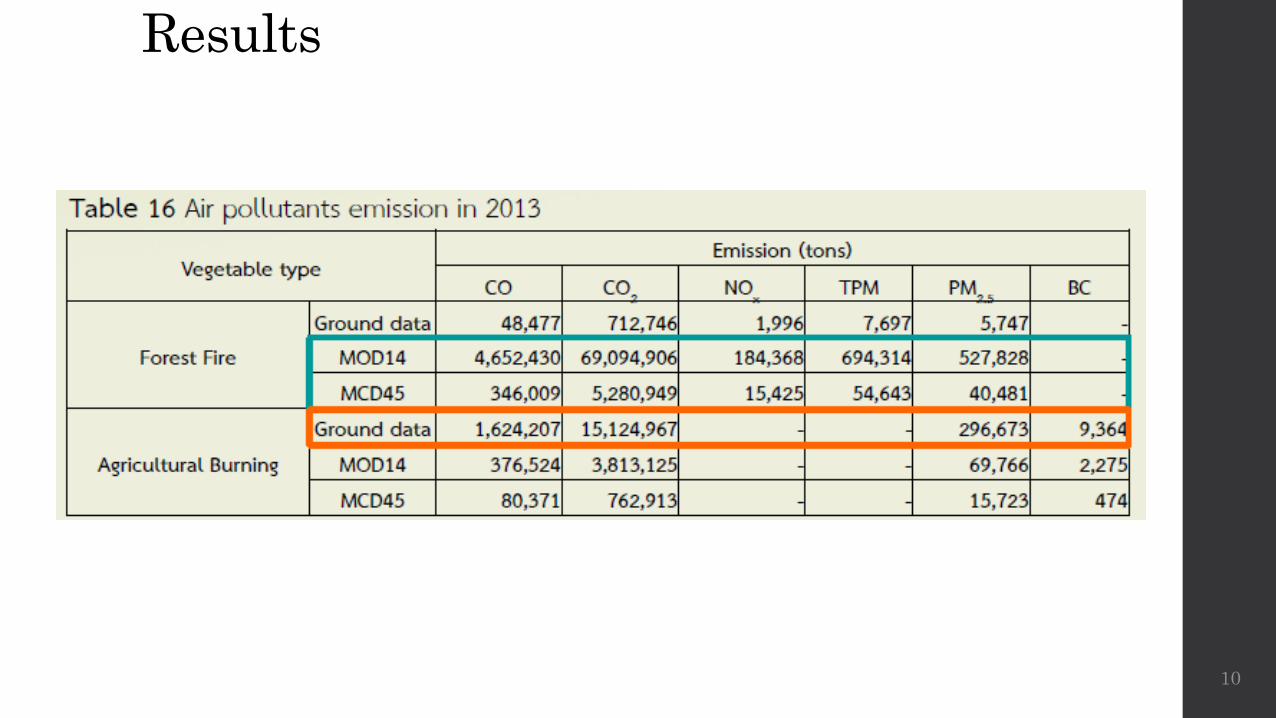
Results
10

Results
11

Previous Work on Emission Inventory
12
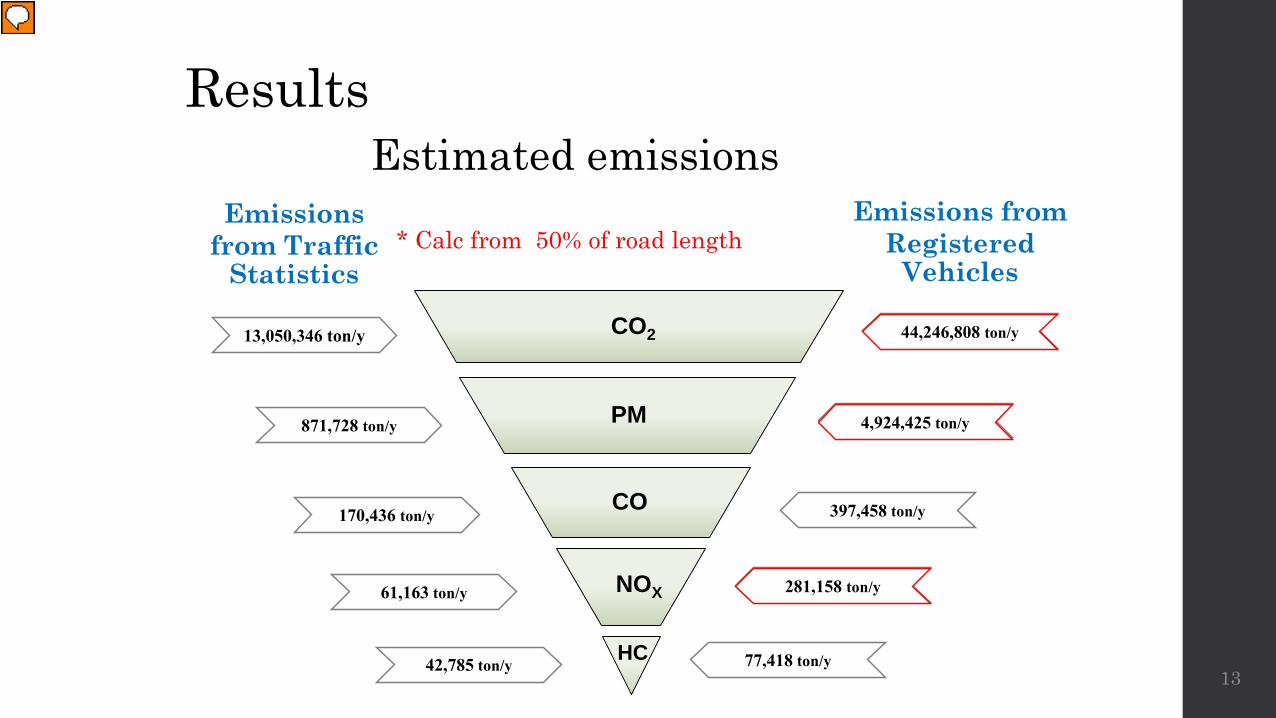
Estimated emissions
42,785 ton/y
61,163 ton/y
170,436 ton/y
871,728 ton/y
13,050,346 ton/y CO2
PM
CO
NOX
HC
44,246,808 ตัน/ปี
4,924,425 ตัน/ปี
397,458 ton/y
281,158 ตัน/ปี
77,418 ton/y
Emissions from Traffic
Statistics
Emissions from Registered
Vehicles
4,924,425 ton/y
44,246,808 ton/y
281,158 ton/y
* Calc from 50% of road length
Results
13
Presenter
Presentation Notes
Overestimate
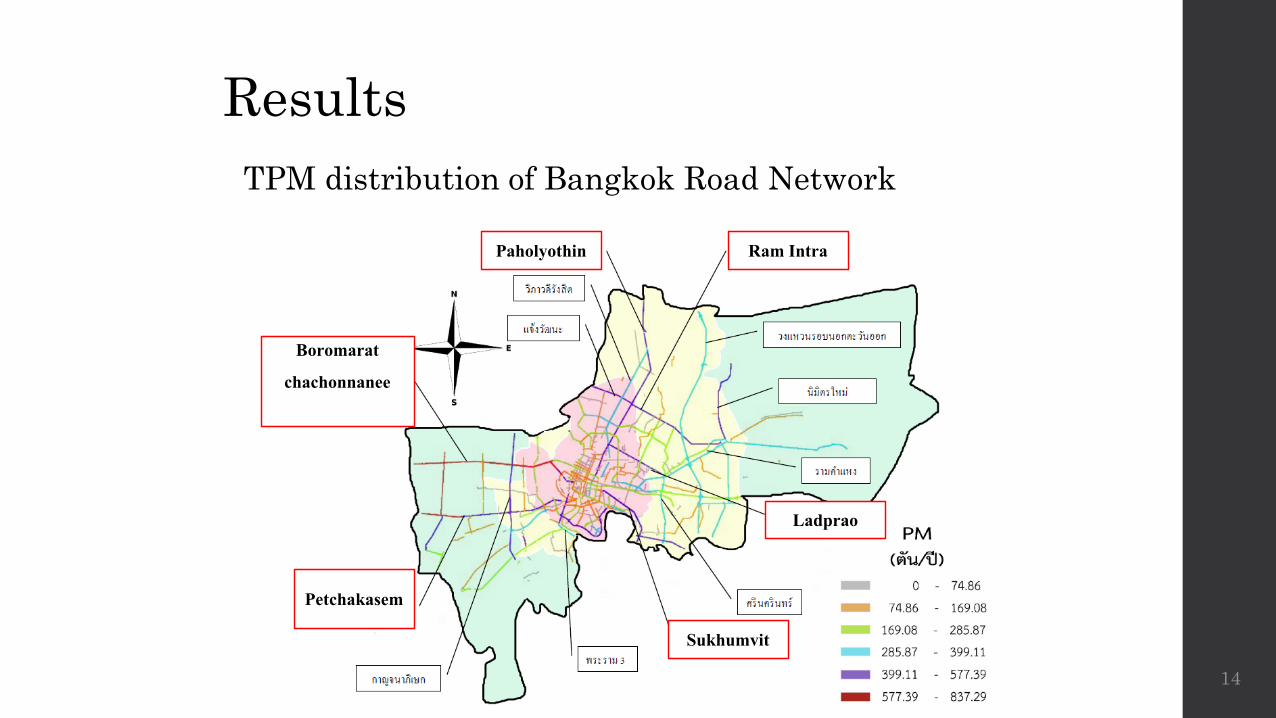
TPM distribution of Bangkok Road Network
Boromarat
chachonnanee
Paholyothin Ram Intra
Ladprao
Sukhumvit
Petchakasem
Results
14
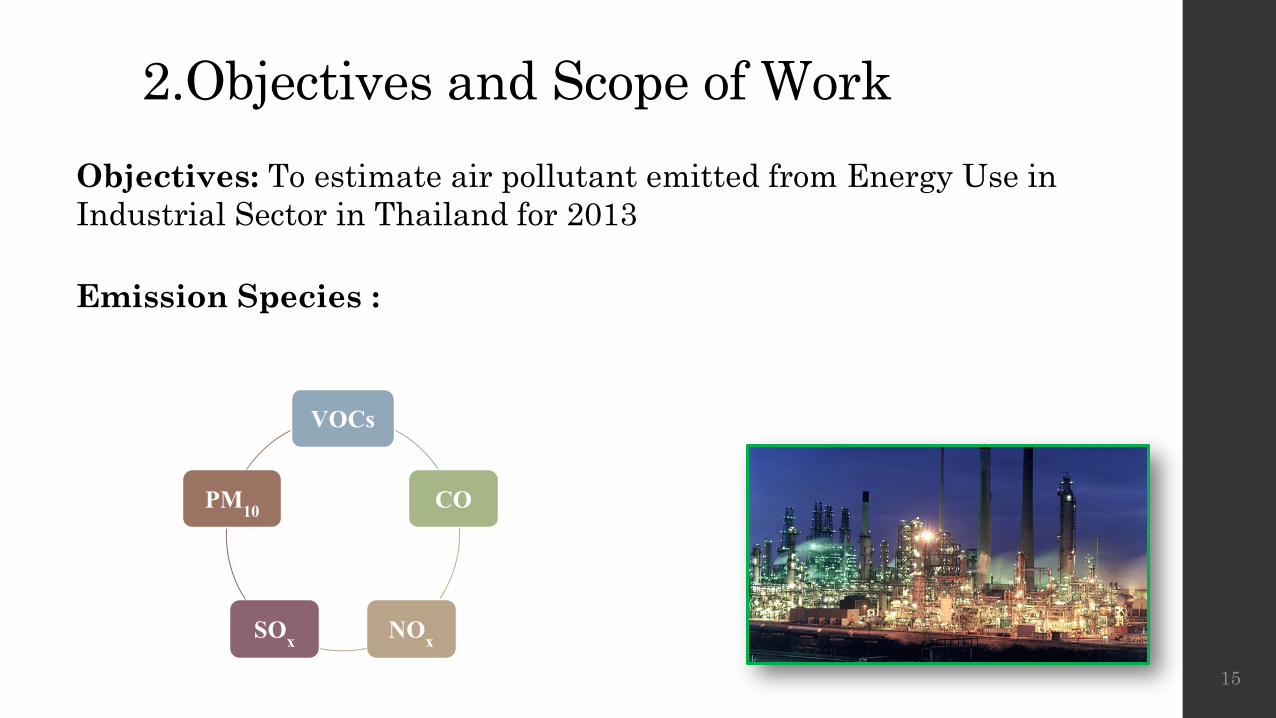
2.Objectives and Scope of WorkObjectives: To estimate air pollutant emitted from Energy Use in Industrial Sector in Thailand for 2013
VOCs
CO
NOxSOx
PM10
Emission Species :
15

3.MethodologyEmission Factors : Semi-bottom up
E = A × EF × (1 – ER / 100)
16
E = Emission rateA = Activity rateEF = Emission FactorER = Overall Emission Reduction Efficiency:%
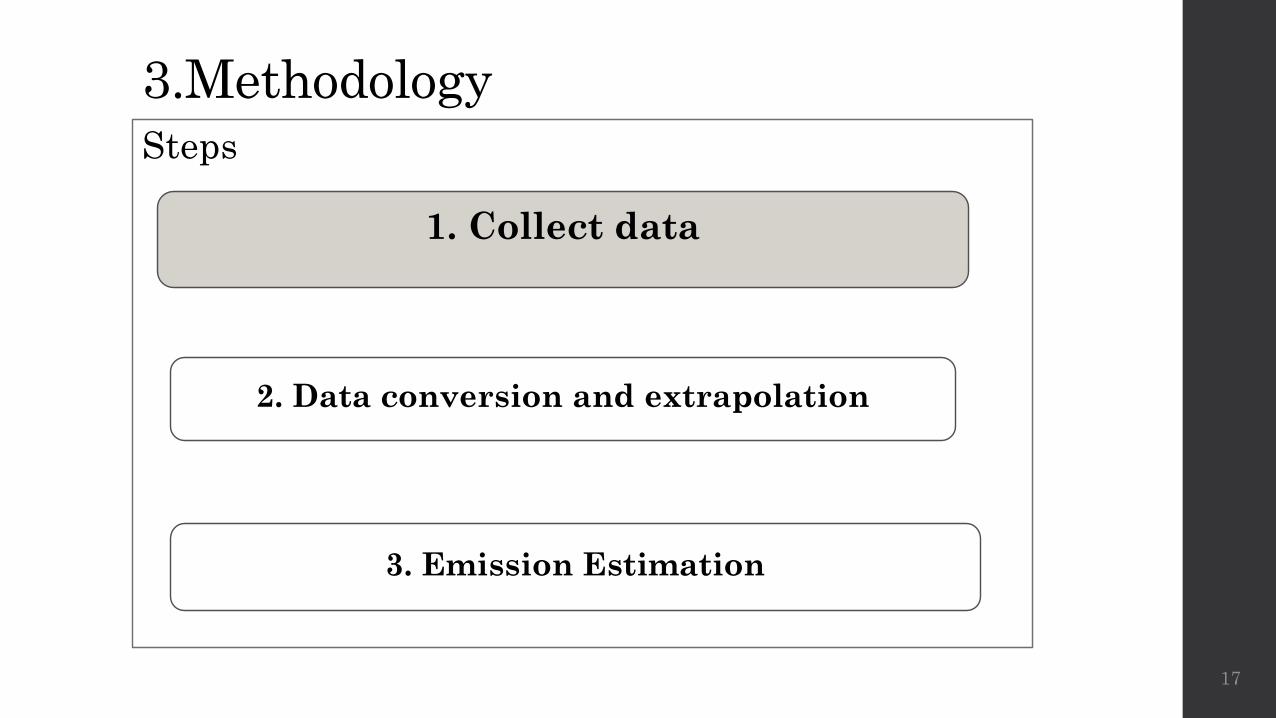
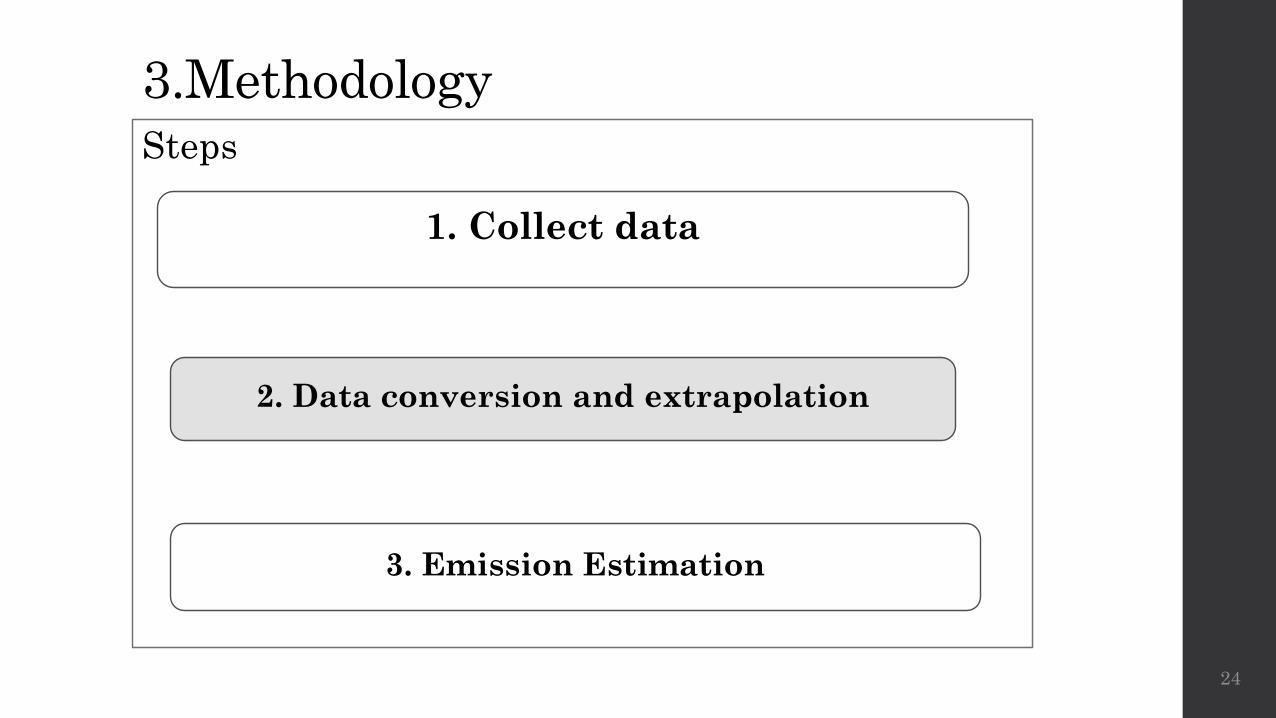
3.MethodologySteps
17
1. Collect data
2. Data conversion and extrapolation
3. Emission Estimation
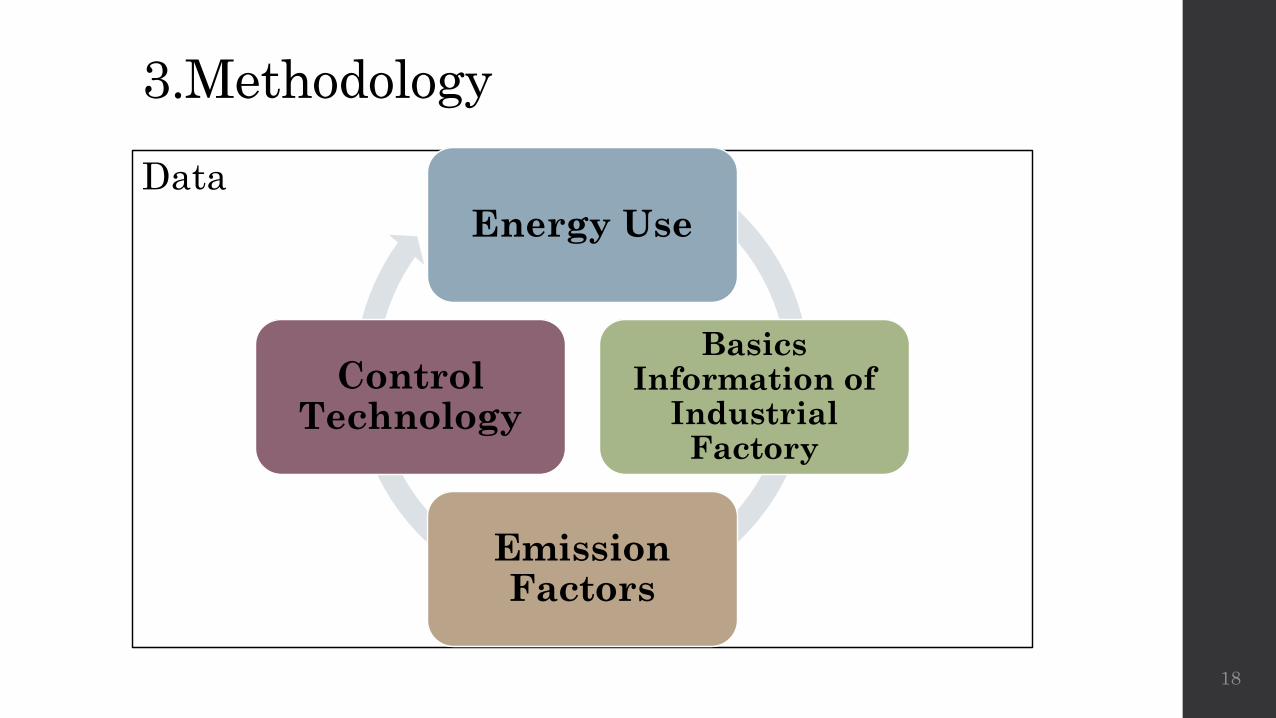
3.MethodologyData
18
Energy Use
Basics Information of
Industrial Factory
Emission Factors
Control Technology
3.Methodology
19
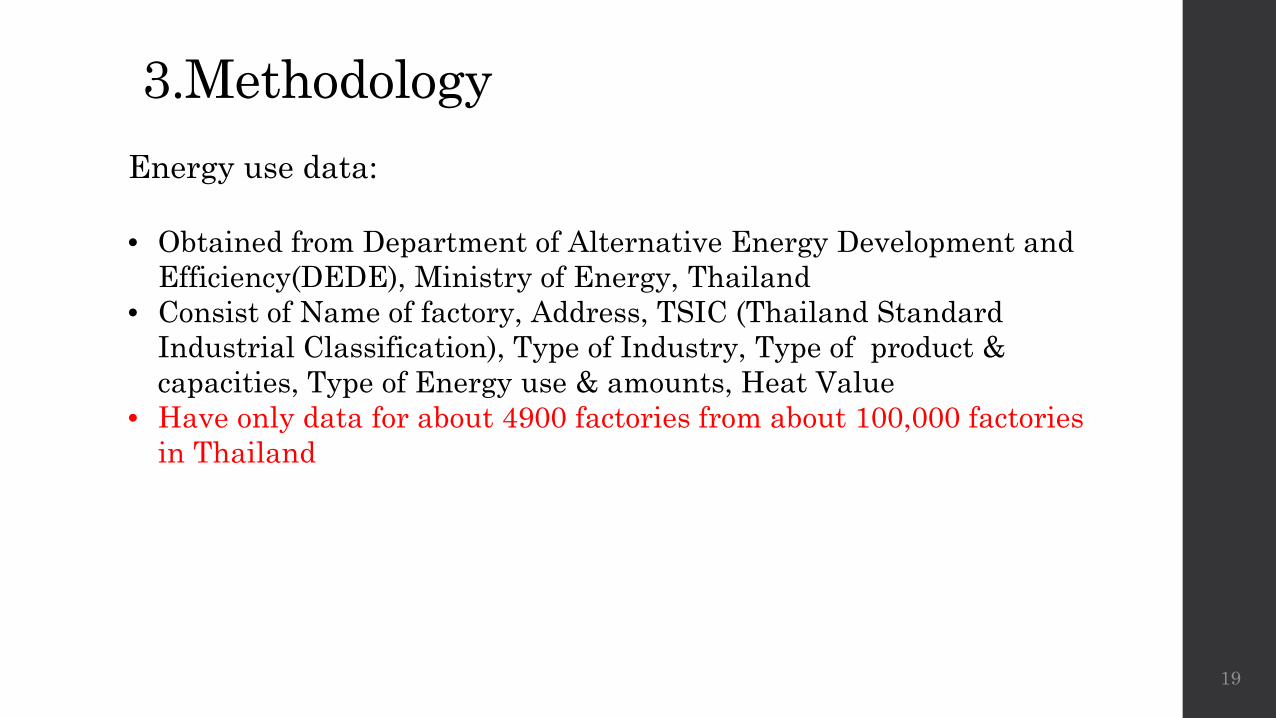
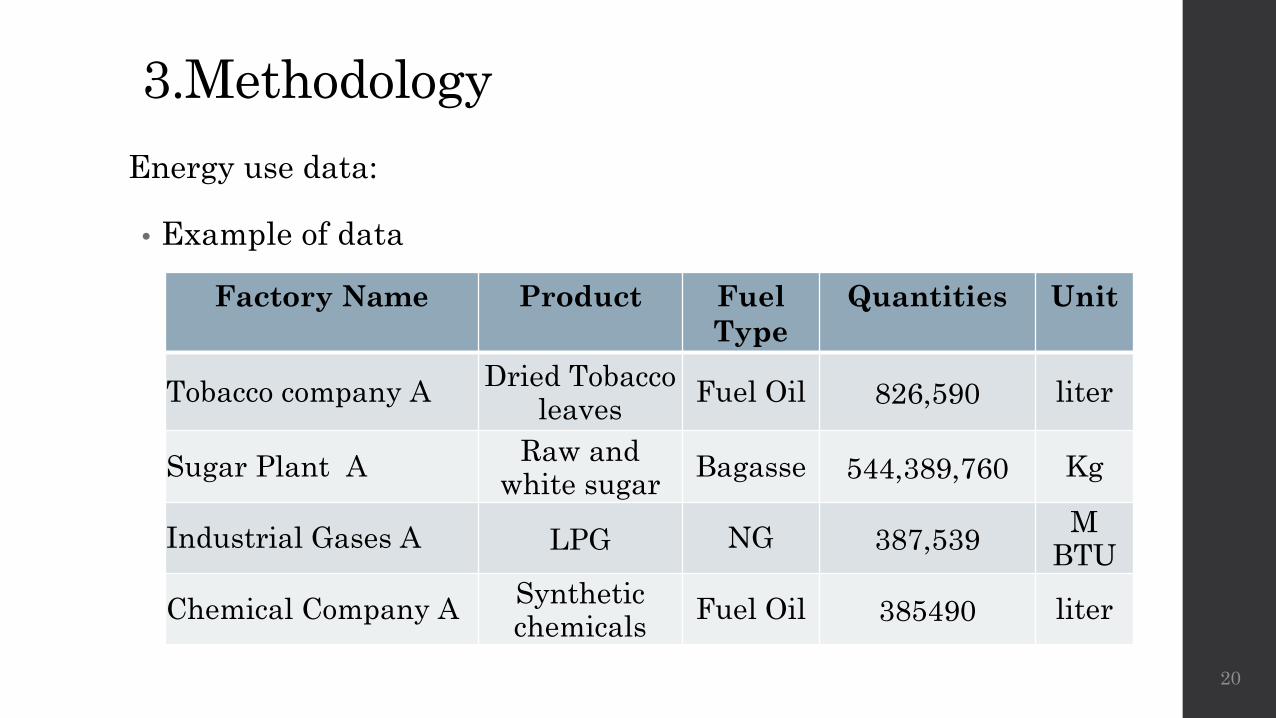
Energy use data:
• Obtained from Department of Alternative Energy Development and Efficiency(DEDE), Ministry of Energy, Thailand
• Consist of Name of factory, Address, TSIC (Thailand Standard Industrial Classification), Type of Industry, Type of product & capacities, Type of Energy use & amounts, Heat Value
• Have only data for about 4900 factories from about 100,000 factories in Thailand
3.Methodology
• Example of data
20
Factory Name Product Fuel Type
Quantities Unit
Tobacco company A Dried Tobacco leaves Fuel Oil 826,590 liter
Sugar Plant A Raw and white sugar Bagasse 544,389,760 Kg
Industrial Gases A LPG NG 387,539 MBTU
Chemical Company A Syntheticchemicals Fuel Oil 385490 liter
Energy use data:
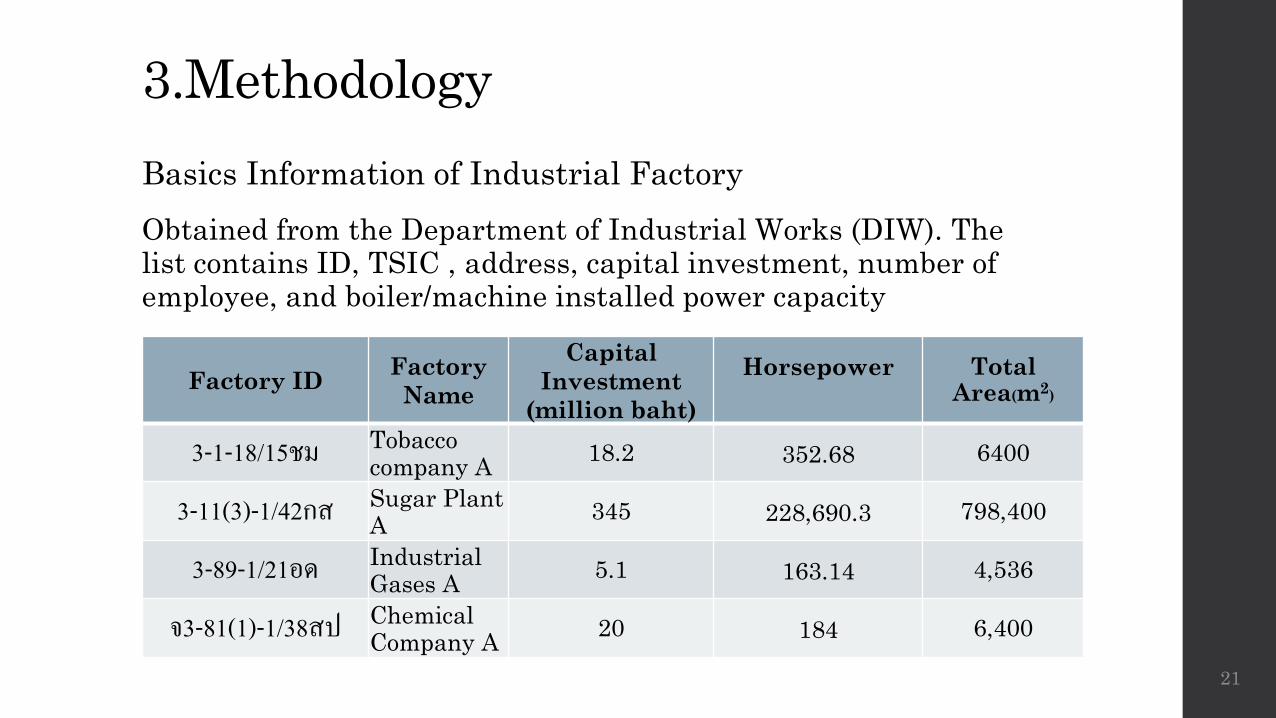
3.MethodologyBasics Information of Industrial FactoryObtained from the Department of Industrial Works (DIW). The list contains ID, TSIC , address, capital investment, number of employee, and boiler/machine installed power capacity
21
Factory ID FactoryName
Capital Investment
(million baht)Horsepower Total
Area(m2)
3-1-18/15ชม Tobacco company A 18.2 352.68 6400
3-11(3)-1/42กส Sugar Plant A 345 228,690.3 798,400
3-89-1/21อด IndustrialGases A 5.1 163.14 4,536
จ3-81(1)-1/38สป ChemicalCompany A 20 184 6,400
3.Methodology
22
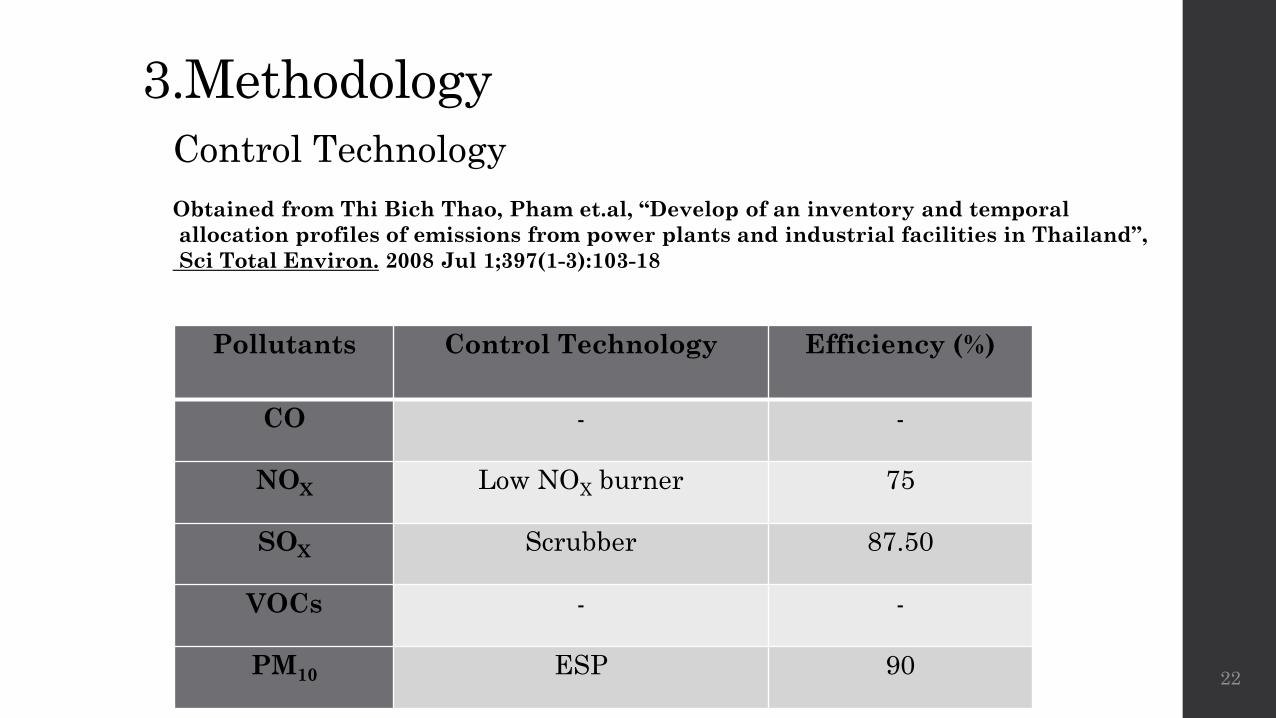
Pollutants Control Technology Efficiency (%)
CO - -
NOX Low NOX burner 75
SOX Scrubber 87.50
VOCs - -
PM10 ESP 90
Control TechnologyObtained from Thi Bich Thao, Pham et.al, “Develop of an inventory and temporalallocation profiles of emissions from power plants and industrial facilities in Thailand”,Sci Total Environ. 2008 Jul 1;397(1-3):103-18
3.Methodology
23
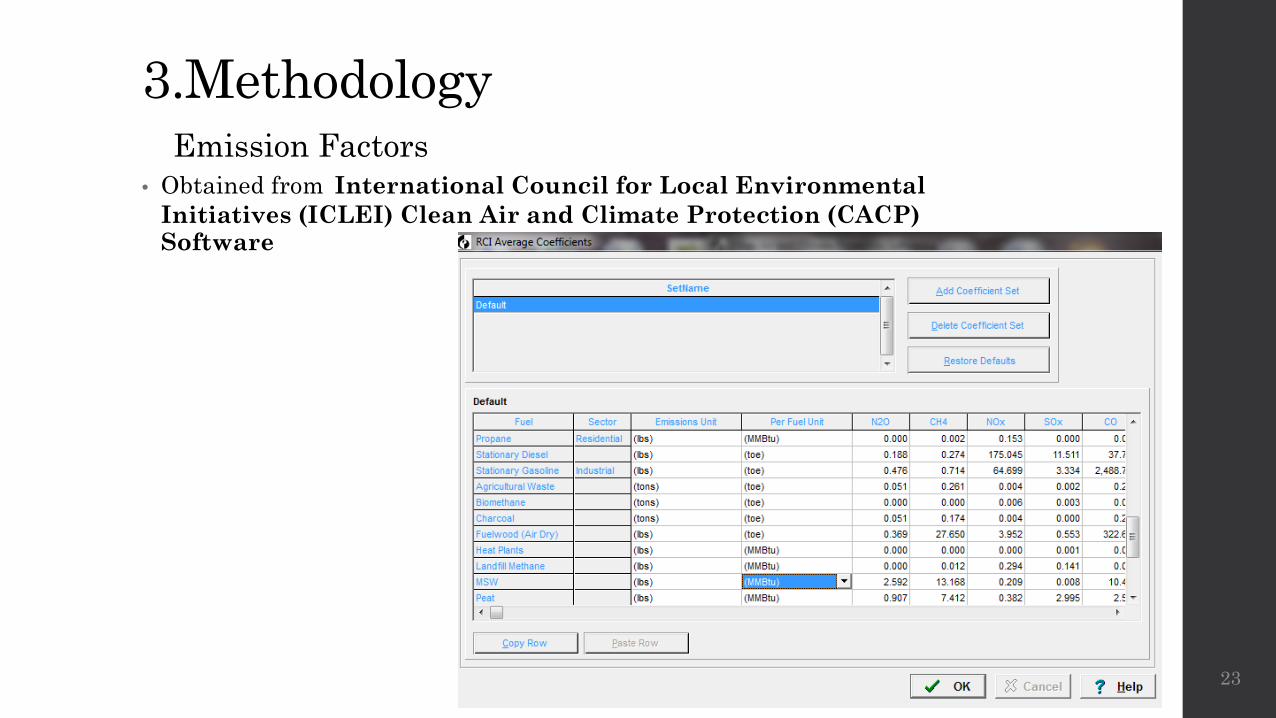
Emission Factors• Obtained from International Council for Local Environmental
Initiatives (ICLEI) Clean Air and Climate Protection (CACP) Software
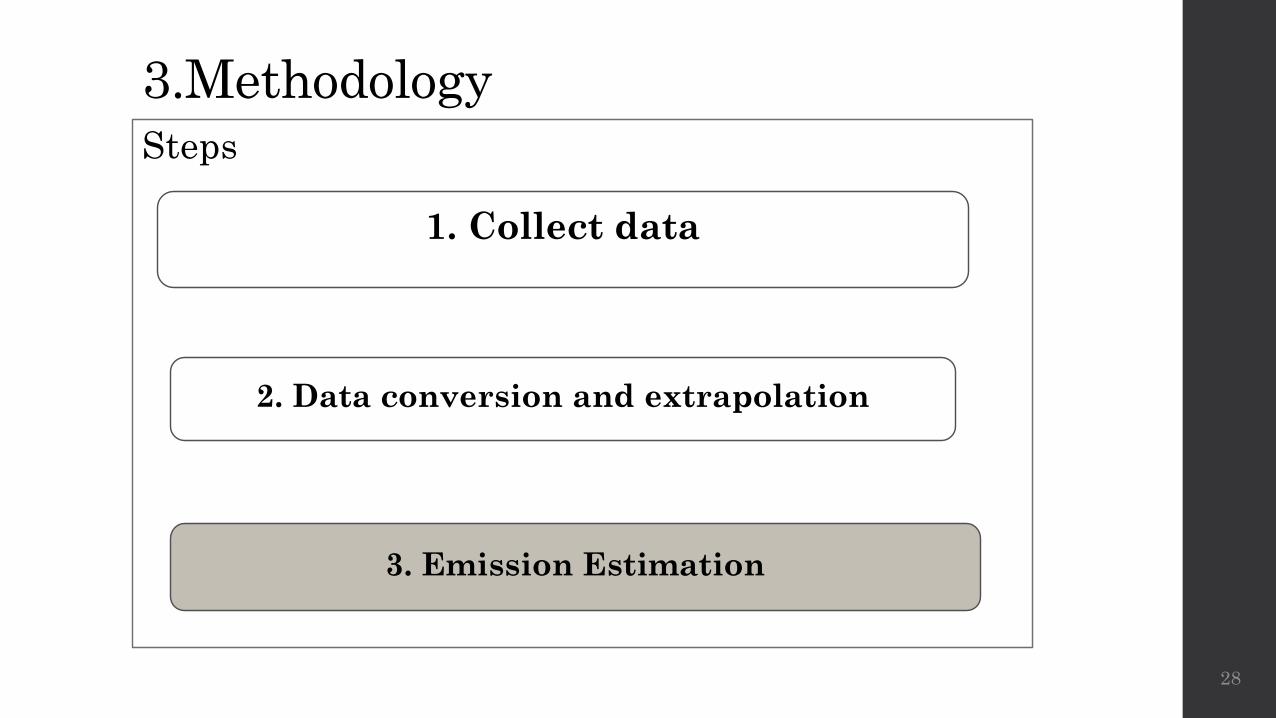
3.MethodologySteps
24
1. Collect data
2. Data conversion and extrapolation
3. Emission Estimation
3.Methodology
25
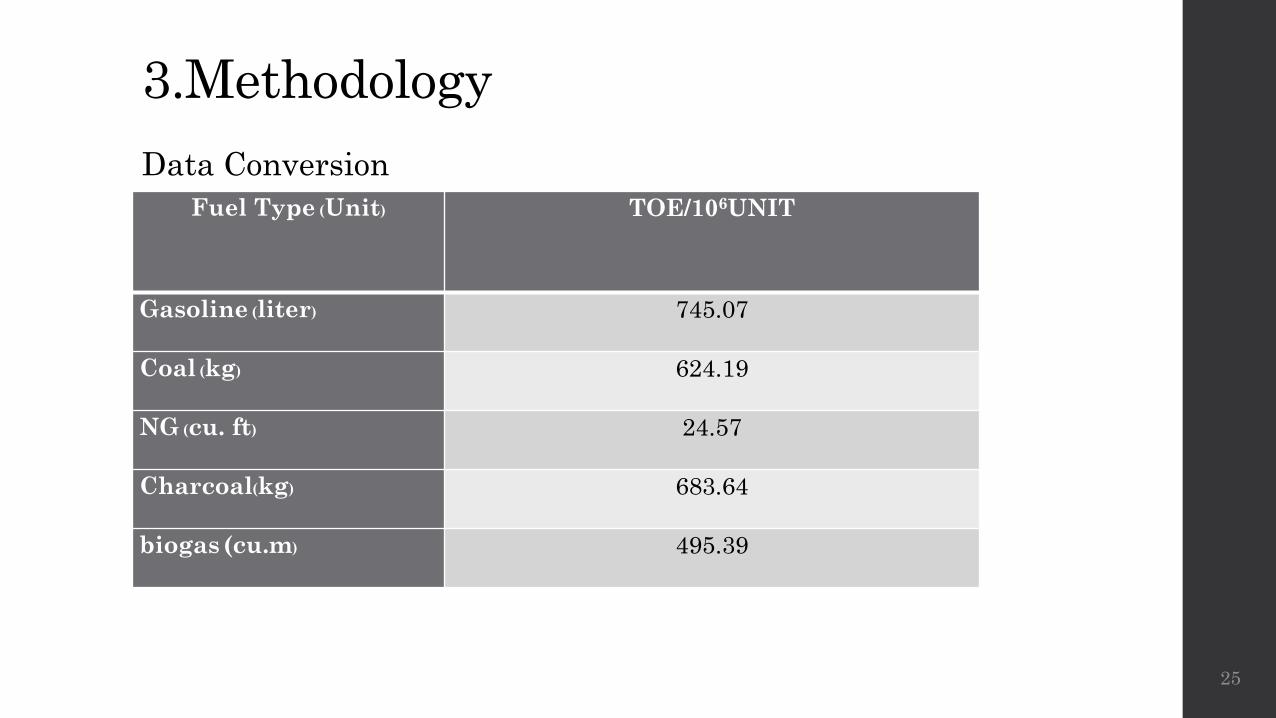
Fuel Type (Unit) TOE/106UNIT
Gasoline (liter) 745.07
Coal (kg) 624.19
NG (cu. ft) 24.57
Charcoal(kg) 683.64
biogas (cu.m) 495.39
Data Conversion

3.Methodology
26
Data Extrapolation Methodology• DIW data
1. filter data only name, address, TSIC, and installed HP 2. Calculated energy use per TSIC type for factory without
energy use by using mean ratio energy per HP from DEDE * installed HP of each factory
3. Sum each type of energy use for all 107 classes 4. Check the total amount of energy use with energy usage in
industrial sector from Energy Statics of Thailand, Ministry of Energy
5. If the total amount of estimated energy use was not match with national statistics, apply an adjusted factor until the difference of two datasets was less than 5%
3.Methodology
27
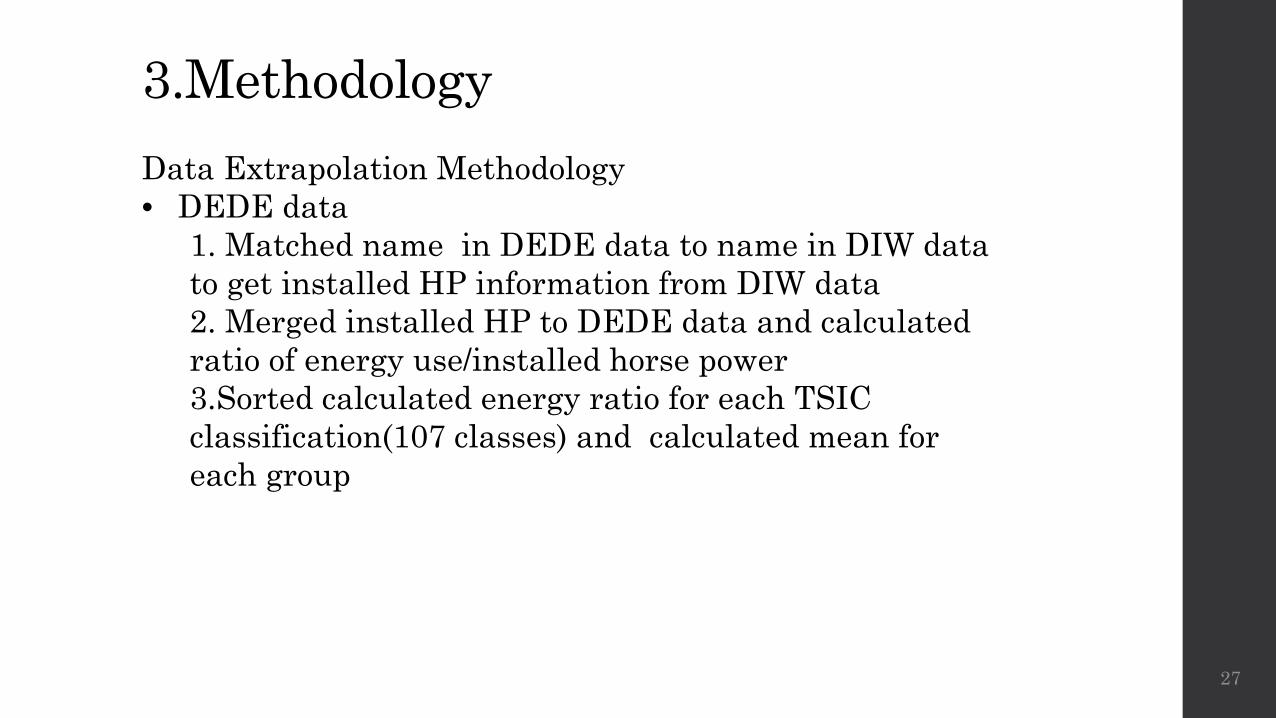
Data Extrapolation Methodology• DEDE data
1. Matched name in DEDE data to name in DIW data to get installed HP information from DIW data2. Merged installed HP to DEDE data and calculated ratio of energy use/installed horse power3.Sorted calculated energy ratio for each TSIC classification(107 classes) and calculated mean for each group
3.MethodologySteps
28
1. Collect data
2. Data conversion and extrapolation
3. Emission Estimation
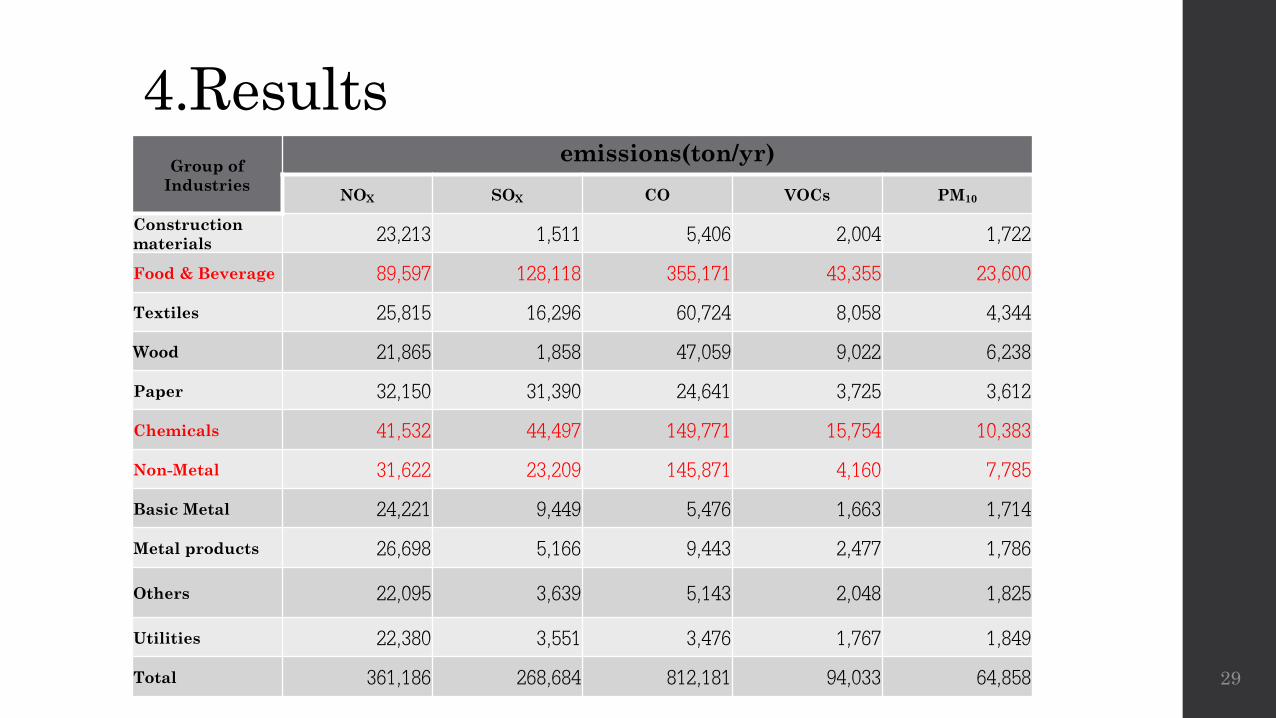
4.Results
29
Group of Industries
emissions(ton/yr)NOX SOX CO VOCs PM10
Construction materials 23,213 1,511 5,406 2,004 1,722
Food & Beverage 89,597 128,118 355,171 43,355 23,600
Textiles 25,815 16,296 60,724 8,058 4,344
Wood 21,865 1,858 47,059 9,022 6,238
Paper 32,150 31,390 24,641 3,725 3,612
Chemicals 41,532 44,497 149,771 15,754 10,383
Non-Metal 31,622 23,209 145,871 4,160 7,785
Basic Metal 24,221 9,449 5,476 1,663 1,714
Metal products 26,698 5,166 9,443 2,477 1,786
Others 22,095 3,639 5,143 2,048 1,825
Utilities 22,380 3,551 3,476 1,767 1,849
Total 361,186 268,684 812,181 94,033 64,858
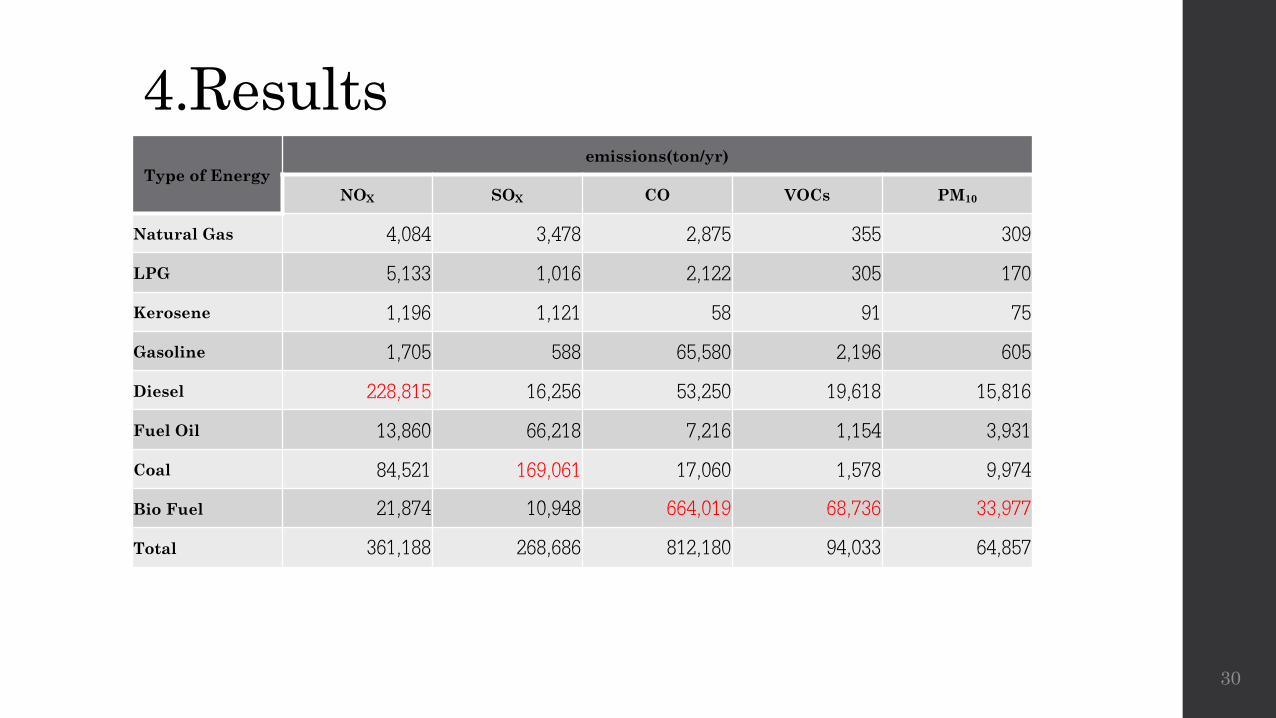
4.Results
30
Type of Energyemissions(ton/yr)
NOX SOX CO VOCs PM10
Natural Gas 4,084 3,478 2,875 355 309
LPG 5,133 1,016 2,122 305 170
Kerosene 1,196 1,121 58 91 75
Gasoline 1,705 588 65,580 2,196 605
Diesel 228,815 16,256 53,250 19,618 15,816
Fuel Oil 13,860 66,218 7,216 1,154 3,931
Coal 84,521 169,061 17,060 1,578 9,974
Bio Fuel 21,874 10,948 664,019 68,736 33,977
Total 361,188 268,686 812,180 94,033 64,857
4.Results
31
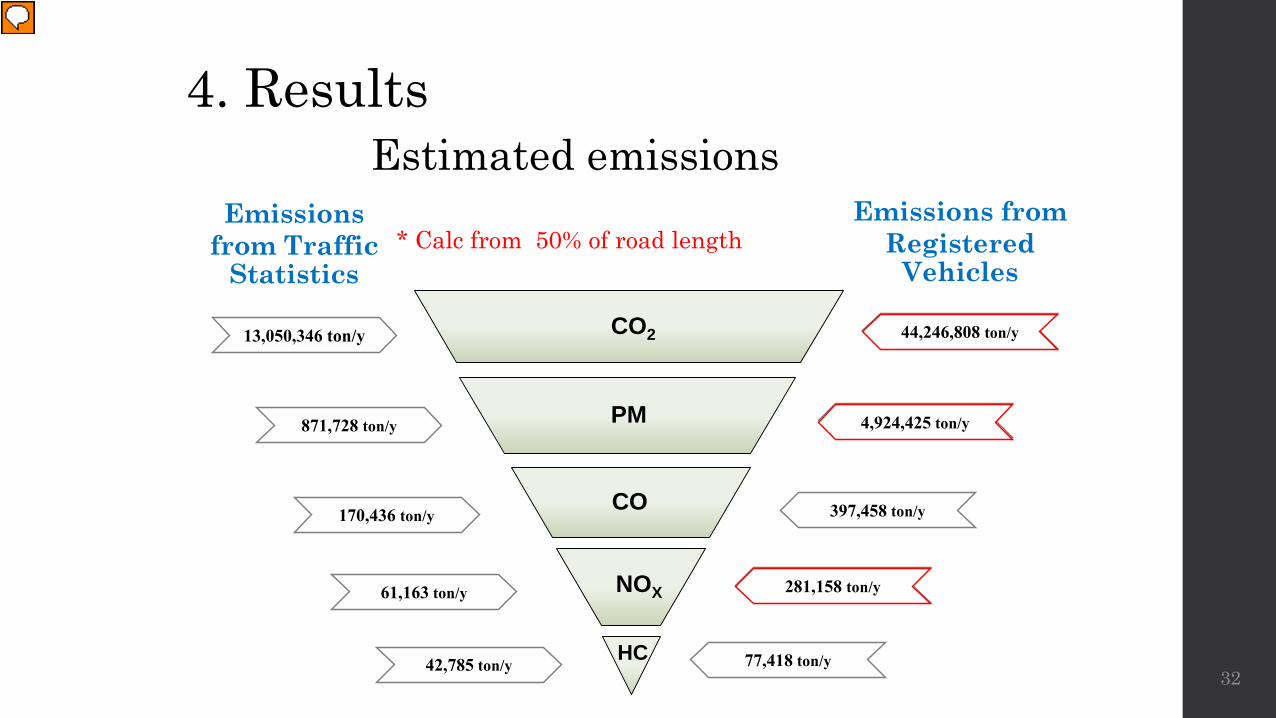
Estimated emissions
42,785 ton/y
61,163 ton/y
170,436 ton/y
871,728 ton/y
13,050,346 ton/y CO2
PM
CO
NOX
HC
44,246,808 ตัน/ปี
4,924,425 ตัน/ปี
397,458 ton/y
281,158 ตัน/ปี
77,418 ton/y
Emissions from Traffic
Statistics
Emissions from Registered
Vehicles
4,924,425 ton/y
44,246,808 ton/y
281,158 ton/y
* Calc from 50% of road length
4. Results
32
Presenter
Presentation Notes
Overestimate
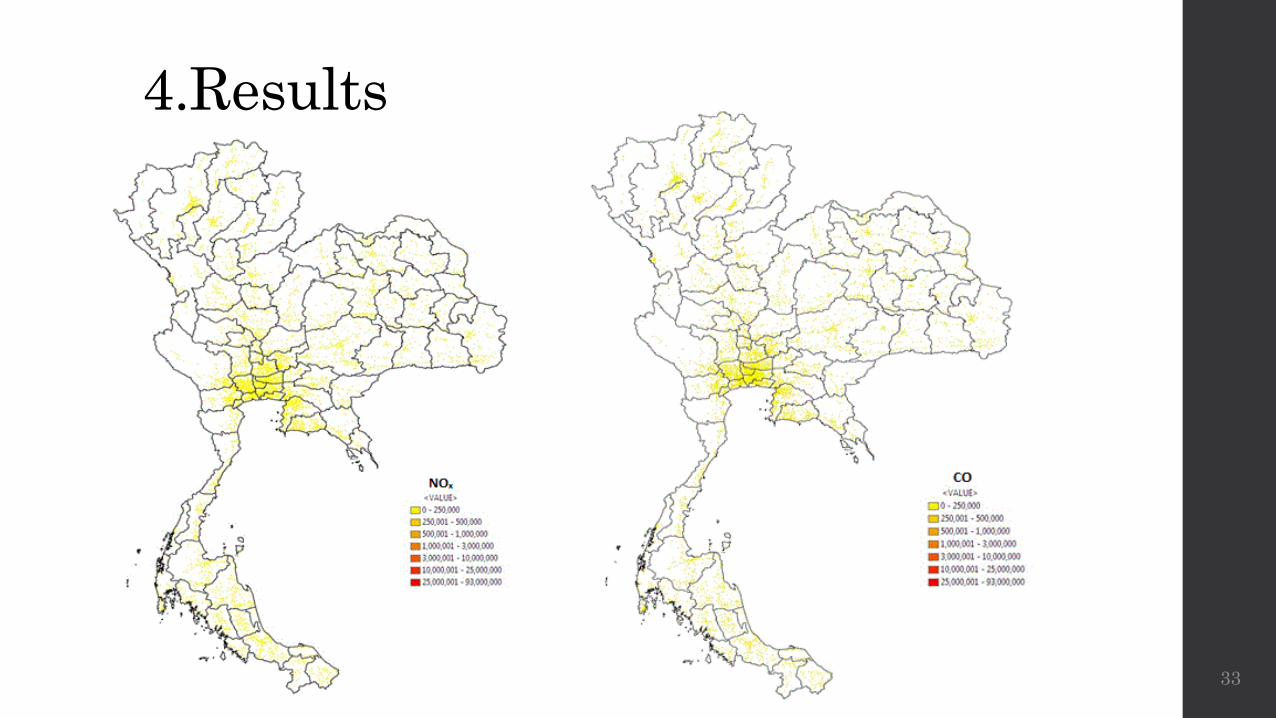
4.Results
33

4.Results
34
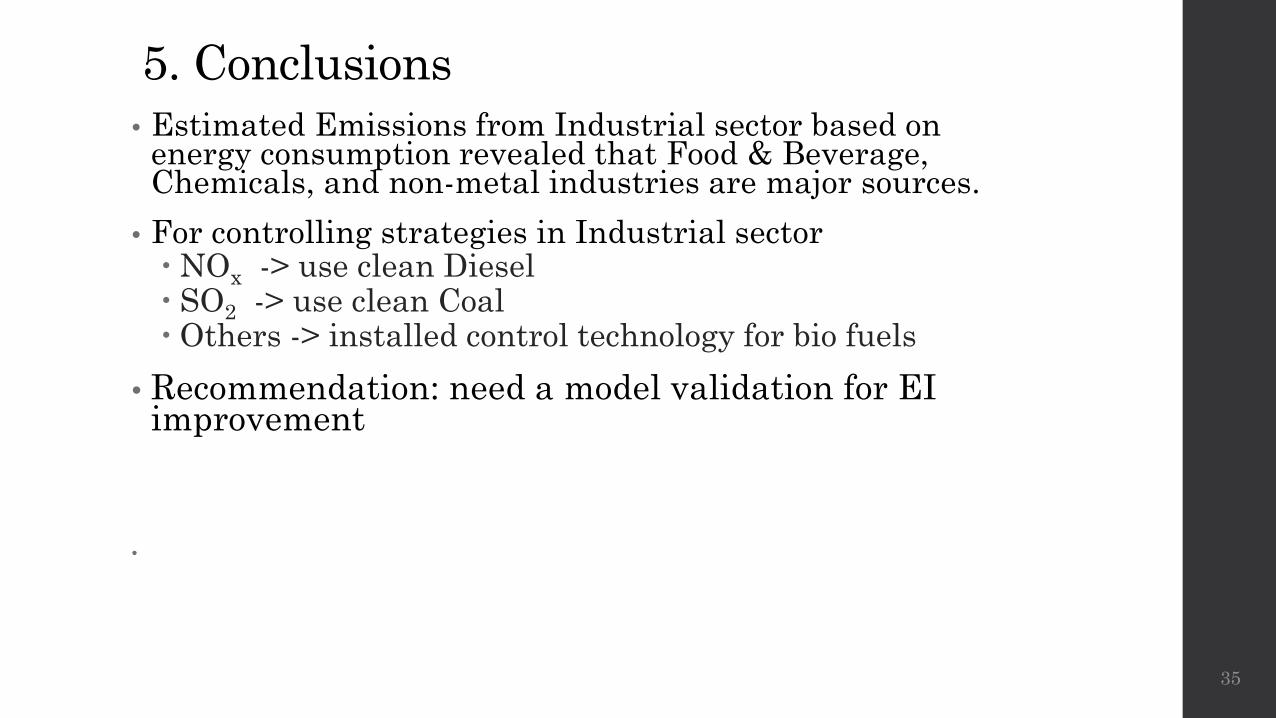
5. Conclusions• Estimated Emissions from Industrial sector based on
energy consumption revealed that Food & Beverage, Chemicals, and non-metal industries are major sources.
• For controlling strategies in Industrial sector NOx -> use clean Diesel SO2 -> use clean Coal Others -> installed control technology for bio fuels
• Recommendation: need a model validation for EI improvement
•
35

•Thanks You•Q&A
36
Related Documents