Update on New York’s No- Fault Fraud & Abuse Problem New York Alliance Against Insurance Fraud Insurance Fraud Briefing Albany, NY March 25, 2003 Robert P. Hartwig, Ph.D., CPCU, Senior Vice President & Chief Economist Insurance Information Institute 110 William Street New York, NY 10038 Tel: (212) 346-5520 Fax: (212) 732-1916 [email protected]

Update on New York’s No-Fault Fraud & Abuse Problem New York Alliance Against Insurance Fraud Insurance Fraud Briefing Albany, NY March 25, 2003 Robert.
Dec 29, 2015
Welcome message from author
This document is posted to help you gain knowledge. Please leave a comment to let me know what you think about it! Share it to your friends and learn new things together.
Transcript

Update on New York’s No-Fault Fraud & Abuse Problem
New York Alliance Against Insurance FraudInsurance Fraud Briefing
Albany, NYMarch 25, 2003
Robert P. Hartwig, Ph.D., CPCU, Senior Vice President & Chief EconomistInsurance Information Institute 110 William Street New York, NY 10038
Tel: (212) 346-5520 Fax: (212) 732-1916 [email protected] www.iii.org
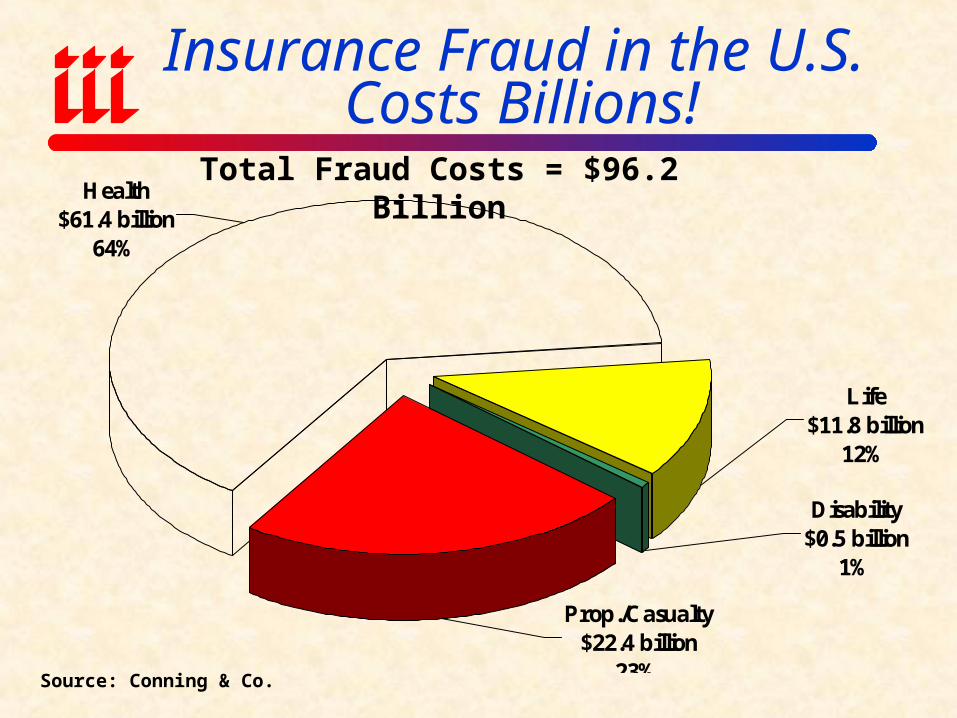
Insurance Fraud in the U.S. Costs Billions!
Prop./Casualty$22.4 billion
23%
Disability$0.5 billion
1%
Life$11.8 billion
12%
Health$61.4 billion
64%
Total Fraud Costs = $96.2 Billion
Source: Conning & Co.
Comparative Statistics: PIP Claims Costs
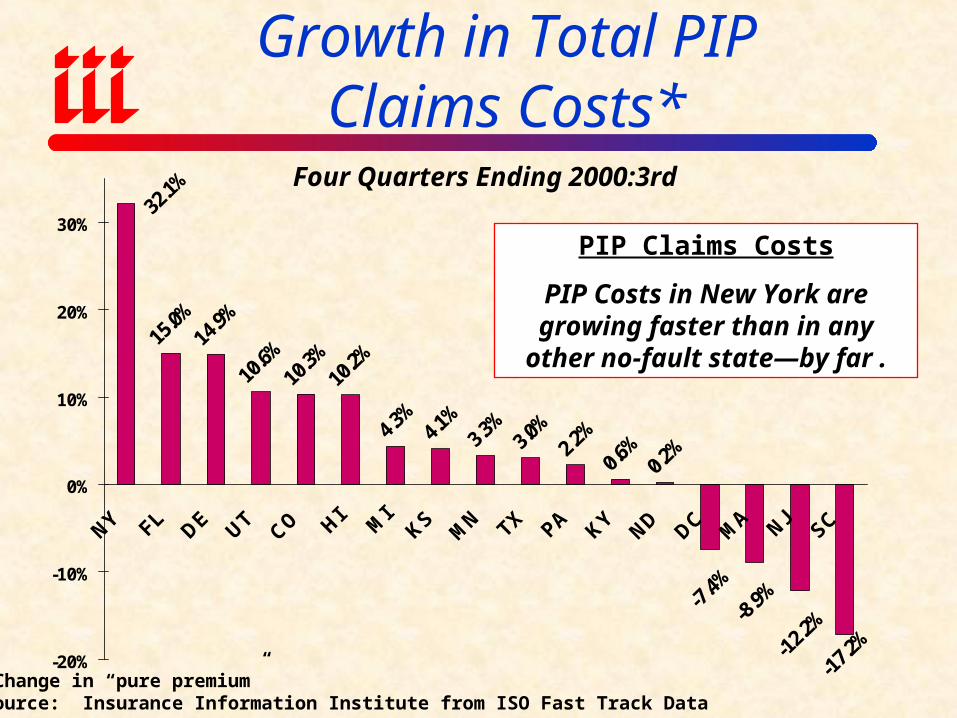
15.0%
14.9%
10.6%
10.3%
10.2%
4.3%
4.1%
3.3%
3.0%
2.2%
0.6%
0.2%
-7.4%
-8.9%
-12.2
%
-17.2
%
32.1%
-20%
-10%
0%
10%
20%
30%
NY FL DE UTCO HI M
IKS
MN TX PA KY
ND DC MA NJ
SC
Growth in Total PIPClaims Costs*
*Change in “pure premium”Source: Insurance Information Institute from ISO Fast Track Data
PIP Claims Costs
PIP Costs in New York are growing faster than in any other no-fault
state—by far .
Four Quarters Ending 2000:3rd
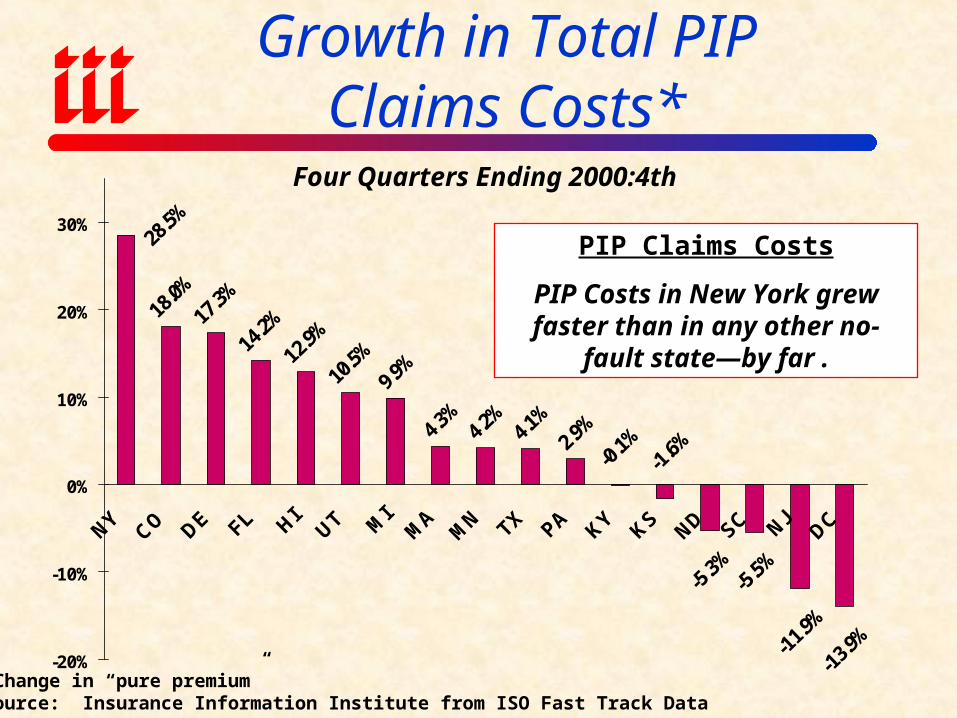
18.0%
17.3%
14.2%
12.9%
10.5%
9.9%
4.3%
4.2%
4.1%
2.9%
-5.3%
-5.5%
-11.9
%
-13.9
%
28.5%
-1.6%-0
.1%
-20%
-10%
0%
10%
20%
30%
NYCO DE FL HI
UT MI
MA
MN TX PA KY KS
ND SC NJDC
Growth in Total PIPClaims Costs*
*Change in “pure premium”Source: Insurance Information Institute from ISO Fast Track Data
PIP Claims Costs
PIP Costs in New York grew faster than in any other no-fault state—by
far .
Four Quarters Ending 2000:4th
24.7%
19.5%
14.4%
14.0%
13.0%
11.3%
5.8%
5.5%
5.4%
4.7%
0.7%
-3.6%
-3.0%-2
.4%
28.6%
1.1%2.6
%
-20%
-10%
0%
10%
20%
30%
SC MA
ND DECO FL M
IPA KY TX HI
MN UT NY
DC NJKS
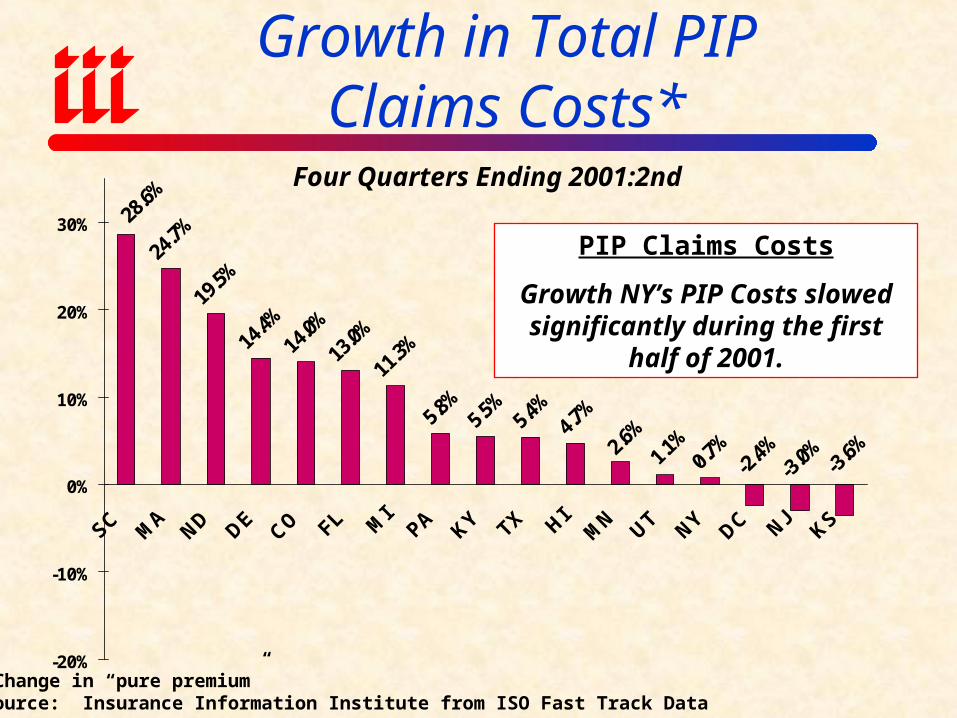
Growth in Total PIPClaims Costs*
*Change in “pure premium”Source: Insurance Information Institute from ISO Fast Track Data
PIP Claims Costs
Growth NY’s PIP Costs slowed significantly during the first half of
2001.
Four Quarters Ending 2001:2nd

-20%
-15%
-10%
-5%
0%
5%
10%
15%
20%
25%
Growth in Total PIPClaims Costs*
*Change in “pure premium”Source: Insurance Information Institute from ISO Fast Track Data
PIP Claims Costs
Growth NY’s PIP Costs are began to rise again after slowing during late 2001, early 2002
Four Quarters Ending 2002:3rd

Private Passenger Auto:6 Least Profitable States, 2000
(Profit as a % of Direct Premium Earned)
7.7
-1.2
-2.6-3.2 -3.3
-4.0
-9.8-10
-8
-6
-4
-2
0
2
4
6
8
U.S. New York Texas Montana Florida S. Carolina Louisiana
Source: NAIC; Insurance Information Institute
•NY ranked 44th in terms of profitability in 2000
•FL ranked 48th

Return on Net WorthPrivate Passenger Auto (%),
13.9
6.2
-1.1
12.2
2.8
7.08.2
13.012.4
4.8
-3.6
10.6
14.3 14.2
11.6 12.1 12.4
7.7
2.2
9.8
16.2
13.5
10.77.3
8.6
7.5
10.0
8.0
10.1
11.4
-5
0
5
10
15
20
91 92 93 94 95 96 97 98 99 00
New York
Florida
U.S.
Source: NAIC.
1991-2000
PIP Fraud and Abuse in New York State
0%
50%
100%
150%
200%
250%
300%
U.S. New York
*Through 4 quarters ending 2000:3rd.Source: American Insurance Association/ISO FastTrack; Insurance Information Institute
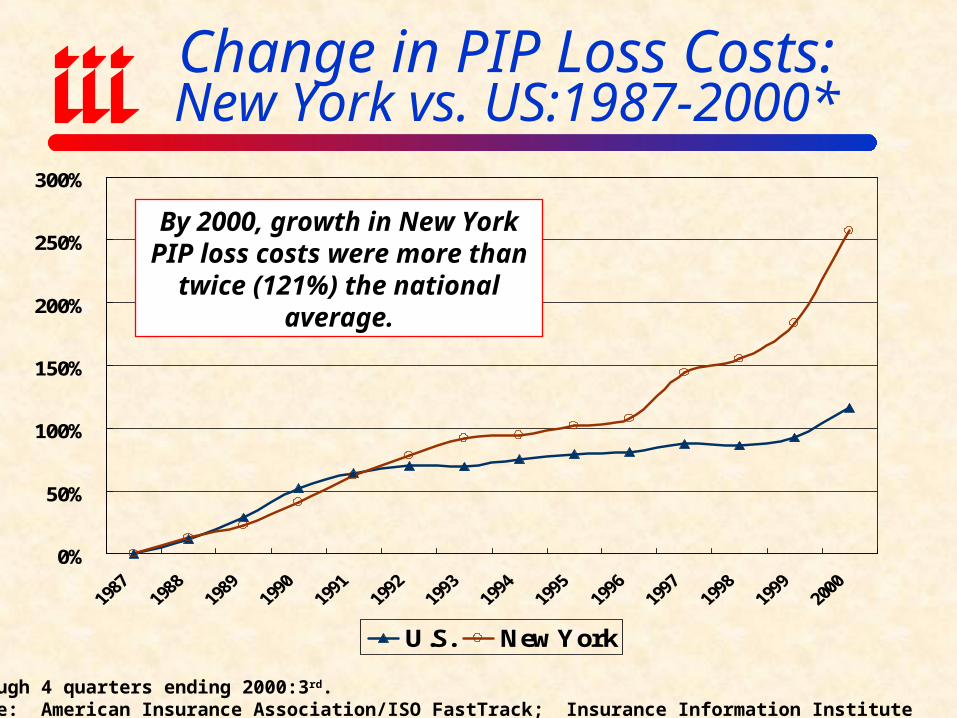
Change in PIP Loss Costs:New York vs. US:1987-2000*
By 2000, growth in New York PIP loss costs were more than twice (121%) the national average.
0%
50%
100%
150%
200%
250%
U.S. New York
*Through 4 quarters ending 2002:3rd.Source: American Insurance Association/ISO FastTrack; Insurance Information Institute
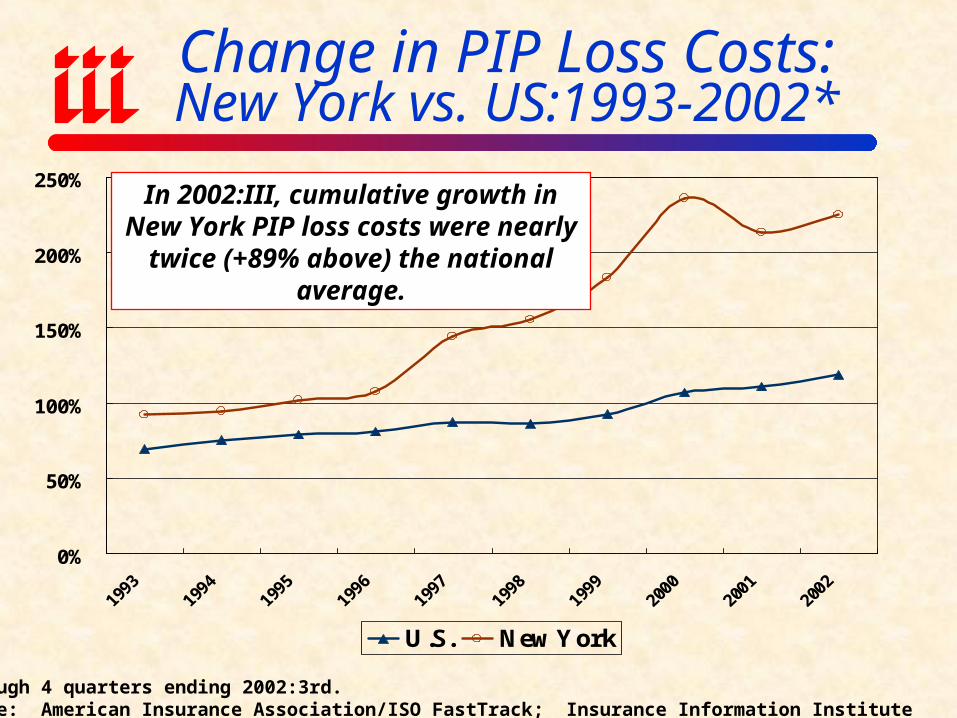
Change in PIP Loss Costs:New York vs. US:1993-2002*
In 2002:III, cumulative growth in New York PIP loss costs were nearly twice (+89% above) the national average.

Year Ending 2001:2nd2.27 2.26
2.11
1.90 1.87 1.86 1.801.68
1.60 1.60
0.0
0.5
1.0
1.5
2.0
2.5
NY MA CO FL DE UT MN NJ HI US*
*US excludes New York and Florida
Personal Injury Protection Paid Claim Frequency
Source: Insurance Information Institute and Insurance Services Office.
PIP frequency was 42% above the US average

Year-Ending 2002:III2.61
2.36
2.06 2.03 1.991.90 1.86 1.80 1.80 1.80 1.73
0.0
0.5
1.0
1.5
2.0
2.5
3.0
MA CO NY MD OR DE FL MN UT WA US*
*US excludes New York
Personal Injury Protection Paid Claim Frequency
Source: Insurance Information Institute and Insurance Services Office.
PIP frequency is 19% above the
US average

-2.1%
1.4%
-1.4%-1.4%
0.5%
-0.5%
5.7%6.7% 6.7%
4.7%
-2.7%-2.7%
-4.5%
-5.8%
-4.6%-5.1%
-8%
-6%
-4%
-2%
0%
2%
4%
6%
8%
Change in NY Personal Injury Protection Paid Claim Frequency*
* Average over four previous quarters.Source: Insurance Services Office, Insurance Information Institute.
PIP frequency has fallen
steadily since early 2001, but…
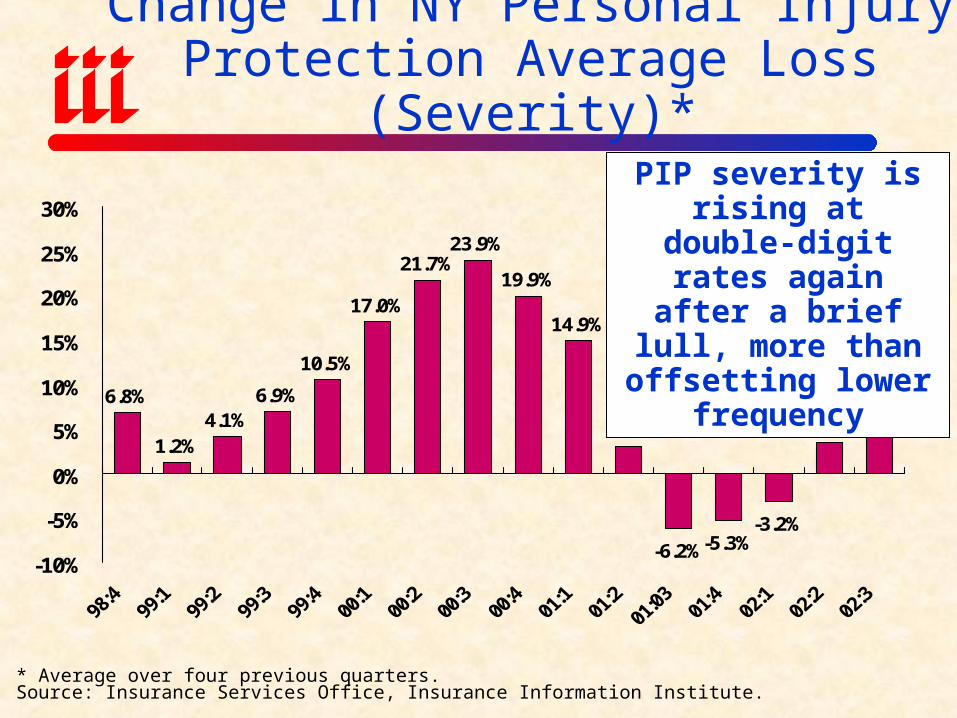
6.8%
1.2%4.1%
6.9%
10.5%
17.0%
21.7%23.9%
19.9%
14.9%
3.0%
-6.2%-5.3%-3.2%
3.5%
11.0%
-10%
-5%
0%
5%
10%
15%
20%
25%
30%
Change in NY Personal Injury Protection Average Loss (Severity)*
PIP severity is rising at double-digit rates again after a brief lull, more than offsetting lower
frequency
* Average over four previous quarters.Source: Insurance Services Office, Insurance Information Institute.

-2.1
%
1.4
%
-1.4
%
-1.4
%
0.5
%
-0.5
%
5.7
%
6.7
%
6.7
%
4.7
%
-2.7
%
-2.7
%
-4.5
%
-5.8
%
-4.6
%
-5.1
%
6.8
%
1.2
% 4.1
% 6.9
% 10.5
%
17.0
% 21.7
%
23.9
%
19.9
%
14.9
%
3.0
%
-6.2
%
-5.3
%
-3.2
%
3.5
%
11.0
%
-10%
-5%
0%
5%
10%
15%
20%
25%
30%PIP Frequency PIP Severity
Change in NY Personal Injury Protection Claim Frequency & Average Loss*
PIP frequency and severity
were falling by the 2nd half of
2001; now diverging
* Average over four previous quarters.Source: Insurance Services Office, Insurance Information Institute.

$4,862 $4,969
$5,675$6,064
$6,700
$8,335
$3,976$4,183 $4,352
$4,699$4,963
$4,523
1995 1996 1997 1998 1999 2000
New York
Other No-Fault States*
* Excluding Michigan
Average PIP Claim
PIP Claim Severity 1995-2000:New York vs. United States
Source: Fast Track Monitoring System, Fourth Quarter 2000 Report

$4,862 $4,969
$5,675$6,063
$6,699
$8,030$7,603
$8,276
$3,976$4,183
$4,840
$5,326
$6,126$6,364
$6,721
$4,989
1995 1996 1997 1998 1999 2000 2001 2002
New York
Other No-Fault States
Average PIP Claim
PIP Claim Severity 1995-2002:New York vs. United States
Source: Fast Track Monitoring System, Third Quarter 2002 Report
The average PIP claim in NY is $1,555 or 23% above the US average
Impact on Cost of Auto Insurance in New York State

Projected Average Auto Insurance Expenditure in NY State Assuming (March 2003 Est.)
$957
$1,041
$1,119
$1,186
$1,257
$1,332
$900
$1,000
$1,100
$1,200
$1,300
$1,400
2000 2001 2002 2003 2004 2005
Source: Insurance Information Institute

Projected Per Vehicle Average Cost of No-Fault Auto Insurance Fraud, (March 2003 Est.)
$9
$45
$26
$33
$46
$60
$75
$0
$25
$50
$75
$100
1999 2000 2001 2002 2003 2004 2005
Source: Insurance Information Institute
Cost per Vehicle
•Decrease in PIP claim frequency & severity in latter half of 2001
(amplified by 9/11 effect)•Administrative reforms
•High-profile crackdowns
NY’s PIP Fraud tax is $46/vehicle and rising sharply!

Annual Cost of No-Fault Auto Insurance Fraud in NY, (March 2003 Est.)
$77
$388
$238
$309
$432
$572
$732
$0
$250
$500
$750
$1,000
1999 2000 2001 2002 2003 2004 2005
Source: Insurance Information Institute
$ Millions
No-fault fraud will cost drivers in NY state $432 million in 2003,
or $1.2 million per day.
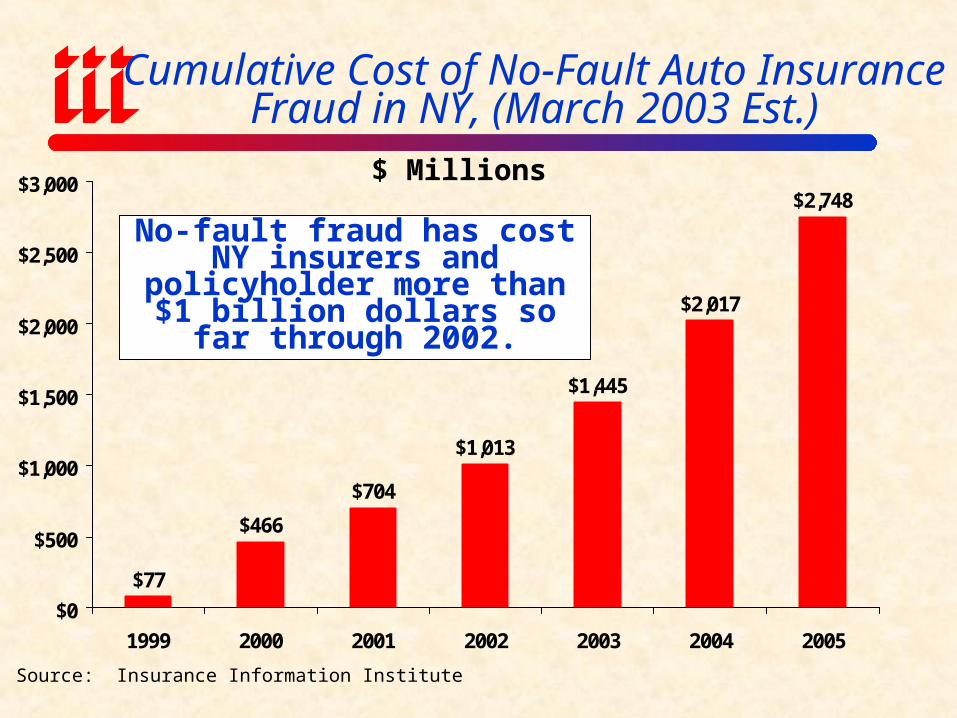
Cumulative Cost of No-Fault Auto Insurance Fraud in NY, (March 2003 Est.)
$77
$466
$704
$1,013
$1,445
$2,017
$2,748
$0
$500
$1,000
$1,500
$2,000
$2,500
$3,000
1999 2000 2001 2002 2003 2004 2005
Source: Insurance Information Institute
$ Millions
No-fault fraud has cost NY insurers and policyholder more
than $1 billion dollars so far through 2002.

No-Fault Fraud Statistics in New York State

New York Insurance Fraud Reports, 1995 - 2002
0
2,000
4,000
6,000
8,000
10,000
12,000
14,000
16,000
1995 1996 1997 1998 1999 2000 2001 2002
Auto Collision Damage
Auto Theft
No-Fault Auto
Source: New York Department of Insurance; Insurance Information Institute.
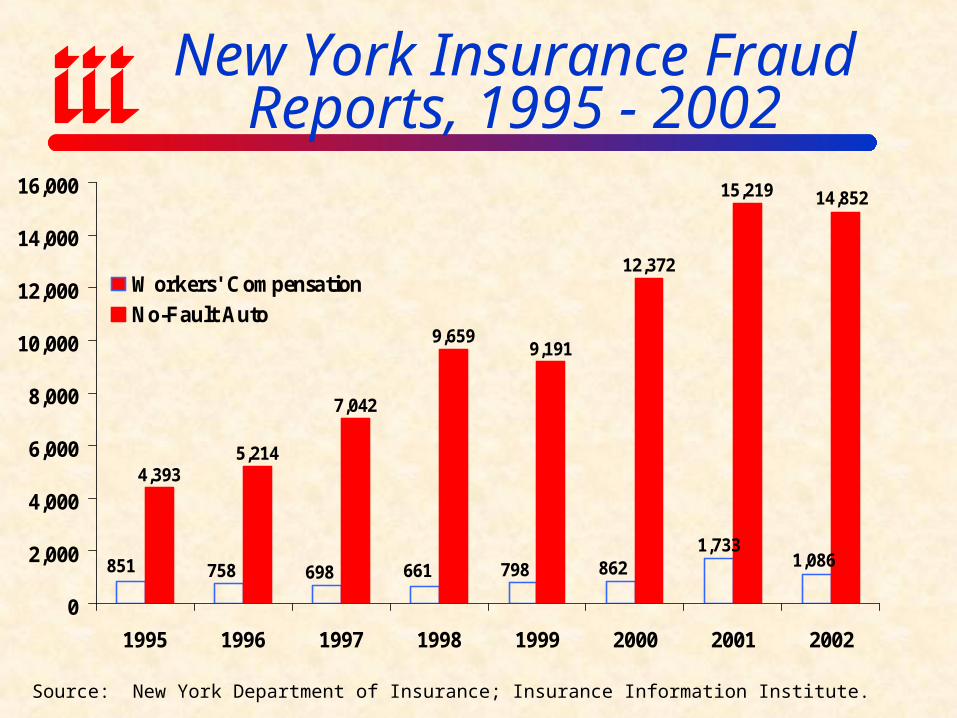
New York Insurance Fraud Reports, 1995 - 2002
1,7331,086
4,3935,214
7,042
9,6599,191
12,372
15,219 14,852
862798661698758851
0
2,000
4,000
6,000
8,000
10,000
12,000
14,000
16,000
1995 1996 1997 1998 1999 2000 2001 2002
Workers' Compensation
No-Fault Auto
Source: New York Department of Insurance; Insurance Information Institute.

New York Insurance Fraud Reports, 1995 - 2002
1,572 1,518
7,042
9,6599,191
12,372
15,219 14,852
2,2052,3592,637
5,4575,841
4,7125,214
4,393
0
2,000
4,000
6,000
8,000
10,000
12,000
14,000
16,000
1995 1996 1997 1998 1999 2000 2001 2002
Health/Accident
No-Fault Auto
Source: New York Department of Insurance; Insurance Information Institute.

Total Reports = 26,028
No-Fault Auto59%
Auto Theft8%
Auto Collision
4%
Health Accident
6%
Workers' Comp
4%
All Other16%
Composition of Fraud Reports, 1995 vs. 2001
2001Total Reports = 20,205
Workers' Comp3.9%
All Other29%
Health Accident
23%
AutoTheft7.6%
Auto Collision
10%No-Fault Auto22%
1995
Source: New York Department of Insurance; Insurance Information Institute.

Total Reports = 26,028
No-Fault Auto59%
Auto Theft8%
Auto Collision
4%
Health Accident
6%
Workers' Comp
4%
All Other16%
Composition of Fraud Reports, 2001 vs. 2002
20022001
Source: New York Department of Insurance; Insurance Information Institute.
Total Reports = 24,578
All Other19%
Workers' Comp
4%
Health Accident
6%
Auto Collision
3% Auto Theft7%
No-Fault Auto61%

No-Fault Fraud: A Growing Problem
0
5,000
10,000
15,000
20,000
25,000
30,000
1995 1996 1997 1998 1999 2000 2001 2002
Total All Types of Fraud
No-Fault Auto Fraud
Source: New York Department of Insurance; Insurance Information Institute.
PIP fraud reports accounted for 61% of all fraud reports in 2002
compared with 22% in 1995
Insurance Information Institute On-Line
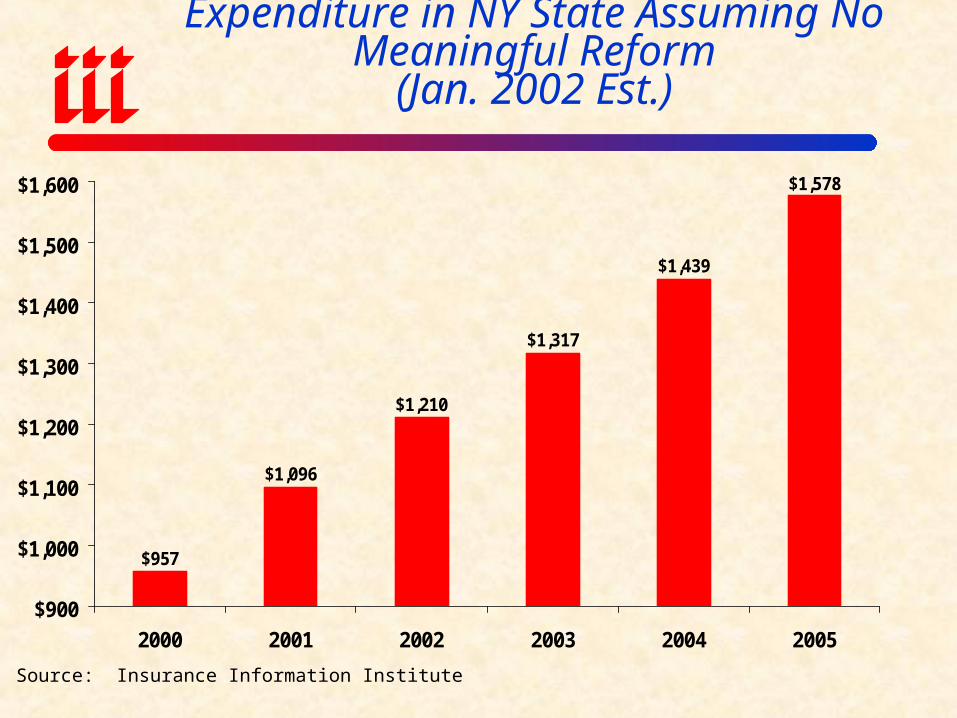
Projected Average Auto Insurance Expenditure in NY State Assuming No Meaningful Reform
(Jan. 2002 Est.)
$957
$1,096
$1,210
$1,317
$1,439
$1,578
$900
$1,000
$1,100
$1,200
$1,300
$1,400
$1,500
$1,600
2000 2001 2002 2003 2004 2005
Source: Insurance Information Institute

Projected Average Cost of No-Fault Auto Insurance Fraud in NY State Assuming No Meaningful Reform (Jan. 2002 Est.)
9
46
$81
$124
$177
$242
$321
$0
$100
$200
$300
$400
1999 2000 2001 2002 2003 2004 2005
Source: Insurance Information Institute
Cost per Vehicle
Related Documents