Report for ICP-ANACOM Update of the mobile LRIC model: change report PUBLIC VERSION 7 April 2015 Paulina Pastor, Fabio Fradella, Alessandro Ravagnolo, Paola Valenza Ref: 2002126-153

Welcome message from author
This document is posted to help you gain knowledge. Please leave a comment to let me know what you think about it! Share it to your friends and learn new things together.
Transcript

Report for ICP-ANACOM
Update of the mobile
LRIC model:
change report
PUBLIC VERSION
7 April 2015
Paulina Pastor, Fabio Fradella, Alessandro
Ravagnolo, Paola Valenza
Ref: 2002126-153
.

Update of the mobile LRIC model: change report
Ref: 2002126-153 .
Contents
1 Introduction 1
2 Model update – Demand and 2G/3G network parameters 2
2.1 Macroeconomics 2
2.2 Connections and traffic 3
2.3 Loading parameters 8
2.4 Definition of the geotypes and theoretical radii 11
2.5 Network parameters and modelling updates 14
2.6 Cost inputs 22
2.7 Regulatory fees 26
2.8 WACC 27
2.9 Other updates 28
3 The inclusion of 4G in the model 30
3.1 Inclusion of new services (retail and network) 30
3.2 4G-capable spectrum holding and spectrum upfront payment 30
3.3 4G network population coverage 32
3.4 The LTE network 33
3.5 E-UTRAN radio access network 34
3.6 Dimensioning of backhaul transmission 40
3.7 Core network and servers 41
3.8 Features of LTE-specific assets 46
3.9 Routeing factors 48

Update of the mobile LRIC model: change report
Ref: 2002126-153 .
Confidentiality Notice: Analysys Mason Limited has produced the information contained
herein for ANACOM. The ownership, use and disclosure of this information are subject to
the Commercial Terms contained in the contract between Analysys Mason Limited and ICP-
ANACOM.
Analysys Mason Limited Sucursal en España
José Abascal 44 4°
28003 Madrid
Spain
Tel: +34 91 399 5016
Fax: +34 91 451 8071
www.analysysmason.com
Registered in England: Analysys Mason Limited
Bush House, North West Wing
Aldwych
London WC2B 4PJ
UK
No. 5177472, C.I.F. W0066133J

Update of the mobile LRIC model: change report | 1
Ref: 2002126-153 .
1 Introduction
ICP-ANACOM has commissioned Analysys Mason Limited (Analysys Mason) to update the
bottom-up long-run incremental cost (BU-LRIC) model (“new model”) for the purpose of
understanding the cost of mobile voice termination in Portugal that Analysys Mason itself
developed between 2010 and 2012 (“old model”). This wholesale service falls under the
designation of Market 21 (previously Market 7, according to the 2009 European Commission
Recommendation on relevant markets).
This report, which has been prepared for exclusive use of ICP-ANACOM, should be read in
conjunction with the model documentation and the concept paper. Its objective is to provide an
overview of the changes made to the model.
The remaining sections of this document are structured as follows:
Section 2 describes all the model updates that were needed due to the evolution of market
demand, 2G and 3G technology developments (based on data provided by the operators)
Section 3 describes the model updates that were required to include the 4G network.
Note: confidential inputs were removed and replaced by the mark [].
1 Commission of The European Communities, COMMISSION RECOMMENDATION of 9.10.2014 on relevant product
and service markets within the electronic communications sector susceptible to ex ante regulation, 9 October 2014.

Update of the mobile LRIC model: change report | 2
Ref: 2002126-153 .
2 Model update – Demand and 2G/3G network parameters
This section describes all the changes that we have made to the old model to reflect the evolution
of the Portuguese market (e.g. macroeconomic changes and demand for mobile services) and
updates to the characteristics of networks already present in the old model (e.g. loading and
capacity upgrades of the 2G and 3G network). The arrangement of subsections follows the order
and logical flow of the Excel model.
2.1 Macroeconomics
In the “Operator_Demand” worksheet we have updated the following macroeconomic indicators to
reflect the latest data available (see Figure 2.1 and Figure 2.2):
National population, on the basis of updated projections from third-party sources like the
EIU, Euromonitor, ITU and Analysys Mason Research; like the old model, the new one uses
an average of the forecasts from the various third-party analysts.
Inflation, on the basis of third-party sources like the EIU and Euromonitor. Consistently with
the old model, we have used the Euromonitor’s data for the forecast and assumed constant 2%
inflation after 2025.
It should be noted that the data between 2011 and 2013 in the old model were assumptions or
forecasts and might have been revised in the meantime by the sources we are using. Hence, we
decided to use in the new model the updates figures. Similarly, we have updated the figures from
before 2011 if they have been revised in order to make sure that the model is run with the most
reliable source of information on the Portuguese market that are available today.

Update of the mobile LRIC model: change report | 3
Ref: 2002126-153 .
Figure 2.1: Comparison of national population
forecast (million inhabitants) [Source: Analysys
Mason based on EIU, Euromonitor, ITU and
Analysys Mason Research, 2015]
Figure 2.2: Comparison of inflation forecast [Source:
Analysys Mason based on Euromonitor, 2015]
We also updated data on population by freguesia in the “Geotypes” worksheet with the latest
census2 figures from 2011, including a slight methodology change: indeed, the new model uses the
number of individuals present in each freguesia instead of the resident population as the new
population metric, since this better reflects the number of users generating traffic in a given area.
2.2 Connections and traffic
2.2.1 Connections
We have updated and upgraded the mechanics (as further explained later in this section) of the
market module in the “Operator_Demand” worksheet. Whenever possible, we have continued to
use the same sources we used for the old model, that is:
ICP-ANACOM for actual data3
third-party analyst forecasts (e.g. GSMA Intelligence, ITU and Analysys Mason Research) to
inform our projections.
A broader set of data and information on the Portuguese market is now available, compared to
when we developed the old model. Hence, we decided to upgrade the mechanics of the market
module in order to take account of the new data and produce a better informed forecast.
2 Instituto nacional de Estatistica, Censos 2011, available at http://mapas.ine.pt/download/index2011.phtml.
3 ICP-ANACOM, Estatisticas, available at http://www.anacom.pt/render.jsp?categoryId=520&tab=379826.
10.2
10.7
0
1
2
3
4
5
6
7
8
9
10
11
12
13
14
200
52
00
62
00
72
00
82
00
92
01
02
01
12
01
22
01
32
01
42
01
52
01
62
01
72
01
82
01
92
02
02
02
12
02
22
02
32
02
42
02
5
New model Old model
actual <-- --> forecast
-1.5%
-1.0%
-0.5%
-
0.5%
1.0%
1.5%
2.0%
2.5%
3.0%
3.5%
4.0%
200
52
00
62
00
72
00
82
00
92
01
02
01
12
01
22
01
32
01
42
01
52
01
62
01
72
01
82
01
92
02
02
02
12
02
22
02
32
02
42
02
5
New model Old model
actual <-- --> forecast
Update of the mobile LRIC model: change report | 4
Ref: 2002126-153 .
Among other items, the model now includes the following market data:
traffic from mobile networks to non-geographic numbers
the number of datacards/dongles present in the market
mobile data traffic in megabytes (including details of datacard traffic)
SMS traffic split by destination.
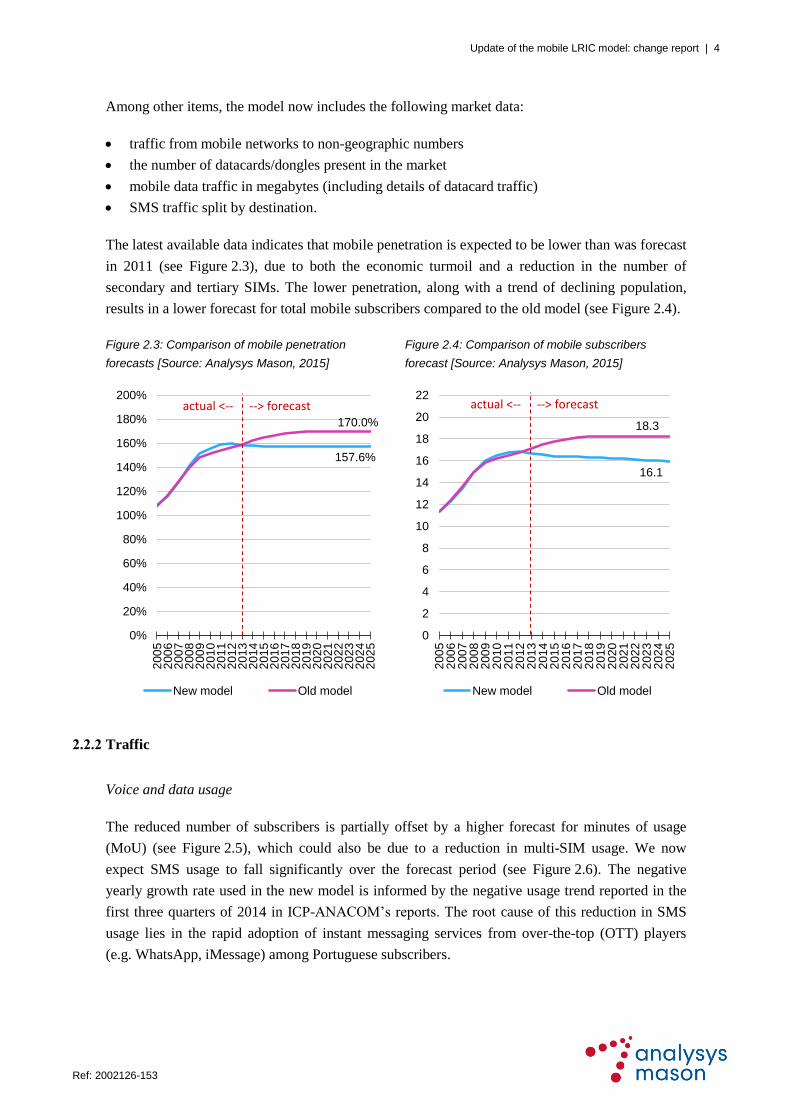
The latest available data indicates that mobile penetration is expected to be lower than was forecast
in 2011 (see Figure 2.3), due to both the economic turmoil and a reduction in the number of
secondary and tertiary SIMs. The lower penetration, along with a trend of declining population,
results in a lower forecast for total mobile subscribers compared to the old model (see Figure 2.4).
Figure 2.3: Comparison of mobile penetration
forecasts [Source: Analysys Mason, 2015]
Figure 2.4: Comparison of mobile subscribers
forecast [Source: Analysys Mason, 2015]
2.2.2 Traffic
Voice and data usage
The reduced number of subscribers is partially offset by a higher forecast for minutes of usage
(MoU) (see Figure 2.5), which could also be due to a reduction in multi-SIM usage. We now
expect SMS usage to fall significantly over the forecast period (see Figure 2.6). The negative
yearly growth rate used in the new model is informed by the negative usage trend reported in the
first three quarters of 2014 in ICP-ANACOM’s reports. The root cause of this reduction in SMS
usage lies in the rapid adoption of instant messaging services from over-the-top (OTT) players
(e.g. WhatsApp, iMessage) among Portuguese subscribers.
157.6%
170.0%
0%
20%
40%
60%
80%
100%
120%
140%
160%
180%
200%
200
52
00
62
00
72
00
82
00
92
01
02
01
12
01
22
01
32
01
42
01
52
01
62
01
72
01
82
01
92
02
02
02
12
02
22
02
32
02
42
02
5
New model Old model
actual <-- --> forecast
16.1
18.3
0
2
4
6
8
10
12
14
16
18
20
22
200
52
00
62
00
72
00
82
00
92
01
02
01
12
01
22
01
32
01
42
01
52
01
62
01
72
01
82
01
92
02
02
02
12
02
22
02
32
02
42
02
5
New model Old model
actual <-- --> forecast

Update of the mobile LRIC model: change report | 5
Ref: 2002126-153 .
Figure 2.5: Comparison of forecasts for minutes of
usage [Source: Analysys Mason, 2015]
Figure 2.6: Comparison of forecasts for SMS
consumption per user [Source: Analysys Mason,
2015]
Given the growing importance of data traffic in the Portuguese mobile market, we have upgraded
the mechanism used to forecast total megabytes of traffic generated by data users. This has
involved performing the following tasks:
defining a migration of subscribers from 2G to 3G and 4G4 (see Figure 2.7)
segmenting the market by mobile device type (i.e. handsets, datacards/dongles) (see
Figure 2.8)
forecasting the rate of adoption of data services by device type and technology
assuming a profile of data consumption of data users by device type and technology, and
forecasting its evolution according to European benchmarks.
Incoming traffic from off-net
We have slightly revised the calculation of the incoming traffic from off-net as a percentage of
outgoing traffic.
The model calculates the split of outgoing and incoming traffic separately:
Outgoing traffic – Differently from the previous version of the model, the total traffic is now
driven by the outgoing MoU, which was previously a back-calculation. This allows to better
capture the impact of changing market shares of the operators. However, this update can be
4 A user is defined as a 4G subscriber if he/she owns a 4G-capable device and SIM and subscribes to 4G services.
120.9
108.8
0
20
40
60
80
100
120
140
200
52
00
62
00
72
00
82
00
92
01
02
01
12
01
22
01
32
01
42
01
52
01
62
01
72
01
82
01
92
02
02
02
12
02
22
02
32
02
42
02
5
New model Old model
actual <-- --> forecast
52.7
139.4
0
20
40
60
80
100
120
140
160
200
52
00
62
00
72
00
82
00
92
01
02
01
12
01
22
01
32
01
42
01
52
01
62
01
72
01
82
01
92
02
02
02
12
02
22
02
32
02
42
02
5
New model Old model
actual <-- --> forecast

Update of the mobile LRIC model: change report | 6
Ref: 2002126-153 .
considered negligible and does not change the overall logic of the market model. The outgoing
traffic is then calculated in two steps:
— The first step is the split of the total outgoing traffic by destination (to mobile, to
international and to fixed networks). In line with what done in the previous model and the
unpredictability of the traffic, the breakdown percentages of the split is maintained
constant
— The second step is the calculation of the split of the outgoing traffic to mobile between on-
net and off-net. This calculation is performed in a side model that takes into account the
evolution of the market shares of the operator
Incoming traffic – For the calculation of the total incoming traffic two changes were done.
— The first one is specular to the one done for the outgoing traffic: the total incoming traffic
from off-net is now driven by the incoming MoU from off-net. Similarly to the previous
model, the trend of the total traffic is assumed to be the same as the outgoing traffic, thus
maintaining a stable ratio between outgoing and incoming from off-net over time. In the
previous version of the model the incoming traffic from off-net represented 20.7% of total
outgoing traffic and, in light of the considerations reported above, this percentage does not
evolve over time. The split of the incoming traffic from off-net by origin (i.e. from other
mobile, fixed and international networks) is also assumed to remain constant
— The second change is to add the incoming on-net traffic separately on top of the one
incoming from off-net. In the previous model the calculation described above also
included the on-net traffic, which is now excluded and added separately since it is already
calculated in the outgoing calculations and does not need to be re-calculated.
These changes were done because it is more correct to assume that it is the ratio between outgoing
on-net and off-net traffic depending from the market share, rather than the incoming traffic from
off-net as percentage of outgoing traffic; indeed, the latter is driven by market considerations (for
instance, it includes also voice traffic originated from fixed and international networks).

Update of the mobile LRIC model: change report | 7
Ref: 2002126-153 .
2.2.3 Breakdown of subscribers by generation and device type
Figure 2.7: Share of subscribers split by technology
[Source: Analysys Mason, 2015]
Figure 2.8: Split of SIMs between handsets and
datacards / dongles [Source: Analysys Mason, 2015]
In light of the new data available and the launch of LTE in 2012, the new model includes a higher
forecast of data traffic, compared to the old model (see Figure 2.9). The new projection is in line
with benchmarks for the evolution of total mobile traffic projected by third-party analysts in
Europe.
Figure 2.9: Comparison of data traffic projections [Source: Analysys Mason, 2015]
0%
10%
20%
30%
40%
50%
60%
70%
80%
90%
100%
200
52
00
62
00
72
00
82
00
92
01
02
01
12012
2013
2014
201
52
01
62
01
72
01
82
01
92
02
02
02
12
02
22
02
32
02
42
02
5
2G 3G 4G
1.0 0.5
0
2
4
6
8
10
12
14
16
18
200
52
00
62
00
72
00
82
00
92
01
02
01
12
01
22
01
32
01
42
01
52
01
62
01
72
01
82
01
92
02
02
02
12
02
22
02
32
02
42
02
5
# of handsets # of datacards
489
74
0
100
200
300
400
500
600
200
5
2006
200
7
200
8
200
9
201
0
201
1
201
2
201
3
201
4
201
5
201
6
201
7
201
8
201
9
202
0
2021
202
2
202
3
202
4
202
5
Pe
tab
yte
s
New model Old model
actual <-- --> forecast

Update of the mobile LRIC model: change report | 8
Ref: 2002126-153 .
2.3 Loading parameters
2.3.1 Calculation of traffic carried by the networks
The model updates described in Section 2.2 enable calculation of the total traffic generated by 2G,
3G and 4G subscribers separately. However, the traffic generated by a 4G subscriber is not
necessarily carried over the 4G network: instead, it may fall back onto 3G or 2G networks (as
discussed in the concept paper). There are a number of reasons why traffic might fall back onto
lower-generation networks:
Coverage gaps – There are coverage differences among the networks, with 2G able to provide
an almost ubiquitous coverage layer to ensure the provision of basic voice services. For
instance, whenever the signal reception is weak or absent a 4G subscriber will automatically
connect to the strongest signal available, regardless of the technology of the SIM card installed
Device availability – Mobile users may not have a handset which is capable of supporting a
particular technology, despite having an enabled SIM installed; for instance, there still is a
large share of 2G handsets in the market that is not able to connect to the 3G network, and
most of the handsets that are sold today are not VoLTE capable
User experience / capex efficiency – Mobile operators are interested in maximising the user
experience offered to their customers. On the basis of their network loading operators might
decide that a certain share of traffic needs to fall-back on other networks in order to avoid over
loading capacity constrained cells. This also allows limiting the capex required to increase
capacity on the constrained network by better utilising the capacity already installed for other
technologies.
Therefore, we updated the model to allow the traffic routing over different networks with a
migration profile that is set in the “Load_inputs” worksheet. The migration is separately set for the
different traffic types:
voice traffic (as shown in Figure 2.10)
messages (including SMS and MMS)
low-speed data traffic (GPRS, EDGE, UMTS R99)
high-speed data traffic (e.g. HSPA, LTE).

Update of the mobile LRIC model: change report | 9
Ref: 2002126-153 .
Figure 2.10: Share of voice traffic carried by each network generation [Source: Analysys Mason, 2015]
We have assumed that the voice traffic generated by 4G subscribers is carried by 2G and by 3G
networks (respectively 55% and 45% of the total) until the launch of VoLTE, which is set to occur
in 2016 in the base case. The fact that a higher share of voice traffic falls back onto the 2G
network is due to its ubiquitous coverage. For more details on the migration to VoLTE, please see
the Launch of VoLTE paragraph in Section 3.7. We are also assuming that 10% (stable over the
modelling time period) of the voice traffic generated by 3G subscribers is downgraded to 2G,
again because of the lower 3G population coverage.
Figure 2.11: Share of data traffic carried by each network generation [Source: Analysys Mason, 2015]
78% 77% 77% 75% 71%65%
57%49%
43%39% 35% 32% 29% 28% 27%
22% 23% 23% 25% 29%31%
30%
29%
27%26%
25%25%
24% 24% 23%
0% 0% 0% 0% 0% 4%13%
22%30%
36%40% 44% 46% 49% 50%
0%
10%
20%
30%
40%
50%
60%
70%
80%
90%
100%
2011 2012 2013 2014 2015 2016 2017 2018 2019 2020 2021 2022 2023 2024 2025
% o
f vo
ice
min
ute
s
2G - minutes 3G - minutes 4G - minutes
0% 0% 0% 0% 0% 0% 0% 0% 0% 0% 0% 0% 0% 0% 0%
100% 99%94%
84%
69%
54%
41%31%
24% 20% 17% 15% 15% 14% 13%
0% 1%6%
16%
31%
46%
59%69%
76% 80% 83% 85% 85% 86% 87%
0%
10%
20%
30%
40%
50%
60%
70%
80%
90%
100%
2011 2012 2013 2014 2015 2016 2017 2018 2019 2020 2021 2022 2023 2024 2025
% o
f m
eg
ab
yte
s o
f d
ata
2G - megabytes 3G - megabytes 4G - megabytes
%
Update of the mobile LRIC model: change report | 10
Ref: 2002126-153 .
We have assumed that a certain percentage of the data traffic generated by 4G subscribers (30% in
2012, decreasing to 5% in 2021) falls back on to the existing 3G network, which serves as an
additional capacity layer. This is caused by the fact that mobile operators will try to re-use capacity
on their 3G networks once subscribers have begun migrating to 4G, in order to optimise the capital
expenditure.
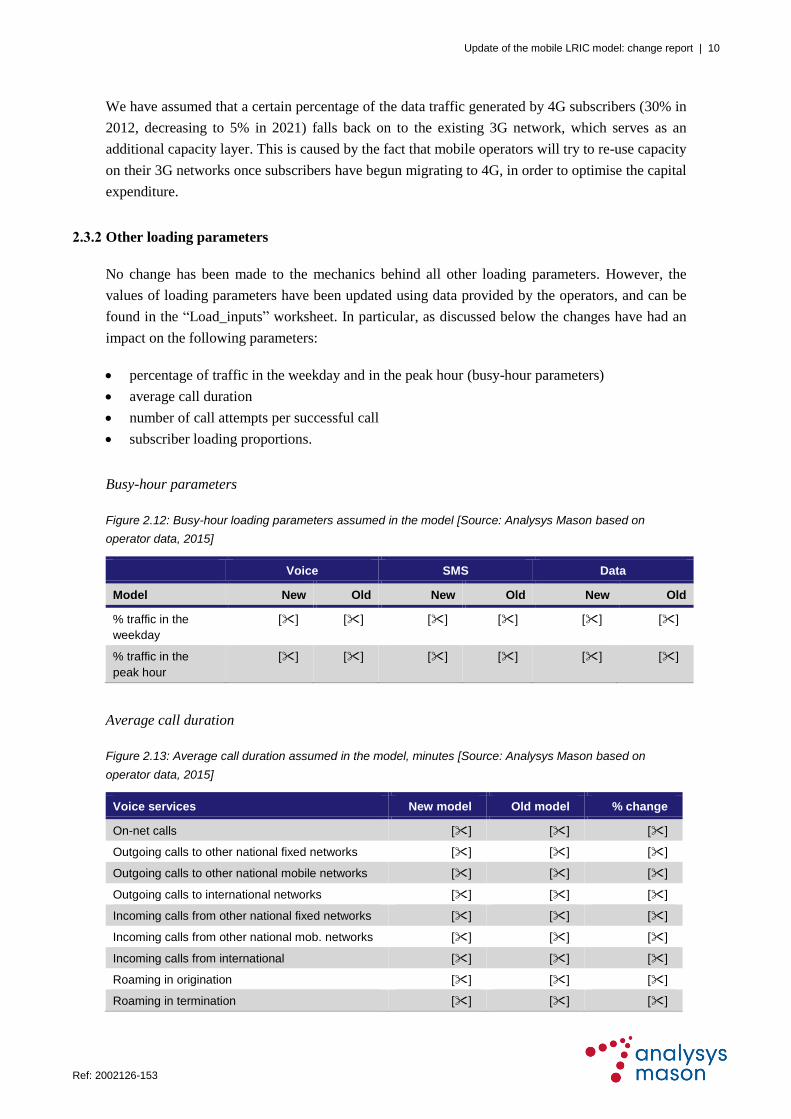
2.3.2 Other loading parameters
No change has been made to the mechanics behind all other loading parameters. However, the
values of loading parameters have been updated using data provided by the operators, and can be
found in the “Load_inputs” worksheet. In particular, as discussed below the changes have had an
impact on the following parameters:
percentage of traffic in the weekday and in the peak hour (busy-hour parameters)
average call duration
number of call attempts per successful call
subscriber loading proportions.
Busy-hour parameters
Figure 2.12: Busy-hour loading parameters assumed in the model [Source: Analysys Mason based on
operator data, 2015]
Voice SMS Data
Model New Old New Old New Old
% traffic in the
weekday
[] [] [] [] [] []
% traffic in the
peak hour
[] [] [] [] [] []
Average call duration
Figure 2.13: Average call duration assumed in the model, minutes [Source: Analysys Mason based on
operator data, 2015]
Voice services New model Old model % change
On-net calls [] [] []
Outgoing calls to other national fixed networks [] [] []
Outgoing calls to other national mobile networks [] [] []
Outgoing calls to international networks [] [] []
Incoming calls from other national fixed networks [] [] []
Incoming calls from other national mob. networks [] [] []
Incoming calls from international [] [] []
Roaming in origination [] [] []
Roaming in termination [] [] []

Update of the mobile LRIC model: change report | 11
Ref: 2002126-153 .
Call attempts per successful call
Figure 2.14: Call attempts per successful call assumed in the model [Source: Analysys Mason based on
operator data, 2015]
Voice services New model Old model % change
On-net calls [] [] []
Outgoing calls to other national fixed networks [] [] []
Outgoing calls to other national mobile networks [] [] []
Outgoing calls to international networks [] [] []
Incoming calls from other national fixed networks [] [] []
Incoming calls from other national mob. networks [] [] []
Incoming calls from international [] [] []
Roaming in origination [] [] []
Roaming in termination [] [] []
Subscriber loading proportions
We have updated the active packet data protocol (PDP) context per 2G and 3G subscriber on the
basis of data provided by the operators.
Figure 2.15: Active PDP contexts per subscribers [Source: Analysys Mason, 2015]
New model Old model % change
Active PDP contexts per 2G subscribers [] [] []
Active PDP contexts per 3G subscribers [] [] []
This parameter is used to dimension the GGSN core network equipment.
2.4 Definition of the geotypes and theoretical radii
All of the inputs calculated on a per-geotype basis, including the definition of the geotypes
themselves, must be consistent among them. Consequently, we have updated all of these inputs
according to two main principles:
Availability of homologue benchmarks, with a closer look to regulatory models that have
already included the 4G network
Validation through third-party sources to double-check that the input values used in the model
are sensible (i.e. inside the benchmark range).
Definition of the geotypes and traffic distribution
We have updated the population density thresholds for the definition of the geotypes according to
available benchmarks; indeed, the definition of the geotypes is based on a number of factors,

Update of the mobile LRIC model: change report | 12
Ref: 2002126-153 .
including conformation of the territory, availability of locations suitable for mobile sites, etc.,
which are approximated with the population density (which is an indirect proxy for the expected
traffic in the area). These thresholds are – and must be – directly correlated with the updated cell
radii values (see par. Theoretical coverage radius).
Figure 2.16: Comparison of the distribution of population across geotypes in the new and in the 2011 models
[Source: Analysys Mason, 2015]
Density threshold
(pop/km2)
% of
population
Density threshold
(pop/km2)
% of
population
New model Old model
Dense urban d > 14 000 1.5% d > 7500 8.1%
Urban 1100 < d < 14 000 38.8% 280 < d < 7500 54.3%
Suburban 100 < d < 1100 42.0% 35 < d < 280 29.8%
Rural d < 100 17.7% d < 35 7.8%
In a similar manner, we have also updated the distribution of traffic by geotype in the Radio access
network elements and inputs section of the “NwDes_Inputs” worksheet (see Figure 2.17). A
distinction is now made between voice and data traffic in order to capture the impact of the take-up
of mobile broadband (as a substitute for fixed broadband connections) in suburban and rural areas.
Figure 2.17: Voice and data traffic distribution by geotype [Source: Analysys Mason, 2015]
Geotypes Voice traffic
(new model)
Data traffic
(new model)
Voice and data traffic
(old model)
Dense urban 3.9% 3.0% 13.7%
Urban 54.0% 49.3% 57.8%
Suburban 32.0% 36.9% 23.3%
Rural 10.2% 10.8% 5.3%
Theoretical coverage radius
We have updated the theoretical radii of each spectrum band since the used radii have to be
consistent with the definition of the geotypes (see Figure 2.18), and cross-checked that these
figures are aligned with available benchmarks. This change can be seen in the Radio network
section of the “NwDes_Inputs” worksheet. Of course, the model also includes radii for the new
LTE bands (800MHz and 2600MHz), which are assumed to be around 120% and 78% of the
900MHz radius respectively.
Figure 2.18: Theoretical cell radius in kilometres assumed in the models by geotype and frequency band
[Source: Analysys Mason, 2015]
Geotype 800MHz 900MHz 1800MHz 2100MHz 2600MHz
New model
Dense urban 0.55 0.45 0.40 0.38 0.35

Update of the mobile LRIC model: change report | 13
Ref: 2002126-153 .
Urban 1.96 1.61 1.43 1.39 1.27
Suburban 5.42 4.46 3.95 3.84 3.50
Rural 6.01 4.95 4.38 4.31 3.89
Old model
Dense urban N/A 0.54 0.34 0.25 N/A
Urban N/A 2.97 1.86 1.41 N/A
Suburban N/A 4.45 2.78 2.12 N/A
Rural N/A 6.24 3.90 3.00 N/A
The fact that the average theoretical 2G radii for urban and rural geotypes in the new model are
smaller than those in the old model is consistent with the fact that these geotypes have a higher
average density than in the old model. In contrast, the 3G radius has increased in suburban and
rural geotypes. This is justified by the fact we revised upwards the 3G outdoor population
coverage of the modelled operator (see the 3G outdoor population coverage paragraph in
Section 2.5). An increase in coverage means that the incremental sites are more likely to be
deployed in less dense areas, and are therefore expected to have a larger radius.
The scorched-node coverage coefficient (SNOCC) has also been updated in order to calibrate the
model against the number of sites provided by the operators.
Figure 2.19: Scorched-node coverage coefficient (SNOCC) assumed in the models by geotype and frequency
band [Source: Analysys Mason, 2015]
Geotype 800MHz 900MHz 1800MHz 2100MHz 2600MHz
New model
Dense urban 0.54 0.57 0.59 0.59 0.61
Urban 0.59 0.62 0.65 0.65 0.67
Suburban 0.68 0.72 0.74 0.74 0.77
Rural 0.74 0.78 0.81 0.81 0.84
Old model
Dense urban N/A 0.62 1.00 1.00 N/A
Urban N/A 0.68 1.00 1.00 N/A
Suburban N/A 0.72 1.00 1.00 N/A
Rural N/A 0.90 1.00 1.00 N/A
Average distance of the backhaul links by geotype
In accordance to the changes made on geotype definition threshold (and on the theoretical cell
radii) we have updated also the average link distances in order to maintain the same average
national value. Figure 2.20 below reports the comparison of the distribution of the backhaul links
by length between the new and the old model.

Update of the mobile LRIC model: change report | 14
Ref: 2002126-153 .
Figure 2.20: Comparison of the distribution of backhaul links by length [Source: Analysys Mason, 2015]
Geotype <10km 10–30km 30–50km
New model
Dense urban 100% - -
Urban 93.0% 7.0% -
Suburban 72.0% 27.0% 1.0%
Rural 55.0% 39.0% 6.0%
Old model
Dense urban 100% - -
Urban 83.0% 17.0% 0.1%
Suburban 53.3% 45.5% 1.2%
Rural 36.0% 56.3% 7.7%
For the same reason, we have updated the share of self-provided backhaul links by geotype in
order to keep the national share constant between the new and the old model.
Figure 2.21: Share of self-provided backhaul transit links [Source: Analysys Mason, 2015]
Geotypes New model Old model Change (p.p.)
Dense urban 2.00% 10.00% -8.0%
Urban 15.00% 30.00% -15.0%
Suburban 85.00% 100.00% -15.0%
Rural 100.00% 100.00% -
These updates can be found in the ‘Backhaul Last Mile Access (LMA)’ section of the
“NwDes_Inputs” worksheet.
2.5 Network parameters and modelling updates
3G outdoor population coverage
We have updated the 3G population coverage, since data provided by the operators indicates that
they have achieved a higher outdoor coverage of the population than previously expected (see
Figure 2.22).

Update of the mobile LRIC model: change report | 15
Ref: 2002126-153 .
Figure 2.22: Comparison of UMTS 2100MHz outdoor population coverage [Source: Analysys Mason, 2015]
This update can be found in the ‘Coverage of population’ section of the “NwDes_Inputs”
worksheet.
Indoor special sites: share of traffic carried, distribution of the cells and share of sites scaling
with termination
The share of traffic carried by indoor special sites has remained broadly stable since the old model
was developed, according to the data provided by operators. Some of them have pointed out that
an increase can be expected in future in more densely populated areas; however, for conservative
reasons we have kept the proportion of indoor traffic broadly stable, with almost negligible
growth.
In the old model the indoor special sites were distributed across geotypes on the basis of the traffic
distribution over time. However, indoor site deployment is likely to be skewed towards more
densely populated areas, as stated by operators. In the new model we have assumed that the traffic
carried by these indoor cells will follow the same distribution (see Figure 2.23).
Figure 2.23: Distribution of indoor special sites and indoor carried traffic across geotypes [Source: Analysys
Mason, 2015]
Geotype 2G 3G 4G
Dense urban 20% 20% 20%
Urban 80% 80% 80%
Suburban - - -
Rural - - -
95.0%
91.0%
0%
10%
20%
30%
40%
50%
60%
70%
80%
90%
100%
200
5
200
6
200
7
200
8
200
9
201
0
201
1
201
2
201
3
201
4
201
5
201
6
201
7
201
8
201
9
202
0
202
1
2022
202
3
202
4
202
5
% o
f p
op
ula
tio
n
New model Old model
actual <-- --> forecast

Update of the mobile LRIC model: change report | 16
Ref: 2002126-153 .
We have also updated the number of 2G and 3G indoor special sites; in particular, the number of
2G sites has been increased in light of new figures provided by the operators. To estimate the
indoor site deployment of the modelled operator, we have used the ratio between the number of
indoor special sites and the number of macro sites for 2G as a proxy; that is, [] indoor special
sites per macro site.
The Portuguese MNOs exhibit similar ratios, which range between [] and []. Moreover, both
mobile operators have deployed a similar (slightly lower) number of 3G indoor sites compared to
those for 2G. Therefore we have assumed the number of 3G indoor sites to be [] of the 2G sites
we previously calculated.
According to their responses to the data request, operators do not envisage a significant
deployment of special indoor sites in the future; as such, we have kept the number flat over the
forecast period (as shown in Figure 2.24 and Figure 2.25).
Figure 2.24: Comparison of the number of 2G indoor
special sites [Source: Analysys Mason, 2015]
Figure 2.25: Comparison of the number of 3G indoor
special sites [Source: Analysys Mason, 2015]
[]
[]
The old model assumed that 25% of 2G sites were not necessary when removing the termination
traffic, based on benchmarks. We have revised this percentage by assuming that the indoor special
sites scale with termination in the same proportion as macro sites, which are calculated separately
for 2G, 3G and 4G (see Figure 2.26): the methodology change is justified on the basis that there is
no reason to assume that special sites behave in a different manner than the macro ones with
respect to termination any longer.
Figure 2.26: Share of indoor special sites that are assumed to scale with termination traffic [Source: Analysys
Mason, 2015]
Model 2G 3G 4G
New model 5% 2% -
Old model 25% - -

Update of the mobile LRIC model: change report | 17
Ref: 2002126-153 .
These updates can be found in the ‘Radio access network elements and inputs’ section of the
“NwDes_Inputs” worksheet.
Sectorisation
We have updated the share of sites with one, two or more sectors on the basis of new data
provided by the operators (see Figure 2.27). In line with what was done in the old model, we have
assumed the same sectorisation across geotypes.
Figure 2.27: Comparison of the sectorisation by technology between the new and old models [Source:
Analysys Mason based on operator data, 2015]
Technology 1 sector 2 sectors 3+ sectors
GSM 900MHz
New model [] [] []
Old model [] [] []
GSM 1800MHz
New model [] [] []
Old model [] [] []
UMTS 2100MHz
New model [] [] []
Old model [] [] []
LTE 800MHz
New model [] [] []
Old model [] [] []
LTE 1800MHz
New model [] [] []
Old model [] [] []
LTE 2600MHz
New model [] [] []
Old model [] [] []
These updates can be found in the ‘Radio access network elements and inputs’ section of the
“NwDes_Inputs” worksheet.
2G BTS capacity
We have updated the maximum number of TRXs per sector from 6 to 10 on the basis of new data
provided by the operators.

Update of the mobile LRIC model: change report | 18
Ref: 2002126-153 .
3G NodeB capacity
We have updated the channelisation of UMTS carriers and added additional HSDPA speeds (e.g.
HSDPA10.1, HSDPA14.4 and HSDPA84.4). According to the new inputs received from the
operators, they have rolled out HSPA+ (42.2Mbit/s using DC-HSDPA), while conversely there is
no indication that HSDPA84.4Mbit/s will be rolled out in future; we have updated the model
accordingly, i.e. to include HSDPA42.2Mbit/s but ignore HSDPA84.4Mbit/s.
Figure 2.28: Comparison of HSPDA42.2Mbit/s deployment by geotype [Source: Analysys Mason based on
operator data, 2015]
Geotype New model Old model
Dense urban 2012 N/A
Urban 2013 N/A
Suburban 2015 N/A
Rural N/A N/A
Micro/indoor 2012 2013
Similarly, we have updated the activation year for the lower-speed HSDPA21.1Mbit/s, as shown
in Figure 2.29.
Figure 2.29: Comparison of HSPDA21.1Mbit/s deployment by geotype [Source: Analysys Mason based on
operator data, 2015]
Geotype New model Old model
Dense urban 2010 2010
Urban 2011 N/A
Suburban 2012 N/A
Rural N/A N/A
Micro/indoor 2010 2012
We have also updated the minimum and maximum number of channel elements that can be
deployed on 3G NodeBs on the basis of data provided by the operators, as shown in Figure 2.30.
Figure 2.30: Comparison of the minimum channel elements deployment per carrier [Source: Analysys Mason,
2015]
Carrier Minimum channels Maximum channels
New model Old model New model Old model
R99 (voice) [] 48 [] 112
1.8Mbit/s [] 32 N/A N/A
3.6Mbit/s [] 64 N/A N/A
7.2Mbit/s [] 64 N/A N/A
10.1Mbit/s [] N/A N/A N/A
14.4bit/s [] N/A N/A N/A

Update of the mobile LRIC model: change report | 19
Ref: 2002126-153 .
21.1Mbit/s [] 128 N/A N/A
42.2Mbit/s [] 128 N/A N/A
84.4Mbit/s [] N/A N/A N/A
HSUPA [] 48 N/A N/A
As a consequence of these updates, the 3G network is more traffic capable in the new model than
in the old one (for both voice and data).
Finally, in the new model we have adjusted the share of R99 channels which are sensitive to
termination traffic from 25% to 0%.
All of these updates can be found in the ‘Radio access network elements and inputs’ section of the
“NwDes_Inputs” worksheet.
Proportions of owned and third-party sites
We have updated the percentage of sites that are not owned by the hypothetical existing operator
on the basis of new data provided by the operators (see Figure 2.31).
Figure 2.31: Comparison of the shares of owned and third-party sites in the old and new models [Source:
Analysys Mason, 2015]
Site ownership New model Old model
Operator [] []
Third party [] []
This update can be found in the ‘Radio access network elements and inputs’ section of the
“NwDes_Inputs” worksheet.
Access network elements capacity
We have updated the capacity drivers for the access network elements to take into account inputs
received from the operators:
BSCs: we have increased the minimum deployment from 2 to 8, and increased the capacity in
terms of E1 incoming ports from 250 to 300
RNC: we have increased the capacity of busy-hour traffic from 1600 to 2458Mbit/s
MSCs: we have increased the minimum deployment from 4 to 7.
Backhaul and transmission
We have updated the number of sites that are connected per access point on the basis of new data
provided by the operators, as shown in Figure 2.32.

Update of the mobile LRIC model: change report | 20
Ref: 2002126-153 .
Figure 2.32: Average number of radio sites connected to the upper-level access point, by technology [Source:
Analysys Mason based on data provided by operators, 2015]
Technology New model Old model
2G 200 50
3G 200 180
4G 200 N/A
We have calibrated the model in order to capture the new data received from operators about the
technologies used for their last-mile access (LMA). We have retained assumptions from the old
model relating to the distribution of technologies by geotype; for instance, we assume fibre
backhaul to be concentrated in more densely populated geotypes. The new model now includes the
backhaul links to LTE sites.
Figure 2.33: Share of sites connected by radio technology, backhaul technology and by geotype [Source:
Analysys Mason based on operators’ data, 2015]
Geotype Leased lines Microwave DSL Fibre
New model
2G
Dense Urban 15.0% 20.0% - 65.0%
Urban 20.0% 35.0% - 45.0%
Suburban 20.0% 60.0% - 20.0%
Rural 38.0% 60.0% - 2.0%
Indoor / micro 100.0% - - -
3G
Dense Urban 15.0% 5.0% - 80.0%
Urban 15.0% 30.0% - 55.0%
Suburban 20.0% 40.0% - 40.0%
Rural 20.0% 60.0% - 20.0%
Indoor / micro 100.0% - - -
4G
Dense Urban 3.0% 2.0% - 95.0%
Urban 5.0% 15.0% - 80.0%
Suburban 15.0% 30.0% - 55.0%
Rural 36.0% 60.0% - 4.0%
Indoor / micro 100.0% - - -
Old model
2G
Dense Urban 15.0% 10.0% - 75.0%
Urban 20.0% 35.0% - 45.0%
Suburban 20.0% 60.0% - 20.0%
Rural 28.0% 70.0% - 2.0%

Update of the mobile LRIC model: change report | 21
Ref: 2002126-153 .
Geotype Leased lines Microwave DSL Fibre
Indoor / micro 100.0% - - -
3G
Dense Urban 15.0% 5.0% - 80.0%
Urban 20.0% 30.0% - 50.0%
Suburban 20.0% 55.0% - 25.0%
Rural 28.0% 70.0% - 2.0%
Indoor / micro 100.0% - - -
These updates can be found in the ‘Transmission’ section of the “Nw_Des_Inputs” worksheet.
HSPA backhaul capacity requirements
We have improved the methodology used to calculate the capacity requirements for HSPA
backhaul links. In the old model the requirement was derived only from the peak capacity
available on the site; however, the capacity requirement is also influenced by commercial
considerations, since the upgrade to newer releases increases the speed as well as the capacity
needed. The new model dimensions the E1-equivalent circuit requirement on the basis of the
actual traffic transported, also taking into account the channel elements (CE) maximum utilisation
in order to ensure the resilience of the links.
These updates can be found in the ‘3G radio network’ section of the “Nw_Des_Inputs” worksheet.
Maximum utilisation
We have also updated the maximum utilisation of the main network elements by calibrating them
on the basis of the data received from the operators.
[]
Figure 2.34:
Comparison of
maximum utilisation for
major network elements
[Source: Analysys
Mason based on model
calibration, 2015]

Update of the mobile LRIC model: change report | 22
Ref: 2002126-153 .
2.6 Cost inputs
The results in the new model are shown in real 2013 EUR terms, and so the unit costs have been
updated accordingly. Therefore, in the “Asset_input” worksheet the inputs have been replaced
with the 2013 values in order to keep the unit costs unvaried from the old model, unless any update
was required. In this section of the report we provide an overview of the unit cost changes between
the new and the old model, both in real 2013 EUR terms.
Capex costs
In the following paragraphs we highlight the main updates related to unit capex.
► Radio sites and base stations
As shown in Figure 2.35, we have revised downwards the unit capex for the acquisition of radio
access network elements, on the basis of the data provided by the operators and our benchmarks
from other Western European regulatory cost models. For the physical sites we have maintained a
positive forecast cost trend (even in light of a decrease in actual values) since the main
components of these costs are labour and building materials, which are forecast to be stable or
slightly increase in real terms in the future.
Figure 2.35: Radio sites and base stations – comparison of unit capex and of cost trends assumed in the new
and old models [Source: Analysys Mason based on operator data and international benchmarks, 2015]
Asset 2013 unit cost
(real 2013 EUR)
Cost trend
(year-on-year % change)
New model Old model New model Old model
Own macro site location [] [] 1.0% 1.0%
Third party macro site location [] [] 1.0% 1.0%
Third party indoor site location [] [] 1.0% 1.0%
Macro BTS 1-sector [] [] -5.0% -3.0%
Macro BTS 2-sector [] [] -5.0% -3.0%
Macro BTS 3-sector [] [] -5.0% -3.0%
Indoor / special BTS [] [] -5.0% -3.0%
Macro NodeB 3-sectors [] [] -5.0% -3.0%
Indoor / special NodeB [] [] -5.0% -3.0%
Site upgrade – 2G to 3G [] [] -5.0% -3.0%
RNC base unit [] [] -10.0% -10.0%
We have also updated the cost trends for the base-station asset items (e.g. BTS, NodeB, eNodeB).
These updates can be found in the “Asset_input” worksheet.
Update of the mobile LRIC model: change report | 23
Ref: 2002126-153 .
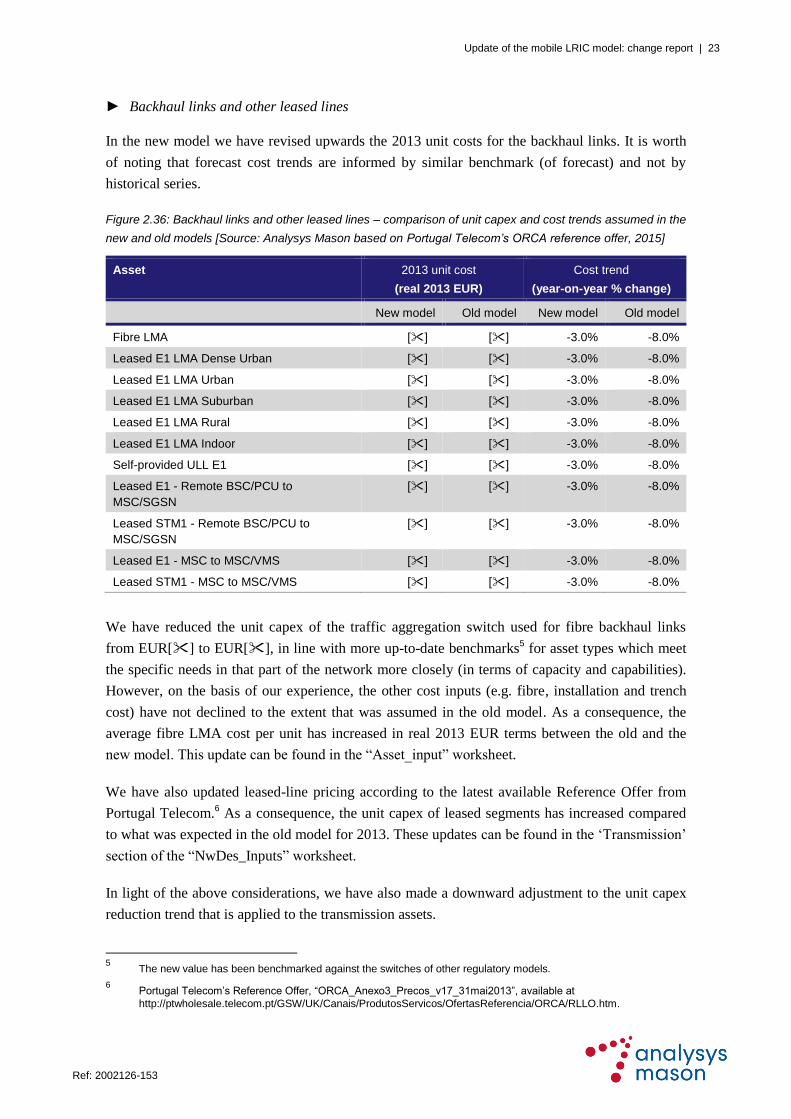
► Backhaul links and other leased lines
In the new model we have revised upwards the 2013 unit costs for the backhaul links. It is worth
of noting that forecast cost trends are informed by similar benchmark (of forecast) and not by
historical series.
Figure 2.36: Backhaul links and other leased lines – comparison of unit capex and cost trends assumed in the
new and old models [Source: Analysys Mason based on Portugal Telecom’s ORCA reference offer, 2015]
Asset 2013 unit cost
(real 2013 EUR)
Cost trend
(year-on-year % change)
New model Old model New model Old model
Fibre LMA [] [] -3.0% -8.0%
Leased E1 LMA Dense Urban [] [] -3.0% -8.0%
Leased E1 LMA Urban [] [] -3.0% -8.0%
Leased E1 LMA Suburban [] [] -3.0% -8.0%
Leased E1 LMA Rural [] [] -3.0% -8.0%
Leased E1 LMA Indoor [] [] -3.0% -8.0%
Self-provided ULL E1 [] [] -3.0% -8.0%
Leased E1 - Remote BSC/PCU to
MSC/SGSN
[] [] -3.0% -8.0%
Leased STM1 - Remote BSC/PCU to
MSC/SGSN
[] [] -3.0% -8.0%
Leased E1 - MSC to MSC/VMS [] [] -3.0% -8.0%
Leased STM1 - MSC to MSC/VMS [] [] -3.0% -8.0%
We have reduced the unit capex of the traffic aggregation switch used for fibre backhaul links
from EUR[] to EUR[], in line with more up-to-date benchmarks5 for asset types which meet
the specific needs in that part of the network more closely (in terms of capacity and capabilities).
However, on the basis of our experience, the other cost inputs (e.g. fibre, installation and trench
cost) have not declined to the extent that was assumed in the old model. As a consequence, the
average fibre LMA cost per unit has increased in real 2013 EUR terms between the old and the
new model. This update can be found in the “Asset_input” worksheet.
We have also updated leased-line pricing according to the latest available Reference Offer from
Portugal Telecom.6 As a consequence, the unit capex of leased segments has increased compared
to what was expected in the old model for 2013. These updates can be found in the ‘Transmission’
section of the “NwDes_Inputs” worksheet.
In light of the above considerations, we have also made a downward adjustment to the unit capex
reduction trend that is applied to the transmission assets.
5 The new value has been benchmarked against the switches of other regulatory models.
6 Portugal Telecom’s Reference Offer, “ORCA_Anexo3_Precos_v17_31mai2013”, available at
http://ptwholesale.telecom.pt/GSW/UK/Canais/ProdutosServicos/OfertasReferencia/ORCA/RLLO.htm.

Update of the mobile LRIC model: change report | 24
Ref: 2002126-153 .
Opex costs
We have revised the operational expenditure (opex) per unit in a similar way to that described for
capex. Noteworthy, we have decreased the share of indirect costs from []% to []% on the
basis of the cost data observed in our benchmarks for the 2012.
► Radio sites and base stations
We have updated the opex per unit for some of the radio sites and base-station assets on the basis
of our benchmarks from other Western European regulatory cost models.
Figure 2.37: Radio sites and base stations – comparison of unit opex and cost trends assumed in the new
and old models [Source: Analysys Mason based on operator data and international benchmarks, 2015]
Asset 2013 unit cost
(real 2013 EUR)
Cost trend
(year-on-year % change)
New model Old model New model Old model
Own macro site location [] [] - -
Third party macro site location [] [] - -
Third party indoor site location [] [] - -
Macro BTS 1-sector [] [] -12.0% -12.0%
Macro BTS 2-sector [] [] -12.0% -12.0%
Macro BTS 3-sector [] [] -12.0% -12.0%
Indoor / special BTS [] [] - -
Macro NodeB 3-sectors [] [] - -
Indoor / special NodeB [] [] - -
Site upgrade – 2G to 3G [] [] -2.0% -2.0%
RNC base unit [] [] - -
These updates can be found in the “Asset_input” worksheet.
► Backhaul links and other leased lines
We have validated the leased-line pricing on the basis of Portugal Telecom’s Reference Offer.7
Similar to what has happened to the unit capex, the 2013 operational expenditure per link has
increased between the old and the new model. The cost trend has been updated accordingly.
Figure 2.38: Backhaul links and other leased lines – comparison of unit opex and of cost trends assumed in
the new and old models [Source: Analysys Mason based on Portugal Telecom’s ORCA reference offer, 2015]
Asset 2013 unit cost
(real 2013 EUR)
Cost trend
(year-on-year % change)
New model Old model New model Old model
Fibre LMA [] [] -% -%
7 Portugal Telecom’s Reference Offer, “ORCA_Anexo3_Precos_v17_31mai2013”, available at
http://ptwholesale.telecom.pt/GSW/UK/Canais/ProdutosServicos/OfertasReferencia/ORCA/RLLO.htm.

Update of the mobile LRIC model: change report | 25
Ref: 2002126-153 .
Leased E1 LMA Dense Urban [] [] -5.0% -15.0%
Leased E1 LMA Urban [] [] -5.0% -15.0%
Leased E1 LMA Suburban [] [] -5.0% -15.0%
Leased E1 LMA Rural [] [] -5.0% -15.0%
Leased E1 LMA Indoor [] [] -5.0% -15.0%
Self-provided ULL E1 [] [] -5.0% -15.0%
Leased E1 - Remote BSC/PCU to
MSC/SGSN
[] [] -5.0% -15.0%
Leased STM1 - Remote BSC/PCU to
MSC/SGSN
[] [] -5.0% -15.0%
Leased E1 - MSC to MSC/VMS [] [] -5.0% -15.0%
Leased STM1 - MSC to MSC/VMS [] [] -5.0% -15.0%
In line with the assumptions taken for the backhaul links, we have decreased the cost trend of the
regional and national backbone links.
Figure 2.39: Regional and national backbone links – comparison of unit opex and of cost trends assumed in
the new and old models [Source: Analysys Mason, 2015]
Asset 2013 unit cost
(real 2013 EUR)
Cost trend
(year-on-year % change)
New model Old model New model Old model
Regional backbone access points STM1 [] [] -5.0% -15.0%
Regional backbone access points STM4 [] [] -5.0% -15.0%
Regional backbone access points STM16 [] [] -5.0% -15.0%
Regional backbone access points STM64 [] [] -5.0% -15.0%
Regional backbone distance (km) [] [] -5.0% -15.0%
National backbone access points STM1 [] [] -5.0% -15.0%
National backbone access points STM4 [] [] -5.0% -15.0%
National backbone access points STM16 [] [] -5.0% -15.0%
National backbone access points STM64 [] [] -5.0% -15.0%
National backbone distance (km) [] [] -5.0% -15.0%
These updates can be found in the ‘Transmission’ section of the “NwDes_Inputs” worksheet.
► Core network
We have refined the logics underlying the network management system (‘NMS’) from two points
of view to make it more in line with the current deployments of the Portuguese operators; more
specifically, we have:
updated (namely reduced) the cost to make it more in line with the actual costs reported by the
Portuguese operators

Update of the mobile LRIC model: change report | 26
Ref: 2002126-153 .
increased the number of “logical units” in order to take into account the deployment of LTE
and the launch of VoLTE.
Figure 2.40: Network management system – comparison of unit opex and of cost trends assumed in the new
and old models [Source: Analysys Mason, 2015]
Asset 2013 unit cost
(real 2013 EUR)
Cost trend
(year-on-year % change)
New model Old model New model Old model
Network management system (HW) [] [] - -
Network management system (SW) [] [] - -
2.7 Regulatory fees
To be consistent with the bottom-up model recently developed by Analysys Mason and ICP-
ANACOM for fixed core networks in Portugal, the new mobile model now includes a cost for
regulatory fees. In the interests of consistency and simplicity we have adopted the same
methodology followed in the fixed model, which is in line with ICP-ANACOM’s calculation of
the regulatory fees charged to the major telecoms operators (by revenue).
Indeed, Tier-2 operators (with revenue higher than EUR1.5 million) pay a variable regulatory fee
T2, which is a percentage of their revenue; i.e. 𝑇2 = 𝑡2 × 𝑅2, where t2 is the fee rate (expressed as
a percentage of revenue) and R2 is the relevant revenue, which excludes VAT, sales of terminals
(equipment), transactions between entities of the same group and revenue from the universal
service. t2 is calculated by ICP-ANACOM and is worth 0.5999% for the year 2014. In light of the
actual values, a long-term value of 0.6% for t2 appears reasonable (see Figure 2.41).
The mobile termination cost calculated by the new model is marked up by t2 to also take into
account the regulatory fees, i.e. 𝑇𝑒𝑟𝑚𝑖𝑛𝑎𝑡𝑖𝑜𝑛 𝑐𝑜𝑠𝑡𝑤𝑖𝑡ℎ 𝑟𝑒𝑔𝑢𝑙𝑎𝑡𝑜𝑟𝑦 𝑓𝑒𝑒𝑠 = 𝑇𝑒𝑟𝑚𝑖𝑛𝑎𝑡𝑖𝑜𝑛 𝑐𝑜𝑠𝑡 ×
(1 + 𝑡2).

Update of the mobile LRIC model: change report | 27
Ref: 2002126-153 .
Figure 2.41: t2 forecast
for calculation of the
regulatory fees included
in the model [Source:
Analysys Mason, 2015]
2.8 WACC
We have updated the WACC following the same methodology used in the old model. Figure 2.42
compares the WACC components between the new and the old version of the model.
Figure 2.42: Comparison of WACC components [Source: Analysys Mason, 2015]
WACC New
model
Old
model
Source
Risk-free rate, nominal 3.91% 4.80% ECB, Eurostat
Equity premium 5.75% 6.02% Average between the data from
Aguirreamalloa and Linares and
from Damodaran
Beta (relevered for gearing and tax) 1.57 0.81 Calculation
Unlevered beta 0.69 0.53 Average of mobile operators’ beta
(Mobistar, Telenor ASA,
TeliaSonera AB, Vodafone, Mobile
Telesystems) extracted from
Reuters8 and Financial Times
9
websites
Nominal cost of equity (post-tax) 12.92% 9.67% Calculation
Nominal cost of equity (pre-tax) 17.82% 13.62% Calculation
Nominal cost of debt (pre-tax) 4.84% 6.14% Calculation
Debt premium over risk-free rate 0.93% 1.34% Benchmark of debt premiums
adopted by other Western
European telecoms regulators
8 See http://www.reuters.com/finance/stocks/.
9 See http://markets.ft.com/research/Markets/Overview.
0.5% 0.5% 0.5%0.5%
0.6%
0.6% 0.6% 0.6% 0.6% 0.6%0.6%
0.0%
0.1%
0.2%
0.3%
0.4%
0.5%
0.6%
0.7%
200
5
200
6
200
7
200
8
200
9
201
0
2011
201
2
201
3
201
4
201
5
2016
201
7
201
8
201
9
202
0
202
1
202
2
202
3
202
4
202
5
% o
f re
ve
nu
e
actual <-- --> forecast
Update of the mobile LRIC model: change report | 28
Ref: 2002126-153 .
Gearing D/(D+E) 56.19% 33.93% Average 2010–2014 gearing of
Western European mobile
operators (Mobistar, Telenor ASA,
TeliaSonera AB, Vodafone, Mobile
Telesystems) sourced from
Financial Times and Morningstar
Debt over equity (D/E) 128.28% 51.36% Calculation
Marginal tax rate 27.50% 29.00% Tax rate for 2015, DG Orcamento10
Nominal WACC (pre-tax) 10.52% 11.08% Calculation
Inflation rate 1.70% 1.73% 2015–2025 average based on
Euromonitor
Real pre-tax WACC 8.68% 9.19% Calculation
2.9 Other updates
The other relevant model updates are presented in this section.
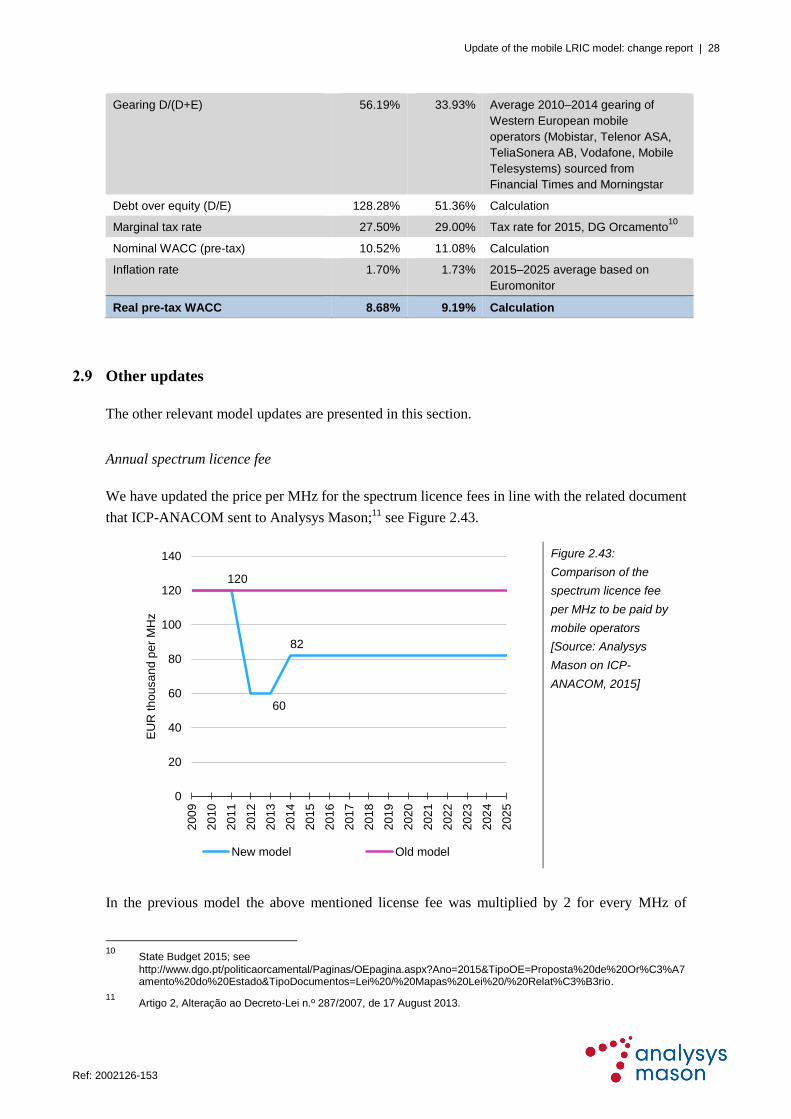
Annual spectrum licence fee
We have updated the price per MHz for the spectrum licence fees in line with the related document
that ICP-ANACOM sent to Analysys Mason;11
see Figure 2.43.
Figure 2.43:
Comparison of the
spectrum licence fee
per MHz to be paid by
mobile operators
[Source: Analysys
Mason on ICP-
ANACOM, 2015]
In the previous model the above mentioned license fee was multiplied by 2 for every MHz of
10
State Budget 2015; see
http://www.dgo.pt/politicaorcamental/Paginas/OEpagina.aspx?Ano=2015&TipoOE=Proposta%20de%20Or%C3%A7amento%20do%20Estado&TipoDocumentos=Lei%20/%20Mapas%20Lei%20/%20Relat%C3%B3rio.
11 Artigo 2, Alteração ao Decreto-Lei n.º 287/2007, de 17 August 2013.
120
60
82
0
20
40
60
80
100
120
140
200
9
201
0
201
1
201
2
2013
201
4
2015
201
6
2017
201
8
2019
202
0
2021
202
2
2023
202
4
2025
EU
R t
ho
usa
nd
pe
r M
Hz
New model Old model

Update of the mobile LRIC model: change report | 29
Ref: 2002126-153 .
spectrum beyond 35MHz. This rule has been removed from the model, since it does no long apply
as we understand from our conversations with ICP-ANACOM.
These updates can be found in the ‘Spectrum and licence fees’ section of the “NwDes_Inputs”
worksheet.
Real 2013 versus real 2011 results
The results that were shown in real 2011 EURcents in the old model are shown as real 2013
EURcents in the new model.

Update of the mobile LRIC model: change report | 30
Ref: 2002126-153 .
3 The inclusion of 4G in the model
This section describes all the changes we have made to the model to include 4G services, 4G
network, 4G spectrum bands, etc.
3.1 Inclusion of new services (retail and network)
We have added the services provided over the 4G network homologous to those already provided
over the 2G and 3G networks. However, even though 4G data services have been offered since
2012, it will only be possible to offer voice services over 4G once the mobile operators have rolled
out their voice over LTE (VoLTE) platform; we have assumed the commercial launch of VoLTE
to take place in 2016. We discuss the topic in more detail in the Launch of VoLTE paragraph of
Section 3.7.
New network services included in the model
4G On-net calls
4G Outgoing calls to other national fixed networks
4G Outgoing calls to other national mobile networks
4G Outgoing calls to international
4G Incoming calls from other national fixed networks
4G Incoming calls from other national mobile networks
4G Incoming calls from international
4G Roaming in origination
4G Roaming in termination
4G On-net SMS
4G Outgoing SMS to other networks
4G Incoming SMS from other networks
4G Data (LTE)
Figure 3.1: 4G network
services [Source:
Analysys Mason, 2015]
3.2 4G-capable spectrum holding and spectrum upfront payment
LTE spectrum holding and re-farming of the 1800MHz spectrum band
The 2011 spectrum auction assigned LTE-capable spectrum in three bands, i.e. 800MHz,
1800MHz and 2600MHz.12
12
ICP-ANACOM, “Information on multi-band spectrum auction”, available at
http://www.anacom.pt/render.jsp?contentId=1106646#.VIr2UzHF_pV.

Update of the mobile LRIC model: change report | 31
Ref: 2002126-153 .
As shown in Figure 3.2, the three MNOs were awarded similar spectrum lots, with Vodafone
obtaining the largest amount of spectrum in total, thanks to additional lots in the 900MHz and
2600MHz bands (the latter including an unpaired TDD lot).
Spectrum
bands
MEO Vodafone NOS
800MHz 2×10MHz 2×10MHz 2×10MHz
900MHz - 2×5MHz -
1800MHz 2×14MHz 2×14MHz 2×14MHz
2600MHz 2×20MHz 2×20MHz
25MHz TDD
2×20MHz
Figure 3.2: Outcome of
the 2011 spectrum
auction in Portugal
[Source: ICP-ANACOM,
2014]
In light of these results we have assumed a spectrum holding for the modelled operator as shown
in Figure 3.3, with an amount of LTE-capable spectrum similar to that actually awarded to existing
Portuguese MNOs.
Figure 3.3: Paired spectrum holding assumed for the modelled operator [Source: Analysys Mason, 2015]
800MHz 900MHz 1800MHz 2100MHz 2600MHz
Old model - 2×8MHz 2×6MHz 2×20MHz -
New spectrum assigned in 2011 2×10MHz - 2×14MHz - 2×20MHz
Spectrum holding from 2012 2×10MHz 2×8MHz 2×20MHz 2×20MHz 2×20MHz
The spectrum in the 800MHz band is modelled to provide the primary coverage layer for LTE,
whereas the 2.6GHz and the 1.8GHz ones are modelled to provide primary and secondary capacity
overlays respectively.
We have modelled the re-farming of the GSM 1800MHz spectrum to LTE in 2018; indeed, this
spectrum has already been used to provide LTE services by Portuguese MNOs (some on selected
sites, others on all sites). However, the re-farming of GSM spectrum to LTE is subject to the
migration of voice traffic from 2G to other networks; indeed, the capacity provided by the
GSM 900MHz coverage layer alone is insufficient to carry the modelled operator’s 2G traffic, and
so the operator would need to make additional investments to increase the capacity installed (i.e.
by deploying additional sites). Therefore, we consider the launch of VoLTE as a key enabler of
spectrum re-farming. The spectrum is re-farmed at the beginning of 2018 because this is the first
year in which the share of total voice traffic carried on the 2G network falls below 50%.
LTE spectrum costs
The latest spectrum auction awarded all the spectrum lots at the reserve price. We have therefore
assumed the same upfront payments for the modelled operator and a 15-year licence duration, as
shown in Figure 3.4.
Update of the mobile LRIC model: change report | 32
Ref: 2002126-153 .
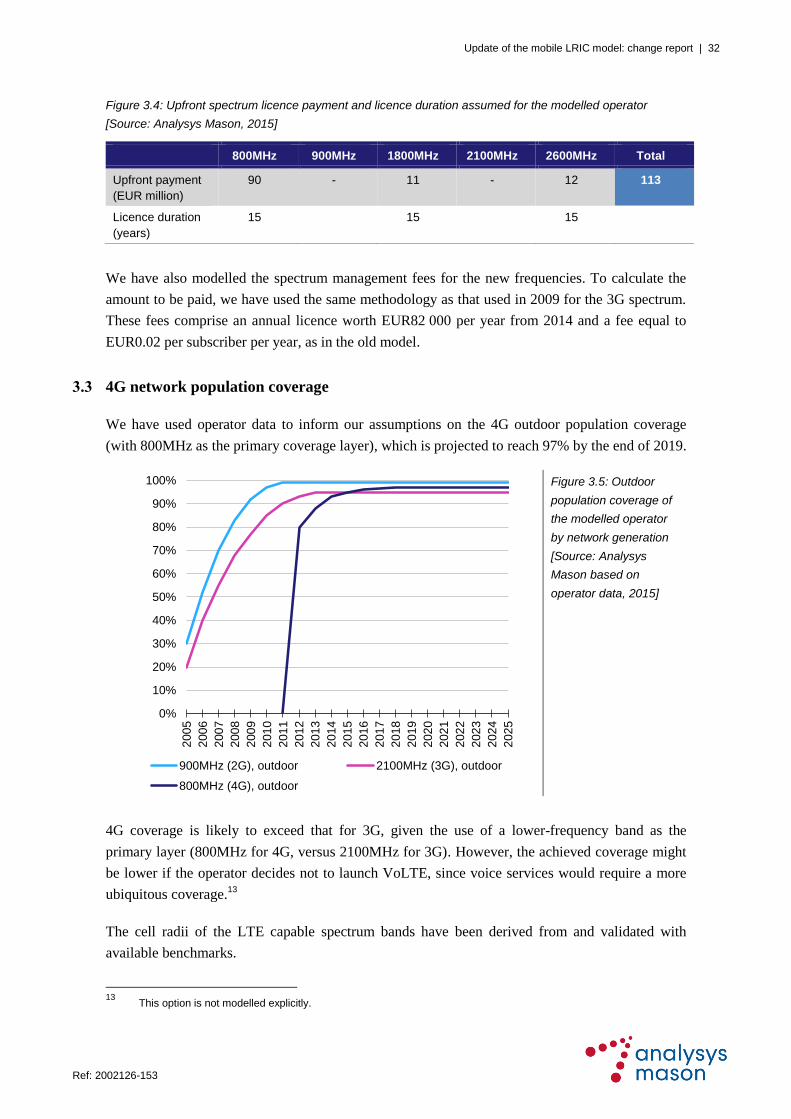
Figure 3.4: Upfront spectrum licence payment and licence duration assumed for the modelled operator
[Source: Analysys Mason, 2015]
800MHz 900MHz 1800MHz 2100MHz 2600MHz Total
Upfront payment
(EUR million)
90 - 11 - 12 113
Licence duration
(years)
15 15 15
We have also modelled the spectrum management fees for the new frequencies. To calculate the
amount to be paid, we have used the same methodology as that used in 2009 for the 3G spectrum.
These fees comprise an annual licence worth EUR82 000 per year from 2014 and a fee equal to
EUR0.02 per subscriber per year, as in the old model.
3.3 4G network population coverage
We have used operator data to inform our assumptions on the 4G outdoor population coverage
(with 800MHz as the primary coverage layer), which is projected to reach 97% by the end of 2019.
Figure 3.5: Outdoor
population coverage of
the modelled operator
by network generation
[Source: Analysys
Mason based on
operator data, 2015]
4G coverage is likely to exceed that for 3G, given the use of a lower-frequency band as the
primary layer (800MHz for 4G, versus 2100MHz for 3G). However, the achieved coverage might
be lower if the operator decides not to launch VoLTE, since voice services would require a more
ubiquitous coverage.13
The cell radii of the LTE capable spectrum bands have been derived from and validated with
available benchmarks.
13
This option is not modelled explicitly.
0%
10%
20%
30%
40%
50%
60%
70%
80%
90%
100%
200
5
200
6
200
7
2008
200
9
201
0
201
1
2012
201
3
201
4
201
5
2016
201
7
201
8
201
9
2020
202
1
202
2
202
3
2024
202
5
900MHz (2G), outdoor 2100MHz (3G), outdoor
800MHz (4G), outdoor

Update of the mobile LRIC model: change report | 33
Ref: 2002126-153 .
Indoor special sites
We have assumed that the number of 4G indoor special sites will converge with the number of 2G
special sites (which are deployed for indoor coverage).
3.4 The LTE network
We have modelled a theoretical LTE network in accordance with international best practice,14
which appears in line with the networks actually rolled out by Portuguese operators.
Figure 3.6 illustrates the main components of the all-IP LTE network we have modelled:
E-UTRAN (orthogonal frequency division multiplexing (OFDM)) access network
evolved packet core (EPC) core network.
Figure 3.6: Illustration of the modelled LTE network and the relationship with the legacy GPRS infrastructure
[Source: Analysys Mason, 2015]
In the following sections we provide an overview of the equipment and dimensioning rules
followed in the model.
14
Telecom Italia, Notiziario Tecnico: speciale LTE, perché? Sostenibilità, tecnologie e uso delle nuove reti, Q3 2013.
(URL http://www.telecomitalia.com/content/dam/telecomitalia/it/archivio/documenti/Innovazione/MnisitoNotiziario/2013/2-2013/NT2-2013.pdf); Alcatel-Lucent, Introduction to Evolved Packet Core (URL http://www3.alcatel-lucent.com/wps/DocumentStreamerServlet?LMSG_CABINET=Docs_and_Resource_Ctr&LMSG_CONTENT_FILE=White_Papers/Intro_EPC_wp_0309.pdf); Alcatel-Lucent, The LTE Network Architecture (URL )
Traffic flow
Interwork or signalling traffic flow
LTE-GPRS interwork flow to allow the fall-back of data traffic
All-IP packet system
HSS
IP
services
SGW DTMLTE-AP
MME
Evolved Packet Core (EPC) networkE-UTRAN access network (OFDM)
GPRS core networkUTRAN access network
RNC
HLR
Direct tunnelling
Including IMS
for the
provisioning of
VoLTE
NodeB
NodeB
NodeB
SGSN
GGSN
eNodeB
eNodeB
eNodeB
Circuit-switched system

Update of the mobile LRIC model: change report | 34
Ref: 2002126-153 .
3.5 E-UTRAN radio access network
Coverage layer
The number of assets required for coverage is derived using the same dimensioning rules as for 2G
and 3G networks, with the only difference being that 4G has three spectrum bands available.
Figure 3.7: Calculation
of the number of 4G
sites required to provide
the target outdoor
coverage of the
population [Source:
Analysys Mason, 2015]
Capacity overlays
We have calculated the number of LTE capacity-driven sites through a two-step internationally
validated approach which firstly calculates the number of eNodeBs and eventually the number of
carriers needed to carry the assumed volume of 4G traffic. Both steps are described below.
► eNodeB requirements
We have assumed six LTE upgrades (as shown in Figure 3.8). Each incremental step allows the
operator to increase both the speed offered to the customers and the throughput (capacity).
Special sites (t)
% of secondary/
tertiary spectrum
eNodeBs deployed
on primary site (G)
Number of
secondary/tertiary
eNodeBs for
coverage (G, t)
Number of
primary/secondary
sites available for
overlay (G, t)
Number of separate
secondary/tertiary
sites required (G, t)
Total coverage sites
(G, t)
Land area km2 (G)
% area to be covered
by primary spectrum
(G, t)
Coverage area km2
(G, t)
Primary spectrum
effective coverage
cell radius (G)
Coverage eNodeBs
area km2 (G)Hexagonal factor
Number of primary
eNodeBs for
coverage (G, t)
Number of primary
sites for coverage
(G, t)
Scorched-node
coverage coefficient
(G)
Primary spectrum
coverage cell radius
(G)
G = by geotype, t = by timeInput Calculation Output
KEY:

Update of the mobile LRIC model: change report | 35
Ref: 2002126-153 .
Figure 3.8: LTE upgrades used in the model [Source: Analysys Mason, 2015]
Peak speed in Mbit/s Modulation MHz paired spectrum MIMO configuration
37.0 64 QAM 2×5MHz 2×2
75.6 64 QAM 2×10MHz 2×2
152.7 64 QAM 2×20MHz 2×2
229.8 64 QAM 2×30MHz 2×2
306.9 64 QAM 2×40MHz 2×2
604.5 64 QAM 2×40MHz 4×4
Note: The peak speed achievable has been calculated assuming a 10% guard band, 7 OFDMA symbols in a
timeslot and a 15kHz subcarrier size.
Supported by the data provided by Portuguese MNOs, we have assumed that the modelled
operator is deploying the following carrier configurations across all geotypes:
a 2×10MHz carrier in the primary spectrum band (800MHz)
a 2×20MHz carrier in the secondary spectrum band (2600MHz)
a 2×20MHz carrier in the tertiary spectrum band; this carrier is assumed to be deployed only if
needed to fulfil excess in traffic demand
— of course, the availability of 2×20MHz spectrum in the 1800MHz band is subject to its re-
farming from GSM.
We have made some assumptions regarding the deployment period of each upgrade, as shown in
Figure 3.9 for the coverage and additional capacity layers respectively.
Figure 3.9: Years in which the LTE upgrades are deployed by geotype [Source: Analysys Mason, 2015]
Upgrade
(Mbit/s)
Dense urban Urban Suburban Rural Micro /
indoor
37.0 2012 2012 2012 2012 2012
75.6 2012 2012 2013 2013 2012
152.7 2013 2014 2016 2020 2013
229.8 2016 2018 2020 2024 2016
306.9 2018 2020 2022 N/A 2018
604.5 N/A N/A N/A N/A N/A
This is consistent with the data provided by operators in Portugal. The main Portuguese MNOs
have a basic configuration of around 70Mbit/s and have already started deploying the 150Mbit/s
upgrade on some sites following the commercial launch of LTE-Advanced in 2013.
The other main inputs to the eNodeB capacity calculation used in the model are summarised in
Figure 3.10.

Update of the mobile LRIC model: change report | 36
Ref: 2002126-153 .
Figure 3.10: Description of other main inputs used in the eNodeB calculation [Source: Analysys Mason, 2015]
Name Value assumed Description
Effective Mbit/s as a
proportion of peak Mbit/s
(average throughput)
25% For example, the peak rate might be
c. 12Mbit/s, but the effective rate over
the cell area is c. 3Mbit/s
Coverage frequency 800MHz – primary spectrum Frequency assumed to be used to
deploy coverage eNodeBs in all
geotype
Capacity frequency 2600MHz – secondary spectrum;
1800MHz – tertiary spectrum
Remaining frequencies available for
4G services. The tertiary spectrum
band is only deployed if the demand
exceeds the capacity available in
primary and secondary spectrum
bands
The ratio between the effective throughput achieved and the peak speed is a key input in the
model, since it drives the capacity of the network. MNOs provided quite different responses to the
data request on this issue. Based on their response, the percentage should range between []%
and []%. Our assumption is closer to the lower bound of the range provided, and has been
validated through the internally available benchmarks.
In order to validate the value we have assumed, we benchmarked it against other Western
European regulatory models.
In terms of methodology, we firstly calculated the busy-hour (BH) Mbit/s per coverage site by
accounting for the carriers’ maximum utilisation factor and average throughput. We then
calculated the maximum bitrate across all carriers, multiplying the total number of carriers
(coverage and capacity) available by the capacity per carrier (capacity per sector multiplied by the
average number of sectors). This capacity depends on the evolutionary step adopted by the
modelled operator on both the coverage and capacity layers (see Figure 3.8). As a consequence,
the capacity per available carrier increases over time as the modelled operator upgrades its LTE
technology.
We then calculated the number of eNodeB macrocells required to carry the BH throughput using
the following formula:
𝑒𝑁𝑜𝑑𝑒𝐵𝑠 𝑚𝑎𝑐𝑟𝑜𝑐𝑒𝑙𝑙𝑠
= 𝑒𝑁𝑜𝑑𝑒𝐵𝑠 𝑟𝑒𝑞𝑢𝑖𝑟𝑒𝑑 𝑓𝑜𝑟 𝑐𝑜𝑣𝑒𝑟𝑎𝑔𝑒
× [(𝐵𝐻
𝑀𝑏𝑖𝑡𝑠 𝑝𝑒𝑟 𝑐𝑜𝑣𝑒𝑟𝑎𝑔𝑒 𝑒𝑁𝑜𝑑𝑒𝐵
𝑀𝑎𝑥𝑖𝑚𝑢𝑚 𝑏𝑖𝑡𝑟𝑎𝑡𝑒− 1)]
By definition, the total number of eNodeBs required is the sum of those previously calculated for
coverage plus the demand capacity-driven ones calculated in this step, as shown in Figure 3.11.
Update of the mobile LRIC model: change report | 37
Ref: 2002126-153 .
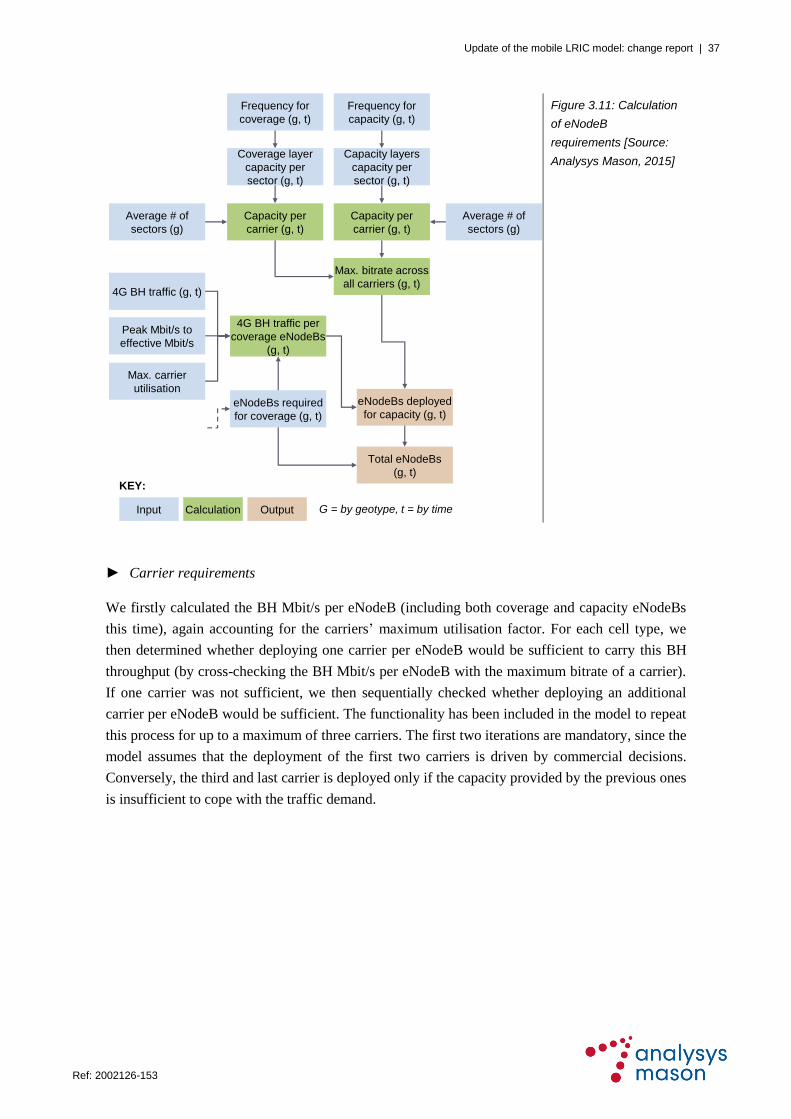
Figure 3.11: Calculation
of eNodeB
requirements [Source:
Analysys Mason, 2015]
► Carrier requirements
We firstly calculated the BH Mbit/s per eNodeB (including both coverage and capacity eNodeBs
this time), again accounting for the carriers’ maximum utilisation factor. For each cell type, we
then determined whether deploying one carrier per eNodeB would be sufficient to carry this BH
throughput (by cross-checking the BH Mbit/s per eNodeB with the maximum bitrate of a carrier).
If one carrier was not sufficient, we then sequentially checked whether deploying an additional
carrier per eNodeB would be sufficient. The functionality has been included in the model to repeat
this process for up to a maximum of three carriers. The first two iterations are mandatory, since the
model assumes that the deployment of the first two carriers is driven by commercial decisions.
Conversely, the third and last carrier is deployed only if the capacity provided by the previous ones
is insufficient to cope with the traffic demand.
Frequency for
coverage (g, t)
Frequency for
capacity (g, t)
Coverage layer
capacity per
sector (g, t)
Capacity layers
capacity per
sector (g, t)
Average # of
sectors (g)
Average # of
sectors (g)
Capacity per
carrier (g, t)
Capacity per
carrier (g, t)
Max. bitrate across
all carriers (g, t)
eNodeBs required
for coverage (g, t)
eNodeBs deployed
for capacity (g, t)
4G BH traffic (g, t)
Peak Mbit/s to
effective Mbit/s
Max. carrier
utilisation
Total eNodeBs
(g, t)
4G BH traffic per
coverage eNodeBs
(g, t)
G = by geotype, t = by timeInput Calculation Output
KEY:

Update of the mobile LRIC model: change report | 38
Ref: 2002126-153 .
Figure 3.12: Calculation
of LTE carrier
requirements [Source:
Analysys Mason, 2015]
We then summed up the total number of carriers across all LTE upgrades available. The planning
period was then factored into the output, with the final results by cell type aggregated into tables of
macro/microcell carriers by geotype over time.
Calculation of physical sites
Although the methodology has not changed from that used for the old model, the addition of 4G
technology complicates the calculation of the number of physical sites required in the access
network. We have derived the degree of co-location of the different mobile technology generations
on the basis of the following drivers:
share of 2G sites capable of hosting 3G
share of 2G sites capable of hosting 4G
share of 2G sites without 3G capable of hosting 4G
share of 3G sites without 2G capable of hosting 4G.
We have assumed that, as far as possible, mobile operators roll out the incremental technology on
top of already existing physical sites in order to optimise their capital expenditure. Radio sites can
have a number of technological configurations:
2G only
3G only
4G only
2G + 3G
2G + 4G
Total eNodeBs
(g, t)
4G BH Mbit/s per
eNodeB (g, t)
LTE step capacity
on the first carrier
(g, t)
4G BH Mbit/s per
eNodeB after using
the first carrier
(g, t)
4G BH traffic
(g, t)
Peak Mbit/s to
effective Mbit/s
Max. carrier
utilisation
Capacity per LTE
step
Carriers deployed
for each LTE step
(g, t)
Calculation iterated for
n carriers available
G = by geotype, t = by timeInput Calculation Output
KEY:
Total eNodeBs
(g, t)

Update of the mobile LRIC model: change report | 39
Ref: 2002126-153 .
2G + 3G + 4G
3G + 4G.
The total number of physical locations required by the radio access network is the sum of all the
configurations above.
Transmission
The dimensioning of the backhaul transmission follows the same rules used for links connecting
HSPA sites. Please see the Backhaul and transmission paragraph in Section 2.5 for more details on
the technology split used.
LTE-AP
LTE does not require the equivalent of the RNC (for 3G) or BSC (for 2G). The functionalities of
this equipment are distributed between the eNodeB (in the access network) and the MME (in the
core network), effectively removing one network layer. Nonetheless, we have assumed the
existence of an aggregation hub (“LTE-AP”) where the 4G backhaul links converge to aggregate
the traffic into more capable links connecting to the regional and national backbone. We have
assumed that the LTE-AP has additional functionalities and features, including multiplexing, an
optical distribution frame (ODF).
The LTE-APs are assumed to be co-located with RNCs and BSCs.
The deployment of the LTE-AP is illustrated in Figure 3.13, and is driven by:
the maximum number of E1 ports connected, assuming a maximum utilisation (estimated to be
5000 with a []% maximum utilisation)
the minimum number of LTE aggregation points deployed in the network for resilience
the number of RNC locations.
The total number of LTE aggregation points is the highest of these three values.

Update of the mobile LRIC model: change report | 40
Ref: 2002126-153 .
Figure 3.13: LTE-AP dimensioning [Source: Analysys Mason, 2015]
Similarly to what happens for the RNCs and BSCs, the number of incoming ports (eNodeB-facing
ports) are directly derived from the number of backhaul E1 links, including all technologies.
The LTE-AP links facing the core network are either E1 or STM1/4 and are dimensioned based on
the average LTE downlink throughput, taking into account a utilisation factor that reflects, among
other things, the need for redundant ports and links.
Due to the lack of data provided by Portuguese operators, the unit opex and capex of this
equipment has been derived from a benchmark of other European country models (where it is
generally defined as “high-speed transmission hub”). It should be noted that the unit costs used in
the model assume that the LTE-AP includes multiplexing capabilities and an optical distribution
frame (ODF) to connect all the fibre backhaul links.
3.6 Dimensioning of backhaul transmission
The backhaul transmission dimensioning follows the same rules already used for the 2G and the
3G networks.
RNC throughput
max. utilisation
Mbit/s capacity
of an RNC
Number of
eNodeB-facing
ports (t)
Maximum
utilisation in terms
of ports
E1 ports capacity
of an LTE-AP
Minimum
deploymentNumber of RNCs
Number of LTE-AP
per ports
requirement
Total number of
LTE-APs (t)
LTE Mbit/s in the
busy hour
Average downlink
Mbit/s in radio layer
per LTE ag. point Mbit/s capacity of
core-facing E1,
STM1/4 portsNumber of core-
facing LTE-AP
ports LTE-AP link
utilisation
LTE ag. point –
core links
Minimum number
of core-facing
LTE-APs
G = by geotype, t = by timeInput Calculation Output
KEY:

Update of the mobile LRIC model: change report | 41
Ref: 2002126-153 .
3.7 Core network and servers
4G core network
The inclusion of a 4G radio network requires the modelling of a 4G core network, which is assumed to
be an evolved packet core (EPC)15
one. This is an industry-standard architecture used to carry the data
traffic from 4G eNodeBs and is in line with the 4G network diagram provided by the operators. We
modelled four main assets:
Serving gateway (SGW) – The primary function of this equipment is to manage the user-plane
mobility and act as a demarcation point between the RAN and the core network. It serves as a
local mobility anchor, meaning that packets are routed through this point for intra E-UTRAN
mobility and for mobility through other generations (2G/3G)
Data traffic manager (DTM) – This equipment includes any other systems that handle data
traffic. Among others these include:
— packet data network gateway (PDN-G) – This equipment, generally co-located with the
SGW, serves as an anchor point towards the external packet data network. It supports
policy enforcement features, packet filtering and charging support
— policy and charging rules function (PCRF) – This equipment manages the policy and rule
functions
Mobility management entity (MME) – This equipment performs the signalling and control
functions to manage the user equipment access to network connections, the assignment of
network resources and the management of the mobility states to support tracking, paging,
roaming and handovers. The MME also provides the control plan functionalities (similarly to
the SGSN in a GPRS core network)
Home subscriber server (HSS) – This equipment is the 4G equivalent of the home location
register (HLR).
The main inputs used in the calculation are described in Figure 3.14 below.
Figure 3.14: Description of inputs used in the LTE core network calculations [Source: Analysys Mason, 2015]
Name Description
Server capacity The capacities of the core assets dimensioned in their respective units
Minimum roll-out The minimum number of equipment that must be deployed
Server redundancy A value of 2 means that for each equipment deployed there is also a spare one
Server minimums The minimum number of equipment that must be deployed
15
Alcatel-Lucent, Introduction to Evolved Packet Core. (URL: http://resources.alcatel-lucent.com/?cid=133461)

Update of the mobile LRIC model: change report | 42
Ref: 2002126-153 .
The equipment deployed in the 4G core network is calculated according to the specific demand
drivers, along with the assumed capacity and utilisation. Figure 3.15 illustrates the calculations.
Figure 3.15: Calculation
of 4G core network
assets [Source:
Analysys Mason, 2015]
Figure 3.16 provides a summary of the inputs used for 4G core network assets. All of these inputs
can be found in the ‘Core network elements’ section of the “NwDes_Inputs” worksheet.
Figure 3.16: Specifications of the 4G core network elements [Source: Analysys Mason, 2015]
Asset Capacity Minimum
roll-out
Redundancy Max.
utilisation
Source
MME
(Hw and Sw)16
12 500 000
SAUs
2 1 [] Operator data
SGW 40 000Mbit/s 2 1 [] Analysys Mason
Data traffic
manager
30 000Mbit/s 2 1 [] Analysys Mason
HSS 1 000 000 4G
subscribers
1 1 [] Operator data
For MME dimensioning, we have assumed that 50% of 4G users are simultaneously active on the
network, as for 3G in the ‘Subscribers loading proportion’ section of the “Load_inputs” worksheet.
Launch of VoLTE
As discussed in the concept paper, the model includes VoLTE because it is an efficient technology
that has now been rolled out by several MNOs. Some Portuguese operators wrote that there is no
information about the possible launch of the service, whereas others stated that launch of VoLTE
is planned, but did not disclose any information on when it is supposed to occur.
On the basis of the status of VoLTE deployment in other Western European countries (see
Figure 3.17), we have assumed that the modelled operator launches this service in 2016.
16
Hardware and software.
Demand drivers
for servers (t)
Servers
deployment (t)Utilisation
Server capacity
Server minimum
roll-out
Server redundancy
G = by geotype, t = by timeInput Calculation Output
KEY:

Update of the mobile LRIC model: change report | 43
Ref: 2002126-153 .
Figure 3.17: Status of VoLTE in selected Western European countries [Source: Analysys Mason Research,
2014]
Operator Country Status Expected launch year
Swisscom Switzerland In deployment 2015
H3G United Kingdom In deployment 2015
EE United Kingdom In deployment 2015
Bouygues France In deployment 2015
E-Plus Germany In deployment N/A
T-Mobile Germany In deployment 2014
Telefónica Germany In deployment N/A
Vodafone Germany In deployment 2014
KPN Netherlands Trialling July 2014
Tele2 Netherlands In deployment N/A
Tele2 Sweden In deployment N/A
TeliaSonera Sweden In deployment N/A
Telefónica Spain Trialling N/A
Vodafone Spain In deployment N/A
The rate of adoption of VoLTE services largely depends on the availability of capable handsets.
Most of the devices currently available in the market do not support VoLTE, as this is only
included as a feature in high-end handsets. However, we expect this functionality to start being
embedded in mid-range handsets during 2015. At that point, the rate of adoption of VoLTE will
then depend on how much mobile operators are willing to push (subsidise) new handsets.
Figure 3.18: Share of
voice traffic generated
by 4G subscribers that
is VoLTE [Source:
Analysys Mason, 2015]
0%
10%
20%
30%
40%
50%
60%
70%
80%
90%
100%
- 1 2 3 4 5 6 7 8 9 10 11
% o
f vo
ice
tra
ffic
ge
ne
rate
d b
y L
TE
use
rs
Years since launch
% of voice traffic generated by 4G subscribers

Update of the mobile LRIC model: change report | 44
Ref: 2002126-153 .
The model assumes that the share of 4G subscribers voice traffic migrated to VoLTE reaches
around 40% two years after commercial launch (i.e. in 2018).
There are very few international data points to indicate how quickly the migration to VoLTE might
occur. Most of these data points come from South Korea, which is at the forefront of LTE adoption
and was one of the first countries worldwide to launch VoLTE. For example, LG U+ launched
LTE in March 2012 and had migrated around 50% of its subscriber base to LTE within 2.5 years.17
The Korean operator LG U+ launched VoLTE in July 2013 and managed to migrate 50% of its
LTE subscribers to the new voice services technology within less than two years.
However, the South Korean case may not be considered as a valid benchmark for Portugal, since
the country’s MNOs have direct access to local handset manufacturers, which is a key lever for
accelerating the adoption of VoLTE-capable devices. In addition, MNOs in South Korea have
provided heavy subsidies on LTE handsets (to the extent that raised regulator’s concerns and had
to pay a hefty fine).
Nevertheless, Portuguese operators might enjoy some latecomer advantages, since they could
benefit from previous successful experiences in other countries.
VoLTE network
Once a VoLTE platform is deployed, voice and data can both be provided over the 4G network,
under the control of the network operator.
VoLTE requires an IP Multimedia Subsystem (IMS) to be deployed in the core network. The IMS
core is composed of:
the call server (CS), which contains the voice service functions CSCF, ENUM and DNS18,19
the session border controllers (SBCs)
the telephony application servers (TASs), which must be deployed to manage voice services
(with the TASs in particular managing capabilities such as call forwarding, call wait and call
transfer).
The IMS core assets are summarised in Figure 3.19 below.
17
LG U+, VoLTE as Key Success Factor, 2014
18 Call session control function, E.164 number mapping and domain name system, respectively.
19 The CSCF, ENUM and DNS are not explicitly modelled; they are contained within the call server (CS) and as such
are treated as a single asset.

Update of the mobile LRIC model: change report | 45
Ref: 2002126-153 .
Figure 3.19:
Appearance of an IP
Multimedia System
[Source: Analysys
Mason, 2015]
The VoLTE platform must also communicate with the 4G data platform (via the MME/SGW),
meaning that upgrades to existing assets are required. In particular, the MSC–S must be enhanced
so that:
calls can connect to the IMS domain via the MSC–S, to continue to provide the voice service
if a 4G user is within the coverage of the 2G/3G circuit-switched networks rather than the
coverage of the 4G network
calls can be handed over from the 4G network to the 2G/3G networks.
A separate converged HLR/HSS can also be deployed to manage data on the 4G subscriber base,
keeping the legacy HLR unchanged. Upgrades to the network management system (NMS) may
also be required to support VoLTE.
The main inputs used in the VoLTE network calculation are outlined in Figure 3.20.
Figure 3.20: Description of inputs used in the VoLTE network calculation [Source: Analysys Mason, 2015]
Name Description
Capacity driver Quantity that is used to dimension the number of assets required
Server capacity The capacities of the core assets dimensioned in their respective units
Server minimums The minimum number of equipment that must be deployed
Server redundancy A value of 2 means that for each equipment deployed there is also a spare
4G voice call data rate The data rate required for VoLTE calls in the radio network. The model
assumes a value of 12.65kbit/s, based on the specification of the Adaptive
Multi-Rate Wideband (AMR-WB) standard
The calculation structure for VoLTE assets in the updated model is the same of the one adopted for
the 4G core network, as shown in Figure 3.15. The servers deployed within the VoLTE network
are calculated according to their demand drivers, along with their specifications and utilisation.
The planning period is then factored into the output.
Figure 3.21 summarises the inputs for the VoLTE assets modelled, namely their assumed
capacities, minimum numbers and redundancies. These inputs can be found within the ‘Core
network elements’ section of the “NwDes_Inputs” worksheet.
CSCF
SBC
ENUM
DNS
TAS
Call server
(CS)
IP Multimedia System (IMS)
HSS MME MSC-S HLR
LTE-GPRS interwork flow to allow
the fall-back of voice traffic
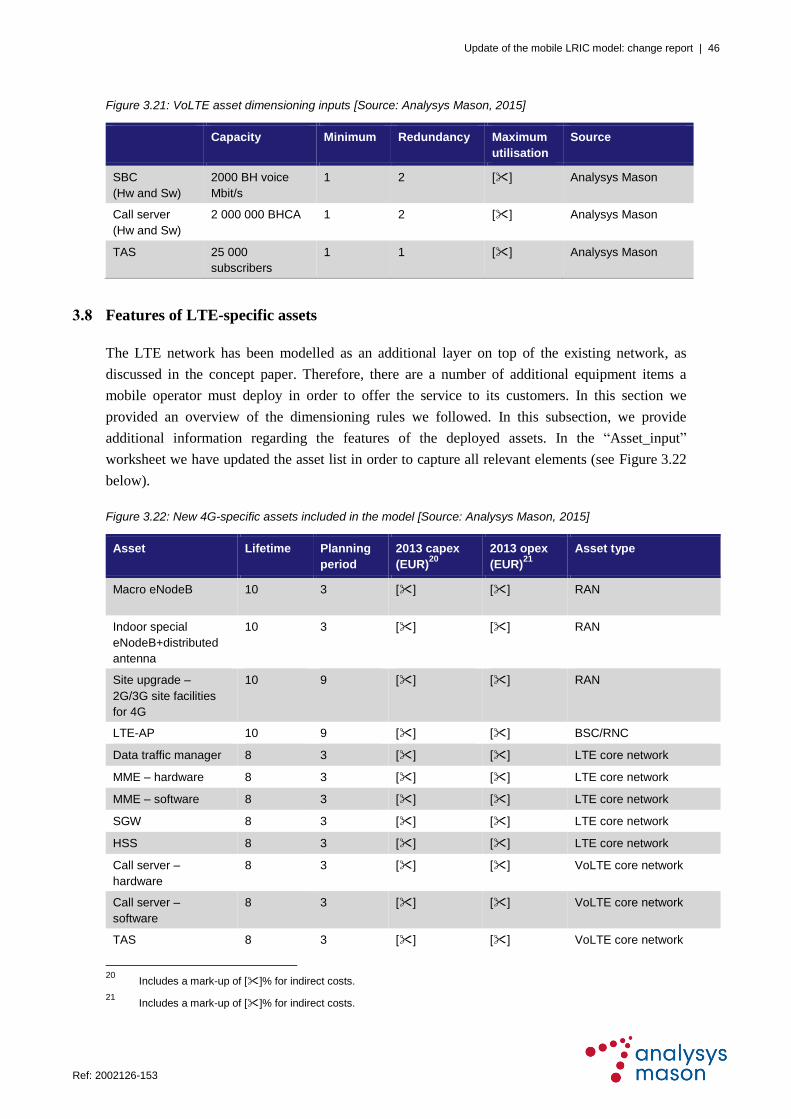
Update of the mobile LRIC model: change report | 46
Ref: 2002126-153 .
Figure 3.21: VoLTE asset dimensioning inputs [Source: Analysys Mason, 2015]
Capacity Minimum Redundancy Maximum
utilisation
Source
SBC
(Hw and Sw)
2000 BH voice
Mbit/s
1 2 [] Analysys Mason
Call server
(Hw and Sw)
2 000 000 BHCA 1 2 [] Analysys Mason
TAS 25 000
subscribers
1 1 [] Analysys Mason
3.8 Features of LTE-specific assets
The LTE network has been modelled as an additional layer on top of the existing network, as
discussed in the concept paper. Therefore, there are a number of additional equipment items a
mobile operator must deploy in order to offer the service to its customers. In this section we
provided an overview of the dimensioning rules we followed. In this subsection, we provide
additional information regarding the features of the deployed assets. In the “Asset_input”
worksheet we have updated the asset list in order to capture all relevant elements (see Figure 3.22
below).
Figure 3.22: New 4G-specific assets included in the model [Source: Analysys Mason, 2015]
Asset Lifetime Planning
period
2013 capex
(EUR)20
2013 opex
(EUR)21
Asset type
Macro eNodeB 10 3 [] [] RAN
Indoor special
eNodeB+distributed
antenna
10 3 [] [] RAN
Site upgrade –
2G/3G site facilities
for 4G
10 9 [] [] RAN
LTE-AP 10 9 [] [] BSC/RNC
Data traffic manager 8 3 [] [] LTE core network
MME – hardware 8 3 [] [] LTE core network
MME – software 8 3 [] [] LTE core network
SGW 8 3 [] [] LTE core network
HSS 8 3 [] [] LTE core network
Call server –
hardware
8 3 [] [] VoLTE core network
Call server –
software
8 3 [] [] VoLTE core network
TAS 8 3 [] [] VoLTE core network
20
Includes a mark-up of []% for indirect costs.
21 Includes a mark-up of []% for indirect costs.

Update of the mobile LRIC model: change report | 47
Ref: 2002126-153 .
Asset Lifetime Planning
period
2013 capex
(EUR)20
2013 opex
(EUR)21
Asset type
SBC – hardware 8 3 [] [] VoLTE core network
SBC – software 8 3 [] [] VoLTE core network
VoLTE upgrade –
HLR
8 3 [] [] VoLTE core network
VoLTE upgrade –
MSC-S
8 3 [] [] VoLTE core network
VoLTE upgrade –
NMS
8 3 [] [] VoLTE core network
4G upfront licence
fees
15 - 22
[] 4G licences
4G frequencies
management fees
1 - 23
[] 4G spectrum fees
LTE step for: 37.0 10 3 [] [] Base-station equipment
LTE step for: 75.6 10 3 [] [] Base-station equipment
LTE step for: 152.7 10 3 [] [] Base-station equipment
LTE step for: 229.8 10 3 [] [] Base station equipment
LTE step for: 306.9 10 3 [] [] Base station equipment
LTE step for: 604.5 10 3 [] [] Base station equipment
Cost trend
We have applied to the LTE-specific assets the same cost trends that were assumed in the old
model for their 2G/3G equivalents, as shown in Figure 3.23.
22
This represents the lump sum assumed to be paid by the hypothetical existing operator; see Section 3.2 for further
details.
23 This represents the annual fee paid on a per-MHz basis; see Section 3.2 for further details.
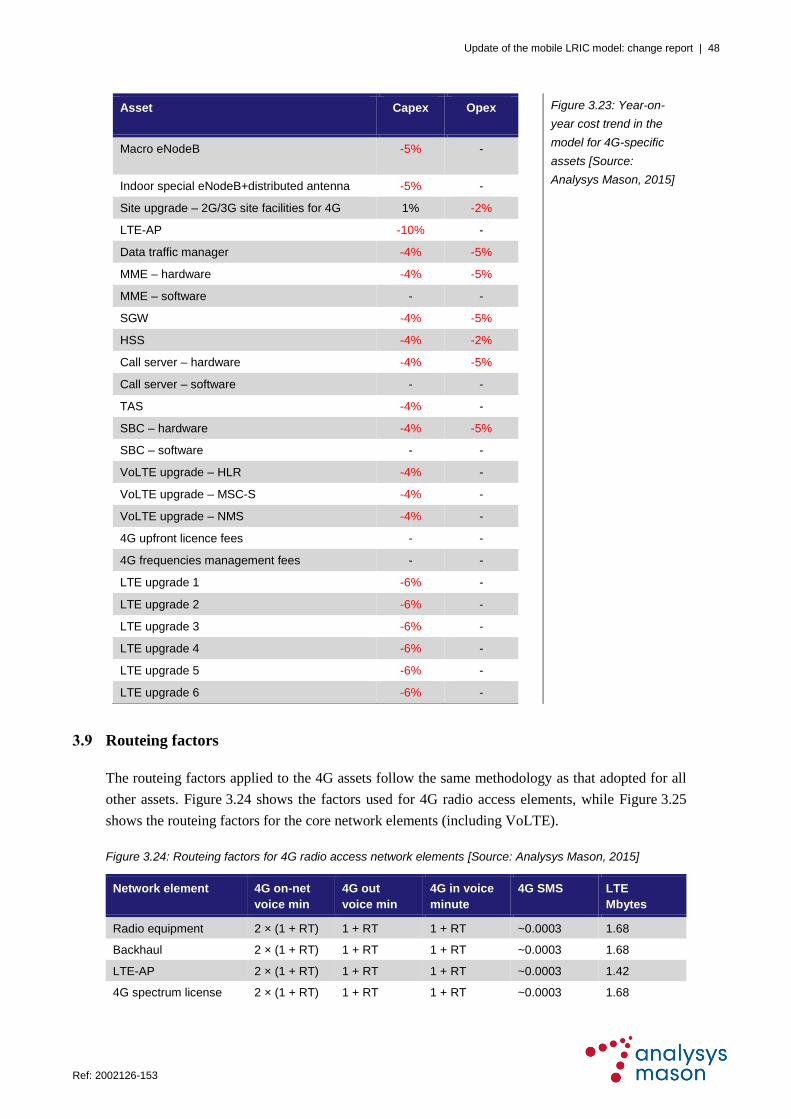
Update of the mobile LRIC model: change report | 48
Ref: 2002126-153 .
Asset Capex Opex
Macro eNodeB -5% -
Indoor special eNodeB+distributed antenna -5% -
Site upgrade – 2G/3G site facilities for 4G 1% -2%
LTE-AP -10% -
Data traffic manager -4% -5%
MME – hardware -4% -5%
MME – software - -
SGW -4% -5%
HSS -4% -2%
Call server – hardware -4% -5%
Call server – software - -
TAS -4% -
SBC – hardware -4% -5%
SBC – software - -
VoLTE upgrade – HLR -4% -
VoLTE upgrade – MSC-S -4% -
VoLTE upgrade – NMS -4% -
4G upfront licence fees - -
4G frequencies management fees - -
LTE upgrade 1 -6% -
LTE upgrade 2 -6% -
LTE upgrade 3 -6% -
LTE upgrade 4 -6% -
LTE upgrade 5 -6% -
LTE upgrade 6 -6% -
Figure 3.23: Year-on-
year cost trend in the
model for 4G-specific
assets [Source:
Analysys Mason, 2015]
3.9 Routeing factors
The routeing factors applied to the 4G assets follow the same methodology as that adopted for all
other assets. Figure 3.24 shows the factors used for 4G radio access elements, while Figure 3.25
shows the routeing factors for the core network elements (including VoLTE).
Figure 3.24: Routeing factors for 4G radio access network elements [Source: Analysys Mason, 2015]
Network element 4G on-net
voice min
4G out
voice min
4G in voice
minute
4G SMS LTE
Mbytes
Radio equipment 2 × (1 + RT) 1 + RT 1 + RT ~0.0003 1.68
Backhaul 2 × (1 + RT) 1 + RT 1 + RT ~0.0003 1.68
LTE-AP 2 × (1 + RT) 1 + RT 1 + RT ~0.0003 1.42
4G spectrum license 2 × (1 + RT) 1 + RT 1 + RT ~0.0003 1.68
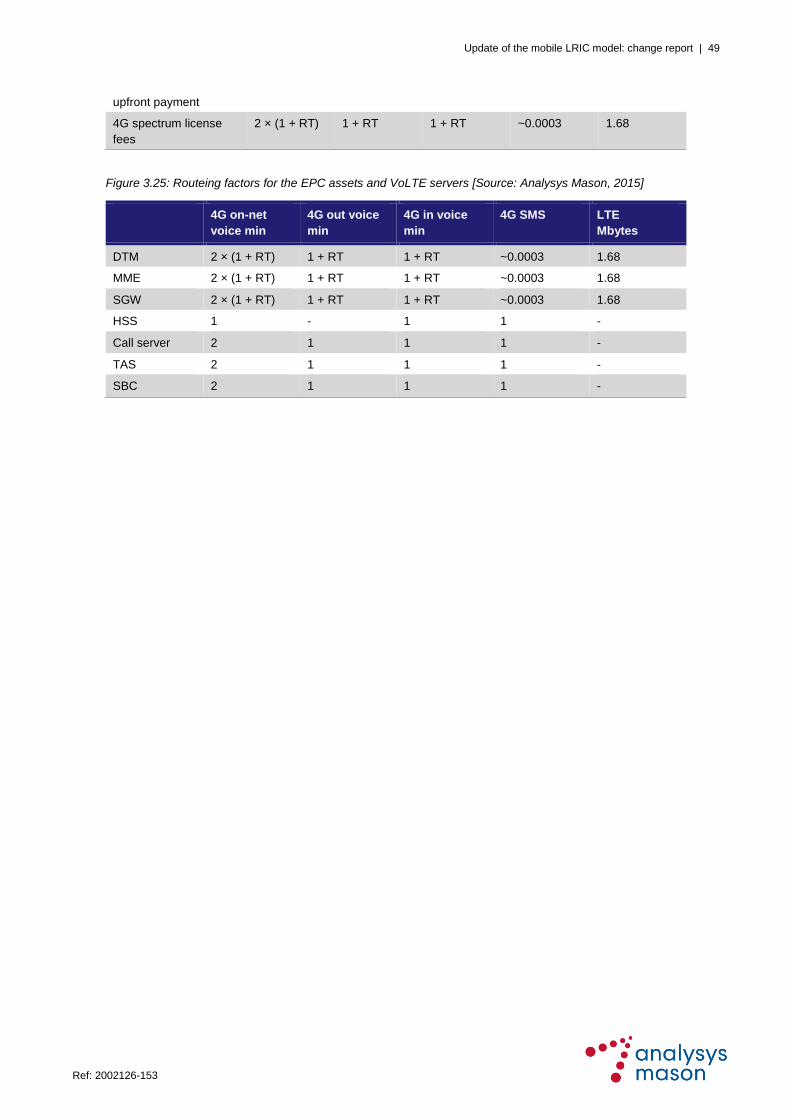
Update of the mobile LRIC model: change report | 49
Ref: 2002126-153 .
upfront payment
4G spectrum license
fees
2 × (1 + RT) 1 + RT 1 + RT ~0.0003 1.68
Figure 3.25: Routeing factors for the EPC assets and VoLTE servers [Source: Analysys Mason, 2015]
4G on-net
voice min
4G out voice
min
4G in voice
min
4G SMS LTE
Mbytes
DTM 2 × (1 + RT) 1 + RT 1 + RT ~0.0003 1.68
MME 2 × (1 + RT) 1 + RT 1 + RT ~0.0003 1.68
SGW 2 × (1 + RT) 1 + RT 1 + RT ~0.0003 1.68
HSS 1 - 1 1 -
Call server 2 1 1 1 -
TAS 2 1 1 1 -
SBC 2 1 1 1 -
Related Documents