University of Nairobi School of Engineering Developing a Complementary Mobile & Web-based Application for Recording and Sharing Electricity Customer Meter Reading and Power Incidence Data. Case Study: Langata Constituency, Nairobi County, Kenya. Paul Silali Wekesa F56/88500/2016 A Project submitted in partial fulfillment for the Degree of Master of Science in Geographic Information Systems, in the Department of Geospatial and Space Technology. August, 2018.

Welcome message from author
This document is posted to help you gain knowledge. Please leave a comment to let me know what you think about it! Share it to your friends and learn new things together.
Transcript

University of Nairobi
School of Engineering
Developing a Complementary Mobile & Web-based Application for
Recording and Sharing Electricity Customer Meter Reading and Power
Incidence Data.
Case Study: Langata Constituency, Nairobi County, Kenya.
Paul Silali Wekesa
F56/88500/2016
A Project submitted in partial fulfillment for the Degree of Master of Science in Geographic
Information Systems, in the Department of Geospatial and Space Technology.
August, 2018.
ii
Abstract
Energy is an essential factor of the economy, the national security of a nation as well as
standard of living. Kenya’s Vision 2030 identifies energy as one of the major enablers of
infrastructure development under the socio-economic pillar. Kenya is undergoing a rapid
development stage in relation to its domestic energy demands. The current government
demanded that Kenya Power and Lighting Company (KPLC) accelerate electricity
connectivity within the country; this called for a totally new approach in the connectivity,
meter reading and billing model within the electricity distribution company.
Manual reading of power meters is indeed a time-consuming exercise, KPLC meter readers
face a number of challenges while trying to gain access to customer postpaid meters in the
field. These challenges range from unrestrained animals, inclement weather conditions, or
meters located behind a locked fence and buildings. On the other hand, the company
emergency teams also face a number of challenges while resolving power incidences reported
by the customers. One of the main challenge includes locating the incident areas based on the
vague description from the customers and hence lack of proper preparation (with the right
equipment) to handle the reported incident.
The growth in the telecommunication sector has enabled a positive willingness by power
consumers to volunteer information and embrace new innovative approaches being
implemented by the company. This study seeks to take advantage of this with the main
objective of developing a complementary mobile and web-based application for recording
and sharing electricity customer meter reading and power incidence data. The objective was
achieved and the study was able to develop an electrical network geodatabase using Open
Source software, PostgreSQL /PostGIS as the application database, a mobile application
developed in Android studio using Java Programming Language, and a web application
developed in the Node.JS environment using JavaScript. The application was published and
tested within the case study area of Langata constituency in Nairobi County.
The mobile application meter reading and power incidence reporting platform is aimed at
improving customer billing process and timely resolution of incidences, ultimately customer
satisfaction on service delivery. It is recommended that this application is replicated through
all the other constituencies in Kenya to support meter reading and power outage management
in the company. Other utility companies can use this application to efficiently improve
service delivery to customers. These can range from water and sewerage companies,
telecommunication companies to oil and gas distribution companies among others.

iii
UNIVERSITY OF NAIROBI
Declaration of Originality Form
This form must be completed and signed for all works submitted to the University for Examination.
Name of Student: Paul Silali Wekesa_________________________________________
Registration Number F56/88500/2016___________________________________________
College: College of Architecture and Engineering________________________
Faculty/School/Institute: School of Engineering______________________________________
Department: Department of Geospatial and Space Technology ________________
Course Name: Degree of Master of Science in Geographic Information Systems ____
Title of the work: Developing a Complementary Mobile & Web based Application for Recording
and Sharing Electricity Customer Meter Reading and Power Incidence Data.
Case Study: Langata Constituency, Nairobi County.
DECLARATION
1. I understand what Plagiarism is and I am aware of the University’s policy in this regard.
2. I declare that this project is my original work and has not been submitted elsewhere for
examination, award of a degree or publication. Where other people’s work, or my own
work has been used, this has properly been acknowledged and referenced in accordance
with the University of Nairobi’s requirements.
3. I have not sought or used the services of any professional agencies to produce this work.
4. I have not allowed, and shall not allow anyone to copy my work with the intention of
passing it off as his/her own work.
5. I understand that any false claim in respect of this work shall result in disciplinary action,
in accordance with University Plagiarism Policy.
Signature: _______________________
Date: ____________________________

iv
Declaration
I, Paul Silali Wekesa, hereby declare that this project is my original work. To the best of my
knowledge, the work presented here has not been presented for a degree in any in any other
Institution of Higher Learning.
Paul Silali Wekesa ------------------------- ------------------------
Name of Student Signature Date
This project has been submitted for examination with my approval as university supervisor.
Dr. D. N. Siriba ------------------------- -------------------------
Name of Supervisor Signature Date

v
Dedication
I dedicate this project to my family; my wife, sons, my dad and mum for the moral and
material support they gave me during; not only the period of doing this project but also
during my entire academic journey. May the Almighty Father bless them abundantly.

vi
Acknowledgement
First and foremost, I am most grateful to the Lord Almighty for the gift of life, the
opportunity, time and resources to pursue the Master of Science in Geographic Information
Systems (Msc. GIS) program. I would also like to acknowledge the assistance received from
different individuals, organizations and the Department of Geospatial & Space Technology of
the University of Nairobi. In particular single out the following for their priceless support:
I express my sincere gratitude to my supervisor, Dr. D. N. Siriba of the Department of
Geospatial & Space Technology for his invaluable contribution, support, and guidance
throughout the program and during this research project. This enabled me to put the project
together as coherently as possible. He has been there to offer technical support and provide
ideas that pace the project with great finesse and skill.
I would also like to thank the Chair, all members of academic staff and student colleagues
from the department for their support and for making learning GIS a possibility. Ladies and
gentlemen may God bless you in all your professional and scholarly endeavors.
I also wish to convey my appreciation to my brother Dennis M. Wekesa for the guidance and
training he offered me in mobile and web application development, and the support
throughout the period of this research project. The training and guidance he offered in server-
side JavaScript coding and Android application development enabled the design and
implementation of the project to be a success.
Special gratitude to my wife Jacinter A. Kore and our children, AlphaMyles Silali and
JayPrince Silali for their understanding, support and encouragement throughout the period of
my study.
Last but not least, I wish to convey my sincere appreciation to those whose names do not
appear here but contributed in one way or the other. Friends, rest assured that your support
and contribution is much appreciated.
vii
Table of Contents.
Abstract ..................................................................................................................................... ii
Declaration............................................................................................................................... iv
Dedication ................................................................................................................................. v
Acknowledgement ................................................................................................................... vi
Table of Contents. .................................................................................................................. vii
List of Figures ........................................................................................................................... x
List of Tables .......................................................................................................................... xii
List of Appendices ................................................................................................................ xiii
List of Abbreviations ............................................................................................................ xiv
CHAPTER 1: INTRODUCTION ........................................................................................... 1
1.1 Background ...................................................................................................................... 1
1.2 Problem Statement ........................................................................................................... 2
1.3 Research Objectives ......................................................................................................... 4
1.4 Research Questions .......................................................................................................... 4
1.5 Justification of the Study .................................................................................................. 4
1.6 Scope and Limitations of the Study ................................................................................. 5
1.7 Organization of the Study ................................................................................................ 6
CHAPTER 2: LITERATURE REVIEW .............................................................................. 7
2.1 Introduction ...................................................................................................................... 7
2.2 Kenya’s Energy Sector Institutional Set up ..................................................................... 8
2.3 Kenya’s Electricity Subsector ........................................................................................ 10
2.4 Kenya Power and Lighting Company Ltd (KPLC) ........................................................ 11
2.4.1 KPLC Mandate ........................................................................................................ 11
2.4.2 KPLC Corporate Objectives .................................................................................... 11
2.4.3 Customer Service Division ...................................................................................... 12
2.4.4 Operation and Maintenance ..................................................................................... 13
2.5 Telecommunication Subsector in Kenya........................................................................ 14
2.5.1 Mobile Phone Penetration in Kenya ........................................................................ 15
2.5.2 Android Technology ................................................................................................ 16
2.5.3 Android Development ............................................................................................. 16
2.6 GIS and Web Mapping ................................................................................................... 18
2.6.1 Geographic Information Systems (GIS) .................................................................. 18
viii
2.6.2 Web Mapping .......................................................................................................... 18
2.6.3 Components of Web Mapping ................................................................................. 19
2.6.4 Available Web Mapping Technologies ................................................................... 21
2.7 Volunteered Geographic Information (VGI)................................................................. 24
2.8 Geo-tagging .................................................................................................................... 25
2.9 Similar Case studies City of Windhoek-Self-Reading (SMS) ....................................... 26
2.10 Conclusion on the literature review ............................................................................. 26
CHAPTER 3: MATERIALS AND METHODS ................................................................. 27
3.1 Introduction .................................................................................................................... 27
3.2 The Study Area............................................................................................................... 27
3.3 Summary of Project Objectives, Methods and Results .................................................. 29
3.4 Methodology for the Study. ........................................................................................... 30
3.5 Data Identification .......................................................................................................... 31
3.6 Data Collection and Preparation .................................................................................... 31
3.6.1 Data Tools Used (Hardware and Software) ............................................................. 31
3.6.2 Data Collection ........................................................................................................ 31
3.6.3 Data Preparation ...................................................................................................... 32
3.7 Developing an Electrical Network Geodatabase ............................................................ 33
3.7.1 Data Tools Used (Hardware and Software) ............................................................. 33
3.7.2 Database Design. ..................................................................................................... 34
3.7.3 Creating a Spatial Geodatabase in PostgreSQL with PostGIS Extension ............... 39
3.7.4 Importing Electrical Network Datasets into PostGIS .............................................. 40
3.7.5 Installing GeoServer and Setting up a GeoServer - PostGIS Connection ............... 41
3.7.6 Styling and Publishing Electrical Dataset Layers.................................................... 43
3.8 Developing a Mobile Application .................................................................................. 45
3.8.1 Data Tools Used (Hardware and Software) ............................................................. 45
3.8.2 Installation Android Studio and Creating a Project ................................................. 46
3.8.3 Developing an Android Mobile Application ........................................................... 47
3.8.4 Testing and Debugging the Mobile Application ..................................................... 50
3.8.5 Compiling an Executable File and Testing on a Mobile Phone .............................. 50
3.9 Developing a Web Application Locally ......................................................................... 50
3.9.1 Data Tools Used (Hardware and Software) ............................................................. 50
3.9.2 Installation Node.js Framework Environment and Libraries .................................. 50
ix
3.9.3 Creation and Population of PostgreSQL Tables ...................................................... 50
3.9.4 Coding of the Web Application ............................................................................... 51
3.9.5 Testing and Debugging the Web Application ......................................................... 53
3.10 Publishing, Sharing and Testing the Application ......................................................... 53
3.10.1 Data Tools Used (Hardware and Software) ........................................................... 53
3.10.2 AWS Account Registration and Creation Server Instance .................................... 54
3.10.3 Configuring the Server and Installing the Required Software .............................. 56
3.10.4 Uploading of Web Application Code to the Server ............................................... 56
3.10.5 Running and Testing the Web Application Remotely ........................................... 56
CHAPTER 4: RESULTS AND DISCUSSIONS. ................................................................ 57
4.1 Introduction .................................................................................................................... 57
4.2 Data Collection and Preparation Results ........................................................................ 57
4.3 Developing an Electrical Network Geodatabase ............................................................ 58
4.3.1 Output on Design of customer Details Tables. ........................................................ 58
4.3.2 Output on Spatial Geodatabase in PostGIS and GeoServer Output. ....................... 59
4.4 Developing a Mobile Application. ................................................................................. 61
4.5 Developing a Web Application Locally. ........................................................................ 66
4.6 Publishing, Sharing and Testing the Application ........................................................... 77
4.6.1 Publishing and Sharing the Application on AWS Server. ....................................... 77
4.6.2 Testing the Mobile Web Application Remotely ...................................................... 77
4.7 Discussion and Analysis of the Results ......................................................................... 77
4.8 Challenges in Implementing the Application ................................................................. 78
CHAPTER 5: CONCLUSIONS AND RECOMMENDATIONS ...................................... 79
5.1 Conclusions .................................................................................................................... 79
5.2 Recommendations .......................................................................................................... 80
5.3 Suggestions for Future Research .................................................................................... 80
REFERENCES ....................................................................................................................... 81
APPENDICES ........................................................................................................................ 85
Appendix A Developing an Electrical Network Geodatabase ............................................. 85
Appendix B Developing a Mobile Application.................................................................... 86
Appendix C Developing a Web Application Locally .......................................................... 87
Appendix D Publishing, Sharing and Testing the Application ............................................ 90
x
List of Figures
Figures Page
Figure 2.1: The Energy Sector Institutional Framework in Kenya (Source: IEA, 2015) .......... 8
Figure 2.2: Electric Power Supply Value Chain (Source: Business Sweden, 2016)................ 10
Figure 2.3: An illustration of the electrical distribution network (Source: Author, 2018) ...... 12
Figure 2.4: An illustration of Telecommunication System (Source: Author, 2018) ............... 15
Figure 2.5: Android OS Architecture....................................................................................... 16
Figure 2.6: System Three-tier architecture (Source: Author, 2018) ........................................ 20
Figure 3.1: Study area Langata constituency in Nairobi County (Source: Author, 2018). ...... 28
Figure 3.2: Overview of Methodology (Source: Author, 2018). ............................................. 30
Figure 3.3: Clipping Medium Voltage electrical network data in ArcGIS software ............... 32
Figure 3.4: External Model Diagram ....................................................................................... 34
Figure 3.5: Normalized Entity Relationship Diagram ............................................................. 35
Figure 3.6: Creating a Geodatabase in PostgreSQL with PostGIS Extension ........................ 39
Figure 3.7: Importing shapefiles into PostgreSQL database. .................................................. 40
Figure 3.8: Screenshot of workspace created in GeoServer. ................................................... 41
Figure 3.9: GeoServer - PostGIS Connection Setup ................................................................ 42
Figure 3.10: Electrical network layer imported into GeoServer .............................................. 42
Figure 3.11: The styling of the datasets in uDig ...................................................................... 43
Figure 3.12: Exporting dataset SLD files in uDig ................................................................... 44
Figure 3.13: Electrical network dataset styles imported into GeoServer ................................. 44
Figure 3.14: Applying the Styling of in GeoServer ................................................................. 45
Figure 3.15: Installation Android studio and configuring a new project. ................................ 46
Figure 3.16: Setting the Target Android device ....................................................................... 47
Figure 3.17: Developing the android application main forms ................................................. 48
Figure 3.18: Developing the android application (Java programing language and XML) ...... 49
Figure 3.19: Web Service schema ........................................................................................... 51
Figure 3.20: Web Portal programming on visual studio code editor ....................................... 52
Figure 3.21: Applications interaction on the cloud (Source: Author, 2018) ........................... 53
Figure 3.22: Account Registration for Amazon Web Services................................................ 54
Figure 3.23: Setting up Amazon Elastic Compute Cloud instance .......................................... 55
Figure 3.24: Putty configuration to connect to the database .................................................... 56
Figure 4.1: Electrical network data prepared in ArcGIS ......................................................... 57
xi
Figure 4.2: Designed customer details data imported in PostGIS ........................................... 58
Figure 4.3: Spatial Geodatabase in PostGIS and GeoServer output. ....................................... 59
Figure 4.4: Final electrical network data layers workspace and projection in GeoServer ...... 60
Figure 4.5: Published spatial electrical network data in GeoServer ........................................ 60
Figure 4.6: A Screenshot illustrating the requested application permissions. ......................... 61
Figure 4.7: A Screenshot illustrating application icon on the android phone desktop ............ 61
Figure 4.8: The mobile application main page ........................................................................ 62
Figure 4.9: The mobile application Meter Reading and Instructions page .............................. 63
Figure 4.10: The mobile application Incidence Reporting and Instruction page ..................... 64
Figure 4.11: The mobile application data upload acknowledgment page. .............................. 65
Figure 4.12: Web portal home page ......................................................................................... 66
Figure 4.13: Web portal Dash board page ............................................................................... 67
Figure 4.14: Web portal Readings Page - Main Window ........................................................ 68
Figure 4.15: Web portal Readings Page - Details Link ........................................................... 69
Figure 4.16: Web portal Map page (With Open Street Map and World Imagery base maps) 70
Figure 4.17: Web portal Power Incidences Page ..................................................................... 71
Figure 4.18: Web portal Power Incidences Page Details Link 1 ............................................. 71
Figure 4.19: Web portal Power Incidences Page Details Link 2 ............................................. 72
Figure 4.20: Contacts Page ...................................................................................................... 73
Figure 4.21: Web portal Name Search page ............................................................................ 74
Figure 4.22: Web portal Customer – Profile page ................................................................... 74
Figure 4.23: Web portal Customer – Meter Details and Location page .................................. 75
Figure 4.24: Web portal Customer – Meter Reading and Location on Map ........................... 75
Figure 4.25: Web portal Meter box: Itinerary search page ...................................................... 76
Figure 4.26: Web portal Meter Code: search page. ................................................................. 76
Figure 4.27: Published Web portal on AWS server ................................................................. 77
xii
List of Tables
Tables Page
Table 3.2: Langata Constituency County wards. ..................................................................... 27
Table 3.1: Summary of project objectives, research questions, methods, and Results............ 29
Table 3.3: Project Data sources .............................................................................................. 32
Table 3.4: Schema for Customer Details table ....................................................................... 36
Table 3.5: Schema for Meter Details table ............................................................................. 36
Table 3.6: Schema for Meter box Details table ...................................................................... 37
Table 3.7: Schema for Reading Details table .......................................................................... 37
Table 3.8: SQL statements for creating tables in PostgreSQL ............................................... 38
xiii
List of Appendices
Tables Page
Appendix A1 Sample Styling Sheet for Medium Voltage Lines (SLD File) .......................... 85
Appendix B1: Mobile Application Development on Android Studio ..................................... 86
Appendix C1: Web Map Page HTML Code............................................................................ 87
Appendix D1: Server connection and Configuration............................................................... 90

xiv
List of Abbreviations
API Application Programming Interface
APK Android Application Package
APP Application
ASP Active Server Page
AVD Android Virtual Device
AWS Amazon Web Services
CAK Communication Authority of Kenya
CRECO Constitution & Reform Education Consortium
ERC Energy Regulatory Commission
ESri Environmental Systems Research Institute
FDI Foreign Direct Investment
GDC Geothermal Development Company
GeoJSON Geographic JavaScript Object
GIS Geographic Information Systems
GML Geography Mark-up Language
GOK Government of Kenya
GPS Global Positioning System
GWh Gigawatt Hour
HTML HyperText Mark-up Language
HTTP Hypertext Transfer Protocol
HTTPS Secured HyperText Transfer Protocol
IDE Integrated Development Environment
IIS Internet Information Services
IPP Independent Power Producers
JPG Joint Photographic Experts Group
JSP Java Server Pages
JVM Java Virtual Machine
KENGEN Kenya Electricity Generating Company
KETRACO Kenya Electricity and Transmission Company
KIPPRA Kenya Institute for Public Policy Research and Analysis
KML Keyhole Markup Language
KNBS Kenya National Bureau of Statistics
KPLC Kenya Power and Lighting Company

xv
LAN Local Area Network
MoEP Ministry of Energy and Petroleum
OGC Open Geospatial Consortium
ORDBMS Object-Relational Database Management System
OSM OpenStreetMap
PHP HyperText Preprocessor
REA Rural Electrification Authority
REP Rural Electrification Programme
SDK Software Development Kit
SLD Styled Layer Descriptor
SODNET Social Development Network
SOK Survey of Kenya
SQL Structured Query Language
SRID Spatial Reference System Identifier
UNHCR United Nations High Commissioner for Refugees
URI Uniform Resource Identifier
URL Uniform Resource Locator
UTM Universal Transverse Mercator
VGI Volunteered Geographic Information
WAN Wide Area Network
WFS Web Feature Service
WMS Web Mapping Service
XML Extensible Mark-up Language

CHAPTER 1: INTRODUCTION
1.1 Background
Energy is an essential factor of the economy, the national security of a nation as well as
standard of living. The amount of energy use in a country gives an indication of its economic
growth and development. Energy is identified in Kenya's Vision 2030 as one of the major
enablers of infrastructure development under the socio-economic pillar. Low cost, reliable,
sustainable and competitive energy for every citizen is the main ingredient in the
achievement of the Vision (MoEP, 2015).
Kenya drives its energy requirements from mainly three major sources: wood fuel, petroleum,
and electricity. These sources make up 69%, 22%, and 9% respectively of the net energy
consumption in Kenya (Deloitte, 2016). Kenya is undergoing a rapid development stage in
relation to its domestic energy demands. A report by the Kenya Institute for Public Policy
Research and Analysis (2017), indicated that Kenya needs to reduce the cost of energy and
provide stable, quality power supply. This will, in turn, decrease the cost of doing business,
therefore, attracting Foreign Direct Investments (FDIs) and also boost efficiency and
productivity within the industrial sector.
Kenya’s electricity is produced from hydro, thermal, geothermal, solar and wind (Institute of
Economic Affairs, 2015). Kenya Economic Report by KIPPRA (2017), indicated that the
country’s electricity domestic demand increased from 7,826.4 GWh in 2015 to 8,053.2 GWh
in 2016. Electricity tariffs in Kenya remain relatively high at a regional level, despite efforts
by the Energy Regulatory Commission to decrease the tariffs, this could weaken the nation’s
industrial competitiveness (KIPPRA, 2017). Over the decade the country has had an uptake
in electricity connections both in urban and rural areas. This has been driven by a myriad of
various factors, chief amongst them being a new political dispensation in 2002 and the
promulgation of the Constitution of Kenya in 2010.
The number of Mobile cellular subscriptions worldwide now exceeds the global population
(International Telecommunication Union, 2017). The telecommunications sector in Kenya
has witnessed the total number of mobile-cellular subscriptions increase significantly in the
past few years. A report by the Communications Authority of Kenya (2017), indicated that
the performance relating to mobile telephone sub-sector recorded a substantial growth in the
2
course of the second quarter of the financial year 2017/18. The report further points out that
during this period there was a 4.4 percent growth in the total number of active mobile
subscriptions, from 41.0 million recorded in the first quarter to 42.8 million subscriptions.
Subsequently, the mobile penetration level increased to 94.3percent from 90.4 percent
reported in the preceding quarter (Communications Authority of Kenya, 2017).
The advancement of technology has enabled interaction by non-professionals, known as
volunteers to produce, share and consume Geographic Information. The phenomenon of
Volunteer Geographic Information (VGI) is as a result of the extensive involvement of a
large number of private citizens, many times with little or no formal qualifications, in the
creation of Geographic Information. VGI can also be defined as a type crowdsourcing data
generated by volunteers that provides important mass data for decision-making. VGI
continues to be one of the most essential user-generated geographic contents that can provide
a better understanding of planning issues and other challenges (Zhou, 2014).
The current government demanded that Kenya Power and Lighting Company (KPLC)
accelerate electricity connectivity within the country; this called for a totally new approach in
the connectivity, meter reading and billing model within the electricity distribution company.
This study seeks to take advantage of technological growth in the telecommunication sector,
mobile telephony; the positive willingness by power consumers to volunteer information and
embrace this new innovative approaches being implemented by the company. To develop a
mobile and web application that complements the company’s the meter reading process and
also provide a spatial platform for reporting power incidences.
1.2 Problem Statement
Economic activities in Kenya are adversely affected by the high cost of energy. Growth and
competition amongst the various industries in the country are hindered by the relatively high
cost of production, including high electricity tariffs compared to regional markets and power
outages (KIPPRA, 2017). There has been an increase in the number of customers connected
to the power grid due to the various initiatives launched by the Government. These initiatives
are aimed at ensuring low-cost electricity connections to households and achieving over 70%
connectivity by 2017 and universal access by 2020 (Republic of Kenya, 2007).
3
Manual reading of power meters is indeed a time-consuming exercise, especially across large
estates, large portfolios, and apartment buildings. The company’s customer service personnel
(meter readers) face a number of accessibility challenges while undertaking the exercise of
reading postpaid meters. Some of the main challenges include a lot of time spent on locating
certain customer premises and meters, some premises and meters are locked and hence
inaccessible to the meter readers, in other areas premises are located far apart hence the
readers are required to cover long distances in harsh weather conditions. With these
challenges the scope of work allocated to the meter readers to cover before the next reading
cycle may not be covered and hence a negative impact on the accurate reading of all the
postpaid meters every month.
Operation and Maintenance personnel (emergency teams) also face a number of challenges
while resolving power incidences reported by the customers. The main challenges include;
locating incident areas based on a vague description from the customers, lack of proper
preparation (tools and equipment) by the emergency team to handle the reported incidence
based on wrong or unclear description of the incident reported by the customer. With the
wrong information received from the customers, the emergency teams cannot quickly and
efficiently respond to their complaints when the services are disrupted.
The steady rise in the number of power customers in the country, in comparison to the limited
number of KPLC personnel, tasked with providing meter reading and emergency response
services, compounds the above mentioned challenges. Hence the need for the company to
employ deferent technologies and processes to enhance service delivery to its customers. This
study seeks to bridge this gap by developing a complimentary mobile and web-based
application for recording and sharing electricity customer meter reading and power incidence
data.
4
1.3 Research Objectives
Main Objective
The main objective of this study is to develop a complementary mobile and web-based
application for recording and sharing electricity customer meter reading and power incidence
data.
Specific Objectives
1. To develop an electrical network geodatabase for recording and sharing electricity
customer meter reading and power incidence data.
2. To develop a mobile application through which users can report electricity customer
meter reading and power incidence data.
3. To develop a web application through which users can directly record, upload and
share electricity customer meter reading and power incidence data.
4. To publish, share and test the application with case study area of Langata
Constituency, Nairobi County.
1.4 Research Questions
This study intends to address the following research questions:
1. How can an electrical network geodatabase be developed for recording and sharing
electricity customer meter reading and power incidence data?
2. How can a mobile application be developed through which users can report electricity
customer meter reading and power incidence data?
3. How can a web application be developed through which users can directly record,
upload and share electricity customer meter reading and power incidence data?
4. How can this application be published online, shared and tested with a case study
area?
1.5 Justification of the Study
The customers benefit if correct electricity consumption bills are dispatched. This can be
improved with customers assisting in meter reading, using a mobile phone application to
record and share their meter reading on stipulated dates by KPLC. This process will
complement the current meter reading process and ensure that a good number of postpaid
meters are accessed for billing purpose. The Web application is a platform to receive and
display meter readings sent by the customers through their phones. From the Web
application, the meter reading personnel can, verify both spatially and using tagged photos,
5
the accuracy of the reading, and decide on whether to use the reading for billing or visit and
capture the readings.
Customers also seek to benefit from prompt responses to the reported power incidences. The
Emergency the personnel can obtain, from the web application information needed to restore
service quickly and hence reduce the duration of outages. This has been and continues to be a
primary goal for every utility company seeking operational excellence. The web application
can help in this effort by displaying the actual location of the incidence on the map to enable
the teams to plan, prioritize and navigate to the site.
The application also provides a photo of the incidence taken by the customer, this gives the
emergency teams a graphical view of the incidence and hence enable them to study and
deduce the probable cause of the outage and therefore carry the right equipment and gear.
From the location of the site on the map and the uploaded photo, the emergency teams can
carry out proper planning and make informed decisions on how to handle the incident. The
objective is to make the planning and response process of incidence more accurate and faster.
This process can be designed to complement the call center effort currently being used by
KPLC, which if put to use will enhance efficiency and effectiveness in incidence responses.
1.6 Scope and Limitations of the Study
Scope
This project was limited to developing a mobile and web application that enables users to
record and share electricity customer meter reading and power incidence data. The target
users are all postpaid customers, meter readers and emergency teams from KPLC. The target
population of this study is limited to the Nairobi urban population which was easy to reach
and who provided evaluation and feedback of the system. The application was developed on
Google’s Android platform.
Limitations
The mobile app will be available only for Android devices and the targeted users are limited
to the Nairobi urban population. VGI can sometimes have a lack of data quality assurance
and also introduce issues surrounding liability and security. With regards to the privacy of
personal information, the customer data used in the application database contain dummy
names and numbers. The developed application was limited to the Android platform only and
the target users are assumed to have android devices. High voltages power line data was not
used as part of the spatial data in the application database.
6
1.7 Organization of the Study
The project report is structured and organized in chapters and essentially consists of five
chapters each having several sub-topics discussed under it as outlined in the table of content;
Chapter one entails the background to the project, the gap under the problem statement that
the study seeks to address, justification of undertaking the study, the main and specific
objectives guiding the study , and finally the scope, and limitations. Chapter two reviews the
literature that is significant to the study. Chapter three generally presents the methods and
materials used during the project. Chapter four discusses the results obtained after
implementing the methodology, analysis, and discussions of the results obtained. Finally,
chapter five consists of conclusions and thereafter recommendations.
7
CHAPTER 2: LITERATURE REVIEW
2.1 Introduction
This chapter presents an overview of the literature on Kenya’s energy sector, the institutional
setup and the electricity subsector power supply value chain. This section also describes the
mandate of the electricity distribution company KPLC, a summary of the incidence reporting
and meter reading functions in the company. The chapter also gives an overview of the
telecommunication industry and mobile phone penetration in Kenya, Android technology,
and development. It also reviews the concepts of GIS and web mapping in the context of the
development of a complementary Mobile & Web-based Application. Finally, the chapter
reviews related case studies.
Kenya Vision 2030 on energy
Kenya Vision 2030 is a long-term development blueprint aimed at creating “a globally
competitive and prosperous country with a high quality of life by 2030”. The vision strives to
transform Kenya into “a newly-industrializing, middle-income country providing a high
quality of life to all its citizens in a clean and secure environment” (Republic of Kenya,
2007). Kenya Vision 2030 identifies energy as central to the economic, social and political
development of the country. In the face of growing energy demand, the Vision notes that
currently, the energy rates in Kenya are above those of her competitors. It consequently gives
priority to the expansion of the generation of energy as well as improve efficiency in energy
consumption (Institute of Economic Affairs, 2015).
The economic pillar of the Vision 2030 Economic Plan foresees major infrastructural
development to expedite economic growth in the country. This will be achieved by ensuring
that the energy sector institutional reforms process is continuous, with a framework that
defines the regulations in the sector, motivating and creating a conducive environment for
private generators of power to operate in, separation of companies involved in the generation
and distribution of power, ensuring the new sources of energy are secured and exploited and
finally connecting Kenya to countries within the region that export surplus energy (Republic
of Kenya, 2007).
Kenyan Government in conjunction with the Energy Regulatory Commission (ERC) has been
able to develop an energy policy framework detailing provision of energy services that are
cost-effective, affordable and of adequate quality on a sustainable basis over the period 2004-
2023.
8
2.2 Kenya’s Energy Sector Institutional Set up
The Ministry of Energy and Petroleum (MoEP) is tasked with facilitating provision of energy
in Kenya while the industry regulator is the Energy Regulatory Commission (ERC). The
Energy Act which created the ERC as the sole sector regulator integrated all laws pertaining
to the energy sector and in turn ensured legal frameworks, policies and institutions have been
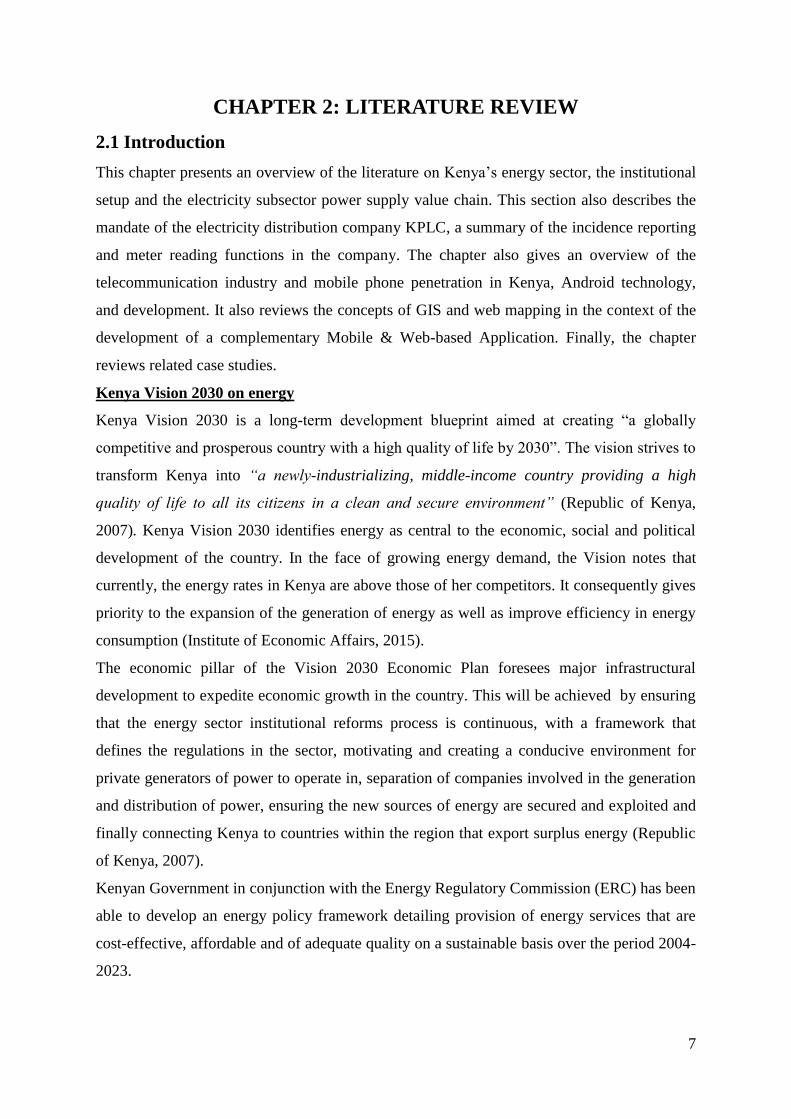
developed now and again. This provides a platform for reforms within the energy sector.
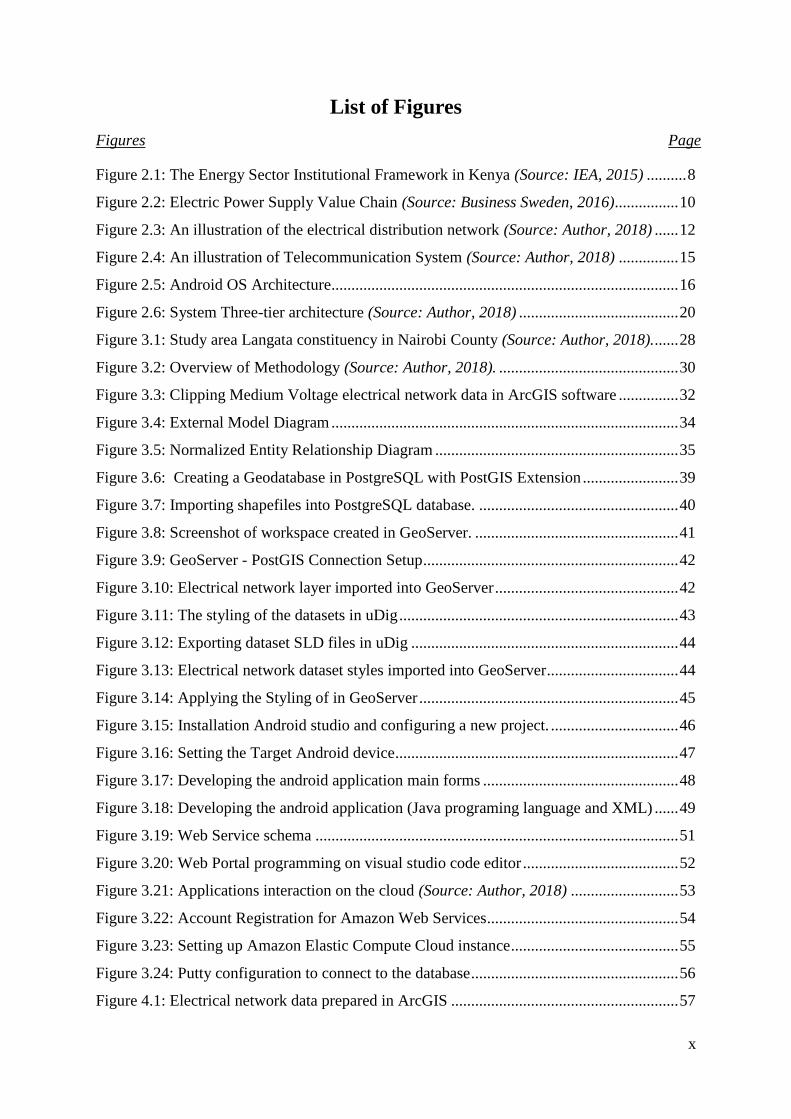
Figure 2.1 illustrates the major institutions in Kenya’s Energy sector.
Figure 2.1: The Energy Sector Institutional Framework in Kenya (Source: IEA, 2015)
The countries energy sector is made up of policy making and implementation institutions.
The policy making institutions include; the Ministry of Energy and Petroleum (MoEP) that
receives advice from the ERC and the Energy Tribunal to provide an enabling environment to
all stakeholders by formulating and articulating policies. The ministry has been tasked with
providing training of manpower, planning for the national energy and petroleum, and souring
the financial resources required (Ministry of Energy and Petroleum, 2015). The Energy
Tribunal came into operation in July 2007, founded by the Energy Act, 2006 under section
108. The tribunal has authority to hear and determine appeals against decisions made by
ERC and all cases relating to the energy sector that have been referred to the tribunal.

9
Finally the Energy Act, 2006 formed the Energy Regulatory Commission (ERC), to provide
technical and economic regulation in the energy sub-sector. Other functions include setting,
reviewing, licensing and enforcing energy purchase tariffs, ensuring that disputes emanating
from power purchase and network service contracts are settled and approved.
The implementing institutions under the electricity Sub-sector include power generation
companies such as Kenya Electricity Generating Company Limited (KenGen), The
Geothermal Development Corporation (GDC) and Independent Power Producers (IPPs).
KenGen is the major power producer of the bulk of electricity consumed in the country. It
produces about 82.1% of the electricity consumed in Kenya (Owiro et al., 2015). Currently,
the company is utilizing the different sources to generate electricity including; hydro,
geothermal, and thermal and wind. The Geothermal Development Corporation (GDC) is a
government owned organization, established by the Energy Act of 2006 with the following
specific roles: to fast-track development of geothermal resources in Kenya, to provide
constant supply of steam to power plant developers for electricity generation, and to promote
alternative uses of geothermal resources other than electricity generation e.g. drying of grains
(Owiro et al., 2015). Finally, Independent Power Producers (IPPs) that are private companies
which generate power and sell electricity in bulk to KPLC.
Other implementing institutions under the electricity Sub-sector are transmission and
distribution companies. These include Kenya Power and Lighting Company Limited (KPLC),
Kenya Electricity Transmission Company Limited (KETRACO), and Rural Electrification
Authority (REA).
KETRACO is a state owned Corporation that was formed to develop infrastructure for high
voltage electricity transmission. KETRACO is tasked with inspection, planning, designing,
constructing and maintenance of transmission lines in the country. These transmission lines
form the backbone of the countries National Transmission Grid. The transmission networks
linked to other countries enable regional trade power trade that is facilitated by KETRACO.
REA was founded by the Energy Act of 2006 under section 66 tasked to manage rural
electrification fund disbursed by the government, to acquire all the resources required for
rural electrification, to extend the existing electricity supply to rural areas in the country, and
encourage the development and utilization of renewable energy (Owiro et al., 2015).
10
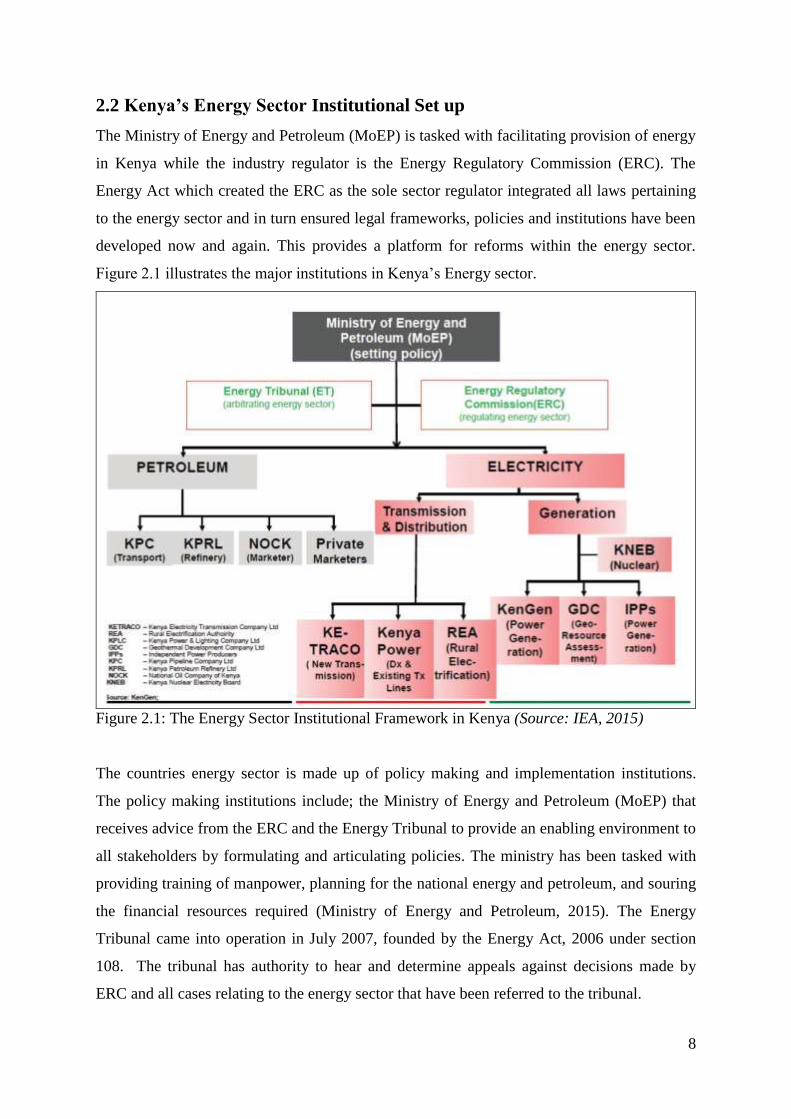
2.3 Kenya’s Electricity Subsector
Kenya’s electricity system is still largely public sector owned and driven, despite the past
years of private sector participation. Sectoral reforms have included unbundling of generation
from transmission and distribution/retail businesses and liberalization of generation to allow
entry of IPPs. Figure 2.2 illustrates the various companies in the electricity subsector in
Kenya, grouped under distribution, transmission, and generation categories.
Electric Power Distribution, Transmission, and Generation Companies.
Figure 2.2: Electric Power Supply Value Chain (Source: Business Sweden, 2016)

11
2.4 Kenya Power and Lighting Company Ltd (KPLC)
2.4.1 KPLC Mandate
The Company’s core mandate is selling of electricity to its customers, building and
maintaining the power distribution and transmission network, carrying out energy balance by
planning for ample electricity generation as well as transmission capacity to meet demand.
KPLC strives to efficiently transmit and distribute high-quality electricity that is safe,
adequate and reliable at cost-effective tariffs. This ensures the company delivers high-quality
customer service to the power consumers. KPLC is a key player in the electric power supply
subsector with the mandate to purchase bulk electricity supply, transmit, distribute and retail
electricity to end-use customers in Kenya. Therefore this reason responsible for customer
connection, metering, and management of all the transmission and distribution lines. They
collect revenue and endeavour to ensure reliable and quality electric power reaches the
customer.
2.4.2 KPLC Corporate Objectives
KPLC, (2012) in the companies 5 Year corporate strategic plan outlines the following as the
some of the main corporate objectives:
To accelerate customer connectivity to fulfil the Vision 2030 Medium Term Plan II
Flagship project of one million new customers connected in a five year period.
To carry out distribution system expansion that facilitates achievement of the
Government’s 5,000+MW generation expansion plan by 2017.
To improve the delivery of customer services and the transmission and distribution
efficiency of electricity in the country.
To improve electricity supply quality to exceed customer expectations, reduce the cost of
doing business and increase sales revenue.
To expand and maintain robust electricity system infrastructure at the least cost possible
and modernise operations through automation in order to enhance efficiency
To carry out innovation in all business spheres to enhance efficiency and service quality
12
Electrical distribution network
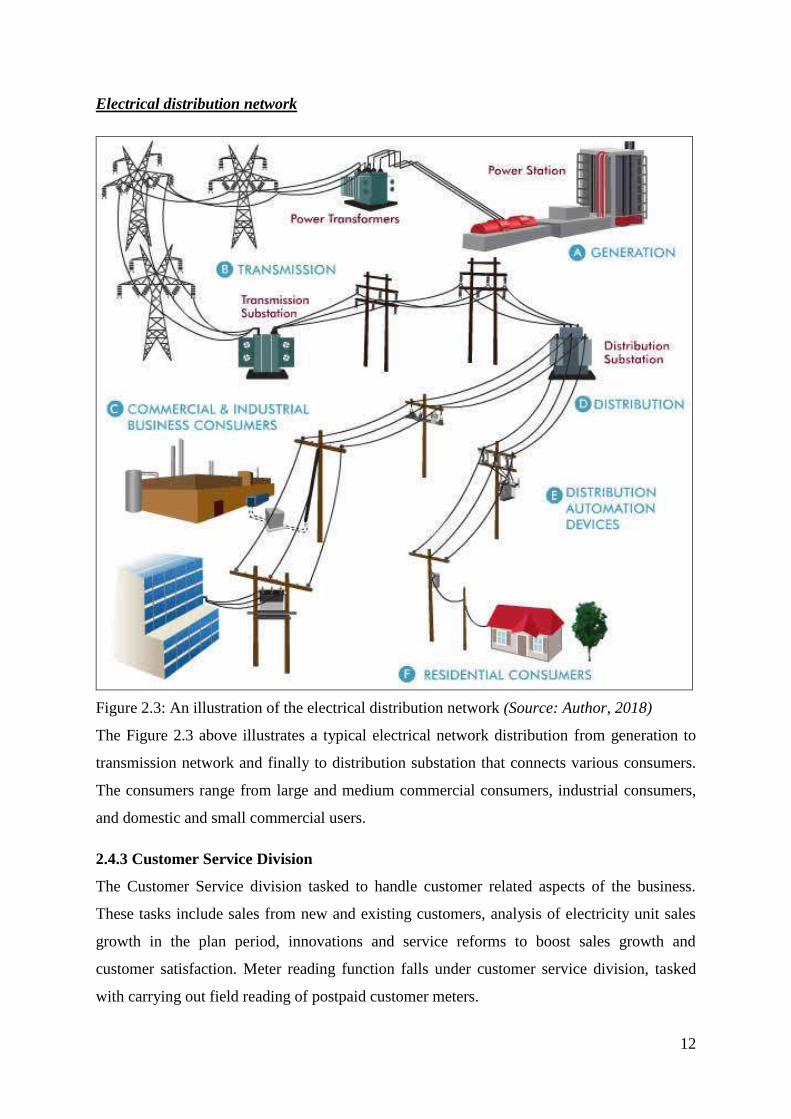
Figure 2.3: An illustration of the electrical distribution network (Source: Author, 2018)
The Figure 2.3 above illustrates a typical electrical network distribution from generation to
transmission network and finally to distribution substation that connects various consumers.
The consumers range from large and medium commercial consumers, industrial consumers,
and domestic and small commercial users.
2.4.3 Customer Service Division
The Customer Service division tasked to handle customer related aspects of the business.
These tasks include sales from new and existing customers, analysis of electricity unit sales
growth in the plan period, innovations and service reforms to boost sales growth and
customer satisfaction. Meter reading function falls under customer service division, tasked
with carrying out field reading of postpaid customer meters.
13
Meter reading procedure
Meter reader uses a mobile handset to carry out the meter reading process. Each meter reader
is allocated an itinerary; an itinerary is composed of a number of meters within the same
location, which can be optimally read by one meter reader within a day. The number of
meters per Itinerary varies from one area to another within the country, depending on the
density of population. Extra high-density areas are town flats next to each other while low
density is mainly rural areas.
The meter reader turns on the handset and confirms the date, itinerary loaded and the number
of meters and proceeds to the field where the first property of the meter is situated. The
reader is expected to gain access to the premises of customers for purposes of carrying out
meter reading. The reader verifies the meter in the property corresponds to the one in the
mobile handset. If the meter corresponds, he/she keys in the reading in the handset by
punching the correct keys/numbers to reflect the same, and confirming the reading keyed in is
correct. He/she records any property anomaly noted in his/her notebook.
The reader then proceeds to the next property as listed in the mobile handset and repeats the
same procedure above, doing so until the whole itinerary is complete. He/she records all
unread meters and the reasons for being unread. This information will be relayed back to the
office. The meter reading services entail monthly reading of all meters allocated to the reader
and uploading them to Kenya Power’s billing system via the local reading application. The
reading is done based on Kenya Power’s meter reading calendar. The company encourages
meter readers to maintain 100% meter reading coverage and accuracy in their respective
Itineraries. The Government directed KPLC to cease electricity bill estimation for postpaid
customers, hence the company is obligated to invest more resources in its meter reading
operations
2.4.4 Operation and Maintenance
Kenya power manages its outage incidences using a non-spatial application called Incidence
Management System (IMS). The IMS is operated at the company's call center which was
recently set up as a specialized central point for incidence management. It is also at the
regional Emergency offices which follow up on these incidences until when they are
resolved. The call center forwards the recorded incidences to regional offices for actions. The
IMS data is received via customer calls for incidences related to power outages. This data in
IMS does not have the spatial components for the customer location or for the distribution
14
networks. It only has the alphanumeric information linking the customer to the transformer
serving him and subsequently to its feeder and substation. The customer details are retrieved
by keying his or her account number in the Customer Information System.
Incidence reporting procedure
Information pertaining to the nature of outage is first received from the customer and
recorded. The operator then assigns the field crew the incidences to resolve. The customer
location is traced by phone calls which make the field personnel's work tedious and time-
consuming. The actual cause of the outage will be known when the person arrives at the site.
They will track the network from consumer end to fault point. They may, therefore, not have
the right equipment and materials to restore power.
When an incident is resolved, the field personnel calls the emergency office to enable them to
record the cause of the outage, the solution given and time of completion. They are then
directed to the next incidence. Some incidences might be repetitive and are solved at one
point such as at the transformer or at a broken jumper and therefore the many incidences
booked under the same parent needed no more attention.
2.5 Telecommunication Subsector in Kenya
One of the main objectives of the study is to develop a mobile application through which
users can report electricity customer meter reading and power incidence data.This section
gives an overview of the telecommunication sector, mobile phone penetration and
subscription rate in the country in Kenya. The section also reviews background information
on Android technology and development. This is vital to justify the use of mobile phone and
Android operating system in the study.
Revenue streams from mobile networks, employment opportunities offered by companies,
innovations, and services contribute immensely to the economy of developing countries.
Internet and data services are gaining popularity in many mobile network services but
traditional services like SMS and voice still remain the most popular among users.
Mobile telephone capacity expanded by 14.0 percent from 62.8 million in 2015 to 71.6
million in 2016 mainly on account of strong demand for mobile services. Mobile
subscriptions increased from 37.7 million in 2015 to 39.0 million in 2016. The number of
mobile money subscribers increased by 19.6 percent to 32.0 million in 2016, according to the
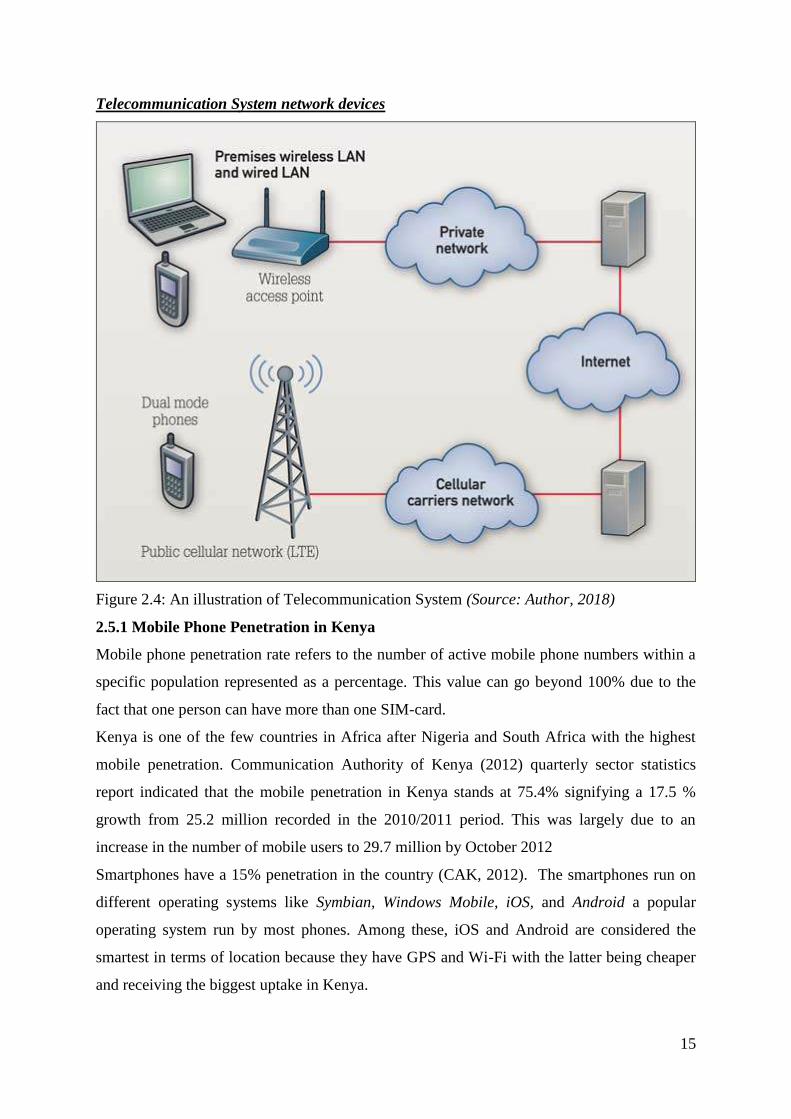
Economic Surveys 2015-2017 (KNBS, 2017). Figure 2.4 illustrates how the various devices
communicate in a telecommunication system network.
15
Telecommunication System network devices
Figure 2.4: An illustration of Telecommunication System (Source: Author, 2018)
2.5.1 Mobile Phone Penetration in Kenya
Mobile phone penetration rate refers to the number of active mobile phone numbers within a
specific population represented as a percentage. This value can go beyond 100% due to the
fact that one person can have more than one SIM-card.
Kenya is one of the few countries in Africa after Nigeria and South Africa with the highest
mobile penetration. Communication Authority of Kenya (2012) quarterly sector statistics
report indicated that the mobile penetration in Kenya stands at 75.4% signifying a 17.5 %
growth from 25.2 million recorded in the 2010/2011 period. This was largely due to an
increase in the number of mobile users to 29.7 million by October 2012
Smartphones have a 15% penetration in the country (CAK, 2012). The smartphones run on
different operating systems like Symbian, Windows Mobile, iOS, and Android a popular
operating system run by most phones. Among these, iOS and Android are considered the
smartest in terms of location because they have GPS and Wi-Fi with the latter being cheaper
and receiving the biggest uptake in Kenya.
16
2.5.2 Android Technology
Android Operating System
Android, Inc. was founded in Palo Alto, California, United States in October 2003 by Andy
Rubin and later acquired by Google on August 17, 2005. Android is a mobile operating
system based on the Linux kernel and mainly designed for mobile devices such as
smartphones and tablet computers Android Source code is released by Google under the open
source licenses though most Android devices ship with a combination of open source
software and proprietary software developed and licensed by Google. The open source nature
of Android has enabled many to create and distribute their own modified version of the OS
through the Android Open Source Project (ASOP).
2.5.3 Android Development
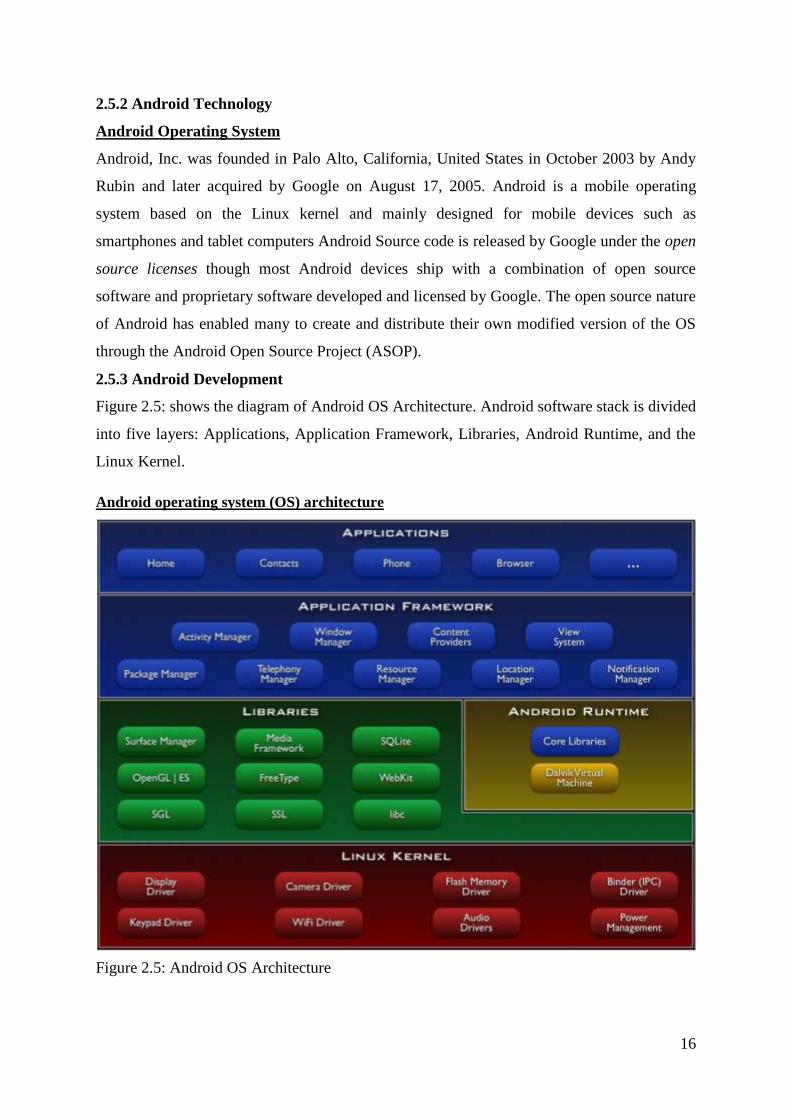
Figure 2.5: shows the diagram of Android OS Architecture. Android software stack is divided
into five layers: Applications, Application Framework, Libraries, Android Runtime, and the
Linux Kernel.
Android operating system (OS) architecture
Figure 2.5: Android OS Architecture
17
Linux Kernel
The kernel is found in the lower layer of the Android operating system and is the core of the
operating system. The Linux kernel has all the essential hardware drivers and also acts as an
abstraction layer between the device hardware and the upper layers of the Android software
stack. The Linux Kernel is what interacts with the hardware and contains all device drivers
used by higher levels of the software stack to control and communicate with the hardware.
Such drivers are the Display Driver, Camera Driver, Flash Memory Driver, Audio Driver etc.
Libraries
This is the layer that enables the device to handle different types of data. These libraries are
written in C or C++ language and are specific to a particular hardware. Some of the core
libraries are: SQLite used to access data published by content providers and includes SQLite
database management classes, Secure Sockets Layer (SSL) used to provide internet security
and Skia Graphics Library (SGL) which is the underlying 2D graphics engine.
Android Runtime
The Android Runtime consists of the Dalvik Virtual Machine (DVM) or Android RunTime
(ART) and core Java libraries. Dalvik Virtual Machine a type of Java Virtual Machine (JVM)
used in Android devices to run applications and is optimized for low processing power and
low memory environments.
Application Framework
The frameworks are blocks in which the applications directly interact with. They are the basic
tools used to build applications and provide the basic functions of phones like resource
management, voice call management etc. The Android framework includes the following key
services: Content Providers: Manages data sharing between applications (Allows
applications to publish and share data with other applications). Activity Manager: Manages
all aspects of the application lifecycle and activity stack. Telephone Manager: Manages all
voice calls providing the telephony services available on the device such as status and
subscriber information. Location Manager: Uses GPS or cell towers for location management
allowing an application to receive updates about location changes.
Applications
In Android architecture, the applications are found at the top layer of the architecture. The
user of the Android device would mostly interact with this layer and several standard
applications come pre-installed with every device, such as SMS client application, Dialer,
Web browser and Contact manager. A developer is able to write applications that replace
default system applications and applications that solve a specific problem.
18
2.6 GIS and Web Mapping
2.6.1 Geographic Information Systems (GIS)
GIS refers to a system of hardware, software and procedures that capture, store, edit,
manipulate, manage, analyze, share and visualize georeferenced data (Fu and Sun, 2011).
GIS is used to produce a wide range of maps but its capabilities go beyond mapping. It offers
a rich set of analytical functions that can reveal hidden relationships, patterns, and trends that
are not readily apparent, enabling people to think spatially to solve problems and make smart
decisions (Fu and Sun, 2011). By understanding spatially distributed phenomena in many
areas GIS can be utilized to assist in decision making and evaluating problems (Sakamoto
and Fukui 2004).
2.6.2 Web Mapping
Web mapping is the process by which maps are designed, implemented, generated and
delivered on the web (Neumann 2008). Web maps can be viewed from a standard web
browser, mobile devices, and desktop map viewers. Web Maps are authored through a variety
of means but the traditional method would be through the desktop. A typical workflow would
be the standard author, share and use process. The authoring process is carried out by
standard desktop GIS software such as ArcGIS for Desktop or free and open source open
source such as Quantum GIS. The sharing process is done on either enterprise systems or
cloud-based platforms that avail the resource into the online platform.
Web mapping is a form of distributed computing based on the client-server architecture. It
affords the benefits attributed to a distributed computing system. In principle, in web
mapping, any user with internet connectivity can benefit from web mapping services.
Notably, it is not required that a user be a GIS expert in order to benefit from web mapping
services.
Websites are becoming increasingly popular especially with the distant passage of
information: one very effective way of sharing map information to a group of non-technical
end users is through a webpage. Mitchell (2005) defines two broad kinds of web map
applications as static and dynamic. Static maps are displayed as an image on a web page
while for dynamic maps, a user can interact with the map with functionalities such as
querying and zooming of layers on the map. Such maps are much more complex and require
programming skills to create and display them.
19
Advantages of web mapping
The World Wide Web being used as a dissemination medium for maps has empowered GIS
and provided new opportunities mapping such as; low cost incurred while sharing the maps,
increased frequency updating data and related software at low cost, customizable map
contents to suit user needs, variety of distributed data sources and generally the ease of
sharing of Geographic Information. Web mapping is the easiest way to improve internal and
external communication with users who understand maps (Stachowicz, 2004).
Challenges of web mapping
Technical restrictions such as low display resolution and limited bandwidth pose a major
challenge to web mapping. Many mobile computing devices are physically small with slow
wireless Internet connections. There also exist the challenges of data privacy, copyright and
security issues. Data accuracy, reliability, currency and complexity also pose major
challenges in web mapping. Today web maps are interactive and integrate multiple media.
This means that both web mapping and web cartography also have to deal with interactivity,
usability and multimedia issues (Kraak J. &Allan B. 2001).
2.6.3 Components of Web Mapping
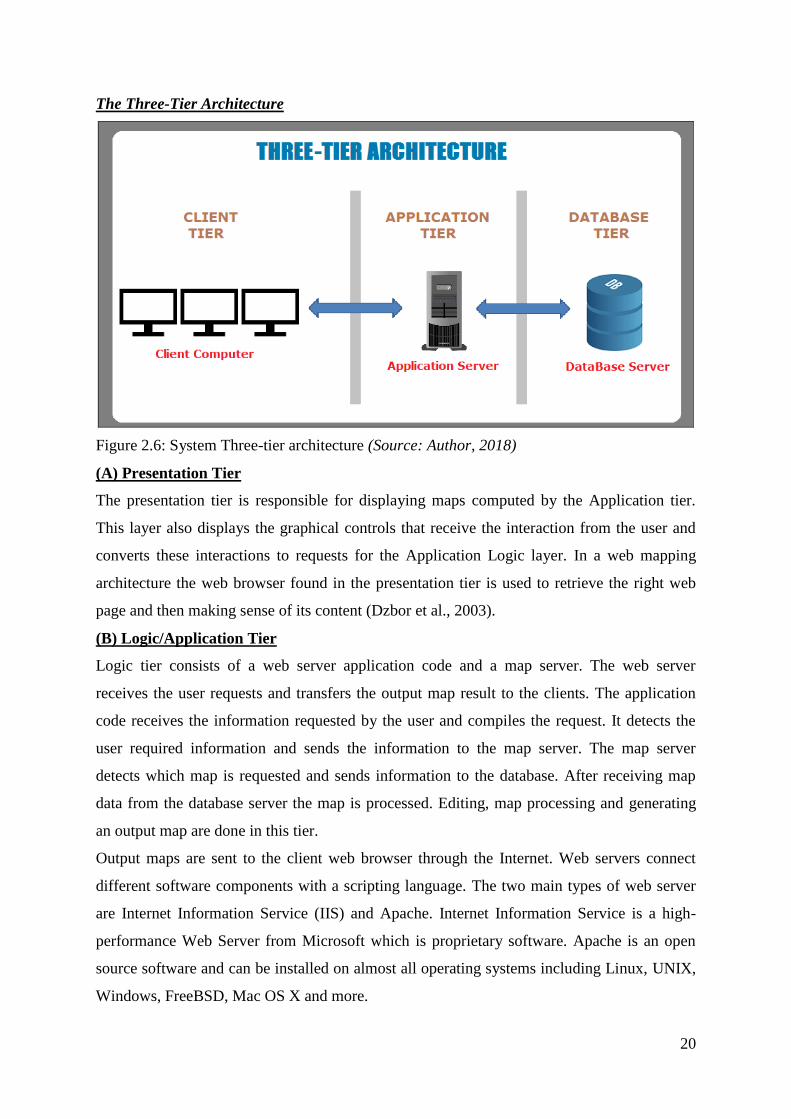
The Three-Tier Architecture
Most Web applications employ the use of a Three-Tier Architecture module as a framework
on the Internet. This Architecture helps to separate the Business Logic from the Application,
Data Storage, and database. Figure: 2.6 below shows the client-server three-tier architecture
for creating web applications. It is composed of client (presentation), server (application) and
data (database) tiers.
Developers can develop, maintain, upgrade or replace any of the three tiers and hence a
preferred over other architectures. The client sends a request to the server which in turn
processes and executes the query and directs it to the database. The database returns the result
which is fetched by and processed by the server and delivered to the client.
20
The Three-Tier Architecture
Figure 2.6: System Three-tier architecture (Source: Author, 2018)
(A) Presentation Tier
The presentation tier is responsible for displaying maps computed by the Application tier.
This layer also displays the graphical controls that receive the interaction from the user and
converts these interactions to requests for the Application Logic layer. In a web mapping
architecture the web browser found in the presentation tier is used to retrieve the right web
page and then making sense of its content (Dzbor et al., 2003).
(B) Logic/Application Tier
Logic tier consists of a web server application code and a map server. The web server
receives the user requests and transfers the output map result to the clients. The application
code receives the information requested by the user and compiles the request. It detects the
user required information and sends the information to the map server. The map server
detects which map is requested and sends information to the database. After receiving map
data from the database server the map is processed. Editing, map processing and generating
an output map are done in this tier.
Output maps are sent to the client web browser through the Internet. Web servers connect
different software components with a scripting language. The two main types of web server
are Internet Information Service (IIS) and Apache. Internet Information Service is a high-
performance Web Server from Microsoft which is proprietary software. Apache is an open
source software and can be installed on almost all operating systems including Linux, UNIX,
Windows, FreeBSD, Mac OS X and more.
21
(C) Database Tier
The Database tier manages and organizes the map data. The relational database table is
created using the relational database model and used for efficient retrieval of data. It sends
and receives instruction and information through maps server and application code compiling
center. Map file stores the whole map in a file which is accessed by the map server. This
project uses the PostgreSQL database with PostGIS Extension.
2.6.4 Available Web Mapping Technologies
(1) Scripting language and JavaScript
Scripting languages often follow the syntax and semantics of command languages that allow
controlling one or more software application. Client-side scripting is executed on the client
side by web browsers whereas in the server side scripting runs on the server side or
application servers. The popular server-side scripts are PHP, ASP, and JSP. JavaScript and
VBScript are client-side object-oriented scripting language and is popular for developing a
client-side application. Developed by Netscape, JavaScript is an object-based client-side, e
scripting language which can be embedded directly into HTML pages. It allows users to
create dynamic, interactive Web-based applications that run completely within a Web
browser.
(2) Application Programming Interface
In computer programming, an application programming interface (API) is a set of routines,
protocols, and tools used by an application to communicate with other control programs,
communication protocol or operating system. In addition to accessing databases or computer
hardware, such as hard disk drives or video cards, an API can ease the work of programming
GUI components. Almost every application depends on the APIs of the underlying operating
system to perform such basic functions as accessing the file system (Orenstein, 2000).
Each API is designed in a specific programming language and has several specifications that
define it facilitates communication between two applications to exchange messages or data.
A set of functions and procedures that offers a library so other software can use it as an
abstraction layer, both using each other’s information without compromising their
independence. The Android mobile application will use an API to communicate with the
portal and upload information sent by the customer
22
(3) Cloud computing
Cloud computing is the delivery of computing services over the internet, providing a shared a
shared pool of resources, including data storage space, networks, computer processing power,
and specialized corporate and user applications. Cloud computing architecture allows users to
access information and computer resources from anywhere that a network connection is
available. The hardware and software resources are provided to users on-demand managed by
third parties at remote locations.
Some of the major characteristics of cloud computing include: On-demand self-service,
where the can request and manage their own computing resources, broad network access that
allows services to be offered over the Internet or private networks, resource pooling where
customers draw from a pool of computing resources, usually in remote data centres, rapid
elasticity where services can be scaled larger or smaller and finally the service is measured
and customers are billed accordingly.
(a) Cloud computing Service Models.
Cloud Providers offer services that can be grouped into three categories.
Software as a Service (SaaS) in this model, a complete application is offered to the
customer, as a service on demand. A single instance of the service runs on the cloud &
multiple end users are serviced. The service provider hosts only a single application on
the server and the customer does not need upfront investment in servers or software
licenses hence the costs are lowered.
Platform as a Service (PaaS) an operating system, hardware, and network are provided,
and the customer installs or develops its own software and applications. The operating
systems and network access are not managed by the customer, and there might be
constraints as to which applications can be deployed. The customer has the freedom to
build his own applications, which run on the provider’s infrastructure. Examples include
Amazon Web Services (AWS), Rackspace and Microsoft Azure.
Infrastructure as a Service (IaaS) provides just the hardware and network; the
customer installs or develops its own operating systems, software and applications. The
customer controls and manages the systems in terms of the operating systems,
applications, storage, and network connectivity, but do not themselves control the cloud
infrastructure.
23
(b) Deployment of cloud services
Deploying cloud computing can differ depending on requirements. The following are the
main deployment models each with specific characteristics that support the needs of the
services and users of the clouds in particular ways.
Private Cloud: The cloud infrastructure is operated solely for a specific organization and
is managed by the organization or a third party. The cloud infrastructure has been
deployed and is maintained and operated for a specific organization. The operation may
be in-house or with a third party on the premises.
Community Cloud: The service is shared among a number of organizations with similar
interests and requirements and made available only to those groups. The infrastructure
may be owned and operated by the organizations or by a cloud service provider.
Public Cloud: The cloud infrastructure is available to the public on a commercial basis
by a cloud service provider. This enables a consumer to develop and deploy a service in
the cloud with very little financial outlay compared to the capital expenditure
requirements normally associated with other deployment options.
(c) Cloud Computing Benefits
The following are some of the possible benefits for those who offer cloud computing-based
services and applications:
Reduced Cost: Companies can reduce their capital expenditures and use operational
expenditures for increasing their computing capabilities. The billing model is paid as per
usage; the infrastructure is not purchased thus lowering maintenance. Initial expense and
recurring expenses are much lower than traditional computing.
Increased Storage. With the massive Infrastructure that is offered by Cloud providers
today, storage & maintenance of large volumes of data is a reality. Sudden workload
spikes are also managed effectively & efficiently since the cloud can scale dynamically.
Scalability/Flexibility. Companies can start with a small deployment and grow to a large
deployment fairly rapidly, and then scale back if necessary. Also, the flexibility of cloud
computing allows companies to use extra resources at peak times, enabling them to
satisfy consumer
Maintenance. Cloud service providers do the system maintenance, and access is through
APIs that do not require application installations onto PCs, thus further reducing
maintenance requirements.
24
Mobile Accessible. Mobile workers have increased productivity due to systems accessible
in an infrastructure available from anywhere.
Reliability Services using multiple redundant sites can support business continuity and
disaster recovery.
2.7 Volunteered Geographic Information (VGI)
VGI based on a usually one-way flow of information is intended to create, collect, validate,
analyse, and disseminate geographic data contributed voluntarily by individuals (Elwood,
2008d; Goodchild, 2007b, 2008; Miscione et al., 2011; Tulloch, 2008). VGI employed as a
collective effort is usually associated with crowdsourcing or externally decided joint
activities (Xu and Nyerges, 2016).
VGI can be defined as "crowdsourced" geographic information provided by a wide range of
participants with varying levels of education, knowledge and skills, a valued and useful
source of information for governments and organizations in the modern society. In this
approach, data sources are provided by communities of volunteers as opposed to government
entities, organizations i.e. research institutions. This has been fuelled by the emergence of
Web 2.0 technologies, miniaturization of the Global Positioning System (GPS) devices and
advancement of broadband communication links (Goodchild. 2007). Mobile computing
Services are multiplying rapidly in terms of range, processing speeds, and storage capacities.
The growing interest in compiling and editing georeferenced data has manifested itself in the
growth of volunteered geographic information systems such as OpenStreetMap and Ushahidi,
platform VGI or locational crowdsourcing.
VGI Accuracy and Reliability
Concerning quality, VGI can be said to be the most current data source. However. VGI
compared to traditional authoritative data sources can be said to have poor positional
accuracy and overall veracity, however, this assertion might not be entirely accurate and can
be debated using Linus's law. This law states that the more people involved and watching
over a project, the more likely errors can be spotted and fixed early (Howard and Leblanc.
2003). Another argument in support of VGI is the argument that near things are more related
than distant things and therefore citizen contributions will be more accurate for places which
these people understand. Citizen contributions will be more accurate for places which these
people understand.
25
Example of VGI initiative
Ushahidi is an open source web application for information collection, visualization, and
interactive mapping. It helps one to collect info from: SMS, Twitter, RSS feeds and Email. It
helps one to process that information, categorize it, geo-locate it and publish it on a map.
Ushahidi, which translates to "testimony "in Swahili was developed to map reports of the
aftermath of 2007-08 post-election violence in Kenya. It is a non-profit software company
that develops free and open-source software for information collection, visualization, and
interactive mapping. Since then, thousands have used Ushahidi's crowdsourcing tools to raise
their voice.
2.8 Geo-tagging
Geotagging refers to the process of appending geospatial identification metadata to various
types of media such as narrative documents, web content, and images (Hunter, 2012). With
various social web tools and applications, users can add geospatial information to web
content, photographs, audio, and video. Using hardware integrated with Global Positioning
System (GPS) receivers, this can be done automatically (Hu & Ge, 2008).
Geo-tagging photos
This allows users to associate a photo with a particular location. This is achieved by adding
metadata containing coordinates or other location data like address systems to a picture or
any other media type. Essentially any type of media can have a location associated with it but
the only thing that will vary is the way a location is expressed and stored.
Geo-tagging can be an automatic process of a camera which is GPS enabled, however, it can
also be accomplished manually or by pairing the time a picture was taken with the time a
coordinate was taken. For automatic geo-tagging, it is usually the position of the
photographer or rather the camera itself which gets recorded. In the resulting pictures, this
information is stored in the digital file; predominantly in jpg format. (UNHCR, 2012)
Geo-tagging can help users find a wide variety of location-specific information. Geo-tagging
enabled information services can also potentially be used to find location-based news,
websites, or other resources. Platforms like Google Maps or Flickr where users upload their
geo-tagged pictures can be used to look at sites, find unmapped infrastructure or share geo-
tagged pictures with the wider public or a selected user group only. Geo-tagging indicates the
location of the content of a given picture or other media, and on some media platforms show
media relevant to a given location. (UNHCR, 2012)
26
2.9 Similar Case studies City of Windhoek-Self-Reading (SMS)
The city of Windhoek is the capital and largest city of the Republic of Namibia. It is located
in central Namibia and offers a self-reading using short message service (SMS) that allows
the customer to submit their monthly water/electricity meter reading via SMS. This service is
offered by the Department of Finance. The City in an effort to improve service delivery and
satisfy customer needs introduced a self-reading SMS facility whereby residents of the capital
can self-register to submit their water and electricity meter readings via SMS from the
comfort of their own homes.
The owner of the premises is required to go to the City of Windhoek townhouse to complete
the application form after which they register their cell phone number to an Account by
sending an SMS with their account number and statement key. Once registered, clients are
required and obliged to provide monthly readings between the 20th and 30th of each month
to avoid utility consumption being estimated. The system allows for only one registration per
Account and a single mobile phone can register to more than one Account. The Account
Number and Statement Key are found on the user monthly statement. Once your cell phone
number is registered to an Account, the user is eligible to submit their monthly reading by
sending an SMS. The Meter Number is indicated on the customer’s statement and only one
reading per month is acceptable. Spot checks on readings are conducted frequently by the
council personnel. The City Council have the right to take confirmation readings from time
to time in order to double check the readings provided by the client.
2.10 Conclusion on the literature review
The literature review discussed in this chapter points out that the growing interest in
compiling and editing georeferenced data by citizens has manifested itself in the growth of
volunteered geographic information systems such as OpenStreetMap and Ushahidi platforms.
Most of this VGI initiatives focus on offering humanitarian and social solutions to the users.
Effective service delivery to power consumers calls for utility companies utilizing the
available technologies and contributions from the public to support their processes.
Self-Reading (SMS) system by City of Windhoek, Namibia case study is a good
demonstration of how the customers can provide information to aid in the billing process.
This system implemented by the City of Windhoek lacks a mechanism to confirm the meter
reading sent by the user and location of the user at the time of reading. It requires the Council
personnel to conduct frequent spot checks from time to time to confirm readings sent.
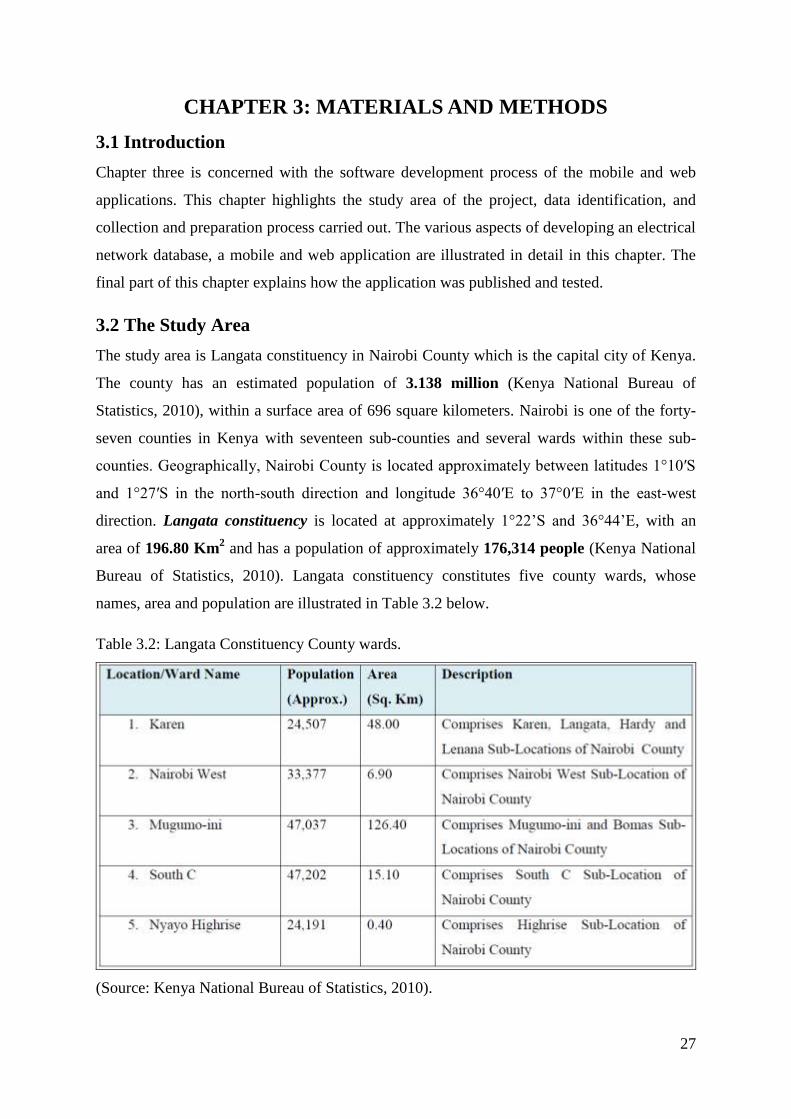
27
CHAPTER 3: MATERIALS AND METHODS
3.1 Introduction
Chapter three is concerned with the software development process of the mobile and web
applications. This chapter highlights the study area of the project, data identification, and
collection and preparation process carried out. The various aspects of developing an electrical
network database, a mobile and web application are illustrated in detail in this chapter. The
final part of this chapter explains how the application was published and tested.
3.2 The Study Area
The study area is Langata constituency in Nairobi County which is the capital city of Kenya.
The county has an estimated population of 3.138 million (Kenya National Bureau of
Statistics, 2010), within a surface area of 696 square kilometers. Nairobi is one of the forty-
seven counties in Kenya with seventeen sub-counties and several wards within these sub-
counties. Geographically, Nairobi County is located approximately between latitudes 1°10′S
and 1°27′S in the north-south direction and longitude 36°40′E to 37°0′E in the east-west
direction. Langata constituency is located at approximately 1°22’S and 36°44’E, with an
area of 196.80 Km2 and has a population of approximately 176,314 people (Kenya National
Bureau of Statistics, 2010). Langata constituency constitutes five county wards, whose
names, area and population are illustrated in Table 3.2 below.
Table 3.2: Langata Constituency County wards.
(Source: Kenya National Bureau of Statistics, 2010).
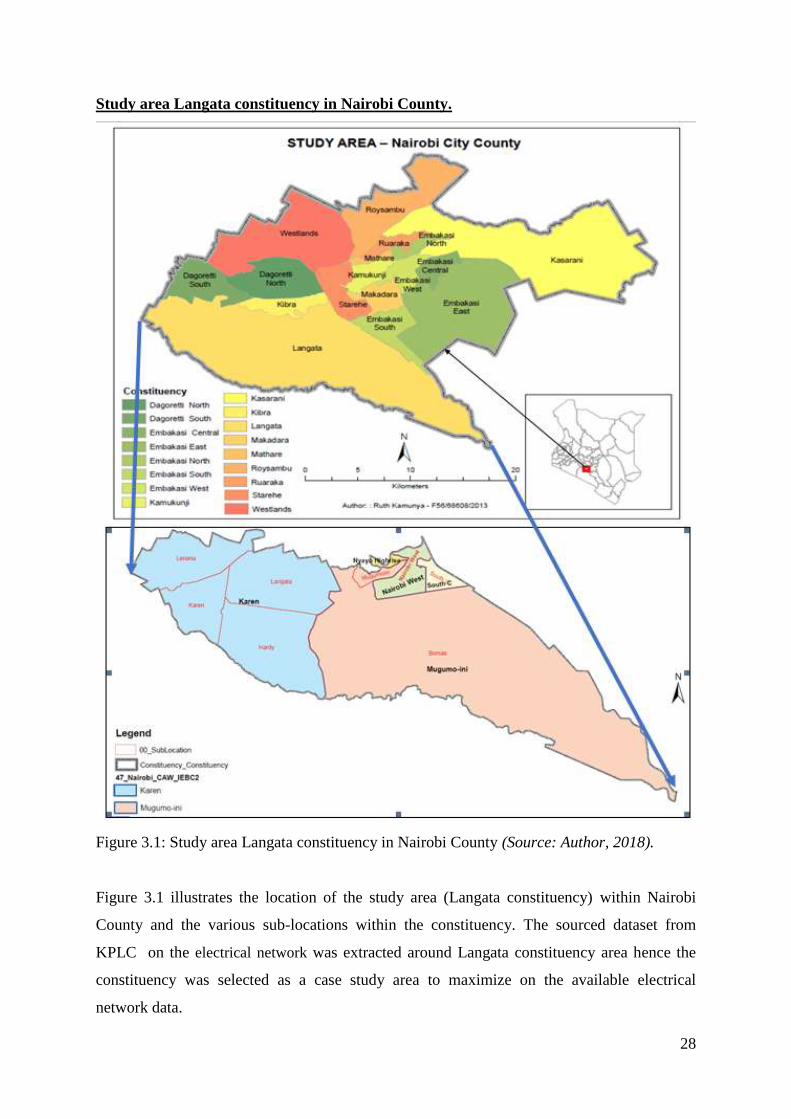
28
Study area Langata constituency in Nairobi County.
Figure 3.1: Study area Langata constituency in Nairobi County (Source: Author, 2018).
Figure 3.1 illustrates the location of the study area (Langata constituency) within Nairobi
County and the various sub-locations within the constituency. The sourced dataset from
KPLC on the electrical network was extracted around Langata constituency area hence the
constituency was selected as a case study area to maximize on the available electrical
network data.
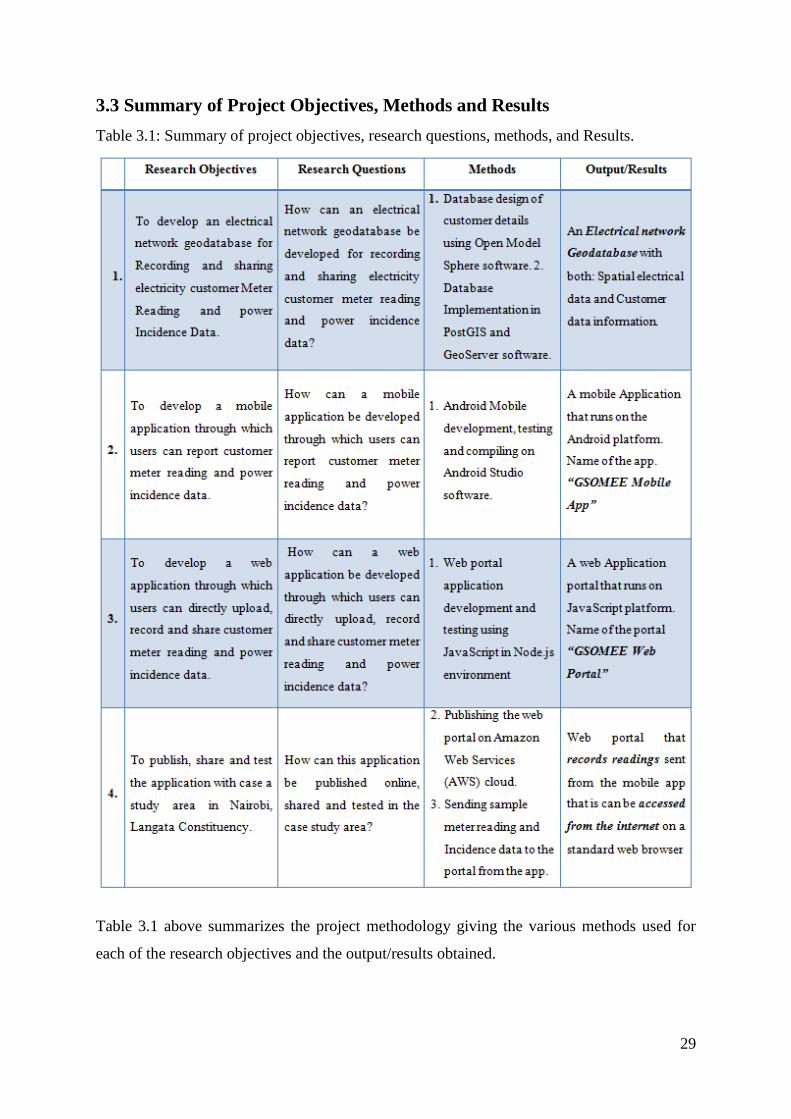
29
3.3 Summary of Project Objectives, Methods and Results
Table 3.1: Summary of project objectives, research questions, methods, and Results.
Table 3.1 above summarizes the project methodology giving the various methods used for
each of the research objectives and the output/results obtained.
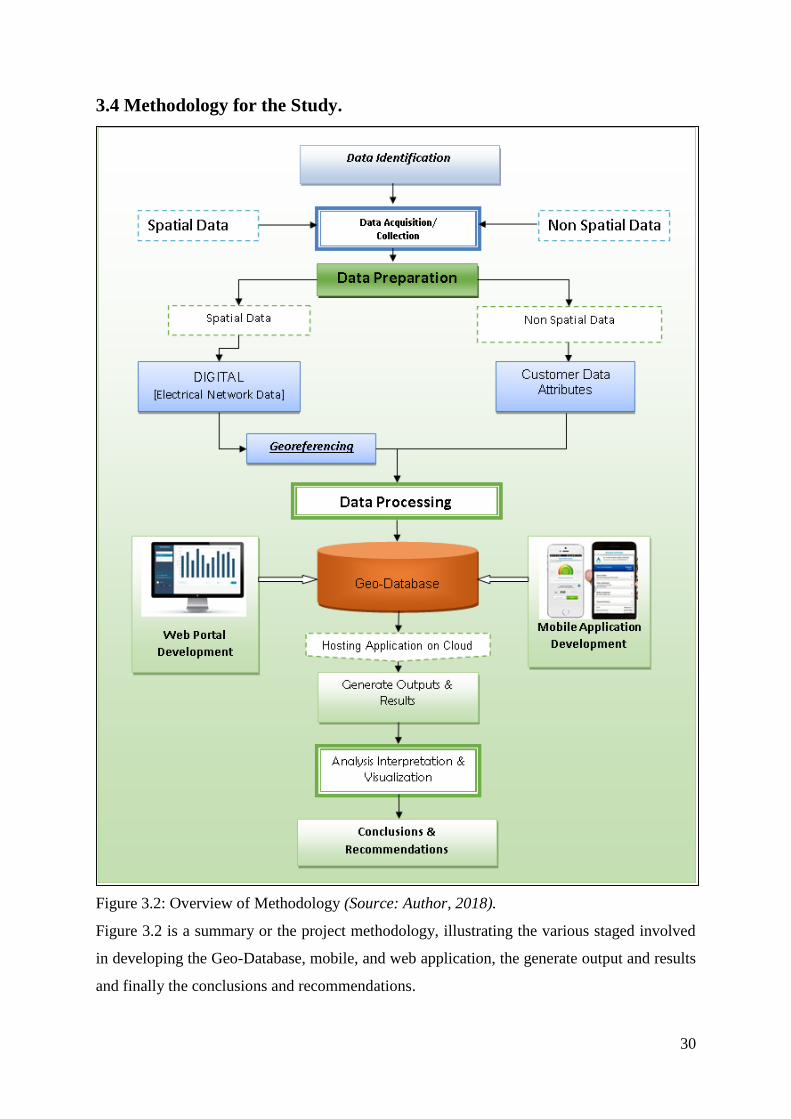
30
3.4 Methodology for the Study.
Figure 3.2: Overview of Methodology (Source: Author, 2018).
Figure 3.2 is a summary or the project methodology, illustrating the various staged involved
in developing the Geo-Database, mobile, and web application, the generate output and results
and finally the conclusions and recommendations.
31
3.5 Data Identification
In this study, the main objective was to come up with an interactive mobile and web
application to support recording and sharing electricity customer power meter readings and
incidences. There was a need, therefore, to map the entire electrical network in the study area.
This ensured that the customer can have his/her location identified and the associated
electrical connectivity shown. There was also need to come up with a dummy customer
Meter details to support the same.
In view of the objectives set, it was concluded that the data required was:
Electrical data on Medium and Low voltage power lines, Secondary substations
(Transformers) associated with the lines in the study area, Customer meter box
location with dummy details.
Kenya map showing administrative boundaries
Dummy customer meter details associated to the above meter boxes.
3.6 Data Collection and Preparation
3.6.1 Data Tools Used (Hardware and Software)
ESRI Arc Map version 10.2.1.
This was used to prepared (clipping and editing) the electrical network data. The software
was also used to input the required attributes for the edited electrical network data
Global Mapper version 18.
This was used to transform the coordinates system of the various datasets from one
coordinate system to another. It also used to export data into various data formats used in the
application.
3.6.2 Data Collection
Data collection involved gathering the requisite data obtained from KPLC. The data were re-
projected to the same coordinate system, Arc 1960, UTM 37S and saved as shapefiles data
format for ease of manipulation in the PostGIS and GeoServer software. Important attributes
for the different datasets were also picked from the field and used to sample the accuracy of
the electrical network data obtained.
The administrative boundary data was acquired from the Survey of Kenya. The
administrative boundaries had all the counties in Kenya and were used to extract the study
area boundaries.
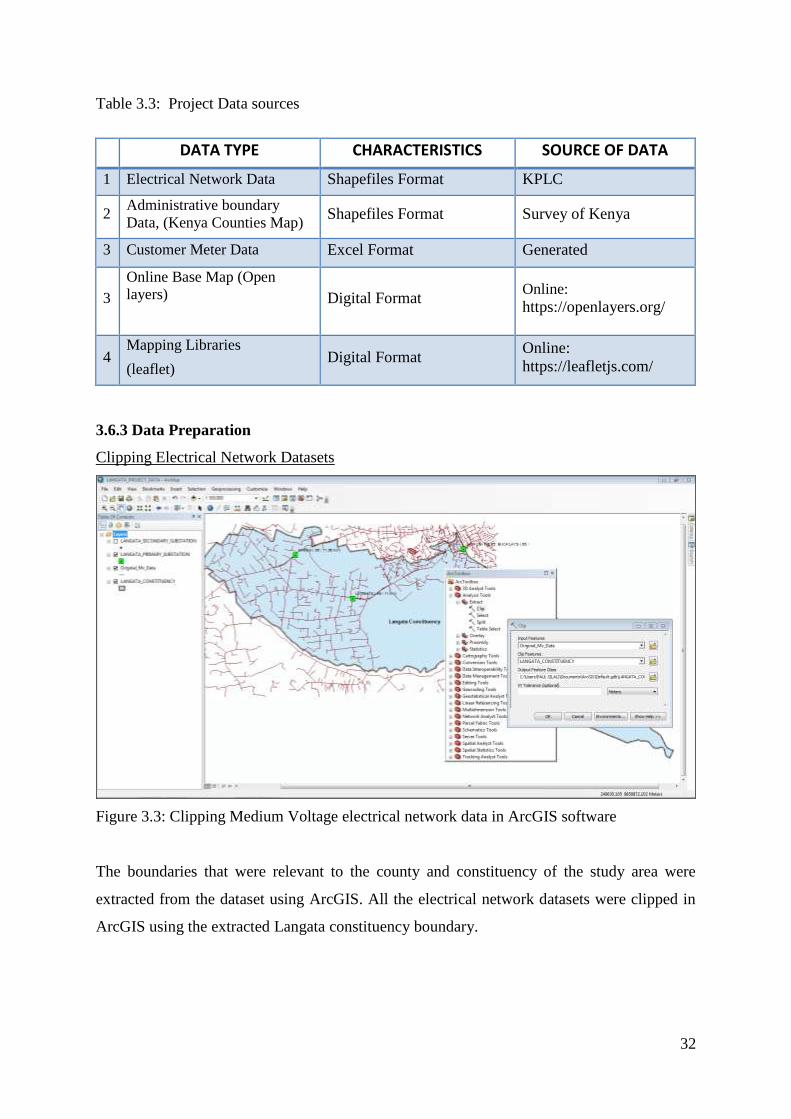
32
Table 3.3: Project Data sources
3.6.3 Data Preparation
Clipping Electrical Network Datasets
Figure 3.3: Clipping Medium Voltage electrical network data in ArcGIS software
The boundaries that were relevant to the county and constituency of the study area were
extracted from the dataset using ArcGIS. All the electrical network datasets were clipped in
ArcGIS using the extracted Langata constituency boundary.
DATA TYPE CHARACTERISTICS SOURCE OF DATA
1 Electrical Network Data Shapefiles Format KPLC
2 Administrative boundary
Data, (Kenya Counties Map) Shapefiles Format Survey of Kenya
3 Customer Meter Data Excel Format Generated
3
Online Base Map (Open layers)
Digital Format Online: https://openlayers.org/
4 Mapping Libraries
(leaflet) Digital Format
Online:
https://leafletjs.com/
33
Data Editing
Data editing was done to remove errors in electrical network datasets for the study area. The
editing task included;
Cleaning and quality control
Checking and correcting the integrity of the captured data.
Checking the coordinate system and carrying out transformations to adjust the
projection where necessary.
Others involved, removal of dangles, overshoot, undershoot and spelling mistakes.
3.7 Developing an Electrical Network Geodatabase
3.7.1 Data Tools Used (Hardware and Software)
Open ModelSphere Version 3.2
Open ModelSphere is an open source for data processing and UML modeling tool.This
application was used for conceptual and logical data modeling as well as the physical design
of the database (database modeling).
PostgreSQL Version 10
PostgreSQL is an open source object-relational database management system used together
with the PostGIS to develop the spatial database.
PostGIS Version 2.0
PostGIS is an open source software that extends the functionalities of PostgreSQL adding
support for geographic objects allowing location queries to be run in SQL. PostGIS is
compliant with specifications from Open Geospatial Consortium (OGC).
GeoServer
GeoServer is an open-source server written in Java. Was used to share, process and edit
geospatial electrical network data. It has high interoperability and publishes data from any
major spatial data source using open standards.
uDig
This is a User-friendly Desktop Internet GIS (uDig), an open source desktop application
framework, whose goal is to provide a complete Java solution for desktop GIS data access,
editing, and viewing. In this project, uDig was used in styling the spatial data geometries
before publishing.
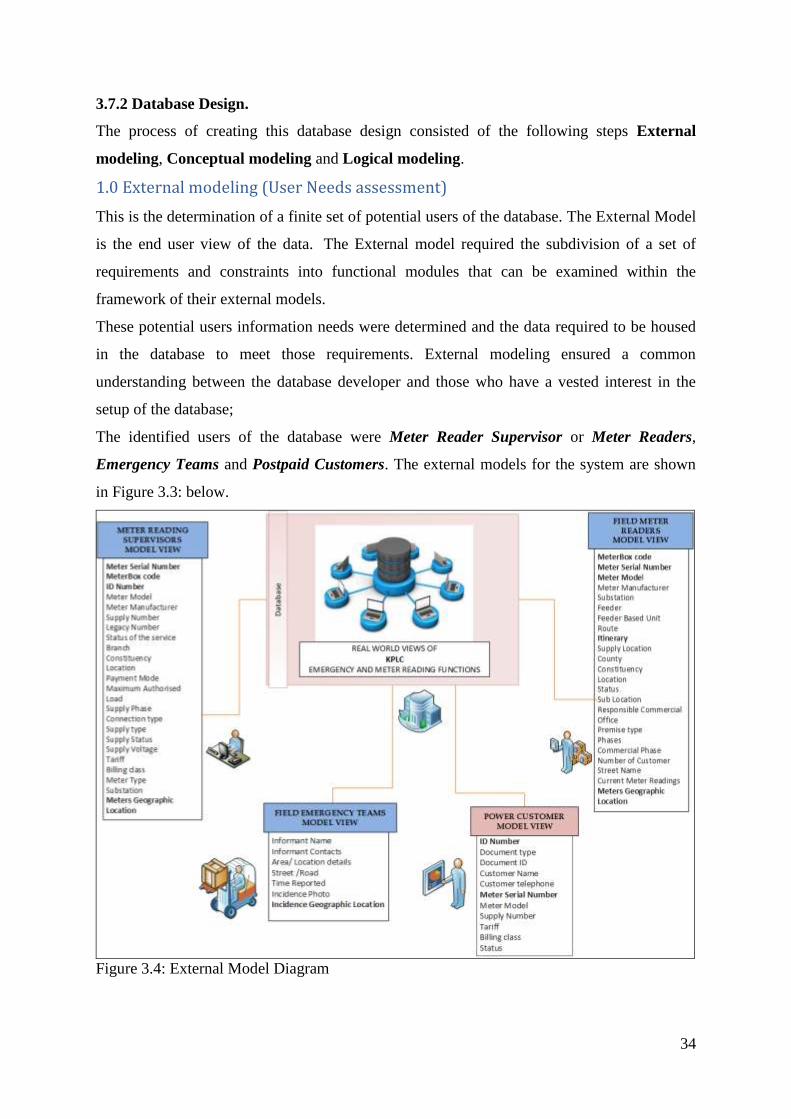
34
3.7.2 Database Design.
The process of creating this database design consisted of the following steps External
modeling, Conceptual modeling and Logical modeling.
1.0 External modeling (User Needs assessment)
This is the determination of a finite set of potential users of the database. The External Model
is the end user view of the data. The External model required the subdivision of a set of
requirements and constraints into functional modules that can be examined within the
framework of their external models.
These potential users information needs were determined and the data required to be housed
in the database to meet those requirements. External modeling ensured a common
understanding between the database developer and those who have a vested interest in the
setup of the database;
The identified users of the database were Meter Reader Supervisor or Meter Readers,
Emergency Teams and Postpaid Customers. The external models for the system are shown
in Figure 3.3: below.
Figure 3.4: External Model Diagram
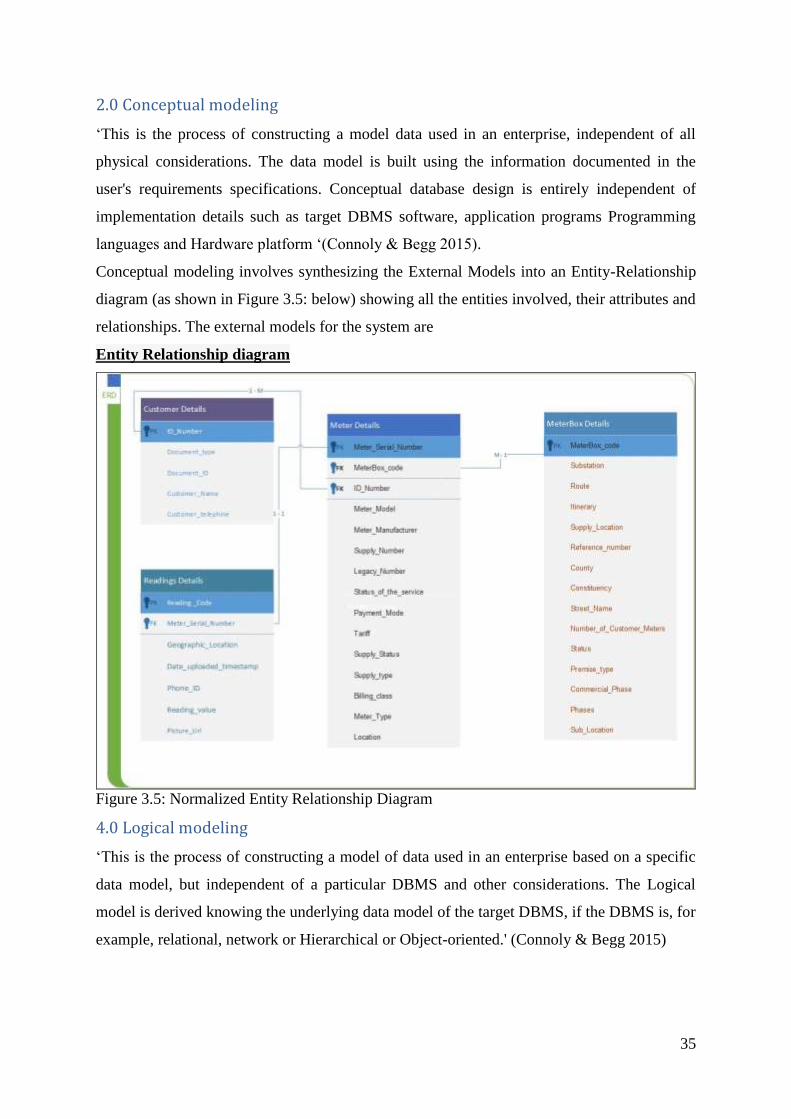
35
2.0 Conceptual modeling
‘This is the process of constructing a model data used in an enterprise, independent of all
physical considerations. The data model is built using the information documented in the
user's requirements specifications. Conceptual database design is entirely independent of
implementation details such as target DBMS software, application programs Programming
languages and Hardware platform ‘(Connoly & Begg 2015).
Conceptual modeling involves synthesizing the External Models into an Entity-Relationship
diagram (as shown in Figure 3.5: below) showing all the entities involved, their attributes and
relationships. The external models for the system are
Entity Relationship diagram
Figure 3.5: Normalized Entity Relationship Diagram
4.0 Logical modeling
‘This is the process of constructing a model of data used in an enterprise based on a specific
data model, but independent of a particular DBMS and other considerations. The Logical
model is derived knowing the underlying data model of the target DBMS, if the DBMS is, for
example, relational, network or Hierarchical or Object-oriented.' (Connoly & Begg 2015)
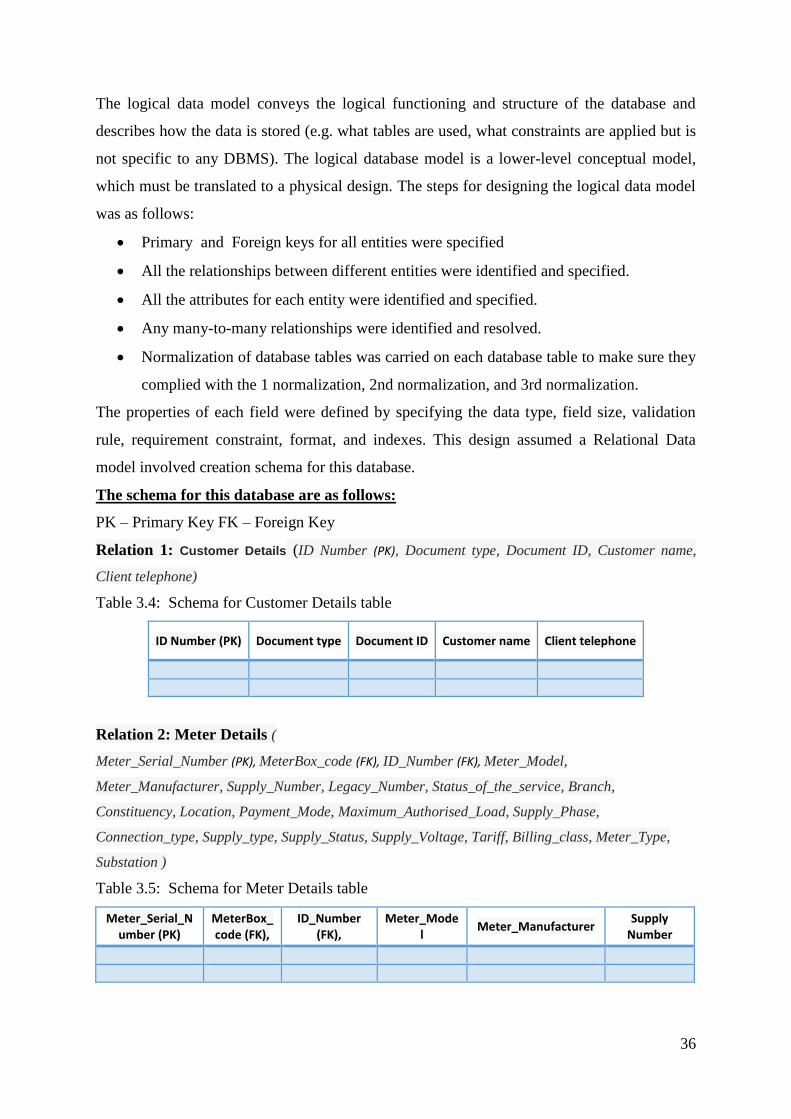
36
The logical data model conveys the logical functioning and structure of the database and
describes how the data is stored (e.g. what tables are used, what constraints are applied but is
not specific to any DBMS). The logical database model is a lower-level conceptual model,
which must be translated to a physical design. The steps for designing the logical data model
was as follows:
Primary and Foreign keys for all entities were specified
All the relationships between different entities were identified and specified.
All the attributes for each entity were identified and specified.
Any many-to-many relationships were identified and resolved.
Normalization of database tables was carried on each database table to make sure they
complied with the 1 normalization, 2nd normalization, and 3rd normalization.
The properties of each field were defined by specifying the data type, field size, validation
rule, requirement constraint, format, and indexes. This design assumed a Relational Data
model involved creation schema for this database.
The schema for this database are as follows:
PK – Primary Key FK – Foreign Key
Relation 1: Customer Details (ID Number (PK), Document type, Document ID, Customer name,
Client telephone)
Table 3.4: Schema for Customer Details table
ID Number (PK) Document type Document ID Customer name Client telephone
Relation 2: Meter Details (
Meter_Serial_Number (PK), MeterBox_code (FK), ID_Number (FK), Meter_Model,
Meter_Manufacturer, Supply_Number, Legacy_Number, Status_of_the_service, Branch,
Constituency, Location, Payment_Mode, Maximum_Authorised_Load, Supply_Phase,
Connection_type, Supply_type, Supply_Status, Supply_Voltage, Tariff, Billing_class, Meter_Type,
Substation )
Table 3.5: Schema for Meter Details table
Meter_Serial_Number (PK)
MeterBox_code (FK),
ID_Number (FK),
Meter_Model
Meter_Manufacturer Supply
Number
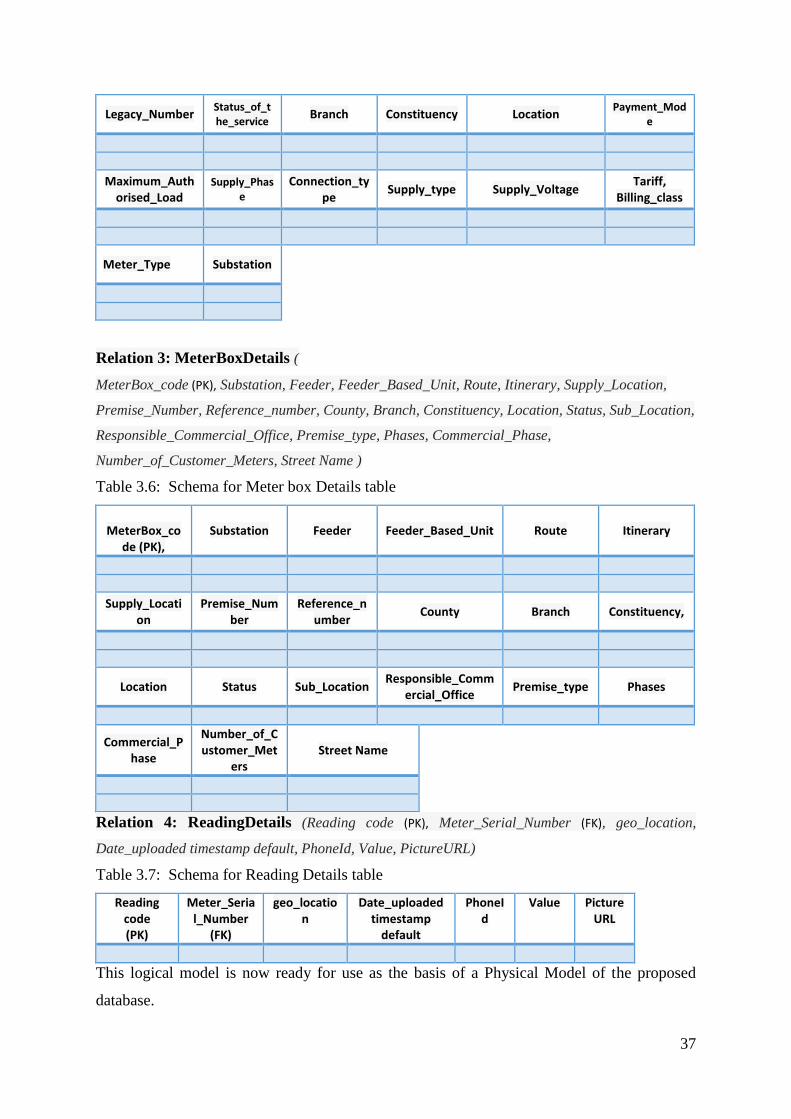
37
Legacy_Number Status_of_the_service
Branch Constituency Location Payment_Mod
e
Maximum_Authorised_Load
Supply_Phase
Connection_type
Supply_type Supply_Voltage Tariff,
Billing_class
Meter_Type Substation
Relation 3: MeterBoxDetails (
MeterBox_code (PK), Substation, Feeder, Feeder_Based_Unit, Route, Itinerary, Supply_Location,
Premise_Number, Reference_number, County, Branch, Constituency, Location, Status, Sub_Location,
Responsible_Commercial_Office, Premise_type, Phases, Commercial_Phase,
Number_of_Customer_Meters, Street Name )
Table 3.6: Schema for Meter box Details table
MeterBox_co
de (PK), Substation Feeder Feeder_Based_Unit Route Itinerary
Supply_Location
Premise_Number
Reference_number
County Branch Constituency,
Location Status Sub_Location Responsible_Comm
ercial_Office Premise_type Phases
Commercial_Phase
Number_of_Customer_Met
ers Street Name
Relation 4: ReadingDetails (Reading code (PK), Meter_Serial_Number (FK), geo_location,
Date_uploaded timestamp default, PhoneId, Value, PictureURL)
Table 3.7: Schema for Reading Details table
Reading code (PK)
Meter_Serial_Number
(FK)
geo_location
Date_uploaded timestamp
default
PhoneId
Value PictureURL
This logical model is now ready for use as the basis of a Physical Model of the proposed
database.
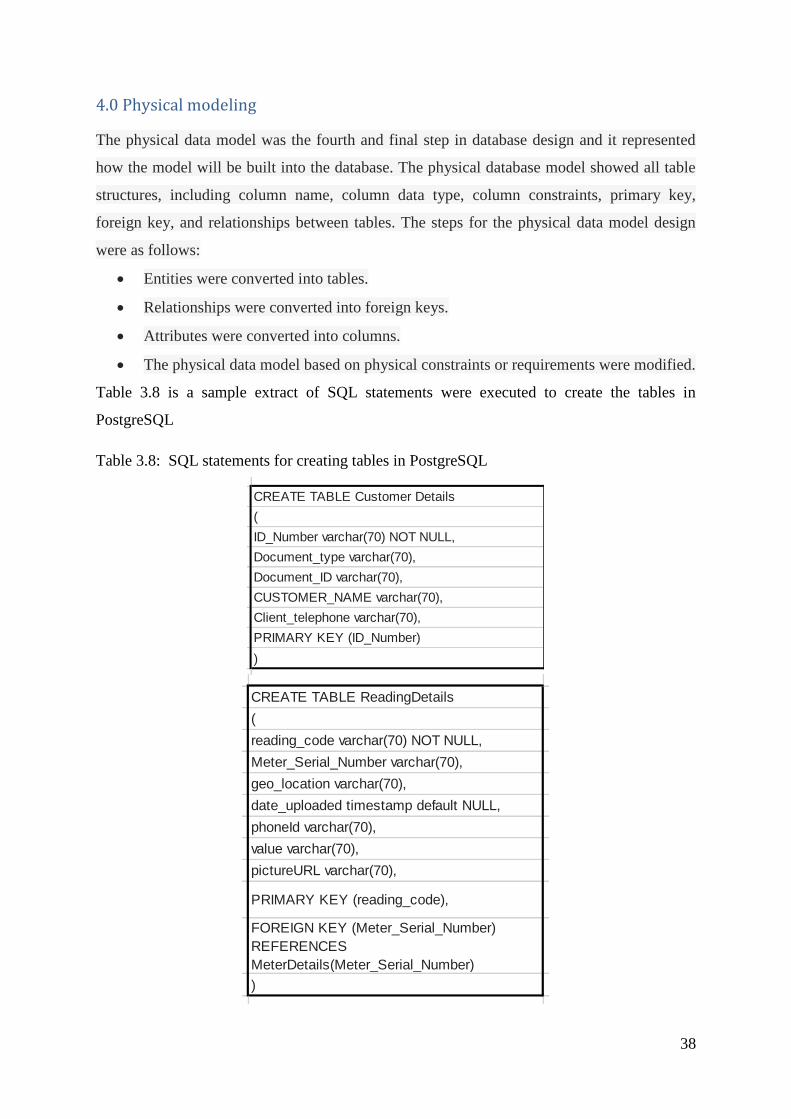
38
4.0 Physical modeling
The physical data model was the fourth and final step in database design and it represented
how the model will be built into the database. The physical database model showed all table
structures, including column name, column data type, column constraints, primary key,
foreign key, and relationships between tables. The steps for the physical data model design
were as follows:
Entities were converted into tables.
Relationships were converted into foreign keys.
Attributes were converted into columns.
The physical data model based on physical constraints or requirements were modified.
Table 3.8 is a sample extract of SQL statements were executed to create the tables in
PostgreSQL
Table 3.8: SQL statements for creating tables in PostgreSQL
CREATE TABLE Customer Details CREATE TABLE MeterBoxDetails
( (
ID_Number varchar(70) NOT NULL, MeterBox_code varchar(70) NOT NULL,
Document_type varchar(70), Substation varchar(70),
Document_ID varchar(70), Feeder varchar(70),
CUSTOMER_NAME varchar(70), Feeder_Based_Unit varchar(70),
Client_telephone varchar(70), Route varchar(70),
PRIMARY KEY (ID_Number) Itinerary varchar(70),
) Supply_Location varchar(70),
Premise_Number varchar(70),
CREATE TABLE MeterDetails Reference_number varchar(70),
( County varchar(70),
Meter_Serial_Number varchar(70) NOT NULL, Branch varchar(70),
MeterBox_code varchar(70), Constituency varchar(70),
ID_Number varchar(70) , Location varchar(70),
Meter_Model varchar(70), Status varchar(70),
Meter_Manufacturer varchar(70), Sub_Location varchar(70),
Supply_Number varchar(70), Responsible_Commercial_Office varchar(70),
Legacy_Number varchar(70), Premise_type varchar(70),
Status_of_the_service varchar(70), Phases varchar(70),
Branch varchar(70), Commercial_Phase varchar(70),
Constituency varchar(70), Number_of_Customer_Meters varchar(70),
Location varchar(70), Street_Name varchar(70),
Payment_Mode varchar(70), PRIMARY KEY (MeterBox_code)
Maximum_Authorised_Load varchar(70), )
Supply_Phase varchar(70),
Connection_type varchar(70), CREATE TABLE ReadingDetails
Supply_type varchar(70), (
Supply_Status varchar(70), reading_code varchar(70) NOT NULL,
Supply_Voltage varchar(70), Meter_Serial_Number varchar(70),
Tariff varchar(70), geo_location varchar(70),
Billing_class varchar(70), date_uploaded timestamp default NULL,
Meter_Type varchar(70), phoneId varchar(70),
Substation varchar(70), value varchar(70),
PRIMARY KEY (Meter_Serial_Number), pictureURL varchar(70),
FOREIGN KEY (ID_Number) REFERENCES
CustomerDetails(ID_Number),PRIMARY KEY (reading_code),
FOREIGN KEY (MeterBox_code) REFERENCES
MeterBoxDetails(MeterBox_code)
FOREIGN KEY (Meter_Serial_Number)
REFERENCES
MeterDetails(Meter_Serial_Number)
) )
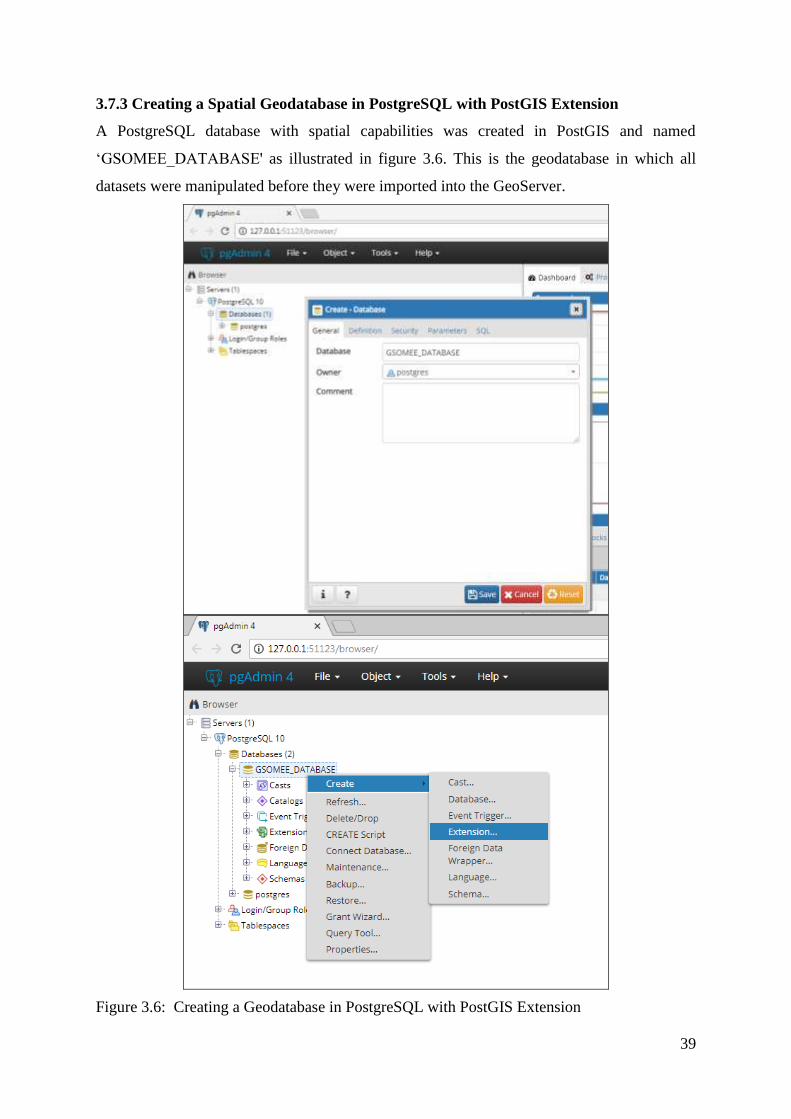
39
3.7.3 Creating a Spatial Geodatabase in PostgreSQL with PostGIS Extension
A PostgreSQL database with spatial capabilities was created in PostGIS and named
‘GSOMEE_DATABASE' as illustrated in figure 3.6. This is the geodatabase in which all
datasets were manipulated before they were imported into the GeoServer.
Figure 3.6: Creating a Geodatabase in PostgreSQL with PostGIS Extension
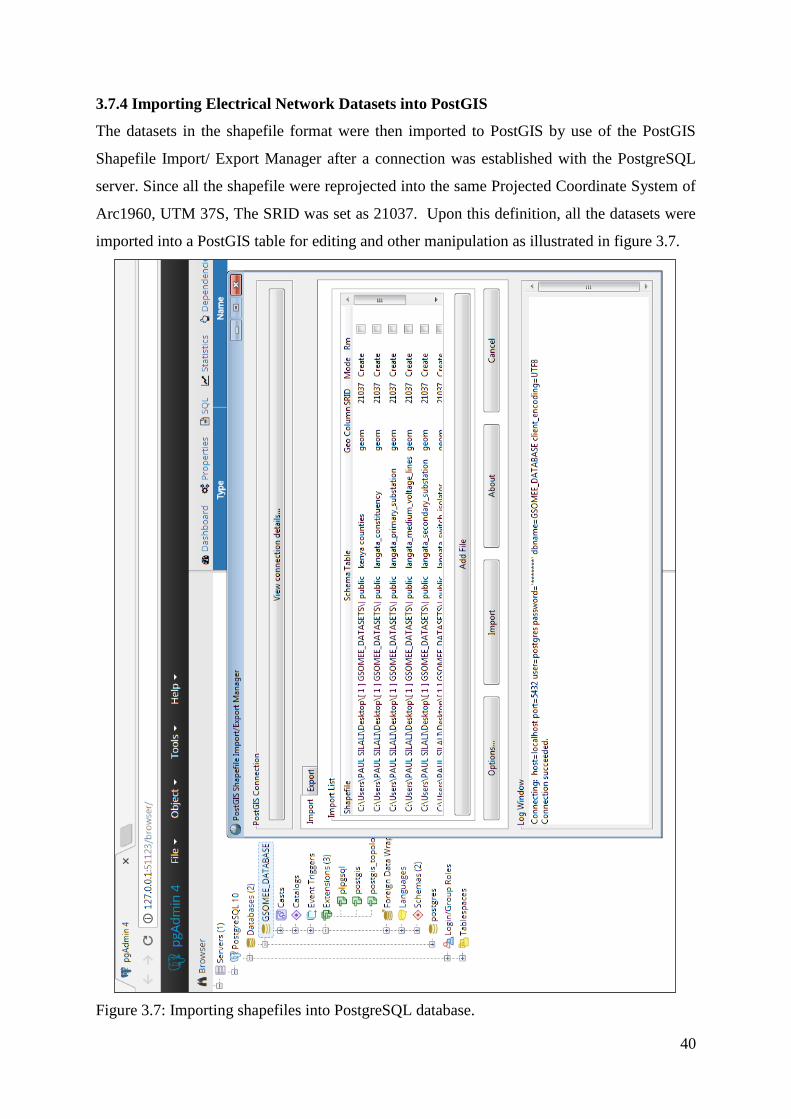
40
3.7.4 Importing Electrical Network Datasets into PostGIS
The datasets in the shapefile format were then imported to PostGIS by use of the PostGIS
Shapefile Import/ Export Manager after a connection was established with the PostgreSQL
server. Since all the shapefile were reprojected into the same Projected Coordinate System of
Arc1960, UTM 37S, The SRID was set as 21037. Upon this definition, all the datasets were
imported into a PostGIS table for editing and other manipulation as illustrated in figure 3.7.
Figure 3.7: Importing shapefiles into PostgreSQL database.
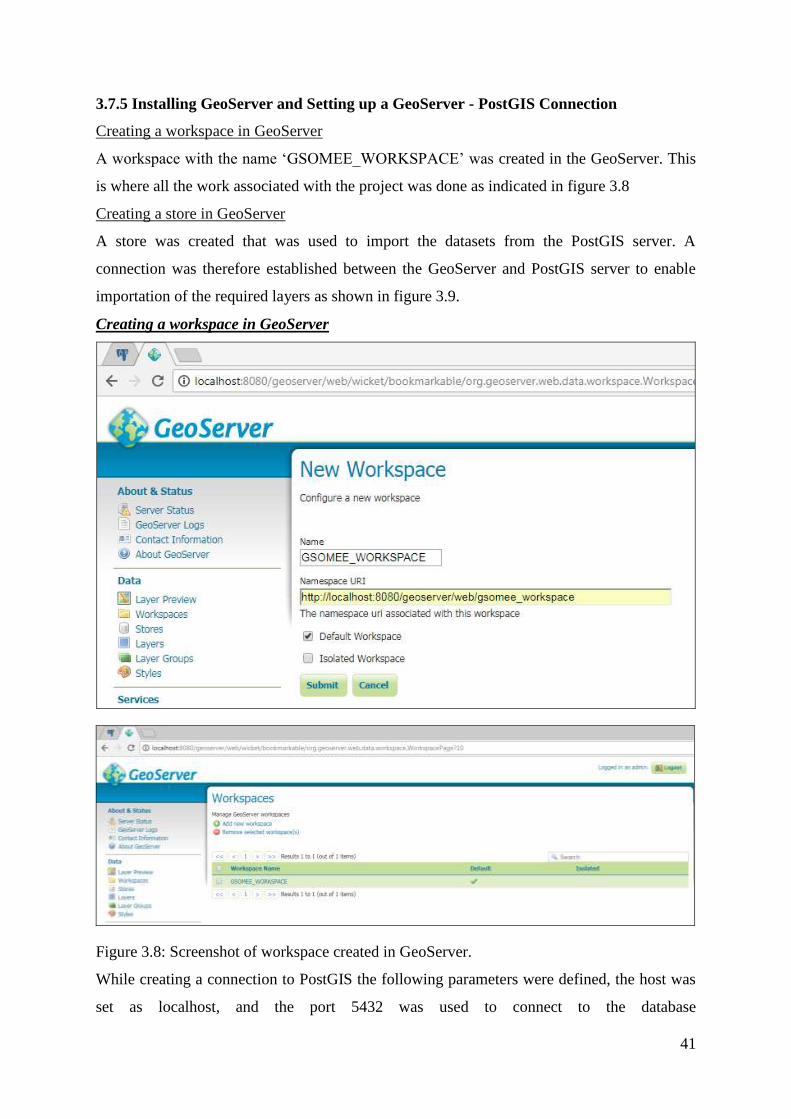
41
3.7.5 Installing GeoServer and Setting up a GeoServer - PostGIS Connection
Creating a workspace in GeoServer
A workspace with the name ‘GSOMEE_WORKSPACE’ was created in the GeoServer. This
is where all the work associated with the project was done as indicated in figure 3.8
Creating a store in GeoServer
A store was created that was used to import the datasets from the PostGIS server. A
connection was therefore established between the GeoServer and PostGIS server to enable
importation of the required layers as shown in figure 3.9.
Creating a workspace in GeoServer
Figure 3.8: Screenshot of workspace created in GeoServer.
While creating a connection to PostGIS the following parameters were defined, the host was
set as localhost, and the port 5432 was used to connect to the database
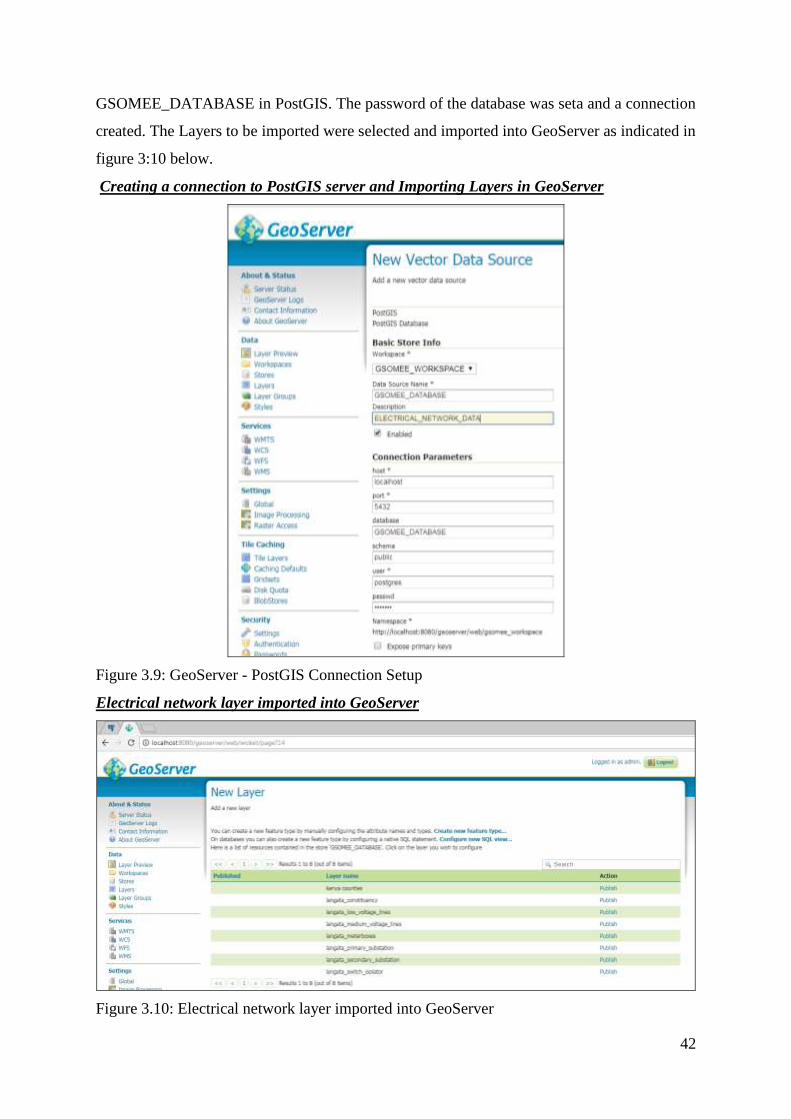
42
GSOMEE_DATABASE in PostGIS. The password of the database was seta and a connection
created. The Layers to be imported were selected and imported into GeoServer as indicated in
figure 3:10 below.
Creating a connection to PostGIS server and Importing Layers in GeoServer
Figure 3.9: GeoServer - PostGIS Connection Setup
Electrical network layer imported into GeoServer
Figure 3.10: Electrical network layer imported into GeoServer
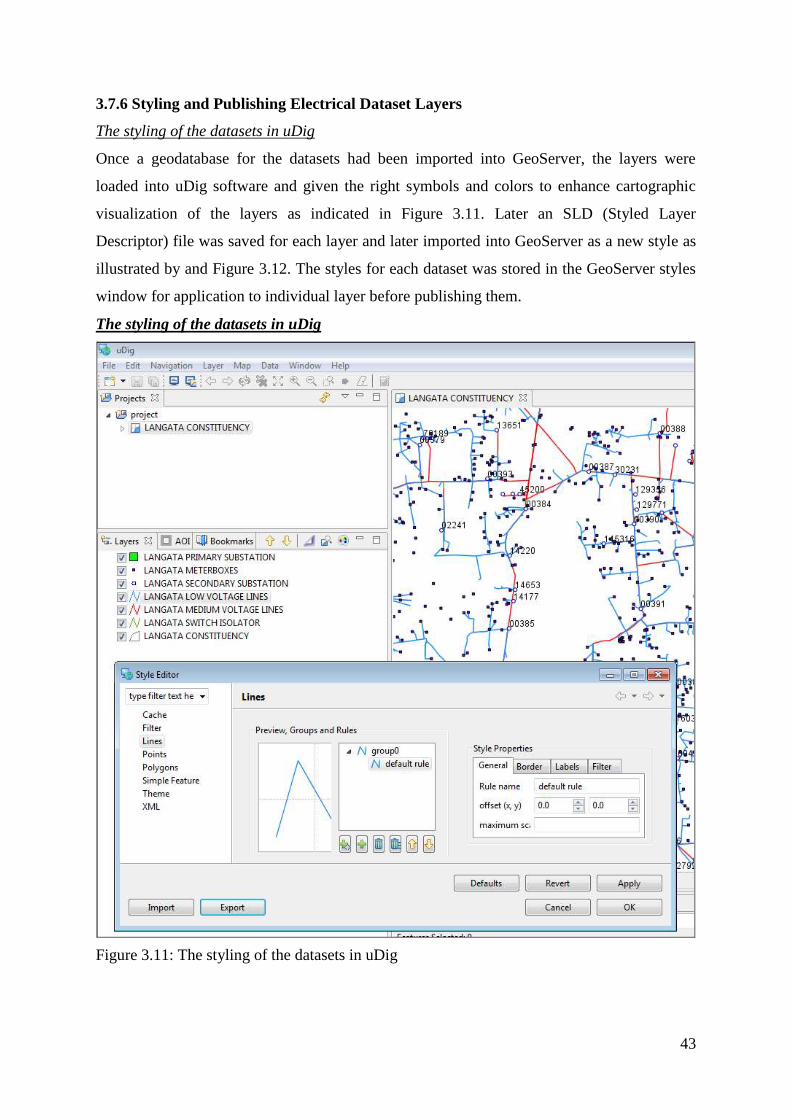
43
3.7.6 Styling and Publishing Electrical Dataset Layers
The styling of the datasets in uDig
Once a geodatabase for the datasets had been imported into GeoServer, the layers were
loaded into uDig software and given the right symbols and colors to enhance cartographic
visualization of the layers as indicated in Figure 3.11. Later an SLD (Styled Layer
Descriptor) file was saved for each layer and later imported into GeoServer as a new style as
illustrated by and Figure 3.12. The styles for each dataset was stored in the GeoServer styles
window for application to individual layer before publishing them.
The styling of the datasets in uDig
Figure 3.11: The styling of the datasets in uDig
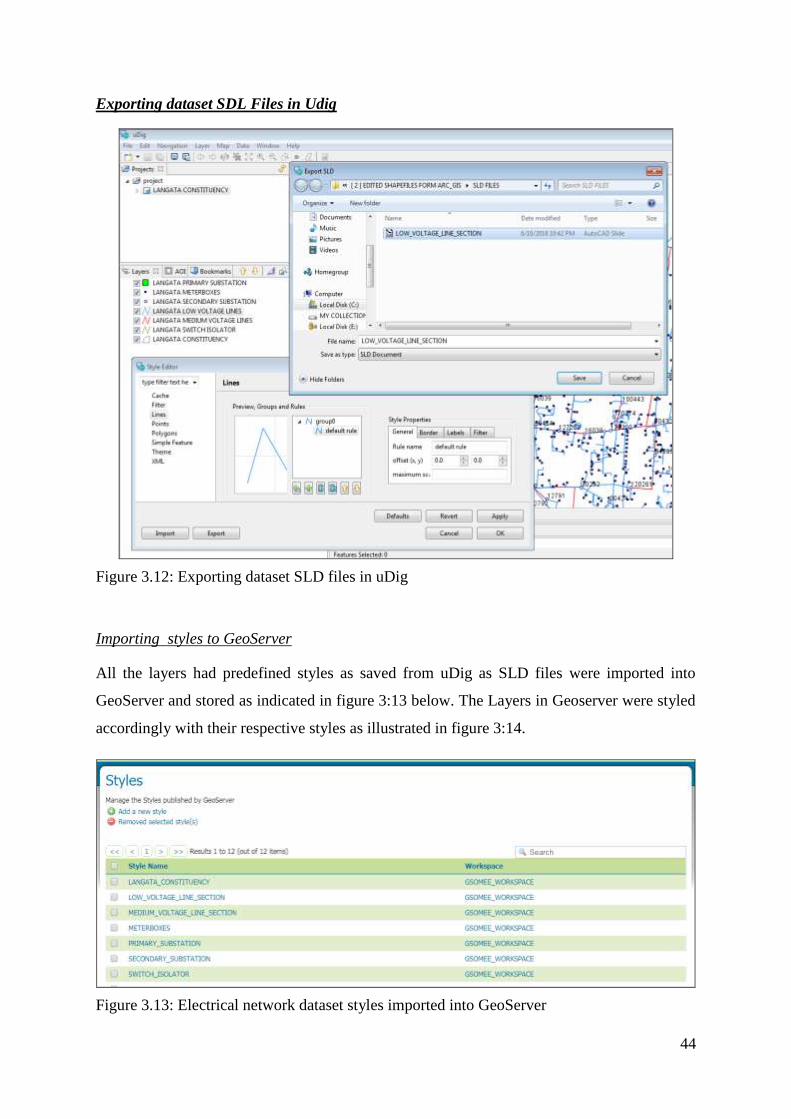
44
Exporting dataset SDL Files in Udig
Figure 3.12: Exporting dataset SLD files in uDig
Importing styles to GeoServer
All the layers had predefined styles as saved from uDig as SLD files were imported into
GeoServer and stored as indicated in figure 3:13 below. The Layers in Geoserver were styled
accordingly with their respective styles as illustrated in figure 3:14.
Figure 3.13: Electrical network dataset styles imported into GeoServer
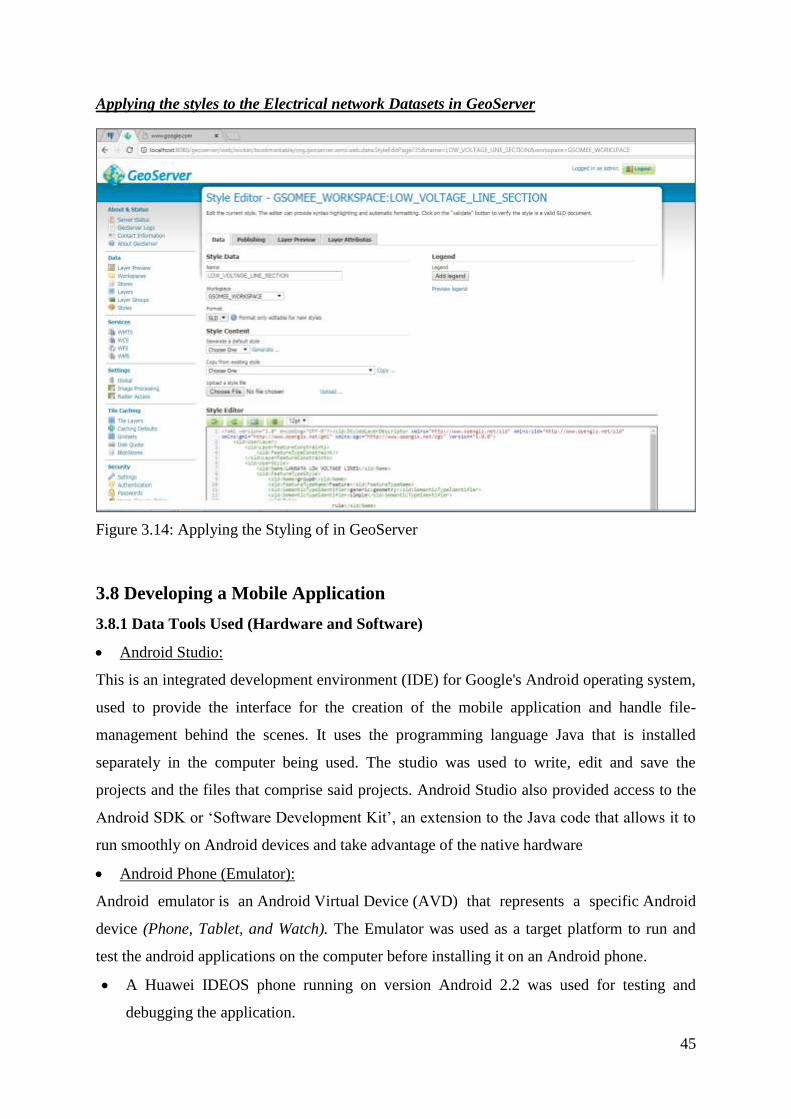
45
Applying the styles to the Electrical network Datasets in GeoServer
Figure 3.14: Applying the Styling of in GeoServer
3.8 Developing a Mobile Application
3.8.1 Data Tools Used (Hardware and Software)
Android Studio:
This is an integrated development environment (IDE) for Google's Android operating system,
used to provide the interface for the creation of the mobile application and handle file-
management behind the scenes. It uses the programming language Java that is installed
separately in the computer being used. The studio was used to write, edit and save the
projects and the files that comprise said projects. Android Studio also provided access to the
Android SDK or ‘Software Development Kit’, an extension to the Java code that allows it to
run smoothly on Android devices and take advantage of the native hardware
Android Phone (Emulator):
Android emulator is an Android Virtual Device (AVD) that represents a specific Android
device (Phone, Tablet, and Watch). The Emulator was used as a target platform to run and
test the android applications on the computer before installing it on an Android phone.
A Huawei IDEOS phone running on version Android 2.2 was used for testing and
debugging the application.
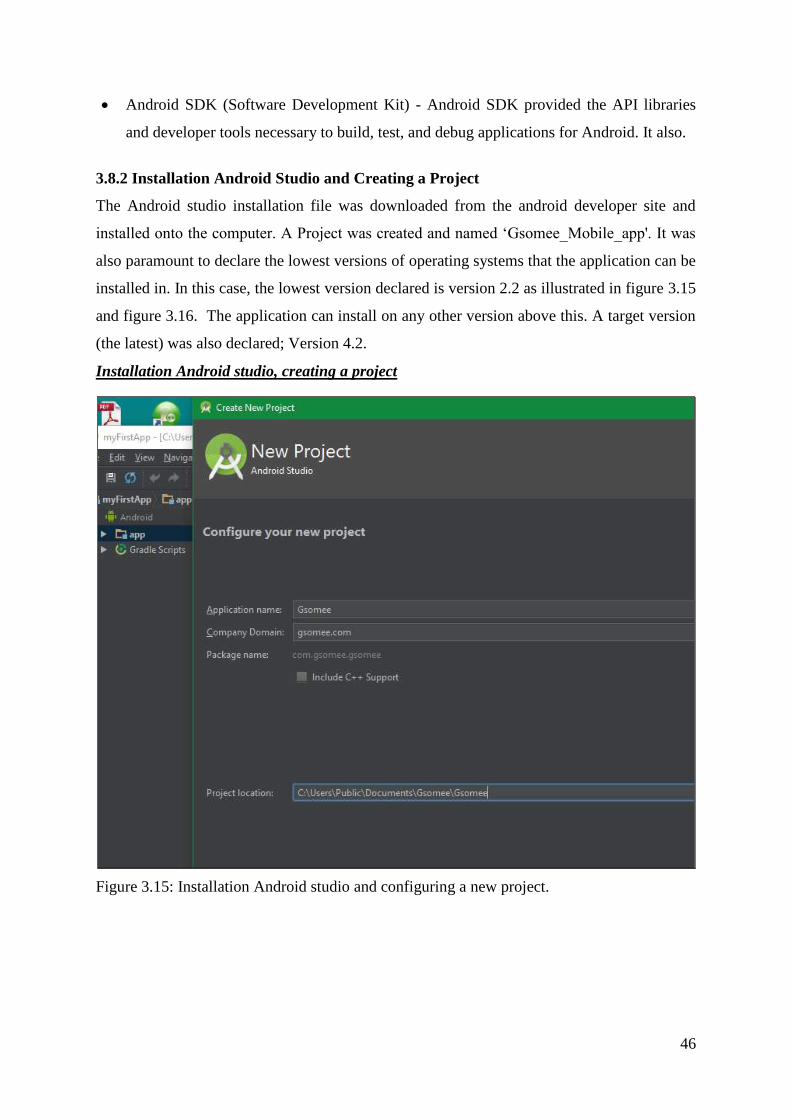
46
Android SDK (Software Development Kit) - Android SDK provided the API libraries
and developer tools necessary to build, test, and debug applications for Android. It also.
3.8.2 Installation Android Studio and Creating a Project
The Android studio installation file was downloaded from the android developer site and
installed onto the computer. A Project was created and named ‘Gsomee_Mobile_app'. It was
also paramount to declare the lowest versions of operating systems that the application can be
installed in. In this case, the lowest version declared is version 2.2 as illustrated in figure 3.15
and figure 3.16. The application can install on any other version above this. A target version
(the latest) was also declared; Version 4.2.
Installation Android studio, creating a project
Figure 3.15: Installation Android studio and configuring a new project.
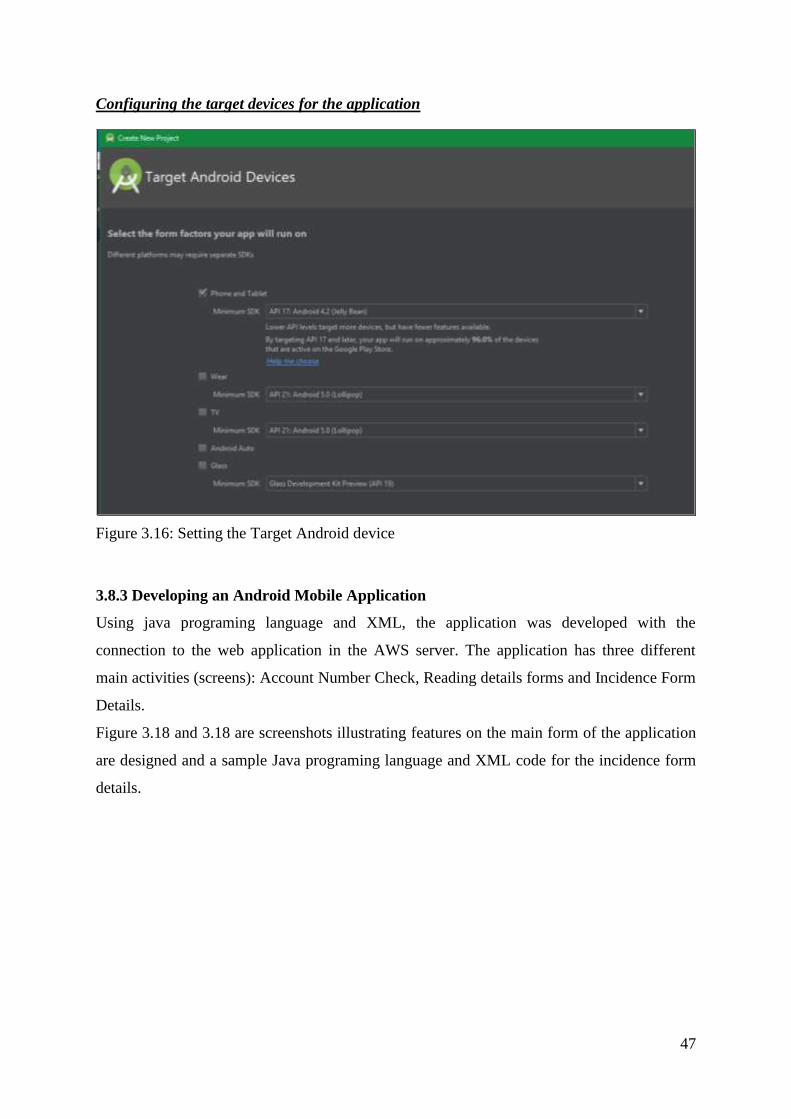
47
Configuring the target devices for the application
Figure 3.16: Setting the Target Android device
3.8.3 Developing an Android Mobile Application
Using java programing language and XML, the application was developed with the
connection to the web application in the AWS server. The application has three different
main activities (screens): Account Number Check, Reading details forms and Incidence Form
Details.
Figure 3.18 and 3.18 are screenshots illustrating features on the main form of the application
are designed and a sample Java programing language and XML code for the incidence form
details.
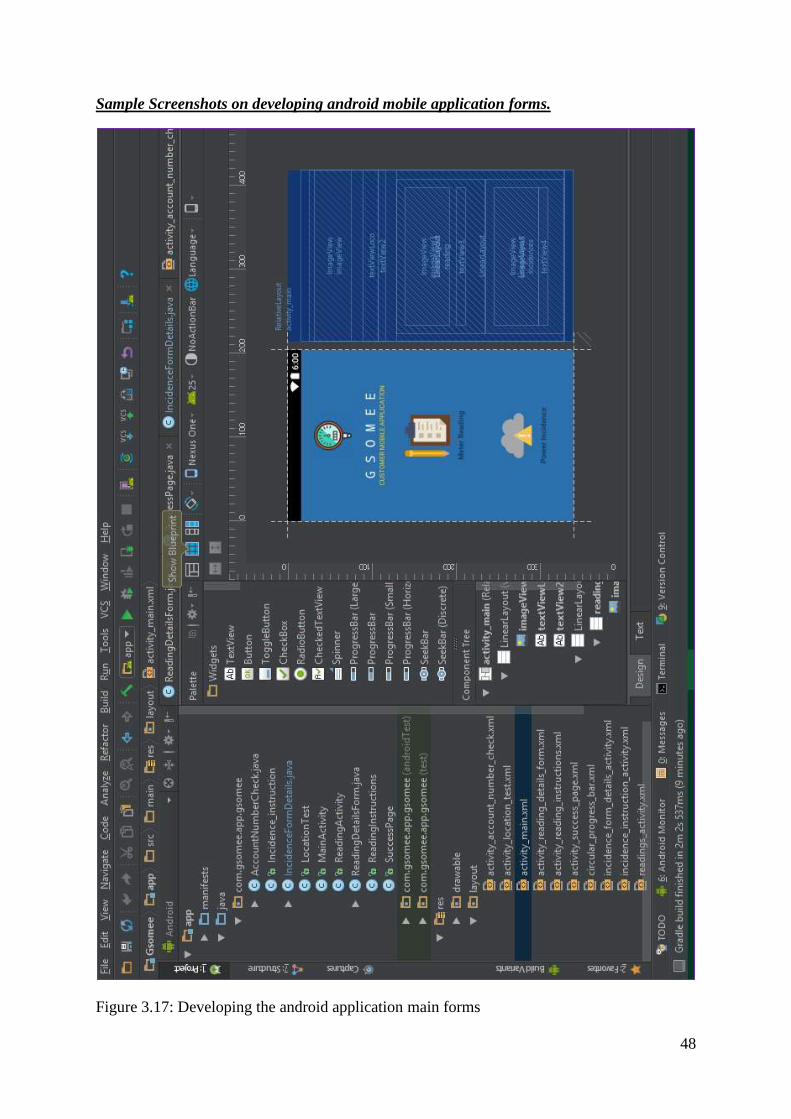
48
Sample Screenshots on developing android mobile application forms.
Figure 3.17: Developing the android application main forms
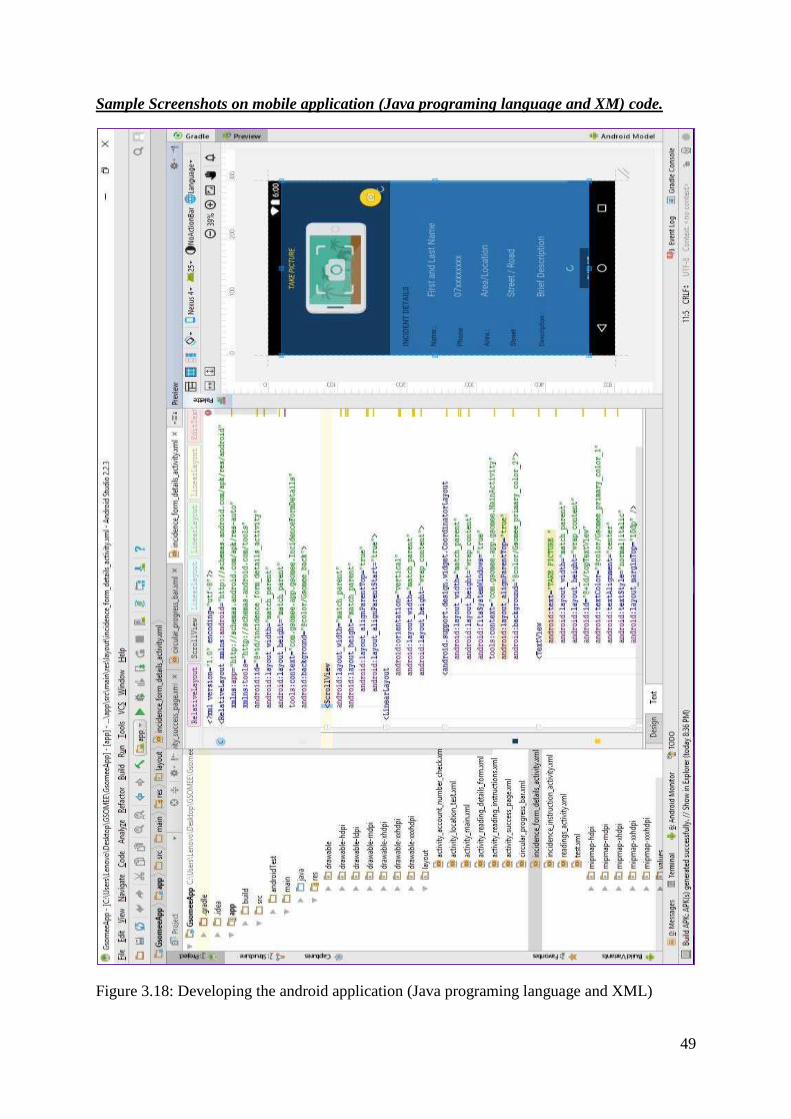
49
Sample Screenshots on mobile application (Java programing language and XM) code.
Figure 3.18: Developing the android application (Java programing language and XML)
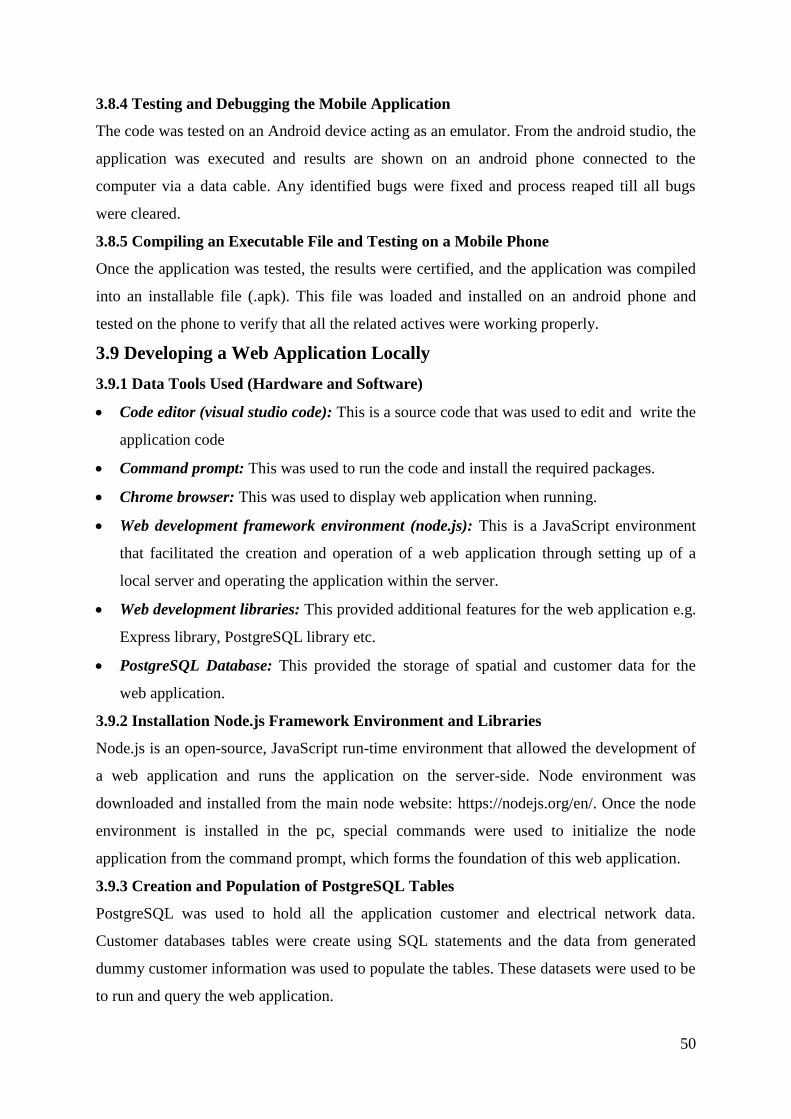
50
3.8.4 Testing and Debugging the Mobile Application
The code was tested on an Android device acting as an emulator. From the android studio, the
application was executed and results are shown on an android phone connected to the
computer via a data cable. Any identified bugs were fixed and process reaped till all bugs
were cleared.
3.8.5 Compiling an Executable File and Testing on a Mobile Phone
Once the application was tested, the results were certified, and the application was compiled
into an installable file (.apk). This file was loaded and installed on an android phone and
tested on the phone to verify that all the related actives were working properly.
3.9 Developing a Web Application Locally
3.9.1 Data Tools Used (Hardware and Software)
Code editor (visual studio code): This is a source code that was used to edit and write the
application code
Command prompt: This was used to run the code and install the required packages.
Chrome browser: This was used to display web application when running.
Web development framework environment (node.js): This is a JavaScript environment
that facilitated the creation and operation of a web application through setting up of a
local server and operating the application within the server.
Web development libraries: This provided additional features for the web application e.g.
Express library, PostgreSQL library etc.
PostgreSQL Database: This provided the storage of spatial and customer data for the
web application.
3.9.2 Installation Node.js Framework Environment and Libraries
Node.js is an open-source, JavaScript run-time environment that allowed the development of
a web application and runs the application on the server-side. Node environment was
downloaded and installed from the main node website: https://nodejs.org/en/. Once the node
environment is installed in the pc, special commands were used to initialize the node
application from the command prompt, which forms the foundation of this web application.
3.9.3 Creation and Population of PostgreSQL Tables
PostgreSQL was used to hold all the application customer and electrical network data.
Customer databases tables were create using SQL statements and the data from generated
dummy customer information was used to populate the tables. These datasets were used to be
to run and query the web application.
51
3.9.4 Coding of the Web Application
The application was developed using the following scripting and programming languages
libraries and tools: HTML, JavaScript, OpenLayers, PostgreSQL, and PostGIS. Figure
3.19: shows the web-service architecture that was adopted to facilitate the client and server-
side scripting.
Figure 3.19: Web Service schema
Programming of the web application required back-end (server-side) features which included
connecting to PostgreSQL database using the installed libraries and development of the
applications Business Logic. For the Front-end (client-side), the user interface was designed
and coded based on HTML and JavaScript. Specific pages in the client-side which had map
were connected to the GeoServer to display certain layers onto the maps. All the coding was
done with visual studio code editor and uploaded to an online code storage application called
repositories.
Visual Studio code editor was used to edit the application code in both HTML and
JavaScript. Figure 3:20 is a screenshot of part of the code used to develop the application.
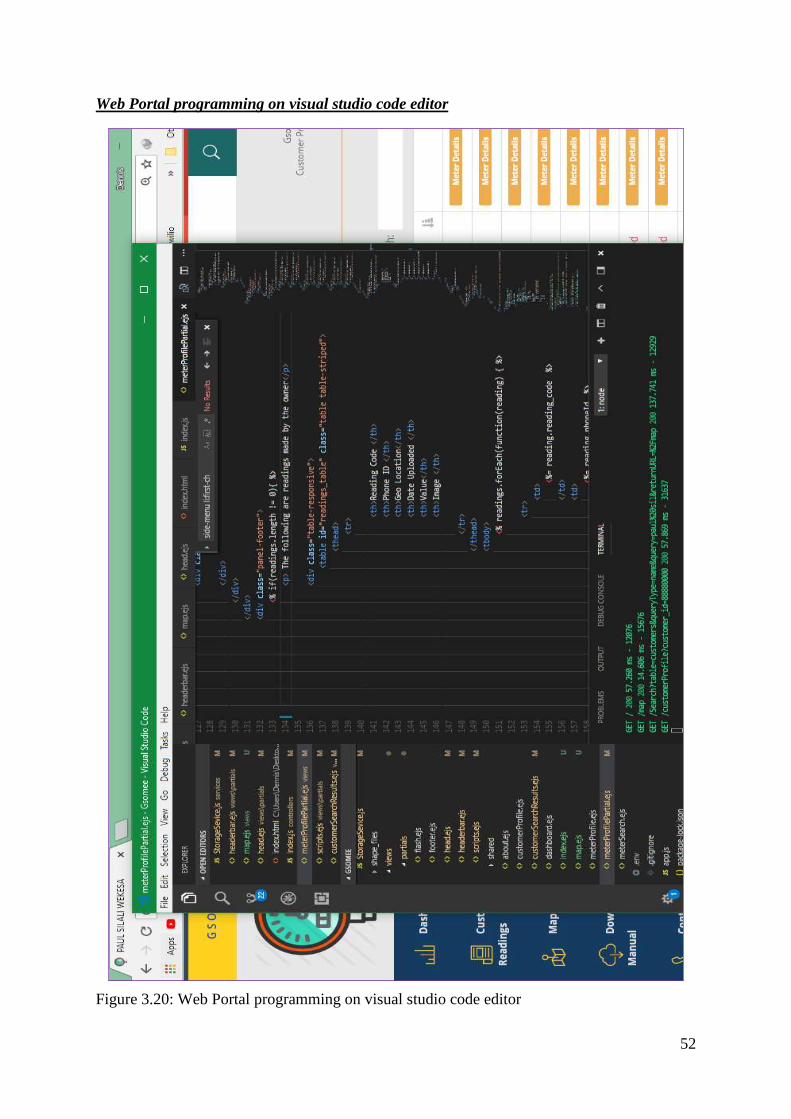
52
Web Portal programming on visual studio code editor
Figure 3.20: Web Portal programming on visual studio code editor
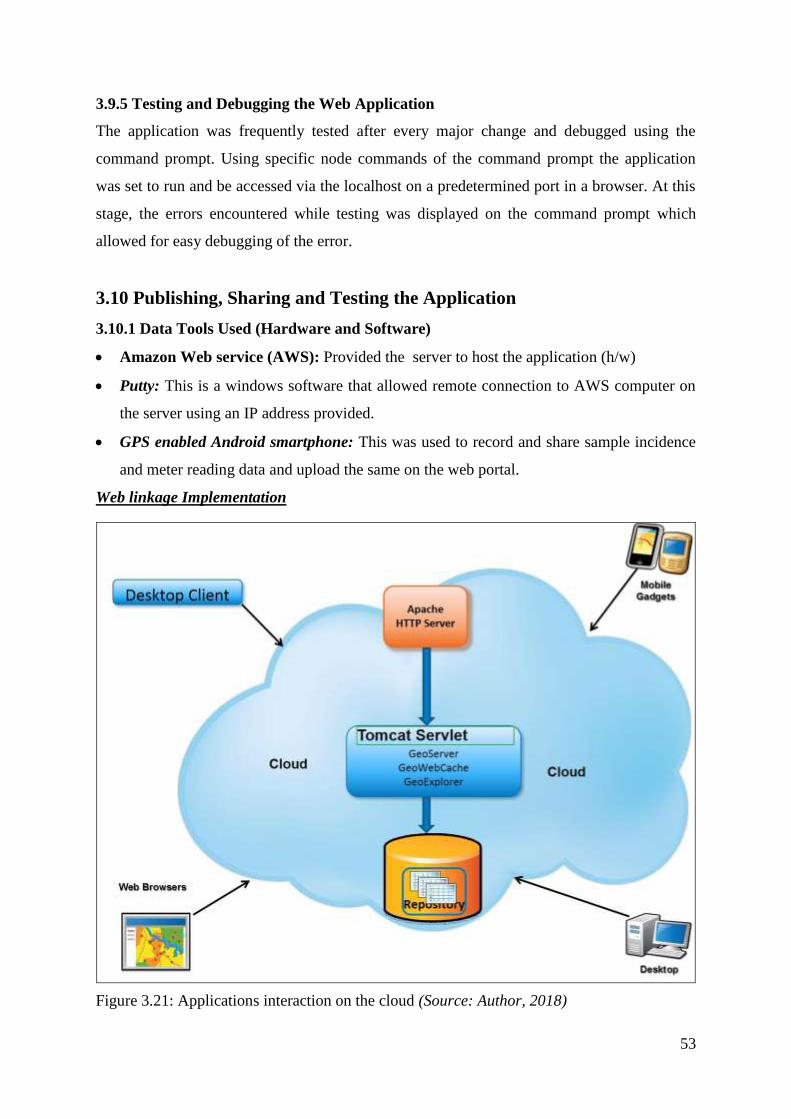
53
3.9.5 Testing and Debugging the Web Application
The application was frequently tested after every major change and debugged using the
command prompt. Using specific node commands of the command prompt the application
was set to run and be accessed via the localhost on a predetermined port in a browser. At this
stage, the errors encountered while testing was displayed on the command prompt which
allowed for easy debugging of the error.
3.10 Publishing, Sharing and Testing the Application
3.10.1 Data Tools Used (Hardware and Software)
Amazon Web service (AWS): Provided the server to host the application (h/w)
Putty: This is a windows software that allowed remote connection to AWS computer on
the server using an IP address provided.
GPS enabled Android smartphone: This was used to record and share sample incidence
and meter reading data and upload the same on the web portal.
Web linkage Implementation
Figure 3.21: Applications interaction on the cloud (Source: Author, 2018)
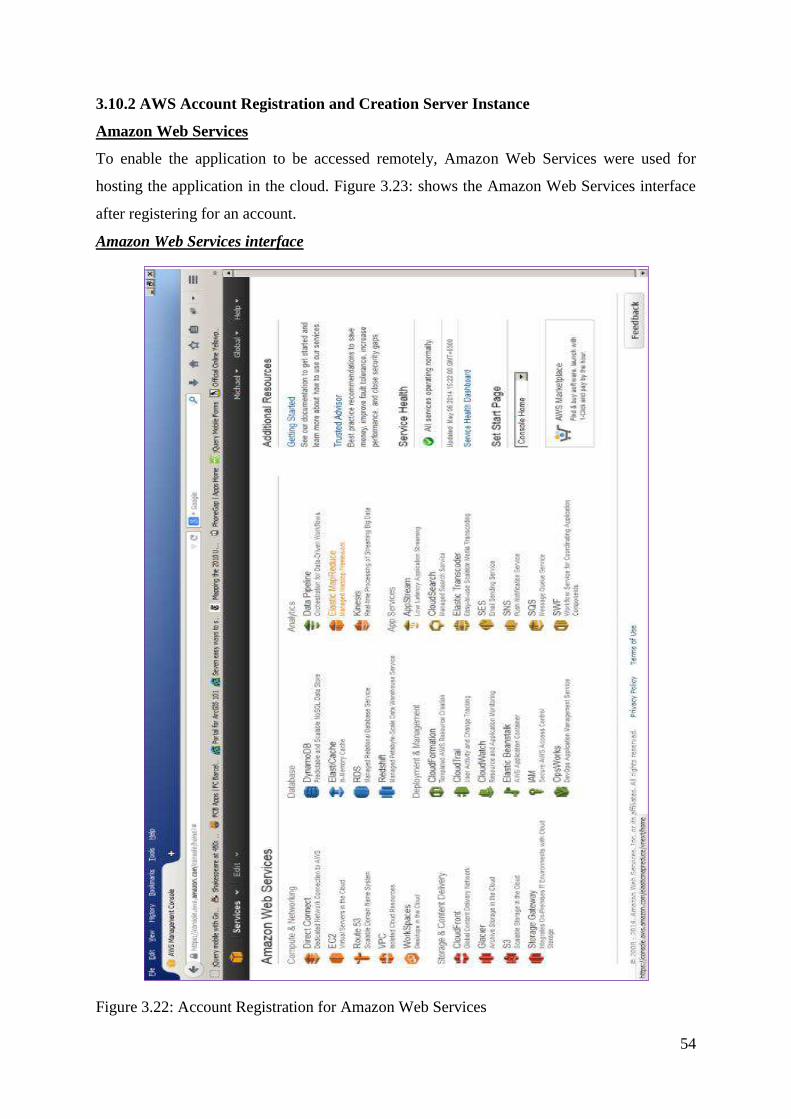
54
3.10.2 AWS Account Registration and Creation Server Instance
Amazon Web Services
To enable the application to be accessed remotely, Amazon Web Services were used for
hosting the application in the cloud. Figure 3.23: shows the Amazon Web Services interface
after registering for an account.
Amazon Web Services interface
Figure 3.22: Account Registration for Amazon Web Services
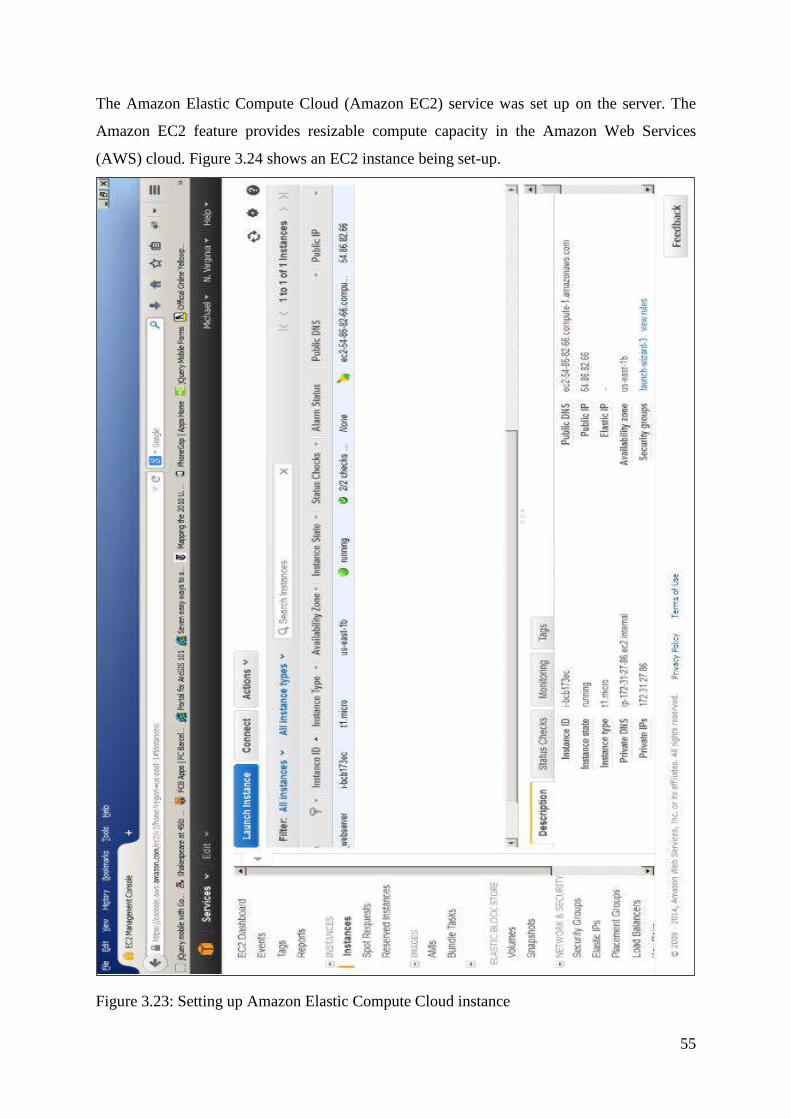
55
The Amazon Elastic Compute Cloud (Amazon EC2) service was set up on the server. The
Amazon EC2 feature provides resizable compute capacity in the Amazon Web Services
(AWS) cloud. Figure 3.24 shows an EC2 instance being set-up.
Figure 3.23: Setting up Amazon Elastic Compute Cloud instance
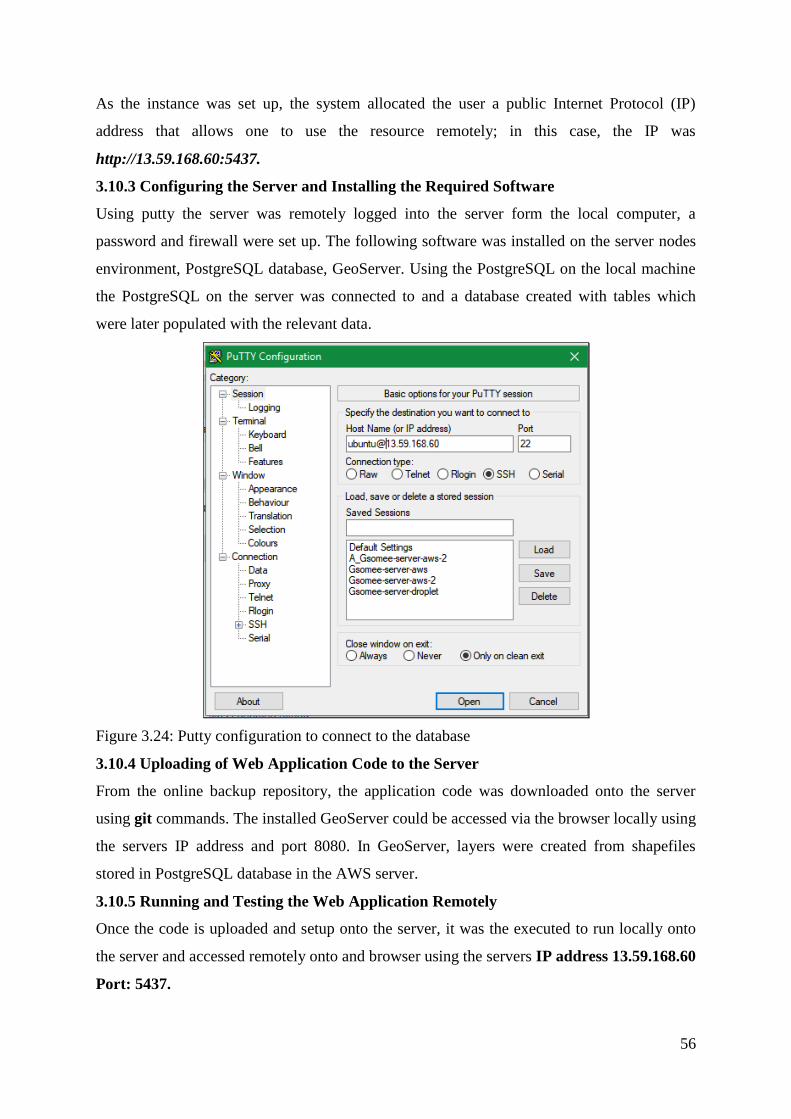
56
As the instance was set up, the system allocated the user a public Internet Protocol (IP)
address that allows one to use the resource remotely; in this case, the IP was
http://13.59.168.60:5437.
3.10.3 Configuring the Server and Installing the Required Software
Using putty the server was remotely logged into the server form the local computer, a
password and firewall were set up. The following software was installed on the server nodes
environment, PostgreSQL database, GeoServer. Using the PostgreSQL on the local machine
the PostgreSQL on the server was connected to and a database created with tables which
were later populated with the relevant data.
Figure 3.24: Putty configuration to connect to the database
3.10.4 Uploading of Web Application Code to the Server
From the online backup repository, the application code was downloaded onto the server
using git commands. The installed GeoServer could be accessed via the browser locally using
the servers IP address and port 8080. In GeoServer, layers were created from shapefiles
stored in PostgreSQL database in the AWS server.
3.10.5 Running and Testing the Web Application Remotely
Once the code is uploaded and setup onto the server, it was the executed to run locally onto
the server and accessed remotely onto and browser using the servers IP address 13.59.168.60
Port: 5437.
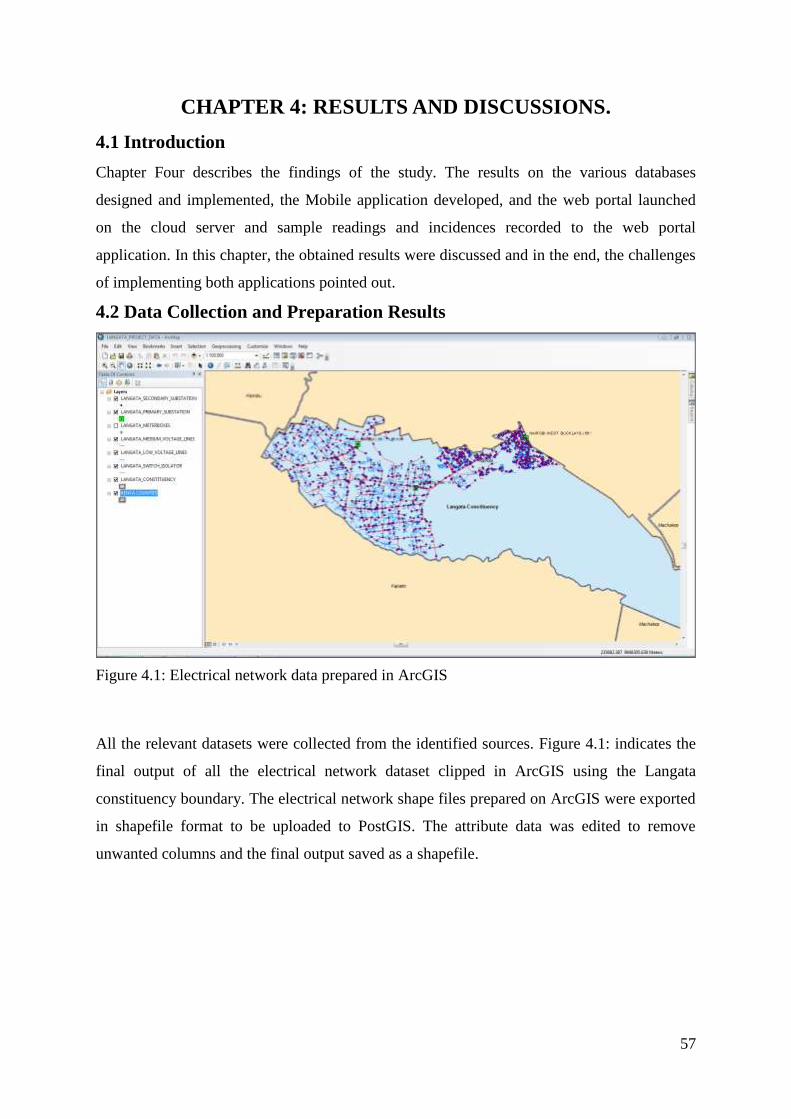
57
CHAPTER 4: RESULTS AND DISCUSSIONS.
4.1 Introduction
Chapter Four describes the findings of the study. The results on the various databases
designed and implemented, the Mobile application developed, and the web portal launched
on the cloud server and sample readings and incidences recorded to the web portal
application. In this chapter, the obtained results were discussed and in the end, the challenges
of implementing both applications pointed out.
4.2 Data Collection and Preparation Results
Figure 4.1: Electrical network data prepared in ArcGIS
All the relevant datasets were collected from the identified sources. Figure 4.1: indicates the
final output of all the electrical network dataset clipped in ArcGIS using the Langata
constituency boundary. The electrical network shape files prepared on ArcGIS were exported
in shapefile format to be uploaded to PostGIS. The attribute data was edited to remove
unwanted columns and the final output saved as a shapefile.
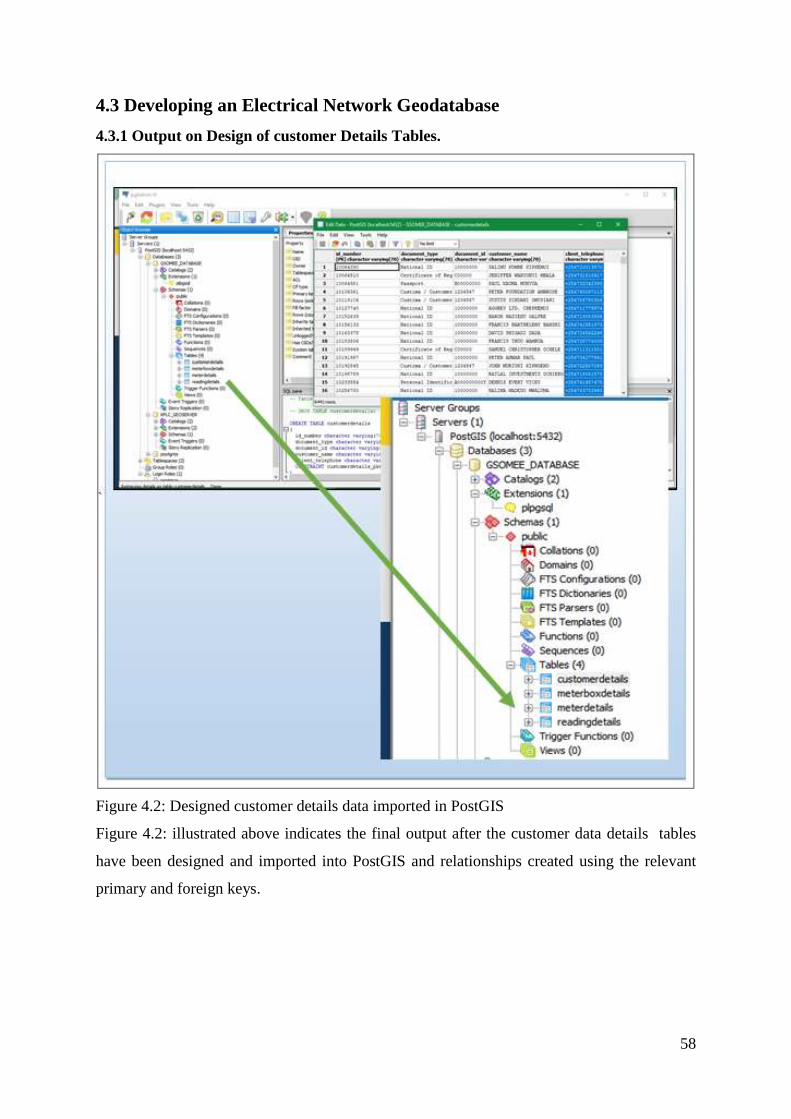
58
4.3 Developing an Electrical Network Geodatabase
4.3.1 Output on Design of customer Details Tables.
Figure 4.2: Designed customer details data imported in PostGIS
Figure 4.2: illustrated above indicates the final output after the customer data details tables
have been designed and imported into PostGIS and relationships created using the relevant
primary and foreign keys.
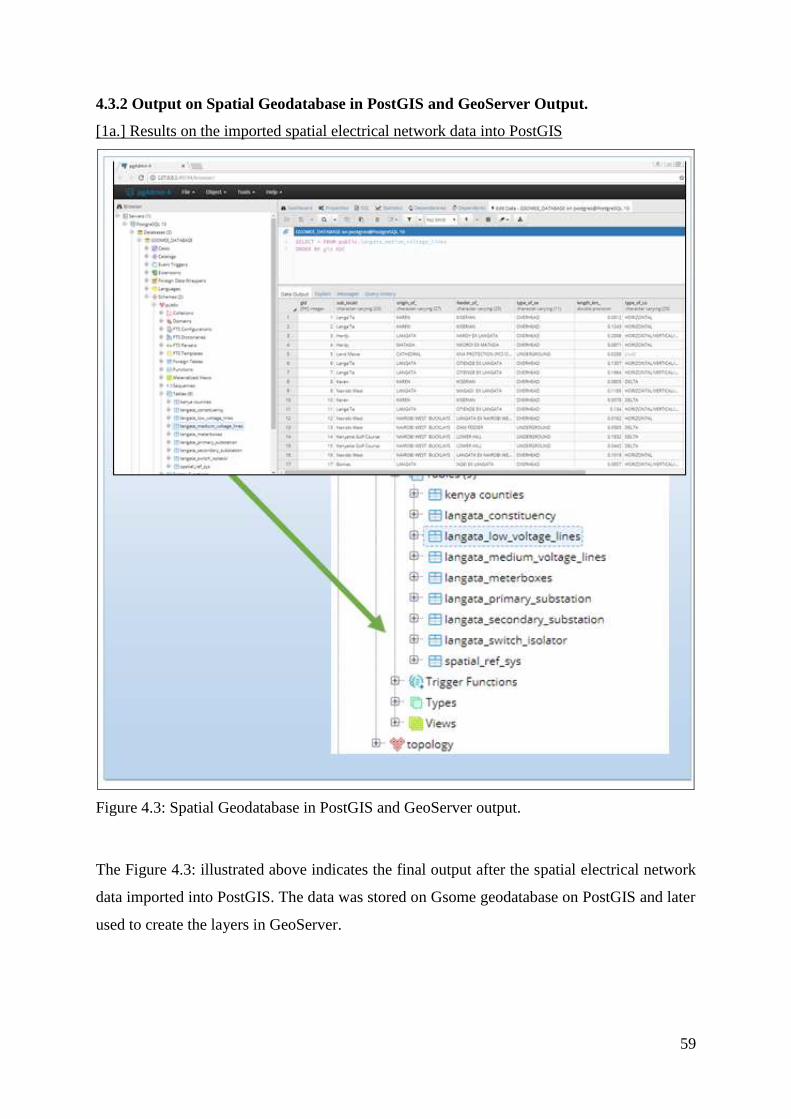
59
4.3.2 Output on Spatial Geodatabase in PostGIS and GeoServer Output.
[1a.] Results on the imported spatial electrical network data into PostGIS
Figure 4.3: Spatial Geodatabase in PostGIS and GeoServer output.
The Figure 4.3: illustrated above indicates the final output after the spatial electrical network
data imported into PostGIS. The data was stored on Gsome geodatabase on PostGIS and later
used to create the layers in GeoServer.
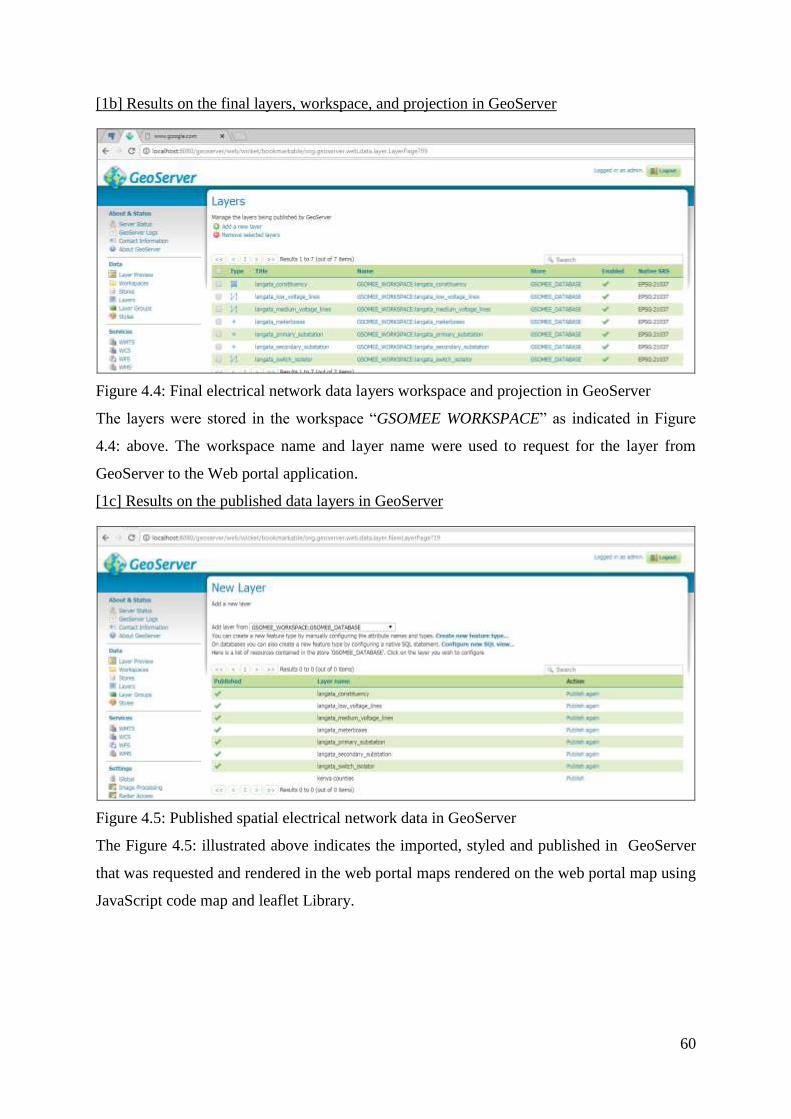
60
[1b] Results on the final layers, workspace, and projection in GeoServer
Figure 4.4: Final electrical network data layers workspace and projection in GeoServer
The layers were stored in the workspace “GSOMEE WORKSPACE” as indicated in Figure
4.4: above. The workspace name and layer name were used to request for the layer from
GeoServer to the Web portal application.
[1c] Results on the published data layers in GeoServer
Figure 4.5: Published spatial electrical network data in GeoServer
The Figure 4.5: illustrated above indicates the imported, styled and published in GeoServer
that was requested and rendered in the web portal maps rendered on the web portal map using
JavaScript code map and leaflet Library.
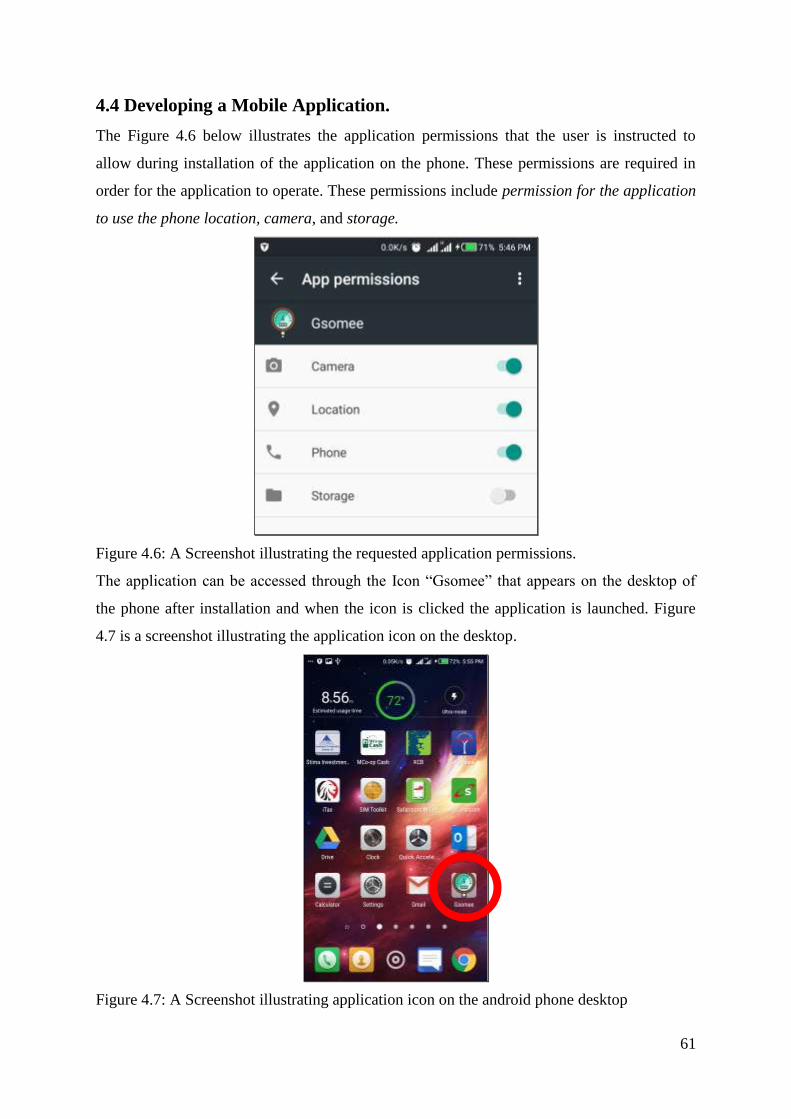
61
4.4 Developing a Mobile Application.
The Figure 4.6 below illustrates the application permissions that the user is instructed to
allow during installation of the application on the phone. These permissions are required in
order for the application to operate. These permissions include permission for the application
to use the phone location, camera, and storage.
Figure 4.6: A Screenshot illustrating the requested application permissions.
The application can be accessed through the Icon “Gsomee” that appears on the desktop of
the phone after installation and when the icon is clicked the application is launched. Figure
4.7 is a screenshot illustrating the application icon on the desktop.
Figure 4.7: A Screenshot illustrating application icon on the android phone desktop
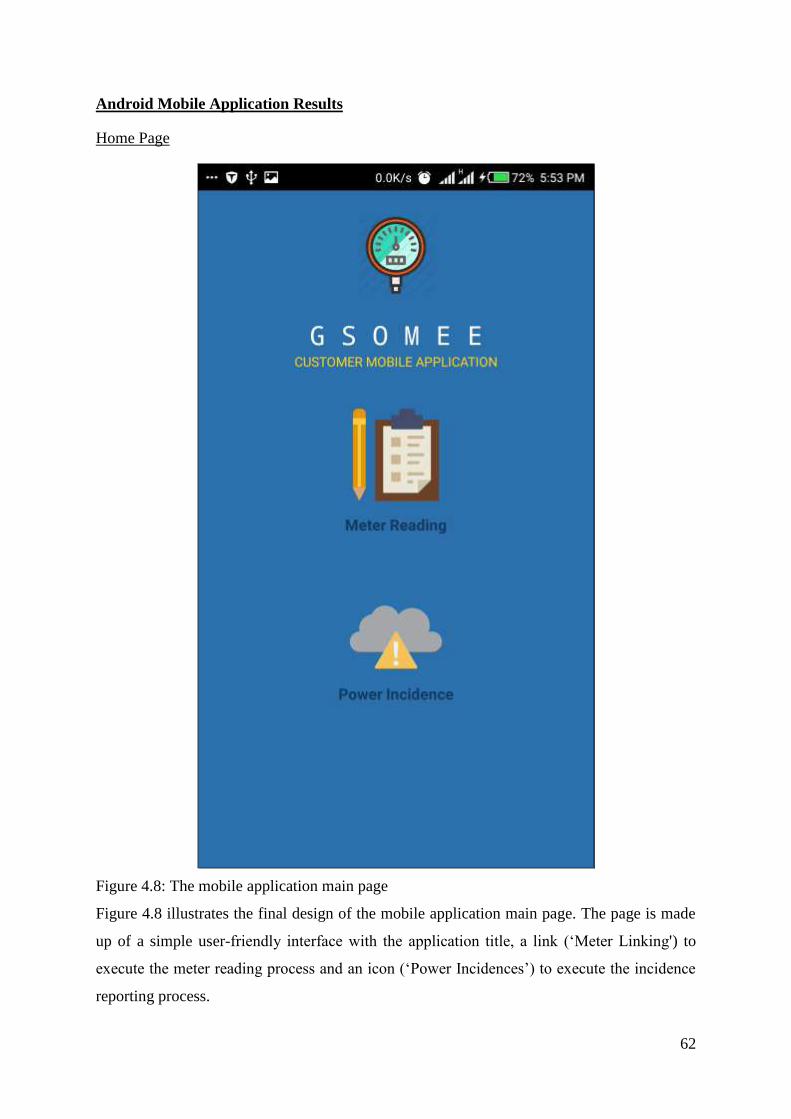
62
Android Mobile Application Results
Home Page
Figure 4.8: The mobile application main page
Figure 4.8 illustrates the final design of the mobile application main page. The page is made
up of a simple user-friendly interface with the application title, a link (‘Meter Linking') to
execute the meter reading process and an icon (‘Power Incidences’) to execute the incidence
reporting process.
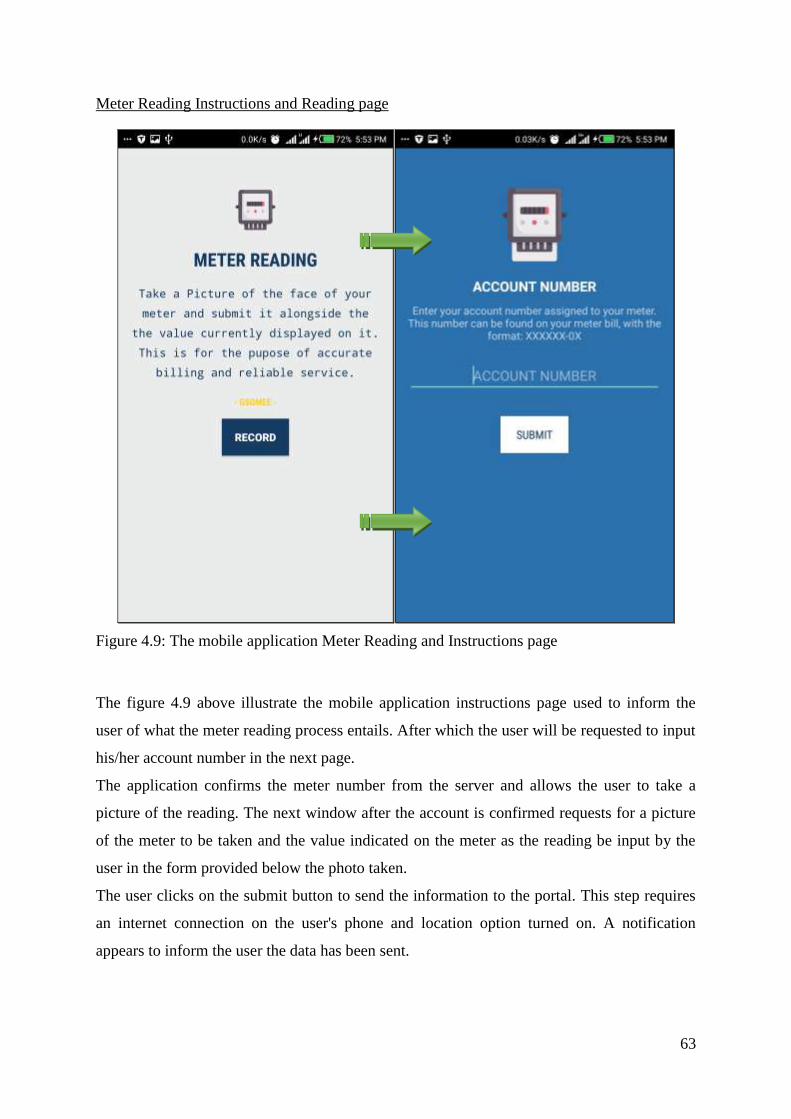
63
Meter Reading Instructions and Reading page
Figure 4.9: The mobile application Meter Reading and Instructions page
The figure 4.9 above illustrate the mobile application instructions page used to inform the
user of what the meter reading process entails. After which the user will be requested to input
his/her account number in the next page.
The application confirms the meter number from the server and allows the user to take a
picture of the reading. The next window after the account is confirmed requests for a picture
of the meter to be taken and the value indicated on the meter as the reading be input by the
user in the form provided below the photo taken.
The user clicks on the submit button to send the information to the portal. This step requires
an internet connection on the user's phone and location option turned on. A notification
appears to inform the user the data has been sent.
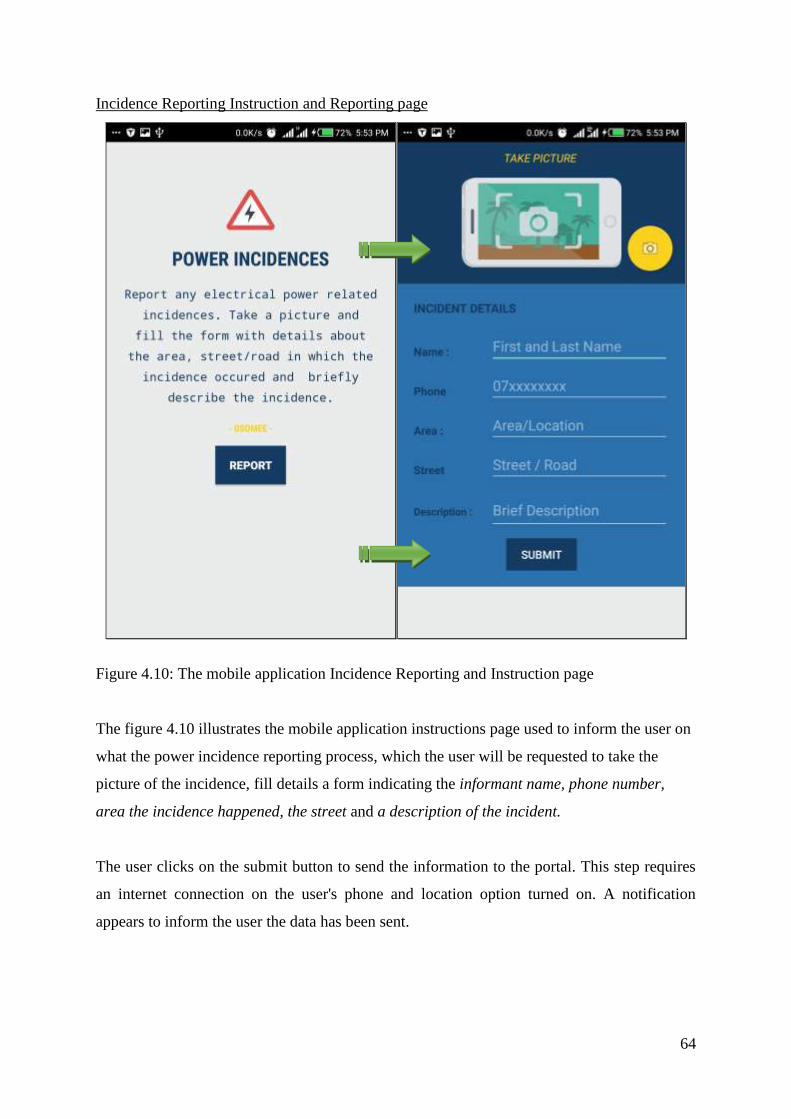
64
Incidence Reporting Instruction and Reporting page
Figure 4.10: The mobile application Incidence Reporting and Instruction page
The figure 4.10 illustrates the mobile application instructions page used to inform the user on
what the power incidence reporting process, which the user will be requested to take the
picture of the incidence, fill details a form indicating the informant name, phone number,
area the incidence happened, the street and a description of the incident.
The user clicks on the submit button to send the information to the portal. This step requires
an internet connection on the user's phone and location option turned on. A notification
appears to inform the user the data has been sent.
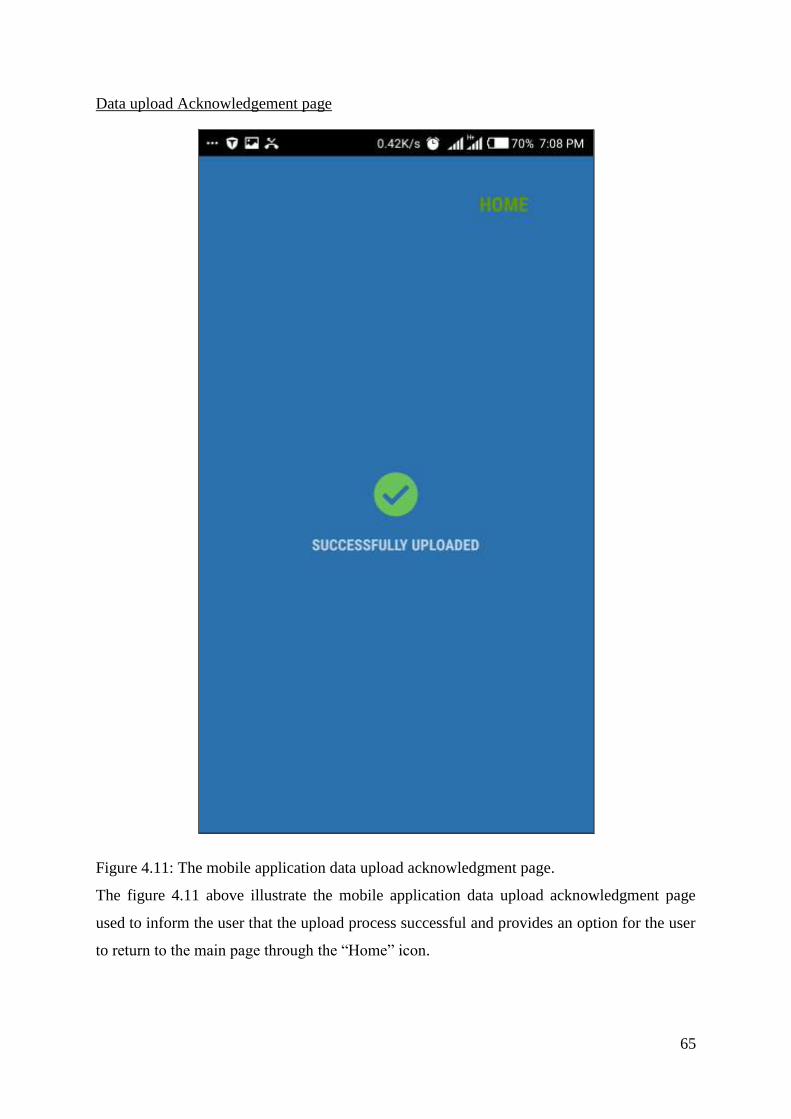
65
Data upload Acknowledgement page
Figure 4.11: The mobile application data upload acknowledgment page.
The figure 4.11 above illustrate the mobile application data upload acknowledgment page
used to inform the user that the upload process successful and provides an option for the user
to return to the main page through the “Home” icon.
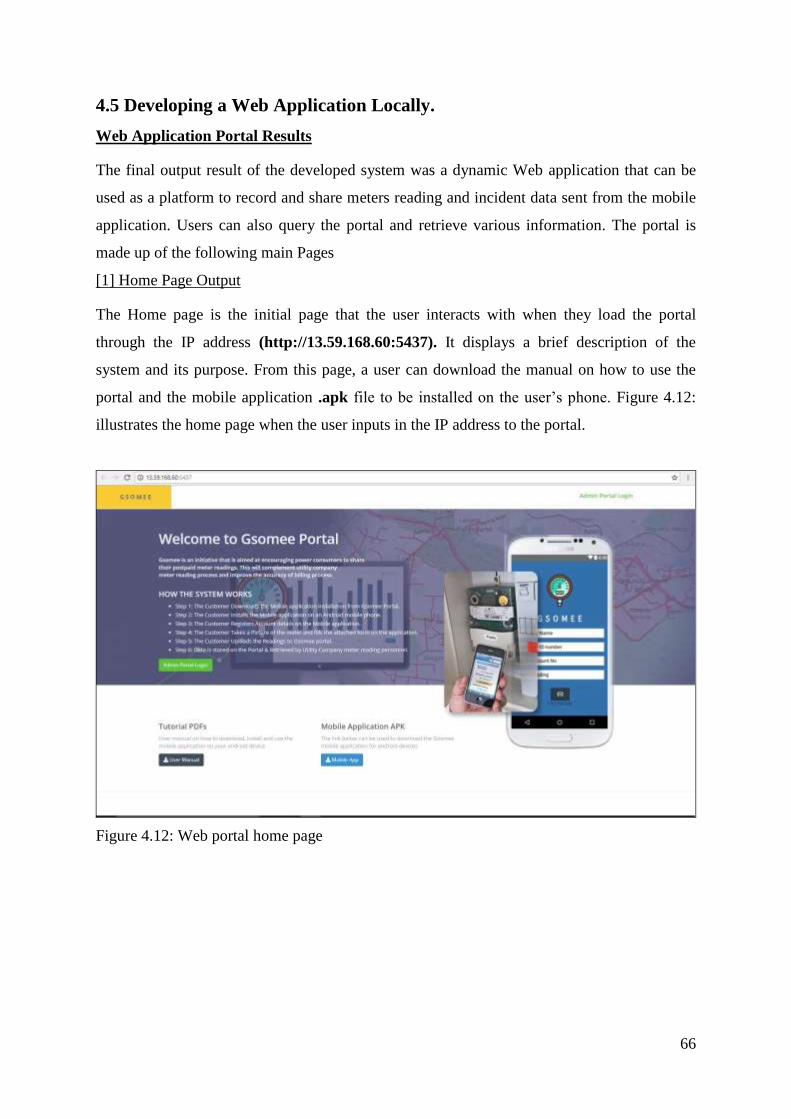
66
4.5 Developing a Web Application Locally.
Web Application Portal Results
The final output result of the developed system was a dynamic Web application that can be
used as a platform to record and share meters reading and incident data sent from the mobile
application. Users can also query the portal and retrieve various information. The portal is
made up of the following main Pages
[1] Home Page Output
The Home page is the initial page that the user interacts with when they load the portal
through the IP address (http://13.59.168.60:5437). It displays a brief description of the
system and its purpose. From this page, a user can download the manual on how to use the
portal and the mobile application .apk file to be installed on the user’s phone. Figure 4.12:
illustrates the home page when the user inputs in the IP address to the portal.
Figure 4.12: Web portal home page
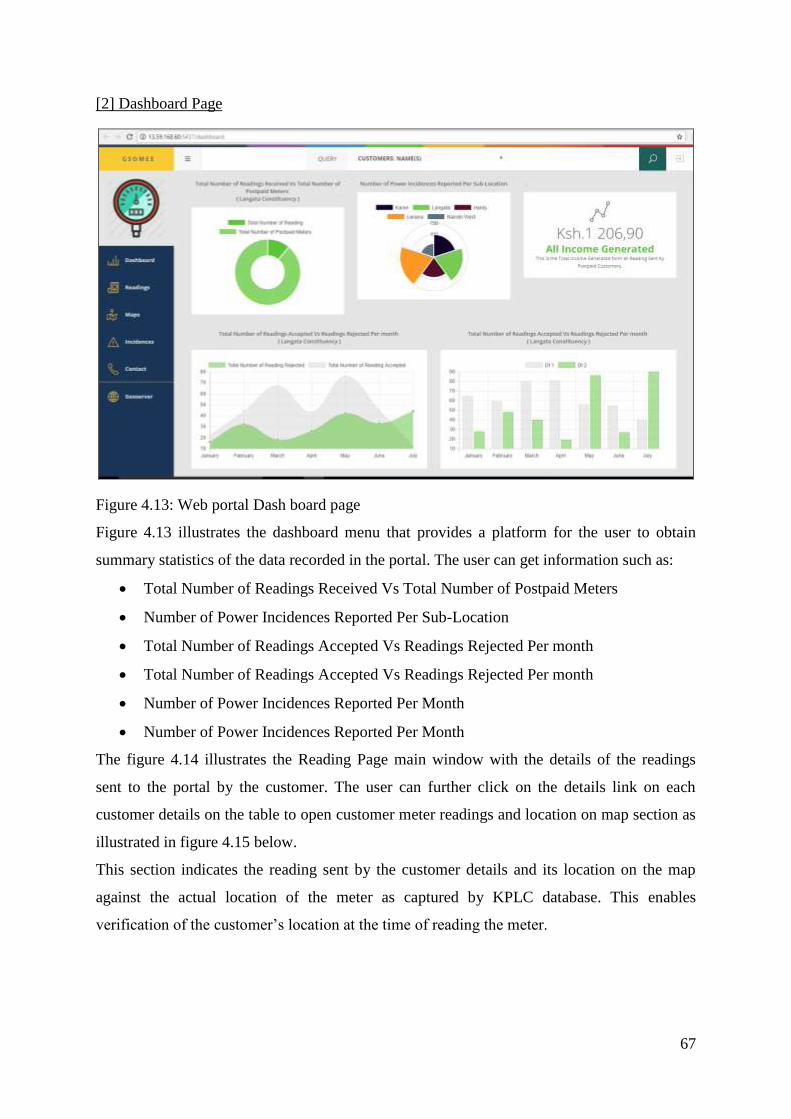
67
[2] Dashboard Page
Figure 4.13: Web portal Dash board page
Figure 4.13 illustrates the dashboard menu that provides a platform for the user to obtain
summary statistics of the data recorded in the portal. The user can get information such as:
Total Number of Readings Received Vs Total Number of Postpaid Meters
Number of Power Incidences Reported Per Sub-Location
Total Number of Readings Accepted Vs Readings Rejected Per month
Total Number of Readings Accepted Vs Readings Rejected Per month
Number of Power Incidences Reported Per Month
Number of Power Incidences Reported Per Month
The figure 4.14 illustrates the Reading Page main window with the details of the readings
sent to the portal by the customer. The user can further click on the details link on each
customer details on the table to open customer meter readings and location on map section as
illustrated in figure 4.15 below.
This section indicates the reading sent by the customer details and its location on the map
against the actual location of the meter as captured by KPLC database. This enables
verification of the customer’s location at the time of reading the meter.
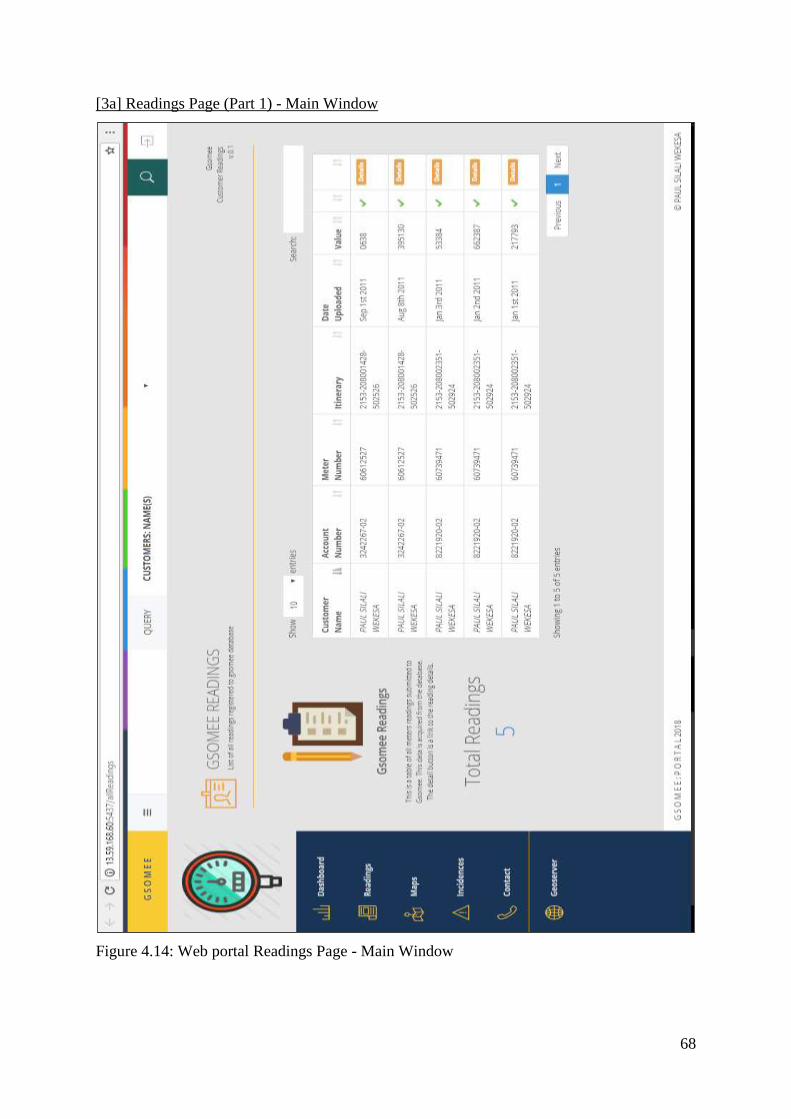
68
[3a] Readings Page (Part 1) - Main Window
Figure 4.14: Web portal Readings Page - Main Window
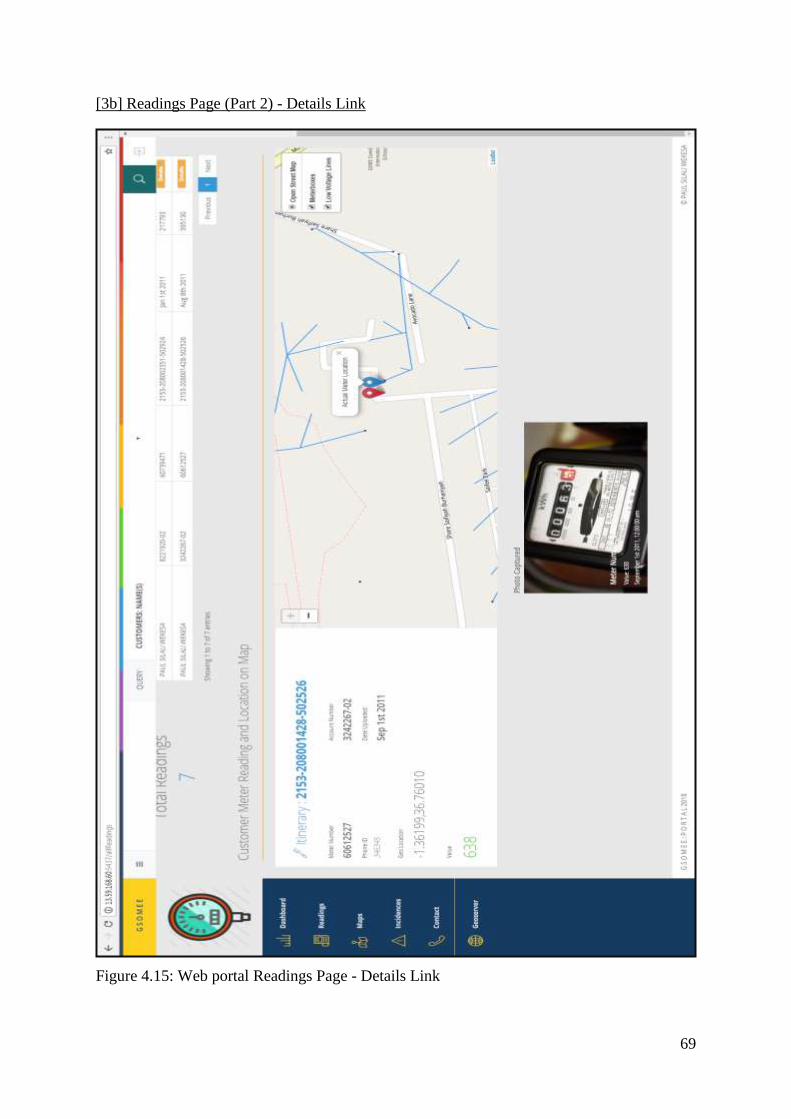
69
[3b] Readings Page (Part 2) - Details Link
Figure 4.15: Web portal Readings Page - Details Link
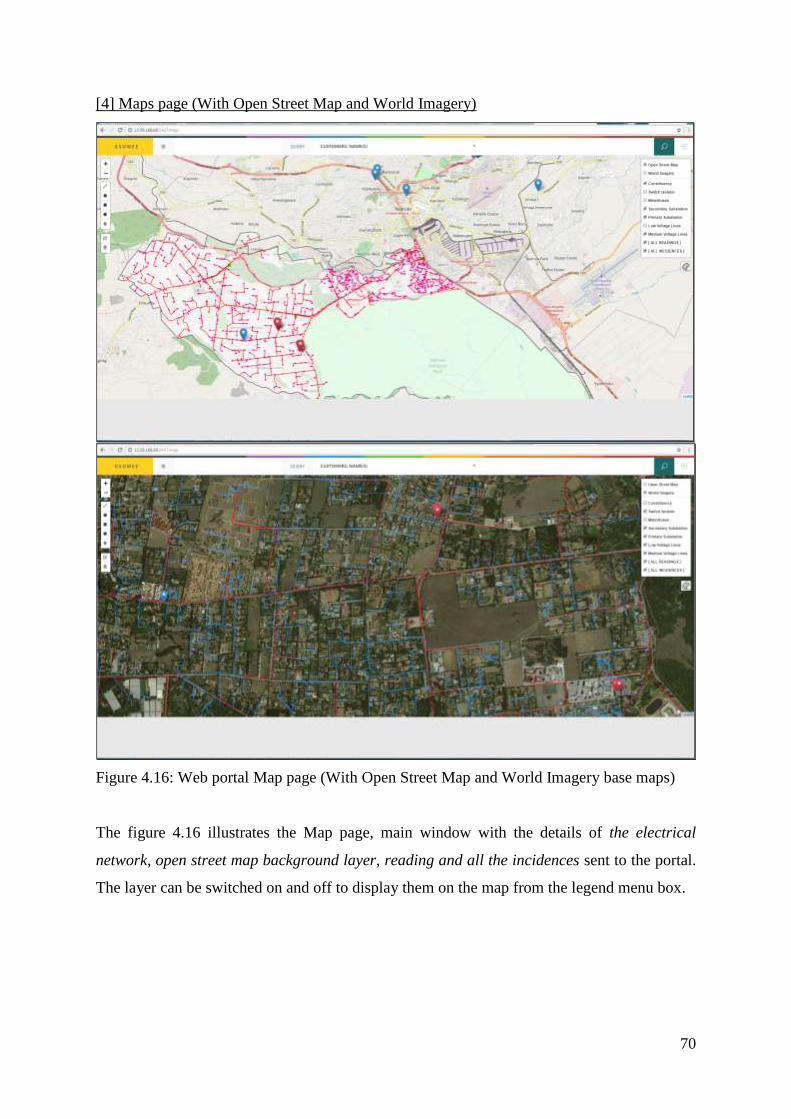
70
[4] Maps page (With Open Street Map and World Imagery)
Figure 4.16: Web portal Map page (With Open Street Map and World Imagery base maps)
The figure 4.16 illustrates the Map page, main window with the details of the electrical
network, open street map background layer, reading and all the incidences sent to the portal.
The layer can be switched on and off to display them on the map from the legend menu box.
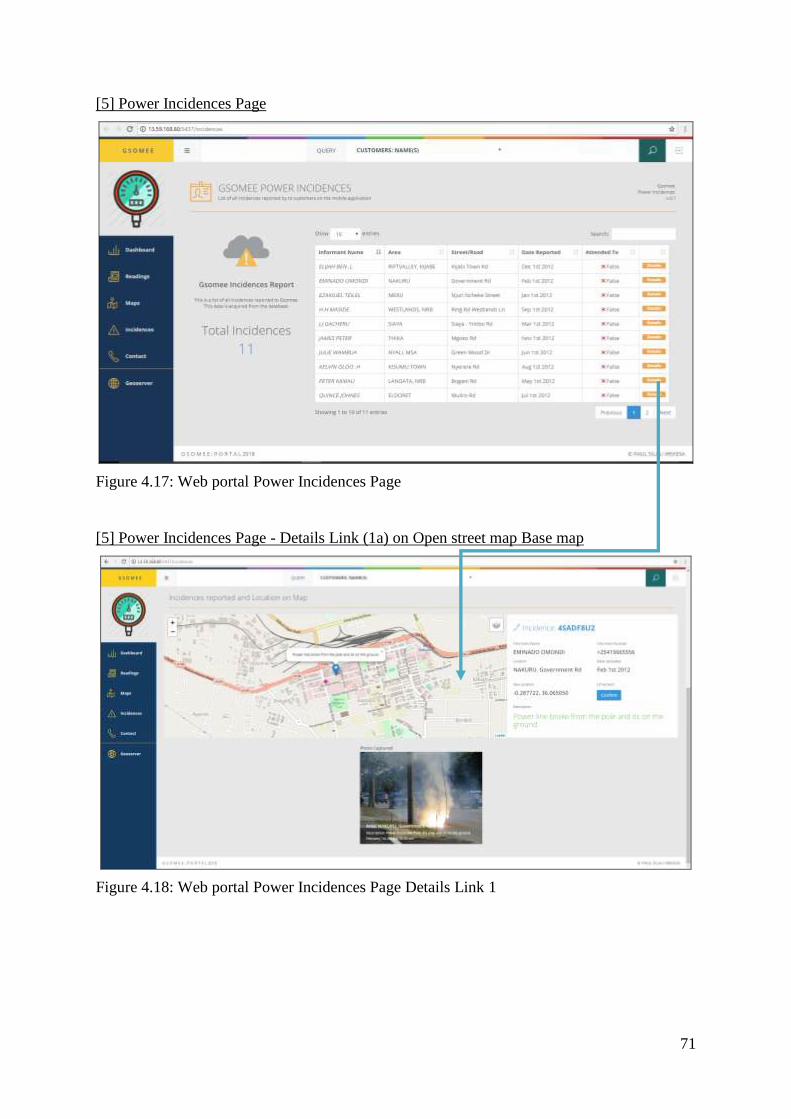
71
[5] Power Incidences Page
Figure 4.17: Web portal Power Incidences Page
[5] Power Incidences Page - Details Link (1a) on Open street map Base map
Figure 4.18: Web portal Power Incidences Page Details Link 1
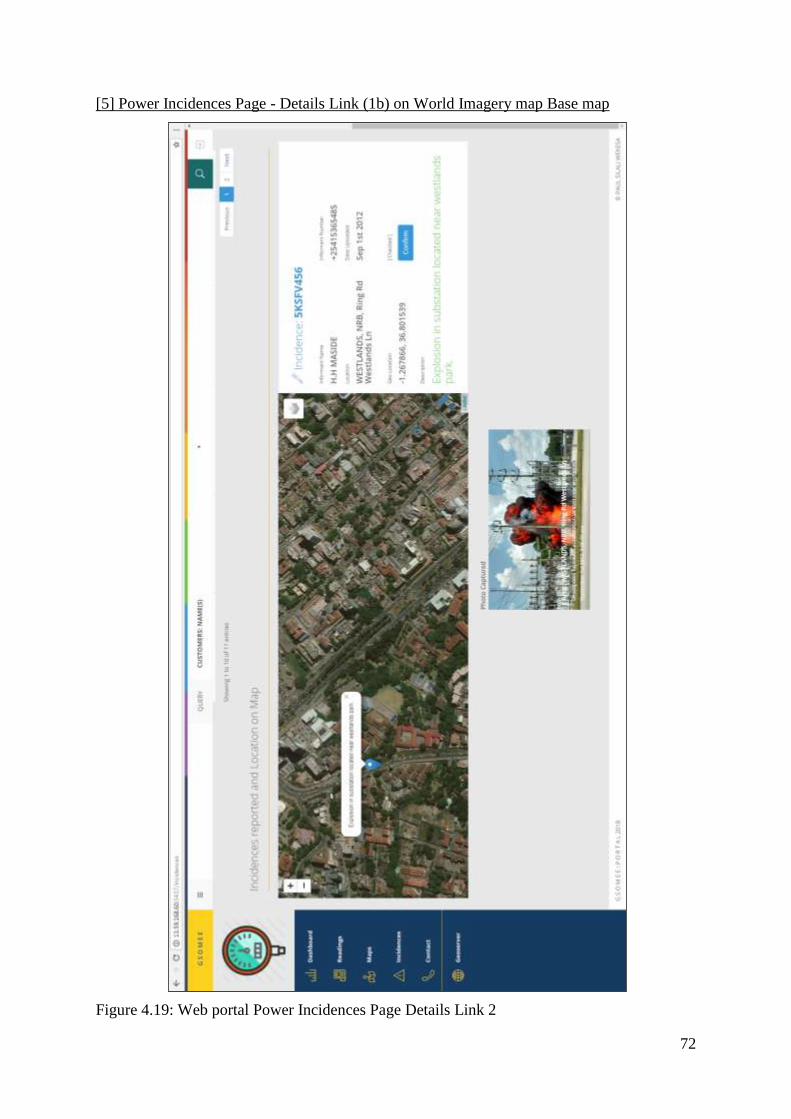
72
[5] Power Incidences Page - Details Link (1b) on World Imagery map Base map
Figure 4.19: Web portal Power Incidences Page Details Link 2
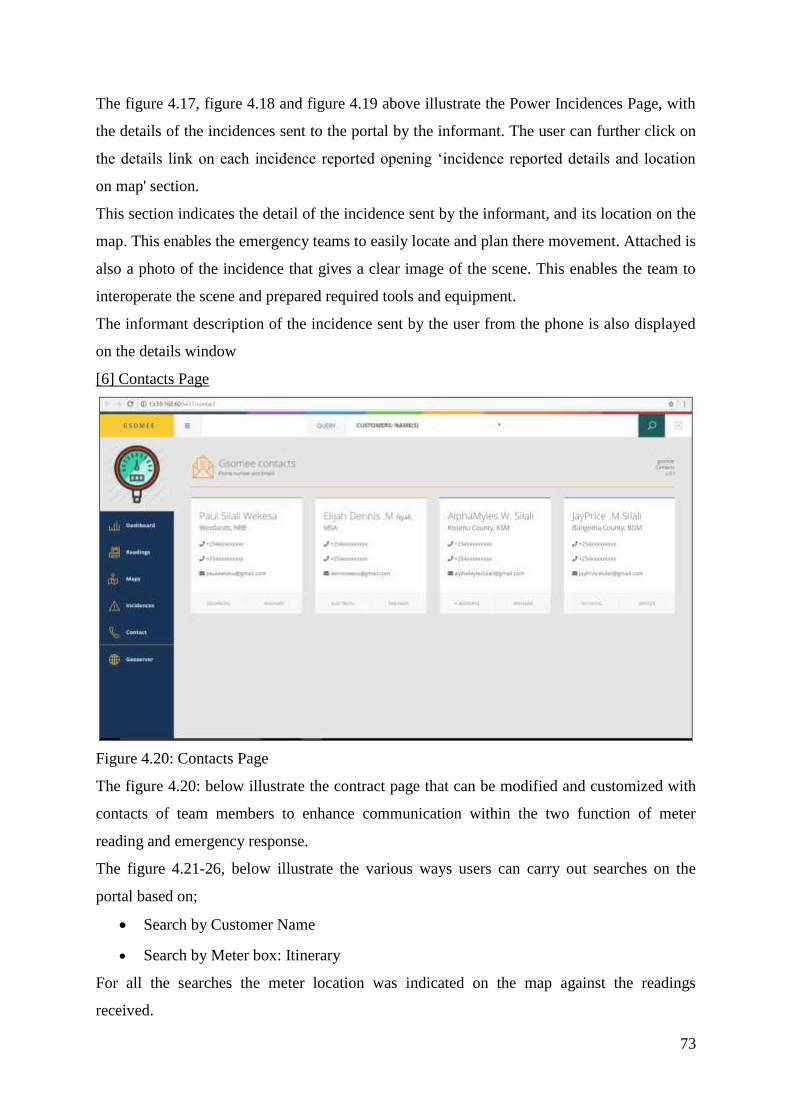
73
The figure 4.17, figure 4.18 and figure 4.19 above illustrate the Power Incidences Page, with
the details of the incidences sent to the portal by the informant. The user can further click on
the details link on each incidence reported opening ‘incidence reported details and location
on map' section.
This section indicates the detail of the incidence sent by the informant, and its location on the
map. This enables the emergency teams to easily locate and plan there movement. Attached is
also a photo of the incidence that gives a clear image of the scene. This enables the team to
interoperate the scene and prepared required tools and equipment.
The informant description of the incidence sent by the user from the phone is also displayed
on the details window
[6] Contacts Page
Figure 4.20: Contacts Page
The figure 4.20: below illustrate the contract page that can be modified and customized with
contacts of team members to enhance communication within the two function of meter
reading and emergency response.
The figure 4.21-26, below illustrate the various ways users can carry out searches on the
portal based on;
Search by Customer Name
Search by Meter box: Itinerary
For all the searches the meter location was indicated on the map against the readings
received.
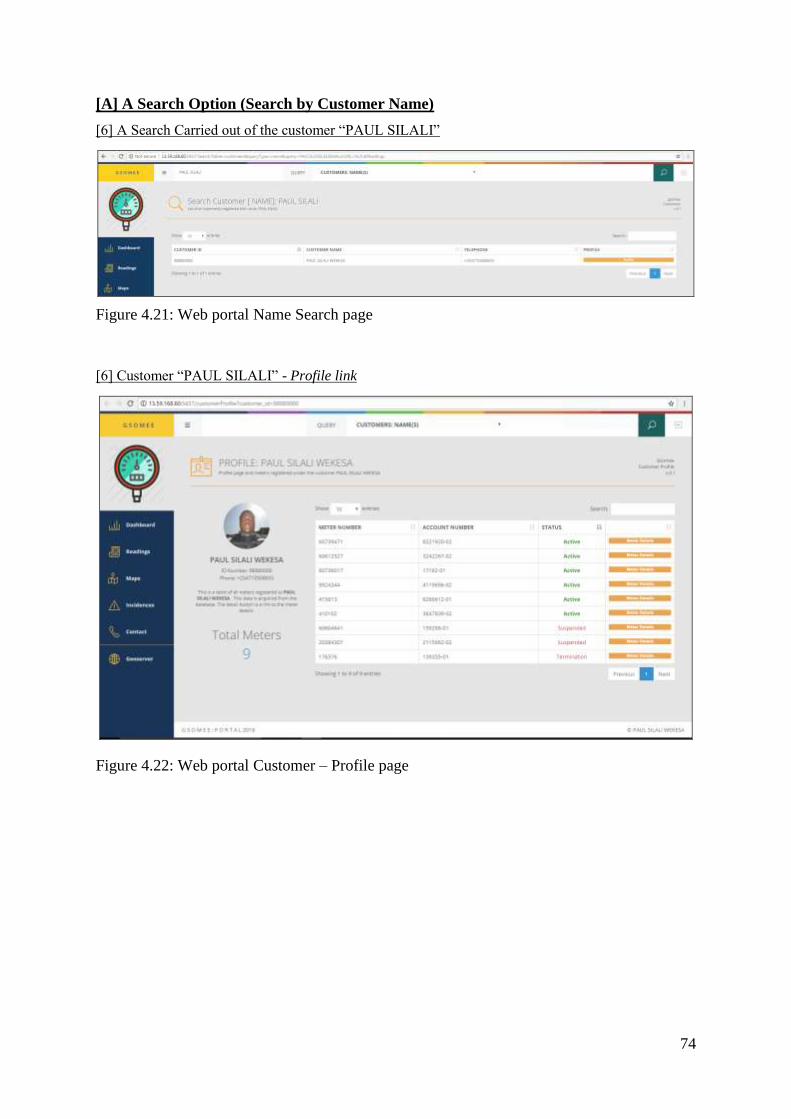
74
[A] A Search Option (Search by Customer Name)
[6] A Search Carried out of the customer “PAUL SILALI”
Figure 4.21: Web portal Name Search page
[6] Customer “PAUL SILALI” - Profile link
Figure 4.22: Web portal Customer – Profile page
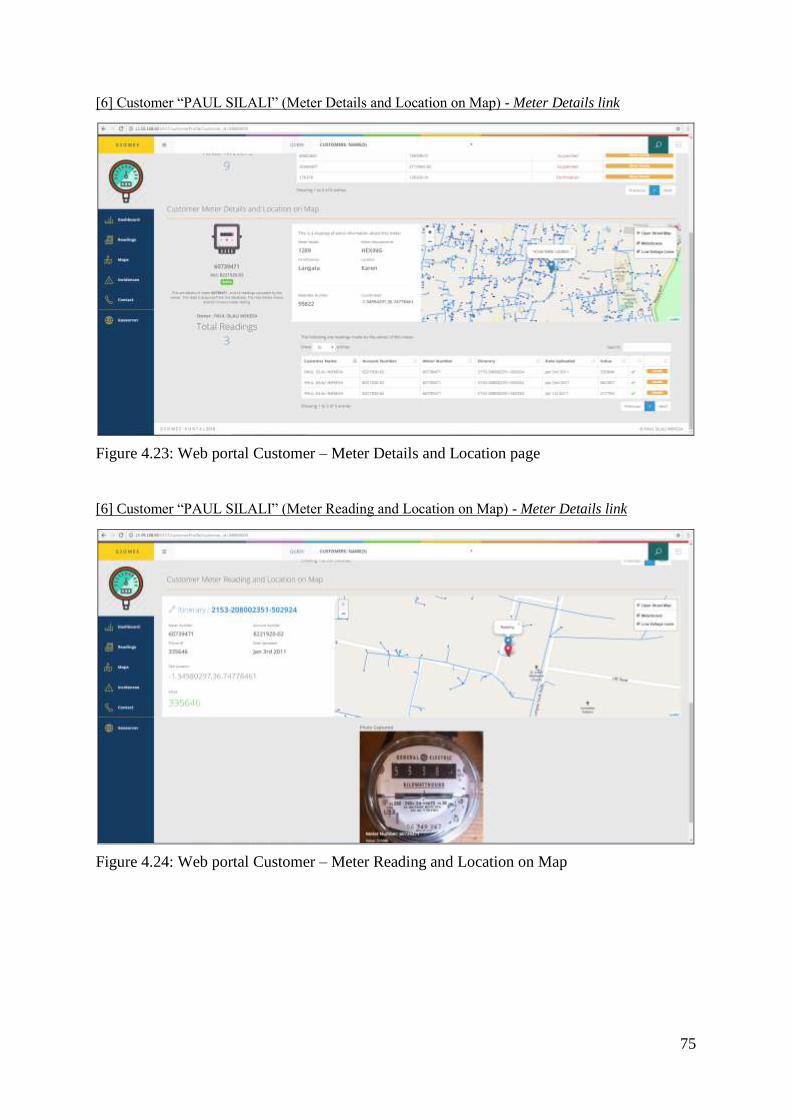
75
[6] Customer “PAUL SILALI” (Meter Details and Location on Map) - Meter Details link
Figure 4.23: Web portal Customer – Meter Details and Location page
[6] Customer “PAUL SILALI” (Meter Reading and Location on Map) - Meter Details link
Figure 4.24: Web portal Customer – Meter Reading and Location on Map
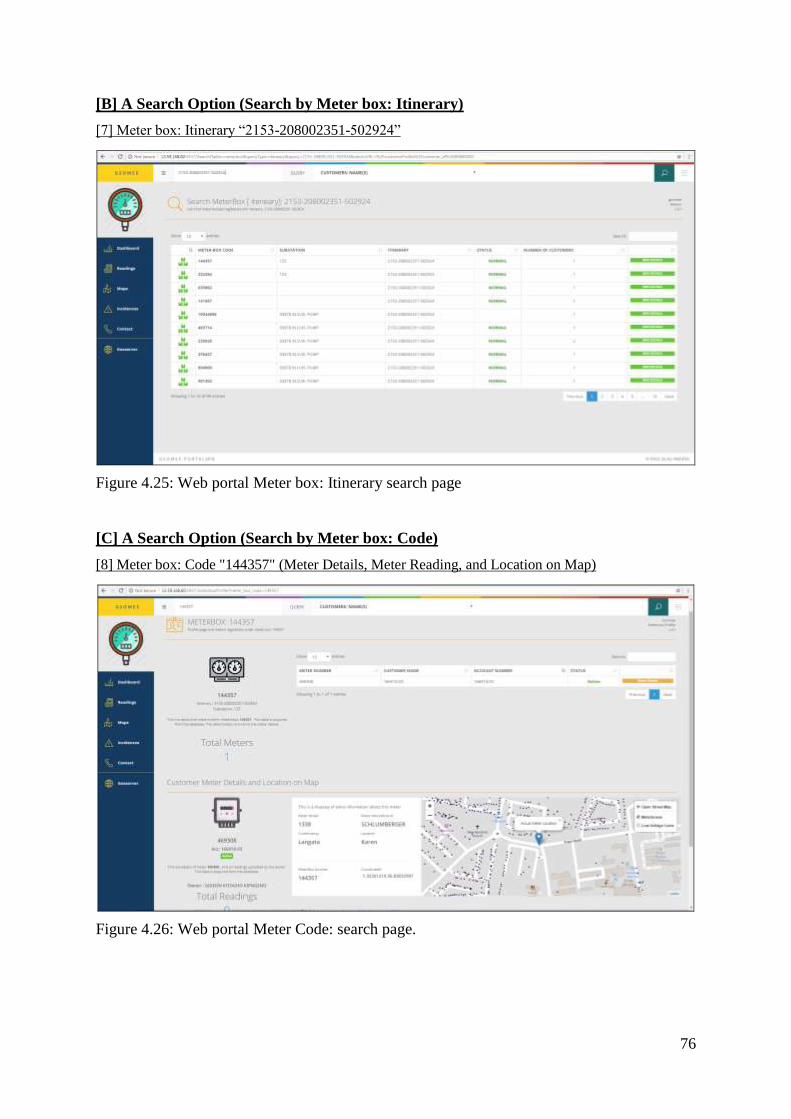
76
[B] A Search Option (Search by Meter box: Itinerary)
[7] Meter box: Itinerary “2153-208002351-502924”
Figure 4.25: Web portal Meter box: Itinerary search page
[C] A Search Option (Search by Meter box: Code)
[8] Meter box: Code "144357" (Meter Details, Meter Reading, and Location on Map)
Figure 4.26: Web portal Meter Code: search page.
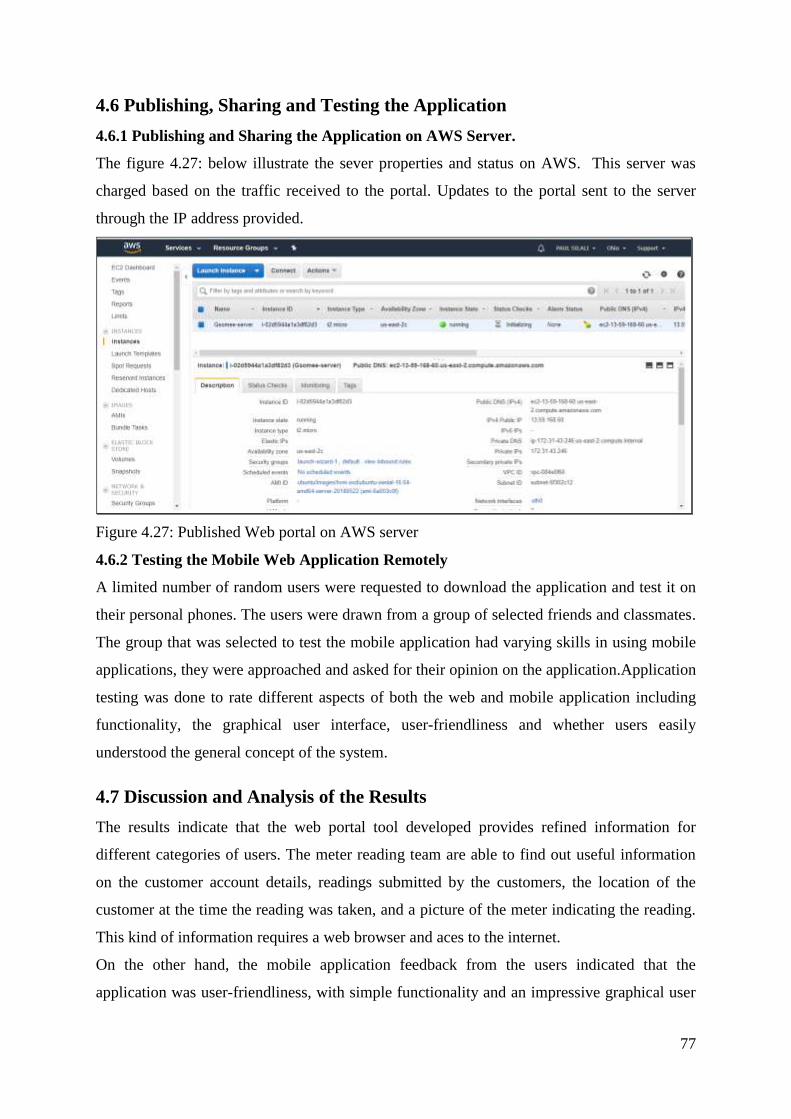
77
4.6 Publishing, Sharing and Testing the Application
4.6.1 Publishing and Sharing the Application on AWS Server.
The figure 4.27: below illustrate the sever properties and status on AWS. This server was
charged based on the traffic received to the portal. Updates to the portal sent to the server
through the IP address provided.
Figure 4.27: Published Web portal on AWS server
4.6.2 Testing the Mobile Web Application Remotely
A limited number of random users were requested to download the application and test it on
their personal phones. The users were drawn from a group of selected friends and classmates.
The group that was selected to test the mobile application had varying skills in using mobile
applications, they were approached and asked for their opinion on the application.Application
testing was done to rate different aspects of both the web and mobile application including
functionality, the graphical user interface, user-friendliness and whether users easily
understood the general concept of the system.
4.7 Discussion and Analysis of the Results
The results indicate that the web portal tool developed provides refined information for
different categories of users. The meter reading team are able to find out useful information
on the customer account details, readings submitted by the customers, the location of the
customer at the time the reading was taken, and a picture of the meter indicating the reading.
This kind of information requires a web browser and aces to the internet.
On the other hand, the mobile application feedback from the users indicated that the
application was user-friendliness, with simple functionality and an impressive graphical user
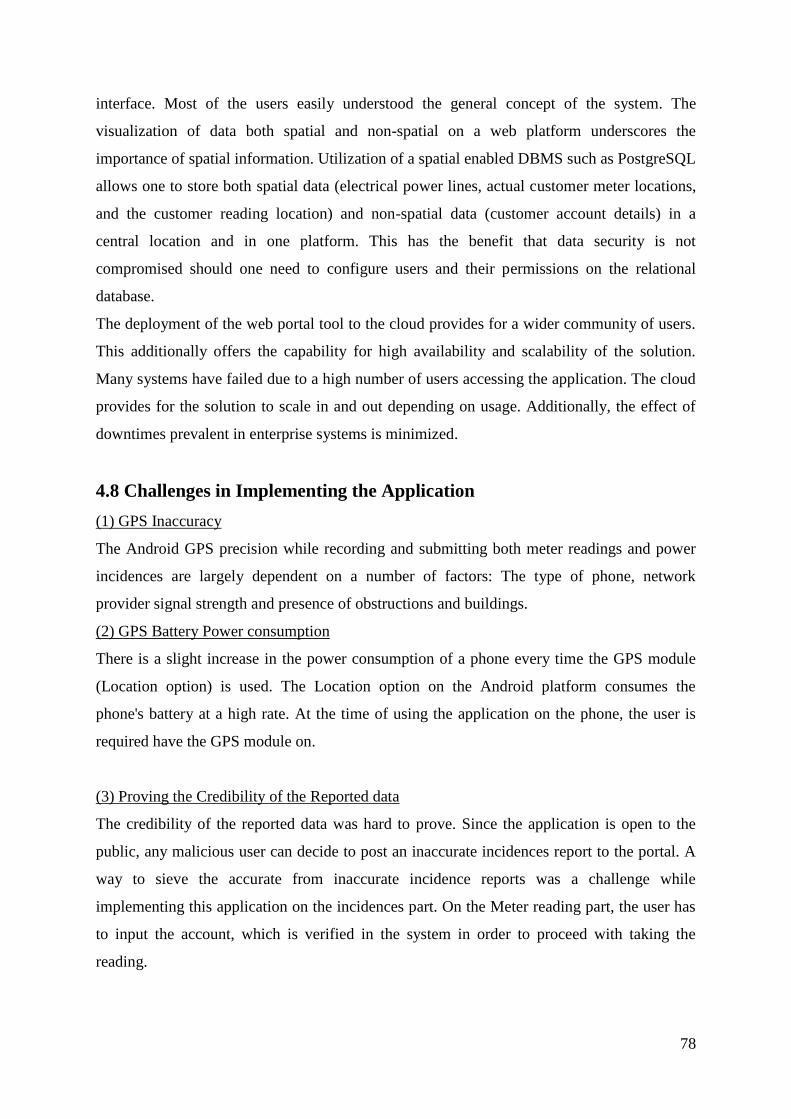
78
interface. Most of the users easily understood the general concept of the system. The
visualization of data both spatial and non-spatial on a web platform underscores the
importance of spatial information. Utilization of a spatial enabled DBMS such as PostgreSQL
allows one to store both spatial data (electrical power lines, actual customer meter locations,
and the customer reading location) and non-spatial data (customer account details) in a
central location and in one platform. This has the benefit that data security is not
compromised should one need to configure users and their permissions on the relational
database.
The deployment of the web portal tool to the cloud provides for a wider community of users.
This additionally offers the capability for high availability and scalability of the solution.
Many systems have failed due to a high number of users accessing the application. The cloud
provides for the solution to scale in and out depending on usage. Additionally, the effect of
downtimes prevalent in enterprise systems is minimized.
4.8 Challenges in Implementing the Application
(1) GPS Inaccuracy
The Android GPS precision while recording and submitting both meter readings and power
incidences are largely dependent on a number of factors: The type of phone, network
provider signal strength and presence of obstructions and buildings.
(2) GPS Battery Power consumption
There is a slight increase in the power consumption of a phone every time the GPS module
(Location option) is used. The Location option on the Android platform consumes the
phone's battery at a high rate. At the time of using the application on the phone, the user is
required have the GPS module on.
(3) Proving the Credibility of the Reported data
The credibility of the reported data was hard to prove. Since the application is open to the
public, any malicious user can decide to post an inaccurate incidences report to the portal. A
way to sieve the accurate from inaccurate incidence reports was a challenge while
implementing this application on the incidences part. On the Meter reading part, the user has
to input the account, which is verified in the system in order to proceed with taking the
reading.
79
CHAPTER 5: CONCLUSIONS AND RECOMMENDATIONS
This chapter will highlight an overview on the suggestions for future research,
recommendations and conclusive remarks on the project when matched to the general and
specific objectives. This project aimed at developing a complementary mobile and web-based
application for recording and sharing electricity customer meter reading and power incidence
data.
5.1 Conclusions
The developed mobile and web application met the stipulated objectives by demonstrating
how the meter readers, the meter supervisors, and the emergency teams can retrieve the vital
information they require for their operation on a timely basis. The web portal application can
enable users to identify the location of incidences and reading on the map. The measure,
digitize, zoom and pan tools on the displayed map enabled users of the system to interact
with the dynamic map to obtain desired information. The map, therefore, served a vital role in
equipping the user with direction information and orientation during fieldwork visits.
The mobile application power incidence reporting platform is aimed at improving the
resolution of these incidents and ultimately contribute to maintaining a constant supply of
power to the customers. This application allows users to report any incident witnessed that
occurs on the electrical network as they go by there day to day duties. Majority of the users
also indicated that the application is generally user-friendly and easy to understand. The
research objectives can thus be said to be achieved because the application had good
reception among the target users that participated in the testing process.
There exists an opportunity to tap into this area in KLPC today because of the increased
penetration of smartphones and also the increased interest of the company to reduce the
number of power outages. This application seeks to improve the outage management by using
information from the public. With the application, the emergency team can prioritize on how
to use the available resources to tackle the outages e.g. the optimal routes to the customer or
probable location of the fault can be viewed on the map from where the crew is thus saving
on time. All these will reduce the time of resolving the incidences, help in keeping accurate
information on incidences, delighting customers and improving the efficiency of work.
80
The opportunity that exists in Kenya concerning sharing of information by the public to
institutions and government agencies has not be tapped. This is enhanced especially with the
increase in the number of smartphones with Android OS. Thus the mobile application comes
in handy to provide a solution to the way users report and share meter readings and incidents.
5.2 Recommendations
Geo-technology was used in place of the conventional hard-copy maps to display, share and
report information. This was accomplished by using open source software’s to display, query
and analyze information relating to meter reading and power incidences. The web has the
ability to disseminate spatial information to a wide audience. The information disseminated
through this application can be used by KPLC personnel, the public and other decision-
makers and interested stakeholders in the electricity distribution.
It is recommended that this application is replicated through all the other constituencies in
Kenya to support power outage management in the company. Other utilities can use this
application to better respond to customers when they face service interruptions and customer
to report meter reading. The utilities can range from water and sewerage companies,
telecommunication companies to oil and gas distribution companies among others.
The recommendations that can be drawn from the research are that the authorities and
government should recognize and embrace the efforts of mobile applications in trying to
improve service delivery in utility companies. It should also support such efforts through
funding and integration of applications with the relevant departments. The application can be
extended to be installed on other mobile phone operating systems such as the iOS based on
the user base and mobile device penetration so as to get access to huge audiences.
5.3 Suggestions for Future Research
Based on user feedback the application can continuously be improved to cater for users
changing needs. Further research should be done in future to enhance functionalities of the
application and thus ensure user retention. There needs to be more research on how to verify
the authenticity of the reported power incidences because the incidents are just reported by
anyone with the application installed on their mobile phone. A verification and screening
mechanisms can be introduced for these reported incidents to guarantee the accuracy and
reliability of the data. There also need for further research on how the mobile application can
be developed on iOS is a mobile operating system for Apple and the same linked to the web
portal.
81
REFERENCES
1. Communication Authority of Kenya (CAK), (2012). Quarterly sector statistics report first
quarter of the financial year 2012/13.
2. Communications Authority of Kenya (2017). Second quarter sector statistics report for
the financial year 2017/2018 (p. 7). Nairobi.
3. Connolly & Begg (2015). Pearson. Database Systems: A Practical Approach to Design,
Implementation, and Management. Sixth edition.
4. Deloitte (2016). Kenya economic outlook 2016: The story behind the numbers.
5. Dykes, j, MacEachren, A.M., Kraak M. J. (2005). Exploring Geovisualization,
International cartographic Association (Elsevier, Amsterdam) pp 3-4
6. Dzbor M., Domingue J. and Motta E., (2003). Knowledge Media Institute, The Open
University, Milton Keynes, UK pp 1-3.
7. Elwood, S. (2008). ‘Volunteered geographic information: key questions, concepts and
methods to guide emerging research and practice’,GeoJournal, 72(3–4), pp.
8. Elwood, S., Goodchild, M. F., & Sui, D. Z. (2012). Researching Volunteered Geographic
Information: Spatial Data, Geographic Research, and New Social Practice. Annals of the
Association of American Geographers, 102(3): 571–590.
9. Fu P. and Sun J, (2011). Web GIS: Principles and Applications, ESRI Press, New York,
USA.
10. Goodchild, M. F. (2007b). ‘Editorial: citizens as voluntary sensors: spatial data
infrastructure in the world of Web 2.0’, International Journal of Spatial Data
Infrastructures Research, 2, pp. 24–32.
11. Goodchild, M. F. (2008). ‘Commentary: whither VGI?’, GeoJournal, 72(3–4), pp. 239–
244.
12. Goodchild, M. F. (2007). Citizens as sensors: the world of volunteered geography.
GeoJournal, 69: 211-221.
13. Goodchild, M. F. Longley, P. A. Maguire, D. J. Rhind D. W. (2005). Geographical
Information Systems and Science John Wiley & Sons Ltd, 2 ed. pp 291-292 39
14. Goodchild, M. F., and Glennon, J. (2010). Crowdsourcing geographic information for
disaster response: a research frontier. International Journal of Digital Earth, Vol.3, No.3,
231-241.
82
15. Goodchild, M.F. (2007). "Citizens as voluntary sensors: spatial data infrastructure in the
world of Web 2.0" International Journal of Spatial Data Infrastructures Research 2: 24–
32.
16. Google (2010). Android Structure, at http://developer.android.com/index.html [Accessed
1, March 2018].
17. Government of Kenya (2007). Vision 2030: A Globally Competitive and Prosperous
Kenya.GoK
18. Government of Kenya (2013). Kenya Vision 2030 Medium Term Plan: 2013-2017. GoK
19. Howard. M., & Leblanc. D. (2003). Writing Secure Code. New York: Microsoft Press. -
20. Hu, Y.-H. & Ge, L., (2008). Chapter 11: GeoTagMapper: An Online Map-based
Geographic Information Retrieval System for Geo-Tagged Web Content. In: M. P.
Peterson, ed. International Perspectives on Maps and the Internet Lecture Notes in
Geoinformation and Cartography. Berlin, Germany: Springer Berlin Heidelberg, pp. 153-
164.
21. Ian J. and Norman W. (2004). URI/Resource Relationships Architecture of the World
Wide Web, Volume One. World Wide Web Consortium
22. IDC (2012). Android Marks Fourth Anniversary since Launch with 75.0% Market Share
in Third Quarter, at
http://www.idc.com/getdoc.jsp?containerId=prUS23771812#.UWFoSTd3N7M
[Accessed 1, June 2018].
23. Institute of Economic Affairs (IEA), (2015). Situational Analysis of Energy Industry,
Policy and Strategy for Kenya Institute of Economic Affairs (IEA), 2015
24. International Telecommunication Union (2017). Measuring the Information Society
Report (p. 6). Geneva. Retrieved from https://www.itu.int/en/ITU-
D/Statistics/Documents/publications/misr2017/MISR2017_Volume1.pdf [Accessed
20/06/2018]
25. Jiang, B. Huang, B., and Vasek, V. (2003). Geovisualisation for Planning Support
Systems. In Planning Support Systems in Practice, Geertman, S., and Stillwell, J. (Eds.)
(Berlin: Springer).
26. Kenya Institute for Public Policy Research and Analysis (2017), Kenya Economic Report
(KER) (pp. 15-17). Nairobi: Kenya Institute for Public Policy Research and Analysis
(KIPPRA).
83
27. Kenya National Bureau of Statistics (KNBS), (2009). Kenya Population and Housing
Census, Government Press, Nairobi, Kenya
28. Kenya National Bureau of Statistics (KNBS), (2008). Well-being in Kenya; A socio-
Economic Profile, English Press Limited, Nairobi, Kenya
29. Kenya National Bureau of Statistics (2013). Economic Survey, 2013. KNBS
30. Kenya National Bureau of Statistics (2017). Economic Survey, 2017. KNBS
31. KIPPRA. (2017). Kenya Economic Report 2017. https://doi.org/10.1007/s10842-006-
7185-8
32. KPLC, (2012). 5 Year Corporate Strategic Plan 2013/14 to 2017/18 (p. 10). Nairobi:
Kenya Power and Lighting Company Ltd.
33. Kraak, M.J. (2004). The role of the map in a web - GIS environment: Journal of
geographical systems: geographical information, analysis, theory and decision, 6 (2004) 2
pp. 83-93.
34. Vaquero L. M., L. Rodero-Merino, J. Caceres, and M. Lindner (2009). A break in the
clouds: Towards a cloud definition, SIGCOMM Computer Communications Review,
39:50-55.
35. MacEachren, A.M. (2004). Geovisualization for knowledge construction and decision
support. IEEE computer graphics and applications, 24(1), pp.13-17.
36. MacEachren, A.M. and Kraak, M.J. (1997). Exploratory cartographic visualization:
advancing the agenda. Computers & Geosciences, 23(4), pp. 335-343.
37. Meyer N. V. (2004). The GIS and Land Records, The ArcGIS Parcel Data Model ESRI
press, USA
38. Ministry of Energy and Petroleum (MoEP) (2015). Draft National Energy and Petroleum
Policy.
39. Miscione, G., Verplanke, J. and Martinez, J. (2011). ‘Voluntary information and PGIS’,
in PGIS: Participatory Geographic Information Systems and Land Planning: Life
Experiences for People Empowerment and Community Transformation, ed. by
40. Mitchell. T. (2005). Web Mapping Illustrated: Using Open Source GIS Toolkits. O’Reilly
Media.
41. Orenstein, D. (2010). Quick Study: Application Programming Interface (API)
http://www.computerworld.com/s/article/43487/Application_Programming_Interface
[Accessed 20/06/2018]
84
42. Owiro, D., Poquillon, G., Sivi Njonjo, K. and Oduor, C. (2015). Situational Analysis of
Energy Industry, Policy and Strategy for Kenya. Nairobi: Institute of Economic Affairs
(IEA).
43. Republic of Kenya. (2007). Kenya Vision 2030. Government of Kenya Issue, 29
44. Sakamoto A. & Fukui, H., (2004). Development and application of a livable environment
evaluation support system using Web GIS. Journal of Geographical Systems, Springer
(Berlin / Heidelberg) 6(2) pp 175-195
45. Stachowicz S. (2004). Geographical data sharing – Advantages of web based technology
to local government, 10th EC GI & GIS Workshop 23-25 June 2004, ESDI State of the
Art,Warsaw, Poland, pp 1-2 41
46. Tsou, M.H. and Buttenfield, B.P. (2002). A Dynamic Architecture for Distributed
Geographic Information Services. Transactions in GIS. 6(4) pp 355-381.
47. UNHCR. (2012). Geo-Tagging and Sharing Infrastructure Pictures in the Field – Guiding
Notes (pp. 2-3). Geneva: United Nations High Commissioner for Refugees.
48. Xu, J. and Nyerges, T.L. (2016). ‘A framework for user-generated geographic content
acquisition in an age of crowdsourcing’, Cartography and Geographic Information
Science.
49. Zhou, Y. (2014). Volunteered Geographical Information: an Alternative Solution for
Overcoming the Chasm between Storm water Management and Community
Participation (Masters). University of Nebraska.
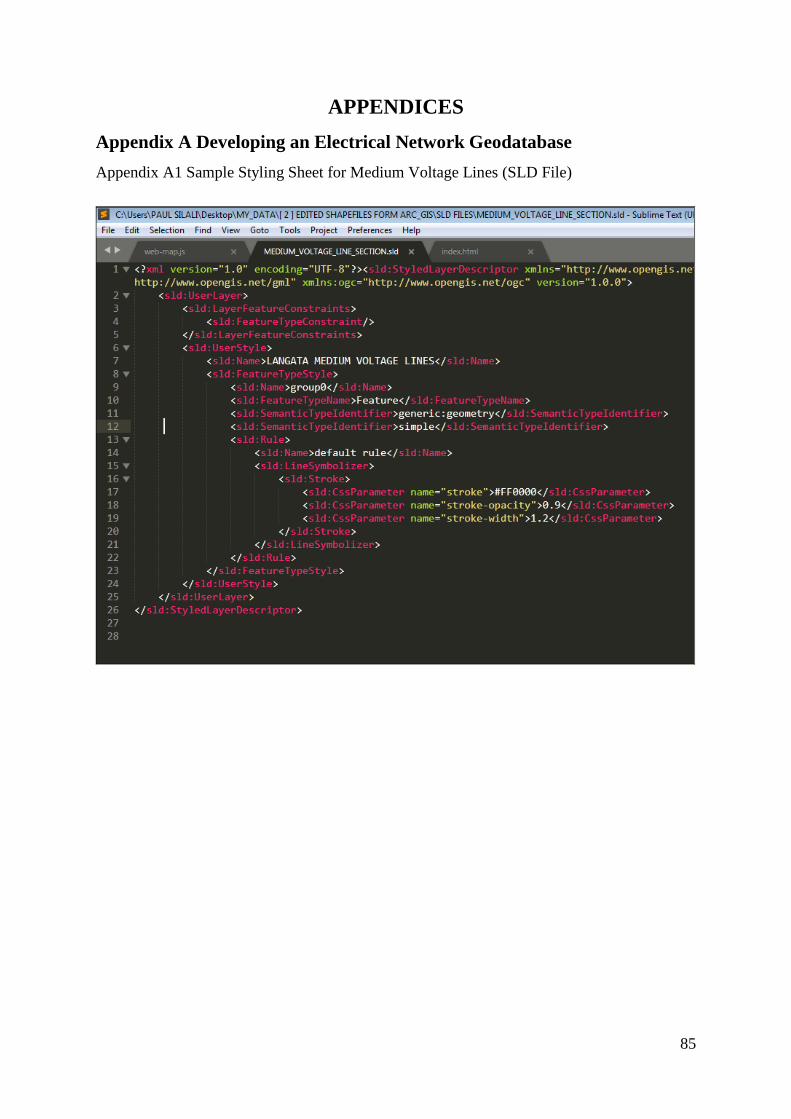
85
APPENDICES
Appendix A Developing an Electrical Network Geodatabase
Appendix A1 Sample Styling Sheet for Medium Voltage Lines (SLD File)
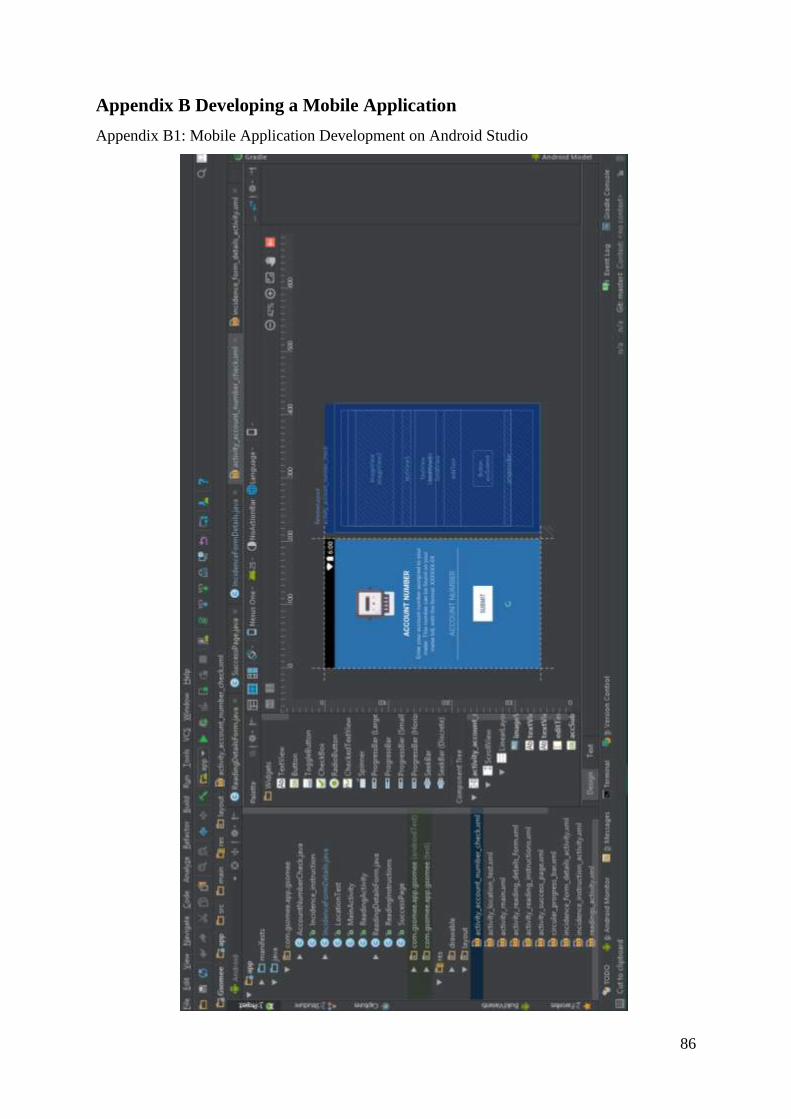
86
Appendix B Developing a Mobile Application
Appendix B1: Mobile Application Development on Android Studio
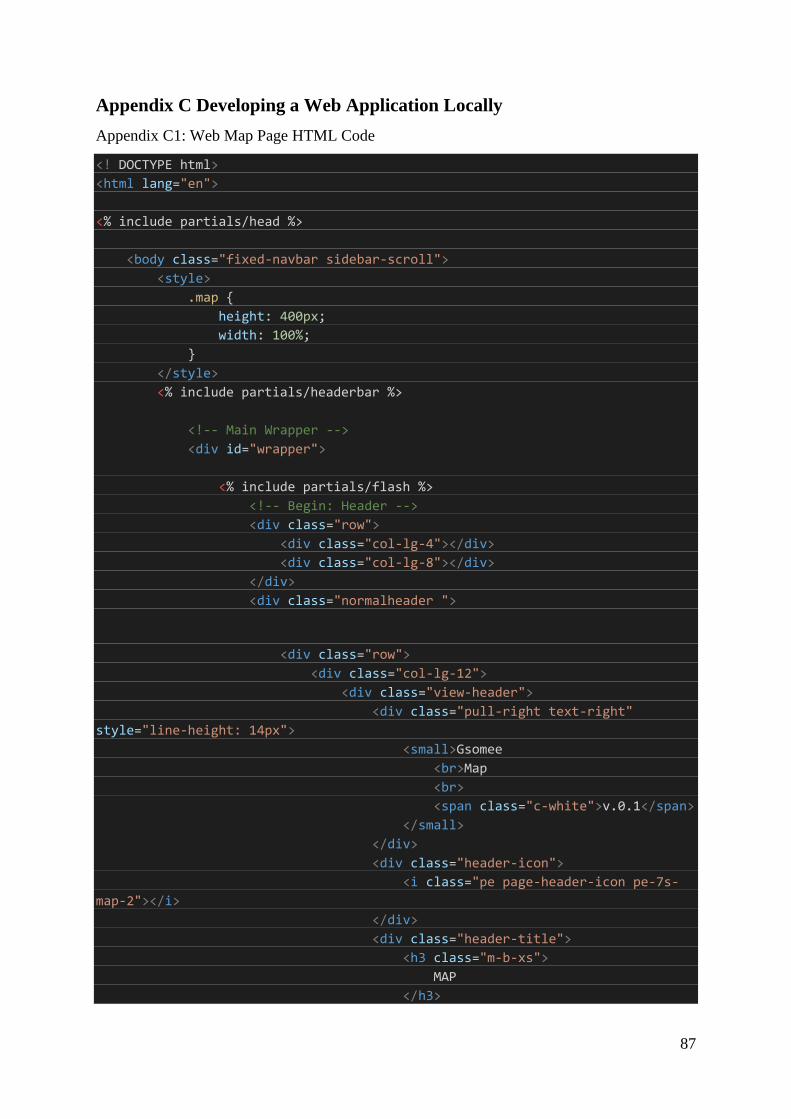
87
Appendix C Developing a Web Application Locally
Appendix C1: Web Map Page HTML Code
<! DOCTYPE html>
<html lang="en">
<% include partials/head %>
<body class="fixed-navbar sidebar-scroll">
<style>
.map {
height: 400px;
width: 100%;
}
</style>
<% include partials/headerbar %>
<!-- Main Wrapper -->
<div id="wrapper">
<% include partials/flash %>
<!-- Begin: Header -->
<div class="row">
<div class="col-lg-4"></div>
<div class="col-lg-8"></div>
</div>
<div class="normalheader ">
<div class="row">
<div class="col-lg-12">
<div class="view-header">
<div class="pull-right text-right"
style="line-height: 14px">
<small>Gsomee
<br>Map
<br>
<span class="c-white">v.0.1</span>
</small>
</div>
<div class="header-icon">
<i class="pe page-header-icon pe-7s-
map-2"></i>
</div>
<div class="header-title">
<h3 class="m-b-xs">
MAP
</h3>
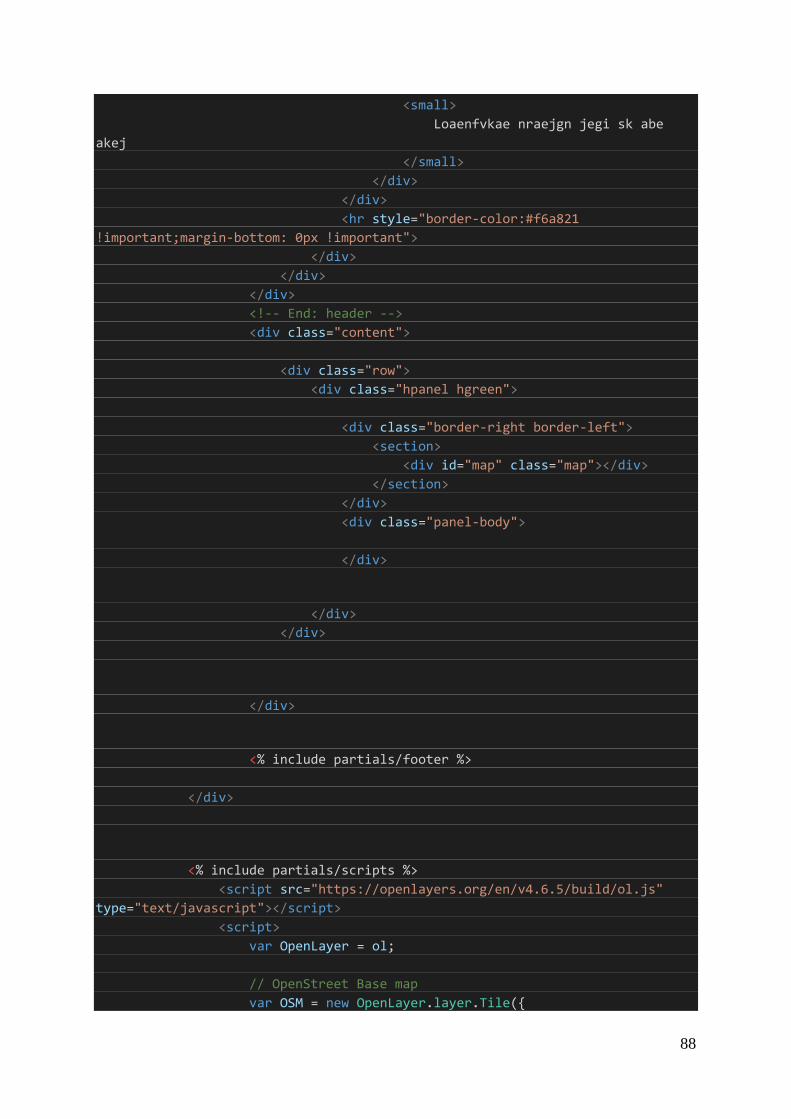
88
<small>
Loaenfvkae nraejgn jegi sk abe
akej
</small>
</div>
</div>
<hr style="border-color:#f6a821
!important;margin-bottom: 0px !important">
</div>
</div>
</div>
<!-- End: header -->
<div class="content">
<div class="row">
<div class="hpanel hgreen">
<div class="border-right border-left">
<section>
<div id="map" class="map"></div>
</section>
</div>
<div class="panel-body">
</div>
</div>
</div>
</div>
<% include partials/footer %>
</div>
<% include partials/scripts %>
<script src="https://openlayers.org/en/v4.6.5/build/ol.js"
type="text/javascript"></script>
<script>
var OpenLayer = ol;
// OpenStreet Base map
var OSM = new OpenLayer.layer.Tile({
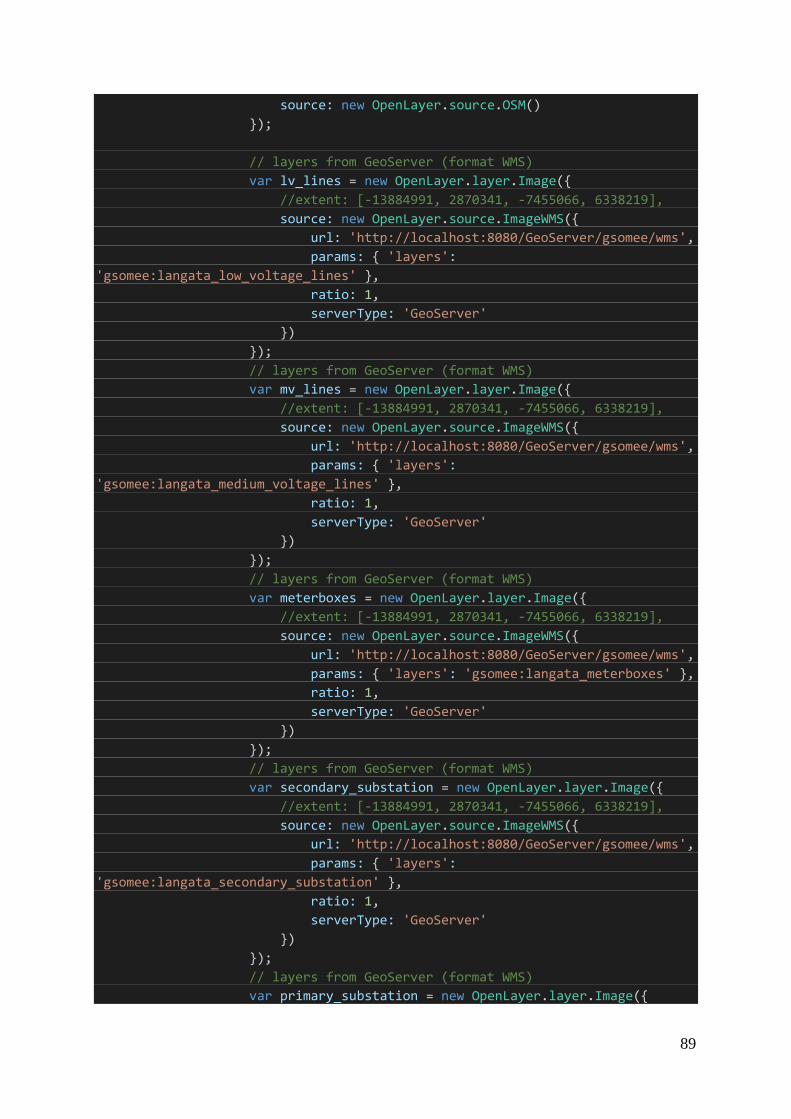
89
source: new OpenLayer.source.OSM()
});
// layers from GeoServer (format WMS)
var lv_lines = new OpenLayer.layer.Image({
//extent: [-13884991, 2870341, -7455066, 6338219],
source: new OpenLayer.source.ImageWMS({
url: 'http://localhost:8080/GeoServer/gsomee/wms',
params: { 'layers':
'gsomee:langata_low_voltage_lines' },
ratio: 1,
serverType: 'GeoServer'
})
});
// layers from GeoServer (format WMS)
var mv_lines = new OpenLayer.layer.Image({
//extent: [-13884991, 2870341, -7455066, 6338219],
source: new OpenLayer.source.ImageWMS({
url: 'http://localhost:8080/GeoServer/gsomee/wms',
params: { 'layers':
'gsomee:langata_medium_voltage_lines' },
ratio: 1,
serverType: 'GeoServer'
})
});
// layers from GeoServer (format WMS)
var meterboxes = new OpenLayer.layer.Image({
//extent: [-13884991, 2870341, -7455066, 6338219],
source: new OpenLayer.source.ImageWMS({
url: 'http://localhost:8080/GeoServer/gsomee/wms',
params: { 'layers': 'gsomee:langata_meterboxes' },
ratio: 1,
serverType: 'GeoServer'
})
});
// layers from GeoServer (format WMS)
var secondary_substation = new OpenLayer.layer.Image({
//extent: [-13884991, 2870341, -7455066, 6338219],
source: new OpenLayer.source.ImageWMS({
url: 'http://localhost:8080/GeoServer/gsomee/wms',
params: { 'layers':
'gsomee:langata_secondary_substation' },
ratio: 1,
serverType: 'GeoServer'
})
});
// layers from GeoServer (format WMS)
var primary_substation = new OpenLayer.layer.Image({
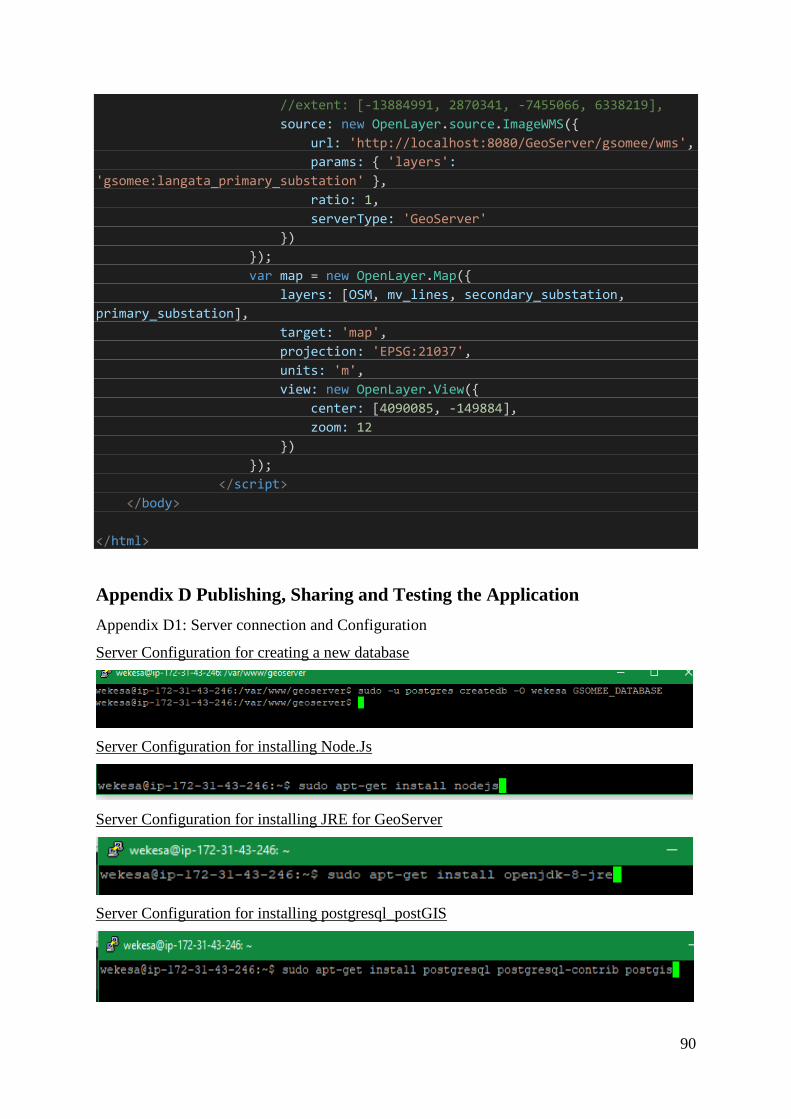
90
//extent: [-13884991, 2870341, -7455066, 6338219],
source: new OpenLayer.source.ImageWMS({
url: 'http://localhost:8080/GeoServer/gsomee/wms',
params: { 'layers':
'gsomee:langata_primary_substation' },
ratio: 1,
serverType: 'GeoServer'
})
});
var map = new OpenLayer.Map({
layers: [OSM, mv_lines, secondary_substation,
primary_substation],
target: 'map',
projection: 'EPSG:21037',
units: 'm',
view: new OpenLayer.View({
center: [4090085, -149884],
zoom: 12
})
});
</script>
</body>
</html>
Appendix D Publishing, Sharing and Testing the Application
Appendix D1: Server connection and Configuration
Server Configuration for creating a new database
Server Configuration for installing Node.Js
Server Configuration for installing JRE for GeoServer
Server Configuration for installing postgresql_postGIS
Related Documents


