UOBKayHian Singapore Daily Monday, April 29, 2013 Please see important notice on last page Page 1 of 19 AT A GLANCE Corporate Page 18 Aussino: Board rejects advice to withdraw RTO. Sembcorp: Eyes another Indian power plant. SGX: To raise fees for mainboard listing. Zhongmin Baihui: Opens its 10th store in China. Economics Page 18 Economy: S'pore March factory output falls 4.1% yoy: EDB. KEY HIGHLIGHTS Sector Regional Plantation Page 2 Lower 2013 CPO price assumption to RM2,500/tonne due to slow recovery in CPO prices and slower-than-expected drawdown of inventory. Property Page 4 Residential measures prompt further switching. Results Ascott Residence Trust (ART SP/BUY/S$1.46/Target: S$1.57) Page 6 1Q13: Better positioned for acquisitions. CapitaLand (CAPL SP/BUY/S$3.65/Target: S$4.41) Page 9 1Q13: Residential sales gathering pace. CDL Hospitality Trusts (CDREIT SP/HOLD/S$2.05/Target: S$2.36) Page 12 1Q13: Weaker results but acquisitions to boost future performance. Yangzijiang Shipbuilding Holdings (YZJ SP/BUY/S$0.96/Target: S$1.22) Page 15 1Q13: Earnings drop 30% yoy, as expected. Stock Price Chg Volume (S$) (%) (’000) Golden Agri-Resources 0.57 0.0 57,941 Genting Singapore 1.52 2.7 48,030 Liongold Corp 1.17 3.6 29,929 CapitaLand 3.65 2.0 24,465 Thai Beverage 0.58 0.0 19,606 Stock Price Chg Volume (S$) (%) (’000) Liongold Corp 1.17 3.6 29,929 Sinarmas Land 0.45 3.4 3,142 Parkson Retail Asia 1.65 3.1 538 Capitamall Trust 2.34 3.1 11,281 People's Food Holdings 1.48 2.8 3,226 Stock Price Chg Volume (S$) (%) (’000) STX OSV Holdings 1.07 (4.1) 18,189 M1 3.17 (3.1) 2,723 Ezion Holdings 2.00 (2.9) 4,729 Del Monte Pacific 0.82 (2.4) 1,042 Silverlake Axis 0.68 (2.2) 526 Note: Based on top 100 stocks by market capitalisation Top Volume Top Gainers Top Losers 2012 2013F 2014F GDP (% yoy) US 2.2 1.5 3.0 Euro Zone (0.6) (0.8) (0.2) Japan 2.0 1.5 2.3 Singapore 1.3 3.0 3.8 Malaysia 5.6 5.5 5.2 Thailand 6.4 4.0 5.2 Indonesia 6.2 6.3 6.4 Hong Kong 1.4* 3.6 3.9 China 7.8 8.0 8.2 2012 2013F 2014F Brent (US$/bbl) 108.8 110 110 Aluminium (US$/mt) 2,066 2,071 2,100 Copper (US$/mt) 7,955 7,535 7,500 Gold Price London (US$/ounce) 1,671 1,669 1,700 Iron Ore (USc/dmtu) 128 149 155 CPO (US$/mt) 921 806 970 BDI 919 1,200 1,500 * Forecast Source: Bloomberg, UOB Kay Hian Key Assumptions Prev Close 1D % 1W % 1M % YTD % DJIA 14712.6 0.1 1.1 0.9 12.3 S&P 500 1582.2 (0.2) 1.7 0.8 10.9 FTSE 100 6426.4 (0.3) 2.2 0.2 9.0 AS30 5082.7 (0.0) 3.5 2.1 9.0 CSI 300 2447.3 (0.8) (3.4) (1.9) (3.0) FSSTI 3348.9 0.3 1.7 1.2 5.7 HSCEI 10834.1 0.6 2.3 (0.6) (5.3) HSI 22547.7 0.7 2.4 1.1 (0.5) JCI 4978.5 (0.3) (0.4) 0.8 15.3 KLCI 1711.3 0.3 0.3 2.4 1.3 KOSPI 1944.6 (0.4) 2.0 (3.0) (2.6) Nikkei 225 13884.1 (0.3) 4.3 12.0 33.6 SET 1582.9 0.6 2.4 1.4 13.7 TWSE 8022.1 0.0 1.2 1.3 4.2 BDI 871 (0.1) (1.9) (6.4) 24.6 CPO (RM/mt) 2290 0.9 0.5 (3.8) 2.6 Nymex Crude (US$/bbl) 93 (0.4) 4.4 (4.7) 0.9 Source: Bloomberg Key Indices

Welcome message from author
This document is posted to help you gain knowledge. Please leave a comment to let me know what you think about it! Share it to your friends and learn new things together.
Transcript

UOBKayHian
Singapore Daily Monday, April 29, 2013
Please see important notice on last page Page 1 of 19
AT A GLANCE
Corporate Page 18 Aussino: Board rejects advice to withdraw RTO. Sembcorp: Eyes another Indian power plant. SGX: To raise fees for mainboard listing. Zhongmin Baihui: Opens its 10th store in China.
Economics Page 18 Economy: S'pore March factory output falls 4.1% yoy: EDB.
KEY HIGHLIGHTS
Sector Regional Plantation Page 2 Lower 2013 CPO price assumption to RM2,500/tonne due to slow recovery in CPO prices and slower-than-expected drawdown of inventory. Property Page 4 Residential measures prompt further switching.
Results Ascott Residence Trust (ART SP/BUY/S$1.46/Target: S$1.57) Page 6 1Q13: Better positioned for acquisitions. CapitaLand (CAPL SP/BUY/S$3.65/Target: S$4.41) Page 9 1Q13: Residential sales gathering pace. CDL Hospitality Trusts (CDREIT SP/HOLD/S$2.05/Target: S$2.36) Page 12 1Q13: Weaker results but acquisitions to boost future performance. Yangzijiang Shipbuilding Holdings (YZJ SP/BUY/S$0.96/Target: S$1.22) Page 15 1Q13: Earnings drop 30% yoy, as expected.
Stock Price Chg Volume (S$) (%) (’000)
Golden Agri-Resources 0.57 0.0 57,941 Genting Singapore 1.52 2.7 48,030 Liongold Corp 1.17 3.6 29,929 CapitaLand 3.65 2.0 24,465 Thai Beverage 0.58 0.0 19,606
Stock Price Chg Volume (S$) (%) (’000)
Liongold Corp 1.17 3.6 29,929 Sinarmas Land 0.45 3.4 3,142 Parkson Retail Asia 1.65 3.1 538 Capitamall Trust 2.34 3.1 11,281 People's Food Holdings 1.48 2.8 3,226
Stock Price Chg Volume (S$) (%) (’000)
STX OSV Holdings 1.07 (4.1) 18,189 M1 3.17 (3.1) 2,723 Ezion Holdings 2.00 (2.9) 4,729 Del Monte Pacific 0.82 (2.4) 1,042 Silverlake Axis 0.68 (2.2) 526
Note: Based on top 100 stocks by market capitalisation
Top Volume
Top Gainers
Top Losers
2012 2013F 2014F
GDP (% yoy) US 2.2 1.5 3.0 Euro Zone (0.6) (0.8) (0.2) Japan 2.0 1.5 2.3 Singapore 1.3 3.0 3.8 Malaysia 5.6 5.5 5.2 Thailand 6.4 4.0 5.2 Indonesia 6.2 6.3 6.4 Hong Kong 1.4* 3.6 3.9 China 7.8 8.0 8.2
2012 2013F 2014F
Brent (US$/bbl) 108.8 110 110 Aluminium (US$/mt) 2,066 2,071 2,100 Copper (US$/mt) 7,955 7,535 7,500 Gold Price London (US$/ounce) 1,671 1,669 1,700 Iron Ore (USc/dmtu) 128 149 155 CPO (US$/mt) 921 806 970 BDI 919 1,200 1,500
* Forecast Source: Bloomberg, UOB Kay Hian
Key Assumptions
Prev Close 1D % 1W % 1M % YTD %
DJIA 14712.6 0.1 1.1 0.9 12.3 S&P 500 1582.2 (0.2) 1.7 0.8 10.9 FTSE 100 6426.4 (0.3) 2.2 0.2 9.0 AS30 5082.7 (0.0) 3.5 2.1 9.0 CSI 300 2447.3 (0.8) (3.4) (1.9) (3.0) FSSTI 3348.9 0.3 1.7 1.2 5.7 HSCEI 10834.1 0.6 2.3 (0.6) (5.3) HSI 22547.7 0.7 2.4 1.1 (0.5) JCI 4978.5 (0.3) (0.4) 0.8 15.3 KLCI 1711.3 0.3 0.3 2.4 1.3 KOSPI 1944.6 (0.4) 2.0 (3.0) (2.6) Nikkei 225 13884.1 (0.3) 4.3 12.0 33.6 SET 1582.9 0.6 2.4 1.4 13.7 TWSE 8022.1 0.0 1.2 1.3 4.2
BDI 871 (0.1) (1.9) (6.4) 24.6 CPO (RM/mt) 2290 0.9 0.5 (3.8) 2.6 Nymex Crude (US$/bbl) 93 (0.4) 4.4 (4.7) 0.9 Source: Bloomberg
Key Indices

Singapore Daily Monday, April 29, 2013
Please see important notice on last page Page 2 of 19
Plantation – Regional
Stubbornly High Inventory
Stubbornly high inventories and pressure from the weakness in crude oil prices weigh on the crude palm oil price uptrend despite a demand recovery. Distortion in demand due to policy changes has resulted in a slowdown in biodiesel demand while edible oils supply is expected to improve in 2013 due to better weather condition. We have cut our average crude CPO price for 2013 to RM2,500/tonne from RM2,900/tonne. Maintain UNDERWEIGHT.
What’s New We cut 2013 CPO price forecast to RM2,500/tonne from RM2,900/tonne
on the back of a) Stubbornly high inventory. The drawdown in the record palm oil
stocks was slower than expected, causing CPO price to trade sideways, mainly due to the high carryover inventory in 2012 and lack of demand from the energy sector.
b) Policy changes distort demand. Weaker external demand is expected for biodiesel as: a) edible oil base methyl ester (biodiesel) is losing market share to used/waste oil as a biodiesel feedstock, and b) biodiesel demand from Europe has been slowing down after Spain cut its biodiesel mandate in Feb 13.
c) Edible oils supply outlook improves. Better weather conditions for the past one year have led to stronger CPO production from Malaysia, with 1Q13 CPO production increasing 15% yoy. Stock-to-usage ratio for soybean in 2012/13 has been revised to 22.3% from the 21.9% reported by Oil World in Dec 12. This indicates that more soybeans will be available in the market.
Action Maintained UNDERWEIGHT. Plantation stocks are unlikely to outperform
when CPO prices trade sideways. However, Indonesian plantation companies are better positioned as their estates’ younger age profile translates into stronger production growth. SELL Golden Agri-Resources (GGR SP/SELL/Target: S$0.55) and Genting Plantations (GENP MK/SELL/Target: RM6.80). BUY Wilmar International (WIL SP/BUY/Target: S$3.80), IOI Corporation (IOI MK/BUY/Target: RM5.70), First Resources (FR SP/BUY/Target: S$2.35) and Bumitama Agri (BAL SP/BUY/Target: S$1.12).
Assumption Changes We lower our CPO price assumption for 2013 to RM2,500/tonne from
RM2,900/tonne, and maintain the assumption of RM2,950/tonne for 2014.
Peer Comparison Share
Company Ticker Rec Price Target Price
Market Cap ------------PE (x)------------- ROE P/B Div
Div Yield
(RM) (RM) (US$m) 2012 2013F 2014F (%) (x) (sen) (%) Genting Plant GENP MK SELL 8.70 6.80 2,175 20.2 28.7 16.6 9.8 1.9 9.1 1.0 Sime Darby SIME MK HOLD 9.44 9.75 18,692 13.5 15.9 14.3 16.6 2.2 29.8 3.2 KL Kepong KLK MK HOLD 21.38 20.05 7,502 21.2 21.3 16.0 17.1 3.2 50.3 2.4 IJM Plantations IJMP MK HOLD 3.07 3.00 811 23.7 20.5 14.3 7.7 1.7 7.6 2.5 IOI Corporation IOI MK BUY 5.04 5.70 10,610 18.8 18.4 15.0 14.5 2.5 15.1 3.0 Felda Global* FGV MK NR 4.56 NA 5,532 16.2 19.6 17.9 12.6 2.8 12.3 2.7 (S$) (cent) Golden Agri-Res GGR SP SELL 0.565 0.550 5,859 13.7 15.9 13.3 4.9 0.6 0.4 0.6 Mewah Int’l MII SP SELL 0.470 0.450 572 22.5 21.8 10.6 4.4 1.0 0.5 1.1 Kencana Agri KAGR SP SELL 0.305 0.320 283 70.7 24.9 10.3 7.6 1.2 0.2 0.8 Indofood Agri Res IFAR SP HOLD 1.14 1.25 1,321 12.3 13.4 10.8 7.9 0.9 1.7 1.5 Wilmar Int’l WIL SP BUY 3.37 3.80 17,412 13.9 13.0 11.2 9.1 1.2 6.1 1.8 First Resources FR SP BUY 1.73 2.35 2,214 10.5 12.7 10.1 23.9 1.9 4.4 2.6 Bumitama Agri BAL SP BUY 1.02 1.12 1,448 21.8 17.1 13.8 18.2 2.9 0.0 0.0 (Rp) (Rp) Astra Agro Lestari AALI IJ HOLD 17,400 20,000 2,818 11.4 13.5 11.2 28.1 3.0 643.7 3.7 BW Plantation BWPT IJ HOLD 970 1,050 404 14.9 17.2 11.7 17.0 2.4 9.7 1.0 Sampoerna Agro LSIP IJ BUY 1,730 2,150 1,214 10.6 11.8 9.7 18.4 1.9 65.4 3.8 London Sumatra SGRO IJ BUY 2,050 2,550 399 11.8 12.0 8.8 12.9 1.5 34.1 1.7
* Based on consensus Source: Bloomberg, UOB Kay Hian
UNDERWEIGHT (Maintained)
Sector Update Top Picks
Company Rec Target Share Price Price (lcl crcy) (lcl crcy) Golden Agri SELL 0.55 0.565 Genting Plant. SELL 6.80 8.70 Mewah SELL 0.450 0.470 Kencana Agri SELL 0.320 0.305
Source: Bloomberg, UOB Kay Hian
CPO Price Trading Sideways
30
50
70
90
110
130
150
170
190
06 07 08 09 10 11 12 13
CPO Price
Crude Oil Price
(US$/barrel)
Source: Bloomberg
High Carry Forward Inventory For 2012
-5
0
5
10
15
20
25
30
35
6
7
8
9
10
11
12
2008 2009 2010 2011 2012
(%)(m tonnes)
Ending Stock
yoy % chg
Source: Oil World
Analysts
Regional Research Team +65 6535 6868 [email protected]

Singapore Daily Monday, April 29, 2013
Please see important notice on last page Page 3 of 19
Essentials Slower price recovery. Ytd, CPO spot price averaged RM2,318/tonne as
at 25 Apr 13 and 3-month futures contract price was RM2,309/tonne. The recovery was behind expectation on the back of stronger production in 1Q13 and market sentiment being hurt by policy changes in consuming countries. This led to expectations of a slower-than-usual inventory drawdown for 1Q13.
Pressure from weakness in crude oil price. The weakness in crude oil prices adds downward pressure on CPO prices due to the use of biodiesel as a substitute for crude oil. Crude oil prices are now lower than CPO prices, which leaves the non-subsidised biodiesel blend looking unattractive and pushes CPO prices lower.
High carryover palm oil inventory. The current high levels of palm oil inventories in Malaysia and Indonesia are mainly due to high carryover inventories from 2012. Based on Oil World’s estimation, global palm oil inventory stands at 11.5m tonnes and has set a new record due to lacklustre demand in 2012. Palm oil inventory in Malaysia was at a record high of 2.63m tonnes as at end-12 while Indonesia’s inventory stood at 3.9m tonnes (+23.8% yoy).
Seasonal pick-up… As we are entering the high demand season in 2Q and 3Q due to the coming festive season and are exiting the winter season in the Northern Hemisphere, exports are likely to pick up gradually. For 2013, we are expecting palm oil consumption to grow by 3.5m tonnes on better economic growth vs production growth of 2.6m tonnes. 2014 will then have a better start with slightly lower carryover inventory as compared with the beginning of 2013.
… but demand growth might be capped by high inventory at importing countries. Strong purchases of edible oils by China and India in 2011-12 has boosted both countries’ stocks to record levels, which may curtail their near-term demand. Total edible oils stocks at ports and pipelines in India had increased to 1.96m tonnes as at 1 Mar 13, which represent the country's consumption needs of nearly 40 days against the usual 30 days. In China, palm oil inventory touched a record high of about 1.5m tonnes in mid-Apr 13, in the wake of record imports over the last four months. This is equivalent to 3 months’ stocks vs the usual 1.0-1.5 months previously.
Price recovery likely in 4Q13. We expect CPO price to show a slow uptrend from mid-13 as festive demand kicks in and expect Malaysia’s domestic demand to pick up by late-3Q13 on B10 biodiesel blend rolling out in the southern and northern regions. Also, Argentina’s government has decided to increase mandatory admixture of biodiesel from B7 to B8 by April, B9 by May and B10 by June. This will increase domestic biodiesel usage and mitigate the poor biodiesel export demand.
Be prepared for 1H13 weak results season. Although strong yoy CPO production growth were reported in 1Q13, plantation companies are likely to report weaker or flat yoy and weaker qoq results. Pure upstream players are expected to experience low earnings on the back of a) Lower ASP. Ytd, the ASP for CPO was RM2,323/tonne for Malaysia
spot prices and an average of US$841/tonne for Rotterdam c.i.f. b) Higher cost of production on wages adjustment. Rising labour
cost would translate into thinner profit margin for plantation companies especially plantation companies with large exposure in Indonesia market due to the sharp revision on minimum wage of 17-44% in 2013. The wage adjustment is likely to spread over 1Q13 and 2Q13 as some wage negotiations were completed only in late Mar/Apr 13.
Sector Catalysts Adverse weather conditions. Risks Reversal of the biodiesel policy, eg Spain has revised its biodiesel
mandate from 7% to 4.1%.
China’s Palm Oil Inventory Has Doubled From Its Low In Sep 12
China: Palm Oil Stock at Ports
200400
600800
1,0001,200
1,4001,600
Apr-12 Jun-12 Aug-12 Oct-12 Dec-12 Feb-13 Apr-13
('000 tonnes)
Source: MPOC, Pansun Indian Edible Oil Stocks At Record High Too
1,200
1,400
1,600
1,800
2,000
2,200
Apr-12 Jun-12 Aug-12 Oct-12 Dec-12 Feb-13 Apr-13
('000 tonnes) India: Edible Oils Stocks Position &
Source: The Solvent Extractors’ Association of India Earnings Revision With CPO Price Adjustment
2013 EPS Company Old New % Chg Malaysia (sen) (sen) GENP 43.5 30.4 (30.1) KLK 122.4 100.6 (17.8) IJMP 17.3 15.0 (13.3) IOI 28.4 27.3 (3.8) SIME 59.5 59.5 0.0 Singapore (cent) (cent) KAGR 2.3 1.2 (47.8) FR 17.2 13.8 (19.8) GGR 4.4 3.6 (18.7) IFAR 10.4 8.8 (15.4) WIL 26.8 25.0 (6.4) BAL 6.7 6.7 (0.0) Indonesia (Rp) (Rp) BWPT 80 56 (29.4) SGRO 211 170 (19.3) LSIP 176 146 (17.0) AALI 1,547 1,287 (16.8)
* EPS based on FY14 **CPO price assumption revised to RM2,500/tonne in previous report. Source: UOB Kay Hian
Higher Production yoy Offset By Lower Selling Prices CPO Production (tonnes)
1Q13 yoy % chg
qoq % chg
Kulim 51,545 50.8 (26.9) Genting Plant (FFB) 364,016 32.3 (20.9) IJM Plant 39,456 31.4 (28.6) Sarawak Oil Palm 80,691 28.5 (20.3) Astra Agro* 243,207 27.7 (19.4) Hap Seng Plant 39,706 20.3 (23.4) IOI 160,268 20.0 (25.1) KLK 185,478 18.7 (19.9) BW Plantations 30,195 10.1 (7.0) Sime 548,216 5.2 (23.3) First Resources 114,898 4.3 (28.9) United Plantations 48,032 1.4 (21.6) Felda Global 630,601 NA (33.5) CPO Price (RM/tonne)
2,302 (27.8) 6.1
* 2M13 CPO Production Source: Respective Companies, MPOB

Singapore Daily Monday, April 29, 2013
Please see important notice on last page Page 4 of 19
Property – Singapore
Residential Measures Prompt Further Switching
The seventh round of residential measures prompted further switching into the industrial, office and retail sectors. With the moderation in residential price appreciation, the threat of new measures has subsided. We prefer deep value and diversified stocks with exposure to the office sector, where demand is accelerating. Top picks include Suntec REIT, CapitaCommercial Trust, OUE and Ho Bee.
What’s New Urban Redevelopment Authority’s (URA) real estate statistics for 1Q13
show that prices of residential, office, retail and industrial properties changed 0.6% qoq (4Q12: 1.8%), 2.1% (0.3%), 2.1% (-0.2%) and 4.5% (-0.7%) respectively. Rentals for residential, office, retail and industrial properties adjusted in tandem by 0.8% (4Q12: 0.7%), -0.2% (-0.3%), -0.6 % (0.2%) and 0.4% (3.9%) respectively.
Action The slowdown in residential prices follows the seventh round of property
measures in Jan 13. We anticipate that residential volumes will moderate by 20-40% yoy and prices to correct by 3-8% as investment demand slows. We prefer deep value and diversified stocks with exposure to the office sector. Top picks include Suntec REIT, CapitaCommercial Trust, OUE and Ho Bee.
Essentials Residential price growth moderating, threat of new measures
subside. Price growth continued to be led by mass-market homes, which were up 1.4%, while high-end and mid-tier homes were up 0.6% and 0.2% respectively. Developer sales volumes picked up to 5,412 units compared with 4,353 units in 4Q12 although resale transactions as a proportion of total transactions fell to 25% from 41% in 4Q12. Given the slower qoq price growth, the threat of more stringent measures appear to be subsiding, with DPM Tharman recently stating that home prices are moving in the right direction relative to incomes. However, the government will be closely monitoring the property market for any signs of overheating.
Retail segment saw a slight 0.6% dip in rents but expected to remain stable. Retail rentals dipped 0.6% reversing from a 0.2% growth in 4Q12 as occupancies fell by 0.3ppt to 94.5%. Rentals are expected to remain stable due to strong occupancies, rising wages and full employment. Measures targeting retail shop sizes, which were launched in end-1Q13 may impact strata demand in the medium term.
Peer Comparison Price Target Upside/ Market Curr Fwd Curr Fwd Book Price/ RNAV Net Company Ticker Rec 26 Apr 13 Price (Downside) Cap. PE PE Yield Yield NAV ps Book ps ROE Gearing * (S$) (S$) to TP (%) (US$m) (x) (x) (%) (%) (S$) (x) (S$) (%) (%) Developers CapitaLand CAPL SP BUY 3.65 4.41 20.8 12,553.8 19.5 16.7 2.2 2.5 3.55 1.03 5.18 6.2 44.7 City Devt CIT SP HOLD 11.34 12.19 7.5 8,330.5 14.6 12.7 1.3 1.4 8.03 1.41 13.55 9.6 25.0 GuocoLand GUOL SP HOLD 2.32 2.39 3.0 2,217.8 10.1 9.5 3.4 3.4 1.96 1.18 2.98 2.7 191.6 Ho Bee HOBEE SP BUY 2.08 2.45 17.8 1,140.1 13.2 14.5 1.4 1.4 2.58 0.81 3.07 10.9 16.6 Keppel Land KPLD SP BUY 4.01 5.11 27.4 5,007.8 14.9 14.3 3.0 3.0 4.11 0.98 5.37 14.3 30.9 OUE OUE SP BUY 3.1 3.36 8.4 2,278.8 24.6 19.8 2.3 2.6 3.49 0.89 4.20 2.9 62.1 Wheelock WP SP BUY 1.945 2.41 23.9 1,880.2 21.7 17.3 3.1 3.1 2.61 0.74 3.01 2.1 (14.1) Wing Tai WINGT SP BUY 2.1 2.35 11.9 1,328.5 6.8 9.1 2.9 2.9 2.91 0.72 2.93 12.1 15.1 REITs Ascendasreit AREIT SP HOLD 2.67 2.86 7.1 5,175.7 19.1 17.6 5.3 5.8 1.94 1.37 1.94 7.1 28.4 AscottREIT ART SP BUY 1.455 1.57 7.6 1,480.9 28.0 26.4 5.8 6.1 1.35 1.07 1.45 4.4 35.1 CACHE CACHE SP BUY 1.4 1.52 8.6 875.7 18.7 17.2 6.2 6.5 0.98 1.43 1.01 6.4 28.8 CapitaComm CCT SP BUY 1.695 2.00 18.0 3,895.9 23.1 23.2 4.7 4.7 1.64 1.03 1.78 4.3 29.7 CapitaMall CT SP BUY 2.34 2.54 8.5 6,535.4 24.3 22.9 4.4 4.6 1.67 1.40 1.64 5.2 34.3 CDL Htrust CDREIT SP BUY 2.05 2.36 15.1 1,606.5 16.7 16.2 5.7 5.8 1.61 1.27 1.62 6.9 24.8 FrasersCT FCT SP BUY 2.3 2.51 9.1 1,531.2 21.8 21.6 4.8 4.8 1.54 1.49 1.53 6.5 30.5 Kep REIT KREIT SP BUY 1.515 1.64 8.3 3,275.9 34.7 32.2 5.1 5.3 1.31 1.15 1.34 3.4 40.2 MapletreeInd MINT SP BUY 1.575 1.75 11.1 2,088.7 17.4 16.6 5.9 6.2 1.10 1.43 1.15 8.3 34.8 MapletreeLog MLT SP BUY 1.31 1.41 7.6 2,573.9 17.4 16.7 5.4 5.7 0.92 1.43 1.00 7.2 33.8 Sabana REIT SSREIT SP HOLD 1.35 1.40 3.7 699.7 15.6 17.0 7.1 6.7 1.09 1.24 1.09 7.3 36.6 Starhill Gbl SGREIT SP BUY 0.965 1.03 6.7 1,514.8 18.6 18.2 4.8 5.0 0.88 1.10 0.88 5.6 30.1 Suntec REIT SUN SP BUY 1.965 2.27 15.5 3,575.6 39.1 31.4 4.6 4.8 2.06 0.95 2.06 1.4 36.1
* Property Developers: Net Debt to Shareholder Equity * REITs: Net Debt to Total Assets Source: Bloomberg, UOB Kay Hian
OVERWEIGHT (Maintained)
Sector Update Top Sector Picks
Company Rec Target Share Upsi
de Price Price % (S$) (S$) CapitaComm BUY 2.00 1.695 18% Ho Bee BUY 2.45 2.08 18% OUE BUY 3.36 3.10 8% Suntec REIT BUY 2.27 1.965 16%
Source: UOB Kay Hian Overall Price Index
0
50
100
150
200
250
1Q04 1Q06 1Q08 1Q10 1Q12
Indust rial
Office
Res idential
Retail
Source: URA, UOB Kay Hian Price Trend
1Q13 4Q12 Residential 0.6% 1.8% Office 2.1% 0.3% Retail 2.1% -0.2% Industrial 4.5% -0.7%
Source: URA Analysts Vikrant Pandey [email protected] +65 6590 6623
Terence Khi [email protected] +65 6590 6614

Singapore Daily Monday, April 29, 2013
Please see important notice on last page Page 5 of 19
Factory and warehouse occupancies remained high at 93% although strong investment demand led to a 4.5% rise in prices, reversing from a 0.7% correction in 4Q12 and despite a new Sellers’ Stamp Duty imposed in January. Multi-user warehouses saw the fastest rise of 10.6% due to limited supply in the sector and greater transactions of industrial properties with longer leases.
Net demand for office space is accelerating, with 270,000sf of space occupied in 1Q13, up 48% from 183,000sf in 4Q12. This led to a 20bp rise in office occupancy to 90.6%. Office rentals are also bottoming, falling by 0.2% vs a 0.3% drop in 4Q12. Office leasing momentum is strongly supported by the 50% of pre-commitments for space due for completion in 2013.
Assumption Changes None. We expect residential prices to correct by 3-8% as demand slows.
Office rentals are anticipated to bottom in 2013, and rise 8% in 2014 as demand accelerates. Retail rentals are expected to remain resilient, rising 0-2% in 2013 while industrial rental growth will similarly be subdued at 0-2% in light of increasing factory and warehouse supply.
Sector Catalysts
Rise in residential take-up supported by price discounts, improving affordability, rising wages and stable job prospects.
Pick-up in manufacturing and trade, rising industrial demand and new foreign direct investments into Singapore
Positive newsflow on office pre-leasing activity, office conversions and improving liquidity at benchmark levels.
Improving outlook for retail rentals, consumer spending, wage increments and mall occupancies.
Risks Additional government measures targeting speculative residential,
industrial and retail demand. A weaker-than-expected pick-up in demand depressing rentals and
capital values in the office and industrial segments. URA Rental Indices By Segment Private Residential – Type of sale
0
50
100
150
200
250
1Q04 1Q06 1Q08 1Q10 1Q12
Indus tria l
Office
Res identia l
Reta il
0%
10%
20%
30%
40%
50%
60%
70%
80%
4Q09 1Q10 2Q10 3Q10 4Q10 1Q11 2Q11 3Q11 4Q11 1Q12 2Q12 3Q12 4Q12 1Q13
0
2,000
4,000
6,000
8,000
10,000
12,000
New Sale Sub sale Resale Newsale (%) Sub sale(%) Re sale(%)
Source: URA, UOB Kay Hian Source: URA, UOB Kay Hian
Private Residential Transactions (OverallBuyer Profile)
71% 73% 73% 71% 70% 68% 68% 69%77% 76% 73% 74% 77%
15% 13% 13% 13% 13% 14% 13% 12%
16% 16% 19% 18% 12%
12% 11% 11% 12% 15% 15% 17% 16%
6% 7% 7% 7% 10%2% 3% 3% 4% 3% 3% 2% 3% 1% 0% 1% 1% 0%
0%
10%
20%
30%
40%
50%
60%
70%
80%
90%
100%
2010Q12010Q22010Q32010Q42011Q12011Q22011Q32011Q42012Q12012Q22012Q32012Q42013Q1
Singaporeans Permanent Residents Foreigners Company
Source: URA, UOB Kay Hian Property Price Indices (Private vs Public)
0
50
100
150
200
250
1Q91 1Q93 1Q95 1Q97 1Q99 1Q01 1Q03 1Q05 1Q07 1Q09 1Q11 1Q1
4Q98=100
URA Private Residential Index
HDB Resale Price Index
Source: URA, UOB Kay Hian Private Property Price Index by Segment
70
90
110
130
150
170
190
210
230
1Q04 1Q05 1Q06 1Q07 1Q08 1Q09 1Q10 1Q11 1Q12 1Q13
High-End
Mid-Tier
Mass Market
Source: URA, UOB Kay Hian

Singapore Daily Monday, April 29, 2013
Please see important notice on last page Page 6 of 19
Ascott Residence Trust (ART SP)
BUY (Maintained)
Company Results
Share Price S$1.46
Target Price S$1.57
Upside +7.6%
(Previous TP S$1.52) Company Description
Ascott Residence Trust owns and operates serviced residence units internationally in the key cities of Europe, Asia Pacific and the Middle East.
Stock Data
GICS sector Financials
Bloomberg ticker: ART SP
Shares issued (m): 1,259.8
Market cap (S$m): 1,833.0
Market cap (US$m): 1,480.7
3-mth avg daily t'over (US$m): 2.0
Price Performance (%)
52-week high/low S$1.47/S$1.04
1mth 3mth 6mth 1yr YTD
6.2 2.8 12.4 32.3 7.0
Major Shareholders %
CapitaLand 49.0
FY13 NAV/Share (S$) 1.44
FY13 Net Debt/Share (S$) 0.63
Price Chart
80
90
100
110
120
130
0.90
1.00
1.10
1.20
1.30
1.40
1.50
(%)(lcy)ASCOTT RESIDENCE TRUST
Ascott Residence Trust/FSSTI Index
0
5
10
15
20
Apr 12 Jun 12 Aug 12 Oct 12 Dec 12 Feb 13 Apr 13
Volume (m)
Source: Bloomberg
Analysts
Vijay Natarajan +65 6590 6626 [email protected] Vikrant Pandey +65 6590 6623 [email protected]
1Q13: Better Positioned For Acqusitions
Results were in line with expectations. The weaker performance in Singapore and Vietnam was partly offset by a stronger performance in China and Japan. This is the first quarter of forex gains after nine consecutive quarters of forex losses, boosting DPU. Looking ahead, AEIs and acquisitions will continue to enhance yields in the coming years. Maintain BUY and increase target price S$1.57 (previously S$1.52).
1Q13 Results Year to 31 Dec 1Q13 yoy Remarks
(S$m) % chg Gross Revenue 69.2 (3) Gross Profit 33.8 (9)Distributable Income 27.6 14DPU (cents) 2.25 5RevPAU (S$/day) 124 (10)
Japan and China performed better while RevPAU from Singapore and Vietnam came in lower on weaker demand and disruptions.
Source: ART, UOB Kay Hian
Results Ascott Residence Trust’s (ART) 1Q13 DPU of 2.25 cents (+5% yoy)
was in line with our and consensus expectations. Unitholders distribution rose 14% yoy to S$27.6m on the back of better performances from China and Japan, lower financing costs and an exchange gain.
Finance costs came in 12% lower as ART repaid foreign-currency loans from its recent private placement proceeds.
Master leases and management contracts with minimum guaranteed income accounted for 50% of gross profit, lending stability to the income.
Key Financials Year to 31 Dec (S$m) 2011 2012 2013F 2014F 2015F
Net turnover 289 304 319 330 342
EBITDA 167 170 180 189 198
Operating profit 157 159 166 172 179
Net profit (rep./act.) 180 179 65 70 72
Net profit (adj.) 53 68 65 70 72
EPU (cent) 4.7 6.0 5.2 5.6 5.8
DPU (cent) 8.5 8.8 8.5 9.0 9.3
PE (x) 30.9 24.4 27.9 26.0 25.2
P/B (x) 1.1 1.1 1.0 1.0 1.1
DPU Yld (%) 5.9 6.0 5.8 6.2 6.4
Net margin (%) 62.5 58.9 20.3 21.1 21.0
Net debt/(cash) to equity (%) 70.0 68.8 44.1 46.8 49.5
Interest cover (x) 4.4 4.2 4.9 5.1 5.0
ROE (%) 12.2 11.6 3.9 3.9 4.1
Consensus DPU (cent) n.a. n.a. 8.7 9.0 9.3
UOBKH/Consensus (x) - - 0.97 1.00 1.00
Source: ART, Bloomberg, UOB Kay Hian

Singapore Daily Monday, April 29, 2013
Please see important notice on last page Page 7 of 19
Stock Impact AEI works will continue to enhance yields. During the quarter, ART
completed asset enhancement intitiatives (AEIs) in Citadines Croissette Cannes. Management sees this as an undervalued asset and expects the AEI to boost yields. Recent AEI works in Ascott Jakarta and Citadines Prestige Trafalgar Square London have lifted rentals by up to 30%. Other AEI works in progress include one each in Belgium, Spain, China, Indonesia and Australia.
A weaker 1Q13 for Singapore and Vietnam due to disruptions and slower demand. RevPAU from Singapore declined 11% yoy (on same-store basis) mainly due to disruptions from construction works near Somerset Liang Court while RevPAU from Vietnam declined 5% yoy on weaker market demand. On the other hand, gross profits from Japan (+23%) and China (+23%) came in stronger on the back of higher contributions from new acquisitions and improved market demand. Looking ahead, China, the UK and Indonesia markets are expected to be growth drivers while some weakness are expected in Singapore and Vietnam.
Forex surprises on the upside. Despite the yen sliding 7.7% vs the S$, ART realised a net forex gain of S$2.3m in 1Q13 (vs a loss of S$1.8m in 1Q12) as the euro rebounded 3.3% from Dec 12 lows. This is the first quarter of forex gains after nine consecutive quarters of forex losses. Gains were largely due to repayment of foreign-currency bank loans in 1Q13 using the S$150m placement proceeds.
Gearing up for acquisitions. After the recent private placement raising S$150m, ART’s gearing has dropped to a more comfortable 0.36x giving it a headroom of S$150m-250m. Management will continue to look out for yield-accretive acquisition opportunities, particularly in China and other gateway cities in Asia and Europe. ART’s sponsor, The Ascott Group, has a strong pipeline of more than 30,000 serviced units across Asia Pacific, Europe and the Gulf region.
Earnings Revision/Risk We increase our 2013-15 DPU forecasts by 1-2%, factoring in better
room rates for its newly-refurbished units.
Valuation/Recommendation Maintain BUY with a higher target price of S$1.57 (from S$1.52),
factoring in the increased DPU. Our target price is based on a two-stage dividend discount model (required rate of return: 7.3% and terminal growth rate: 2.0%). ART is currently trading at 2013 and 2014 dividend yield of 5.8% and 6.2% respectively
.
RevPAU
0
50
100
150
200
250
Singapore
Australia
China
Indonesia
Japan*
Philippines
Vietnam
United
Kingdom
Belgium
Spain
Overall
-20
-18
-16
-14
-12
-10
-8
-6
-4
-2
0
1Q13 1Q12 YOY chg
(S$) (%)
*excludes rental housing Source: ART Gross Profit By Region (1Q13)
Source: ART Foreign Exchange Movements
Source: ART Debt Maturity Profile
Source: ART

Singapore Daily Monday, April 29, 2013
Please see important notice on last page Page 8 of 19
Profit & Loss Balance Sheet Year to 31 Dec (S$m) 2012 2013F 2014F 2015F Year to 31 Dec (S$m) 2012 2013F 2014F 2015F
Net turnover 304 319 330 342 Fixed assets 2,835 2,844 2,850 2,852
EBITDA 170 180 189 198 Other LT assets 6 3 3 3
Deprec. & amort. 11 14 16 19 Cash/ST investment 125 243 213 186
EBIT 159 166 172 179 Other current assets 36 36 36 36
Total other non-operating income (13) (20) (20) (20) Total assets 3,003 3,126 3,102 3,077
Associate contributions 0 0 0 0 ST debt 168 168 168 168
Net interest income/(expense) (40) (37) (37) (39) Other current liabilities 124 127 133 140
Pre-tax profit 106 110 116 119 LT debt 1,022 872 872 872
Tax (27) (35) (36) (37) Other LT liabilities 47 47 47 47
Minorities (10) (10) (10) (10) Shareholders' equity 1,547 1,809 1,767 1,725
Net profit 179 65 70 72 Minority interest 94 104 114 124
Net profit (adj.) 68 65 70 72
Total liabilities & equity 3,002 3,126 3,102 3,077
Cash Flow Key Metrics Year to 31 Dec (S$m) 2012 2013F 2014F 2015F Year to 31 Dec (%) 2012 2013F 2014F 2015F
Operating 125 142 151 159 Profitability
Pre-tax profit 200 110 116 119 EBITDA margin 55.9 56.4 57.2 57.9
Tax (21) (35) (36) (37) Pre-tax margin 34.7 34.4 35.0 34.8
Deprec. & amort. 11 14 16 19 Net margin 58.9 20.3 21.1 21.0
Associates (0) (0) (0) (0) ROA 5.9 2.1 2.2 2.3
Working capital changes (19) 6 6 6 ROE 11.6 3.9 3.9 4.1
Non-cash items (66) 37 37 39
Other operating cashflows 20 11 12 12 Growth
Investing 8 (20) (20) (19) Turnover 5.3 5.1 3.4 3.6
Capex (growth) (11) (10) (10) (11) EBITDA 2.0 5.9 4.9 4.8
Investments (350) (12) (12) (10) Pre-tax profit 7.8 4.0 5.3 3.0
Proceeds from sale of assets 375 0 0 0 Net profit (0.7) (63.7) 7.2 3.2
Others (6) 2 2 2 Net profit (adj.) 27.7 (4.4) 7.2 3.2
Financing (147) (4) (161) (167) EPU 26.5 (12.5) 7.2 3.2
Distribution to unitholders (3) (10) (10) (10)
Issue of shares 0 150 0 0 Leverage
Proceeds from borrowings 283 0 0 0 Debt to total capital 42.0 35.2 35.6 36.0
Loan repayment (283) 0 0 0 Debt to equity 76.9 57.5 58.8 60.3
Others/interest paid (144) (144) (151) (157) Net debt/(cash) to equity 68.8 44.1 46.8 49.5
Net cash inflow (outflow) (14) 118 (30) (27) Interest cover (x) 4.2 4.9 5.1 5.0
Beginning cash & cash equivalent
145 125 243 213
Changes due to forex impact (6) 0 0 0 Ending cash & cash equivalent 125 243 213 186

Singapore Daily Monday, April 29, 2013
Please see important notice on last page Page 9 of 19
CapitaLand (CAPL SP)
BUY (Maintained)
Company Results
Share Price S$3.65
Target Price S$4.41
Upside +20.8% Company Description
The CapitaLand group operates in residential and commercial properties, property fund management, and serviced residences.
Stock Data
GICS sector Financials
Bloomberg ticker: CAPL SP
Shares issued (m): 4,257.3
Market cap (S$m): 15,539.0
Market cap (US$m): 12,551.7
3-mth avg daily t'over (US$m): 33.6
Price Performance (%)
52-week high/low S$4.03/S$2.43
1mth 3mth 6mth 1yr YTD
3.1 (8.3) 9.6 24.2 (1.4)
Major Shareholders %
Temasek Hldgs 40.4
FY13 NAV/Share (S$) 3.67
FY13 Net Debt/Share (S$) 1.96
Price Chart
70
80
90
100
110
120
130
140
150
2.00
2.50
3.00
3.50
4.00
4.50
(%)(lcy) CAPITALAND LTD Capitaland Ltd/FSSTI Index
0
20
40
60
Apr 12 Jun 12 Aug 12 Oct 12 Dec 12 Feb 13 Apr 13
Volume (m)
Source: Bloomberg
Analysts
Vikrant Pandey +65 6590 6623 [email protected]
Terence Khi +65 6590 6614 [email protected]
1Q13: Residential Sales Gathering Pace
We expect better earnings in the coming quarters to offset the shortfall this quarter. Management is cautiously optimistic towards the Singapore housing market with a stable outlook for China, underpinned by rapid urbanisation. The acquisition of a prime waterfront mixed development site in Iskandar Malaysia is a long-term positive. Potential monetisation of AustraLand, Storhub and Surbana could further unlock shareholder value. Maintain BUY. Target price: S$4.41.
1Q13 Results Year to 31 Dec (S$m) 1Q13 yoy Remarks
% chg
Turnover 661.9 3.2
Operating Profit 244.2 6.4 Pre-tax Profit 272.2 20.2 Tax (26.2) (8.9) PATMI 188.2 41.2 PATMI(excl. exceptionals) 133.3 70.0 EPS (¢) 4.4 41.9
Strong revenue contribution from development projects in Singapore and China, portfolio gains, as well as rental income and management fees from the Group’s shopping mall business.
EBIT 1Q12 yoy Remarks
Business Segment (S$m) % chg CapitaLand Singapore 110.8 29.6 CapitaLand China 109.1 106.4 CapitaMalls Asia 98.3 16.9 Ascott 7.5 49.0) Corporate and Others 60.4 36.0)
Total 386.1 16.5 Source: CapitaLand, UOB Kay Hian
Results Results below expectations CapitaLand reported 1Q13 net profit of
S$188.2m, up 41% yoy, driven by strong revenue contribution from development projects in Singapore and China, portfolio gains, as well as rental income and management fees from the group’s shopping malls. Excluding the portfolio gains of S$47.5m, revaluation gains of S$8.0m and an impairment loss of S$600,000, the operating net profit of S$133.3m is below our expectation, accounting for 17% of our full-year forecast of S$801.5m. This is mainly due to lower-than-expected contributions from d’Leedon, Bedok Residences and its China projects.
Key Financials
Year to 31 Dec (S$m) 2011 2012 2013F 2014F 2015F
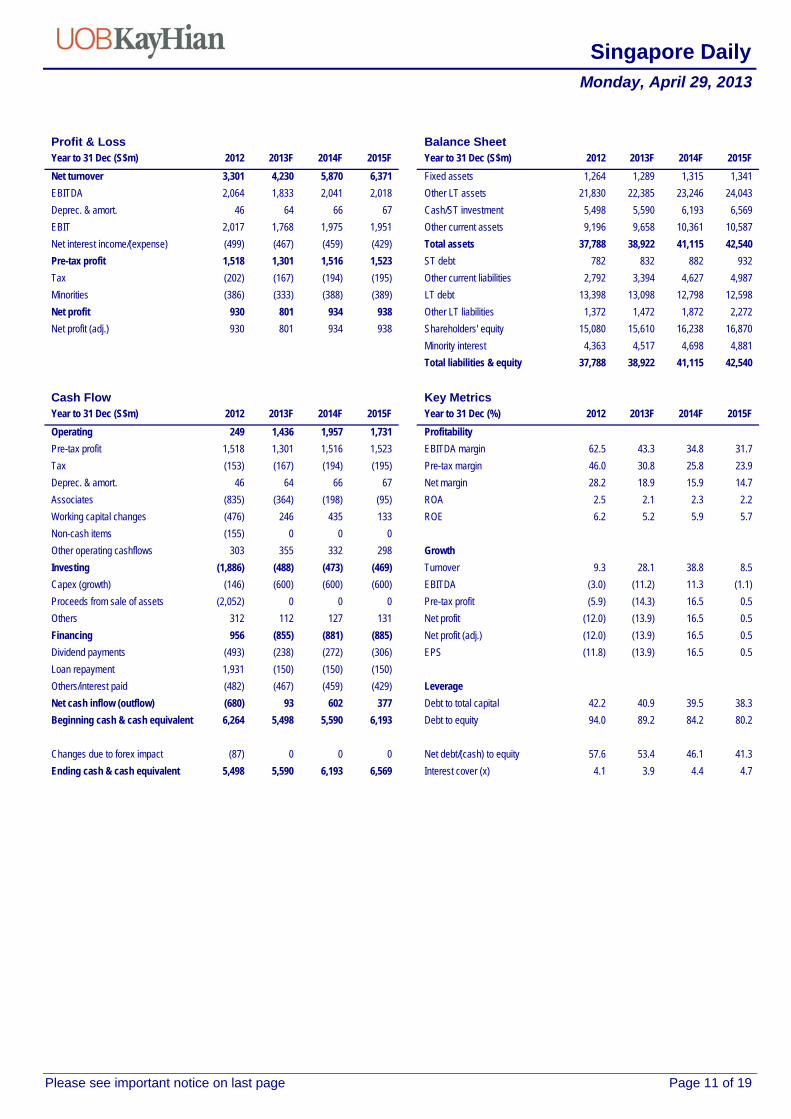
Net turnover 3,020 3,301 4,230 5,870 6,371 EBITDA 2,127 2,064 1,833 2,041 2,018 Operating profit 2,087 2,017 1,768 1,975 1,951 Net profit (rep./act.) 1,057 930 801 934 938 Net profit (adj.) 1,057 930 801 934 938 EPS (cent) 24.8 21.9 18.9 22.0 22.1 PE (x) 14.7 16.7 19.4 16.6 16.5 P/B (x) 1.0 1.0 1.0 1.0 0.9 EV/EBITDA (x) 13.3 13.8 15.5 13.9 14.1 Dividend yield (%) 2.2 1.9 2.2 2.5 2.5 Net margin (%) 35.0 28.2 18.9 15.9 14.7 Net debt/(cash) to equity (%) 39.8 57.6 53.4 46.1 41.3 Interest cover (x) 4.5 4.1 3.9 4.4 4.7 ROE (%) 7.3 6.2 5.2 5.9 5.7 Consensus net profit - - 743 932 971 UOBKH/Consensus (x) - - 1.08 1.00 0.97
Source: CapitaLand Limited, Bloomberg, UOB Kay Hian
Singapore Daily Monday, April 29, 2013
Please see important notice on last page Page 10 of 19
Singapore (46%) and China (36%) remain the key contributors of EBIT. As at end-1Q13, net debt-to-equity ratio was 0.44x (2012: 0.45x) with a
cash position of S$5.4b. Net tangible asset was S$3.50/share (+3% yoy). Stock Impact Singapore residential sales gaining momentum. The strong
residential sales value of S$1.3b from 544 units sold in Singapore matched the full-year sales for 2012. D’Leedon accounted for 88% of the units sold. Management said the incentive schemes (10-15% discounts) were introduced in key projects (d’Leedon and The Interlace) as a strategic move to push sales and reduce high inventory risks (discounts were mainly offered on low-mid floor and bigger units). CapitaLand targets to launch Marine Point and Bishan St 14 in 2H13.
Management is cautiously optimistic towards the housing market in Singapore despite the latest round of residential cooling measures (in Jan 13), citing positive longer-term outlook underpinned by strong economic fundamentals and policies to grow the population. Management is on the look-out for acquisition opportunities in Singapore and intends to maintain an 8-10% share in the Singapore residential market.
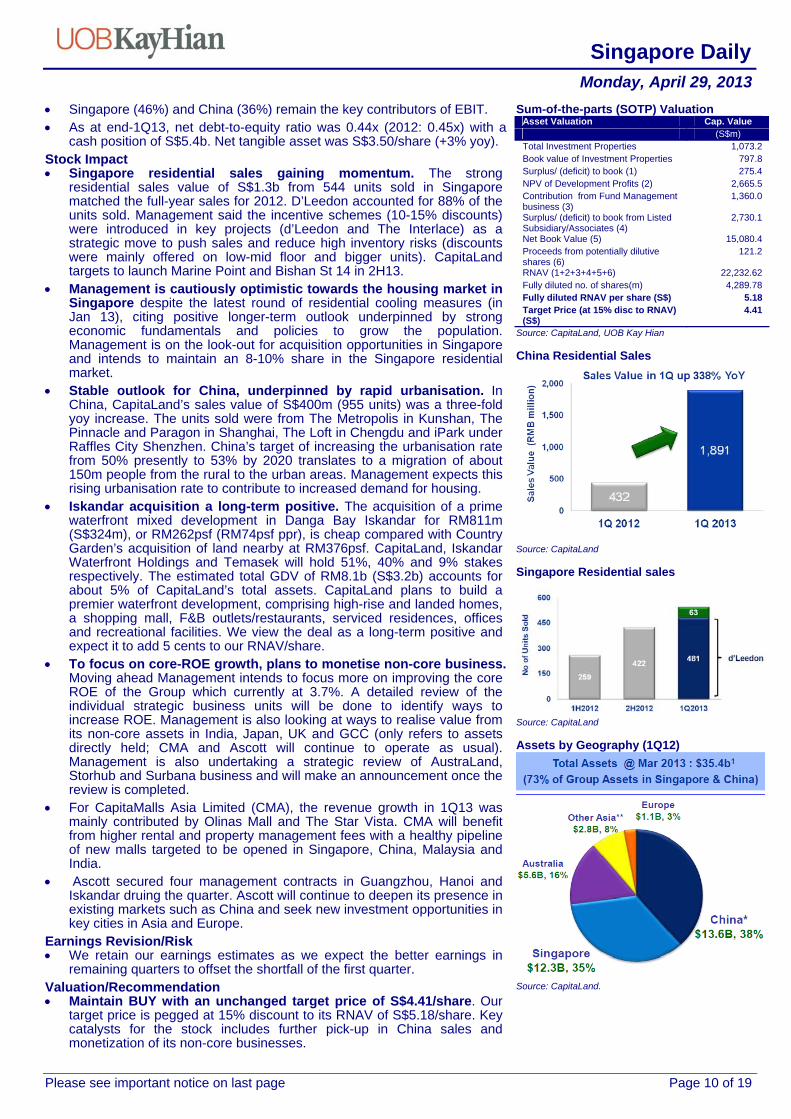
Stable outlook for China, underpinned by rapid urbanisation. In China, CapitaLand’s sales value of S$400m (955 units) was a three-fold yoy increase. The units sold were from The Metropolis in Kunshan, The Pinnacle and Paragon in Shanghai, The Loft in Chengdu and iPark under Raffles City Shenzhen. China’s target of increasing the urbanisation rate from 50% presently to 53% by 2020 translates to a migration of about 150m people from the rural to the urban areas. Management expects this rising urbanisation rate to contribute to increased demand for housing.
Iskandar acquisition a long-term positive. The acquisition of a prime waterfront mixed development in Danga Bay Iskandar for RM811m (S$324m), or RM262psf (RM74psf ppr), is cheap compared with Country Garden’s acquisition of land nearby at RM376psf. CapitaLand, Iskandar Waterfront Holdings and Temasek will hold 51%, 40% and 9% stakes respectively. The estimated total GDV of RM8.1b (S$3.2b) accounts for about 5% of CapitaLand’s total assets. CapitaLand plans to build a premier waterfront development, comprising high-rise and landed homes, a shopping mall, F&B outlets/restaurants, serviced residences, offices and recreational facilities. We view the deal as a long-term positive and expect it to add 5 cents to our RNAV/share.
To focus on core-ROE growth, plans to monetise non-core business. Moving ahead Management intends to focus more on improving the core ROE of the Group which currently at 3.7%. A detailed review of the individual strategic business units will be done to identify ways to increase ROE. Management is also looking at ways to realise value from its non-core assets in India, Japan, UK and GCC (only refers to assets directly held; CMA and Ascott will continue to operate as usual). Management is also undertaking a strategic review of AustraLand, Storhub and Surbana business and will make an announcement once the review is completed.
For CapitaMalls Asia Limited (CMA), the revenue growth in 1Q13 was mainly contributed by Olinas Mall and The Star Vista. CMA will benefit from higher rental and property management fees with a healthy pipeline of new malls targeted to be opened in Singapore, China, Malaysia and India.
Ascott secured four management contracts in Guangzhou, Hanoi and Iskandar druing the quarter. Ascott will continue to deepen its presence in existing markets such as China and seek new investment opportunities in key cities in Asia and Europe.
Earnings Revision/Risk We retain our earnings estimates as we expect the better earnings in
remaining quarters to offset the shortfall of the first quarter. Valuation/Recommendation Maintain BUY with an unchanged target price of S$4.41/share. Our
target price is pegged at 15% discount to its RNAV of S$5.18/share. Key catalysts for the stock includes further pick-up in China sales and monetization of its non-core businesses.
Sum-of-the-parts (SOTP) ValuationAsset Valuation Cap. Value
(S$m) Total Investment Properties 1,073.2 Book value of Investment Properties 797.8 Surplus/ (deficit) to book (1) 275.4 NPV of Development Profits (2) 2,665.5 Contribution from Fund Management business (3)
1,360.0
Surplus/ (deficit) to book from Listed Subsidiary/Associates (4)
2,730.1
Net Book Value (5) 15,080.4 Proceeds from potentially dilutive shares (6)
121.2
RNAV (1+2+3+4+5+6) 22,232.62 Fully diluted no. of shares(m) 4,289.78 Fully diluted RNAV per share (S$) 5.18 Target Price (at 15% disc to RNAV) (S$)
4.41
Source: CapitaLand, UOB Kay Hian China Residential Sales
Source: CapitaLand Singapore Residential sales
Source: CapitaLand Assets by Geography (1Q12)
Source: CapitaLand.
Singapore Daily Monday, April 29, 2013
Please see important notice on last page Page 11 of 19
Profit & Loss Balance Sheet Year to 31 Dec (S$m) 2012 2013F 2014F 2015F Year to 31 Dec (S$m) 2012 2013F 2014F 2015F
Net turnover 3,301 4,230 5,870 6,371 Fixed assets 1,264 1,289 1,315 1,341
EBITDA 2,064 1,833 2,041 2,018 Other LT assets 21,830 22,385 23,246 24,043
Deprec. & amort. 46 64 66 67 Cash/ST investment 5,498 5,590 6,193 6,569
EBIT 2,017 1,768 1,975 1,951 Other current assets 9,196 9,658 10,361 10,587
Net interest income/(expense) (499) (467) (459) (429) Total assets 37,788 38,922 41,115 42,540
Pre-tax profit 1,518 1,301 1,516 1,523 ST debt 782 832 882 932
Tax (202) (167) (194) (195) Other current liabilities 2,792 3,394 4,627 4,987
Minorities (386) (333) (388) (389) LT debt 13,398 13,098 12,798 12,598
Net profit 930 801 934 938 Other LT liabilities 1,372 1,472 1,872 2,272
Net profit (adj.) 930 801 934 938 Shareholders' equity 15,080 15,610 16,238 16,870
Minority interest 4,363 4,517 4,698 4,881
Total liabilities & equity 37,788 38,922 41,115 42,540
Cash Flow Key Metrics Year to 31 Dec (S$m) 2012 2013F 2014F 2015F Year to 31 Dec (%) 2012 2013F 2014F 2015F
Operating 249 1,436 1,957 1,731 Profitability
Pre-tax profit 1,518 1,301 1,516 1,523 EBITDA margin 62.5 43.3 34.8 31.7
Tax (153) (167) (194) (195) Pre-tax margin 46.0 30.8 25.8 23.9
Deprec. & amort. 46 64 66 67 Net margin 28.2 18.9 15.9 14.7
Associates (835) (364) (198) (95) ROA 2.5 2.1 2.3 2.2
Working capital changes (476) 246 435 133 ROE 6.2 5.2 5.9 5.7
Non-cash items (155) 0 0 0
Other operating cashflows 303 355 332 298 Growth
Investing (1,886) (488) (473) (469) Turnover 9.3 28.1 38.8 8.5
Capex (growth) (146) (600) (600) (600) EBITDA (3.0) (11.2) 11.3 (1.1)
Proceeds from sale of assets (2,052) 0 0 0 Pre-tax profit (5.9) (14.3) 16.5 0.5
Others 312 112 127 131 Net profit (12.0) (13.9) 16.5 0.5
Financing 956 (855) (881) (885) Net profit (adj.) (12.0) (13.9) 16.5 0.5
Dividend payments (493) (238) (272) (306) EPS (11.8) (13.9) 16.5 0.5
Loan repayment 1,931 (150) (150) (150)
Others/interest paid (482) (467) (459) (429) Leverage
Net cash inflow (outflow) (680) 93 602 377 Debt to total capital 42.2 40.9 39.5 38.3
Beginning cash & cash equivalent 6,264 5,498 5,590 6,193 Debt to equity 94.0 89.2 84.2 80.2
Changes due to forex impact (87) 0 0 0 Net debt/(cash) to equity 57.6 53.4 46.1 41.3
Ending cash & cash equivalent 5,498 5,590 6,193 6,569
Interest cover (x) 4.1 3.9 4.4 4.7

Singapore Daily Monday, April 29, 2013
Please see important notice on last page Page 12 of 19
CDL Hospitality Trusts (CDREIT SP)
BUY (Maintained)
Company Results
Share Price S$2.05
Target Price S$2.36
Upside +15.1% Company Description
CDL Hospitality Trusts is a stapled group compromising H-REIT and HBT.
Stock Data
GICS sector Financials
Bloomberg ticker: CDREIT SP
Shares issued (m): 970.0
Market cap (S$m): 1,988.6
Market cap (US$m): 1,606.3
3-mth avg daily t'over (US$m): 3.5
Price Performance (%)
52-week high/low S$2.12/S$1.74
1mth 3mth 6mth 1yr YTD
0.5 3.0 0.0 10.5 9.0
Major Shareholders %
Hospitality Hldgs 32.5
FY13 NAV/Share (S$) 1.62
FY13 Net Debt/Share (S$) 0.55
Price Chart
80
90
100
110
120
1.60
1.70
1.80
1.90
2.00
2.10
2.20
(%)(lcy)CDL HOSPITALIT Y TRUSTS
Cdl Hospitality Trusts/FSSTI Index
0
5
10
15
Apr 12 Jun 12 Aug 12 Oct 12 Dec 12 Feb 13 Apr 13
Volume (m)
Source: Bloomberg
Analysts
Vijay Natarajan +65 6590 6626 [email protected]
Vikrant Pandey +65 6590 6623 [email protected]
1Q13: Weaker Results But Acquisitions To Boost FuturePerformance
The slightly weaker Singapore performance was in line with its earlier guidance. We expect room rates and occupancies to pick up during the latter half of the year on the back of more events and new attractions. The recent yield-accretive acquisition of Angsana Velavaru should also help boost yields. Maintain BUY and target price of S$2.36.
Results Summary
Year to 31 Dec (S$m) 1Q13 yoy Remarks % chg Gross Revenue 37.9 (1.3)Net Property Income 35.3 (2.1)Distributable Income(before working capital deductions)
29.0 (2.8)
DPU before deductions (cents) 2.99 (3.2)DPU after deductions (cents) 2.69 (3.2)
Weak Singapore hotel performance due to late Chinese New Year impact.
Source: CDREIT
Results Results in line. CDL Hospitality Trusts (CDREIT) reported 1Q13 DPU
of 2.99 cents (-3.2% yoy). The final 1Q13 DPU after working capital deductions (90% payout ratio) of 2.69 cents was in line with our expectation, accounting for 23% of our full-year DPU forecast.
RevPAR slipped on late-CNY impact. RevPAR for 1Q13 fell 8% yoy due to the absence of the bi-annual Singapore Airshow and Chinese New Year (CNY) falling in February, which impacted corporate travel demand.
Geographically, Singapore still accounted for the bulk (72%) of total net property income, followed by Australia (18%), New Zealand (7%) and the Maldives (3%). Overall, minimum rental guarantees accounted for 48% of total gross revenue.
Net asset value stands at S$1.59/share.
Key Financials Year to 31 Dec (S$m) 2011 2012 2013F 2014F 2015F Net turnover 141 150 164 170 172 EBITDA 121 125 139 144 147 Operating profit 121 125 139 144 147 Net profit (rep./act.) 103 107 120 124 126 Net profit (adj.) 103 107 120 124 126 EPU (cent) 10.7 11.1 12.3 12.7 12.7 DPU (cent) 11.0 11.3 11.6 11.8 11.9 PE (x) 19.2 18.5 16.7 16.2 16.1 P/B (x) 1.3 1.3 1.3 1.2 1.2 DPU Yld (%) 5.4 5.5 5.7 5.8 5.8 Net margin (%) 73.1 71.7 73.0 73.0 72.8 Net debt/(cash) to equity (%) 30.0 29.1 34.1 30.9 27.5 Interest cover (x) 9.2 8.0 8.3 8.1 7.9 ROE (%) 6.9 6.9 7.6 7.8 7.7 Consensus DPU (cent) n.a. n.a. 11.9 12.1 12.3
UOBKH/Consensus (x) - - 0.98 0.98 0.97
Source: CDREIT, Bloomberg, UOB Kay Hian

Singapore Daily Monday, April 29, 2013
Please see important notice on last page Page 13 of 19
Stock Impact Weaker 1Q13 Singapore performance in line with guidance, expect a
better 2H. The weaker 1Q13 Singapore performance with RevPAR down 8% yoy was mainly due to a 7% fall in room rates. This is in line with management guidance of a softer 1Q due to the absence of the bi-annual Singapore Airshow and CNY falling in February (2012: January), disrupting corporate travel. The most impacted was Grand Copthorne King, which saw a 23% yoy decline in NPI due to lower room bookings from key accounts in the shipping and marine sectors. This was, however, partly offset by stronger performances from its overseas hotels. We see these results as one-off and expect a pick-up in room rates in 2H13 on the back of major events, such as Broadcast Asia 2013 and CommunicAsia 2013.
Angsana Velavaru to boost yields. In 1Q13, CDREIT completed the acquisition of 113-villa Angsana Velavaru, Maldives, from Banyan Tree. The property made a notable maiden contribution with a 29% yoy increase in RevPAR to US$474 for the two months ended Mar 13, boosted by the increase in leisure travel during the CNY period. The property’s proforma annualised NPI yield (9M12) of 9.5% was much higher than the existing portfolio’s implied yield of 6% and should help to enhance yields in the coming quarters.
One of the lowly-geared S-REIT, providing ample scope for acquisitions. Post-acquisition of the Maldives resort in 1Q13, CDREIT’s gearing remained low at 28%, among the lowest in S-REITs, presenting debt headroom of more than S$400m (assuming a comfortable level of 0.4x). Management noted that Singapore will remain its focus market for acquisitions. Besides Singapore, it also sees acquisition potential in Japan and the Middle East.
Earnings Revision/Risk No changes to our earnings estimates. We expect DPU to grow 1-2%
over the next two years.
Valuation/Recommendation Maintain BUY and target price of S$2.36, based on a two-stage
dividend discount model (required rate of return: 6.9% and terminal growth rate: 2%). CDREIT is currently trading at 2013 and 2014 dividend yield of 5.7% and 5.8% respectively.
.
Occupancy Levels And ADR
Source: CDREIT, UOB Kay Hian Net Property Income By Hotel (1Q13)
Source: CDREIT, UOB Kay Hian Asset Breakdown By Geography
Source: CDREIT, UOB Kay Hian Singapore Hotels’ Valuations
656
574
413
310
403360
-
100
200
300
400
500
600
700
800
Orchard Hotel Grand CopthorneWaterfront Hotel
M Hotel Copthorne King's hotel Novotel Clarke Quay Studio-M
0
100
200
300
400
500
600
700
Valuation per room key 2010 (S$) Valuation per room key 2011 (S$) Valuation per room key 2012 (S$) Number of Rooms
S$ '000
Source: CDREIT

Singapore Daily Monday, April 29, 2013
Please see important notice on last page Page 14 of 19
Profit & Loss Balance Sheet Year to 31 Dec (S$m) 2012 2013F 2014F 2015F Year to 31 Dec (S$m) 2012 2013F 2014F 2015F
Net turnover 150 164 170 172 Fixed assets 2,045 2,132 2,132 2,132
EBITDA 125 139 144 147 Other LT assets 0 0 0 0
Deprec. & amort. 0 0 0 0 Cash/ST investment 75 80 125 169
EBIT 125 139 144 147 Other current assets 14 14 14 14
Net interest income/(expense) (16) (17) (18) (19) Total assets 2,134 2,225 2,270 2,314
Pre-tax profit 110 122 126 128 ST debt 260 260 260 260
Tax (2) (2) (3) (3) Other current liabilities 25 23 24 24
Net profit 107 120 124 126 LT debt 270 357 363 363
Net profit (adj.) 107 120 124 126 Other LT liabilities 15 11 13 13
Shareholders' equity 1,564 1,575 1,611 1,654
Total liabilities & equity 2,134 2,225 2,270 2,314
Cash Flow Key Metrics Year to 31 Dec (S$m) 2012 2013F 2014F 2015F Year to 31 Dec (%) 2012 2013F 2014F 2015F
Operating 136 138 145 147 Profitability
Pre-tax profit 125 114 117 118 EBITDA margin 83.8 84.7 85.0 85.2
Deprec. & amort. 0 0 0 0 Pre-tax margin 73.3 74.5 74.5 74.3
Working capital changes 1 (2) 1 0 Net margin 71.7 73.0 73.0 72.8
Non-cash items 16 17 18 19 ROA 5.0 5.5 5.5 5.5
Other operating cashflows (5) 10 10 10 ROE 6.9 7.6 7.8 7.7
Investing (5) (91) (4) (4)
Capex (growth) (6) (91) (4) (4) Growth
Others 1 0 0 0 Turnover 6.0 9.6 3.5 1.6
Financing (126) (43) (97) (99) EBITDA 3.7 10.9 3.9 1.7
Distribution to unitholders (110) (126) (129) (131) Pre-tax profit 1.8 11.6 3.4 1.4
Issue of shares 0 0 0 0 Net profit 4.0 11.7 3.4 1.4
Proceeds from borrowings 0 100 50 50 Net profit (adj.) 4.0 11.7 3.4 1.4
Loan repayment 0 0 0 0 EPU 3.8 11.0 2.8 0.7
Others/interest paid (16) (17) (18) (19)
Net cash inflow (outflow) 5 5 45 44 Leverage
Beginning cash & cash equivalent 70 75 80 125 Debt to total capital 25.3 28.1 27.9 27.4
Ending cash & cash equivalent 75 80 125 169 Debt to equity 33.9 39.2 38.7 37.7
Net debt/(cash) to equity 29.1 34.1 30.9 27.5
Interest cover (x) 8.0 8.3 8.1 7.9

Singapore Daily Monday, April 29, 2013
Please see important notice on last page Page 15 of 19
Yangzijiang Shipbuilding Holdings (YZJ SP)
Key Financials Year to 31 Dec (Rmbm) 2011 2012 2013F 2014F 2015F
Net turnover 15,706 14,799 13,735 12,184 12,295EBITDA 4,701 4,451 3,431 3,123 2,996Operating profit 4,468 4,185 3,089 2,729 2,550Net profit (rep./act.) 3,977 3,581 2,598 2,342 2,228Net profit (adj.) 3,977 3,581 2,598 2,342 2,228EPS (fen) 103.6 93.3 67.7 61.0 58.1PE (x) 4.6 5.1 7.1 7.8 8.2P/B (x) 1.4 1.2 1.1 1.0 0.9EV/EBITDA (x) 4.9 5.2 6.8 7.4 7.7Dividend yield (%) 5.8 5.3 4.2 3.8 3.6Net margin (%) 25.3 24.2 18.9 19.2 18.1Net debt/(cash) to equity (%) 41.1 34.2 24.0 14.7 7.8Interest cover (x) 37.7 10.4 13.0 14.4 16.9ROE (%) 34.7 25.1 15.9 13.1 11.4Consensus net profit - - 2,743 2,052 1,925UOBKH/Consensus (x) - - 0.95 1.14 1.16Source: YZJ, Bloomberg, UOB Kay Hian
BUY (Maintained)
Company Results
Share Price S$0.960
Target Price S$1.22
Upside +27.1%
(Previous TP S$1.52) Company Description Yangzijiang Shipbuilding (Holdings) is a Jiangsu-based shipyard. The major products are Handysize and Sub-Panamax containerships and Panamax bulk carriers Stock Data GICS sector Industrials
Bloomberg ticker: YZJ SP
Shares issued (m): 3,832.1
Market cap (S$m): 3,678.8
Market cap (US$m): 2,971.6
3-mth avg daily t'over (US$m): 7.2
Price Performance (%) 52-week high/low S$1.20/S$0.850
1mth 3mth 6mth 1yr YTD
0.0 (4.0) 3.2 (18.6) 0.0
Major Shareholders %
Newyard Worldwide Hldgs 23.0
FY13 NAV/Share (Rmb) 4.47
FY13 Net Debt/Share (Rmb) 1.07
Price Chart
Source: Bloomberg
Analysts
Lawrence Li +8621 5404 7225 x 813 [email protected]
Nancy Wei +65 6590 6628 [email protected]
60
70
80
90
100
110
0.70
0.80
0.90
1.00
1.10
1.20
1.30
(%)(lcy)YANGZIJIANG SHIPBUILDIN G
Yangzijiang Shipbuilding/F SST I Index
0
50
100
150
Apr 12 Jun 12 Aug 12 Oct 12 Dec 12 Feb 13 Apr 13
Volume (m)
1Q13: Earnings Drop 30% yoy, As Expected
YZJ’s 1Q13 net income declined by 30%, in line with our expectations. Revenue declined by 22% due to cessation of orders and delivery slippage while shipbuilding margin remains robust at 26%. Newbuild orders recovered substantially and should have bottomed out while P/B-based valuation remains at a historical trough level. Maintain BUY and cut target price to S$1.22 from S$1.52.
1Q13 Results Year to 31 Dec (Rmbm) 1Q13 1Q12 yoy Remarks ) % chg
Revenue 2,867 3,686 -22 9 vessels delivered in 3Q12 (1Q12:15, 4Q12: 12)
Gross profit 1,034 1,219 -15 Net income 717 1,018 -30 Forex gains shrank 72% to Rmb50.3m Diluted EPS (Rmb) 0.19 0.27 -30
Gross margin 36 33 9 Higher percentage of revenue contribution from higher margin investment business
Shipbuilding GM 26 26 -2 Stable at a relatively healthier level Revenue breakdown Shipbuilding 2,472 3,344 -26 Less vessels delivered Held-to-Maturity Investment
373 293 27
Investments 21 49 -56 Lower loan amount extended in 1Q13 and disposal of 31.5% stake in Wuxi Runyuan in 2Q12
Source: YZJ, UOB Kay Hian Results
Yangzijiang Shipbuilding’s (YZJ) 1Q13 results were in line with expectations. Revenue was Rmb2.87b (-22% yoy), of which shipbuilding revenue was Rmb2.47b (-26% yoy), and investment revenue generated from held-to-maturity investments, cash and Runyuan micro financing was Rmb395m (+15% yoy). 1Q13 net income was Rmb717m (-30% yoy), representing 1Q13 EPS of Rmb0.19.

Singapore Daily Monday, April 29, 2013
Please see important notice on last page Page 16 of 19
Revenue was dragged down by the cessation of contracts and delivery slippage. Contract of one vessel ceased in 1Q13 vs four contracts in 4Q12. We also believe the delivery schedule and revenue contraction was also significantly impacted by delivery slippage upon the request of customers. As a result YZJ only delivered nine vessels in 1Q13, largely below the historical level and revenue declined by 22% yoy.
Shipbuilding margin remains robust. Overall gross margin (including investment business) improved to 36% from 1Q12’s 33% due primarily to significantly higher percentage of high margin investment business within revenue. Shipbuilding margin maintained robust at 26%.
Stock Impact New contracts saw substantial recovery in 1Q13. YZJ has secured
four 10,000 TEU orders from Seaspan, one 94,000 dwt trans-load vessel, five 82,000 dry bulks, and two 36,000 dwt multi-purpose vessels. The total contract value secured in 1Q13 was US$600m, which is double 2012’s full-year contract value of US$300m. Total value of orderbook reached US$3.3b, consisting of 36 containerships and 29 bulk carriers. Seaspan may further exercise 7-9 options of 10,000TEU within 2013, which would boost YZJ’s newbuild 2013 orders value to US$1.3b-1.5b.
YZJ still gained contracts amid the intense competition from Japanese and Chinese SOE shipyards. We found that Japanese shipbuilding market share soared to 26% in 2012 from 16% in 2011 due to the heavy depreciation of the yen, while that of Chinese declined to 39% in 2012 from 43% in 2011. Japanese shipyards are now fully occupied until 2015. Besides the Japanese shipyards, Chinese SOE shipyards gained market share from non-SOEs because they can endure loss and have stronger capability to get financed to cope with heavy-tail payment terms. Given intense competition from Japanese and Chinese SOE peers, YZJ still expanded its market share in China and the margin of the contracts secured in 1Q13 is even 2-5ppt higher due to its excellent efficiency. YZJ’s yards is now full for 2015 and there is no intention to reactivate Changbo yard due to cost consideration.
Increased interest in eco ships provides opportunity for YZJ's shipbuilding business. Amid the sluggish shipping industry, ship owners are more focused on fuel-efficient vessels to improve profitability. The 20% fuel savings from eco vessels can fully offset the higher price of eco ship vessels compared to the old design ones. YZJ currently has enquiries for more than 10 eco ships and major competitors are Japanese yards, which have already received a number of orders of eco ships.
Earnings Revision/Risk None.
Valuation/Recommendation Maintain BUY but lower our target price from S$1.52 to S$1.22, based
on 9x 2013F PE. As a shipyard with adequate cash, we put YZJ as our top pick with Chinese shipyards sector amid an industry downturn.
Newbuild orders cycle should have bottomed out for YZJ but P/B valuations still around the historical low. Though earnings cycle is still trending down, we believe newbuild order cycle for YZJ has bottomed out, which is historically more correlated to share prices compared to earnings cycle. Valuation of 1.0x 2013F P/B is almost at a historical low and provides firm protection.
Share Price Catalyst Contract wins.
Newbuild Orders
67.6
741.33
810 0 30
302
158197234
548
415.3
512.3
700
0 095
200
0 0
600
0
5
10
15
20
1q08
2q08
3q08
4q08
1Q09
2Q09
3Q09
4Q09
1Q10
2Q10
3Q10
4Q10
1Q11
2Q11
3Q11
4Q11
1Q12
2Q12
3Q12
4Q12
1Q13
(No. of vessels)
0100200300400500600700800
(US$m)Contract value No of vessels
Source: YZJ, UOB Kay Hian Orderbook
0.0
1,000.0
2,000.0
3,000.0
4,000.0
5,000.0
6,000.0
7,000.0
8,000.0
3Q08 1Q09 3Q09 1Q10 3Q10 1Q11 3Q11 1Q12 3Q12 1Q13
US$m
Containerships Bulk carriers
Source: YZJ, UOB Kay Hian Production Schedule
17 18 22 22 20
1022
26 30 30
2
10 10
0
10
20
30
40
50
60
70
2008 2009 2010 2011 2012
(No. of vessels)
JYS JNYS Changbo
Source: YZJ, UOB Kay Hian Gross Margin Trend
0.0
1000.0
2000.0
3000.0
4000.0
5000.0
6000.0
2007 2008 2009 2010 2011 2012F 2013F 2014F
(Rmbm)
0.0%
5.0%
10.0%
15.0%
20.0%
25.0%
30.0%
Gross profit Core Gross margin
Source: YZJ, UOB Kay Hian

Singapore Daily Monday, April 29, 2013
Please see important notice on last page Page 17 of 19
Profit & Loss Year to 31 Dec (Rmbm) 2012 2013F 2014F 2015F
Net turnover 14,799 13,735 12,184 12,295
EBITDA 4,451 3,431 3,123 2,996
Deprec. & amort. 266 342 394 446
EBIT 4,185 3,089 2,729 2,550
Total other non-operating income 679 300 300 300
Associate contributions 0 50 50 50
Net interest income/(expense) (430) (264) (217) (178)
Pre-tax profit 4,434 3,175 2,862 2,722
Tax (846) (572) (515) (490)
Minorities (7) (5) (5) (4)
Net profit 3,581 2,598 2,342 2,228
Net profit (adj.) 3,581 2,598 2,342 2,228
Balance Sheet Year to 31 Dec (Rmbm) 2012 2013F 2014F 2015F
Fixed assets 4,277 4,755 5,184 5,561
Other LT assets 7,284 7,265 7,243 7,221
Cash/ST investment 2,087 1,888 2,252 2,414
Other current assets 19,555 19,143 18,423 18,494
Total assets 33,202 33,051 33,102 33,690
ST debt 3,200 3,000 2,000 2,000
Other current liabilities 8,428 8,222 7,749 7,829
LT debt 4,191 3,000 3,000 2,000
Other LT liabilities 1,116 929 891 874
Shareholders' equity 15,510 17,142 18,704 20,230
Minority interest 757 757 757 757
Total liabilities & equity 33,202 33,051 33,102 33,690 Cash Flow Year to 31 Dec (Rmbm) 2012 2013F 2014F 2015F
Operating 1,677 2,696 2,727 2,488
Pre-tax profit 4,434 3,175 2,862 2,722
Tax (846) (572) (515) (490)
Deprec. & amort. 266 342 394 446
Associates 0 0 0 0
Working capital changes (1,875) 379 282 25
Non-cash items 140 (359) (74) (33)
Other operating cashflows (443) (269) (222) (182)
Investing (1,567) (801) (801) (801)
Capex (growth) (1,002) (801) (801) (801)
Capex (maintenance) 0 0 0 0
Investments (580) 0 0 0
Proceeds from sale of assets 0 0 0 0
Others 15 0 0 0
Financing (1,176) (2,093) (1,562) (1,525)
Dividend payments (1,066) (967) (780) (703)
Issue of shares 0 0 0 0
Proceeds from borrowings 800 1,000 1,000 1,000
Loan repayment (1,900) (2,390) (2,000) (2,000)
Others/interest paid 990 264 217 178
Net cash inflow (outflow) (1,066) (198) 363 162
Beginning cash & cash equivalent 3,152 2,087 1,888 2,252
Changes due to forex impact 0 0 0 0
Ending cash & cash equivalent 2,087 1,888 2,252 2,414
Key Metrics Year to 31 Dec (%) 2012 2013F 2014F 2015F
Profitability EBITDA margin 30.1 25.0 25.6 24.4
Pre-tax margin 30.0 23.1 23.5 22.1
Net margin 24.2 18.9 19.2 18.1
ROA 10.7 7.8 7.1 6.7
ROE 25.1 15.9 13.1 11.4
Growth Turnover (5.8) (7.2) (11.3) 0.9
EBITDA (5.3) (22.9) (9.0) (4.1)
Pre-tax profit (11.3) (28.4) (9.9) (4.9)
Net profit (10.0) (27.4) (9.9) (4.9)
Net profit (adj.) (10.0) (27.4) (9.9) (4.9)
EPS (10.0) (27.4) (9.9) (4.9)
Leverage Debt to total capital 31.2 25.1 20.4 16.0
Debt to equity 47.6 35.0 26.7 19.8
Net debt/(cash) to equity 34.2 24.0 14.7 7.8
Interest cover (x) 10.4 13.0 14.4 16.9

Singapore Daily Monday, April 29, 2013
Please see important notice on last page Page 18 of 19
Corporate Aussino: Board rejects advice to withdraw RTO. Aussino’s board has rejected the advice of its financial adviser to voluntarily withdraw its application for a controversial S$70m reverse takeover (RTO) of the energy business of Max Myanmar group, owned by Myanmar tycoon Zaw Zaw. Singapore Exchange has raised several concerns over the RTO, which includes allegations of human rights violations by the Max Myanmar Group of companies, allegations that the Max Myanmar Group is under investigation by Myanmar's tax authorities, and the status of land occupational rights critical to the company's operations post-acquisition. (Source: The Business Times) Sembcorp: Eyes another Indian power plant. Sembcorp is eyeing opportunities to build on its Indian power business. According to Indian reports, Sembcorp and Malaysia's Genting Group have conducted due diligence on the 1,320 MW power facility being developed in Krishnapatnam by Nargarjuna Construction Company (NCC) and Gayatri Projects. The project is at a preliminary stage and no binding agreement has been signed. (Source: The Business Times) SGX: To raise fees for mainboard listing. The minimum initial listing fee will be raised to S$100,000 from 1 July from the current S$50,000. Beginning 1 Jan 14, annual listing fee will be increased to S$30 per S$1m market cap, from the current S$25. Minimum and maximum annual listing fee will go up from S$25,000 and S$100,000 to S$35,000 and S$150,000 respectively. Additional listings fees will be assessed at the same rate of S$100 per S$1m market cap beginning 1 July, but the minimum will be increased to S$30,000 from the current S$5,000; the maximum will be doubled to S$200,000. The new fees will apply to equity, convertible equity and preference shares, but not to debt securities. Initial and annual listing fees were last revised in 2006; Additional-listing fees have been the same since 1999. (Source: The Business Times) Zhongmin Baihui: Opens its 10th store in China. Departmental store operator Zhongmin Baihui Retail Group opened its 10th store in China, putting itself on a path to expand rapidly in the next two years. Its 188,000 sf Quanzhou Xinhua store in a historic part of Fujian province will boost the company's bottom line immediately, and bring the group's total gross floor area to 1.7m sf. The company is planning to move from the Catalist board to the mainboard later this year, with directors having sold shares recently to meet free float and shareholder base requirements. (Source: The Business Times) Economics Economy: S'pore March factory output falls 4.1% yoy: EDB. Singapore's factory output shrank a larger-than-expected 4.1% in March from a year ago. Output grew only 6.2% mom after seasonal adjustments. Excluding the 16.2% yoy growth in biomedical output, March industrial production would have contracted a sharper 8.6% yoy, and stayed flat mom. Electronics sector continued its decline, albeit at a slower pace. It shrank 7.2% in March compared to the prior year, after contracting 19.7% yoy in February. (Source: The Business Times)
Singapore Daily Monday, April 29, 2013
Page 19 of 19
We have based this document on information obtained from sources we believe to be reliable, but we do not make any representation or warranty nor accept any responsibility or liability as to its accuracy, completeness or correctness. Expressions of opinion contained herein are those of UOB Kay Hian Research Pte Ltd only and are subject to change without notice. Any recommendation contained in this document does not have regard to the specific investment objectives, financial situation and the particular needs of any specific addressee. This document is for the information of the addressee only and is not to be taken as substitution for the exercise of judgement by the addressee. This document is not and should not be construed as an offer or a solicitation of an offer to purchase or subscribe or sell any securities. UOB Kay Hian and its affiliates, their Directors, officers and/or employees may own or have positions in any securities mentioned herein or any securities related thereto and may from time to time add to or dispose of any such securities. UOB Kay Hian and its affiliates may act as market maker or have assumed an underwriting position in the securities of companies discussed herein (or investments related thereto) and may sell them to or buy them from customers on a principal basis and may also perform or seek to perform investment banking or underwriting services for or relating to those companies. UOB Kay Hian (U.K.) Limited, a UOB Kay Hian subsidiary which distributes UOB Kay Hian research for only institutional clients, is an authorised person in the meaning of the Financial Services and Markets Act 2000 and is regulated by Financial Services Authority (FSA). In the United States of America, this research report is being distributed by UOB Kay Hian (U.S.) Inc (“UOBKHUS”) which accepts responsibility for the contents. UOBKHUS is a broker-dealer registered with the U.S. Securities and Exchange Commission and is an affiliate company of UOBKH. Any U.S. person receiving this report who wishes to effect transactions in any securities referred to herein should contact UOBKHUS, not its affiliate. The information herein has been obtained from, and any opinions herein are based upon sources believed reliable, but we do not represent that it is accurate or complete and it should not be relied upon as such. All opinions and estimates herein reflect our judgement on the date of this report and are subject to change without notice. This report is not intended to be an offer, or the solicitation of any offer, to buy or sell the securities referred to herein. From time to time, the firm preparing this report or its affiliates or the principals or employees of such firm or its affiliates may have a position in the securities referred to herein or hold options, warrants or rights with respect thereto or other securities of such issuers and may make a market or otherwise act as principal In transactions in any of these securities. Any such non-U.S. persons may have purchased securities referred to herein for their own account in advance of release of this report. Further information on the securities referred to herein may be obtained from UOBKHUS upon request. http://research.uobkayhian.com
MCI (P) 122/03/2013 RCB Regn. No. 198700235E
Related Documents