UN WRAPPING INVESTOR RISK In the Global Plastic Containers and Packaging Sector Tracker Report March 2021

Welcome message from author
This document is posted to help you gain knowledge. Please leave a comment to let me know what you think about it! Share it to your friends and learn new things together.
Transcript

UNWRAPPING INVESTOR RISK In the Global Plastic Containers
and Packaging Sector
Tracker Report March 2021
2
Key Takeaways 5
Executive Summary 6
Plastic Containers & Packaging Companies: In the Land of Giants 10
Defining the Plastic Containers & Packaging Sector 14
Identifying the Companies 15
A Sector Facing Variable Fortunes 16
Investors have the Power to Set a New Agenda, but Few Do 19
The Companies’ Perception of their Risk 23
Balancing Demand with Sustainability 27
The Investors’ Response 29
Most Companies Have Barely Moved on Sustainable Initiatives 32
The Consumer’s View 34
Regulatory Pressure is Building 36
Stakeholder Consensus? 37
Recommendations 38
Appendix A: Companies in the Planet Tracker Universe Ranked by Plastic 40 Containers and Packaging Sector-Specific Revenue
Appendix B: Top 50 Equity Institutional Investors Invested in Companies 43 the Planet Tracker Universe.
Appendix C: Top 50 Fixed Income Managers Invested in the Companies in 46 the Planet Tracker Universe by % Exposure to Fixed Income Tracked, estimated. Source: Bloomberg L.P
Appendix D: The Basics - From Monomers to Polymers to Plastics to Reuse 48
Appendix E: Potential Unrealised Returns on an Average Cost Basis for 51 Investment Advisors and Sovereign Wealth Funds Invested in the Planet Tracker Universe
Appendix F: Largest Private Equity, Foundation and Individual Investors 53 with a Single Investment in the 83 Companies in the Planet Tracker Universe
Appendix G: Corporate Bonds and Loans Assessed Issued by the 54 Companies in the Planet Tracker Universe
Appendix H: Companies in the Planet Tracker Universe Equity Prices with 58 Currency Translation Used for Valuation Calculations.
Disclaimer 61
References 62
CONTENTS
3
Suggested citation: Thoumi G, CFA FRM, Willis J, Manili A: Unwrapping Investor Risk: Global Plastic Containers and Packaging sector: Planet Tracker (2021).
ABOUT PLANET TRACKER Planet Tracker is a non-profit financial think tank aligning capital markets with planetary limits. It was created to investigate the risk of market failure related to ecological limits. This investigation is primarily for the investor community where ecological limits, other than climate change, are often not aligned with investor capital. Planet Tracker generates breakthrough analytics to redefine how financial and environmental data interact with the aim of changing the practices of financial decision makers to help avoid both environmental and financial failure.
PLASTICS TRACKER The goal of Plastics Tracker is to stem the flow of environmentally damaging plastics and related products that are creating global waste and health issues. By taking a financial lens and using financial analytics to transparently map capital flows and influences in the mid-stream of the supply chain from resins production through to product use, Plastics Tracker seeks to stop unsustainable practices while encouraging investment in sustainable solutions.
ACKNOWLEDGEMENTS Authors: Gabriel Thoumi CFA FRM, John Willis Researcher: Arianna Manili Editor: Dominic Lyle
Planet Tracker would like to acknowledge the input of those who reviewed draft versions of this report: Dominic Charles, Chris Gee, Tamar Matalon, Kelly McBee, Dawn Rittenhouse, Joshua Romo and Ame Trandem.
WITH THANKS TO OUR FUNDERS Planet Tracker gratefully acknowledges the support of the funders who helped to make the publication of this report possible.

4
...a coherent PLAN
to transition to
more SUSTAINABLE
processes and products

5
Hiding in plain sight between petrochemical companies and consumers (e.g. fast moving consumer goods companies) are the plastic containers and packaging companies, also called “converters” or “plastics producers”.
Planet Tracker has identified a Universe of 83 publicly traded global companies i in the Plastic Containers and Packaging (PC&P) sector, which individually have an annual plastic revenue which exceeds USD 100 million and 10% of each company’s total revenue, according to Bloomberg. These 83 companies have a combined market capitalisation of USD 126 billion and account for 93% of the sector’s revenue. In this report we refer to these companies as ‘The Planet Tracker Universe’.
20 companies dominate the PC&P sector globally, accounting for 64% of its USD 53.8 billion revenue, although few have names known to the general public.
The companies in the PC&P sector are facing a possible pincer movement as policymakers and consumers are mobilising to push the industry into taking responsibility for the single-use plastics they produce and sell. In turn, this raises the threat that PC&P investments could become stranded.
Companies in the Planet Tracker Universe need a coherent plan to transition to more sustainable processes and products:
• 53 companies in our Planet Tracker Universe report no policies on key sustainable packaging-related topics and few reflect the rising risk of legislation in their company filings.
• The top twenty institutional investors in the Planet Tracker Universe have unrealised gains 1
of USD 7.7 billion in 447 investments, led by Vanguard with USD 1.9 billion. Total unrealised gains in the Universe are USD 24 billion held in 8,665 investments surveyed by Planet Tracker.
• Less than one-tenth of 1% of the 4,175 institutional investors, with investments in the Universe surveyed, are members of investor initiatives supporting sustainable plastics initiatives.
• 70 investors control 60% of public plastics production in the Universe: almost none have pollution policies.
• As of 4 January 2021, companies in the Planet Tracker Universe had issued no green bonds, no sustainability bonds and no sustainability-linked loans.
• Alarmingly, none of the top 20 individual private equity or foundation investors who each have only one investment in the Planet Tracker Universe for a total of 20 investments valued at USD 10.98 billion, or 12.5% of the 8,655 investments assessed, are participating in, or members of, investor initiatives supporting sustainable plastics initiatives.
70% of the Universe’s corporate bonds and loans are rolling over by 2025, creating an opportunity for some of these PC&P companies to convince investors they should be worthy of issuing green fixed income instruments.
Conversely, the largest fixed income investors in this industry, led by BlackRock, J.P. Morgan, Prudential and Robeco, have a clear opportunity to set the investor agenda for these publicly traded companies with regards to how the Universe will coalesce around a vision to support a transition to sustainable practices and a circular economy.
KEY TAKEAWAYS
1 An unrealised gain is a potential profit that exists on paper, resulting from an investment. It is an increase in the value of an asset that has yet to be sold for cash, such as a stock position that has increased in value but still remains open. A gain becomes realized once the position is sold for a profit.

6
The identity of the Plastic Containers & Packaging (PC&P) companies is often unknown outside the plastics industry, major fast moving consumer goods (FMCG) companies and financial markets, despite the visibility of the products they produce, ranging
from plastic bottles to food containers. Instead, the focus remains on the raw material suppliers, the major chemical and oil companies and the bottle and container users, such as the branded consumer companies. It raises the interesting issue of whether the brand name on the container (e.g., Coca-Cola) carries the risk, rather than the plastic bottle manufacturer.
Planet Tracker has identified 83 publicly traded global companies in the PC&P sector which individually have an annual revenue in excess of USD 100 million and derive at least 10% of their revenue from this sector. In this report we refer to these companies as ‘The Planet Tracker Universe’.
The companies in the Planet Tracker Universe have an estimated USD 54 billion in annual revenue (89% of the whole sector’s revenue) and USD 126 billion market capitalisation (34% of the whole sector’s market capitalisation).
However, this disguises the dominance of the 20 largest players in the PC&P sector. This grouping accounts for 62% of the sector’s revenue and has a combined market capitalisation of USD 82 billion.
With the growing risks this sector faces, we encourage investors and financiers to be aware of this concentration risk.
EXECUTIVE SUMMARY

7
Within the Planet Tracker Universe of companies:
• The top 70 equity investors have a total investment of USD 50.44 billion and control 60% of public PC&P production: almost none have pollution policies.
• Of those 70 investors, we calculate that the top 50 institutional equity investors in the Universe have investments totalling USD 39.46 billion, equal to 45% overall of the investments tracked.
• A further 20 individual, private equity or foundation investors who each have only one investment in the sector represent a total investment of USD 10.98 billion.
• In addition, the top 50 fixed income managers have a further USD 3.55 billion of exposure.
• Many of these investors have substantial unrealised gains from their equity investments. The top twenty institutional equity investors in the Universe have unrealised gains 2 of USD 7.7 billion in 447 investments, led by Vanguard with USD 1.9 billion.
While these potential investment gains will provide comfort for the financial institutions, the issue is whether they are temporary. From an investor’s point of view, to ensure returns, they need the PC&P companies to be fully aware of the looming impacts from growing pressure to reduce plastics pollution and to be taking mitigating actions to address these risks.
The most publicly recognised environmental issue associated with plastics is packaging waste. Plastic packaging accounts for 36% of all plastic produced ii which, in turn, accounts for nearly half of all plastic waste.iii Compounding this problem is that much of this is for single-use purposes which, depending on the product, can endure indefinitely in the environment when discarded. This has captured the attention of consumers, policymakers and increasingly investor alliances.
Consumers are recognising the environmental impacts of plastic waste and are beginning to advocate for regulation as well as to engage with FMCG companies directly, placing negative pressure on the respective brands. PC&P companies may become the next focus of consumer campaigns and plastics-conscious consumers.
2 An unrealised gain is a potential profit that exists on paper, resulting from an investment. It is an increase in the value of an asset that has yet to be sold for cash, such as a stock position that has increased in value but still remains open. A gain becomes realized once the position is sold for a profit.

8
Many government policymakers are aware of the growing plastic pollution problem. Many politicians, sensitive to growing consumer pressure, enjoy showing green credentials and discarded plastic may prove a revenue generator through taxes and penalties. As COVID-19 sovereign debts rise, this becomes ever more enticing. Although a number of the largest petrochemical companies are state-owned, this is not the case for companies further down the plastics value chain.
It would be hard for the PC&P and FMCG (fast moving consumer goods) companies to feign ignorance about the mounting problem of plastic pollution, as many of these companies have joined alliances which broadly recognise the fact that this issue urgently needs addressing.
With policymakers recognising the growing plastic problem and consumers becoming more activist towards the producers and politicians, the plastic containers and packaging companies will inevitably become a focus. Governments may impose waste controls on these companies or demand a rapid transition to new products, which raises the possibility of stranded assets as companies are unable to re-tool their production facilities fast enough, resulting in investment impairments, write-downs and write-offs, something presently being played out in the oil and gas sector.
The PC&P sector is at an inflection point. The industry is at risk as its existing technologies are directly associated with environmental harm while newer technologies, which could support an evolution in sustainable plastics and lead the PC&P sector into a circular economy, are not yet being invested in at scale.
This scenario should be sending a clear warning signal to Investors about the rising probability of stranded assets. If the PC&P companies fail to find a technological solution to the environmental harm stemming directly from their products, will policymakers force their hand? Meanwhile, investors should demand management teams formulate transition plans in order to protect their unrealised PC&P investments before the financial markets commence a devaluation of these companies.

9
We recommend that stakeholders take the following actions:
All investors should immediately request public disclosure of environmental risks and policies from all 83 publicly traded companies we have identified in the PC&P sector as the Planet Tracker Universe in order to safeguard their unrealised investment gains. In turn, this should allow investors to assess the likelihood of incurring stranded assets and asset write downs.
Equity investors, invested in companies in the Planet Tracker Universe, need to implement time-bound policies and recommendations whose results will be reported to their institutions’ Governance Boards in a timely and consistent manner. These should support the rapid expansion of site-specific recycling infrastructure while insisting upon the rapid standardisation of design of the polymers so that it is easier to recycle and reuse these polymers effectively in a closed loop manner.
Fixed income investors need to work directly with companies in the Planet Tracker Universe to ensure they factor into pricing short-mid- and long-term legislative risks that may impact debt covenants. The maturity of such instruments, or new issues, presents an ideal time for such active involvement.
Companies in the Planet Tracker Universe need to recognise the impending risks in their filings and describe their transition strategy towards a circular economy. They can perform this individually or in the larger alliances to which they are signatories. Companies should:
Implement a global business strategy by 2025 that migrates their business platforms in a time-bound manner towards sustainable practices and a circular economy model to mitigate the financial risks described in this report.iv These companies must focus their energies on designing for reusability and they must actively join global alliances to support a transition towards a plastics-waste free economy.
Disclose their environmental risks in their regulatory filings and their environmental policies. All companies must issue corporate responsibility reports annually to improve their disclosure.
Policymakers and regulators need to work directly with investors and companies throughout the supply chain to simplify product design, reduce the complexity of packaging and harmonise packaging formats, grow the adoption of recyclable feedstocks, increase recyclable infrastructure and improve consumer outreach, so that plastics pollution can be rapidly mitigated and addressed.

10
Sandwiched between the petrochemical companies, which provide the raw materials, and the fast-moving consumer goods (FMCG) companies, which sell the short shelf-life goods, is the Plastic Containers and Packaging (PC&P) sector - see Figure 1.
Despite the PC&P sector manufacturing thousands of plastic products which are consumed and discarded each day, the sector has a low profile, with few of these companies recognisable to the general public. However, this is not true of the raw material suppliers, which include large chemical conglomerates (e.g., BASF, Dow) and major oil companies (e.g., ExxonMobil, PetroChina); nor of the FMCG companies, which include many companies with recognisable brand names (e.g., Proctor & Gamble, Unilever, Nestlé and Coca-Cola).
The PC&P companies are business-to-business (B2B) enterprises which are dependent on both the raw materials they receive to make the products that their customers require and their customer’s product and design specifications. It is difficult for them to go it alone and develop new packaging products without the required sign-off from their FMCG clients.
There are a few examples of the packaging companies working together with their customers such as Amcor’s and Nestlé’s joint development of the world’s first recyclable retort 3 pouch for pet food.vi Berry Global has also announced a working arrangement with the AZEK Company to allow the use of sustainable building materials from recycled plastic.vii However there are not many.
We caution against the idea that the PC&P companies will be able to remain hidden for much longer. As we discuss in this paper, the risk profile of this sector is rising and coping with an inevitable transition in their business model will be paramount for investors and financiers, despite the promising sales growth to date.
PLASTIC CONTAINERS & PACKAGING COMPANIES: IN THE LAND OF GIANTS
Figure 1: Global Plastic Production by Industry Sector, 2015. v
3 A retort pouch or retortable pouch is a type of food packaging made from a laminate of flexible plastic and metal foils. It allows the sterile packaging of a wide variety of food and drink handled by aseptic processing and is used as an alternative to traditional industrial canning methods.
11
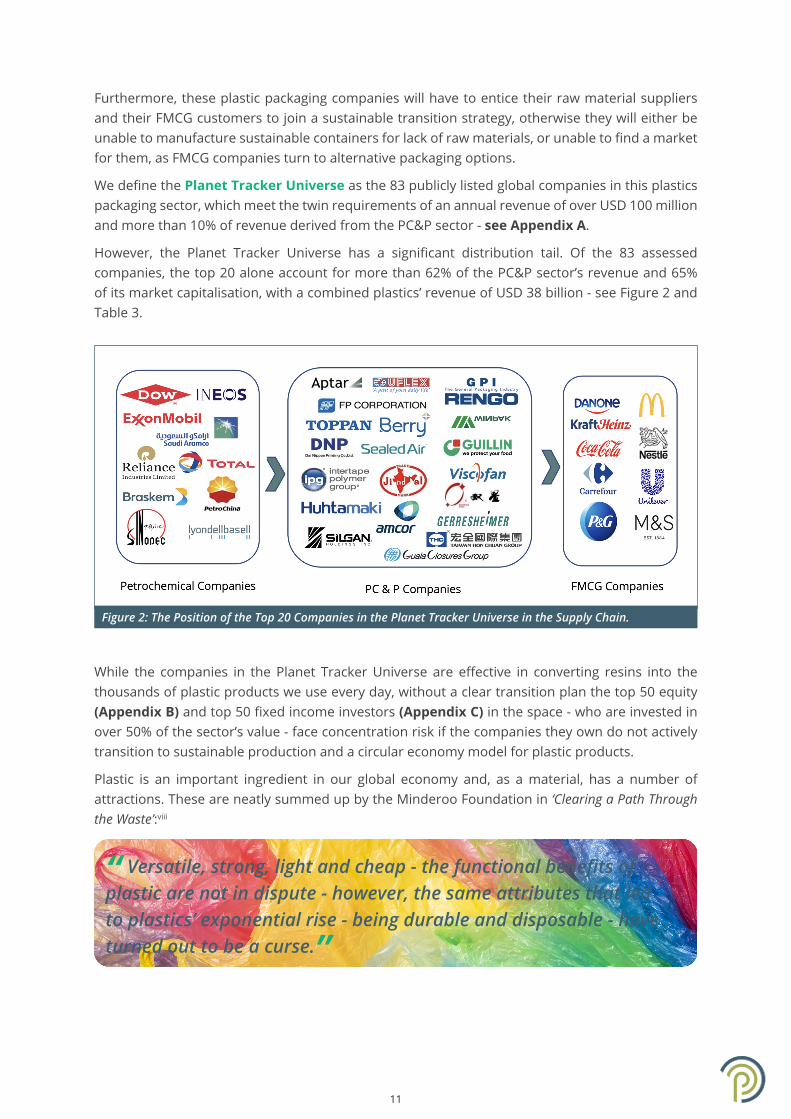
Furthermore, these plastic packaging companies will have to entice their raw material suppliers and their FMCG customers to join a sustainable transition strategy, otherwise they will either be unable to manufacture sustainable containers for lack of raw materials, or unable to find a market for them, as FMCG companies turn to alternative packaging options.
We define the Planet Tracker Universe as the 83 publicly listed global companies in this plastics packaging sector, which meet the twin requirements of an annual revenue of over USD 100 million and more than 10% of revenue derived from the PC&P sector - see Appendix A.
However, the Planet Tracker Universe has a significant distribution tail. Of the 83 assessed companies, the top 20 alone account for more than 62% of the PC&P sector’s revenue and 65% of its market capitalisation, with a combined plastics’ revenue of USD 38 billion - see Figure 2 and Table 3.
While the companies in the Planet Tracker Universe are effective in converting resins into the thousands of plastic products we use every day, without a clear transition plan the top 50 equity (Appendix B) and top 50 fixed income investors (Appendix C) in the space - who are invested in over 50% of the sector’s value - face concentration risk if the companies they own do not actively transition to sustainable production and a circular economy model for plastic products.
Plastic is an important ingredient in our global economy and, as a material, has a number of attractions. These are neatly summed up by the Minderoo Foundation in ‘Clearing a Path Through the Waste’:viii
“ Versatile, strong, light and cheap - the functional benefits of plastic are not in dispute - however, the same attributes that led to plastics’ exponential rise - being durable and disposable - have turned out to be a curse.”
Figure 2: The Position of the Top 20 Companies in the Planet Tracker Universe in the Supply Chain.

12
The attraction of these products has created unintended consequences. Affordability has made their use widespread, but their unconstrained disposal is problematic, especially since inadequate disposal ensures they remain in the environment for longer than necessary. Many plastics have long lifespans - in a recent peer reviewed scientific article, which assessed a variety of publications, estimates ranged from 1 year to greater than 10,000 years (Figure 3 and Table 1).
The bars represent the range of estimates, the red circles represent the mean of estimates and the number of estimates for each plastic good (N) is provided on the right (N = 255 in total). The recycling number corresponds to the base polymer of each good. PET = polyethylene terephthalate, PS = polystyrene, LDPE = low-density polyethylene, PA = polyamide, and PP = polypropylene. Individual lifetime estimates and additional details are available. (Image credit: Natalie Reiner/Woods Hole Oceanographic Institution).
For a schematic of plastics production, their applications and their recycling codes - see Appendix D.
Figure 3: Review of 57 information graphics and documents from 2008 to 2019 that report environmental lifetimes of common plastic consumer goods.ix
Table 1: Estimates of Sample Plastics’ Lifespans.x
Use Plastic Type Recycle Code Range No. of
Estimates Mean
Plastic Bottle Polyethylene terephthalate #1 100 to 10,000 54 800
Diaper Low-density polyethylene #4 75 to 800 43 450
Styrofoam Cup Polystyrene #6 1 to 10,000 43 1,000
Fishing Line Polyamide #7 600* 37 600*
Plastic Bag Low-density polyethylene #4 20 to 10,000 42 250
Six Pack Ring Low-density polyethylene #4 50 to 450 27 400
Plastic Straw Polypropylene #5 100 to 700 9 275
*All 37 assessments stated that fishing line lasts 600 years.

13
The PC&P sector faces a number of significant direct and indirect environmental risks which may impact its core business strategies:
• For every tonne of plastic produced, 4.4 tonnes of carbon dioxide are emitted, which does not include the full life-cycle assessment of plastics’ impacts.xi
• 40% of plastic ends up in the environment.
• 11 million tonnes flow into the ocean annually,xii of which 80% is from flexible and multilayer plastic, the subject of this report.
• Currently, plastic waste in the ocean is estimated at 150 million metric tonnes xiii and this is forecast to double by 2040.xiv
• Under business as usual, the plastics industry would account for 19% of the remaining global carbon budget to remain under 1.5 °C by 2040.xv
• Over 170 chemicals used in fracking (which contributes to some production plastic feedstocks) have known human health impacts.xvi
This report provides an insight into whether such environment-related concerns are accurately valued in equity and debt pricing for the shareholders and capital providers of the 83 publicly traded PC&P companies xvii we have identified as the Planet Tracker Universe in the PC&P sector.
14
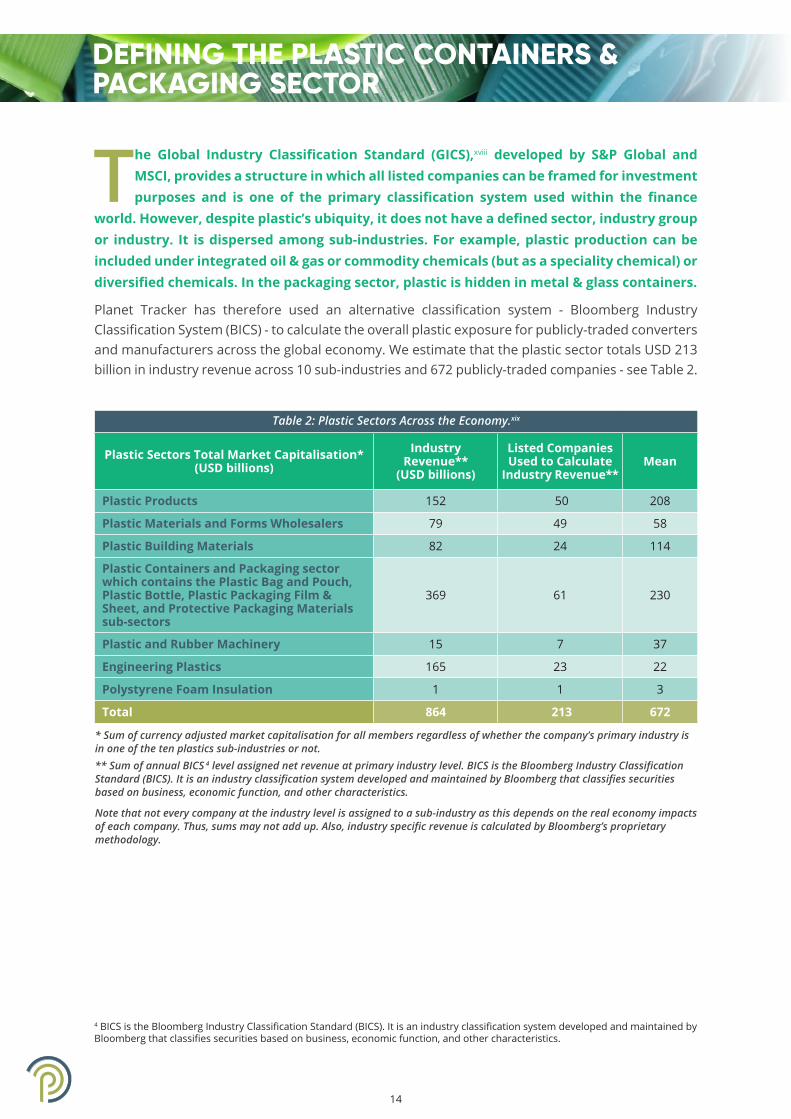
The Global Industry Classification Standard (GICS),xviii developed by S&P Global and MSCI, provides a structure in which all listed companies can be framed for investment purposes and is one of the primary classification system used within the finance
world. However, despite plastic’s ubiquity, it does not have a defined sector, industry group or industry. It is dispersed among sub-industries. For example, plastic production can be included under integrated oil & gas or commodity chemicals (but as a speciality chemical) or diversified chemicals. In the packaging sector, plastic is hidden in metal & glass containers.
Planet Tracker has therefore used an alternative classification system - Bloomberg Industry Classification System (BICS) - to calculate the overall plastic exposure for publicly-traded converters and manufacturers across the global economy. We estimate that the plastic sector totals USD 213 billion in industry revenue across 10 sub-industries and 672 publicly-traded companies - see Table 2.
Table 2: Plastic Sectors Across the Economy.xix
Plastic Sectors Total Market Capitalisation* (USD billions)
Industry Revenue**
(USD billions)
Listed Companies Used to Calculate
Industry Revenue**Mean
Plastic Products 152 50 208
Plastic Materials and Forms Wholesalers 79 49 58
Plastic Building Materials 82 24 114
Plastic Containers and Packaging sector which contains the Plastic Bag and Pouch, Plastic Bottle, Plastic Packaging Film & Sheet, and Protective Packaging Materials sub-sectors
369 61 230
Plastic and Rubber Machinery 15 7 37
Engineering Plastics 165 23 22
Polystyrene Foam Insulation 1 1 3
Total 864 213 672
* Sum of currency adjusted market capitalisation for all members regardless of whether the company’s primary industry is in one of the ten plastics sub-industries or not.** Sum of annual BICS 4 level assigned net revenue at primary industry level. BICS is the Bloomberg Industry Classification Standard (BICS). It is an industry classification system developed and maintained by Bloomberg that classifies securities based on business, economic function, and other characteristics.
Note that not every company at the industry level is assigned to a sub-industry as this depends on the real economy impacts of each company. Thus, sums may not add up. Also, industry specific revenue is calculated by Bloomberg’s proprietary methodology.
DEFINING THE PLASTIC CONTAINERS & PACKAGING SECTOR
4 BICS is the Bloomberg Industry Classification Standard (BICS). It is an industry classification system developed and maintained by Bloomberg that classifies securities based on business, economic function, and other characteristics.

15
IDENTIFYING THE COMPANIES
The 83 publicly traded companies in the PC&P sector we have identified as the Planet Tracker Universe have an estimated USD 54 billion in annual revenue (89% of the whole sector’s revenue) and USD 126 billion market capitalisation (34% of the whole
Universe’s market capitalisation) and a combined estimated total of 471,000 employees - see Appendix A.
There is a noticeable concentration within this subset, as the top 20 companies in the Universe by share of revenue, while only having 22% of the sector’s market capitalisation, are responsible for 62% of the PCP sector’s total revenue - see Table 3.
Of the top 20 in the Planet Tracker Universe, their primary listing is on 11 different stock exchanges, although three regulatory regimes dominate: EU and the USA (five companies each), Japan (four companies), followed by India and Canada (two companies each) and China and Taiwan (one company each) - see Appendix A.
The PC&P sector overall is further broken down into the following sub-industries: Plastic Bag and Pouch, Plastic Bottle, Plastic Packaging Film & Sheet and Protective Packaging Materials.
Table 3: Plastic Containers and Packaging Publicly Traded Companies’ Annual PC&P Industry-Specific Revenue.xx
UseTotal Market
Capitalisation** (USD billions)
Percent Market Capitalisation
Industry Revenue***
(USD billions)
Percent Industry Revenue
Plastic Containers and Packaging Sector* 369 100% 61 100%
83 Companies in the Planet Tracker Universe 126 34% 54 89%
Top 20 Companies in the Planet Tracker Universe 82 22% 38 62%
* Plastic Containers and Packaging sector which contains the Plastic Bag and Pouch, Plastic Bottle, Plastic Packaging Film & Sheet, and Protective Packaging Materials sub-sectors.** Sum of currency adjusted market cap for all PC&P industry members. 83 companies out of 245 companies with reported market capitalisation, as of 4 January 2021.*** Sum of annual BICS level assigned net revenue at primary PC&P industry level.

16
To provide an indication of the investment performance of the 83 companies in the Planet Tracker Universe, Planet Tracker created a market capitalisation weighted portfolio priced in USD, benchmarked against the MSCI ACWI (All Countries World Index).
While the MSCI ACWI Index is not an exact geographical match for these companies as it does not include Vietnam, it nonetheless provides a suitable benchmark for the Planet Tracker Universe’s performance on a global basis, from 2015 to 2020 - see Figure 4.
We recognise that our equity portfolio back test of the Planet Tracker Universe is indicative only, as its performance could be attributed to other factors such as sector, country, size or growth, for example.
Over the past 24 quarters, our Planet Tracker Universe portfolio has significantly underperformed the MSCI ACWI Index – see Table 5.
A SECTOR FACING VARIABLE FORTUNES
Figure 4: Planet Tracker Universe Performance vs. MSCI ACWI Index, 1 January 2015 to 1 January 2021.5
5 The MSCI ACWI Index is designed to represent performance of the full opportunity set of large- and mid-cap stocks across 23 developed and 27 emerging markets. As of November 2020, it covers more than 3,000 constituents across 11 sectors and approximately 85% of the free float-adjusted market capitalisation in each market. The index is built using MSCI’s Global Investable Market Index (GIMI) methodology, which is designed to take into account variations reflecting conditions across regions, market cap sizes, sectors, style segments and combinations.
Table 5: Investment Performance Statistics for the Planet Tracker Universe portfolio 1 January 2015 to 1 January 2021. N=24. Quarterly. USD adjusted. Market capitalisation weighted.
Return Statistics Risk Statistics Risk/Return Statistics
Total Return (%) 39.18 Standard Deviation 11.27 Sharpe Ratio 0.36
Mean Return (%) 6.61 Semi variance 10.61 Jensen Alpha -1.19
Mean Active Return (%) -4.40 Tracking Error (%) 8.62 Information Ratio -0.41
Minimum Return (%) -7.96 Skewness -1.23 Beta 0.70
Maximum Return (%) 4.23 Correlation 0.80

17
The Planet Tracker Universe portfolio outperformed the MSCI ACWI Index in only seven quarters between 2015 and 2020 with significant underperformance beginning before the COVID-19 outbreak. The cumulative return of the MSCI ACWI Index was 79.41% while the return for the Planet Tracker Universe over the same period was 39.18%, an underperformance of 40.23%.
The Planet Tracker Universe portfolio starts with 74 companies in Q1 2015 and adds the following:
• Q1 2016: Suzhou Hycan Holdings
• Q2 2016: TPBI
• Q3 2017: Xiamen Yanjan New Material
• Q1 2018: Samyang Packaging Corp., Guala Closures and Panca Budi Idaman
• Q2 2019: Shanghai Yongguan Adhesive Products Corp.
• Q3 2019: Amcor
• Q4 2020: An Phat Holdings
The Planet Tracker Universe portfolio’s mean active return, which is the average quarterly return relative to the benchmark, demonstrates significant underperformance against the MSCI ACWI Index. While the Planet Tracker Universe began outperforming the MSCI ACWI Index in 2015, since Q4 2017 - well before COVID-19 - the Universe significantly underperformed the MSCI ACWI Index. This underperformance is confirmed with a low Sharpe ratio and a poor information ratio, which measures the excess return of this portfolio less the MSCI ACWI Index divided by the tracking error - see Table 6.
Table 6: Contribution by Sector to Planet Tracker Universe Portfolio Total Return 2015 – 2020.xxi
% Average Weight Total Return %* Contribution to Return %
PC&P Index 100.00% 40.17% 40.17%
Materials sector 73.28% 45.67% 33.31%
Industrials sector 13.45% 20.23% 3.06%
Health Care sector 7.74% 13.59% 0.89%
Consumer Staples sector 5.28% 64.68% 2.77%
Consumer Discretionary sector 0.25% 26.89% 0.14%
* Different day count calculation means slightly different % than Table 5.

18
It is noteworthy that the top ten companies positively contributing to the Planet Tracker Universe portfolio total return have all made public sustainability commitments - see Table 7.
These ten companies contributed 84.17%xxiii of the Planet Tracker Universe’s active return to the 40.17% total return between 2015 and 2020. In addition, the majority of these ten companies have issued corporate responsibility reports in 2020.
On the other hand, only 30 companies out of the 83 companies in the Planet Tracker Universe report any environmental policies tracked, according to Bloomberg - see Table 15.
Table 7: Top Ten Companies Contributing to Planet Tracker Universe Portfolio Total Return 2015 - 2020.xxii
Company Average Weight
Contribution to Total Return
Corporate Responsibility Report (2020)
GRI Report (2020)
New Plastic Economy Signatory
Sustainable Plastics Policy
Biodiversity Policy
AptarGroup 5.78% 5.95% Y Y Y Y Y
CCL Industries 6.89% 5.87% Y Y
Berry Global 5.80% 3.96% Y Y Y Y
Huhtamaki 4.17% 3.81% Y Y Y Y
Sonoco Products 5.21% 3.66% Y Y
FP Corp. 2.39% 2.99% Y
Gerresheimer 2.47% 2.23% Y
Amcor 3.77% 1.80% Y Y Y Y Y
Sealed Air 7.94% 1.80% Y
Silgan Holdings 3.31% 1.74% Y
Total 47.73% 33.81% 7 4 5 7 3

19
The largest investors in the sector are investment advisors, which are companies that make investment recommendations, engage in security analysis for a fee and have discretionary authority over their clients’ assets. They are required to uphold a
fiduciary responsibility.
Planet Tracker surveyed 8,665 investment positions for 4,175 different investors in the 83 companies in the Planet Tracker Universe. In aggregate, institutional equity investors have USD 24.17 billion in unrealised gains in the companies assessed.
Of these, the top 20 institutional investors have USD 7.70 billion in unrealised gains6 from investments in the Planet Tracker Universe. Their investments represent 31.9% of all unrealised gains in the Planet Tracker Universe - see Appendix E.
These investments are at risk of becoming stranded if the investors do not persuade the companies in the Planet Tracker Universe to transition to more sustainable practices.
Appendix B shows the top 50 equity investors after assessing 8,655 equity investments in the 83 listed companies in the Planet Tracker Universe, valued in total at more than USD 87.6 billion. It demonstrates that the top 50 institutional investors, sovereign wealth funds and insurance companies own 45% of shares in the companies in the Planet Tracker Universe.
Not one of these 50 institutional investors is a member of an investor coalition to work on plastics including As You Sow’s Plastic Solutions Investor Alliance or is a signatory to the New Plastics Economy Global Commitment and only five of these 50 institutions are members of the PRI Plastics Working Group.
Appendix F shows the top 20 private equity, foundation and individual investors who each have a single investment in the Planet Tracker Universe. These 20 investors have 20 investments that in total equal USD 10.98 billion, or 12.5% of the 8,655 investments assessed in the Planet Tracker Universe.
Not one of these 20 investors is a member of As You Sow’s Plastic Solutions Investor Alliance, a signatory to the New Plastics Economy Global Commitment, or a member of the PRI Plastics Working Group, as of 30 September 2020.
The Norges Bank publication ‘Ocean Sustainability Expectations Towards Companies’ is a positive example of an investment manager’s policy guidance including risk assessment of plastics pollution in the ocean – it provides a useful template for companies in the Planet Tracker Universe to replicate for their own operations.
INVESTORS HAVE THE POWER TO SET A NEW AGENDA, BUT FEW DO
6 An unrealised gain is a potential profit that exists on paper, resulting from an investment. It is an increase in the value of an asset that has yet to be sold for cash, such as a stock position that has increased in value but still remains open. A gain becomes realized once the position is sold for a profit.

20
In 2018, Norges Bank published its Ocean Sustainability Expectations Towards Companies policy guidance for companies in which it invests, which includes USD 1.073 billion it has invested in 34 companies in which it has equity ownership positions in the Planet Tracker Universe. The investor stated that ocean degradation can reduce revenue while increasing legal, regulatory, financial and physical risks from over-exploited resources.
Norges Bank states that it wants the boards of companies in which it invests to:
Understand the broader environmental and social consequences of business operations;
Integrate material ocean-related risks and opportunities into corporate strategy, risk management and reporting;
Define responsibilities within the organisation that are effectively guided, monitored, and reviewed by company management.
Norges Bank set out specific requirements for companies potentially impacted by ocean degradation including plastic pollution and stated that any PC&P companies it invests in must:
Integrate ocean sustainability into strategy:
“Companies engaged in the plastics value chain should have a strategy addressing a transition towards a circular economy (p. 5)”.
Integrate material ocean-related risks into risk management:
“Companies involved in agriculture, mining, waste management and other activities that can result in land-based marine pollution, and related supply chains, should work towards preventing or significantly reducing such pollution (p. 5)”.
Disclose material priorities and report associated metrics and targets:
“Companies should disclose outcomes of their activities, products and services that may affect the oceans. For example, food and beverage companies could seek to disclose the end-of-life solutions for their plastic packaging (p. 6)”.
Planet Tracker was able to identify the ownership of USD 8.9 billion – or 31.2% – of the USD 28.6 billion in fixed income securities – both corporate bonds and loans – issued by the companies in the Planet Tracker Universe. In many jurisdictions, regulators do not require ownership of fixed income securities to be reported.
Planet Tracker assessed 22.8% of all outstanding fixed income securities for a total of USD 5.62 billion out of USD 24.68 billion, or 43 out of 152 fixed income securities.
Ownership of the 152 fixed income securities is split between 87 corporate bonds and 65 corporate loans, issued either directly by the 83 companies in the Planet Tracker Universe tracked or by their subsidiaries - see Appendix G for a list of corporate bonds and loans assessed.
The largest fixed income investors in this industry have significant positions. Led by BlackRock, J.P. Morgan, Prudential and Robeco, these investors have a clear opportunity to set the investor agenda for these publicly-traded companies with regards to how the sector will coalesce around a vision to support a transition to a circular economy – see Appendix E.

21
The league table ranking for banks credited with involvement in fixed income issuance in the Planet Tracker Universe, from 1 January 2015 to 31 December 2020, lists the top 20 investment banks with a cumulative 81.8% of total volume and 68.3% share of revenue from issuing fixed income to companies in the Planet Tracker Universe - see Table 8.
As of 4 January 2021, companies in the Planet Tracker Universe had issued:
• No green bonds
• No sustainability bonds
• No sustainability-linked loans.
69.9% of the USD 24.68 billion in bonds and loans will mature in the next five years - 2021 to 2025 - see Table 9. Given that none of the bonds (or loans) in the Planet Tracker Universe, as of 4 January 2021, are green bonds, sustainability bonds or sustainability-linked loans, there is an immediate opportunity as these roll over for the bankers to plan to issue green or sustainability linked bonds or loans to fund the transition of the Planet Tracker Universe towards a sustainable future.
Table 8: Planet Tracker Universe League Table 2015 to 2020.xxiv
Manager/BookrunnerVolume
(USD millions)
Overall %Cumulative Volume %
Total
Revenue (USD
millions)Revenue Share %
Cumulative Revenue %
Total
1 Bank of America Securities 5,854 16.9% 16.9% 18.11 11.9% 11.9%
2 BMO Capital Markets 2,689 7.8% 24.6% 8.23 5.4% 17.3%
3 Scotiabank 2,651 7.7% 32.3% 6.67 4.4% 21.6%
4 Wells Fargo & Co. 2,184 6.3% 38.6% 6.84 4.5% 26.1%
5 HSBC 2,111 6.1% 44.7% 4.11 2.7% 28.8%
6 J.P. Morgan 1,803 5.2% 49.9% 7.45 4.9% 33.7%
7 Goldman Sachs 1,757 5.1% 55.0% 6.93 4.5% 38.3%
8 Mizuho Financial 1,685 4.9% 59.8% 7.46 4.9% 43.1%
9 UniCredit 876 2.5% 62.3% 7.02 4.6% 47.8%
10 Rabobank 813 2.3% 64.7% 1.44 0.9% 48.7%
11 Sumitomo Mitsui Financial 804 2.3% 67.0% 3.25 2.1% 50.8%
12 Commerzbank 720 2.1% 69.1% 1.67 1.1% 51.9%
13 Citi 643 1.9% 70.9% 0.93 0.6% 52.5%
14 Nomura 620 1.8% 72.7% 2.65 1.7% 54.3%
15 Credit Suisse 542 1.6% 74.3% 7.89 5.2% 59.4%
16 Barclays 467 1.4% 75.6% 4.80 3.2% 62.6%
17 Morgan Stanley 459 1.3% 77.0% 3.11 2.0% 64.6%
18 US Bancorp 438 1.3% 78.2% 0.72 0.5% 65.1%
19 Credit Agricole CIB 431 1.2% 79.5% 2.19 1.4% 66.5%
20 Nedbank 404 1.2% 80.6% 1.63 1.1% 67.6%
20 Standard Bank of South Africa 404 1.2% 81.8% 1.09 0.7% 68.3%
28,354 81.8% 104.19 68.3%

22
In aggregate, across both equity and fixed income investments, the top four investors in the Planet Tracker Universe are estimated to be Vanguard Group, BlackRock, State Street and the Government Pension Investment Fund of Japan - see Table 10.
Table 9: Planet Tracker Universe Fixed Income Maturity by Security Category 2021 to 2040 (USD billions).xxv
Total Senior Unsecured
Company Guaranteed
Bank Guaranteed Unsecured Secured Senior
Secured Bonds No Data
2021 1,231 394 40 - 85 13 - - 699
2022 4,284 118 425 1 4 - - - 3,735
2023 5,160 856 875 1 3 - - 9 3,417
2024 3,710 371 465 - - 52 524 - 2,298
2025 2,855 1,213 400 13 28 - - - 1,200
2026 1,431 442 895 - - 80 14 - -
2027 496 62 425 10 - - - - -
2028 1,509 1,271 238 - - - - - -
2029 780 775 - 5 - - - - -
2030 1,396 1,396 - - - - - - -
2031 177 147 - - - - - - 30
2033 450 - 450 - - - - - -
2036 147 147 - - - - - - -
2040 894 894 - - - - - - -
Total 24,667 8,086 4,229 30 120 145 538 9 11,509
Table 10: Top Four Equity and Fixed Income Investors in the Planet Tracker Universe.xxvi
Investor Investment USD (millions)
% Equity Investment in
SectorFixed Income Investment
% Fixed Income Investment in
Sector
Total Aggregate
Investment
Vanguard 4,991 5.7% 118 2.1% 5,109
BlackRock 4,493 5.1% 420 7.5% 4,913
State Street 2,227 2.5% 30 0.5% 2,257 Government Pension Investment Fund of Japan
1,551 1.8% 45 0.8% 1,596
Total 13,262 613 13,875

23
Planet Tracker surveyed over 7,800 regulatory filings made between 1 January 2015 and 1 January 2021 by companies in the Planet Tracker Universe. The aim was to determine the main environmental and natural capital constraints they believe they are facing
and about which they are obliged to inform investors in filings.
We searched for important key words or phrases such as ‘waste’ or ‘recycling’ or ‘extended producer responsibility’. Filings included the following report categories, when available in English (or translated by Bloomberg from Japanese, French, German, Spanish, Portuguese, Italian, Traditional Chinese, Korean, Simplified Chinese and Russian): annual reports, corporate responsibility reports, quarterly reports, corporate governance reports, formal company presentations, annual consolidated financial statements, annual audited financial statements, 8-K, 10-Q, DEF 14A, ESG releases, S-4/A and others.
The analysis shows that few if any companies in the sector are identifying such terms as key natural capital risks in their regulatory filings. This exposes these companies to considerable legal risks as they have a duty to inform existing and potential investors of the risks of investing in their company - see Table 11.
Furthermore, only 21 out of 83 companies in the Planet Tracker Universe – 25% of all companies analysed – issued a corporate responsibility report in 2020. Of the 21 companies’ corporate responsibility reports, ten were in English, eight were in Japanese, three were in Chinese and three were also translated from Japanese into English - see Table 12.
THE COMPANIES’ PERCEPTION OF THEIR RISK
Table 11: Planet Tracker Universe: Survey of 7,800 Regulatory Filings by the Planet Tracker Universe for Natural Capital Key Words, 1 January 2015 to 1 January 2021.xxvii
Mentioned in Regulatory Fillings Total Mentions 2015 to 2020 Companies % of Companies
Climate Change 231 31 36%
Circular Economy 104 28 34%
Global Warming 84 24 29%
Waste Reduction 79 21 25%
Biodiversity 69 16 19%
Species 37 15 18%
Oceans 20 12 15%
Seas 15 7 8%
Extended Producer Responsibility 13 5 6%
Planetary Impact 7 2 2%
Keyword search via Bloomberg’s automation tools screening of documents where possible in English, Japanese, French, German, Spanish, Portuguese, Italian, Traditional Chinese, Korean, Simplified Chinese and Russian.

24
Using GRI, a commonly accepted global ESG tool allowing companies to report on their sustainability impacts in a consistent and credible way as an example, only 6% of all companies in the Planet Tracker Universe report via GRI according to Bloomberg data - see Table 13. Lack of adequate reporting limits the ability of the companies in the Planet Tracker Universe to communicate to investors the environmental risks associated with plastics production.
In other words, 94% of companies in the Planet Tracker Universe do not file GRI reports that would enable comparable ESG analytics across the sector.
On closer inspection, it is clear that most companies in the PC&P Universe lack rudimentary policies to address key risks they face – see Table 14.
Table 13: Total Corporate Responsibility Reports, GRI, and New Plastics Economy Global Commitments, for the companies in the PC&P Universe 2020.xxix
Sustainability Reports Companies in the Planet Tracker Universe % Yes % No
Published Corporate Responsibility Report in 2020 21 25% 75%
Cites GRI in latest reports 7 8% 92%
GRI reported verified and submitted 5 6% 94%
New Plastics Economy Global Commitment 5 6% 94%
7 The GRI Standards are a global ESG tool allowing companies to report on their sustainability impacts in a consistent and credible way. This enhances global comparability and enables organisations to be transparent and accountable.
Table 14: Companies in the Planet Tracker Universe Environmental Policies Overall Assessment, 2020.xxx
Sustainability ReportsCompanies in the
Planet Tracker Universe Disclosure
% Yes % No
Waste Reduction Policy 29 35% 65%
Energy Efficiency Policy 27 33% 67%
Water Policy 22 27% 73%
Climate Change Policy 20 24% 76%
Total GHG CO2 Emissions Intensity per Sales 19 23% 77%
Sustainable Packaging 15 18% 82%
Biodiversity Policy 8 10% 90%
Table 12: Planet Tracker Universe’ Companies with Corporate Responsibility Reports in 2020.xxviii
Companies
Achilles FP Corp. Rengo
Amcor Guala Closures Sealed Air
AptarGroup Hokkan Holdings Sonoco Products
Berry Global Huhtamaki Taiwan Hon Chuan Enterprise
Carlit Holdings Intertape Polymer Group Ton Yi Industrial Corp.**
Chuo Kagaku Ishizuka Glass Winpak
Dai Nippon Printing Nampak* Yonyu Plastics
* Cites in its report the Global Reporting Initiative (GRI) standards. ** In accordance with GRI, not verified or submitted to GRI. Orange: GRI report verified and submitted to GRI.
25
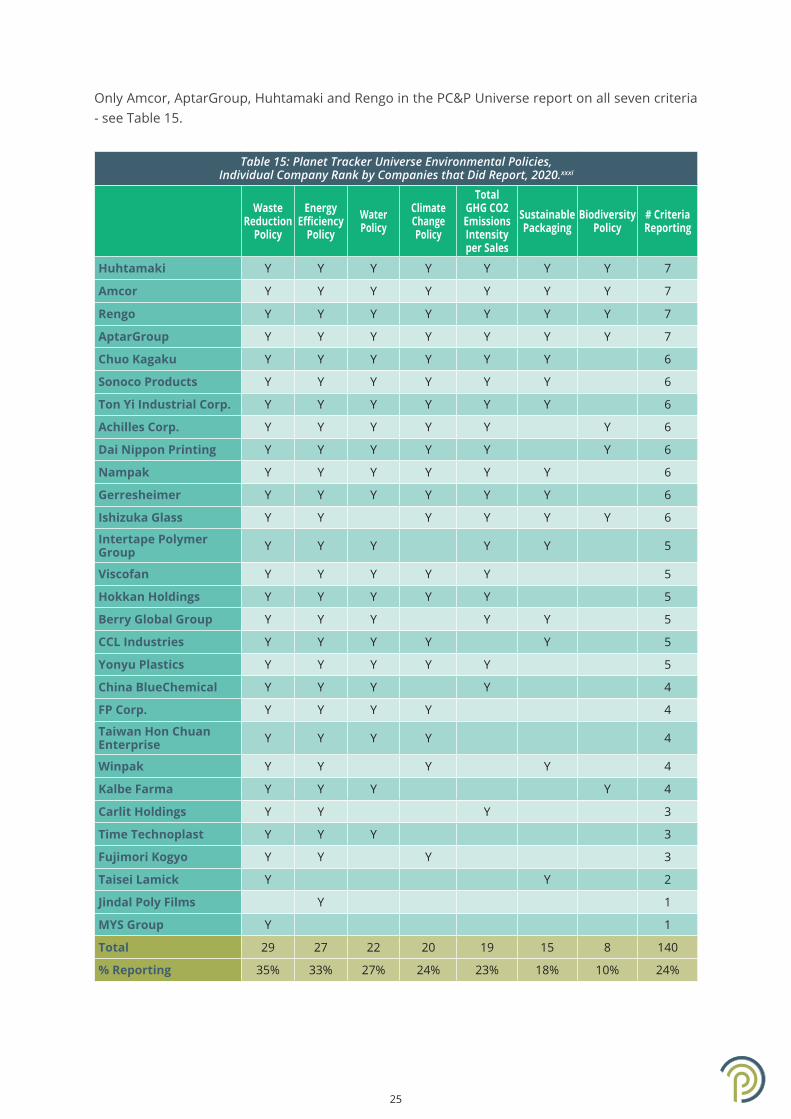
Only Amcor, AptarGroup, Huhtamaki and Rengo in the PC&P Universe report on all seven criteria - see Table 15.
Table 15: Planet Tracker Universe Environmental Policies, Individual Company Rank by Companies that Did Report, 2020.xxxi
Waste Reduction
Policy
Energy Efficiency
PolicyWater Policy
Climate Change Policy
Total GHG CO2 Emissions Intensity per Sales
Sustainable Packaging
Biodiversity Policy
# Criteria Reporting
Huhtamaki Y Y Y Y Y Y Y 7
Amcor Y Y Y Y Y Y Y 7
Rengo Y Y Y Y Y Y Y 7
AptarGroup Y Y Y Y Y Y Y 7
Chuo Kagaku Y Y Y Y Y Y 6
Sonoco Products Y Y Y Y Y Y 6
Ton Yi Industrial Corp. Y Y Y Y Y Y 6
Achilles Corp. Y Y Y Y Y Y 6
Dai Nippon Printing Y Y Y Y Y Y 6
Nampak Y Y Y Y Y Y 6
Gerresheimer Y Y Y Y Y Y 6
Ishizuka Glass Y Y Y Y Y Y 6
Intertape Polymer Group Y Y Y Y Y 5
Viscofan Y Y Y Y Y 5
Hokkan Holdings Y Y Y Y Y 5
Berry Global Group Y Y Y Y Y 5
CCL Industries Y Y Y Y Y 5
Yonyu Plastics Y Y Y Y Y 5
China BlueChemical Y Y Y Y 4
FP Corp. Y Y Y Y 4
Taiwan Hon Chuan Enterprise Y Y Y Y 4
Winpak Y Y Y Y 4
Kalbe Farma Y Y Y Y 4
Carlit Holdings Y Y Y 3
Time Technoplast Y Y Y 3
Fujimori Kogyo Y Y Y 3
Taisei Lamick Y Y 2
Jindal Poly Films Y 1
MYS Group Y 1
Total 29 27 22 20 19 15 8 140
% Reporting 35% 33% 27% 24% 23% 18% 10% 24%

26
Remarkably, according to Bloomberg, 53 companies in the Planet Tracker Universe are not disclosing if they have any policies regarding waste reduction, energy efficiency, water, climate change, GhG or CO2 emissions, sustainable packaging or biodiversity.
The policy categories are listed below.
Waste Reduction Policy: Indicates whether the company has implemented any initiatives to reduce the waste generated during the course of its operations.
Energy Efficiency Policy: Indicates whether the company has implemented any initiatives to make its use of energy more efficient.
Water Policy: Indicates whether the organisation has undertaken any initiatives to reduce the quantity of water used or to improve the efficiency of its processes, and whether the company is considering the potential water stress to its areas of operation.
Climate Change Policy: Indicates whether the company has outlined its intention to help reduce global emissions of GhGs through its ongoing operations and/or the use of its products and services.
Total GhG or CO2 Emissions Intensity per Sales: Total greenhouse gas (GhG) if available. Otherwise total carbon dioxide (CO2) intensity calculated as metric tonnes of greenhouse gases, if available, or CO2 emitted per million of sales revenue in the company’s reporting currency. Source is company filings.
Sustainable Packaging Commitment: Indicates whether the company has taken any steps to make its packaging more environmentally friendly. This might include efforts to improve the recyclability of packaging, to use less environmentally damaging materials in packaging etc.
Biodiversity Policy: Indicates whether the company has implemented any initiatives to ensure the protection of biodiversity. This might include trees and vegetation as well as wildlife and endangered species.
We anticipate a marked increase in such risk identification in future filings as global legislative initiatives, investor requests and a corporate push towards a new plastic waste paradigm makes this all but inevitable.
27
We recognise that plastic is a key component of the global economy. While not always a requirement, plastic can, for example be useful in decreasing food waste.xxxii As a lightweight material, thermoset plastics reduce the overall weight
of vehicles, trucks and planes with, according to the U.S. Department of Energy, a 10% reduction in vehicle weight which increases fuel economy by 5% to 7%.xxxiii In the healthcare industry, plastics is an ingredient used in PPE protection, sterilisation and effective medical delivery, however the medical industry is beginning to assess its waste problems.xxxiv This has become particularly evident in the COVID-19 pandemic.
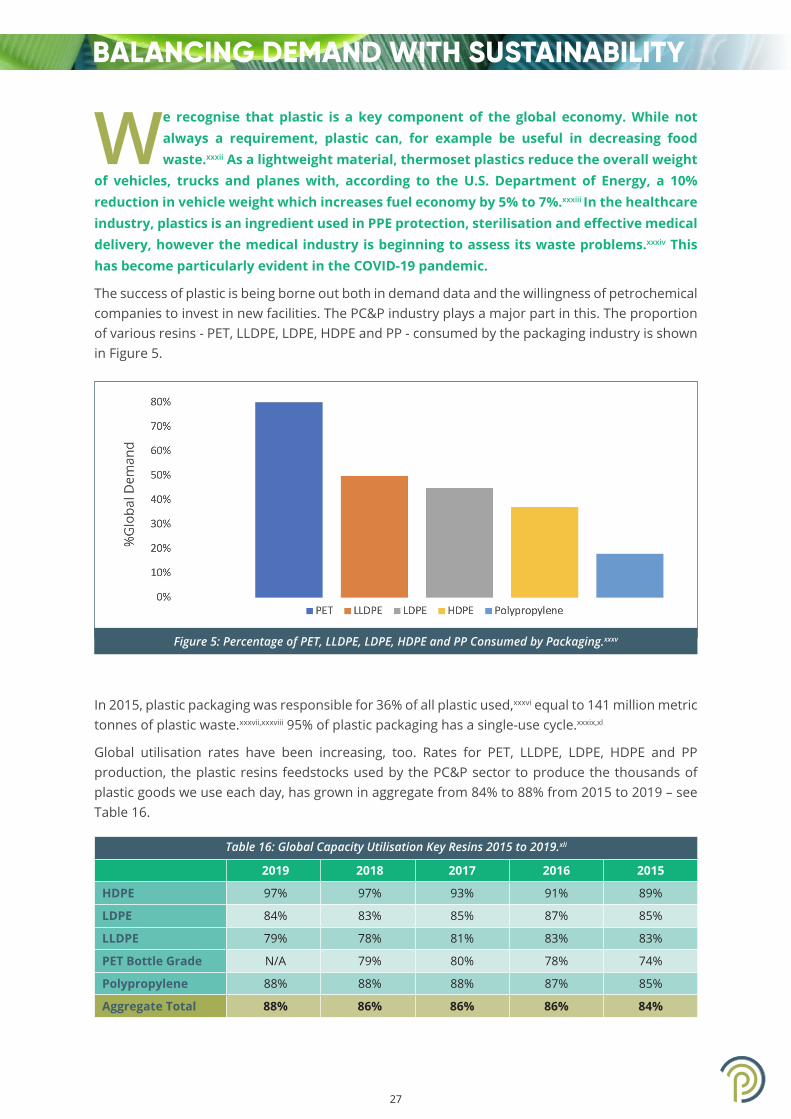
The success of plastic is being borne out both in demand data and the willingness of petrochemical companies to invest in new facilities. The PC&P industry plays a major part in this. The proportion of various resins - PET, LLDPE, LDPE, HDPE and PP - consumed by the packaging industry is shown in Figure 5.
In 2015, plastic packaging was responsible for 36% of all plastic used,xxxvi equal to 141 million metric tonnes of plastic waste.xxxvii,xxxviii 95% of plastic packaging has a single-use cycle.xxxix,xl
Global utilisation rates have been increasing, too. Rates for PET, LLDPE, LDPE, HDPE and PP production, the plastic resins feedstocks used by the PC&P sector to produce the thousands of plastic goods we use each day, has grown in aggregate from 84% to 88% from 2015 to 2019 – see Table 16.
BALANCING DEMAND WITH SUSTAINABILITY
Table 16: Global Capacity Utilisation Key Resins 2015 to 2019.xli
2019 2018 2017 2016 2015
HDPE 97% 97% 93% 91% 89%
LDPE 84% 83% 85% 87% 85%
LLDPE 79% 78% 81% 83% 83%
PET Bottle Grade N/A 79% 80% 78% 74%
Polypropylene 88% 88% 88% 87% 85%
Aggregate Total 88% 86% 86% 86% 84%
Figure 5: Percentage of PET, LLDPE, LDPE, HDPE and PP Consumed by Packaging.xxxv

28
However, it is the very success of plastic that has become its burden, giving rise to an increasingly negative environmental footprint. This is particularly true for single-use plastic. In turn, investors’ risk exposure is increasing for the same reasons that we listed earlier for the companies in the Planet Tracker Universe.
Environmental risks that investors need to consider include:
Plastic has a clear upstream fossil fuel footprint. Petrochemicals, from which plastic is derived, are now the fastest-growing percentage of a barrel of oil. The OECD and OPEC forecast 3.2 million barrels of oil per day growth for plastic feedstocks by 2030.xlii
For every plastic tonne produced, 4.4 tonnes of carbon dioxide are emitted, which does not include the full life-cycle assessment of plastics’ impacts.
40% of plastics end up in the environment with 11 million tonnes flowing into the oceans annually – similar to dumping a garbage truck of plastics into the oceans every minute, every hour, every day, throughout the year.xliv
Of the 11 million tonnes that ended up in the oceans in 2016, 80% share of leakage was from flexible and multilayer plastics, the subject of this report.
Currently, plastics waste in the ocean is estimated at 150 million metric tonnes,xlv and this is forecast to double by 2040.xlvi
Under business as usual, the plastic industry would account for 19% of the remaining global carbon budget to remain under 1.5 °C temperature rise by 2040.
Over 170 chemicals used in fracking (to produce plastic feedstocks) have known human health impacts.

29
It is clear that the companies themselves, and their legal advisors, are failing to recognise the growing risks described above. Investors therefore need to execute their fiduciary duty on behalf of their beneficiaries and request that these corporations improve their
disclosures. Both investors and companies can join the emerging co-ordinating groups.
The PRI Plastic Investor Working Group, which represents USD 5.9 trillion in assets under management (AUM),xlvii recognises that, ‘With increasing production and use, and poor end-of-life management, there are many environmental and economic risks associated with plastic. There are also legal requirements companies must increasingly respond to’.
This Working Group includes mainstream investors including Schroders, Federated Hermes, Rockefeller Asset Management, Robeco, Invesco and others - see Table 17.
On the PC&P sector only, it states, ‘The containers and packaging sector, as well as related sectors such as food and beverage and consumer goods, faces reputational and regulatory pressures to use alternative materials and recycled content at scale’.
Other investor groups have been developed. Corporate watchdog As You Sow, a non-profit shareholder advocacy organisation, launched the Plastic Solutions Investor Alliance alongside nearly 50 other global institutional investors and civil society organisations with more than USD 2 trillion in AUM - see Table 18.xlviii
THE INVESTORS’ RESPONSE
Table 17: PRI Plastic Investor Working Group Institutional Investor Members.
Institutional Investors
Aberdeen Standard Investments California Public Employees’ Retirement System CalPERS Neuberger Berman Group
Achmea Investment Management CCLA PAI Partners
ACTIAM Colonial First State Global Asset Management Robeco
Æquo Shareholder Engagement Services Colonial First State Rockefeller Asset Management
Alberta Investment Management Corporation Federated Hermes Sancroft International
Albizia Capital Fidelity International Schroders
BMO Global Asset Management Humanis Stewart Investors
BNP Paribas Asset Management Invesco Ltd UniSuper Management
Boston Common Asset Management Janus Henderson Investors Western Asset Management
Brunel Pension Partnership Mercy Investment Services

30
The Alliance describes the pressure facing FMCG companies, which PC&P companies need to understand, as these are the pressures the clients of these PC&P companies are facing, when it states that:
“Companies that place plastic packaging on the market need to demonstrate awareness of these challenges and prioritize actions to resolve them”.
Table 18: Plastic Solutions Investor Alliance Members (30/09/2020).
Institutional Investors and Civil Society Organisations
Actiam Dignity Health Nia Impact Capital
Adrian Dominican Sisters Domini Impact Investments P1 Investment Management
Aegon Asset Management EdenTree Investment Management Pax World Funds
ASN Bank Epic Capital Wealth Management Robeco
As You Sow Ethical Partners Funds Management Sisters of St Francis of Philadelphia
Ausbil Investment Management Federated Hermes Terra Alpha Investments
Aviva Investors First Affirmative Financial Network The Barrow Cadbury Trust
AXA Group Green Century Capital Management
The Ecumenical Council for Corporate Responsibility
Bailard Inc. Hull Family Foundation The Joseph Rowntree Charitable Trust
Boston Common Asset Management Impax Asset Management The Sustainability Group of Loring,
Wolcott & Coolidge
Boston Trust Walden Interfaith Center on Corporate Responsibility Trillium Asset Management
Candriam Investors Group JLens Investor Network Triodos Investment Management
Central Finance Board of the Methodist Church/Epworth Investment Management
Local Authority Pension Fund Forum Unigestion
Congregation of St. Joseph Melior Investment Management Vancity Investment Management
Dana Investment Advisors Mercy Investment Services Veris Wealth Partners
Daughters of Charity, Province of St. Louise NEI Investments Vert Asset Management

31
“Companies using plastic packaging should:
• Transition plastic packaging to be recyclable, reusable, or compostable to the fullest extent possible.
• Disclose annual plastic packaging use.
• Set plastics use reduction goals.
• Develop alternatives to plastics for packaging purposes, especially for single use packaging.
• Acknowledge responsibility and play a significant role in funding and facilitating collection and recycling or composting of packaging in markets where they operate (i.e. producer responsibility).
• Support public policy measures on reducing plastic waste and broadening producer responsibility.
• Accelerate research on the potential for technology and innovation to provide solutions”.
A further indication of the willingness of major financial institutions to recognise the need for a transition towards a circular economy (in plastics and other sectors) is the support of over 30 CEOs and senior executives from leading asset managers and banks - Goldman Sachs, HSBC, LGIM, ING, Intesa Sanpaolo, J.P. Morgan Chase, Morgan Stanley among others - representing over USD 18 trillion of assets, for The Ellen MacArthur Foundation’s research, ‘Financing the Circular Economy’,xlix which calls on the financial sector to ‘seize the full potential by scaling the circular economy in collaboration with governments and corporates’.
32
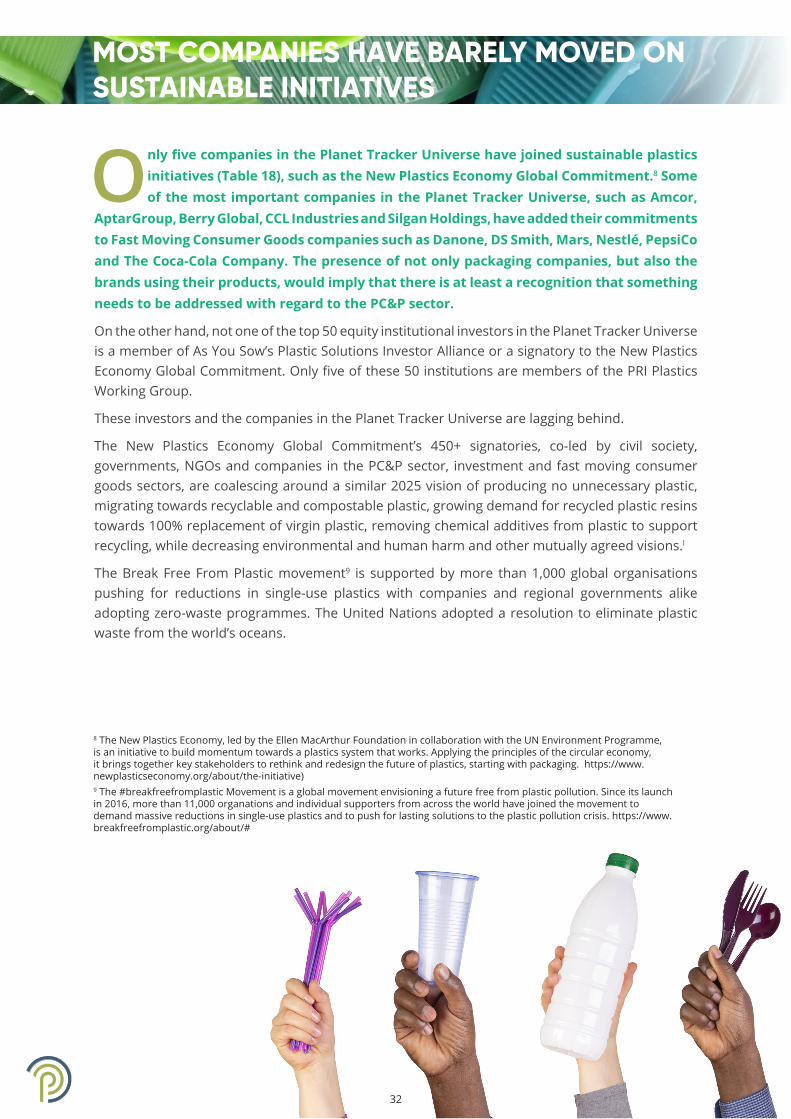
Only five companies in the Planet Tracker Universe have joined sustainable plastics initiatives (Table 18), such as the New Plastics Economy Global Commitment.8 Some of the most important companies in the Planet Tracker Universe, such as Amcor,
AptarGroup, Berry Global, CCL Industries and Silgan Holdings, have added their commitments to Fast Moving Consumer Goods companies such as Danone, DS Smith, Mars, Nestlé, PepsiCo and The Coca-Cola Company. The presence of not only packaging companies, but also the brands using their products, would imply that there is at least a recognition that something needs to be addressed with regard to the PC&P sector.
On the other hand, not one of the top 50 equity institutional investors in the Planet Tracker Universe is a member of As You Sow’s Plastic Solutions Investor Alliance or a signatory to the New Plastics Economy Global Commitment. Only five of these 50 institutions are members of the PRI Plastics Working Group.
These investors and the companies in the Planet Tracker Universe are lagging behind.
The New Plastics Economy Global Commitment’s 450+ signatories, co-led by civil society, governments, NGOs and companies in the PC&P sector, investment and fast moving consumer goods sectors, are coalescing around a similar 2025 vision of producing no unnecessary plastic, migrating towards recyclable and compostable plastic, growing demand for recycled plastic resins towards 100% replacement of virgin plastic, removing chemical additives from plastic to support recycling, while decreasing environmental and human harm and other mutually agreed visions.l
The Break Free From Plastic movement9 is supported by more than 1,000 global organisations pushing for reductions in single-use plastics with companies and regional governments alike adopting zero-waste programmes. The United Nations adopted a resolution to eliminate plastic waste from the world’s oceans.
MOST COMPANIES HAVE BARELY MOVED ON SUSTAINABLE INITIATIVES
8 The New Plastics Economy, led by the Ellen MacArthur Foundation in collaboration with the UN Environment Programme, is an initiative to build momentum towards a plastics system that works. Applying the principles of the circular economy, it brings together key stakeholders to rethink and redesign the future of plastics, starting with packaging. https://www.newplasticseconomy.org/about/the-initiative)9 The #breakfreefromplastic Movement is a global movement envisioning a future free from plastic pollution. Since its launch in 2016, more than 11,000 organations and individual supporters from across the world have joined the movement to demand massive reductions in single-use plastics and to push for lasting solutions to the plastic pollution crisis. https://www.breakfreefromplastic.org/about/#

33
Some of the many recent downstream initiatives include:
Multinational consumer goods company Unilever committing to decrease its virgin plastic footprint by 50% by 2025.
Nestlé announcing it will spend up to CHF 1.5 billion (USD 1.7 billion) by 2025 to purchase more than two million metric tonnes of food-grade recycled plastic. Building on its 2018 commitment to make 100% of its packaging recyclable or reusable by 2025, Nestlé will reduce its use of virgin plastics by one third by 2025.
Indorama Ventures, headquartered in Thailand, but with almost 30% of its revenue from the EU in 2019, has committed USD 1.5 billion over the next five years to develop ‘bottle-to-bottle’ recycling to assist customers such as Coca-Cola, PepsiCo and Nestlé in achieving a higher % of recycled PET plastics to comply with new regulations such as the European Commission’s Single-use Plastics Directive.
Danone has committed that by 2025 all packaging will be reusable, recyclable or compostable and it aims to initiate / support initiatives to enhance collection and recycling in all top 20 markets (90% sales) by 2025.
Mondelez has committed to making all packaging recyclable by 2025 and providing clear information on recycling guidelines to customers.
PepsiCo stating its goal is to reduce virgin plastic content by 35% across its beverage portfolio by 2025 (2.5 million tonnes of cumulative virgin plastics displaced). It expects to eliminate 67 billion plastic bottles by 2025 and is building on the goal to make 100% of packaging recyclable, compostable or biodegradable and increase recycled content to 25%.
The German machinery and engineering trade group VDMA, which represents 3,300 companies,li is pushing for policymakers to increase the prices of virgin plastic feedstocks and increase quotas for recycled plastic within products predominately in the PC&P sector. VDMA is asking that policymakers support responsible plastic production, use and waste management,lii given that the PC&P sector lacks a transparent vision of how some plastic is necessary, while other plastic causes harm.
In the face of these initiatives, demand for plastic is beginning to decouple from GDP, as plastic growth to GDP elasticity adjusts to the new regulatory, investor and consumer pressures, bounded by upstream feedstock growth and downstream policy constraints.
J.P. Morgan is now forecasting that plastics’ demand elasticity - currently at 1.5x GDP - will decrease to 0.5x GDP by 2050, as the market migrates from virgin resins to recycled resins.liii

34
Situated at the end of the plastics supply chain, consumers are able to apply considerable pressure on both brands and governments to force change. The growing public outcry against single use plastic bags, amplified by celebrity environmentalists such as Sir
David Attenborough, has driven a response from FMCG companies on packaging and led to supermarket chains reducing their use of single-use plastic bags, although regulatory measures, such as a small charge on each bag, have reinforced that trend.
Perhaps more interesting is who is held responsible for ensuring consumer products are environmentally and socially responsible, with minimal impacts to communities. In this, consumers appear conflicted.
On the one hand, a survey by Kantar, in collaboration with Europanel and GfK, of more than 65,000 people in 24 countries in 2019, exploring how they feel about the use of plastics by FMCG companies, found that plastic waste was second only to climate change among consumer concerns - see Figure 6.
On the other hand, research in 2019 by Bioplastics News found that “nearly half (48%) of all consumers worldwide expect manufacturers to take the lead, saying they have the most responsibility to act on these issues. And making changes to account for this is clearly a matter of ‘when’, rather than ‘if’, for all businesses”.lv
This view is strongly supported by a limited survey of consumers in three countries, USA, France & U.K., in which they put the onus firmly on companies, placing them above governments and themselves - see Figure 7.
THE CONSUMER’S VIEW
Figure 6: Top Environmental Concerns Globally. Kantar survey of 65000 adults in 24 countries.liv

35
In November 2020, a report by global market research and public opinion specialist IPSOS, ‘The Sustainable Imperative;’lvi noted: ‘Consumer expectations and demands for more sustainable practices are higher than they have ever been, and they have withstood the pressures of the pandemic.
‘It is no longer a question of when companies should pursue a sustainability agenda, but how they should go about it’.
Figure 7: Where does Responsibility Lie? Ipsos Research among c. 1000 adults in each market: US, UK and France, Q2 2019.
Q: Who, if anyone, do
you think is responsible
for ensuring consumer
products are environmentally
and socially responsible?
36
Governments are increasingly enacting legislation and policies that directly impact the PC&P sector with, as of September 2020, more than 180 policies to date in 75 nations globally.lvii
In the European Strategy for Plastics in a Circular Economy, the European Commission has asserted that ‘by 2030, all plastic packaging placed on the EU market is either reusable or can be recycled in a cost-effective manner’.lviii
In February 2020, legislative pressure was identified as the top risk to the plastic industry by J.P. Morgan Cazenove, in ‘Petrochemicals – Peak Plastic: Potential impacts of a shift towards a circular economy on plastic and feedstock demand’.lix
Planet Tracker believes that governments are incentivised to tackle this problem for three main reasons, in addition to the environmental benefits that would follow.
1 Governments at both a national and municipal/regional level are incurring costs from having to clear up the plastic waste. In 2019, Deloitte placed a price on plastic pollution.lx The report – ‘The Price Tag of Plastic Pollution’ - estimates that marine plastic pollution could have resulted in an economic loss of USD 6 to 19 billion for 87 coastal countries in 2018. It further states, ‘Our conclusion is that beyond obvious ecological arguments, there is a strong economic and financial reason to address the marine plastic pollution challenge’.
2 Government debt levels have risen during the COVID-19 pandemic, finance ministries will be looking for revenue opportunities. Taxes on plastic containers may prove tempting as would levies against the revenues of the plastic producers, PC&P and FMCG companies.
3 Consumers could well think more positively of administrations that show their green credentials and avoid passing the consequences of such a strategy on to the consumers.
If legislation proves an attractive route, the options fall into three main categories:
1 Production and sale
2 Consumption and use
3 Waste management, circular economy and promoting recycled resins over virgin resins.
Across the three main markets in terms of production - China, the EU and the US – while differences exist, the broad momentum is the same - see Figure 8.
These three regions give examples of the policy risks globally. California’s one cent “sin-tax” on single-use plastic is forecast to become law in 2023lxi and the EU’s upcoming €800 per tonne plastic waste levy which came into force on 1 January 2021, will push the plastic industry to innovate, invest and restructure.lxii
REGULATORY PRESSURE IS BUILDING

37
China we view as the most straightforward at present, with bans which commenced this year. In the EU there has been a top-down approach with policy set at EU level but with national implementation necessary by each member state. The US is the most diverse, with policies remaining very fragmented depending on the state or city. The election of President-elect Biden may alter this picture as 2021 progresses.
Having examined the views of different stakeholders a confused picture emerges.
The companies in the Planet Tracker Universe are not revealing risks to investors in their filings about issues such as waste, pollution, recycling or extended user responsibilities.
The institutional investors which are the major shareholding group in these companies in the Planet Tracker Universe, however, do perceive some dangers, as alliances have been formed to highlight the needs for a circular economy or end of life management solutions. However, to date little is heard from them about the possibility of stranded assets, which is the likely outcome if companies fail to transition to a more sustainable output.
And yet, some companies from the broader PC&P and FMCG sectors are signatories to declarations promoting a new plastic economy. It appears inevitable that this mismatch will be corrected or declarations of intention to change be exposed as potentially misleading.
Consumers perceive the onus is on corporate players to tackle the environmental issues, although if an issue captures the public’s attention, such as marine litter, then companies who produce single-use plastics will come under increasing pressure to change.
For the financial markets, the important issue is that the risk exposure of companies in the Planet Tracker Universe is likely to change from the status quo. If there is a broad consensus that the unintended consequences of plastic products need to be addressed and if companies in the PC&P sector do not react quickly enough, then governments may need to fill the void. In turn, this raises important questions for investors about the rising probability of stranded assets.
Figure 8: Three Largest Plastics Producers (European Chemical Industry Council 2020) with Growing Legislation.
STAKEHOLDER CONSENSUS?

38
Companies in the Planet Tracker Universe are at an inflection point. The industry is at risk of adhering to the present technologies which drive environmental harm, pushing the sector towards obsolescence while newer technologies, which could
support an evolution in sustainable plastics and lead the Planet Tracker Universe into a circular economy, are not yet being invested in at scale.
We recommend that stakeholders take the following actions:
All investors should:
• Immediately request public disclosure of environmental risks and policies from all the 83 companies in the Planet Tracker Universe in order to safeguard their unrealised investment gains. In turn, this should allow investors to assess the likelihood of incurring stranded assets and asset write downs. These 83 companies need to recognise the impending risks in their filings and describe their transition strategy towards a circular economy. They can perform this individually or in the larger alliances to which they are signatories. For example:
• Develop time-bound engagement plans aligned with laws, regulations and initiatives: These investors must commit to publish time-bound engagement plans by 2025 for all companies in the Planet Tracker Universe in which they invest, aligned with global plastic waste initiatives and regulatory policies. These should require changes to production lines to reduce, in absolute terms, the pollution, measured in tonnes, associated with the products they produce.
• Demand that the companies in which they invest make clear, public commitments, by employing Norges Bank’s ‘Ocean Sustainability Expectations Towards Companies’ policy guidance or similar documents, to address the pollution from plastic products.
• Lead by example by joining and directly engaging in global alliances to work collaboratively across industry to decrease their environmental impacts in a time-bound, auditable manner and encourage companies in the Planet Tracker Universe to do the same.
Equity investors, invested in the plastics supply chain, need to implement time-bound policies and recommendations whose results will be reported to their institutions’ Governance Boards in a timely and consistent manner. These should support the rapid expansion of site-specific recycling infrastructure while insisting upon the rapid standardisation of design of the polymers so that it easier to recycle and reuse these polymers effectively in a closed loop manner.
RECOMMENDATIONS

39
Fixed income investors need to work directly with companies in the Planet Tracker Universe to ensure they factor into pricing short- mid- and long-term legislative risks that may impact debt covenants. The maturity of such instruments (e.g., bonds, loans), or new issues, presents an ideal time for such active involvement.
• Review debt covenants: Fixed income investors must review the debt covenants of companies in the Planet Tracker Universe which they manage to ensure compliance with both financing requirements and environmental laws, as well as regulations and policies that govern each company they finance. This is aimed at minimising fiduciary risk to the investors and their beneficiaries while enabling the companies in which they invest to immediately develop and implement strategies to pivot their production lines to minimize pollution.
• Commit to renewing all debt by 2025 as green and sustainable: Investment bankers and the companies they represent must commit to renewing as green and sustainable the 70% of debt that is maturing in the Planet Tracker Universe by 2025 to finance industry retooling towards a circular economy based on the sustainable plastics products of tomorrow, not the dirty plastics products of yesterday.
Companies in the PC&P Universe should:
• implement a global business strategy by 2025 that migrates their business platforms in a time-bound manner towards a circular economy so as to mitigate the financial risks described in this report.lxiii These companies must focus their energies on designing for reusability and they must actively join global alliances to support a transition towards a plastics-waste free economy.
• must disclose their environmental risks in their regulatory filings and their environmental policies. All companies must issue corporate responsibility reports annually to improve their disclosure.
Policymakers and regulators need to work directly with investors and companies throughout the supply chain to simplify product design, reduce the complexity of packaging and harmonise packaging formats, grow the adoption of recyclable feedstocks, increase recyclable infrastructure and improve consumer outreach, so that plastics pollution can be rapidly mitigated and addressed.

40
APPENDIX A COMPANIES IN THE PLANET TRACKER UNIVERSE RANKED BY PLASTIC CONTAINERS AND PACKAGING SECTOR-SPECIFIC REVENUE
Table 19: Companies in the Planet Tracker Universe Ranked by Plastic Containers and Packaging Sector-Specific Revenue.lxiv
CompaniesMarket
Cap (USD millions)**
Industry Specific Revenue
(USD millions)
% Revenue
from Industry
Sum Market Cap Size Major Index ISIN Current
Employees
Berry Global Group* $7,218 $5,180 44% 8.9% Mid-cap Russell 1000 US08579W1036 47,000
Sealed Air Corp. $7,046 $4,791 100% 17.2% Mid-cap S&P 500 US81211K1007 16,500
Toppan Printing $4,945 $3,787 28% 23.7% Mid-cap Nikkei 225 JP3629000005 52,599
Dai Nippon Printing $6,003 $3,589 28% 29.9% Mid-cap Nikkei 225 JP3493800001 38,181
AptarGroup* $8,679 $2,860 100% 34.8% Mid-cap Russell 1000 US0383361039 14,000
Huhtamaki $5,528 $2,738 72% 39.5% Mid-cap STXE 600 FI0009000459 18,554
Amcor* $18,289 $2,716 22% 44.2% Large-cap S&P 500 JE00BJ1F3079 50,000
FP Corp. $3,471 $1,714 100% 47.2% Mid-cap Topix JP3167000003 4,484
Intertape Polymer Group $1,195 $1,159 100% 49.2% Small-cap S&P/TSX Composite CA4609191032 1,800
Rengo $2,228 $1,091 17% 51.0% Mid-cap Topix JP3981400009 18,902
Jindal Poly Films $273 $1,049 96% 52.8% Micro-cap S&P BSE SmallCap INE197D01010 1,751
Uflex $378 $1,013 100% 54.6% Small-cap S&P BSE 500 INE516A01017 6,360
Viscofan $3,425 $901 95% 56.1% Mid-cap STXE 600 ES0184262212 4,904
Winpak $2,248 $874 100% 57.6% Mid-cap S&P/TSX Composite CA97535P1045 2,400
Gerresheimer $3,485 $846 54% 59.1% Mid-cap STXE 600 DE000A0LD6E6 9,890
Taiwan Hon Chuan Enterprise $597 $697 100% 60.3% Small-cap Taiwan TAIEX TW0009939009 4,642
Groupe Guillin $569 $685 93% 61.5% Small-cap Euronext Growth All Share FR0012819381 2,619
Guala Closures $677 $679 100% 62.7% Small-cap STXE TM IT0005311821 4,849
Jiangsu Shuangxing Color Plastic New Materials
$1,716 $633 98% 63.7% Small-cap Shenzhen SE Composite CNE1000013N6 1,433
Silgan Holdings* $4,043 $611 14% 64.8% Mid-cap Russell 1000 US8270481091 13,100
Sekisui Kasei $245 $534 43% 65.7% Micro-cap Topix JP3419800002 3,855
Shanghai Zijiang Enterprise Group $1,007 $526 39% 66.6% Small-cap Shanghai SE
Composite CNE000001055 7,026
Kalbe Farma $5,080 $521 33% 67.5% Mid-cap Jakarta Composite ID1000125107 12,161
Fujimori Kogyo $872 $520 49% 68.4% Small-cap Topix JP3821000001 2,522
Sonoco Products $6,013 $512 10% 69.3% Mid-cap Russell 1000 US8354951027 23,000
Time Technoplast $146 $505 100% 70.2% Micro-cap S&P BSE 500 INE508G01029 2,561
Hokkan Holdings $191 $465 40% 71.0% Micro-cap Topix JP3846600009 2,424
Resilux $356 $463 100% 71.8% Small-cap S&P Europe SmallCap BE0003707214 907
Polyplex Thailand $682 $454 100% 72.6% Small-cap Stock Exchange of Thailand Index TH0815010002 520
Chuo Kagaku $117 $442 100% 73.3% Micro-cap JASDAQ Stock JP3514000003 1,702
Ton Yi Industrial Corp. $631 $422 40% 74.0% Small-cap Taiwan TAIEX TW0009907006 1,192

41
CompaniesMarket
Cap (USD millions)**
Industry Specific Revenue
(USD millions)
% Revenue
from Industry
Sum Market Cap Size Major Index ISIN Current
Employees
CCL Industries* $8,372 $420 10% 74.8% Mid-cap S&P/TSX Composite CA1249003098 21,400
An Phat Holdings $483 $406 99% 75.5% Small-cap Ho Chi Minh Stock Index VN000000APH7 98
EPL $1,111 $384 100% 76.1% Small-cap S&P BSE 500 INE255A01020 1,168
An Phat Bioplastics $128 $364 90% 76.8% Micro-cap Ho Chi Minh Stock Index VN000000AAA4 1,715
Myers Industries $700 $356 69% 77.4% Small-cap Russell 2000 US6284641098 1,640
Achilles Corp. $223 $348 47% 78.0% Micro-cap Topix JP3108000005 1,675
MYS Group $991 $346 71% 78.6% Small-cap Shenzhen SE Composite CNE100000H85 4,900
NPC $111 $334 86% 79.1% Micro-cap KOSPI KR7004250007 219
Samyang Packaging Corp. $285 $322 100% 79.7% Micro-cap KOSPI KR7272550005 470
Takween Advanced Industries $356 $317 100% 80.2% Small-cap Tadawul All Share SA130G50IOH8
Cosmo Films $121 $310 100% 80.8% Micro-cap S&P BSE SmallCap INE757A01017 911
Shanghai Yongguan Adhesive Products Corp.
$492 $285 100% 81.3% Small-cap Shanghai SE Composite CNE100003LN9 1,497
Ishizuka Glass $82 $285 42% 81.8% Micro-cap Topix JP3136000001 2,153
Bilcare $14 $257 100% 82.2% Nano-cap No major index INE986A01012
Shenzhen Beauty Star $2,011 $232 81% 82.6% Mid-cap Shenzhen SE
Composite CNE100000BR7 4,550
AJ Plast $257 $221 100% 83.0% Micro-cap Stock Exchange of Thailand Index TH0214010Z07 507
Taisei Lamick $211 $221 90% 83.4% Micro-cap Topix JP3444900009 846
China BlueChemical $743 $217 14% 83.7% Small-cap BBG HKSE All CNE1000002D0 4,834
Thong Guan Industries $248 $211 93% 84.1% Micro-cap FTSE ASEAN All-Share MYL7034OO001 865
Plasto Cargal Group $38 $208 100% 84.5% Nano-cap TA-All Share IL0007270163 358
Grupa Kety $1,210 $205 22% 84.8% Small-cap WSE WIG PLKETY000011 5,188
PSB Industries $77 $205 68% 85.2% Micro-cap CAC All Tradeable FR0000060329 1,890
Indopoly Swakarsa Industry $42 $203 100% 85.5% Nano-cap Jakarta Composite ID1000115900 1,208
Zhuhai Zhongfu Enterprise $512 $197 87% 85.9% Small-cap Shenzhen SE
Composite CNE0000000C8 1,976
Panca Budi Idaman $176 $183 56% 86.2% Micro-cap Jakarta Composite ID1000141401 3,593
Trias Sentosa $79 $181 100% 86.5% Micro-cap Jakarta Composite ID1000059009 1,159
Pack Corp. $543 $180 21% 86.8% Small-cap Topix JP3345900009 1,252
CPMC Holdings $508 $170 16% 87.1% Small-cap BBG HKSE All HK0000057171 6,039
Tredegar Corp. $685 $169 17% 87.4% Small-cap Russell 2000 US8946501009 3,000
Zhejiang Great Southeast $749 $166 71% 87.7% Small-cap Shenzhen SE
Composite CNE100000CH6 652
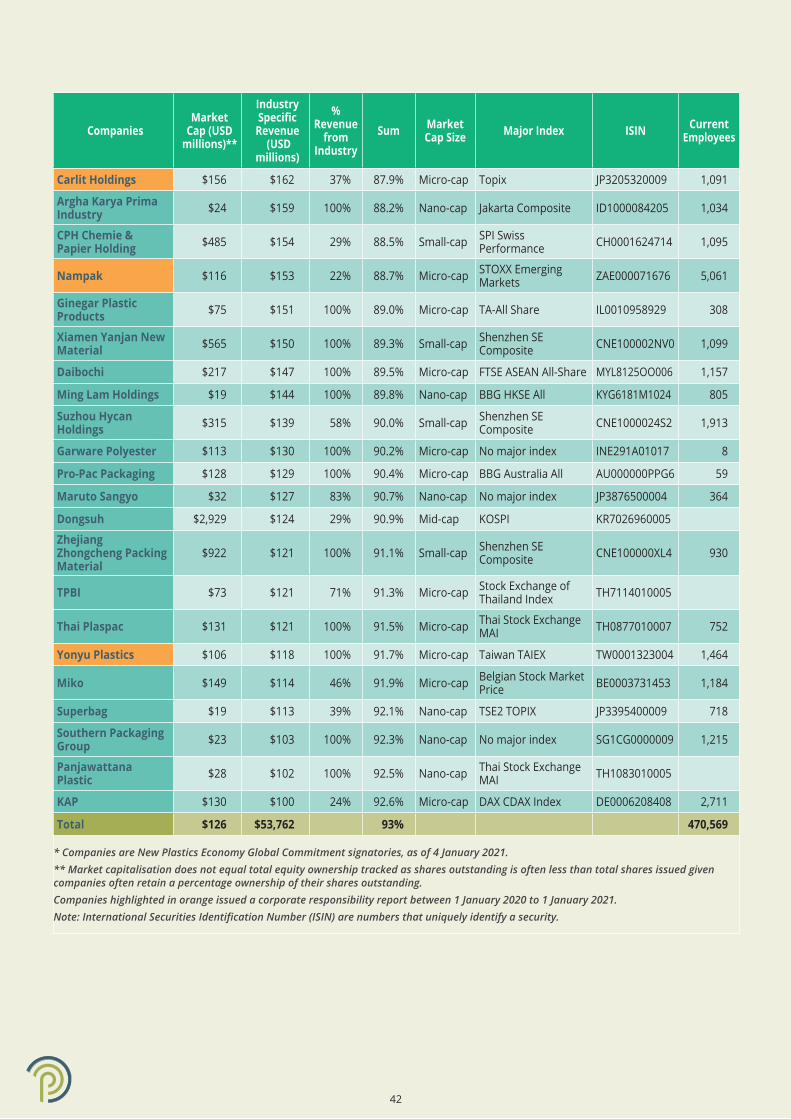
42
CompaniesMarket
Cap (USD millions)**
Industry Specific Revenue
(USD millions)
% Revenue
from Industry
Sum Market Cap Size Major Index ISIN Current
Employees
Carlit Holdings $156 $162 37% 87.9% Micro-cap Topix JP3205320009 1,091
Argha Karya Prima Industry $24 $159 100% 88.2% Nano-cap Jakarta Composite ID1000084205 1,034
CPH Chemie & Papier Holding $485 $154 29% 88.5% Small-cap SPI Swiss
Performance CH0001624714 1,095
Nampak $116 $153 22% 88.7% Micro-cap STOXX Emerging Markets ZAE000071676 5,061
Ginegar Plastic Products $75 $151 100% 89.0% Micro-cap TA-All Share IL0010958929 308
Xiamen Yanjan New Material $565 $150 100% 89.3% Small-cap Shenzhen SE
Composite CNE100002NV0 1,099
Daibochi $217 $147 100% 89.5% Micro-cap FTSE ASEAN All-Share MYL8125OO006 1,157
Ming Lam Holdings $19 $144 100% 89.8% Nano-cap BBG HKSE All KYG6181M1024 805
Suzhou Hycan Holdings $315 $139 58% 90.0% Small-cap Shenzhen SE
Composite CNE1000024S2 1,913
Garware Polyester $113 $130 100% 90.2% Micro-cap No major index INE291A01017 8
Pro-Pac Packaging $128 $129 100% 90.4% Micro-cap BBG Australia All AU000000PPG6 59
Maruto Sangyo $32 $127 83% 90.7% Nano-cap No major index JP3876500004 364
Dongsuh $2,929 $124 29% 90.9% Mid-cap KOSPI KR7026960005
Zhejiang Zhongcheng Packing Material
$922 $121 100% 91.1% Small-cap Shenzhen SE Composite CNE100000XL4 930
TPBI $73 $121 71% 91.3% Micro-cap Stock Exchange of Thailand Index TH7114010005
Thai Plaspac $131 $121 100% 91.5% Micro-cap Thai Stock Exchange MAI TH0877010007 752
Yonyu Plastics $106 $118 100% 91.7% Micro-cap Taiwan TAIEX TW0001323004 1,464
Miko $149 $114 46% 91.9% Micro-cap Belgian Stock Market Price BE0003731453 1,184
Superbag $19 $113 39% 92.1% Nano-cap TSE2 TOPIX JP3395400009 718
Southern Packaging Group $23 $103 100% 92.3% Nano-cap No major index SG1CG0000009 1,215
Panjawattana Plastic $28 $102 100% 92.5% Nano-cap Thai Stock Exchange
MAI TH1083010005
KAP $130 $100 24% 92.6% Micro-cap DAX CDAX Index DE0006208408 2,711
Total $126 $53,762 93% 470,569
* Companies are New Plastics Economy Global Commitment signatories, as of 4 January 2021.** Market capitalisation does not equal total equity ownership tracked as shares outstanding is often less than total shares issued given companies often retain a percentage ownership of their shares outstanding.Companies highlighted in orange issued a corporate responsibility report between 1 January 2020 to 1 January 2021. Note: International Securities Identification Number (ISIN) are numbers that uniquely identify a security.
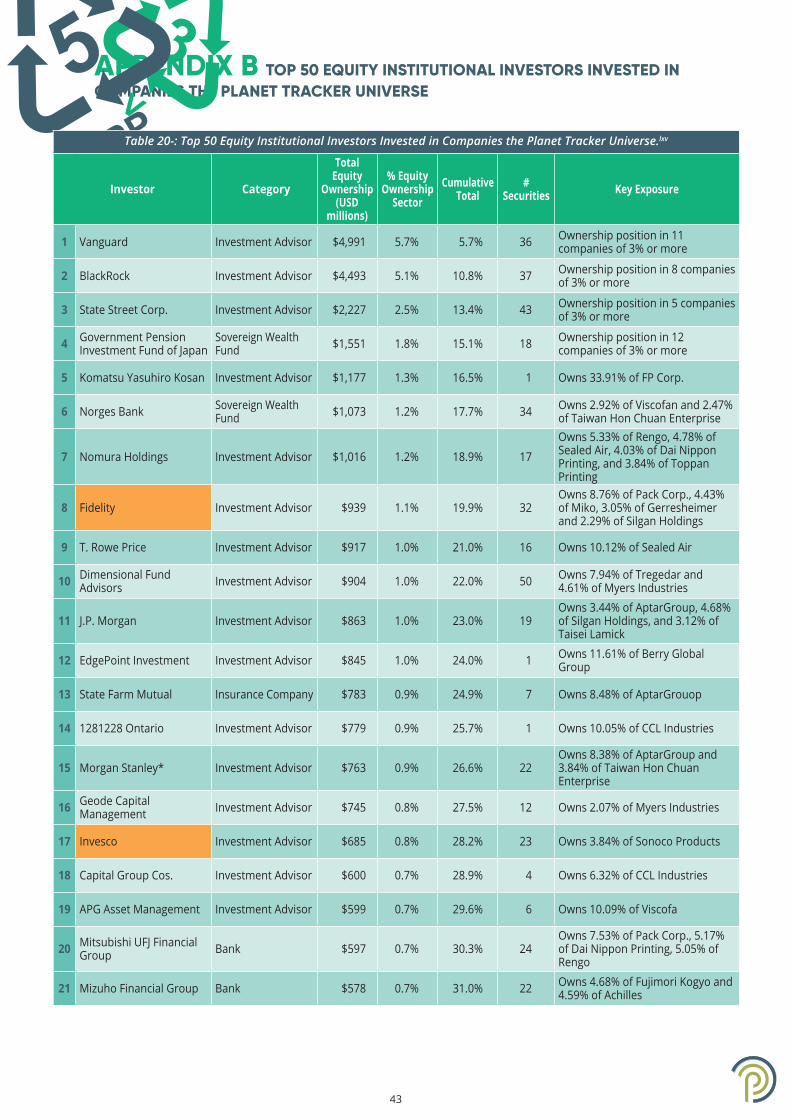
43
APPENDIX B TOP 50 EQUITY INSTITUTIONAL INVESTORS INVESTED IN COMPANIES THE PLANET TRACKER UNIVERSE
Table 20-: Top 50 Equity Institutional Investors Invested in Companies the Planet Tracker Universe.lxv
Investor Category
Total Equity
Ownership (USD
millions)
% Equity Ownership
SectorCumulative
Total#
Securities Key Exposure
1 Vanguard Investment Advisor $4,991 5.7% 5.7% 36 Ownership position in 11 companies of 3% or more
2 BlackRock Investment Advisor $4,493 5.1% 10.8% 37 Ownership position in 8 companies of 3% or more
3 State Street Corp. Investment Advisor $2,227 2.5% 13.4% 43 Ownership position in 5 companies of 3% or more
4 Government Pension Investment Fund of Japan
Sovereign Wealth Fund $1,551 1.8% 15.1% 18 Ownership position in 12
companies of 3% or more
5 Komatsu Yasuhiro Kosan Investment Advisor $1,177 1.3% 16.5% 1 Owns 33.91% of FP Corp.
6 Norges Bank Sovereign Wealth Fund $1,073 1.2% 17.7% 34 Owns 2.92% of Viscofan and 2.47%
of Taiwan Hon Chuan Enterprise
7 Nomura Holdings Investment Advisor $1,016 1.2% 18.9% 17
Owns 5.33% of Rengo, 4.78% of Sealed Air, 4.03% of Dai Nippon Printing, and 3.84% of Toppan Printing
8 Fidelity Investment Advisor $939 1.1% 19.9% 32Owns 8.76% of Pack Corp., 4.43% of Miko, 3.05% of Gerresheimer and 2.29% of Silgan Holdings
9 T. Rowe Price Investment Advisor $917 1.0% 21.0% 16 Owns 10.12% of Sealed Air
10 Dimensional Fund Advisors Investment Advisor $904 1.0% 22.0% 50 Owns 7.94% of Tregedar and
4.61% of Myers Industries
11 J.P. Morgan Investment Advisor $863 1.0% 23.0% 19Owns 3.44% of AptarGroup, 4.68% of Silgan Holdings, and 3.12% of Taisei Lamick
12 EdgePoint Investment Investment Advisor $845 1.0% 24.0% 1 Owns 11.61% of Berry Global Group
13 State Farm Mutual Insurance Company $783 0.9% 24.9% 7 Owns 8.48% of AptarGrouop
14 1281228 Ontario Investment Advisor $779 0.9% 25.7% 1 Owns 10.05% of CCL Industries
15 Morgan Stanley* Investment Advisor $763 0.9% 26.6% 22Owns 8.38% of AptarGroup and 3.84% of Taiwan Hon Chuan Enterprise
16 Geode Capital Management Investment Advisor $745 0.8% 27.5% 12 Owns 2.07% of Myers Industries
17 Invesco Investment Advisor $685 0.8% 28.2% 23 Owns 3.84% of Sonoco Products
18 Capital Group Cos. Investment Advisor $600 0.7% 28.9% 4 Owns 6.32% of CCL Industries
19 APG Asset Management Investment Advisor $599 0.7% 29.6% 6 Owns 10.09% of Viscofa
20 Mitsubishi UFJ Financial Group Bank $597 0.7% 30.3% 24
Owns 7.53% of Pack Corp., 5.17% of Dai Nippon Printing, 5.05% of Rengo
21 Mizuho Financial Group Bank $578 0.7% 31.0% 22 Owns 4.68% of Fujimori Kogyo and 4.59% of Achilles
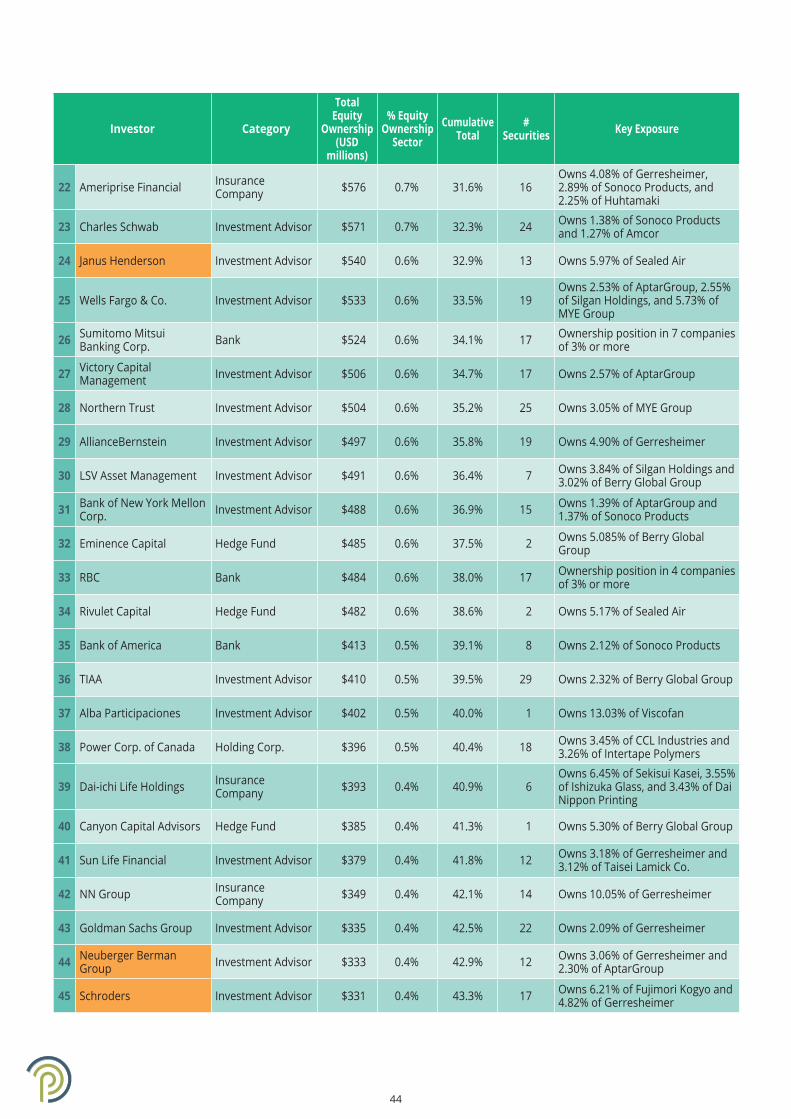
44
Investor Category
Total Equity
Ownership (USD
millions)
% Equity Ownership
SectorCumulative
Total#
Securities Key Exposure
22 Ameriprise Financial Insurance Company $576 0.7% 31.6% 16
Owns 4.08% of Gerresheimer, 2.89% of Sonoco Products, and 2.25% of Huhtamaki
23 Charles Schwab Investment Advisor $571 0.7% 32.3% 24 Owns 1.38% of Sonoco Products and 1.27% of Amcor
24 Janus Henderson Investment Advisor $540 0.6% 32.9% 13 Owns 5.97% of Sealed Air
25 Wells Fargo & Co. Investment Advisor $533 0.6% 33.5% 19Owns 2.53% of AptarGroup, 2.55% of Silgan Holdings, and 5.73% of MYE Group
26 Sumitomo Mitsui Banking Corp. Bank $524 0.6% 34.1% 17 Ownership position in 7 companies
of 3% or more
27 Victory Capital Management Investment Advisor $506 0.6% 34.7% 17 Owns 2.57% of AptarGroup
28 Northern Trust Investment Advisor $504 0.6% 35.2% 25 Owns 3.05% of MYE Group
29 AllianceBernstein Investment Advisor $497 0.6% 35.8% 19 Owns 4.90% of Gerresheimer
30 LSV Asset Management Investment Advisor $491 0.6% 36.4% 7 Owns 3.84% of Silgan Holdings and 3.02% of Berry Global Group
31 Bank of New York Mellon Corp. Investment Advisor $488 0.6% 36.9% 15 Owns 1.39% of AptarGroup and
1.37% of Sonoco Products
32 Eminence Capital Hedge Fund $485 0.6% 37.5% 2 Owns 5.085% of Berry Global Group
33 RBC Bank $484 0.6% 38.0% 17 Ownership position in 4 companies of 3% or more
34 Rivulet Capital Hedge Fund $482 0.6% 38.6% 2 Owns 5.17% of Sealed Air
35 Bank of America Bank $413 0.5% 39.1% 8 Owns 2.12% of Sonoco Products
36 TIAA Investment Advisor $410 0.5% 39.5% 29 Owns 2.32% of Berry Global Group
37 Alba Participaciones Investment Advisor $402 0.5% 40.0% 1 Owns 13.03% of Viscofan
38 Power Corp. of Canada Holding Corp. $396 0.5% 40.4% 18 Owns 3.45% of CCL Industries and 3.26% of Intertape Polymers
39 Dai-ichi Life Holdings Insurance Company $393 0.4% 40.9% 6
Owns 6.45% of Sekisui Kasei, 3.55% of Ishizuka Glass, and 3.43% of Dai Nippon Printing
40 Canyon Capital Advisors Hedge Fund $385 0.4% 41.3% 1 Owns 5.30% of Berry Global Group
41 Sun Life Financial Investment Advisor $379 0.4% 41.8% 12 Owns 3.18% of Gerresheimer and 3.12% of Taisei Lamick Co.
42 NN Group Insurance Company $349 0.4% 42.1% 14 Owns 10.05% of Gerresheimer
43 Goldman Sachs Group Investment Advisor $335 0.4% 42.5% 22 Owns 2.09% of Gerresheimer
44 Neuberger Berman Group Investment Advisor $333 0.4% 42.9% 12 Owns 3.06% of Gerresheimer and
2.30% of AptarGroup
45 Schroders Investment Advisor $331 0.4% 43.3% 17 Owns 6.21% of Fujimori Kogyo and 4.82% of Gerresheimer

45
Pl
Investor Category
Total Equity
Ownership (USD
millions)
% Equity Ownership
SectorCumulative
Total#
Securities Key Exposure
46 Wellington Management Group Investment Advisor $324 0.4% 43.7% 6 Owns 3.63% of Silgan Holdings and
3.22% of Viscofan
47 Nippon Life Insurance Insurance Company $324 0.4% 44.0% 16 Owns 4.29% of Toppan Printing
and 4.86% of Hokkan Holdings
48 Manulife Insurance Company $323 0.4% 44.4% 46 Owns 1.49% of CCL Industries
49 American Century Cos. Investment Advisor $286 0.3% 44.7% 32 Owns 3.72% of Sonoco Products
50 Aviva Insurance Company $272 0.3% 45.0% 7 Owns 20.92% of Grupa Kety
Subtotal Top 50 Institutions $39,461 45.0% 865 positions
Grand Total $87,622 100.0% 8,655 positions
* Combination of Morgan Stanley, Eaton Vance, and Calvert Investments. Note: Market capitalisation does not equal total equity ownership tracked as shares outstanding is often less than total shares issued given companies often retain a percentage ownership of their shares outstanding.Orange means the company is a PRI Plastics Working Group member.
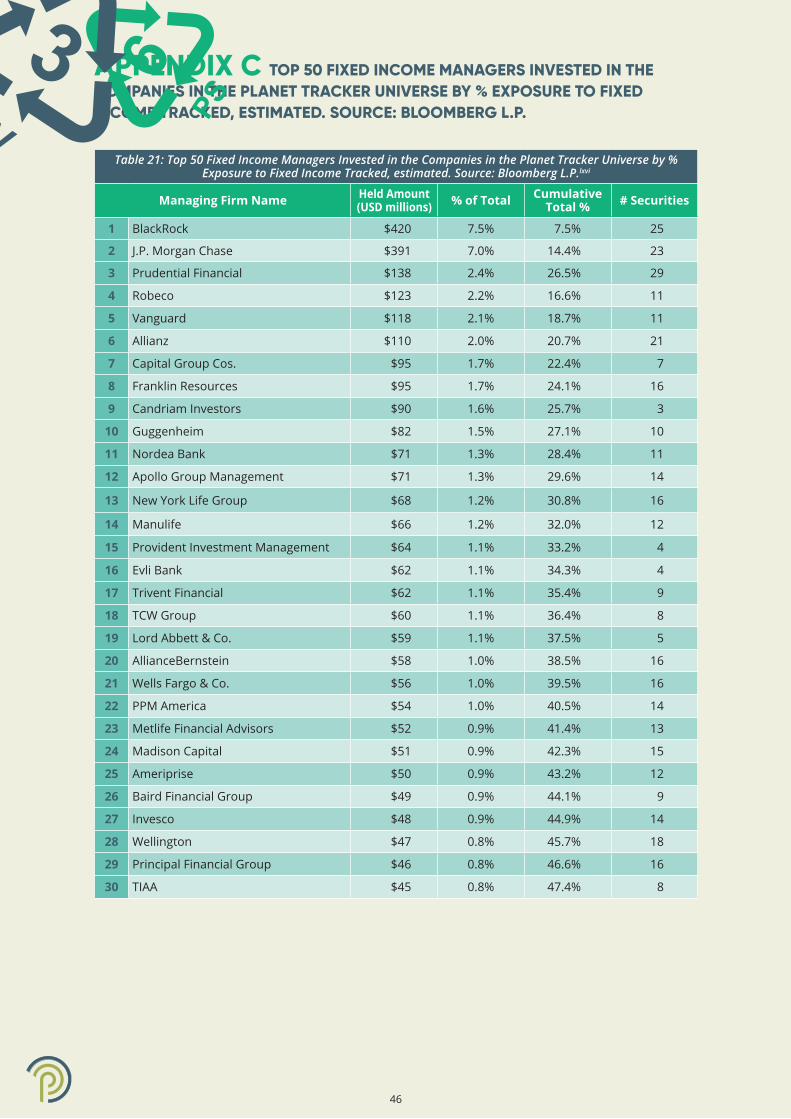
APPENDIX C TOP 50 FIXED INCOME MANAGERS INVESTED IN THE COMPANIES IN THE PLANET TRACKER UNIVERSE BY % EXPOSURE TO FIXED INCOME TRACKED, ESTIMATED. SOURCE: BLOOMBERG L.P.
46
Table 21: Top 50 Fixed Income Managers Invested in the Companies in the Planet Tracker Universe by % Exposure to Fixed Income Tracked, estimated. Source: Bloomberg L.P.lxvi
Managing Firm Name Held Amount (USD millions) % of Total Cumulative
Total % # Securities
1 BlackRock $420 7.5% 7.5% 25
2 J.P. Morgan Chase $391 7.0% 14.4% 23
3 Prudential Financial $138 2.4% 26.5% 29
4 Robeco $123 2.2% 16.6% 11
5 Vanguard $118 2.1% 18.7% 11
6 Allianz $110 2.0% 20.7% 21
7 Capital Group Cos. $95 1.7% 22.4% 7
8 Franklin Resources $95 1.7% 24.1% 16
9 Candriam Investors $90 1.6% 25.7% 3
10 Guggenheim $82 1.5% 27.1% 10
11 Nordea Bank $71 1.3% 28.4% 11
12 Apollo Group Management $71 1.3% 29.6% 14
13 New York Life Group $68 1.2% 30.8% 16
14 Manulife $66 1.2% 32.0% 12
15 Provident Investment Management $64 1.1% 33.2% 4
16 Evli Bank $62 1.1% 34.3% 4
17 Trivent Financial $62 1.1% 35.4% 9
18 TCW Group $60 1.1% 36.4% 8
19 Lord Abbett & Co. $59 1.1% 37.5% 5
20 AllianceBernstein $58 1.0% 38.5% 16
21 Wells Fargo & Co. $56 1.0% 39.5% 16
22 PPM America $54 1.0% 40.5% 14
23 Metlife Financial Advisors $52 0.9% 41.4% 13
24 Madison Capital $51 0.9% 42.3% 15
25 Ameriprise $50 0.9% 43.2% 12
26 Baird Financial Group $49 0.9% 44.1% 9
27 Invesco $48 0.9% 44.9% 14
28 Wellington $47 0.8% 45.7% 18
29 Principal Financial Group $46 0.8% 46.6% 16
30 TIAA $45 0.8% 47.4% 8

47
Managing Firm Name Held Amount (USD millions) % of Total Cumulative
Total % # Securities
31 Government Pension Investment Fund of Japan $45 0.8% 48.2% 15
32 Goldman Sachs $44 0.8% 48.9% 18
33 Voya Investment Management $43 0.8% 49.7% 17
34 Ashmore Group $42 0.7% 50.4% 12
35 Goldpoint Partners $40 0.7% 51.1% 14
36 NYL Investors $40 0.7% 51.9% 14
37 UBS $38 0.7% 52.5% 13
38 Power Corp. of Canada $38 0.7% 53.2% 7
39 Auto Owners Group $37 0.7% 53.9% 2
40 Federated Investors $37 0.7% 54.5% 11
41 Western Asset Management $36 0.7% 55.2% 13
42 Deutsche Bank $36 0.6% 55.8% 18
43 Barings $36 0.6% 56.5% 14
44 Dai-Ichi Life Holdings $35 0.6% 57.1% 4
45 Victory Capital Management $34 0.6% 57.7% 6
46 Industry Funds Management $34 0.6% 58.3% 9
47 Tokio Marine Holdings $34 0.6% 58.9% 6
48 HSBC $34 0.6% 59.5% 10
49 Tortoise Capital Advisors $33 0.6% 60.1% 12
50 HPS Investment Partners $32 0.6% 60.7% 13
Total $3,548 60.7%

48
While plastics can be sourced from bio-based feedstocks (vegetable oils or other sources), the industry is predominantly reliant on fossil fuel feedstocks (crude oil, natural gas liquids or coal). As shown in Figure 9, plastics are generally produced applying the following steps:
Extracting crude oil, natural gas and coal.
Refining to convert feedstocks into monomers, which are the building blocks of polymers. Refining requires heating the feedstocks in a furnace and sending the contents to a distillation unit so that lighter and heavier compounds separate, which is called fractionalisation. After distillation, either steam or catalytic cracking occurs, which breaks down hydrocarbons into alkenes, alkanes or alkynes.
APPENDIX D THE BASICS - FROM MONOMERS TO POLYMERS TO PLASTICS TO REUSE
Raw materials
Distillation - cracking
Base chemicals
Resin intermediates
Polymerization
Chemical reactions
Polycondensation
Monomers
Polymerization
Polymers (mainly thermosetting)
Polymers (mainly thermoplastics)
Compounding Compounding
Processing: moulding by (machinery)...- compression/injection - blow moulding- extrusion - calendering- vacuum forming - coating, etc
Finished products(such as mouldings, pipe, sheet, film, containers,
insulated cable, flooring, upholstery, foams, fibres)
Paints, glues, etc Moulding powders
Fillers,plasticiserspigments,
etc
Figure 9: Production Sequence in the Processing of Plastics. Source: Encyclopaedia of Occupational Health and Safety.
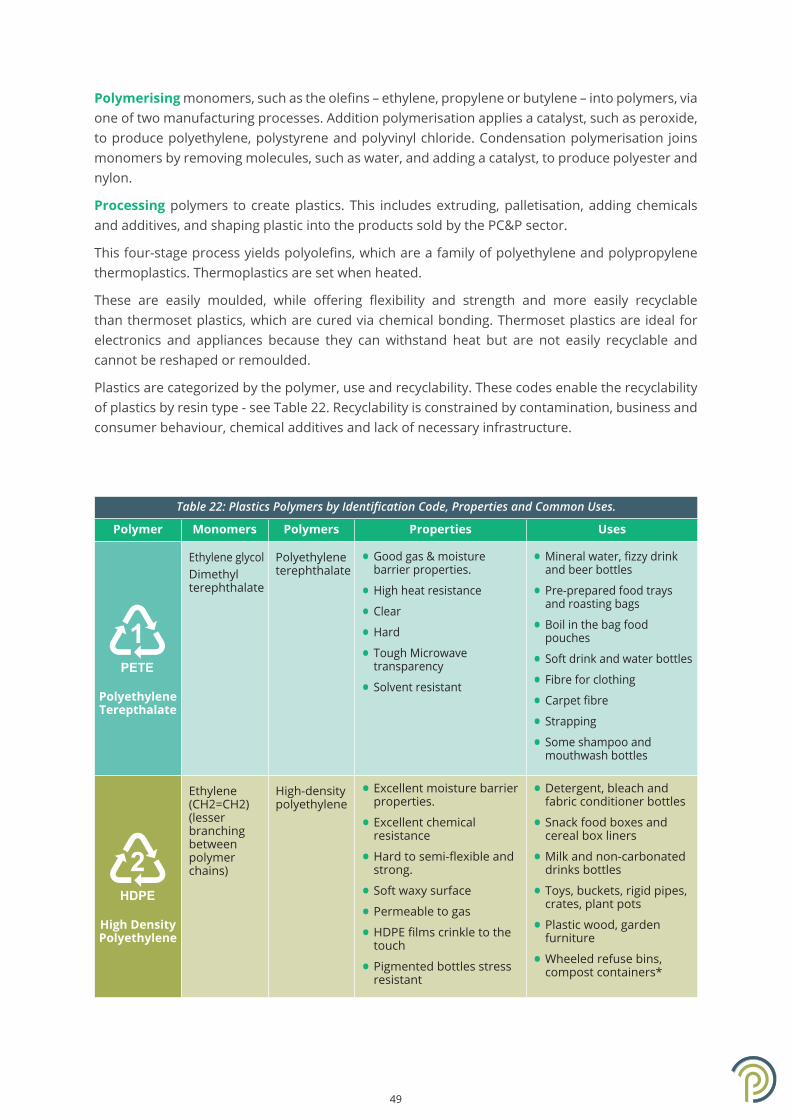
49
Polymerising monomers, such as the olefins – ethylene, propylene or butylene – into polymers, via one of two manufacturing processes. Addition polymerisation applies a catalyst, such as peroxide, to produce polyethylene, polystyrene and polyvinyl chloride. Condensation polymerisation joins monomers by removing molecules, such as water, and adding a catalyst, to produce polyester and nylon.
Processing polymers to create plastics. This includes extruding, palletisation, adding chemicals and additives, and shaping plastic into the products sold by the PC&P sector.
This four-stage process yields polyolefins, which are a family of polyethylene and polypropylene thermoplastics. Thermoplastics are set when heated.
These are easily moulded, while offering flexibility and strength and more easily recyclable than thermoset plastics, which are cured via chemical bonding. Thermoset plastics are ideal for electronics and appliances because they can withstand heat but are not easily recyclable and cannot be reshaped or remoulded.
Plastics are categorized by the polymer, use and recyclability. These codes enable the recyclability of plastics by resin type - see Table 22. Recyclability is constrained by contamination, business and consumer behaviour, chemical additives and lack of necessary infrastructure.
Table 22: Plastics Polymers by Identification Code, Properties and Common Uses.
Polymer Monomers Polymers Properties Uses
Polyethylene Terepthalate
Ethylene glycolDimethyl terephthalate
Polyethylene terephthalate
• Good gas & moisture barrier properties.
• High heat resistance
• Clear
• Hard
• Tough Microwave transparency
• Solvent resistant
• Mineral water, fizzy drink and beer bottles
• Pre-prepared food trays and roasting bags
• Boil in the bag food pouches
• Soft drink and water bottles
• Fibre for clothing
• Carpet fibre
• Strapping
• Some shampoo and mouthwash bottles
High Density Polyethylene
Ethylene (CH2=CH2) (lesser branching between polymer chains)
High-density polyethylene
• Excellent moisture barrier properties.
• Excellent chemical resistance
• Hard to semi-flexible and strong.
• Soft waxy surface
• Permeable to gas
• HDPE films crinkle to the touch
• Pigmented bottles stress resistant
• Detergent, bleach and fabric conditioner bottles
• Snack food boxes and cereal box liners
• Milk and non-carbonated drinks bottles
• Toys, buckets, rigid pipes, crates, plant pots
• Plastic wood, garden furniture
• Wheeled refuse bins, compost containers*

50
Polymer Monomers Polymers Properties Uses
Polyvinyl Chloride
Vinyl chloride Polyvinyl chloride
• Excellent transparency
• Hard, rigid (flexible when plasticised)
• Good chemical resistance
• Long term stability
• Good weathering ability
• Stable electrical properties
• Low gas permeability
• Credit cards
• Carpet backing and other floor covering
• Window and door frames, guttering
• Pipes and fittings, wire and cable sheathing
• Synthetic leather products**
Low Density Polyethylene
Ethylene (CH2=CH2) (excessive branching)
Low-density polyethylene and linear low-density polyethylene
• Tough and flexible
• Waxy surface
• Soft – scratches easily
• Good transparency
• Low melting point
• Stable electrical properties Good moisture barrier properties
• Films, fertiliser bags, refuse sacks
• Packaging films, bubble wrap
• Flexible bottles
• Irrigation pipes
• Thick shopping bags (clothes and produce)
• Wire and cable applications
• Some bottle tops
Polypropylene
Propylene Polypropylene • Excellent chemical resistance
• High melting point
• Hard, but flexible
• Waxy surface
• Translucent
• Strong
• Most bottle tops
• Ketchup and syrup bottles
• Yoghurt and some margarine containers
• Potato crisp bags, biscuit wrappers
• Crates, plant pots, drinking straws
• Hinged lunch boxes, refrigerated containers
• Fabric and carpet fibres
• Heavy duty bags and tarps
Polystyrene
Styrene Polystyrene • Clear to opaque
• Glassy surface
• Rigid or foamed
• Hard
• Brittle
• High clarity
• Affected by fats and solvents
• Yoghurt containers, egg boxes
• Fast food trays
• Video cases
• Vending cups and disposable cutlery
• Seed trays
• Coat hangers
• Low cost brittle toys
They are identified with “7 and OTHER” or a triangle with numbers from 7 to 19
• There are other polymers that have a wide range of uses, particularly in engineering sectors
• Nylon (PA)
• Acrylonitrile butadiene styrene (ABS) Polycarbonate (PC)
• Layered or multi-material mixed polymers
*It is never safe to reuse an HDPE bottle as a food or drink because of the risk of chemical leaching. ** PVC should never come into contact with food or drink as it can be harmful if digested.

51
Pl
APPENDIX E POTENTIAL UNREALISED RETURNS ON AN AVERAGE COST BASIS FOR INVESTMENT ADVISORS AND SOVEREIGN WEALTH FUNDS INVESTED IN THE PLANET TRACKER UNIVERSE
Table 23-: Potential Unrealised Returns on an Average Cost Basis for Investment Advisors and Sovereign Wealth Funds Invested in the Planet Tracker Universe.
InvestorUnrealised
Gains (millions USD)
% of Total Tracked Notes
1 Vanguard Group 1,913 7.9%$1,605 million in unrealised gains from 5 investments: AptarGroup, Sonoco Products, Sealed Air, Berry Global, and Silgan Holdings
2 BlackRock 1,642 6.8%$1,503 million in unrealised gains from 6 investments: AptarGroup, Sonoco Products, Sealed Air, Amcor, Berry Global, and Silgan Holdings
3 State Street Corp. 717 3.0% $625 million in unrealised gains from 4 investments: AptarGroup, Sonoco Products, Sealed Air, and Amcor
4 Norges Bank 329 1.3% $301 million in unrealised gains from 11 investments
5 State Farm 324 1.2% $323 million in unrealised gains from 1 investment: AptarGroup
6 Dimensional Fund Advisors 294 1.2% $268 million in unrealised gains from 11 investments
7 J.P. Morgan Chase 289 1.1% $263 million in unrealised gains from 2 investments: AptarGroup and Silgan Holdings
8 Morgan Stanley* 268 0.9% $223 million in unrealised gains from 1 investment: AptarGroup
9 Fidelity 210 0.8% $210 million in unrealised gains from 7 investments
10 Neuberger Berman 205 0.8% $178 million in unrealised gains from 1 investment: AptarGroup
11 Geode Capital Management 201 0.8% $203 million in unrealised gains and $2 million in
unrealised losses
12 T. Rowe Price 194 0.8% $132 million in unrealised gains from 1 investment: Sealed Air
13 Aviva 185 0.7% $183 million in unrealised gains from 1 investment: Grupa Kety
14 Ameriprise 168 0.6%$164 million in unrealised gains from 5 investments: Sonoco Products, Huhtamaki, CCL Industries, Gerresheimer and AptarGroup
15 Government Pension Investment Fund 153 0.6% $151 million in unrealised gains from 2 investments:
FP Corp. and Rengo Co.
16 Invesco 139 0.5% $82 million in unrealised gains from 1 investment: Silgan Holdings
17 Wells Fargo & Co. 131 0.5%$107 million in unrealised gains from 4 investments: AptarGroup, Silgan Holdings, Berry Global and Myers Indust
18 Charles Schwab 121 0.5% $95 million in unrealised gains from 4 investments: Amcor, Sonoco Products, AptarGroup, and Sealed Air
19 APG Asset Management 118 0.4% $99 million in unrealised gains from 2 investments:
Viscofan and Gerresheimer
20 NN Group 103 7.9% $102 million in unrealised gains from 2 investments: Grupa Kety and Gerresheimer
Subtotal - Top 20 7,704 31.9% 447 total investments
Grand Total 24,171 100% 8,665 total investments

52
Planet Tracker chose to apply the average cost basis approach to calculating unrealised gains as average cost basis is often used by investment advisors in their tax reporting to regulatory authorities.
The average cost basis considers the total cost to investors or beneficiaries. It factors in capital gains, stock splits, capital distributions, reinvested dividends and returns of capital. The average cost basis helps determine what the economic gain or loss will be to an investor or beneficiary when they liquidate their investment.

53
Pl
APPENDIX F LARGEST PRIVATE EQUITY, FOUNDATION AND INDIVIDUAL INVESTORS WITH A SINGLE INVESTMENT IN THE 83 COMPANIES IN THE PLANET TRACKER UNIVERSE
Table 24-: Largest Private Equity, Foundation and Individual Investors with a Single Investment in the 83 Companies in the Planet Tracker Universe.lxix
Investor Category Total (USD millions)
% Ownership
SectorCumulative
Total Notes
1 Epsilon Bidco PTE (The Blackstone Group) Private Equity $1,516 1.7% 1.7% Owns 51.96% of EPL
2 Antti Aarnio-Wihuri, Chairman, Winpak Individual $1,156 1.3% 3.0% Owns 52.58% of Winpak
3 Shenzhen Qinghua University Private Equity $707 0.8% 3.9% Owns 34.43% of Shenzhen Beauty
Star
4 R. Philip Silver, Co-Founder Silgan Holdings Individual $612 0.7% 4.6% Owns 15.10% of Silgan Holdings
5 Finnish Cultural Foundation Foundation $566 0.6% 5.2%
Heikki Huhtamäki donated a majority shareholding in the Huhtamäki company to the Finnish Cultural Foundation in 1943. The Foundation currently has 11.15% equity ownership stake in Huhtamaki.
6 Kim Seok-Soo, former President Dongsuh Co. Individual $546 0.6% 5.8% Owns 18.98% of Dongsuh
7 Kim Sang-Heon, former Chairman Dongsuh Co. Individual $500 0.6% 6.4% Owns 17.39% of Dongsuh
8 Gira Sole Prima Private Equity $498 0.6% 7.0% Owns 10.29% of Kalbe Farma TBK
9 Greg Horrigan, Co-Founder Silgan Holdings Individual $492 0.6% 7.5% Owns 12.14% of Silgan Holdings
10 Santa Seha Sanadi Private Equity $478 0.5% 8.1% Owns 9.89% of Kalbe Farma TBK
11 Diptanala Bahana Private Equity $460 0.5% 8.6% Owns 9.50% of Kalbe Farma TBK
12 Lucasta Murni Cemerlang Private Equity $458 0.5% 9.1% Owns 9.47% of Kalbe Farma TBK
13Wu Peifu, Chairman, Jiangsu Shuangxing Color Plastic New Materials Co.
Individual $455 0.5% 9.6%Owns 26.07% of Jiangsu Shuangxing Color Plastic New Materials Co.
14 Ladang Ira Panen Private Equity $452 0.5% 10.2% Owns 9.36% of Kalbe Farma TBK
15 Bina Artha Charisma Private Equity $412 0.5% 10.6% Owns 8.52% of Kalbe Farma TBK
16Wang Haipeng, Chairman, Chairman, MYS Group
Individual $401 0.5% 11.1% Owns 41.73% of MYS Group
17Kim Jong-Hui, Senior Managing Director, Dongsuh Co.
Individual $362 0.4% 11.5% Owns 12.59% of Dongsuh
18Shenzhen Tongchan Group (People's Republic of China)
Government $319 0.4% 11.9% Owns 15.53% of Shenzhen Beauty Star
19Chen Dakui, ex-Chairman/President, Zhejiang Zhongcheng Packing Material
Individual $298 0.3% 12.2% Owns 32.95% of Zhejiang Zhongcheng Packing Material
20 Uni-President Enterprises Corporation $295 0.3% 12.5% Owns 45.55% of Ton Yi Industrial Group
Subtotal of Top 20 $10,984 12.5% 20 positions
Grand Total $87,622 100.0% 8,655 positions
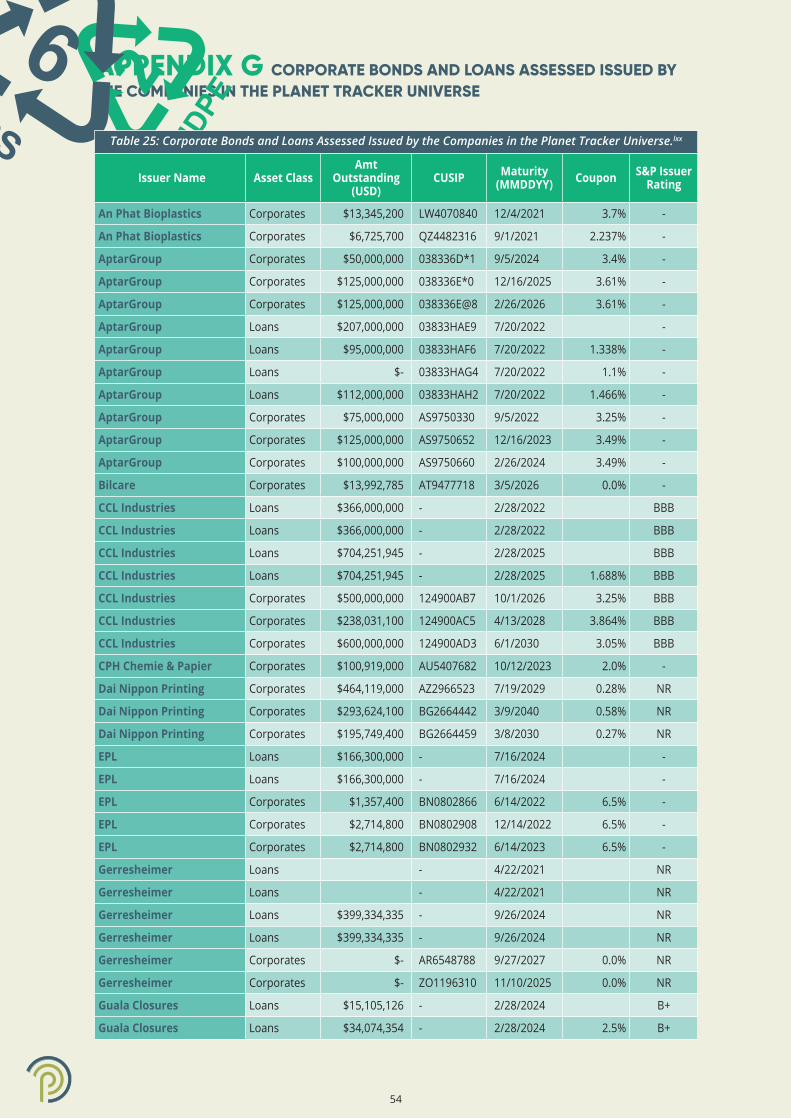
54
APPENDIX G CORPORATE BONDS AND LOANS ASSESSED ISSUED BY THE COMPANIES IN THE PLANET TRACKER UNIVERSE
Table 25: Corporate Bonds and Loans Assessed Issued by the Companies in the Planet Tracker Universe.lxx
Issuer Name Asset ClassAmt
Outstanding (USD)
CUSIP Maturity (MMDDYY) Coupon S&P Issuer
Rating
An Phat Bioplastics Corporates $13,345,200 LW4070840 12/4/2021 3.7% -
An Phat Bioplastics Corporates $6,725,700 QZ4482316 9/1/2021 2.237% -
AptarGroup Corporates $50,000,000 038336D*1 9/5/2024 3.4% -
AptarGroup Corporates $125,000,000 038336E*0 12/16/2025 3.61% -
AptarGroup Corporates $125,000,000 038336E@8 2/26/2026 3.61% -
AptarGroup Loans $207,000,000 03833HAE9 7/20/2022 -
AptarGroup Loans $95,000,000 03833HAF6 7/20/2022 1.338% -
AptarGroup Loans $- 03833HAG4 7/20/2022 1.1% -
AptarGroup Loans $112,000,000 03833HAH2 7/20/2022 1.466% -
AptarGroup Corporates $75,000,000 AS9750330 9/5/2022 3.25% -
AptarGroup Corporates $125,000,000 AS9750652 12/16/2023 3.49% -
AptarGroup Corporates $100,000,000 AS9750660 2/26/2024 3.49% -
Bilcare Corporates $13,992,785 AT9477718 3/5/2026 0.0% -
CCL Industries Loans $366,000,000 - 2/28/2022 BBB
CCL Industries Loans $366,000,000 - 2/28/2022 BBB
CCL Industries Loans $704,251,945 - 2/28/2025 BBB
CCL Industries Loans $704,251,945 - 2/28/2025 1.688% BBB
CCL Industries Corporates $500,000,000 124900AB7 10/1/2026 3.25% BBB
CCL Industries Corporates $238,031,100 124900AC5 4/13/2028 3.864% BBB
CCL Industries Corporates $600,000,000 124900AD3 6/1/2030 3.05% BBB
CPH Chemie & Papier Corporates $100,919,000 AU5407682 10/12/2023 2.0% -
Dai Nippon Printing Corporates $464,119,000 AZ2966523 7/19/2029 0.28% NR
Dai Nippon Printing Corporates $293,624,100 BG2664442 3/9/2040 0.58% NR
Dai Nippon Printing Corporates $195,749,400 BG2664459 3/8/2030 0.27% NR
EPL Loans $166,300,000 - 7/16/2024 -
EPL Loans $166,300,000 - 7/16/2024 -
EPL Corporates $1,357,400 BN0802866 6/14/2022 6.5% -
EPL Corporates $2,714,800 BN0802908 12/14/2022 6.5% -
EPL Corporates $2,714,800 BN0802932 6/14/2023 6.5% -
Gerresheimer Loans - 4/22/2021 NR
Gerresheimer Loans - 4/22/2021 NR
Gerresheimer Loans $399,334,335 - 9/26/2024 NR
Gerresheimer Loans $399,334,335 - 9/26/2024 NR
Gerresheimer Corporates $- AR6548788 9/27/2027 0.0% NR
Gerresheimer Corporates $- ZO1196310 11/10/2025 0.0% NR
Guala Closures Loans $15,105,126 - 2/28/2024 B+
Guala Closures Loans $34,074,354 - 2/28/2024 2.5% B+
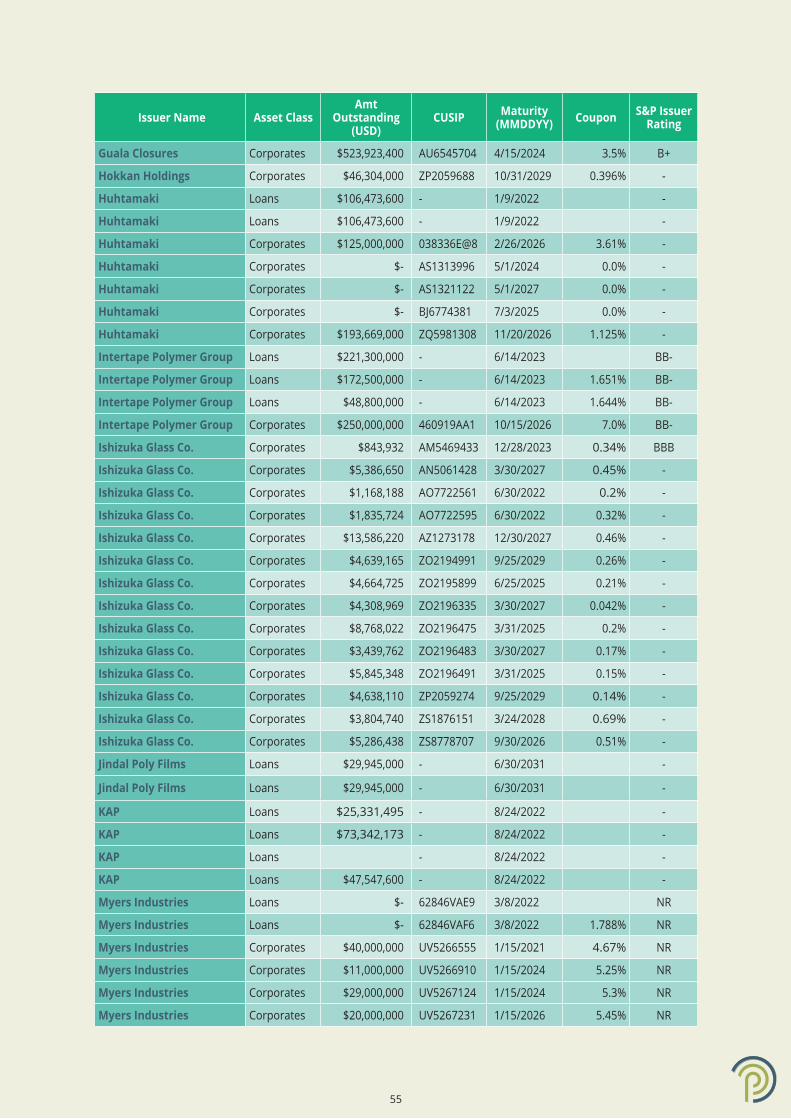
55
Issuer Name Asset ClassAmt
Outstanding (USD)
CUSIP Maturity (MMDDYY) Coupon S&P Issuer
Rating
Guala Closures Corporates $523,923,400 AU6545704 4/15/2024 3.5% B+
Hokkan Holdings Corporates $46,304,000 ZP2059688 10/31/2029 0.396% -
Huhtamaki Loans $106,473,600 - 1/9/2022 -
Huhtamaki Loans $106,473,600 - 1/9/2022 -
Huhtamaki Corporates $125,000,000 038336E@8 2/26/2026 3.61% -
Huhtamaki Corporates $- AS1313996 5/1/2024 0.0% -
Huhtamaki Corporates $- AS1321122 5/1/2027 0.0% -
Huhtamaki Corporates $- BJ6774381 7/3/2025 0.0% -
Huhtamaki Corporates $193,669,000 ZQ5981308 11/20/2026 1.125% -
Intertape Polymer Group Loans $221,300,000 - 6/14/2023 BB-
Intertape Polymer Group Loans $172,500,000 - 6/14/2023 1.651% BB-
Intertape Polymer Group Loans $48,800,000 - 6/14/2023 1.644% BB-
Intertape Polymer Group Corporates $250,000,000 460919AA1 10/15/2026 7.0% BB-
Ishizuka Glass Co. Corporates $843,932 AM5469433 12/28/2023 0.34% BBB
Ishizuka Glass Co. Corporates $5,386,650 AN5061428 3/30/2027 0.45% -
Ishizuka Glass Co. Corporates $1,168,188 AO7722561 6/30/2022 0.2% -
Ishizuka Glass Co. Corporates $1,835,724 AO7722595 6/30/2022 0.32% -
Ishizuka Glass Co. Corporates $13,586,220 AZ1273178 12/30/2027 0.46% -
Ishizuka Glass Co. Corporates $4,639,165 ZO2194991 9/25/2029 0.26% -
Ishizuka Glass Co. Corporates $4,664,725 ZO2195899 6/25/2025 0.21% -
Ishizuka Glass Co. Corporates $4,308,969 ZO2196335 3/30/2027 0.042% -
Ishizuka Glass Co. Corporates $8,768,022 ZO2196475 3/31/2025 0.2% -
Ishizuka Glass Co. Corporates $3,439,762 ZO2196483 3/30/2027 0.17% -
Ishizuka Glass Co. Corporates $5,845,348 ZO2196491 3/31/2025 0.15% -
Ishizuka Glass Co. Corporates $4,638,110 ZP2059274 9/25/2029 0.14% -
Ishizuka Glass Co. Corporates $3,804,740 ZS1876151 3/24/2028 0.69% -
Ishizuka Glass Co. Corporates $5,286,438 ZS8778707 9/30/2026 0.51% -
Jindal Poly Films Loans $29,945,000 - 6/30/2031 -
Jindal Poly Films Loans $29,945,000 - 6/30/2031 -
KAP Loans $25,331,495 - 8/24/2022 -
KAP Loans $73,342,173 - 8/24/2022 -
KAP Loans - 8/24/2022 -
KAP Loans $47,547,600 - 8/24/2022 -
Myers Industries Loans $- 62846VAE9 3/8/2022 NR
Myers Industries Loans $- 62846VAF6 3/8/2022 1.788% NR
Myers Industries Corporates $40,000,000 UV5266555 1/15/2021 4.67% NR
Myers Industries Corporates $11,000,000 UV5266910 1/15/2024 5.25% NR
Myers Industries Corporates $29,000,000 UV5267124 1/15/2024 5.3% NR
Myers Industries Corporates $20,000,000 UV5267231 1/15/2026 5.45% NR

56
Issuer Name Asset ClassAmt
Outstanding (USD)
CUSIP Maturity (MMDDYY) Coupon S&P Issuer
Rating
Nampak Loans $141,155,200 - 9/28/2022 -
Nampak Loans $141,155,200 - 9/28/2023 -
Nampak Loans $245,000,000 - 9/28/2022 -
Nampak Loans - 9/28/2023 -
Nampak Loans - 9/28/2023 -
Nampak Loans $491,793,231 - 9/28/2023 -
Plasto Cargal Group Corporates $9,011,733 LW5846610 8/1/2023 5.85% -
Plasto Cargal Group Corporates $3,400,017 QZ0813142 8/1/2021 4.75% -
Pro-Pac Packaging Loans $40,600,700 - 3/23/2023 -
Pro-Pac Packaging Loans - 3/23/2023 -
Pro-Pac Packaging Loans $40,600,700 - 3/23/2023 -
PSB Industries Loans - 2/6/2024 -
PSB Industries Loans - 2/6/2024 -
Rengo Co. Loans $48,706,100 - 3/14/2024 -
Rengo Co. Loans $130,796,000 - - -
Rengo Co. Loans $48,706,100 - 3/14/2024 -
Rengo Co. Loans $130,796,000 - - -
Rengo Co. Corporates $87,573,300 AL2948829 12/8/2026 0.39% -
Rengo Co. Corporates $87,573,300 AL2948837 12/8/2023 0.28% -
Rengo Co. Corporates $44,499,600 AQ1804345 12/13/2024 0.27% -
Rengo Co. Corporates $44,499,600 AQ1804352 12/14/2027 0.41% -
Rengo Co. Corporates $88,003,800 AV7173066 12/13/2028 0.415% -
Rengo Co. Corporates $95,368,900 EK4186392 9/3/2021 0.451% -
Rengo Co. Corporates $41,617,400 UV4266226 9/2/2022 0.498% -
Rengo Co. Corporates $91,519,400 ZQ6601988 12/11/2026 0.21% -
Rengo Co. Corporates $91,519,400 ZQ6602002 12/12/2029 0.3% -
Samyang Packaging Corp. Loans $143,088,320 - 9/7/2022 -
Samyang Packaging Corp. Loans $143,088,320 - 9/7/2022 -
Samyang Packaging Corp. Corporates $44,333,700 AU2896242 9/7/2021 2.825% -
Sealed Air Corp. Corporates $450,000,000 81211KAK6 7/15/2033 6.875% BB+
Sealed Air Corp. Corporates $425,000,000 81211KAU4 4/1/2023 5.25% BB+
Sealed Air Corp. Corporates $425,000,000 81211KAV2 12/1/2022 4.875% BB+
Sealed Air Corp. Corporates $425,000,000 81211KAW0 12/1/2024 5.125% BB+
Sealed Air Corp. Corporates $400,000,000 81211KAX8 9/15/2025 5.5% BB+
Sealed Air Corp. Corporates $425,000,000 81211KAY6 12/1/2027 4.0% BB+
Sealed Air Corp. Loans $691,300,000 81211LBC1 7/11/2023 BB+
Sealed Air Corp. Loans $- 81211LBD9 7/11/2023 1.644% BB+
Sealed Air Corp. Loans $- 81211LBE7 7/11/2023 1.644% BB+
Sealed Air Corp. Loans $181,837,500 81211LBF4 7/11/2023 1.64% BB+

57
Issuer Name Asset ClassAmt
Outstanding (USD)
CUSIP Maturity (MMDDYY) Coupon S&P Issuer
Rating
Sealed Air Corp. Loans $474,600,000 81211LBH0 8/1/2022 1.269% BB+
Sealed Air Corp. Corporates $449,676,000 EK9644080 9/15/2023 4.5% BB+
Sekisui Kasei Co. Corporates $64,063,580 ZQ6798354 12/11/2026 0.5% -
Shanghai Yongguan Adhesive Products Corporates $79,594,320 ZO9323445 12/8/2026 0.5% -
Shanghai Zijiang Enterprise Group Corporates $28,277,800 BH2912914 3/26/2025 4.5% -
Shanghai Zijiang Enterprise Group Corporates $75,176,500 ZO9902750 4/19/2021 2.85% -
Silgan Holdings Corporates $300,000,000 827048AU3 3/15/2025 4.75% BB+
Silgan Holdings Corporates $30,000,000 827048AV1 2/1/2028 4.125% BB+
Silgan Holdings Corporates $570,000,000 827048AW9 2/1/2028 4.125% BB+
Silgan Holdings Loans $1,146,000,000 82704EBB1 5/30/2024 BB+
Silgan Holdings Loans $246,000,000 82704EBE5 5/30/2023 1.237% BB+
Silgan Holdings Loans $900,000,000 82704EBG0 5/30/2024 1.894% BB+
Silgan Holdings Corporates $782,463,500 AQ4025203 3/15/2025 3.25% BB+
Silgan Holdings Corporates $108,787 BG1648552 6/1/2028 2.3% BB+
Silgan Holdings Corporates $578,749,227 BK0252787 6/1/2028 2.3% BB+
Sonoco Products Loans $100,000,000 - 3/31/2021 BBB
Sonoco Products Loans $150,000,000 - 3/17/2021 BBB
Sonoco Products Loans $100,000,000 - 3/31/2021 1.394% BBB
Sonoco Products Loans $150,000,000 - 3/17/2021 1.394% BBB
Sonoco Products Corporates $4,321,000 835495AA0 8/1/2021 9.2% BBB
Sonoco Products Corporates $600,000,000 835495AJ1 11/1/2040 5.75% BBB
Sonoco Products Corporates $250,000,000 835495AK8 11/1/2021 4.375% BBB
Sonoco Products Corporates $600,000,000 835495AL6 5/1/2030 3.125% BBB
Sonoco Products Loans $136,897,000 83549UAH0 7/20/2022 BBB
Sonoco Products Loans $- 83549UAJ6 7/20/2022 1.338% BBB
Sonoco Products Loans $136,897,000 83549UAK3 7/20/2022 1.466% BBB
Suzhou Hycan Holdings Corporates $52,240,710 AV8517626 11/27/2024 1.0% -
Taiwan Hon Chuan Enterprise Corporates $101,505,600 AS0083657 4/27/2023 1.07% -
Takween Advanced Industries Loans $242,611,460 - 9/11/2021 -
Takween Advanced Industries Loans $242,611,460 - 9/11/2021 -
Toppan Printing Corporates $441,484,000 EJ5037613 1/27/2023 0.932% NR
Toppan Printing Corporates $168,904,000 EK6306055 12/12/2029 1.104% NR
Toppan Printing Corporates $146,837,100 QZ2407133 9/5/2036 0.73% NR
Toppan Printing Corporates $146,837,100 QZ3834608 9/5/2031 0.55% NR
Tredegar Corp. Loans $7,000,000 - 6/28/2024 -
Tredegar Corp. Loans $7,000,000 - 6/28/2024 1.863% -
Zhuhai Zhongfu Enterprise Corporates $16,662,975 EJ0369813 3/28/2017 6.6% -
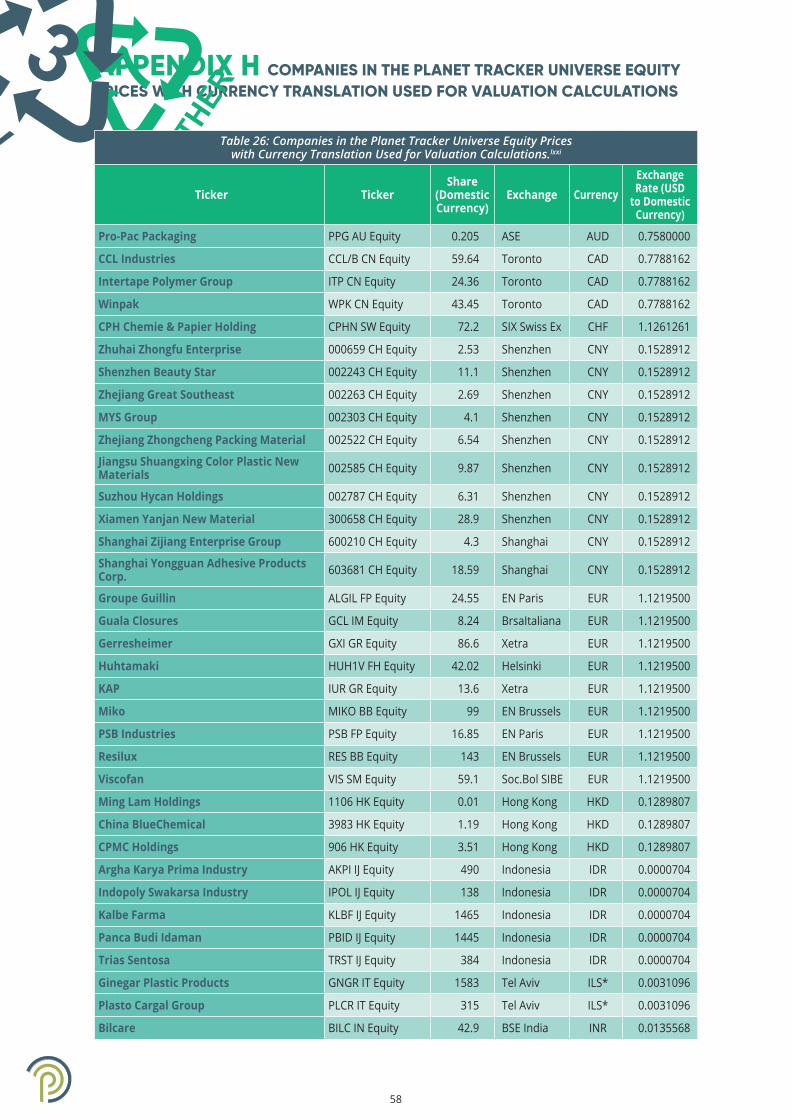
58
APPENDIX H COMPANIES IN THE PLANET TRACKER UNIVERSE EQUITY PRICES WITH CURRENCY TRANSLATION USED FOR VALUATION CALCULATIONS
Table 26: Companies in the Planet Tracker Universe Equity Prices with Currency Translation Used for Valuation Calculations.lxxi
Ticker TickerShare
(Domestic Currency)
Exchange CurrencyExchange Rate (USD
to Domestic Currency)
Pro-Pac Packaging PPG AU Equity 0.205 ASE AUD 0.7580000
CCL Industries CCL/B CN Equity 59.64 Toronto CAD 0.7788162
Intertape Polymer Group ITP CN Equity 24.36 Toronto CAD 0.7788162
Winpak WPK CN Equity 43.45 Toronto CAD 0.7788162
CPH Chemie & Papier Holding CPHN SW Equity 72.2 SIX Swiss Ex CHF 1.1261261
Zhuhai Zhongfu Enterprise 000659 CH Equity 2.53 Shenzhen CNY 0.1528912
Shenzhen Beauty Star 002243 CH Equity 11.1 Shenzhen CNY 0.1528912
Zhejiang Great Southeast 002263 CH Equity 2.69 Shenzhen CNY 0.1528912
MYS Group 002303 CH Equity 4.1 Shenzhen CNY 0.1528912
Zhejiang Zhongcheng Packing Material 002522 CH Equity 6.54 Shenzhen CNY 0.1528912
Jiangsu Shuangxing Color Plastic New Materials 002585 CH Equity 9.87 Shenzhen CNY 0.1528912
Suzhou Hycan Holdings 002787 CH Equity 6.31 Shenzhen CNY 0.1528912
Xiamen Yanjan New Material 300658 CH Equity 28.9 Shenzhen CNY 0.1528912
Shanghai Zijiang Enterprise Group 600210 CH Equity 4.3 Shanghai CNY 0.1528912
Shanghai Yongguan Adhesive Products Corp. 603681 CH Equity 18.59 Shanghai CNY 0.1528912
Groupe Guillin ALGIL FP Equity 24.55 EN Paris EUR 1.1219500
Guala Closures GCL IM Equity 8.24 BrsaItaliana EUR 1.1219500
Gerresheimer GXI GR Equity 86.6 Xetra EUR 1.1219500
Huhtamaki HUH1V FH Equity 42.02 Helsinki EUR 1.1219500
KAP IUR GR Equity 13.6 Xetra EUR 1.1219500
Miko MIKO BB Equity 99 EN Brussels EUR 1.1219500
PSB Industries PSB FP Equity 16.85 EN Paris EUR 1.1219500
Resilux RES BB Equity 143 EN Brussels EUR 1.1219500
Viscofan VIS SM Equity 59.1 Soc.Bol SIBE EUR 1.1219500
Ming Lam Holdings 1106 HK Equity 0.01 Hong Kong HKD 0.1289807
China BlueChemical 3983 HK Equity 1.19 Hong Kong HKD 0.1289807
CPMC Holdings 906 HK Equity 3.51 Hong Kong HKD 0.1289807
Argha Karya Prima Industry AKPI IJ Equity 490 Indonesia IDR 0.0000704
Indopoly Swakarsa Industry IPOL IJ Equity 138 Indonesia IDR 0.0000704
Kalbe Farma KLBF IJ Equity 1465 Indonesia IDR 0.0000704
Panca Budi Idaman PBID IJ Equity 1445 Indonesia IDR 0.0000704
Trias Sentosa TRST IJ Equity 384 Indonesia IDR 0.0000704
Ginegar Plastic Products GNGR IT Equity 1583 Tel Aviv ILS* 0.0031096
Plasto Cargal Group PLCR IT Equity 315 Tel Aviv ILS* 0.0031096
Bilcare BILC IN Equity 42.9 BSE India INR 0.0135568

59
Ticker TickerShare
(Domestic Currency)
Exchange CurrencyExchange Rate (USD
to Domestic Currency)
Cosmo Films CFLM IN Equity 454.35 Natl India INR 0.0135568
EPL EPLL IN Equity 252.4 Natl India INR 0.0135568
Garware Polyester GWPL IN Equity 367.75 BSE India INR 0.0135568
Jindal Poly Films JDPF IN Equity 466.05 Natl India INR 0.0135568
Time Technoplast TIME IN Equity 47.25 Natl India INR 0.0135568
Uflex UFLX IN Equity 374.75 Natl India INR 0.0135568
Rengo 3941 JP Equity 839 Tokyo JPY 0.0096581
Superbag 3945 JP Equity 1169 Tokyo JPY 0.0096581
Pack Corp./The 3950 JP Equity 2715 Tokyo JPY 0.0096581
Sekisui Kasei 4228 JP Equity 528 Tokyo JPY 0.0096581
Carlit Holdings 4275 JP Equity 667 Tokyo JPY 0.0096581
Taisei Lamick 4994 JP Equity 3110 Tokyo JPY 0.0096581
Achilles Corp. 5142 JP Equity 1422 Tokyo JPY 0.0096581
Ishizuka Glass 5204 JP Equity 1951 Tokyo JPY 0.0096581
Hokkan Holdings 5902 JP Equity 1431 Tokyo JPY 0.0096581
Maruto Sangyo 7894 JP Equity 2085 Fukuoka JPY 0.0096581
Chuo Kagaku 7895 JP Equity 553 Tokyo JPY 0.0096581
Toppan Printing 7911 JP Equity 1432 Tokyo JPY 0.0096581
Dai Nippon Printing 7912 JP Equity 1858 Tokyo JPY 0.0096581
Fujimori Kogyo 7917 JP Equity 4670 Tokyo JPY 0.0096581
FP Corp. 7947 JP Equity 4250 Tokyo JPY 0.0096581
NPC 004250 KS Equity 3205 Korea SE KRW 0.0009026
Dongsuh Cos. 026960 KS Equity 31950 Korea SE KRW 0.0009026
Samyang Packaging Corp. 272550 KS Equity 21650 Korea SE KRW 0.0009026
Daibochi DPP MK Equity 2.65 Bursa Malays MYR 0.2460933
Thong Guan Industries TGI MK Equity 2.62 Bursa Malays MYR 0.2460933
Grupa Kety KTY PW Equity 484 Warsaw PLN 0.2705042
Takween Advanced Industries TAKWEEN AB Equity 14.06 Saudi Arabia SAR 0.2664890
Southern Packaging Group SPAK SP Equity 0.475 Singapore SGD 0.7506380
AJ Plast AJ TB Equity 19.1 Bangkok THB 0.0330961
Panjawattana Plastic PJW TB Equity 1.39 Bangkok THB 0.0330961
Polyplex Thailand PTL TB Equity 21.9 Bangkok THB 0.0330961
Thai Plaspac TPAC TB Equity 11.6 Bangkok THB 0.0330961
TPBI Public TPBI TB Equity 4.98 Bangkok THB 0.0330961
Yonyu Plastics 1323 TT Equity 33.15 Taiwan TWD 0.0355202
Ton Yi Industrial Corp. 9907 TT Equity 11.55 Taiwan TWD 0.0355202
Taiwan Hon Chuan Enterprise 9939 TT Equity 58.6 Taiwan TWD 0.0355202

60
Ticker TickerShare
(Domestic Currency)
Exchange CurrencyExchange Rate (USD
to Domestic Currency)
Amcor AMCR US Equity 11.63 New York USD 1.0000000
AptarGroup ATR US Equity 135.12 New York USD 1.0000000
Berry Global Group BERY US Equity 54.485 New York USD 1.0000000
Myers Industries MYE US Equity 19.51 New York USD 1.0000000
Sealed Air Corp. SEE US Equity 46.035 New York USD 1.0000000
Silgan Holdings SLGN US Equity 36.66 NASDAQ GS USD 1.0000000
Sonoco Products SON US Equity 60.17 New York USD 1.0000000
Tredegar Corp. TG US Equity 16.35 New York USD 1.0000000
An Phat Bioplastics AAA VN Equity 14100 Ho Chi Minh VND 0.0000432
An Phat Holdings APH VN Equity 75400 Ho Chi Minh VND 0.0000432
Nampak NPK SJ Equity 215 Johannesburg ZAR* 0.0006854

As an initiative of Investor Watch, Planet Tracker’s reports are impersonal and do not provide individualised advice or
recommendations for any specific reader or portfolio. Investor Watch is not an investment adviser and makes no recommendations regarding the advisability of investing in any particular company, investment fund or other vehicle. The information contained in this research report does not constitute an offer to sell securities or the solicitation of an offer to buy, or recommendation for investment in, any securities within any jurisdiction. The information is not intended as financial advice.
The information used to compile this report has been collected from a number of sources in the public domain and from Investor Watch licensors. While Investor Watch and its partners have obtained information believed to be reliable, none of them shall be liable for any claims or losses of any nature in connection with information contained in this document, including but not limited to, lost profits or punitive or consequential damages. This research report provides general information only. The information and opinions constitute a judgment as at the date indicated and are subject to change without notice. The information may therefore not be accurate or current. The information and opinions contained in this report have been compiled or arrived at from sources believed to be reliable and in good faith, but no representation or warranty, express or implied, is made by Investor Watch as to their accuracy, completeness or correctness and Investor Watch does also not warrant that the information is up-to-date.
DISCLAIMER
61

62
i Planet Tracker calculated. Data source Bloomberg, L.P. (2020). Accessed 22 December 2020.
ii Geyer, Jambeck, and Law, Science Advances, (19 July 2017). Production, use, and fate of all plastics ever made.
iii UNEP (2018). Single-use Plastics: A Roadmap for Sustainability
iv Comer, Cunningham, and Sleiman, J.P.Morgan Cazenove (12 February 2020). Petrochemicals – Peak Plastic: Potential impacts of a shift towards a circular economy on plastic and feedstock demand.
v UNEP (2018). Single-use Plastics: A Roadmap for Sustainability.
vi Amcor (29 September 2020). World-First Recyclable Retort Pouch for Pet Food.
vii Berry Global (21 September 2020). Berry Global and The AZEK Company Unite to Recycle 30+ Million Pounds of Plastic.
viii Minderoo Foundation and SYSTEMIQ (2020). Clearing a path through the waste: Essential Transparency in the Plastics Supply Chain.
ix Ward and Reddy, PNAS (10 June 2020). Opinion: We need better data about the environmental persistence of plastic goods (117:26:14618-14621).
x Ward and Reddy, PNAS (10 June 2020). Opinion: We need better data about the environmental persistence of plastic goods (117:26:14618-14621). Sources of data are from governments, NGOs, academic institutions, academic journals, textbooks, reference books, non-profit organisations, for-profit companies, and media outlooks. Sources include: South Carolina Department of Health and Environmental Control, Woods Hole Sea Grant, Belgium Federal Public Services (FPS), Texas General Land Office, European Union, Nantucket Township, United Nations, Massachusetts Office of Coastal Zone Management, U.S. National Park Service, World Economic Forum, Pennsylvania State University, Center for Microbial Oceanography (University of Hawai’i), Richards & Beger, 2011. Marine Pollution Bulletin 62.8: 1693-1701., Geology and the Environment 7th Edition (Pipkin et al., page 563), Management of Marine Plastic Debris (Niaounakis; page 128), Ocean Notion, World Wildlife Foundation,The Ocean Conservancy, Oceana, 4Ocean, SAFETY4SEA, Marine Science Institute, Waste Warriors, 11th Hour Racing, Museum of Design Zurich, Acuario Michin, Wikipedia Commons, Beach Environmental Awareness Campaign Hawai’i, Alan’s Factory Outlet, Nofir, Postconsumers, The Balance Small Business, Our World in Data, Down 2 Earth Materials, Sharon Plywoods, Waster, Greatness Achieved Publishing, Helgi Library, J.P. Morgan Cazenove Capital, Healthy Options, Be Green Packaging, Farmers Almanac, Deutsche Welle, Egemasa, BBC, American Chemical Society, TED-Ed, Huffington Post, Snow Brains, Corpus Christy Business News, Scoop Whoop, Planet Experts, Scoop.it!, RecreoViral, Arizona Highways, and The Telegraph.
xi Zheng and Suh, Nature Climate Change (2019). Strategies to reduce the global carbon footprint of plastics.
xii Pew Charitable Trust (2020). Breaking the Plastic Wave: A comprehensive assesment of pathways towards stopping ocean plastic pollution.
xiii Geyer, Jambeck and Lavendar Law, Science 347 (2015). Waste Inputs from Land Into the Ocean.
xiv The Economist Group (2020). A sustainable ocean economy in 2030: Opportunities and challenges.
xv Pew Charitable Trust (2020). Breaking the Plastic Wave: A comprehensive assesment of pathways towards stopping ocean plastic pollution.
xvi Azoulay et al., CIEL (2019). Plastic and Health: The Hidden Costs of a Plastic Planet.
xvii Planet Tracker calculated. Data source Bloomberg, L.P. (2020). Accessed 22 December 2020.
xviii S&P Global (2018). GICS: Global Industry Classification Standard.
xix Reported by Bloomberg, L.P. (2020). Accessed 4 January 2021.
xx Reported by Bloomberg, L.P. (2020). Accessed 4 January 2021.
xxi Planet Tracker calculated. Data source Bloomberg, L.P. (2020). Accessed 12 January 2021.
xxii Planet Tracker calculated. Data source Bloomberg, L.P. (2020). Accessed 12 January 2021.
xxiii 84.17% is calculated by 33.81%/40.17%.
xxiv Planet Tracker calculated. Data source Bloomberg, L.P. (2020). Accessed 5 January 2021.
xxv Planet Tracker assessed. Reported by Bloomberg, L.P. (2020). Accessed 5 January 2021.
xxvi Planet Tracker calculated. Data source Bloomberg, L.P. (2020). Accessed 5 January 2021.
REFERENCES

63
xxvii • Planet Tracker calculated. Data source Bloomberg, L.P. (2020). Accessed 4 January 2021.
• Methodology is the following, employing Blooomberg’s DSCO screening tool: • Search for keywords under exact match in company filling database. • Include subsidiaries and related companies. • Date rate range is 1 January 2015 to 1 January 2021. • Review only filings category. • Download and review documentation, when necessary for confirmation. • Sum total mentions using exact match criteria.
Fillings are translated by Bloomberg via settings on the NZPD screen language settings, and then pulled from the following languages, when available, according to Bloomberg:
• English • Japanese • French • German • Spanish • Portuguese • Italian • Traditional Chinese • Korean • Simplified Chinese
• Russian
xxviii Planet Tracker calculated. Data source Bloomberg, L.P. (2020). Accessed 5 January 2021.
xxix Planet Tracker calculated. Data source Bloomberg, L.P. (2020). Accessed 5 January 2021.
xxx Planet Tracker calculated. Data source Bloomberg, L.P. (2020). Accessed 5 January 2021.
xxxi Planet Tracker calculated. Data source Bloomberg, L.P. (2020). Accessed 5 January 2021.
xxxii Zero Waste Europe (2018). Unwrapped: how throwaway plastic is failing to solve Europe’s food waste problem (and what we need to do instead).
xxxiii Joost, JOM (24 August 2012). Reducing Vehicle Weight and Improving U.S. Energy Efficiency Using Integrated Computational Materials Engineering.
xxxiv Health Care Without Harm (2020). Towards plastic-free healthcare.
xxxv Bowen, Varghase, and O’Connor, ICIS (15 December 2020). TOPIC PAGE: Packaging – impacto on chemicals.
xxxvi Geyer, Jambeck, and Law, Science Advances, (19 July 2017). Production, use, and fate of all plastics ever made.
xxxvii Geyer, Jambeck and Lavendar Law, Science 347 (2015). Waste Inputs from Land into the Ocean.
xxxviii James, PRI (2019). The Plastics Landscape: Risks and Opportunities Along the Value Chain.
xxxix James, PRI (2019). The Plastics Landscape: The Challenges and Possible Solutions.
xl World Economic Forum, Ellen MacArthur Foundation, and McKinsey & Co. (2016). The New Plastics Economy.
xli Planet Tracker calculated. Data source Nexant, Inc. via Bloomberg, L.P., accessed 21 December 2020.
xlii Mathonniere, ICIS (1 March 2019). Corrected: INSIGHT: Crude oil to chemicals (COTC), a refiner’s new mantra.
xliii Zheng and Suh, Nature Climate Change (2019). Strategies to reduce the global carbon footprint of plastics.
xliv Pew Charitable Trust (2020). Breaking the Plastic Wave: A comprehensive assesment of pathways towards stopping ocean plastic pollution.
xlv Geyer, Jambeck and Lavendar Law, Science 347 (2015). Waste Inputs from Land Into the Ocean.
xlvi The Economist Group (2020). A sustainable ocean economy in 2030: Opportunities and challenges.
xlvii PRI (2020). Plastic Investor Working Group. Accessed 22 December 2020.
xlviii Plastic Solutions Alliance members as 30 September 2020. Provided by email from Kelly McBee, As You Sow.
xlix Ellen Macarthur Foundation (2020). Financing the Circular Economy: Capturing the opportunity.
l Ellen MacArthur Foundation (25 June 2020). New Plastics Economy Global Commitment.
li VDMA (18 August 2020). Dauerhafter Markt für Rezyklate – Kreislaufwirtschaft mit Zukunft.

64
lii VDMA (18 August 2020). Dauerhafter Markt für Rezyklate – Kreislaufwirtschaft mit Zukunft.
liii Comer, Cunningham, and Sleiman, J.P.Morgan Cazenove (12 February 2020). Petrochemicals – Peak Plastic: Potential impacts of a shift towards a circular economy on plastic and feedstock demand.
liv https://bioplasticsnews.com/2019/09/11/global-consumer-survey-on-plastic-waste/
lv https://bioplasticsnews.com/2019/09/11/global-consumer-survey-on-plastic-waste/
lvi Lacey and Long, Ipsos Views (November 2020). The Sustainability Imperative: The case for building sustainable businesses has never been stronger.
lvii PRI and Anthesis (2020). Global Plastics Legislation. Accessed 31 August 2020.
lviii https://ec.europa.eu/environment/circular-economy/pdf/plastics-strategy-brochure.pdf
lix Comer, Cunningham, and Sleiman, J.P.Morgan Cazenove (12 February 2020). Petrochemicals – Peak Plastic: Potential impacts of a shift towards a circular economy on plastic and feedstock demand.
lx https://www2.deloitte.com/nl/nl/pages/strategy-analytics-and-ma/articles/the-price-tag-of-plastic-pollution.html
lxi Simon, Wired (April 2020). Should Governments Slap a Tax on Plastic? More than billon tons of it could enter the environment in the next 20 years. It’s time, advocates say, to put a sin tax on single-use plastic.
lxii Thoumi, Planet Tracker (3 August 2020). EU Recovery Plan’s “Bottle Deposit Law” Plastic Waste Levy Begins in January 2021, but Recycling Infrastructure Insufficient.
lxiii Comer, Cunningham, and Sleiman, J.P.Morgan Cazenove (12 February 2020). Petrochemicals – Peak Plastic: Potential impacts of a shift towards a circular economy on plastic and feedstock demand.
lxiv Planet Tracker calculated. Data source Bloomberg, L.P. (2020). Accessed 22 December 2020.
lxv Planet Tracker calculated. Data source Bloomberg, L.P. (2020). Accessed 22 December 2020.
lxvi Planet Tracker calculated. Data source Bloomberg, L.P. (2020). Accessed 5 January 2021.
lxvii Hydrocarbons are organic compounds. Hydrocarbon can be either aliphatic or aromatic. Aliphatic hydrocarbons have no benzene rings. Aromatic hydrocarbons have benzene rings. There are three families of hydrocarbons:
• Alkane family: Methane (CH4), ethane (CH3-CH3 or C2H6), propane (CH3-CH2-CH3), butane (CH3-CH2-CH2-CH3), pentane (CH3-CH2-CH2- CH2-CH3), etc.
• Alkene family: Ethylene (CH2=CH2 or C2H4), propylene (CH2=CH-CH2), 1-butylene (CH2=CH-CH2-CH3), 2-butylene (CH3-CH=CH-CH3), etc.
• Alkyne hydrocarbons: Ethyne (CH CH or C2H2), propyne (CH C-CH3), 1-butyne (CH C-CH2-CH3), 2-butyne (CH3-CHCH-CH3), etc.
lxviii Janus Henderson Investors. Accessed 4 January 2021.
lxix Planet Tracker calculated. Data source Bloomberg, L.P. (2020). Accessed 22 December 2020.
lxx Planet Tracker calculated. Date source Bloomberg, L.P. (2020). Accessed 5 January 2021.
lxxi Planet Tracker calculated. Date source Bloomberg, L.P. (2020). Accessed 5 January 2021.


www.planet-tracker.org
Related Documents