Welcome message from author
This document is posted to help you gain knowledge. Please leave a comment to let me know what you think about it! Share it to your friends and learn new things together.
Transcript
Disclaimer
This study has been carried out for the European Aviation Safety Agency by an external organization and expresses the opinion of the organization undertaking the study. It is provided for information purposes only and the views expressed in the study have not been adopted, endorsed or in any way approved by the European Aviation Safety Agency. Consequently it should not be relied upon as a statement, as any form of warranty, representation, undertaking, contractual, or other commitment binding in law upon the European Aviation Safety Agency.
Ownership of all copyright and other intellectual property rights in this material including any documentation, data and technical information, remains vested to the European Aviation Safety Agency. All logo, copyrights, trademarks, and registered trademarks that may be contained within are the property of their respective owners.
Reproduction of this study, in whole or in part, is permitted under the condition that the full body of this Disclaimer remains clearly and visibly affixed at all times with such reproduced part.
6575Vol 3.FR
RUNWAY FRICTION CHARACTERISTICS MEASUREMENT AND AIRCRAFT BRAKING (RuFAB)
FINAL REPORT
VOLUME 3 – FUNCTIONAL FRICTION
Submitted in response to Contract: EASA.2008.C46
March 2010
Submitted to:
Mr. Werner Kleine-Beek Research Project Manager
Safety Analysis and Research Department Executive Directorate
European Aviation Safety Agency (EASA) Ottoplatz 1
D-50679 Cologne Germany
Submitted by:
BMT FLEET TECHNOLOGY LIMITED 311 Legget Drive
Kanata, ON K2K 1Z8
BMT Contact: George Comfort Tel: 613-592-2830, Ext. 226
Fax: 613-592-4950 Email: [email protected]
BMT Fleet Technology Limited 6575Vol 3.FR
Runway Friction Characteristics Measurement and Aircraft Braking (RuFAB) i
BMT DOCUMENT QUALITY CONTROL DATA SHEET
REPORT: Runway Friction Characteristics Measurement and Aircraft Braking (RuFAB): Volume 3 – Functional Friction
DATE: March 2010
PREPARED BY: George Comfort, Group Leader, Cold Regions and Materials
Technology, BMT Fleet Technology Ltd.
___________________________________________________ Dr. Zoltan Rado, Pennsylvania State University, State College, PA, USA
____________________________________________________ Terry Townshend, Townshend Technical Services, Bolton, ON, Canada
Al Mazur, BMT Fleet Technology Limited
REVIEWED BY:
Razek Abdelnour, Ing, Senior Consultant
APPROVED BY: George Comfort, BMT Fleet Technology Ltd.
BMT Fleet Technology Limited 6575Vol 3.FR
Runway Friction Characteristics Measurement and Aircraft Braking (RuFAB) ii Volume 3 – Functional Friction
ACRONYMS AND ABBREVIATIONS
AASHTO American Association of State Highway and Transportation
Officials ABS AMS
Antilock Braking System Aircraft Movement Surface
ASFT Airport Surface Friction Tester ASTM American Society for Testing and Materials BPN British Pendulum NumberBPT British Pendulum Tester CAA Civil Aviation Authority CCD Charge-Coupled Device CEN Comité Européen de Normalisation (France) CFME Continuous Friction Measurement Equipment CTM Circular Texture Meter db Decibel(s) DFT Dynamic Friction Tester DGAC Direction Générale de l’Aviation Civile (France) EASA European Aviation Safety Authority EFI European Friction Index ESDU Engineering Sciences Data Unit ETD Estimated Texture Depth FAA Federal Aviation Administration FMD Friction Measuring Device FMS Flight Management System FN Friction Number FTF Friction Task Force GPS Global Positioning System Hz Hertz ICAO International Civil Aviation Organization IFI International Friction Index ISO International Organization for Standardization km/h Kilometre(s) per Hour m Metre(s) mm Millimetre(s) MPD Mean Profile Depth MTD Mean Texture Depth NASA National Aeronautics and Space Administration NOTAM Notice to Airmen OFM Outflow Meter OFT Outflow Time R&D Research and Development RCR Runway Condition Reporting RFT Runway Friction Tester RMS Root Mean Square ROAR Road Analyzer and Recorder ROSAN Road Surface Analyzer RuFAB Runway Friction Characteristics Measurement and Aircraft
Braking
BMT Fleet Technology Limited 6575Vol 3.FR
Runway Friction Characteristics Measurement and Aircraft Braking (RuFAB) iii Volume 3 – Functional Friction
SCRIM Sideway Force Coefficient Routine Investigation Machine SFT Saab Friction Tester or Surface Friction Tester SN Skid Number SNOWTAM Snow Warning To Airmen SPM Sand Patch Method SRM Stuttgarter Reibungs-Messer TALPAR ARC Takeoff And Landing Performance Assessment Aviation
Rulemaking Committee TDG Texture Depth Gauge TP Technical Publication UK United Kingdom US(A) Unites States (of America)
BMT Fleet Technology Limited 6575Vol 3.FR
Runway Friction Characteristics Measurement and Aircraft Braking (RuFAB) iv Volume 3 – Functional Friction
TABLE OF CONTENTS
ACKNOWLEDGEMENTS ....................................................................................................... x
EXECUTIVE SUMMARY ...................................................................................................... xi
1 INTRODUCTION .............................................................................................................. 1 1.1 Volume 3 ................................................................................................................... 1
1.1.1 Content of Volume 3 ..................................................................................... 1 1.1.2 Notice Regarding Definition of Depth .......................................................... 2
2 FRICTION MEASURING EQUIPMENT ......................................................................... 3 2.1 Overview and Summary Comparisons ..................................................................... 3
2.1.1 High Speed Pavement Friction Test Methods ............................................... 3 2.1.2 Low Speed or Spot Friction Measurement Techniques ................................ 7
2.2 Detailed Information for High Speed Friction Measuring Devices .......................... 8 2.2.1 Locked Wheel Testers for Highways ............................................................ 8 2.2.2 Fixed Slip Devices ...................................................................................... 10 2.2.3 Side-Force Devices ..................................................................................... 12 2.2.4 Variable Slip Devices .................................................................................. 14
2.3 Detailed Information for Low Speed Friction Measuring Devices ......................... 17 2.3.1 Vehicle Braking Decelerometers ................................................................ 17 2.3.2 British Pendulum Tester .............................................................................. 18 2.3.3 Dynamic Friction Tester ............................................................................. 19
3 SCIENTIFIC AND OPERATIONAL CONSOLIDATIONS OF HARMONIZATION . 21 3.1 Present Practices for Friction Measurement ........................................................... 21 3.2 Fixed Slip Devices .................................................................................................. 21
3.2.1 Measurement Principle ............................................................................... 22 3.2.2 Design Characteristics and Procedures ....................................................... 24
3.2.2.1 Important Design Characteristics ................................................. 24 3.2.2.2 Procedures ..................................................................................... 27
3.3 Side Force Devices .................................................................................................. 28 3.3.1 Measurement Principle ............................................................................... 28 3.3.2 Design Characteristics and Procedures ....................................................... 29
3.3.2.1 Important Design Characteristics ................................................. 29 3.3.2.2 Procedures ..................................................................................... 30
3.4 Calibration ............................................................................................................... 31 3.4.1 Static Calibration ......................................................................................... 31 3.4.2 Dynamic Calibration ................................................................................... 31
3.4.2.1 Introduction ................................................................................... 31 3.4.2.2 Brief Summary of the Dynamic Calibration Process ................... 32 3.4.2.3 Difficulties with the Dynamic Calibration Process ...................... 32
3.5 Summary ................................................................................................................. 33 3.6 Previous Harmonization Efforts .............................................................................. 34
3.6.1 Review of Previous Harmonization Efforts ................................................ 34 3.6.2 Model Development and Model Setup ....................................................... 35
3.6.2.1 Fixed Slip Ratio and Side Slip Angle ........................................... 36 3.6.2.2 Derivation of Measured Friction Coefficient ............................... 38 3.6.2.3 Tire Inflation Pressure .................................................................. 38 3.6.2.4 Tire Parameters ............................................................................. 39
BMT Fleet Technology Limited 6575Vol 3.FR
Runway Friction Characteristics Measurement and Aircraft Braking (RuFAB) v Volume 3 – Functional Friction
3.6.2.5 Self-Wetting Systems ................................................................... 39 3.6.2.6 Conclusion .................................................................................... 40
3.6.3 Harmonization Trials .................................................................................. 41 3.6.4 Harmonization Models: Conversion to a Single Index ............................... 43
3.6.4.1 General Approach Used by National Aviation Authorities .......... 43 3.6.4.2 The International Runway Friction Index (IRFI) ......................... 43 3.6.4.3 The International Friction Index (IFI) .......................................... 44 3.6.4.4 The European Friction Index (EFI) .............................................. 45
3.6.5 Harmonization Models: Statistical Approach ............................................. 49 3.7 Correlation to Aircraft ............................................................................................. 52 3.8 Status Review and Present Limitations ................................................................... 58
3.8.1 Device Performance .................................................................................... 58 3.8.2 Incomplete Knowledge Base Regarding Some Key Parameters ................ 58
3.9 Synopsis of Current/Recent R&D Activities on Harmonization ............................ 59 3.10 Summary ................................................................................................................. 64 3.11 Assessment of the Feasibility for Harmonization ................................................... 66 3.12 Overall Conclusions ................................................................................................ 69
4 ALTERNATIVE METHODS FOR SURFACE FRICTION EVALUATION ................ 71 4.1 Overall Review of Methods for Texture Measurements ......................................... 71
4.1.1 Introduction ................................................................................................. 71 4.1.2 Texture Measurement Devices Capable of Highway Speeds: Laser Texture
Meter ........................................................................................................... 77 4.1.3 Low Speed and Spot Texture Measurement Devices ................................. 78
4.1.3.1 Circular Texture Meter ................................................................. 78 4.1.3.2 Sand Patch Texture Meter ............................................................ 79 4.1.3.3 Outflow Meter .............................................................................. 80
4.2 Conclusion on the Present Friction and Texture Measuring Technologies ............ 81 4.3 Alternative Methods to Evaluate Surface Friction Characteristics ......................... 82
4.3.1 Option 1: The Kummer Model ................................................................... 82 4.3.2 Option 2: Aircraft Based Assessment Method ........................................... 86 4.3.3 Option 3: Criteria Based on the Pavement Texture and Geometrical
Characteristics ............................................................................................. 87 4.3.4 Option 4: Other Methods ........................................................................... 88 4.3.5 Potential for “Cross-Pollination” from Other Industries ............................. 89 4.3.6 Summary and Conclusions .......................................................................... 90
5 STEPWISE PROCEDURE AND GUIDELINES FOR HARMONIZATION ................ 92 5.1 CFMD Qualification Testing For Compliance with Various Standards ................. 92
5.1.1 Review and Evaluation of IFI, IRFI, EFI Quality Testing Standards and other Studies ................................................................................................ 92
5.1.2 Recommendation ........................................................................................ 94 5.1.2.1 Surface Selection Requirements ................................................... 95 5.1.2.2 Testing Process Requirements ...................................................... 95 5.1.2.3 Determination of Quality Measures .............................................. 96
5.2 Review Technical Criteria for Measuring Device Compliance .............................. 98 5.2.1 Material Reviewed ...................................................................................... 98 5.2.2 Review of Content in Specifications ........................................................... 98
5.2.2.1 Mechanical Design ....................................................................... 98 5.2.2.2 Output ........................................................................................... 99 5.2.2.3 Operating Conditions .................................................................... 99
BMT Fleet Technology Limited 6575Vol 3.FR
Runway Friction Characteristics Measurement and Aircraft Braking (RuFAB) vi Volume 3 – Functional Friction
5.2.2.4 Repeatability ................................................................................. 99 5.2.2.5 Watering System ........................................................................... 99 5.2.2.6 Test Speed ..................................................................................... 99 5.2.2.7 Device Documentation and Instrumentation ................................ 99 5.2.2.8 Host Vehicle ................................................................................. 99 5.2.2.9 Test Tire ...................................................................................... 100
5.2.3 Overall Comments .................................................................................... 100 5.2.4 Recommendation ...................................................................................... 100
5.2.4.1 Introduction ................................................................................. 100 5.2.4.2 Basic Design and Measurement Requirements .......................... 100 5.2.4.3 Uncertainty and Stability of Measuring System ......................... 101 5.2.4.4 Measurement and Procedure-Related Requirements .................. 102 5.2.4.5 Self-Wetting System ................................................................... 102 5.2.4.6 Data Recording and Electronic Signal Conditioning .................. 102
5.3 Meeting Quality Requirements in Relation to Various Standards ........................ 103 5.3.1 Material Reviewed .................................................................................... 103 5.3.2 Recommendation ...................................................................................... 103
5.3.2.1 Principles and Broad Guidelines ................................................ 103 5.3.2.2 Description of Proposed Approach ............................................. 107 5.3.2.3 Main Guidelines for Harmonization Testing Procedure
Development ............................................................................... 109 5.3.2.4 An Example for Harmonization Testing Process ....................... 112 5.3.2.5 Advantages of Proposed Approach ............................................ 115
5.4 Propose the Establishment of a Reference Equipment Database Taking into Account Type of Equipment, Type and Location of Surface, etc. ........................ 117
5.5 Assess the Need to Issue Specific EASA Specifications in this Field .................. 117 5.5.1 Review Present Specification .................................................................... 117
5.6 Proposals for Amendment of the ICAO Harmonization Table ............................. 118 5.7 Summary and Conclusions .................................................................................... 120
6 REFERENCES ............................................................................................................... 122
BMT Fleet Technology Limited 6575Vol 3.FR
Runway Friction Characteristics Measurement and Aircraft Braking (RuFAB) vii Volume 3 – Functional Friction
LIST OF ILLUSTRATIONS
Figure 2.1: ASTM E274 Locked Wheel Testing Device ......................................................... 8 Figure 2.2: GripTester Fixed-Slip Friction Testing Device ................................................... 11 Figure 2.3: SCRIM - Sideways Force Coefficient Routine Investigation Machine .............. 13 Figure 2.4: The Mu Meter Side Force Friction Testing Device ............................................. 13 Figure 2.5: The RUNAR Variable Slip Friction Testing Device ........................................... 15 Figure 2.6: Mechanical (Bowmonk) and Electronic (ERD) Decelerometers ........................ 17 Figure 2.7: British Pendulum Tester ...................................................................................... 19 Figure 2.8: The Dynamic Friction Tester ............................................................................... 20 Figure 3.1: Schematic for Mechanically-Braked Fixed Slip Measurement Principle ........... 23 Figure 3.2: Schematic for Hydraulically-Braked Fixed Slip Measuring Principle ................ 23 Figure 3.3: Standardized Friction Tires for SAAB, RFT, RUNAR, and other Devices ........ 24 Figure 3.4: Standardized Friction Tires for the Grip Tester .................................................. 25 Figure 3.5: Standardized Friction Tires for the IMAG and IRV Devices .............................. 25 Figure 3.6: Schematic Diagram for Side Force Coefficient Measurement Principle ............ 28 Figure 3.7: Standardized Friction Tires for the Mu-Meter Device ........................................ 29 Figure 3.8: General Schematic: Pavement Friction versus Tire Slip ..................................... 36 Figure 3.9: EFI, IFI, and the PIARC Friction Models ........................................................... 37 Figure 3.10: Effect of Water Depth on Measured Friction Coefficient of Friction ................ 40 Figure 3.11: Schematic of the ESDU Method (CROW, 2003) ................................................ 50 Figure 3.12: Aircraft Braking (Mu) vs. Reference IRV ........................................................... 54 Figure 3.13: Aircraft Braking (Mu) vs. ERD ........................................................................... 55 Figure 3.14: Aircraft Braking (Mu) vs. IRFI(ERD) with Non-Uniform Sites Removed ........ 55 Figure 3.15: Aircraft Braking (Mu) vs. RUNAR ..................................................................... 56 Figure 3.16: Aircraft Braking (Mu) vs. IRFI(RUNAR) ........................................................... 56 Figure 3.17: Aircraft Braking (Mu) vs. SFT79 ........................................................................ 57 Figure 3.18: Aircraft Braking (Mu) vs. IRFI(SFT79) .............................................................. 57 Figure 3.19: Predicted Harmonized Friction values Using the EDSU model for 40km/h ....... 59 Figure 3.20: Predicted Harmonized Friction values Using the EDSU model for 65km/h ....... 60 Figure 3.21: Predicted Harmonized Friction Values Using EDSU Model for 95 km/h .......... 60 Figure 3.22: Predicted Harmonized Friction Values ............................................................... 61 Figure 3.23: Mu-Datum Parameter Consistency for the ESDU Model (CROW, 2006) ......... 63 Figure 3.24: Variation of Kappa Runway Interaction Parameter in ESDU Model (CROW,
2006) .................................................................................................................... 63 Figure 3.25: Variation over Time for the “a” Constants in the IFI Model .............................. 64 Figure 3.26 Variation over Time for the “b” Constants in the IFI Model .............................. 64 Figure 3.27: Wallop NASA Site Surface Friction Changes over 8 Years as Measured by the
VADOT E0274 Trailer ........................................................................................ 67 Figure 3.28: Wallop NASA Site Surface Friction Changes over 5 Years as Measured by the
IMAG/IRV .......................................................................................................... 68 Figure 3.29 Wallop NASA Site Surface Texture Changes over 8 Years as Measured by the
CT Meter ............................................................................................................. 68 Figure 3.30 Wallop NASA Site Surface Texture Changes over 8 Years as Measured by the
Sand Patch Method .............................................................................................. 69 Figure 4.1: The ROad Surface ANalyzer Laser Device (ROSAN). ...................................... 77 Figure 4.2: The Circular Texture Meter ................................................................................. 78 Figure 4.3 The Sand Patch Measurement Tools ................................................................... 79 Figure 4.4: The Outflow Meter .............................................................................................. 81
BMT Fleet Technology Limited 6575Vol 3.FR
Runway Friction Characteristics Measurement and Aircraft Braking (RuFAB) viii Volume 3 – Functional Friction
Figure 4.5: Kummer's Unified Theory of Rubber and Tire Friction ...................................... 82 Figure 4.6: Comparison Between Measured and Predicted Friction (Ergun, 2005) .............. 84 Figure 4.7 Pavement Surface Profile by Stereo Photography ............................................... 85 Figure 4.8 Equipment Setup for Stereo Photography ........................................................... 85 Figure 4.9 Schematic of Data Distribution for Aircraft Based Assessment Approach ........ 86 Figure 4.10 Schematic for Aircraft Based Assessment Approach .......................................... 87 Figure 4.11: Different Types of Friction Categories ................................................................ 90 Figure 5.1: Summary of Harmonization Process Development .......................................... 111 Figure 5.2: Schematic of the Harmonization Process .......................................................... 112 Figure 5.3: Example Result of an ANOVA Analysis from MS Excel ................................ 114
BMT Fleet Technology Limited 6575Vol 3.FR
Runway Friction Characteristics Measurement and Aircraft Braking (RuFAB) ix Volume 3 – Functional Friction
LIST OF TABLES
Table 2.1: Overview of High Speed Pavement Friction Test Methods ................................... 3 Table 2.2: Comparison of High Speed Pavement Friction Test Methods ............................... 5 Table 2.3: Overview of Low Speed or Spot Friction Measurement Methods ......................... 7 Table 3.1: Different Friction Measuring Devices Used at Airports ..................................... 21 Table 3.2: Relevant References Regarding Significance of Device Design Parameters ...... 35 Table 3.3: Relevant References Regarding Harmonization Trials ....................................... 41 Table 3-4: Relevant Harmonization Models Examined in the HERMES Project ................ 46 Table 3.5: Correlation Coefficients of Harmonized Friction Numbers of Different Devices to
Aircraft Braking Friction ..................................................................................... 53 Table 4.1: Summary of Texture Measurement Methods: Laser Profiler Method ................ 73 Table 4.2: Low Speed or Spot Texture Test Methods: SPM, Grease Patch and OFM ........ 74 Table 4.3: Low Speed or Spot Texture Test Methods: CTM and TDG ............................... 75 Table 4.4: Summary of Low Speed or Spot Pavement Surface Texture Test Methods ....... 76 Table 4.5: Norwegian Criteria (Unofficial) .......................................................................... 88 Table 5.1: Relevant References Related to Harmonization ................................................... 92 Table 5.2: Summary of Quality Testing Requirements for FMD ........................................... 93 Table 5.3: Relevant References: Technical Criteria for Friction Measuring Devices ........... 98 Table 5.4: Summary of Harmonization Testing Quality Requirements .............................. 103 Table 5.5: Runway Friction Levels Specified by ICAO, 2004 (Table A-1) ........................ 119 Table 5.6: Runway Friction Levels Advised by the FAA AC 150/5320-12C – 1997 ......... 119 Table 5.7: Example ICAO Equivalency Table .................................................................... 120
BMT Fleet Technology Limited 6575Vol 3.FR
Runway Friction Characteristics Measurement and Aircraft Braking (RuFAB) x Volume 3 – Functional Friction
ACKNOWLEDGEMENTS
Werner Kleine-Beek of EASA was the Project Officer. He is thanked for his efforts throughout to administer and facilitate the work.
The contributions of the Project Steering Committee (listed below) are acknowledged as well. Their contributions included attending project meetings, providing guidance regarding the approach(es) for the project, providing information and references, reviewing the questionnaires that were sent out, and facilitating contacts.
Jean Baril, EASA;
Rachel Daeschler, EASA;
Xavier Vergez, EASA;
Chris Gash, CAA-UK;
John Matthews, EASA;
Herbert Meyer, EASA;
Ivan-David Nicolas, EASA;
Armann Norheim, Avinor (Norway);
Jerry Ostronic, FAA (USA);
Vincenzo Pennetta, EASA;
Francis Richards, Eurocontrol;
Maria Algar Ruiz, EASA;
Filippo Tomasello, EASA; and
François Watrin, DGAC-France.
Acknowledgements are made to various members of the Project Steering Committee for providing advance information regarding various ongoing initiatives as follows:
Jerry Ostronic, for information regarding the TALPA ARC recommendations;
François Watrin, for information regarding the French DGAC study; and
Armann Norheim, for information regarding the ICAO FTF.
Acknowledgements are also made to the various individuals and organizations who responded to the questionnaires which were sent out as part of the project. Although they cannot be named (to maintain their anonymity), their support is collectively acknowledged.
BMT Fleet Technology Limited 6575Vol 3.FR
Runway Friction Characteristics Measurement and Aircraft Braking (RuFAB) xi Volume 3 – Functional Friction
EXECUTIVE SUMMARY
This report constitutes the final submission under EASA Contract No. EASA.2008.C46 for the Runway Friction Characteristics Measurement and Aircraft Braking (RuFAB) study, which was sponsored by the European Aviation Safety Authority (EASA) to investigate and harmonize:
(a) Terminologies for runway surface conditions, related to functional and operational friction characteristics;
(b) Functional characteristics as they relate to friction measurement reporting; and
(c) Operational characteristics as they relate to runway surface condition assessment and reporting, friction measurement, and aircraft braking.
The overall objective of the work was to provide recommendations regarding the assessment of runway friction characteristics and Runway Condition Reporting (RCR). This is a broad subject, and thus, the project had several specific objectives, as generally summarized below:
(a) To conduct a broad information-gathering effort to determine the current state-of-practice.
(b) To compare the various approaches and definitions used for RCR, and to suggest approaches for harmonizing them.
(c) To compare the various approaches used for assessing functional friction characteristics, and to suggest approaches for harmonizing them. This included an evaluation of past approaches for harmonizing the readings from ground friction-measuring devices, and recommendations for an updated device equivalency table (to Table A-1 in ICAO Annex 14, Volume 1).
(d) To compare the various approaches used for assessing operational friction characteristics, and to suggest approaches for harmonizing them.
This is Volume 3 of a four-volume series of reports describing the project, as follows: (a) Volume 1 – Summary of Findings and Recommendations; (b) Volume 2 - Documentation and Taxonomy; (c) Volume 3 - Functional Friction; and (d) Volume 4 - Operational Friction.
It should be noted that all recommendations are only presented in Volume 1.
Section 3 is divided with respect to the three main tasks in the scope of work related to functional friction assessments:
(a) Scientific and Operational Consolidations of Harmonization;
(b) Investigations for Alternative Methods to Evaluate Surface Friction Characteristics; and
(c) Definition of a Stepwise Procedure and Guidelines for Harmonization.
BMT Fleet Technology Limited 6575Vol 3.FR
Runway Friction Characteristics Measurement and Aircraft Braking (RuFAB) xii Volume 3 – Functional Friction
The last sub-section of Section 3 presents recommendations regarding updates to the device equivalency table in ICAO Annex 14, Volume 1.
Scientific and Operational Consolidations of Harmonization
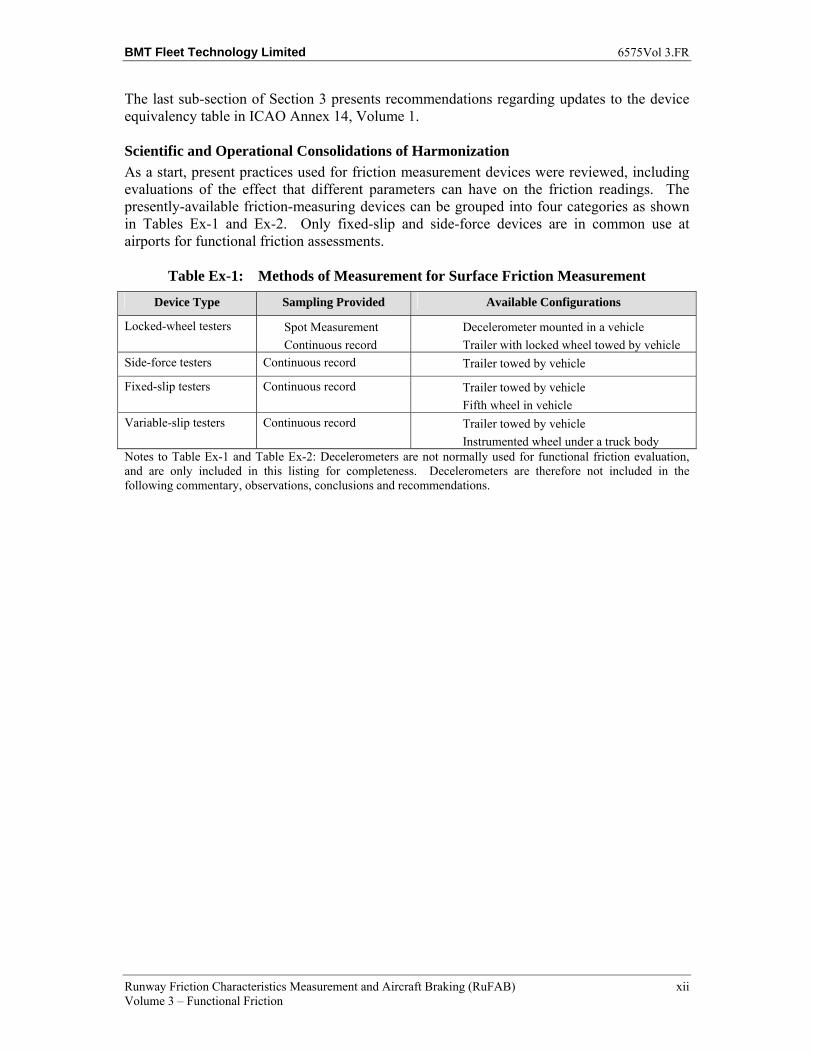
As a start, present practices used for friction measurement devices were reviewed, including evaluations of the effect that different parameters can have on the friction readings. The presently-available friction-measuring devices can be grouped into four categories as shown in Tables Ex-1 and Ex-2. Only fixed-slip and side-force devices are in common use at airports for functional friction assessments.
Table Ex-1: Methods of Measurement for Surface Friction Measurement
Device Type Sampling Provided Available Configurations
Locked-wheel testers Spot Measurement
Continuous record
Decelerometer mounted in a vehicle
Trailer with locked wheel towed by vehicle
Side-force testers Continuous record Trailer towed by vehicle
Fixed-slip testers Continuous record Trailer towed by vehicle
Fifth wheel in vehicle
Variable-slip testers Continuous record Trailer towed by vehicle
Instrumented wheel under a truck body Notes to Table Ex-1 and Table Ex-2: Decelerometers are not normally used for functional friction evaluation, and are only included in this listing for completeness. Decelerometers are therefore not included in the following commentary, observations, conclusions and recommendations.
BMT Fleet Technology Limited 6575Vol 3.FR
Runway Friction Characteristics Measurement and Aircraft Braking (RuFAB) xiii Volume 3 – Functional Friction
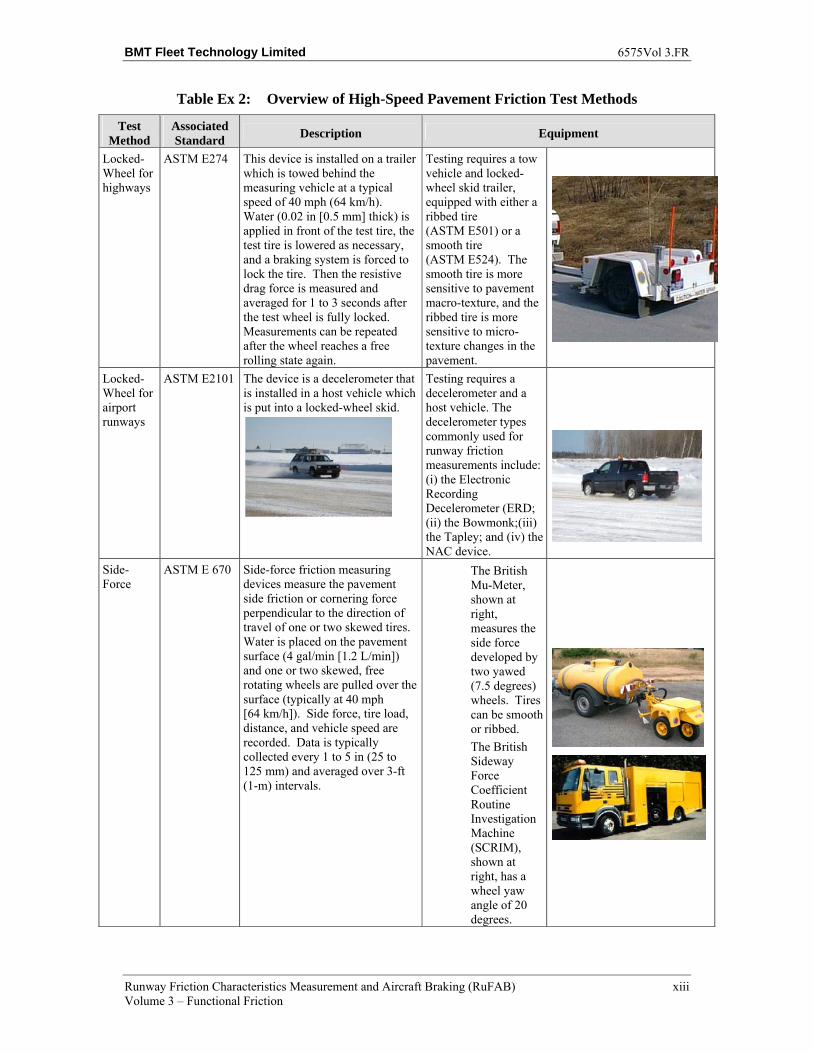
Table Ex 2: Overview of High-Speed Pavement Friction Test Methods
Test Method
Associated Standard
Description Equipment
Locked-Wheel for highways
ASTM E274 This device is installed on a trailer which is towed behind the measuring vehicle at a typical speed of 40 mph (64 km/h). Water (0.02 in [0.5 mm] thick) is applied in front of the test tire, the test tire is lowered as necessary, and a braking system is forced to lock the tire. Then the resistive drag force is measured and averaged for 1 to 3 seconds after the test wheel is fully locked. Measurements can be repeated after the wheel reaches a free rolling state again.
Testing requires a tow vehicle and locked-wheel skid trailer, equipped with either a ribbed tire (ASTM E501) or a smooth tire (ASTM E524). The smooth tire is more sensitive to pavement macro-texture, and the ribbed tire is more sensitive to micro-texture changes in the pavement.
Locked-Wheel for airport runways
ASTM E2101 The device is a decelerometer that is installed in a host vehicle which is put into a locked-wheel skid.
Testing requires a decelerometer and a host vehicle. The decelerometer types commonly used for runway friction measurements include: (i) the Electronic Recording Decelerometer (ERD; (ii) the Bowmonk;(iii) the Tapley; and (iv) the NAC device.
Side-Force
ASTM E 670 Side-force friction measuring devices measure the pavement side friction or cornering force perpendicular to the direction of travel of one or two skewed tires. Water is placed on the pavement surface (4 gal/min [1.2 L/min]) and one or two skewed, free rotating wheels are pulled over the surface (typically at 40 mph [64 km/h]). Side force, tire load, distance, and vehicle speed are recorded. Data is typically collected every 1 to 5 in (25 to 125 mm) and averaged over 3-ft (1-m) intervals.
The British Mu-Meter, shown at right, measures the side force developed by two yawed (7.5 degrees) wheels. Tires can be smooth or ribbed.
The British Sideway Force Coefficient Routine Investigation Machine (SCRIM), shown at right, has a wheel yaw angle of 20 degrees.
BMT Fleet Technology Limited 6575Vol 3.FR
Runway Friction Characteristics Measurement and Aircraft Braking (RuFAB) xiv Volume 3 – Functional Friction
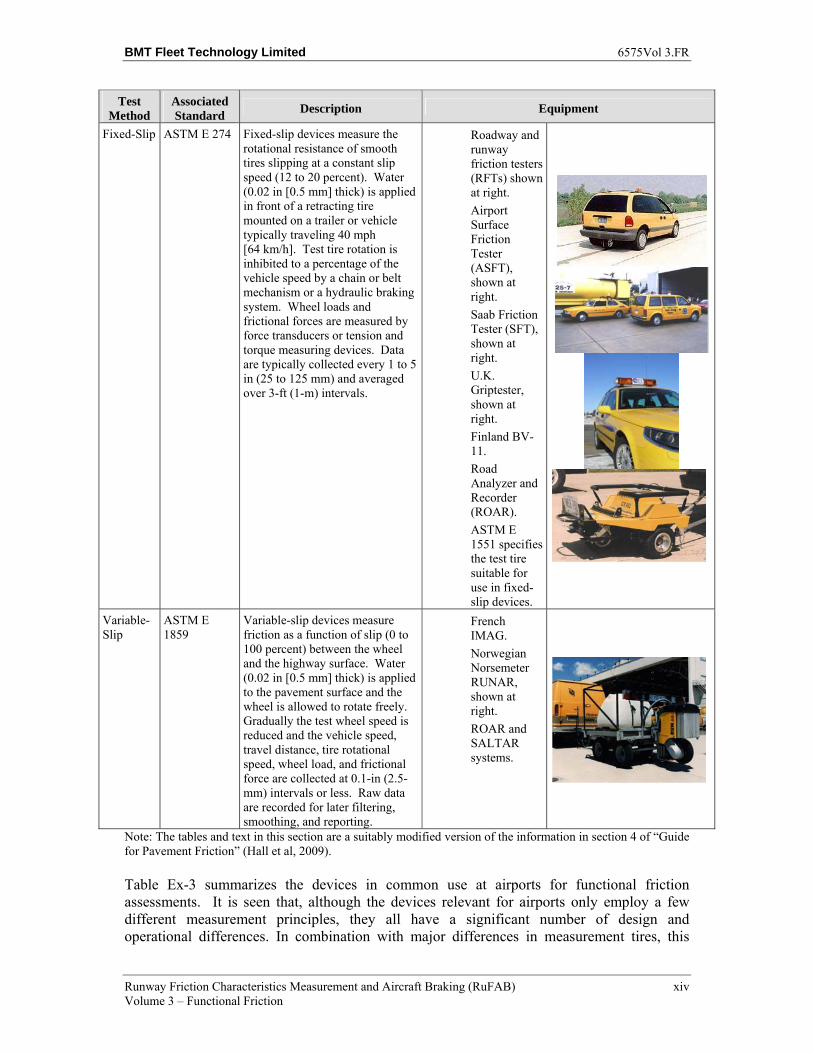
Test Method
Associated Standard
Description Equipment
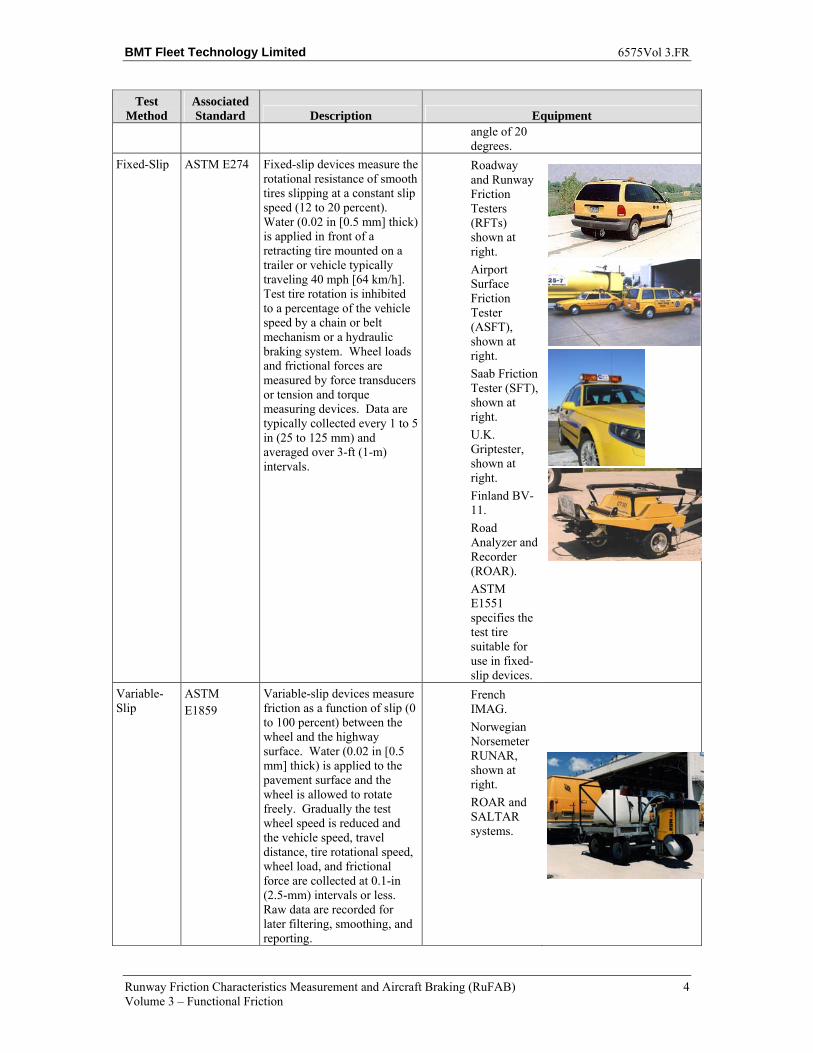
Fixed-Slip ASTM E 274 Fixed-slip devices measure the rotational resistance of smooth tires slipping at a constant slip speed (12 to 20 percent). Water (0.02 in [0.5 mm] thick) is applied in front of a retracting tire mounted on a trailer or vehicle typically traveling 40 mph [64 km/h]. Test tire rotation is inhibited to a percentage of the vehicle speed by a chain or belt mechanism or a hydraulic braking system. Wheel loads and frictional forces are measured by force transducers or tension and torque measuring devices. Data are typically collected every 1 to 5 in (25 to 125 mm) and averaged over 3-ft (1-m) intervals.
Roadway and runway friction testers (RFTs) shown at right.
Airport Surface Friction Tester (ASFT), shown at right.
Saab Friction Tester (SFT), shown at right.
U.K. Griptester, shown at right.
Finland BV-11.
Road Analyzer and Recorder (ROAR).
ASTM E 1551 specifies the test tire suitable for use in fixed-slip devices.
Variable-Slip
ASTM E 1859
Variable-slip devices measure friction as a function of slip (0 to 100 percent) between the wheel and the highway surface. Water (0.02 in [0.5 mm] thick) is applied to the pavement surface and the wheel is allowed to rotate freely. Gradually the test wheel speed is reduced and the vehicle speed, travel distance, tire rotational speed, wheel load, and frictional force are collected at 0.1-in (2.5-mm) intervals or less. Raw data are recorded for later filtering, smoothing, and reporting.
French IMAG.
Norwegian Norsemeter RUNAR, shown at right.
ROAR and SALTAR systems.
Note: The tables and text in this section are a suitably modified version of the information in section 4 of “Guide for Pavement Friction” (Hall et al, 2009).
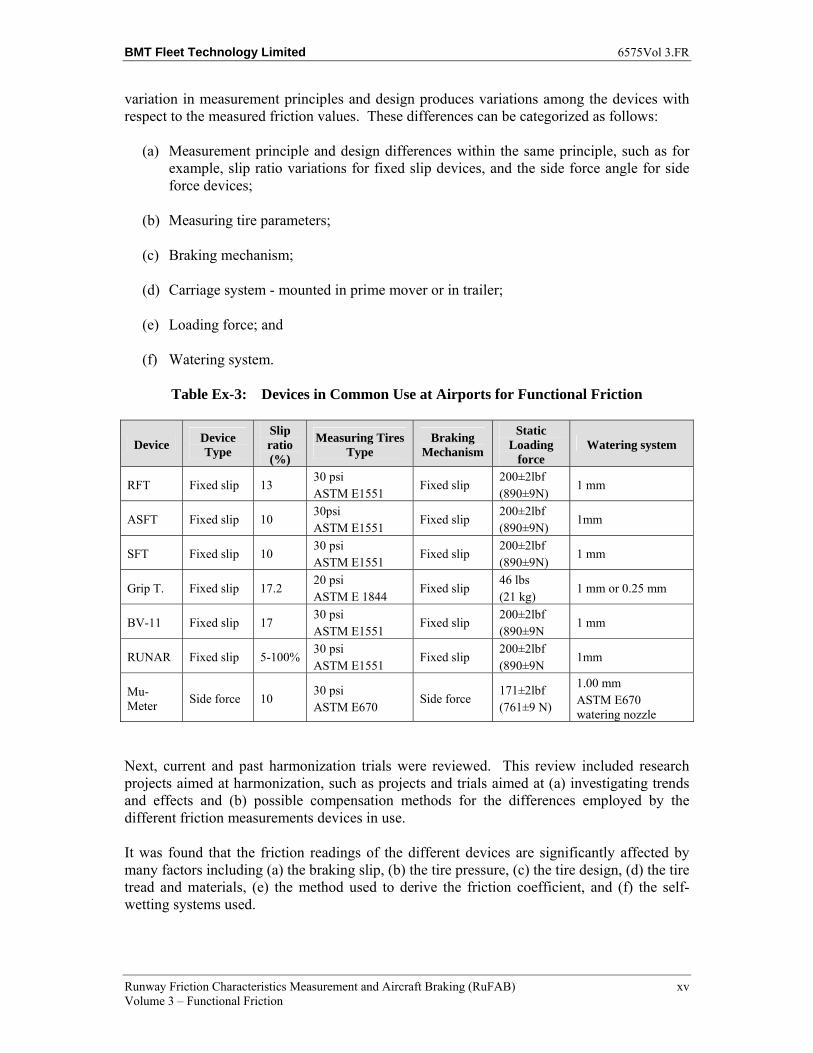
Table Ex-3 summarizes the devices in common use at airports for functional friction assessments. It is seen that, although the devices relevant for airports only employ a few different measurement principles, they all have a significant number of design and operational differences. In combination with major differences in measurement tires, this
BMT Fleet Technology Limited 6575Vol 3.FR
Runway Friction Characteristics Measurement and Aircraft Braking (RuFAB) xv Volume 3 – Functional Friction
variation in measurement principles and design produces variations among the devices with respect to the measured friction values. These differences can be categorized as follows:
(a) Measurement principle and design differences within the same principle, such as for example, slip ratio variations for fixed slip devices, and the side force angle for side force devices;
(b) Measuring tire parameters;
(c) Braking mechanism;
(d) Carriage system - mounted in prime mover or in trailer;
(e) Loading force; and
(f) Watering system.
Table Ex-3: Devices in Common Use at Airports for Functional Friction
Device Device Type
Slip ratio (%)
Measuring Tires Type
Braking Mechanism
Static Loading
force Watering system
RFT Fixed slip 13 30 psi ASTM E1551
Fixed slip 200±2lbf (890±9N)
1 mm
ASFT Fixed slip 10 30psi ASTM E1551
Fixed slip 200±2lbf (890±9N)
1mm
SFT Fixed slip 10 30 psi ASTM E1551
Fixed slip 200±2lbf (890±9N)
1 mm
Grip T. Fixed slip 17.2 20 psi ASTM E 1844
Fixed slip 46 lbs (21 kg)
1 mm or 0.25 mm
BV-11 Fixed slip 17 30 psi ASTM E1551
Fixed slip 200±2lbf (890±9N
1 mm
RUNAR Fixed slip 5-100% 30 psi ASTM E1551
Fixed slip 200±2lbf (890±9N
1mm
Mu-Meter
Side force 10 30 psi ASTM E670
Side force 171±2lbf (761±9 N)
1.00 mm ASTM E670 watering nozzle
Next, current and past harmonization trials were reviewed. This review included research projects aimed at harmonization, such as projects and trials aimed at (a) investigating trends and effects and (b) possible compensation methods for the differences employed by the different friction measurements devices in use.
It was found that the friction readings of the different devices are significantly affected by many factors including (a) the braking slip, (b) the tire pressure, (c) the tire design, (d) the tire tread and materials, (e) the method used to derive the friction coefficient, and (f) the self-wetting systems used.
BMT Fleet Technology Limited 6575Vol 3.FR
Runway Friction Characteristics Measurement and Aircraft Braking (RuFAB) xvi Volume 3 – Functional Friction
It was concluded that, of these parameters, the braking slip ratio is the only physical parameter that is sufficiently well understood, with a precise and empirically-tested model that is both of high enough quality and practical enough, to be used in harmonization models.
The relationship of the measured friction coefficient to differences in device braking mechanism and derivation of braking friction is relatively well explained from applied physical models, but the models are not sufficiently tested nor are they practical for use in the harmonization models in their present forms.
Variations in delivered water depth, water delivery and distribution profile and various tire parameters also affect the measured friction coefficient. However, although their significance is recognized, their effect cannot be reliably quantified and therefore accounted for using any of the presently available models.
One possible way to overcome these problems for scientific consolidation and harmonization is to use a physically-based formula to compensate for the differences among the devices, if a suitably well defined and precise formula exists. For parameters where a formula is not available, harmonization could proceed by standardizing these other parameters. This would eliminate the differences in the different friction measurement devices and consequently their effects on the friction measurement readings.
After examining the significance of the parameters affecting the friction readings and available or potential compensation models all of the recent and new harmonization models and trials (Table Ex-4) were reviewed in an effort to determine the best candidate(s) for a harmonization model.
BMT Fleet Technology Limited 6575Vol 3.FR
Runway Friction Characteristics Measurement and Aircraft Braking (RuFAB) xvii Volume 3 – Functional Friction
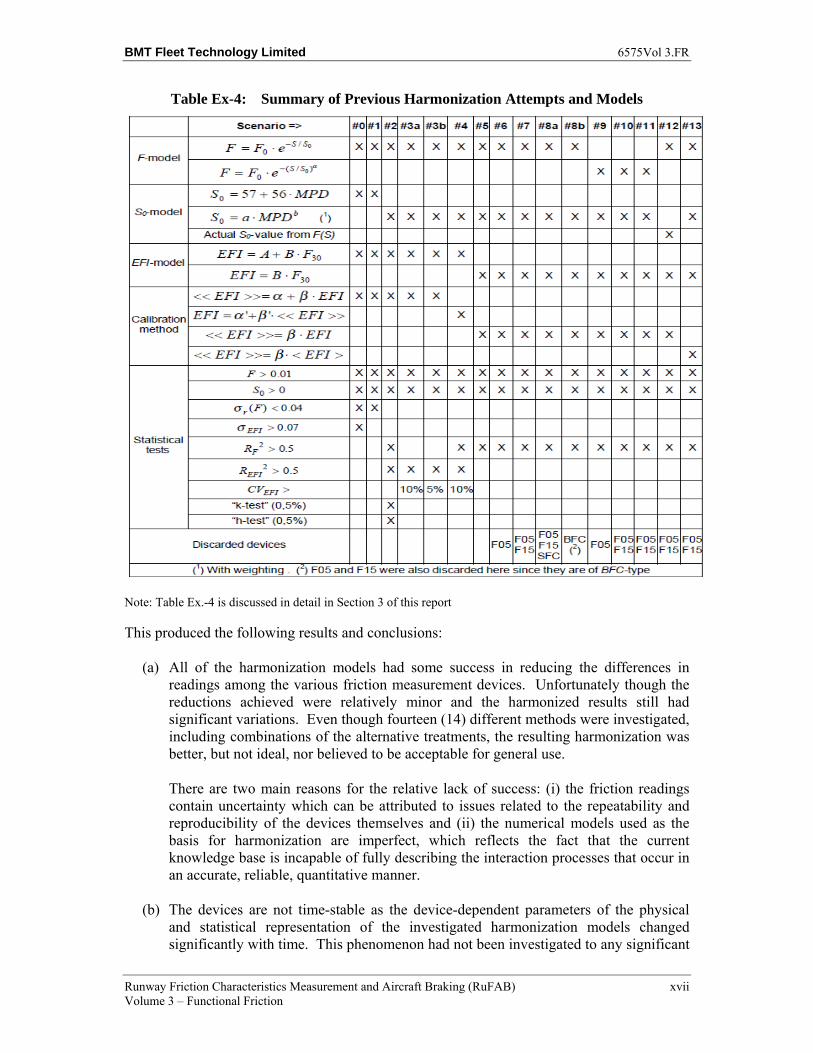
Table Ex-4: Summary of Previous Harmonization Attempts and Models
Note: Table Ex.-4 is discussed in detail in Section 3 of this report
This produced the following results and conclusions:
(a) All of the harmonization models had some success in reducing the differences in readings among the various friction measurement devices. Unfortunately though the reductions achieved were relatively minor and the harmonized results still had significant variations. Even though fourteen (14) different methods were investigated, including combinations of the alternative treatments, the resulting harmonization was better, but not ideal, nor believed to be acceptable for general use.
There are two main reasons for the relative lack of success: (i) the friction readings contain uncertainty which can be attributed to issues related to the repeatability and reproducibility of the devices themselves and (ii) the numerical models used as the basis for harmonization are imperfect, which reflects the fact that the current knowledge base is incapable of fully describing the interaction processes that occur in an accurate, reliable, quantitative manner.
(b) The devices are not time-stable as the device-dependent parameters of the physical and statistical representation of the investigated harmonization models changed significantly with time. This phenomenon had not been investigated to any significant
BMT Fleet Technology Limited 6575Vol 3.FR
Runway Friction Characteristics Measurement and Aircraft Braking (RuFAB) xviii Volume 3 – Functional Friction
extent by the prior work. However, it must be addressed in the recommendation for harmonization model of this study.
(c) The existing harmonization models do not guarantee that the friction index they provide can be correlated to aircraft braking performance within acceptable limits. It is widely recognized that the friction criteria used at present by airports for runway maintenance planning or action are not directly related to aircraft performance. This issue should be addressed given that one of the most important purposes of harmonization trials is to produce results that are meaningful indicators of the braking coefficients experienced by aircraft on wet runway surfaces.
It is understood that this issue is also being considered by the ICAO FTF in relation to the most appropriate interpretation of the term “slippery when wet”. Furthermore, the project team was advised that the ICAO FTF intends to develop detailed guidance with respect to how this issue should be addressed with future work. Because a report from the ICAO FTF is not yet available, detailed conclusions are premature.
Finally, assessments were made regarding the feasibility of harmonization. This included identifying issues and topics that need to be considered for the harmonization model.
It was concluded that none of the previous harmonization models produced satisfactory results in their present forms. The reviews and the investigations, as well as the comparative research projects performed for evaluating the different harmonization models, showed that these unsatisfactory results can be traced to a number of sources including:
(a) Weaknesses in the models and procedures themselves;
(b) Changes in the reference sources used, whether they be reference surfaces, or reference devices; and
(c) Quality control issues related with harmonization trials.
A number of key elements were identified for the harmonization procedure and model development as follows:
(a) Reference Surfaces. It is necessary to develop special reference surfaces which deliver frictional characteristics that are time-stable, economical to produce, and for which manufacturing or construction is predictable and reproducible.
(b) Reference Device. It is necessary to develop or identify a reference device(s) that is: (i) stable in time and performance; (ii) economical to produce and use; and (iii) repeatable and reproducible with regard to measurement results.
(c) Quality Requirements. It is necessary to define a set of strict quality requirements for all the devices that can be included in a harmonization process. These quality requirements must include repeatability, reproducibility, and time-stability criteria.
Investigations for Alternative Methods to Evaluate Surface Friction Characteristics
First, the technologies currently used for friction characteristics and texture measurements were surveyed as well as any other alternative methods. This review also included an
BMT Fleet Technology Limited 6575Vol 3.FR
Runway Friction Characteristics Measurement and Aircraft Braking (RuFAB) xix Volume 3 – Functional Friction
extensive evaluation of friction characteristics and texture measurement technologies. It was based on the different categories of friction and texture measurement technologies including their method and basic make-up of equipment, measurement procedure, measurement indexes, and advantages and disadvantages.
It was concluded that the most suitable reference devices at present for possible harmonization are the DF Tester for friction measurements and the CT Meter for texture measurements. (These devices are described in the main text). This conclusion was based on the facts that both of these devices are very reliable, time stable and economical, and provide repeatable and reproducible results.
The last step in this investigation was to assess alternative methods for functional friction assessments other than friction-measuring devices. Four alternatives were considered:
(a) Theoretical Approach – This would be based on knowledge of the surface’s macro- and micro-texture properties and the tire’s visco-elastic properties.
(b) Calculating the aircraft braking action directly from data collected by the aircraft during landing.
(c) The use of pavement-only properties such as texture and geometry. It is noted that Norway has recently (July, 2009) implemented this approach.
(d) Visual Inspection – This approach involves: (i) using laser to detect surface irregularities and contaminants on the surface; and then (ii) using this information in a projection methodology to predict friction.
The first approach (i.e., a theoretical approach) has been available since Kummer developed his model in 1966. Unfortunately though, as of yet, there is no effective way of measuring pavement micro-texture. This made it impossible to effectively use this method in the past, and probably it will cause it to not be applicable in the near future as well. However, due to the rapid development of digital photography, this approach might be an option in the longer term future.
Except for approach (c) in Norway, approaches (b) and (c) are in their very early stages; and even though proof-of-concepts have been developed, there is still a need for a considerable amount of work to verify and evaluate their effectiveness, objectiveness, suitability, and comparability through the different climates, regions and countries.
As a result, for the near future, this leaves no alternative method that can be used instead of friction-measuring devices. For longer time horizons, there are a number of promising technologies and EASA is advised to monitor them, and perhaps encourage them, depending on the initial results.
Definition of a Stepwise Procedure and Guidelines for Harmonization
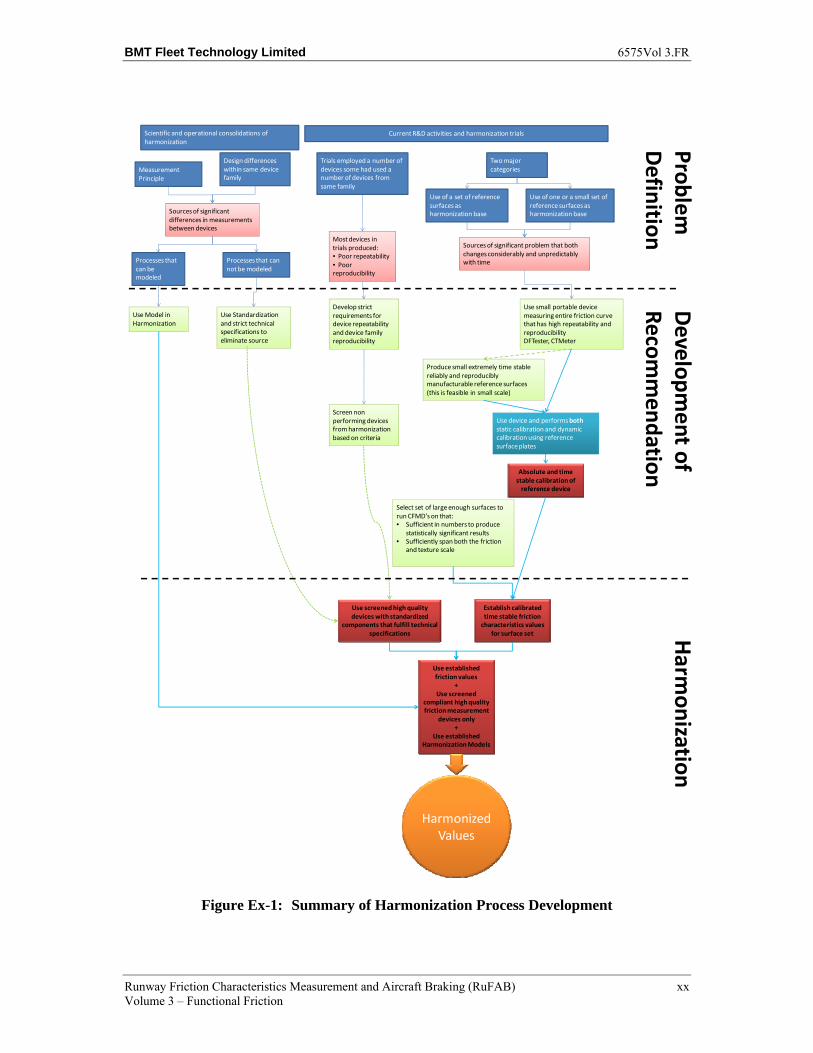
The development of a stepwise procedure and guidelines for harmonization of friction measuring devices was the final result for this part of this study. The full flow diagram of the recommended harmonization procedures and surrounding set of requirements is given in the flow chart shown in Figure Ex-1, which is discussed in detail in the main text.
BMT Fleet Technology Limited 6575Vol 3.FR
Runway Friction Characteristics Measurement and Aircraft Braking (RuFAB) xx Volume 3 – Functional Friction
Figure Ex-1: Summary of Harmonization Process Development
Sources of significant differences in measurements between devices
Scientific and operational consolidations of harmonization
Measurement Principle
Design differences within same device family
Processes that can be modeled
Processes that can not be modeled
Use Model in Harmonization
Use Standardization and strict technical specifications to eliminate source
Current R&D activities and harmonization trials
Two major categories
Use of a set of reference surfaces as harmonization base
Use of one or a small set of reference surfaces as harmonization base
Sources of significant problem that both changes considerably and unpredictably with time
Use small portable device measuring entire friction curve that has high repeatability and reproducibilityDFTester, CTMeter
Produce small extremely time stable reliably and reproducibly manufacturable reference surfaces (this is feasible in small scale)
Trials employed a number of devices some had used a number of devices from same family
Most devices in trials produced:• Poor repeatability• Poor reproducibility
Develop strict requirements for device repeatability and device family reproducibility
Screen non performing devices from harmonization based on criteria
Use device and performs both static calibration and dynamic calibration using reference surface plates
Absolute and time stable calibration of
reference device
Select set of large enough surfaces to run CFMD’s on that:• Sufficient in numbers to produce
statistically significant results• Sufficiently span both the friction
and texture scale
Establish calibrated time stable friction
characteristics values for surface set
Use screened high quality devices with standardized
components that fulfill technical specifications
Use established friction values
+Use screened
compliant high quality friction measurement
devices only+
Use established Harmonization Models
Harmonized Values
Harm
onizationD
evelopment of
Recomm
endationProblemD
efinition
BMT Fleet Technology Limited 6575Vol 3.FR
Runway Friction Characteristics Measurement and Aircraft Braking (RuFAB) xxi Volume 3 – Functional Friction
The recommendations made include the following steps:
(a) Quality testing requirements such as the repeatability, reproducibility, and time stability for each FMD - these include a detailed specification of the testing process and the calculation process for evaluating repeatability, reproducibility, and time stability. Threshold values are recommended for repeatability, reproducibility, and time stability for friction-measuring devices that should govern whether or not they are allowed to participate in a harmonization process.
(b) The development of technical specification requirements defining the criteria that FMDs must meet for functional friction measurements on runways, and which fulfill the requirements for the harmonization process.
(c) Harmonization Process - recommendations are provided which include a detailed description of the harmonization testing setup, process and evaluation. They also include information regarding the reference device and the reference surfaces.
The recommended stepwise procedure and guidelines for harmonization for FMDs, was developed by first reviewing and evaluating the FMD quality testing requirements in ASTM, ISO, CEN, and ICAO standards. Unfortunately, these standards and practices only include requirements for repeatability and sometimes accuracy, if they include any criteria. Also, repeatability and accuracy are not defined consistently in some cases, which will lead to confusion. The only standard that refers to a specific methodology for calculating these values is CEN/TS 13036-2:2009.
Updating the Device Equivalency Table in ICAO Annex 14
The feasibility of amending the device equivalency table in ICAO Annex 14 Sup A was investigated using various harmonization approaches.
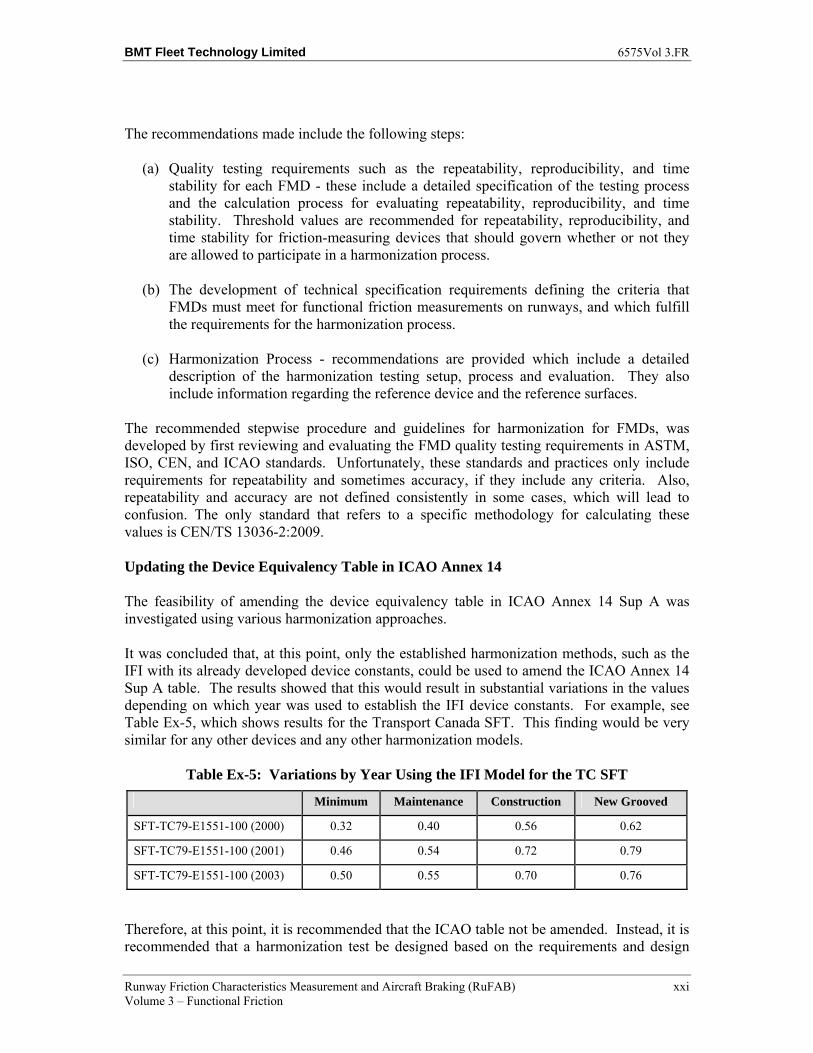
It was concluded that, at this point, only the established harmonization methods, such as the IFI with its already developed device constants, could be used to amend the ICAO Annex 14 Sup A table. The results showed that this would result in substantial variations in the values depending on which year was used to establish the IFI device constants. For example, see Table Ex-5, which shows results for the Transport Canada SFT. This finding would be very similar for any other devices and any other harmonization models.
Table Ex-5: Variations by Year Using the IFI Model for the TC SFT
Minimum Maintenance Construction New Grooved
SFT-TC79-E1551-100 (2000) 0.32 0.40 0.56 0.62
SFT-TC79-E1551-100 (2001) 0.46 0.54 0.72 0.79
SFT-TC79-E1551-100 (2003) 0.50 0.55 0.70 0.76
Therefore, at this point, it is recommended that the ICAO table not be amended. Instead, it is recommended that a harmonization test be designed based on the requirements and design
BMT Fleet Technology Limited 6575Vol 3.FR
Runway Friction Characteristics Measurement and Aircraft Braking (RuFAB) xxii Volume 3 – Functional Friction
parameters recommended in this part and that this be used with the new device parameters to amend the ICAO table.
BMT Fleet Technology Limited 6575Vol 3.FR
Runway Friction Characteristics Measurement and Aircraft Braking (RuFAB) 1 Volume 3 – Functional Friction
1 INTRODUCTION
The reports for the work in this project have been organized in four volumes as follows:
(a) Volume 1 – Summary of Findings and Recommendations – for clarity, all recommendations are only presented in Volume 1;
(b) Volume 2 - Documentation and Taxonomy;
(c) Volume 3 - Functional Friction; and
(d) Volume 4 - Operational Friction.
1.1 Volume 3
1.1.1 Content of Volume 3
This report (i.e., Volume 3) is divided with respect to the three main tasks that were defined in the scope of work for investigations of functional friction characteristics:
(a) Scientific and Operational Consolidations of Harmonization:
a. Review present practices of functional friction measurements taking into account elements like the type and characteristics of equipment used, the procedures, the frequency of static and dynamic calibration, etc.
b. Assess the anticipated results of current R&D activities and identify remaining gaps.
c. Assess the feasibility for harmonization.
d. Develop proposals for amendment of the harmonization table specified by ICAO (Annex 14, Sup A – Table 1).
(b) Investigation of Alternative Methods to Evaluate Surface Friction Characteristics:
a. Review alternative methods such as those for texture measurement, e.g. use of laser photography.
b. Evaluate the application of these methods for defining surface friction characteristics.
(c) Definition of a Stepwise Procedure and Guidelines for Harmonization:
a. Establish conditions for friction measuring device qualification testing complying with ASTM, ISO, CEN and ICAO standards taking into account parameter such as surfaces, speeds, depth of water film, temperature characteristics conditions and required practical test implementation conditions, e.g. number of measurement, accuracy, consistency of results, etc.
b. Review technical criteria for measuring device compliance.
BMT Fleet Technology Limited 6575Vol 3.FR
Runway Friction Characteristics Measurement and Aircraft Braking (RuFAB) 2 Volume 3 – Functional Friction
c. Review acceptable methods, accuracy and consistency of implementing harmonization procedures in relation with ASTM, ISO, CEN and ICAO standards.
d. Propose the establishment of a reference equipment database taking into account factors like type of equipment, type and location of surface, type of tire, inflation pressure, test speeds, and weather conditions during tests.
e. Assess the need to issue specific EASA specifications (i.e. ETSO) in this field.
1.1.2 Notice Regarding Definition of Depth
To avoid confusion, it should be noted that unless specifically stated in the text, all depths defined in this report series refer to the actual depth of material, and not the water-equivalent depth.
BMT Fleet Technology Limited 6575Vol 3.FR
Runway Friction Characteristics Measurement and Aircraft Braking (RuFAB) 3 Volume 3 – Functional Friction
2 FRICTION MEASURING EQUIPMENT
Currently-available technologies for friction measurement were surveyed. The results were sub-divided based on the different device categories. The survey included the methods used, the basic make-up of the equipment, the measurement procedure, the measurement indexes, and the advantages and disadvantages of each.
Friction measurement technologies may be categorized as follows:
(a) High speed friction measuring devices: the types of devices within this category include: (i) side-force testers; (ii) fixed-slip testers; (iii) locked-wheel testers, and; (iv) variable slip testers.
(b) Low speed or spot friction measuring devices: the equipment within this category includes: (i) instruments to measure stopping distance measurement; (ii) devices to measure deceleration rate, and; (iii) Portable testers.
2.1 Overview and Summary Comparisons
2.1.1 High Speed Pavement Friction Test Methods
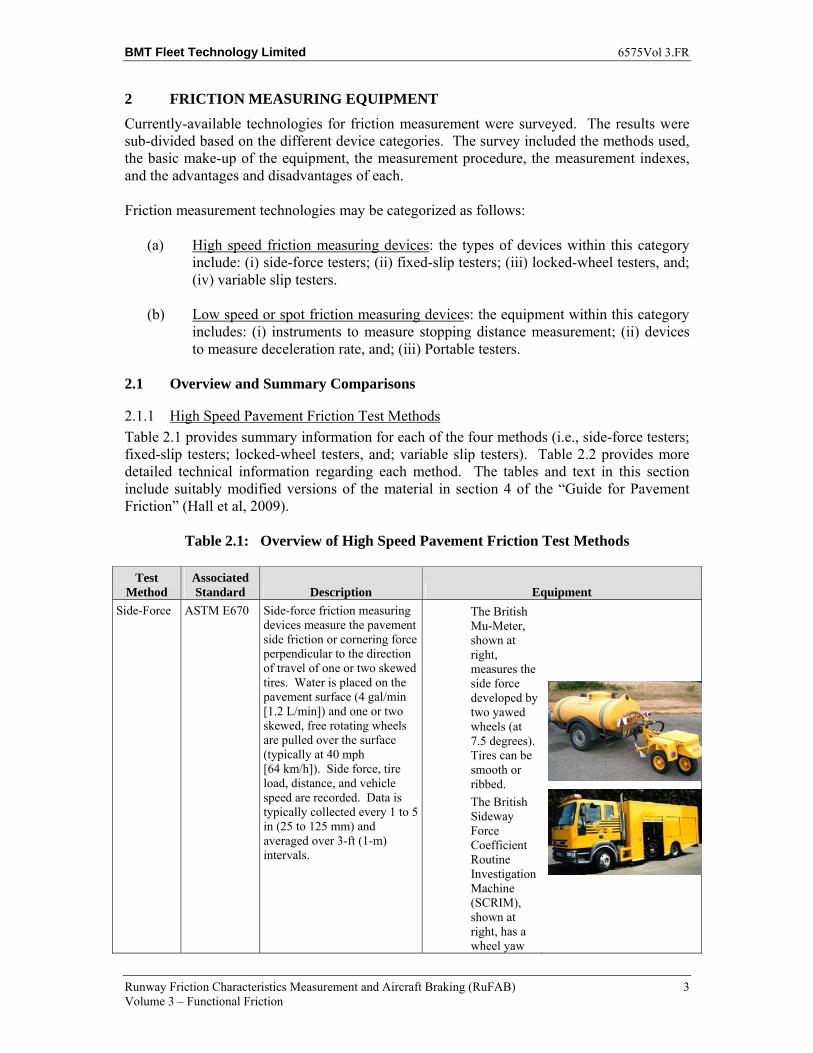
Table 2.1 provides summary information for each of the four methods (i.e., side-force testers; fixed-slip testers; locked-wheel testers, and; variable slip testers). Table 2.2 provides more detailed technical information regarding each method. The tables and text in this section include suitably modified versions of the material in section 4 of the “Guide for Pavement Friction” (Hall et al, 2009).
Table 2.1: Overview of High Speed Pavement Friction Test Methods
Test Method
Associated Standard Description Equipment
Side-Force ASTM E670 Side-force friction measuring devices measure the pavement side friction or cornering force perpendicular to the direction of travel of one or two skewed tires. Water is placed on the pavement surface (4 gal/min [1.2 L/min]) and one or two skewed, free rotating wheels are pulled over the surface (typically at 40 mph [64 km/h]). Side force, tire load, distance, and vehicle speed are recorded. Data is typically collected every 1 to 5 in (25 to 125 mm) and averaged over 3-ft (1-m) intervals.
The British Mu-Meter, shown at right, measures the side force developed by two yawed wheels (at 7.5 degrees). Tires can be smooth or ribbed.
The British Sideway Force Coefficient Routine Investigation Machine (SCRIM), shown at right, has a wheel yaw
BMT Fleet Technology Limited 6575Vol 3.FR
Runway Friction Characteristics Measurement and Aircraft Braking (RuFAB) 4 Volume 3 – Functional Friction
Test Method
Associated Standard Description Equipment
angle of 20 degrees.
Fixed-Slip ASTM E274 Fixed-slip devices measure the rotational resistance of smooth tires slipping at a constant slip speed (12 to 20 percent). Water (0.02 in [0.5 mm] thick) is applied in front of a retracting tire mounted on a trailer or vehicle typically traveling 40 mph [64 km/h]. Test tire rotation is inhibited to a percentage of the vehicle speed by a chain or belt mechanism or a hydraulic braking system. Wheel loads and frictional forces are measured by force transducers or tension and torque measuring devices. Data are typically collected every 1 to 5 in (25 to 125 mm) and averaged over 3-ft (1-m) intervals.
Roadway and Runway Friction Testers (RFTs) shown at right.
Airport Surface Friction Tester (ASFT), shown at right.
Saab Friction Tester (SFT), shown at right.
U.K. Griptester, shown at right.
Finland BV-11.
Road Analyzer and Recorder (ROAR).
ASTM E1551 specifies the test tire suitable for use in fixed-slip devices.
Variable-Slip
ASTM E1859
Variable-slip devices measure friction as a function of slip (0 to 100 percent) between the wheel and the highway surface. Water (0.02 in [0.5 mm] thick) is applied to the pavement surface and the wheel is allowed to rotate freely. Gradually the test wheel speed is reduced and the vehicle speed, travel distance, tire rotational speed, wheel load, and frictional force are collected at 0.1-in (2.5-mm) intervals or less. Raw data are recorded for later filtering, smoothing, and reporting.
French IMAG.
Norwegian Norsemeter RUNAR, shown at right.
ROAR and SALTAR systems.
BMT Fleet Technology Limited 6575Vol 3.FR
Runway Friction Characteristics Measurement and Aircraft Braking (RuFAB) 5 Volume 3 – Functional Friction
Test Method
Associated Standard Description Equipment
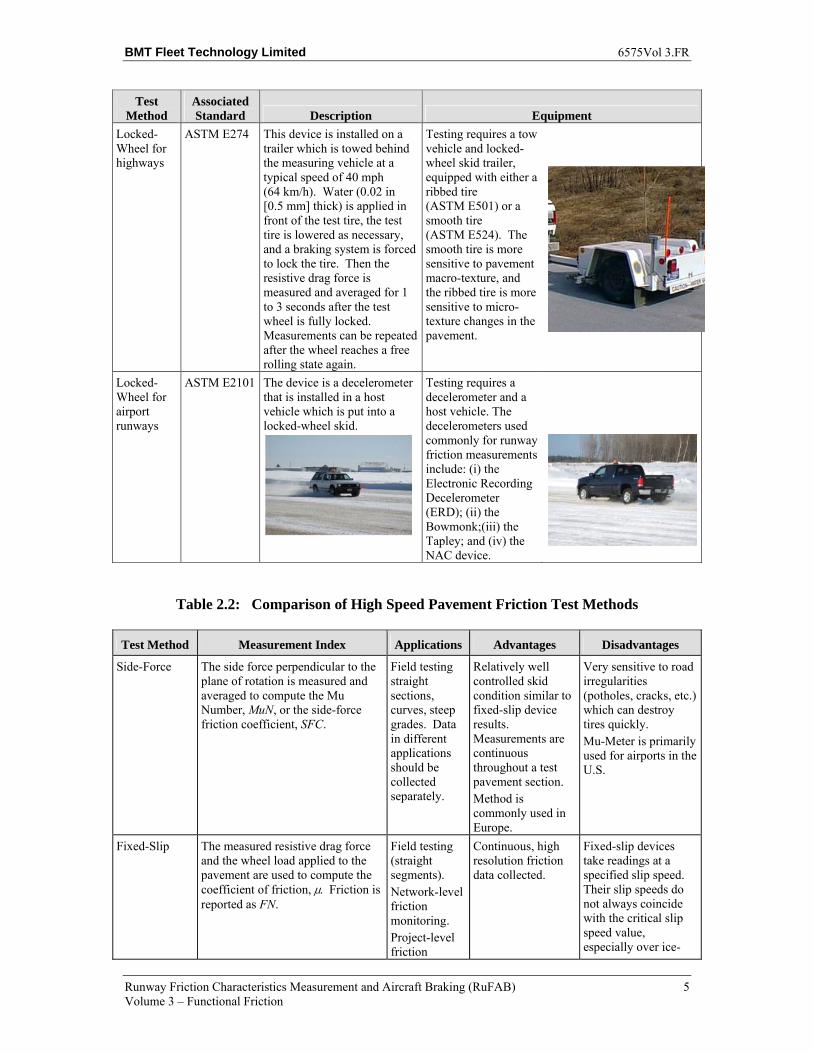
Locked-Wheel for highways
ASTM E274 This device is installed on a trailer which is towed behind the measuring vehicle at a typical speed of 40 mph (64 km/h). Water (0.02 in [0.5 mm] thick) is applied in front of the test tire, the test tire is lowered as necessary, and a braking system is forced to lock the tire. Then the resistive drag force is measured and averaged for 1 to 3 seconds after the test wheel is fully locked. Measurements can be repeated after the wheel reaches a free rolling state again.
Testing requires a tow vehicle and locked-wheel skid trailer, equipped with either a ribbed tire (ASTM E501) or a smooth tire (ASTM E524). The smooth tire is more sensitive to pavement macro-texture, and the ribbed tire is more sensitive to micro-texture changes in the pavement.
Locked-Wheel for airport runways
ASTM E2101 The device is a decelerometer that is installed in a host vehicle which is put into a locked-wheel skid.
Testing requires a decelerometer and a host vehicle. The decelerometers used commonly for runway friction measurements include: (i) the Electronic Recording Decelerometer (ERD); (ii) the Bowmonk;(iii) the Tapley; and (iv) the NAC device.
Table 2.2: Comparison of High Speed Pavement Friction Test Methods
Test Method Measurement Index Applications Advantages Disadvantages
Side-Force The side force perpendicular to the plane of rotation is measured and averaged to compute the Mu Number, MuN, or the side-force friction coefficient, SFC.
Field testing straight sections, curves, steep grades. Data in different applications should be collected separately.
Relatively well controlled skid condition similar to fixed-slip device results. Measurements are continuous throughout a test pavement section. Method is commonly used in Europe.
Very sensitive to road irregularities (potholes, cracks, etc.) which can destroy tires quickly. Mu-Meter is primarily used for airports in the U.S.
Fixed-Slip The measured resistive drag force and the wheel load applied to the pavement are used to compute the coefficient of friction, μ. Friction is reported as FN.
Field testing (straight segments). Network-level friction monitoring. Project-level friction
Continuous, high resolution friction data collected.
Fixed-slip devices take readings at a specified slip speed. Their slip speeds do not always coincide with the critical slip speed value, especially over ice-
BMT Fleet Technology Limited 6575Vol 3.FR
Runway Friction Characteristics Measurement and Aircraft Braking (RuFAB) 6 Volume 3 – Functional Friction
Test Method Measurement Index Applications Advantages Disadvantages
monitoring. and snow-covered surfaces. Uses large amounts of water in continuous mode. Requires skilful data reduction.
Variable-Slip When used for variable-slip measurements, the system provides a chart of the relationship between slip friction number and slip speed. The resulting indices are as follows:
Longitudinal slip friction number
Peak slip friction number
Critical slip ratio
Slip ratio
Slip to skid friction number
Estimated friction number
Rado shape factor When used for locked-wheel measurements, the system provides friction number (µ) values.
Field testing (straight or curved segments). Network-level friction monitoring. Project-level friction monitoring.
Can provide continuously any desired fixed or variable slip friction results. Can provide the Rado shape factor for detailed evaluation.
Large, complex equipment with high maintenance costs and complex data processing and analysis needs. Uses large amounts of water in continuous mode.
Locked-Wheel, for either highway use or airport use
The measured resistive drag force and the wheel load applied to the pavement are used to compute the coefficient of friction, μ. Friction is reported as friction number (FN) or skid number (SN), which is computed as follows:
WF
FFN 100100 == μ
where: FN = Friction number at the
measured speed. µ = Coefficient of friction. F = Tractive force applied to the
tire. Fn = Vertical load applied to the
tire.
Field testing (straight segments). Network-level friction monitoring.
Highways: Well developed and very widely used in the U.S. More than 40 states use locked-wheel devices. Systems are user friendly, relatively simple, and not time consuming. Airports: Decelerometers are commonly used for operational friction measurements in winter in several countries including winter in Canada, USA and France.
Highways: Can only be used on straight segments (no curves, T-sections, or roundabouts). Can miss slippery spots because measurements are intermittent. Airports: Decelerometers are only considered to be reliable on “solid” surfaces, such as compacted snow or ice, or on fluid-type surfaces (wet snow, slush, loose snow, etc) of limited depth. They are spot measurements.
BMT Fleet Technology Limited 6575Vol 3.FR
Runway Friction Characteristics Measurement and Aircraft Braking (RuFAB) 7 Volume 3 – Functional Friction
2.1.2 Low Speed or Spot Friction Measurement Techniques
These are reviewed in Table 2.3. The tables and text in this section include suitably modified versions of the material in section 4 of the “Guide for Pavement Friction” (Hall et al, 2009).
Table 2.3: Overview of Low Speed or Spot Friction Measurement Methods
Test Method Associated Standard
Description Equipment
Stopping Distance Measurement
ASTM E445 The pavement surface is sprayed with water until saturated. A vehicle is driven at a constant speed (40 mph [64 km/h] specified) over the surface. The wheels are locked, and the distance the vehicle travels while reaching a full stop is measured. Alternatively, different speeds and a fully engaged Antilock Braking System (ABS) have been used.
A passenger car or light truck (at least 3,200 lb [preferably equipped with a heavy-duty suspension system]) is specified. The braking system should be capable of full and sustained lockup. Tires should be ASTM E501 ribbed design.
Deceleration Rate Measurement
ASTM E2101 Testing is typically done in winter contaminated conditions. While traveling at standard speed (20 to 30 mph [32 to 48 km/h]), the brakes are applied to lock the wheels until deceleration rates can be measured. The deceleration rate is recorded for friction computation.
Mechanical or electronic equipment, shown at right, is installed on any vehicle to measure and record deceleration rate during stopping.
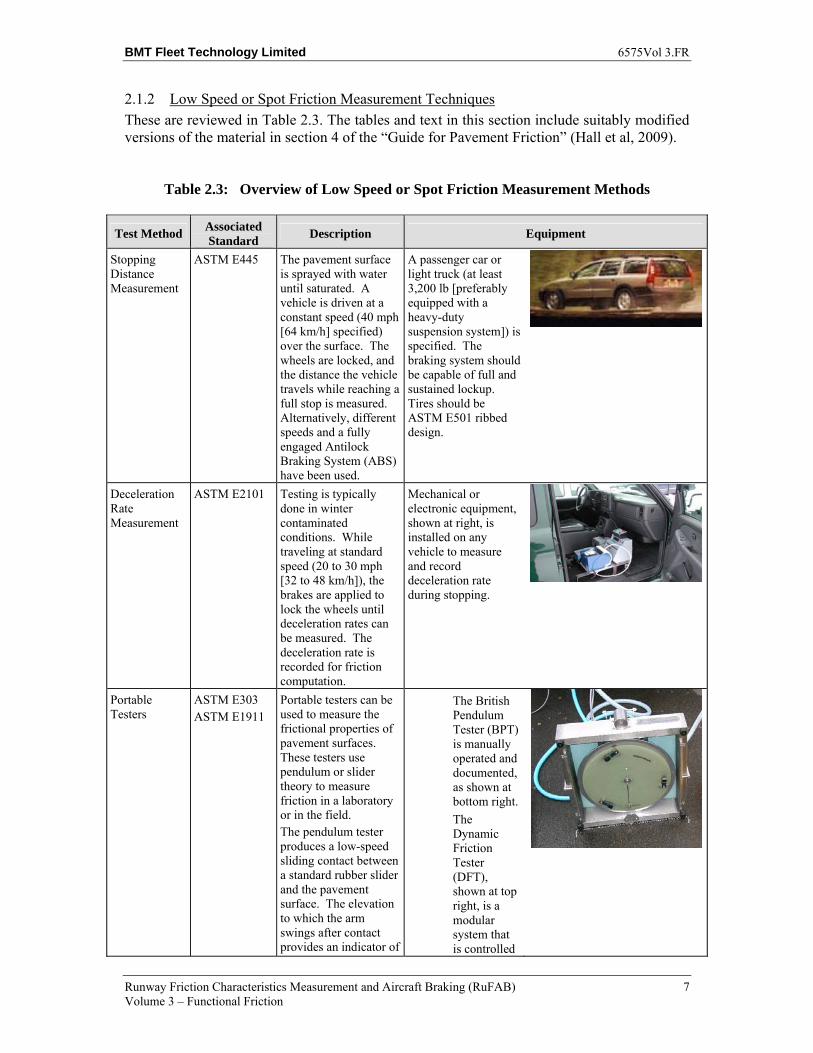
Portable Testers
ASTM E303 ASTM E1911
Portable testers can be used to measure the frictional properties of pavement surfaces. These testers use pendulum or slider theory to measure friction in a laboratory or in the field. The pendulum tester produces a low-speed sliding contact between a standard rubber slider and the pavement surface. The elevation to which the arm swings after contact provides an indicator of
The British Pendulum Tester (BPT) is manually operated and documented, as shown at bottom right.
The Dynamic Friction Tester (DFT), shown at top right, is a modular system that is controlled
BMT Fleet Technology Limited 6575Vol 3.FR
Runway Friction Characteristics Measurement and Aircraft Braking (RuFAB) 8 Volume 3 – Functional Friction
Test Method Associated Standard
Description Equipment
the frictional properties. Data from five readings are typically collected and recorded by hand. The dynamic friction tester measures the torque necessary To rotate three small, spring-loaded, rubber pads in a circular path over the pavement surface at speeds from 3 to 55 mph (5 to 89 km/h). Water is applied at 0.95 gal/min (3.6 L/min) during testing. Rotational speed, rotational torque, and downward load are measured and recorded electronically.
electronically. Results are typically recorded at 12, 24, 36, and 48 mph 20, 40, 60, and 80 km/h), and the speed, friction relationship can be plotted. It fits in the trunk of a car and is accompanied by a water tank and portable computer.
2.2 Detailed Information for High Speed Friction Measuring Devices
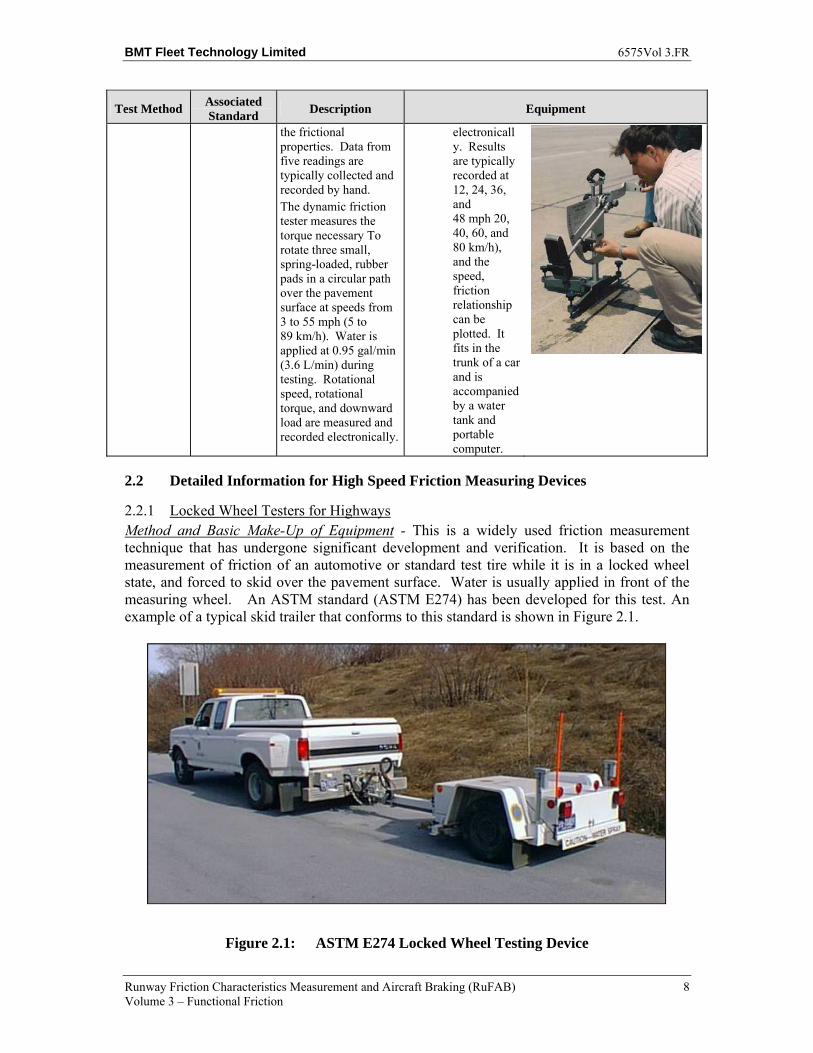
2.2.1 Locked Wheel Testers for Highways Method and Basic Make-Up of Equipment - This is a widely used friction measurement technique that has undergone significant development and verification. It is based on the measurement of friction of an automotive or standard test tire while it is in a locked wheel state, and forced to skid over the pavement surface. Water is usually applied in front of the measuring wheel. An ASTM standard (ASTM E274) has been developed for this test. An example of a typical skid trailer that conforms to this standard is shown in Figure 2.1.
Figure 2.1: ASTM E274 Locked Wheel Testing Device
BMT Fleet Technology Limited 6575Vol 3.FR
Runway Friction Characteristics Measurement and Aircraft Braking (RuFAB) 9 Volume 3 – Functional Friction
A specially designed braking system is installed on the measurement wheel capable of rapidly and repeatedly locking and releasing the measurement wheel. The system is equipped with an electronic bidirectional force measurement device measuring the resistive friction force and the load or normal force acting on the measurement tire. The measurement system is mounted on a standardized trailer or a large host vehicle. Usually a single-wheel pneumatic tire is mounted on the trailer or the host vehicle. Water is applied in front of the measuring wheel during testing such that the full wheel tread with plus half an inch on each side of the tire is covered with water. The water is applied to form a 0.02 in deep stable water film. For special tests and measurements on runways, the depth of the water film is 0.04 inches or 1 mm.
Both ribbed (ASTM E501) and smooth (ASTM E524) tires are available for pavement friction measurement. The two different tires are of the same size, rubber compound and pressure and differ only in the tire tread design. The ASTM E501 tire is a longitudinally grooved ribbed tire while the E524 is a blank tire with no tread design. The blank ASTM E524 tire is more sensitive to pavement macro-texture while the ribbed ASTM E501 tire only sensitive to micro-texture changes in the pavement.
Measurement Procedure - Similar measurement procedures are used for all locked wheel testers. The measurement wheel is lowered to the ground, if it is not constantly rolling on the surface. When the wheel is in a full rolling state, which usually takes 2-3 seconds or at least ten full rotations after lowering, water is applied in front of the measurement tire. After the water flow is stable, the brake system is triggered to lock the wheel. Simultaneously, the data acquisition is started to collect the raw measurement data. Once the wheel is fully locked and the necessary amount of locked wheel friction data is collected, which takes usually about two to three seconds after the start, the wheel is released and the data processed. The measurement can be repeated after the wheel reaches a free rolling state again. Measurement Indices - The friction is outputted in terms of a Friction Number (ASTM) or a Skid Number (AASHTO). It is determined by averaging the measured friction force divided by the normal load (equation 2.1) during which the wheel is in a locked state for usually 2 seconds or more. Friction is reported as FN, which is computed as follows:
W
FFN 100100 == μ
[2.1]
where: FN = friction number at the measured speed µ = coefficient of friction F= tractive force applied to the tire W = vertical load applied to the tire Advantages and Disadvantages - The locked wheel method has the disadvantage that it can be used only on a road geometry that is free of excessive geometric features, such as high curvature bends, T-sections or roundabouts. Furthermore, it is a spot measurement and can thus miss a slippery spot. Because of these limitations, this method usually does not give the resolution required by project-level standards. The advantages of the measurement method
BMT Fleet Technology Limited 6575Vol 3.FR
Runway Friction Characteristics Measurement and Aircraft Braking (RuFAB) 10 Volume 3 – Functional Friction
and device are that it is a very well-developed and widely-used technique. It is very commonly used in USA with the result that many users (e.g., State highway departments) have an extensive database of readings. In North America, the most utilized friction measurement method using this approach is the ASTM E274 skid trailer, which is used by a large majority of state highway agencies. (More than 40 states use this method). The technique is proven and the devices have designs that are robust and user-friendly. Both the measurement and the data processing is relatively simple and not time consuming. Most of the devices can make measurements for a long period of time, with the test duration being usually limited only by the amount of water carried on the host vehicle. The technique is very useful for network level monitoring measurements. Devices in Use - The devices used in the USA are the Dynatest and E274 skid trailers produced by ICC. Other devices include the Stuttgarter Reibungs-Messer (SRM, Germany, Switzerland, Austria).
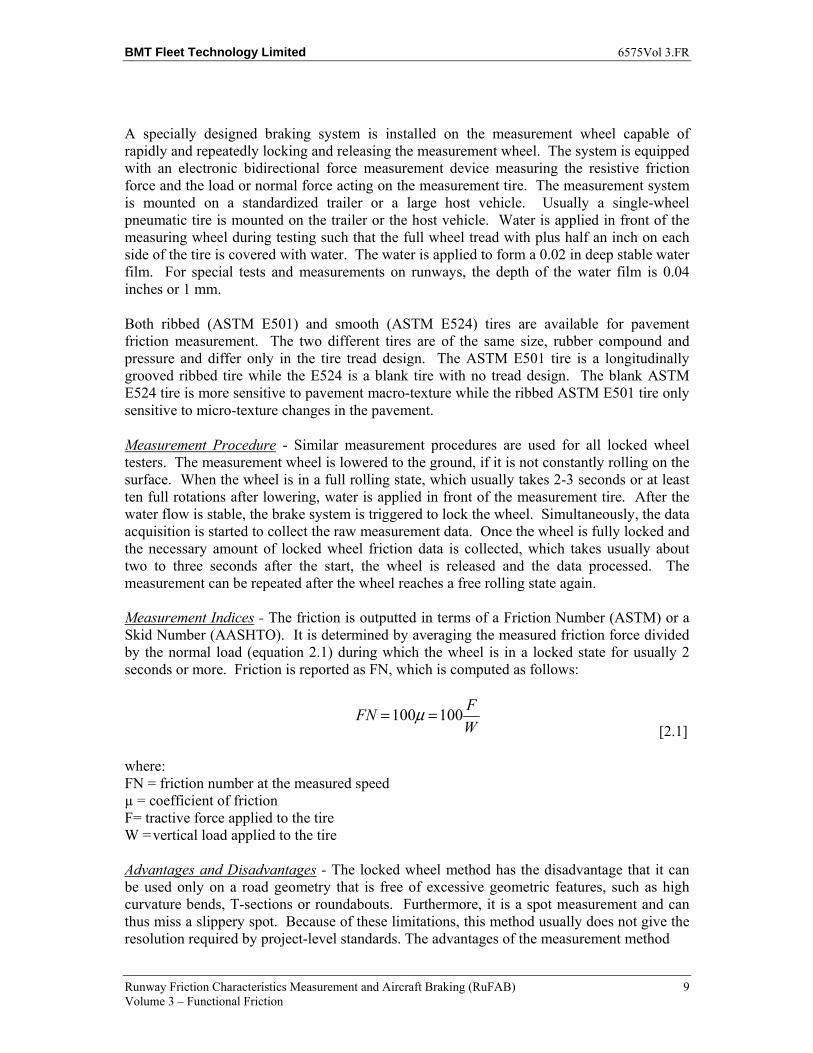
2.2.2 Fixed Slip Devices Method and Basic Make-Up of Equipment - Continuous fixed-slip devices, or Continuous Friction Measurement Equipment (CFMEs) measure the braking force of a standardized smooth or ribbed tire when it is slipped at a constant percentage of the forward speed of the host vehicle or trailer. Water is usually applied in front of the measurement tire. The large majority of fixed slip devices utilize the same mechanical design with a few exceptions. The most common design for these devices utilizes a chain or belt drive mechanism to restrain the measurement wheel from free roll. This is achieved by mechanically coupling the measurement wheel to an axle of two driving wheels with a set of chain and sprockets. The load on the driving wheels is customarily five to ten times as much as on the measurement wheel, thus making the driving wheels powerful enough to exert the restriction on the measuring wheel. The sprockets are designed such that calculating with the diameters of the driving and measuring wheels, the measurement wheel is forced to rotate a certain percentage less than it would if it were free rolling. The driving and measurement wheels are usually designed into a special trailer where the driving axle and wheels are the trailer’s main wheels while the measurement wheel trails behind the center line of the trailer. A commonly used device is illustrated in Figure 2.2.
The devices used mainly at airports, and by a few road authorities too, utilize the same basic principle and design except the system is integrated into a passenger vehicle. In this case, the driving wheels are the un-powered rear wheels of the vehicle and the measurement wheel is integrated under the back of the vehicle behind the rear suspension. The measurement systems are equipped with either a set of force transducers to sense the wheel load and the frictional forces or a set of force measurement and chain tension measurement transducers that measure the wheel load and the torque caused by the frictional forces in the chain drive.
A few new fixed-slip devices achieve constant, fixed slippage of the measurement tire using sophisticated electronic-over-hydraulic controlled braking mechanisms. The water is applied to form a 0.02 in deep stable water film. For special tests and for measurements on runways, the depth of the water film depth is typically set at 0.04 in or 1 mm although there are variations, as described in Volume 2 of this report series.
BMT Fleet Technology Limited 6575Vol 3.FR
Runway Friction Characteristics Measurement and Aircraft Braking (RuFAB) 11 Volume 3 – Functional Friction
Figure 2.2: GripTester Fixed-Slip Friction Testing Device
Several devices have been developed in different countries that use these methods. The majority of equipment is designed for a pre-determined and unchangeable slip ratio that typically differs for each of the devices. The percent slip designed into the measurement equipment is usually set at around 12 to 20 percent.
Measurement Procedure - The measurement procedures for all fixed slip devices are quite similar. To start a measurement, the measuring wheel is lowered to the ground from its at-rest position, in which it does not contact the pavement. This is necessary as the measurement wheel is mechanically coupled to the driving axle, and having it on the ground constantly would destroy the tire quickly. Water is applied in front of the measurement tire immediately before it is lowered onto the ground, and after a minimum of ten full rotations of the test tire, the measurement can begin. The data acquisition system is activated to start collecting data either on operator command or using an automatic trigger signal from GPS or road side features. Data, which consist of vehicle speed, measurement wheel load, frictional force or torque, are collected at a relatively fine distance scale of every 1 to 5 inches, and averaged over a longer pavement length of commonly, 1 meter or 3 feet. The coefficient of friction is calculated over the averaged interval and stored with other measured data that usually include speed and temperature and optionally, surface temperature and water flow. Measurement Indices - Measurements are reported as the coefficient of friction and as the FN (equation 2.1).
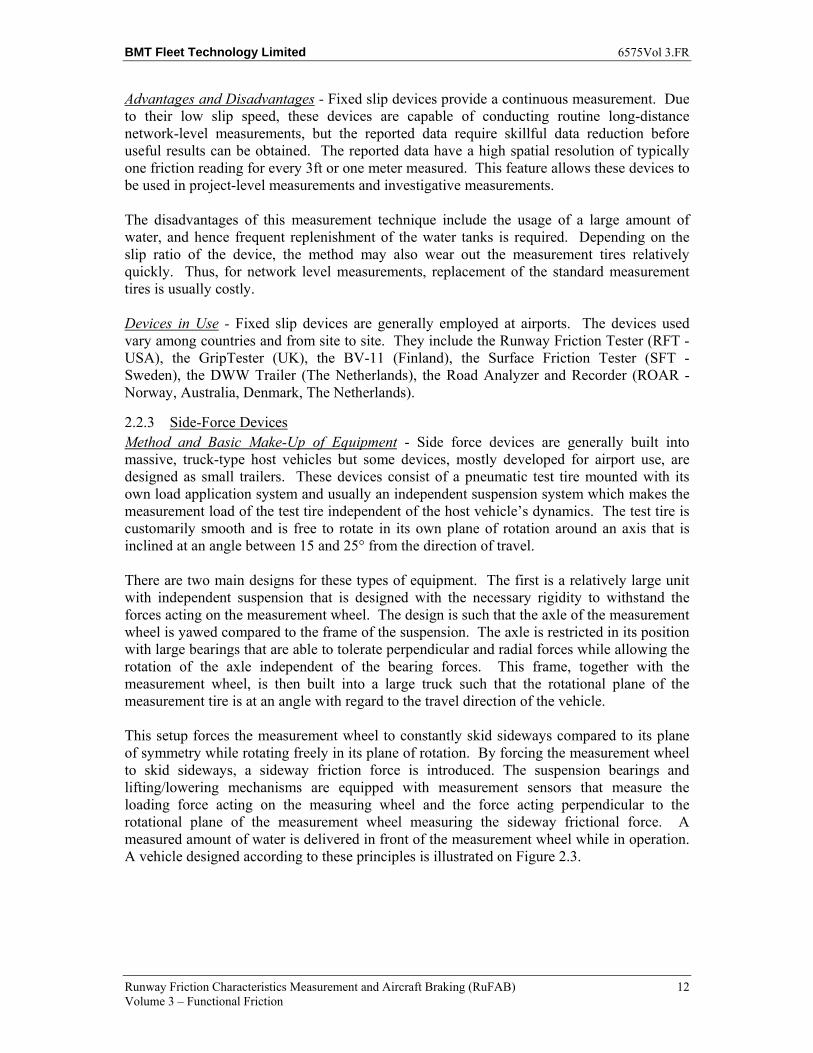
BMT Fleet Technology Limited 6575Vol 3.FR
Runway Friction Characteristics Measurement and Aircraft Braking (RuFAB) 12 Volume 3 – Functional Friction
Advantages and Disadvantages - Fixed slip devices provide a continuous measurement. Due to their low slip speed, these devices are capable of conducting routine long-distance network-level measurements, but the reported data require skillful data reduction before useful results can be obtained. The reported data have a high spatial resolution of typically one friction reading for every 3ft or one meter measured. This feature allows these devices to be used in project-level measurements and investigative measurements. The disadvantages of this measurement technique include the usage of a large amount of water, and hence frequent replenishment of the water tanks is required. Depending on the slip ratio of the device, the method may also wear out the measurement tires relatively quickly. Thus, for network level measurements, replacement of the standard measurement tires is usually costly. Devices in Use - Fixed slip devices are generally employed at airports. The devices used vary among countries and from site to site. They include the Runway Friction Tester (RFT - USA), the GripTester (UK), the BV-11 (Finland), the Surface Friction Tester (SFT - Sweden), the DWW Trailer (The Netherlands), the Road Analyzer and Recorder (ROAR - Norway, Australia, Denmark, The Netherlands).
2.2.3 Side-Force Devices Method and Basic Make-Up of Equipment - Side force devices are generally built into massive, truck-type host vehicles but some devices, mostly developed for airport use, are designed as small trailers. These devices consist of a pneumatic test tire mounted with its own load application system and usually an independent suspension system which makes the measurement load of the test tire independent of the host vehicle’s dynamics. The test tire is customarily smooth and is free to rotate in its own plane of rotation around an axis that is inclined at an angle between 15 and 25° from the direction of travel. There are two main designs for these types of equipment. The first is a relatively large unit with independent suspension that is designed with the necessary rigidity to withstand the forces acting on the measurement wheel. The design is such that the axle of the measurement wheel is yawed compared to the frame of the suspension. The axle is restricted in its position with large bearings that are able to tolerate perpendicular and radial forces while allowing the rotation of the axle independent of the bearing forces. This frame, together with the measurement wheel, is then built into a large truck such that the rotational plane of the measurement tire is at an angle with regard to the travel direction of the vehicle. This setup forces the measurement wheel to constantly skid sideways compared to its plane of symmetry while rotating freely in its plane of rotation. By forcing the measurement wheel to skid sideways, a sideway friction force is introduced. The suspension bearings and lifting/lowering mechanisms are equipped with measurement sensors that measure the loading force acting on the measuring wheel and the force acting perpendicular to the rotational plane of the measurement wheel measuring the sideway frictional force. A measured amount of water is delivered in front of the measurement wheel while in operation. A vehicle designed according to these principles is illustrated on Figure 2.3.
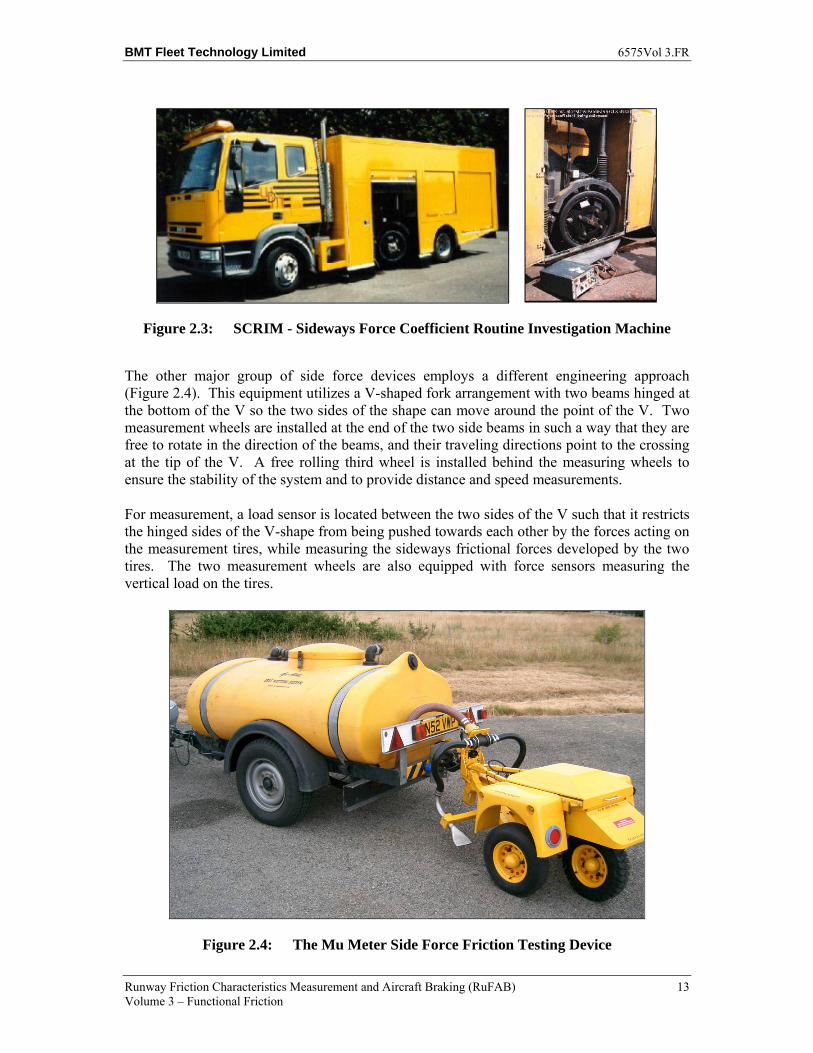
BMT Fleet Technology Limited 6575Vol 3.FR
Runway Friction Characteristics Measurement and Aircraft Braking (RuFAB) 13 Volume 3 – Functional Friction
Figure 2.3: SCRIM - Sideways Force Coefficient Routine Investigation Machine
The other major group of side force devices employs a different engineering approach (Figure 2.4). This equipment utilizes a V-shaped fork arrangement with two beams hinged at the bottom of the V so the two sides of the shape can move around the point of the V. Two measurement wheels are installed at the end of the two side beams in such a way that they are free to rotate in the direction of the beams, and their traveling directions point to the crossing at the tip of the V. A free rolling third wheel is installed behind the measuring wheels to ensure the stability of the system and to provide distance and speed measurements.
For measurement, a load sensor is located between the two sides of the V such that it restricts the hinged sides of the V-shape from being pushed towards each other by the forces acting on the measurement tires, while measuring the sideways frictional forces developed by the two tires. The two measurement wheels are also equipped with force sensors measuring the vertical load on the tires.
Figure 2.4: The Mu Meter Side Force Friction Testing Device
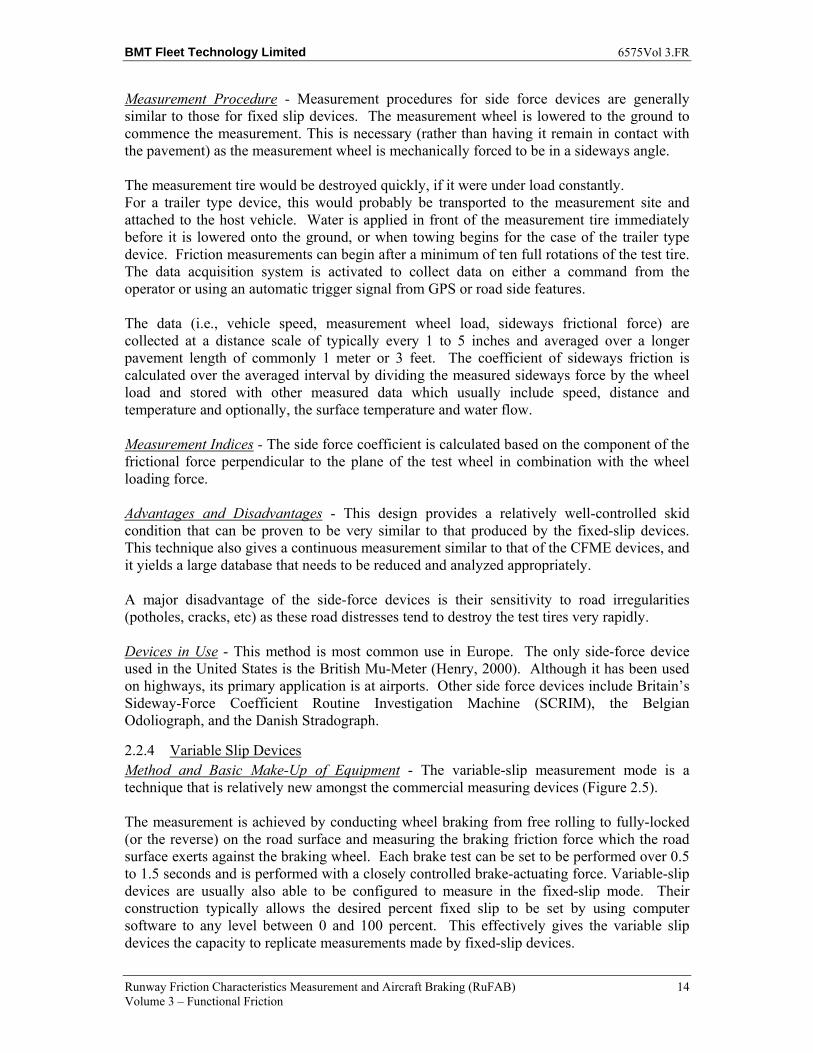
BMT Fleet Technology Limited 6575Vol 3.FR
Runway Friction Characteristics Measurement and Aircraft Braking (RuFAB) 14 Volume 3 – Functional Friction
Measurement Procedure - Measurement procedures for side force devices are generally similar to those for fixed slip devices. The measurement wheel is lowered to the ground to commence the measurement. This is necessary (rather than having it remain in contact with the pavement) as the measurement wheel is mechanically forced to be in a sideways angle. The measurement tire would be destroyed quickly, if it were under load constantly. For a trailer type device, this would probably be transported to the measurement site and attached to the host vehicle. Water is applied in front of the measurement tire immediately before it is lowered onto the ground, or when towing begins for the case of the trailer type device. Friction measurements can begin after a minimum of ten full rotations of the test tire. The data acquisition system is activated to collect data on either a command from the operator or using an automatic trigger signal from GPS or road side features. The data (i.e., vehicle speed, measurement wheel load, sideways frictional force) are collected at a distance scale of typically every 1 to 5 inches and averaged over a longer pavement length of commonly 1 meter or 3 feet. The coefficient of sideways friction is calculated over the averaged interval by dividing the measured sideways force by the wheel load and stored with other measured data which usually include speed, distance and temperature and optionally, the surface temperature and water flow. Measurement Indices - The side force coefficient is calculated based on the component of the frictional force perpendicular to the plane of the test wheel in combination with the wheel loading force. Advantages and Disadvantages - This design provides a relatively well-controlled skid condition that can be proven to be very similar to that produced by the fixed-slip devices. This technique also gives a continuous measurement similar to that of the CFME devices, and it yields a large database that needs to be reduced and analyzed appropriately. A major disadvantage of the side-force devices is their sensitivity to road irregularities (potholes, cracks, etc) as these road distresses tend to destroy the test tires very rapidly. Devices in Use - This method is most common use in Europe. The only side-force device used in the United States is the British Mu-Meter (Henry, 2000). Although it has been used on highways, its primary application is at airports. Other side force devices include Britain’s Sideway-Force Coefficient Routine Investigation Machine (SCRIM), the Belgian Odoliograph, and the Danish Stradograph.
2.2.4 Variable Slip Devices Method and Basic Make-Up of Equipment - The variable-slip measurement mode is a technique that is relatively new amongst the commercial measuring devices (Figure 2.5). The measurement is achieved by conducting wheel braking from free rolling to fully-locked (or the reverse) on the road surface and measuring the braking friction force which the road surface exerts against the braking wheel. Each brake test can be set to be performed over 0.5 to 1.5 seconds and is performed with a closely controlled brake-actuating force. Variable-slip devices are usually also able to be configured to measure in the fixed-slip mode. Their construction typically allows the desired percent fixed slip to be set by using computer software to any level between 0 and 100 percent. This effectively gives the variable slip devices the capacity to replicate measurements made by fixed-slip devices.
BMT Fleet Technology Limited 6575Vol 3.FR
Runway Friction Characteristics Measurement and Aircraft Braking (RuFAB) 15 Volume 3 – Functional Friction
Figure 2.5: The RUNAR Variable Slip Friction Testing Device
The designs of the variable slip devices on the market today are generally based on hydraulic systems although very recently, an electrically-braked system has appeared. There are two different hydraulic designs available at present. One is based on a self-sustaining system with no external hydraulic power needs. This design is based on the simple principle of attaching a hydraulic pump to the rotating shaft of the measurement wheel. When the wheel is rotating on the surface, it will pump oil from a hydraulic reservoir by the pump through a changeable orifice back to the oil tank. By changing the size of the orifice, the amount of oil pumped through can be changed. If the orifice is completely closed, no oil can pass and in turn the pump cannot turn thereby causing the measuring wheel to be locked. On the other hand, if the orifice is completely open, the oil passes through unrestrained, which causes the measuring wheel to turn freely. By controlling the orifice, any degree of slippage of the measurement tire can be achieved using a high speed electronic control system. The friction force forcing the oil through the reduced orifice will introduce heat into the system which is dissipated through air coolers. This system is usually built into trailers containing a lift/lower mechanism for the measurement wheel, oil reservoir, control and data acquisition system, water tank and water delivery system.
The other design uses two variable displacement hydraulic pumps to achieve the same effect. One pump, i.e., the driving pump, is attached to the rear wheels of a large host vehicle while the other pump is built onto the shaft of the measuring wheel. The two pumps are connected with high pressure hydraulic hoses. By setting the displacement of the pumps, the amount of oil going through the system at a given speed can be set between wide limits. By choosing the right combination of settings on the driver and measurement wheel pump, the measurement tire can be forced to any slip ratio by a high speed electronic control system.
For both designs, a load is applied to the measurement wheel by weight or hydraulic cylinders. A measured amount of 0.02 inches (0.5 mm) or 0.04 inches (1 mm) water is applied in front of the measurement wheel. Measurement Procedure - The measurement procedures for the variable slip friction measurement devices are quite different to those utilized by other devices. Even though all devices allow free rotation of the measurement wheel these devices are equipped with
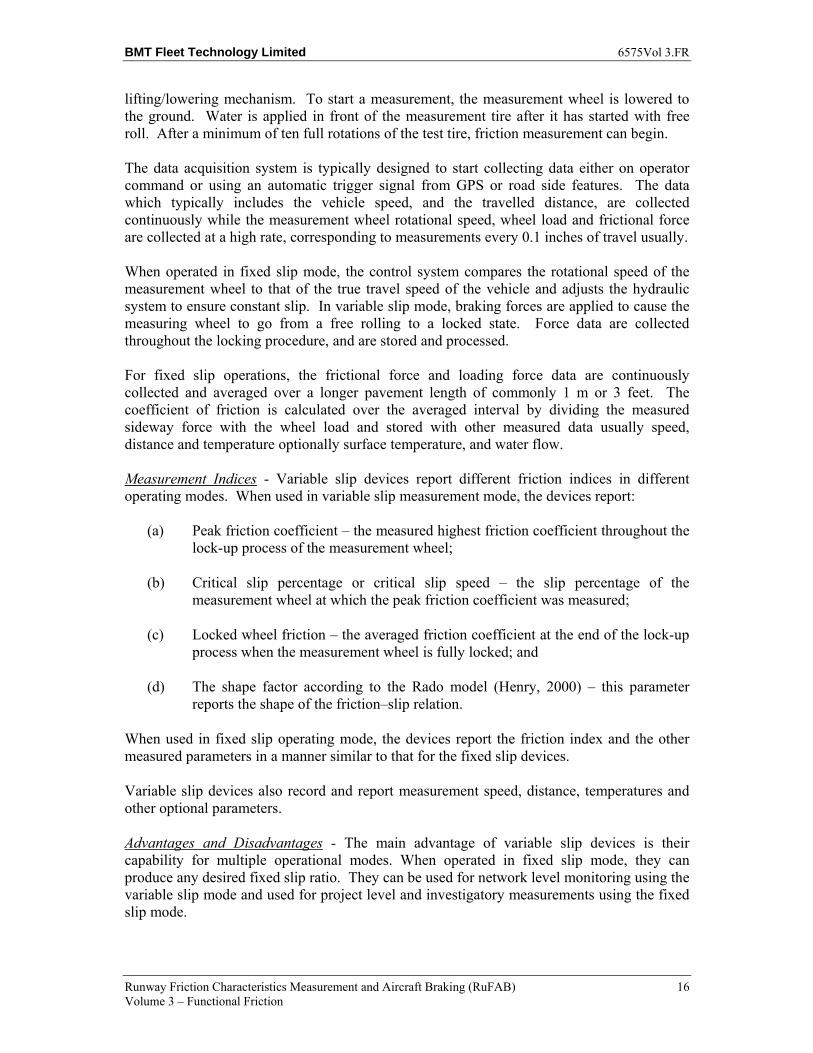
BMT Fleet Technology Limited 6575Vol 3.FR
Runway Friction Characteristics Measurement and Aircraft Braking (RuFAB) 16 Volume 3 – Functional Friction
lifting/lowering mechanism. To start a measurement, the measurement wheel is lowered to the ground. Water is applied in front of the measurement tire after it has started with free roll. After a minimum of ten full rotations of the test tire, friction measurement can begin. The data acquisition system is typically designed to start collecting data either on operator command or using an automatic trigger signal from GPS or road side features. The data which typically includes the vehicle speed, and the travelled distance, are collected continuously while the measurement wheel rotational speed, wheel load and frictional force are collected at a high rate, corresponding to measurements every 0.1 inches of travel usually. When operated in fixed slip mode, the control system compares the rotational speed of the measurement wheel to that of the true travel speed of the vehicle and adjusts the hydraulic system to ensure constant slip. In variable slip mode, braking forces are applied to cause the measuring wheel to go from a free rolling to a locked state. Force data are collected throughout the locking procedure, and are stored and processed. For fixed slip operations, the frictional force and loading force data are continuously collected and averaged over a longer pavement length of commonly 1 m or 3 feet. The coefficient of friction is calculated over the averaged interval by dividing the measured sideway force with the wheel load and stored with other measured data usually speed, distance and temperature optionally surface temperature, and water flow. Measurement Indices - Variable slip devices report different friction indices in different operating modes. When used in variable slip measurement mode, the devices report:
(a) Peak friction coefficient – the measured highest friction coefficient throughout the lock-up process of the measurement wheel;
(b) Critical slip percentage or critical slip speed – the slip percentage of the measurement wheel at which the peak friction coefficient was measured;
(c) Locked wheel friction – the averaged friction coefficient at the end of the lock-up process when the measurement wheel is fully locked; and
(d) The shape factor according to the Rado model (Henry, 2000) – this parameter reports the shape of the friction–slip relation.
When used in fixed slip operating mode, the devices report the friction index and the other measured parameters in a manner similar to that for the fixed slip devices.
Variable slip devices also record and report measurement speed, distance, temperatures and other optional parameters.
Advantages and Disadvantages - The main advantage of variable slip devices is their capability for multiple operational modes. When operated in fixed slip mode, they can produce any desired fixed slip ratio. They can be used for network level monitoring using the variable slip mode and used for project level and investigatory measurements using the fixed slip mode.
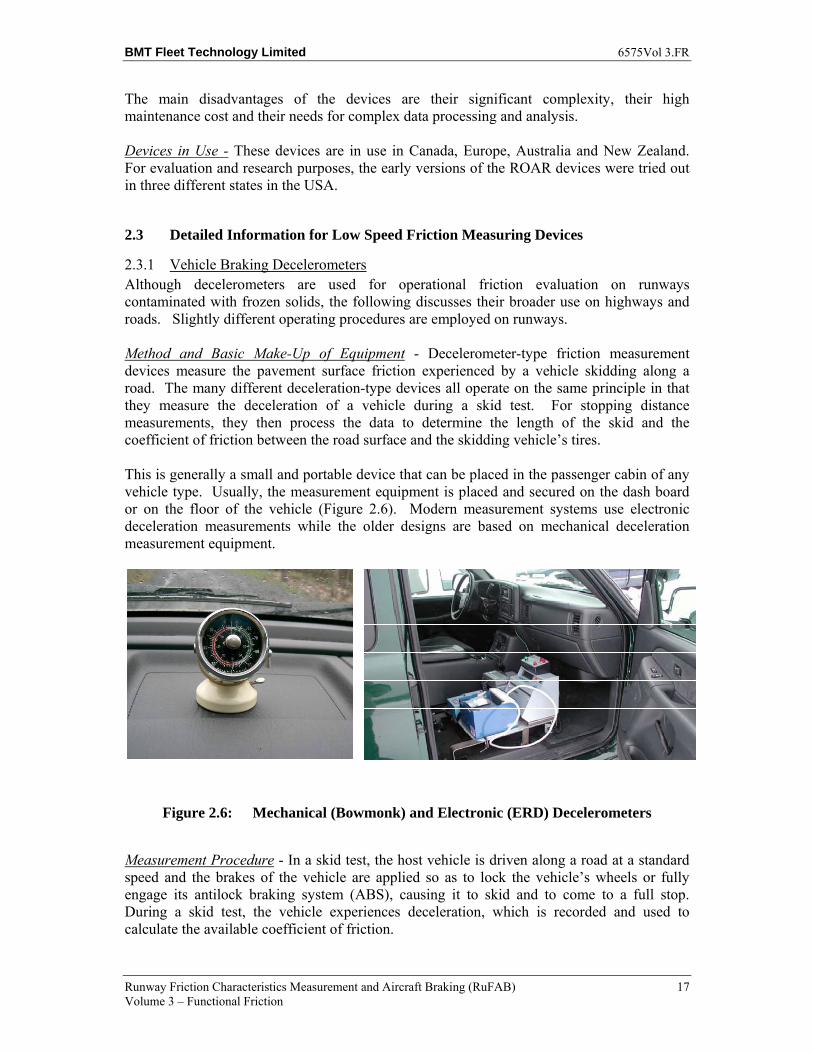
BMT Fleet Technology Limited 6575Vol 3.FR
Runway Friction Characteristics Measurement and Aircraft Braking (RuFAB) 17 Volume 3 – Functional Friction
The main disadvantages of the devices are their significant complexity, their high maintenance cost and their needs for complex data processing and analysis. Devices in Use - These devices are in use in Canada, Europe, Australia and New Zealand. For evaluation and research purposes, the early versions of the ROAR devices were tried out in three different states in the USA.
2.3 Detailed Information for Low Speed Friction Measuring Devices
2.3.1 Vehicle Braking Decelerometers Although decelerometers are used for operational friction evaluation on runways contaminated with frozen solids, the following discusses their broader use on highways and roads. Slightly different operating procedures are employed on runways. Method and Basic Make-Up of Equipment - Decelerometer-type friction measurement devices measure the pavement surface friction experienced by a vehicle skidding along a road. The many different deceleration-type devices all operate on the same principle in that they measure the deceleration of a vehicle during a skid test. For stopping distance measurements, they then process the data to determine the length of the skid and the coefficient of friction between the road surface and the skidding vehicle’s tires. This is generally a small and portable device that can be placed in the passenger cabin of any vehicle type. Usually, the measurement equipment is placed and secured on the dash board or on the floor of the vehicle (Figure 2.6). Modern measurement systems use electronic deceleration measurements while the older designs are based on mechanical deceleration measurement equipment.
Figure 2.6: Mechanical (Bowmonk) and Electronic (ERD) Decelerometers
Measurement Procedure - In a skid test, the host vehicle is driven along a road at a standard speed and the brakes of the vehicle are applied so as to lock the vehicle’s wheels or fully engage its antilock braking system (ABS), causing it to skid and to come to a full stop. During a skid test, the vehicle experiences deceleration, which is recorded and used to calculate the available coefficient of friction.
BMT Fleet Technology Limited 6575Vol 3.FR
Runway Friction Characteristics Measurement and Aircraft Braking (RuFAB) 18 Volume 3 – Functional Friction
Measurement Indices - The measurements usually include the peak friction that occurred during the measurement, the average coefficient of friction calculated through a braking cycle, and speed. The measured deceleration is converted to coefficient of friction, , by the following formula: = Measured deceleration/g [2.2]
where: g = the acceleration due to gravity.
Advantages and Disadvantages - The main advantages of decelerometer friction measurement devices are that they are usually small, portable, lightweight, and easy to install and remove from any vehicle. These devices are not used because of practical considerations for network level monitoring or project level testing. For highway and road applications, decelerometer-type devices are used mostly in accident investigation and require lane closure.
2.3.2 British Pendulum Tester Method and Basic Make-Up of Equipment - The British Pendulum Tester produces sliding contact between a rubber slider mounted on the swing arm of a pendulum tester and the test surface. It is a low-speed test in which the frictional resistance of the test material to the sliding of a standard rubber slider is measured. The rubber slider while pressed against the surface by a spring during a swing produces frictional forces that retard the rotation of the arm. This causes the upswing of the pendulum to be shortened to a degree that is related to the magnitude of the frictional forces. The apparatus consists of a tripod base where the swing arm of the pendulum is attached with bearings on the top section (Figure 2.7). The system is equipped with a quick release mechanism and a fixed scale. The moving pendulum arm pushes a needle in front of it which indicates the point at which maximum upswing of the arm is reached on the fixed scale. Measurement Procedure- The British Pendulum Tester is a hand-operated device with the data also being recorded manually. The measurement procedure begins by levelling the equipment above the test specimen or the test surface that is placed horizontally at the base of the tester. The pivot point of the pendulum is adjusted so that the sliding distance of the rubber slider on the test surface will cover a pre-selected length. Sufficient water is applied at the tested portion of the surface. The test begins with the pendulum arm being held horizontally before it is allowed to freefall under its own weight by the quick release mechanism. After sliding contact, the pendulum arm will continue to swing upwards until its velocity reaches zero. The needle indicates the maximum elevation of the upswing. The reading is recorded by hand. Usually five readings are averaged to calculate one measurement of the British Pendulum Tester.
BMT Fleet Technology Limited 6575Vol 3.FR
Runway Friction Characteristics Measurement and Aircraft Braking (RuFAB) 19 Volume 3 – Functional Friction
Figure 2.7: British Pendulum Tester Measurement Indices- The elevation at which the pendulum comes to a complete stop is calibrated to give a reading in BPN (British Pendulum Number). The BPN is a measure of the interface friction between the slider rubber and the test surface, and it has been used as an indicator of the friction level of the test material or surface. Advantages and Disadvantages- The British Pendulum Test, as described in ASTM E303, is probably the most widely used method in use today for laboratory and on-site spot measurements of pavement surface friction. The test result, reported as the British Pendulum Number (BPN), is often taken as a useful indirect measure of the micro-texture of the test material. Another important application of the British Pendulum Test is to measure the change in BPN of a paving material after it is subjected to wheel polishing treatment, as described in ASTM D3319. The documented disadvantages of this testing method are that the results are not generally reproducible, and they are subject to operator and wind errors. It is a spot measurement technique that is applicable for laboratory and research onsite measurements.
2.3.3 Dynamic Friction Tester Method and Basic Make-Up of Equipment- The Dynamic Friction Tester (DFT) uses the principle of measuring the necessary torque to turn three small rubber pads in a circular path on the measured surface with different speeds. The Dynamic Friction Tester consists of a horizontal spinning disk fitted with three spring-loaded rubber sliders which contact the paved surface. When this happens, the disks’ rotational speed decreases due to the friction generated between the sliders and the paved surface. A water supply unit delivers water to the paved surface being tested. The torque generated by the slider forces is measured during the spin down and then used to calculate the friction as a function of speed. The speed range is generally from 55 mph (90 km/h) down to 3 mph
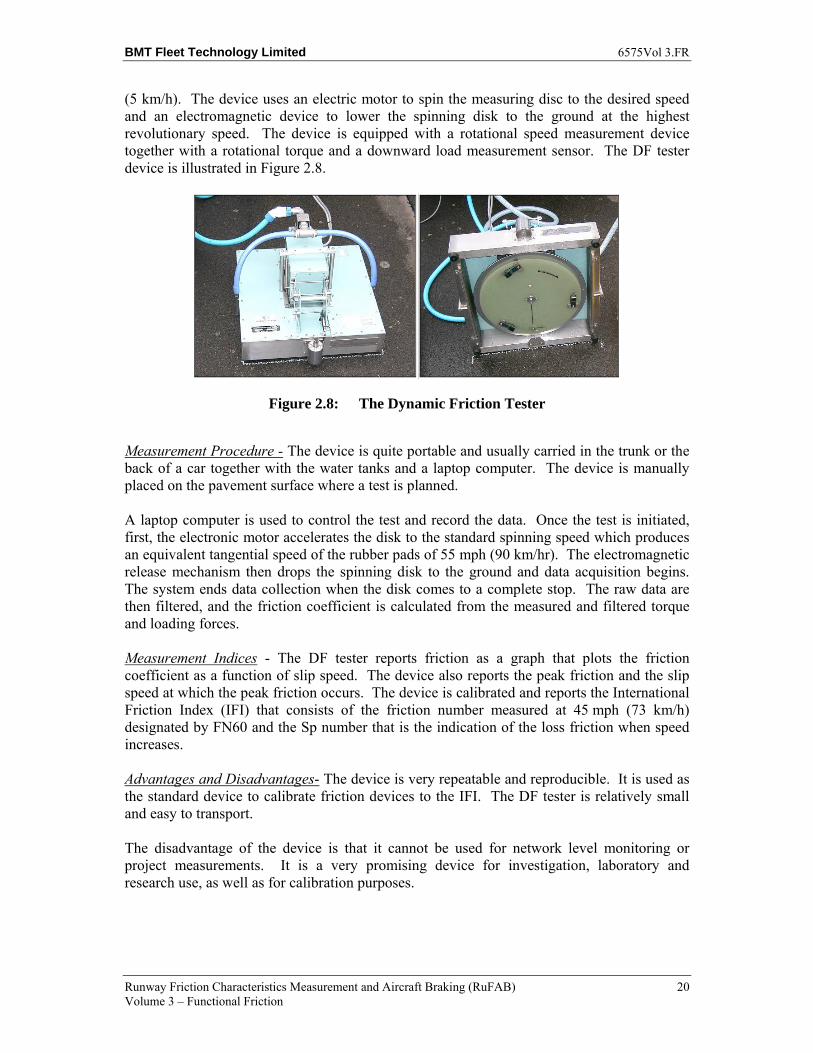
BMT Fleet Technology Limited 6575Vol 3.FR
Runway Friction Characteristics Measurement and Aircraft Braking (RuFAB) 20 Volume 3 – Functional Friction
(5 km/h). The device uses an electric motor to spin the measuring disc to the desired speed and an electromagnetic device to lower the spinning disk to the ground at the highest revolutionary speed. The device is equipped with a rotational speed measurement device together with a rotational torque and a downward load measurement sensor. The DF tester device is illustrated in Figure 2.8.
Figure 2.8: The Dynamic Friction Tester
Measurement Procedure - The device is quite portable and usually carried in the trunk or the back of a car together with the water tanks and a laptop computer. The device is manually placed on the pavement surface where a test is planned. A laptop computer is used to control the test and record the data. Once the test is initiated, first, the electronic motor accelerates the disk to the standard spinning speed which produces an equivalent tangential speed of the rubber pads of 55 mph (90 km/hr). The electromagnetic release mechanism then drops the spinning disk to the ground and data acquisition begins. The system ends data collection when the disk comes to a complete stop. The raw data are then filtered, and the friction coefficient is calculated from the measured and filtered torque and loading forces. Measurement Indices - The DF tester reports friction as a graph that plots the friction coefficient as a function of slip speed. The device also reports the peak friction and the slip speed at which the peak friction occurs. The device is calibrated and reports the International Friction Index (IFI) that consists of the friction number measured at 45 mph (73 km/h) designated by FN60 and the Sp number that is the indication of the loss friction when speed increases. Advantages and Disadvantages- The device is very repeatable and reproducible. It is used as the standard device to calibrate friction devices to the IFI. The DF tester is relatively small and easy to transport. The disadvantage of the device is that it cannot be used for network level monitoring or project measurements. It is a very promising device for investigation, laboratory and research use, as well as for calibration purposes.
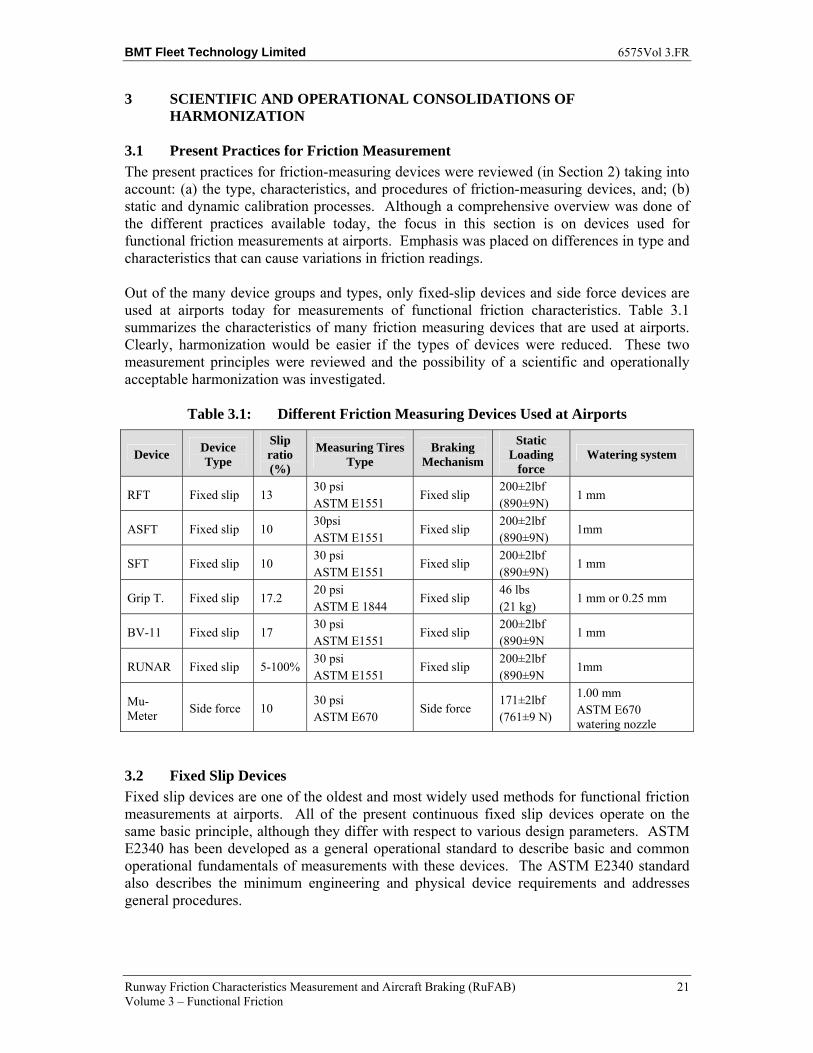
BMT Fleet Technology Limited 6575Vol 3.FR
Runway Friction Characteristics Measurement and Aircraft Braking (RuFAB) 21 Volume 3 – Functional Friction
3 SCIENTIFIC AND OPERATIONAL CONSOLIDATIONS OF HARMONIZATION
3.1 Present Practices for Friction Measurement
The present practices for friction-measuring devices were reviewed (in Section 2) taking into account: (a) the type, characteristics, and procedures of friction-measuring devices, and; (b) static and dynamic calibration processes. Although a comprehensive overview was done of the different practices available today, the focus in this section is on devices used for functional friction measurements at airports. Emphasis was placed on differences in type and characteristics that can cause variations in friction readings.
Out of the many device groups and types, only fixed-slip devices and side force devices are used at airports today for measurements of functional friction characteristics. Table 3.1 summarizes the characteristics of many friction measuring devices that are used at airports. Clearly, harmonization would be easier if the types of devices were reduced. These two measurement principles were reviewed and the possibility of a scientific and operationally acceptable harmonization was investigated.
Table 3.1: Different Friction Measuring Devices Used at Airports
Device Device Type
Slip ratio (%)
Measuring Tires Type
Braking Mechanism
Static Loading
force Watering system
RFT Fixed slip 13 30 psi ASTM E1551
Fixed slip 200±2lbf (890±9N)
1 mm
ASFT Fixed slip 10 30psi ASTM E1551
Fixed slip 200±2lbf (890±9N)
1mm
SFT Fixed slip 10 30 psi ASTM E1551
Fixed slip 200±2lbf (890±9N)
1 mm
Grip T. Fixed slip 17.2 20 psi ASTM E 1844
Fixed slip 46 lbs (21 kg)
1 mm or 0.25 mm
BV-11 Fixed slip 17 30 psi ASTM E1551
Fixed slip 200±2lbf (890±9N
1 mm
RUNAR Fixed slip 5-100% 30 psi ASTM E1551
Fixed slip 200±2lbf (890±9N
1mm
Mu-Meter
Side force 10 30 psi ASTM E670
Side force 171±2lbf (761±9 N)
1.00 mm ASTM E670 watering nozzle
3.2 Fixed Slip Devices
Fixed slip devices are one of the oldest and most widely used methods for functional friction measurements at airports. All of the present continuous fixed slip devices operate on the same basic principle, although they differ with respect to various design parameters. ASTM E2340 has been developed as a general operational standard to describe basic and common operational fundamentals of measurements with these devices. The ASTM E2340 standard also describes the minimum engineering and physical device requirements and addresses general procedures.
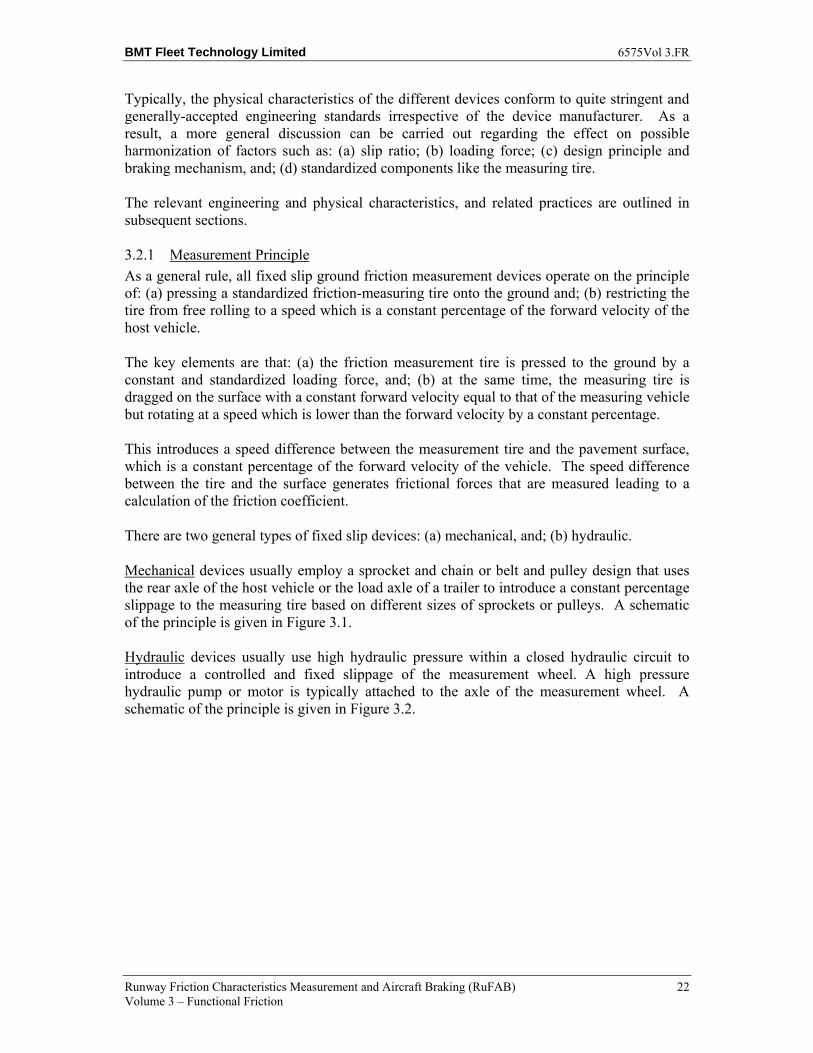
BMT Fleet Technology Limited 6575Vol 3.FR
Runway Friction Characteristics Measurement and Aircraft Braking (RuFAB) 22 Volume 3 – Functional Friction
Typically, the physical characteristics of the different devices conform to quite stringent and generally-accepted engineering standards irrespective of the device manufacturer. As a result, a more general discussion can be carried out regarding the effect on possible harmonization of factors such as: (a) slip ratio; (b) loading force; (c) design principle and braking mechanism, and; (d) standardized components like the measuring tire.
The relevant engineering and physical characteristics, and related practices are outlined in subsequent sections.
3.2.1 Measurement Principle
As a general rule, all fixed slip ground friction measurement devices operate on the principle of: (a) pressing a standardized friction-measuring tire onto the ground and; (b) restricting the tire from free rolling to a speed which is a constant percentage of the forward velocity of the host vehicle.
The key elements are that: (a) the friction measurement tire is pressed to the ground by a constant and standardized loading force, and; (b) at the same time, the measuring tire is dragged on the surface with a constant forward velocity equal to that of the measuring vehicle but rotating at a speed which is lower than the forward velocity by a constant percentage.
This introduces a speed difference between the measurement tire and the pavement surface, which is a constant percentage of the forward velocity of the vehicle. The speed difference between the tire and the surface generates frictional forces that are measured leading to a calculation of the friction coefficient.
There are two general types of fixed slip devices: (a) mechanical, and; (b) hydraulic.
Mechanical devices usually employ a sprocket and chain or belt and pulley design that uses the rear axle of the host vehicle or the load axle of a trailer to introduce a constant percentage slippage to the measuring tire based on different sizes of sprockets or pulleys. A schematic of the principle is given in Figure 3.1.
Hydraulic devices usually use high hydraulic pressure within a closed hydraulic circuit to introduce a controlled and fixed slippage of the measurement wheel. A high pressure hydraulic pump or motor is typically attached to the axle of the measurement wheel. A schematic of the principle is given in Figure 3.2.
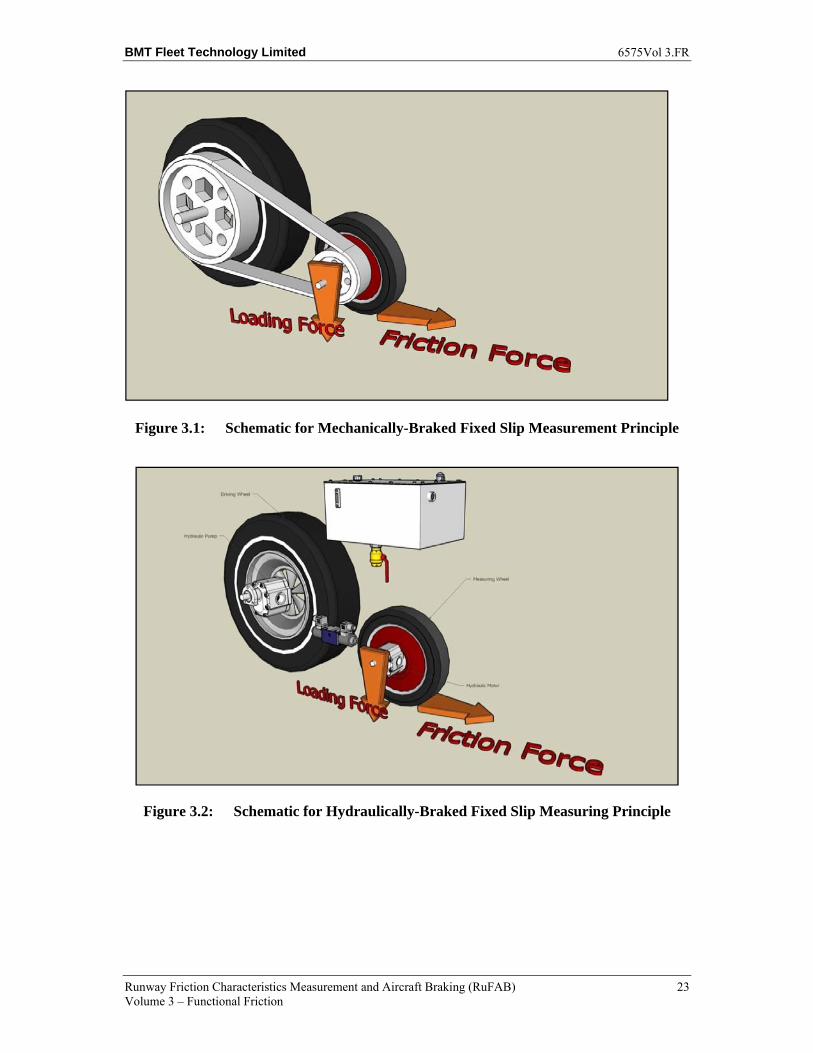
BMT Fleet Technology Limited 6575Vol 3.FR
Runway Friction Characteristics Measurement and Aircraft Braking (RuFAB) 23 Volume 3 – Functional Friction
Figure 3.1: Schematic for Mechanically-Braked Fixed Slip Measurement Principle
Figure 3.2: Schematic for Hydraulically-Braked Fixed Slip Measuring Principle
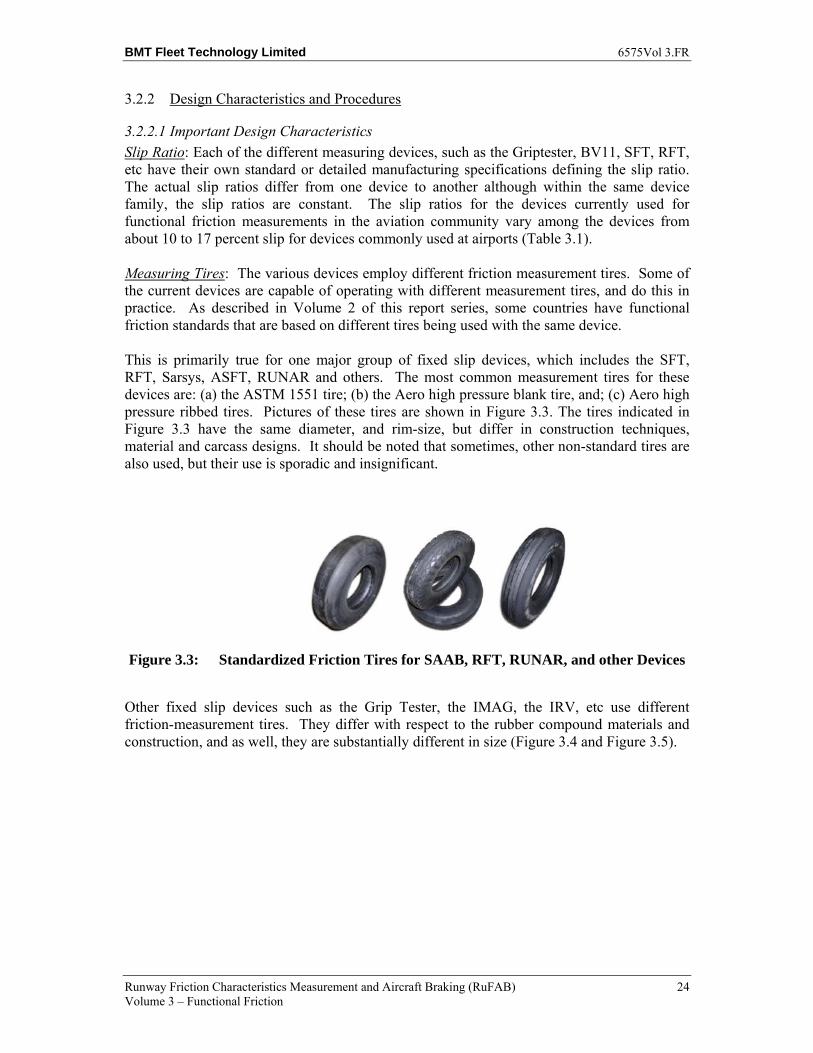
BMT Fleet Technology Limited 6575Vol 3.FR
Runway Friction Characteristics Measurement and Aircraft Braking (RuFAB) 24 Volume 3 – Functional Friction
3.2.2 Design Characteristics and Procedures
3.2.2.1 Important Design Characteristics
Slip Ratio: Each of the different measuring devices, such as the Griptester, BV11, SFT, RFT, etc have their own standard or detailed manufacturing specifications defining the slip ratio. The actual slip ratios differ from one device to another although within the same device family, the slip ratios are constant. The slip ratios for the devices currently used for functional friction measurements in the aviation community vary among the devices from about 10 to 17 percent slip for devices commonly used at airports (Table 3.1).
Measuring Tires: The various devices employ different friction measurement tires. Some of the current devices are capable of operating with different measurement tires, and do this in practice. As described in Volume 2 of this report series, some countries have functional friction standards that are based on different tires being used with the same device.
This is primarily true for one major group of fixed slip devices, which includes the SFT, RFT, Sarsys, ASFT, RUNAR and others. The most common measurement tires for these devices are: (a) the ASTM 1551 tire; (b) the Aero high pressure blank tire, and; (c) Aero high pressure ribbed tires. Pictures of these tires are shown in Figure 3.3. The tires indicated in Figure 3.3 have the same diameter, and rim-size, but differ in construction techniques, material and carcass designs. It should be noted that sometimes, other non-standard tires are also used, but their use is sporadic and insignificant.
Figure 3.3: Standardized Friction Tires for SAAB, RFT, RUNAR, and other Devices
Other fixed slip devices such as the Grip Tester, the IMAG, the IRV, etc use different friction-measurement tires. They differ with respect to the rubber compound materials and construction, and as well, they are substantially different in size (Figure 3.4 and Figure 3.5).
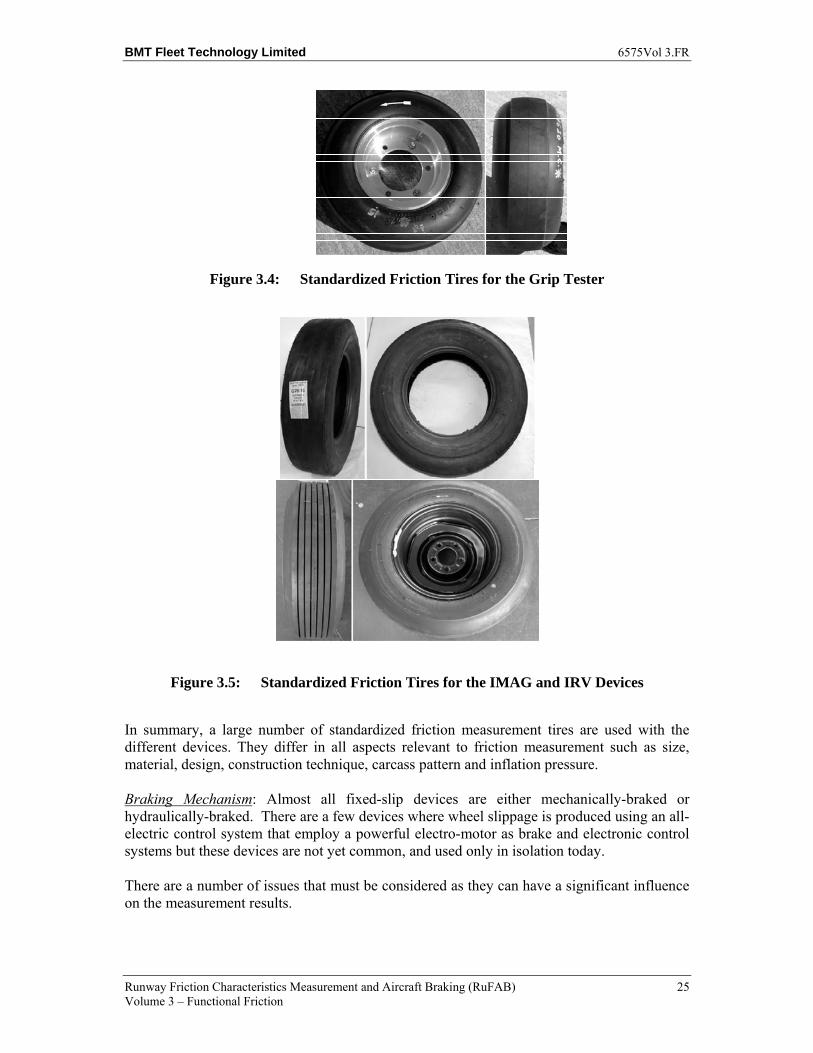
BMT Fleet Technology Limited 6575Vol 3.FR
Runway Friction Characteristics Measurement and Aircraft Braking (RuFAB) 25 Volume 3 – Functional Friction
Figure 3.4: Standardized Friction Tires for the Grip Tester
Figure 3.5: Standardized Friction Tires for the IMAG and IRV Devices
In summary, a large number of standardized friction measurement tires are used with the different devices. They differ in all aspects relevant to friction measurement such as size, material, design, construction technique, carcass pattern and inflation pressure.
Braking Mechanism: Almost all fixed-slip devices are either mechanically-braked or hydraulically-braked. There are a few devices where wheel slippage is produced using an all- electric control system that employ a powerful electro-motor as brake and electronic control systems but these devices are not yet common, and used only in isolation today.
There are a number of issues that must be considered as they can have a significant influence on the measurement results.
BMT Fleet Technology Limited 6575Vol 3.FR
Runway Friction Characteristics Measurement and Aircraft Braking (RuFAB) 26 Volume 3 – Functional Friction
The most important one relates to the amount of slippage that occurs on the driver wheel. For a mechanically-braked system, constant slippage of the measurement tire is achieved by physically linking the measurement wheel through chains or belts to a driver wheel where the percentage slip is derived from the difference in size of the driver and driven sprocket or pulley. These systems have a constant slip difference between the driver and the driven wheel which is ensured by design. However, it must be recognized that in order to create slippage of the measurement wheel, the driver wheel has to exert considerable torque. This torque will introduce an unknown amount of slippage on the driver wheel, and the slippage of the driver wheel will vary depending on the environmental conditions. In turn, this will reduce the actual slip ratio of the measurement wheel, which may lead to variability in the friction readings.
Another issue relates to the fact that the hydraulic braking mechanisms (and the electronic systems as well) typically use a closed loop feedback control system to control the actual slip ratio of the measuring wheel in real time. This has the advantage of creating an actual and absolute slip ratio of the measuring wheel but the performance of the control system can introduce small errors in slip ratio during the measurement due to changes in friction levels of the surface and the dynamics of the systems. It is noted that some hydraulic systems do not use a control system but instead, have pre-determined and set slip ratios that are controlled by the selection of the hydraulic pump-motor combination. In these cases, slippage of the driver wheel is a concern similar to that described for the mechanically-braked systems.
Vertical Loading Force: The different devices, such as the Griptester BV11, SFT, RFT, etc. are designed for a standardized load for their measurement tires. These loads vary in magnitude. There are also variations with respect to the design concepts and mechanisms for introducing these loads onto the measuring tires. There are two major types of designs for creating and maintaining these tire loads.
One approach is to use a tuned suspension with a known weight to create a standardized vertical loading force on the measurement tire. These systems utilize a special suspension to deliver a known static load to the test tire. The suspensions of these systems are designed to minimize dynamic effects produced by the roughness of the measured surface. Because these systems typically can’t keep the variation of the loading force below ± 1 percent (which is the general criterion), they need to be able to measure the loading force on the tire.
The second widely used technique is to use an active hydraulic or pneumatic loading system that is actively controlled by an electronic control system that does deliver a constant loading force on the test tire independent of the surface roughness and the dynamics of the host vehicle. In most cases, these systems also require a loading force measurement sensor due to the fact that the dynamics produced by most runways introduce variations in the loading force exceeding 1 percent.
Regardless of the system utilized to apply a constant load to the measurement wheel of the required magnitude, the devices differ with respect to the target force for the measuring tires. It should be noted here that even those devices that are designed to use the same standard measuring tires are usually designed for different loading forces.
BMT Fleet Technology Limited 6575Vol 3.FR
Runway Friction Characteristics Measurement and Aircraft Braking (RuFAB) 27 Volume 3 – Functional Friction
Watering System: Virtually all fixed-slip devices are equipped with either a standard or optional watering system. These systems are designed to deliver a pre-determined amount of water in front of the measurement tire that coats the measured pavement surface with a theoretically constant water depth across the tire path independent of measuring speed. However, the watering systems differ greatly among the devices, and there are no real common types across the many devices. This comment applies to all parts of the system including the water delivery mechanism and the water nozzle. As a result, the various systems have differing capabilities to reliably apply a water film of constant depth in front of the measuring tire.
3.2.2.2 Procedures
Calibration: Fixed slip devices are required by their manufacturers to be periodically calibrated at specified time intervals. The recommended time interval varies between 6 month and one year depending on the manufacturer and device. Without exception, periodic calibration of the devices is a static one for the loading and friction force sensors of the device. Very few manufacturers offer calibration of the measuring speed sensor.
Calibration of watering systems or positive verification of the actually delivered water film depth is usually not available on present devices.
For field checks, manufacturers usually recommend and provide an easy and practical way to check the validity of the force sensors either each day before use or before each measurement.
Measurement: Fixed slip devices for functional measurements are used in a constant speed mode without exception. Speed variations for a single measurement run are generally restricted to +/- 5 km/hr.
Most major standardization aviation rule making and government organizations set criteria based on test speeds of 65 km/hr and 95 km/hr, although some also use 130 km/hr, as described in Volume 2 of this report series. Fixed-slip devices are typically designed to operate at these speeds although not all of them are capable of operating at the higher speeds.
Functional measurements are restricted with respect to amount of tire wear that is allowed on the measurement tire. Wear mark indicators on the measuring tire are used to check that the tire wear is acceptable, and are noted before each measurement. Measurements performed with tires worn below the acceptable level, or new tires without initial break-in, are invalid. (Initial break-in consists of initial measurements to introduce wear and remove chemical residues from the manufacturing process from the surface of new tires).
The inflation pressure of the measuring tire is also prescribed, but not standardized for all tires. This needs to be continuously checked and maintained to the prescribed level.
Functional friction measurements require the use of water without exception, which is delivered though the devices’ self watering system.
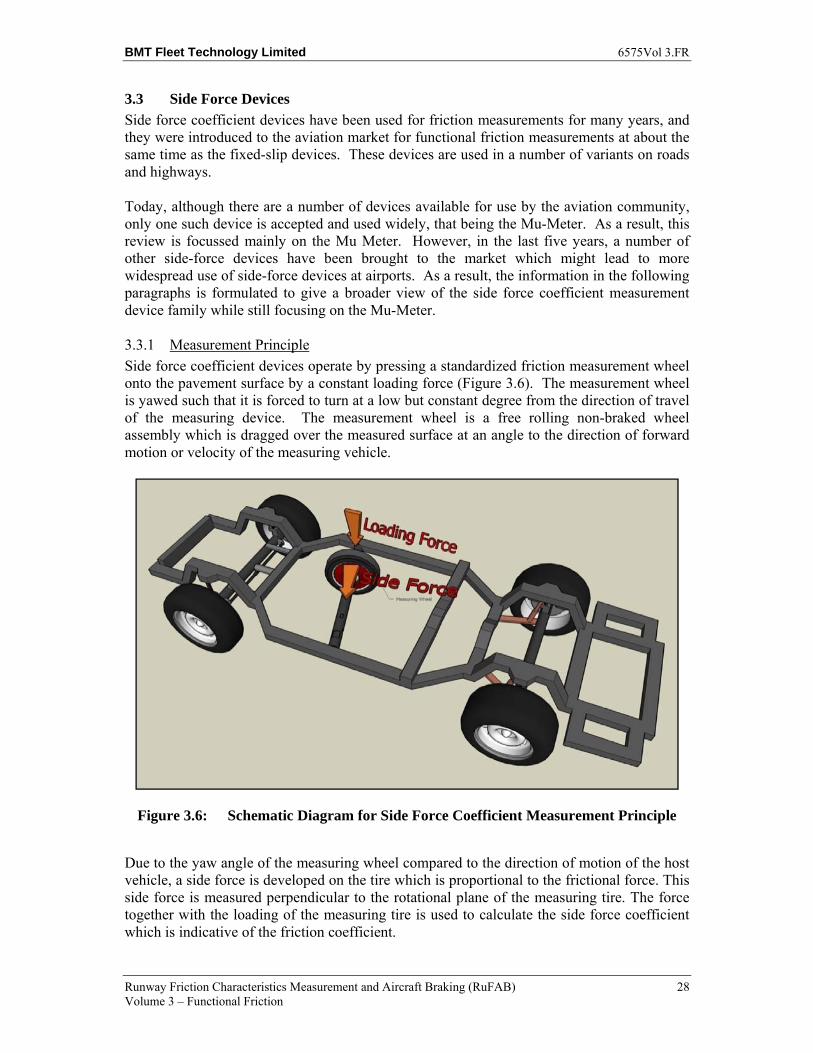
BMT Fleet Technology Limited 6575Vol 3.FR
Runway Friction Characteristics Measurement and Aircraft Braking (RuFAB) 28 Volume 3 – Functional Friction
3.3 Side Force Devices
Side force coefficient devices have been used for friction measurements for many years, and they were introduced to the aviation market for functional friction measurements at about the same time as the fixed-slip devices. These devices are used in a number of variants on roads and highways.
Today, although there are a number of devices available for use by the aviation community, only one such device is accepted and used widely, that being the Mu-Meter. As a result, this review is focussed mainly on the Mu Meter. However, in the last five years, a number of other side-force devices have been brought to the market which might lead to more widespread use of side-force devices at airports. As a result, the information in the following paragraphs is formulated to give a broader view of the side force coefficient measurement device family while still focusing on the Mu-Meter.
3.3.1 Measurement Principle
Side force coefficient devices operate by pressing a standardized friction measurement wheel onto the pavement surface by a constant loading force (Figure 3.6). The measurement wheel is yawed such that it is forced to turn at a low but constant degree from the direction of travel of the measuring device. The measurement wheel is a free rolling non-braked wheel assembly which is dragged over the measured surface at an angle to the direction of forward motion or velocity of the measuring vehicle.
Figure 3.6: Schematic Diagram for Side Force Coefficient Measurement Principle
Due to the yaw angle of the measuring wheel compared to the direction of motion of the host vehicle, a side force is developed on the tire which is proportional to the frictional force. This side force is measured perpendicular to the rotational plane of the measuring tire. The force together with the loading of the measuring tire is used to calculate the side force coefficient which is indicative of the friction coefficient.
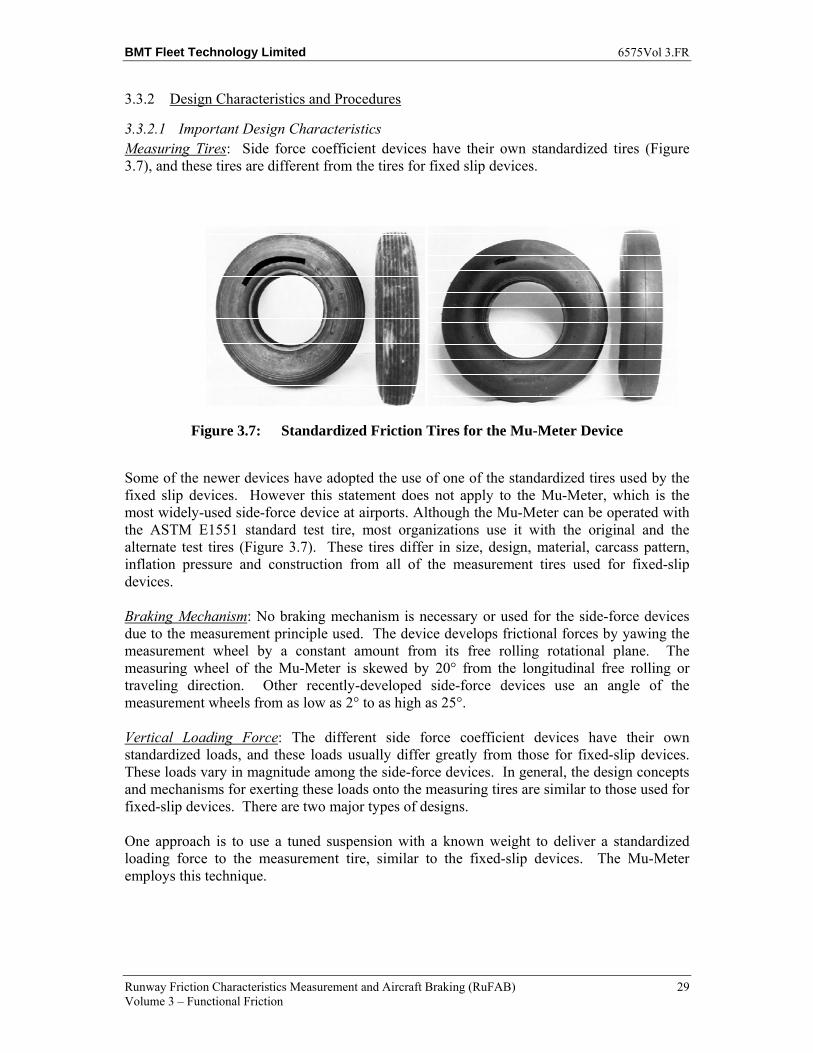
BMT Fleet Technology Limited 6575Vol 3.FR
Runway Friction Characteristics Measurement and Aircraft Braking (RuFAB) 29 Volume 3 – Functional Friction
3.3.2 Design Characteristics and Procedures
3.3.2.1 Important Design Characteristics Measuring Tires: Side force coefficient devices have their own standardized tires (Figure 3.7), and these tires are different from the tires for fixed slip devices.
Figure 3.7: Standardized Friction Tires for the Mu-Meter Device
Some of the newer devices have adopted the use of one of the standardized tires used by the fixed slip devices. However this statement does not apply to the Mu-Meter, which is the most widely-used side-force device at airports. Although the Mu-Meter can be operated with the ASTM E1551 standard test tire, most organizations use it with the original and the alternate test tires (Figure 3.7). These tires differ in size, design, material, carcass pattern, inflation pressure and construction from all of the measurement tires used for fixed-slip devices.
Braking Mechanism: No braking mechanism is necessary or used for the side-force devices due to the measurement principle used. The device develops frictional forces by yawing the measurement wheel by a constant amount from its free rolling rotational plane. The measuring wheel of the Mu-Meter is skewed by 20° from the longitudinal free rolling or traveling direction. Other recently-developed side-force devices use an angle of the measurement wheels from as low as 2° to as high as 25°.
Vertical Loading Force: The different side force coefficient devices have their own standardized loads, and these loads usually differ greatly from those for fixed-slip devices. These loads vary in magnitude among the side-force devices. In general, the design concepts and mechanisms for exerting these loads onto the measuring tires are similar to those used for fixed-slip devices. There are two major types of designs.
One approach is to use a tuned suspension with a known weight to deliver a standardized loading force to the measurement tire, similar to the fixed-slip devices. The Mu-Meter employs this technique.
BMT Fleet Technology Limited 6575Vol 3.FR
Runway Friction Characteristics Measurement and Aircraft Braking (RuFAB) 30 Volume 3 – Functional Friction
The second method is to use an active hydraulic or pneumatic loading system that is actively controlled by an electronic control system that delivers a constant loading force on the test tire independent of the surface roughness and the dynamics of the host vehicle. Generally, these systems also require a loading force measurement sensor due to the fact that the dynamics introduced on most runways introduce variations in the loading force exceeding 1 percent.
Regardless of the system utilized to apply the required, constant loading force to the measurement wheel, the different side-force devices are designed to operate with different loading forces being applied to the measuring tires.
Watering System: The Mu-Meter has a range of watering systems that can be purchased with the measurement system. The device has its own standardized nozzle and water delivery mechanisms. Most of the other side-force devices also incorporate water delivery systems. These systems are designed to deliver a pre-determined amount of water in front of the measurement tires that coats the measured pavement surface with a theoretically constant water depth across the tire path independent of measuring speed. However, the watering systems differ greatly among the devices, and there are no real common types across the many devices. This comment applies to all parts of the system including the water delivery mechanism and the water nozzle. As a result, the various systems have differing capabilities to reliably apply a water film of constant depth in front of the measuring tire.
3.3.2.2 Procedures Calibration: Side-force devices are required by their manufacturers to be calibrated periodically at certain time intervals. The recommended time interval varies between 6 month and one year depending on the manufacturer and device. These calibrations typically are done for the loading and friction force sensors of the device. Without exception, these are static calibrations. Very few manufacturers offer calibration of the measuring speed sensor.
Calibration of watering systems or positive verification of the actually delivered water film depth is usually not available on presently-used devices.
For field checks, manufacturers usually recommend and provide an easy and practical way to check the validity of the force sensors either each day before use, or before each measurement.
Measurement: Side-force devices are used for functional friction measurements in a constant speed mode without exception. Speed variations for a single measurement run are generally restricted to +/- 5 km/h.
Most major aviation rule making and government regulatory organizations set criteria based on test speeds of 65km/hr and 95km/hr. As a result, side-force devices are typically designed to operate at these speeds.
Functional friction measurements are restricted with respect to the amount of wear that is allowed for the measurement tire. Wear mark indicators on the measuring tire are used to check acceptability before each measurement. Measurements performed with tires worn below the acceptable level, or new tires without initial break-in, are invalid. (Initial break-in consists of initial measurements to introduce wear and remove chemical residues from the manufacturing process from the surface of new tires).
BMT Fleet Technology Limited 6575Vol 3.FR
Runway Friction Characteristics Measurement and Aircraft Braking (RuFAB) 31 Volume 3 – Functional Friction
The inflation pressure of the measuring tire is also standardized and needs to be continuously checked and maintained to the prescribed level.
Functional measurements without exception require the use of water, which is delivered though the self watering system on the device.
3.4 Calibration
The preceding discussion has shown that the friction-measuring devices vary greatly, even when the set of equipment is limited to the two types commonly used at airports (i.e., fixed-slip and side-force devices). It might be suggested that the differences in readings caused by these design variations could be compensated for through static and dynamic calibrations. Unfortunately, this is not the case, as will be explained in this section.
3.4.1 Static Calibration
As described previously, fixed-slip and side-force devices have well-designed static calibration procedures that are recommended by the device manufacturers. These static calibration procedures basically make the necessary adjustments to the electronic gains of the vertical load and drag force sensors of the measuring device. These calibration adjustments ensure that the force sensing components of the devices report the correct amount of force that is applied.
Unfortunately, these static calibration procedures are not able to take into account wear and inconsistencies in the many mechanical or hydraulic components between the sensors and the measuring wheels. These can have major effects on the forces reported by the whole measuring system, and hence the indicated friction coefficient. Static calibrations also do not take into account variations in the performance of the measuring tire, which can be quite significant. As a result, quite substantial variations may be encountered in the measurements from well-calibrated identical devices.
3.4.2 Dynamic Calibration
3.4.2.1 Introduction Because static calibration only ensures that the force sensing components of the devices report the correct amount of force applied to the sensors, dynamic calibration has been suggested by many researchers and practitioners as a means to overcome these limitations. Dynamic calibration would ensure that the device as a complex system reports the same and the correct values for the same surfaces, although it does not necessarily include comparisons to other devices or measurements. Also, dynamic calibration can provide valuable information on the repeatability and reproducibility of the device family. Thus it provides a quantifiable measure of the precision of the calibrated devices in their usual operating environment.
Unfortunately, there are two main problems associated with the dynamic calibration that are quite difficult to address. In order to understand these, a general description is required for the dynamic calibration process, which follows in the next section.
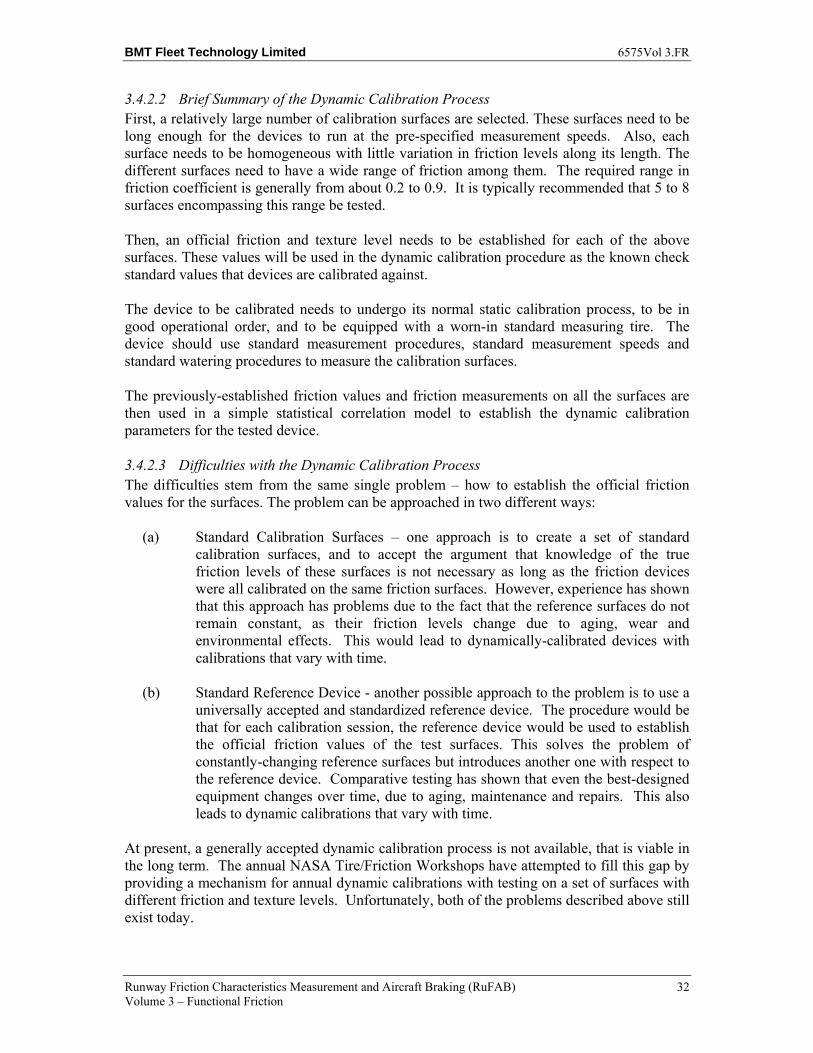
BMT Fleet Technology Limited 6575Vol 3.FR
Runway Friction Characteristics Measurement and Aircraft Braking (RuFAB) 32 Volume 3 – Functional Friction
3.4.2.2 Brief Summary of the Dynamic Calibration Process First, a relatively large number of calibration surfaces are selected. These surfaces need to be long enough for the devices to run at the pre-specified measurement speeds. Also, each surface needs to be homogeneous with little variation in friction levels along its length. The different surfaces need to have a wide range of friction among them. The required range in friction coefficient is generally from about 0.2 to 0.9. It is typically recommended that 5 to 8 surfaces encompassing this range be tested.
Then, an official friction and texture level needs to be established for each of the above surfaces. These values will be used in the dynamic calibration procedure as the known check standard values that devices are calibrated against.
The device to be calibrated needs to undergo its normal static calibration process, to be in good operational order, and to be equipped with a worn-in standard measuring tire. The device should use standard measurement procedures, standard measurement speeds and standard watering procedures to measure the calibration surfaces.
The previously-established friction values and friction measurements on all the surfaces are then used in a simple statistical correlation model to establish the dynamic calibration parameters for the tested device.
3.4.2.3 Difficulties with the Dynamic Calibration Process The difficulties stem from the same single problem – how to establish the official friction values for the surfaces. The problem can be approached in two different ways:
(a) Standard Calibration Surfaces – one approach is to create a set of standard calibration surfaces, and to accept the argument that knowledge of the true friction levels of these surfaces is not necessary as long as the friction devices were all calibrated on the same friction surfaces. However, experience has shown that this approach has problems due to the fact that the reference surfaces do not remain constant, as their friction levels change due to aging, wear and environmental effects. This would lead to dynamically-calibrated devices with calibrations that vary with time.
(b) Standard Reference Device - another possible approach to the problem is to use a universally accepted and standardized reference device. The procedure would be that for each calibration session, the reference device would be used to establish the official friction values of the test surfaces. This solves the problem of constantly-changing reference surfaces but introduces another one with respect to the reference device. Comparative testing has shown that even the best-designed equipment changes over time, due to aging, maintenance and repairs. This also leads to dynamic calibrations that vary with time.
At present, a generally accepted dynamic calibration process is not available, that is viable in the long term. The annual NASA Tire/Friction Workshops have attempted to fill this gap by providing a mechanism for annual dynamic calibrations with testing on a set of surfaces with different friction and texture levels. Unfortunately, both of the problems described above still exist today.
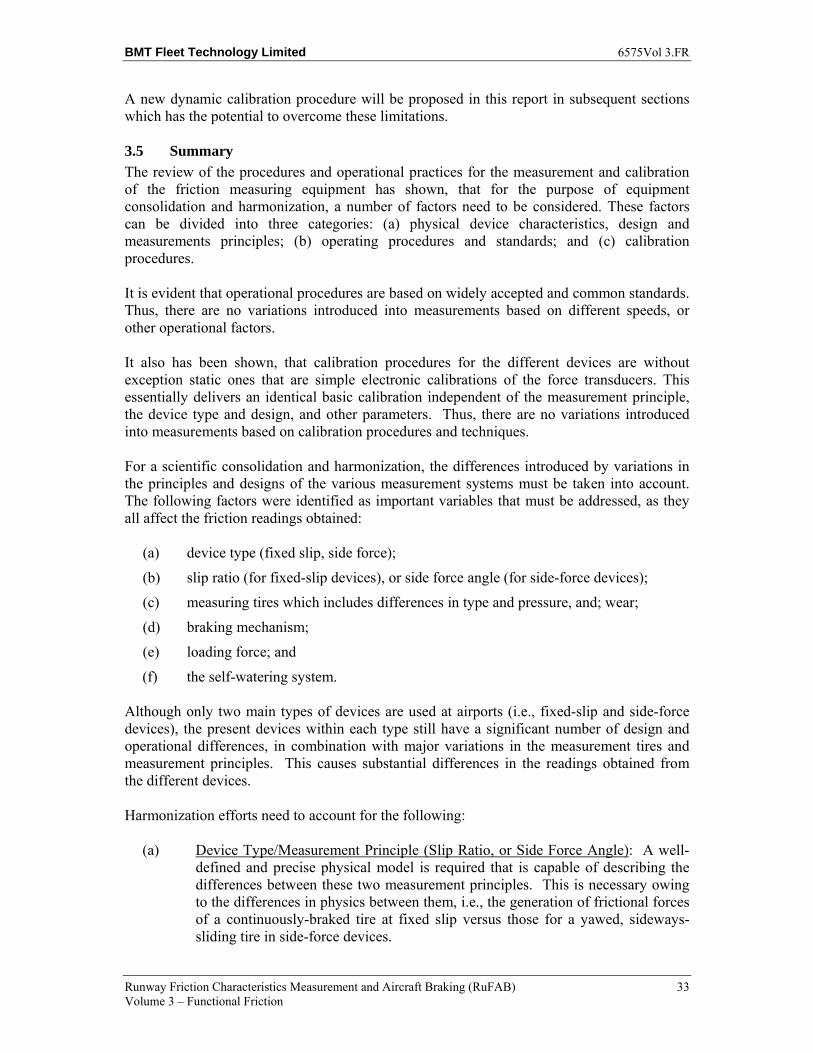
BMT Fleet Technology Limited 6575Vol 3.FR
Runway Friction Characteristics Measurement and Aircraft Braking (RuFAB) 33 Volume 3 – Functional Friction
A new dynamic calibration procedure will be proposed in this report in subsequent sections which has the potential to overcome these limitations.
3.5 Summary
The review of the procedures and operational practices for the measurement and calibration of the friction measuring equipment has shown, that for the purpose of equipment consolidation and harmonization, a number of factors need to be considered. These factors can be divided into three categories: (a) physical device characteristics, design and measurements principles; (b) operating procedures and standards; and (c) calibration procedures.
It is evident that operational procedures are based on widely accepted and common standards. Thus, there are no variations introduced into measurements based on different speeds, or other operational factors.
It also has been shown, that calibration procedures for the different devices are without exception static ones that are simple electronic calibrations of the force transducers. This essentially delivers an identical basic calibration independent of the measurement principle, the device type and design, and other parameters. Thus, there are no variations introduced into measurements based on calibration procedures and techniques.
For a scientific consolidation and harmonization, the differences introduced by variations in the principles and designs of the various measurement systems must be taken into account. The following factors were identified as important variables that must be addressed, as they all affect the friction readings obtained:
(a) device type (fixed slip, side force);
(b) slip ratio (for fixed-slip devices), or side force angle (for side-force devices);
(c) measuring tires which includes differences in type and pressure, and; wear;
(d) braking mechanism;
(e) loading force; and
(f) the self-watering system.
Although only two main types of devices are used at airports (i.e., fixed-slip and side-force devices), the present devices within each type still have a significant number of design and operational differences, in combination with major variations in the measurement tires and measurement principles. This causes substantial differences in the readings obtained from the different devices.
Harmonization efforts need to account for the following:
(a) Device Type/Measurement Principle (Slip Ratio, or Side Force Angle): A well- defined and precise physical model is required that is capable of describing the differences between these two measurement principles. This is necessary owing to the differences in physics between them, i.e., the generation of frictional forces of a continuously-braked tire at fixed slip versus those for a yawed, sideways-sliding tire in side-force devices.
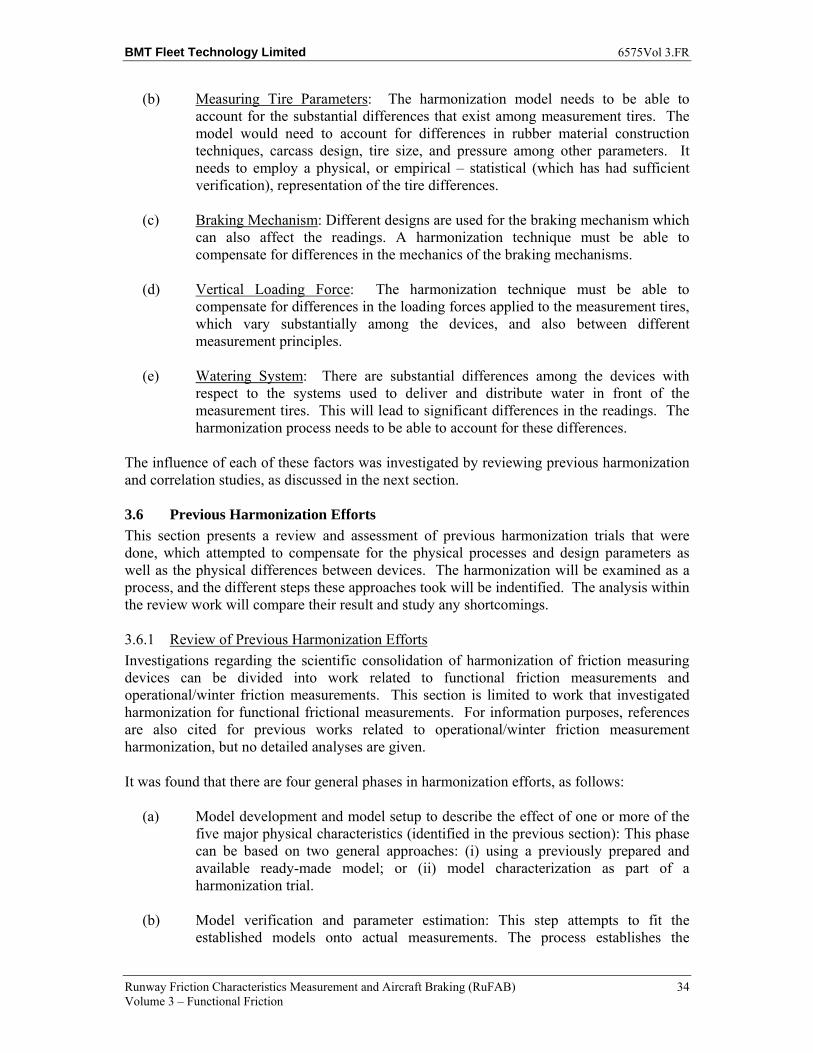
BMT Fleet Technology Limited 6575Vol 3.FR
Runway Friction Characteristics Measurement and Aircraft Braking (RuFAB) 34 Volume 3 – Functional Friction
(b) Measuring Tire Parameters: The harmonization model needs to be able to account for the substantial differences that exist among measurement tires. The model would need to account for differences in rubber material construction techniques, carcass design, tire size, and pressure among other parameters. It needs to employ a physical, or empirical – statistical (which has had sufficient verification), representation of the tire differences.
(c) Braking Mechanism: Different designs are used for the braking mechanism which can also affect the readings. A harmonization technique must be able to compensate for differences in the mechanics of the braking mechanisms.
(d) Vertical Loading Force: The harmonization technique must be able to compensate for differences in the loading forces applied to the measurement tires, which vary substantially among the devices, and also between different measurement principles.
(e) Watering System: There are substantial differences among the devices with respect to the systems used to deliver and distribute water in front of the measurement tires. This will lead to significant differences in the readings. The harmonization process needs to be able to account for these differences.
The influence of each of these factors was investigated by reviewing previous harmonization and correlation studies, as discussed in the next section.
3.6 Previous Harmonization Efforts
This section presents a review and assessment of previous harmonization trials that were done, which attempted to compensate for the physical processes and design parameters as well as the physical differences between devices. The harmonization will be examined as a process, and the different steps these approaches took will be indentified. The analysis within the review work will compare their result and study any shortcomings.
3.6.1 Review of Previous Harmonization Efforts
Investigations regarding the scientific consolidation of harmonization of friction measuring devices can be divided into work related to functional friction measurements and operational/winter friction measurements. This section is limited to work that investigated harmonization for functional frictional measurements. For information purposes, references are also cited for previous works related to operational/winter friction measurement harmonization, but no detailed analyses are given.
It was found that there are four general phases in harmonization efforts, as follows:
(a) Model development and model setup to describe the effect of one or more of the five major physical characteristics (identified in the previous section): This phase can be based on two general approaches: (i) using a previously prepared and available ready-made model; or (ii) model characterization as part of a harmonization trial.
(b) Model verification and parameter estimation: This step attempts to fit the established models onto actual measurements. The process establishes the
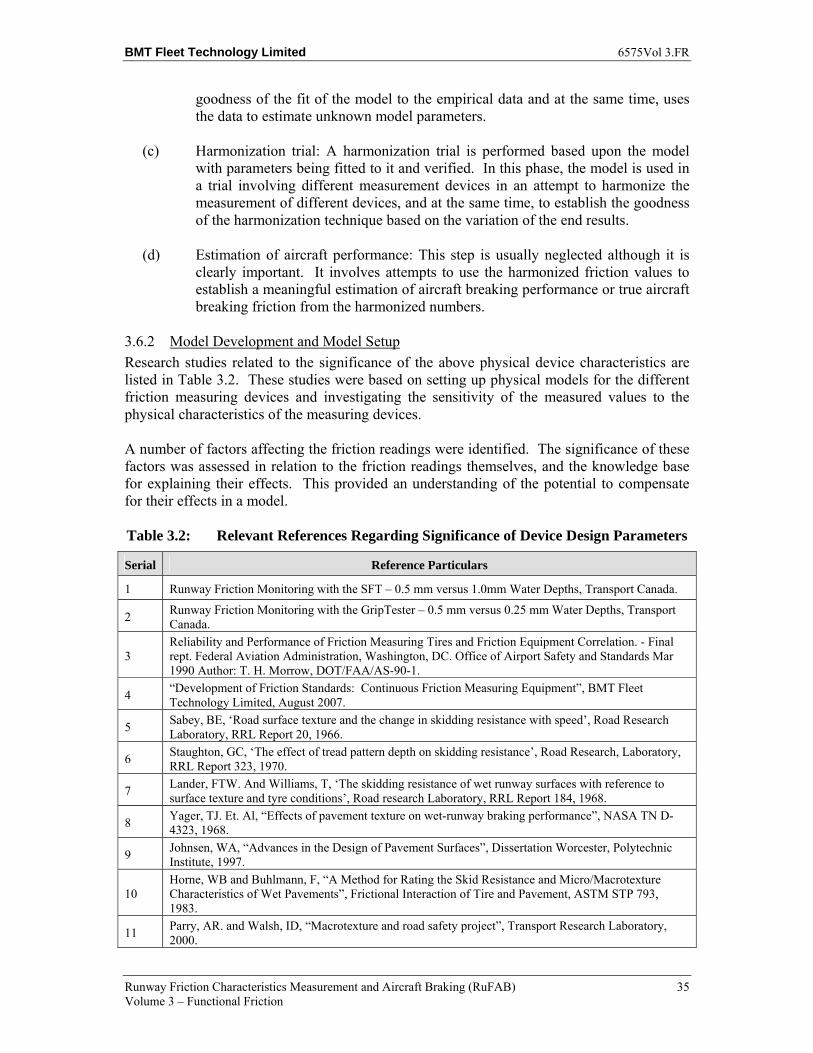
BMT Fleet Technology Limited 6575Vol 3.FR
Runway Friction Characteristics Measurement and Aircraft Braking (RuFAB) 35 Volume 3 – Functional Friction
goodness of the fit of the model to the empirical data and at the same time, uses the data to estimate unknown model parameters.
(c) Harmonization trial: A harmonization trial is performed based upon the model with parameters being fitted to it and verified. In this phase, the model is used in a trial involving different measurement devices in an attempt to harmonize the measurement of different devices, and at the same time, to establish the goodness of the harmonization technique based on the variation of the end results.
(d) Estimation of aircraft performance: This step is usually neglected although it is clearly important. It involves attempts to use the harmonized friction values to establish a meaningful estimation of aircraft breaking performance or true aircraft breaking friction from the harmonized numbers.
3.6.2 Model Development and Model Setup
Research studies related to the significance of the above physical device characteristics are listed in Table 3.2. These studies were based on setting up physical models for the different friction measuring devices and investigating the sensitivity of the measured values to the physical characteristics of the measuring devices.
A number of factors affecting the friction readings were identified. The significance of these factors was assessed in relation to the friction readings themselves, and the knowledge base for explaining their effects. This provided an understanding of the potential to compensate for their effects in a model.
Table 3.2: Relevant References Regarding Significance of Device Design Parameters
Serial Reference Particulars
1 Runway Friction Monitoring with the SFT – 0.5 mm versus 1.0mm Water Depths, Transport Canada.
2 Runway Friction Monitoring with the GripTester – 0.5 mm versus 0.25 mm Water Depths, Transport Canada.
3 Reliability and Performance of Friction Measuring Tires and Friction Equipment Correlation. - Final rept. Federal Aviation Administration, Washington, DC. Office of Airport Safety and Standards Mar 1990 Author: T. H. Morrow, DOT/FAA/AS-90-1.
4 “Development of Friction Standards: Continuous Friction Measuring Equipment”, BMT Fleet Technology Limited, August 2007.
5 Sabey, BE, ‘Road surface texture and the change in skidding resistance with speed’, Road Research Laboratory, RRL Report 20, 1966.
6 Staughton, GC, ‘The effect of tread pattern depth on skidding resistance’, Road Research, Laboratory, RRL Report 323, 1970.
7 Lander, FTW. And Williams, T, ‘The skidding resistance of wet runway surfaces with reference to surface texture and tyre conditions’, Road research Laboratory, RRL Report 184, 1968.
8 Yager, TJ. Et. Al, “Effects of pavement texture on wet-runway braking performance”, NASA TN D-4323, 1968.
9 Johnsen, WA, “Advances in the Design of Pavement Surfaces”, Dissertation Worcester, Polytechnic Institute, 1997.
10 Horne, WB and Buhlmann, F, “A Method for Rating the Skid Resistance and Micro/Macrotexture Characteristics of Wet Pavements”, Frictional Interaction of Tire and Pavement, ASTM STP 793, 1983.
11 Parry, AR. and Walsh, ID, “Macrotexture and road safety project”, Transport Research Laboratory, 2000.
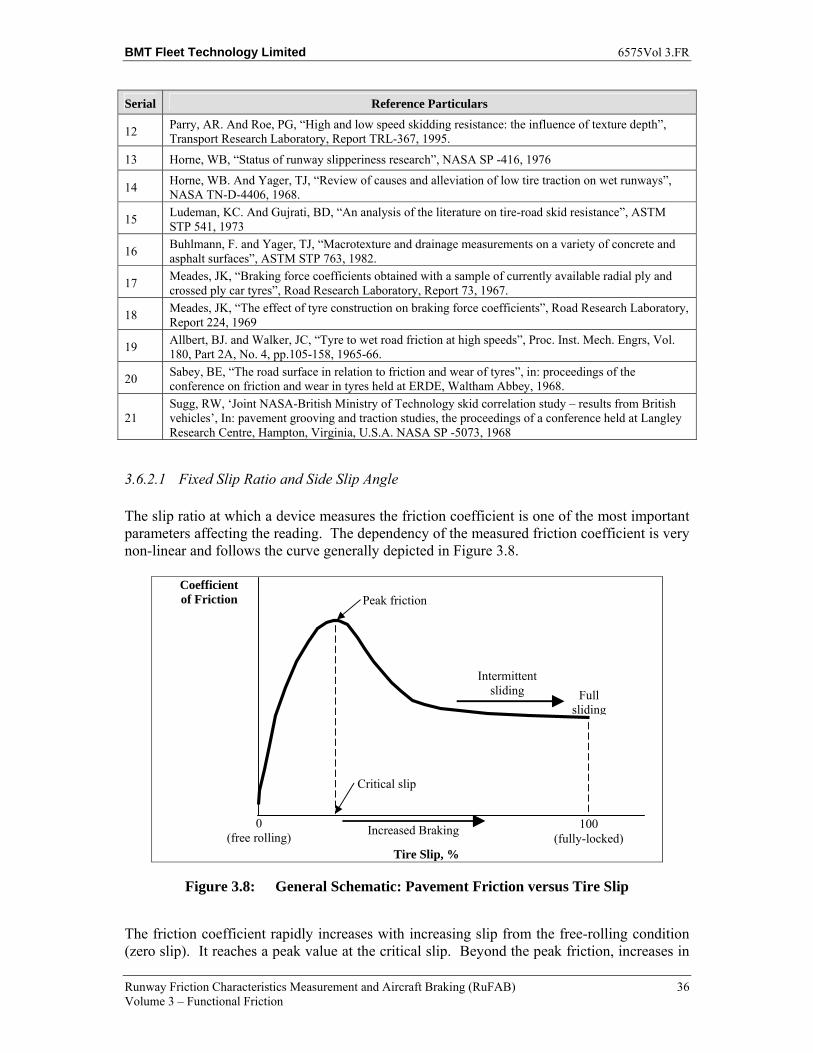
BMT Fleet Technology Limited 6575Vol 3.FR
Runway Friction Characteristics Measurement and Aircraft Braking (RuFAB) 36 Volume 3 – Functional Friction
Serial Reference Particulars
12 Parry, AR. And Roe, PG, “High and low speed skidding resistance: the influence of texture depth”, Transport Research Laboratory, Report TRL-367, 1995.
13 Horne, WB, “Status of runway slipperiness research”, NASA SP -416, 1976
14 Horne, WB. And Yager, TJ, “Review of causes and alleviation of low tire traction on wet runways”, NASA TN-D-4406, 1968.
15 Ludeman, KC. And Gujrati, BD, “An analysis of the literature on tire-road skid resistance”, ASTM STP 541, 1973
16 Buhlmann, F. and Yager, TJ, “Macrotexture and drainage measurements on a variety of concrete and asphalt surfaces”, ASTM STP 763, 1982.
17 Meades, JK, “Braking force coefficients obtained with a sample of currently available radial ply and crossed ply car tyres”, Road Research Laboratory, Report 73, 1967.
18 Meades, JK, “The effect of tyre construction on braking force coefficients”, Road Research Laboratory, Report 224, 1969
19 Allbert, BJ. and Walker, JC, “Tyre to wet road friction at high speeds”, Proc. Inst. Mech. Engrs, Vol. 180, Part 2A, No. 4, pp.105-158, 1965-66.
20 Sabey, BE, “The road surface in relation to friction and wear of tyres”, in: proceedings of the conference on friction and wear in tyres held at ERDE, Waltham Abbey, 1968.
21 Sugg, RW, ‘Joint NASA-British Ministry of Technology skid correlation study – results from British vehicles’, In: pavement grooving and traction studies, the proceedings of a conference held at Langley Research Centre, Hampton, Virginia, U.S.A. NASA SP -5073, 1968
3.6.2.1 Fixed Slip Ratio and Side Slip Angle The slip ratio at which a device measures the friction coefficient is one of the most important parameters affecting the reading. The dependency of the measured friction coefficient is very non-linear and follows the curve generally depicted in Figure 3.8.
Figure 3.8: General Schematic: Pavement Friction versus Tire Slip
The friction coefficient rapidly increases with increasing slip from the free-rolling condition (zero slip). It reaches a peak value at the critical slip. Beyond the peak friction, increases in
Peak friction
Critical slip
Full sliding
100 (fully-locked)
0 (free rolling)
Tire Slip, %
Coefficient of Friction
Increased Braking
Intermittent sliding
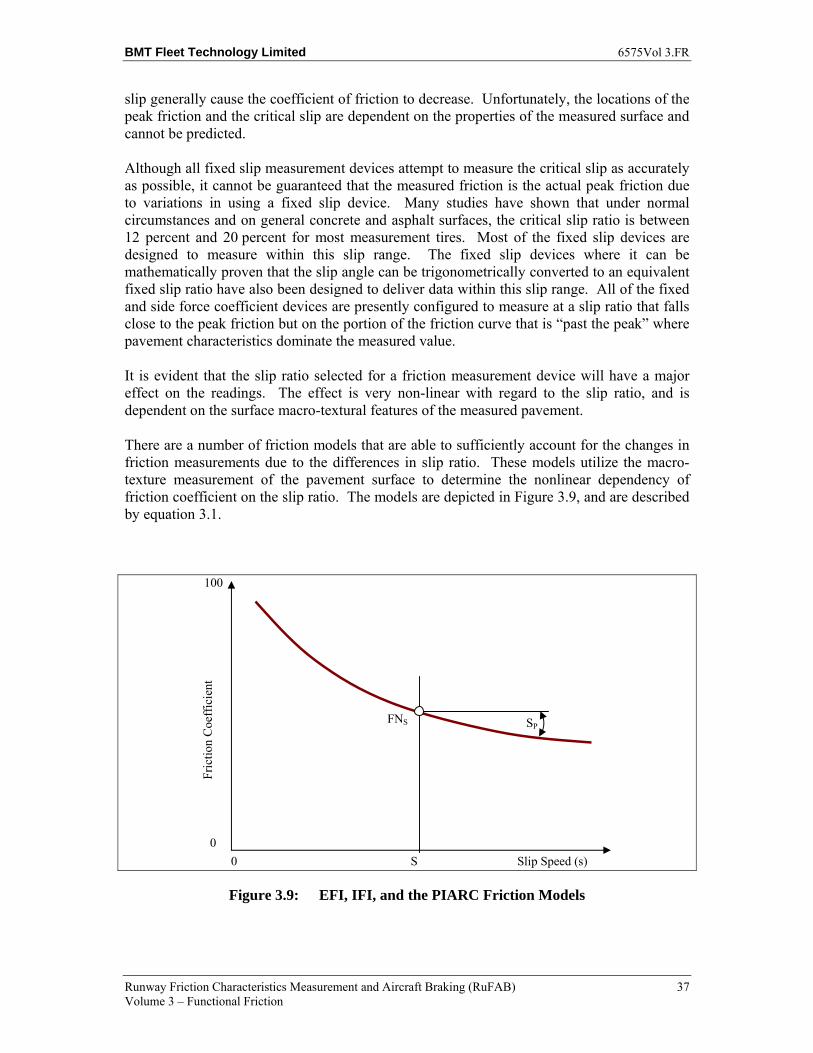
BMT Fleet Technology Limited 6575Vol 3.FR
Runway Friction Characteristics Measurement and Aircraft Braking (RuFAB) 37 Volume 3 – Functional Friction
slip generally cause the coefficient of friction to decrease. Unfortunately, the locations of the peak friction and the critical slip are dependent on the properties of the measured surface and cannot be predicted.
Although all fixed slip measurement devices attempt to measure the critical slip as accurately as possible, it cannot be guaranteed that the measured friction is the actual peak friction due to variations in using a fixed slip device. Many studies have shown that under normal circumstances and on general concrete and asphalt surfaces, the critical slip ratio is between 12 percent and 20 percent for most measurement tires. Most of the fixed slip devices are designed to measure within this slip range. The fixed slip devices where it can be mathematically proven that the slip angle can be trigonometrically converted to an equivalent fixed slip ratio have also been designed to deliver data within this slip range. All of the fixed and side force coefficient devices are presently configured to measure at a slip ratio that falls close to the peak friction but on the portion of the friction curve that is “past the peak” where pavement characteristics dominate the measured value.
It is evident that the slip ratio selected for a friction measurement device will have a major effect on the readings. The effect is very non-linear with regard to the slip ratio, and is dependent on the surface macro-textural features of the measured pavement.
There are a number of friction models that are able to sufficiently account for the changes in friction measurements due to the differences in slip ratio. These models utilize the macro-texture measurement of the pavement surface to determine the nonlinear dependency of friction coefficient on the slip ratio. The models are depicted in Figure 3.9, and are described by equation 3.1.
Figure 3.9: EFI, IFI, and the PIARC Friction Models
S Slip Speed (s) 0
Fric
tion
Coe
ffic
ient
0
100
SPFNS
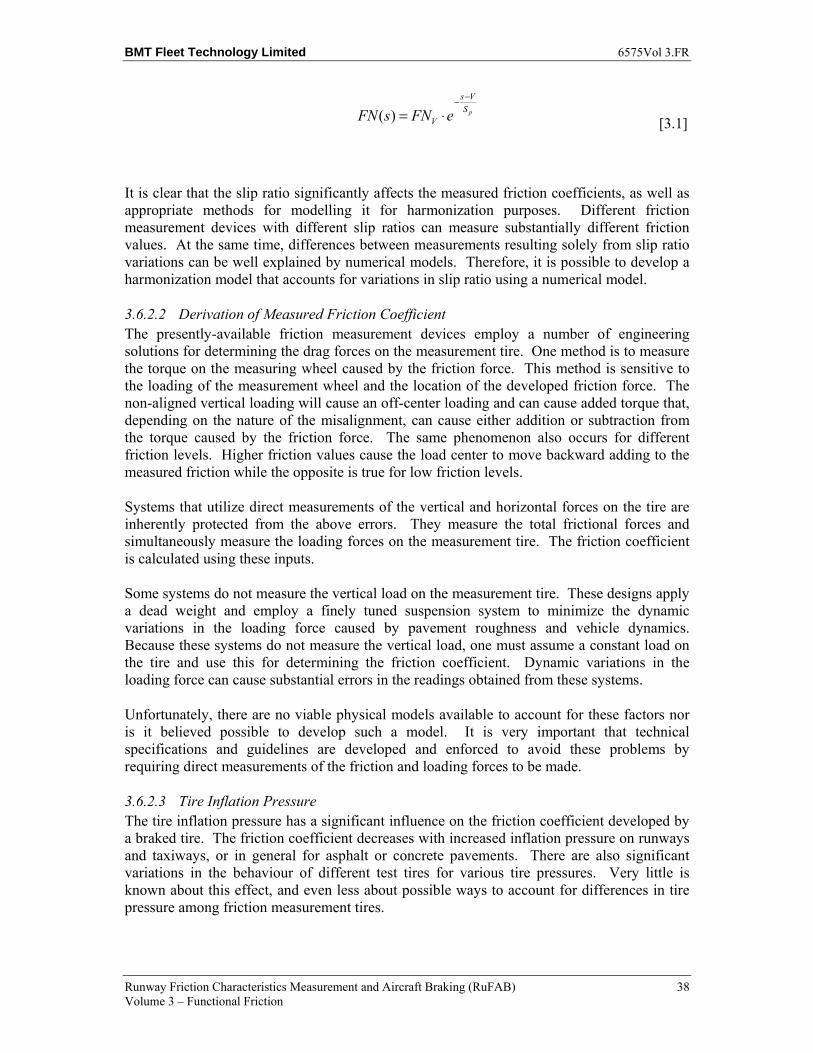
BMT Fleet Technology Limited 6575Vol 3.FR
Runway Friction Characteristics Measurement and Aircraft Braking (RuFAB) 38 Volume 3 – Functional Friction
pS
Vs
V eFNsFN−−
⋅=)( [3.1]
It is clear that the slip ratio significantly affects the measured friction coefficients, as well as appropriate methods for modelling it for harmonization purposes. Different friction measurement devices with different slip ratios can measure substantially different friction values. At the same time, differences between measurements resulting solely from slip ratio variations can be well explained by numerical models. Therefore, it is possible to develop a harmonization model that accounts for variations in slip ratio using a numerical model.
3.6.2.2 Derivation of Measured Friction Coefficient The presently-available friction measurement devices employ a number of engineering solutions for determining the drag forces on the measurement tire. One method is to measure the torque on the measuring wheel caused by the friction force. This method is sensitive to the loading of the measurement wheel and the location of the developed friction force. The non-aligned vertical loading will cause an off-center loading and can cause added torque that, depending on the nature of the misalignment, can cause either addition or subtraction from the torque caused by the friction force. The same phenomenon also occurs for different friction levels. Higher friction values cause the load center to move backward adding to the measured friction while the opposite is true for low friction levels.
Systems that utilize direct measurements of the vertical and horizontal forces on the tire are inherently protected from the above errors. They measure the total frictional forces and simultaneously measure the loading forces on the measurement tire. The friction coefficient is calculated using these inputs.
Some systems do not measure the vertical load on the measurement tire. These designs apply a dead weight and employ a finely tuned suspension system to minimize the dynamic variations in the loading force caused by pavement roughness and vehicle dynamics. Because these systems do not measure the vertical load, one must assume a constant load on the tire and use this for determining the friction coefficient. Dynamic variations in the loading force can cause substantial errors in the readings obtained from these systems.
Unfortunately, there are no viable physical models available to account for these factors nor is it believed possible to develop such a model. It is very important that technical specifications and guidelines are developed and enforced to avoid these problems by requiring direct measurements of the friction and loading forces to be made.
3.6.2.3 Tire Inflation Pressure The tire inflation pressure has a significant influence on the friction coefficient developed by a braked tire. The friction coefficient decreases with increased inflation pressure on runways and taxiways, or in general for asphalt or concrete pavements. There are also significant variations in the behaviour of different test tires for various tire pressures. Very little is known about this effect, and even less about possible ways to account for differences in tire pressure among friction measurement tires.
BMT Fleet Technology Limited 6575Vol 3.FR
Runway Friction Characteristics Measurement and Aircraft Braking (RuFAB) 39 Volume 3 – Functional Friction
It is recommended that standard measurement pressures for the different test tires be mandated and rigorously enforced to minimize this source of variation for friction readings.
3.6.2.4 Tire Parameters The numerous design and construction factors of a measurement tire can also significantly affect the measured friction coefficient. Factors such as the rubber material, ply type and ply rating, tire size, aspect ratio, manufacturing technology, and tread pattern, can have a major influence on the coefficient of friction measured by a tire. It is speculated that the tire size and diameter also affects the friction coefficient but no scientific studies are available to confirm this. Differences in rubber materials will have a great effect on the molecular adhesion between the tire and the pavement surface while the tire tread patterns will determine the actual contact and affect the contact pressure. The aspect ratio and tire size also affect the contact area and the distribution of contact pressure.
There are no practical physical models presently available to predict variations in the measured friction coefficient due to these parameters. Consequently, standardization is the only feasible way forward for harmonization with respect to this general parameter. It is recognized that this would be an extensive undertaking as many parameters are involved. Although an attempt could be made to reconcile the presently used different friction measurement tires with regard to their design, material and tire tread pattern, it would be advisable as a minimum to introduce standards with regard to required aspect ratio and possible tire size.
3.6.2.5 Self-Wetting Systems All friction testers used for functional friction measurements are equipped with a self-wetting system. These systems are designed to deliver a film of water of a pre-determined depth in front of the tire when measurements are made. Many studies have shown that surface wetness affects the friction, although the relationship is very non-linear (Figure 3.10). The water film depths commonly applied today for functional friction measurements include 0.25 mm, 0.5 mm and 1 mm.
However, there are some devices that do not provide a controllable watering system. For those devices, the actual water depth cannot be determined, which is a source of variation for the readings.
There are no physical models presently available that can adequately describe friction variations due to different water depths. It is recommended that the self wetting systems of friction measurement devices be standardized with regard to the delivered water depth, the distribution of water across the measurement tire and the capability of the system to deliver a constant water film thickness independent of variations in the measurement speed.
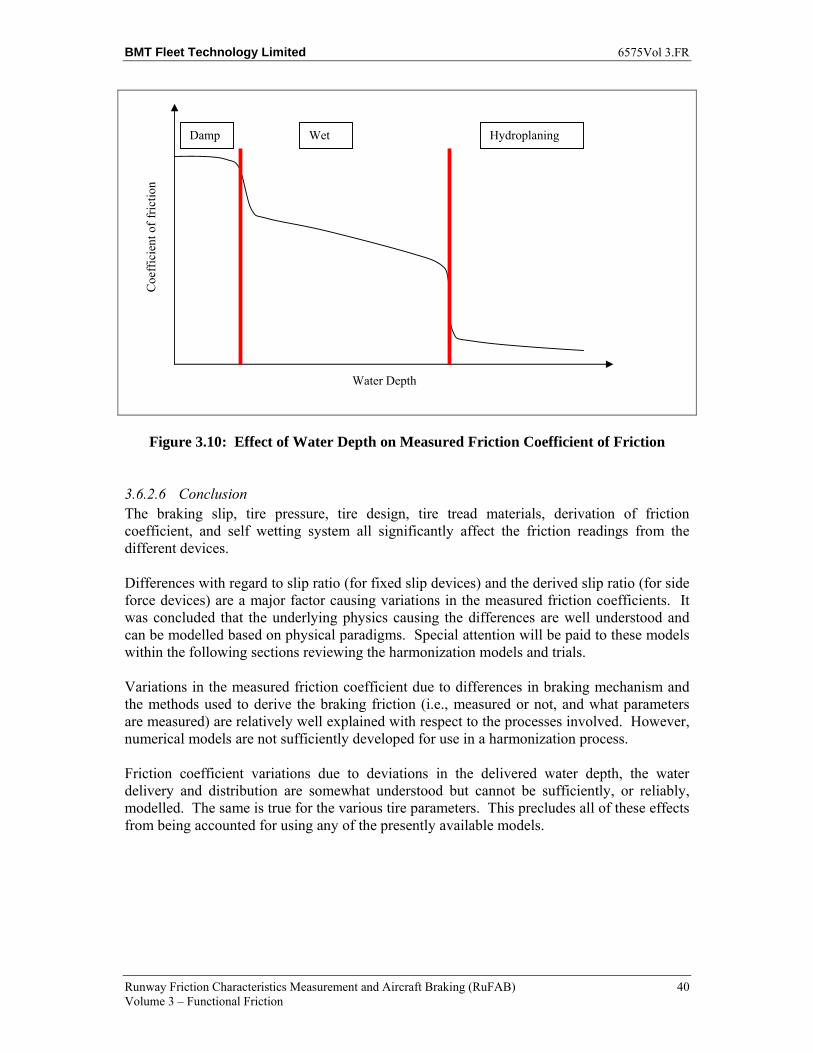
BMT Fleet Technology Limited 6575Vol 3.FR
Runway Friction Characteristics Measurement and Aircraft Braking (RuFAB) 40 Volume 3 – Functional Friction
Figure 3.10: Effect of Water Depth on Measured Friction Coefficient of Friction
3.6.2.6 Conclusion The braking slip, tire pressure, tire design, tire tread materials, derivation of friction coefficient, and self wetting system all significantly affect the friction readings from the different devices.
Differences with regard to slip ratio (for fixed slip devices) and the derived slip ratio (for side force devices) are a major factor causing variations in the measured friction coefficients. It was concluded that the underlying physics causing the differences are well understood and can be modelled based on physical paradigms. Special attention will be paid to these models within the following sections reviewing the harmonization models and trials.
Variations in the measured friction coefficient due to differences in braking mechanism and the methods used to derive the braking friction (i.e., measured or not, and what parameters are measured) are relatively well explained with respect to the processes involved. However, numerical models are not sufficiently developed for use in a harmonization process.
Friction coefficient variations due to deviations in the delivered water depth, the water delivery and distribution are somewhat understood but cannot be sufficiently, or reliably, modelled. The same is true for the various tire parameters. This precludes all of these effects from being accounted for using any of the presently available models.
Water Depth
Coe
ffic
ient
of f
rict
ion
Damp Wet Hydroplaning
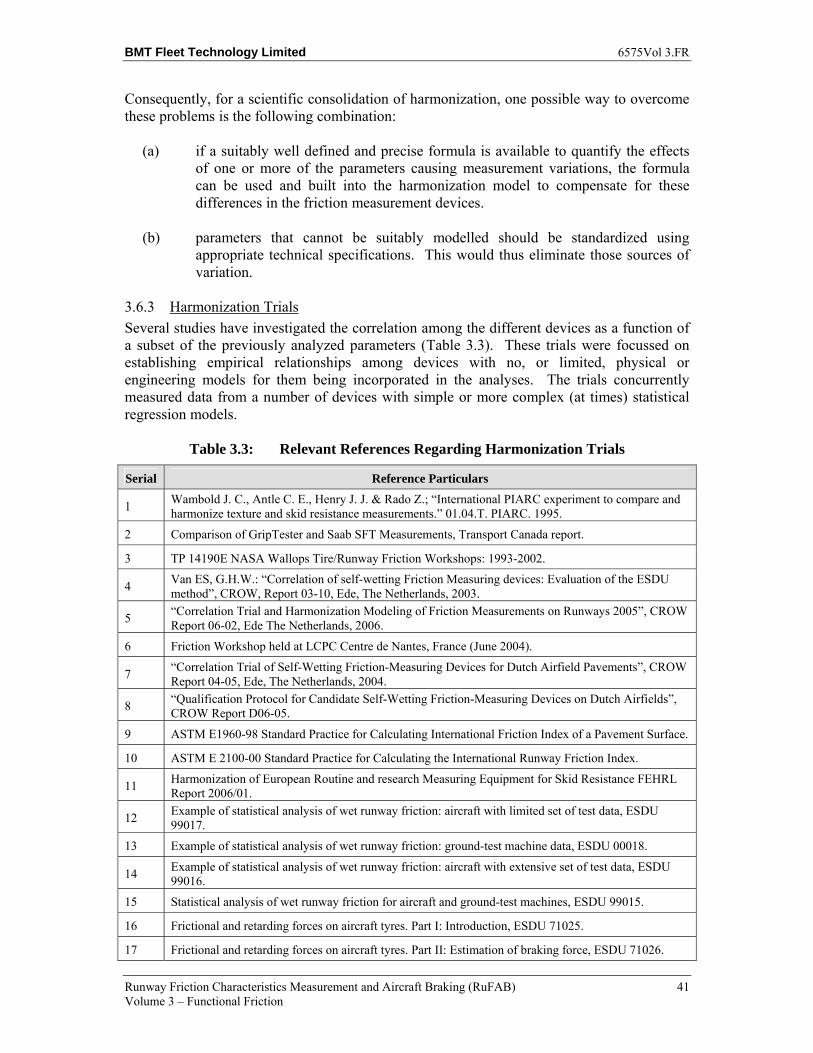
BMT Fleet Technology Limited 6575Vol 3.FR
Runway Friction Characteristics Measurement and Aircraft Braking (RuFAB) 41 Volume 3 – Functional Friction
Consequently, for a scientific consolidation of harmonization, one possible way to overcome these problems is the following combination:
(a) if a suitably well defined and precise formula is available to quantify the effects of one or more of the parameters causing measurement variations, the formula can be used and built into the harmonization model to compensate for these differences in the friction measurement devices.
(b) parameters that cannot be suitably modelled should be standardized using appropriate technical specifications. This would thus eliminate those sources of variation.
3.6.3 Harmonization Trials
Several studies have investigated the correlation among the different devices as a function of a subset of the previously analyzed parameters (Table 3.3). These trials were focussed on establishing empirical relationships among devices with no, or limited, physical or engineering models for them being incorporated in the analyses. The trials concurrently measured data from a number of devices with simple or more complex (at times) statistical regression models.
Table 3.3: Relevant References Regarding Harmonization Trials
Serial Reference Particulars
1 Wambold J. C., Antle C. E., Henry J. J. & Rado Z.; “International PIARC experiment to compare and harmonize texture and skid resistance measurements.” 01.04.T. PIARC. 1995.
2 Comparison of GripTester and Saab SFT Measurements, Transport Canada report.
3 TP 14190E NASA Wallops Tire/Runway Friction Workshops: 1993-2002.
4 Van ES, G.H.W.: “Correlation of self-wetting Friction Measuring devices: Evaluation of the ESDU method”, CROW, Report 03-10, Ede, The Netherlands, 2003.
5 “Correlation Trial and Harmonization Modeling of Friction Measurements on Runways 2005”, CROW Report 06-02, Ede The Netherlands, 2006.
6 Friction Workshop held at LCPC Centre de Nantes, France (June 2004).
7 “Correlation Trial of Self-Wetting Friction-Measuring Devices for Dutch Airfield Pavements”, CROW Report 04-05, Ede, The Netherlands, 2004.
8 “Qualification Protocol for Candidate Self-Wetting Friction-Measuring Devices on Dutch Airfields”, CROW Report D06-05.
9 ASTM E1960-98 Standard Practice for Calculating International Friction Index of a Pavement Surface.
10 ASTM E 2100-00 Standard Practice for Calculating the International Runway Friction Index.
11 Harmonization of European Routine and research Measuring Equipment for Skid Resistance FEHRL Report 2006/01.
12 Example of statistical analysis of wet runway friction: aircraft with limited set of test data, ESDU 99017.
13 Example of statistical analysis of wet runway friction: ground-test machine data, ESDU 00018.
14 Example of statistical analysis of wet runway friction: aircraft with extensive set of test data, ESDU 99016.
15 Statistical analysis of wet runway friction for aircraft and ground-test machines, ESDU 99015.
16 Frictional and retarding forces on aircraft tyres. Part I: Introduction, ESDU 71025.
17 Frictional and retarding forces on aircraft tyres. Part II: Estimation of braking force, ESDU 71026.
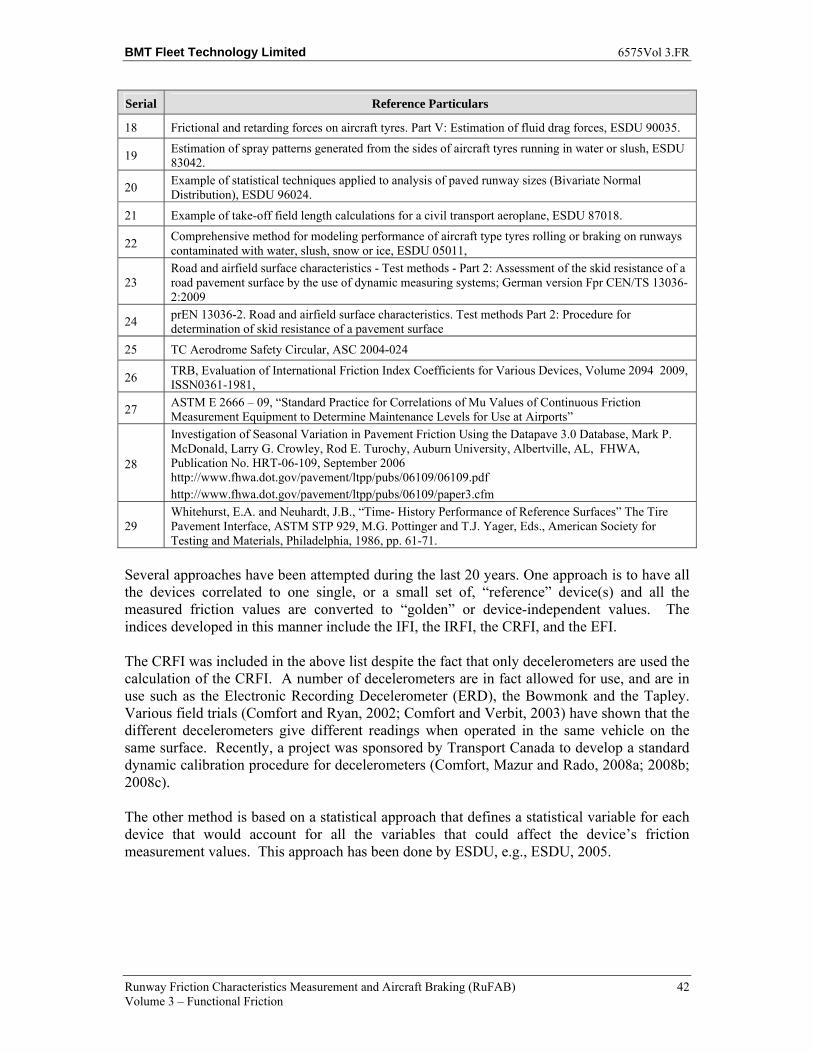
BMT Fleet Technology Limited 6575Vol 3.FR
Runway Friction Characteristics Measurement and Aircraft Braking (RuFAB) 42 Volume 3 – Functional Friction
Serial Reference Particulars
18 Frictional and retarding forces on aircraft tyres. Part V: Estimation of fluid drag forces, ESDU 90035.
19 Estimation of spray patterns generated from the sides of aircraft tyres running in water or slush, ESDU 83042.
20 Example of statistical techniques applied to analysis of paved runway sizes (Bivariate Normal Distribution), ESDU 96024.
21 Example of take-off field length calculations for a civil transport aeroplane, ESDU 87018.
22 Comprehensive method for modeling performance of aircraft type tyres rolling or braking on runways contaminated with water, slush, snow or ice, ESDU 05011,
23 Road and airfield surface characteristics - Test methods - Part 2: Assessment of the skid resistance of a road pavement surface by the use of dynamic measuring systems; German version Fpr CEN/TS 13036-2:2009
24 prEN 13036-2. Road and airfield surface characteristics. Test methods Part 2: Procedure for determination of skid resistance of a pavement surface
25 TC Aerodrome Safety Circular, ASC 2004-024
26 TRB, Evaluation of International Friction Index Coefficients for Various Devices, Volume 2094 2009, ISSN0361-1981,
27 ASTM E 2666 – 09, “Standard Practice for Correlations of Mu Values of Continuous Friction Measurement Equipment to Determine Maintenance Levels for Use at Airports”
28
Investigation of Seasonal Variation in Pavement Friction Using the Datapave 3.0 Database, Mark P. McDonald, Larry G. Crowley, Rod E. Turochy, Auburn University, Albertville, AL, FHWA, Publication No. HRT-06-109, September 2006 http://www.fhwa.dot.gov/pavement/ltpp/pubs/06109/06109.pdf http://www.fhwa.dot.gov/pavement/ltpp/pubs/06109/paper3.cfm
29 Whitehurst, E.A. and Neuhardt, J.B., “Time- History Performance of Reference Surfaces” The Tire Pavement Interface, ASTM STP 929, M.G. Pottinger and T.J. Yager, Eds., American Society for Testing and Materials, Philadelphia, 1986, pp. 61-71.
Several approaches have been attempted during the last 20 years. One approach is to have all the devices correlated to one single, or a small set of, “reference” device(s) and all the measured friction values are converted to “golden” or device-independent values. The indices developed in this manner include the IFI, the IRFI, the CRFI, and the EFI.
The CRFI was included in the above list despite the fact that only decelerometers are used the calculation of the CRFI. A number of decelerometers are in fact allowed for use, and are in use such as the Electronic Recording Decelerometer (ERD), the Bowmonk and the Tapley. Various field trials (Comfort and Ryan, 2002; Comfort and Verbit, 2003) have shown that the different decelerometers give different readings when operated in the same vehicle on the same surface. Recently, a project was sponsored by Transport Canada to develop a standard dynamic calibration procedure for decelerometers (Comfort, Mazur and Rado, 2008a; 2008b; 2008c).
The other method is based on a statistical approach that defines a statistical variable for each device that would account for all the variables that could affect the device’s friction measurement values. This approach has been done by ESDU, e.g., ESDU, 2005.
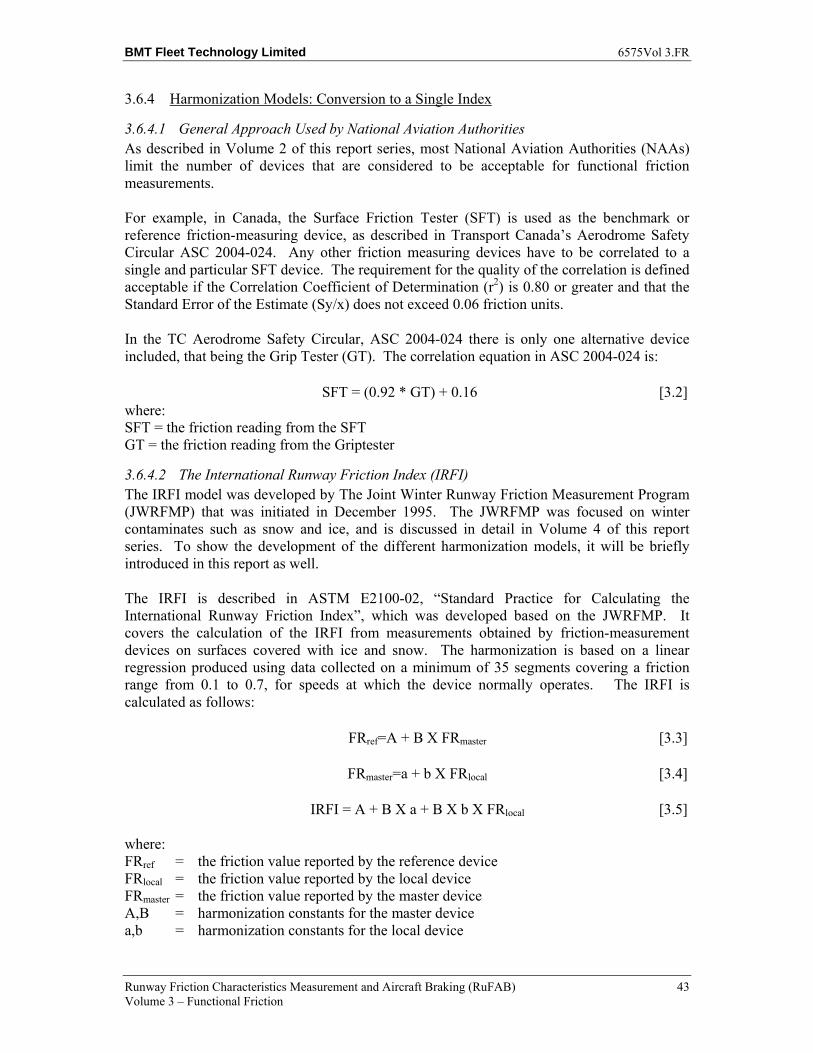
BMT Fleet Technology Limited 6575Vol 3.FR
Runway Friction Characteristics Measurement and Aircraft Braking (RuFAB) 43 Volume 3 – Functional Friction
3.6.4 Harmonization Models: Conversion to a Single Index
3.6.4.1 General Approach Used by National Aviation Authorities As described in Volume 2 of this report series, most National Aviation Authorities (NAAs) limit the number of devices that are considered to be acceptable for functional friction measurements.
For example, in Canada, the Surface Friction Tester (SFT) is used as the benchmark or reference friction-measuring device, as described in Transport Canada’s Aerodrome Safety Circular ASC 2004-024. Any other friction measuring devices have to be correlated to a single and particular SFT device. The requirement for the quality of the correlation is defined acceptable if the Correlation Coefficient of Determination (r2) is 0.80 or greater and that the Standard Error of the Estimate (Sy/x) does not exceed 0.06 friction units.
In the TC Aerodrome Safety Circular, ASC 2004-024 there is only one alternative device included, that being the Grip Tester (GT). The correlation equation in ASC 2004-024 is:
SFT = (0.92 * GT) + 0.16 [3.2] where: SFT = the friction reading from the SFT GT = the friction reading from the Griptester
3.6.4.2 The International Runway Friction Index (IRFI) The IRFI model was developed by The Joint Winter Runway Friction Measurement Program (JWRFMP) that was initiated in December 1995. The JWRFMP was focused on winter contaminates such as snow and ice, and is discussed in detail in Volume 4 of this report series. To show the development of the different harmonization models, it will be briefly introduced in this report as well.
The IRFI is described in ASTM E2100-02, “Standard Practice for Calculating the International Runway Friction Index”, which was developed based on the JWRFMP. It covers the calculation of the IRFI from measurements obtained by friction-measurement devices on surfaces covered with ice and snow. The harmonization is based on a linear regression produced using data collected on a minimum of 35 segments covering a friction range from 0.1 to 0.7, for speeds at which the device normally operates. The IRFI is calculated as follows:
FRref=A + B X FRmaster [3.3]
FRmaster=a + b X FRlocal [3.4]
IRFI = A + B X a + B X b X FRlocal [3.5]
where: FRref = the friction value reported by the reference device FRlocal = the friction value reported by the local device FRmaster = the friction value reported by the master device A,B = harmonization constants for the master device a,b = harmonization constants for the local device
BMT Fleet Technology Limited 6575Vol 3.FR
Runway Friction Characteristics Measurement and Aircraft Braking (RuFAB) 44 Volume 3 – Functional Friction
3.6.4.3 The International Friction Index (IFI) The IFI was developed during the PIARC International Experiment in 1992-1995, and it was one of the main results of the PIARC program. The aim of the experiment was to test many different existing devices on real road surfaces covering a wide range of surface characteristics and materials. Texture measurements had to be associated with the data in order to allow compensation for the different sensitivity of the various friction measurement principles to micro- and macro-texture.
ASTM E1960-98 (“Standard Practice for Calculating International Friction Index of a Pavement Surface”), was developed based on the IFI. The harmonization procedure is as follows:
Sp = a + b X MPD [3.6]
FR60 = FRS exp [(S – 60)/Sp] [3.7]
F60 = A + B X FR60 [3.8]
F60 = A + B X FRS X exp [-(60-S)/(14.2+89.7 MPD)] [3.9]
IFI ( F60, Sp) [3.10]
where: MPD – Mean Profile Depth measured Sp – Speed constants FRS – Friction value measured by the equipment at the slip speed S S – The slip speed the of the measurement FR60 – The adjusted value of friction from a slip speed of S to 60 km/h for the equipment A,B – A,B constants from the linear regression between FR60 and F60 measured on at
least 10 pavements having a range of macro-texture and micro-texture. This standard also includes a dynamic calibration of the devices as follows:
Sp = 14.2 + 89.7 MPD [3.11]
F60 = 0.081 + 0.732 DFT20 exp(-40/Sp) [3.12]
FR60 = FRS exp [(S – 60)/Sp] [3.13]
F60 = A + B X FR60 [3.14]
where: MPD = Mean Profile Depth measured according to ASTM Test Method E 1845 DFT20 = friction value measured according to ASTM Test Method E 1911
BMT Fleet Technology Limited 6575Vol 3.FR
Runway Friction Characteristics Measurement and Aircraft Braking (RuFAB) 45 Volume 3 – Functional Friction
3.6.4.4 The European Friction Index (EFI) This was the next generation of harmonization model, and it was based on the IFI’s principles. The European Project, called Harmonization of European Routine and Research Measuring Equipment for Skid Resistance of Roads and Runways (HERMES), was organized by the Forum of European National Highway Research Laboratories (FEHRL), and is reported in FEHRL, 2006.
The EFI is defined as:
EFI = A+ B × F30 [3.15]
in which
F30 = F × exp[( S – 30)/S0] [3.16]
This gives the following general equation:
EFI = A + B × F × exp[( S – 30)/S0] [3.17]
F30 is the measured friction coefficient, F, brought to the 30 km/h reference slip speed using the predicted value of S0 given by the equation:
S0 = a + b ×MPD [3.18]
It is seen that the only difference between EFI and IFI is that instead of F60, F30 is used for the EFI.
Three different calibration procedures were introduced in the EFI calibration procedure:
(a) Type 1: Periodic calibration of subsets of reference devices to ensure the time stability of the reference values.
(b) Type 2: New device runs alongside existing reference devices and initial “A” and “B” values are calculated for the new device, therefore the new device become a reference device.
(c) Type 3: A device has been calibrated to a reference device.
In the calibration procedure instead of calculating the devices A, B constants to one reference device, it is calculated based on the average of the measurements of the several reference devices. It also takes into account the standard deviation for each device on each surface and discards those measurements that do not fulfill certain standard deviation requirements (FEHRL, 2006).
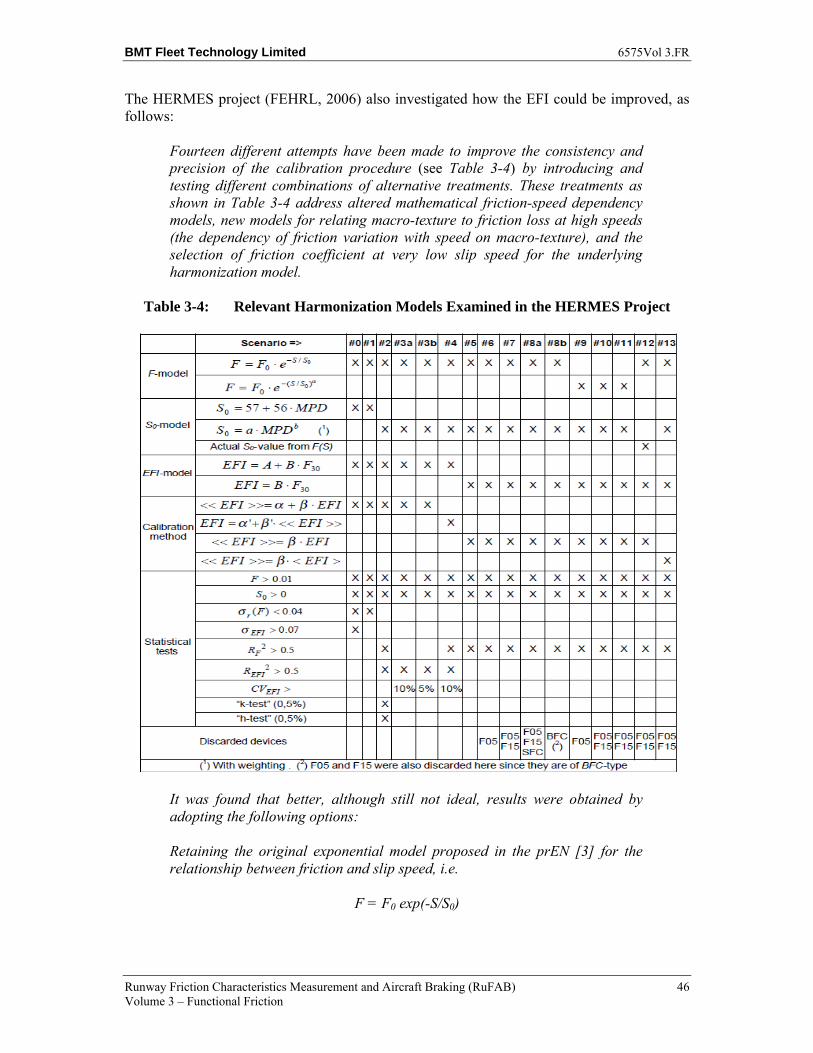
BMT Fleet Technology Limited 6575Vol 3.FR
Runway Friction Characteristics Measurement and Aircraft Braking (RuFAB) 46 Volume 3 – Functional Friction
The HERMES project (FEHRL, 2006) also investigated how the EFI could be improved, as follows:
Fourteen different attempts have been made to improve the consistency and precision of the calibration procedure (see Table 3-4) by introducing and testing different combinations of alternative treatments. These treatments as shown in Table 3-4 address altered mathematical friction-speed dependency models, new models for relating macro-texture to friction loss at high speeds (the dependency of friction variation with speed on macro-texture), and the selection of friction coefficient at very low slip speed for the underlying harmonization model.
Table 3-4: Relevant Harmonization Models Examined in the HERMES Project
It was found that better, although still not ideal, results were obtained by adopting the following options:
Retaining the original exponential model proposed in the prEN [3] for the relationship between friction and slip speed, i.e.
F = F0 exp(-S/S0)
BMT Fleet Technology Limited 6575Vol 3.FR
Runway Friction Characteristics Measurement and Aircraft Braking (RuFAB) 47 Volume 3 – Functional Friction
Use a new model for the relationship between texture depth (expressed as MPD) and the speed parameter S0, with device-specific coefficients “a” and “b”, i.e.
S0 = a *MPDb
Apply the following weighting in the regression calculation to determine “a” and “b”:
w = (S0 /σSo )2
where σSo is the residual standard deviation of S0 with respect to the exponential regression of F against S.
In the definition of EFI, “A” is forced to zero to give:
EFI = B * F30
Both in the regression F(S) and in the regression yielding the value of “B”, the correlation coefficient R2 must be higher than 0,5 otherwise, the corresponding measurement series is discarded.
In the same project, the following new proposal was developed for the revision of EFI (prEN 13036-2-Annex B [28]), in FEHRL, 2006.
The estimate of the Skid Resistance Index (SRI) should be computed by means of the following equations
SRI = B x F exp[(S -30 / S0]
with
S0 = a x MPDb
where F – the measured friction coefficient at slip speed S. a, b and B – are parameters specific to the friction measuring device used.
From a MTD value, one can best estimate MPD by the formula:
MPD = (5MTD -1) / 4 for MTD > 0,2
MPD= 0 for MTD < 0,2
which has been obtained by correlating MTD with MPD [Wambold, 1995].
Let N be the total number of participating devices, NR the number of reference devices among the latter and n the number of surfaces tested. For each measurement series, calculate the linear regression of ln F vs. S:
BMT Fleet Technology Limited 6575Vol 3.FR
Runway Friction Characteristics Measurement and Aircraft Braking (RuFAB) 48 Volume 3 – Functional Friction
ln F = ln F0 - S / S0
which yields n*N values of S0 along with the corresponding correlation coefficients R2. Discard from any further calculation the measurement series with R2 lower than 0,5. Calculate the standard deviation σ of S0 by means of the following formula:
∑ ∑ ∑∑ ∑
with
∑
For each device, calculate the weighted linear regression of ln S0 vs. ln MPD:
w lnS0 = w lna + w b ln MPD
using the following weighting coefficient:
w =( S0 /σ)2
The result of that calculation is assigning a set of specific parameters (a, b) to each device.
From each remaining measurement series, using the current (“old”) Bi values and the newly determined ai and bi values, calculate the average of the r values of SRI, which yields <SRI>ij.
For each surface (j), calculate the “Grand Average” <<SRI>>j of the NR average values of the <SRI>ij reported by the reference devices only.
For each device (i), compute the linear regression of <<SRI>> versus <SRI> with zero intercept:
<< SRI >>= βi < SRI > (i=1,…, N)
On completion of the calibration exercise, the old Bi value for device (i) should be changed to the new value by means of the following formula:
βi,new = βiBi,old ”
BMT Fleet Technology Limited 6575Vol 3.FR
Runway Friction Characteristics Measurement and Aircraft Braking (RuFAB) 49 Volume 3 – Functional Friction
3.6.5 Harmonization Models: Statistical Approach
Each of the above models falls into the category where all the devices have been correlated to one or more reference devices and all the measured values have been converted to one “golden” reference value. The other main type of method is based on a statistical approach that defines a statistical variable for each device that would account for all the variables that could affect the device’s friction measurement values. This approach has been done by ESDU, 2005.
The ESDU model was developed by the Engineering Sciences Data Unit (ESDU) company for representing and relating the braking performances of aircraft and ground-test machines in wet conditions (ESDU, 2005). The method is essentially statistical and implies that there is a clearly-defined level of probability that can be deduced from test runs of an aircraft or ground-test machine in a given set of wetness conditions on a particular runway. If the runway macro-texture depth is known, then the parameter that defines the variation of effective coefficient of braking friction in the given conditions can be readily calculated from a pre-determined friction database.
The method is comprised of two distinct phases (Figure 3.11).
The first is the establishment of separate friction databases for the aircraft and for the ground friction-test machine. The second is to predict operational braking performance of the aircraft from day-to-day measurements from the ground-test machine. Note that in the ESDU method, emphasis is placed on the correlation between the ground friction vehicle and the aircraft. The potential of this method for correlating different ground friction vehicles has not yet been investigated1).
This method assumes the following functions between:
μ coefficient of friction V ground speed p inflation pressure ρ surface contaminant density where: μdatum is coefficient of friction at zero ground speed on a dry surface, which is estimated from friction measurements made on a dry surface at low speed.
β is an empirical variable
Each β is an empirical variable that can be combined with the corresponding macro texture, d, of the tested wetted surface to define the κ runway interaction parameter:
dβκ =
1 ESDU engineers indicated that their method should be able to handle correlations between different ground-test machines.
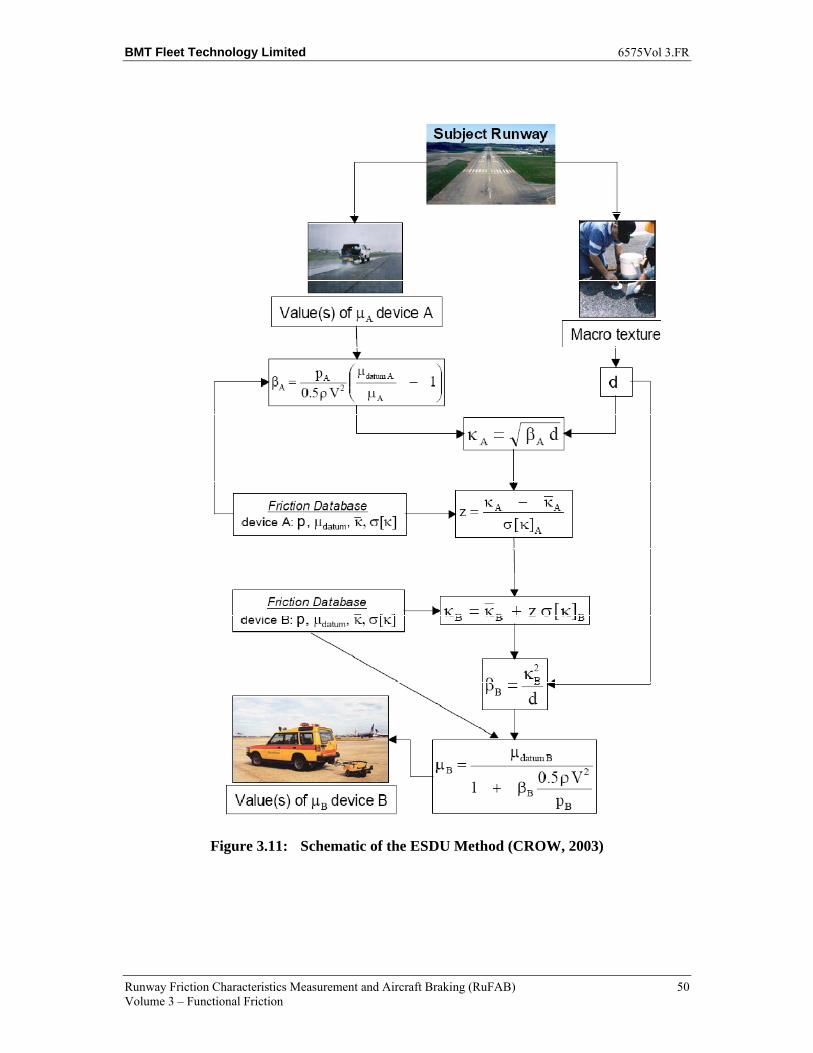
BMT Fleet Technology Limited 6575Vol 3.FR
Runway Friction Characteristics Measurement and Aircraft Braking (RuFAB) 50 Volume 3 – Functional Friction
Figure 3.11: Schematic of the ESDU Method (CROW, 2003)
BMT Fleet Technology Limited 6575Vol 3.FR
Runway Friction Characteristics Measurement and Aircraft Braking (RuFAB) 51 Volume 3 – Functional Friction
The runway interaction parameter should conform to a normal distribution given by
][κσκκ z+=
where
κ the mean value
σ[κ] the standard deviation z the percentage point of the normal distribution
For each friction measuring device, the κ , σ[κ] μdatum can be obtained and used to correlate any two devices A and B with the following form:
][
)(
][
)(
B
BB
A
AA rκσ
κκκσ
κκ −=
−
If the correlation exists and the r correlation coefficient is tested to be significant, then the values of κ of the two devices A and B are normally correlated. The significance of the correlation can be tested using the Spearman rank order correlation method.
The most recent addition to the harmonization models is ASTM E2666 – 09, “Standard Practice for Correlations of Mu Values of Continuous Friction Measurement Equipment to Determine Maintenance Levels for Use at Airports”, which is newly-developed. This harmonization is based on the FAA’s Mark II Mu meter and the ICAO Annex 14 Sup A table that was developed for this measuring device. A summary of this model (ASTM E2666 – 09) follows:
“Since the benchmark (FAA’s Mark II Mu Meter) was retired in early 1990s, a new measure of friction had to be found that could be correlated back to the Boeing 727 friction requirements for the different maintenance levels. Fifteen years of NASA Wallops testing data was studied to find a measure that could be related to the Mark II Mu Meter. Of all the friction measurements made since 1993, only the International Friction Index (IFI)4 (1, 2)5 F60 values were found to be stable and repeatable over the 15 years. To establish a correlation between 1990 based values and the present, the IFI was employed. The IFI was developed to compare and harmonize friction measurements taken with different equipment to a common calibrated index expressed as calibrated wet friction at 60 km/h (F60) and the speed constant (Sp). Using data from a 1993 NASA friction workshop, the FAA’s Mark II Mu Meter was used to determine the IFI friction values, called FM60 and SMp, associated with each of the maintenance classifications. These IFI friction values which are now fixed in time and can be used from 1993 forward to determine what a CFME must measure to satisfy each of the maintenance classifications.
A CFME is calibrated to IFI per Practice E 1960. The IFI constant values (A and B) found for the CFME are used to determine what the CFME’s must measure (FB65(S)) for each maintenance classification.
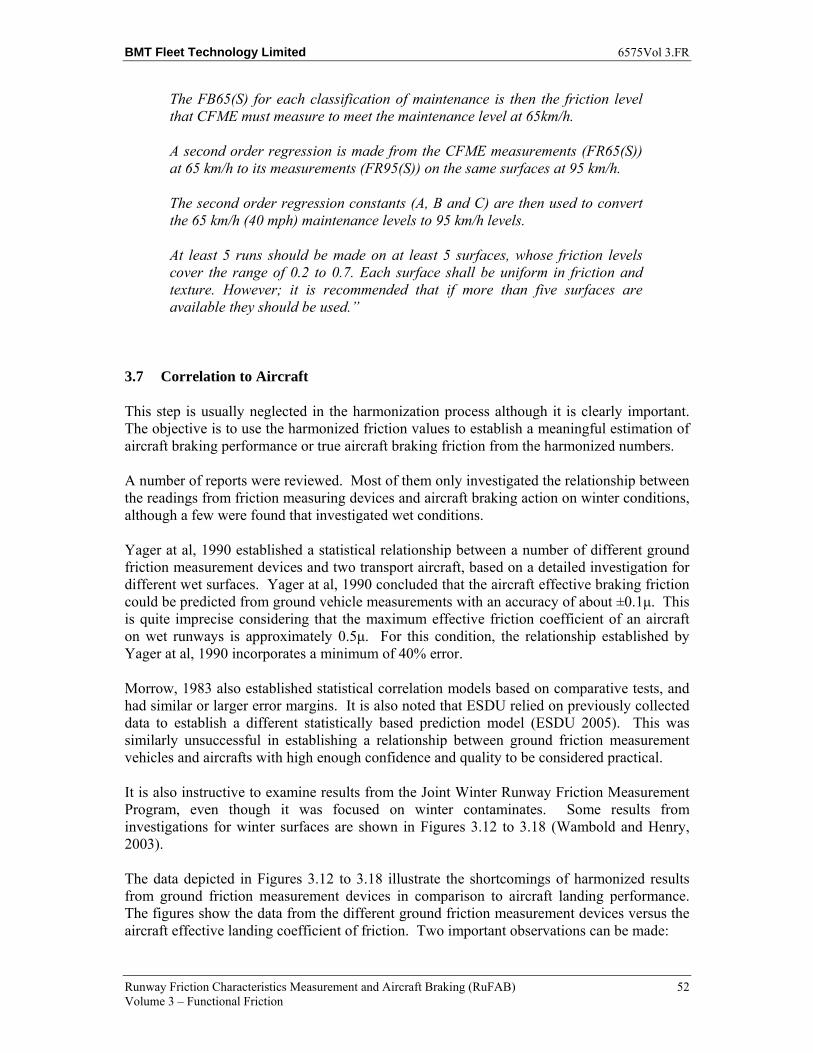
BMT Fleet Technology Limited 6575Vol 3.FR
Runway Friction Characteristics Measurement and Aircraft Braking (RuFAB) 52 Volume 3 – Functional Friction
The FB65(S) for each classification of maintenance is then the friction level that CFME must measure to meet the maintenance level at 65km/h.
A second order regression is made from the CFME measurements (FR65(S)) at 65 km/h to its measurements (FR95(S)) on the same surfaces at 95 km/h.
The second order regression constants (A, B and C) are then used to convert the 65 km/h (40 mph) maintenance levels to 95 km/h levels.
At least 5 runs should be made on at least 5 surfaces, whose friction levels cover the range of 0.2 to 0.7. Each surface shall be uniform in friction and texture. However; it is recommended that if more than five surfaces are available they should be used.”
3.7 Correlation to Aircraft
This step is usually neglected in the harmonization process although it is clearly important. The objective is to use the harmonized friction values to establish a meaningful estimation of aircraft braking performance or true aircraft braking friction from the harmonized numbers.
A number of reports were reviewed. Most of them only investigated the relationship between the readings from friction measuring devices and aircraft braking action on winter conditions, although a few were found that investigated wet conditions.
Yager at al, 1990 established a statistical relationship between a number of different ground friction measurement devices and two transport aircraft, based on a detailed investigation for different wet surfaces. Yager at al, 1990 concluded that the aircraft effective braking friction could be predicted from ground vehicle measurements with an accuracy of about ±0.1μ. This is quite imprecise considering that the maximum effective friction coefficient of an aircraft on wet runways is approximately 0.5μ. For this condition, the relationship established by Yager at al, 1990 incorporates a minimum of 40% error.
Morrow, 1983 also established statistical correlation models based on comparative tests, and had similar or larger error margins. It is also noted that ESDU relied on previously collected data to establish a different statistically based prediction model (ESDU 2005). This was similarly unsuccessful in establishing a relationship between ground friction measurement vehicles and aircrafts with high enough confidence and quality to be considered practical.
It is also instructive to examine results from the Joint Winter Runway Friction Measurement Program, even though it was focused on winter contaminates. Some results from investigations for winter surfaces are shown in Figures 3.12 to 3.18 (Wambold and Henry, 2003).
The data depicted in Figures 3.12 to 3.18 illustrate the shortcomings of harmonized results from ground friction measurement devices in comparison to aircraft landing performance. The figures show the data from the different ground friction measurement devices versus the aircraft effective landing coefficient of friction. Two important observations can be made:
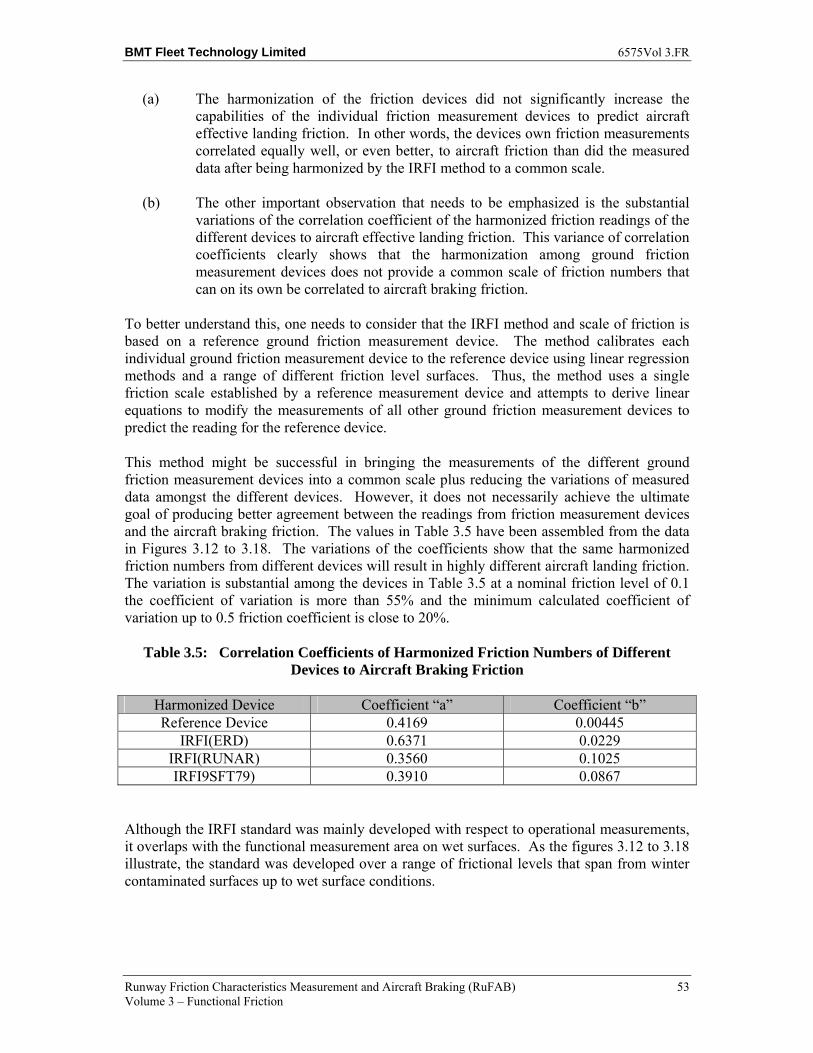
BMT Fleet Technology Limited 6575Vol 3.FR
Runway Friction Characteristics Measurement and Aircraft Braking (RuFAB) 53 Volume 3 – Functional Friction
(a) The harmonization of the friction devices did not significantly increase the capabilities of the individual friction measurement devices to predict aircraft effective landing friction. In other words, the devices own friction measurements correlated equally well, or even better, to aircraft friction than did the measured data after being harmonized by the IRFI method to a common scale.
(b) The other important observation that needs to be emphasized is the substantial variations of the correlation coefficient of the harmonized friction readings of the different devices to aircraft effective landing friction. This variance of correlation coefficients clearly shows that the harmonization among ground friction measurement devices does not provide a common scale of friction numbers that can on its own be correlated to aircraft braking friction.
To better understand this, one needs to consider that the IRFI method and scale of friction is based on a reference ground friction measurement device. The method calibrates each individual ground friction measurement device to the reference device using linear regression methods and a range of different friction level surfaces. Thus, the method uses a single friction scale established by a reference measurement device and attempts to derive linear equations to modify the measurements of all other ground friction measurement devices to predict the reading for the reference device.
This method might be successful in bringing the measurements of the different ground friction measurement devices into a common scale plus reducing the variations of measured data amongst the different devices. However, it does not necessarily achieve the ultimate goal of producing better agreement between the readings from friction measurement devices and the aircraft braking friction. The values in Table 3.5 have been assembled from the data in Figures 3.12 to 3.18. The variations of the coefficients show that the same harmonized friction numbers from different devices will result in highly different aircraft landing friction. The variation is substantial among the devices in Table 3.5 at a nominal friction level of 0.1 the coefficient of variation is more than 55% and the minimum calculated coefficient of variation up to 0.5 friction coefficient is close to 20%.
Table 3.5: Correlation Coefficients of Harmonized Friction Numbers of Different Devices to Aircraft Braking Friction
Harmonized Device Coefficient “a” Coefficient “b” Reference Device 0.4169 0.00445
IRFI(ERD) 0.6371 0.0229 IRFI(RUNAR) 0.3560 0.1025 IRFI9SFT79) 0.3910 0.0867
Although the IRFI standard was mainly developed with respect to operational measurements, it overlaps with the functional measurement area on wet surfaces. As the figures 3.12 to 3.18 illustrate, the standard was developed over a range of frictional levels that span from winter contaminated surfaces up to wet surface conditions.
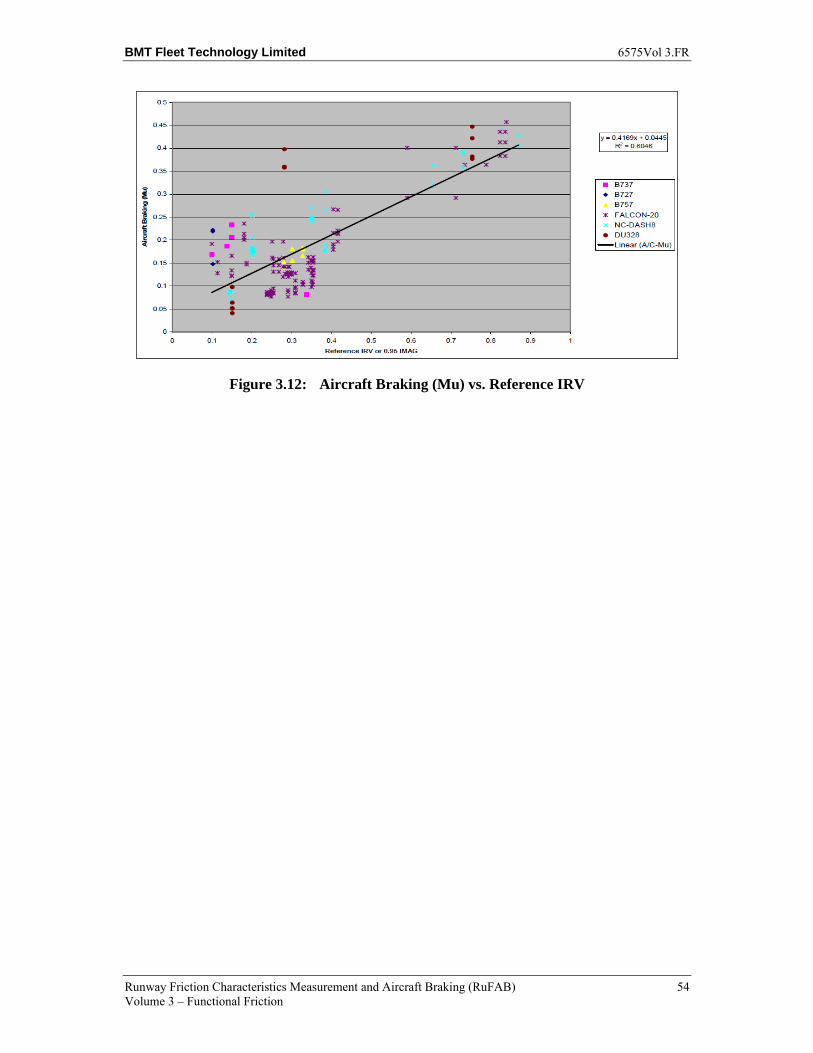
BMT Fleet Technology Limited 6575Vol 3.FR
Runway Friction Characteristics Measurement and Aircraft Braking (RuFAB) 54 Volume 3 – Functional Friction
Figure 3.12: Aircraft Braking (Mu) vs. Reference IRV
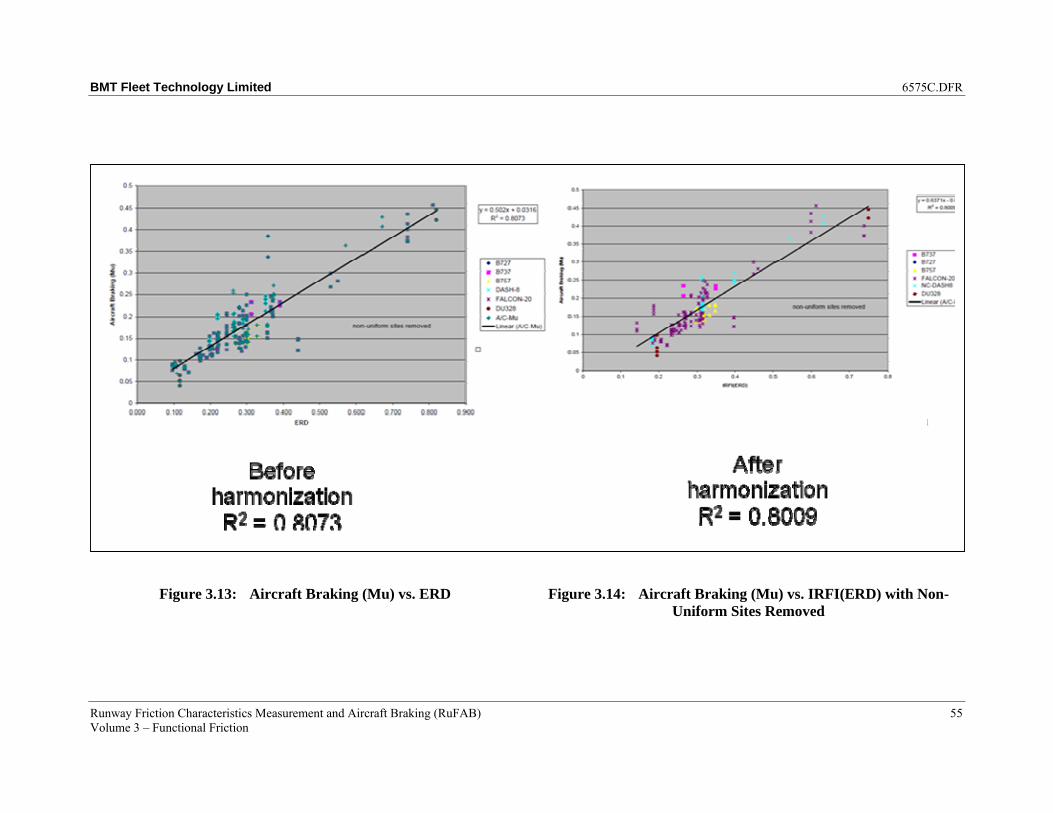
BMT Fleet Technology Limited 6575C.DFR
Runway Friction Characteristics Measurement and Aircraft Braking (RuFAB) 55 Volume 3 – Functional Friction
Figure 3.13: Aircraft Braking (Mu) vs. ERD Figure 3.14: Aircraft Braking (Mu) vs. IRFI(ERD) with Non-Uniform Sites Removed
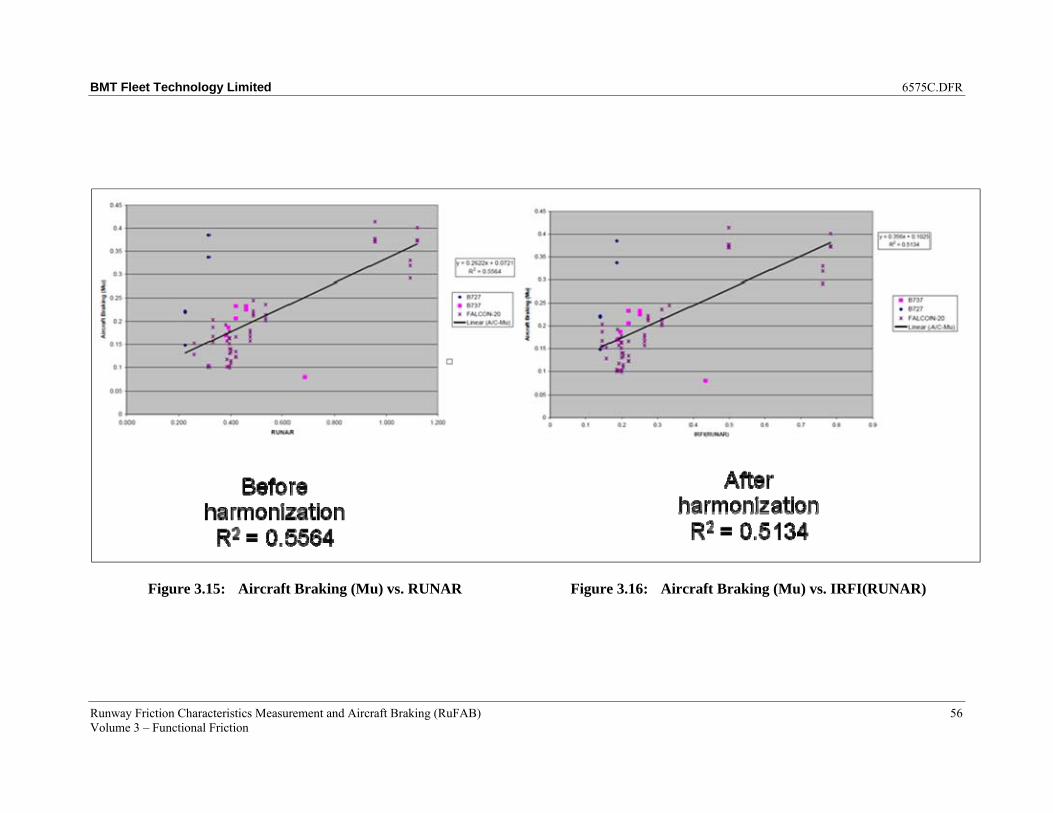
BMT Fleet Technology Limited 6575C.DFR
Runway Friction Characteristics Measurement and Aircraft Braking (RuFAB) 56 Volume 3 – Functional Friction
Figure 3.15: Aircraft Braking (Mu) vs. RUNAR Figure 3.16: Aircraft Braking (Mu) vs. IRFI(RUNAR)
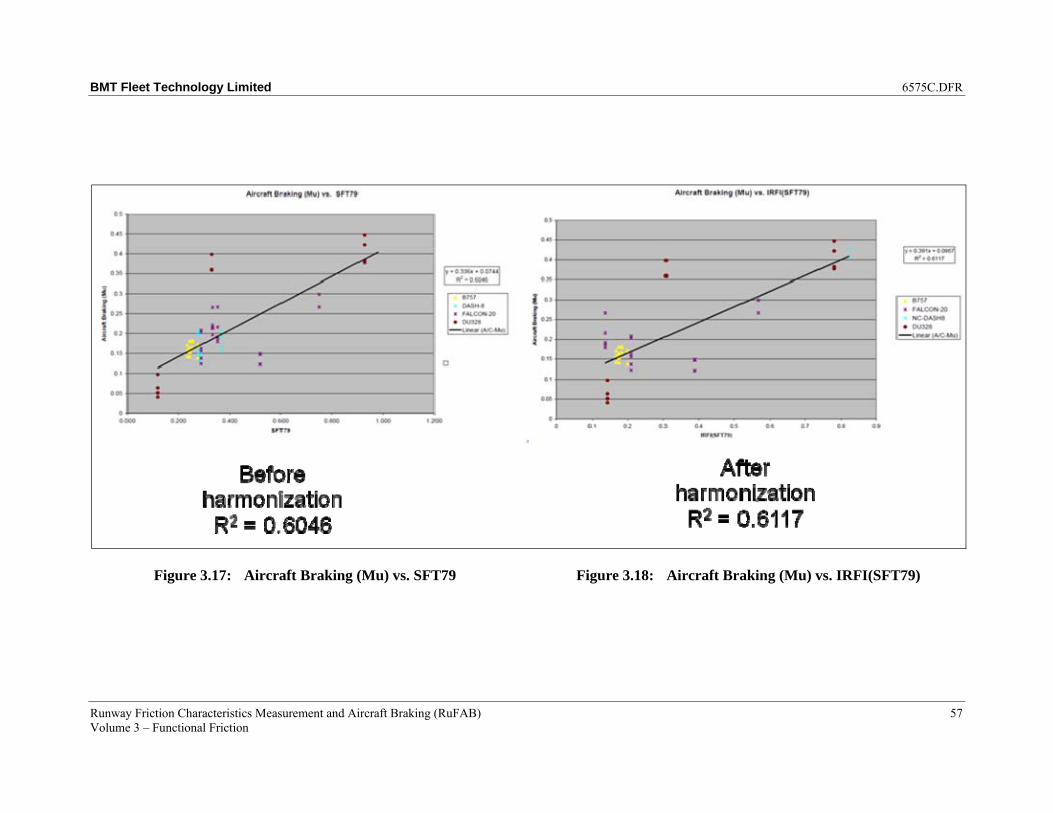
BMT Fleet Technology Limited 6575C.DFR
Runway Friction Characteristics Measurement and Aircraft Braking (RuFAB) 57 Volume 3 – Functional Friction
Figure 3.17: Aircraft Braking (Mu) vs. SFT79 Figure 3.18: Aircraft Braking (Mu) vs. IRFI(SFT79)
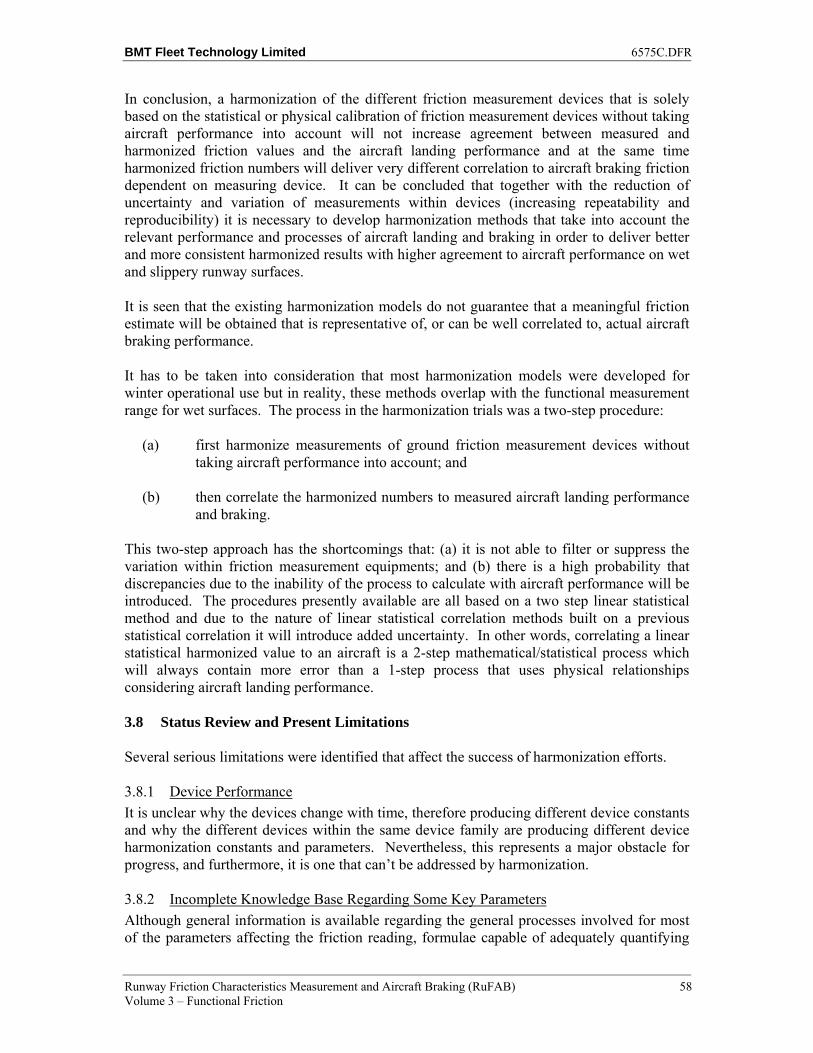
BMT Fleet Technology Limited 6575C.DFR
Runway Friction Characteristics Measurement and Aircraft Braking (RuFAB) 58 Volume 3 – Functional Friction
In conclusion, a harmonization of the different friction measurement devices that is solely based on the statistical or physical calibration of friction measurement devices without taking aircraft performance into account will not increase agreement between measured and harmonized friction values and the aircraft landing performance and at the same time harmonized friction numbers will deliver very different correlation to aircraft braking friction dependent on measuring device. It can be concluded that together with the reduction of uncertainty and variation of measurements within devices (increasing repeatability and reproducibility) it is necessary to develop harmonization methods that take into account the relevant performance and processes of aircraft landing and braking in order to deliver better and more consistent harmonized results with higher agreement to aircraft performance on wet and slippery runway surfaces.
It is seen that the existing harmonization models do not guarantee that a meaningful friction estimate will be obtained that is representative of, or can be well correlated to, actual aircraft braking performance.
It has to be taken into consideration that most harmonization models were developed for winter operational use but in reality, these methods overlap with the functional measurement range for wet surfaces. The process in the harmonization trials was a two-step procedure:
(a) first harmonize measurements of ground friction measurement devices without taking aircraft performance into account; and
(b) then correlate the harmonized numbers to measured aircraft landing performance and braking.
This two-step approach has the shortcomings that: (a) it is not able to filter or suppress the variation within friction measurement equipments; and (b) there is a high probability that discrepancies due to the inability of the process to calculate with aircraft performance will be introduced. The procedures presently available are all based on a two step linear statistical method and due to the nature of linear statistical correlation methods built on a previous statistical correlation it will introduce added uncertainty. In other words, correlating a linear statistical harmonized value to an aircraft is a 2-step mathematical/statistical process which will always contain more error than a 1-step process that uses physical relationships considering aircraft landing performance.
3.8 Status Review and Present Limitations
Several serious limitations were identified that affect the success of harmonization efforts.
3.8.1 Device Performance
It is unclear why the devices change with time, therefore producing different device constants and why the different devices within the same device family are producing different device harmonization constants and parameters. Nevertheless, this represents a major obstacle for progress, and furthermore, it is one that can’t be addressed by harmonization.
3.8.2 Incomplete Knowledge Base Regarding Some Key Parameters
Although general information is available regarding the general processes involved for most of the parameters affecting the friction reading, formulae capable of adequately quantifying
BMT Fleet Technology Limited 6575C.DFR
Runway Friction Characteristics Measurement and Aircraft Braking (RuFAB) 59
the relationships are either incomplete, rudimentary or lacking. Not only is there substantial room for improvement in most models, but also, additional parameters would also need to be included and analyzed in several cases, such as the effect of the water distribution under the tire.
Some trials found that friction values could be well predicted from macro- and micro texture measurements, and the visco-elastic properties of tires. However, since there are practically no devices at present that can measure micro-texture, it is doubtful that these theories can be proven and the formulae defined in the models. This work is in the early stages of development, and insufficient data are available. The problem is compounded by a lack of practical equipment to measure all the necessary parameters for the models. Consequently, it is unclear how these mathematical models can be used in a harmonization process.
3.9 Synopsis of Current/Recent R&D Activities on Harmonization
This section reviews and evaluates the above harmonization models and identifies issues that must be considered for the development of a harmonization model.
As a starting point, the models were reviewed based on the extent to which they reduced the variations between the different friction readings. All of the harmonization models were successful to some extent in reducing the differences. However, the reductions achieved were only slight, and the harmonized results still had significant differences. Fourteen different methods were investigated. Even the best processes and models were far from ideal, and came short of producing usable limits.
Figures 3.19, 3.20 and 3.21 show the results after harmonization on seven different surfaces (CROW, 2006). The difference between the harmonized friction values measured by the different friction devices were still between 0.11 and 0.02.
Figure 3.19: Predicted Harmonized Friction values Using the EDSU model for 40km/h
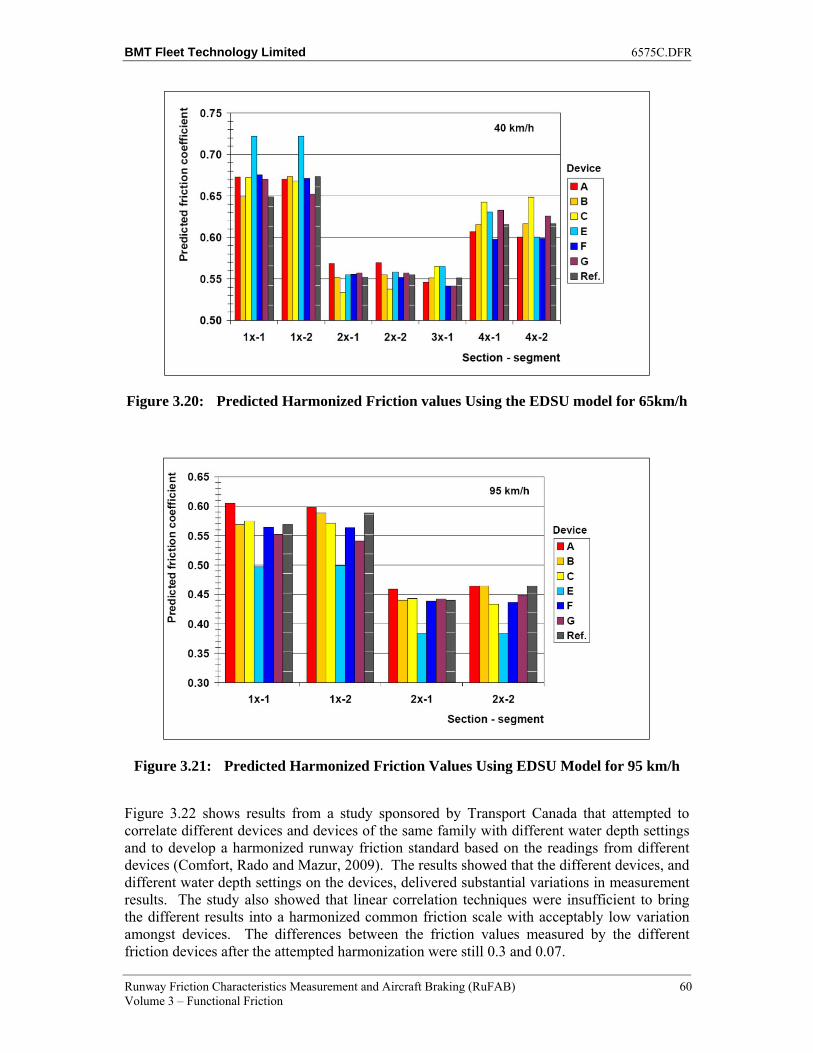
BMT Fleet Technology Limited 6575C.DFR
Runway Friction Characteristics Measurement and Aircraft Braking (RuFAB) 60 Volume 3 – Functional Friction
Figure 3.20: Predicted Harmonized Friction values Using the EDSU model for 65km/h
Figure 3.21: Predicted Harmonized Friction Values Using EDSU Model for 95 km/h
Figure 3.22 shows results from a study sponsored by Transport Canada that attempted to correlate different devices and devices of the same family with different water depth settings and to develop a harmonized runway friction standard based on the readings from different devices (Comfort, Rado and Mazur, 2009). The results showed that the different devices, and different water depth settings on the devices, delivered substantial variations in measurement results. The study also showed that linear correlation techniques were insufficient to bring the different results into a harmonized common friction scale with acceptably low variation amongst devices. The differences between the friction values measured by the different friction devices after the attempted harmonization were still 0.3 and 0.07.
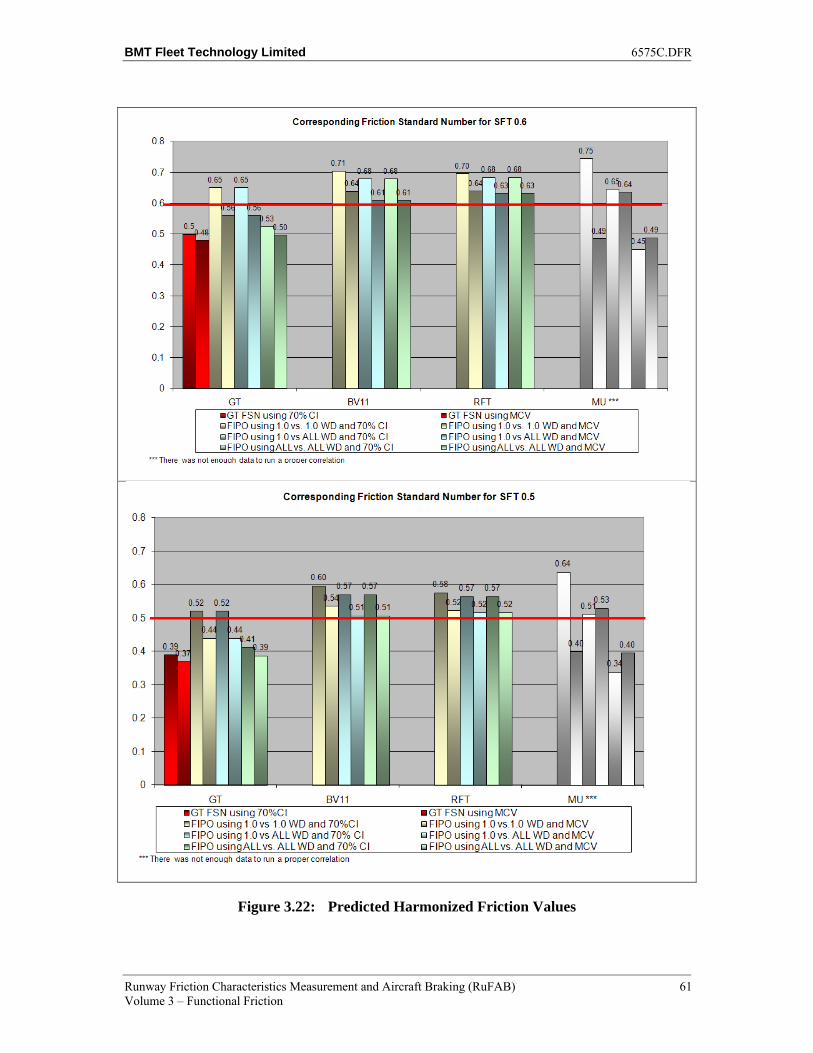
BMT Fleet Technology Limited 6575C.DFR
Runway Friction Characteristics Measurement and Aircraft Braking (RuFAB) 61 Volume 3 – Functional Friction
Figure 3.22: Predicted Harmonized Friction Values
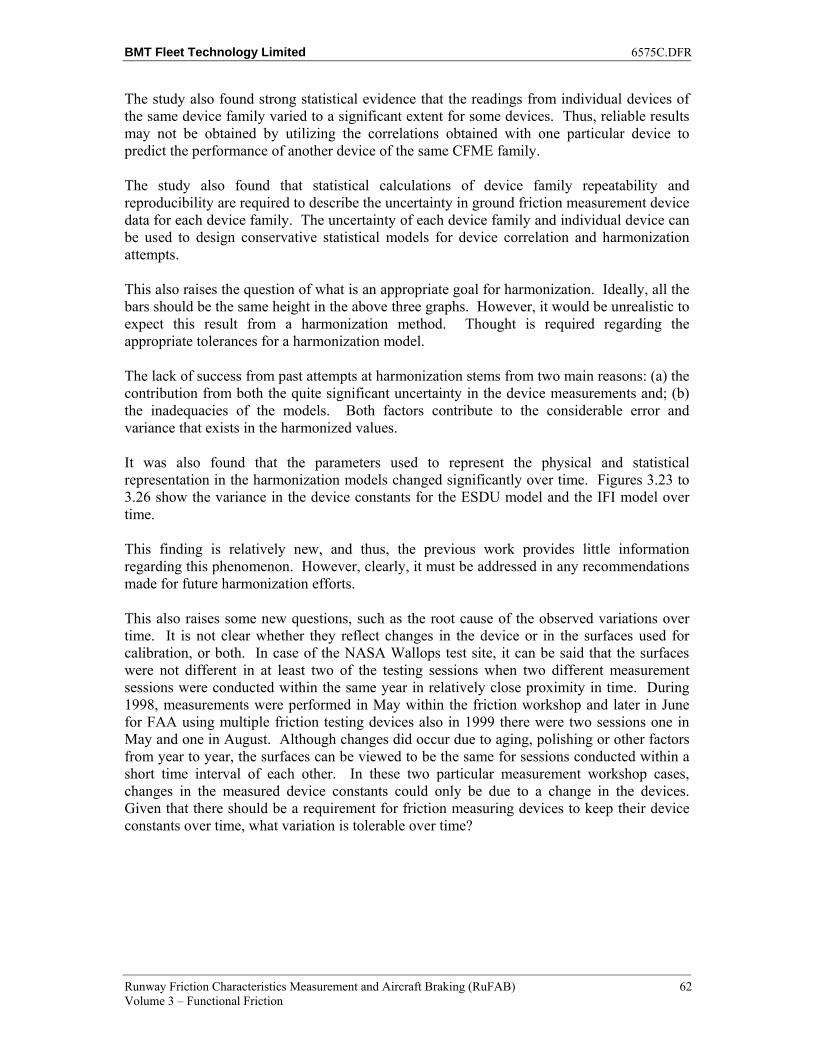
BMT Fleet Technology Limited 6575C.DFR
Runway Friction Characteristics Measurement and Aircraft Braking (RuFAB) 62 Volume 3 – Functional Friction
The study also found strong statistical evidence that the readings from individual devices of the same device family varied to a significant extent for some devices. Thus, reliable results may not be obtained by utilizing the correlations obtained with one particular device to predict the performance of another device of the same CFME family.
The study also found that statistical calculations of device family repeatability and reproducibility are required to describe the uncertainty in ground friction measurement device data for each device family. The uncertainty of each device family and individual device can be used to design conservative statistical models for device correlation and harmonization attempts.
This also raises the question of what is an appropriate goal for harmonization. Ideally, all the bars should be the same height in the above three graphs. However, it would be unrealistic to expect this result from a harmonization method. Thought is required regarding the appropriate tolerances for a harmonization model.
The lack of success from past attempts at harmonization stems from two main reasons: (a) the contribution from both the quite significant uncertainty in the device measurements and; (b) the inadequacies of the models. Both factors contribute to the considerable error and variance that exists in the harmonized values.
It was also found that the parameters used to represent the physical and statistical representation in the harmonization models changed significantly over time. Figures 3.23 to 3.26 show the variance in the device constants for the ESDU model and the IFI model over time.
This finding is relatively new, and thus, the previous work provides little information regarding this phenomenon. However, clearly, it must be addressed in any recommendations made for future harmonization efforts.
This also raises some new questions, such as the root cause of the observed variations over time. It is not clear whether they reflect changes in the device or in the surfaces used for calibration, or both. In case of the NASA Wallops test site, it can be said that the surfaces were not different in at least two of the testing sessions when two different measurement sessions were conducted within the same year in relatively close proximity in time. During 1998, measurements were performed in May within the friction workshop and later in June for FAA using multiple friction testing devices also in 1999 there were two sessions one in May and one in August. Although changes did occur due to aging, polishing or other factors from year to year, the surfaces can be viewed to be the same for sessions conducted within a short time interval of each other. In these two particular measurement workshop cases, changes in the measured device constants could only be due to a change in the devices. Given that there should be a requirement for friction measuring devices to keep their device constants over time, what variation is tolerable over time?
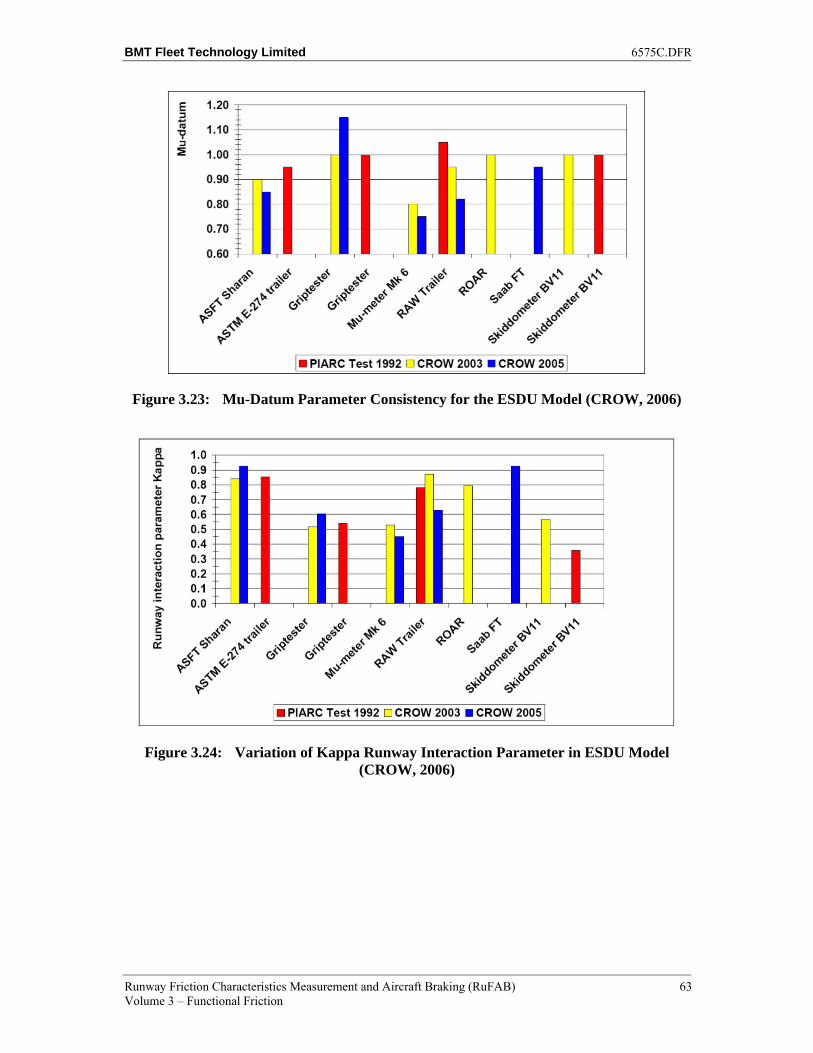
BMT Fleet Technology Limited 6575C.DFR
Runway Friction Characteristics Measurement and Aircraft Braking (RuFAB) 63 Volume 3 – Functional Friction
Figure 3.23: Mu-Datum Parameter Consistency for the ESDU Model (CROW, 2006)
Figure 3.24: Variation of Kappa Runway Interaction Parameter in ESDU Model (CROW, 2006)
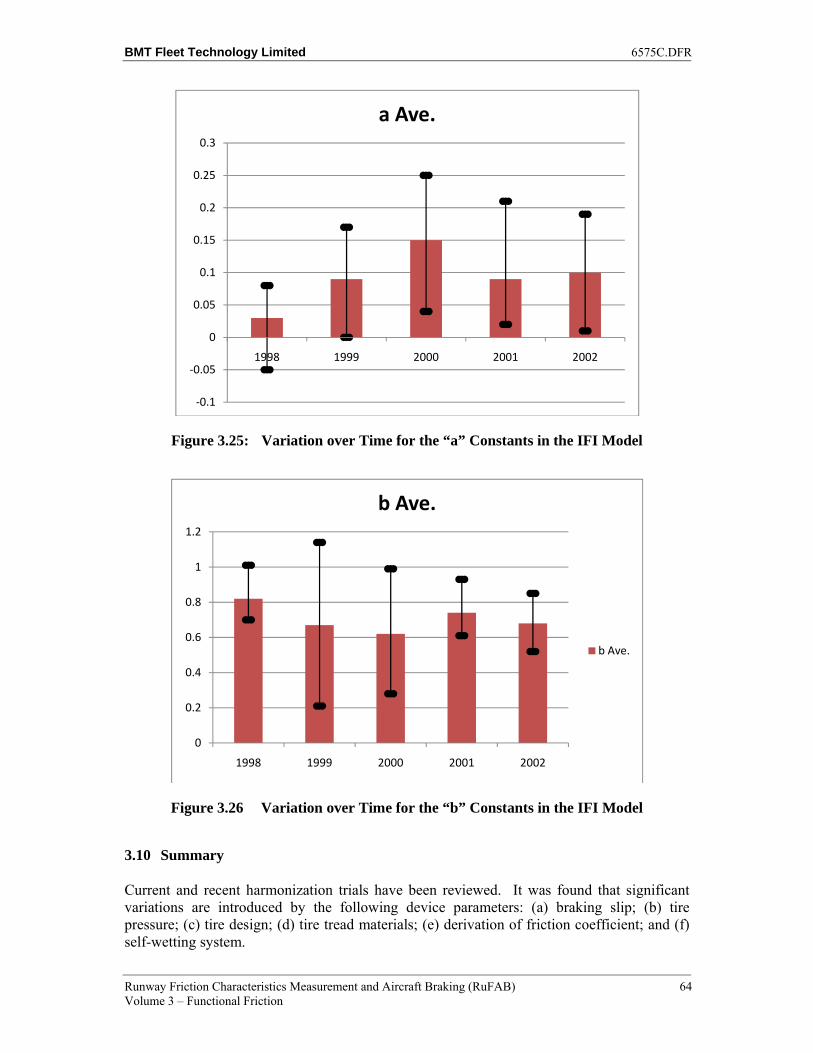
BMT Fleet Technology Limited 6575C.DFR
Runway Friction Characteristics Measurement and Aircraft Braking (RuFAB) 64 Volume 3 – Functional Friction
Figure 3.25: Variation over Time for the “a” Constants in the IFI Model
Figure 3.26 Variation over Time for the “b” Constants in the IFI Model
3.10 Summary
Current and recent harmonization trials have been reviewed. It was found that significant variations are introduced by the following device parameters: (a) braking slip; (b) tire pressure; (c) tire design; (d) tire tread materials; (e) derivation of friction coefficient; and (f) self-wetting system.
-0.1
-0.05
0
0.05
0.1
0.15
0.2
0.25
0.3
1998 1999 2000 2001 2002
a Ave.
0
0.2
0.4
0.6
0.8
1
1.2
1998 1999 2000 2001 2002
b Ave.
b Ave.
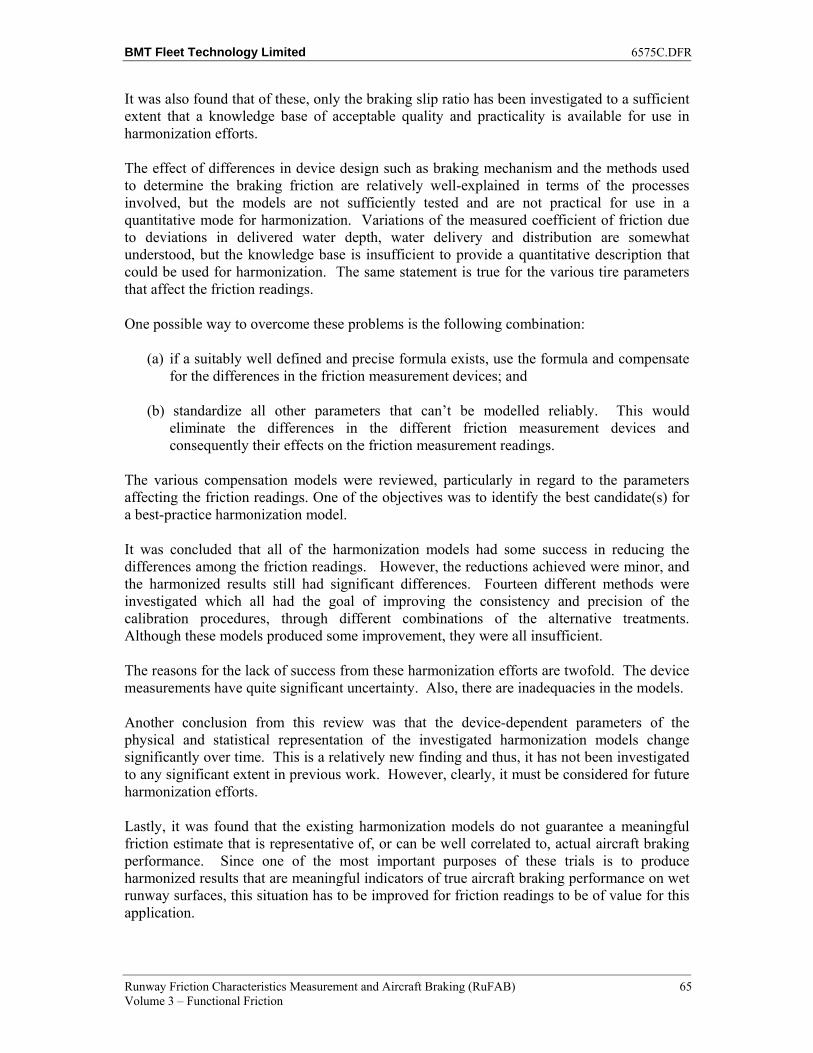
BMT Fleet Technology Limited 6575C.DFR
Runway Friction Characteristics Measurement and Aircraft Braking (RuFAB) 65 Volume 3 – Functional Friction
It was also found that of these, only the braking slip ratio has been investigated to a sufficient extent that a knowledge base of acceptable quality and practicality is available for use in harmonization efforts.
The effect of differences in device design such as braking mechanism and the methods used to determine the braking friction are relatively well-explained in terms of the processes involved, but the models are not sufficiently tested and are not practical for use in a quantitative mode for harmonization. Variations of the measured coefficient of friction due to deviations in delivered water depth, water delivery and distribution are somewhat understood, but the knowledge base is insufficient to provide a quantitative description that could be used for harmonization. The same statement is true for the various tire parameters that affect the friction readings.
One possible way to overcome these problems is the following combination:
(a) if a suitably well defined and precise formula exists, use the formula and compensate for the differences in the friction measurement devices; and
(b) standardize all other parameters that can’t be modelled reliably. This would eliminate the differences in the different friction measurement devices and consequently their effects on the friction measurement readings.
The various compensation models were reviewed, particularly in regard to the parameters affecting the friction readings. One of the objectives was to identify the best candidate(s) for a best-practice harmonization model.
It was concluded that all of the harmonization models had some success in reducing the differences among the friction readings. However, the reductions achieved were minor, and the harmonized results still had significant differences. Fourteen different methods were investigated which all had the goal of improving the consistency and precision of the calibration procedures, through different combinations of the alternative treatments. Although these models produced some improvement, they were all insufficient.
The reasons for the lack of success from these harmonization efforts are twofold. The device measurements have quite significant uncertainty. Also, there are inadequacies in the models.
Another conclusion from this review was that the device-dependent parameters of the physical and statistical representation of the investigated harmonization models change significantly over time. This is a relatively new finding and thus, it has not been investigated to any significant extent in previous work. However, clearly, it must be considered for future harmonization efforts.
Lastly, it was found that the existing harmonization models do not guarantee a meaningful friction estimate that is representative of, or can be well correlated to, actual aircraft braking performance. Since one of the most important purposes of these trials is to produce harmonized results that are meaningful indicators of true aircraft braking performance on wet runway surfaces, this situation has to be improved for friction readings to be of value for this application.
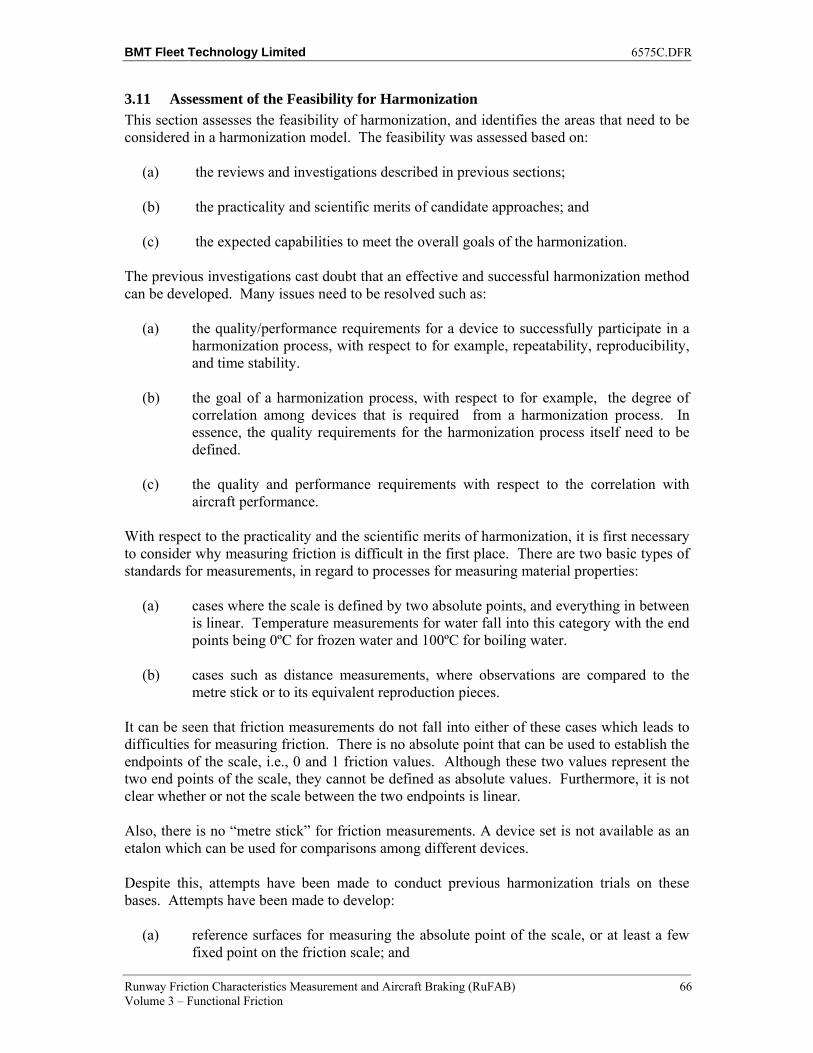
BMT Fleet Technology Limited 6575C.DFR
Runway Friction Characteristics Measurement and Aircraft Braking (RuFAB) 66 Volume 3 – Functional Friction
3.11 Assessment of the Feasibility for Harmonization
This section assesses the feasibility of harmonization, and identifies the areas that need to be considered in a harmonization model. The feasibility was assessed based on:
(a) the reviews and investigations described in previous sections;
(b) the practicality and scientific merits of candidate approaches; and
(c) the expected capabilities to meet the overall goals of the harmonization.
The previous investigations cast doubt that an effective and successful harmonization method can be developed. Many issues need to be resolved such as:
(a) the quality/performance requirements for a device to successfully participate in a harmonization process, with respect to for example, repeatability, reproducibility, and time stability.
(b) the goal of a harmonization process, with respect to for example, the degree of correlation among devices that is required from a harmonization process. In essence, the quality requirements for the harmonization process itself need to be defined.
(c) the quality and performance requirements with respect to the correlation with aircraft performance.
With respect to the practicality and the scientific merits of harmonization, it is first necessary to consider why measuring friction is difficult in the first place. There are two basic types of standards for measurements, in regard to processes for measuring material properties:
(a) cases where the scale is defined by two absolute points, and everything in between is linear. Temperature measurements for water fall into this category with the end points being 0ºC for frozen water and 100ºC for boiling water.
(b) cases such as distance measurements, where observations are compared to the metre stick or to its equivalent reproduction pieces.
It can be seen that friction measurements do not fall into either of these cases which leads to difficulties for measuring friction. There is no absolute point that can be used to establish the endpoints of the scale, i.e., 0 and 1 friction values. Although these two values represent the two end points of the scale, they cannot be defined as absolute values. Furthermore, it is not clear whether or not the scale between the two endpoints is linear.
Also, there is no “metre stick” for friction measurements. A device set is not available as an etalon which can be used for comparisons among different devices.
Despite this, attempts have been made to conduct previous harmonization trials on these bases. Attempts have been made to develop:
(a) reference surfaces for measuring the absolute point of the scale, or at least a few fixed point on the friction scale; and
BMT Fleet Technology Limited 6575C.DFR
Runway Friction Characteristics Measurement and Aircraft Braking (RuFAB) 67 Volume 3 – Functional Friction
(b) reference device(s) that would provide the standard “metre stick”, and to compare all the other devices to it.
Much was learned from these trials with respect to developing both reference surfaces and reference devices. Experience has shown that it is very difficult to manufacture a repeatable reference surface even though detailed specifications can be developed.
When considering the development of an absolute reference surface, it must also be recognized that the friction value of a specific surface is affected by seasonal changes, freeze-thaw cycles, radiation and exposure to sunlight. See Figures 3.27 to 3.30 (Wambold and Henry, 2002). The friction measurements itself can also change the surface and, therefore, change the friction reading.
As well, friction measurements are complicated by the fact that friction is not an intrinsic property, but rather it is a “system” measurement, that depends on the tire, the surface, the material on the surface and the meteorological conditions. Friction is the end result of many non-linear processes between two contacting materials providing a potential for developing resisting forces to motion.
Figure 3.27: Wallop NASA Site Surface Friction Changes over 8 Years as Measured by the VADOT E0274 Trailer
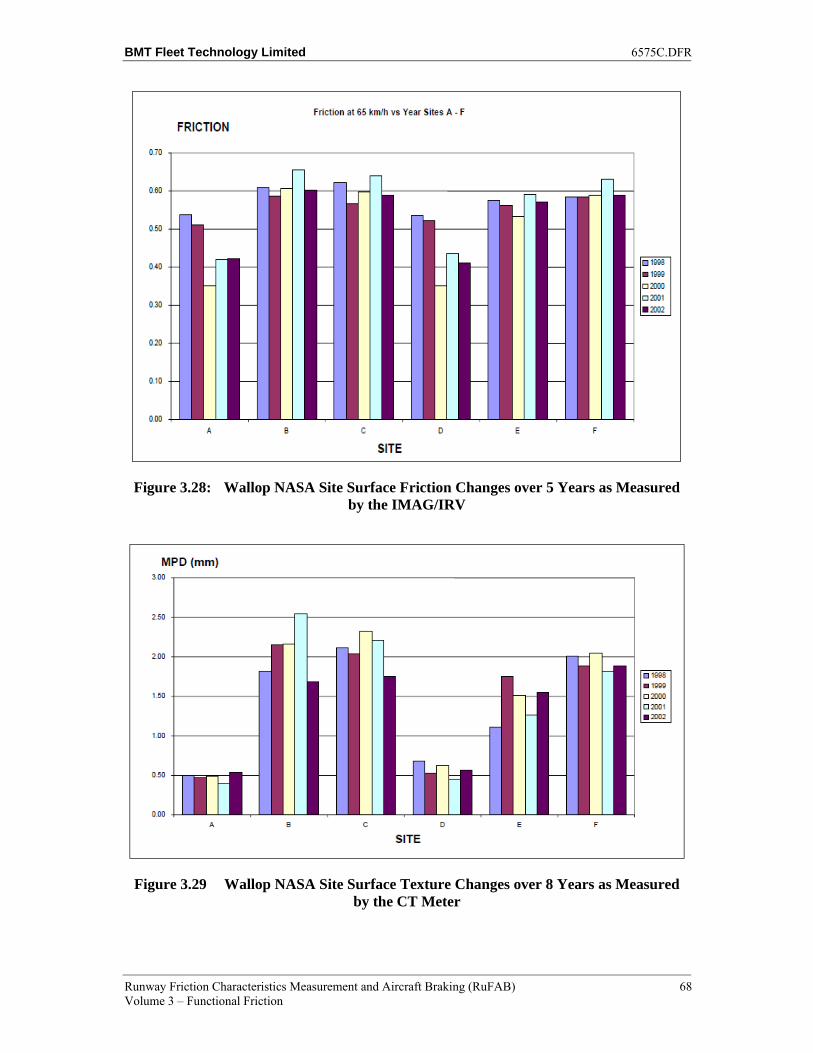
BMT Fleet Technology Limited 6575C.DFR
Runway Friction Characteristics Measurement and Aircraft Braking (RuFAB) 68 Volume 3 – Functional Friction
Figure 3.28: Wallop NASA Site Surface Friction Changes over 5 Years as Measured by the IMAG/IRV
Figure 3.29 Wallop NASA Site Surface Texture Changes over 8 Years as Measured by the CT Meter
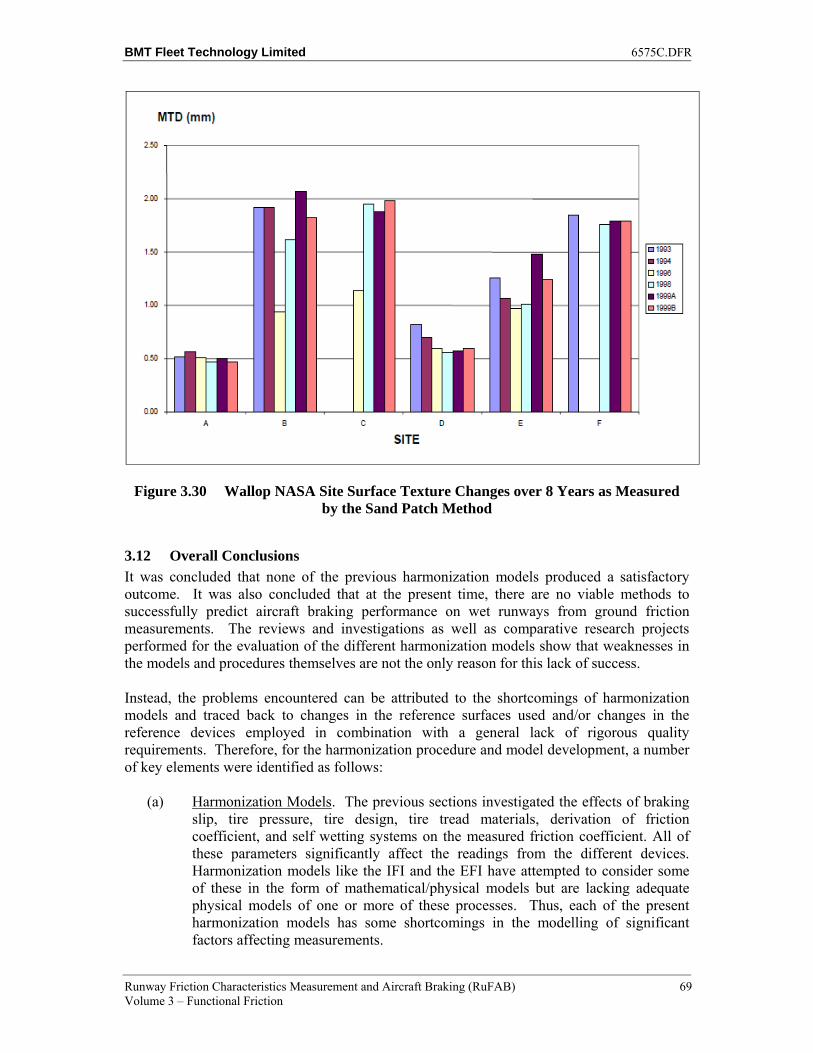
BMT Fleet Technology Limited 6575C.DFR
Runway Friction Characteristics Measurement and Aircraft Braking (RuFAB) 69 Volume 3 – Functional Friction
Figure 3.30 Wallop NASA Site Surface Texture Changes over 8 Years as Measured by the Sand Patch Method
3.12 Overall Conclusions
It was concluded that none of the previous harmonization models produced a satisfactory outcome. It was also concluded that at the present time, there are no viable methods to successfully predict aircraft braking performance on wet runways from ground friction measurements. The reviews and investigations as well as comparative research projects performed for the evaluation of the different harmonization models show that weaknesses in the models and procedures themselves are not the only reason for this lack of success.
Instead, the problems encountered can be attributed to the shortcomings of harmonization models and traced back to changes in the reference surfaces used and/or changes in the reference devices employed in combination with a general lack of rigorous quality requirements. Therefore, for the harmonization procedure and model development, a number of key elements were identified as follows:
(a) Harmonization Models. The previous sections investigated the effects of braking slip, tire pressure, tire design, tire tread materials, derivation of friction coefficient, and self wetting systems on the measured friction coefficient. All of these parameters significantly affect the readings from the different devices. Harmonization models like the IFI and the EFI have attempted to consider some of these in the form of mathematical/physical models but are lacking adequate physical models of one or more of these processes. Thus, each of the present harmonization models has some shortcomings in the modelling of significant factors affecting measurements.
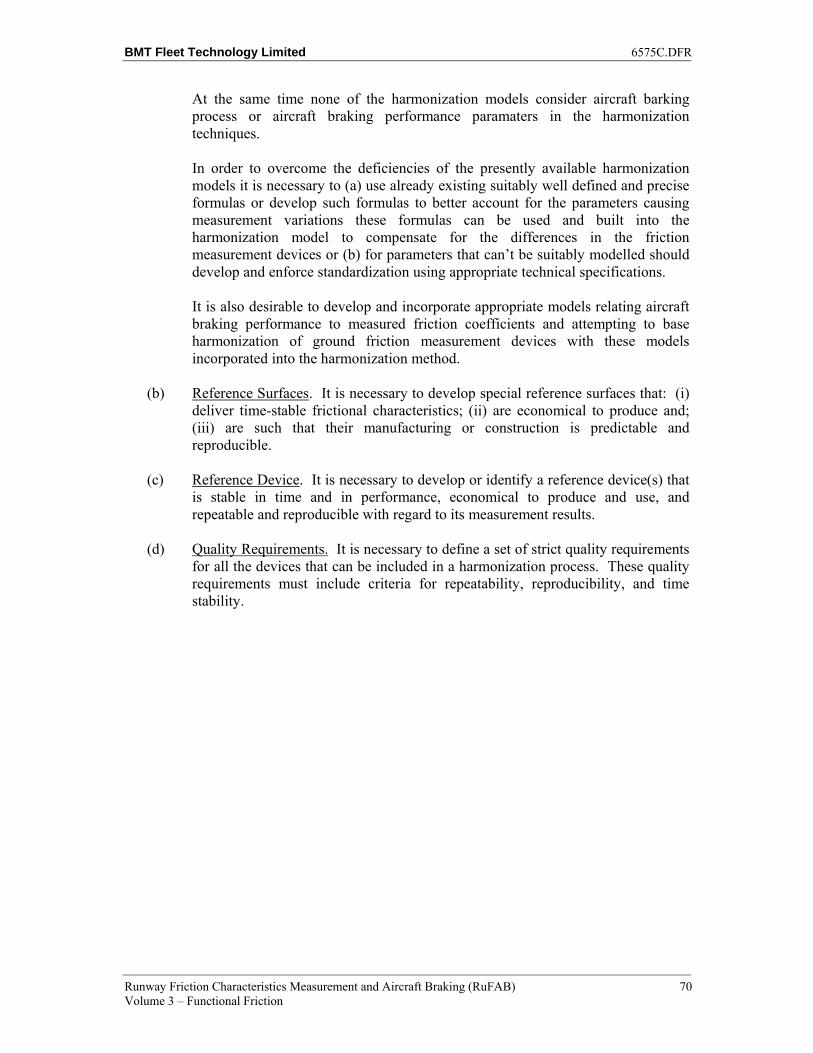
BMT Fleet Technology Limited 6575C.DFR
Runway Friction Characteristics Measurement and Aircraft Braking (RuFAB) 70 Volume 3 – Functional Friction
At the same time none of the harmonization models consider aircraft barking process or aircraft braking performance paramaters in the harmonization techniques.
In order to overcome the deficiencies of the presently available harmonization models it is necessary to (a) use already existing suitably well defined and precise formulas or develop such formulas to better account for the parameters causing measurement variations these formulas can be used and built into the harmonization model to compensate for the differences in the friction measurement devices or (b) for parameters that can’t be suitably modelled should develop and enforce standardization using appropriate technical specifications.
It is also desirable to develop and incorporate appropriate models relating aircraft braking performance to measured friction coefficients and attempting to base harmonization of ground friction measurement devices with these models incorporated into the harmonization method.
(b) Reference Surfaces. It is necessary to develop special reference surfaces that: (i) deliver time-stable frictional characteristics; (ii) are economical to produce and; (iii) are such that their manufacturing or construction is predictable and reproducible.
(c) Reference Device. It is necessary to develop or identify a reference device(s) that is stable in time and in performance, economical to produce and use, and repeatable and reproducible with regard to its measurement results.
(d) Quality Requirements. It is necessary to define a set of strict quality requirements for all the devices that can be included in a harmonization process. These quality requirements must include criteria for repeatability, reproducibility, and time stability.
BMT Fleet Technology Limited 6575C.DFR
Runway Friction Characteristics Measurement and Aircraft Braking (RuFAB) 71 Volume 3 – Functional Friction
4 ALTERNATIVE METHODS FOR SURFACE FRICTION EVALUATION
4.1 Overall Review of Methods for Texture Measurements
4.1.1 Introduction
The measurement of pavement surface characteristics, particularly the friction, texture and unevenness properties of pavements have been of primary importance for the last fifty years. The interrelations of these surface characteristic properties and their significance to the safety and comfort of the travelling public is well documented. For the monitoring, analysis, and investigation of these parameters, many different devices have been developed and used. Presently many different types of equipment are in use for both friction and texture measurements. They differ in their measurement principles, the reported data, and measurement speed. ASTM and AASHTO have developed a set of standard surface characteristic standards and measurement practice standards to ensure that comparisons are feasible for reporting of texture and friction data across different platforms.
In this section, an overview of the different measurement methods and the equipment available is given. Since the standards ensure comparability of the measurements for practical purposes, the methods and devices are discussed in pairs and are grouped according to measurements requiring lane closure (such as the low speed, walking, and stationary devices), and measurements performed at normal traffic speeds.
Texture measurement devices can be sub-divided as follows:
(a) Low-speed devices that require lane closure (stationary, walking and low speed); and
(b) High speed devices that can be operated at highway speeds.
In general with only a very few exceptions, the low speed and stationary measurement devices requiring lane closure are simpler and relatively inexpensive. In contrast, the high speed measurement devices are more complex, require more training to maintain and operate, and are more expensive.
The resolution and accuracy of the acquired data for the low speed measurement devices can still supersede that of the high speed devices but with smaller and smaller margins, given recent developments in technology in data acquisition, sensor technology and data processing power.
Surveys were done of all technologies currently used for texture measurements which provided a comprehensive evaluation and description of these equipments. The review was based on the different categories of texture measurement technologies including their methods, basic make-up of equipment, measurement procedure, measurement indexes, and advantages and disadvantages.
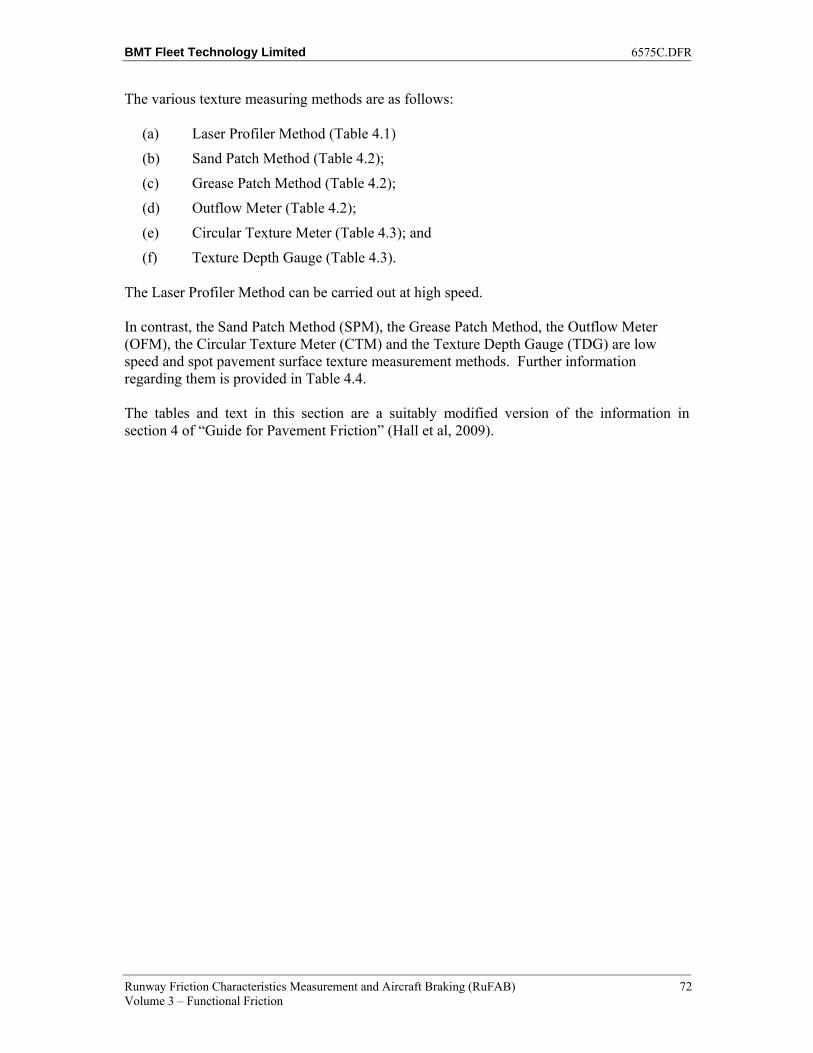
BMT Fleet Technology Limited 6575C.DFR
Runway Friction Characteristics Measurement and Aircraft Braking (RuFAB) 72 Volume 3 – Functional Friction
The various texture measuring methods are as follows:
(a) Laser Profiler Method (Table 4.1)
(b) Sand Patch Method (Table 4.2);
(c) Grease Patch Method (Table 4.2);
(d) Outflow Meter (Table 4.2);
(e) Circular Texture Meter (Table 4.3); and
(f) Texture Depth Gauge (Table 4.3).
The Laser Profiler Method can be carried out at high speed. In contrast, the Sand Patch Method (SPM), the Grease Patch Method, the Outflow Meter (OFM), the Circular Texture Meter (CTM) and the Texture Depth Gauge (TDG) are low speed and spot pavement surface texture measurement methods. Further information regarding them is provided in Table 4.4. The tables and text in this section are a suitably modified version of the information in section 4 of “Guide for Pavement Friction” (Hall et al, 2009).
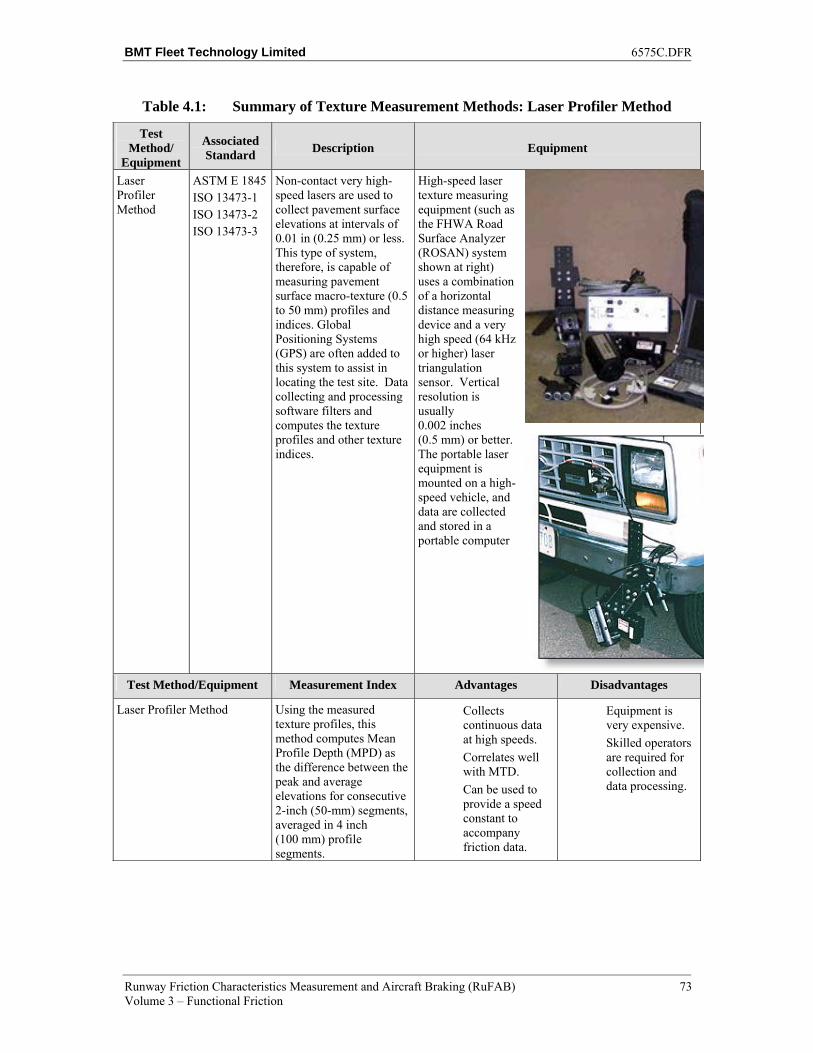
BMT Fleet Technology Limited 6575C.DFR
Runway Friction Characteristics Measurement and Aircraft Braking (RuFAB) 73 Volume 3 – Functional Friction
Table 4.1: Summary of Texture Measurement Methods: Laser Profiler Method
Test Method/
Equipment
Associated Standard
Description Equipment
Laser Profiler Method
ASTM E 1845 ISO 13473-1 ISO 13473-2 ISO 13473-3
Non-contact very high-speed lasers are used to collect pavement surface elevations at intervals of 0.01 in (0.25 mm) or less. This type of system, therefore, is capable of measuring pavement surface macro-texture (0.5 to 50 mm) profiles and indices. Global Positioning Systems (GPS) are often added to this system to assist in locating the test site. Data collecting and processing software filters and computes the texture profiles and other texture indices.
High-speed laser texture measuring equipment (such as the FHWA Road Surface Analyzer (ROSAN) system shown at right) uses a combination of a horizontal distance measuring device and a very high speed (64 kHz or higher) laser triangulation sensor. Vertical resolution is usually 0.002 inches (0.5 mm) or better. The portable laser equipment is mounted on a high-speed vehicle, and data are collected and stored in a portable computer
Test Method/Equipment Measurement Index Advantages Disadvantages
Laser Profiler Method Using the measured texture profiles, this method computes Mean Profile Depth (MPD) as the difference between the peak and average elevations for consecutive 2-inch (50-mm) segments, averaged in 4 inch (100 mm) profile segments.
Collects continuous data at high speeds.
Correlates well with MTD.
Can be used to provide a speed constant to accompany friction data.
Equipment is very expensive.
Skilled operators are required for collection and data processing.
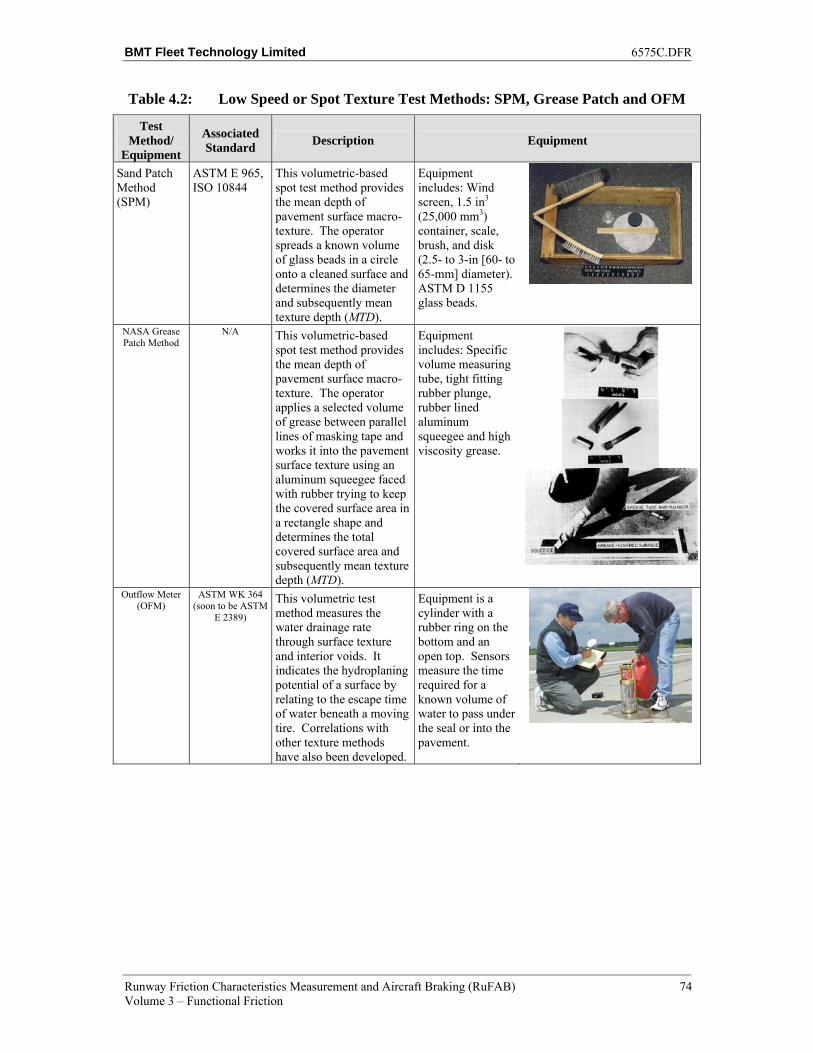
BMT Fleet Technology Limited 6575C.DFR
Runway Friction Characteristics Measurement and Aircraft Braking (RuFAB) 74 Volume 3 – Functional Friction
Table 4.2: Low Speed or Spot Texture Test Methods: SPM, Grease Patch and OFM
Test Method/
Equipment
Associated Standard
Description Equipment
Sand Patch Method (SPM)
ASTM E 965, ISO 10844
This volumetric-based spot test method provides the mean depth of pavement surface macro-texture. The operator spreads a known volume of glass beads in a circle onto a cleaned surface and determines the diameter and subsequently mean texture depth (MTD).
Equipment includes: Wind screen, 1.5 in3 (25,000 mm3) container, scale, brush, and disk (2.5- to 3-in [60- to 65-mm] diameter). ASTM D 1155 glass beads.
NASA Grease Patch Method
N/A This volumetric-based spot test method provides the mean depth of pavement surface macro-texture. The operator applies a selected volume of grease between parallel lines of masking tape and works it into the pavement surface texture using an aluminum squeegee faced with rubber trying to keep the covered surface area in a rectangle shape and determines the total covered surface area and subsequently mean texture depth (MTD).
Equipment includes: Specific volume measuring tube, tight fitting rubber plunge, rubber lined aluminum squeegee and high viscosity grease.
Outflow Meter (OFM)
ASTM WK 364 (soon to be ASTM
E 2389)
This volumetric test method measures the water drainage rate through surface texture and interior voids. It indicates the hydroplaning potential of a surface by relating to the escape time of water beneath a moving tire. Correlations with other texture methods have also been developed.
Equipment is a cylinder with a rubber ring on the bottom and an open top. Sensors measure the time required for a known volume of water to pass under the seal or into the pavement.
BMT Fleet Technology Limited 6575C.DFR
Runway Friction Characteristics Measurement and Aircraft Braking (RuFAB) 75 Volume 3 – Functional Friction
Table 4.3: Low Speed or Spot Texture Test Methods: CTM and TDG
Test Method/
Equipment
Associated Standard
Description Equipment
Circular Texture Meter (CTM)
ASTM E 2157 This non-contact laser device measures the surface texture in an 11.25-in (286-mm) diameter circular profile of the pavement surface at intervals of 0.034 in (0.868 mm), matching the measurement path of the DFT. It rotates at 20 ft/min (6 m/min) and provides profile traces and mean profile depths (MPDs) for the pavement surface.
Equipment includes a water supply, portable computer, and the texture meter device.
Texture Depth Gauge (TDG)
AASHTO T 261
This device provides an average depth of PCC grooves or tining. The gauge is inserted into 10 grooves to measure their depths.
A digital depth gauge, illustrated at right, can be used.
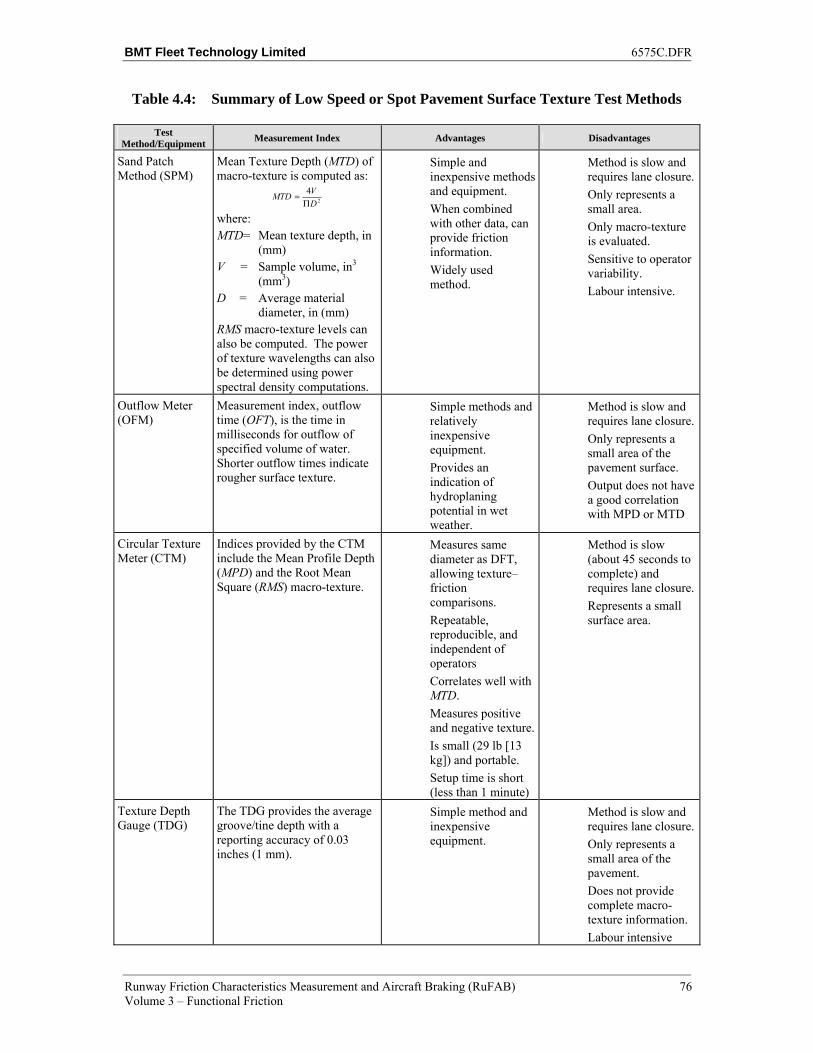
BMT Fleet Technology Limited 6575C.DFR
Runway Friction Characteristics Measurement and Aircraft Braking (RuFAB) 76 Volume 3 – Functional Friction
Table 4.4: Summary of Low Speed or Spot Pavement Surface Texture Test Methods
Test Method/Equipment
Measurement Index Advantages Disadvantages
Sand Patch Method (SPM)
Mean Texture Depth (MTD) of macro-texture is computed as:
2
4
D
VMTD
Π=
where: MTD= Mean texture depth, in
(mm) V = Sample volume, in3
(mm3) D = Average material
diameter, in (mm) RMS macro-texture levels can also be computed. The power of texture wavelengths can also be determined using power spectral density computations.
Simple and inexpensive methods and equipment.
When combined with other data, can provide friction information.
Widely used method.
Method is slow and requires lane closure.
Only represents a small area.
Only macro-texture is evaluated.
Sensitive to operator variability.
Labour intensive.
Outflow Meter (OFM)
Measurement index, outflow time (OFT), is the time in milliseconds for outflow of specified volume of water. Shorter outflow times indicate rougher surface texture.
Simple methods and relatively inexpensive equipment.
Provides an indication of hydroplaning potential in wet weather.
Method is slow and requires lane closure.
Only represents a small area of the pavement surface.
Output does not have a good correlation with MPD or MTD
Circular Texture Meter (CTM)
Indices provided by the CTM include the Mean Profile Depth (MPD) and the Root Mean Square (RMS) macro-texture.
Measures same diameter as DFT, allowing texture–friction comparisons.
Repeatable, reproducible, and independent of operators
Correlates well with MTD.
Measures positive and negative texture.
Is small (29 lb [13 kg]) and portable.
Setup time is short (less than 1 minute)
Method is slow (about 45 seconds to complete) and requires lane closure.
Represents a small surface area.
Texture Depth Gauge (TDG)
The TDG provides the average groove/tine depth with a reporting accuracy of 0.03 inches (1 mm).
Simple method and inexpensive equipment.
Method is slow and requires lane closure.
Only represents a small area of the pavement.
Does not provide complete macro-texture information.
Labour intensive
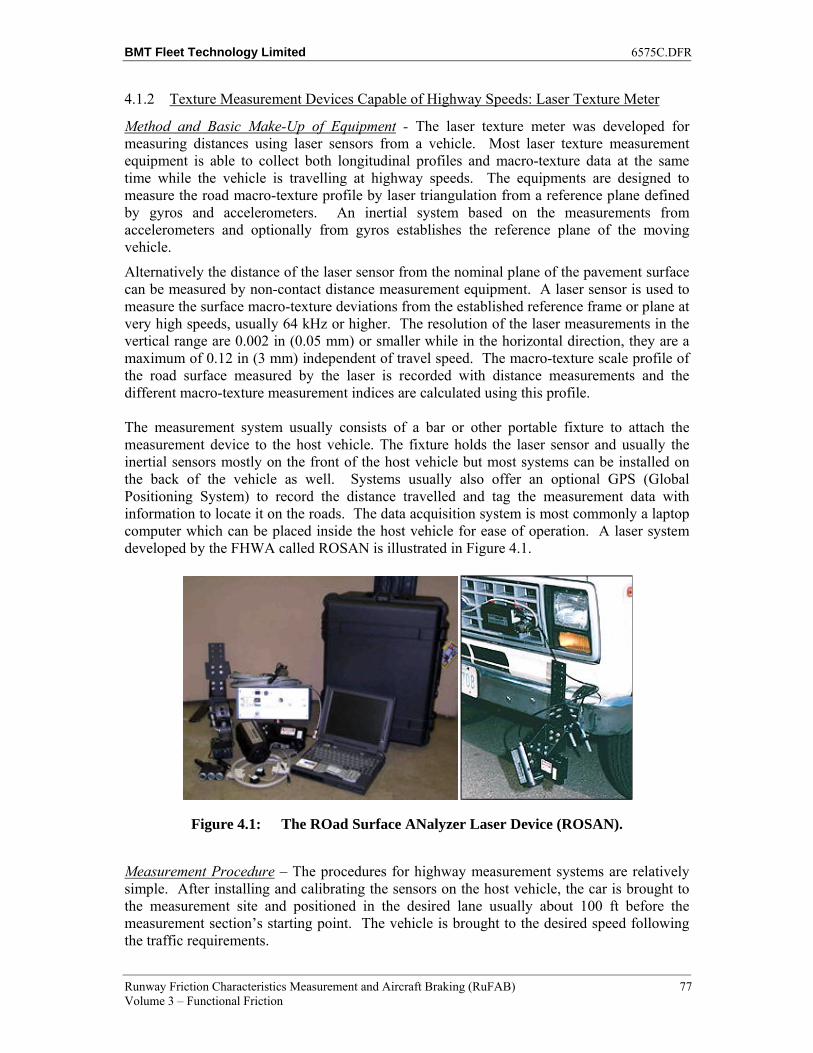
BMT Fleet Technology Limited 6575C.DFR
Runway Friction Characteristics Measurement and Aircraft Braking (RuFAB) 77 Volume 3 – Functional Friction
4.1.2 Texture Measurement Devices Capable of Highway Speeds: Laser Texture Meter
Method and Basic Make-Up of Equipment - The laser texture meter was developed for measuring distances using laser sensors from a vehicle. Most laser texture measurement equipment is able to collect both longitudinal profiles and macro-texture data at the same time while the vehicle is travelling at highway speeds. The equipments are designed to measure the road macro-texture profile by laser triangulation from a reference plane defined by gyros and accelerometers. An inertial system based on the measurements from accelerometers and optionally from gyros establishes the reference plane of the moving vehicle.
Alternatively the distance of the laser sensor from the nominal plane of the pavement surface can be measured by non-contact distance measurement equipment. A laser sensor is used to measure the surface macro-texture deviations from the established reference frame or plane at very high speeds, usually 64 kHz or higher. The resolution of the laser measurements in the vertical range are 0.002 in (0.05 mm) or smaller while in the horizontal direction, they are a maximum of 0.12 in (3 mm) independent of travel speed. The macro-texture scale profile of the road surface measured by the laser is recorded with distance measurements and the different macro-texture measurement indices are calculated using this profile. The measurement system usually consists of a bar or other portable fixture to attach the measurement device to the host vehicle. The fixture holds the laser sensor and usually the inertial sensors mostly on the front of the host vehicle but most systems can be installed on the back of the vehicle as well. Systems usually also offer an optional GPS (Global Positioning System) to record the distance travelled and tag the measurement data with information to locate it on the roads. The data acquisition system is most commonly a laptop computer which can be placed inside the host vehicle for ease of operation. A laser system developed by the FHWA called ROSAN is illustrated in Figure 4.1.
Figure 4.1: The ROad Surface ANalyzer Laser Device (ROSAN).
Measurement Procedure – The procedures for highway measurement systems are relatively simple. After installing and calibrating the sensors on the host vehicle, the car is brought to the measurement site and positioned in the desired lane usually about 100 ft before the measurement section’s starting point. The vehicle is brought to the desired speed following the traffic requirements.
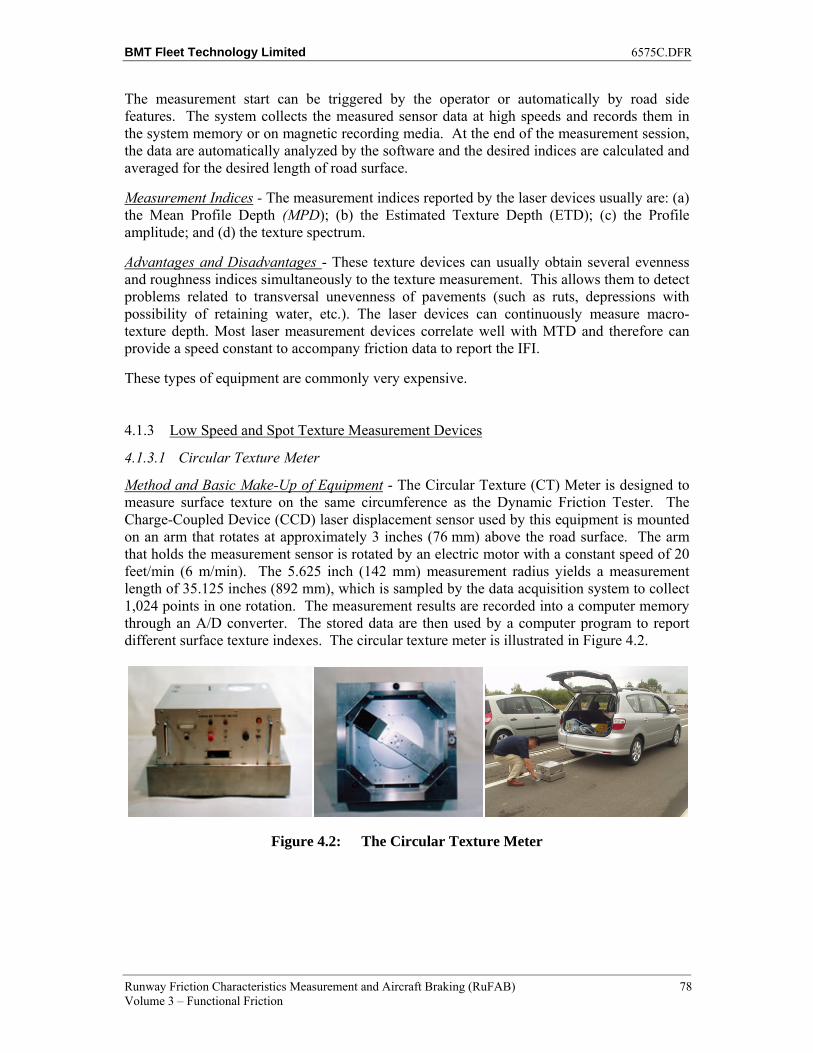
BMT Fleet Technology Limited 6575C.DFR
Runway Friction Characteristics Measurement and Aircraft Braking (RuFAB) 78 Volume 3 – Functional Friction
The measurement start can be triggered by the operator or automatically by road side features. The system collects the measured sensor data at high speeds and records them in the system memory or on magnetic recording media. At the end of the measurement session, the data are automatically analyzed by the software and the desired indices are calculated and averaged for the desired length of road surface.
Measurement Indices - The measurement indices reported by the laser devices usually are: (a) the Mean Profile Depth (MPD); (b) the Estimated Texture Depth (ETD); (c) the Profile amplitude; and (d) the texture spectrum.
Advantages and Disadvantages - These texture devices can usually obtain several evenness and roughness indices simultaneously to the texture measurement. This allows them to detect problems related to transversal unevenness of pavements (such as ruts, depressions with possibility of retaining water, etc.). The laser devices can continuously measure macro-texture depth. Most laser measurement devices correlate well with MTD and therefore can provide a speed constant to accompany friction data to report the IFI.
These types of equipment are commonly very expensive.
4.1.3 Low Speed and Spot Texture Measurement Devices
4.1.3.1 Circular Texture Meter
Method and Basic Make-Up of Equipment - The Circular Texture (CT) Meter is designed to measure surface texture on the same circumference as the Dynamic Friction Tester. The Charge-Coupled Device (CCD) laser displacement sensor used by this equipment is mounted on an arm that rotates at approximately 3 inches (76 mm) above the road surface. The arm that holds the measurement sensor is rotated by an electric motor with a constant speed of 20 feet/min (6 m/min). The 5.625 inch (142 mm) measurement radius yields a measurement length of 35.125 inches (892 mm), which is sampled by the data acquisition system to collect 1,024 points in one rotation. The measurement results are recorded into a computer memory through an A/D converter. The stored data are then used by a computer program to report different surface texture indexes. The circular texture meter is illustrated in Figure 4.2.
Figure 4.2: The Circular Texture Meter
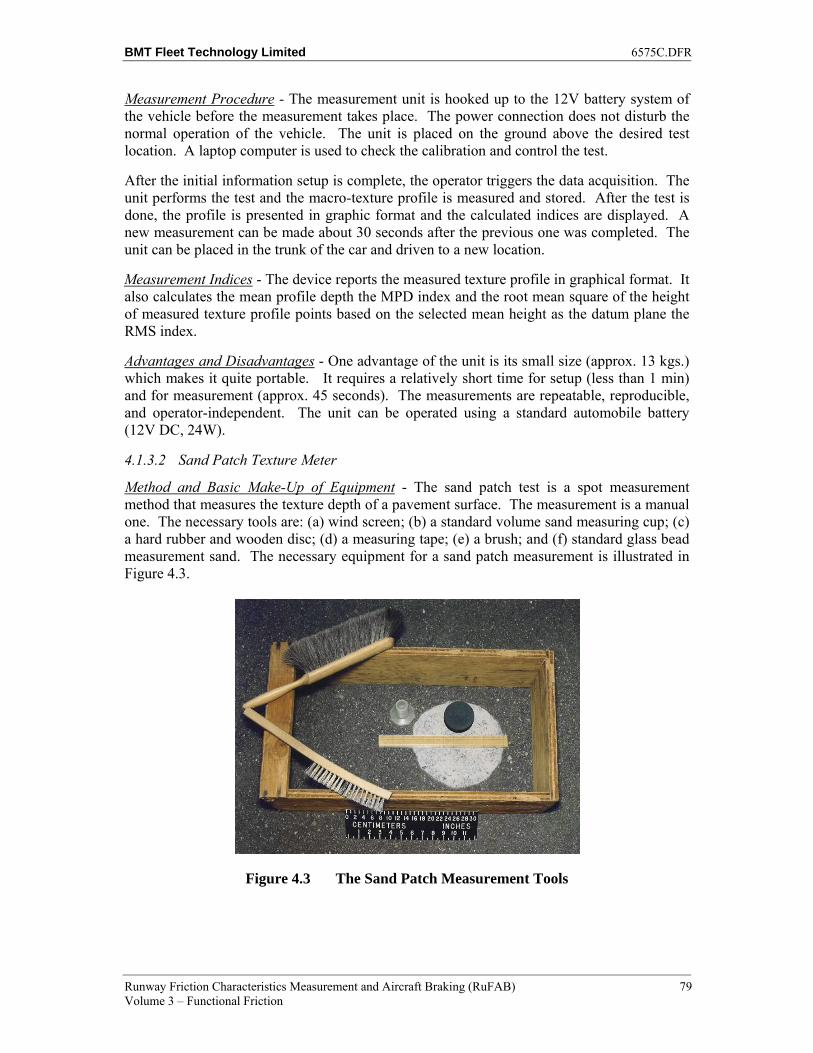
BMT Fleet Technology Limited 6575C.DFR
Runway Friction Characteristics Measurement and Aircraft Braking (RuFAB) 79 Volume 3 – Functional Friction
Measurement Procedure - The measurement unit is hooked up to the 12V battery system of the vehicle before the measurement takes place. The power connection does not disturb the normal operation of the vehicle. The unit is placed on the ground above the desired test location. A laptop computer is used to check the calibration and control the test.
After the initial information setup is complete, the operator triggers the data acquisition. The unit performs the test and the macro-texture profile is measured and stored. After the test is done, the profile is presented in graphic format and the calculated indices are displayed. A new measurement can be made about 30 seconds after the previous one was completed. The unit can be placed in the trunk of the car and driven to a new location.
Measurement Indices - The device reports the measured texture profile in graphical format. It also calculates the mean profile depth the MPD index and the root mean square of the height of measured texture profile points based on the selected mean height as the datum plane the RMS index.
Advantages and Disadvantages - One advantage of the unit is its small size (approx. 13 kgs.) which makes it quite portable. It requires a relatively short time for setup (less than 1 min) and for measurement (approx. 45 seconds). The measurements are repeatable, reproducible, and operator-independent. The unit can be operated using a standard automobile battery (12V DC, 24W).
4.1.3.2 Sand Patch Texture Meter
Method and Basic Make-Up of Equipment - The sand patch test is a spot measurement method that measures the texture depth of a pavement surface. The measurement is a manual one. The necessary tools are: (a) wind screen; (b) a standard volume sand measuring cup; (c) a hard rubber and wooden disc; (d) a measuring tape; (e) a brush; and (f) standard glass bead measurement sand. The necessary equipment for a sand patch measurement is illustrated in Figure 4.3.
Figure 4.3 The Sand Patch Measurement Tools
BMT Fleet Technology Limited 6575C.DFR
Runway Friction Characteristics Measurement and Aircraft Braking (RuFAB) 80 Volume 3 – Functional Friction
Measurement Procedure - The test is carried out on a dry surface. The surface is cleaned from excess dirt and debris with the brush. The standard volume cup is filled with the measurement sand and the known quantity of sand is poured onto the surface in one small spot. The sand then is spread using the rubber or wooden disc in an even circular motions into a circular area. When the sand spreads no further all the voids are filled. The measurement tape is used to measure the diameter of the circle to the nearest millimeter the measurement of the diameter is repeated four times in 45 degree angles from one another. The mean average is then calculated and this figure is then recorded and converted to Mean Texture Depth (MTD).
Measurement Indices - The MTD measurement index is calculated using equation 4.1.
( )⎩⎨⎧
==
⋅⋅=
)(
2)(
3
2 mmdiametermeasuredd
mmvolumesandawhere
d
ammMTD
π [4.1]
Advantages and Disadvantages - This method is simple to conduct and only requires simple, inexpensive equipment.
However, the test is weather-dependent and its reproducibility is inferior because its results are operator-dependent. The method is slow and requires lane closure. Also, it is a spot measurement as it only represents a small area. It is known that MTD can vary significantly along a pavement surface.
4.1.3.3 Outflow Meter
Method and Basic Make-Up of Equipment - This test method was designed to measure pavement surface texture and its relationship to the drainage capability of the pavement through surface and subsurface texture voids. The basic principle is to measure the time taken for a known quantity of water to drain through the pavement texture under gravitational pull. The technique measures the capability of surface textural features to reduce the hydraulic pressure of a water saturated pavement–tire interface.
Thus, it provides an indication of hydroplaning potential under wet conditions. A faster escape time indicates that a thinner film of water may exist between the pavement and the tire. The lower the time required to evacuate the water, the lower the water pressure under the tire. The results obtained using this procedure are related to the mean hydraulic radius of a paved surface and correlate with other methods to measure texture. The measurement device consists of a rubber ring attached to the bottom of a tube that is open at its top end. The tube is equipped with sensors that detect two separate water levels - one high and one low. The device is also equipped with a release trigger mechanism that opens a circular shape at the bottom of the tube and starts the measurement. The two sensors are connected to a timer circuit in such a manner that the high level water sensor will trigger the start of a timer when the water level goes below it and the low level sensor will trigger the stop of the timer when the water level is low. The outflow meter device is illustrated in Figure 4.4.
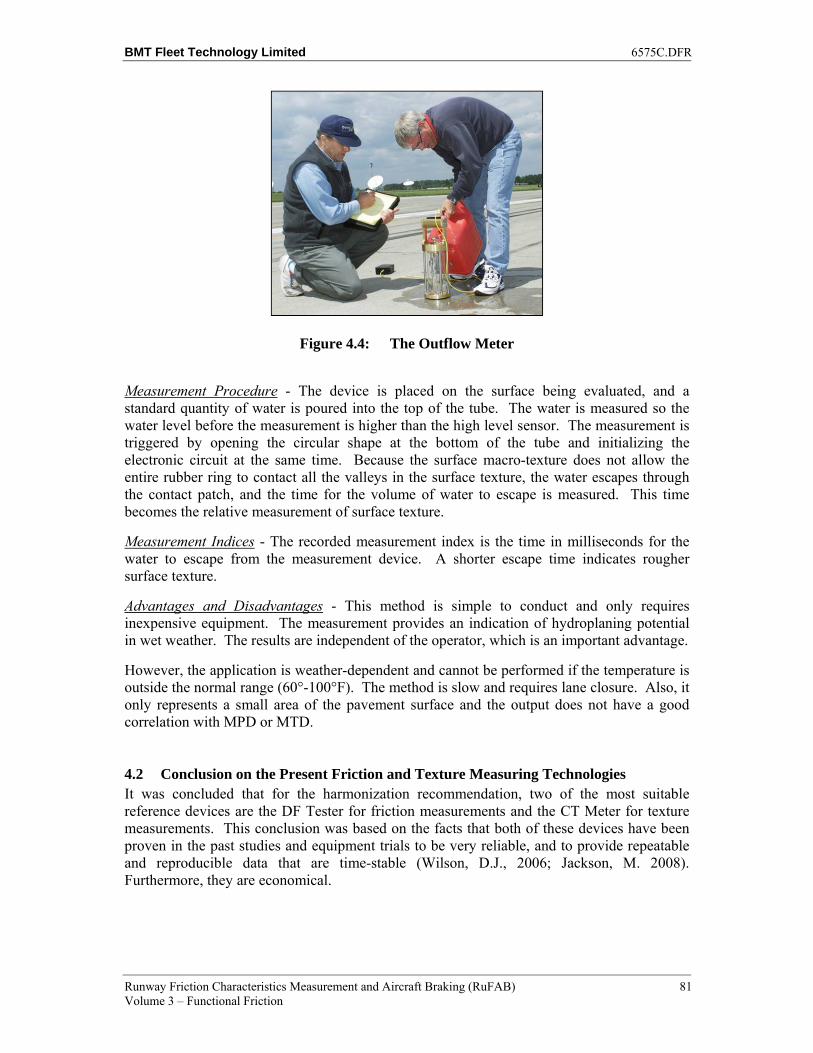
BMT Fleet Technology Limited 6575C.DFR
Runway Friction Characteristics Measurement and Aircraft Braking (RuFAB) 81 Volume 3 – Functional Friction
Figure 4.4: The Outflow Meter
Measurement Procedure - The device is placed on the surface being evaluated, and a standard quantity of water is poured into the top of the tube. The water is measured so the water level before the measurement is higher than the high level sensor. The measurement is triggered by opening the circular shape at the bottom of the tube and initializing the electronic circuit at the same time. Because the surface macro-texture does not allow the entire rubber ring to contact all the valleys in the surface texture, the water escapes through the contact patch, and the time for the volume of water to escape is measured. This time becomes the relative measurement of surface texture.
Measurement Indices - The recorded measurement index is the time in milliseconds for the water to escape from the measurement device. A shorter escape time indicates rougher surface texture.
Advantages and Disadvantages - This method is simple to conduct and only requires inexpensive equipment. The measurement provides an indication of hydroplaning potential in wet weather. The results are independent of the operator, which is an important advantage.
However, the application is weather-dependent and cannot be performed if the temperature is outside the normal range (60°-100°F). The method is slow and requires lane closure. Also, it only represents a small area of the pavement surface and the output does not have a good correlation with MPD or MTD.
4.2 Conclusion on the Present Friction and Texture Measuring Technologies It was concluded that for the harmonization recommendation, two of the most suitable reference devices are the DF Tester for friction measurements and the CT Meter for texture measurements. This conclusion was based on the facts that both of these devices have been proven in the past studies and equipment trials to be very reliable, and to provide repeatable and reproducible data that are time-stable (Wilson, D.J., 2006; Jackson, M. 2008). Furthermore, they are economical.
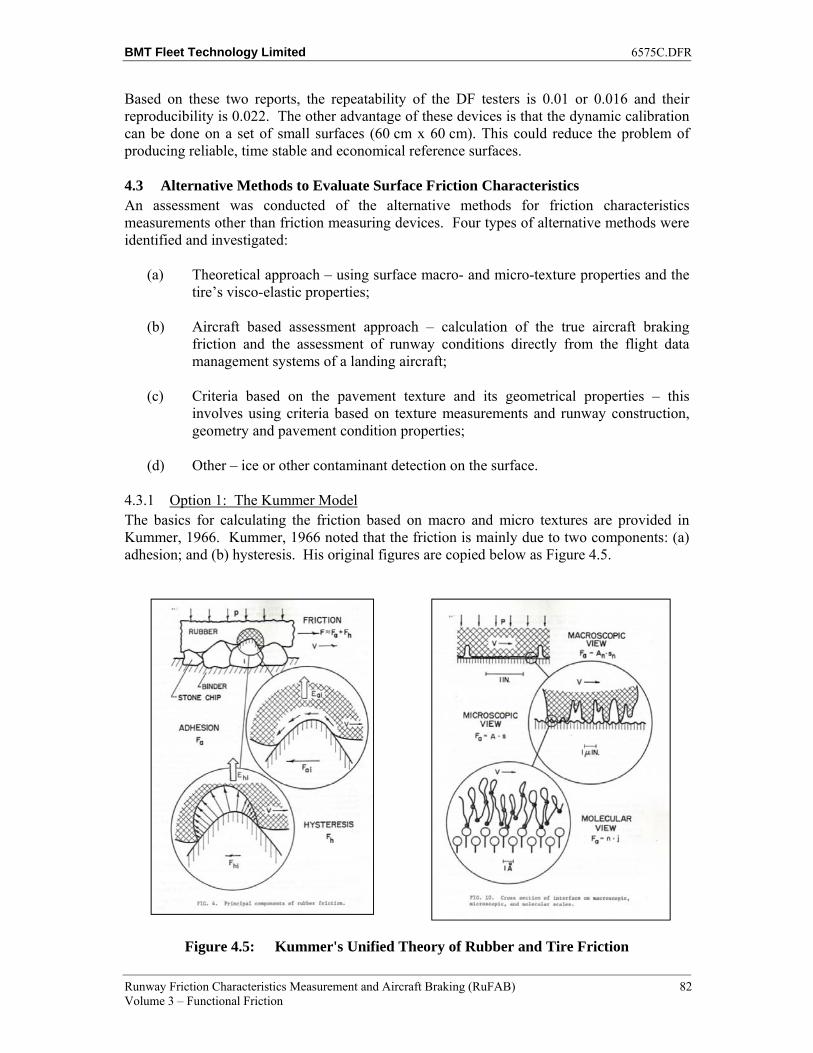
BMT Fleet Technology Limited 6575C.DFR
Runway Friction Characteristics Measurement and Aircraft Braking (RuFAB) 82 Volume 3 – Functional Friction
Based on these two reports, the repeatability of the DF testers is 0.01 or 0.016 and their reproducibility is 0.022. The other advantage of these devices is that the dynamic calibration can be done on a set of small surfaces (60 cm x 60 cm). This could reduce the problem of producing reliable, time stable and economical reference surfaces.
4.3 Alternative Methods to Evaluate Surface Friction Characteristics An assessment was conducted of the alternative methods for friction characteristics measurements other than friction measuring devices. Four types of alternative methods were identified and investigated:
(a) Theoretical approach – using surface macro- and micro-texture properties and the tire’s visco-elastic properties;
(b) Aircraft based assessment approach – calculation of the true aircraft braking friction and the assessment of runway conditions directly from the flight data management systems of a landing aircraft;
(c) Criteria based on the pavement texture and its geometrical properties – this involves using criteria based on texture measurements and runway construction, geometry and pavement condition properties;
(d) Other – ice or other contaminant detection on the surface.
4.3.1 Option 1: The Kummer Model The basics for calculating the friction based on macro and micro textures are provided in Kummer, 1966. Kummer, 1966 noted that the friction is mainly due to two components: (a) adhesion; and (b) hysteresis. His original figures are copied below as Figure 4.5.
Figure 4.5: Kummer's Unified Theory of Rubber and Tire Friction
BMT Fleet Technology Limited 6575C.DFR
Runway Friction Characteristics Measurement and Aircraft Braking (RuFAB) 83 Volume 3 – Functional Friction
Adhesion is the physical contact between the two material (i.e., the rubber and the road surface), and it relies on molecular bonding, which is basically atomic forces. Therefore, this component is very heavily dependent on the pavement micro-texture. Contaminants have an important effect as their presence prohibits physical contact.
The micro-texture offers opportunities for improving the contact area between the two surfaces. Consequently, the adhesion component is relevant for differences between surfaces at low speed, and it is very sensitive to water and other contaminants.
Hysteresis is basically the absorbed energy of the rubber itself from the periodic penetration of asperities of the road surface. Therefore, it is mainly determined by the speed difference of the surfaces and the macro-texture of the surface. Consequently, the higher the macro-texture of the surface, the higher this component will be. It is less sensitive to contaminants but it is essential for providing the surface with the capability to absorb or relieve contaminants thus allowing contact to be made with the micro-texture, thereby allowing adhesion forces to be developed.
Consequently, macro texture determines hysteresis, the highest component of friction at high speed and provides the ability for the surface to relieve contaminants between the contact area thus giving potential for adhesion. Micro-texture provides adhesion in the low speed range but has some affect at high speed as well if contact can be made due to macro texture.
There are several formulas that have been developed based on this model. The two most recent and significant ones were developed by Ergun et al, 2005 and by Holt et al, 1982.
Ergun et al, 2005 developed the following formula:
… the explicit model is obtained
F(S) = (0.37 + 0.11/MPDmac + 0.15/Lamic ) x exp – ( S/(149 + 81 Log(MPDmac) + 80 Log(Rqmic)) (10)
The friction coefficient/slip speed model can be defined as shown in Eq. 10. Each section having a different surface with different characteristics can be represented with its friction coefficient/slip speed curves. Using this model, it is possible to predict the whole measurable range of the friction coefficient/slip speed curve from only macro- and micro-texture measurements.
where:
F(S) = F0 x exp(S/T) [4.2]
F0 =0.37 + 0.11/MPDmac + 0.15/Lamic [4.3]
T = 149 + 81 Log(MPDmac) + 80 Log(Rqmic) [4.4]
where: F(S) = friction coefficient at slip speed S. F0 = friction coefficient at slip speed 0.
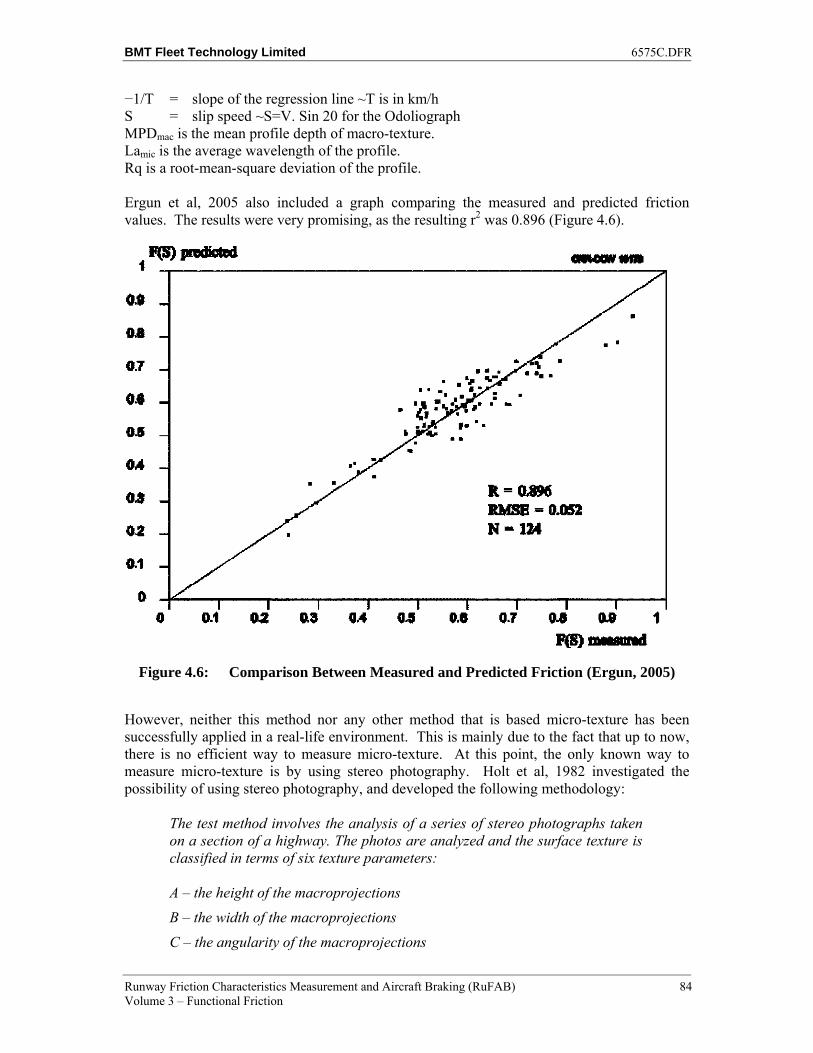
BMT Fleet Technology Limited 6575C.DFR
Runway Friction Characteristics Measurement and Aircraft Braking (RuFAB) 84 Volume 3 – Functional Friction
−1/T = slope of the regression line ~T is in km/h S = slip speed ~S=V. Sin 20 for the Odoliograph MPDmac is the mean profile depth of macro-texture. Lamic is the average wavelength of the profile. Rq is a root-mean-square deviation of the profile. Ergun et al, 2005 also included a graph comparing the measured and predicted friction values. The results were very promising, as the resulting r2 was 0.896 (Figure 4.6).
Figure 4.6: Comparison Between Measured and Predicted Friction (Ergun, 2005)
However, neither this method nor any other method that is based micro-texture has been successfully applied in a real-life environment. This is mainly due to the fact that up to now, there is no efficient way to measure micro-texture. At this point, the only known way to measure micro-texture is by using stereo photography. Holt et al, 1982 investigated the possibility of using stereo photography, and developed the following methodology:
The test method involves the analysis of a series of stereo photographs taken on a section of a highway. The photos are analyzed and the surface texture is classified in terms of six texture parameters:
A – the height of the macroprojections
B – the width of the macroprojections
C – the angularity of the macroprojections
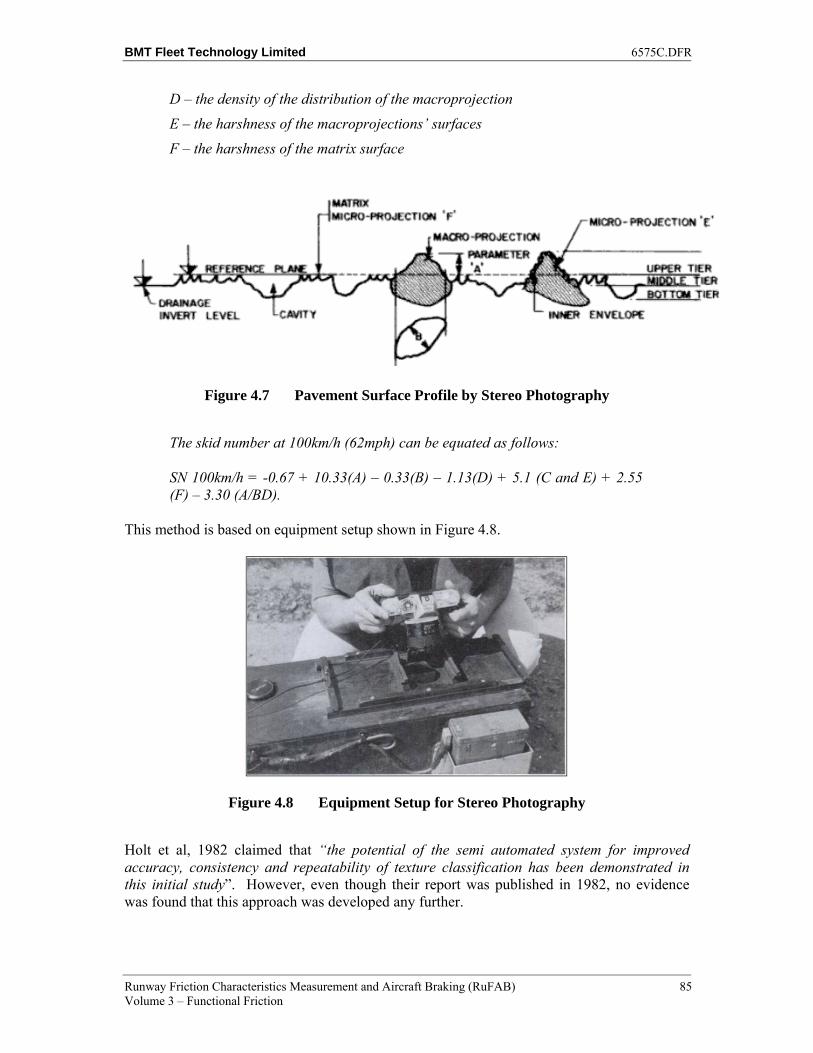
BMT Fleet Technology Limited 6575C.DFR
Runway Friction Characteristics Measurement and Aircraft Braking (RuFAB) 85 Volume 3 – Functional Friction
D – the density of the distribution of the macroprojection
E – the harshness of the macroprojections’ surfaces
F – the harshness of the matrix surface
Figure 4.7 Pavement Surface Profile by Stereo Photography
The skid number at 100km/h (62mph) can be equated as follows:
SN 100km/h = -0.67 + 10.33(A) – 0.33(B) – 1.13(D) + 5.1 (C and E) + 2.55 (F) – 3.30 (A/BD).
This method is based on equipment setup shown in Figure 4.8.
Figure 4.8 Equipment Setup for Stereo Photography
Holt et al, 1982 claimed that “the potential of the semi automated system for improved accuracy, consistency and repeatability of texture classification has been demonstrated in this initial study”. However, even though their report was published in 1982, no evidence was found that this approach was developed any further.
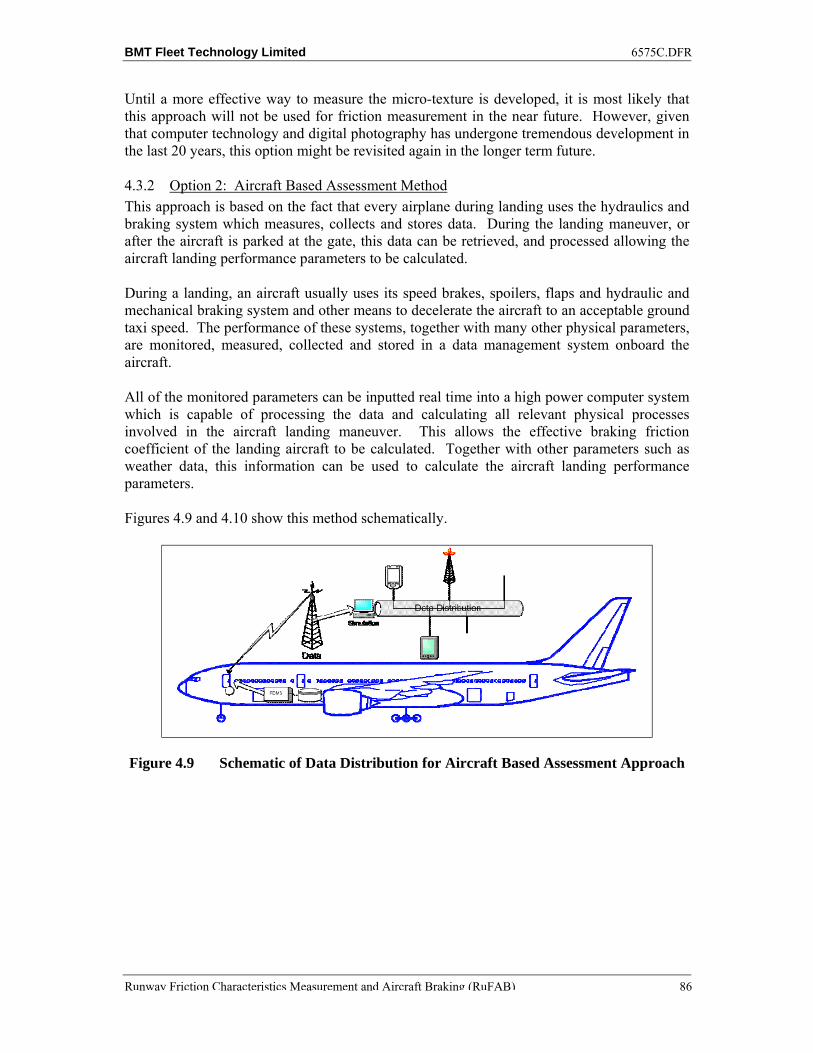
BMT Fleet Technology Limited 6575C.DFR
Runway Friction Characteristics Measurement and Aircraft Braking (RuFAB) 86
Until a more effective way to measure the micro-texture is developed, it is most likely that this approach will not be used for friction measurement in the near future. However, given that computer technology and digital photography has undergone tremendous development in the last 20 years, this option might be revisited again in the longer term future.
4.3.2 Option 2: Aircraft Based Assessment Method
This approach is based on the fact that every airplane during landing uses the hydraulics and braking system which measures, collects and stores data. During the landing maneuver, or after the aircraft is parked at the gate, this data can be retrieved, and processed allowing the aircraft landing performance parameters to be calculated.
During a landing, an aircraft usually uses its speed brakes, spoilers, flaps and hydraulic and mechanical braking system and other means to decelerate the aircraft to an acceptable ground taxi speed. The performance of these systems, together with many other physical parameters, are monitored, measured, collected and stored in a data management system onboard the aircraft.
All of the monitored parameters can be inputted real time into a high power computer system which is capable of processing the data and calculating all relevant physical processes involved in the aircraft landing maneuver. This allows the effective braking friction coefficient of the landing aircraft to be calculated. Together with other parameters such as weather data, this information can be used to calculate the aircraft landing performance parameters.
Figures 4.9 and 4.10 show this method schematically.
Figure 4.9 Schematic of Data Distribution for Aircraft Based Assessment Approach
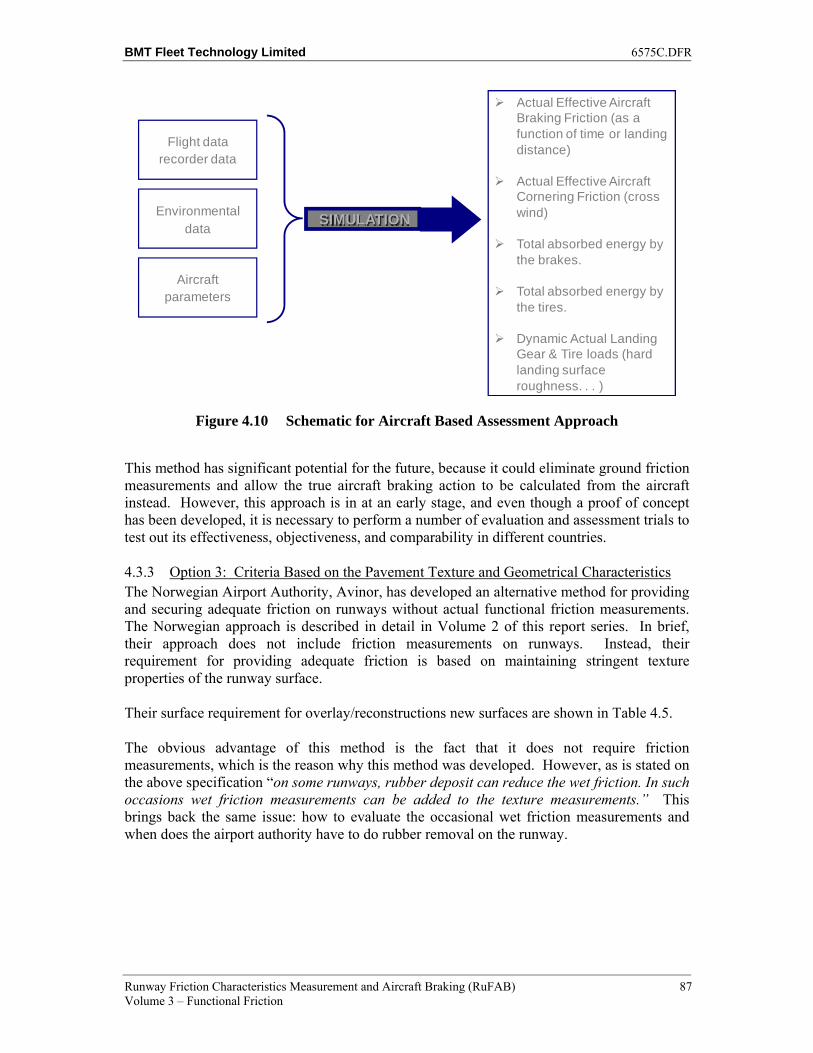
BMT Fleet Technology Limited 6575C.DFR
Runway Friction Characteristics Measurement and Aircraft Braking (RuFAB) 87 Volume 3 – Functional Friction
Figure 4.10 Schematic for Aircraft Based Assessment Approach
This method has significant potential for the future, because it could eliminate ground friction measurements and allow the true aircraft braking action to be calculated from the aircraft instead. However, this approach is in at an early stage, and even though a proof of concept has been developed, it is necessary to perform a number of evaluation and assessment trials to test out its effectiveness, objectiveness, and comparability in different countries.
4.3.3 Option 3: Criteria Based on the Pavement Texture and Geometrical Characteristics The Norwegian Airport Authority, Avinor, has developed an alternative method for providing and securing adequate friction on runways without actual functional friction measurements. The Norwegian approach is described in detail in Volume 2 of this report series. In brief, their approach does not include friction measurements on runways. Instead, their requirement for providing adequate friction is based on maintaining stringent texture properties of the runway surface.
Their surface requirement for overlay/reconstructions new surfaces are shown in Table 4.5.
The obvious advantage of this method is the fact that it does not require friction measurements, which is the reason why this method was developed. However, as is stated on the above specification “on some runways, rubber deposit can reduce the wet friction. In such occasions wet friction measurements can be added to the texture measurements.” This brings back the same issue: how to evaluate the occasional wet friction measurements and when does the airport authority have to do rubber removal on the runway.
Flight data recorder data
Environmentaldata
Aircraft parameters
SIMULATION
Actual Effective Aircraft Braking Friction (as a function of time or landing distance)
Actual Effective Aircraft Cornering Friction (cross wind)
Total absorbed energy by the brakes.
Total absorbed energy by the tires.
Dynamic Actual Landing Gear & Tire loads (hard landing surface roughness. . . )
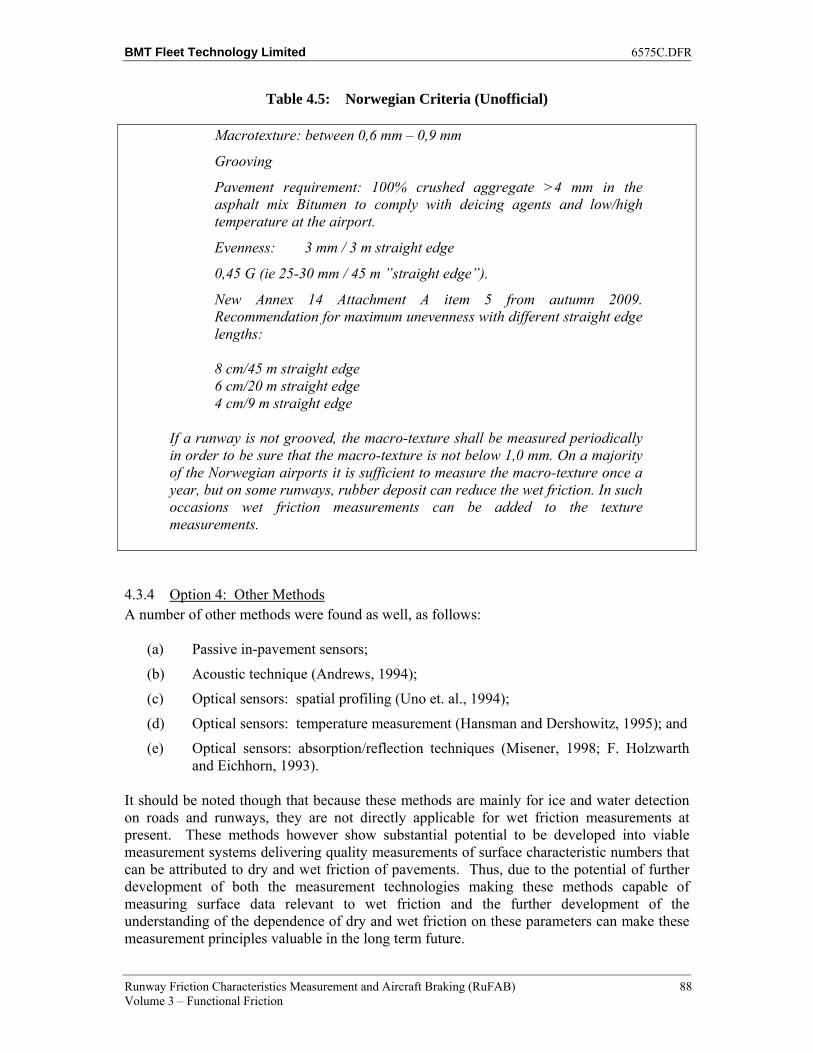
BMT Fleet Technology Limited 6575C.DFR
Runway Friction Characteristics Measurement and Aircraft Braking (RuFAB) 88 Volume 3 – Functional Friction
Table 4.5: Norwegian Criteria (Unofficial)
Macrotexture: between 0,6 mm – 0,9 mm
Grooving
Pavement requirement: 100% crushed aggregate >4 mm in the asphalt mix Bitumen to comply with deicing agents and low/high temperature at the airport.
Evenness: 3 mm / 3 m straight edge
0,45 G (ie 25-30 mm / 45 m ”straight edge”).
New Annex 14 Attachment A item 5 from autumn 2009. Recommendation for maximum unevenness with different straight edge lengths:
8 cm/45 m straight edge 6 cm/20 m straight edge 4 cm/9 m straight edge
If a runway is not grooved, the macro-texture shall be measured periodically in order to be sure that the macro-texture is not below 1,0 mm. On a majority of the Norwegian airports it is sufficient to measure the macro-texture once a year, but on some runways, rubber deposit can reduce the wet friction. In such occasions wet friction measurements can be added to the texture measurements.
4.3.4 Option 4: Other Methods A number of other methods were found as well, as follows:
(a) Passive in-pavement sensors;
(b) Acoustic technique (Andrews, 1994);
(c) Optical sensors: spatial profiling (Uno et. al., 1994);
(d) Optical sensors: temperature measurement (Hansman and Dershowitz, 1995); and
(e) Optical sensors: absorption/reflection techniques (Misener, 1998; F. Holzwarth and Eichhorn, 1993).
It should be noted though that because these methods are mainly for ice and water detection on roads and runways, they are not directly applicable for wet friction measurements at present. These methods however show substantial potential to be developed into viable measurement systems delivering quality measurements of surface characteristic numbers that can be attributed to dry and wet friction of pavements. Thus, due to the potential of further development of both the measurement technologies making these methods capable of measuring surface data relevant to wet friction and the further development of the understanding of the dependence of dry and wet friction on these parameters can make these measurement principles valuable in the long term future.
BMT Fleet Technology Limited 6575C.DFR
Runway Friction Characteristics Measurement and Aircraft Braking (RuFAB) 89 Volume 3 – Functional Friction
4.3.5 Potential for “Cross-Pollination” from Other Industries In order to assess the possibility and likeliness of cross-pollination from other industries to bring new technologies into the realm of pavement surface friction measurement that is relevant to aircraft braking, one needs to assess the different areas of tribology, which in general, is the investigation of the interaction of surfaces in relative motion. Figure 4.11 shows an overview of the different types of tribological/friction categories incorporating relative motion, lubrication and material properties of the mating surface materials. The information in Figure 4.11 is intended to categorize the industries in broad terms that might be considered relevant in assessing the possibility of cross-pollination.
There are industries where the measurements of interest for frictional properties are on dry or lubricated hard surfaces, such as for example, steel bearings or rail road applications. Other possibilities are paper processing and milling applications where dry contact between hard and elastic or visco-elastic materials is of interest. Other applications where frictional properties are assessed between rigid and visco-elastic materials is the printing and computer industries where rubber rollers in the moving parts of prints, copiers, hard disks are rolling on steel surfaces. There are a number of other industries that are measuring and assessing frictional properties but they are of little interest (for friction assessments on pavement) due to the substantial and fundamental differences in mating materials and lubrication environments.
Due to the significant difference in physical properties of each type of friction-related application, and the fact that the only subgroup known within the elastic-on-rigid surfaces with water lubrication is the tire-and-pavement surface interaction, cross-pollination between the different types of friction categories is unlikely. However for completeness, over the long term, periodic reviews and assessments should be carried out for friction measurement and tribological applications for some of the other industries of interest, such as the paper handling, printing and computer components industries.
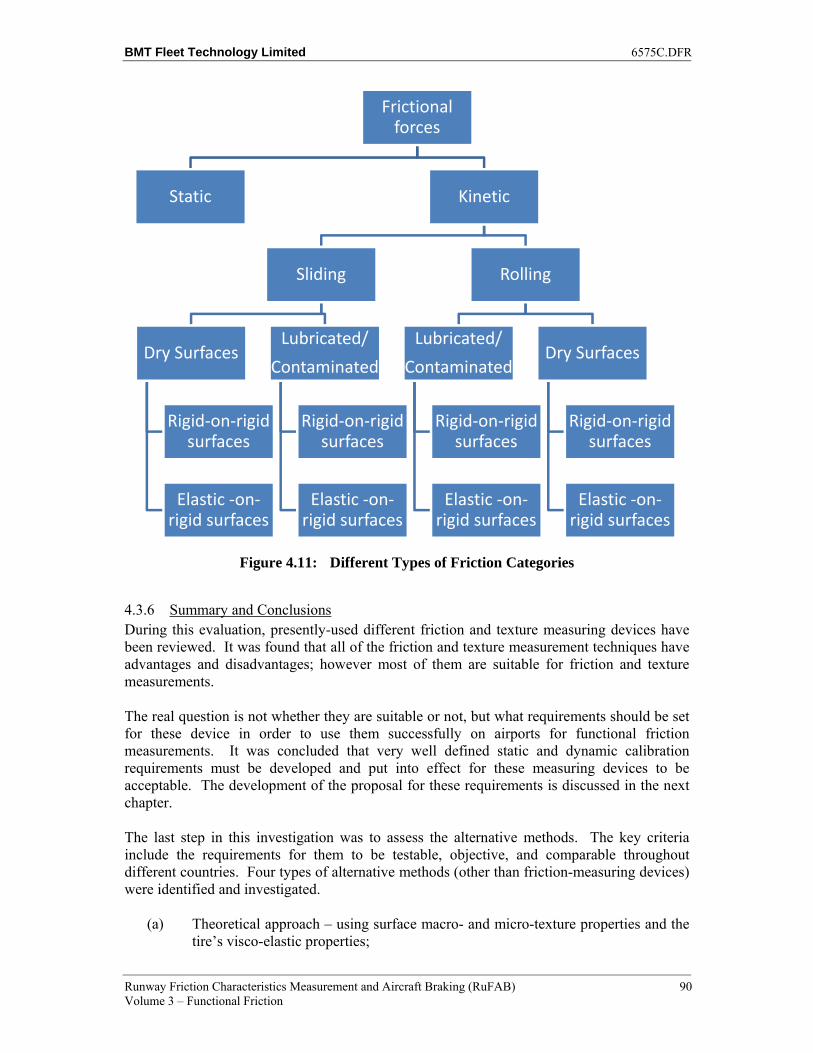
BMT Fleet Technology Limited 6575C.DFR
Runway Friction Characteristics Measurement and Aircraft Braking (RuFAB) 90 Volume 3 – Functional Friction
Figure 4.11: Different Types of Friction Categories
4.3.6 Summary and Conclusions During this evaluation, presently-used different friction and texture measuring devices have been reviewed. It was found that all of the friction and texture measurement techniques have advantages and disadvantages; however most of them are suitable for friction and texture measurements.
The real question is not whether they are suitable or not, but what requirements should be set for these device in order to use them successfully on airports for functional friction measurements. It was concluded that very well defined static and dynamic calibration requirements must be developed and put into effect for these measuring devices to be acceptable. The development of the proposal for these requirements is discussed in the next chapter.
The last step in this investigation was to assess the alternative methods. The key criteria include the requirements for them to be testable, objective, and comparable throughout different countries. Four types of alternative methods (other than friction-measuring devices) were identified and investigated.
(a) Theoretical approach – using surface macro- and micro-texture properties and the tire’s visco-elastic properties;
Frictional forces
Static Kinetic
Sliding
Dry Surfaces
Rigid-on-rigid surfaces
Elastic -on-rigid surfaces
Lubricated/
Contaminated
Rigid-on-rigid surfaces
Elastic -on-rigid surfaces
Rolling
Lubricated/
Contaminated
Rigid-on-rigid surfaces
Elastic -on-rigid surfaces
Dry Surfaces
Rigid-on-rigid surfaces
Elastic -on-rigid surfaces
BMT Fleet Technology Limited 6575C.DFR
Runway Friction Characteristics Measurement and Aircraft Braking (RuFAB) 91 Volume 3 – Functional Friction
(b) Aircraft based assessment approach – calculation of the true aircraft braking friction and the assessment of runway conditions directly from the flight data management systems of a landing aircraft;
(c) Criteria based on the pavement texture and its geometrical properties – this approach uses only laser texture measurements and runway construction, geometry and pavement condition properties; and
(d) Other methods – ice or other contaminant detection on the surface.
The first approach has been available since Kummer developed his model in 1966, but as there is still no effective way of measuring micro texture, this method could not be effectively used in the past and probably will not be in the near future. However, due to the rapid development of digital photography this could be an option for the farther future.
The other two approaches are in their very early stages, and even though proof-of-concepts have been developed, it is necessary to perform a number of evaluation and assessment trials to test out their effectiveness, objectiveness, and comparability in different countries.
Cross pollination from other industries has also been investigated, but found to be a very unlikely scenario.
One promising approach that was developed in Norway bases functional friction monitoring on specific macro texture measurements and maintenance, and the use of specifications regarding aggregates and construction. This approach is in its early deployment status (having been enacted in July, 2009), and it is worthwhile to closely monitor the outcomes and the development of this method. It should be noted that there are questions regarding this approach that need to be answered such as: (i) the ability of the method to monitor and account for rubber build up; (ii) the effect of heavy precipitation or the polishing of the aggregate micro texture that changes wet friction without observable change in macro texture; or (iii) circumstances that are possibly unique to Norway that would make this approach not generally usable due to for example, variations in aggregate properties or specific weather conditions before it could be evaluated on a larger scale in multiple countries.
Consequently, for the very near future, there is no alternative method that can be used instead of the friction-measuring devices. For longer terms the aircraft based assessment approach could be a very effective way of solving the harmonization problem by eliminating the two major inherent problems, the necessity of harmonization of different friction measuring devices and the correlation of the harmonized values to aircraft performance. However, this approach’s applicability to functional friction measurements still needs to be evaluated.
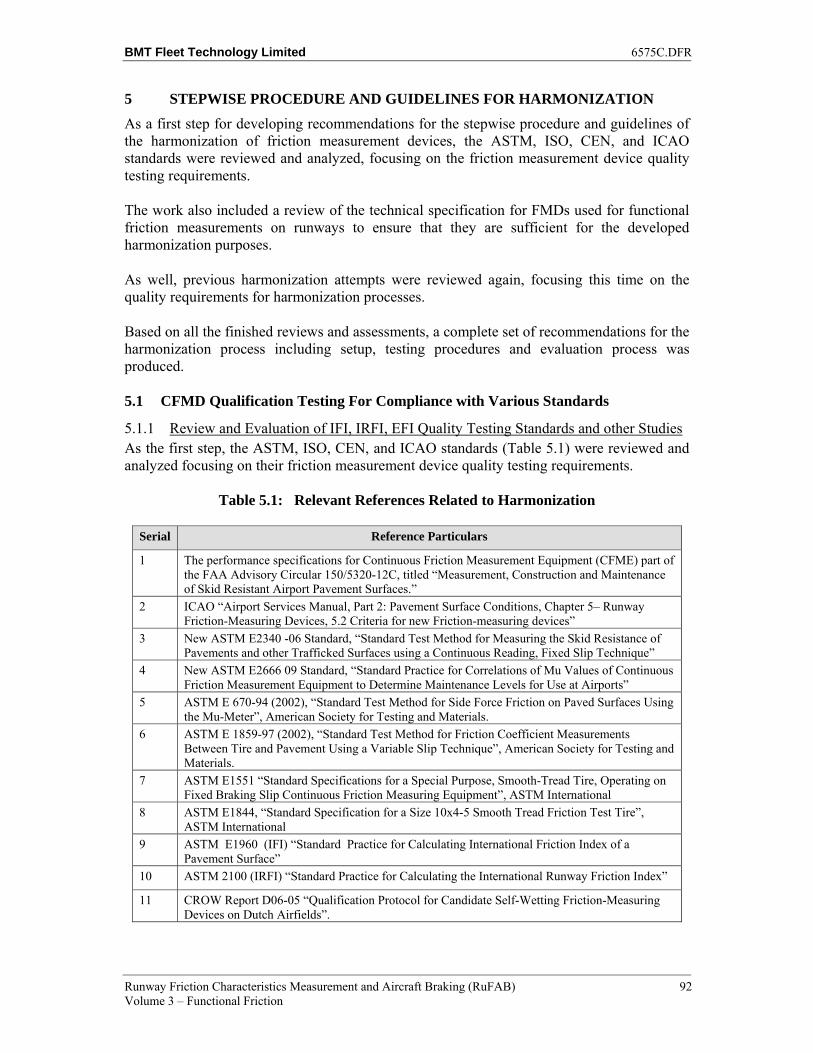
BMT Fleet Technology Limited 6575C.DFR
Runway Friction Characteristics Measurement and Aircraft Braking (RuFAB) 92 Volume 3 – Functional Friction
5 STEPWISE PROCEDURE AND GUIDELINES FOR HARMONIZATION
As a first step for developing recommendations for the stepwise procedure and guidelines of the harmonization of friction measurement devices, the ASTM, ISO, CEN, and ICAO standards were reviewed and analyzed, focusing on the friction measurement device quality testing requirements.
The work also included a review of the technical specification for FMDs used for functional friction measurements on runways to ensure that they are sufficient for the developed harmonization purposes.
As well, previous harmonization attempts were reviewed again, focusing this time on the quality requirements for harmonization processes.
Based on all the finished reviews and assessments, a complete set of recommendations for the harmonization process including setup, testing procedures and evaluation process was produced.
5.1 CFMD Qualification Testing For Compliance with Various Standards
5.1.1 Review and Evaluation of IFI, IRFI, EFI Quality Testing Standards and other Studies As the first step, the ASTM, ISO, CEN, and ICAO standards (Table 5.1) were reviewed and analyzed focusing on their friction measurement device quality testing requirements.
Table 5.1: Relevant References Related to Harmonization
Serial Reference Particulars
1 The performance specifications for Continuous Friction Measurement Equipment (CFME) part of the FAA Advisory Circular 150/5320-12C, titled “Measurement, Construction and Maintenance of Skid Resistant Airport Pavement Surfaces.”
2 ICAO “Airport Services Manual, Part 2: Pavement Surface Conditions, Chapter 5– Runway Friction-Measuring Devices, 5.2 Criteria for new Friction-measuring devices”
3 New ASTM E2340 -06 Standard, “Standard Test Method for Measuring the Skid Resistance of Pavements and other Trafficked Surfaces using a Continuous Reading, Fixed Slip Technique”
4 New ASTM E2666 09 Standard, “Standard Practice for Correlations of Mu Values of Continuous Friction Measurement Equipment to Determine Maintenance Levels for Use at Airports”
5 ASTM E 670-94 (2002), “Standard Test Method for Side Force Friction on Paved Surfaces Using the Mu-Meter”, American Society for Testing and Materials.
6 ASTM E 1859-97 (2002), “Standard Test Method for Friction Coefficient Measurements Between Tire and Pavement Using a Variable Slip Technique”, American Society for Testing and Materials.
7 ASTM E1551 “Standard Specifications for a Special Purpose, Smooth-Tread Tire, Operating on Fixed Braking Slip Continuous Friction Measuring Equipment”, ASTM International
8 ASTM E1844, “Standard Specification for a Size 10x4-5 Smooth Tread Friction Test Tire”, ASTM International
9 ASTM E1960 (IFI) “Standard Practice for Calculating International Friction Index of a Pavement Surface”
10 ASTM 2100 (IRFI) “Standard Practice for Calculating the International Runway Friction Index”
11 CROW Report D06-05 “Qualification Protocol for Candidate Self-Wetting Friction-Measuring Devices on Dutch Airfields”.
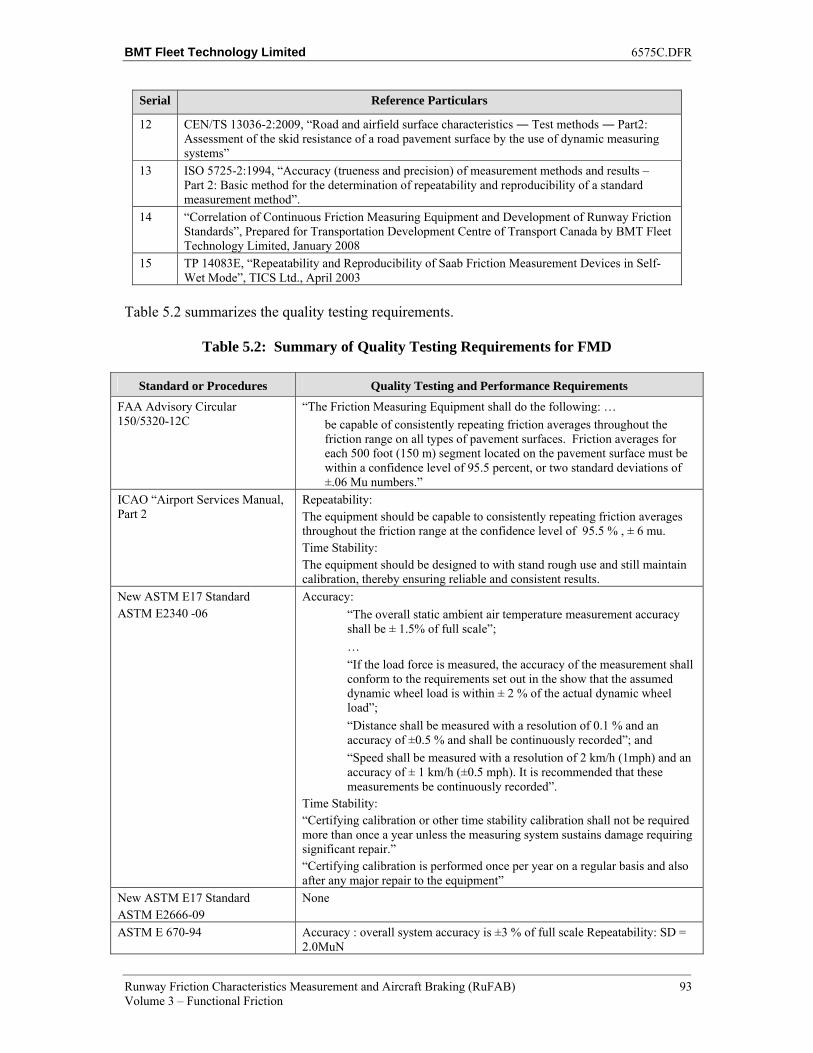
BMT Fleet Technology Limited 6575C.DFR
Runway Friction Characteristics Measurement and Aircraft Braking (RuFAB) 93 Volume 3 – Functional Friction
Serial Reference Particulars
12 CEN/TS 13036-2:2009, “Road and airfield surface characteristics ― Test methods ― Part2: Assessment of the skid resistance of a road pavement surface by the use of dynamic measuring systems”
13 ISO 5725-2:1994, “Accuracy (trueness and precision) of measurement methods and results – Part 2: Basic method for the determination of repeatability and reproducibility of a standard measurement method”.
14 “Correlation of Continuous Friction Measuring Equipment and Development of Runway Friction Standards”, Prepared for Transportation Development Centre of Transport Canada by BMT Fleet Technology Limited, January 2008
15 TP 14083E, “Repeatability and Reproducibility of Saab Friction Measurement Devices in Self-Wet Mode”, TICS Ltd., April 2003
Table 5.2 summarizes the quality testing requirements.
Table 5.2: Summary of Quality Testing Requirements for FMD
Standard or Procedures Quality Testing and Performance Requirements
FAA Advisory Circular 150/5320-12C
“The Friction Measuring Equipment shall do the following: …
be capable of consistently repeating friction averages throughout the friction range on all types of pavement surfaces. Friction averages for each 500 foot (150 m) segment located on the pavement surface must be within a confidence level of 95.5 percent, or two standard deviations of ±.06 Mu numbers.”
ICAO “Airport Services Manual, Part 2
Repeatability: The equipment should be capable to consistently repeating friction averages throughout the friction range at the confidence level of 95.5 % , ± 6 mu. Time Stability: The equipment should be designed to with stand rough use and still maintain calibration, thereby ensuring reliable and consistent results.
New ASTM E17 Standard ASTM E2340 -06
Accuracy:
“The overall static ambient air temperature measurement accuracy shall be ± 1.5% of full scale”;
…
“If the load force is measured, the accuracy of the measurement shall conform to the requirements set out in the show that the assumed dynamic wheel load is within ± 2 % of the actual dynamic wheel load”;
“Distance shall be measured with a resolution of 0.1 % and an accuracy of ±0.5 % and shall be continuously recorded”; and
“Speed shall be measured with a resolution of 2 km/h (1mph) and an accuracy of ± 1 km/h (±0.5 mph). It is recommended that these measurements be continuously recorded”.
Time Stability: “Certifying calibration or other time stability calibration shall not be required more than once a year unless the measuring system sustains damage requiring significant repair.” “Certifying calibration is performed once per year on a regular basis and also after any major repair to the equipment”
New ASTM E17 Standard ASTM E2666-09
None
ASTM E 670-94 Accuracy : overall system accuracy is ±3 % of full scale Repeatability: SD = 2.0MuN
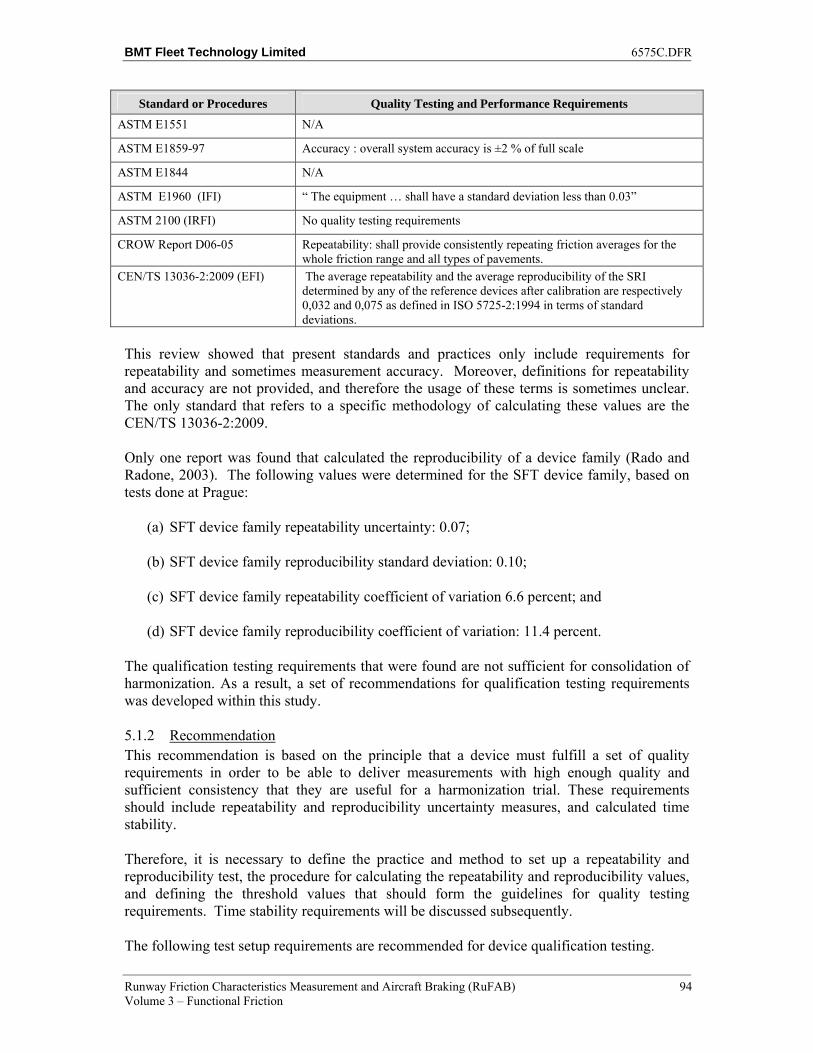
BMT Fleet Technology Limited 6575C.DFR
Runway Friction Characteristics Measurement and Aircraft Braking (RuFAB) 94 Volume 3 – Functional Friction
Standard or Procedures Quality Testing and Performance Requirements
ASTM E1551 N/A
ASTM E1859-97 Accuracy : overall system accuracy is ±2 % of full scale
ASTM E1844 N/A
ASTM E1960 (IFI) “ The equipment … shall have a standard deviation less than 0.03”
ASTM 2100 (IRFI) No quality testing requirements
CROW Report D06-05 Repeatability: shall provide consistently repeating friction averages for the whole friction range and all types of pavements.
CEN/TS 13036-2:2009 (EFI) The average repeatability and the average reproducibility of the SRI determined by any of the reference devices after calibration are respectively 0,032 and 0,075 as defined in ISO 5725-2:1994 in terms of standard deviations.
This review showed that present standards and practices only include requirements for repeatability and sometimes measurement accuracy. Moreover, definitions for repeatability and accuracy are not provided, and therefore the usage of these terms is sometimes unclear. The only standard that refers to a specific methodology of calculating these values are the CEN/TS 13036-2:2009.
Only one report was found that calculated the reproducibility of a device family (Rado and Radone, 2003). The following values were determined for the SFT device family, based on tests done at Prague:
(a) SFT device family repeatability uncertainty: 0.07;
(b) SFT device family reproducibility standard deviation: 0.10;
(c) SFT device family repeatability coefficient of variation 6.6 percent; and
(d) SFT device family reproducibility coefficient of variation: 11.4 percent.
The qualification testing requirements that were found are not sufficient for consolidation of harmonization. As a result, a set of recommendations for qualification testing requirements was developed within this study.
5.1.2 Recommendation This recommendation is based on the principle that a device must fulfill a set of quality requirements in order to be able to deliver measurements with high enough quality and sufficient consistency that they are useful for a harmonization trial. These requirements should include repeatability and reproducibility uncertainty measures, and calculated time stability.
Therefore, it is necessary to define the practice and method to set up a repeatability and reproducibility test, the procedure for calculating the repeatability and reproducibility values, and defining the threshold values that should form the guidelines for quality testing requirements. Time stability requirements will be discussed subsequently.
The following test setup requirements are recommended for device qualification testing.
BMT Fleet Technology Limited 6575C.DFR
Runway Friction Characteristics Measurement and Aircraft Braking (RuFAB) 95 Volume 3 – Functional Friction
5.1.2.1 Surface Selection Requirements At least five different pavement test sections should be selected. A minimum of five (5) test surfaces are required with different friction levels (although it is strongly recommended to use eight or more different surfaces) to ensure that the tests yield quality data. This is needed to ensure that the results can be used for both the calculation of statistically significant correlation parameters and, the necessary statistics regarding reliability and confidence.
Each test section should be a minimum of 200 m long for a 100 m effective data collection section and, have a minimum of 100 m length as a run-in section.
The test surfaces should span friction levels from approximately 0.30 (a smaller value of 0.20 or less is preferred) to 0.7 (a value from 0.8 to 1.00 is preferred). The average friction level of each test surface shall be separated from the other test surfaces by a minimum friction level of 0.05.
The test surfaces should have at least two different texture levels; one with 0.5 mm MTD or less and, the other with MTD greater than 1.0 mm. A wider range of texture depth levels is preferable.
The test sections should be straight with uniform friction and homogeneous texture. The test surfaces should be free of excessive roughness and surface distress (potholes, etc.). The test surfaces should be free of debris, chemicals, and contamination.
The longitudinal slope of each section should be less than ±3 percent. The cross slope of each test section should be less than ±2 percent.
5.1.2.2 Testing Process Requirements To produce the minimum number of statistically required measurements, at least five (5) different surfaces should be tested. At least five (5) runs should be made on each of the ten different surfaces. This gives a minimum of 25 measurements.
The test speed should be in accordance with that set by the State for functional friction measurements. The test speed should be maintained within ± 3 km/h of the target speed for the entire length of the test section.
The self-watering system of the measurement device should deliver a water film depth in accordance with that set by the State for functional friction measurements. The water used for self-wetting should be clean, and free of dirt, chemicals or other contaminants.
The tests should be conducted only when both the pavement surface and the ambient air temperatures are above 0°C (zero degrees Celsius) and the pavement is dry. The surface temperatures for each surface segment should be measured and reported.
The friction measuring systems and components should be calibrated in accordance with the manufacturer's instructions prior to testing. The system parameters for each CFME should be verified in accordance with the manufacturer’s verification procedures (e.g., tire pressure, tire wear, etc.) prior to testing.
BMT Fleet Technology Limited 6575C.DFR
Runway Friction Characteristics Measurement and Aircraft Braking (RuFAB) 96 Volume 3 – Functional Friction
Each device should do two test runs on each surface to condition the surface for measurements with data collection before the actual correlation runs take place. The collected initial data should be discarded from the correlation test results.
Each device should be in measurement mode with its self-wetting system “ON” for at least 100m prior to actual data collection, to ensure good and stable dynamic tire conditions on the test surface and undisturbed data collection.
Marking lines should be placed on the test sections to provide visual guidance for the driver. These will minimize the potential for variations in the measured friction values due to variations in the lateral position of the measurement tire on the measured surface. The CFME and its test tire should be guided by yellow short lines at the beginning, end and each 25 m of the 100 m test section. The marking lines should be placed 0.25 m on each side of the centerline of the selected test section’s longitudinal path. The length of each yellow marker lines should be at least 0.25 m.
The start and the end of each 100 m section should be marked by a traffic cone or another similar method. It is important to ensure that all measurements (whether they be repetitions for a device in a given test series, or; measurements being compared between different devices) are started at the same longitudinal position on the test surface as closely as possible.
Each device should do an extra run through its own water after each measurement to help disperse the water from the measurement surface. This will help to prevent the build-up of significant amounts of water on the test section which would introduce variations in the actual water depth. The extra run could be done by simply driving through the trace of water on the measurement surface as the vehicle returns to the starting position after a measurement run has been made. Friction data should not be collected with the extra run and, the device’s watering system should be switched off. As an alternative to the extra run, a minimum of four minutes delay should be made between two consecutive runs in order for the water to run off the surface.
5.1.2.3 Determination of Quality Measures For the determination of both the repeatability and reproducibility uncertainty of a family of friction measuring devices, a three level measurement session with multiple representatives of the device family must be conducted based on ASTM E691 and ISO 5725-2. For the calculation equations the following symbol designations have been used:
J is the number repetitions – min. 5;
K is the number of surfaces – min. 10; and
L is the number of measurement devices – min. 3.
For the three-level nested design, three basic repeatability statistics of Level-1, Level-2, and Level-3 standard deviations have to be computed across the collected data. It should be noted that the structure of the nested data required to determine device repeatability is substantially different from the nesting structure required for calculating the FMD family’s reproducibility.
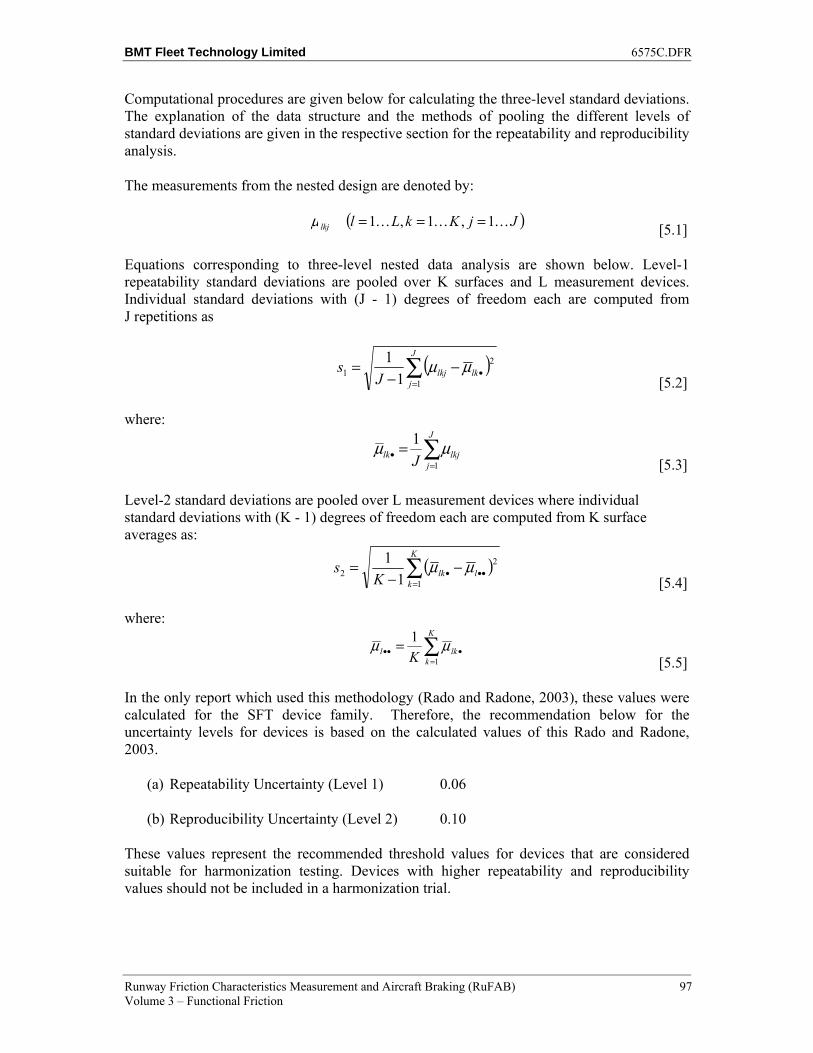
BMT Fleet Technology Limited 6575C.DFR
Runway Friction Characteristics Measurement and Aircraft Braking (RuFAB) 97 Volume 3 – Functional Friction
Computational procedures are given below for calculating the three-level standard deviations. The explanation of the data structure and the methods of pooling the different levels of standard deviations are given in the respective section for the repeatability and reproducibility analysis.
The measurements from the nested design are denoted by:
[5.1]
Equations corresponding to three-level nested data analysis are shown below. Level-1 repeatability standard deviations are pooled over K surfaces and L measurement devices. Individual standard deviations with (J - 1) degrees of freedom each are computed from J repetitions as
( )∑
=•−
−=
J
jlklkjJ
s1
21 1
1 μμ [5.2]
where:
∑
=• =
J
jlkjlk J 1
1 μμ [5.3]
Level-2 standard deviations are pooled over L measurement devices where individual standard deviations with (K - 1) degrees of freedom each are computed from K surface averages as:
( )∑
=••• −
−=
K
kllkK
s1
22 1
1 μμ [5.4]
where:
∑
=••• =
K
klkl K 1
1 μμ [5.5]
In the only report which used this methodology (Rado and Radone, 2003), these values were calculated for the SFT device family. Therefore, the recommendation below for the uncertainty levels for devices is based on the calculated values of this Rado and Radone, 2003.
(a) Repeatability Uncertainty (Level 1) 0.06
(b) Reproducibility Uncertainty (Level 2) 0.10
These values represent the recommended threshold values for devices that are considered suitable for harmonization testing. Devices with higher repeatability and reproducibility values should not be included in a harmonization trial.
( )JjKkLllkj 1,1,1 ===μ
BMT Fleet Technology Limited 6575C.DFR
Runway Friction Characteristics Measurement and Aircraft Braking (RuFAB) 98 Volume 3 – Functional Friction
5.2 Review Technical Criteria for Measuring Device Compliance
5.2.1 Material Reviewed This section also includes a review of the technical specification for devices used for functional friction measurements (Table 5.3) to ensure they provide adequate performance. This review included the following standards and specifications.
Table 5.3: Relevant References: Technical Criteria for Friction Measuring Devices
Serial Reference Particulars
1 The performance specifications for Continuous Friction Measurement Equipment (CFME) part of the FAA Advisory Circular 150/5320-12C, titled “Measurement, Construction and Maintenance of Skid Resistant Airport Pavement Surfaces.”
2 ICAO “Airport Services Manual, Part 2: Pavement Surface Conditions, Chapter 5– Runway Friction-Measuring Devices, 5.2 Criteria for new Friction-measuring devices”.
3 New ASTM E17 Standard, “Standard Test Method for Measuring the Skid Resistance of Pavements and other Trafficked Surfaces using a Continuous Reading, Fixed Slip Technique”.
4 ASTM E 670-94 (2002), “Standard Test Method for Side Force Friction on Paved Surfaces Using the Mu-Meter”, American Society for Testing and Materials.
5 ASTM E 1859-97 (2002), “Standard Test Method for Friction Coefficient Measurements Between Tire and Pavement Using a Variable Slip Technique”, American Society for Testing and Materials.
6 ASTM E1551, “Standard Specifications for a Special Purpose, Smooth-Tread Tire, Operating on Fixed Braking Slip Continuous Friction Measuring Equipment”, ASTM International.
7 ASTM E1844, “Standard Specification for a Size 10x4-5 Smooth Tread Friction Test Tire”, ASTM International.
8 CROW Report D06-05, “Qualification Protocol for Candidate Self-Wetting Friction-Measuring Devices on Dutch Airfields”.
The review was focused on identifying significant common technical requirements. The comparison highlighted a number of issues that are common in most approaches as well as some commonalities regarding the expected technical or engineering requirements. Based on the review, the following summary was compiled.
5.2.2 Review of Content in Specifications
5.2.2.1 Mechanical Design
The following should be targeted:
(a) Mode of measurements: Continuous measurements in motion.
(b) May be self contained or towed.
(c) Shall provide fast, continuous, accurate and reliable measurements for the entire length of the runway.
(d) May be braking force type or side-force type CFME.
(e) Rough design (vibration, stability, effect of roughness).
(f) Should be capable of performing dry tests between 20 km/h and 40 km/h.
BMT Fleet Technology Limited 6575C.DFR
Runway Friction Characteristics Measurement and Aircraft Braking (RuFAB) 99 Volume 3 – Functional Friction
5.2.2.2 Output The range of the friction coefficient should be from 0.0 to at least 1.0. The device should record and report (a) speed, (b) distance, and (c) water flow (although this is not commonly done at present by the devices).
The device should provide average friction values for segments of the runway length from 10 m to one third of the runway length to the full runway length.
The device should produce a permanent record of friction measurements through the whole runway length.
5.2.2.3 Operating Conditions The device should provide acceptable operation in a wide range of conditions. This ranged from not being specified to all weather conditions.
Mostly, the criteria specified operating temperatures from -40ºC to 40ºC and relative humidity values up to 100%.
5.2.2.4 Repeatability This requirement was only loosely defined, and sometimes without the correct statistical meaning. In general, the criteria ranged between 0.02 and 0.06 STD (requiring interpretation) on a 150 m long section.
5.2.2.5 Watering System The film depth requirement varies depending on the practices used by the State. As described in Volume 2, different water film depths are used by different States. The ICAO Airport Services Manual specifies a film depth of 1 mm. Typically, a requirement of 10 percent based on water flow was for accuracy was specified.
No information or requirements were found related to the depth profile or the width of the watered zone in front of the tire.
5.2.2.6 Test Speed The test speed requirements vary depending on the practices used by the State, as described in Volume 2. Test speeds of 65 km/h, and 95 km/h are most usual although some States require from tests at speeds from 40 km/h to 130 km/h.
The specified accuracy requirements varied from none being specified to 2 to 5 percent.
5.2.2.7 Device Documentation and Instrumentation The device documentation requirements varied greatly. They varied from analogue and paper trace to digital recording to 1 m resolution.
5.2.2.8 Host Vehicle No general trend was noted. Some specifications defined the requirements in great detail, even to the point of defining the air-conditioning requirements. Others had no requirements.
In general, the specifications stated that adequate speed and acceleration was required.
BMT Fleet Technology Limited 6575C.DFR
Runway Friction Characteristics Measurement and Aircraft Braking (RuFAB) 100 Volume 3 – Functional Friction
5.2.2.9 Test Tire Mostly, blank tires were specified according to some standard, which may or may not be specified within the standard.
Some documents specified the inflation pressure, which was also present in standards.
5.2.3 Overall Comments The review led to the conclusion that the technical specifications for friction measuring devices are not consistent and not adequate for the purposes of device harmonization.
As discussed previously, it was found that some device parameters significantly affect the friction readings. Furthermore, at present, no satisfactory models are available to account for many of these differences. As a result, it is believed to be necessary to standardize all parameters that can’t be modelled reliably.
As a result, a comprehensive technical specification was developed within this report where all parameters significantly affecting the friction readings, and without appropriate available physical models, are standardized. An example for the new technical specifications was also developed based on the ASTM E2360 standard and described in detail (in a later section).
5.2.4 Recommendation
5.2.4.1 Introduction These recommendations were produced because previous tasks in this project showed that many of the device parameters significantly affect the friction readings and at this point, there are no satisfactory models for accounting for their effects. The main guideline used for developing this was that, if any of the important parameters cannot effectively compensated for in a model, then they must be standardized.
In this recommendation, beside the main guideline, a detailed technical specification was also developed as an example for future work. It is based on the new ASTM E17 standard, ASTM E 2340 – 06, Standard Test Method for Measuring the Skid Resistance of Pavements and Other Trafficked Surfaces Using a Continuous Reading, Fixed-Slip Technique.
The purpose of the technical specification presented here is to give an example, particularly with respect to the topics that should be covered. The development of the final specification should be part of a future development and research study.
5.2.4.2 Basic Design and Measurement Requirements The measurement equipment should be equipped with a force transducer to provide a direct measurement of the friction force generated by the braked test tire.
The measurement device should be equipped with a force transducer to measure the actual loading force acting on the measurement test wheel.
The measurement device shall be designed to be able to apply a vertical load on the measuring test wheel according to the ASTM 1551 standard.
The test apparatus should be able to measure the test speed and distance travelled.
BMT Fleet Technology Limited 6575C.DFR
Runway Friction Characteristics Measurement and Aircraft Braking (RuFAB) 101 Volume 3 – Functional Friction
The measurement device should be able to measure the rate of water flow delivered in front of the measuring test wheel of the self-wetting system.
The equipment should be able to operate reliably under the following conditions:
(a) 100 percent relative humidity rain or spray;
(b) shock, and vibrations encountered during measurement due to surface roughness;
(c) measurement speeds between 10km/h and 120km/h; and
(d) temperatures between –40°C and +45°C
A fixed slip measurement device should be able to maintain the fixed braking slip ratio within ±1 percent of the chosen constant slip ratio independent of testing speed and friction level.
A side force coefficient measurement device shall be able to maintain the selected side angle of the measurement wheel within ±1 degree of the designed slip angle independent of testing speed and friction level.
The test tire should conform to the ASTM standard E 1551.
5.2.4.3 Uncertainty and Stability of Measuring System Under the full range of operating conditions, the device repeatability should be no more than 0.06, and the device family reproducibility should be no more than 0.10.
Certified calibrations or other time stability calibrations should not be required at time intervals of more than once a year unless the measuring system sustains damage requiring significant repair.
The measurement wheel loading force transducer should measure forces without inertial effects. It is required that the force transducer have less than 1% hysteresis over the full scale of its loading range. The mounting of the braking force-measuring transducer should be such that the effects of cross-axle loading should be less than 1 percent of the applied load.
The braking force transducer should be mounted in such a manner as to experience less than 1 degree angular rotation with respect to its longitudinal measuring plane at the maximum expected loading.
Distance should be measured with a resolution of 0.1 m and an accuracy of ±0.1 m on every 100 m length measured.
Speed should be measured with a resolution of 0.1 km/hr and an accuracy of ±0.5 km/hr.
All acquired measurements – friction force, loading force, speed, distance, and water flow – should be recorded during friction measurements. The recorded measurements should be referenced to the travelled distance with a resolution of 1 m and an accuracy of 0.1 m.
BMT Fleet Technology Limited 6575C.DFR
Runway Friction Characteristics Measurement and Aircraft Braking (RuFAB) 102 Volume 3 – Functional Friction
5.2.4.4 Measurement and Procedure-Related Requirements The measurement device should be capable of maintaining the chosen test speed within ±2 km/hr during measurements independent of the fixed slip ratio, selected side angle, friction level, or selected testing speed.
The measurement device should be able to accelerate to 95 km/h speed within a distance of 300 m under the full braking load produced by measurements at a friction level of 1.0, with the watering system filled to total capacity.
5.2.4.5 Self-Wetting System The self-wetting system of the device should be designed to deliver a calculated and measured water film in front of the measurement tire that meets the requirement set out by the State for functional friction measurements. It should provide uniform distribution across the measuring tire. The delivered water film thickness should be independent of the measurement speed.
The water application system should employ a watering nozzle that ensures uniform water distribution at all speeds.
The watering nozzle and the water delivery system should be designed such that water is delivered with zero relative speed to the ground. Thus, the water film should be delivered with horizontal speed equal to the test speed and opposing the direction of travel of the measuring vehicle.
The watering nozzle should be designed to deliver a water film that is 0.02 m (2 cm) wider on each side of the measurement tire and centered around the midpoint of the measurement tire footprint for both fixed-slip and side-force devices.
The self wetting system should be able to maintain a constant and regulated rate of water flow within ±5 percent of the target flow rate.
5.2.4.6 Data Recording and Electronic Signal Conditioning All signal-conditioning and recording equipment should provide linear output and allow data reading resolution to meet the requirements described under the “Uncertainty and Stability of Measuring System” section of this text (section 5.2.4.3).
All electronic signal systems should provide a minimum bandwidth of at least 0 to 100 Hz without distortion across the whole range.
All the required measurements described in “Basic Design and Measurement Requirements” (section 5.2.4.2) should be recorded in phase and referenced to a common distance base and passed through the same filter. A low-pass electronic or digital filter, typically between 4.8 Hz/-3db/4 pole and a 10 Hz/-3db/8 pole, should be installed in the signal-conditioning system.
The static signal-to-noise ratio should be at least 100 to 1 at full scale on all recording channels.
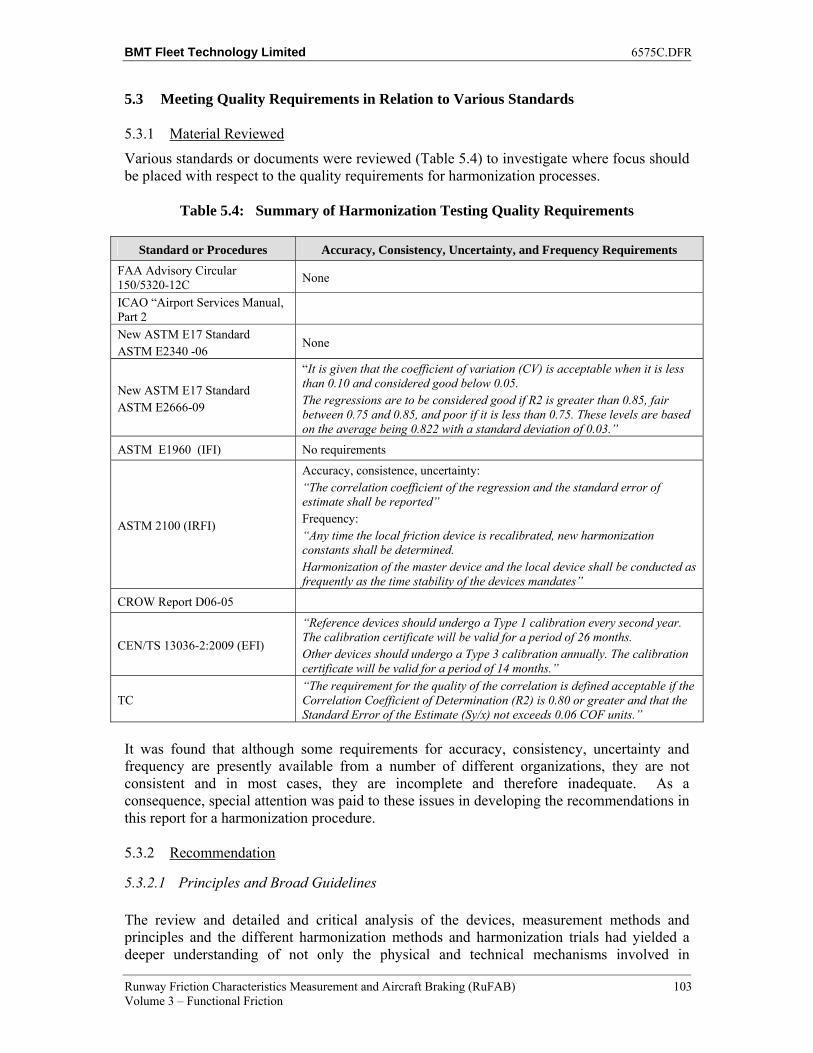
BMT Fleet Technology Limited 6575C.DFR
Runway Friction Characteristics Measurement and Aircraft Braking (RuFAB) 103 Volume 3 – Functional Friction
5.3 Meeting Quality Requirements in Relation to Various Standards
5.3.1 Material Reviewed
Various standards or documents were reviewed (Table 5.4) to investigate where focus should be placed with respect to the quality requirements for harmonization processes.
Table 5.4: Summary of Harmonization Testing Quality Requirements
Standard or Procedures Accuracy, Consistency, Uncertainty, and Frequency Requirements
FAA Advisory Circular 150/5320-12C
None
ICAO “Airport Services Manual, Part 2
New ASTM E17 Standard ASTM E2340 -06
None
New ASTM E17 Standard ASTM E2666-09
“It is given that the coefficient of variation (CV) is acceptable when it is less than 0.10 and considered good below 0.05. The regressions are to be considered good if R2 is greater than 0.85, fair between 0.75 and 0.85, and poor if it is less than 0.75. These levels are based on the average being 0.822 with a standard deviation of 0.03.”
ASTM E1960 (IFI) No requirements
ASTM 2100 (IRFI)
Accuracy, consistence, uncertainty: “The correlation coefficient of the regression and the standard error of estimate shall be reported” Frequency: “Any time the local friction device is recalibrated, new harmonization constants shall be determined. Harmonization of the master device and the local device shall be conducted as frequently as the time stability of the devices mandates”
CROW Report D06-05
CEN/TS 13036-2:2009 (EFI)
“Reference devices should undergo a Type 1 calibration every second year. The calibration certificate will be valid for a period of 26 months. Other devices should undergo a Type 3 calibration annually. The calibration certificate will be valid for a period of 14 months.”
TC “The requirement for the quality of the correlation is defined acceptable if the Correlation Coefficient of Determination (R2) is 0.80 or greater and that the Standard Error of the Estimate (Sy/x) not exceeds 0.06 COF units.”
It was found that although some requirements for accuracy, consistency, uncertainty and frequency are presently available from a number of different organizations, they are not consistent and in most cases, they are incomplete and therefore inadequate. As a consequence, special attention was paid to these issues in developing the recommendations in this report for a harmonization procedure.
5.3.2 Recommendation
5.3.2.1 Principles and Broad Guidelines
The review and detailed and critical analysis of the devices, measurement methods and principles and the different harmonization methods and harmonization trials had yielded a deeper understanding of not only the physical and technical mechanisms involved in
BMT Fleet Technology Limited 6575C.DFR
Runway Friction Characteristics Measurement and Aircraft Braking (RuFAB) 104 Volume 3 – Functional Friction
harmonization efforts but also the importance of requirements, policies and regulations and the necessity for standardizing a number critical steps in a harmonization process. The study identified a number of important aspects of testing equipment, testing methods, basic shortcomings of previous harmonization trials that contributed to the shortcomings of earlier harmonization trials preventing the development of a method that delivers accuracy, precision, time-stability and practicality. There are five broad major areas of the discovered issues:
(a) Lack of universal minimum technical specifications of the measurement devices independent of their respective measurement principles - a number of technical base-level criteria need to be assessed and minimum specifications developed to ensure devices meet minimum requirements allowing successful testing for harmonization. At present despite numerous international standards no universal technical minimum technical specifications exist. At the same time there are important issues that are not addressed in these standards or the requirements are inadequate. These areas are the following:
a. Lack of comprehensive specifications with respect to the required water delivery system - Criteria are required regarding not only the precise amount of water, but also the distribution of water across measurement tires and providing testing and minimum requirement standards.
b. Tires - A number of standardized, but substantially different measurement tires, are in use today. There is a lack of standardization to either use a single specific standardized measurement tire or to develop a comprehensive set of methods for relating the different tires through a high fidelity model.
c. Lack of unified requirements requiring standardized load, and tire pressure even for a single standard measurement tire.
Addressing these technical minimum specifications will deliver measurement platforms of the measurement devices built based on different measurement principles or different slip ratios that are comparable in principle. The established tire models at the same time will deliver methodology that can be used in harmonization trials successfully in bringing the measurements of devices with different but standardized tires to a common scale.
(b) A complete lack of established minimum measurement performance criteria establishing minimum requirements for individual device and device family measurement evaluations - the research in this study has shown that there are substantial variations in measurements, not only among different measurement devices, but also within a single family of devices from the same manufacturer and within the repeated measurement of a single device. At present there is a complete lack of requirements regarding the measurement and minimum performance limits of device repeatability and device family measurement reproducibility of friction measurement devices.
As has been shown in this report, a major factor in uncertainty of all harmonization models and methods is the uncertainty contributed by the different devices and device families. Controlling the inherent measurement uncertainties
BMT Fleet Technology Limited 6575C.DFR
Runway Friction Characteristics Measurement and Aircraft Braking (RuFAB) 105 Volume 3 – Functional Friction
of the devices and at the same time establishing harmonization requirements dependent on measurement uncertainty of the devices and device families will substantially reduce variations within measurement data allowing the harmonization methods to deliver high confidence and high fidelity results.
(c) The review of the different harmonization methods and harmonization trials have
shown that a major issue with all of the correlation and harmonization procedures is the uncertainty inherent in the surfaces measured by the devices for calibration and harmonization. The harmonization methods use long test surfaces that have been built to have different friction levels. These surfaces are then measured by a number of different devices and using a harmonization model and methodology, the devices are harmonized.
Many investigations have documented the fact that these large scale surfaces undergo changes over time due to weather and other external influences. This creates a very substantial problem for harmonization and the subsequent calibration of devices as they will deliver different results depending on the changes undergone by the calibration surfaces.
These changes include proven time dependency of both friction and textural features on even the most protected test surfaces over time. At present, the positive detection and identification of all of the encountered changes in the calibration standard surfaces are not addressed in any harmonization methods. The establishment of a viable and practical method and procedure to follow and establish the encountered changes in the relevant surface characteristic parameters of the surfaces used for calibration and harmonization would remove the problem of time-instability of harmonization and calibration methods stemming from the change of the used surfaces. Thus, it would remove the variations in the harmonization results and in subsequent years’ calibration of devices to the harmonized values due to the changes in the characteristics of the used calibration surfaces.
(d) This study also identified the problem of using reference device or devices for harmonization. Along with the calibration surfaces depicted above, most of the harmonization programs also use a specific reference measurement device or a set of devices in the harmonization method. The methods use the calibration surfaces and the selected reference device or devices to establish a set of measured values that are used in the harmonization process. This presents an additional problem associated with the selection of a device or devices as the reference.
The devices also have been proven to be somewhat unstable in time. Devices undergo aging, maintenance, repair and other mechanical interventions over time and usage that in reality, changes their measurement characteristics over time to an extent that interferes with harmonizations and calibrations. These are unavoidable even for the devices that are not in operational use and kept only for harmonization trials. The calibration and harmonization methods of today completely lack methods and procedures to detect these changes.
BMT Fleet Technology Limited 6575C.DFR
Runway Friction Characteristics Measurement and Aircraft Braking (RuFAB) 106 Volume 3 – Functional Friction
The establishment of a viable and practical method and procedure to follow and establish the encountered changes in the designated reference device or devices would remove the problem of time-instability of harmonization and calibration methods stemming from the change of reference devices. Thus, it would remove the variations in the harmonization results and in subsequent year’s calibration of devices to the harmonized values due to the changes in the reference devices.
(e) Due to the complexity of the problem of friction measurement and the necessary use of a set of large scale calibration surfaces and reference devices today, there is a complete lack of established check-standards for friction measurement, that is analogous to meter standard or established temperature standards. Due to the problems identified and described above, the establishment of such a check standard would have to embody both a set of standardized surfaces and a pair of devices that measure texture and friction of these surfaces and at the same time capable to perform measurements in the field and on large scale calibration surfaces efficiently. The selected devices for this purpose need to be measure the entire friction curve and macro-texture of the surface and need to have very high repeatability and reproducibility compared to other friction measurement devices. The surfaces need to be extremely reproducible and time stable. The establishment of such a check-standard will need to embody the following:
a. A set of small scale standardized surfaces with different texture and friction levels need to be developed. These surfaces need to be small enough to be perfectly reproducible in manufacturing and perfectly controllable in regard to properties relevant for friction and texture measurements. The surfaces need to be built from materials that are very resistant to wear and change. It is estimated that a standard surface fulfilling these criteria will have to be smaller than 0.5m2 and be built according to strict standardized procedures. A set of surfaces fulfilling these requirements can be produced using today’s technology and available materials.
b. A selection of two portable and small scale measurement equipment with high repeatability and reproducibility needs to be made; (i) one to measure surface texture, and (ii) the other to measure surface friction of the standardized test surfaces described above. The friction measurement device needs to be capable to measure friction over the entire friction curve up to 100km/hr slip speed. These devices need to be small and portable and able to measure within laboratory and field environments. Based on the literature review and the analysis of the available measurements devices, the CTMeter and the DFTester are recommended to be used. The devices are small footprint (0.6m x 0.6m) portable and light weight. Both devices exhibit superior repeatability and reproducibility (Wilson, 2006). The devices are designed to perform measurements over precisely the same physical surfaces, thus delivering measurements of surface texture and surface friction from exactly the same physical surface areas. The devices are portable and able to make measurements in both a laboratory and a field measurement environment.
BMT Fleet Technology Limited 6575C.DFR
Runway Friction Characteristics Measurement and Aircraft Braking (RuFAB) 107 Volume 3 – Functional Friction
Based upon the above discussed presently existing shortcomings of equipment, materials, procedures and processes, a new approach was developed to overcome the identified inadequacies and deficiencies. The following section gives an overview of the approach and describes a general logic of the proposed approach.
5.3.2.2 Description of Proposed Approach The purpose of the proposed approach is to overcome the shortcomings of the present practice for harmonization and calibration as defined by the five major inadequacies presented in the previous chapter. A graphical representation of the material of the previous section in a very broad and summarized level is given in Figure 5.1 under the problem definition section of the graph on the top of the page. This section depicts major shortcomings and the origin and basics of these inadequacies. The second part of the graph in Figure 5.1 labeled “Development of Recommendation” gives a logical flowchart of the methodology developed in this report to overcome the problems identified. An overview of the underlying steps and the logic connecting these steps to the defined problems and shortcomings is given below and can be graphically followed in Figure 5.1. As described in the first point of the previous sections, the differences in the measurement principles and design parameters of the different device families present a number of technical discrepancies between the measurement equipment that have a major influence on the readings. To a large extent, these variations are responsible for the differences in measured results. These differences can be categorized into two major groups: (a) processes that can be modelled; and (b) processes that can’t be adequately modelled. These processes are labelled in the graph of Figure 5.1 as “Sources of significant differences in measurements between devices”. It is recommended to separate these two categories and handle them differently:
(a) For those processes that can be adequately modelled, a full and comprehensive model needs to be developed (such as for the slip differences of the different devices and perhaps for variations in tire properties as well). As part of this, these models must be tested for accuracy and adequacy. Following that, they can be used in the harmonization procedure.
(b) For those processes and differences between devices that can’t be adequately modelled, standardization is required across the measurement devices. Such processes include the depth and uniformity of water film across the measurement tire, some of the measurement tires and loading of measurement tires together with internal tire pressure. For these parameters, a standard or common specification is required with obviously, the acceptable devices being required to conform to it.
The above two points are depicted in Figure 5.1 in the blocks labeled “Use Model in Harmonization” and “Use Standardization and strict technical specifications to eliminate source” within the “Development of Recommendation” section.
BMT Fleet Technology Limited 6575C.DFR
Runway Friction Characteristics Measurement and Aircraft Braking (RuFAB) 108 Volume 3 – Functional Friction
Under point 2 in the previous section, the lack of rigorous minimum measurement performance requirements is discussed. The corresponding block in the Problem Definition section of Figure 5.1 is “Most devices in trials produced: poor repeatability, poor reproducibility”. To address this issue the recommended approach encompasses two steps:
(a) The development of strict and uniform device repeatability and device family reproducibility standards. These standards need to define the process and procedures of producing device repeatability and device family reproducibility uncertainty measures according the established mathematical procedures. The standards at the same time need to establish the minimum required performance levels and threshold values a device and its device family needs to meet to be able to be harmonized.
(b) Using the established minimum threshold values and the procedures define the process and frequency of screening the measurement devices. The screening needs to set up threshold levels below which devices are required to be technically reviewed and/or serviced before harmonization is allowed. Another level of thresholds can be set up where devices are allowed to be harmonized but due to substandard uncertainty levels (repeatability and reproducibility) more strict and penalizing harmonization processes are utilized.
The above two points are depicted in Figure 5.1 within the blocks of “Develop strict requirements for device repeatability and device family reproducibility” and “Screen non performing devices from harmonization based on criteria” under the “Development of Recommendation” section. The shortcomings of the use of reference surfaces and reference devices discussed in points 3, 4 and 5 in the previous section are presented in Figure 5.1 within the problem definition section under the blocks labeled “Use of a set of reference surfaces as harmonization base” and “Use of one or a small number of reference devices as harmonization base”. The recommended solution to overcome these problems can be captured in the following steps:
(a) Select two small portable highly repeatable and reproducible devices that measure surface texture and surface friction over the entire friction range to high slip speeds (100km/hr is recommended) to use a harmonization device carrying the laboratory established time stable friction levels to field surfaces.
(b) Develop and produce small extremely time stable reputably and reproducibly manufacturable reference surfaces to establish laboratory friction standards. Due to the developments in materials and manufacturing techniques this is feasible in a small scale. The set of laboratory surfaces need to be designed to deliver a wide range in both texture and friction levels that is relevant to real life applications and need to be manufactured using materials and construction techniques that deliver extreme control over the relevant surface characteristic parameters.
(c) Using the developed set of surfaces and the two portable measurement devices, it is possible to establish an absolute and very time stable calibration mechanism using the surfaces and the two devices. The two measurement devices can be calibrated in laboratory environment using the standard surfaces. The calibrated devices then can be carried out to the field and detect and precisely describe changes that occurred on the large scale calibration surfaces that can be measured
BMT Fleet Technology Limited 6575C.DFR
Runway Friction Characteristics Measurement and Aircraft Braking (RuFAB) 109 Volume 3 – Functional Friction
by all high speed measurement devices. The detected and documented changes then can be accounted for in harmonization.
(d) The two devices calibrated in the laboratory can then establish the true friction and texture levels of the large scale test surfaces and produce the harmonization values. These then can be utilized in the harmonization of all pre-screened measurement devices.
(e) A selection of surfaces large enough to run all CFMD’s for calibration purposes can be also affected by using the laboratory-calibrated small devices. A sufficiently large number of surfaces with a wide range of texture and friction numbers can be used for CFMD calibration.
The above described method is depicted in Figure 5.1 within the logic of the flow of blocks starting with the block labeled “Use small portable device measuring entire friction curve that has high repeatability and reproducibility, DFTester, CTMeter” under the “Development of Recommendation” section. The section labeled “Harmonization” in Figure 5.1 depicts on a broad scale the use of the results from the above described procedures in a harmonization procedure. The blocks only intended to give a very broad overview of the proposed process. It shows that the use of the selected set of large scale real life surfaces can be measured with the laboratory calibrated two portable devices. Since these devices have superior repeatability and reproducibility and both of them have been calibrated to very time stable and repeatable small laboratory reference surfaces they can establish the true time stable and calibrated friction and texture levels of the selected large scale surfaces. The devices to be harmonized have already have been pre-screened and passed the minimum performance requirements in regard to repeatability and reproducibility. Using the available models, the developed harmonization procedures and processes and the established calibrated and time stable friction numbers of the selected large scale surfaces the harmonization of the CFM devices can be made with high confidence and precision. A more detailed and precise description of the harmonization steps is given in section 5.3.2.4.
5.3.2.3 Main Guidelines for Harmonization Testing Procedure Development It was concluded that earlier attempts for harmonization and the underlying processes/models did not include sufficient quality requirements for the devices with respect to accuracy, consistency, uncertainty and frequency. As an example, no threshold values are defined that friction measuring devices must meet to be acceptable for functional friction measurement. In response, the following guidelines for the harmonization process including setup, testing process, and evaluation process were formulated:
(a) It is recommended that a comprehensive set of technical specifications be developed and instituted in standards or other regulatory documents. These standards should be based on the given technical criteria and base-level specifications developed in this study.
BMT Fleet Technology Limited 6575C.DFR
Runway Friction Characteristics Measurement and Aircraft Braking (RuFAB) 110 Volume 3 – Functional Friction
(b) It is suggested that the friction devices should be required to comply with these technical requirements. Devices that are not designed to fulfill these standards need special treatment that might require much more frequent calibration or the use of conservative harmonization values, which penalize these devices.
(c) The establishment of a stringent requirement is recommended for measurement devices regarding the limitation of uncertainty limitation. It should encompass the measurement and establishment of threshold values for both individual device repeatability and device family reproducibility. The procedures for the measurement of these values and the established thresholds should be based on the recommendations of this study.
(d) Every measurement device family should be required to undergo testing for repeatability and reproducibility. Devices that cannot fulfill the specified requirements need special treatment that might require much more frequent calibration or the use of conservative harmonization values, which penalize these devices.
(e) A candidate for the use as the reference measurement device was identified by the study. The use of the DF tester and the CT meter device family as the reference measuring device for frictional and texture measurements is proposed. These devices have a proven record of reliability with good repeatability, device reproducibility and time stability over the different studies and trials that employed them.
(f) As these devices are spot measuring devices their dynamic calibration can be done on a 0.6 m by 0.6 m precision reference surface and could be performed in ideal laboratory settings. This procedure would reduce the problems inherent in the production of high quality reference surfaces to the production of a 0.6 m square surface decreasing the problems of reproducible production to a manageable size. After the dynamic calibration of the reference devices on these small reference surfaces, they can be used for the harmonization process on any set of surfaces fulfilling a minimal set of requirements.
(g) For the harmonization model itself, it is recommended to use the European Friction Index or EFI or the equivalent IFI type of harmonization. Of course, this would only compensate for differences in slip ratios and slip angles.
(h) The establishment and setting of quality requirements for the harmonization testing is also recommended.
(i) The creation of a plan for the frequency of the execution of this harmonization testing is also recommended with a suggested yearly frequency for each compliant device. A strictly enforced and timely calibration plan would ensure the device’s time stability requirements are met. It is recommended that the device constants be compared annually. If the difference is more than a preset threshold value, the device would have to be taken for service for further investigation. It should be barred from functional friction measurements on airports until the repairs are performed.
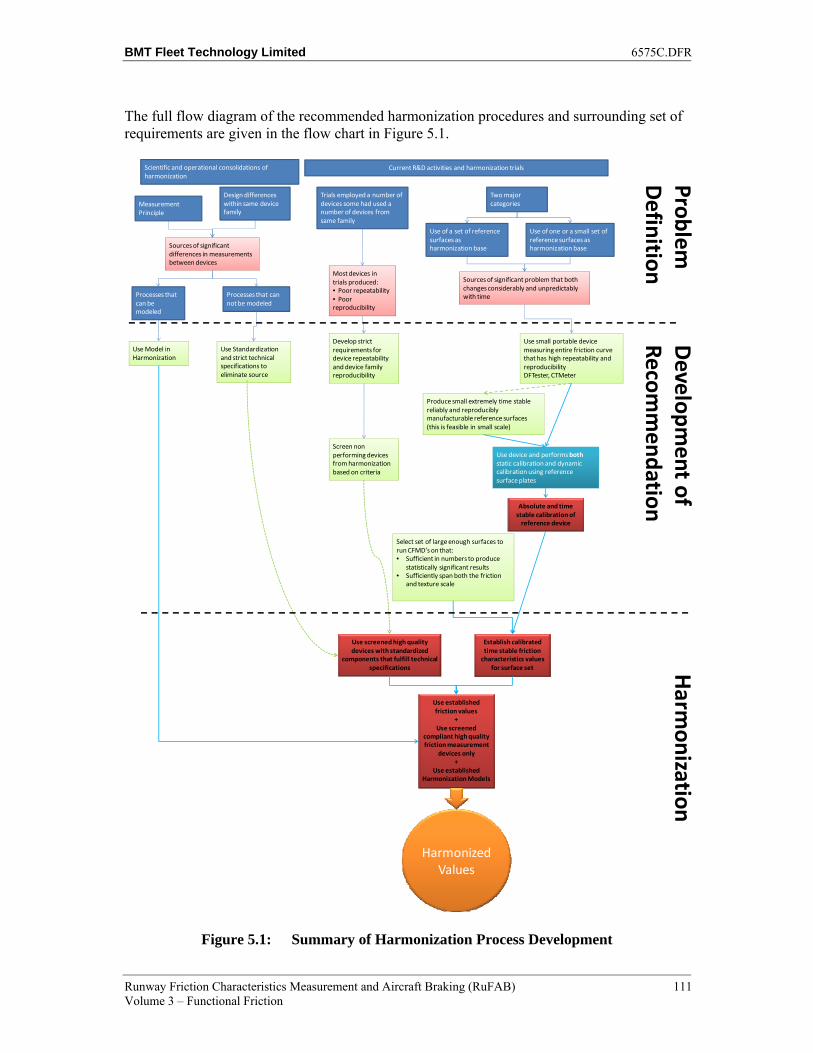
BMT Fleet Technology Limited 6575C.DFR
Runway Friction Characteristics Measurement and Aircraft Braking (RuFAB) 111 Volume 3 – Functional Friction
The full flow diagram of the recommended harmonization procedures and surrounding set of requirements are given in the flow chart in Figure 5.1.
Figure 5.1: Summary of Harmonization Process Development
Sources of significant differences in measurements between devices
Scientific and operational consolidations of harmonization
Measurement Principle
Design differences within same device family
Processes that can be modeled
Processes that can not be modeled
Use Model in Harmonization
Use Standardization and strict technical specifications to eliminate source
Current R&D activities and harmonization trials
Two major categories
Use of a set of reference surfaces as harmonization base
Use of one or a small set of reference surfaces as harmonization base
Sources of significant problem that both changes considerably and unpredictably with time
Use small portable device measuring entire friction curve that has high repeatability and reproducibilityDFTester, CTMeter
Produce small extremely time stable reliably and reproducibly manufacturable reference surfaces (this is feasible in small scale)
Trials employed a number of devices some had used a number of devices from same family
Most devices in trials produced:• Poor repeatability• Poor reproducibility
Develop strict requirements for device repeatability and device family reproducibility
Screen non performing devices from harmonization based on criteria
Use device and performs both static calibration and dynamic calibration using reference surface plates
Absolute and time stable calibration of
reference device
Select set of large enough surfaces to run CFMD’s on that:• Sufficient in numbers to produce
statistically significant results• Sufficiently span both the friction
and texture scale
Establish calibrated time stable friction
characteristics values for surface set
Use screened high quality devices with standardized
components that fulfill technical specifications
Use established friction values
+Use screened
compliant high quality friction measurement
devices only+
Use established Harmonization Models
Harmonized Values
Harm
onizationD
evelopment of
Recomm
endationProblemD
efinition
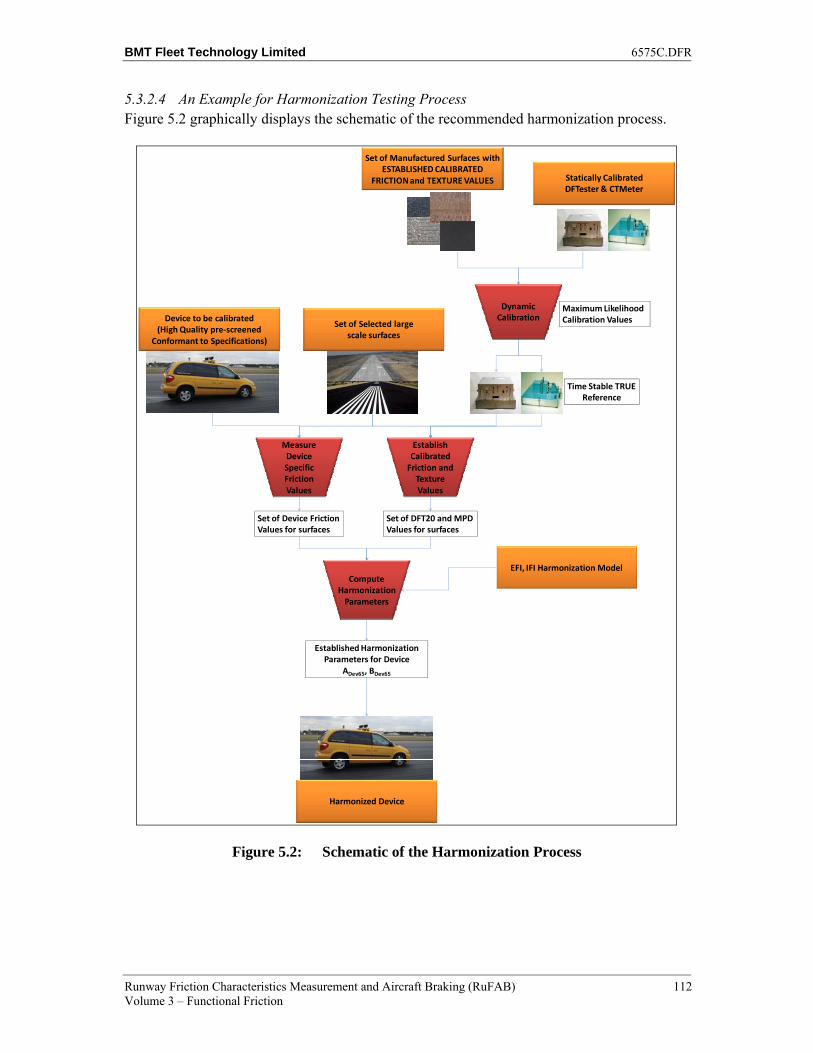
BMT Fleet Technology Limited 6575C.DFR
Runway Friction Characteristics Measurement and Aircraft Braking (RuFAB) 112 Volume 3 – Functional Friction
5.3.2.4 An Example for Harmonization Testing Process Figure 5.2 graphically displays the schematic of the recommended harmonization process.
Figure 5.2: Schematic of the Harmonization Process
Set of Manufactured Surfaces with ESTABLISHED CALIBRATED
FRICTION and TEXTURE VALUES Statically Calibrated DFTester & CTMeter
Dynamic Calibration
Maximum Likelihood Calibration Values
Set of DFT20 and MPDValues for surfaces
Set of Selected large scale surfaces
Establish Calibrated
Friction and Texture Values
Device to be calibrated(High Quality pre-screened
Conformant to Specifications)
MeasureDeviceSpecificFriction Values
Set of Device FrictionValues for surfaces
EFI, IFI Harmonization ModelCompute
HarmonizationParameters
Harmonized Device
Established Harmonization Parameters for Device
ADev65, BDev65
Time Stable TRUEReference
BMT Fleet Technology Limited 6575C.DFR
Runway Friction Characteristics Measurement and Aircraft Braking (RuFAB) 113 Volume 3 – Functional Friction
The logic of the harmonization procedure envisioned in Figure 5.2 is explained in more detail below.
Phase 1 – Static Calibration of the Reference Devices
A static calibration of the DF tester and CT meter devices is to be performed based on the manufacturer’s instructions.
Phase 2 – Dynamic Calibration of the Reference Devices
Dynamic calibration of the DF tester device on a set of minimum five different pre-manufactured 0.6 m by 0.6 m reference surfaces.
The friction levels of the reference surfaces should be pre-assessed by a separate test with at least three DF tester devices The reference test surfaces should span friction levels from approximately 0.1 (closer to 0 is preferable such as polished marble) to 1.00. The reference test surfaces should have at least two different texture levels: one with 0.5 mm MPD or less and the other with MPD greater than 1.0 mm. A wider range of texture depth levels is preferable.
Phase 3 – Selection and Measurement of Test Surfaces for the Harmonization Test
For the quality testing and harmonization process a set of test surfaces has to be defined based on the requirement already put forth in Section 3.1.2.1.
When the test surfaces are selected, their friction and texture level has to be determined by the DF tester and the CT meter devices calibrated in Phase 1 and Phase 2.
Phase 4 – Test Surface Measurements by the FMDs
All the test surfaces have to be measured by every FMD that is to be included in the harmonization process based on the process described in the Section 3.1.2.2.
Phase 5 – Calculate the quality parameters for the FMDs
For every FMD the repeatability has to be calculated based on the process described in Section 3.1.2.3. When there are at least three devices present from the same device family, then the device family reproducibility can also be calculated. All devices that fulfill the preset repeatability and reproducibility requirement can be included in the next phase, the harmonization process. The recommended threshold values are the following:
Repeatability Uncertainty (Level 1) 0.06
Reproducibility Uncertainty (Level 2) 0.10
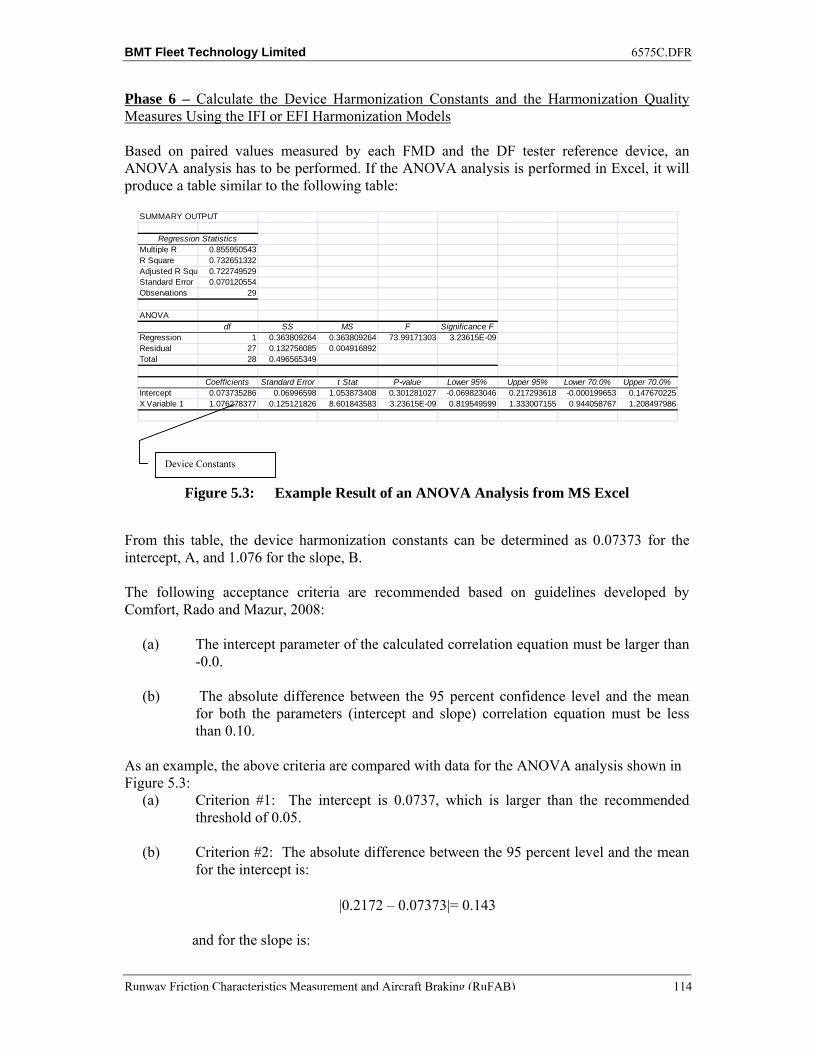
BMT Fleet Technology Limited 6575C.DFR
Runway Friction Characteristics Measurement and Aircraft Braking (RuFAB) 114
Phase 6 – Calculate the Device Harmonization Constants and the Harmonization Quality Measures Using the IFI or EFI Harmonization Models
Based on paired values measured by each FMD and the DF tester reference device, an ANOVA analysis has to be performed. If the ANOVA analysis is performed in Excel, it will produce a table similar to the following table:
Figure 5.3: Example Result of an ANOVA Analysis from MS Excel
From this table, the device harmonization constants can be determined as 0.07373 for the intercept, A, and 1.076 for the slope, B.
The following acceptance criteria are recommended based on guidelines developed by Comfort, Rado and Mazur, 2008:
(a) The intercept parameter of the calculated correlation equation must be larger than -0.0.
(b) The absolute difference between the 95 percent confidence level and the mean for both the parameters (intercept and slope) correlation equation must be less than 0.10.
As an example, the above criteria are compared with data for the ANOVA analysis shown in Figure 5.3:
(a) Criterion #1: The intercept is 0.0737, which is larger than the recommended threshold of 0.05.
(b) Criterion #2: The absolute difference between the 95 percent level and the mean for the intercept is:
|0.2172 – 0.07373|= 0.143
and for the slope is:
SUMMARY OUTPUT
Regression StatisticsMultiple R 0.855950543R Square 0.732651332Adjusted R Squ 0.722749529Standard Error 0.070120554Observations 29
ANOVAdf SS MS F Significance F
Regression 1 0.363809264 0.363809264 73.99171303 3.23615E-09Residual 27 0.132756085 0.004916892Total 28 0.496565349
Coefficients Standard Error t Stat P-value Lower 95% Upper 95% Lower 70.0% Upper 70.0%Intercept 0.073735286 0.06996598 1.053873408 0.301281027 -0.069823046 0.217293618 -0.000199653 0.147670225X Variable 1 1.076278377 0.125121826 8.601843583 3.23615E-09 0.819549599 1.333007155 0.944058767 1.208497986
Device Constants
BMT Fleet Technology Limited 6575C.DFR
Runway Friction Characteristics Measurement and Aircraft Braking (RuFAB) 115 Volume 3 – Functional Friction
|1.333 – 1.0762|= 0.2568
The absolute difference between the 95 percent level and the mean for the intercept values is higher than the threshold 0.1. Therefore, this device would not be qualified for the harmonization trial.
Phase 7 – Calculate the Recommended Friction Classification Levels
For all the devices fulfilling both the quality testing and harmonization testing quality requirements, the Recommended Friction Classification Levels can be calculated based on the new ASTM E2660 standard.
However, these Recommended Friction Classification Levels would be applicable for only that single device and not the entire device family. It is advised that Recommended Friction Classification Levels only be calculated for those device families that meet the reproducibility requirements. It is also suggested that the device constants and harmonization quality measure parameters are calculated based on average values of the entire device family. If the calculated quality parameters are under the threshold of the harmonization quality requirements, the Recommended Friction Classification Levels can be calculated in the same way as in ASTM E2660 for the entire device family and included in the ICAO and FAA table.
Phase 8 – Frequency of the Quality Testing and the Harmonization Constants Calculation
It is recommended that the quality testing and the harmonization constants calculation are done yearly to prevent any shifting of the reported friction values.
It is recommended that for each device the device constants are calculated annually and compared. If the change in the device constant is higher than a preset value, then the use of the particular device in airports should be re-evaluated or the device should be checked for problems.
Where a device family has established device family constants, it is recommended that each single device constants should be compared to the device family constants. In the case where the differences are significant, the device family constants should be re-evaluated.
It is recommended that the threshold for both the changes in device constants from year to year and the difference between a single device and its device family constants defined after thorough evaluation.
5.3.2.5 Advantages of Proposed Approach
The development of the presently proposed model have been based on the outcome of the review and analysis of the state of the art today in measurement techniques and principles, the investigation and critique of harmonization trials and studies and the latest in research and development on the friction measurement field. The study had identified a number of shortcomings and problems with measurement, equipment and harmonization methods and developed a set of recommendations to overcome or reduce the effects of these problems. There are a number of technical and scientific as well as practical and economical advantages of the proposed approach. These advantages are described in the following points:
BMT Fleet Technology Limited 6575C.DFR
Runway Friction Characteristics Measurement and Aircraft Braking (RuFAB) 116 Volume 3 – Functional Friction
(a) Technical advantages:
a. The proposed process eliminates the problems stemming from the time instability and changes in the used reference surfaces and reference devices. In the past, this particular problem has prevented the different calibration methods from delivering the same results over larger multiyear time scales, and thus presented a very large obstacle.
b. The established repeatability and reproducibility minimum criteria will ensure that the harmonized friction measurement equipment deliver low variability and precise measurements. At the same time help CFMD manufacturers to maintain high quality repeatable equipment.
c. The established technical specifications will ensure higher standardization among the different friction measurement principles and devices. This helps deliver a higher quality and fidelity harmonization process that produces much higher confidence results.
(b) The developed process is practical:
a. The used small and portable measurement devices can be transported easily. The devices can be kept in ideal laboratory environment where perfect conditions of the equipment are easy to ensure.
b. The devices can be calibrated in laboratory environment to a set of high quality small scale surfaces under ideal conditions.
c. The measurement equipment can be operated after calibration at the selected large scale filed test sites easily and efficiently
d. The small devices are easy to ship and perform calibration and harmonization at different areas or countries effectively and rapidly.
e. The developed set of laboratory calibration surfaces are small easy to produce, store and handle.
f. The small reference surfaces can be repeatably and reproducibly manufactured to very high quality requirements.
(c) The developed process is economical:
a. The two small devices are relatively inexpensive compared to full size CFMDs.
b. The small calibration devices are inexpensive to ship from location to location and can be effectively and efficiently used for harmonization and calibration in many different areas.
c. The proposed calibration surfaces are very inexpensive to produce compared to large scale surfaces that can be traveled by CFMDs.
In summary the proposed approach overcomes a number of technical and scientific problems encountered in earlier harmonization attempts. Thus, the process proposed delivers the possibility of harmonization amongst different devices and device families with high enough
BMT Fleet Technology Limited 6575C.DFR
Runway Friction Characteristics Measurement and Aircraft Braking (RuFAB) 117 Volume 3 – Functional Friction
quality to be practically usable and deployable in the aviation community. The process is practical where the necessary steps and devices can be obtained and operated efficiently and with minimum time requirements. The harmonization process can be executed virtually anywhere with minimal time constrain and minimal manpower. The approach is economical due to the use of small portable devices and a set of small manufactured reference surfaces with minimal cost. This equipment and the set of calibration surfaces can be easily and inexpensively shipped from location to location performing harmonization in a timely and inexpensive manner.
5.4 Propose the Establishment of a Reference Equipment Database Taking into Account Type of Equipment, Type and Location of Surface, etc.
The recommendation of this section is based on the previous findings and results mainly from the assessment and development of the harmonization processes that suggest that the DF tester and CT meter will be used for reference friction and texture measurement devices.
Therefore for the reference device database there is only one device for friction measurements (DF tester) and one device for texture measurement (CT meter).
However, if any other device is proposed to be accepted as a reference device, then it has to go through the same quality testing procedure as for any other device and it has to match the repeatability and the device family reproducibility of the DF tester. It also has to go through the harmonization process and it has to match the quality of the harmonization of the DF testers to each other. Moreover, due to the fact that all the harmonization testing recommendation are based on the protocol that the dynamic calibration of reference device is performed on a 0.6 m by 0.6 m reference surface, any device that is proposed to be a reference device has to be able to measure and to be dynamically calibrated using a 0.6 m by 0.6 m reference surface.
5.5 Assess the Need to Issue Specific EASA Specifications in this Field
5.5.1 Review Present Specification The only EASA specification pertinent to this matter is CS-25, Certification Specifications for Large Aeroplanes, Operation on Contaminated Runways. This certification provides guidance on contaminated runways such as standing water, slush, wet snow, dry snow, compacted snow, ice, specifically-prepared winter runway. However:
This AMC does not set out to provide a complete technical analytical process but rather to indicate the elements that should be addressed. Where doubt exists with regard to the accuracy of the methodology or the penalties derived, consideration should be given to validation by the use of actual aeroplane tests or other direct experimental measurements.
EASA CS-25 also states the following on the use of ground friction measurement devices:
Use of Ground Friction Measurement Devices Ideally it would be preferable to relate aeroplane braking performance to a friction index measured by a ground friction device that would be reported as part of a Surface Condition Report. However, there is not, at present, a common friction index for all ground friction measuring devices. Hence it is
BMT Fleet Technology Limited 6575C.DFR
Runway Friction Characteristics Measurement and Aircraft Braking (RuFAB) 118 Volume 3 – Functional Friction
not practicable at the present time to determine aeroplane performance on the basis of an internationally accepted friction index measured by ground friction devices. Notwithstanding this lack of a common index, the applicant may optionally choose to present take-off and landing performance data as a function of an aeroplane braking coefficient or wheel braking coefficient constant with ground speed. The responsibility for relating this data to a friction index measured by a ground friction device will fall on the operator and the operating authority.
It can be seen that this specification does not include guidelines for functional friction measurements. To the knowledge of the project team, EASA does not have specifications for functional friction measurements on runways. It is recommended that such specifications be developed.
5.6 Proposals for Amendment of the ICAO Harmonization Table There are two underlying problems with both the ICAO harmonization table in Annex 14, Sup. A (Table A1, which is reproduced as Table 5.5, and the one in force from the FAA (Table 5.6). One is that they are based on the device constants for one single device. During the calculation, it was assumed that one device is an appropriate representative of the whole device family. Experience has shown that this is not true. The device family reproducibility must be considered in calculating these values.
The other problem is that the original threshold values that were established about 20 years ago were based on the readings from a single device, that being the Mu-Meter. Later on, the Mu-Meter was correlated to an SFT and after that, every device has been correlated to SFT and back-calculated to the original Mu–Meter. This process introduced significant an error in the calculation of device-specific levels.
The new ASTM 2660 standard tries to solve this problem by back-calculating Sp and F60 values for these original levels and using them to calculate the new device Recommended Friction Classification Levels.
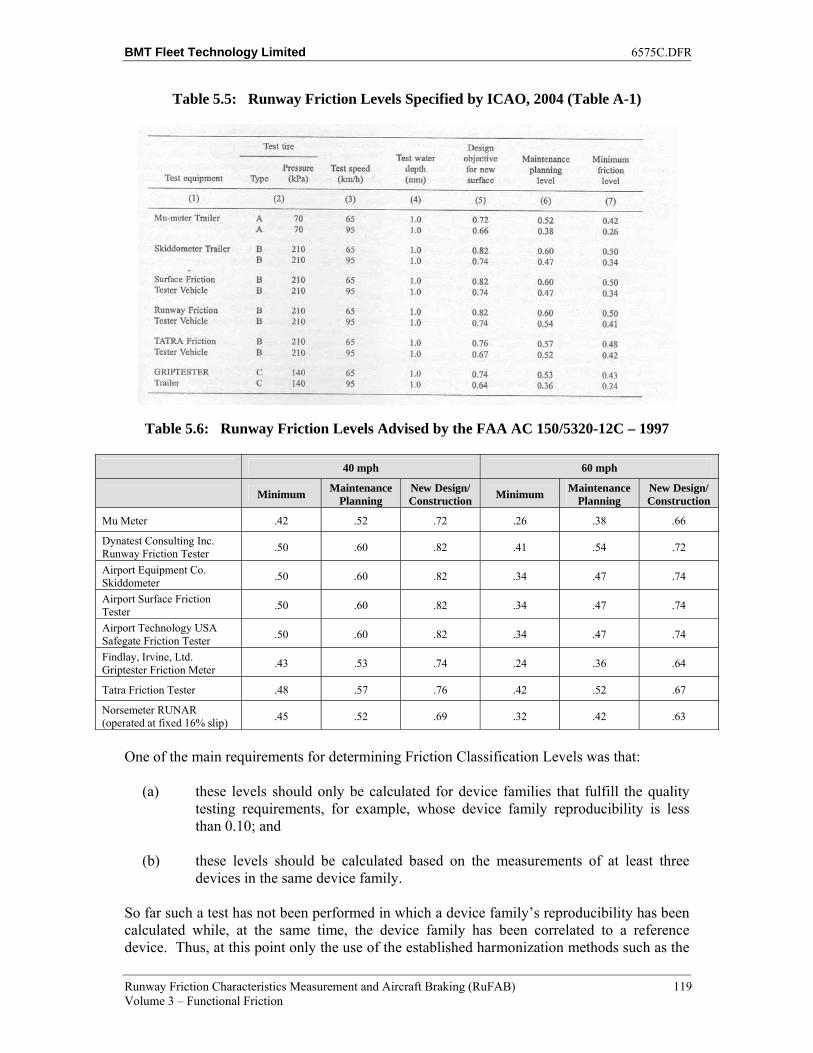
BMT Fleet Technology Limited 6575C.DFR
Runway Friction Characteristics Measurement and Aircraft Braking (RuFAB) 119 Volume 3 – Functional Friction
Table 5.5: Runway Friction Levels Specified by ICAO, 2004 (Table A-1)
Table 5.6: Runway Friction Levels Advised by the FAA AC 150/5320-12C – 1997
40 mph 60 mph
Minimum Maintenance
Planning New Design/Construction
Minimum Maintenance
Planning New Design/Construction
Mu Meter .42 .52 .72 .26 .38 .66
Dynatest Consulting Inc. Runway Friction Tester
.50 .60 .82 .41 .54 .72
Airport Equipment Co. Skiddometer
.50 .60 .82 .34 .47 .74
Airport Surface Friction Tester
.50 .60 .82 .34 .47 .74
Airport Technology USA Safegate Friction Tester
.50 .60 .82 .34 .47 .74
Findlay, Irvine, Ltd. Griptester Friction Meter
.43 .53 .74 .24 .36 .64
Tatra Friction Tester .48 .57 .76 .42 .52 .67
Norsemeter RUNAR (operated at fixed 16% slip)
.45 .52 .69 .32 .42 .63
One of the main requirements for determining Friction Classification Levels was that:
(a) these levels should only be calculated for device families that fulfill the quality testing requirements, for example, whose device family reproducibility is less than 0.10; and
(b) these levels should be calculated based on the measurements of at least three devices in the same device family.
So far such a test has not been performed in which a device family’s reproducibility has been calculated while, at the same time, the device family has been correlated to a reference device. Thus, at this point only the use of the established harmonization methods such as the
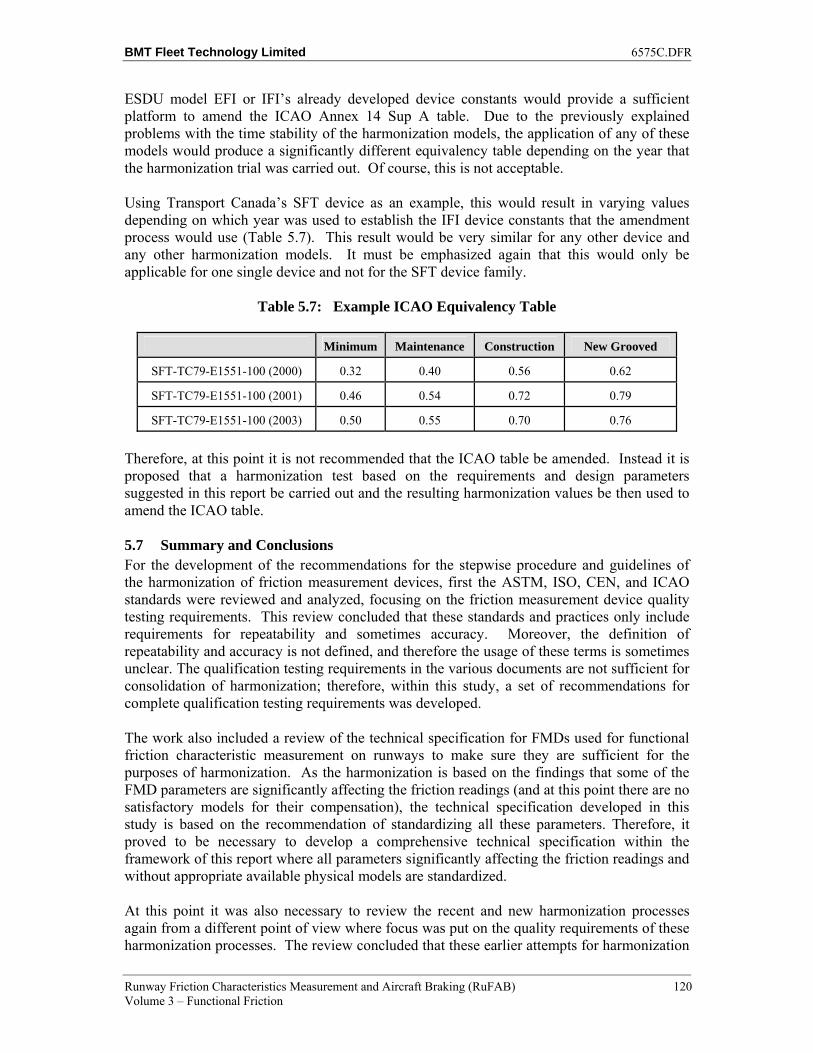
BMT Fleet Technology Limited 6575C.DFR
Runway Friction Characteristics Measurement and Aircraft Braking (RuFAB) 120 Volume 3 – Functional Friction
ESDU model EFI or IFI’s already developed device constants would provide a sufficient platform to amend the ICAO Annex 14 Sup A table. Due to the previously explained problems with the time stability of the harmonization models, the application of any of these models would produce a significantly different equivalency table depending on the year that the harmonization trial was carried out. Of course, this is not acceptable.
Using Transport Canada’s SFT device as an example, this would result in varying values depending on which year was used to establish the IFI device constants that the amendment process would use (Table 5.7). This result would be very similar for any other device and any other harmonization models. It must be emphasized again that this would only be applicable for one single device and not for the SFT device family.
Table 5.7: Example ICAO Equivalency Table
Minimum Maintenance Construction New Grooved
SFT-TC79-E1551-100 (2000) 0.32 0.40 0.56 0.62
SFT-TC79-E1551-100 (2001) 0.46 0.54 0.72 0.79
SFT-TC79-E1551-100 (2003) 0.50 0.55 0.70 0.76
Therefore, at this point it is not recommended that the ICAO table be amended. Instead it is proposed that a harmonization test based on the requirements and design parameters suggested in this report be carried out and the resulting harmonization values be then used to amend the ICAO table.
5.7 Summary and Conclusions For the development of the recommendations for the stepwise procedure and guidelines of the harmonization of friction measurement devices, first the ASTM, ISO, CEN, and ICAO standards were reviewed and analyzed, focusing on the friction measurement device quality testing requirements. This review concluded that these standards and practices only include requirements for repeatability and sometimes accuracy. Moreover, the definition of repeatability and accuracy is not defined, and therefore the usage of these terms is sometimes unclear. The qualification testing requirements in the various documents are not sufficient for consolidation of harmonization; therefore, within this study, a set of recommendations for complete qualification testing requirements was developed.
The work also included a review of the technical specification for FMDs used for functional friction characteristic measurement on runways to make sure they are sufficient for the purposes of harmonization. As the harmonization is based on the findings that some of the FMD parameters are significantly affecting the friction readings (and at this point there are no satisfactory models for their compensation), the technical specification developed in this study is based on the recommendation of standardizing all these parameters. Therefore, it proved to be necessary to develop a comprehensive technical specification within the framework of this report where all parameters significantly affecting the friction readings and without appropriate available physical models are standardized.
At this point it was also necessary to review the recent and new harmonization processes again from a different point of view where focus was put on the quality requirements of these harmonization processes. The review concluded that these earlier attempts for harmonization
BMT Fleet Technology Limited 6575C.DFR
Runway Friction Characteristics Measurement and Aircraft Braking (RuFAB) 121 Volume 3 – Functional Friction
and the underlying processes/models do not include sufficient quality requirements for accuracy, consistence, uncertainty and frequency. There are no threshold values defined that are necessary for the FMDs to be accepted for functional friction characteristic measurement or to be able to be harmonized. As a consequence the work within this study needed to develop a new set of recommendations for the quality requirements and this is included in the last section of the report.
Based on all the finished reviews and assessments a complete set of recommendations for the harmonization process including setup, testing procedures and evaluation process were constructed. The full flow diagram of the recommended harmonization procedures and surrounding set of requirements are given in the flow chart at the end of the section.
Within this section of this chapter the feasibility of amending the ICAO Annex 14 Sup A1 table was also investigated. The analysis and research investigation concluded that, at this point, only the use of the established harmonization methods such as the ESDU model EFI or IFIs already developed device constants would provide a sufficient platform to amend the ICAO Annex 14 Sup A table. Due to the previously explained problems with the time stability of the harmonization models, the application of any of these models would deliver a significantly different equivalency table depending on the year that the harmonization trial was carried out.
Therefore, at this point, it is not recommended that the ICAO device equivalency table be amended. Instead it is proposed that a harmonization test based on the requirements and design parameters suggested in this report be carried out and the harmonization values obtained be used to amend the ICAO table.
BMT Fleet Technology Limited 6575C.DFR
Runway Friction Characteristics Measurement and Aircraft Braking (RuFAB) 122 Volume 3 – Functional Friction
6 REFERENCES
[1] Allbert, B.J., Walker, J.C., 1966, Tyre to wet road friction at high speeds, Proc. Inst. Mech. Engrs, Vol. 180, Part 2A, No. 4, pp.105-158, 1965-66..
[2] Andrews, M., 1994, Porsche’s Contribution to Safer and More Comfortable Driving in the Future, Proc. First ITS World Congress.
[3] Argue, G.H., Denyes, B.B., Haddad, J.N., 1995, Comparison of GripTester and Saab SFT Measurements, Transport Canada
[4] Brach, R.M., Adhesion, Hysteresis and Peak Longitudinal Tire Force, Brach Engineering LLC, University of Notre Dame, http://www.brachengineering.com/publications/wheelslipmodel1.pdf.
[5] Buhlmann, F.,Yager, T.J.,1982, Macrotexture and Drainage Measurements on a Variety of Concrete and Asphalt Surfaces, ASTM STP 763.
[6] CEN/TC 227/WG5 5, prEN 13036-2:2003, 2003, Surface characteristics of road and airfield pavements - Procedure for determination of skid resistance of a pavement surface”, CEN.
[7] CEN/TS 13036-2:2009, 2009, Road and airfield surface characteristics ― Test methods ― Part2: Assessment of the skid resistance of a road pavement surface by the use of dynamic measuring systems.
[8] Comfort, G., Rado, Z., Rado, E., and Mazur, A., 2008a, Correlation of Continuous Friction Measuring Equipment and Development of Runway Friction Standards, Transport Canada report TP 14823E.
[9] Comfort, G., Rado, Z., Rado, E., and Mazur, A., 2008b, Proposed Performance Specifications and Standard Correlation Method for Continuous Friction Measurement Equipment, Transport Canada report TP 14825E.
[10] Comfort, G., Rado, Z., Rado, E., and Mazur, A., 2008c, Decelerometer Calibrations and Standards, Transport Canada report TP 14824E.
[11] Comfort, G., and Verbit, S., 2003, Decelerometer Tests: CRFI Quality Assurance Tests and the Effect of the Vehicle’s ABS System, TP 14176E, Transportation Development Centre, Transport Canada.
[12] Comfort, G., and Ryan, M., 2002, Effect of Vehicle Parameters on the Friction Coefficients Measured by Decelerometers on Winter Surfaces, TP 13980E, Transportation Development Centre, Transport Canada.
[13] CROW, 2006 Qualification Protocol for Candidate Self-Wetting Friction-Measuring Devices on Dutch Airfields, CROW, report 06-05
BMT Fleet Technology Limited 6575C.DFR
Runway Friction Characteristics Measurement and Aircraft Braking (RuFAB) 123 Volume 3 – Functional Friction
[14] Ergun, M., Iyinam, S., and Iyinam, A.F. , 2005, Prediction of Road Surface Friction Coefficient Using Only Macro- and Microtexture Measurements, Journal Of Transportation Engineering © ASCE.
[15] ESDU 1983, Estimation of spray patterns generated from the sides of aircraft tyres running in water or slush, ESDU 83042.
[16] ESDU, 1971, Frictional and retarding forces on aircraft tyres. Part I: Introduction, ESDU 71025.
[17] ESDU, 1971, Frictional and retarding forces on aircraft tyres. Part II: Estimation of braking force, ESDU 71026.
[18] ESDU, 1987, Example of take-off field length calculations for a civil transport aeroplane, ESDU 87018.
[19] ESDU, 1990, Frictional and retarding forces on aircraft tyres. Part V: Estimation of fluid drag forces, ESDU 90035.
[20] ESDU, 1996, Example of statistical techniques applied to analysis of paved runway sizes (Bivariate Normal Distribution), ESDU 96024.
[21] ESDU, 1999, Statistical analysis of wet runway friction for aircraft and ground-test machines, ESDU 99015.
[22] ESDU, 2000, Example of statistical analysis of wet runway friction: aircraft with extensive set of test data, ESDU 99016.
[23] ESDU, 2000, Example of statistical analysis of wet runway friction: aircraft with limited set of test data, ESDU 99017.
[24] ESDU, 2000, Example of statistical analysis of wet runway friction: ground-test machine data, ESDU 00018.
[25] ESDU, 2005, Comprehensive method for modeling performance of aircraft type tyres rolling or braking on runways contaminated with water, slush, snow or ice, ESDU 05011.
[26] ESDU, 2005, Statistical analysis of wet runway friction for aircraft and ground-test machines, ESDU 99015, April 2005.
[27] FEHRL Report 2006/01, 2006 Harmonization of European Routine and research Measuring Equipment for Skid Resistance– reference needed
[28] Flintsch, G.W., 2009, Evaluation of International Friction Index Coefficients for Various Devices, TRB, Volume 2094 2009, ISSN0361-1981.
[29] G.W.H. van Es, 2003 Correlation of Self-wetting Friction- Measurement Devices Evaluation of the ESDU method, CROW report 03-10.
BMT Fleet Technology Limited 6575C.DFR
Runway Friction Characteristics Measurement and Aircraft Braking (RuFAB) 124 Volume 3 – Functional Friction
[30] Gurp, C.v. 2006, Correlation Trial and Harmonization Modelling of Friction Measurements on Runways 2005, CROW report 06-02.
[31] Hall, J.W., Smith, K.L., Titus-Glover, L., Wambold, J., Yager, T., and Rado, Z., 2009, Guide for Pavement Friction, NCHRP Web-Only Document 108, NCHRP Project 01-43.
[32] Hansman, R. J, Jr, Dershowitz, A. L., 1995 Temperature Measurements Reveal Accretion of Ice on Airfoils, NASA Tech Briefs LEW-15639.
[33] Henry J. J., 2000, Evaluation of Pavement Friction Characteristics, NCHRP Synthesis 291,Transportation Research Board, National Research Council, 2000.
[34] Holt, F.B., and Musgrove, G.R., 1982, Surface Texture Classification: A Guide to Pavement Skid Resistance, Pavement Surface Characteristics and Materials, ASTM STP 763, C.M. Hayden, Ed., American Society for Testing and Materials, pp 31-44.
[35] Holzwarth, F., and Eichhorn, U., 1992, Non-Contact Sensors for Road Conditions, Eurosensors VI, San Sebastian, Spain, 5 Ð 7.
[36] Horne, W.B., 1976, Status of runway slipperiness research”, NASA SP -416.
[37] Horne, W.B., Buhlmann, F., 1983, A Method for Rating the Skid Resistance and Micro/Macrotexture Characteristics of Wet Pavements, Frictional Interaction of Tire and Pavement, ASTM STP 793.
[38] Horne, W.B., Yager, T.J.,1968, Review of causes and alleviation of low tire traction on wet runways”, NASA TN-D-4406.
[39] Jackson, N.M., 2008, Harmonization of Texture and Skid-Resistance Measurements, Florida Department of Transportation, Research Report FL/DOT/SMO/08-BDH-23, by N. Mike Jackson, Ph.D., P.E., University of North Florida College of Computing, Engineering.
[40] Johnsen, WA, 1997, Advances in the Design of Pavement Surfaces, Dissertation Worcester, Polytechnic Institute.
[41] KOAC•WMD and the National Aerospace Laboratory, NLR, 2004, Correlation Trial of Self-Wetting Friction-Measuring Devices for Dutch Airfield Pavements, CROW Report 04-05, Ede, The Netherlands, 2004.
[42] Kummer, H., 1966, Unified Theory of Rubber and Tire Friction: Engineering Research Bulletin B-94. Pennsylvania State University, State College, PA.
[43] Lander, FTW. And Williams, T, ‘The skidding resistance of wet runway surfaces with reference to surface texture and tyre conditions’, Road research Laboratory, RRL Report 184.
[44] Ludeman, K.C., Gujrati, B.D., 1973, An analysis of the literature on tire-road skid resistance, ASTM STP 541.
BMT Fleet Technology Limited 6575C.DFR
Runway Friction Characteristics Measurement and Aircraft Braking (RuFAB) 125 Volume 3 – Functional Friction
[45] Mark P. McDonald, Larry G. Crowley, Rod E. Turochy, 2006, Investigation of Seasonal Variation in Pavement Friction Using the Datapave 3.0 Database, Auburn University, Albertville, AL, FHWA, Publication No. HRT-06-109, September 2006 http://www.fhwa.dot.gov/pavement/ltpp/pubs/06109/06109.pdf .
[46] Meades, J.K., 1967, Braking force coefficients obtained with a sample of currently available radial ply and crossed ply car tyres, Road Research Laboratory, Report 73.
[47] Meades, J.K., 1969, The effect of tyre construction on braking force coefficients”, Road Research Laboratory, Report 224.
[48] Misener, J. A., 1998, MOU 285 Final Report, Investigation of an Optical Method to Determine the Presence of Ice on Road Surfaces, California PATH Working Paper, UCB-ITS-PWP-98-17.
[49] Morrow T.H., 1990, Reliability and Performance of Friction Measuring Tires and Friction Equipment Correlation. - Federal Aviation Administration, Washington, DC. Office of Airport Safety and Standards, DOT/FAA/AS-90-1.
[50] Morrow, T.H., 1983, Report on the performance, reliability and correlation of the Mu-Meter and SAAB Friction Tester under self wetting and simulated rainfall conditions U.S. Dept. of Transportation, Federal Aviation Administration. Rep. FAA-AAS-82-VI.
[51] Parry, A.R., Walsh, I.D., 2000, “Macrotexture and road safety project”, Transport Research Laboratory, 2000.
[52] Parry, AR. And Roe, PG, “High and low speed skidding resistance: the influence of texture depth”, Transport Research Laboratory, Report TRL-367, 1995.
[53] prEN 13036-2. Road and airfield surface characteristics. Test methods Part 2: Procedure for determination of skid resistance of a pavement surface.
[54] Rado, Z., Radone. E., 2003, Repeatability and Reproducibility of Saab Friction Measurement Devices in Self-Wet Mode, Transport Canada report TP 14083E.
[55] Sabey, B.E., 1966, Road surface texture and the change in skidding resistance with speed, Road Research Laboratory, RRL Report 20.
[56] Sabey, B.E., 1968, The road surface in relation to friction and wear of tyres”, in: proceedings of the conference on friction and wear in tyres held at ERDE, Waltham Abbey.
[57] Staughton, G.C.,1970, The effect of tread pattern depth on skidding resistance, Road Research, Laboratory, RRL Report 323.
[58] Sugg, R.W., 1968, Joint NASA-British Ministry of Technology skid correlation study – results from British vehicles, Pavement grooving and traction studies, the proceedings of a conference held at Langley Research Centre, Hampton, Virginia, U.S.A. NASA SP -5073.
BMT Fleet Technology Limited 6575C.DFR
Runway Friction Characteristics Measurement and Aircraft Braking (RuFAB) 126 Volume 3 – Functional Friction
[59] Transport Canada, 1995, Runway Friction Monitoring with the SFT – 0.5 mm versus 1.0mm Water Depths, internal Transport Canada report.
[60] Transport Canada, _, Runway Friction Monitoring with the GripTester – 0.5 mm versus 0.25 mm Water Depths, internal Transport Canada report.
[61] Uno, T., et. al., 1994, Road Surface Recognition Method Using Optical Spatial Filter, Proc. Int. Symp. AVEC, 089.
[62] Van ES, G.H.W.: “Correlation of self-wetting Friction Measuring devices: Evaluation of the ESDU method”, CROW, Report 03-10, Ede, The Netherlands, 2003.
[63] Wambold J.C., Antle C.E., Henry J.J., Rado Z., Descornet G., Sandberg U., Gothie M., Huschek S.,1995, International PIARC Experiment to Compare and Harmonize Skid Resistance and Texture Measurements, PIARC Publication n°01.04.T, Paris.
[64] Wambold J.C., Henry, J.J., 2002, NASA WALLOPS TIRE/RUNWAY FRICTION WORKSHOPS 1993-2002.
[65] Wambold J.C., Henry, J.J., 2003, International Runway Friction Index (IRFI) versus Aircraft Braking Coefficient (Mu)), Transport Canada, TP 14318e.
[66] Whitehurst, E.A. and Neuhardt, J.B., Time- History Performance of Reference Surfaces, The Tire Pavement Interface, ASTM STP 929, M.G. Pottinger and T.J. Yager, Eds., American Society for Testing and Materials, Philadelphia, 1986, pp. 61-71.
[67] Wilson, D.G., 2006, An Analysis of the Seasonal and Short-Term Variation of Road Pavement Skid Resistance, Department of Civil and Environmental Engineering, The University of Auckland.
[68] Yager, T.J., Et. Al, 1968, Effects of Pavement Texture on Wet-Runway Braking Performance, NASA TN D-4323.
[69] Yager, T.J., Vogler, W.A., and Baldasare, P., 1990, Evaluation of Two Transport Aircraft and Several Ground Test Vehicles Friction Measurements Obtained for Various Runway Surface Types and Conditions, NASA Technical Paper 2917.
Related Documents