
Welcome message from author
This document is posted to help you gain knowledge. Please leave a comment to let me know what you think about it! Share it to your friends and learn new things together.
Transcript
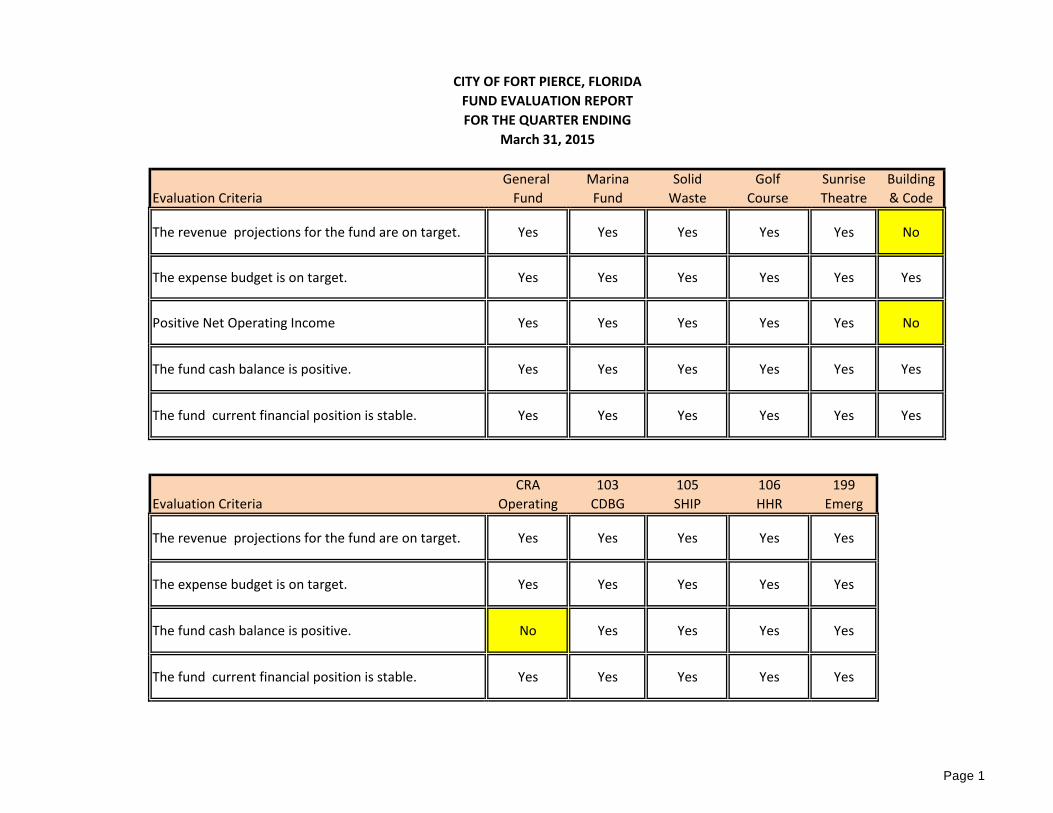
General Marina Solid Golf Sunrise Building
Evaluation Criteria Fund Fund Waste Course Theatre & Code
The revenue projections for the fund are on target. Yes Yes Yes Yes Yes No
The expense budget is on target. Yes Yes Yes Yes Yes Yes
Positive Net Operating Income Yes Yes Yes Yes Yes No
The fund cash balance is positive. Yes Yes Yes Yes Yes Yes
The fund current financial position is stable. Yes Yes Yes Yes Yes Yes
CRA 103 105 106 199
Evaluation Criteria Operating CDBG SHIP HHR Emerg
The revenue projections for the fund are on target. Yes Yes Yes Yes Yes
The expense budget is on target. Yes Yes Yes Yes Yes
The fund cash balance is positive. No Yes Yes Yes Yes
The fund current financial position is stable. Yes Yes Yes Yes Yes
CITY OF FORT PIERCE, FLORIDA
FUND EVALUATION REPORT
FOR THE QUARTER ENDING
March 31, 2015
Page 1
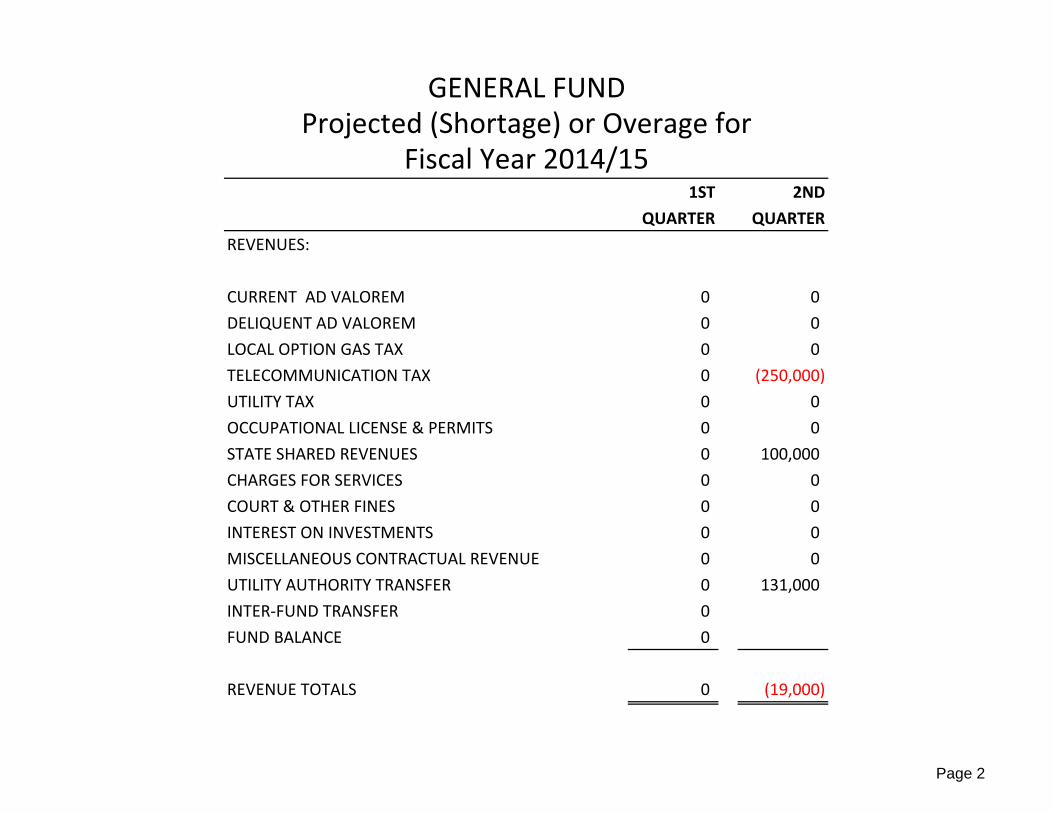
1ST 2ND
QUARTER QUARTER
REVENUES:
CURRENT AD VALOREM 0 0
DELIQUENT AD VALOREM 0 0
LOCAL OPTION GAS TAX 0 0
TELECOMMUNICATION TAX 0 (250,000)
UTILITY TAX 0 0
OCCUPATIONAL LICENSE & PERMITS 0 0
STATE SHARED REVENUES 0 100,000
CHARGES FOR SERVICES 0 0
COURT & OTHER FINES 0 0
INTEREST ON INVESTMENTS 0 0
MISCELLANEOUS CONTRACTUAL REVENUE 0 0
UTILITY AUTHORITY TRANSFER 0 131,000
INTER-FUND TRANSFER 0
FUND BALANCE 0
REVENUE TOTALS 0 (19,000)
GENERAL FUNDProjected (Shortage) or Overage for
Fiscal Year 2014/15
Page 2
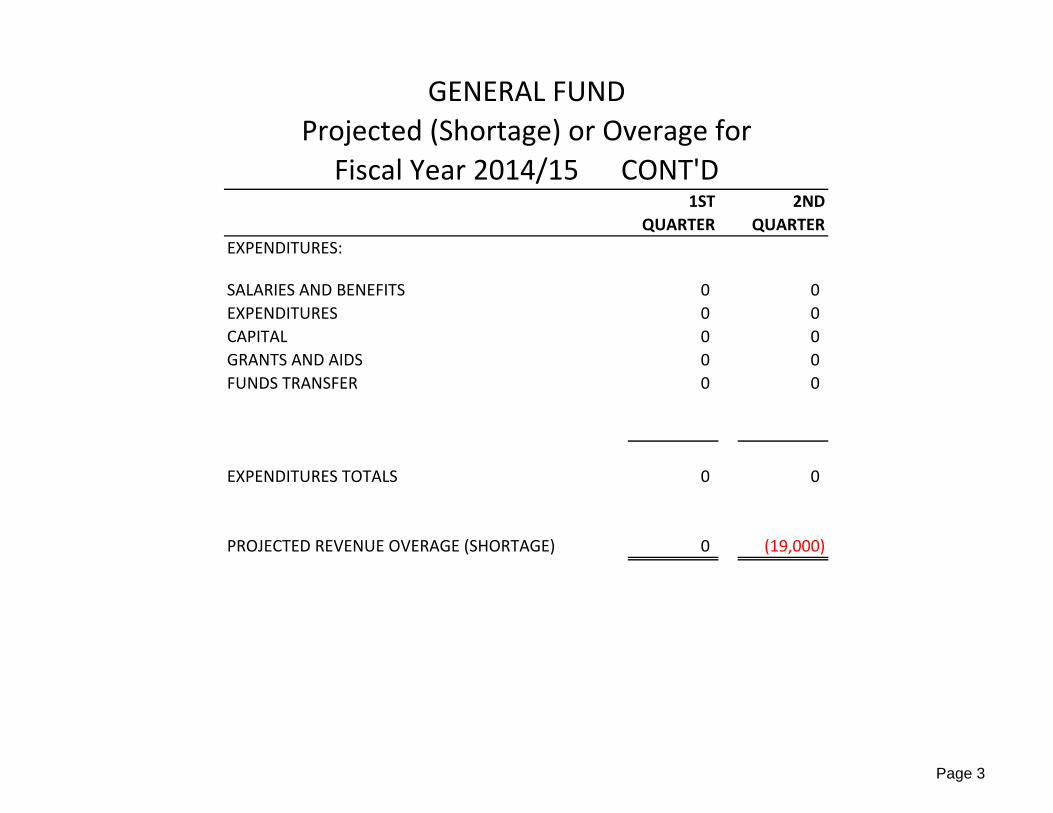
1ST 2ND
QUARTER QUARTER
EXPENDITURES:
SALARIES AND BENEFITS 0 0
EXPENDITURES 0 0
CAPITAL 0 0
GRANTS AND AIDS 0 0
FUNDS TRANSFER 0 0
EXPENDITURES TOTALS 0 0
PROJECTED REVENUE OVERAGE (SHORTAGE) 0 (19,000)
Fiscal Year 2014/15 CONT'D
GENERAL FUND
Projected (Shortage) or Overage for
Page 3
2013/14 2013/14 Yr. Lapse 2014/15 2014/15 Yr. Lapse
Budget Actual 50% Budget Actual 50%
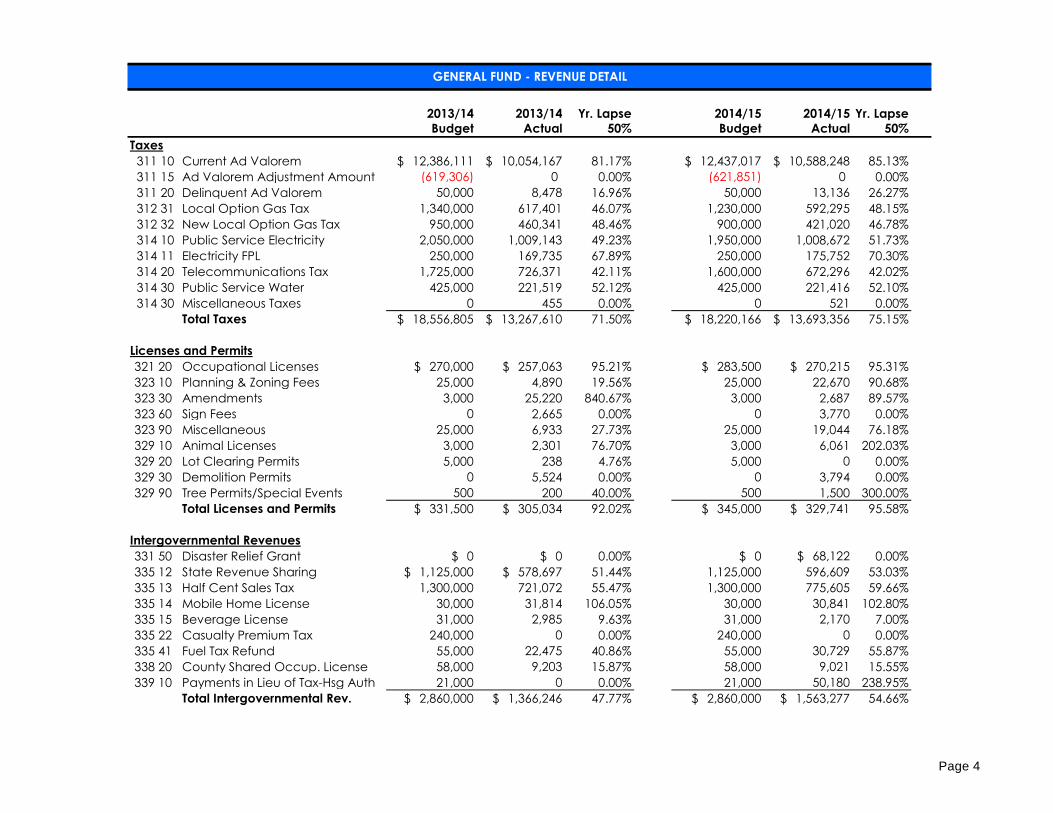
Taxes
311 10 Current Ad Valorem $ 12,386,111 $ 10,054,167 81.17% $ 12,437,017 $ 10,588,248 85.13%
311 15 Ad Valorem Adjustment Amount (619,306) 0 0.00% (621,851) 0 0.00%
311 20 Delinquent Ad Valorem 50,000 8,478 16.96% 50,000 13,136 26.27%
312 31 Local Option Gas Tax 1,340,000 617,401 46.07% 1,230,000 592,295 48.15%
312 32 New Local Option Gas Tax 950,000 460,341 48.46% 900,000 421,020 46.78%
314 10 Public Service Electricity 2,050,000 1,009,143 49.23% 1,950,000 1,008,672 51.73%
314 11 Electricity FPL 250,000 169,735 67.89% 250,000 175,752 70.30%
314 20 Telecommunications Tax 1,725,000 726,371 42.11% 1,600,000 672,296 42.02%
314 30 Public Service Water 425,000 221,519 52.12% 425,000 221,416 52.10%
314 30 Miscellaneous Taxes 0 455 0.00% 0 521 0.00%
Total Taxes $ 18,556,805 $ 13,267,610 71.50% $ 18,220,166 $ 13,693,356 75.15%
Licenses and Permits
321 20 Occupational Licenses $ 270,000 $ 257,063 95.21% $ 283,500 $ 270,215 95.31%
323 10 Planning & Zoning Fees 25,000 4,890 19.56% 25,000 22,670 90.68%
323 30 Amendments 3,000 25,220 840.67% 3,000 2,687 89.57%
323 60 Sign Fees 0 2,665 0.00% 0 3,770 0.00%
323 90 Miscellaneous 25,000 6,933 27.73% 25,000 19,044 76.18%
329 10 Animal Licenses 3,000 2,301 76.70% 3,000 6,061 202.03%
329 20 Lot Clearing Permits 5,000 238 4.76% 5,000 0 0.00%
329 30 Demolition Permits 0 5,524 0.00% 0 3,794 0.00%
329 90 Tree Permits/Special Events 500 200 40.00% 500 1,500 300.00%
Total Licenses and Permits $ 331,500 $ 305,034 92.02% $ 345,000 $ 329,741 95.58%
Intergovernmental Revenues
331 50 Disaster Relief Grant $ 0 $ 0 0.00% $ 0 $ 68,122 0.00%
335 12 State Revenue Sharing $ 1,125,000 $ 578,697 51.44% 1,125,000 596,609 53.03%
335 13 Half Cent Sales Tax 1,300,000 721,072 55.47% 1,300,000 775,605 59.66%
335 14 Mobile Home License 30,000 31,814 106.05% 30,000 30,841 102.80%
335 15 Beverage License 31,000 2,985 9.63% 31,000 2,170 7.00%
335 22 Casualty Premium Tax 240,000 0 0.00% 240,000 0 0.00%
335 41 Fuel Tax Refund 55,000 22,475 40.86% 55,000 30,729 55.87%
338 20 County Shared Occup. License 58,000 9,203 15.87% 58,000 9,021 15.55%
339 10 Payments in Lieu of Tax-Hsg Auth 21,000 0 0.00% 21,000 50,180 238.95%
Total Intergovernmental Rev. $ 2,860,000 $ 1,366,246 47.77% $ 2,860,000 $ 1,563,277 54.66%
GENERAL FUND - REVENUE DETAIL
Page 4
2013/14 2013/14 Yr. Lapse 2014/15 2014/15 Yr. Lapse
Budget Actual 50% Budget Actual 50%
GENERAL FUND - REVENUE DETAIL
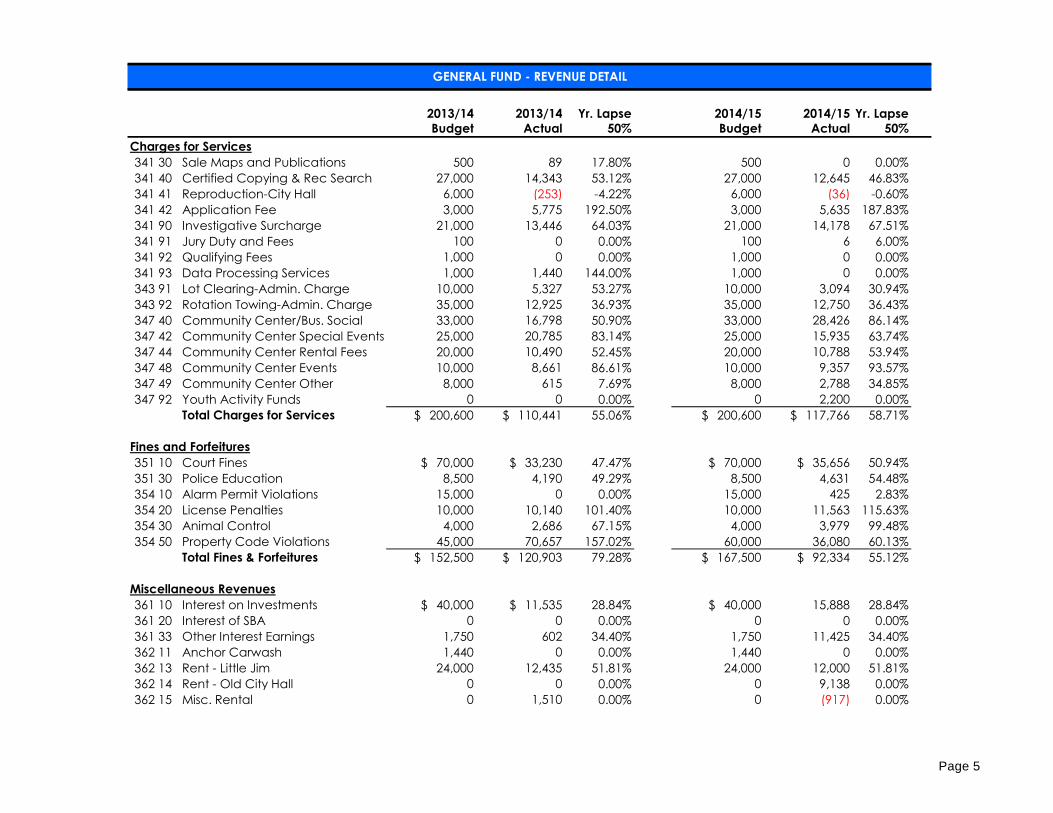
Charges for Services
341 30 Sale Maps and Publications 500 89 17.80% 500 0 0.00%
341 40 Certified Copying & Rec Search 27,000 14,343 53.12% 27,000 12,645 46.83%
341 41 Reproduction-City Hall 6,000 (253) -4.22% 6,000 (36) -0.60%
341 42 Application Fee 3,000 5,775 192.50% 3,000 5,635 187.83%
341 90 Investigative Surcharge 21,000 13,446 64.03% 21,000 14,178 67.51%
341 91 Jury Duty and Fees 100 0 0.00% 100 6 6.00%
341 92 Qualifying Fees 1,000 0 0.00% 1,000 0 0.00%
341 93 Data Processing Services 1,000 1,440 144.00% 1,000 0 0.00%
343 91 Lot Clearing-Admin. Charge 10,000 5,327 53.27% 10,000 3,094 30.94%
343 92 Rotation Towing-Admin. Charge 35,000 12,925 36.93% 35,000 12,750 36.43%
347 40 Community Center/Bus. Social 33,000 16,798 50.90% 33,000 28,426 86.14%
347 42 Community Center Special Events 25,000 20,785 83.14% 25,000 15,935 63.74%
347 44 Community Center Rental Fees 20,000 10,490 52.45% 20,000 10,788 53.94%
347 48 Community Center Events 10,000 8,661 86.61% 10,000 9,357 93.57%
347 49 Community Center Other 8,000 615 7.69% 8,000 2,788 34.85%
347 92 Youth Activity Funds 0 0 0.00% 0 2,200 0.00%
Total Charges for Services $ 200,600 $ 110,441 55.06% $ 200,600 $ 117,766 58.71%
Fines and Forfeitures
351 10 Court Fines $ 70,000 $ 33,230 47.47% $ 70,000 $ 35,656 50.94%
351 30 Police Education 8,500 4,190 49.29% 8,500 4,631 54.48%
354 10 Alarm Permit Violations 15,000 0 0.00% 15,000 425 2.83%
354 20 License Penalties 10,000 10,140 101.40% 10,000 11,563 115.63%
354 30 Animal Control 4,000 2,686 67.15% 4,000 3,979 99.48%
354 50 Property Code Violations 45,000 70,657 157.02% 60,000 36,080 60.13%
Total Fines & Forfeitures $ 152,500 $ 120,903 79.28% $ 167,500 $ 92,334 55.12%
Miscellaneous Revenues
361 10 Interest on Investments $ 40,000 $ 11,535 28.84% $ 40,000 15,888 28.84%
361 20 Interest of SBA 0 0 0.00% 0 0 0.00%
361 33 Other Interest Earnings 1,750 602 34.40% 1,750 11,425 34.40%
362 11 Anchor Carwash 1,440 0 0.00% 1,440 0 0.00%
362 13 Rent - Little Jim 24,000 12,435 51.81% 24,000 12,000 51.81%
362 14 Rent - Old City Hall 0 0 0.00% 0 9,138 0.00%
362 15 Misc. Rental 0 1,510 0.00% 0 (917) 0.00%
Cert, Copying & Records Search Cert, Copying & Records Search
Cert, Copying & Records Search
Page 5
2013/14 2013/14 Yr. Lapse 2014/15 2014/15 Yr. Lapse
Budget Actual 50% Budget Actual 50%
GENERAL FUND - REVENUE DETAIL
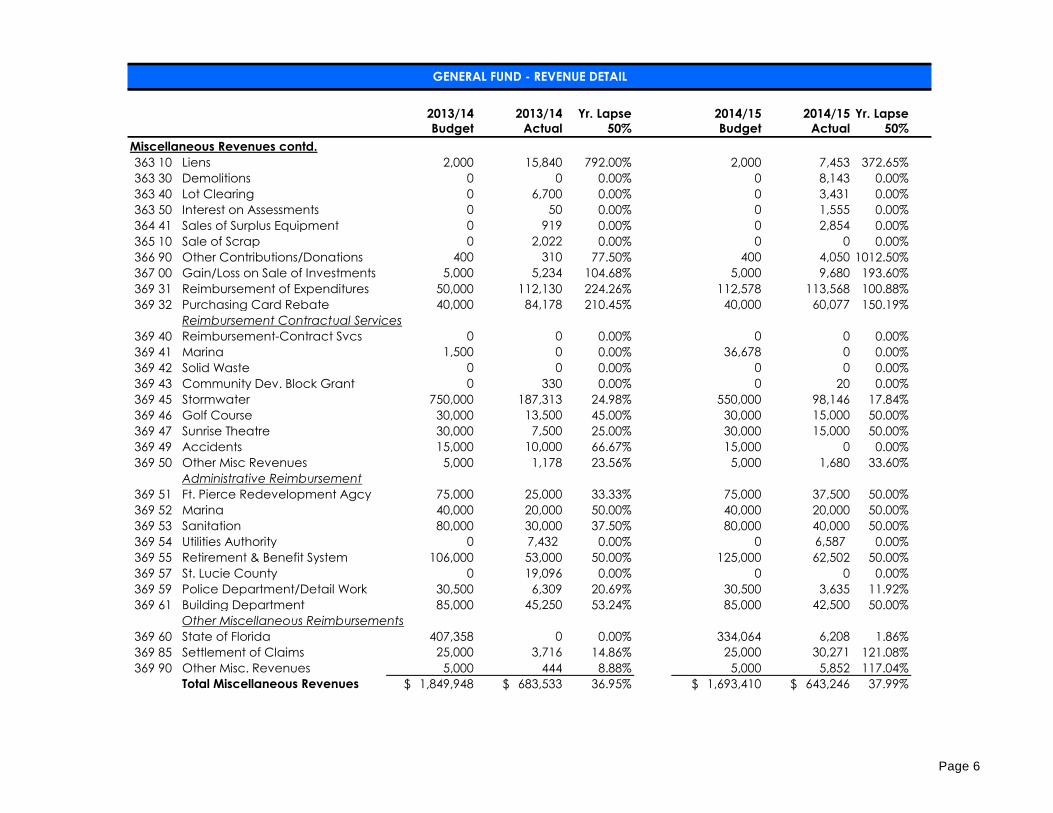
Miscellaneous Revenues contd.
363 10 Liens 2,000 15,840 792.00% 2,000 7,453 372.65%
363 30 Demolitions 0 0 0.00% 0 8,143 0.00%
363 40 Lot Clearing 0 6,700 0.00% 0 3,431 0.00%
363 50 Interest on Assessments 0 50 0.00% 0 1,555 0.00%
364 41 Sales of Surplus Equipment 0 919 0.00% 0 2,854 0.00%
365 10 Sale of Scrap 0 2,022 0.00% 0 0 0.00%
366 90 Other Contributions/Donations 400 310 77.50% 400 4,050 1012.50%
367 00 Gain/Loss on Sale of Investments 5,000 5,234 104.68% 5,000 9,680 193.60%
369 31 Reimbursement of Expenditures 50,000 112,130 224.26% 112,578 113,568 100.88%
369 32 Purchasing Card Rebate 40,000 84,178 210.45% 40,000 60,077 150.19%
Reimbursement Contractual Services
369 40 Reimbursement-Contract Svcs 0 0 0.00% 0 0 0.00%
369 41 Marina 1,500 0 0.00% 36,678 0 0.00%
369 42 Solid Waste 0 0 0.00% 0 0 0.00%
369 43 Community Dev. Block Grant 0 330 0.00% 0 20 0.00%
369 45 Stormwater 750,000 187,313 24.98% 550,000 98,146 17.84%
369 46 Golf Course 30,000 13,500 45.00% 30,000 15,000 50.00%
369 47 Sunrise Theatre 30,000 7,500 25.00% 30,000 15,000 50.00%
369 49 Accidents 15,000 10,000 66.67% 15,000 0 0.00%
369 50 Other Misc Revenues 5,000 1,178 23.56% 5,000 1,680 33.60%
Administrative Reimbursement
369 51 Ft. Pierce Redevelopment Agcy 75,000 25,000 33.33% 75,000 37,500 50.00%
369 52 Marina 40,000 20,000 50.00% 40,000 20,000 50.00%
369 53 Sanitation 80,000 30,000 37.50% 80,000 40,000 50.00%
369 54 Utilities Authority 0 7,432 0.00% 0 6,587 0.00%
369 55 Retirement & Benefit System 106,000 53,000 50.00% 125,000 62,502 50.00%
369 57 St. Lucie County 0 19,096 0.00% 0 0 0.00%
369 59 Police Department/Detail Work 30,500 6,309 20.69% 30,500 3,635 11.92%
369 61 Building Department 85,000 45,250 53.24% 85,000 42,500 50.00%
Other Miscellaneous Reimbursements
369 60 State of Florida 407,358 0 0.00% 334,064 6,208 1.86%
369 85 Settlement of Claims 25,000 3,716 14.86% 25,000 30,271 121.08%
369 90 Other Misc. Revenues 5,000 444 8.88% 5,000 5,852 117.04%
Total Miscellaneous Revenues $ 1,849,948 $ 683,533 36.95% $ 1,693,410 $ 643,246 37.99%
CoSalCo
Community Development Block Sales-Surplus Furniture, Fixt., Equip.
Page 6
2013/14 2013/14 Yr. Lapse 2014/15 2014/15 Yr. Lapse
Budget Actual 50% Budget Actual 50%
GENERAL FUND - REVENUE DETAIL
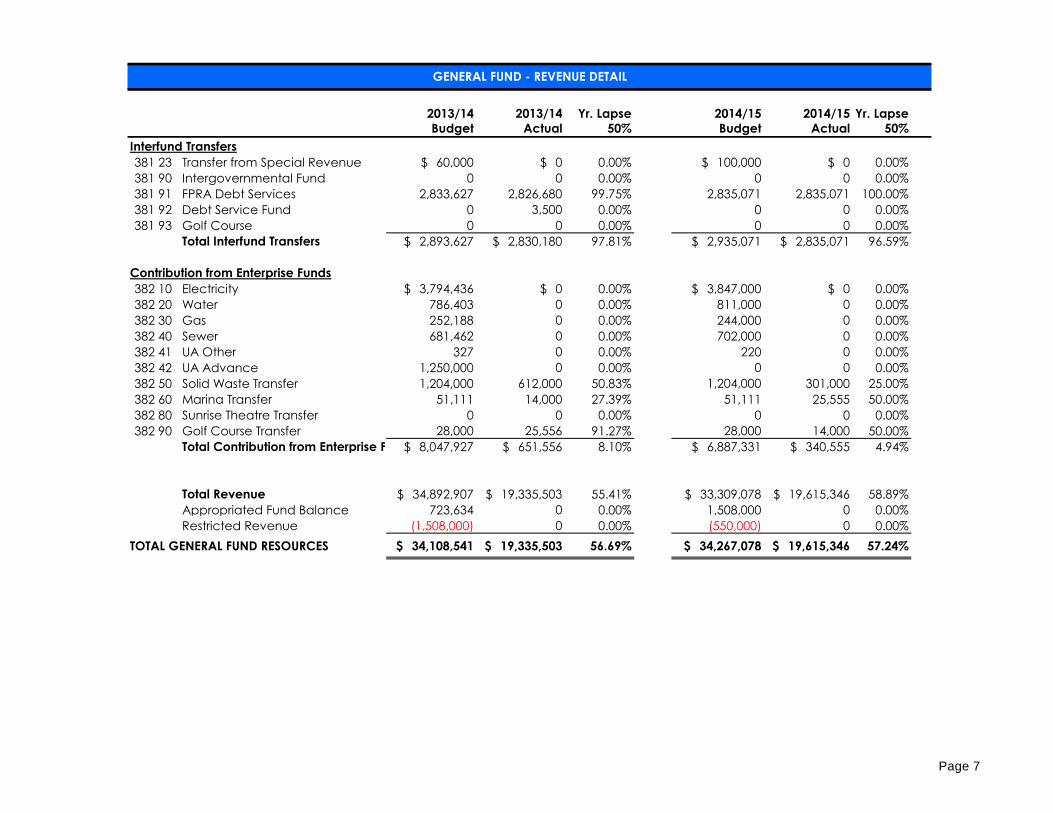
Interfund Transfers
381 23 Transfer from Special Revenue $ 60,000 $ 0 0.00% $ 100,000 $ 0 0.00%
381 90 Intergovernmental Fund 0 0 0.00% 0 0 0.00%
381 91 FPRA Debt Services 2,833,627 2,826,680 99.75% 2,835,071 2,835,071 100.00%
381 92 Debt Service Fund 0 3,500 0.00% 0 0 0.00%
381 93 Golf Course 0 0 0.00% 0 0 0.00%
Total Interfund Transfers $ 2,893,627 $ 2,830,180 97.81% $ 2,935,071 $ 2,835,071 96.59%
Contribution from Enterprise Funds
382 10 Electricity $ 3,794,436 $ 0 0.00% $ 3,847,000 $ 0 0.00%
382 20 Water 786,403 0 0.00% 811,000 0 0.00%
382 30 Gas 252,188 0 0.00% 244,000 0 0.00%
382 40 Sewer 681,462 0 0.00% 702,000 0 0.00%
382 41 UA Other 327 0 0.00% 220 0 0.00%
382 42 UA Advance 1,250,000 0 0.00% 0 0 0.00%
382 50 Solid Waste Transfer 1,204,000 612,000 50.83% 1,204,000 301,000 25.00%
382 60 Marina Transfer 51,111 14,000 27.39% 51,111 25,555 50.00%
382 80 Sunrise Theatre Transfer 0 0 0.00% 0 0 0.00%
382 90 Golf Course Transfer 28,000 25,556 91.27% 28,000 14,000 50.00%
Total Contribution from Enterprise Funds$ 8,047,927 $ 651,556 8.10% $ 6,887,331 $ 340,555 4.94%
Total Revenue $ 34,892,907 $ 19,335,503 55.41% $ 33,309,078 $ 19,615,346 58.89%
Appropriated Fund Balance 723,634 0 0.00% 1,508,000 0 0.00%
Restricted Revenue (1,508,000) 0 0.00% (550,000) 0 0.00%
TOTAL GENERAL FUND RESOURCES $ 34,108,541 $ 19,335,503 56.69% $ 34,267,078 $ 19,615,346 57.24%
Page 7
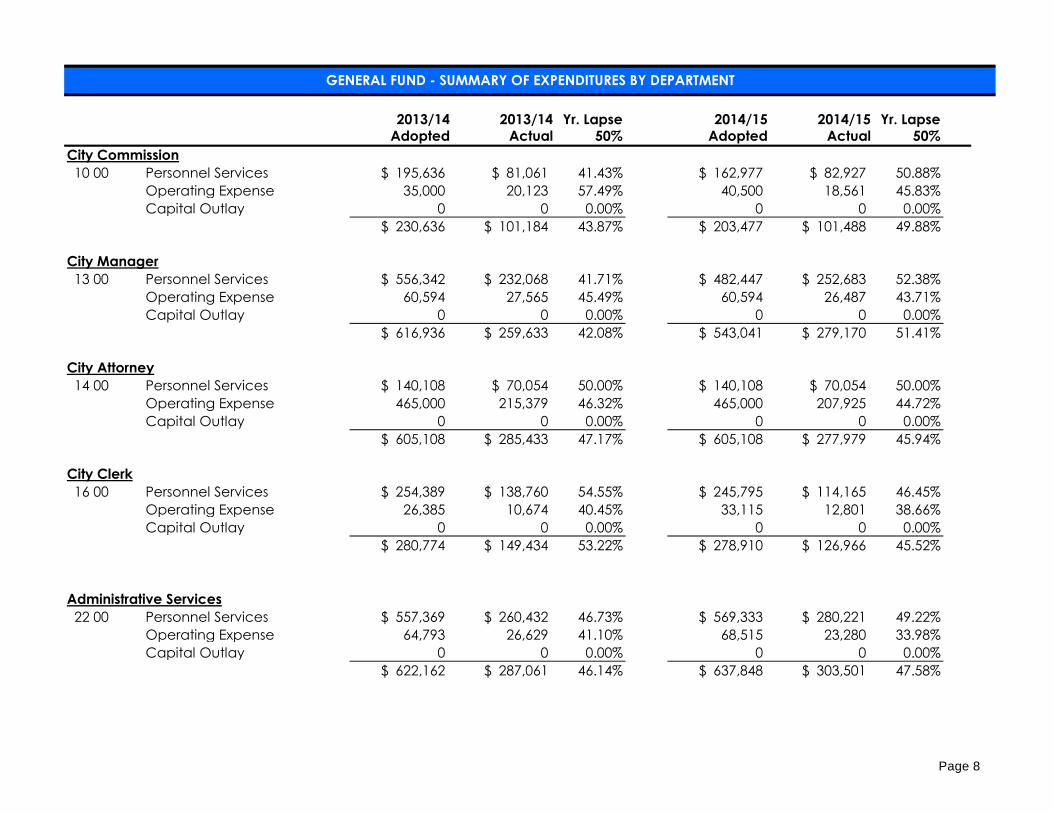
2013/14 2013/14 Yr. Lapse 2014/15 2014/15 Yr. LapseAdopted Actual 50% Adopted Actual 50%
City Commission
10 00 Personnel Services $ 195,636 $ 81,061 41.43% $ 162,977 $ 82,927 50.88%
Operating Expense 35,000 20,123 57.49% 40,500 18,561 45.83%
Capital Outlay 0 0 0.00% 0 0 0.00%
$ 230,636 $ 101,184 43.87% $ 203,477 $ 101,488 49.88%
City Manager
13 00 Personnel Services $ 556,342 $ 232,068 41.71% $ 482,447 $ 252,683 52.38%
Operating Expense 60,594 27,565 45.49% 60,594 26,487 43.71%
Capital Outlay 0 0 0.00% 0 0 0.00%
$ 616,936 $ 259,633 42.08% $ 543,041 $ 279,170 51.41%
City Attorney
14 00 Personnel Services $ 140,108 $ 70,054 50.00% $ 140,108 $ 70,054 50.00%
Operating Expense 465,000 215,379 46.32% 465,000 207,925 44.72%
Capital Outlay 0 0 0.00% 0 0 0.00%
$ 605,108 $ 285,433 47.17% $ 605,108 $ 277,979 45.94%
City Clerk
16 00 Personnel Services $ 254,389 $ 138,760 54.55% $ 245,795 $ 114,165 46.45%
Operating Expense 26,385 10,674 40.45% 33,115 12,801 38.66%
Capital Outlay 0 0 0.00% 0 0 0.00%
$ 280,774 $ 149,434 53.22% $ 278,910 $ 126,966 45.52%
Administrative Services
22 00 Personnel Services $ 557,369 $ 260,432 46.73% $ 569,333 $ 280,221 49.22%
Operating Expense 64,793 26,629 41.10% 68,515 23,280 33.98%
Capital Outlay 0 0 0.00% 0 0 0.00%
$ 622,162 $ 287,061 46.14% $ 637,848 $ 303,501 47.58%
GENERAL FUND - SUMMARY OF EXPENDITURES BY DEPARTMENT
Page 8
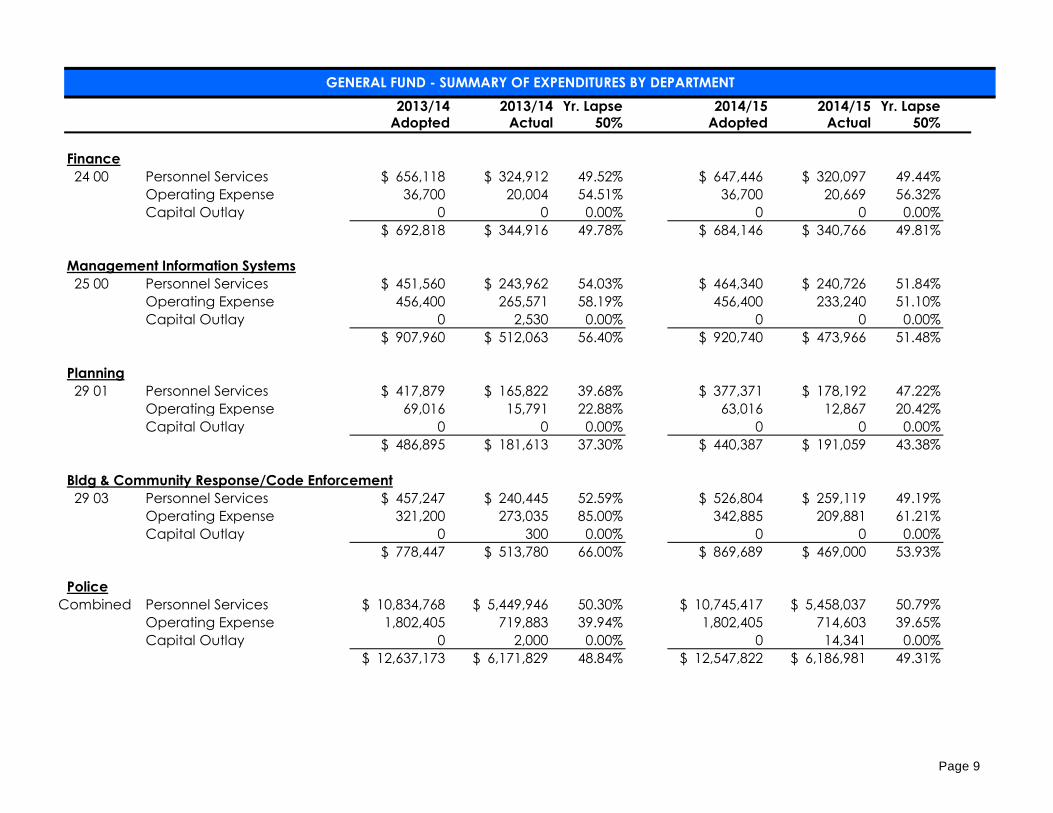
2013/14 2013/14 Yr. Lapse 2014/15 2014/15 Yr. LapseAdopted Actual 50% Adopted Actual 50%
Finance
24 00 Personnel Services $ 656,118 $ 324,912 49.52% $ 647,446 $ 320,097 49.44%
Operating Expense 36,700 20,004 54.51% 36,700 20,669 56.32%
Capital Outlay 0 0 0.00% 0 0 0.00%
$ 692,818 $ 344,916 49.78% $ 684,146 $ 340,766 49.81%
Management Information Systems
25 00 Personnel Services $ 451,560 $ 243,962 54.03% $ 464,340 $ 240,726 51.84%
Operating Expense 456,400 265,571 58.19% 456,400 233,240 51.10%
Capital Outlay 0 2,530 0.00% 0 0 0.00%
$ 907,960 $ 512,063 56.40% $ 920,740 $ 473,966 51.48%
Planning
29 01 Personnel Services $ 417,879 $ 165,822 39.68% $ 377,371 $ 178,192 47.22%
Operating Expense 69,016 15,791 22.88% 63,016 12,867 20.42%
Capital Outlay 0 0 0.00% 0 0 0.00%
$ 486,895 $ 181,613 37.30% $ 440,387 $ 191,059 43.38%
Bldg & Community Response/Code Enforcement
29 03 Personnel Services $ 457,247 $ 240,445 52.59% $ 526,804 $ 259,119 49.19%
Operating Expense 321,200 273,035 85.00% 342,885 209,881 61.21%
Capital Outlay 0 300 0.00% 0 0 0.00%
$ 778,447 $ 513,780 66.00% $ 869,689 $ 469,000 53.93%
Police
Combined Personnel Services $ 10,834,768 $ 5,449,946 50.30% $ 10,745,417 $ 5,458,037 50.79%
Operating Expense 1,802,405 719,883 39.94% 1,802,405 714,603 39.65%
Capital Outlay 0 2,000 0.00% 0 14,341 0.00%
$ 12,637,173 $ 6,171,829 48.84% $ 12,547,822 $ 6,186,981 49.31%
GENERAL FUND - SUMMARY OF EXPENDITURES BY DEPARTMENT
Page 9
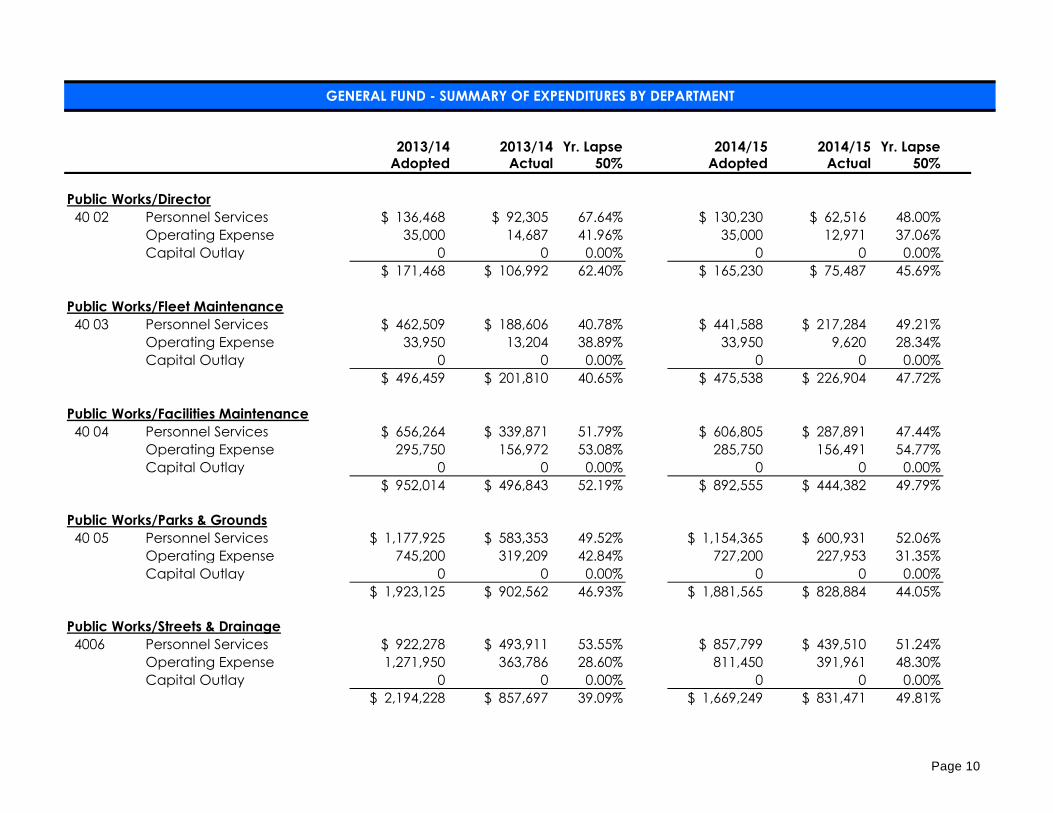
2013/14 2013/14 Yr. Lapse 2014/15 2014/15 Yr. LapseAdopted Actual 50% Adopted Actual 50%
Public Works/Director
40 02 Personnel Services $ 136,468 $ 92,305 67.64% $ 130,230 $ 62,516 48.00%
Operating Expense 35,000 14,687 41.96% 35,000 12,971 37.06%
Capital Outlay 0 0 0.00% 0 0 0.00%
$ 171,468 $ 106,992 62.40% $ 165,230 $ 75,487 45.69%
Public Works/Fleet Maintenance
40 03 Personnel Services $ 462,509 $ 188,606 40.78% $ 441,588 $ 217,284 49.21%
Operating Expense 33,950 13,204 38.89% 33,950 9,620 28.34%
Capital Outlay 0 0 0.00% 0 0 0.00%
$ 496,459 $ 201,810 40.65% $ 475,538 $ 226,904 47.72%
Public Works/Facilities Maintenance
40 04 Personnel Services $ 656,264 $ 339,871 51.79% $ 606,805 $ 287,891 47.44%
Operating Expense 295,750 156,972 53.08% 285,750 156,491 54.77%
Capital Outlay 0 0 0.00% 0 0 0.00%
$ 952,014 $ 496,843 52.19% $ 892,555 $ 444,382 49.79%
Public Works/Parks & Grounds
40 05 Personnel Services $ 1,177,925 $ 583,353 49.52% $ 1,154,365 $ 600,931 52.06%
Operating Expense 745,200 319,209 42.84% 727,200 227,953 31.35%
Capital Outlay 0 0 0.00% 0 0 0.00%
$ 1,923,125 $ 902,562 46.93% $ 1,881,565 $ 828,884 44.05%
Public Works/Streets & Drainage
4006 Personnel Services $ 922,278 $ 493,911 53.55% $ 857,799 $ 439,510 51.24%
Operating Expense 1,271,950 363,786 28.60% 811,450 391,961 48.30%
Capital Outlay 0 0 0.00% 0 0 0.00%
$ 2,194,228 $ 857,697 39.09% $ 1,669,249 $ 831,471 49.81%
GENERAL FUND - SUMMARY OF EXPENDITURES BY DEPARTMENT
Page 10
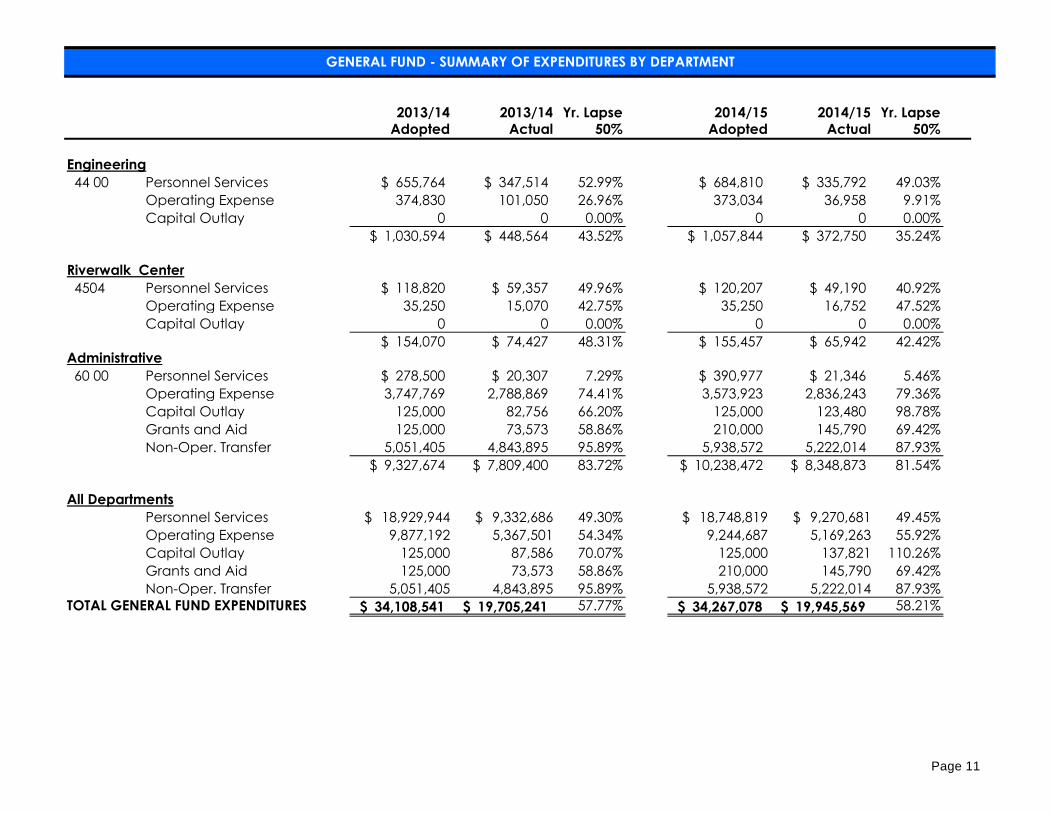
2013/14 2013/14 Yr. Lapse 2014/15 2014/15 Yr. LapseAdopted Actual 50% Adopted Actual 50%
Engineering
44 00 Personnel Services $ 655,764 $ 347,514 52.99% $ 684,810 $ 335,792 49.03%
Operating Expense 374,830 101,050 26.96% 373,034 36,958 9.91%
Capital Outlay 0 0 0.00% 0 0 0.00%
$ 1,030,594 $ 448,564 43.52% $ 1,057,844 $ 372,750 35.24%
Riverwalk Center
4504 Personnel Services $ 118,820 $ 59,357 49.96% $ 120,207 $ 49,190 40.92% Adopted
Operating Expense 35,250 15,070 42.75% 35,250 16,752 47.52% Adopted
Capital Outlay 0 0 0.00% 0 0 0.00%
$ 154,070 $ 74,427 48.31% $ 155,457 $ 65,942 42.42%Administrative
60 00 Personnel Services $ 278,500 $ 20,307 7.29% $ 390,977 $ 21,346 5.46%
Operating Expense 3,747,769 2,788,869 74.41% 3,573,923 2,836,243 79.36%
Capital Outlay 125,000 82,756 66.20% 125,000 123,480 98.78%
Grants and Aid 125,000 73,573 58.86% 210,000 145,790 69.42%
Non-Oper. Transfer 5,051,405 4,843,895 95.89% 5,938,572 5,222,014 87.93%
$ 9,327,674 $ 7,809,400 83.72% $ 10,238,472 $ 8,348,873 81.54%
All Departments
Personnel Services $ 18,929,944 $ 9,332,686 49.30% $ 18,748,819 $ 9,270,681 49.45%
Operating Expense 9,877,192 5,367,501 54.34% 9,244,687 5,169,263 55.92%
Capital Outlay 125,000 87,586 70.07% 125,000 137,821 110.26%
Grants and Aid 125,000 73,573 58.86% 210,000 145,790 69.42%
Non-Oper. Transfer 5,051,405 4,843,895 95.89% 5,938,572 5,222,014 87.93%
TOTAL GENERAL FUND EXPENDITURES $ 34,108,541 $ 19,705,241 57.77% $ 34,267,078 $ 19,945,569 58.21%
GENERAL FUND - SUMMARY OF EXPENDITURES BY DEPARTMENT
Page 11
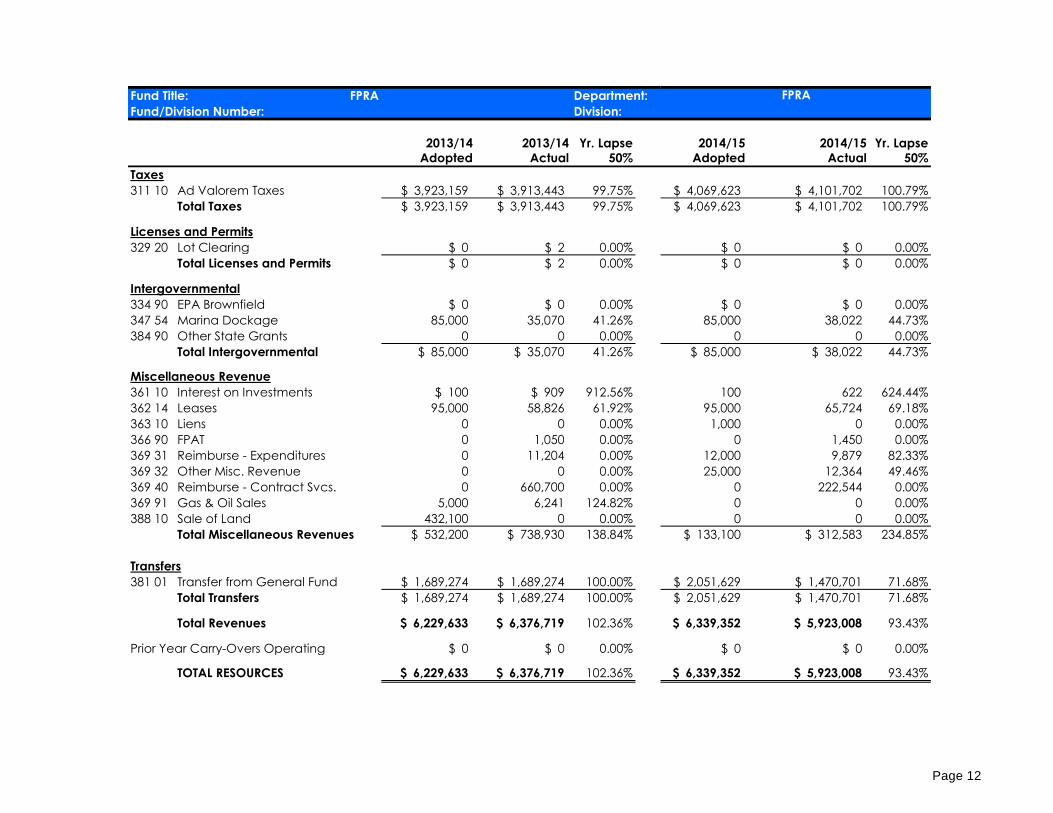
Fund Title: FPRA Department:
Fund/Division Number: Division:
2013/14 2013/14 Yr. Lapse 2014/15 2014/15 Yr. Lapse
Adopted Actual 50% Adopted Actual 50%
Taxes
311 10 Ad Valorem Taxes $ 3,923,159 $ 3,913,443 99.75% $ 4,069,623 $ 4,101,702 100.79%
Total Taxes $ 3,923,159 $ 3,913,443 99.75% $ 4,069,623 $ 4,101,702 100.79%
Licenses and Permits
329 20 Lot Clearing $ 0 $ 2 0.00% $ 0 $ 0 0.00%
Total Licenses and Permits $ 0 $ 2 0.00% $ 0 $ 0 0.00%
Intergovernmental
334 90 EPA Brownfield $ 0 $ 0 0.00% $ 0 $ 0 0.00%
347 54 Marina Dockage 85,000 35,070 41.26% 85,000 38,022 44.73%
384 90 Other State Grants 0 0 0.00% 0 0 0.00%
Total Intergovernmental $ 85,000 $ 35,070 41.26% $ 85,000 $ 38,022 44.73%
Miscellaneous Revenue
361 10 Interest on Investments $ 100 $ 909 912.56% 100 622 624.44%
362 14 Leases 95,000 58,826 61.92% 95,000 65,724 69.18%
363 10 Liens 0 0 0.00% 1,000 0 0.00%
366 90 FPAT 0 1,050 0.00% 0 1,450 0.00%
369 31 Reimburse - Expenditures 0 11,204 0.00% 12,000 9,879 82.33%
369 32 Other Misc. Revenue 0 0 0.00% 25,000 12,364 49.46%
369 40 Reimburse - Contract Svcs. 0 660,700 0.00% 0 222,544 0.00%
369 91 Gas & Oil Sales 5,000 6,241 124.82% 0 0 0.00%
388 10 Sale of Land 432,100 0 0.00% 0 0 0.00%
Total Miscellaneous Revenues $ 532,200 $ 738,930 138.84% $ 133,100 $ 312,583 234.85%
Transfers
381 01 Transfer from General Fund $ 1,689,274 $ 1,689,274 100.00% $ 2,051,629 $ 1,470,701 71.68%
Total Transfers $ 1,689,274 $ 1,689,274 100.00% $ 2,051,629 $ 1,470,701 71.68%
Total Revenues $ 6,229,633 $ 6,376,719 102.36% $ 6,339,352 $ 5,923,008 93.43%
Prior Year Carry-Overs Operating $ 0 $ 0 0.00% $ 0 $ 0 0.00%
TOTAL RESOURCES $ 6,229,633 $ 6,376,719 102.36% $ 6,339,352 $ 5,923,008 93.43%
FPRA
* Authorized Authorized Fund Funded Authorized Authorized Fund Funded Authorized Authorized Fund Funded Authorized Authorized Fund Funded Authorized Authorized Fund Funded Authorized Authorized Fund Funded Authorized Authorized Fund Funded Authorized Authorized Fund Funded Authorized Authorized Fund Funded Authorized Authorized Fund Funded Authorized Authorized Fund Funded Authorized Authorized Authorized Fund Funded Authorized Authorized Fund Funded Authorized Authorized Fund Funded Authorized Authorized Fu Funded Authorized Authorized Fu Funded Authorized Authorized Fu Funded Authorized Authorized Fund Funded Neighbo Authorized Authorized Fund Funded Authorized Authorized Authorized Authorized Authorized Authorized Authorized Authorized Authorized Authorized Authorized Authorized Authorized Authorized Authorized Authorized Authorized Authorized Authorized
Page 12
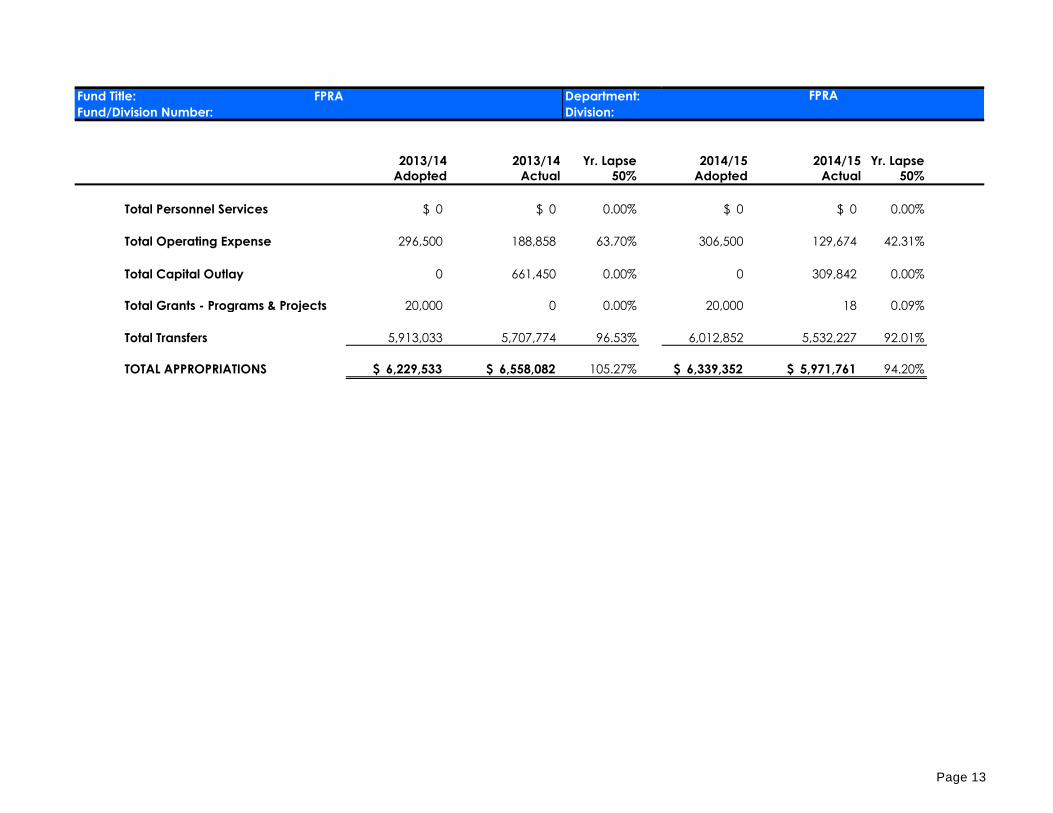
Fund Title: FPRA Department:
Fund/Division Number: Division:
2013/14 2013/14 Yr. Lapse 2014/15 2014/15 Yr. Lapse
Adopted Actual 50% Adopted Actual 50%
Total Personnel Services $ 0 $ 0 0.00% $ 0 $ 0 0.00%
Total Operating Expense 296,500 188,858 63.70% 306,500 129,674 42.31%
Total Capital Outlay 0 661,450 0.00% 0 309,842 0.00%
Total Grants - Programs & Projects 20,000 0 0.00% 20,000 18 0.09%
Total Transfers 5,913,033 5,707,774 96.53% 6,012,852 5,532,227 92.01%
TOTAL APPROPRIATIONS $ 6,229,533 $ 6,558,082 105.27% $ 6,339,352 $ 5,971,761 94.20%
FPRA
Page 13
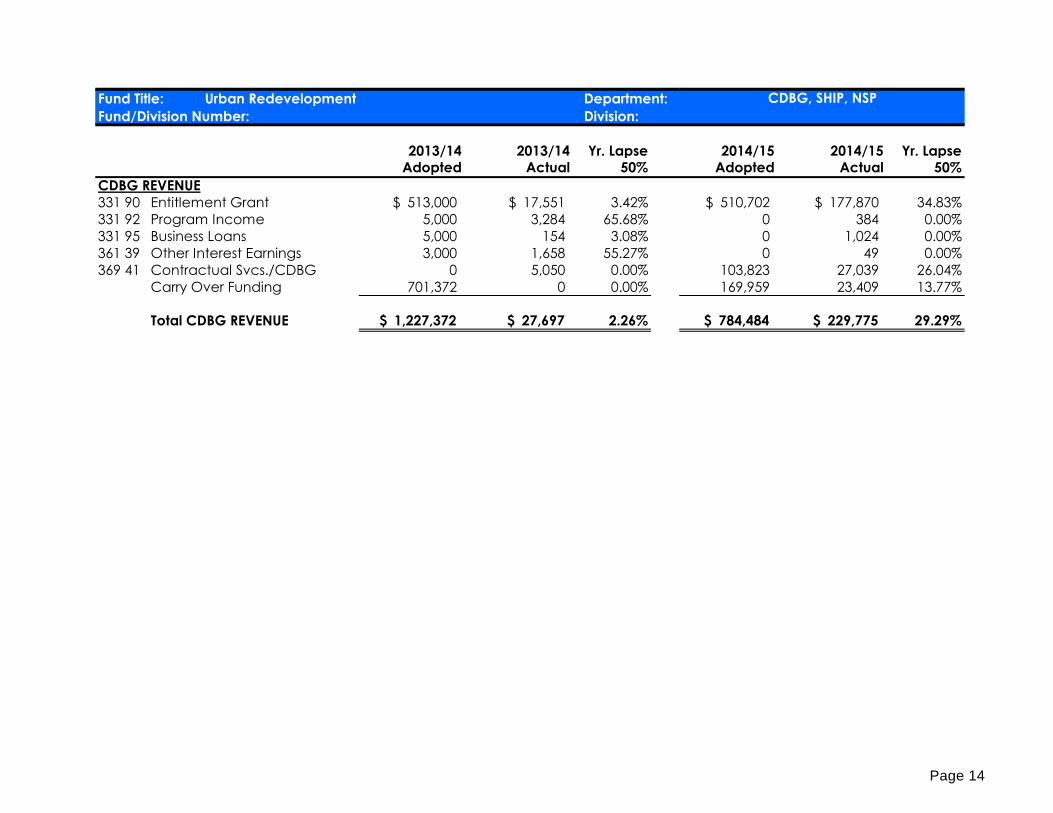
Fund Title: Urban Redevelopment Department:
Fund/Division Number: Division:
2013/14 2013/14 Yr. Lapse 2014/15 2014/15 Yr. LapseAdopted Actual 50% Adopted Actual 50%
CDBG REVENUE
331 90 Entitlement Grant $ 513,000 $ 17,551 3.42% $ 510,702 $ 177,870 34.83%
331 92 Program Income 5,000 3,284 65.68% 0 384 0.00%
331 95 Business Loans 5,000 154 3.08% 0 1,024 0.00%
361 39 Other Interest Earnings 3,000 1,658 55.27% 0 49 0.00%
369 41 Contractual Svcs./CDBG 0 5,050 0.00% 103,823 27,039 26.04%
Carry Over Funding 701,372 0 0.00% 169,959 23,409 13.77%
Total CDBG REVENUE $ 1,227,372 $ 27,697 2.26% $ 784,484 $ 229,775 29.29%
CDBG, SHIP, NSP
Page 14
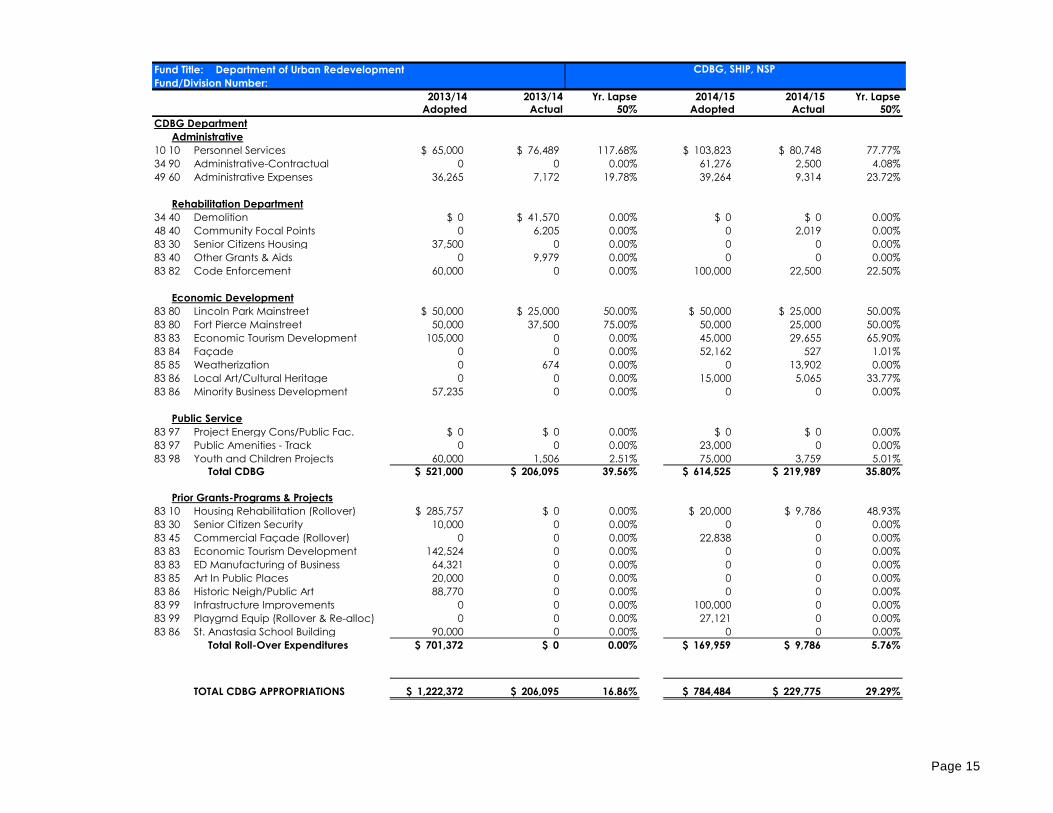
Fund Title: Department of Urban Redevelopment
Fund/Division Number:
2013/14 2013/14 Yr. Lapse 2014/15 2014/15 Yr. Lapse
Adopted Actual 50% Adopted Actual 50%
CDBG Department
Administrative
10 10 Personnel Services $ 65,000 $ 76,489 117.68% $ 103,823 $ 80,748 77.77%
34 90 Administrative-Contractual 0 0 0.00% 61,276 2,500 4.08%
49 60 Administrative Expenses 36,265 7,172 19.78% 39,264 9,314 23.72%
Rehabilitation Department
34 40 Demolition $ 0 $ 41,570 0.00% $ 0 $ 0 0.00%
48 40 Community Focal Points 0 6,205 0.00% 0 2,019 0.00%
83 30 Senior Citizens Housing 37,500 0 0.00% 0 0 0.00%
83 40 Other Grants & Aids 0 9,979 0.00% 0 0 0.00%
83 82 Code Enforcement 60,000 0 0.00% 100,000 22,500 22.50%
Economic Development
83 80 Lincoln Park Mainstreet $ 50,000 $ 25,000 50.00% $ 50,000 $ 25,000 50.00%
83 80 Fort Pierce Mainstreet 50,000 37,500 75.00% 50,000 25,000 50.00%
83 83 Economic Tourism Development 105,000 0 0.00% 45,000 29,655 65.90%
83 84 Façade 0 0 0.00% 52,162 527 1.01%
85 85 Weatherization 0 674 0.00% 0 13,902 0.00%
83 86 Local Art/Cultural Heritage 0 0 0.00% 15,000 5,065 33.77%
83 86 Minority Business Development 57,235 0 0.00% 0 0 0.00%
Public Service
83 97 Project Energy Cons/Public Fac. $ 0 $ 0 0.00% $ 0 $ 0 0.00%
83 97 Public Amenities - Track 0 0 0.00% 23,000 0 0.00%
83 98 Youth and Children Projects 60,000 1,506 2.51% 75,000 3,759 5.01%
Total CDBG $ 521,000 $ 206,095 39.56% $ 614,525 $ 219,989 35.80%
Prior Grants-Programs & Projects
83 10 Housing Rehabilitation (Rollover) $ 285,757 $ 0 0.00% $ 20,000 $ 9,786 48.93%
83 30 Senior Citizen Security 10,000 0 0.00% 0 0 0.00%
83 45 Commercial Façade (Rollover) 0 0 0.00% 22,838 0 0.00%
83 83 Economic Tourism Development 142,524 0 0.00% 0 0 0.00%
83 83 ED Manufacturing of Business 64,321 0 0.00% 0 0 0.00%
83 85 Art In Public Places 20,000 0 0.00% 0 0 0.00%
83 86 Historic Neigh/Public Art 88,770 0 0.00% 0 0 0.00%
83 99 Infrastructure Improvements 0 0 0.00% 100,000 0 0.00%
83 99 Playgrnd Equip (Rollover & Re-alloc) 0 0 0.00% 27,121 0 0.00%
83 86 St. Anastasia School Building 90,000 0 0.00% 0 0 0.00%
Total Roll-Over Expenditures $ 701,372 $ 0 0.00% $ 169,959 $ 9,786 5.76%
TOTAL CDBG APPROPRIATIONS $ 1,222,372 $ 206,095 16.86% $ 784,484 $ 229,775 29.29%
CDBG, SHIP, NSP
Page 15
Fund Title: Department of Urban Redevelopment
Fund/Division Number:
CDBG, SHIP, NSP
2013/14 2013/14 Yr. Lapse 2014/15 2014/15 Yr. Lapse
Adopted Actual 50% Adopted Actual 50%
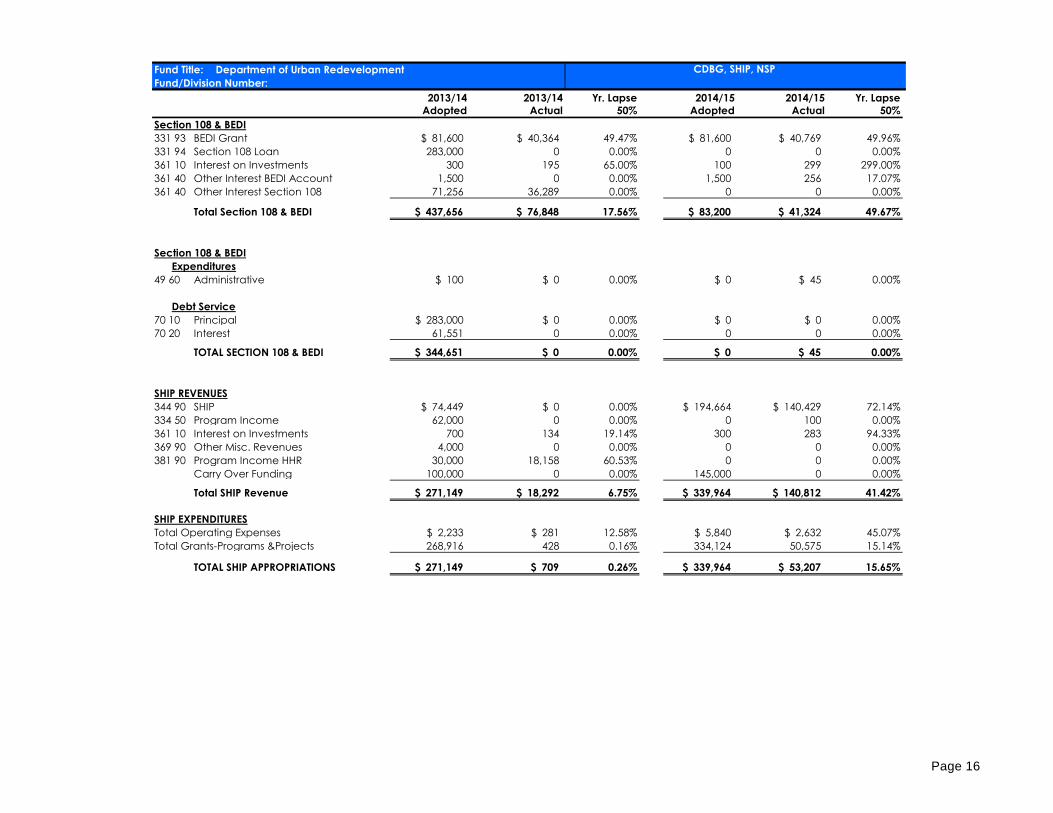
Section 108 & BEDI
331 93 BEDI Grant $ 81,600 $ 40,364 49.47% $ 81,600 $ 40,769 49.96%
331 94 Section 108 Loan 283,000 0 0.00% 0 0 0.00%
361 10 Interest on Investments 300 195 65.00% 100 299 299.00%
361 40 Other Interest BEDI Account 1,500 0 0.00% 1,500 256 17.07%
361 40 Other Interest Section 108 71,256 36,289 0.00% 0 0 0.00%
Total Section 108 & BEDI $ 437,656 $ 76,848 17.56% $ 83,200 $ 41,324 49.67%
Section 108 & BEDI
Expenditures
49 60 Administrative $ 100 $ 0 0.00% $ 0 $ 45 0.00%
Debt Service
70 10 Principal $ 283,000 $ 0 0.00% $ 0 $ 0 0.00%
70 20 Interest 61,551 0 0.00% 0 0 0.00%
TOTAL SECTION 108 & BEDI $ 344,651 $ 0 0.00% $ 0 $ 45 0.00%
SHIP REVENUES
344 90 SHIP $ 74,449 $ 0 0.00% $ 194,664 $ 140,429 72.14%
334 50 Program Income 62,000 0 0.00% 0 100 0.00%
361 10 Interest on Investments 700 134 19.14% 300 283 94.33%
369 90 Other Misc. Revenues 4,000 0 0.00% 0 0 0.00%
381 90 Program Income HHR 30,000 18,158 60.53% 0 0 0.00%
Carry Over Funding 100,000 0 0.00% 145,000 0 0.00%
Total SHIP Revenue $ 271,149 $ 18,292 6.75% $ 339,964 $ 140,812 41.42%
SHIP EXPENDITURES
Total Operating Expenses $ 2,233 $ 281 12.58% $ 5,840 $ 2,632 45.07%
Total Grants-Programs &Projects 268,916 428 0.16% 334,124 50,575 15.14%
TOTAL SHIP APPROPRIATIONS $ 271,149 $ 709 0.26% $ 339,964 $ 53,207 15.65%
Page 16
Fund Title: Department of Urban Redevelopment
Fund/Division Number:
CDBG, SHIP, NSP
2013/14 2013/14 Yr. Lapse 2014/15 2014/15 Yr. Lapse
Adopted Actual 50% Adopted Actual 50%
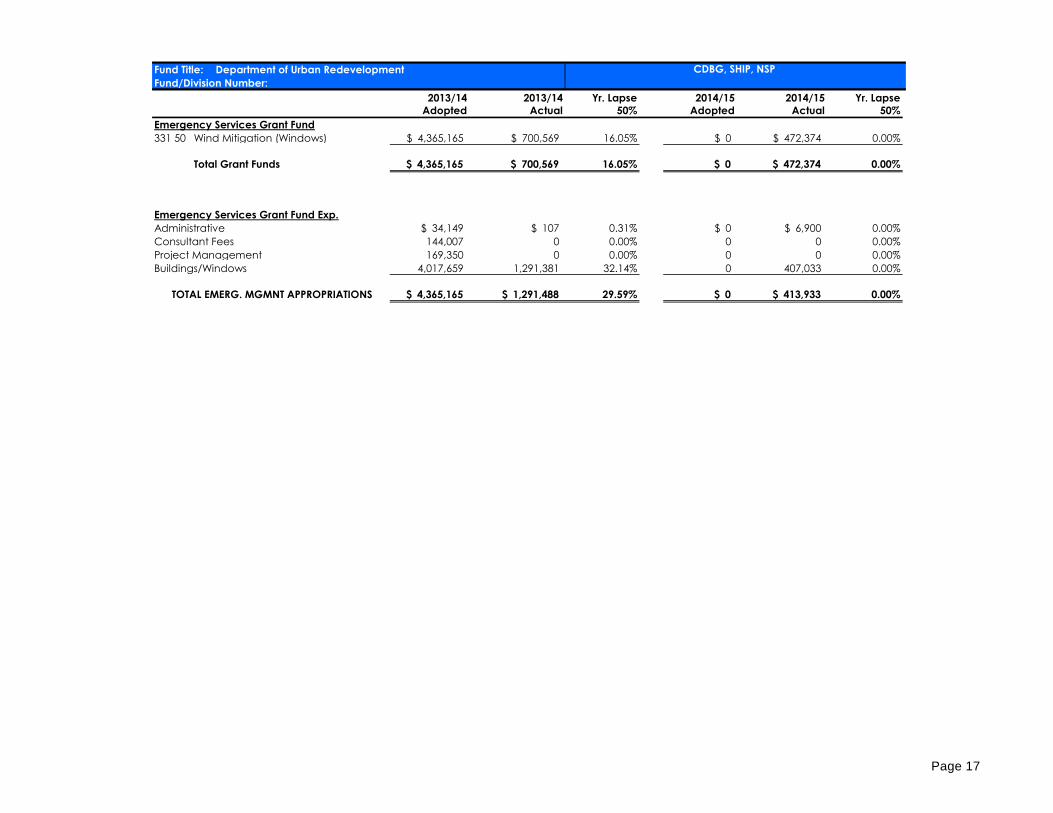
Emergency Services Grant Fund
331 50 Wind Mitigation (Windows) $ 4,365,165 $ 700,569 16.05% $ 0 $ 472,374 0.00%
Total Grant Funds $ 4,365,165 $ 700,569 16.05% $ 0 $ 472,374 0.00%
Emergency Services Grant Fund Exp.
Administrative $ 34,149 $ 107 0.31% $ 0 $ 6,900 0.00%
Consultant Fees 144,007 0 0.00% 0 0 0.00%
Project Management 169,350 0 0.00% 0 0 0.00%
Buildings/Windows 4,017,659 1,291,381 32.14% 0 407,033 0.00%
TOTAL EMERG. MGMNT APPROPRIATIONS $ 4,365,165 $ 1,291,488 29.59% $ 0 $ 413,933 0.00%
* Neigh
Page 17
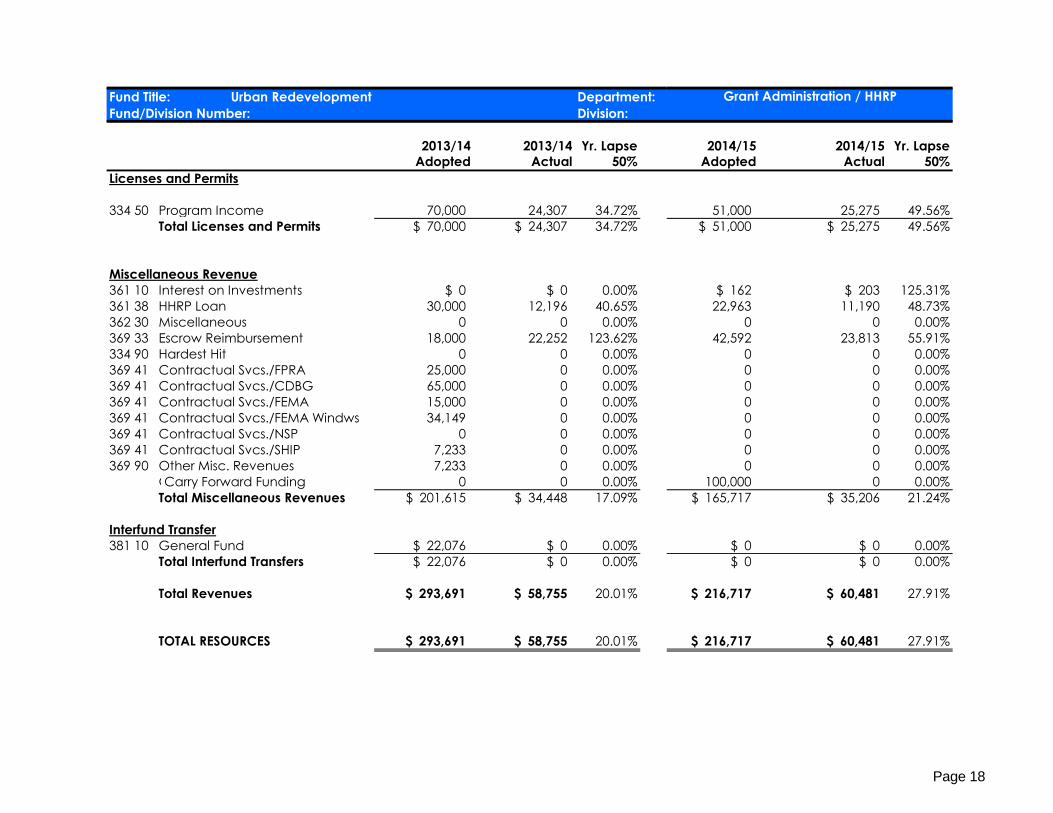
Fund Title: Urban Redevelopment Department:
Fund/Division Number: Division:
2013/14 2013/14 Yr. Lapse 2014/15 2014/15 Yr. Lapse
Adopted Actual 50% Adopted Actual 50%
Licenses and Permits
334 50 Program Income 70,000 24,307 34.72% 51,000 25,275 49.56%
Total Licenses and Permits $ 70,000 $ 24,307 34.72% $ 51,000 $ 25,275 49.56%
Miscellaneous Revenue
361 10 Interest on Investments $ 0 $ 0 0.00% $ 162 $ 203 125.31%
361 38 HHRP Loan 30,000 12,196 40.65% 22,963 11,190 48.73%
362 30 Miscellaneous 0 0 0.00% 0 0 0.00%
369 33 Escrow Reimbursement 18,000 22,252 123.62% 42,592 23,813 55.91%
334 90 Hardest Hit 0 0 0.00% 0 0 0.00%
369 41 Contractual Svcs./FPRA 25,000 0 0.00% 0 0 0.00%
369 41 Contractual Svcs./CDBG 65,000 0 0.00% 0 0 0.00%
369 41 Contractual Svcs./FEMA 15,000 0 0.00% 0 0 0.00%
369 41 Contractual Svcs./FEMA Windws 34,149 0 0.00% 0 0 0.00%
369 41 Contractual Svcs./NSP 0 0 0.00% 0 0 0.00%
369 41 Contractual Svcs./SHIP 7,233 0 0.00% 0 0 0.00%
369 90 Other Misc. Revenues 7,233 0 0.00% 0 0 0.00%
Other Misc. RevenuesCarry Forward Funding 0 0 0.00% 100,000 0 0.00%
Total Miscellaneous Revenues $ 201,615 $ 34,448 17.09% $ 165,717 $ 35,206 21.24%
Interfund Transfer
381 10 General Fund $ 22,076 $ 0 0.00% $ 0 $ 0 0.00%
Total Interfund Transfers $ 22,076 $ 0 0.00% $ 0 $ 0 0.00%
Total Revenues $ 293,691 $ 58,755 20.01% $ 216,717 $ 60,481 27.91%
TOTAL RESOURCES $ 293,691 $ 58,755 20.01% $ 216,717 $ 60,481 27.91%
Grant Administration / HHRP
Page 18
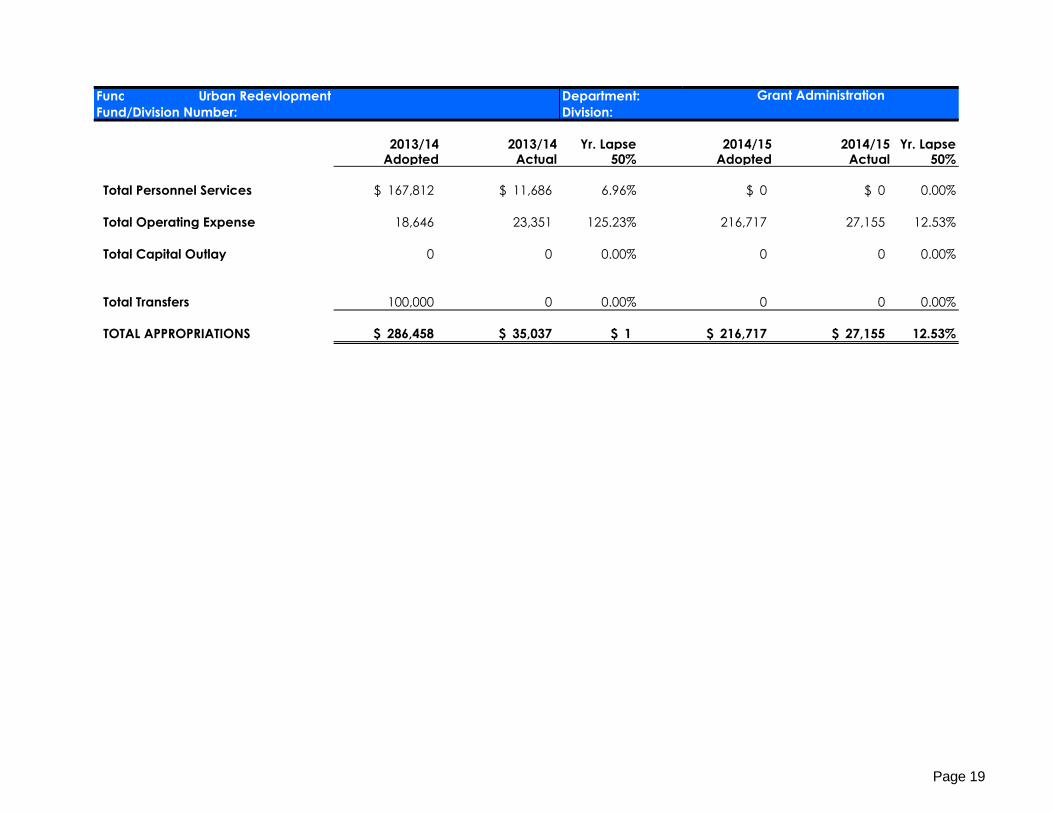
Fund Title: Urban Redevlopment Department:
Fund/Division Number: Division:
2013/14 2013/14 Yr. Lapse 2014/15 2014/15 Yr. LapseAdopted Actual 50% Adopted Actual 50%
Total Personnel Services $ 167,812 $ 11,686 6.96% $ 0 $ 0 0.00%
Total Operating Expense 18,646 23,351 125.23% 216,717 27,155 12.53%
Total Capital Outlay 0 0 0.00% 0 0 0.00%
Total Transfers 100,000 0 0.00% 0 0 0.00%
TOTAL APPROPRIATIONS $ 286,458 $ 35,037 $ 1 $ 216,717 $ 27,155 12.53%
Grant Administration
Page 19
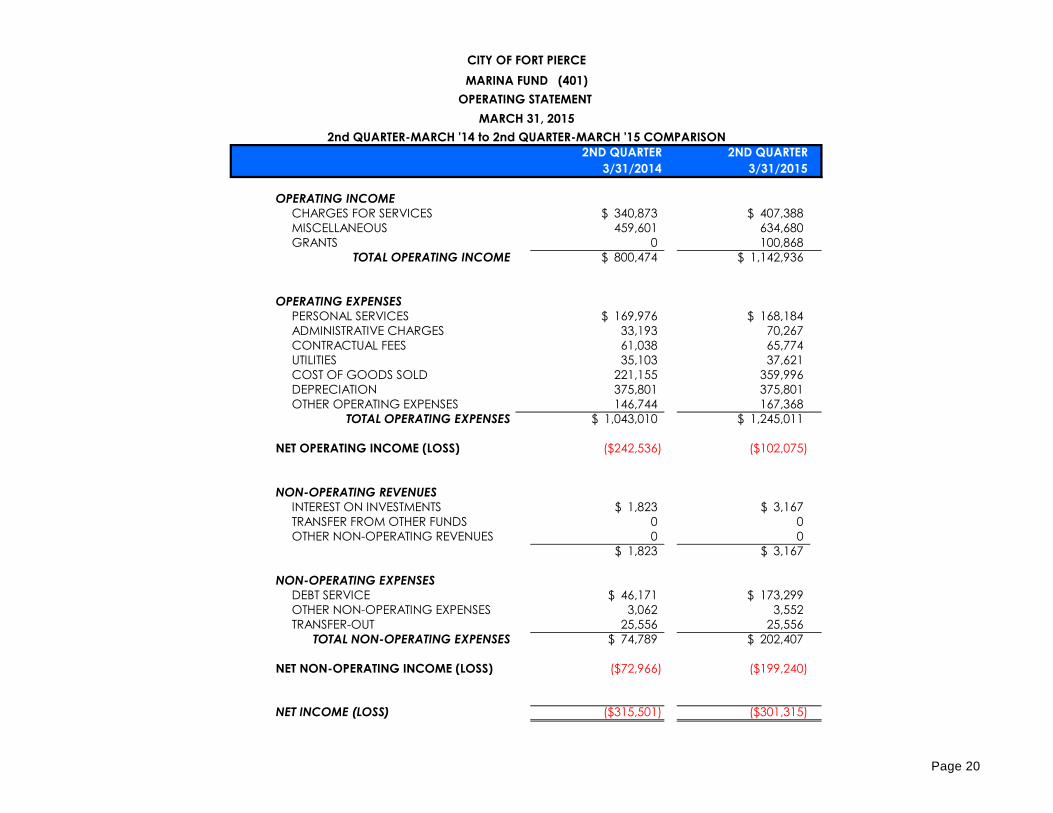
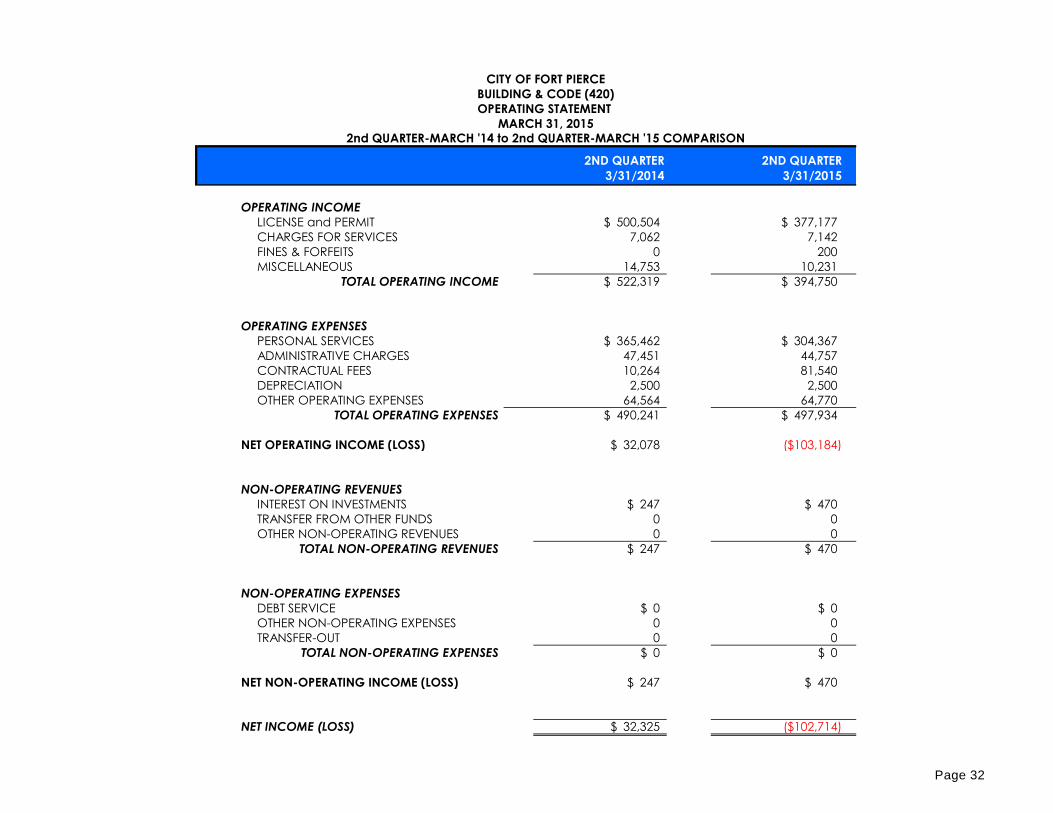
2ND QUARTER 2ND QUARTER
3/31/2014 3/31/2015
OPERATING INCOME
CHARGES FOR SERVICES $ 340,873 $ 407,388
MISCELLANEOUS 459,601 634,680
GRANTS 0 100,868
TOTAL OPERATING INCOME $ 800,474 $ 1,142,936
OPERATING EXPENSES
PERSONAL SERVICES $ 169,976 $ 168,184
ADMINISTRATIVE CHARGES 33,193 70,267
CONTRACTUAL FEES 61,038 65,774
UTILITIES 35,103 37,621
COST OF GOODS SOLD 221,155 359,996
DEPRECIATION 375,801 375,801
OTHER OPERATING EXPENSES 146,744 167,368
TOTAL OPERATING EXPENSES $ 1,043,010 $ 1,245,011
NET OPERATING INCOME (LOSS) ($242,536) ($102,075)
NON-OPERATING REVENUES
INTEREST ON INVESTMENTS $ 1,823 $ 3,167
TRANSFER FROM OTHER FUNDS 0 0
OTHER NON-OPERATING REVENUES 0 0
$ 1,823 $ 3,167
NON-OPERATING EXPENSES
DEBT SERVICE $ 46,171 $ 173,299
OTHER NON-OPERATING EXPENSES 3,062 3,552
TRANSFER-OUT 25,556 25,556
TOTAL NON-OPERATING EXPENSES $ 74,789 $ 202,407
NET NON-OPERATING INCOME (LOSS) ($72,966) ($199,240)
NET INCOME (LOSS) ($315,501) ($301,315)
CITY OF FORT PIERCE
MARINA FUND (401)
OPERATING STATEMENT
MARCH 31, 2015
2nd QUARTER-MARCH '14 to 2nd QUARTER-MARCH '15 COMPARISON
Page 20
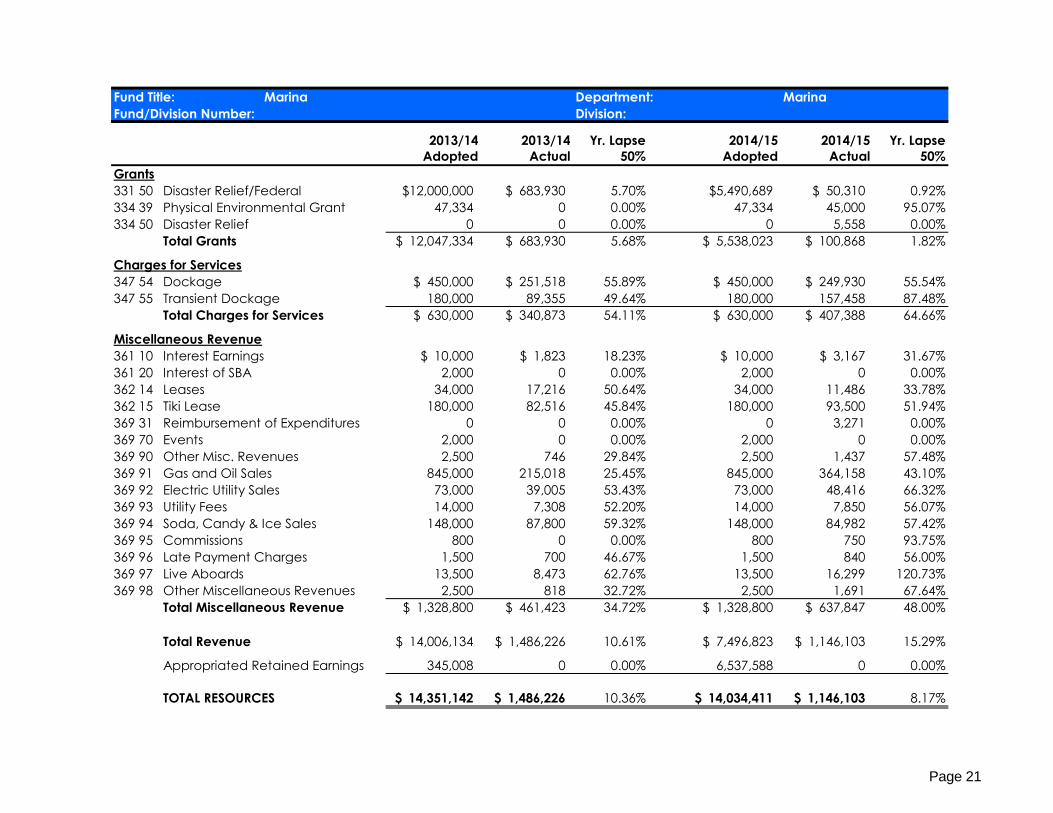
Fund Title: Marina Department: Marina
Fund/Division Number: Division:
2013/14 2013/14 Yr. Lapse 2014/15 2014/15 Yr. Lapse
Adopted Actual 50% Adopted Actual 50%
Grants
331 50 Disaster Relief/Federal $12,000,000 $ 683,930 5.70% $5,490,689 $ 50,310 0.92%
334 39 Physical Environmental Grant 47,334 0 0.00% 47,334 45,000 95.07%
334 50 Disaster Relief 0 0 0.00% 0 5,558 0.00%
Total Grants $ 12,047,334 $ 683,930 5.68% $ 5,538,023 $ 100,868 1.82%
Charges for Services
347 54 Dockage $ 450,000 $ 251,518 55.89% $ 450,000 $ 249,930 55.54%
347 55 Transient Dockage 180,000 89,355 49.64% 180,000 157,458 87.48%
Total Charges for Services $ 630,000 $ 340,873 54.11% $ 630,000 $ 407,388 64.66%
Miscellaneous Revenue
361 10 Interest Earnings $ 10,000 $ 1,823 18.23% $ 10,000 $ 3,167 31.67%
361 20 Interest of SBA 2,000 0 0.00% 2,000 0 0.00%
362 14 Leases 34,000 17,216 50.64% 34,000 11,486 33.78%
362 15 Tiki Lease 180,000 82,516 45.84% 180,000 93,500 51.94%
369 31 Reimbursement of Expenditures 0 0 0.00% 0 3,271 0.00%
369 70 Events 2,000 0 0.00% 2,000 0 0.00%
369 90 Other Misc. Revenues 2,500 746 29.84% 2,500 1,437 57.48%
369 91 Gas and Oil Sales 845,000 215,018 25.45% 845,000 364,158 43.10%
369 92 Electric Utility Sales 73,000 39,005 53.43% 73,000 48,416 66.32%
369 93 Utility Fees 14,000 7,308 52.20% 14,000 7,850 56.07%
369 94 Soda, Candy & Ice Sales 148,000 87,800 59.32% 148,000 84,982 57.42%
369 95 Commissions 800 0 0.00% 800 750 93.75%
369 96 Late Payment Charges 1,500 700 46.67% 1,500 840 56.00%
369 97 Live Aboards 13,500 8,473 62.76% 13,500 16,299 120.73%
369 98 Other Miscellaneous Revenues 2,500 818 32.72% 2,500 1,691 67.64%
Total Miscellaneous Revenue $ 1,328,800 $ 461,423 34.72% $ 1,328,800 $ 637,847 48.00%
Total Revenue $ 14,006,134 $ 1,486,226 10.61% $ 7,496,823 $ 1,146,103 15.29%
Appropriated Retained Earnings 345,008 0 0.00% 6,537,588 0 0.00%
TOTAL RESOURCES $ 14,351,142 $ 1,486,226 10.36% $ 14,034,411 $ 1,146,103 8.17%
Page 21
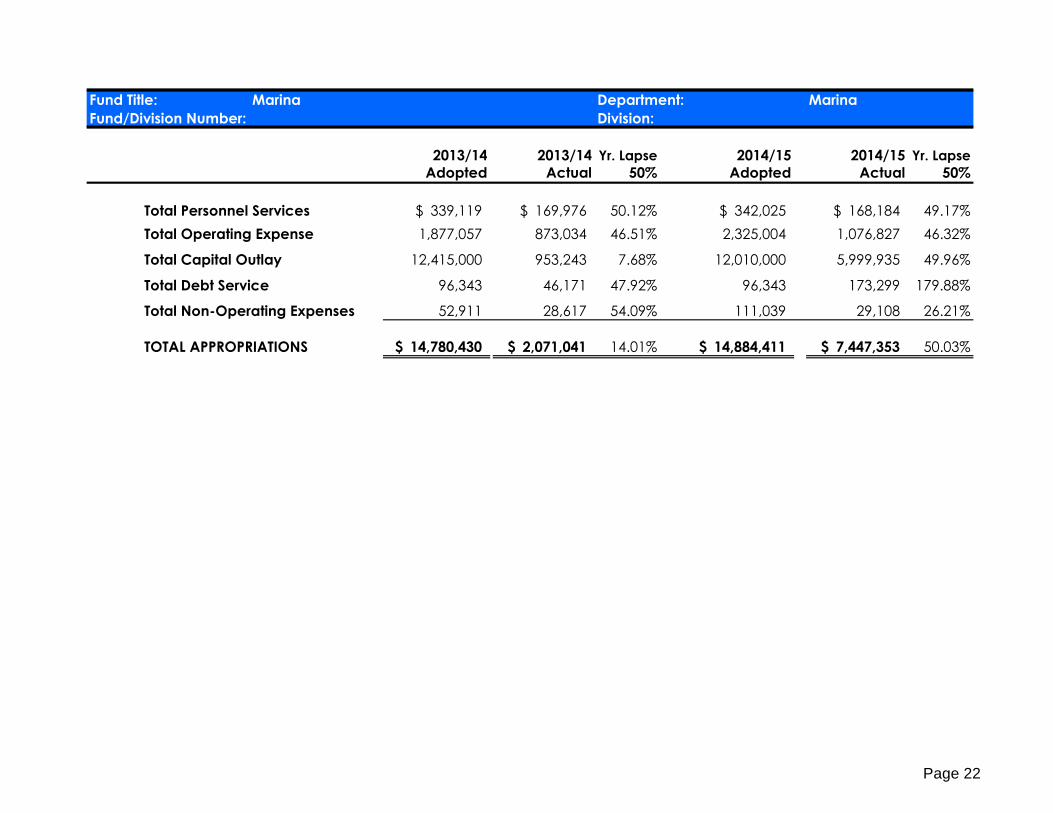
Fund Title: Marina Department: Marina
Fund/Division Number: Division:
2013/14 2013/14 Yr. Lapse 2014/15 2014/15 Yr. Lapse
Adopted Actual 50% Adopted Actual 50%
Total Personnel Services $ 339,119 $ 169,976 50.12% $ 342,025 $ 168,184 49.17%
Total Operating Expense 1,877,057 873,034 46.51% 2,325,004 1,076,827 46.32%
Total Capital Outlay 12,415,000 953,243 7.68% 12,010,000 5,999,935 49.96%
Total Debt Service 96,343 46,171 47.92% 96,343 173,299 179.88%
Total Non-Operating Expenses 52,911 28,617 54.09% 111,039 29,108 26.21%
TOTAL APPROPRIATIONS $ 14,780,430 $ 2,071,041 14.01% $ 14,884,411 $ 7,447,353 50.03%
Page 22
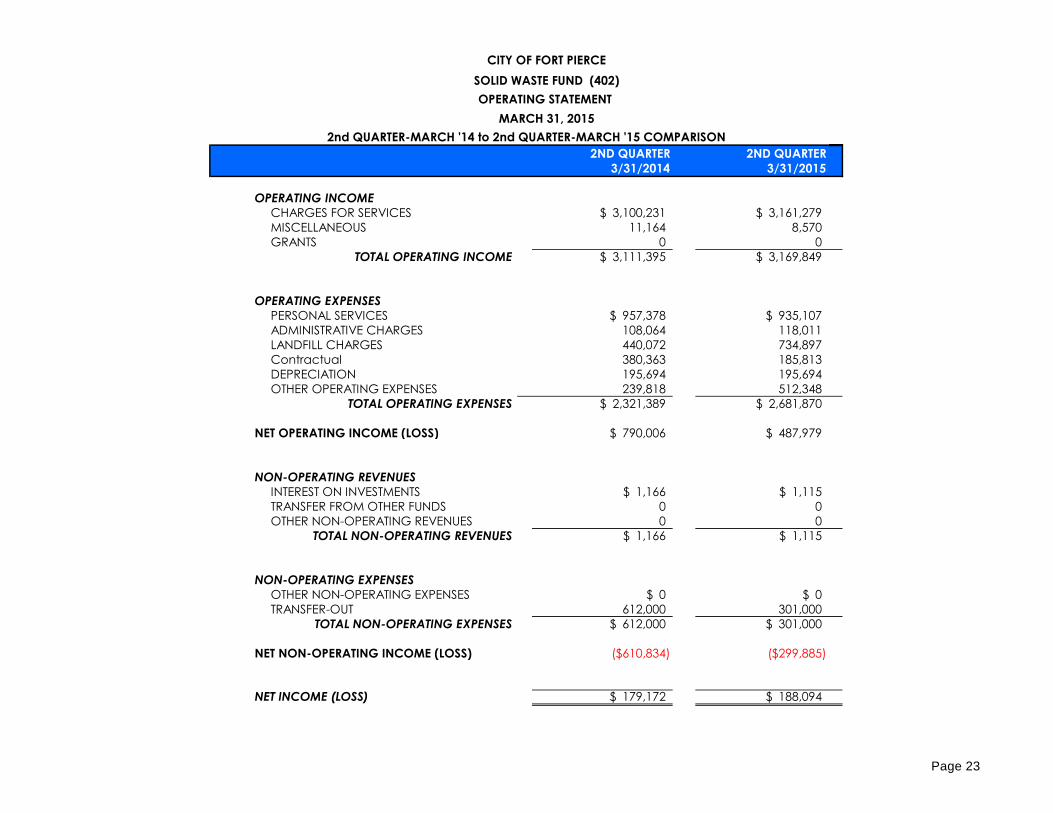
2ND QUARTER 2ND QUARTER
3/31/2014 3/31/2015
OPERATING INCOME
CHARGES FOR SERVICES $ 3,100,231 $ 3,161,279
MISCELLANEOUS 11,164 8,570
GRANTS 0 0
TOTAL OPERATING INCOME $ 3,111,395 $ 3,169,849
OPERATING EXPENSES
PERSONAL SERVICES $ 957,378 $ 935,107
ADMINISTRATIVE CHARGES 108,064 118,011
LANDFILL CHARGES 440,072 734,897
Contractual 380,363 185,813
DEPRECIATION 195,694 195,694
OTHER OPERATING EXPENSES 239,818 512,348
TOTAL OPERATING EXPENSES $ 2,321,389 $ 2,681,870
NET OPERATING INCOME (LOSS) $ 790,006 $ 487,979
NON-OPERATING REVENUES
INTEREST ON INVESTMENTS $ 1,166 $ 1,115
TRANSFER FROM OTHER FUNDS 0 0
OTHER NON-OPERATING REVENUES 0 0
TOTAL NON-OPERATING REVENUES $ 1,166 $ 1,115
NON-OPERATING EXPENSES
OTHER NON-OPERATING EXPENSES $ 0 $ 0
TRANSFER-OUT 612,000 301,000
TOTAL NON-OPERATING EXPENSES $ 612,000 $ 301,000
NET NON-OPERATING INCOME (LOSS) ($610,834) ($299,885)
NET INCOME (LOSS) $ 179,172 $ 188,094
CITY OF FORT PIERCE
SOLID WASTE FUND (402)
OPERATING STATEMENT
MARCH 31, 2015
2nd QUARTER-MARCH '14 to 2nd QUARTER-MARCH '15 COMPARISON
Page 23
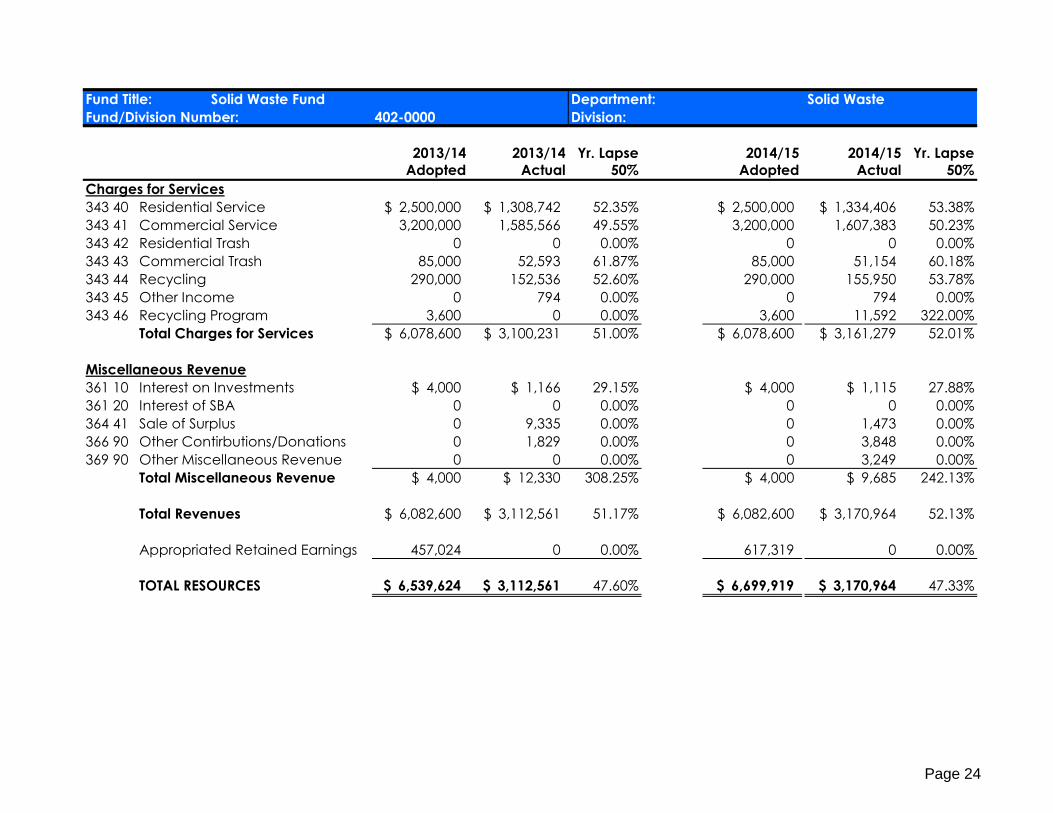
Fund Title: Solid Waste Fund Department: Solid Waste
Fund/Division Number: 402-0000 Division:
2013/14 2013/14 Yr. Lapse 2014/15 2014/15 Yr. Lapse
Adopted Actual 50% Adopted Actual 50%
Charges for Services
343 40 Residential Service $ 2,500,000 $ 1,308,742 52.35% $ 2,500,000 $ 1,334,406 53.38%
343 41 Commercial Service 3,200,000 1,585,566 49.55% 3,200,000 1,607,383 50.23%
343 42 Residential Trash 0 0 0.00% 0 0 0.00%
343 43 Commercial Trash 85,000 52,593 61.87% 85,000 51,154 60.18%
343 44 Recycling 290,000 152,536 52.60% 290,000 155,950 53.78%
343 45 Other Income 0 794 0.00% 0 794 0.00%
343 46 Recycling Program 3,600 0 0.00% 3,600 11,592 322.00%
Total Charges for Services $ 6,078,600 $ 3,100,231 51.00% $ 6,078,600 $ 3,161,279 52.01%
Miscellaneous Revenue
361 10 Interest on Investments $ 4,000 $ 1,166 29.15% $ 4,000 $ 1,115 27.88%
361 20 Interest of SBA 0 0 0.00% 0 0 0.00%
364 41 Sale of Surplus 0 9,335 0.00% 0 1,473 0.00%
366 90 Other Contirbutions/Donations 0 1,829 0.00% 0 3,848 0.00%
369 90 Other Miscellaneous Revenue 0 0 0.00% 0 3,249 0.00%
Total Miscellaneous Revenue $ 4,000 $ 12,330 308.25% $ 4,000 $ 9,685 242.13%
Total Revenues $ 6,082,600 $ 3,112,561 51.17% $ 6,082,600 $ 3,170,964 52.13%
Appropriated Retained Earnings 457,024 0 0.00% 617,319 0 0.00%
TOTAL RESOURCES $ 6,539,624 $ 3,112,561 47.60% $ 6,699,919 $ 3,170,964 47.33%
Page 24
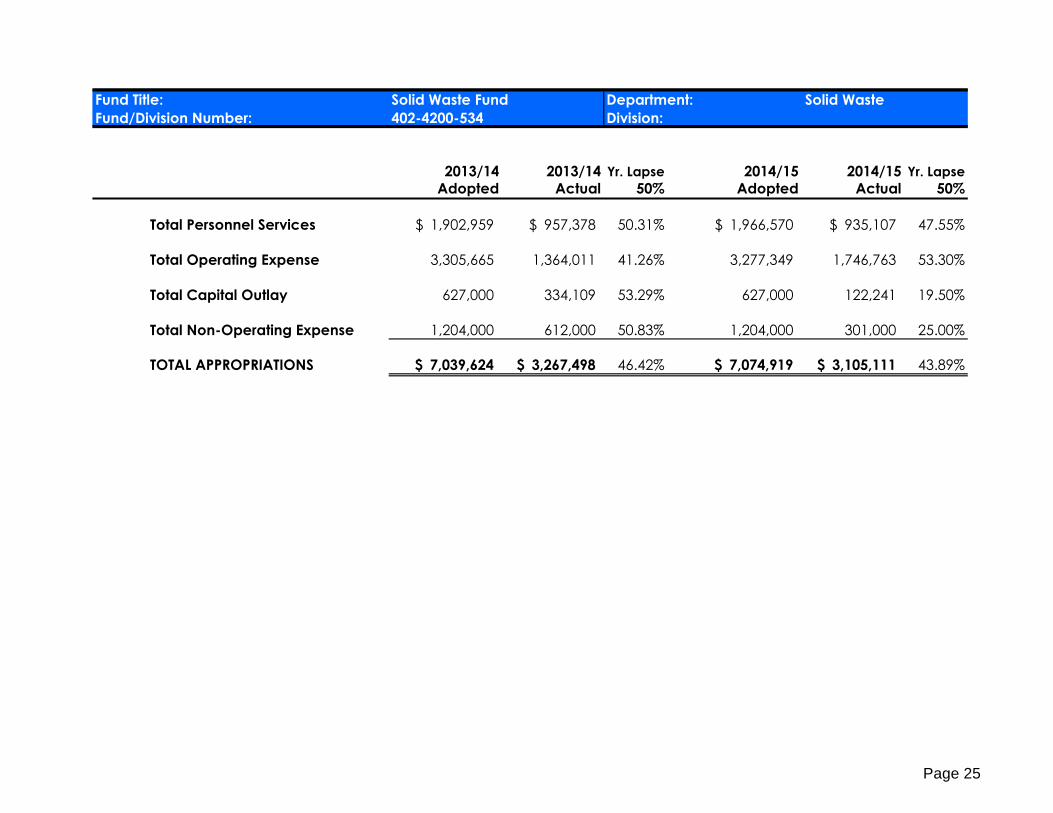
Fund Title: Solid Waste Fund Department: Solid Waste
Fund/Division Number: 402-4200-534 Division:
2013/14 2013/14 Yr. Lapse 2014/15 2014/15 Yr. Lapse
Adopted Actual 50% Adopted Actual 50%
Total Personnel Services $ 1,902,959 $ 957,378 50.31% $ 1,966,570 $ 935,107 47.55%
Total Operating Expense 3,305,665 1,364,011 41.26% 3,277,349 1,746,763 53.30%
Total Capital Outlay 627,000 334,109 53.29% 627,000 122,241 19.50%
Total Non-Operating Expense 1,204,000 612,000 50.83% 1,204,000 301,000 25.00%
TOTAL APPROPRIATIONS $ 7,039,624 $ 3,267,498 46.42% $ 7,074,919 $ 3,105,111 43.89%
Page 25
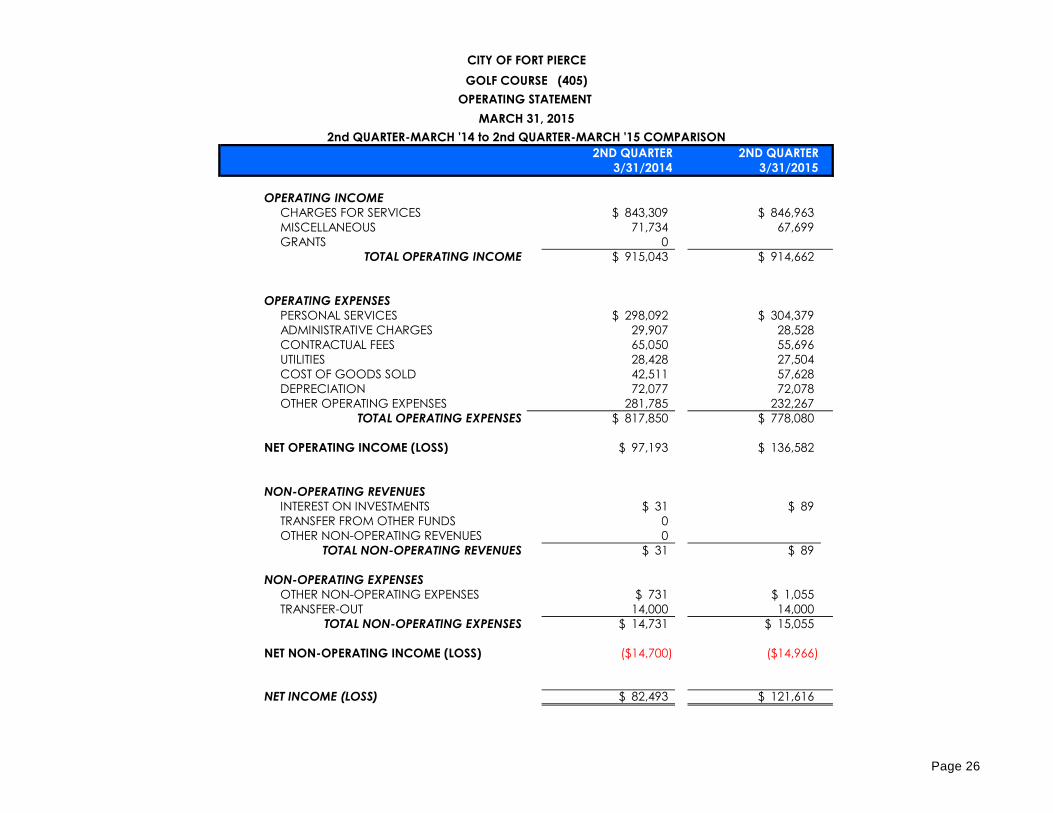
2ND QUARTER 2ND QUARTER
3/31/2014 3/31/2015
OPERATING INCOME
CHARGES FOR SERVICES $ 843,309 $ 846,963
MISCELLANEOUS 71,734 67,699
GRANTS 0
TOTAL OPERATING INCOME $ 915,043 $ 914,662
OPERATING EXPENSES
PERSONAL SERVICES $ 298,092 $ 304,379
ADMINISTRATIVE CHARGES 29,907 28,528
CONTRACTUAL FEES 65,050 55,696
UTILITIES 28,428 27,504
COST OF GOODS SOLD 42,511 57,628
DEPRECIATION 72,077 72,078
OTHER OPERATING EXPENSES 281,785 232,267
TOTAL OPERATING EXPENSES $ 817,850 $ 778,080
NET OPERATING INCOME (LOSS) $ 97,193 $ 136,582
NON-OPERATING REVENUES
INTEREST ON INVESTMENTS $ 31 $ 89
TRANSFER FROM OTHER FUNDS 0
OTHER NON-OPERATING REVENUES 0
TOTAL NON-OPERATING REVENUES $ 31 $ 89
NON-OPERATING EXPENSES
OTHER NON-OPERATING EXPENSES $ 731 $ 1,055
TRANSFER-OUT 14,000 14,000
TOTAL NON-OPERATING EXPENSES $ 14,731 $ 15,055
NET NON-OPERATING INCOME (LOSS) ($14,700) ($14,966)
NET INCOME (LOSS) $ 82,493 $ 121,616
CITY OF FORT PIERCE
GOLF COURSE (405)
OPERATING STATEMENT
MARCH 31, 2015
2nd QUARTER-MARCH '14 to 2nd QUARTER-MARCH '15 COMPARISON
Page 26
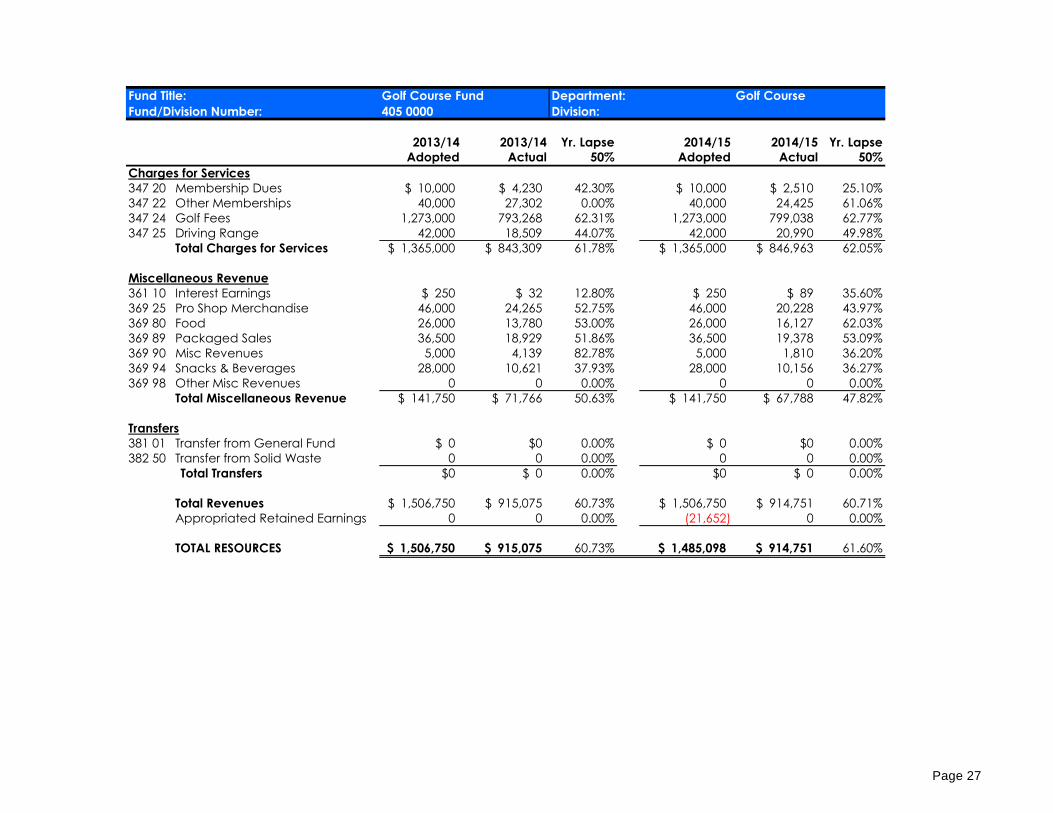
Fund Title: Golf Course Fund Department: Golf Course
Fund/Division Number: 405 0000 Division:
2013/14 2013/14 Yr. Lapse 2014/15 2014/15 Yr. Lapse
Adopted Actual 50% Adopted Actual 50%
Charges for Services
347 20 Membership Dues $ 10,000 $ 4,230 42.30% $ 10,000 $ 2,510 25.10%
347 22 Other Memberships 40,000 27,302 0.00% 40,000 24,425 61.06%
347 24 Golf Fees 1,273,000 793,268 62.31% 1,273,000 799,038 62.77%
347 25 Driving Range 42,000 18,509 44.07% 42,000 20,990 49.98%
Total Charges for Services $ 1,365,000 $ 843,309 61.78% $ 1,365,000 $ 846,963 62.05%
Miscellaneous Revenue
361 10 Interest Earnings $ 250 $ 32 12.80% $ 250 $ 89 35.60%
369 25 Pro Shop Merchandise 46,000 24,265 52.75% 46,000 20,228 43.97%
369 80 Food 26,000 13,780 53.00% 26,000 16,127 62.03%
369 89 Packaged Sales 36,500 18,929 51.86% 36,500 19,378 53.09%
369 90 Misc Revenues 5,000 4,139 82.78% 5,000 1,810 36.20%
369 94 Snacks & Beverages 28,000 10,621 37.93% 28,000 10,156 36.27%
369 98 Other Misc Revenues 0 0 0.00% 0 0 0.00%
Total Miscellaneous Revenue $ 141,750 $ 71,766 50.63% $ 141,750 $ 67,788 47.82%
Transfers
381 01 Transfer from General Fund $ 0 $0 0.00% $ 0 $0 0.00%
382 50 Transfer from Solid Waste 0 0 0.00% 0 0 0.00%
Total Transfers $0 $ 0 0.00% $0 $ 0 0.00%
Total Revenues $ 1,506,750 $ 915,075 60.73% $ 1,506,750 $ 914,751 60.71%
Appropriated Retained Earnings 0 0 0.00% (21,652) 0 0.00%
TOTAL RESOURCES $ 1,506,750 $ 915,075 60.73% $ 1,485,098 $ 914,751 61.60%
* Authorized Authorized Authorized Authorized Authorized Authorized Authorized Authorized Authorized Authorized Authorized Authorized Authorized Authorized Authorized Authorized Authorized Authorized Authorized Authorized Authorized Authorized Authorized Authorized Authorized Authorized Authorized Authorized Authorized Authorized Authorized Authorized Authorized Authorized Authorized Authorized Neighbo Authorized Authorized Authorized Authorized Authorized Authorized Authorized Authorized Authorized Authorized Authorized Authorized Authorized Authorized Authorized Authorized Authorized Authorized Authorized Authorized Authorized Authorized Authorized Authorized Authorized Authorized Authorized Authorized Authorized Authorized Authorized Authorized Authorized Authorized Authorized Authorized Authorized Authorized Authorized Authorized Authorized Authorized Authorized Authorized Authorized Authorized Authorized Authorized Authorized Authorized Authorized Authorized Authorized Authorized Authorized Authorized Authorized Authorized Authorized Authorized Authorized Authorized Authorized Authorized Authorized Authorized Authorized Authorized Authorized Authorized Authorized Authorized Authorized Authorized Authorized Authorized Authorized Authorized Authorized Authorized Authorized Authorized Authorized Authorized Authorized Authorized Authorized Authorized Authorized Authorized Authorized Authorized Authorized Authorized Authorized Authorized Authorized Authorized Authorized Authorized Authorized Authorized Authorized Authorized Authorized Authorized Authorized Authorized Authorized Authorized Authorized Authorized Authorized Authorized Authorized Authorized Authorized Authorized Authorized Authorized Authorized Authorized Authorized Authorized Authorized Authorized Authorized Authorized Authorized Authorized Authorized Authorized Authorized Authorized Authorized Authorized Authorized Authorized Authorized Authorized Authorized Authorized Authorized Authorized Authorized Authorized Authorized Authorized Authorized Authorized Authorized Authorized Authorized Authorized Authorized Authorized Authorized Authorized Authorized Authorized Authorized Authorized Authorized Authorized Authorized Authorized Authorized Authorized Authorized Authorized Authorized Authorized Authorized Authorized Authorized Authorized Authorized Authorized Authorized Authorized Authorized Authorized Authorized Authorized Authorized Authorized Authorized Authorized Authorized Authorized Authorized Authorized Authorized Authorized Authorized Authorized Authorized Authorized Authorized Authorized Authorized Authorized Authorized Authorized Authorized Authorized Authorized Authorized Authorized Authorized Authorized Authorized Authorized Authorized Authorized Authorized Authorized Authorized Authorized Authorized Authorized Authorized Authorized Authorized Authorized Authorized Authorized Authorized Authorized Authorized Authorized Authorized Authorized Authorized Authorized Authorized Authorized Authorized Authorized Authorized Authorized Authorized Authorized Authorized Authorized Authorized Authorized Authorized Authorized Authorized Authorized Authorized Authorized Authorized Authorized Authorized Authorized Authorized Authorized Authorized Authorized Authorized Authorized Authorized Authorized Authorized Authorized Authorized Authorized Authorized Authorized Authorized Authorized Authorized Authorized Authorized Authorized Authorized Authorized Authorized Authorized Authorized Authorized Authorized Authorized Authorized Authorized Authorized Authorized Authorized Authorized Authorized Authorized Authorized Authorized Authorized Authorized Authorized Authorized Authorized Authorized Authorized Authorized Authorized Authorized Authorized Authorized Authorized Authorized Authorized Authorized Authorized Authorized Authorized Authorized Authorized Authorized Authorized Authorized Authorized Authorized Authorized Authorized Authorized Authorized Authorized Authorized Authorized Authorized Authorized Authorized Authorized Authorized Authorized Authorized Authorized Authorized Authorized Authorized Authorized Authorized Authorized Authorized Authorized Authorized Authorized Authorized Authorized Authorized Authorized Authorized Authorized Authorized Authorized Authorized Authorized Authorized Authorized Authorized Authorized Authorized Authorized Authorized Authorized Authorized Authorized Authorized Authorized Authorized Authorized Authorized Authorized Authorized Authorized Authorized Authorized Authorized Authorized Authorized Authorized Authorized Authorized Authorized Authorized Authorized Authorized Authorized Authorized Authorized Authorized Authorized Authorized Authorized Authorized Authorized Authorized Authorized Authorized Authorized Authorized Authorized
Page 27
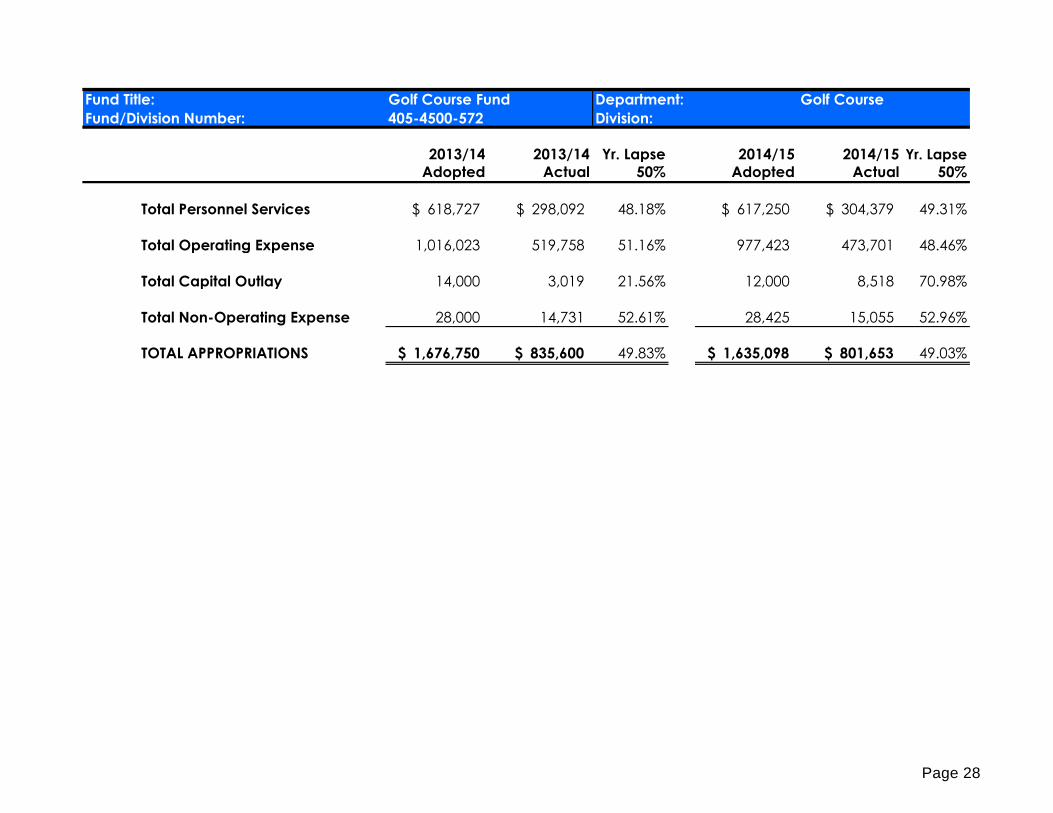
Fund Title: Golf Course Fund Department: Golf Course
Fund/Division Number: 405-4500-572 Division:
2013/14 2013/14 Yr. Lapse 2014/15 2014/15 Yr. Lapse
Adopted Actual 50% Adopted Actual 50%
Total Personnel Services $ 618,727 $ 298,092 48.18% $ 617,250 $ 304,379 49.31%
Total Operating Expense 1,016,023 519,758 51.16% 977,423 473,701 48.46%
Total Capital Outlay 14,000 3,019 21.56% 12,000 8,518 70.98%
Total Non-Operating Expense 28,000 14,731 52.61% 28,425 15,055 52.96%
TOTAL APPROPRIATIONS $ 1,676,750 $ 835,600 49.83% $ 1,635,098 $ 801,653 49.03%
Page 28
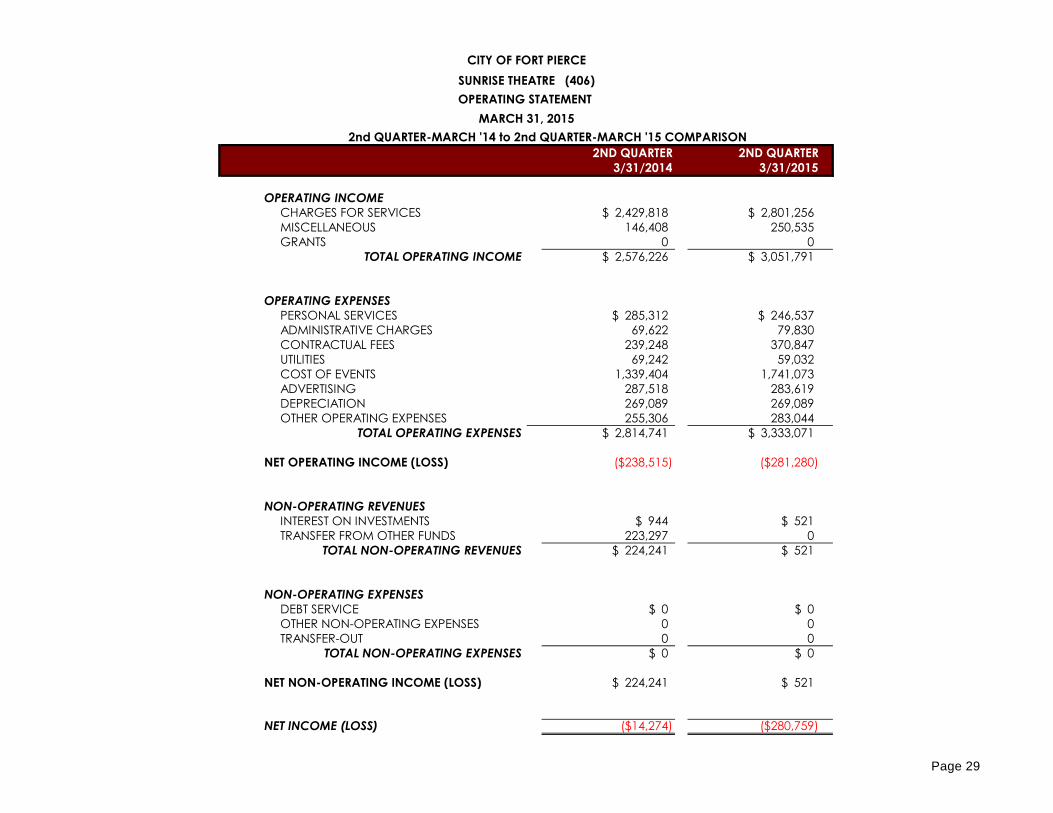
2ND QUARTER 2ND QUARTER
3/31/2014 3/31/2015
OPERATING INCOME
CHARGES FOR SERVICES $ 2,429,818 $ 2,801,256
MISCELLANEOUS 146,408 250,535
GRANTS 0 0
TOTAL OPERATING INCOME $ 2,576,226 $ 3,051,791
OPERATING EXPENSES
PERSONAL SERVICES $ 285,312 $ 246,537
ADMINISTRATIVE CHARGES 69,622 79,830
CONTRACTUAL FEES 239,248 370,847
UTILITIES 69,242 59,032
COST OF EVENTS 1,339,404 1,741,073
ADVERTISING 287,518 283,619
DEPRECIATION 269,089 269,089
OTHER OPERATING EXPENSES 255,306 283,044
TOTAL OPERATING EXPENSES $ 2,814,741 $ 3,333,071
NET OPERATING INCOME (LOSS) ($238,515) ($281,280)
NON-OPERATING REVENUES
INTEREST ON INVESTMENTS $ 944 $ 521
TRANSFER FROM OTHER FUNDS 223,297 0
TOTAL NON-OPERATING REVENUES $ 224,241 $ 521
NON-OPERATING EXPENSES
DEBT SERVICE $ 0 $ 0
OTHER NON-OPERATING EXPENSES 0 0
TRANSFER-OUT 0 0
TOTAL NON-OPERATING EXPENSES $ 0 $ 0
NET NON-OPERATING INCOME (LOSS) $ 224,241 $ 521
NET INCOME (LOSS) ($14,274) ($280,759)
CITY OF FORT PIERCE
SUNRISE THEATRE (406)
OPERATING STATEMENT
MARCH 31, 2015
2nd QUARTER-MARCH '14 to 2nd QUARTER-MARCH '15 COMPARISON
Page 29
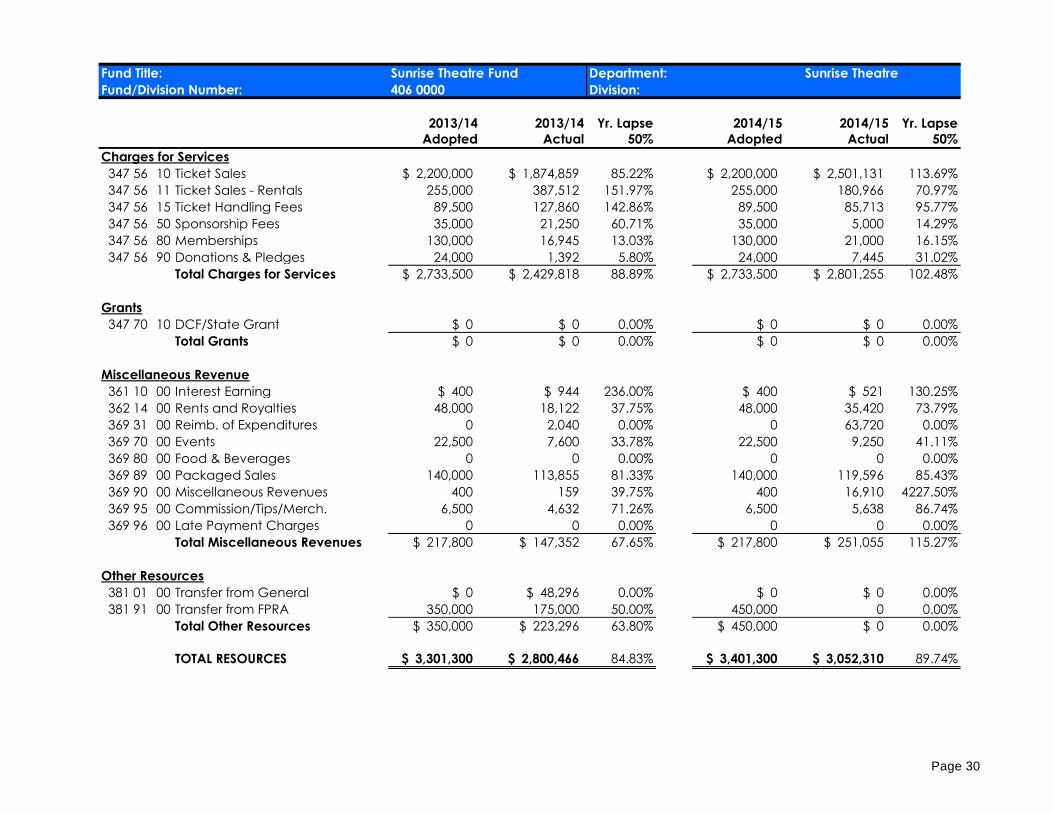
Fund Title: Sunrise Theatre Fund Department: Sunrise Theatre
Fund/Division Number: 406 0000 Division:
2013/14 2013/14 Yr. Lapse 2014/15 2014/15 Yr. Lapse
Adopted Actual 50% Adopted Actual 50%
Charges for Services
347 56 10 Ticket Sales $ 2,200,000 $ 1,874,859 85.22% $ 2,200,000 $ 2,501,131 113.69%
347 56 11 Ticket Sales - Rentals 255,000 387,512 151.97% 255,000 180,966 70.97%
347 56 15 Ticket Handling Fees 89,500 127,860 142.86% 89,500 85,713 95.77%
347 56 50 Sponsorship Fees 35,000 21,250 60.71% 35,000 5,000 14.29%
347 56 80 Memberships 130,000 16,945 13.03% 130,000 21,000 16.15%
347 56 90 Donations & Pledges 24,000 1,392 5.80% 24,000 7,445 31.02%
Total Charges for Services $ 2,733,500 $ 2,429,818 88.89% $ 2,733,500 $ 2,801,255 102.48%
Grants
347 70 10 DCF/State Grant $ 0 $ 0 0.00% $ 0 $ 0 0.00%
Total Grants $ 0 $ 0 0.00% $ 0 $ 0 0.00%
Miscellaneous Revenue
361 10 00 Interest Earning $ 400 $ 944 236.00% $ 400 $ 521 130.25%
362 14 00 Rents and Royalties 48,000 18,122 37.75% 48,000 35,420 73.79%
369 31 00 Reimb. of Expenditures 0 2,040 0.00% 0 63,720 0.00%
369 70 00 Events 22,500 7,600 33.78% 22,500 9,250 41.11%
369 80 00 Food & Beverages 0 0 0.00% 0 0 0.00%
369 89 00 Packaged Sales 140,000 113,855 81.33% 140,000 119,596 85.43%
369 90 00 Miscellaneous Revenues 400 159 39.75% 400 16,910 4227.50%
369 95 00 Commission/Tips/Merch. 6,500 4,632 71.26% 6,500 5,638 86.74%
369 96 00 Late Payment Charges 0 0 0.00% 0 0 0.00%
Total Miscellaneous Revenues $ 217,800 $ 147,352 67.65% $ 217,800 $ 251,055 115.27%
Other Resources
381 01 00 Transfer from General $ 0 $ 48,296 0.00% $ 0 $ 0 0.00%
381 91 00 Transfer from FPRA 350,000 175,000 50.00% 450,000 0 0.00%
Total Other Resources $ 350,000 $ 223,296 63.80% $ 450,000 $ 0 0.00%
TOTAL RESOURCES $ 3,301,300 $ 2,800,466 84.83% $ 3,401,300 $ 3,052,310 89.74%
Page 30
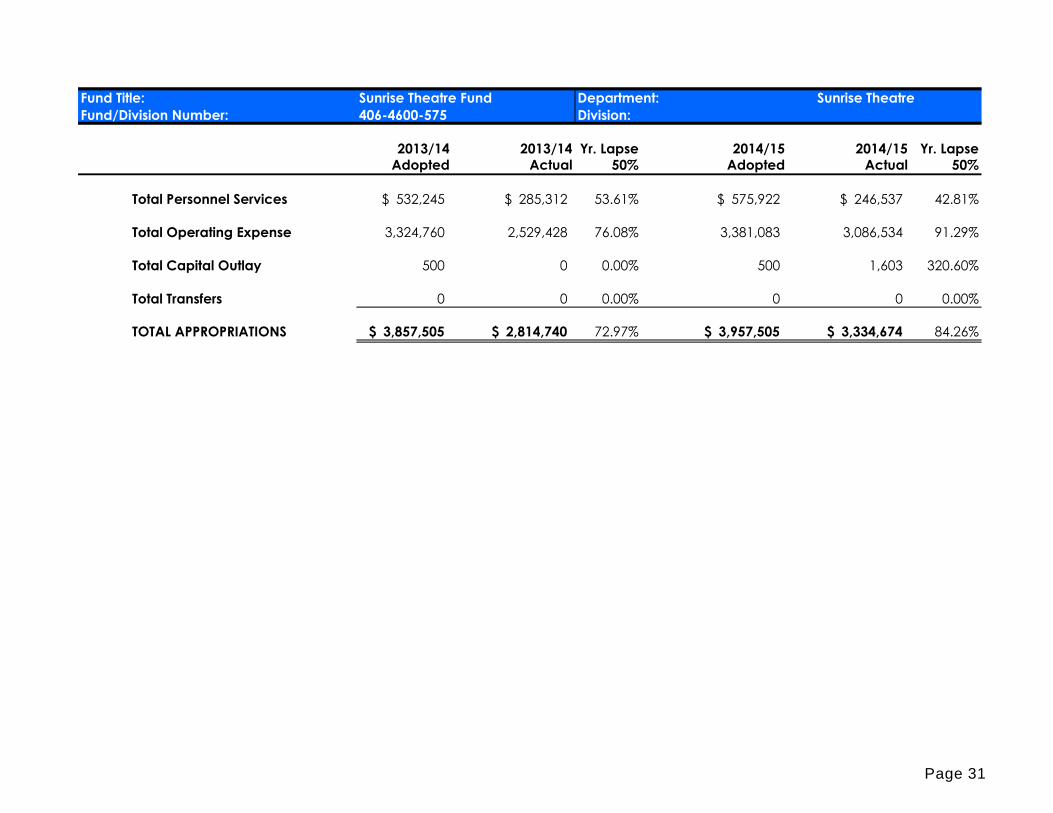
Fund Title: Sunrise Theatre Fund Department: Sunrise Theatre
Fund/Division Number: 406-4600-575 Division:
2013/14 2013/14 Yr. Lapse 2014/15 2014/15 Yr. Lapse
Adopted Actual 50% Adopted Actual 50%
Total Personnel Services $ 532,245 $ 285,312 53.61% $ 575,922 $ 246,537 42.81%
Total Operating Expense 3,324,760 2,529,428 76.08% 3,381,083 3,086,534 91.29%
Total Capital Outlay 500 0 0.00% 500 1,603 320.60%
Total Transfers 0 0 0.00% 0 0 0.00%
TOTAL APPROPRIATIONS $ 3,857,505 $ 2,814,740 72.97% $ 3,957,505 $ 3,334,674 84.26%
Page 31
2ND QUARTER
3/31/2014
2ND QUARTER
3/31/2015
OPERATING INCOME
LICENSE and PERMIT $ 500,504 $ 377,177
CHARGES FOR SERVICES 7,062 7,142
FINES & FORFEITS 0 200
MISCELLANEOUS 14,753 10,231
TOTAL OPERATING INCOME $ 522,319 $ 394,750
OPERATING EXPENSES
PERSONAL SERVICES $ 365,462 $ 304,367
ADMINISTRATIVE CHARGES 47,451 44,757
CONTRACTUAL FEES 10,264 81,540
DEPRECIATION 2,500 2,500
OTHER OPERATING EXPENSES 64,564 64,770
TOTAL OPERATING EXPENSES $ 490,241 $ 497,934
NET OPERATING INCOME (LOSS) $ 32,078 ($103,184)
NON-OPERATING REVENUES
INTEREST ON INVESTMENTS $ 247 $ 470
TRANSFER FROM OTHER FUNDS 0 0
OTHER NON-OPERATING REVENUES 0 0
TOTAL NON-OPERATING REVENUES $ 247 $ 470
NON-OPERATING EXPENSES
DEBT SERVICE $ 0 $ 0
OTHER NON-OPERATING EXPENSES 0 0
TRANSFER-OUT 0 0
TOTAL NON-OPERATING EXPENSES $ 0 $ 0
NET NON-OPERATING INCOME (LOSS) $ 247 $ 470
NET INCOME (LOSS) $ 32,325 ($102,714)
CITY OF FORT PIERCE
BUILDING & CODE (420)
OPERATING STATEMENT
MARCH 31, 20152nd QUARTER-MARCH '14 to 2nd QUARTER-MARCH '15 COMPARISON
Page 32
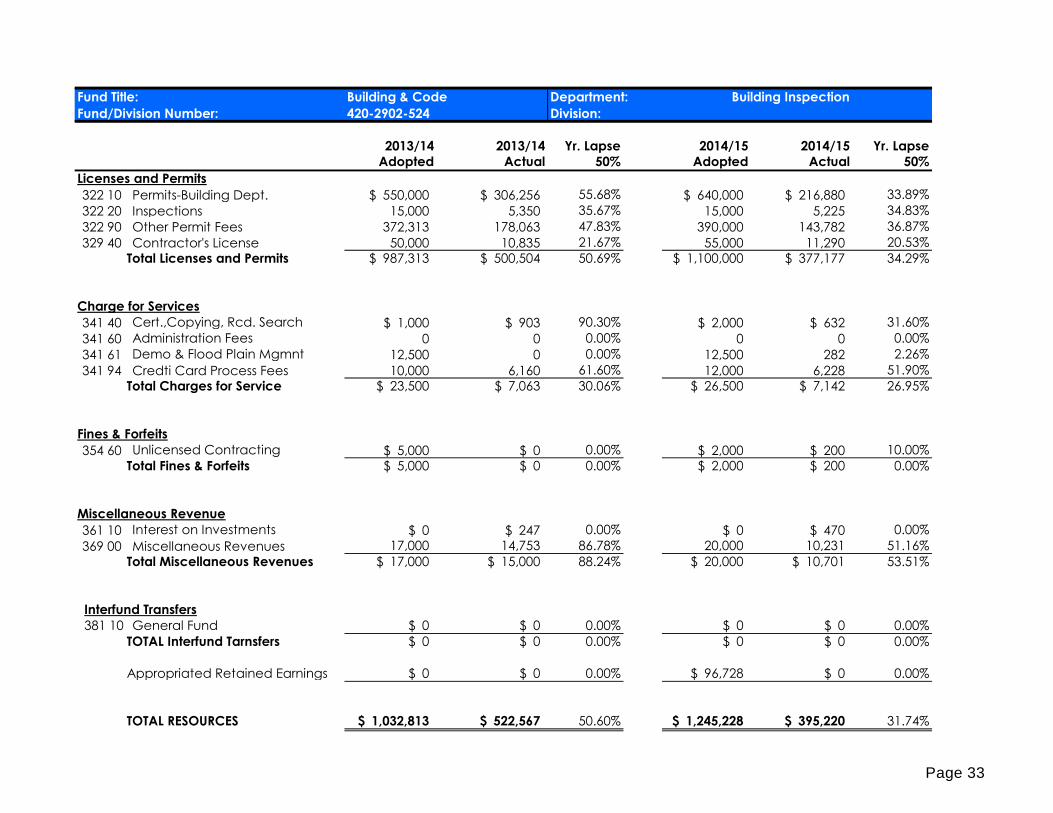
Fund Title: Building & Code Department: Building Inspection
Fund/Division Number: 420-2902-524 Division:
2013/14 2013/14 Yr. Lapse 2014/15 2014/15 Yr. Lapse
Adopted Actual 50% Adopted Actual 50%
Licenses and Permits
322 10 Permits-Building Dept. $ 550,000 $ 306,256 55.68% $ 640,000 $ 216,880 33.89%
322 20 Inspections 15,000 5,350 35.67% 15,000 5,225 34.83%
322 90 Other Permit Fees 372,313 178,063 47.83% 390,000 143,782 36.87%
329 40 Contractor's License 50,000 10,835 21.67% 55,000 11,290 20.53%
Total Licenses and Permits $ 987,313 $ 500,504 50.69% $ 1,100,000 $ 377,177 34.29%
Charge for Services
341 40 Cert.,Copying, Rcd. Search $ 1,000 $ 903 90.30% $ 2,000 $ 632 31.60%
341 60 Administration Fees 0 0 0.00% 0 0 0.00%
341 61 Demo & Flood Plain Mgmnt 12,500 0 0.00% 12,500 282 2.26%
341 94 Credti Card Process Fees 10,000 6,160 61.60% 12,000 6,228 51.90%
Total Charges for Service $ 23,500 $ 7,063 30.06% $ 26,500 $ 7,142 26.95%
Fines & Forfeits
354 60 Unlicensed Contracting $ 5,000 $ 0 0.00% $ 2,000 $ 200 10.00%
Total Fines & Forfeits $ 5,000 $ 0 0.00% $ 2,000 $ 200 0.00%
Miscellaneous Revenue
361 10 Interest on Investments $ 0 $ 247 0.00% $ 0 $ 470 0.00%
369 00 Miscellaneous Revenues 17,000 14,753 86.78% 20,000 10,231 51.16%
Total Miscellaneous Revenues $ 17,000 $ 15,000 88.24% $ 20,000 $ 10,701 53.51%
Interfund Transfers
381 10 General Fund $ 0 $ 0 0.00% $ 0 $ 0 0.00%
TOTAL Interfund Tarnsfers $ 0 $ 0 0.00% $ 0 $ 0 0.00%
Appropriated Retained Earnings $ 0 $ 0 0.00% $ 96,728 $ 0 0.00%
TOTAL RESOURCES $ 1,032,813 $ 522,567 50.60% $ 1,245,228 $ 395,220 31.74%
Page 33
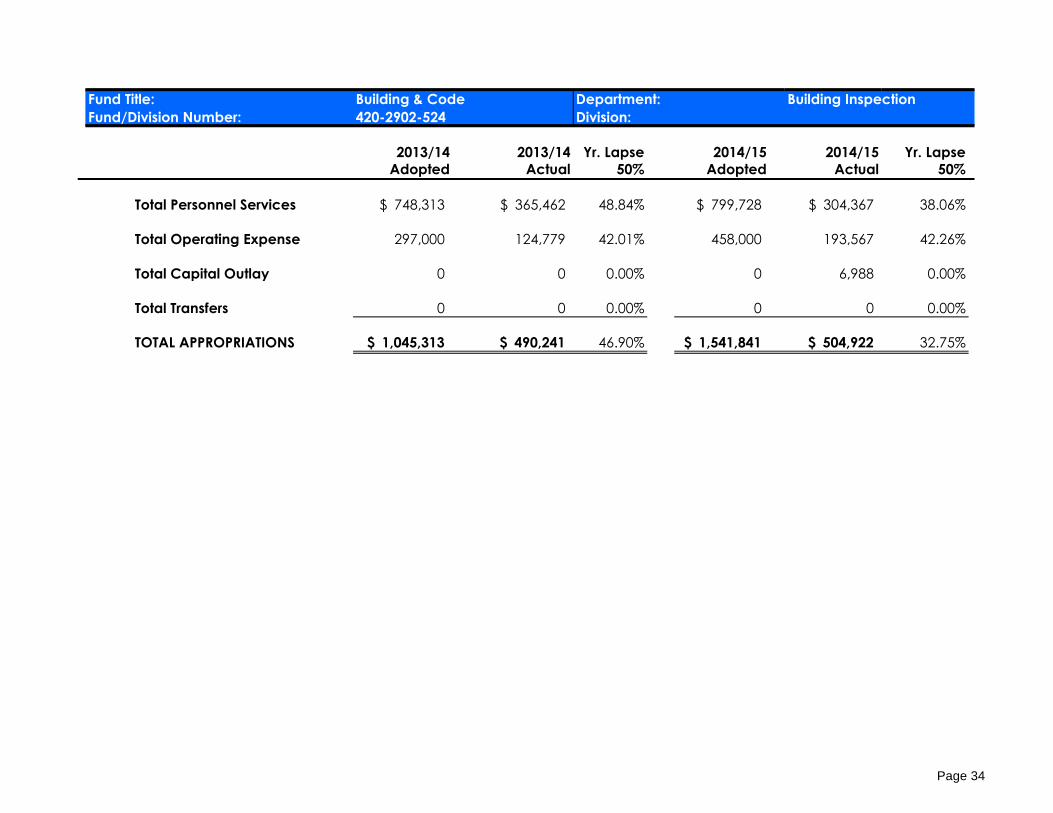
Fund Title: Building & Code Department: Building Inspection
Fund/Division Number: 420-2902-524 Division:
2013/14 2013/14 Yr. Lapse 2014/15 2014/15 Yr. Lapse
Adopted Actual 50% Adopted Actual 50%
Total Personnel Services $ 748,313 $ 365,462 48.84% $ 799,728 $ 304,367 38.06%
Total Operating Expense 297,000 124,779 42.01% 458,000 193,567 42.26%
Total Capital Outlay 0 0 0.00% 0 6,988 0.00%
Total Transfers 0 0 0.00% 0 0 0.00%
TOTAL APPROPRIATIONS $ 1,045,313 $ 490,241 46.90% $ 1,541,841 $ 504,922 32.75%
Page 34
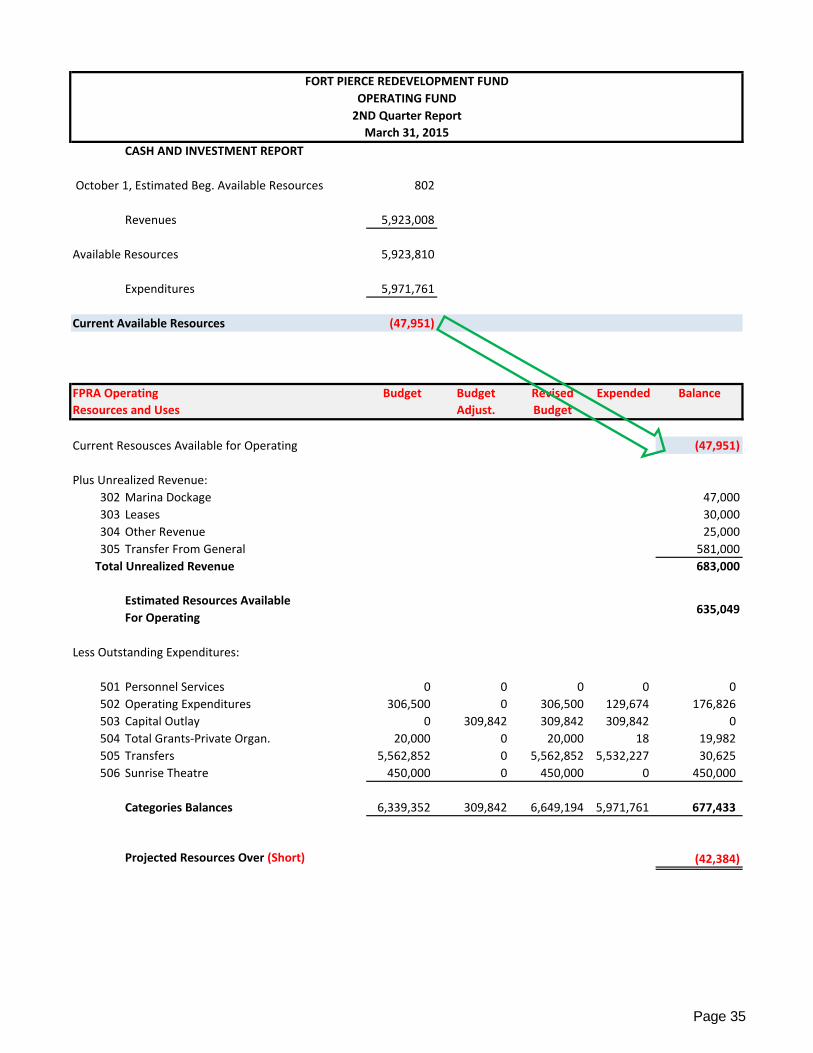
CASH AND INVESTMENT REPORT
October 1, Estimated Beg. Available Resources 802
Revenues 5,923,008
Available Resources 5,923,810
Expenditures 5,971,761
Current Available Resources (47,951)
FPRA Operating Budget Budget Revised Expended Balance
Resources and Uses Adjust. Budget
Current Resousces Available for Operating (47,951)
Plus Unrealized Revenue:
302 Marina Dockage 47,000
303 Leases 30,000
304 Other Revenue 25,000
305 Transfer From General 581,000
Total Unrealized Revenue 683,000
Estimated Resources Available
For Operating635,049
Less Outstanding Expenditures:
501 Personnel Services 0 0 0 0 0
502 Operating Expenditures 306,500 0 306,500 129,674 176,826
503 Capital Outlay 0 309,842 309,842 309,842 0
504 Total Grants-Private Organ. 20,000 0 20,000 18 19,982
505 Transfers 5,562,852 0 5,562,852 5,532,227 30,625
506 Sunrise Theatre 450,000 0 450,000 0 450,000
Categories Balances 6,339,352 309,842 6,649,194 5,971,761 677,433
Projected Resources Over (Short) (42,384)
FORT PIERCE REDEVELOPMENT FUND
OPERATING FUND
2ND Quarter Report
March 31, 2015
Page 35
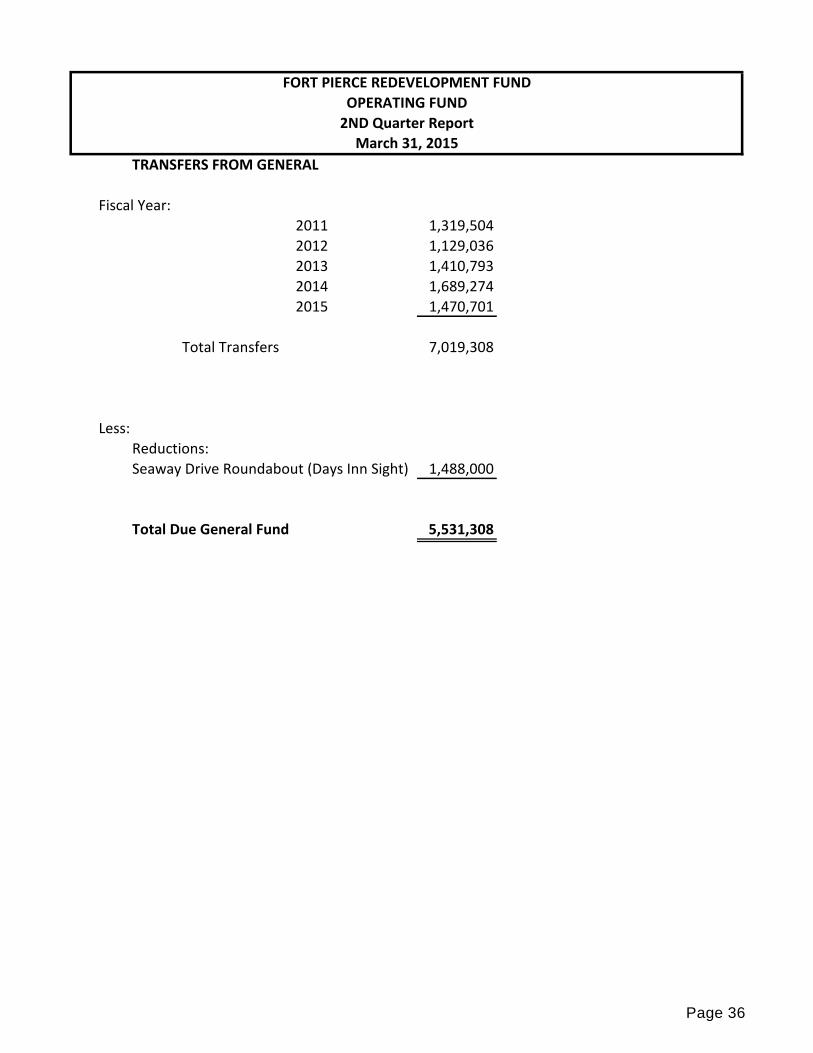
TRANSFERS FROM GENERAL
Fiscal Year:
2011 1,319,504
2012 1,129,036
2013 1,410,793
2014 1,689,274
2015 1,470,701
Total Transfers 7,019,308
Less:
Reductions:
Seaway Drive Roundabout (Days Inn Sight) 1,488,000
Total Due General Fund 5,531,308
FORT PIERCE REDEVELOPMENT FUND
OPERATING FUND
2ND Quarter Report
March 31, 2015
Page 36
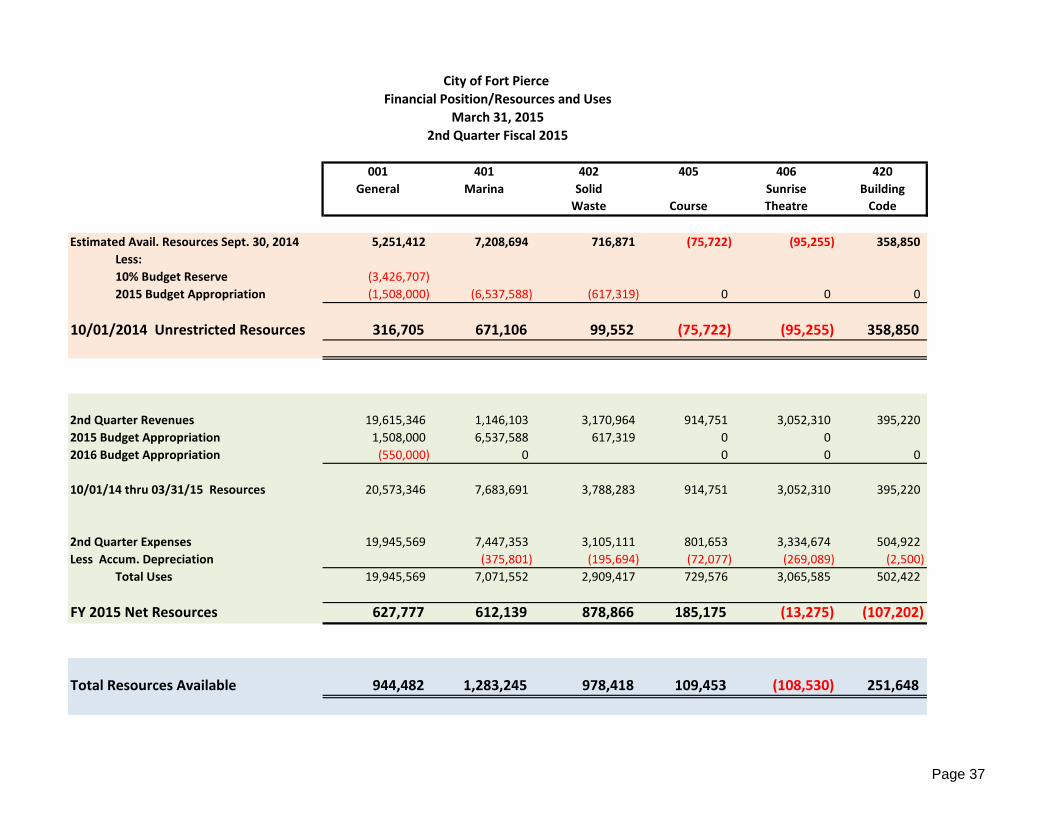
001 401 402 405 406 420
General Marina Solid Sunrise Building
Waste Course Theatre Code
Estimated Avail. Resources Sept. 30, 2014 5,251,412 7,208,694 716,871 (75,722) (95,255) 358,850
Less:
10% Budget Reserve (3,426,707)
2015 Budget Appropriation (1,508,000) (6,537,588) (617,319) 0 0 0
10/01/2014 Unrestricted Resources 316,705 671,106 99,552 (75,722) (95,255) 358,850
2nd Quarter Revenues 19,615,346 1,146,103 3,170,964 914,751 3,052,310 395,220
2015 Budget Appropriation 1,508,000 6,537,588 617,319 0 0
2016 Budget Appropriation (550,000) 0 0 0 0
10/01/14 thru 03/31/15 Resources 20,573,346 7,683,691 3,788,283 914,751 3,052,310 395,220
2nd Quarter Expenses 19,945,569 7,447,353 3,105,111 801,653 3,334,674 504,922
Less Accum. Depreciation (375,801) (195,694) (72,077) (269,089) (2,500)
Total Uses 19,945,569 7,071,552 2,909,417 729,576 3,065,585 502,422
FY 2015 Net Resources 627,777 612,139 878,866 185,175 (13,275) (107,202)
Total Resources Available 944,482 1,283,245 978,418 109,453 (108,530) 251,648
City of Fort Pierce
Financial Position/Resources and Uses
March 31, 2015
2nd Quarter Fiscal 2015
Page 37
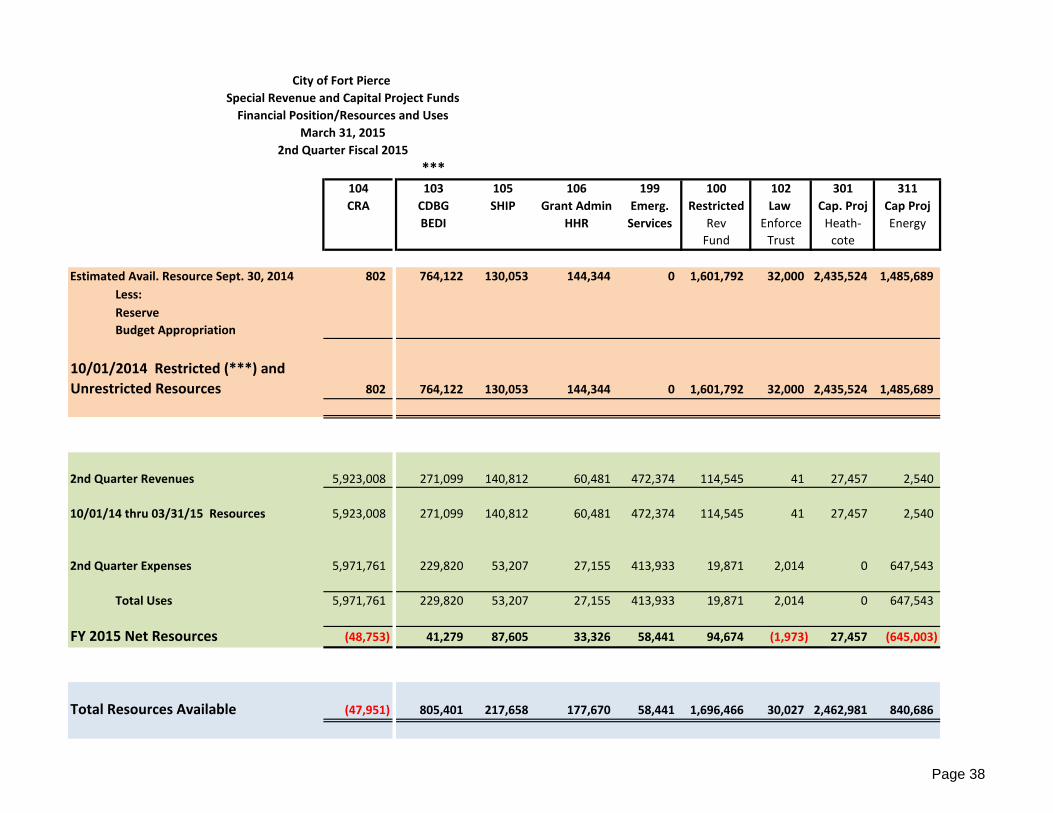
***104 103 105 106 199 100 102 301 311
CRA CDBG SHIP Grant Admin Emerg. Restricted Law Cap. Proj Cap Proj
BEDI HHR Services Rev Enforce Heath- Energy
Fund Trust cote
Estimated Avail. Resource Sept. 30, 2014 802 764,122 130,053 144,344 0 1,601,792 32,000 2,435,524 1,485,689
Less:
Reserve
Budget Appropriation
802 764,122 130,053 144,344 0 1,601,792 32,000 2,435,524 1,485,689
2nd Quarter Revenues 5,923,008 271,099 140,812 60,481 472,374 114,545 41 27,457 2,540
10/01/14 thru 03/31/15 Resources 5,923,008 271,099 140,812 60,481 472,374 114,545 41 27,457 2,540
2nd Quarter Expenses 5,971,761 229,820 53,207 27,155 413,933 19,871 2,014 0 647,543
Total Uses 5,971,761 229,820 53,207 27,155 413,933 19,871 2,014 0 647,543
FY 2015 Net Resources (48,753) 41,279 87,605 33,326 58,441 94,674 (1,973) 27,457 (645,003)
Total Resources Available (47,951) 805,401 217,658 177,670 58,441 1,696,466 30,027 2,462,981 840,686
10/01/2014 Restricted (***) and
Unrestricted Resources
City of Fort Pierce
Special Revenue and Capital Project Funds
Financial Position/Resources and Uses
March 31, 2015
2nd Quarter Fiscal 2015
Page 38
Related Documents


![Ft. Pierce News. (Fort Pierce, Florida) 1908-09-18 [p ].ufdcimages.uflib.ufl.edu/UF/00/07/59/02/00045/00342.pdf · 2009-02-15 · Mediumft NEVSV PIERCE PIERCE Advertising FORT NESYS](https://static.cupdf.com/doc/110x72/5e591dc205bef650112fc4c5/ft-pierce-news-fort-pierce-florida-1908-09-18-p-2009-02-15-mediumft-nevsv.jpg)


![Ft. Pierce News. (Fort Pierce, Florida) 1911-05-26 [p ].ufdcimages.uflib.ufl.edu/UF/00/07/59/02/00159/01256.pdf · 1f waFIIIvr-F IlfJl ftCxknurrnilaer11rb NSURANCI PIERCE PIERCE SWcctl](https://static.cupdf.com/doc/110x72/5e8383ff7da5cc3259330f06/ft-pierce-news-fort-pierce-florida-1911-05-26-p-1f-wafiiivr-f-ilfjl-ftcxknurrnilaer11rb.jpg)

