Welcome message from author
This document is posted to help you gain knowledge. Please leave a comment to let me know what you think about it! Share it to your friends and learn new things together.
Transcript
Austin, Texas2012-13 Proposed Budget
Volume 1
As required by section 102.005 (b) of the Texas Local Government Code, the City of Austin is providing the following statement on this cover page of its proposed budget:
This budget will raise more total property taxes than last year’s budget by $35,006,714 or 9.1%, and of that amount $14,569,734 is tax revenue to be raised from new property added to the tax roll this year.
The amounts above are based on the City’s proposed fiscal year 2012-13 tax rate of 50.29 cents per $100 of assessed valuation. The City’s fiscal year 2011-12 tax rate (the current tax rate) is 48.11 cents per $100 of assessed valuation.
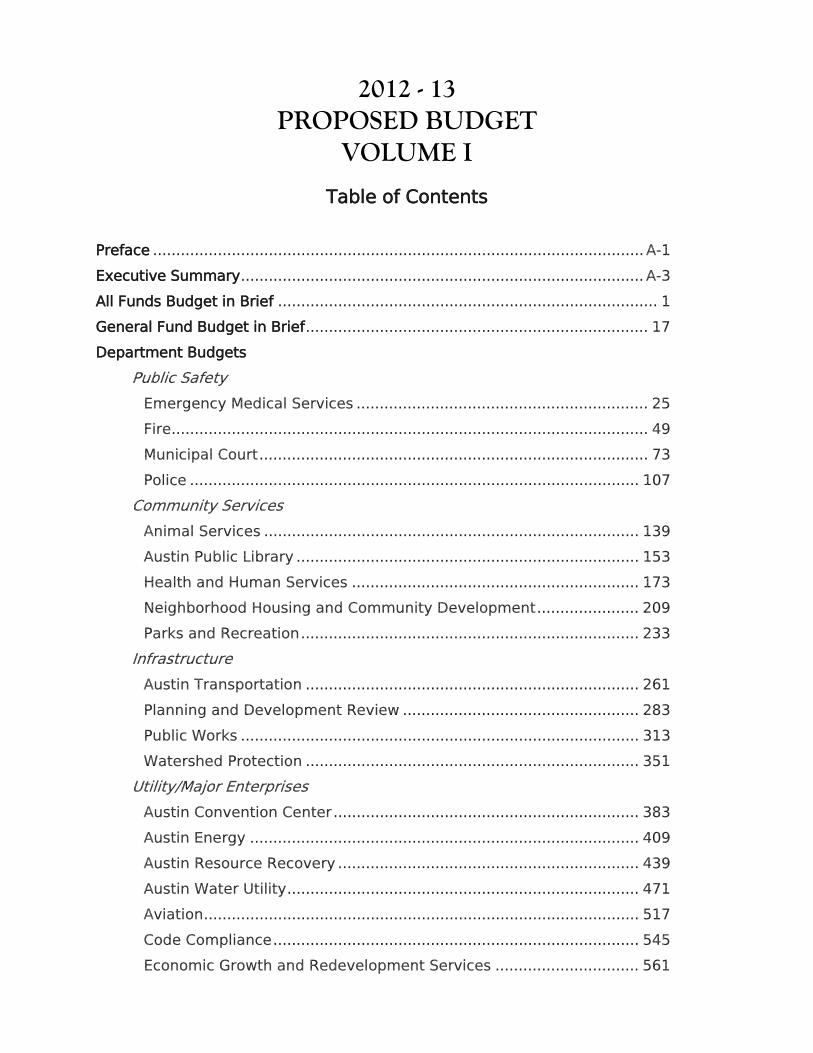
2012 - 13 PROPOSED BUDGET
VOLUME I
Table of Contents
Preface .......................................................................................................... A-1
Executive Summary ....................................................................................... A-3
All Funds Budget in Brief .................................................................................. 1
General Fund Budget in Brief .......................................................................... 17
Department Budgets
Public Safety
Emergency Medical Services ............................................................... 25
Fire ....................................................................................................... 49
Municipal Court .................................................................................... 73
Police ................................................................................................. 107
Community Services
Animal Services ................................................................................. 139
Austin Public Library .......................................................................... 153
Health and Human Services .............................................................. 173
Neighborhood Housing and Community Development ...................... 209
Parks and Recreation ......................................................................... 233
Infrastructure
Austin Transportation ........................................................................ 261
Planning and Development Review ................................................... 283
Public Works ...................................................................................... 313
Watershed Protection ........................................................................ 351
Utility/Major Enterprises
Austin Convention Center .................................................................. 383
Austin Energy .................................................................................... 409
Austin Resource Recovery ................................................................. 439
Austin Water Utility ............................................................................ 471
Aviation .............................................................................................. 517
Code Compliance ............................................................................... 545
Economic Growth and Redevelopment Services ............................... 561
Financial Summaries
Personnel ........................................................................................... 579
Funds Subject to Appropriation ......................................................... 581
Fund Summaries ................................................................................ 585
Reflective of the City’s desire to be responsible stewards of the planet’s resources, the City of Austin’s budget document uses paper made from 100% recycled post-consumer fiber, is acid- and lignin free, and Green Seal® and Forest Stewardship Council (FSC) certified. Additionally, the typeface is Ecofont®, designed specifically to use less toner. The Office continues to look for ways to bring additional environmentally-responsible practices into the production of the Budget document.
This
Certificate of Excellence is presented to
for exceeding the standards established by the ICMA Center for Performance Measurement™ in the identification and public reporting of key outcome measures, surveying of both residents and employees, and the pervasiveness of performance measurement in the
organization’s culture.
Presented at the 97th ICMA Annual Conference Milwaukee, Wisconsin 19 September 2011
Robert J . O ’Ne i ll Jr . IC MA Exec utive Director
Mic hael LawsonDirector
IC MA Center for Performanc e Measurement
David M. Ch i lds IC MA Pres ident
Austin, TX
City of Austin City Manager’s Office P.O. Box 1088, Austin, TX 78767 (512) 974-2200, Fax (512) 974-2833
Marc A. Ott, City Manager [email protected] August 1, 2012 Mayor, Mayor Pro Tem, and Members of the City Council: I am pleased to submit for your consideration the Fiscal Year 2012-13 Proposed Budget, which represents the culmination of more than eight months of sustained effort on the part of City staff. This document details a financial plan that:
Is balanced and structurally sound, not only for the upcoming fiscal year but also over the long-term;
Was developed through an open and transparent process that values the priorities and participation of Council, staff, stakeholders, and citizens;
Maintains the world-class standard of service delivery that our residents, business owners, and visitors deserve and have come to expect; and
Values and rewards our employees for the exceptional work they perform on behalf of the community each and every day.
This Budget upholds a commitment to structural balance, in both the near- and long-term, and is the product of a comprehensive multi-year effort to ensure that we utilize the City’s resources in the most responsible and cost-effective way possible. Council and staff have approached the economic crisis of the past several years as an opportunity rather than an excuse. Through a combination of disciplined decision-making, creative problem solving, and simple hard work, we have maintained or expanded core service delivery while restraining spending growth, to become leaner, smarter, and more efficient as an organization, resulting in greater value for our citizens. Over the last three years, our efforts have included:
Working proactively to improve the long-term financial health of the Employee Retirement System, including establishing a second-tier, lower-cost pension plan for new civilian hires;
Implementing enhanced employee wellness programs, which has allowed us to hold year-over-year cost growth of health insurance to 3% in FY 2012-13, as opposed to 8% in the previous year;
Renegotiating labor contracts with sworn personnel to reduce staffing costs; Postponing civilian market studies and associated pay adjustments for over
two years and placing a moratorium on employee wage increases in FY 2009-10;
Implementing a rigorous hiring review process for non-public safety positions;
Repurposing positions to higher-demand service areas and eliminating 178 non-essential vacant positions; and
Cutting or eliminating $10.5 million in services, including library and pool hours, supervised after-school playground sites, funding for the LBJ fire academy, and the Trail of Lights.
Three short years ago, the forecast for FY 2009-10 projected an annual budget shortfall of $29.6 million, even assuming adoption of the rollback tax rate, and the outlook for the out-years was similarly forbidding. As a result of the aggressive and proactive steps we have taken together, the accompanying document represents the third consecutive annual budget that includes a tax rate below the rollback threshold. Moreover, the outlook for the future is bright; for the first time in my tenure with the City, financial staff presented Council with a five-year forecast that did not project a short-fall in revenue. The City’s reserve funds are healthy and growing, putting us in good standing with the financial rating agencies that consistently reaffirm the City’s AAA credit worthiness. To our common credit, we have achieved this structural stability while avoiding a single employee layoff and while maintaining or expanding the core services most valued by our residents and stakeholders. It is City staff’s ongoing commitment to provide Council with extensive information and more opportunity for input, well in advance of decisions being made, in order to promote an open, inclusive, and transparent budget process. The $3.1 billion budget before you today was developed in accordance with this standard. Budget development began in October, when staff presented Council with the results of our Annual Citizen Survey. Incorporating this feedback from our community, the City’s annual business planning, conducted in December and January, resulted in several significant departmental reorganizations and other refinements. The City Council Policy Retreat, which took place in February, provided Council with the opportunity to define broad policy objectives on a number of timely and important topics. This was followed by the publication of the Annual Performance Report, City Dashboard, and an update to the Horizon Issues forecast in March, a comprehensive list of Unmet Service Demands in April, and a detailed Menu of Potential Budget Reductions in May. Finally, staff presented the annual economic outlook and five-year financial forecast to Council over the course of three work sessions in late April and early May. Each year, we strive to provide you with this high-quality and relevant budget information as early in the process as possible, in order to allow you a maximum of time and data in establishing funding priorities and policy guidelines. We likewise have an equally strong commitment to providing residents and other stakeholders with ever-greater access to and opportunity for participation in the budget process. Over the course of the spring, representatives from the City’s Budget Office and departmental staff presented budget forecasts at fifteen public meetings held by the City’s various Boards and Commissions and solicited input from board members, residents and stakeholders. Leveraging the City’s considerable
The City of Austin is committed to compliance with the American with Disabilities Act. Reasonable modifications and equal access to communications will be provided upon request.
technological resources, we expanded the SpeakUpAustin! Web forum, facilitated an online budget question-and-answer application, and conducted an online budget priorities survey. In support of these initiatives, the City launched a promotional campaign that included newspaper advertisements in both Spanish and English, social media alerts, e-mail notifications on departmental and Public Information Office distribution lists, and announcements and links on the City’s newly redesigned website. In the weeks ahead, as we work toward budget adoption, the community will have many additional opportunities to monitor or become involved in the process, including three Council work sessions and seven public hearings on the budget, tax rate, and utility rates. The Budget includes a proposed increase in the property tax rate of 2.18 cents, from 48.11 to 50.29 cents per $100 of taxable value, which, as noted above, is below the maximum rollback calculation for the third consecutive year. In addition to the increase in electric rates recently approved by Council, rate increases are needed for the City’s water, drainage, transportation, and resource recovery utilities in order to maintain the financial sustainability of these enterprises. While affordability is always a paramount concern, the recommended increases are both prudent and necessary if the City is to continue investing in core service areas such as public safety, health and human services, parks and recreation, infrastructure improvements, energy reliability and water quality. In closing, I want to recognize the entire workforce and applaud their ongoing commitment and dedication to making the City of Austin the most livable and best-managed city in the nation. As a result of their hard work, Austin continues to set the standard in municipal service delivery—exceeding national norms in 41 of 46 service areas and outpacing the national average for overall quality of services by nineteen percentage points. Without the ongoing commitment of our employees to promoting best management and livability, these impressive survey results would be unattainable. As always, I want to thank you, the City Council, for your hard work, commitment and ongoing support. Sincerely,
Marc A. Ott

CITY OF AUSTIN, TEXAS
CITY COUNCIL
Lee Leffingwell Mayor
Sheryl Cole
Mayor Pro Tem
Mike Martinez Laura Morrison
Chris Riley Kathie Tovo Bill Spelman
Council Members
Marc A. Ott City Manager
CITY OF AUSTIN, TEXAS
CITY COUNCIL PRIORITIES
2012-2013
Rich Social and Cultural Community
Vibrant Urban Fabric
Healthy, Family-Friendly, Safe City
Sustainable Economic Development and Financial Health
Cit
y M
anag
erM
arc
A.
Ott
974
-22
00
Cit
y M
anag
er
Mar
c A
. O
tt97
4-2
200
Cit
y o
f A
ust
in
Dep
uty
Cit
y M
anag
erM
icha
el M
cDon
ald
974-
2307
Dep
uty
Cit
y M
anag
erM
icha
el M
cDon
ald
974-
2307
Ass
ista
nt
Cit
y M
an
ager
Sue
Edw
ards
974-
7906
Ass
ista
nt
Cit
y M
an
ager
Sue
Ed
war
ds97
4-79
06
Ass
ista
nt
Cit
y M
an
ager
Ber
t Lu
mb
rera
s97
4-77
17
Ass
ista
nt
Cit
y M
an
ager
Ber
t Lu
mb
rera
s97
4-77
17
Cit
y C
lerk
Shi
rley
Gen
try
974-
2210
Cit
y C
lerk
Shi
rley
Gen
try
974-
2210
Cit
y A
ud
ito
rK
enne
th M
ory
974-
2805
Cit
y A
ud
ito
rK
enne
th M
ory
974-
2805
Mu
nic
ipal
Co
urt
Reb
ecca
Sta
rkC
ourt
Cle
rk, 9
74-4
692
Ma
yor
and
Cit
y C
ou
nci
lM
ayo
r an
d C
ity
Co
un
cil
Au
stin
Res
iden
tsA
us
tin
Res
iden
ts
Com
mun
icat
ions
and
Pub
lic I
nfor
mat
ion
Off
ice
– (5
12)
974
-222
0
Mu
nic
ipal
Co
urt
Ju
dg
eE
vely
n J.
McK
ee,
Pre
sidi
ng J
udge
974-
4842
Au
sti
n E
ner
gy
Larr
y W
eis
Gen
era
l Man
age
r 32
2-60
02
Au
sti
n E
ner
gy
Larr
y W
eis
Gen
era
l Man
age
r 32
2-60
02
Eff
ectiv
e 6/
2/20
12
Fin
anci
al S
ervi
ces
Ela
ine
Har
tC
hief
Fin
anci
al O
ffic
er97
4-33
44
Fin
anci
al S
ervi
ces
Ela
ine
Har
tC
hief
Fin
anci
al O
ffic
er
974-
3344
Go
vern
me
nt
Rel
ati
on
sJo
hn H
rnci
r, O
ffic
er97
4-22
46
Go
vern
me
nt
Rel
ati
on
s
John
Hrn
cir,
Off
icer
974-
2246
Ac
tin
g A
ssis
tan
t C
ity
Man
ag
er
Ant
hon
y S
nipe
s97
4-63
39
Ac
tin
g A
ssis
tan
t C
ity
Man
ag
er
Ant
hon
y S
nipe
s97
4-63
39
Law
Dep
artm
en
t K
aren
Ken
nard
, C
ity A
ttor
ney
974-
2268
Law
Dep
artm
en
t K
aren
Ken
nard
, C
ity A
ttor
ney
974-
2268
Off
ice
of
Po
lice
Mo
nit
or
Mar
go F
rasi
er,
Pol
ice
Mon
itor
974-
9090
Off
ice
of
Po
lice
Mo
nit
or
Mar
go F
rasi
er,
Pol
ice
Mon
itor
974-
9090
Co
mm
un
icat
ion
s &
Pu
blic
In
form
atio
n O
ffic
eD
oug
Mat
the
ws,
Dire
ctor
974-
2220
Co
mm
un
icat
ion
s &
Pu
bli
c In
form
atio
n O
ffic
eD
oug
Mat
thew
s, D
irec
tor
974-
2220
Bu
ild
ing
Ser
vice
sE
ric S
tock
ton,
Off
icer
974-
2306
Bu
ild
ing
Se
rvic
esE
ric S
tock
ton,
Off
icer
974-
2306
Sm
all
& M
ino
rity
Bu
sin
ess
Res
ou
rces
Dep
t.V
eron
ica
Lara
, D
irec
tor
974-
7600
Sm
all
& M
ino
rity
Bu
sin
ess
Res
ou
rces
Dep
t.
Ver
onic
a La
ra,
Dir
ecto
r97
4-76
00
Co
de
Co
mp
lian
ce
Dep
artm
ent
Car
l Sm
art,
Dire
ctor
974-
1970
Co
de
Co
mp
lian
ce
Dep
artm
ent
Car
l Sm
art,
Dire
ctor
974-
1970
Au
stin
Co
nve
nti
on
Ce
nte
r D
ep
t.M
ark
Tes
ter,
Dire
ctor
404-
4000
Au
sti
n C
on
ven
tio
n C
en
ter
De
pt.
M
ark
Tes
ter,
Dire
ctor
404-
4000
Au
sti
n W
ater
Uti
lity
Gre
g M
esza
ros,
Dire
ctor
972-
0108
Au
sti
n W
ater
Uti
lity
Gre
g M
esza
ros,
Dire
ctor
972-
0108
Avi
atio
n D
ep
artm
ent
Jim
Sm
ith,
Exe
cutiv
e D
irect
or
530-
7518
Avi
atio
n D
ep
artm
ent
Jim
Sm
ith,
Exe
cutiv
e D
irect
or
530-
7518
Em
erg
ency
Med
ical
Ser
vice
s D
epar
tme
nt
Ern
esto
Rod
rigue
z, D
irect
or97
2-72
03
Em
erg
enc
y M
edic
al S
ervi
ces
Dep
artm
en
t E
rnes
to R
odrig
uez,
Dire
ctor
972-
7203
Fir
e D
epar
tmen
tR
hoda
Mae
Ke
rr,
Chi
ef
974-
0130
Fir
e D
epar
tmen
tR
hoda
Mae
Ke
rr,
Chi
ef
974-
0130
Co
mm
un
ity
Co
urt
Pet
e V
alde
z, C
ourt
Adm
inis
trat
or97
4-48
73
Co
mm
un
ity
Co
urt
Pet
e V
alde
z, C
ourt
Adm
inis
trat
or
974-
4873
Po
lice
Dep
artm
ent
Art
Ace
vedo
, C
hief
974-
5030
Po
lice
Dep
artm
ent
Art
Ace
vedo
, C
hief
974-
5030
Eco
no
mic
Gro
wth
an
d
Red
eve
lop
men
t S
ervi
ces
Off
ice
Ke
vin
John
s, D
irect
or97
4-78
19
Eco
no
mic
Gro
wth
an
d
Red
eve
lop
men
t S
ervi
ces
Off
ice
Ke
vin
John
s, D
irect
or97
4-78
19
Pla
nn
ing
an
d D
eve
lop
men
t R
evi
ew
Dep
artm
en
t G
reg
Gue
rnse
y, D
irect
or97
4-23
87
Pla
nn
ing
an
d D
eve
lop
men
t R
evi
ew
Dep
artm
en
tG
reg
Gue
rnse
y, D
irect
or97
4-23
87
Wa
ters
he
d P
rote
ctio
n D
epar
tmen
tV
icto
ria L
i, D
irect
or97
4-23
39
Wa
ters
he
d P
rote
ctio
n D
epar
tmen
tV
icto
ria L
i, D
irect
or97
4-23
39
Lib
rary
De
par
tme
nt
Bre
nda
Bra
nch,
Dir
ecto
r97
4-74
44
Lib
rary
Dep
artm
ent
Bre
nda
Bra
nch,
Dir
ecto
r97
4-74
44
Hea
lth
an
d H
um
an S
ervi
ces
Dep
artm
en
t/M
edic
al D
irec
tor
Car
los
Riv
era
, D
ire
ctor
972-
5010
Hea
lth
an
d H
um
an S
ervi
ces
Dep
artm
en
t/M
edic
al D
irec
tor
Car
los
Riv
era
, D
ire
ctor
972-
5010
Par
ks a
nd
Rec
rea
tio
n D
epar
tmen
t S
ara
Hen
sle
y, D
irect
or
974-
6717
Par
ks a
nd
Rec
rea
tio
n D
epar
tmen
t S
ara
Hen
sle
y, D
irect
or
974-
6717
Au
sti
n R
eso
urc
e R
eco
very
R
ober
t G
eder
t, D
irec
tor
974-
1987
Au
sti
n R
eso
urc
e R
eco
very
R
ober
t G
eder
t, D
irec
tor
974-
1987
Co
mm
un
ity
Ser
vice
sF
inan
cial
& A
dm
inis
trat
ive
Ser
vice
sP
ub
lic S
afet
yD
evel
op
men
t S
ervi
ces
Sta
ff Li
aiso
n: C
ity C
lerk
Sta
ff L
iais
on:
Mun
icip
al C
ourt
, M
unic
ipal
Cou
rt J
udge
s an
d P
olic
e M
onito
r
Sta
ff L
iais
on:
City
Aud
itor,
AC
VB
Ass
ista
nt
Cit
y M
ana
ger
Rob
ert
Goo
de97
4-77
17
Ass
ista
nt
Cit
y M
ana
ger
Rob
ert
Goo
de97
4-77
17
Infr
astr
uct
ure
Ser
vice
s
Cap
ital
Pla
nn
ing
Off
ice
Mik
e T
rimbl
e, O
ffice
r97
4-33
44
Cap
ital
Pla
nn
ing
Off
ice
Mik
e T
rimbl
e, O
ffice
r97
4-33
44
Fle
et
Ser
vice
sG
erry
Cal
k, O
ffic
er97
4-32
02
Fle
et
Ser
vice
sG
erry
Cal
k, O
ffic
er
974-
3202
Ac
tin
g C
hie
f o
f S
taff
Ra
y B
ara
y97
4-22
20
Ac
tin
g C
hie
f o
f S
taff
Ra
y B
ara
y97
4-22
20
Tra
ns
po
rta
tio
n D
epar
tmen
t R
ober
t S
pilla
r, D
ire
ctor
97
4-70
92
Tra
ns
po
rta
tio
n D
epar
tmen
t R
ober
t S
pilla
r, D
ire
ctor
97
4-70
92
Off
ice
of
Ho
mel
an
d S
ec
uri
ty a
nd
E
mer
gen
cy
Man
ag
emen
t O
tis L
atin
, D
irect
or
974-
0450
Off
ice
of
Ho
mel
an
d S
ec
uri
ty a
nd
E
mer
gen
cy
Man
ag
emen
t O
tis L
atin
, D
irect
or
974-
0450
Pu
blic
Wo
rks
De
par
tmen
tH
ow
ard
Laz
arus
, D
irect
or97
4-70
65
Pu
bli
c W
ork
s D
epar
tmen
tH
ow
ard
Laz
arus
, D
irect
or97
4-70
65
An
imal
Ser
vice
s O
ffic
eA
biga
il S
mith
, O
ffice
r97
8-05
36
An
imal
Ser
vice
s O
ffic
eA
biga
il S
mith
, O
ffice
r97
8-05
36
Off
ice
of
Rea
l E
stat
e S
ervi
ces
Laur
aine
Riz
er,
Off
icer
974-
7078
Off
ice
of
Rea
l E
stat
e S
ervi
ces
Laur
aine
Riz
er,
Off
icer
974-
7078
Su
sta
ina
bil
ity
Off
ice
Luci
a A
then
s, O
ffic
er97
4-79
02
Su
sta
ina
bil
ity
Off
ice
Luci
a A
then
s, O
ffic
er97
4-79
02
Hu
man
Res
ou
rce
sM
ark
Was
hing
ton,
Dire
ctor
97
4-32
02
Hu
man
Res
ou
rce
sM
ark
Was
hing
ton,
Dire
ctor
97
4-32
02N
eig
hb
orh
oo
d H
ou
sin
g a
nd
C
om
mu
nit
y D
eve
lop
men
t B
etsy
Spe
ncer
, D
irec
tor
974-
3100
Nei
gh
bo
rho
od
Ho
usi
ng
an
d
Co
mm
un
ity
Dev
elo
pm
ent
Bet
sy S
penc
er,
Dir
ecto
r97
4-31
00
Co
mm
un
icat
ion
s &
Tec
hn
olo
gy
Mg
t.S
teph
en E
lkin
s, C
hief
Info
rmat
ion
Off
icer
97
4-77
02
Co
mm
un
icat
ion
s &
Tec
hn
olo
gy
Mg
t.
Ste
phen
Elk
ins,
Chi
ef In
form
atio
n O
ffic
er
974-
7702
Ass
ista
nt
to t
he
Cit
y M
ana
ger
974-
2220
Ass
ista
nt
to t
he
Cit
y M
ana
ger
974-
2220
Ag
en
da
Off
ice
Ag
en
da
Off
ice
Sta
ff Li
aiso
n: A
ustin
Ene
rgyT
elec
om
mu
nic
atio
ns
& R
egu
lato
ry A
ffai
rsR
onde
lla H
aw
kins
, O
ffice
r97
4-29
99
Tel
eco
mm
un
icat
ion
s &
Reg
ula
tory
Aff
airs
R
onde
lla H
aw
kins
, O
ffice
r97
4-29
99
Lab
or
Rel
ati
on
s O
ffic
eD
eve
n D
esai
, O
ffic
er97
4-27
77
Lab
or
Rel
ati
on
s O
ffic
e D
eve
n D
esai
, O
ffic
er97
4-27
77
Co
ntr
act
Man
agem
en
t D
epar
tmen
tR
osie
Tru
elo
ve, D
irec
tor
974-
7141
Co
ntr
act
Ma
na
ge
men
t D
ep
artm
en
t R
osie
Tru
elo
ve, D
irec
tor
974-
7141
AC
AP
Co
ord
ina
tor
AC
AP
Co
ord
ina
tor Off
ice
of
Med
ical
Dir
ecto
rP
aul H
inch
ey,
Dire
ctor
978-
0003
Off
ice
of
Med
ica
l Dir
ecto
r P
aul H
inch
ey,
Dire
ctor
978-
0003


Preface

Preface The Budget consists of two volumes: Volume 1—Includes the Executive Summary, an operating budget-in-brief of all City funds, a General
Fund budget-in-brief, and departmental discussions in the major service areas of public safety, community services, infrastructure, and utility and major enterprises. Departmental discussions are discussed alphabetically within the major service areas and include an overview of revenue and funding, a summarized program and activity organizational chart, missions and goals, a message from the department director, budget and revenue highlights, significant changes, detailed activity pages with requirements and performance targets, and a summary of inputs by program, activity, and funding sources. The City’s summary of personnel and the financial summaries of all budgeted funds are also included in this volume.
Volume 2—Departmental discussions continue with the internal services and support services departments. This volume also includes discussion of other non-departmental funds, debt, the capital budget, grants, a discussion of financial policies and other supporting documents to the budget, such as the fee schedule, budget ordinances, economic outlook and statistical information on Austin and its economy.
Copies of the budget can be found at each of the City libraries or on the City of Austin website at www.AustinTexas.gov/finance or a cd-rom may be requested from the Budget Office by calling (512) 974-2610.
Other References Several reference materials in addition to the budget can be accessed on the City’s website Austin Finance Online at www.AustinTexas.gov/finance. These include a tutorial on the City’s budget planning process, the Economic Outlook and Financial Forecast, which contains supplemental information on the local economy as well as projections of future revenue and expenditures, an update of departmental Horizon Issues, the 2012-13 Menu of Potential Budget Reductions, the Unmet Needs Report and the 2010-11 Annual Performance Report. The 5-year Capital Improvements Plan, published by the Capital Planning Office, is available online at http://austintexas.gov/department/cip-plans. Capital funding authorization for the next fiscal year is shown in the Capital Budget section contained in Volume 2. The City’s website also posts Council budget questions and answers throughout the budget process.
Financial Policies The Austin City Council has adopted a comprehensive set of financial policies to govern the financial management of the various City funds. The City Council developed financial policies to ensure that the City’s financial resources are managed in a prudent manner. The City maintains the goal of a structurally-balanced budget to achieve long-term financial stability for the Austin community. The City’s financial policies dictate that current revenue, which does not include the General Fund beginning balance, will be sufficient to support current expenditures (defined as “structural balance”). Unreserved fund balances in excess of what is required shall normally be used to fund capital items in the operating and capital budgets. A complete copy of the financial policies is contained in Volume 2 along with the City’s current compliance status for each individual policy. The City of Austin is in compliance with 93 of the 98 financial policies, as approved. Unless otherwise noted, the FY 2012-13 Budget has been used to determine the current status of the financial policies.
Basis of Budgeting and Accounting Governmental funds, which include the General Fund, are budgeted on a modified accrual basis. Revenue is recognized as soon as it is measurable and available. Revenue is considered to be available when it is collectible within the current period or soon enough thereafter to pay liabilities of the current period. For this purpose, the City considers revenue to be available if it is collected within 60 days of the end of the current fiscal period. Expenditures generally are recorded when a liability is incurred. However, debt service expenditures, as well as expenditures related to compensated absences, are recorded only when payment is due. Encumbrances are recognized by governmental funds in the year of commitment since they represent a commitment of funding for goods or services.
2012-13 Proposed Budget, Austin, TX
Volume I | A-1
Preface Proprietary funds, which include enterprise, internal service, and fiduciary funds, are budgeted on a full accrual basis, with the exception of compensated absences and debt service payments. For these two items, the City budgets for the payments that are expected to be paid during the fiscal year. Encumbrances are recognized by enterprise and internal service funds in the year of commitment since they represent a commitment of funding for goods or services. Except for the differences noted above in debt service payments and compensated absences, the basis of accounting and budgeting in the City of Austin are the same: modified accrual for governmental funds and full accrual for proprietary funds. However, the fund structure of the budget differs from the Comprehensive Annual Financial Report (CAFR) of the City. As an example, the Austin Energy fund in the budget reflects only the operating activities of the electric utility, while the Austin Energy fund in the CAFR reflects the operating activities, capital project activities, debt service activities and reserve account activities. Therefore, these amounts are not comparable between the two documents.
2012-13 Proposed Budget, Austin, TX
A-2 | Volume I

Executive Summary

City of Austin Proposed Budget Executive Summary Fiscal Year 2012-13
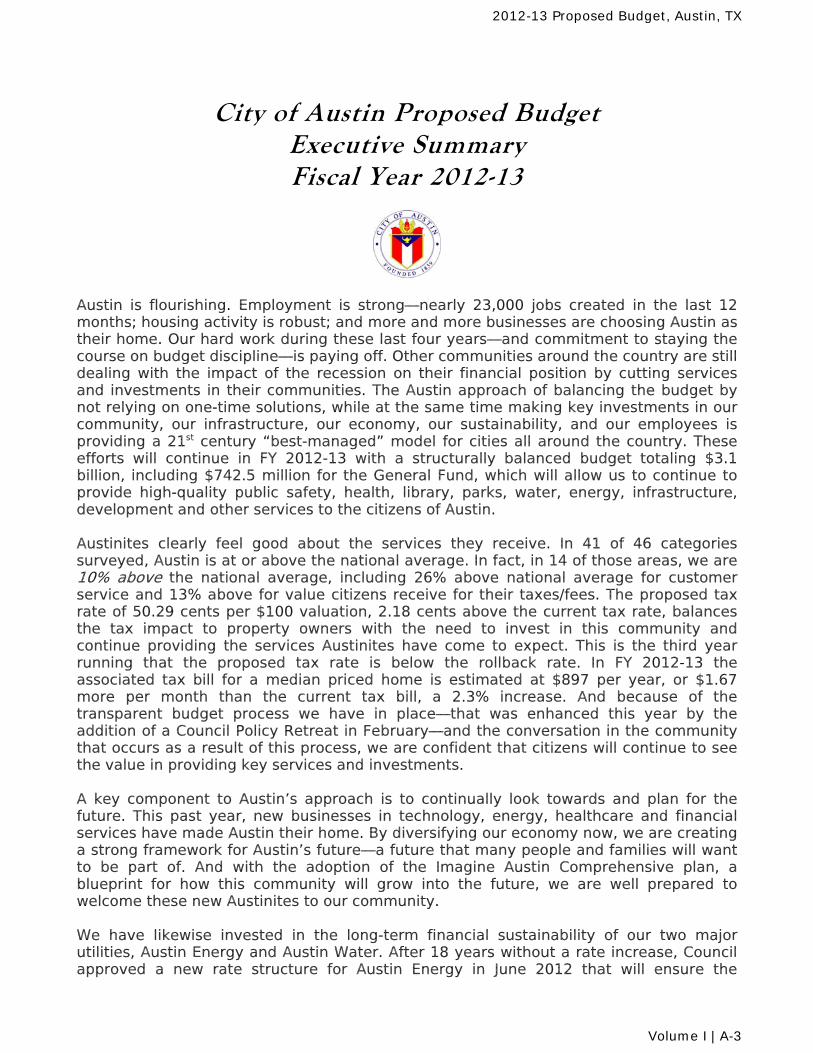
Austin is flourishing. Employment is strong—nearly 23,000 jobs created in the last 12 months; housing activity is robust; and more and more businesses are choosing Austin as their home. Our hard work during these last four years—and commitment to staying the course on budget discipline—is paying off. Other communities around the country are still dealing with the impact of the recession on their financial position by cutting services and investments in their communities. The Austin approach of balancing the budget by not relying on one-time solutions, while at the same time making key investments in our community, our infrastructure, our economy, our sustainability, and our employees is providing a 21st century “best-managed” model for cities all around the country. These efforts will continue in FY 2012-13 with a structurally balanced budget totaling $3.1 billion, including $742.5 million for the General Fund, which will allow us to continue to provide high-quality public safety, health, library, parks, water, energy, infrastructure, development and other services to the citizens of Austin. Austinites clearly feel good about the services they receive. In 41 of 46 categories surveyed, Austin is at or above the national average. In fact, in 14 of those areas, we are 10% above the national average, including 26% above national average for customer service and 13% above for value citizens receive for their taxes/fees. The proposed tax rate of 50.29 cents per $100 valuation, 2.18 cents above the current tax rate, balances the tax impact to property owners with the need to invest in this community and continue providing the services Austinites have come to expect. This is the third year running that the proposed tax rate is below the rollback rate. In FY 2012-13 the associated tax bill for a median priced home is estimated at $897 per year, or $1.67 more per month than the current tax bill, a 2.3% increase. And because of the transparent budget process we have in place—that was enhanced this year by the addition of a Council Policy Retreat in February—and the conversation in the community that occurs as a result of this process, we are confident that citizens will continue to see the value in providing key services and investments. A key component to Austin’s approach is to continually look towards and plan for the future. This past year, new businesses in technology, energy, healthcare and financial services have made Austin their home. By diversifying our economy now, we are creating a strong framework for Austin’s future—a future that many people and families will want to be part of. And with the adoption of the Imagine Austin Comprehensive plan, a blueprint for how this community will grow into the future, we are well prepared to welcome these new Austinites to our community. We have likewise invested in the long-term financial sustainability of our two major utilities, Austin Energy and Austin Water. After 18 years without a rate increase, Council approved a new rate structure for Austin Energy in June 2012 that will ensure the
2012-13 Proposed Budget, Austin, TX
Volume I | A-3
financial sustainability of the utility for future generations. The Austin Water Utility is also recommending a rate increase, as well as a new rate structure, that will significantly reduce revenue volatility while maintaining strong price incentives that encourage conservation of this limited resource. Both of these efforts were conducted with the transparency that has come to define our financial processes; engaging the community on the front-end of major recommendations. Austin Energy conducted a 6 month public process and supported Council in their work sessions. The proposed rates for the Austin Water Utility were similarly developed over a 7 month public process, including 15 public meetings of a Joint Committee of staff, board and commission members and citizens. At the heart of these Utilities and their new rate structures is a commitment to sustainability, conservation and affordability. While this budget reflects a resurgent economy, it does not lose sight of our sustainable budget goals, and does not rely on one-time revenue to support on-going costs. This Austin model that we have had in place for the last four years has served us well. We have maintained reserve levels and our AAA bond ratings, yet at the same time made key decisions and investments that benefit not only our current residents, but those that will come. Austin exists in a rarefied space. Our struggle moving forward will be to continually raise the bar on what is possible, while continuing to move ever closer towards the Imagine Austin vision of a community where the necessities of life—and all that makes Austin the most livable city in the country—are affordable and accessible to all.
Best Managed City
To achieve our vision of making Austin the most livable city in the country and to support City Council’s policies and initiatives, the employees of the City—whether they be executives, managers, or front-line service providers—have the singular mission of making the City of Austin the best managed city in the country. City staff is committed to creating a work environment that fosters creative thinking and innovation throughout the organization; thereby better positioning the workforce to more effectively respond to new challenges as well as new opportunities. Being the best managed is about everybody in the organization doing the best they can, every day, to provide the best services possible to the community. Since establishing our Best Managed mission, the question “How will we know that we’ve achieved it?” has been frequently asked. The answer: “We’ll never declare that we’ve reached that goal, but rather others will do it for us.” This year, we can clearly see our hard work and determination are being noticed, evidenced through the exceptionally high satisfaction marks we received from our citizens on our annual community survey. Over the last three years, resident satisfaction with overall city services has steadily improved, and in 2011 Austin outpaced the national average for large cities in 41 of 46 service areas measured. Our overall quality score of 65% was 19% higher than our peer cities’ average, and our customer service score of 69% was 26% higher. Overall satisfaction with city services rated #1 among 13 comparable cities with populations greater than 500,000 leading the survey team to conclude that “The City of Austin is setting the standard for performance among large U.S. cities.”
2012-13 Proposed Budget, Austin, TX
A-4 | Volume I
Additional highlights of recent Best Managed Initiatives are listed below. Imagine Austin. In June 2012, the City Council unanimously voted to adopt Imagine Austin, the City’s comprehensive plan for Austin’s future. The plan defines where the City is today and where we want to go, setting a context to guide decision-makers for the next 30 years. This plan took more than two years to develop with tens of thousands of Austinites helping to shape it throughout the public process. There were four rounds of public input, including five surveys, 21 public meetings, 189 Meetings-in-a-Box, 57 traveling team events, 112 speaking events, and over 100 meetings of the 38-member Citizens’ Advisory Task Force. The result is a plan that adheres to the six core principles established by citizens: 1) Grow as a compact, connected city, 2) Integrate nature into the city, 3) Provide paths to prosperity for all, 4) Develop as an affordable and healthy community, 5) Sustainably manage water, energy and other environmental resources, and 6) Think creatively and work together. This plan’s success will be monitored annually with the performance metrics integrated into the document and formally assessed at least every five years, as required by the City Charter. It’s a flexible plan and will be updated regularly so that we can continue to ensure that the community’s priorities and values are sustained as the city and region grow. Building for the Future. The Imagine Austin Comprehensive Plan will guide how and where future development occurs citywide. Complementing Imagine Austin is the Downtown Austin Plan, which was adopted by the City Council in December 2011. This plan serves the critical role of creating the best implementation strategy for development in the high-profile and vibrant downtown area. During the past year, City staff has made progress on important downtown projects such as the Waller Creek Tunnel and Downtown Wastewater Tunnel, and we are well-underway with the New Central Library Project, with the schematic design phase embracing cutting-edge approaches to ensure that Austin’s next central library will truly be a “Library for the Future.” The City also continues to make progress on critical facility and infrastructure projects citywide. In November 2011, we opened the state-of-the-art Austin Animal Center, which will support our efforts for continued and long-term success as a No-Kill community. We continue to coordinate the redevelopment of the old Mueller airport site, with more than 250 single- and multi-family housing units being built or started last year, including more than 200 affordable homes. Several transportation projects were completed, including the reconstruction of the East Seventh Street corridor, Brazos and 32nd Streets, the Pfluger Pedestrian Bridge extension, and the South Congress makeover incorporating new bicycle lanes and reverse angle parking, an award winner for Best Internal Project by the Texas Public Works Association. And perhaps most notably, construction of Water Treatment Plant 4 is progressing on schedule and anticipated to begin operating in 2014. When complete, the initial phase of construction will result in a 50 million gallon per day water treatment facility which will provide clean, reliable, and affordable water for both current and future generations of Austinites. Engaging Communities. Austin set the standard for community engagement with our public input process of the Imagine Austin Comprehensive Plan, with our efforts being cited by the Alliance for Innovation, the National League of Cities and the Texas Transportation Institute as a “best practice.” Recent budget cycles have provided an unprecedented level of stakeholder involvement through surveys, focus groups, budget work sessions, town hall meetings, public meetings with the City’s boards and commissions, online question and answer forums for both citizens and council members, an online discussion forum (SpeakUpAustin!), and a City Council Policy Retreat. Austin
2012-13 Proposed Budget, Austin, TX
Volume I | A-5
Energy opened a customer-focused service center in North Austin to provide walk-in assistance to customers and to serve as a community resource. The Code Compliance department established a Community Outreach Office to identify and connect resources and assistance programs with persons cited for code violations. Through a collaborative process with the community, the City redesigned the AustinTexas.gov website and many departments have developed and improved upon their public access websites as a way to better communicate and engage. The City of Austin is committed to increasing transparency and providing opportunities for public input. Greening Austin. Austin is leading the way in environmental protection and innovation. The City’s goal for reducing emissions from City government operations are the world’s most ambitious—a 100% reduction by 2020. Achieving this goal will require innovative thinking and the implementation of new green initiatives. The Sustainability Office made significant progress toward this goal last year. All City facilities are now powered by the GreenChoice renewable energy program, ranking Austin #2 on the U.S. Environmental Protection Agency’s Top 20 Local Government list for green power purchasers. The newly-online Webberville Solar project is helping to bring Austin Energy one step closer to meeting its goal of 35% renewable power by 2020. The City completed one of our flagship green infrastructure projects, the Lundelius McDaniels Biofiltration Pond for stormwater treatment, that treats polluted stormwater runoff with native vegetation and soil before it enters the Barton Springs recharge area. The Austin Public Library diverted 130 tons of discarded materials out of landfills through the work of Recycled Reads, the APL bookstore. The Austin Resource Recovery department re-blended more than 8,000 gallons of Austin Reblend paint for re-use and won numerous awards for its innovative reality TV show, Dare to Go Zero, in which four families tried to reduce their weekly waste stream to zero pounds. And the Austin Water Utility has been expanding its reclaimed water program, most recently at the Austin-Bergstrom International Airport, providing an alternative water source for irrigation and cooling that should conserve 25-35 million gallons of potable (drinking) water annually while also reducing operating costs. Keeping Austin Safe. Public safety is one of the fundamental roles of a local government and the highest priority of our citizens. Our public safety departments continue to work hard to improve, innovate and keep our community safe. Last year’s response times for life-threatening and emergency calls for Fire, Emergency Medical Services, and Police were all better than the Council approved targets. EMS reached 92% of its Priority One calls in urban areas within 10 minutes, Police’s emergency call response time was less than 7 minutes, and Fire completed 86% of its calls within eight minutes. Austin’s violent and property crime rates have also been decreasing over time. The Austin Police Department was awarded Impaired Driving Mobilization Department of the Year by the Texas Department of Transportation and launched the RAIDS Online crime-mapping tool to allow the public an interactive map and database to become better informed about crime activity in their neighborhoods. Our fire department has been working to enhance cooperation with regional emergency response and responded fully to the Pinnacle and Labor Day wildland fires. Wildfire community education has been a citywide effort, with the Parks and Recreation Department recently developing a “shaded fuel break” along the southwest boundary of Circle C Metropolitan Park to help reduce the wildfire risk of nearby homes. Austin is a StormReady Community of the National Weather Service, and the community outreach plan, Disaster Ready Austin, is now implemented, ready for when emergencies and disasters strike.
2012-13 Proposed Budget, Austin, TX
A-6 | Volume I
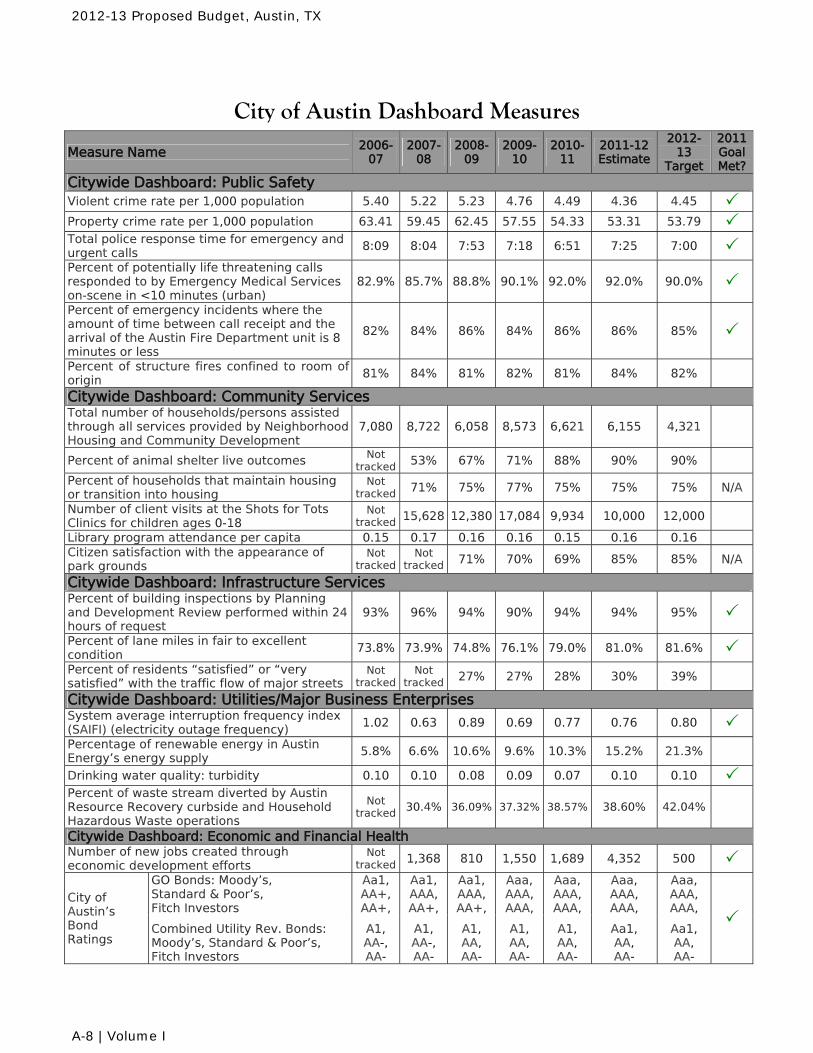
Pulling Together. City staff understand community needs and community responsibility, often working with civic groups to better our city. Our departments worked with community partners to adopt 100% tobacco-free policies, increased client access to primary care by 30% at the Refugee Health Screening clinic by partnering with Lone Star Circle of Care, and launched Car-Share Austin in partnership with the car-share providers car2go and Zipcar. The Austin Police Department partnered with the Greater Austin Crime Commission in the Guns4Groceries gun buyback program, and Neighborhood Housing partnered with the nonprofit Foundation Communities on the development of M Station Apartments, a 150-unit rental community with affordable units. Sustaining Healthy Finances. Maintaining sound financial and economic development policies within the City organization allows for a high-level of services to the community. Because of our policies, the City’s bond ratings for General Obligation bonds continues to be AAA for all three bond rating agencies, Moody’s (Aaa), Standard & Poor’s and Fitch Investors. In addition, our combined utility system revenue bonds were upgraded in June 2012 to Aa1 based on positive findings by Moody’s of our sound financial practices, and the Aviation Department improved its Standard & Poor’s credit rating from “A-“ to “A”, which will assist with the airport’s long-term sustainable growth plans and ability to secure funding at lower borrowing rates. We also took advantage of a competitive construction business climate, achieving 13.5% savings in bids vs. estimates for the City’s construction projects, and we exceeded portfolio benchmarks for the year, earning $4.5 million in interest earnings. The average yield on the Investment Pool portfolio was 0.38 percent compared to the U.S. Treasury Bond benchmark rate of 0.15 percent. City Performance and the City of Austin Dashboard. The idea behind an organizational dashboard is to provide a summarized snapshot of performance for the most important services that a city provides so that these measures can easily and frequently be reviewed by city staff, Council and citizens. The Dashboard measures, 21 of the most critical indicators of the City’s success, were selected in collaboration with a citizen panel comprised of graduates from the CityWorks Academy. The Dashboard includes indicators from each of the major service areas presented in this budget document, Public Safety, Community Services, Infrastructure, and Utilities/Major Business Enterprises. A fifth category of Economic and Financial Health is also included. Taken collectively, these 21 indicators give City Management, City Council, and the residents of Austin a tool for quickly assessing how well the City of Austin is performing. The table on the following page lists the City Dashboard measures along with their proposed targets for 2012-13. Of the 19 dashboard measures with targets set for FY 2010-11, eleven – or 58% – met their targets. Fifteen, or 79%, either met, exceeded or came within 3% of their targets. Seventeen, or 81% of the Dashboard measures, improved or maintained performance overall during the 5-year timeframe from FY 2006-07 to FY 2010-11. For FY 2012-13, these Dashboard measures, as well as the other measures tracked by city departments, will continue to have targets set that are both challenging—reflecting our commitment to “raising the bar”—and realistic based on available resources. Setting targets, tracking and analyzing data, and discussing and making decisions off of the outcomes are beneficial processes for the City organization and critical to improving City services and delivery.
2012-13 Proposed Budget, Austin, TX
Volume I | A-7
City of Austin Dashboard Measures
Measure Name 2006-07
2007-08
2008-09
2009-10
2010-11
2011-12 Estimate
2012-13
Target
2011 Goal Met?
Citywide Dashboard: Public Safety Violent crime rate per 1,000 population 5.40 5.22 5.23 4.76 4.49 4.36 4.45 Property crime rate per 1,000 population 63.41 59.45 62.45 57.55 54.33 53.31 53.79 Total police response time for emergency and urgent calls
8:09 8:04 7:53 7:18 6:51 7:25 7:00 Percent of potentially life threatening calls responded to by Emergency Medical Services on-scene in <10 minutes (urban)
82.9% 85.7% 88.8% 90.1% 92.0% 92.0% 90.0% Percent of emergency incidents where the amount of time between call receipt and the arrival of the Austin Fire Department unit is 8 minutes or less
82% 84% 86% 84% 86% 86% 85%
Percent of structure fires confined to room of origin 81% 84% 81% 82% 81% 84% 82% Citywide Dashboard: Community Services Total number of households/persons assisted through all services provided by Neighborhood Housing and Community Development
7,080 8,722 6,058 8,573 6,621 6,155 4,321
Percent of animal shelter live outcomes Not tracked 53% 67% 71% 88% 90% 90%
Percent of households that maintain housing or transition into housing
Not tracked 71% 75% 77% 75% 75% 75% N/A
Number of client visits at the Shots for Tots Clinics for children ages 0-18
Not tracked 15,628 12,380 17,084 9,934 10,000 12,000
Library program attendance per capita 0.15 0.17 0.16 0.16 0.15 0.16 0.16 Citizen satisfaction with the appearance of park grounds
Not tracked
Not tracked 71% 70% 69% 85% 85% N/A
Citywide Dashboard: Infrastructure Services Percent of building inspections by Planning and Development Review performed within 24 hours of request
93% 96% 94% 90% 94% 94% 95% Percent of lane miles in fair to excellent condition
73.8% 73.9% 74.8% 76.1% 79.0% 81.0% 81.6% Percent of residents “satisfied” or “very satisfied” with the traffic flow of major streets
Not tracked
Not tracked 27% 27% 28% 30% 39%
Citywide Dashboard: Utilities/Major Business Enterprises System average interruption frequency index (SAIFI) (electricity outage frequency)
1.02 0.63 0.89 0.69 0.77 0.76 0.80 Percentage of renewable energy in Austin Energy’s energy supply 5.8% 6.6% 10.6% 9.6% 10.3% 15.2% 21.3% Drinking water quality: turbidity 0.10 0.10 0.08 0.09 0.07 0.10 0.10 Percent of waste stream diverted by Austin Resource Recovery curbside and Household Hazardous Waste operations
Not tracked 30.4% 36.09% 37.32% 38.57% 38.60% 42.04%
Citywide Dashboard: Economic and Financial Health Number of new jobs created through economic development efforts
Not tracked 1,368 810 1,550 1,689 4,352 500
City of Austin’s Bond Ratings
GO Bonds: Moody’s, Standard & Poor’s, Fitch Investors
Aa1, AA+, AA+,
Aa1, AAA, AA+,
Aa1, AAA, AA+,
Aaa, AAA, AAA,
Aaa, AAA, AAA,
Aaa, AAA, AAA,
Aaa, AAA, AAA,
Combined Utility Rev. Bonds: Moody’s, Standard & Poor’s, Fitch Investors
A1, AA-, AA-
A1, AA-, AA-
A1, AA, AA-
A1, AA, AA-
A1, AA, AA-
Aa1, AA, AA-
Aa1, AA, AA-
2012-13 Proposed Budget, Austin, TX
A-8 | Volume I
Impact of the Budget on City Employees Wages and Other Compensation. The City’s workforce is its greatest asset and continued investments in this area are essential to the pursuit of being Best Managed. City employees played a crucial role in balancing the FY 2009-10 Budget by renegotiating labor contracts and agreeing to forego planned pay increases. These concessions continue to save tax dollars today through lower base wages. The FY 2012-13 Budget includes wage adjustment of 3% for both uniformed and civilian personnel, helping them to keep pace with the rising cost of living. The Budget also includes a continuation of the Service Incentive Pay program, which allows for an annual lump-sum payment to civilian employees based on tenure. In agreement with the approved terms of our contracts with uniformed personnel, funding is also included for increases associated with step and longevity pay for sworn staff. In FY 2011-12, we returned to reviewing the salaries of our workforce compared to the market. This program had been placed on hold for three years until the City’s revenue showed sustained improvement. As part of the FY 2011-12 Budget, City Council approved implementation of the market study effective April 1, 2012. Full-year funding for the market increases are included in the FY 2012-13 Budget. Medical and Dental Insurance. The City’s efforts over the past few years to make changes, implement policy and initiate programs aimed at keeping health insurance costs down are beginning to have an impact. In FY 2012-13, City contributions to the Employee Benefits Fund are budgeted at only a 3% growth rate. This increase is 5% less than the 8% increase implemented in the FY 2011-12 Budget. The City is continuing to cover 100% for employee PPO medical coverage, while increasing the charge introduced in 2012 for employee-only enrollees in the higher cost HMO by $2.50 per pay period for a total of $5.00 per pay period. Employees with dependent coverage will see a 5.4% increase in premiums. Coverage for retirees without Medicare will increase by 8% and with Medicare by 2%. Plan design changes due to healthcare reform include covering 100% of the costs for generic birth control and female sterilization. The City will continue to cover 100% for employee dental coverage. Employees with dependent coverage will see a 9.8% increase. The Table of Allowance for the Dental Assistance Plan will increase. The City will introduce a Health Reimbursement Account to incent healthy behaviors for employees and retirees. Improving the Financial Health of the Employees’ Retirement System. The City of Austin is the plan sponsor of three employee pension systems: the Employees’ Retirement System (ERS), the Police Retirement System, and the Firefighter Retirement System. ERS is the largest pension system and provides retirement benefits for civilian employees, as well as EMS personnel. Over the past several years, primarily as a result of enhanced benefit levels and substantial investment losses, additional City contributions to the ERS have been necessary to improve the funded status of the system and lower the amortization period of the unfunded liability. Since 2005, the City‘s contribution has increased from 8% of salary to 18%. Combined with the requisite employee contribution of an additional 8% brings the combined City/employee contribution rate to 26% of salary. In addition to increasing City contributions to the ERS, a new lower cost benefit
2012-13 Proposed Budget, Austin, TX
Volume I | A-9
tier went into effect January 1, 2012. This new benefit tier only applies to employees hired on or after that date and increases the age and service criteria necessary to reach retirement eligibility. It also decreases the pension multiplier, which is used to determine the final pension amount paid to future retirees. These two changes will, over time, substantially improve the long-term financial health of the ERS. Consistent with the City’s approved collective bargaining agreements with sworn Police and Firefighters, additional City contributions to the Police and Firefighter Retirement Systems have also been included in the FY 2012-13 Budget. Both Systems will receive an additional 1% City contribution beginning the first pay period of the fiscal year. The Firefighter Retirement System will receive a further 1% increase starting in September 2013.
General Fund Highlights Animal Services. The Animal Services Office’s (ASO) budget for FY 2012-13 totals $8.2 million and 94.5 FTEs. This includes funds to convert a part-time veterinarian position to full-time and the operation of a portion of the Town Lake Animal Center (TLAC) as an overflow shelter facility. The additional hours of veterinary care will have a direct impact on ASO’s ability to maintain or improve upon its live-outcome rate and the funding for TLAC operations will help to alleviate a shortage of large-dog kennels at Austin Animal Center and allow ASO crucial flexibility in responding to surges in shelter intake.
Austin Public Library. The Austin Public Library operates 20 branch libraries, the Faulk Central Library, and the Austin History Center. Along with planned expenditure increases to maintain these facilities, the FY 2012-13 Budget includes funding for 12 new FTEs and dedicated funding for temporary employees to alleviate the growing burden on current Library staff. These additional resources will provide critical support to the entire library system.
CIP Highlights – Library’s capital budget includes $6.2 million in new appropriation, per the approved funding plan, for the new central library. Design will continue in FY13. Expected spending in FY 2012-13 is $3.3 million for the library and other library building improvements.
Emergency Medical Services. The Emergency Medical Services’ (EMS) budget for FY 2012-13 provides funding for 448.5 uniformed personnel, 84 non-uniformed positions, and the operation of 35 full-time ambulance units and 5 demand units. This amount includes funding for six new paramedic positions for a demand unit at the Medic 5 Station, annualizing staffing costs added mid-year of FY 2011-12 for operation of the Mueller station, and implementation of a new National Curriculum stipend under the existing Meet and Confer agreement. The budget also includes one-time funding for ambulances and equipment for the Mueller and Medic 5 Stations and the replacement of cardiac monitors, stretchers, Automatic External Defibrillators, and stair-chairs. EMS’ FY 2012-13 revenues are $30.9 million, an increase of $1.5 million over the FY 2011-12 Budget. The change in revenue is primarily due to an increase in the transport fees and in the reimbursement amount from the Travis County Healthcare District.
2012-13 Proposed Budget, Austin, TX
A-10 | Volume I
Fire. The budget of the Austin Fire Department (AFD) maintains funding for 1,083 firefighters for the continued operation of 45 fire stations. The department recently learned that it may be awarded a Staffing for Adequate Fire and Emergency Response (SAFER) federal grant. This grant would allow the department to achieve four-person staffing on the remaining three aerial trucks in addition to three rescue units in FY 2012-13. Additional overtime is also included in AFD’s budget to cover the cost of back filling sworn positions due to the unusually high number of sworn vacancies. Funding is also included in the budget for the annualized cost of 3 inspector positions added mid-year 2012 and 5 new non-sworn staff that will provide needed support in the areas of community outreach, payroll services and administration of the personal protective equipment maintenance program. CIP Highlights – The FY 2012-13 spending for AFD is $1.0 million for the continued effort to add women’s locker rooms to various fire stations. There is a new appropriation being added to Fleet’s CIP for AFD pumper trucks in the amount of nearly $2.9 million. Health and Human Services. The Health and Human Services Department’s (HHSD) budget for FY 2012-13 is comprised of $39.3 million from the General Fund, $20.3 million in grants and $1.9 million from the Sustainability Fund. Combined these funds support 417.5 FTEs. The HHSD budget includes funding for 3 previously grant funded positions. One of these position, a Public Health Nurse, serves 2,887 unduplicated clients annually at the South Austin Neighborhood Center, providing blood-pressure and blood-sugar screening as well as educational outreach regarding diabetes and hypertension. The other two positions are a Toxicologist and a Community Development Manager that were previously funded by the Public Health and Emergency Preparedness grant. Transferring these positions to the General Fund ensures they will be appropriately and consistently funded and allows remaining grant funds to be redirected to other programmatic staff. The Social Services Contracts Program is budgeted at $25.5 million for FY 2012-13, including an increase of $841,000 to provide full-year funding for the mental health interlocal agreement with Austin/Travis County Integral Care (ATCIC). Municipal Court. The Municipal Court’s budget for FY 2012-13 includes funding for an additional two Case Managers. These positions will increase the Downtown Austin Community Court’s ability to provide services to repeat offenders, both by serving offenders who appear on the docket and by outreaching to and engaging offenders in the community before they are arrested and brought to court. Additional funding is also included in the Juvenile Case Manager fund for the implementation of a pilot program for Juvenile Class C cases through an interlocal agreement with Travis County. The Municipal Court is projecting a $2.2 million decrease in revenue collections in FY 2012-13. The decrease in revenue is attributable to a steep decline in the number of traffic citation cases filed at Municipal Court. There are two primary factors contributing to the drop. First, newer technology allows officers to verify insurance at the time of the traffic stop eliminating the need to issue a citation for failure to maintain insurance. Second, APD has shifted resources to higher priority enforcement in an effort to reduce traffic fatalities. The decrease in traffic violations is projected to be partially offset by an increase of $0.5 million in revenue from parking fines resulting with the newly expanded parking hours.
2012-13 Proposed Budget, Austin, TX
Volume I | A-11
Parks and Recreation. The Parks and Recreation Department’s (PARD) budget for FY 2012-13 includes funding for staff, contractuals, and commodities to maintain and operate the City’s 23 recreation centers, 43 pools, and numerous metropolitan and neighborhood parks. The budget includes funding for 4 new FTEs related to parks grounds maintenance, 6 FTEs for the opening of the new Asian American Resource Center, 2 FTEs for the operation of the Carver Genealogy Center, 1.5 FTEs to enhance services at the Mexican American Cultural Center and one position to improve contract compliance and management. The budget also includes a $0.6 million increase for preventative maintenance contracts that is needed for the Department’s aging facilities and one-time critical funds of $388,600 for park maintenance and recreational equipment and furniture and fixtures for the Asian American Resource Center. CIP Highlights – PARD’s capital budget for FY 2012-13 includes $10.2 million in new appropriation and a spending plan of $30.1 million. The majority of spending will be from the City’s 2006 Bond Program and covers improvements to the Conley-Guerrero Senior Activity Center, renovation of Bartholomew pool, trail improvements near the Shoal Creek Greenbelt, improvements at Auditorium shores, a new play-scape at Dove Springs Park and many other projects including critical rehabilitations for various facilities. Planning and Development Review. The Planning and Development Review Department’s (PDRD) budget for FY 2012-13 maintains funding for existing services, and adds annualized costs associated with an FY 2011-12 budget amendment that increased certain development fees and added 11 FTEs to improve the development review process. The budget also includes funding for three additional positions to begin work on implementing the Imagine Austin Comprehensive Plan by overseeing the rewrite to the City’s Land Development Code CIP project. CIP Highlights – PDRD’s capital budget includes $2.0 million for consulting costs associated with rewriting the City’s Land Development Code. This will be a multi-year project and is scheduled to begin October 2012. Another $1.5 million is included for the Great Streets Redevelopment Program. This program is supported by partial funding for private sector implementation of downtown Great Streets improvements and supplemental funding for downtown Great Streets capital improvement projects. PDRD’s Spending for FY 2012-13 is expected to be nearly $1.3 million for planning, zone code update and Great Streets projects. Police. The Austin Police Department’s (APD) budget for FY 2012-13 includes funding for 1,740 officers to maintain the sworn staffing ratio of 2.0 officers per 1,000 population. This includes funding for 22 new officers in FY 2012-13 and the annualized cost of 47 officers added mid-year FY 2011-12. The budget also includes funding for the promotion of ten officer positions to higher ranks. Twelve communication positions and two Victim Witness Counselors, previously funded by grants, are being transferred to the General Fund in order to maintain these critical programs despite the loss of the grant funds. Additional operating budget items include a decrease in the cost of the booking interlocal agreement with Travis County and continued funding for the City’s share of the costs for the Austin Regional Intelligence Center. CIP Highlights - APD’s capital program will see $2.9 million in spending for the continued implementation of the Digital Vehicular Video System and installation of network infrastructure and audio/video equipment.
2012-13 Proposed Budget, Austin, TX
A-12 | Volume I
Enterprise Highlights Austin Convention Center. The Austin Convention Center (ACC) is responsible for operations and maintenance of the City’s Convention Center and Palmer Events Center. The primary funding source for the Convention Center is hotel occupancy tax, which accounts for $37.2 million, or 61%, of the Convention Center’s total revenue in FY 2012-13. For the 3rd year in a row the ACC Budget does not include any new positions. With plans underway to open two Convention hotels in 2015, a new opportunity will exist for ACC to host larger conventions and to host multiple events simultaneously. In order to meet the significantly increased demand, additional space on the south side of the Convention Center will be needed to offer a more competitive meeting room package. The current meeting room package features small to mid-sized meeting rooms and needs larger rooms that can be divisible, if desired, by operable walls. ACC is currently working with the City of Austin’s Department of Public Works on possible options to add or retrofit space. CIP Highlights - ACC’s FY 2012-13 Capital Budget contains $9.0 million in new appropriations transferred from Convention Center funds for building improvement projects with $3.3 million in spending. The work plan focuses on projects which will help to better serve customers, including the rebuilding of escalators, repairing and upgrading the garages, and upgrading electrical capacity in the pre-function areas of the Convention Center. Renovations to the Palmer Events Center will also have spending. Austin Energy. Austin Energy is the City of Austin’s municipally-owned and operated electric utility providing retail electric service to over 400,000 metered customers in its 437 square mile service area (206 square miles in the City of Austin and 231 square miles in Travis and Williamson counties). Over the past four years, Austin Energy (AE) budget has not been structurally balanced – meaning that available funds were not sufficient to cover requirements. As part of the long-term strategy to strengthen the financial position of the Utility, the City Council approved in FY 2011-12 the first base rate increase in 18 years. The new rate plan, set to take effect on October 1, 2012 is projected to generate $71.0 million in new revenue annually. This additional revenue will maintain the Utility’s long-term financial stability while allowing it to remain responsive to its customers needs. A second component of the long-term financial strategy is continued cost containment efforts. In FY 2012-13, these efforts include stringent limits on workforce growth, reducing controllable contractual and commodities expenses, and deferring capital spending and reducing project scopes when feasible and cost effective. AE’s budget for FY 2012-13 totals $1.28 billion in revenue, including a $10.9 million transfer from the Strategic Reserve Fund, with requirements totaling $1.27 billion. Fuel costs, budgeted at $414.2 million, are passed through to the customer with zero profit added. Fuel cost fluctuations will impact fuel revenue in a similar manner; natural gas prices have been volatile over the past decade and are the main driver of Austin Energy’s fuel cost fluctuations.
2012-13 Proposed Budget, Austin, TX
Volume I | A-13
CIP Highlights – AE’s capital budget for FY 2012-13 includes $177.4 million of new appropriations to support infrastructure improvements. These new and existing appropriations support the FY 2012-13 Capital Improvement Spending Plan of $220.8 million. The Capital Improvements Spending Plan includes: $46.5 million for Power Production projects, $5.2 million for non-nuclear decommissioning related to the Holly Power Plant, $12.8 million for Alternative Energy projects, $76.5 million in Distribution projects, $44.7 million for Transmission projects, $4.5 million for Customer Billing and Metering projects, and $30.6 million for other utility-wide support projects. The $220.8 million FY 2012-13 Capital Improvement Spending Plan is funded with $152.0 million issuance of commercial paper and $68.8 million of transfers from operations (internally generated cash) and beginning cash balances. Austin Resource Recovery. The primary focus of Austin Resource Recovery (ARR) in FY 2012-13 will be on the implementation of its Master Plan in support of the City Council’s Zero Waste goals. A key component of reducing waste is to encourage recycling through price incentives. For FY 2012-13, the ARR is recommending a rate of 16 cents per gallon for the 24, 32, and 64 gallon carts, and a 25 cent per gallon rate for the 96 gallon cart. The per-gallon rate system creates a financial incentive for customers to decrease their trash volume by recycling more items and downsizing their trash cart capacity. Another significant change is renaming of the Anti-Litter fee to the Clean Community Fee. This fee supports litter abatement, street cleaning, and hazardous waste disposal services provided by ARR as well as activities provided by the Code Compliance Department. The FY 2012-13 Budget includes an increase in the fee of $1.00 per month for residential customers and $4.50 per month for commercial customers. ARR’s budget for FY 2012-13 includes an additional 10 positions to support increased resource recovery efforts related to the Department’s various Zero Waste activities as mandated in the recently approved Austin Resource Recovery Master Plan. ARR is also making significant investments in public education in FY 2012-13 related to the new single use bag regulations and recycling requirements at special events. A total of $2.4 million and 4 FTEs are included in the budget for enhanced marketing, outreach and educational activities. CIP Highlights - ARR’s capital budget includes a total appropriation of $14.5 million for capital equipment; primarily for the purchase of compressed natural gas vehicles as part of a multi-year conversion effort from diesel and additional support vehicles for the collection of organic materials at all residential units. ARR will also continue spending on environmental remediation projects at the Harold Court and Loop 360 Landfills. The total spending planned for FY 2012-13 is $21.8 million Austin Transportation. The Austin Transportation Department (ATD) will assume the street banner hanging and removal program from Austin Energy in FY 2012-13, requiring two new positions. A new Ground Transportation Officer and a part-time administrative position are included in the budget to support valet parking enforcement. CIP Highlights - ATD also reinvesting pay station and parking revenue back into the downtown area via a $2.5 million transfer to the capital budget that will provide
2012-13 Proposed Budget, Austin, TX
A-14 | Volume I
increased funding for studying urban rail, implementation of the second phase of wayfinding, and various other downtown and transportation initiatives. Austin Water Utility. The Austin Water Utility (AWU) provides water, wastewater, and reclaimed water services to over 212,000 customers within Austin and surrounding areas. AWU’s budget for FY 2012-13 includes revenue of $514.8 million from the sale of water, wastewater, and reclaimed water service along with other miscellaneous revenue. Total requirements for operations and maintenance, debt service, and transfers total $517.5 million. As part of an overall strategic plan to meet basic core services while continuing to integrate environmental consciousness and sustainability into all of the Utility’s operations, AWU’s budget includes funding for 26 new FTEs. Thirteen of these positions are related to Water Treatment Plant 4. The other 13 positions will be part of an overall strategic plan to meet basic core services while continuing to incorporate and integrate environmental consciousness and sustainability into all Utility operations. Those 13 positions can be broken down into four categories: managing a growing system and staffing new facilities; enhancing water conservation, reclaimed water, water accountability and water quality; planning for the future; and ensuring solid business practices. On the revenue side, AWU is proposing a two-phase change to customer rates for FY 2012-13. The first phase, effective November 1, 2012, will implement a 6.0% system-wide increase for wastewater service and a 10.8% system-wide increase for reclaimed water. The second phase of the rate proposal, effective February 1, 2013, will implement the rate recommendations of the Joint Subcommittee on AWU Financial Planning. The proposed changes include eliminating the current Revenue Stability Fee, redesigning the fixed-revenue structures for all customer classes, integrating new volumetric rate block intervals, and creating a new water revenue stability reserve fund to offset revenue shortfalls. The combined impact of the proposed water and wastewater rate changes on a typical AWU residential customer is projected to be $6.77 per month. CIP Highlights - Austin Water Utility’s Capital budget includes $42.5 million in new appropriations and reallocations to fund new vehicle purchases, wastewater facilities improvements, and expansion of the existing reclaimed water system. Specifically, Water Treatment Plant 4 will continue to be a major priority in FY 2012-13 as AWU works to bring the plant to substantial completion by the spring of 2014. The CIP spending for the department is planned to be $258.6 million. Aviation. Austin Bergstrom International Airport’s (ABIA) budget for FY 2012-13 of $86.6 million and 351 FTEs will enable it to continue providing excellence in customer service—Austin style. Driven by 3.5% projected growth in passenger traffic, Aviation projects landing fees and terminal-lease revenue to increase by 5.7% in FY 2012-13, while non-airline revenue is expected to increase by 16.5%. At the same time, the Department projects holding airline cost per enplaned passenger—a key indicator and an important metric in the airport industry—to $8.94, a 2.4% increase over its FY 2011-12 target. Providing quality facilities while controlling costs is critical to maintaining a reasonable cost per enplaned passenger. CIP Highlights - Aviation will continue its ongoing efforts to make improvements to its airside, landside, and terminal areas with an increased appropriation of $24.5 million. The FY 2012-13 spending plan of $60.6 million will focus on terminal and other airport
2012-13 Proposed Budget, Austin, TX
Volume I | A-15
facility improvements, such as terminal expansion, freight and garage elevator refurbishment, roadway safety and security upgrades, and overflow parking lot improvements. Code Compliance. The Code Compliance Department has historically been funded through transfers from Austin Resource Recovery Fund and the General Fund. Beginning in FY 2012-13, the Code Compliance Department will be funded primarily by a portion of the revenue generated from the Clean Community Fee (previously the Anti-Litter Fee). The FY 2012-13 Budget includes an increase in the fee of $1.00 per month for residential customers and $4.50 per month for commercial customers to support both Austin Resource Recovery and Code Compliance activities. Specifically for Code, the increase in revenue generated through the higher fee will support the addition of 8 new FTEs that help the Department meet the community’s expectations of service and responsiveness and allow for implementation of a proactive Multi-Family Inspection Program. The Department’s budget includes funding for another 9 FTEs needed to effectively enforce the Private Waste Hauler Ordinance. Administration of this program is transferring from ARR to the Code Compliance in FY 2012-13. Economic Growth and Redevelopment Services. In FY 2012-13, the Economic Growth and Redevelopment Services Department (EGRSO) will focus its efforts on promoting economic growth, attracting corporate business, promoting sustainable growth in the Desired Development Zone, assisting locally-owned small businesses, and continuing to support creative development through arts and music. In support of these efforts and in collaboration with numerous other City departments, EGRSO is opening a new one-stop-shop Special Events Center in FY 2012-13. When complete, the new Center will greatly streamline the permitting process for special events in Austin. Neighborhood Housing and Community Development. The Neighborhood Housing and Community Development Department (NHCD) provides housing, community development, and small business development services to benefit eligible residents. The primary funding source for these services and staff support are federal grant awards. In FY 2012-13, NHCD is receiving $1.8 million less in federal CDBG and HOME grants. This loss is substantially offset by $1.3 million in one-time grant funds from the Neighborhood Stabilization Program, Lead Hazard Reduction, and the Sustainable Community Challenge grants awarded in the prior year. To further mitigate the drop in CDBG and HOME grant funds, NHCD will begin charging the personnel costs for five previously grant-funded positions to the Housing Trust Fund. An increase of $0.5 million in the transfer from the Sustainability Fund is also included to fully fund public facilities, such as the African American Cultural and Heritage Facility, and to provide ongoing maintenance and support to the Urban Renewal Agency. Though these corporate and department actions have minimized the negative impact to services in FY 2012-13, NHCD anticipates that grant funding will continue to be a challenge in future years. The department will be addressing this challenge, which includes a review of current grant programs and other funding options, prior to the FY 2013-14 budget process. CIP Highlights – NHCD expects to expend nearly $4.5 million on various projects, primarily funded through previously appropriated funds from the 2006 GO Bond program to make eligible repairs through sub-recipients to eliminate health and safety hazards and/or provide improved accessibility for low and moderate income homeowners.
2012-13 Proposed Budget, Austin, TX
A-16 | Volume I
Public Works. The Public Works Department (PWD) is responsible for providing preventive street maintenance, street repair, transportation planning, and transportation enhancement programs, as well as managing the city’s bicycle and pedestrian infrastructure and maintenance of the city’s off-street right-of-way. One of the City’s annual goals is to maintain 80% of the street inventory in fair to excellent condition, which requires providing preventive maintenance to ten percent of the street inventory annually. Due to the department’s commitment to achieving this goal, it is estimated PWD will finish the year at 81% and is projecting 82% for FY 2012-13. Public Works operations are largely funded through the Transportation User Fee. An increase of $0.51 per single-family residence is proposed to support the existing and new initiatives. In FY 2010-11, Public Works began a cyclic tree maintenance program and has initiated improvements to the center islands, medians, and other structures. The next initiative is to further manage and enhance the right-of-way appearance and condition. Funding for 4 new positions is included in the budget to address this through a more aggressive tree planting program and replacement of irrigated areas with more drought tolerant plantings. Another focus is increasing career progression opportunities for Street and Bridge staff. Three positions will supplement the career training and progression program for street and bridge operations. These positions will focus on developing skills testing and verification, recordkeeping, and certification of Street and Bridge equipment operators. The Public Works Department has the organizational mission to provide an integrated approach to the development, design, construction, and maintenance of the City’s infrastructure systems and facilities. CIP Highlights - The Department’s FY 2012-13 capital budget includes a total appropriation of approximately $2.0 million sidewalk improvements and technology projects. Other significant highlights for capital projects continuing or scheduled for completion are the Boardwalk Trail at Lady Bird Lake, the Neighborhood Partnering Program, and the street reconstruction project for 3rd Street. Public Works combined with Austin Transportation Department has an estimated spending plan for FY 2012-13 at $87.7 million. Watershed Protection. The Watershed Protection Department (WPD), was established in 1991 to maintain and improve water quality, reduce the impact of flooding, create stable stream systems and maintain the City’s drainage infrastructure. The primary source of funding for the Watershed Protection Department is a monthly drainage fee assessed to City of Austin utility customers. A 7.7% increase to the base billing unit (equivalent residential unit) is proposed for FY 2012-13. Primary cost drivers for WPD in FY 2012-13 include basic personnel costs of $1.0 million, transfers and other requirements which include a $1.9 million increase to the Enterprise Capital Improvements Program and a $1.4 million transfer for City Administrative Support. Additionally, contractual costs for service agreement contracts also increased by $400K due to the increase prices of asphalt, concrete, drainage materials, sand and gravel. There are no new FTE for FY 2012-13. CIP Highlights - WPD’s capital budget for FY 2012-13 includes a total new appropriation of $31.4 million. This appropriation includes funding for the Waller Creek Tunnel, erosion control, flood control improvements, localized drainage improvements, water quality
2012-13 Proposed Budget, Austin, TX
Volume I | A-17
remediation/protection projects, vehicle purchases, and database and GIS projects. The appropriation also includes 2006 General Obligation Bond funding for Watershed Protection Master Plan projects as well as Urban Watershed Structural Control funds from the water quality fee-in-lieu program. WPD will continue making progress on numerous projects related to creek flood hazard mitigation, stormwater pond safety, localized flood hazard mitigation, stormwater treatment, and stream restoration. WPD’s FY 2012-13 spending plan is $50.9 million.
Internal Service Highlights Support Services Departments. Departments within the Support Services Fund provide assistance to the City of Austin and its citizens. These services include providing objective analysis of the adequacy of the City’s management systems, maintaining the financial integrity of the City government, providing a liaison between the City and other governmental entities and legislative bodies, managing the City’s human resources, and overseeing the implementation of all programs and services. Significant changes to the Support Services FY 2013 Budget include the following: Contract Management Department (CMD) and Office of Real Estate Services. These two departments are moving into the Support Services Fund from the Capital Projects Management Fund (CPMF) to better align CMD with the City Purchasing Office within the Financial Services Department, allowing for greater consistency in the City’s overall procurement function. As a result, requirements are increasing by $7.3 million and 78 FTEs have been added. The increase to Support Services is offset by a commensurate reduction in the CPMF. Small and Minority Business Review (SMBR). A one-time increase of $1.2 million is included in the budget for a legally-mandated disparity study. The disparity study examines business utilization in Austin-Round Rock MSA to determine statistical disparities by race, ethnicity and gender classification. It also examines the effect of remedial race- and gender-based efforts by the City of Austin. This study is used to guide SMBR’s program development and City WBE/MBE purchasing policies. According to State Code, a disparity study must be conducted every 5 years. The last study expires December 31, 2013. Building Services. The growth in both the number and age of City facilities has outpaced the Building Services Department’s capacity to manage and maintain these facilities. To begin addressing this issue, five new positions are being added in FY 2012-13, the first part of a 3 year plan to bring staffing levels into alignment with work load. Law Department. The new Ethics and Compliance team is being expanded by four positions. The team will build on the platform provided by the Integrity Office, formally housed in Management Services, and focus on public information, open meetings, financial disclosure, and document retention.
2012-13 Proposed Budget, Austin, TX
A-18 | Volume I
Financial Services Department (FSD). FSD’s budget for FY 2012-13 includes 4 new positions to improve financial reporting, enhance internal control activities and support the implementation of a new contract monitoring activity.
Human Resources Department (HRD). HRD is adding personnel to support the anticipated conversion of EMS to civil staffing, the Banner records program, and the growing employee retirement system. Communications and Technology Management (CTM). The Communications and Technology Management Department (CTM) supports the City’s major technology infrastructure and initiatives, from providing a reliable and secure network to conduct business to spearheading the use of new technologies to improve productivity and effectiveness. The Department provides critical installation and maintenance of several public safety communication systems and devices, as well as provides training and help desk services to City employees. CIP Highlights – CTM has a total new appropriation for FY 2012-13 at $50.4 million and spending plans at $17.7 million. This is for projects addressing both ongoing technology maintenance and replacement and funding for new initiatives and major projects. To ensure the City is effectively managing its information technology (IT) infrastructure, funding is also included in the total appropriation to conduct a citywide IT Assessment study. While the scope of work has yet to be determined, the ultimate goal is to survey the existing IT framework including resources, policies, practices and goals, factoring in business needs and resource availability, to produce an organization-wide plan that can help guide and inform the City’s future IT decisions. Two major capital projects are included in the Department’s FY 2012-13 budget: $32 million for component replacement of the Greater Austin/Travis County Regional Radio System (GATRRS) and $11.8 million to upgrade the City of Austin Telecommunications Network (COATN). Construction of GATRRS began in 2001. Infrastructure equipment—microwave radios and antennas, voice radio repeaters, and dispatch consoles—is approaching obsolescence. For the system, which is the communication backbone for the areas’ public safety agencies, to stay functional and reliable, these three major component groups have to be replaced. Additionally, the current fiber optic network, COATN, cannot support current and future telecommunications projects due to a lack of capacity to transmit large amounts of data and lack of adequate bandwidth. The proliferation of video web streaming, training, video teleconferencing, and event monitoring have surpassed the existing system’s capabilities. To ensure adequate bandwidth resources for many years to come, system hardware needs to be upgraded, an initiative that is currently being pursued by the Department.
Conclusion Our adherence to structurally balanced budgets, while making critical investments that will benefit Austin now and in the future, is setting the standard for what a best managed 21st century city should be. A fundamental component of the Austin model is the active engagement of our citizens. The benefits of this approach are two-fold: hearing from
2012-13 Proposed Budget, Austin, TX
Volume I | A-19
citizens about their needs, but also informing citizens about the resources needed to keep providing the high-quality services that they demand. And the citizens have told us that we are providing high quality services, in fact the results of the annual citizen satisfaction survey tell us that we “continue to set the standard for customer service among top U.S. cities.” This year’s proposed budget, and associated property tax rate of 50.29 cents per $100 of taxable value, allows the General Fund to cover $38.7 million in cost drivers as well as investing $5.9 million in unmet service demands. This budget enhances public safety by adding 22 new police officers to maintain a ratio of 2.0 officers per 1,000 residents and also includes annualized costs for 12 paramedics added in FY 2011-12 to staff the new Mueller station and 6 new paramedics for an additional peak-demand unit. The Fire Department recent award of the SAFER grant will allow the department to achieve four-person staffing on the remaining three aerial trucks as well as three rescue units. Users of our libraries, parks, and community centers will likewise experience markedly better service with the addition of 25.5 positions to these services areas. And finally, the 3 additional positions included in the budget of the Planning & Development Review Department, in addition to the 11 added during FY 2011-12, will provide the City with the resources needed to implement the Imagine Austin Comprehensive Plan and to serve as a catalyst for development activity and economic growth throughout the City. In accordance with our model of planning for the future, we will continue to make key infrastructure investments throughout the City. The FY 2012-13 General Government CIP appropriations total $87.9 million and Enterprise Government CIP appropriations total $299.4 million. These investments are critical to maintaining quality of life for our residents, and for creating a reliable infrastructure back-bone for businesses. The City of Austin closely follows its financial policies in order to maintain the highest bond ratings among all three agencies. Our Government Obligation Bond rating is Aaa with Moody’s and AAA with the Standard & Poor’s and Fitch Investors bond rating agencies. Our adherence to structurally balanced budgets, maintaining reserves, and making wise investment choices are at the heart of these ratings. A community is ultimately defined by its people. But it can be highly influenced by the actions of local government. We have been good stewards of our citizen’s tax dollars—always remaining cognizant of the importance of keeping Austin affordable, but continuing to make the needed investments to maintain Austin as the most livable city in the country, a truly unique place that businesses and families want to call home.
2012-13 Proposed Budget, Austin, TX
A-20 | Volume I

All Funds Budget in Brief

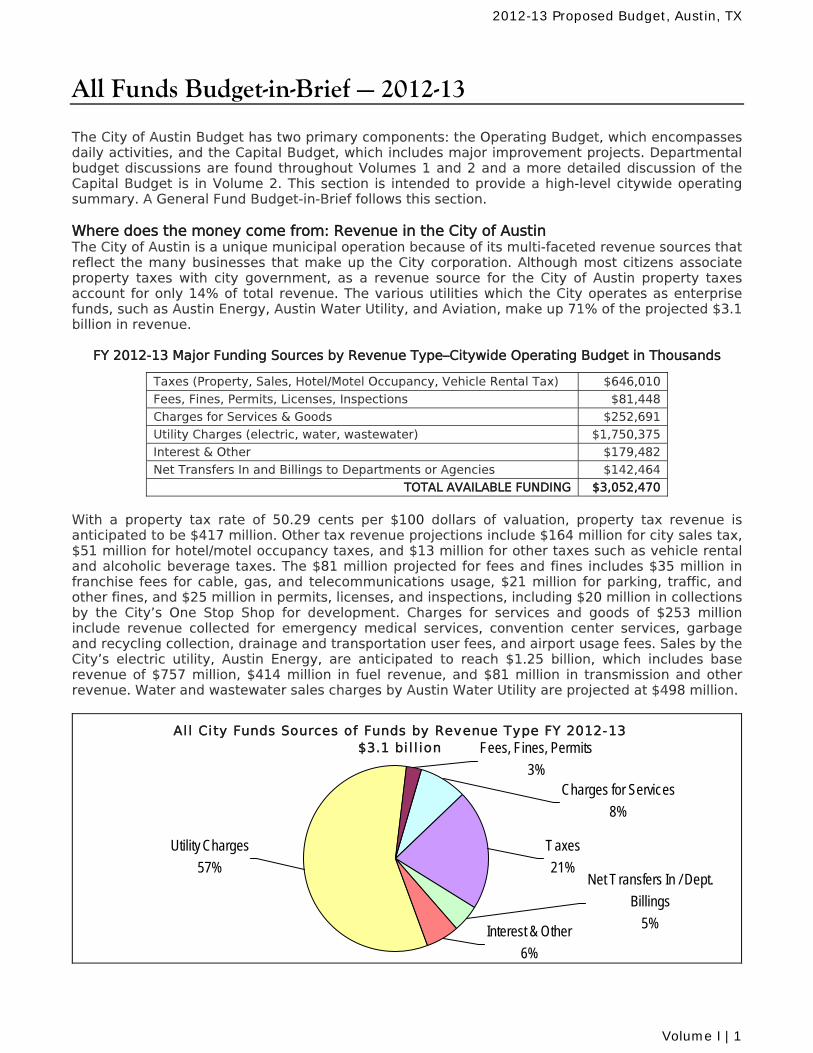
All Funds Budget-in-Brief — 2012-13 The City of Austin Budget has two primary components: the Operating Budget, which encompasses daily activities, and the Capital Budget, which includes major improvement projects. Departmental budget discussions are found throughout Volumes 1 and 2 and a more detailed discussion of the Capital Budget is in Volume 2. This section is intended to provide a high-level citywide operating summary. A General Fund Budget-in-Brief follows this section. Where does the money come from: Revenue in the City of Austin The City of Austin is a unique municipal operation because of its multi-faceted revenue sources that reflect the many businesses that make up the City corporation. Although most citizens associate property taxes with city government, as a revenue source for the City of Austin property taxes account for only 14% of total revenue. The various utilities which the City operates as enterprise funds, such as Austin Energy, Austin Water Utility, and Aviation, make up 71% of the projected $3.1 billion in revenue.
FY 2012-13 Major Funding Sources by Revenue Type–Citywide Operating Budget in Thousands
Taxes (Property, Sales, Hotel/Motel Occupancy, Vehicle Rental Tax) $646,010
Fees, Fines, Permits, Licenses, Inspections $81,448
Charges for Services & Goods $252,691
Utility Charges (electric, water, wastewater) $1,750,375
Interest & Other $179,482
Net Transfers In and Billings to Departments or Agencies $142,464
TOTAL AVAILABLE FUNDING $3,052,470 With a property tax rate of 50.29 cents per $100 dollars of valuation, property tax revenue is anticipated to be $417 million. Other tax revenue projections include $164 million for city sales tax, $51 million for hotel/motel occupancy taxes, and $13 million for other taxes such as vehicle rental and alcoholic beverage taxes. The $81 million projected for fees and fines includes $35 million in franchise fees for cable, gas, and telecommunications usage, $21 million for parking, traffic, and other fines, and $25 million in permits, licenses, and inspections, including $20 million in collections by the City’s One Stop Shop for development. Charges for services and goods of $253 million include revenue collected for emergency medical services, convention center services, garbage and recycling collection, drainage and transportation user fees, and airport usage fees. Sales by the City’s electric utility, Austin Energy, are anticipated to reach $1.25 billion, which includes base revenue of $757 million, $414 million in fuel revenue, and $81 million in transmission and other revenue. Water and wastewater sales charges by Austin Water Utility are projected at $498 million.
Al l City Funds Sources of Funds by Revenue Type FY 2012-13$3.1 bi l l ion
Interest & Other
6%
Net T ransfers In / Dept.
Billings
5%
Taxes
21%
Fees, Fines, Permits
3%Charges for Services
8%
Utility Charges
57%
2012-13 Proposed Budget, Austin, TX
Volume I | 1
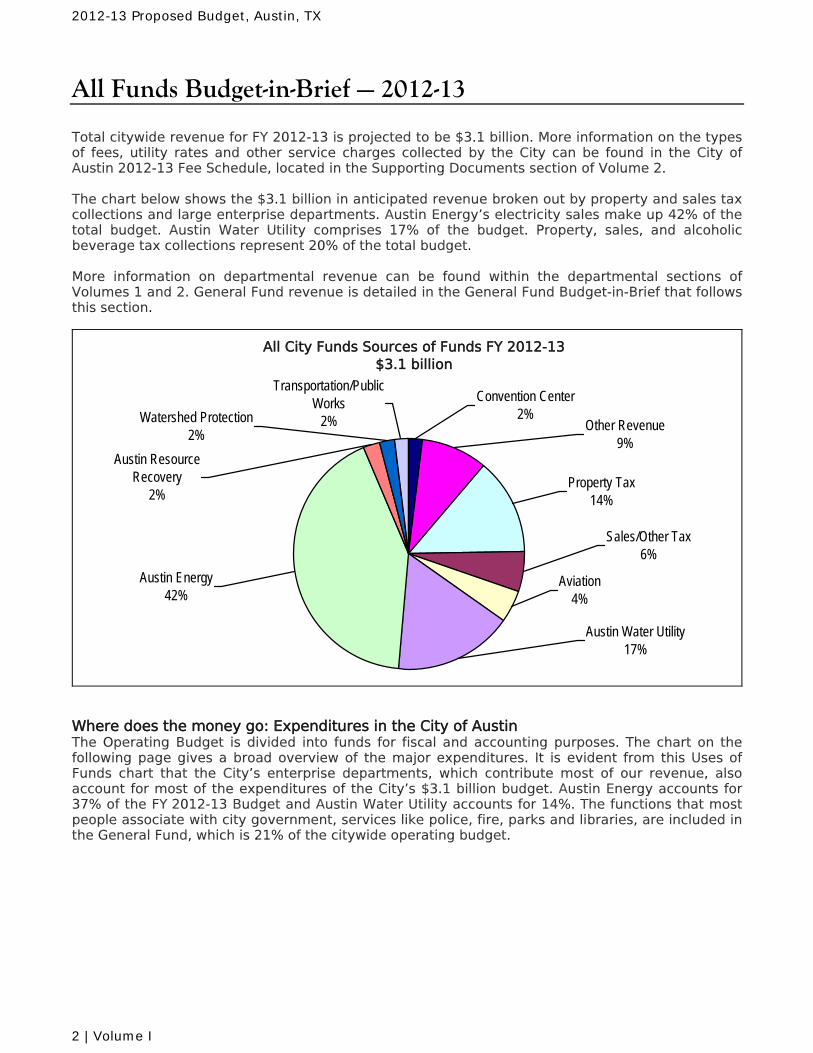
All Funds Budget-in-Brief — 2012-13 Total citywide revenue for FY 2012-13 is projected to be $3.1 billion. More information on the types of fees, utility rates and other service charges collected by the City can be found in the City of Austin 2012-13 Fee Schedule, located in the Supporting Documents section of Volume 2. The chart below shows the $3.1 billion in anticipated revenue broken out by property and sales tax collections and large enterprise departments. Austin Energy’s electricity sales make up 42% of the total budget. Austin Water Utility comprises 17% of the budget. Property, sales, and alcoholic beverage tax collections represent 20% of the total budget. More information on departmental revenue can be found within the departmental sections of Volumes 1 and 2. General Fund revenue is detailed in the General Fund Budget-in-Brief that follows this section.
All City Funds Sources of Funds FY 2012-13$3.1 billion
Transportation/Public Works
2%Watershed Protection2%
Sales/Other Tax6%
Aviation4%
Convention Center2%
Other Revenue9%
Property Tax14%
Austin Water Utility17%
Austin Resource Recovery
2%
Austin Energy42%
Where does the money go: Expenditures in the City of Austin The Operating Budget is divided into funds for fiscal and accounting purposes. The chart on the following page gives a broad overview of the major expenditures. It is evident from this Uses of Funds chart that the City’s enterprise departments, which contribute most of our revenue, also account for most of the expenditures of the City’s $3.1 billion budget. Austin Energy accounts for 37% of the FY 2012-13 Budget and Austin Water Utility accounts for 14%. The functions that most people associate with city government, services like police, fire, parks and libraries, are included in the General Fund, which is 21% of the citywide operating budget.
2012-13 Proposed Budget, Austin, TX
2 | Volume I
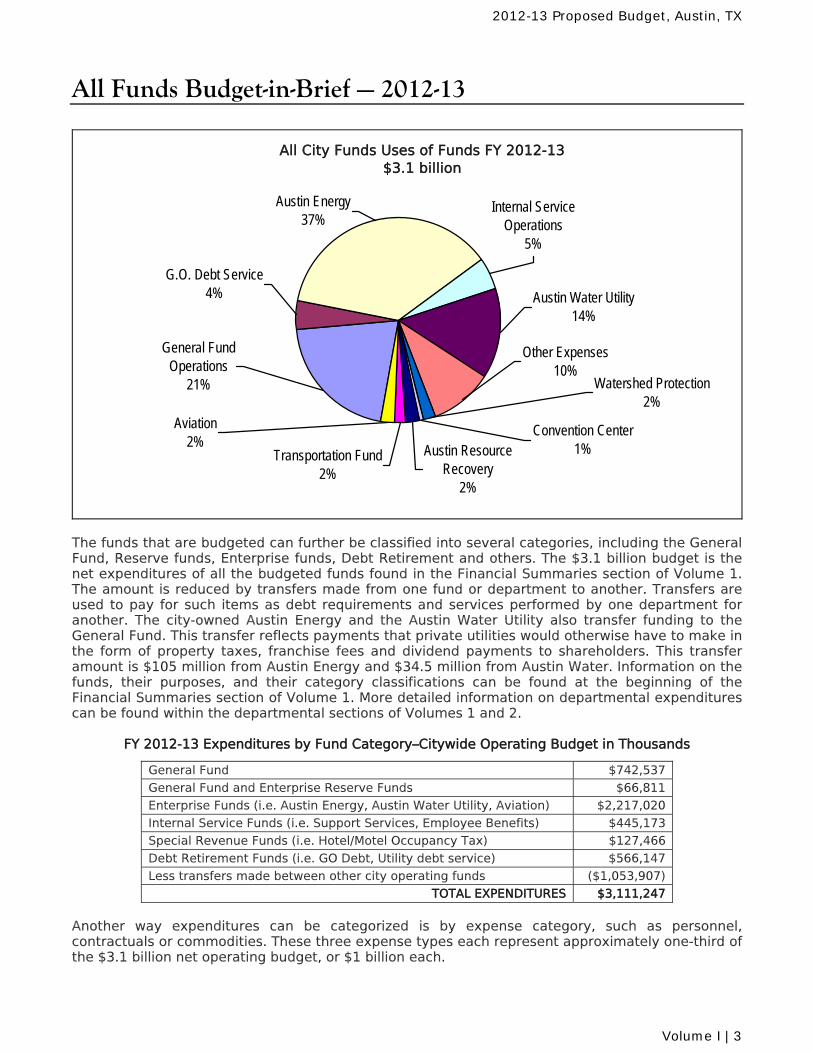
All Funds Budget-in-Brief — 2012-13
All City Funds Uses of Funds FY 2012-13$3.1 billion
Convention Center1%Austin Resource
Recovery2%
Transportation Fund2%
Aviation2%
G.O. Debt Service4%
General Fund Operations
21% Watershed Protection2%
Other Expenses10%
Austin Water Utility14%
Internal Service Operations
5%
Austin Energy37%
The funds that are budgeted can further be classified into several categories, including the General Fund, Reserve funds, Enterprise funds, Debt Retirement and others. The $3.1 billion budget is the net expenditures of all the budgeted funds found in the Financial Summaries section of Volume 1. The amount is reduced by transfers made from one fund or department to another. Transfers are used to pay for such items as debt requirements and services performed by one department for another. The city-owned Austin Energy and the Austin Water Utility also transfer funding to the General Fund. This transfer reflects payments that private utilities would otherwise have to make in the form of property taxes, franchise fees and dividend payments to shareholders. This transfer amount is $105 million from Austin Energy and $34.5 million from Austin Water. Information on the funds, their purposes, and their category classifications can be found at the beginning of the Financial Summaries section of Volume 1. More detailed information on departmental expenditures can be found within the departmental sections of Volumes 1 and 2.
FY 2012-13 Expenditures by Fund Category–Citywide Operating Budget in Thousands
General Fund $742,537
General Fund and Enterprise Reserve Funds $66,811
Enterprise Funds (i.e. Austin Energy, Austin Water Utility, Aviation) $2,217,020
Internal Service Funds (i.e. Support Services, Employee Benefits) $445,173
Special Revenue Funds (i.e. Hotel/Motel Occupancy Tax) $127,466
Debt Retirement Funds (i.e. GO Debt, Utility debt service) $566,147
Less transfers made between other city operating funds ($1,053,907)
TOTAL EXPENDITURES $3,111,247 Another way expenditures can be categorized is by expense category, such as personnel, contractuals or commodities. These three expense types each represent approximately one-third of the $3.1 billion net operating budget, or $1 billion each.
2012-13 Proposed Budget, Austin, TX
Volume I | 3
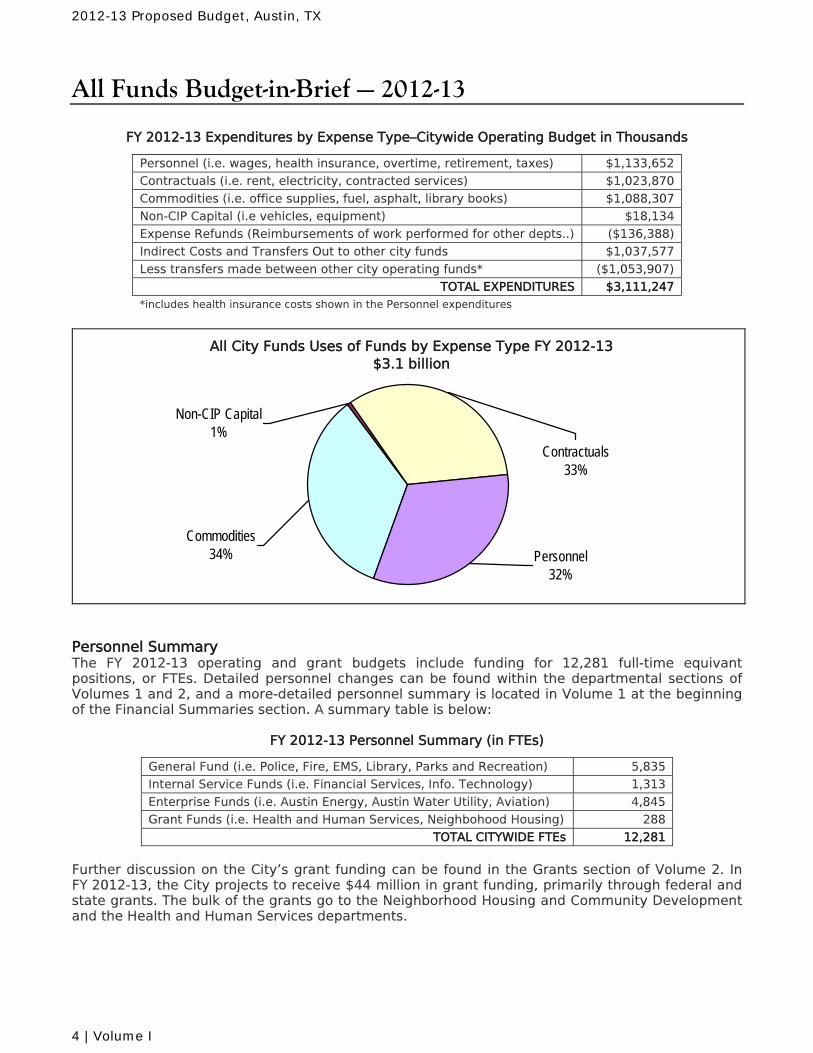
All Funds Budget-in-Brief — 2012-13
FY 2012-13 Expenditures by Expense Type–Citywide Operating Budget in Thousands
Personnel (i.e. wages, health insurance, overtime, retirement, taxes) $1,133,652
Contractuals (i.e. rent, electricity, contracted services) $1,023,870
Commodities (i.e. office supplies, fuel, asphalt, library books) $1,088,307
Non-CIP Capital (i.e vehicles, equipment) $18,134
Expense Refunds (Reimbursements of work performed for other depts..) ($136,388)
Indirect Costs and Transfers Out to other city funds $1,037,577
Less transfers made between other city operating funds* ($1,053,907)
TOTAL EXPENDITURES $3,111,247*includes health insurance costs shown in the Personnel expenditures
All City Funds Uses of Funds by Expense Type FY 2012-13$3.1 billion
Commodities34% Personnel
32%
Non-CIP Capital1%
Contractuals33%
Personnel Summary The FY 2012-13 operating and grant budgets include funding for 12,281 full-time equivant positions, or FTEs. Detailed personnel changes can be found within the departmental sections of Volumes 1 and 2, and a more-detailed personnel summary is located in Volume 1 at the beginning of the Financial Summaries section. A summary table is below:
FY 2012-13 Personnel Summary (in FTEs)
General Fund (i.e. Police, Fire, EMS, Library, Parks and Recreation) 5,835
Internal Service Funds (i.e. Financial Services, Info. Technology) 1,313
Enterprise Funds (i.e. Austin Energy, Austin Water Utility, Aviation) 4,845
Grant Funds (i.e. Health and Human Services, Neighbohood Housing) 288
TOTAL CITYWIDE FTEs 12,281 Further discussion on the City’s grant funding can be found in the Grants section of Volume 2. In FY 2012-13, the City projects to receive $44 million in grant funding, primarily through federal and state grants. The bulk of the grants go to the Neighborhood Housing and Community Development and the Health and Human Services departments.
2012-13 Proposed Budget, Austin, TX
4 | Volume I
All Funds Budget-in-Brief — 2012-13 All Funds Summary The table on the following page summarizes citywide revenue and expenditures by both revenue or expense types and fund category. That is followed by a more detailed all funds summary, including two years of prior year actuals, FY 2011-12 budgets and current year estimates and the proposed budget of each budgeted fund. Detailed budget and financial information for each fund is located in the Financial Summaries section of Volume 1. The fund summaries are in alphabetical order after presentation of the General and Support Services Funds. The change in fund summary balances for all funds in the aggregate is projected to be negative seven percent. The General Fund is structurally balanced, with projected revenue matching expenditures.
2012-13 Proposed Budget, Austin, TX
Volume I | 5
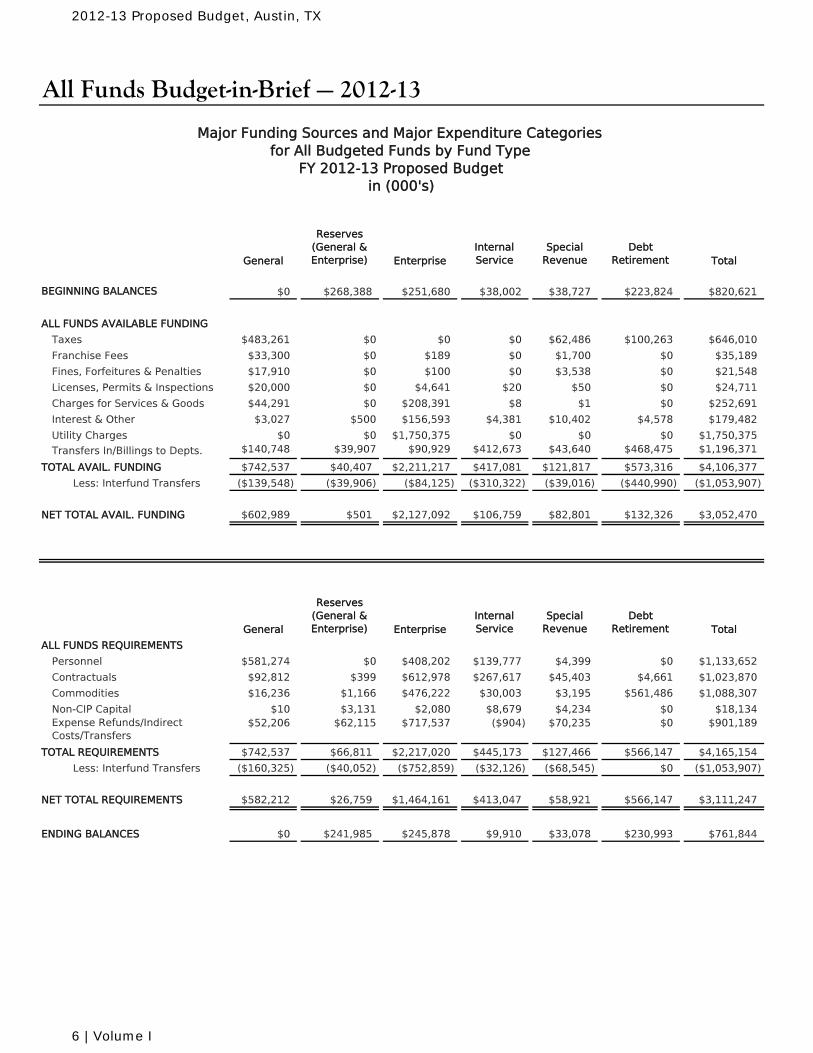
All Funds Budget-in-Brief — 2012-13
General
Reserves (General & Enterprise) Enterprise
Internal Service
Special Revenue
Debt Retirement Total
BEGINNING BALANCES $0 $268,388 $251,680 $38,002 $38,727 $223,824 $820,621
ALL FUNDS AVAILABLE FUNDING
Taxes $483,261 $0 $0 $0 $62,486 $100,263 $646,010
Franchise Fees $33,300 $0 $189 $0 $1,700 $0 $35,189
Fines, Forfeitures & Penalties $17,910 $0 $100 $0 $3,538 $0 $21,548
Licenses, Permits & Inspections $20,000 $0 $4,641 $20 $50 $0 $24,711
Charges for Services & Goods $44,291 $0 $208,391 $8 $1 $0 $252,691
Interest & Other $3,027 $500 $156,593 $4,381 $10,402 $4,578 $179,482
Utility Charges $0 $0 $1,750,375 $0 $0 $0 $1,750,375
Transfers In/Billings to Depts. $140,748 $39,907 $90,929 $412,673 $43,640 $468,475 $1,196,371
TOTAL AVAIL. FUNDING $742,537 $40,407 $2,211,217 $417,081 $121,817 $573,316 $4,106,377
Less: Interfund Transfers ($139,548) ($39,906) ($84,125) ($310,322) ($39,016) ($440,990) ($1,053,907)
NET TOTAL AVAIL. FUNDING $602,989 $501 $2,127,092 $106,759 $82,801 $132,326 $3,052,470
General
Reserves (General & Enterprise) Enterprise
Internal Service
Special Revenue
Debt Retirement Total
ALL FUNDS REQUIREMENTS
Personnel $581,274 $0 $408,202 $139,777 $4,399 $0 $1,133,652
Contractuals $92,812 $399 $612,978 $267,617 $45,403 $4,661 $1,023,870
Commodities $16,236 $1,166 $476,222 $30,003 $3,195 $561,486 $1,088,307
Non-CIP Capital $10 $3,131 $2,080 $8,679 $4,234 $0 $18,134Expense Refunds/Indirect Costs/Transfers
$52,206 $62,115 $717,537 ($904) $70,235 $0 $901,189
TOTAL REQUIREMENTS $742,537 $66,811 $2,217,020 $445,173 $127,466 $566,147 $4,165,154
Less: Interfund Transfers ($160,325) ($40,052) ($752,859) ($32,126) ($68,545) $0 ($1,053,907)
NET TOTAL REQUIREMENTS $582,212 $26,759 $1,464,161 $413,047 $58,921 $566,147 $3,111,247
ENDING BALANCES $0 $241,985 $245,878 $9,910 $33,078 $230,993 $761,844
Major Funding Sources and Major Expenditure Categoriesfor All Budgeted Funds by Fund Type
FY 2012-13 Proposed Budgetin (000's)
2012-13 Proposed Budget, Austin, TX
6 | Volume I
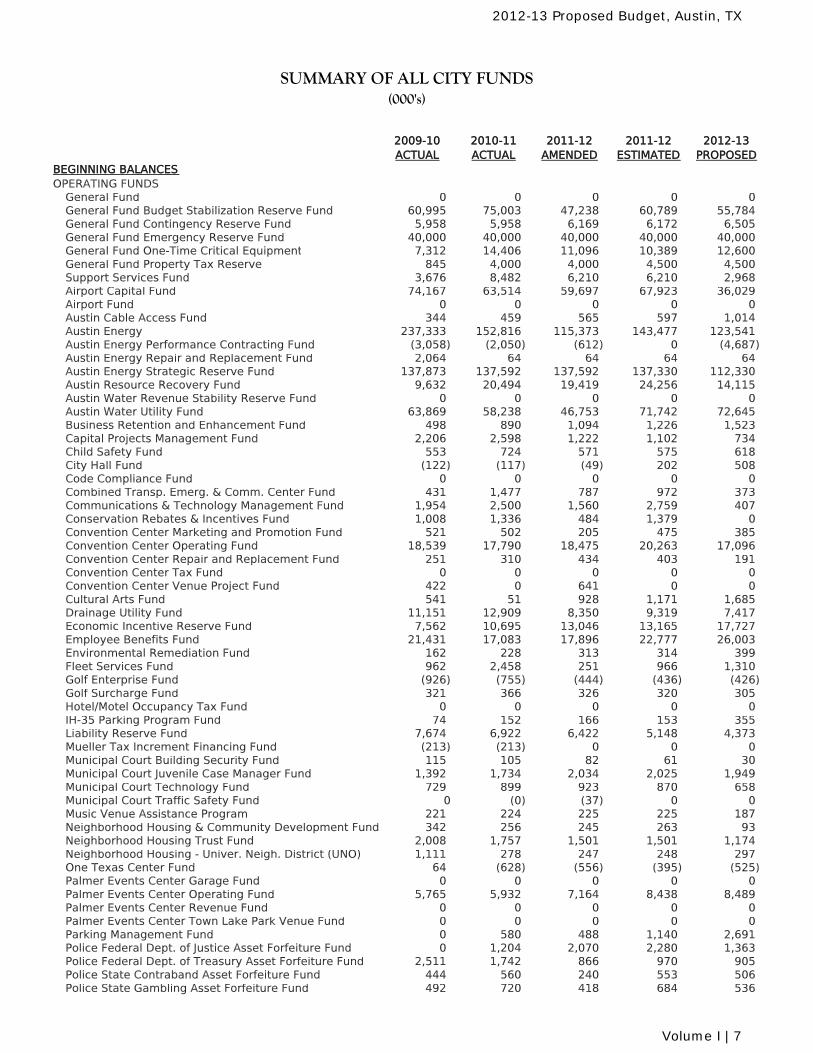
SUMMARY OF ALL CITY FUNDS(000's)
2009-10 2010-11 2011-12 2011-12 2012-13ACTUAL ACTUAL AMENDED ESTIMATED PROPOSED
BEGINNING BALANCESOPERATING FUNDS
General Fund 0 0 0 0 0General Fund Budget Stabilization Reserve Fund 60,995 75,003 47,238 60,789 55,784General Fund Contingency Reserve Fund 5,958 5,958 6,169 6,172 6,505General Fund Emergency Reserve Fund 40,000 40,000 40,000 40,000 40,000General Fund One-Time Critical Equipment 7,312 14,406 11,096 10,389 12,600General Fund Property Tax Reserve 845 4,000 4,000 4,500 4,500Support Services Fund 3,676 8,482 6,210 6,210 2,968Airport Capital Fund 74,167 63,514 59,697 67,923 36,029Airport Fund 0 0 0 0 0Austin Cable Access Fund 344 459 565 597 1,014Austin Energy 237,333 152,816 115,373 143,477 123,541Austin Energy Performance Contracting Fund (3,058) (2,050) (612) 0 (4,687)Austin Energy Repair and Replacement Fund 2,064 64 64 64 64Austin Energy Strategic Reserve Fund 137,873 137,592 137,592 137,330 112,330Austin Resource Recovery Fund 9,632 20,494 19,419 24,256 14,115Austin Water Revenue Stability Reserve Fund 0 0 0 0 0Austin Water Utility Fund 63,869 58,238 46,753 71,742 72,645Business Retention and Enhancement Fund 498 890 1,094 1,226 1,523Capital Projects Management Fund 2,206 2,598 1,222 1,102 734Child Safety Fund 553 724 571 575 618City Hall Fund (122) (117) (49) 202 508Code Compliance Fund 0 0 0 0 0Combined Transp. Emerg. & Comm. Center Fund 431 1,477 787 972 373Communications & Technology Management Fund 1,954 2,500 1,560 2,759 407Conservation Rebates & Incentives Fund 1,008 1,336 484 1,379 0Convention Center Marketing and Promotion Fund 521 502 205 475 385Convention Center Operating Fund 18,539 17,790 18,475 20,263 17,096Convention Center Repair and Replacement Fund 251 310 434 403 191Convention Center Tax Fund 0 0 0 0 0Convention Center Venue Project Fund 422 0 641 0 0Cultural Arts Fund 541 51 928 1,171 1,685Drainage Utility Fund 11,151 12,909 8,350 9,319 7,417Economic Incentive Reserve Fund 7,562 10,695 13,046 13,165 17,727Employee Benefits Fund 21,431 17,083 17,896 22,777 26,003Environmental Remediation Fund 162 228 313 314 399Fleet Services Fund 962 2,458 251 966 1,310Golf Enterprise Fund (926) (755) (444) (436) (426)Golf Surcharge Fund 321 366 326 320 305Hotel/Motel Occupancy Tax Fund 0 0 0 0 0IH-35 Parking Program Fund 74 152 166 153 355Liability Reserve Fund 7,674 6,922 6,422 5,148 4,373Mueller Tax Increment Financing Fund (213) (213) 0 0 0Municipal Court Building Security Fund 115 105 82 61 30Municipal Court Juvenile Case Manager Fund 1,392 1,734 2,034 2,025 1,949Municipal Court Technology Fund 729 899 923 870 658Municipal Court Traffic Safety Fund 0 (0) (37) 0 0Music Venue Assistance Program 221 224 225 225 187Neighborhood Housing & Community Development Fund 342 256 245 263 93Neighborhood Housing Trust Fund 2,008 1,757 1,501 1,501 1,174Neighborhood Housing - Univer. Neigh. District (UNO) 1,111 278 247 248 297One Texas Center Fund 64 (628) (556) (395) (525)Palmer Events Center Garage Fund 0 0 0 0 0Palmer Events Center Operating Fund 5,765 5,932 7,164 8,438 8,489Palmer Events Center Revenue Fund 0 0 0 0 0Palmer Events Center Town Lake Park Venue Fund 0 0 0 0 0Parking Management Fund 0 580 488 1,140 2,691Police Federal Dept. of Justice Asset Forfeiture Fund 0 1,204 2,070 2,280 1,363Police Federal Dept. of Treasury Asset Forfeiture Fund 2,511 1,742 866 970 905Police State Contraband Asset Forfeiture Fund 444 560 240 553 506Police State Gambling Asset Forfeiture Fund 492 720 418 684 536
2012-13 Proposed Budget, Austin, TX
Volume I | 7
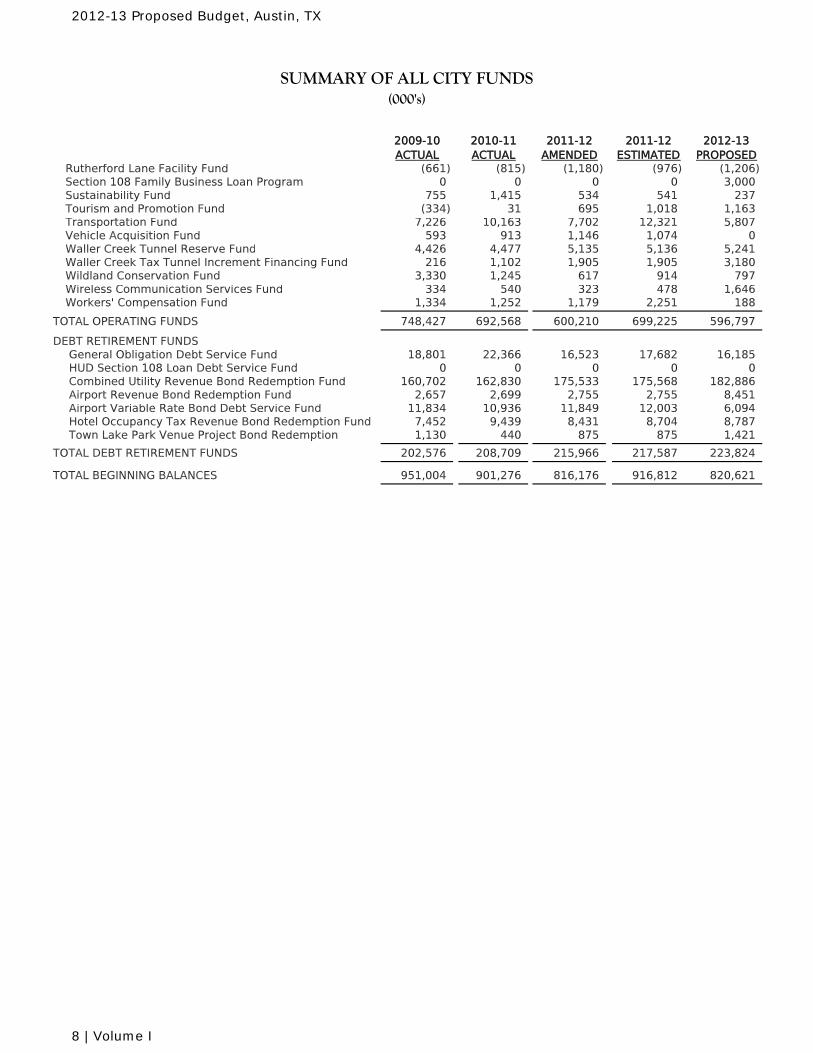
SUMMARY OF ALL CITY FUNDS(000's)
2009-10 2010-11 2011-12 2011-12 2012-13ACTUAL ACTUAL AMENDED ESTIMATED PROPOSED
Rutherford Lane Facility Fund (661) (815) (1,180) (976) (1,206)Section 108 Family Business Loan Program 0 0 0 0 3,000Sustainability Fund 755 1,415 534 541 237Tourism and Promotion Fund (334) 31 695 1,018 1,163Transportation Fund 7,226 10,163 7,702 12,321 5,807Vehicle Acquisition Fund 593 913 1,146 1,074 0Waller Creek Tunnel Reserve Fund 4,426 4,477 5,135 5,136 5,241Waller Creek Tax Tunnel Increment Financing Fund 216 1,102 1,905 1,905 3,180Wildland Conservation Fund 3,330 1,245 617 914 797Wireless Communication Services Fund 334 540 323 478 1,646Workers' Compensation Fund 1,334 1,252 1,179 2,251 188
TOTAL OPERATING FUNDS 748,427 692,568 600,210 699,225 596,797
DEBT RETIREMENT FUNDS General Obligation Debt Service Fund 18,801 22,366 16,523 17,682 16,185 HUD Section 108 Loan Debt Service Fund 0 0 0 0 0 Combined Utility Revenue Bond Redemption Fund 160,702 162,830 175,533 175,568 182,886 Airport Revenue Bond Redemption Fund 2,657 2,699 2,755 2,755 8,451 Airport Variable Rate Bond Debt Service Fund 11,834 10,936 11,849 12,003 6,094 Hotel Occupancy Tax Revenue Bond Redemption Fund 7,452 9,439 8,431 8,704 8,787 Town Lake Park Venue Project Bond Redemption 1,130 440 875 875 1,421
TOTAL DEBT RETIREMENT FUNDS 202,576 208,709 215,966 217,587 223,824
TOTAL BEGINNING BALANCES 951,004 901,276 816,176 916,812 820,621
2012-13 Proposed Budget, Austin, TX
8 | Volume I
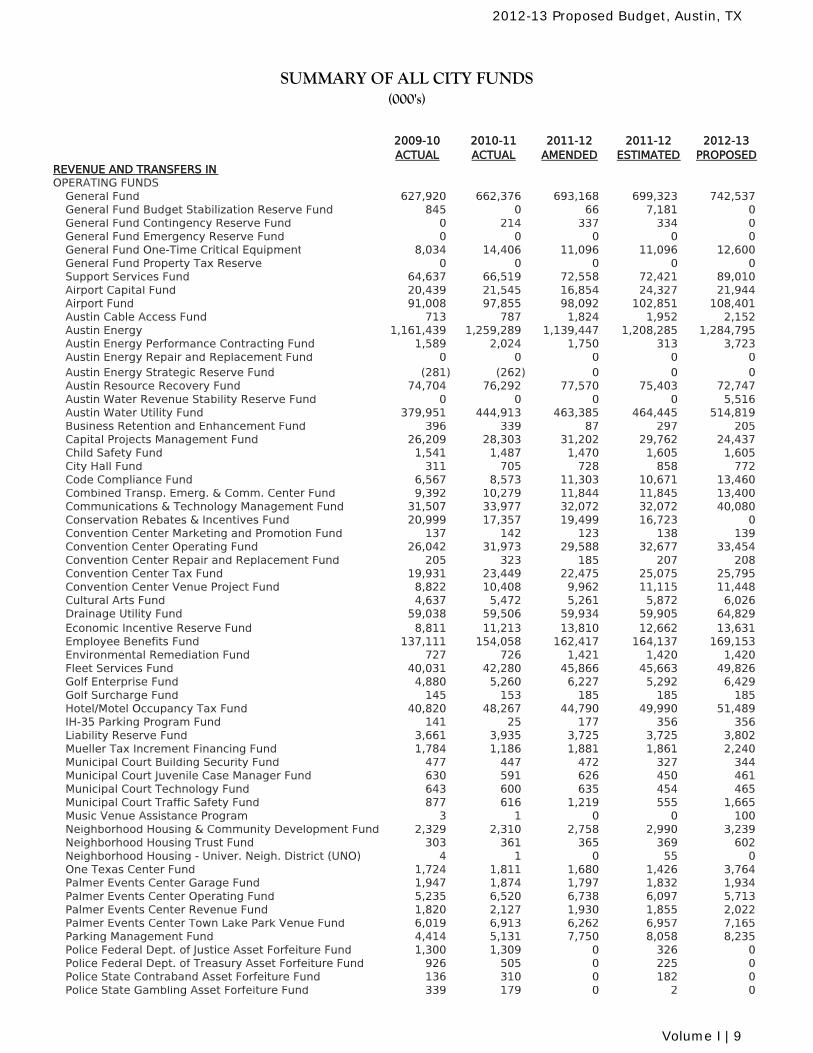
SUMMARY OF ALL CITY FUNDS(000's)
2009-10 2010-11 2011-12 2011-12 2012-13ACTUAL ACTUAL AMENDED ESTIMATED PROPOSED
REVENUE AND TRANSFERS INOPERATING FUNDS
General Fund 627,920 662,376 693,168 699,323 742,537General Fund Budget Stabilization Reserve Fund 845 0 66 7,181 0General Fund Contingency Reserve Fund 0 214 337 334 0General Fund Emergency Reserve Fund 0 0 0 0 0General Fund One-Time Critical Equipment 8,034 14,406 11,096 11,096 12,600General Fund Property Tax Reserve 0 0 0 0 0Support Services Fund 64,637 66,519 72,558 72,421 89,010Airport Capital Fund 20,439 21,545 16,854 24,327 21,944Airport Fund 91,008 97,855 98,092 102,851 108,401Austin Cable Access Fund 713 787 1,824 1,952 2,152Austin Energy 1,161,439 1,259,289 1,139,447 1,208,285 1,284,795Austin Energy Performance Contracting Fund 1,589 2,024 1,750 313 3,723Austin Energy Repair and Replacement Fund 0 0 0 0 0Austin Energy Strategic Reserve Fund (281) (262) 0 0 0Austin Resource Recovery Fund 74,704 76,292 77,570 75,403 72,747Austin Water Revenue Stability Reserve Fund 0 0 0 0 5,516Austin Water Utility Fund 379,951 444,913 463,385 464,445 514,819Business Retention and Enhancement Fund 396 339 87 297 205Capital Projects Management Fund 26,209 28,303 31,202 29,762 24,437Child Safety Fund 1,541 1,487 1,470 1,605 1,605City Hall Fund 311 705 728 858 772Code Compliance Fund 6,567 8,573 11,303 10,671 13,460Combined Transp. Emerg. & Comm. Center Fund 9,392 10,279 11,844 11,845 13,400Communications & Technology Management Fund 31,507 33,977 32,072 32,072 40,080Conservation Rebates & Incentives Fund 20,999 17,357 19,499 16,723 0Convention Center Marketing and Promotion Fund 137 142 123 138 139Convention Center Operating Fund 26,042 31,973 29,588 32,677 33,454Convention Center Repair and Replacement Fund 205 323 185 207 208Convention Center Tax Fund 19,931 23,449 22,475 25,075 25,795Convention Center Venue Project Fund 8,822 10,408 9,962 11,115 11,448Cultural Arts Fund 4,637 5,472 5,261 5,872 6,026Drainage Utility Fund 59,038 59,506 59,934 59,905 64,829Economic Incentive Reserve Fund 8,811 11,213 13,810 12,662 13,631Employee Benefits Fund 137,111 154,058 162,417 164,137 169,153Environmental Remediation Fund 727 726 1,421 1,420 1,420Fleet Services Fund 40,031 42,280 45,866 45,663 49,826Golf Enterprise Fund 4,880 5,260 6,227 5,292 6,429Golf Surcharge Fund 145 153 185 185 185Hotel/Motel Occupancy Tax Fund 40,820 48,267 44,790 49,990 51,489IH-35 Parking Program Fund 141 25 177 356 356Liability Reserve Fund 3,661 3,935 3,725 3,725 3,802Mueller Tax Increment Financing Fund 1,784 1,186 1,881 1,861 2,240Municipal Court Building Security Fund 477 447 472 327 344Municipal Court Juvenile Case Manager Fund 630 591 626 450 461Municipal Court Technology Fund 643 600 635 454 465Municipal Court Traffic Safety Fund 877 616 1,219 555 1,665Music Venue Assistance Program 3 1 0 0 100Neighborhood Housing & Community Development Fund 2,329 2,310 2,758 2,990 3,239Neighborhood Housing Trust Fund 303 361 365 369 602Neighborhood Housing - Univer. Neigh. District (UNO) 4 1 0 55 0One Texas Center Fund 1,724 1,811 1,680 1,426 3,764Palmer Events Center Garage Fund 1,947 1,874 1,797 1,832 1,934Palmer Events Center Operating Fund 5,235 6,520 6,738 6,097 5,713Palmer Events Center Revenue Fund 1,820 2,127 1,930 1,855 2,022Palmer Events Center Town Lake Park Venue Fund 6,019 6,913 6,262 6,957 7,165Parking Management Fund 4,414 5,131 7,750 8,058 8,235Police Federal Dept. of Justice Asset Forfeiture Fund 1,300 1,309 0 326 0Police Federal Dept. of Treasury Asset Forfeiture Fund 926 505 0 225 0Police State Contraband Asset Forfeiture Fund 136 310 0 182 0Police State Gambling Asset Forfeiture Fund 339 179 0 2 0
2012-13 Proposed Budget, Austin, TX
Volume I | 9
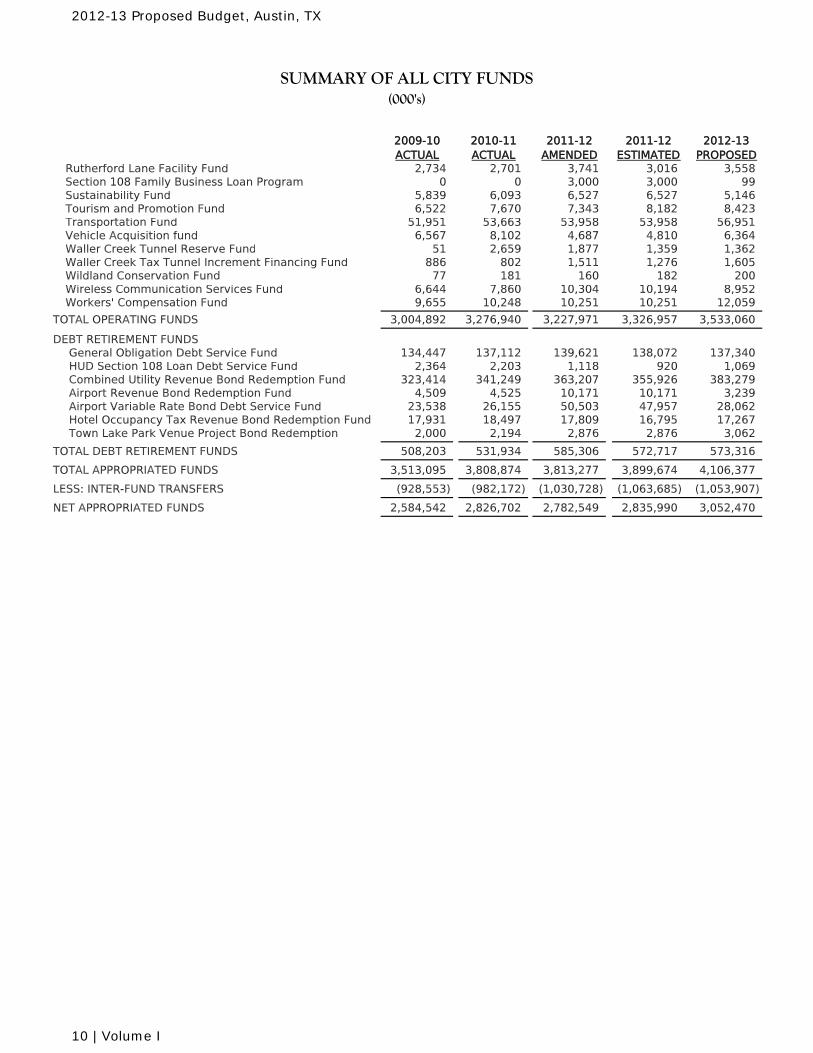
SUMMARY OF ALL CITY FUNDS(000's)
2009-10 2010-11 2011-12 2011-12 2012-13ACTUAL ACTUAL AMENDED ESTIMATED PROPOSED
Rutherford Lane Facility Fund 2,734 2,701 3,741 3,016 3,558Section 108 Family Business Loan Program 0 0 3,000 3,000 99Sustainability Fund 5,839 6,093 6,527 6,527 5,146Tourism and Promotion Fund 6,522 7,670 7,343 8,182 8,423Transportation Fund 51,951 53,663 53,958 53,958 56,951Vehicle Acquisition fund 6,567 8,102 4,687 4,810 6,364Waller Creek Tunnel Reserve Fund 51 2,659 1,877 1,359 1,362Waller Creek Tax Tunnel Increment Financing Fund 886 802 1,511 1,276 1,605Wildland Conservation Fund 77 181 160 182 200Wireless Communication Services Fund 6,644 7,860 10,304 10,194 8,952Workers' Compensation Fund 9,655 10,248 10,251 10,251 12,059
TOTAL OPERATING FUNDS 3,004,892 3,276,940 3,227,971 3,326,957 3,533,060
DEBT RETIREMENT FUNDS General Obligation Debt Service Fund 134,447 137,112 139,621 138,072 137,340 HUD Section 108 Loan Debt Service Fund 2,364 2,203 1,118 920 1,069 Combined Utility Revenue Bond Redemption Fund 323,414 341,249 363,207 355,926 383,279 Airport Revenue Bond Redemption Fund 4,509 4,525 10,171 10,171 3,239 Airport Variable Rate Bond Debt Service Fund 23,538 26,155 50,503 47,957 28,062 Hotel Occupancy Tax Revenue Bond Redemption Fund 17,931 18,497 17,809 16,795 17,267 Town Lake Park Venue Project Bond Redemption 2,000 2,194 2,876 2,876 3,062
TOTAL DEBT RETIREMENT FUNDS 508,203 531,934 585,306 572,717 573,316
TOTAL APPROPRIATED FUNDS 3,513,095 3,808,874 3,813,277 3,899,674 4,106,377
LESS: INTER-FUND TRANSFERS (928,553) (982,172) (1,030,728) (1,063,685) (1,053,907)
NET APPROPRIATED FUNDS 2,584,542 2,826,702 2,782,549 2,835,990 3,052,470
2012-13 Proposed Budget, Austin, TX
10 | Volume I
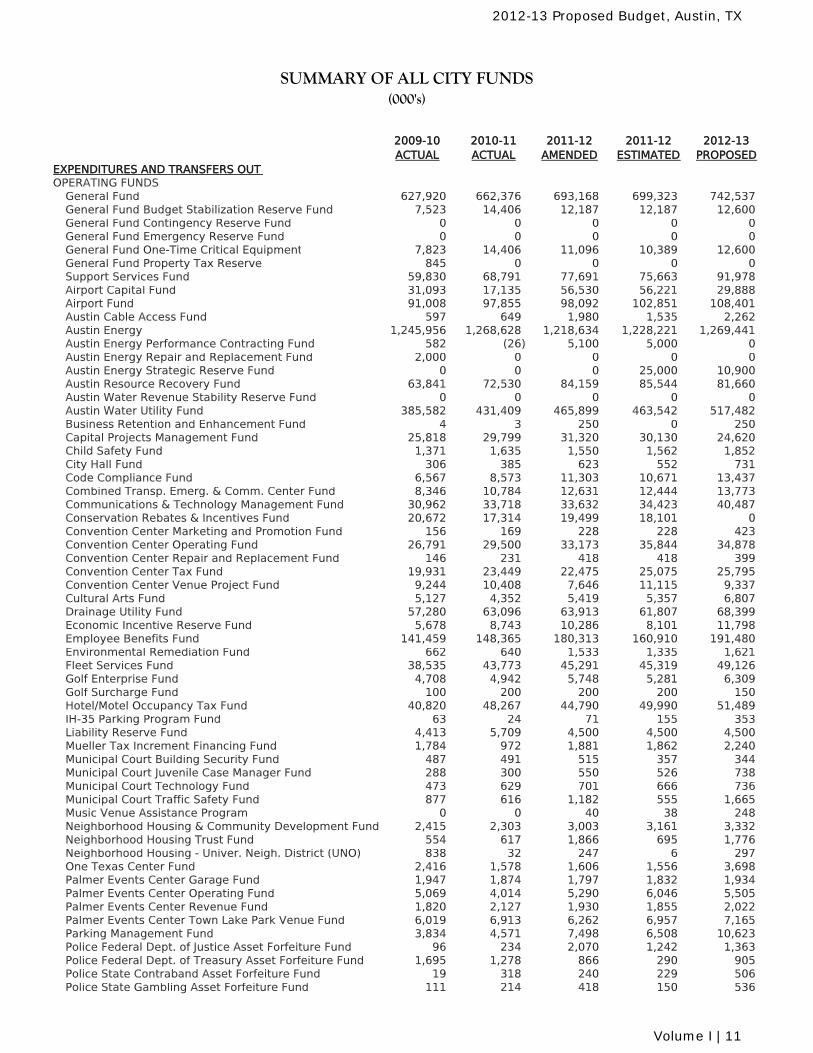
SUMMARY OF ALL CITY FUNDS(000's)
2009-10 2010-11 2011-12 2011-12 2012-13ACTUAL ACTUAL AMENDED ESTIMATED PROPOSED
EXPENDITURES AND TRANSFERS OUTOPERATING FUNDS
General Fund 627,920 662,376 693,168 699,323 742,537General Fund Budget Stabilization Reserve Fund 7,523 14,406 12,187 12,187 12,600General Fund Contingency Reserve Fund 0 0 0 0 0General Fund Emergency Reserve Fund 0 0 0 0 0General Fund One-Time Critical Equipment 7,823 14,406 11,096 10,389 12,600General Fund Property Tax Reserve 845 0 0 0 0Support Services Fund 59,830 68,791 77,691 75,663 91,978Airport Capital Fund 31,093 17,135 56,530 56,221 29,888Airport Fund 91,008 97,855 98,092 102,851 108,401Austin Cable Access Fund 597 649 1,980 1,535 2,262Austin Energy 1,245,956 1,268,628 1,218,634 1,228,221 1,269,441Austin Energy Performance Contracting Fund 582 (26) 5,100 5,000 0Austin Energy Repair and Replacement Fund 2,000 0 0 0 0Austin Energy Strategic Reserve Fund 0 0 0 25,000 10,900Austin Resource Recovery Fund 63,841 72,530 84,159 85,544 81,660Austin Water Revenue Stability Reserve Fund 0 0 0 0 0Austin Water Utility Fund 385,582 431,409 465,899 463,542 517,482Business Retention and Enhancement Fund 4 3 250 0 250Capital Projects Management Fund 25,818 29,799 31,320 30,130 24,620Child Safety Fund 1,371 1,635 1,550 1,562 1,852City Hall Fund 306 385 623 552 731Code Compliance Fund 6,567 8,573 11,303 10,671 13,437Combined Transp. Emerg. & Comm. Center Fund 8,346 10,784 12,631 12,444 13,773Communications & Technology Management Fund 30,962 33,718 33,632 34,423 40,487Conservation Rebates & Incentives Fund 20,672 17,314 19,499 18,101 0Convention Center Marketing and Promotion Fund 156 169 228 228 423Convention Center Operating Fund 26,791 29,500 33,173 35,844 34,878Convention Center Repair and Replacement Fund 146 231 418 418 399Convention Center Tax Fund 19,931 23,449 22,475 25,075 25,795Convention Center Venue Project Fund 9,244 10,408 7,646 11,115 9,337Cultural Arts Fund 5,127 4,352 5,419 5,357 6,807Drainage Utility Fund 57,280 63,096 63,913 61,807 68,399Economic Incentive Reserve Fund 5,678 8,743 10,286 8,101 11,798Employee Benefits Fund 141,459 148,365 180,313 160,910 191,480Environmental Remediation Fund 662 640 1,533 1,335 1,621Fleet Services Fund 38,535 43,773 45,291 45,319 49,126Golf Enterprise Fund 4,708 4,942 5,748 5,281 6,309Golf Surcharge Fund 100 200 200 200 150Hotel/Motel Occupancy Tax Fund 40,820 48,267 44,790 49,990 51,489IH-35 Parking Program Fund 63 24 71 155 353Liability Reserve Fund 4,413 5,709 4,500 4,500 4,500Mueller Tax Increment Financing Fund 1,784 972 1,881 1,862 2,240Municipal Court Building Security Fund 487 491 515 357 344Municipal Court Juvenile Case Manager Fund 288 300 550 526 738Municipal Court Technology Fund 473 629 701 666 736Municipal Court Traffic Safety Fund 877 616 1,182 555 1,665Music Venue Assistance Program 0 0 40 38 248Neighborhood Housing & Community Development Fund 2,415 2,303 3,003 3,161 3,332Neighborhood Housing Trust Fund 554 617 1,866 695 1,776Neighborhood Housing - Univer. Neigh. District (UNO) 838 32 247 6 297One Texas Center Fund 2,416 1,578 1,606 1,556 3,698Palmer Events Center Garage Fund 1,947 1,874 1,797 1,832 1,934Palmer Events Center Operating Fund 5,069 4,014 5,290 6,046 5,505Palmer Events Center Revenue Fund 1,820 2,127 1,930 1,855 2,022Palmer Events Center Town Lake Park Venue Fund 6,019 6,913 6,262 6,957 7,165Parking Management Fund 3,834 4,571 7,498 6,508 10,623Police Federal Dept. of Justice Asset Forfeiture Fund 96 234 2,070 1,242 1,363Police Federal Dept. of Treasury Asset Forfeiture Fund 1,695 1,278 866 290 905Police State Contraband Asset Forfeiture Fund 19 318 240 229 506Police State Gambling Asset Forfeiture Fund 111 214 418 150 536
2012-13 Proposed Budget, Austin, TX
Volume I | 11
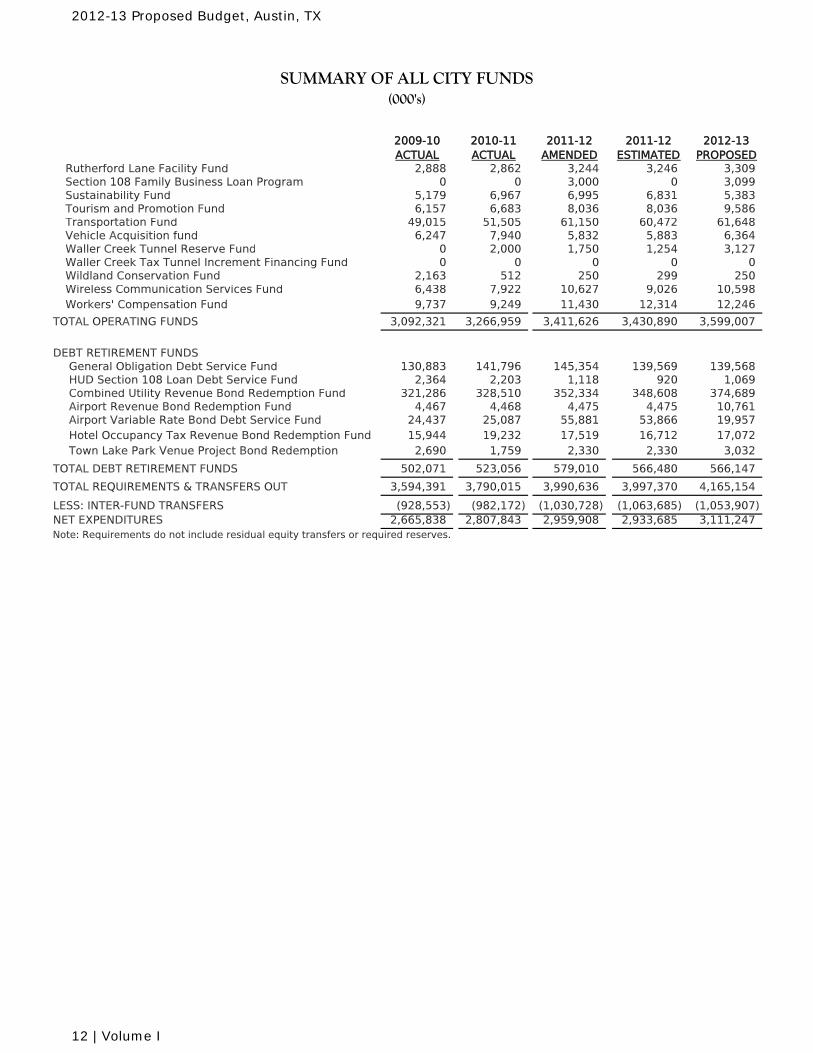
SUMMARY OF ALL CITY FUNDS(000's)
2009-10 2010-11 2011-12 2011-12 2012-13ACTUAL ACTUAL AMENDED ESTIMATED PROPOSED
Rutherford Lane Facility Fund 2,888 2,862 3,244 3,246 3,309Section 108 Family Business Loan Program 0 0 3,000 0 3,099Sustainability Fund 5,179 6,967 6,995 6,831 5,383Tourism and Promotion Fund 6,157 6,683 8,036 8,036 9,586Transportation Fund 49,015 51,505 61,150 60,472 61,648Vehicle Acquisition fund 6,247 7,940 5,832 5,883 6,364Waller Creek Tunnel Reserve Fund 0 2,000 1,750 1,254 3,127Waller Creek Tax Tunnel Increment Financing Fund 0 0 0 0 0Wildland Conservation Fund 2,163 512 250 299 250Wireless Communication Services Fund 6,438 7,922 10,627 9,026 10,598Workers' Compensation Fund 9,737 9,249 11,430 12,314 12,246
TOTAL OPERATING FUNDS 3,092,321 3,266,959 3,411,626 3,430,890 3,599,007
DEBT RETIREMENT FUNDS General Obligation Debt Service Fund 130,883 141,796 145,354 139,569 139,568 HUD Section 108 Loan Debt Service Fund 2,364 2,203 1,118 920 1,069 Combined Utility Revenue Bond Redemption Fund 321,286 328,510 352,334 348,608 374,689 Airport Revenue Bond Redemption Fund 4,467 4,468 4,475 4,475 10,761 Airport Variable Rate Bond Debt Service Fund 24,437 25,087 55,881 53,866 19,957 Hotel Occupancy Tax Revenue Bond Redemption Fund 15,944 19,232 17,519 16,712 17,072 Town Lake Park Venue Project Bond Redemption 2,690 1,759 2,330 2,330 3,032
TOTAL DEBT RETIREMENT FUNDS 502,071 523,056 579,010 566,480 566,147
TOTAL REQUIREMENTS & TRANSFERS OUT 3,594,391 3,790,015 3,990,636 3,997,370 4,165,154
LESS: INTER-FUND TRANSFERS (928,553) (982,172) (1,030,728) (1,063,685) (1,053,907)NET EXPENDITURES 2,665,838 2,807,843 2,959,908 2,933,685 3,111,247Note: Requirements do not include residual equity transfers or required reserves.
2012-13 Proposed Budget, Austin, TX
12 | Volume I
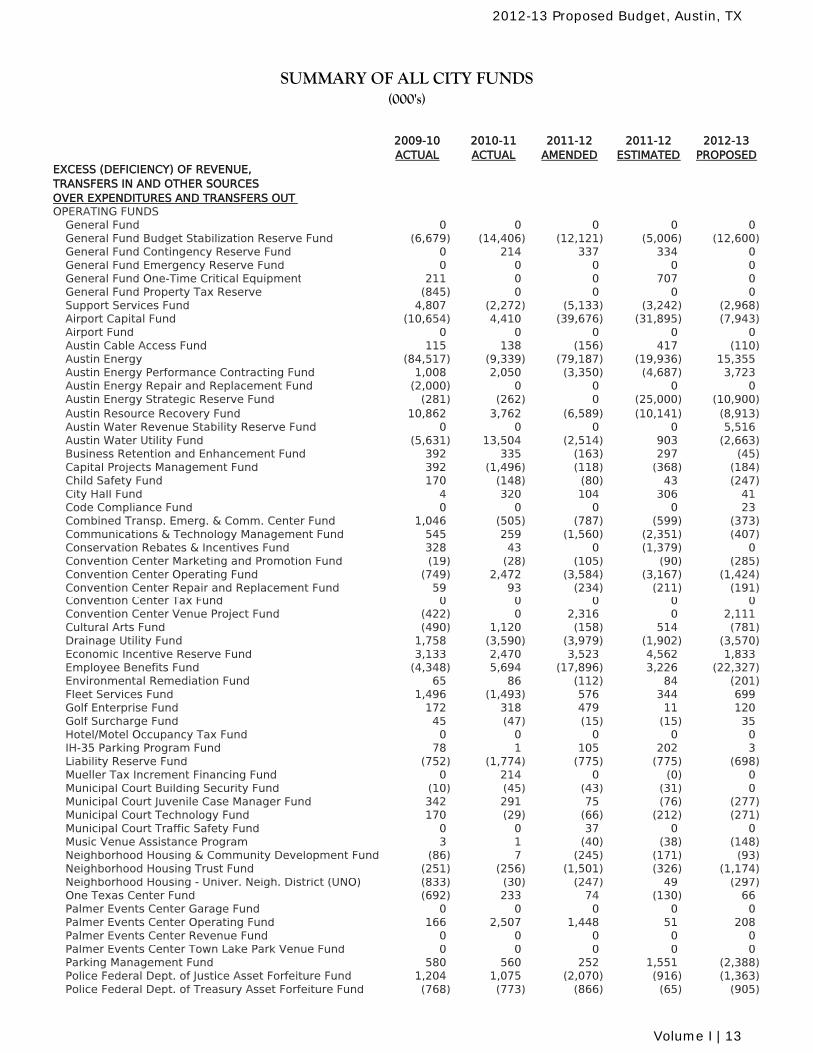
SUMMARY OF ALL CITY FUNDS(000's)
2009-10 2010-11 2011-12 2011-12 2012-13ACTUAL ACTUAL AMENDED ESTIMATED PROPOSED
EXCESS (DEFICIENCY) OF REVENUE,TRANSFERS IN AND OTHER SOURCESOVER EXPENDITURES AND TRANSFERS OUTOPERATING FUNDS
General Fund 0 0 0 0 0General Fund Budget Stabilization Reserve Fund (6,679) (14,406) (12,121) (5,006) (12,600)General Fund Contingency Reserve Fund 0 214 337 334 0General Fund Emergency Reserve Fund 0 0 0 0 0General Fund One-Time Critical Equipment 211 0 0 707 0General Fund Property Tax Reserve (845) 0 0 0 0Support Services Fund 4,807 (2,272) (5,133) (3,242) (2,968)Airport Capital Fund (10,654) 4,410 (39,676) (31,895) (7,943)Airport Fund 0 0 0 0 0Austin Cable Access Fund 115 138 (156) 417 (110)Austin Energy (84,517) (9,339) (79,187) (19,936) 15,355Austin Energy Performance Contracting Fund 1,008 2,050 (3,350) (4,687) 3,723Austin Energy Repair and Replacement Fund (2,000) 0 0 0 0Austin Energy Strategic Reserve Fund (281) (262) 0 (25,000) (10,900)Austin Resource Recovery Fund 10,862 3,762 (6,589) (10,141) (8,913)Austin Water Revenue Stability Reserve Fund 0 0 0 0 5,516Austin Water Utility Fund (5,631) 13,504 (2,514) 903 (2,663)Business Retention and Enhancement Fund 392 335 (163) 297 (45)Capital Projects Management Fund 392 (1,496) (118) (368) (184)Child Safety Fund 170 (148) (80) 43 (247)City Hall Fund 4 320 104 306 41Code Compliance Fund 0 0 0 0 23Combined Transp. Emerg. & Comm. Center Fund 1,046 (505) (787) (599) (373)Communications & Technology Management Fund 545 259 (1,560) (2,351) (407)Conservation Rebates & Incentives Fund 328 43 0 (1,379) 0Convention Center Marketing and Promotion Fund (19) (28) (105) (90) (285)Convention Center Operating Fund (749) 2,472 (3,584) (3,167) (1,424)Convention Center Repair and Replacement Fund 59 93 (234) (211) (191)Convention Center Tax Fund 0 0 0 0 0Convention Center Venue Project Fund (422) 0 2,316 0 2,111Cultural Arts Fund (490) 1,120 (158) 514 (781)Drainage Utility Fund 1,758 (3,590) (3,979) (1,902) (3,570)Economic Incentive Reserve Fund 3,133 2,470 3,523 4,562 1,833Employee Benefits Fund (4,348) 5,694 (17,896) 3,226 (22,327)Environmental Remediation Fund 65 86 (112) 84 (201)Fleet Services Fund 1,496 (1,493) 576 344 699Golf Enterprise Fund 172 318 479 11 120Golf Surcharge Fund 45 (47) (15) (15) 35Hotel/Motel Occupancy Tax Fund 0 0 0 0 0IH-35 Parking Program Fund 78 1 105 202 3Liability Reserve Fund (752) (1,774) (775) (775) (698)Mueller Tax Increment Financing Fund 0 214 0 (0) 0Municipal Court Building Security Fund (10) (45) (43) (31) 0Municipal Court Juvenile Case Manager Fund 342 291 75 (76) (277)Municipal Court Technology Fund 170 (29) (66) (212) (271)Municipal Court Traffic Safety Fund 0 0 37 0 0Music Venue Assistance Program 3 1 (40) (38) (148)Neighborhood Housing & Community Development Fund (86) 7 (245) (171) (93)Neighborhood Housing Trust Fund (251) (256) (1,501) (326) (1,174)Neighborhood Housing - Univer. Neigh. District (UNO) (833) (30) (247) 49 (297)One Texas Center Fund (692) 233 74 (130) 66Palmer Events Center Garage Fund 0 0 0 0 0Palmer Events Center Operating Fund 166 2,507 1,448 51 208Palmer Events Center Revenue Fund 0 0 0 0 0Palmer Events Center Town Lake Park Venue Fund 0 0 0 0 0Parking Management Fund 580 560 252 1,551 (2,388)Police Federal Dept. of Justice Asset Forfeiture Fund 1,204 1,075 (2,070) (916) (1,363)Police Federal Dept. of Treasury Asset Forfeiture Fund (768) (773) (866) (65) (905)
2012-13 Proposed Budget, Austin, TX
Volume I | 13
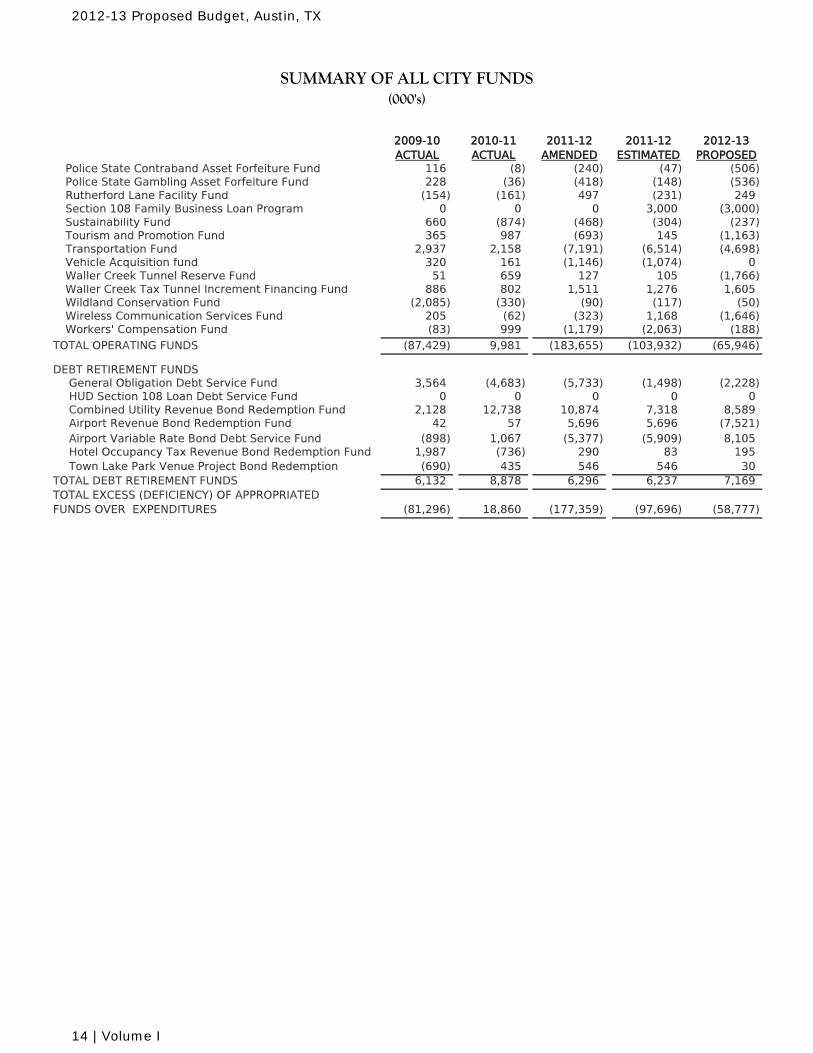
SUMMARY OF ALL CITY FUNDS(000's)
2009-10 2010-11 2011-12 2011-12 2012-13ACTUAL ACTUAL AMENDED ESTIMATED PROPOSED
Police State Contraband Asset Forfeiture Fund 116 (8) (240) (47) (506)Police State Gambling Asset Forfeiture Fund 228 (36) (418) (148) (536)Rutherford Lane Facility Fund (154) (161) 497 (231) 249Section 108 Family Business Loan Program 0 0 0 3,000 (3,000)Sustainability Fund 660 (874) (468) (304) (237)Tourism and Promotion Fund 365 987 (693) 145 (1,163)Transportation Fund 2,937 2,158 (7,191) (6,514) (4,698)Vehicle Acquisition fund 320 161 (1,146) (1,074) 0Waller Creek Tunnel Reserve Fund 51 659 127 105 (1,766)Waller Creek Tax Tunnel Increment Financing Fund 886 802 1,511 1,276 1,605Wildland Conservation Fund (2,085) (330) (90) (117) (50)Wireless Communication Services Fund 205 (62) (323) 1,168 (1,646)Workers' Compensation Fund (83) 999 (1,179) (2,063) (188)
TOTAL OPERATING FUNDS (87,429) 9,981 (183,655) (103,932) (65,946)
DEBT RETIREMENT FUNDS General Obligation Debt Service Fund 3,564 (4,683) (5,733) (1,498) (2,228) HUD Section 108 Loan Debt Service Fund 0 0 0 0 0 Combined Utility Revenue Bond Redemption Fund 2,128 12,738 10,874 7,318 8,589 Airport Revenue Bond Redemption Fund 42 57 5,696 5,696 (7,521) Airport Variable Rate Bond Debt Service Fund (898) 1,067 (5,377) (5,909) 8,105 Hotel Occupancy Tax Revenue Bond Redemption Fund 1,987 (736) 290 83 195 Town Lake Park Venue Project Bond Redemption (690) 435 546 546 30
TOTAL DEBT RETIREMENT FUNDS 6,132 8,878 6,296 6,237 7,169TOTAL EXCESS (DEFICIENCY) OF APPROPRIATEDFUNDS OVER EXPENDITURES (81,296) 18,860 (177,359) (97,696) (58,777)
2012-13 Proposed Budget, Austin, TX
14 | Volume I
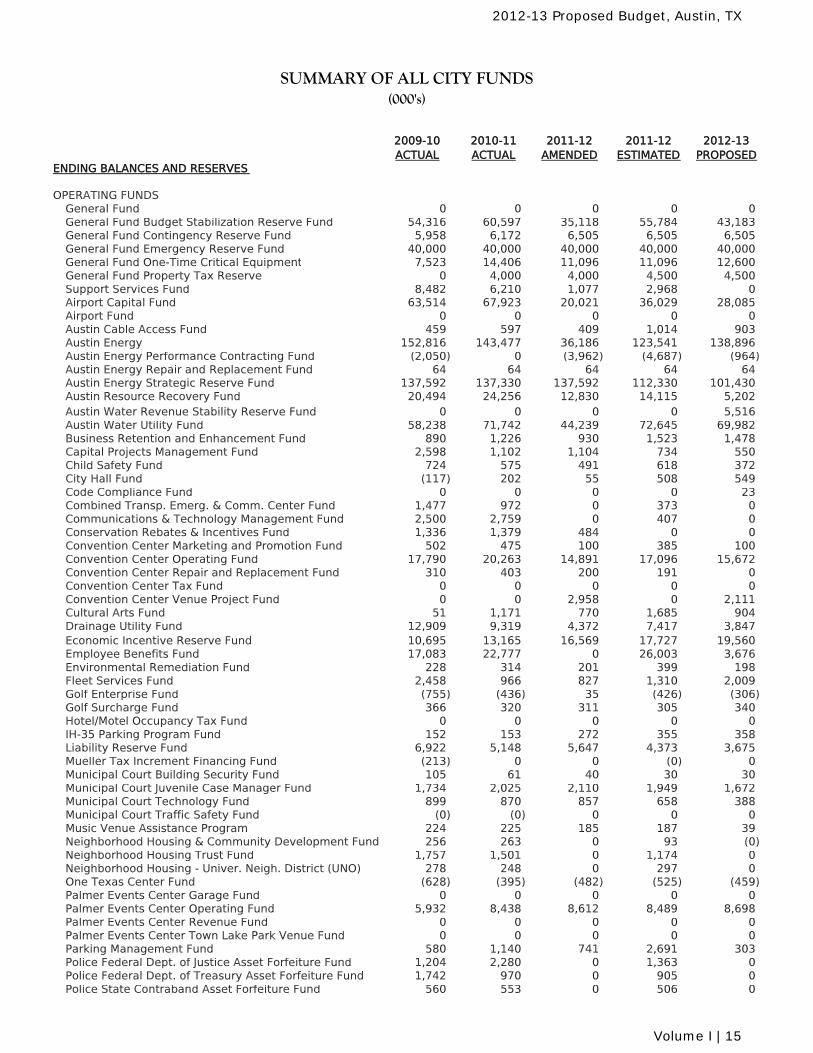
SUMMARY OF ALL CITY FUNDS(000's)
2009-10 2010-11 2011-12 2011-12 2012-13ACTUAL ACTUAL AMENDED ESTIMATED PROPOSED
ENDING BALANCES AND RESERVES
OPERATING FUNDSGeneral Fund 0 0 0 0 0General Fund Budget Stabilization Reserve Fund 54,316 60,597 35,118 55,784 43,183General Fund Contingency Reserve Fund 5,958 6,172 6,505 6,505 6,505General Fund Emergency Reserve Fund 40,000 40,000 40,000 40,000 40,000General Fund One-Time Critical Equipment 7,523 14,406 11,096 11,096 12,600General Fund Property Tax Reserve 0 4,000 4,000 4,500 4,500Support Services Fund 8,482 6,210 1,077 2,968 0Airport Capital Fund 63,514 67,923 20,021 36,029 28,085Airport Fund 0 0 0 0 0Austin Cable Access Fund 459 597 409 1,014 903Austin Energy 152,816 143,477 36,186 123,541 138,896Austin Energy Performance Contracting Fund (2,050) 0 (3,962) (4,687) (964)Austin Energy Repair and Replacement Fund 64 64 64 64 64Austin Energy Strategic Reserve Fund 137,592 137,330 137,592 112,330 101,430Austin Resource Recovery Fund 20,494 24,256 12,830 14,115 5,202Austin Water Revenue Stability Reserve Fund 0 0 0 0 5,516Austin Water Utility Fund 58,238 71,742 44,239 72,645 69,982Business Retention and Enhancement Fund 890 1,226 930 1,523 1,478Capital Projects Management Fund 2,598 1,102 1,104 734 550Child Safety Fund 724 575 491 618 372City Hall Fund (117) 202 55 508 549Code Compliance Fund 0 0 0 0 23Combined Transp. Emerg. & Comm. Center Fund 1,477 972 0 373 0Communications & Technology Management Fund 2,500 2,759 0 407 0Conservation Rebates & Incentives Fund 1,336 1,379 484 0 0Convention Center Marketing and Promotion Fund 502 475 100 385 100Convention Center Operating Fund 17,790 20,263 14,891 17,096 15,672Convention Center Repair and Replacement Fund 310 403 200 191 0Convention Center Tax Fund 0 0 0 0 0Convention Center Venue Project Fund 0 0 2,958 0 2,111Cultural Arts Fund 51 1,171 770 1,685 904Drainage Utility Fund 12,909 9,319 4,372 7,417 3,847Economic Incentive Reserve Fund 10,695 13,165 16,569 17,727 19,560Employee Benefits Fund 17,083 22,777 0 26,003 3,676Environmental Remediation Fund 228 314 201 399 198Fleet Services Fund 2,458 966 827 1,310 2,009Golf Enterprise Fund (755) (436) 35 (426) (306)Golf Surcharge Fund 366 320 311 305 340Hotel/Motel Occupancy Tax Fund 0 0 0 0 0IH-35 Parking Program Fund 152 153 272 355 358Liability Reserve Fund 6,922 5,148 5,647 4,373 3,675Mueller Tax Increment Financing Fund (213) 0 0 (0) 0Municipal Court Building Security Fund 105 61 40 30 30Municipal Court Juvenile Case Manager Fund 1,734 2,025 2,110 1,949 1,672Municipal Court Technology Fund 899 870 857 658 388Municipal Court Traffic Safety Fund (0) (0) 0 0 0Music Venue Assistance Program 224 225 185 187 39Neighborhood Housing & Community Development Fund 256 263 0 93 (0)Neighborhood Housing Trust Fund 1,757 1,501 0 1,174 0Neighborhood Housing - Univer. Neigh. District (UNO) 278 248 0 297 0One Texas Center Fund (628) (395) (482) (525) (459)Palmer Events Center Garage Fund 0 0 0 0 0Palmer Events Center Operating Fund 5,932 8,438 8,612 8,489 8,698Palmer Events Center Revenue Fund 0 0 0 0 0Palmer Events Center Town Lake Park Venue Fund 0 0 0 0 0Parking Management Fund 580 1,140 741 2,691 303Police Federal Dept. of Justice Asset Forfeiture Fund 1,204 2,280 0 1,363 0Police Federal Dept. of Treasury Asset Forfeiture Fund 1,742 970 0 905 0Police State Contraband Asset Forfeiture Fund 560 553 0 506 0
2012-13 Proposed Budget, Austin, TX
Volume I | 15
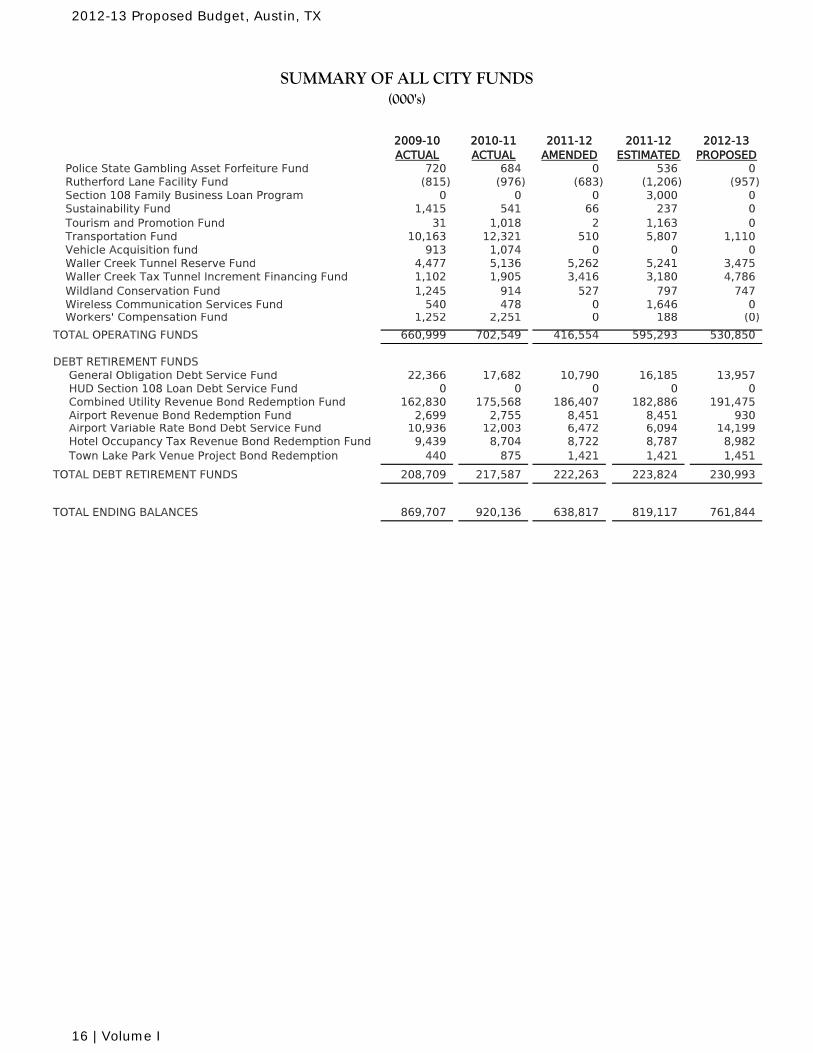
SUMMARY OF ALL CITY FUNDS(000's)
2009-10 2010-11 2011-12 2011-12 2012-13ACTUAL ACTUAL AMENDED ESTIMATED PROPOSED
Police State Gambling Asset Forfeiture Fund 720 684 0 536 0Rutherford Lane Facility Fund (815) (976) (683) (1,206) (957)Section 108 Family Business Loan Program 0 0 0 3,000 0Sustainability Fund 1,415 541 66 237 0Tourism and Promotion Fund 31 1,018 2 1,163 0Transportation Fund 10,163 12,321 510 5,807 1,110Vehicle Acquisition fund 913 1,074 0 0 0Waller Creek Tunnel Reserve Fund 4,477 5,136 5,262 5,241 3,475Waller Creek Tax Tunnel Increment Financing Fund 1,102 1,905 3,416 3,180 4,786Wildland Conservation Fund 1,245 914 527 797 747Wireless Communication Services Fund 540 478 0 1,646 0Workers' Compensation Fund 1,252 2,251 0 188 (0)
TOTAL OPERATING FUNDS 660,999 702,549 416,554 595,293 530,850
DEBT RETIREMENT FUNDS General Obligation Debt Service Fund 22,366 17,682 10,790 16,185 13,957 HUD Section 108 Loan Debt Service Fund 0 0 0 0 0 Combined Utility Revenue Bond Redemption Fund 162,830 175,568 186,407 182,886 191,475 Airport Revenue Bond Redemption Fund 2,699 2,755 8,451 8,451 930 Airport Variable Rate Bond Debt Service Fund 10,936 12,003 6,472 6,094 14,199 Hotel Occupancy Tax Revenue Bond Redemption Fund 9,439 8,704 8,722 8,787 8,982 Town Lake Park Venue Project Bond Redemption 440 875 1,421 1,421 1,451
TOTAL DEBT RETIREMENT FUNDS 208,709 217,587 222,263 223,824 230,993
TOTAL ENDING BALANCES 869,707 920,136 638,817 819,117 761,844
2012-13 Proposed Budget, Austin, TX
16 | Volume I

General Fund Budget in Brief

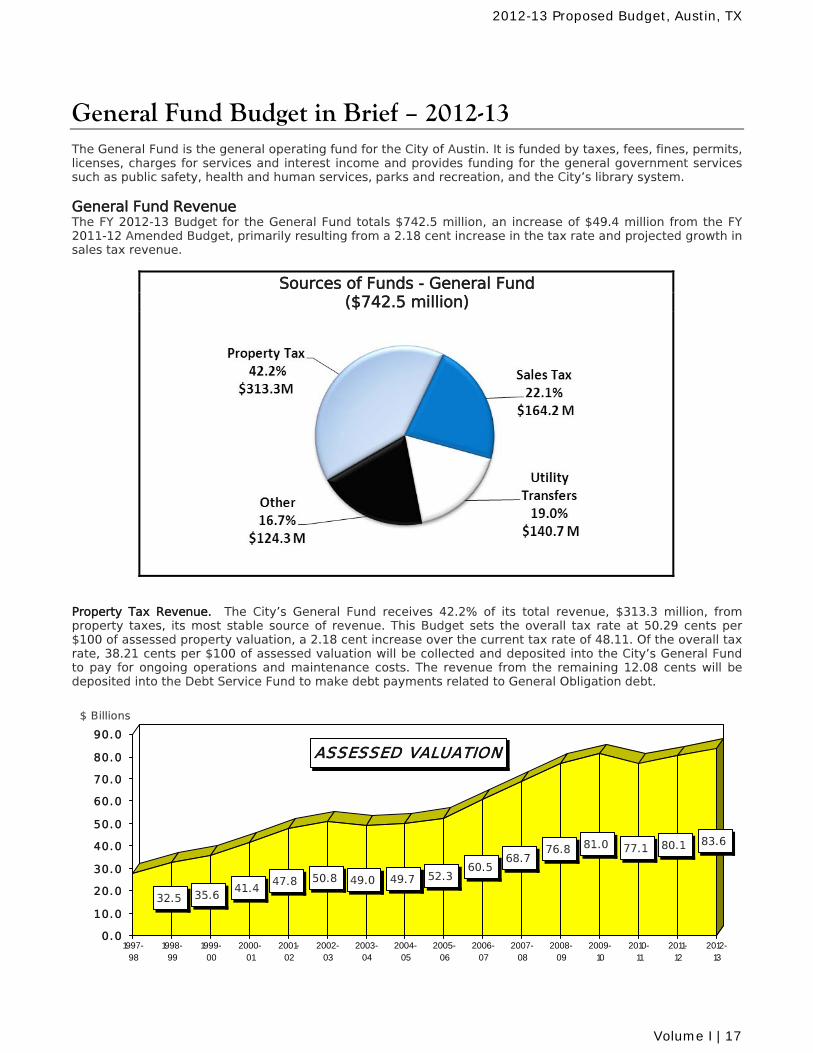
General Fund Budget in Brief – 2012-13 The General Fund is the general operating fund for the City of Austin. It is funded by taxes, fees, fines, permits, licenses, charges for services and interest income and provides funding for the general government services such as public safety, health and human services, parks and recreation, and the City’s library system. General Fund Revenue The FY 2012-13 Budget for the General Fund totals $742.5 million, an increase of $49.4 million from the FY 2011-12 Amended Budget, primarily resulting from a 2.18 cent increase in the tax rate and projected growth in sales tax revenue.
Sources of Funds - General Fund ($742.5 million)
Property Tax Revenue. The City’s General Fund receives 42.2% of its total revenue, $313.3 million, from property taxes, its most stable source of revenue. This Budget sets the overall tax rate at 50.29 cents per $100 of assessed property valuation, a 2.18 cent increase over the current tax rate of 48.11. Of the overall tax rate, 38.21 cents per $100 of assessed valuation will be collected and deposited into the City’s General Fund to pay for ongoing operations and maintenance costs. The revenue from the remaining 12.08 cents will be deposited into the Debt Service Fund to make debt payments related to General Obligation debt.
32.5 35.641.4
47.8 50.8 49.0 49.7 52.360.5
68.776.8 81.0 77.1 80.1 83.6
0.0
10.0
20.0
30.0
40.0
50.0
60.0
70.0
80.0
90.0
1997-98
1998-99
1999-00
2000-01
2001-02
2002-03
2003-04
2004-05
2005-06
2006-07
2007-08
2008-09
2009-10
2010-11
2011-12
2012-13
ASSESSED VALUATION
$ Billions
2012-13 Proposed Budget, Austin, TX
Volume I | 17
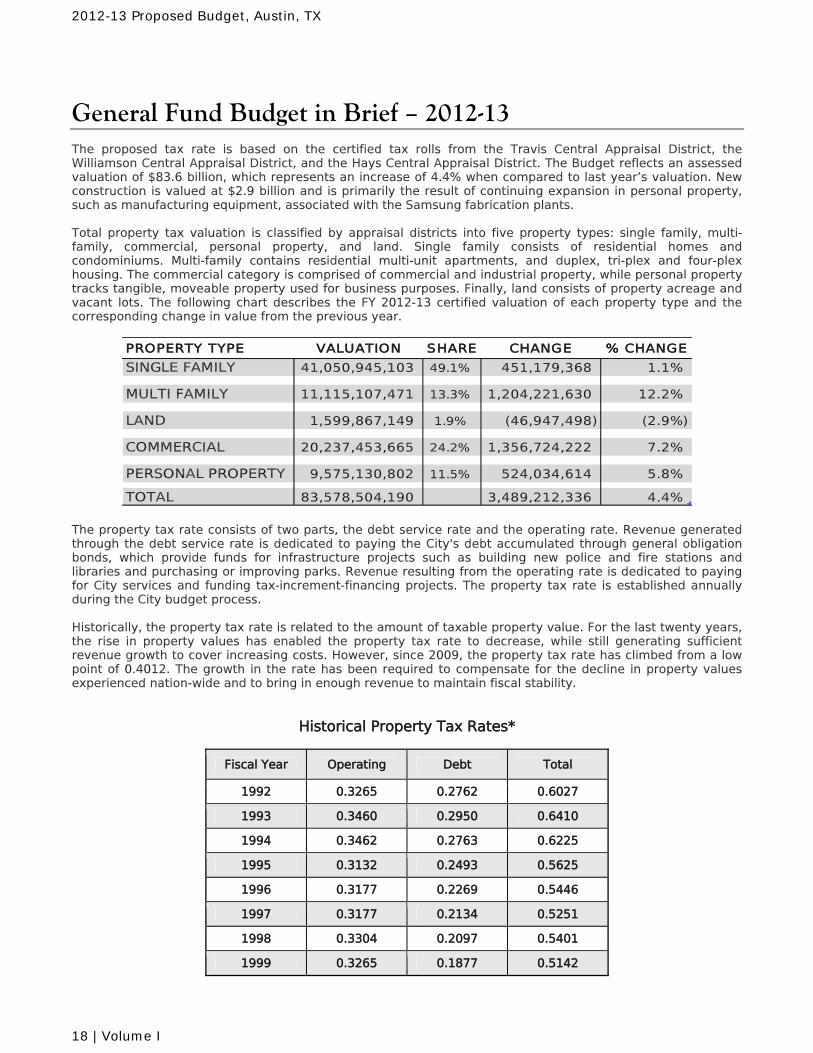
General Fund Budget in Brief – 2012-13 The proposed tax rate is based on the certified tax rolls from the Travis Central Appraisal District, the Williamson Central Appraisal District, and the Hays Central Appraisal District. The Budget reflects an assessed valuation of $83.6 billion, which represents an increase of 4.4% when compared to last year’s valuation. New construction is valued at $2.9 billion and is primarily the result of continuing expansion in personal property, such as manufacturing equipment, associated with the Samsung fabrication plants. Total property tax valuation is classified by appraisal districts into five property types: single family, multi-family, commercial, personal property, and land. Single family consists of residential homes and condominiums. Multi-family contains residential multi-unit apartments, and duplex, tri-plex and four-plex housing. The commercial category is comprised of commercial and industrial property, while personal property tracks tangible, moveable property used for business purposes. Finally, land consists of property acreage and vacant lots. The following chart describes the FY 2012-13 certified valuation of each property type and the corresponding change in value from the previous year.
PROPERTY TYPE VALUATION SHARE CHANGE % CHANGE
SINGLE FAMILY 41,050,945,103 49.1% 451,179,368 1.1%
MULTI FAMILY 11,115,107,471 13.3% 1,204,221,630 12.2%
LAND 1,599,867,149 1.9% (46,947,498) (2.9%)
COMMERCIAL 20,237,453,665 24.2% 1,356,724,222 7.2%
PERSONAL PROPERTY 9,575,130,802 11.5% 524,034,614 5.8%
TOTAL 83,578,504,190 3,489,212,336 4.4% The property tax rate consists of two parts, the debt service rate and the operating rate. Revenue generated through the debt service rate is dedicated to paying the City's debt accumulated through general obligation bonds, which provide funds for infrastructure projects such as building new police and fire stations and libraries and purchasing or improving parks. Revenue resulting from the operating rate is dedicated to paying for City services and funding tax-increment-financing projects. The property tax rate is established annually during the City budget process. Historically, the property tax rate is related to the amount of taxable property value. For the last twenty years, the rise in property values has enabled the property tax rate to decrease, while still generating sufficient revenue growth to cover increasing costs. However, since 2009, the property tax rate has climbed from a low point of 0.4012. The growth in the rate has been required to compensate for the decline in property values experienced nation-wide and to bring in enough revenue to maintain fiscal stability.
Historical Property Tax Rates*
Fiscal Year Operating Debt Total
1992 0.3265 0.2762 0.6027
1993 0.3460 0.2950 0.6410
1994 0.3462 0.2763 0.6225
1995 0.3132 0.2493 0.5625
1996 0.3177 0.2269 0.5446
1997 0.3177 0.2134 0.5251
1998 0.3304 0.2097 0.5401
1999 0.3265 0.1877 0.5142
2012-13 Proposed Budget, Austin, TX
18 | Volume I
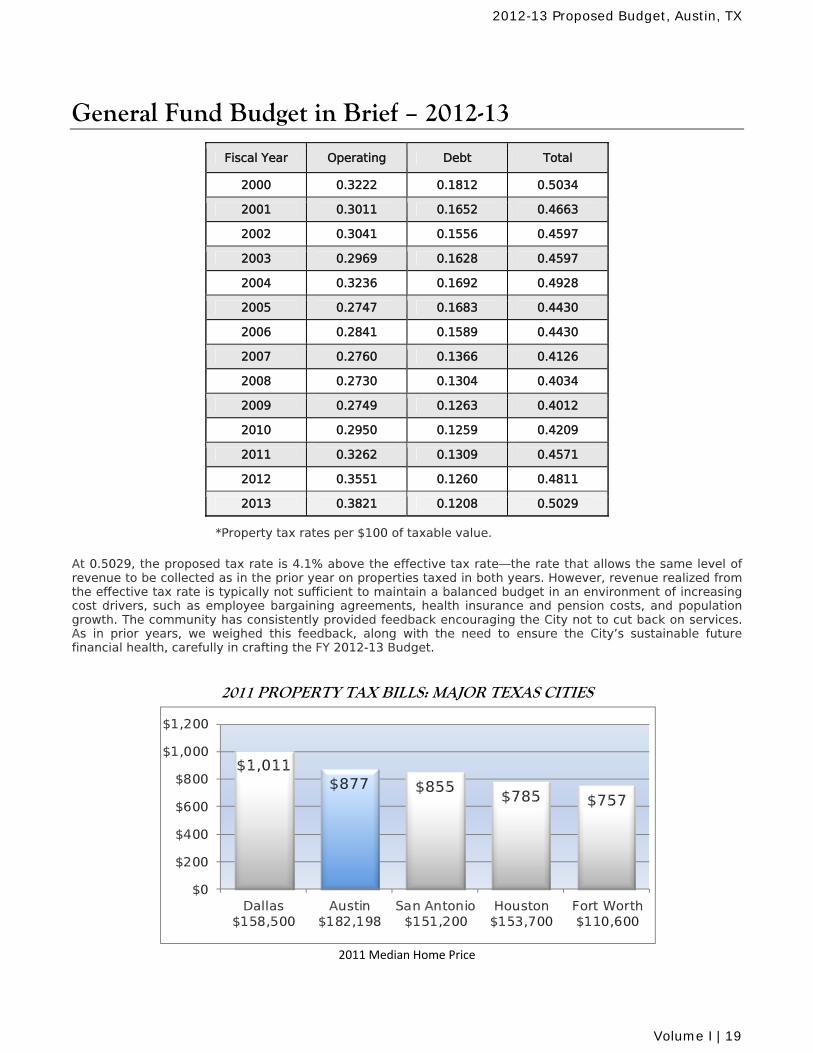
General Fund Budget in Brief – 2012-13
Fiscal Year Operating Debt Total
2000 0.3222 0.1812 0.5034
2001 0.3011 0.1652 0.4663
2002 0.3041 0.1556 0.4597
2003 0.2969 0.1628 0.4597
2004 0.3236 0.1692 0.4928
2005 0.2747 0.1683 0.4430
2006 0.2841 0.1589 0.4430
2007 0.2760 0.1366 0.4126
2008 0.2730 0.1304 0.4034
2009 0.2749 0.1263 0.4012
2010 0.2950 0.1259 0.4209
2011 0.3262 0.1309 0.4571
2012 0.3551 0.1260 0.4811
2013 0.3821 0.1208 0.5029
*Property tax rates per $100 of taxable value. At 0.5029, the proposed tax rate is 4.1% above the effective tax rate—the rate that allows the same level of revenue to be collected as in the prior year on properties taxed in both years. However, revenue realized from the effective tax rate is typically not sufficient to maintain a balanced budget in an environment of increasing cost drivers, such as employee bargaining agreements, health insurance and pension costs, and population growth. The community has consistently provided feedback encouraging the City not to cut back on services. As in prior years, we weighed this feedback, along with the need to ensure the City’s sustainable future financial health, carefully in crafting the FY 2012-13 Budget.
2011 PROPERTY TAX BILLS: MAJOR TEXAS CITIES
$1,011$877 $855
$785 $757
$0
$200
$400
$600
$800
$1,000
$1,200
Dallas$158,500
Austin$182,198
San Antonio$151,200
Houston$153,700
Fort Worth$110,600
2011 Median Home Price
2012-13 Proposed Budget, Austin, TX
Volume I | 19
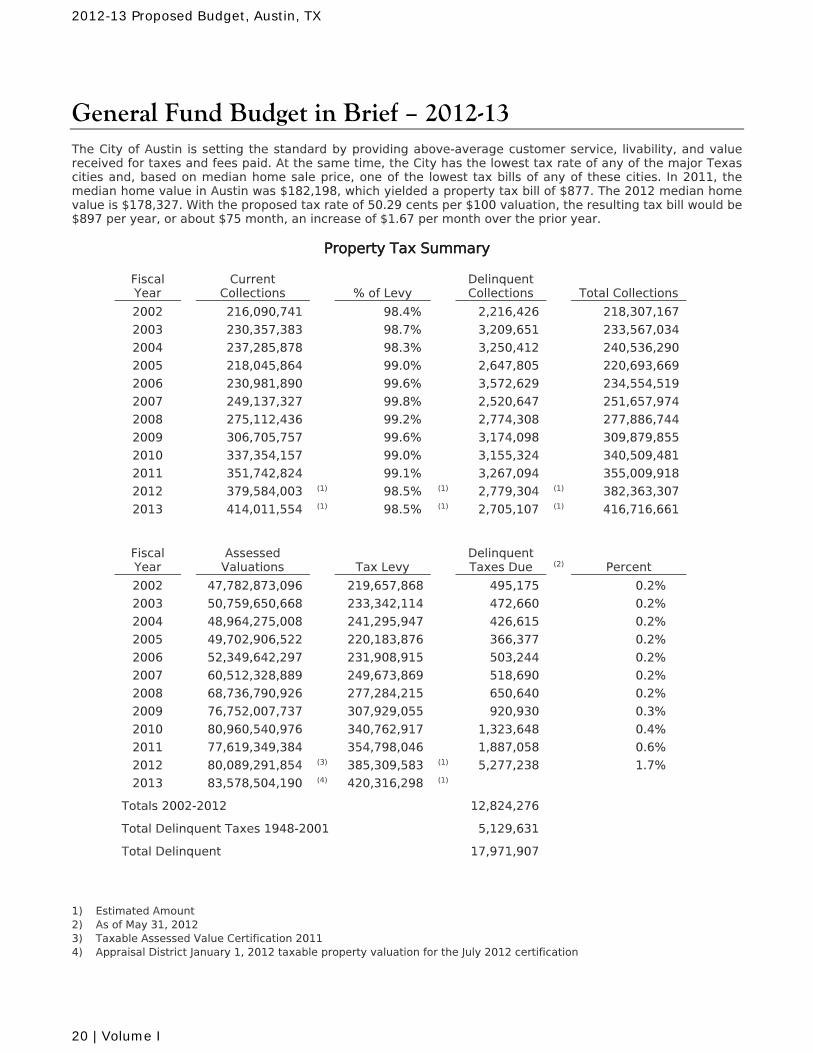
General Fund Budget in Brief – 2012-13 The City of Austin is setting the standard by providing above-average customer service, livability, and value received for taxes and fees paid. At the same time, the City has the lowest tax rate of any of the major Texas cities and, based on median home sale price, one of the lowest tax bills of any of these cities. In 2011, the median home value in Austin was $182,198, which yielded a property tax bill of $877. The 2012 median home value is $178,327. With the proposed tax rate of 50.29 cents per $100 valuation, the resulting tax bill would be $897 per year, or about $75 month, an increase of $1.67 per month over the prior year.
Property Tax Summary
Fiscal Year
Current Collections % of Levy
Delinquent Collections Total Collections
2002 216,090,741 98.4% 2,216,426 218,307,167
2003 230,357,383 98.7% 3,209,651 233,567,034
2004 237,285,878 98.3% 3,250,412 240,536,290
2005 218,045,864 99.0% 2,647,805 220,693,669
2006 230,981,890 99.6% 3,572,629 234,554,519
2007 249,137,327 99.8% 2,520,647 251,657,974
2008 275,112,436 99.2% 2,774,308 277,886,744
2009 306,705,757 99.6% 3,174,098 309,879,855
2010 337,354,157 99.0% 3,155,324 340,509,481
2011 351,742,824 99.1% 3,267,094 355,009,918
2012 379,584,003 (1) 98.5% (1) 2,779,304 (1) 382,363,307
2013 414,011,554 (1) 98.5% (1) 2,705,107 (1) 416,716,661
Fiscal Year
Assessed Valuations Tax Levy
Delinquent Taxes Due (2) Percent
2002 47,782,873,096 219,657,868 495,175 0.2%
2003 50,759,650,668 233,342,114 472,660 0.2%
2004 48,964,275,008 241,295,947 426,615 0.2%
2005 49,702,906,522 220,183,876 366,377 0.2%
2006 52,349,642,297 231,908,915 503,244 0.2%
2007 60,512,328,889 249,673,869 518,690 0.2%
2008 68,736,790,926 277,284,215 650,640 0.2%
2009 76,752,007,737 307,929,055 920,930 0.3%
2010 80,960,540,976 340,762,917 1,323,648 0.4%
2011 77,619,349,384 354,798,046 1,887,058 0.6%
2012 80,089,291,854 (3) 385,309,583 (1) 5,277,238 1.7%
2013 83,578,504,190 (4) 420,316,298 (1)
Totals 2002-2012 12,824,276
Total Delinquent Taxes 1948-2001 5,129,631
Total Delinquent 17,971,907 1) Estimated Amount 2) As of May 31, 2012 3) Taxable Assessed Value Certification 2011 4) Appraisal District January 1, 2012 taxable property valuation for the July 2012 certification
2012-13 Proposed Budget, Austin, TX
20 | Volume I
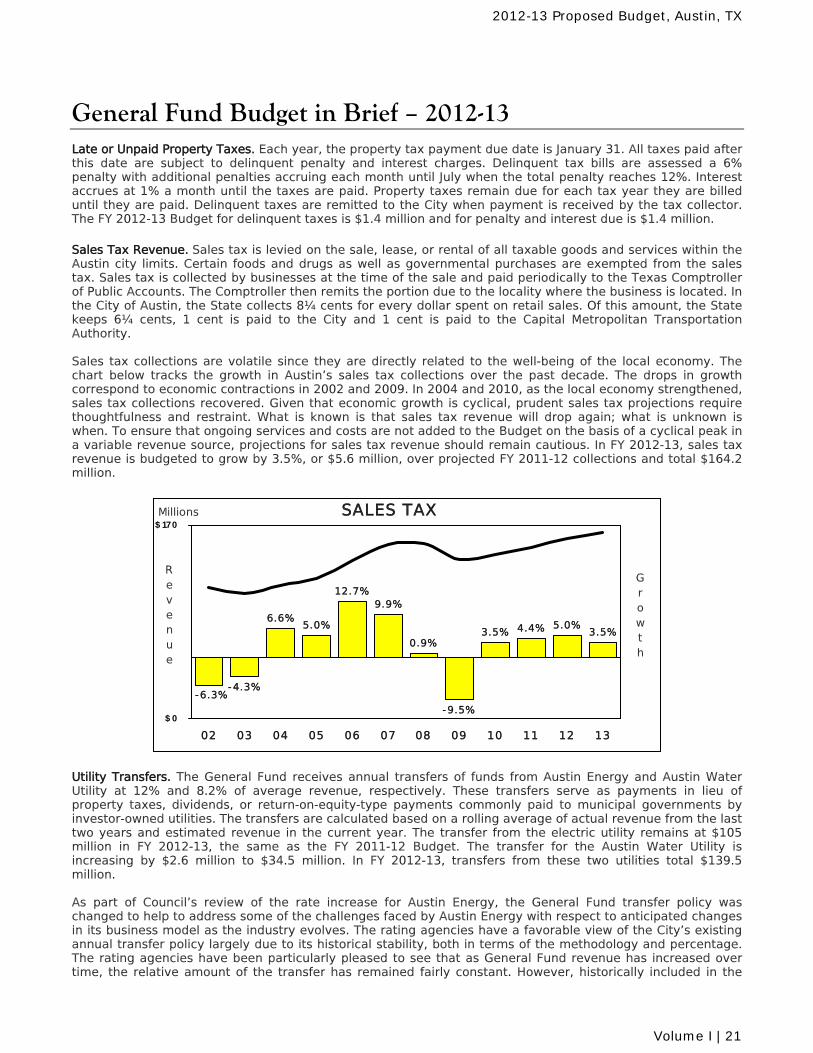
General Fund Budget in Brief – 2012-13 Late or Unpaid Property Taxes. Each year, the property tax payment due date is January 31. All taxes paid after this date are subject to delinquent penalty and interest charges. Delinquent tax bills are assessed a 6% penalty with additional penalties accruing each month until July when the total penalty reaches 12%. Interest accrues at 1% a month until the taxes are paid. Property taxes remain due for each tax year they are billed until they are paid. Delinquent taxes are remitted to the City when payment is received by the tax collector. The FY 2012-13 Budget for delinquent taxes is $1.4 million and for penalty and interest due is $1.4 million.
Sales Tax Revenue. Sales tax is levied on the sale, lease, or rental of all taxable goods and services within the Austin city limits. Certain foods and drugs as well as governmental purchases are exempted from the sales tax. Sales tax is collected by businesses at the time of the sale and paid periodically to the Texas Comptroller of Public Accounts. The Comptroller then remits the portion due to the locality where the business is located. In the City of Austin, the State collects 8¼ cents for every dollar spent on retail sales. Of this amount, the State keeps 6¼ cents, 1 cent is paid to the City and 1 cent is paid to the Capital Metropolitan Transportation Authority. Sales tax collections are volatile since they are directly related to the well-being of the local economy. The chart below tracks the growth in Austin’s sales tax collections over the past decade. The drops in growth correspond to economic contractions in 2002 and 2009. In 2004 and 2010, as the local economy strengthened, sales tax collections recovered. Given that economic growth is cyclical, prudent sales tax projections require thoughtfulness and restraint. What is known is that sales tax revenue will drop again; what is unknown is when. To ensure that ongoing services and costs are not added to the Budget on the basis of a cyclical peak in a variable revenue source, projections for sales tax revenue should remain cautious. In FY 2012-13, sales tax revenue is budgeted to grow by 3.5%, or $5.6 million, over projected FY 2011-12 collections and total $164.2 million.
-4.3%
6.6%3.5%
5.0%
-6.3%
5.0%
12.7%9.9%
0.9%
-9.5%
3.5% 4.4%
$ 0
$ 170
02 03 04 05 06 07 08 09 10 11 12 13
Millions SALES TAX
Revenue
Growth
Utility Transfers. The General Fund receives annual transfers of funds from Austin Energy and Austin Water Utility at 12% and 8.2% of average revenue, respectively. These transfers serve as payments in lieu of property taxes, dividends, or return-on-equity-type payments commonly paid to municipal governments by investor-owned utilities. The transfers are calculated based on a rolling average of actual revenue from the last two years and estimated revenue in the current year. The transfer from the electric utility remains at $105 million in FY 2012-13, the same as the FY 2011-12 Budget. The transfer for the Austin Water Utility is increasing by $2.6 million to $34.5 million. In FY 2012-13, transfers from these two utilities total $139.5 million. As part of Council’s review of the rate increase for Austin Energy, the General Fund transfer policy was changed to help to address some of the challenges faced by Austin Energy with respect to anticipated changes in its business model as the industry evolves. The rating agencies have a favorable view of the City’s existing annual transfer policy largely due to its historical stability, both in terms of the methodology and percentage. The rating agencies have been particularly pleased to see that as General Fund revenue has increased over time, the relative amount of the transfer has remained fairly constant. However, historically included in the
2012-13 Proposed Budget, Austin, TX
Volume I | 21
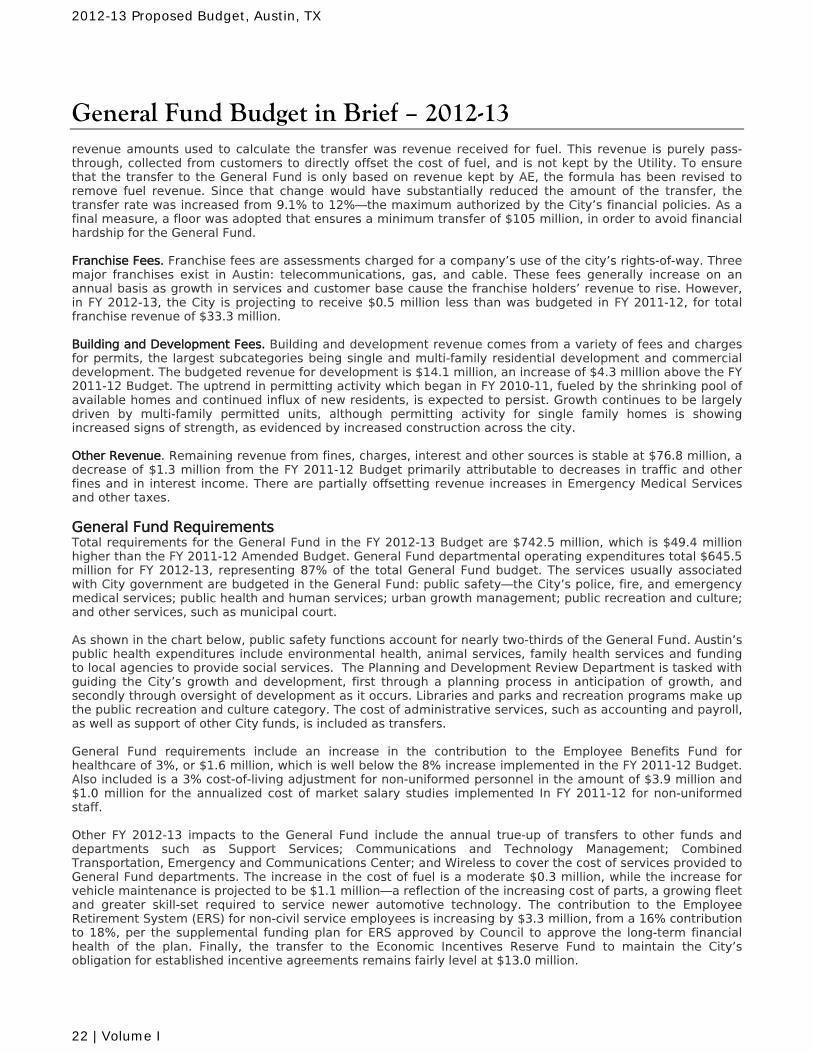
General Fund Budget in Brief – 2012-13 revenue amounts used to calculate the transfer was revenue received for fuel. This revenue is purely pass-through, collected from customers to directly offset the cost of fuel, and is not kept by the Utility. To ensure that the transfer to the General Fund is only based on revenue kept by AE, the formula has been revised to remove fuel revenue. Since that change would have substantially reduced the amount of the transfer, the transfer rate was increased from 9.1% to 12%—the maximum authorized by the City’s financial policies. As a final measure, a floor was adopted that ensures a minimum transfer of $105 million, in order to avoid financial hardship for the General Fund. Franchise Fees. Franchise fees are assessments charged for a company’s use of the city’s rights-of-way. Three major franchises exist in Austin: telecommunications, gas, and cable. These fees generally increase on an annual basis as growth in services and customer base cause the franchise holders’ revenue to rise. However, in FY 2012-13, the City is projecting to receive $0.5 million less than was budgeted in FY 2011-12, for total franchise revenue of $33.3 million. Building and Development Fees. Building and development revenue comes from a variety of fees and charges for permits, the largest subcategories being single and multi-family residential development and commercial development. The budgeted revenue for development is $14.1 million, an increase of $4.3 million above the FY 2011-12 Budget. The uptrend in permitting activity which began in FY 2010-11, fueled by the shrinking pool of available homes and continued influx of new residents, is expected to persist. Growth continues to be largely driven by multi-family permitted units, although permitting activity for single family homes is showing increased signs of strength, as evidenced by increased construction across the city. Other Revenue. Remaining revenue from fines, charges, interest and other sources is stable at $76.8 million, a decrease of $1.3 million from the FY 2011-12 Budget primarily attributable to decreases in traffic and other fines and in interest income. There are partially offsetting revenue increases in Emergency Medical Services and other taxes. General Fund Requirements Total requirements for the General Fund in the FY 2012-13 Budget are $742.5 million, which is $49.4 million higher than the FY 2011-12 Amended Budget. General Fund departmental operating expenditures total $645.5 million for FY 2012-13, representing 87% of the total General Fund budget. The services usually associated with City government are budgeted in the General Fund: public safety—the City’s police, fire, and emergency medical services; public health and human services; urban growth management; public recreation and culture; and other services, such as municipal court. As shown in the chart below, public safety functions account for nearly two-thirds of the General Fund. Austin’s public health expenditures include environmental health, animal services, family health services and funding to local agencies to provide social services. The Planning and Development Review Department is tasked with guiding the City’s growth and development, first through a planning process in anticipation of growth, and secondly through oversight of development as it occurs. Libraries and parks and recreation programs make up the public recreation and culture category. The cost of administrative services, such as accounting and payroll, as well as support of other City funds, is included as transfers. General Fund requirements include an increase in the contribution to the Employee Benefits Fund for healthcare of 3%, or $1.6 million, which is well below the 8% increase implemented in the FY 2011-12 Budget. Also included is a 3% cost-of-living adjustment for non-uniformed personnel in the amount of $3.9 million and $1.0 million for the annualized cost of market salary studies implemented In FY 2011-12 for non-uniformed staff. Other FY 2012-13 impacts to the General Fund include the annual true-up of transfers to other funds and departments such as Support Services; Communications and Technology Management; Combined Transportation, Emergency and Communications Center; and Wireless to cover the cost of services provided to General Fund departments. The increase in the cost of fuel is a moderate $0.3 million, while the increase for vehicle maintenance is projected to be $1.1 million—a reflection of the increasing cost of parts, a growing fleet and greater skill-set required to service newer automotive technology. The contribution to the Employee Retirement System (ERS) for non-civil service employees is increasing by $3.3 million, from a 16% contribution to 18%, per the supplemental funding plan for ERS approved by Council to approve the long-term financial health of the plan. Finally, the transfer to the Economic Incentives Reserve Fund to maintain the City’s obligation for established incentive agreements remains fairly level at $13.0 million.
2012-13 Proposed Budget, Austin, TX
22 | Volume I
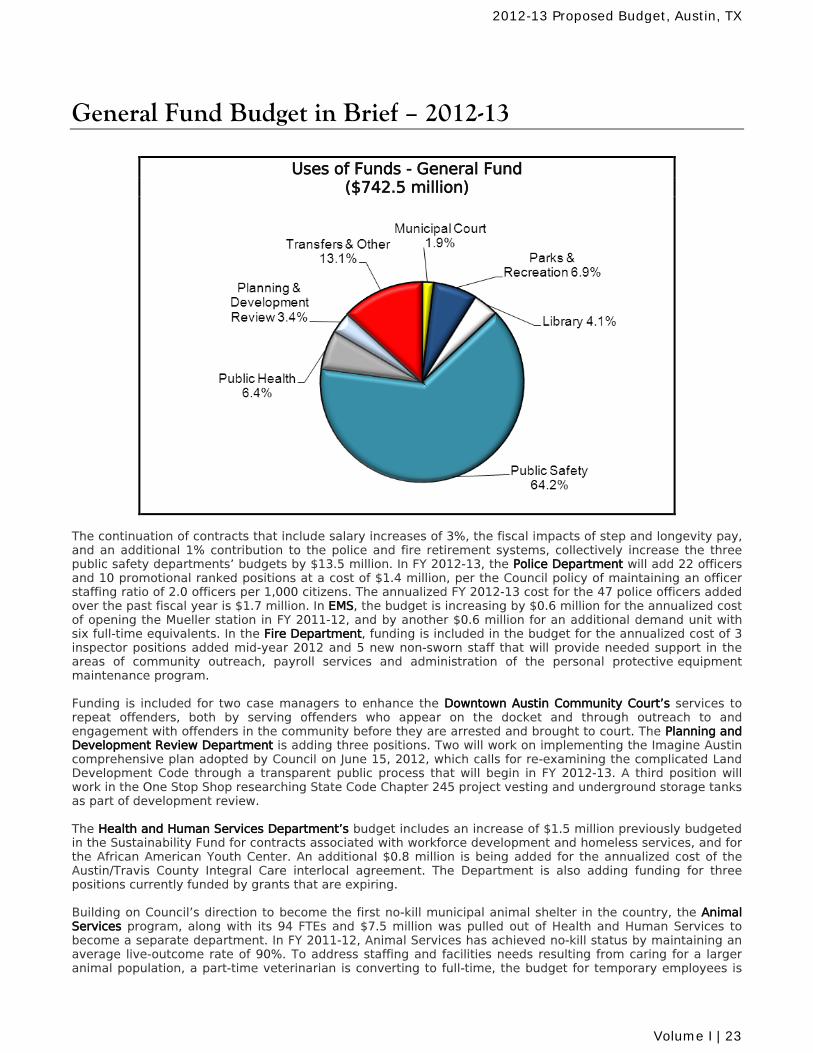
General Fund Budget in Brief – 2012-13
Uses of Funds - General Fund ($742.5 million)
The continuation of contracts that include salary increases of 3%, the fiscal impacts of step and longevity pay, and an additional 1% contribution to the police and fire retirement systems, collectively increase the three public safety departments’ budgets by $13.5 million. In FY 2012-13, the Police Department will add 22 officers and 10 promotional ranked positions at a cost of $1.4 million, per the Council policy of maintaining an officer staffing ratio of 2.0 officers per 1,000 citizens. The annualized FY 2012-13 cost for the 47 police officers added over the past fiscal year is $1.7 million. In EMS, the budget is increasing by $0.6 million for the annualized cost of opening the Mueller station in FY 2011-12, and by another $0.6 million for an additional demand unit with six full-time equivalents. In the Fire Department, funding is included in the budget for the annualized cost of 3 inspector positions added mid-year 2012 and 5 new non-sworn staff that will provide needed support in the areas of community outreach, payroll services and administration of the personal protective equipment maintenance program. Funding is included for two case managers to enhance the Downtown Austin Community Court’s services to repeat offenders, both by serving offenders who appear on the docket and through outreach to and engagement with offenders in the community before they are arrested and brought to court. The Planning and Development Review Department is adding three positions. Two will work on implementing the Imagine Austin comprehensive plan adopted by Council on June 15, 2012, which calls for re-examining the complicated Land Development Code through a transparent public process that will begin in FY 2012-13. A third position will work in the One Stop Shop researching State Code Chapter 245 project vesting and underground storage tanks as part of development review. The Health and Human Services Department’s budget includes an increase of $1.5 million previously budgeted in the Sustainability Fund for contracts associated with workforce development and homeless services, and for the African American Youth Center. An additional $0.8 million is being added for the annualized cost of the Austin/Travis County Integral Care interlocal agreement. The Department is also adding funding for three positions currently funded by grants that are expiring. Building on Council’s direction to become the first no-kill municipal animal shelter in the country, the Animal Services program, along with its 94 FTEs and $7.5 million was pulled out of Health and Human Services to become a separate department. In FY 2011-12, Animal Services has achieved no-kill status by maintaining an average live-outcome rate of 90%. To address staffing and facilities needs resulting from caring for a larger animal population, a part-time veterinarian is converting to full-time, the budget for temporary employees is
2012-13 Proposed Budget, Austin, TX
Volume I | 23
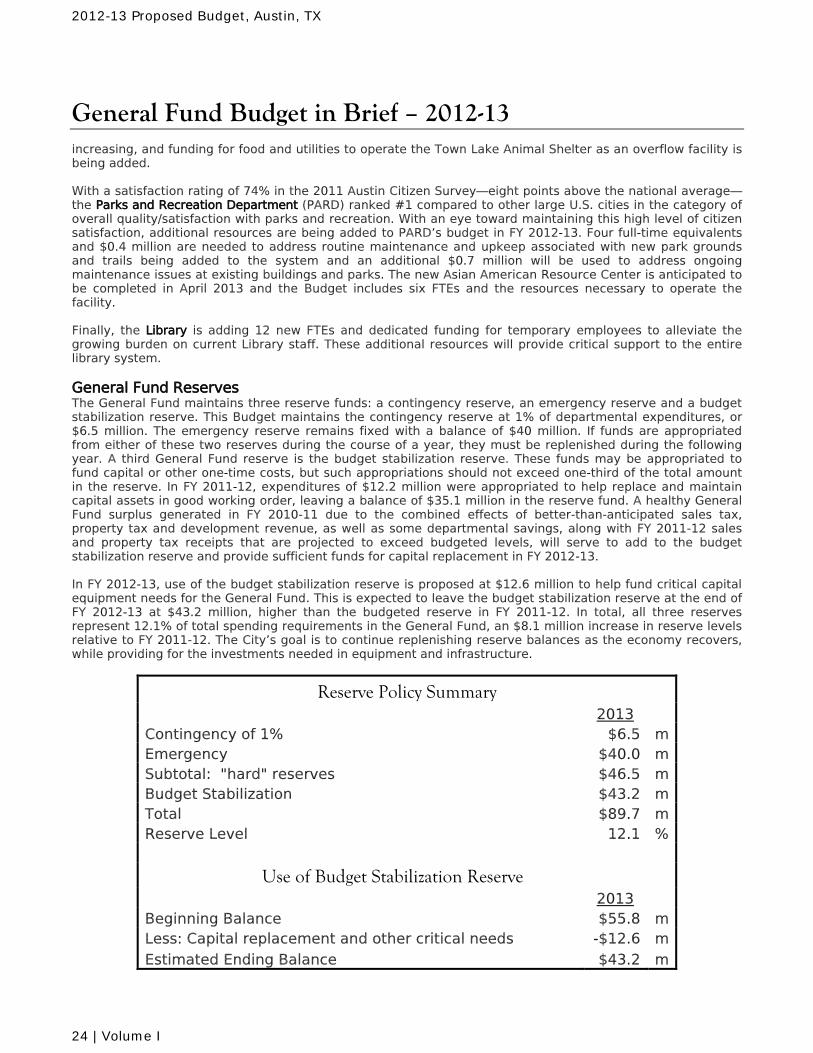
General Fund Budget in Brief – 2012-13 increasing, and funding for food and utilities to operate the Town Lake Animal Shelter as an overflow facility is being added. With a satisfaction rating of 74% in the 2011 Austin Citizen Survey—eight points above the national average—the Parks and Recreation Department (PARD) ranked #1 compared to other large U.S. cities in the category of overall quality/satisfaction with parks and recreation. With an eye toward maintaining this high level of citizen satisfaction, additional resources are being added to PARD’s budget in FY 2012-13. Four full-time equivalents and $0.4 million are needed to address routine maintenance and upkeep associated with new park grounds and trails being added to the system and an additional $0.7 million will be used to address ongoing maintenance issues at existing buildings and parks. The new Asian American Resource Center is anticipated to be completed in April 2013 and the Budget includes six FTEs and the resources necessary to operate the facility. Finally, the Library is adding 12 new FTEs and dedicated funding for temporary employees to alleviate the growing burden on current Library staff. These additional resources will provide critical support to the entire library system. General Fund Reserves The General Fund maintains three reserve funds: a contingency reserve, an emergency reserve and a budget stabilization reserve. This Budget maintains the contingency reserve at 1% of departmental expenditures, or $6.5 million. The emergency reserve remains fixed with a balance of $40 million. If funds are appropriated from either of these two reserves during the course of a year, they must be replenished during the following year. A third General Fund reserve is the budget stabilization reserve. These funds may be appropriated to fund capital or other one-time costs, but such appropriations should not exceed one-third of the total amount in the reserve. In FY 2011-12, expenditures of $12.2 million were appropriated to help replace and maintain capital assets in good working order, leaving a balance of $35.1 million in the reserve fund. A healthy General Fund surplus generated in FY 2010-11 due to the combined effects of better-than-anticipated sales tax, property tax and development revenue, as well as some departmental savings, along with FY 2011-12 sales and property tax receipts that are projected to exceed budgeted levels, will serve to add to the budget stabilization reserve and provide sufficient funds for capital replacement in FY 2012-13. In FY 2012-13, use of the budget stabilization reserve is proposed at $12.6 million to help fund critical capital equipment needs for the General Fund. This is expected to leave the budget stabilization reserve at the end of FY 2012-13 at $43.2 million, higher than the budgeted reserve in FY 2011-12. In total, all three reserves represent 12.1% of total spending requirements in the General Fund, an $8.1 million increase in reserve levels relative to FY 2011-12. The City’s goal is to continue replenishing reserve balances as the economy recovers, while providing for the investments needed in equipment and infrastructure.
Reserve Policy Summary 2013 Contingency of 1% $6.5 m Emergency $40.0 m Subtotal: "hard" reserves $46.5 m Budget Stabilization $43.2 m Total $89.7 m Reserve Level 12.1 %
Use of Budget Stabilization Reserve 2013 Beginning Balance $55.8 m Less: Capital replacement and other critical needs -$12.6 m Estimated Ending Balance $43.2 m
2012-13 Proposed Budget, Austin, TX
24 | Volume I
City of Austin
2012-2013 Proposed
Budget
Volume I Public Safety

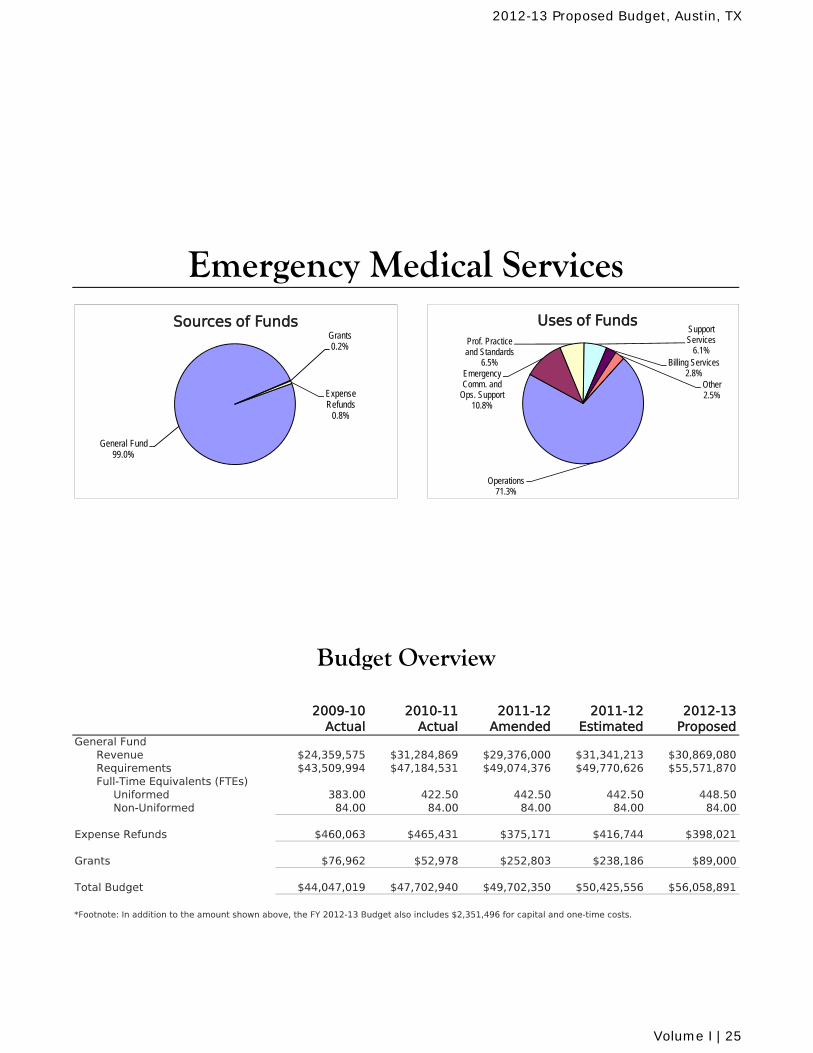
2009-10 Actual
2010-11 Actual
2011-12 Amended
2011-12 Estimated
2012-13 Proposed
General FundRevenue $24,359,575 $31,284,869 $29,376,000 $31,341,213 $30,869,080Requirements $43,509,994 $47,184,531 $49,074,376 $49,770,626 $55,571,870Full-Time Equivalents (FTEs) Uniformed 383.00 422.50 442.50 442.50 448.50 Non-Uniformed 84.00 84.00 84.00 84.00 84.00
Expense Refunds $460,063 $465,431 $375,171 $416,744 $398,021
Grants $76,962 $52,978 $252,803 $238,186 $89,000
Total Budget $44,047,019 $47,702,940 $49,702,350 $50,425,556 $56,058,891
Budget Overview
Emergency Medical Services
*Footnote: In addition to the amount shown above, the FY 2012-13 Budget also includes $2,351,496 for capital and one-time costs.
General Fund99.0%
Grants0.2%
Expense Refunds
0.8%
Sources of Funds
Operations71.3%
Emergency Comm. and
Ops. Support10.8%
Prof. Practice and Standards
6.5%
Support Services
6.1%Billing Services
2.8%Other2.5%
Uses of Funds
2012-13 Proposed Budget, Austin, TX
Volume I | 25
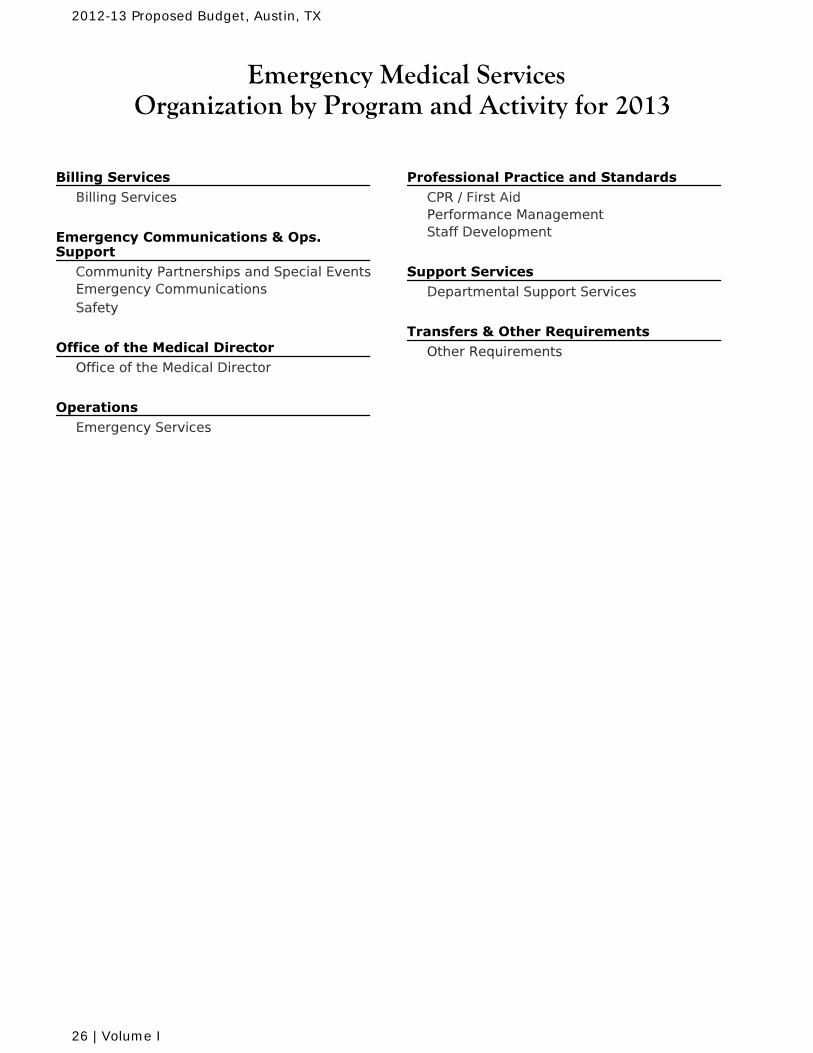
Emergency Medical ServicesOrganization by Program and Activity for 2013
Billing Services Billing Services
Emergency Communications & Ops.Support
Community Partnerships and Special EventsEmergency CommunicationsSafety
Office of the Medical Director Office of the Medical Director
Operations Emergency Services
Professional Practice and Standards CPR / First AidPerformance ManagementStaff Development
Support Services Departmental Support Services
Transfers & Other Requirements Other Requirements
2012-13 Proposed Budget, Austin, TX
26 | Volume I
Emergency Medical ServicesMission and Goals for 2013
Mission
Austin-Travis County EMS changes the lives of the people we serve. We preserve life, improvehealth, and promote safety. We are engaged in and accountable to the community we serve.
Goals
Achieve community customer service satisfaction rate of at least 90 percent in 2013.
Respond to life threatening priority one calls within 9 minutes and 59 seconds 90 percent of thetime in urban areas of the community in 2013.
Achieve at least a 13 percent community discharge-alive rate of patients with cardiac arrest fromcardiac causes in 2013.
Deliver at least 32 percent of patients with cardiac arrest from cardiac causes to an appropriatemedical facility with a pulse in 2013.
Deliver time critical patients (Trauma Alerts, Stroke, and Cardiac (STEMI) Alerts) to appropriatehospitals within an average of 60 minutes of EMS system activation in 2013.
Maintain a twelve-month collection rate percentage on patient bills of at least 45 percent in 2013.
Achieve Commission on the Accreditation of Ambulance Services Accreditation by 2013.
2012-13 Proposed Budget, Austin, TX
Volume I | 27
Emergency Medical Services
Message from the Director
Austin-Travis County EMS (A/TCEMS) is faced with an assortment of future challenges. Growth of vertical development, continued increases in traffic and population density and growth in Travis County all pose challenges for A/TCEMS. Despite this, the A/TCEMS Department has steadily improved response times, trauma care performance, heart attack care, stroke care, and survival from cardiac arrests.
As challenges have increased A/TCEMS has found solutions that enhance its ability to operate more effectively and efficiently. In early 2010, A/TCEMS fully implemented its electronic patient care reporting system (ePCR) and this system has begun to revolutionize how A/TCEMS gathers patient care information, processes invoices, improves quality of care, and gives back information to the industry. Since FY 2009-10, A/TCEMS has added 4 full-time units and 2 demand units to its service territory and these resources help in addressing the continued demand for services. In FY 2011-12 EMS began building its Community Health Paramedic Program. This program, which focuses on frequent users, is another step in the evolution of patient care. The FY 2012-13 budget includes funding for one additional demand unit at the Medic 5 Station.
A/TCEMS is also addressing the challenges by embarking on a journey to balance the department’s financial resources, performance measures, and ultimately its organizational model to better meet community needs and expectations. This organizational redesign involves three primary areas: operational effectiveness and efficiency; sustainable revenue streams and billing/collections; and financial modeling. The changes that the department has made to date and the changes needed over the next few years will be molded into a strategic plan that will be reviewed annually and aligned with the department’s budget and business plan. The strategic plan will be evaluated annually to make sure that the vision and strategies continue to serve the needs of the community.
Ernie Rodriguez Executive Director
Austin-Travis County Emergency Medical Services Department
2012-13 Proposed Budget, Austin, TX
28 | Volume I
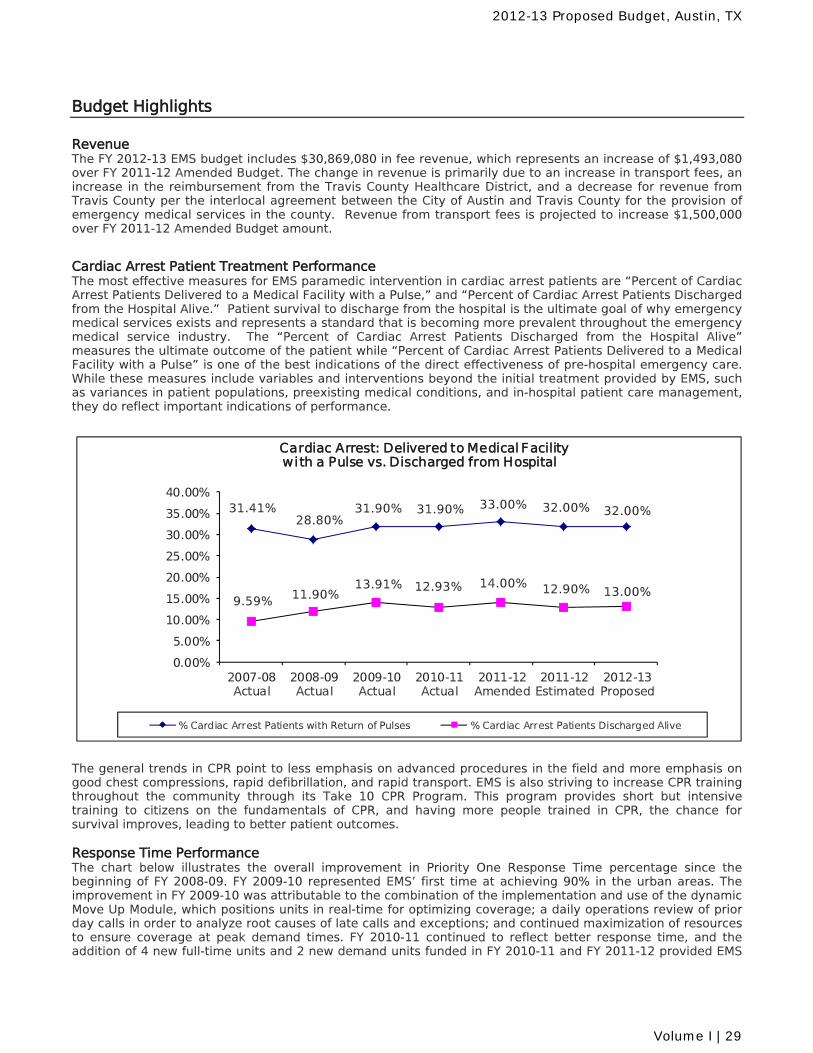
Budget Highlights
Revenue The FY 2012-13 EMS budget includes $30,869,080 in fee revenue, which represents an increase of $1,493,080 over FY 2011-12 Amended Budget. The change in revenue is primarily due to an increase in transport fees, an increase in the reimbursement from the Travis County Healthcare District, and a decrease for revenue from Travis County per the interlocal agreement between the City of Austin and Travis County for the provision of emergency medical services in the county. Revenue from transport fees is projected to increase $1,500,000 over FY 2011-12 Amended Budget amount.
Cardiac Arrest Patient Treatment Performance The most effective measures for EMS paramedic intervention in cardiac arrest patients are “Percent of Cardiac Arrest Patients Delivered to a Medical Facility with a Pulse,” and “Percent of Cardiac Arrest Patients Discharged from the Hospital Alive.” Patient survival to discharge from the hospital is the ultimate goal of why emergency medical services exists and represents a standard that is becoming more prevalent throughout the emergency medical service industry. The “Percent of Cardiac Arrest Patients Discharged from the Hospital Alive” measures the ultimate outcome of the patient while “Percent of Cardiac Arrest Patients Delivered to a Medical Facility with a Pulse” is one of the best indications of the direct effectiveness of pre-hospital emergency care. While these measures include variables and interventions beyond the initial treatment provided by EMS, such as variances in patient populations, preexisting medical conditions, and in-hospital patient care management, they do reflect important indications of performance.
31.41%28.80%
31.90% 31.90% 33.00% 32.00% 32.00%
9.59% 11.90%13.91% 12.93% 14.00% 12.90% 13.00%
0.00%
5.00%
10.00%
15.00%
20.00%
25.00%
30.00%
35.00%
40.00%
2007-08Actual
2008-09Actual
2009-10Actual
2010-11Actual
2011-12Amended
2011-12Estimated
2012-13Proposed
% Cardiac Arrest Patients with Return of Pulses % Cardiac Arrest Patients Discharged Alive
Cardiac Arrest: Delivered to Medical Facilitywith a Pulse vs. Discharged from Hospital
The general trends in CPR point to less emphasis on advanced procedures in the field and more emphasis on good chest compressions, rapid defibrillation, and rapid transport. EMS is also striving to increase CPR training throughout the community through its Take 10 CPR Program. This program provides short but intensive training to citizens on the fundamentals of CPR, and having more people trained in CPR, the chance for survival improves, leading to better patient outcomes. Response Time Performance The chart below illustrates the overall improvement in Priority One Response Time percentage since the beginning of FY 2008-09. FY 2009-10 represented EMS’ first time at achieving 90% in the urban areas. The improvement in FY 2009-10 was attributable to the combination of the implementation and use of the dynamic Move Up Module, which positions units in real-time for optimizing coverage; a daily operations review of prior day calls in order to analyze root causes of late calls and exceptions; and continued maximization of resources to ensure coverage at peak demand times. FY 2010-11 continued to reflect better response time, and the addition of 4 new full-time units and 2 new demand units funded in FY 2010-11 and FY 2011-12 provided EMS
2012-13 Proposed Budget, Austin, TX
Volume I | 29
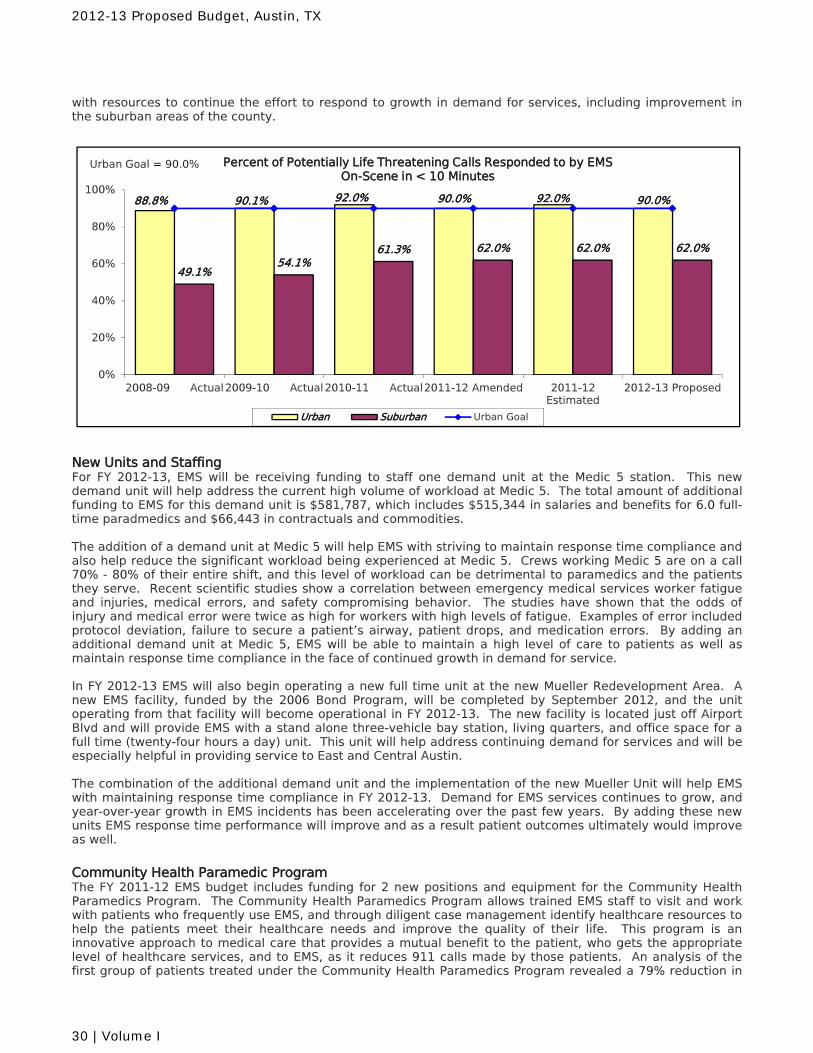
with resources to continue the effort to respond to growth in demand for services, including improvement in the suburban areas of the county.
88.8% 90.1% 92.0% 90.0% 92.0% 90.0%
49.1%54.1%
61.3% 62.0% 62.0% 62.0%
0%
20%
40%
60%
80%
100%
2008-09 Actual2009-10 Actual2010-11 Actual2011-12 Amended 2011-12Estimated
2012-13 Proposed
Percent of Potentially Life Threatening Calls Responded to by EMSOn-Scene in < 10 Minutes
Urban Suburban Urban Goal
Urban Goal = 90.0%
New Units and Staffing For FY 2012-13, EMS will be receiving funding to staff one demand unit at the Medic 5 station. This new demand unit will help address the current high volume of workload at Medic 5. The total amount of additional funding to EMS for this demand unit is $581,787, which includes $515,344 in salaries and benefits for 6.0 full-time paradmedics and $66,443 in contractuals and commodities. The addition of a demand unit at Medic 5 will help EMS with striving to maintain response time compliance and also help reduce the significant workload being experienced at Medic 5. Crews working Medic 5 are on a call 70% - 80% of their entire shift, and this level of workload can be detrimental to paramedics and the patients they serve. Recent scientific studies show a correlation between emergency medical services worker fatigue and injuries, medical errors, and safety compromising behavior. The studies have shown that the odds of injury and medical error were twice as high for workers with high levels of fatigue. Examples of error included protocol deviation, failure to secure a patient’s airway, patient drops, and medication errors. By adding an additional demand unit at Medic 5, EMS will be able to maintain a high level of care to patients as well as maintain response time compliance in the face of continued growth in demand for service. In FY 2012-13 EMS will also begin operating a new full time unit at the new Mueller Redevelopment Area. A new EMS facility, funded by the 2006 Bond Program, will be completed by September 2012, and the unit operating from that facility will become operational in FY 2012-13. The new facility is located just off Airport Blvd and will provide EMS with a stand alone three-vehicle bay station, living quarters, and office space for a full time (twenty-four hours a day) unit. This unit will help address continuing demand for services and will be especially helpful in providing service to East and Central Austin. The combination of the additional demand unit and the implementation of the new Mueller Unit will help EMS with maintaining response time compliance in FY 2012-13. Demand for EMS services continues to grow, and year-over-year growth in EMS incidents has been accelerating over the past few years. By adding these new units EMS response time performance will improve and as a result patient outcomes ultimately would improve as well.
Community Health Paramedic Program The FY 2011-12 EMS budget includes funding for 2 new positions and equipment for the Community Health Paramedics Program. The Community Health Paramedics Program allows trained EMS staff to visit and work with patients who frequently use EMS, and through diligent case management identify healthcare resources to help the patients meet their healthcare needs and improve the quality of their life. This program is an innovative approach to medical care that provides a mutual benefit to the patient, who gets the appropriate level of healthcare services, and to EMS, as it reduces 911 calls made by those patients. An analysis of the first group of patients treated under the Community Health Paramedics Program revealed a 79% reduction in
2012-13 Proposed Budget, Austin, TX
30 | Volume I
their use of EMS services and a second group of patients decreased their use of EMS services by 41%. Although these first groups of patients represent small sample sizes, the program has a high potential for success. One-Time Critical Items The Budget includes funding in the One-Time Critical Capital Fund in the amount of $2,351,496 for cardiac monitors, two ambulances and equipment for Mueller Station and the new demand unit at Medic 5 station, Stryker Power Pro Stretchers, Automatic External Defibrillators (AEDs), and Stairchairs.
2012-13 Proposed Budget, Austin, TX
Volume I | 31
General Fund
Revenue Changes Dollars
The Budget includes an increase in transport and aid-at-scene revenue due to ananticipated increase in billable trips and process improvements in the billingprocess. $1,500,000
The Budget includes a decrease for revenue from Travis County per the interlocalagreement between the City of Austin and Travis County for the provision ofemergency medical services in the county. ($394,100)
The Budget includes an increase in revenue from the Travis County HealthcareDistrict (Central Health) for provision of emergency medical services to enrolleesof the Medical Assistance Program. $300,000
The Budget includes an increase of $10,000 for permit fee revenue from franchiseapplications for non-emergency transportation providers. $10,000
An increase in standby service revenue is anticipated due to rising demand fromsponsors of public events. $71,880
The Budget includes an increase of $10,500 in revenue from photocopies, adecrease of $5,000 in revenue from the EMS Public Education Program, and adecrease of $200 in Interest Income. $5,300
Expenditure Changes FTEs Dollars
CitywideThe Budget includes $185,403 for salary increases associated with civilian wageadjustments in FY 2013. An additional $97,955 is included in the Budget forincreased City contributions for health insurance. $283,358
The Budget includes $34,832 for wage adjustments associated with implementingthe City's recently completed market study. $34,832
The Budget includes additional funding for the Employees' Retirement System thatis equivalent to 2% of payroll for non-civil service employees to help improve thefunded status of the pension system. This amount also includes a budgetreallocation from the fund level to the department level. $3,066,376
Due to rising fuel costs and anticipated maintenance for vehicles the budgets forboth of these contractuals are increasing by $130,366 and $181,034 respectively. $311,400
Meet and Confer Per the Meet and Confer agreement $778,582 is included in the Budget for a 3%base wage increase for uniformed employees. $778,582
The Budget includes a $274,134 increase for the implementation of a newNational Curriculum stipend under the Meet and Confer agreement. $274,134
OperationsThe Budget includes an increase of $640,111 for salaries and benefits for 12.0FTEs to annualize funding for Mueller station approved in FY 2011-12. $640,111
Funding is included in the Budget for a new demand unit at Medic 5 station. Thefull year cost of adding 6.0 full-time EMS Paramedic positions is $515,344. Anadditional $66,443 is included for contractuals and commodities. 6.00 $581,787
Significant ChangesEmergency Medical Services
2012-13 Proposed Budget, Austin, TX
32 | Volume I
Expenditure Changes FTEs Dollars
One Clinical Specialist is reallocated from Operations to Support Services tomanage business analysis and research functions. (1.00) ($119,455)
The Budget reallocates one Operations Manager to Professional Practices andStandards to manage quality assurance functions. (1.00) ($141,049)
One Operations Manager, two Operations Supervisors, and one Paramedic arereallocated to Community Partnerships and Special Events to consolidate supportfunctions. (4.00) ($501,260)
The Budget reallocates one Paramedic from Support Services to Operations toreflect the discontinuation of recruitment responsibilities. 1.00 $77,460
An increase of $165,662 for drugs, medical supplies, and medical equipment isincluded in the Budget to reflect higher usage rates and general inflation ofmedical supply prices. $165,662
The Budget includes an increase of $51,880 in overtime to provide standbyservices for the Formula One race in November 2012. $51,880
A decrease in the amount of $17,040 is included in the Budget for one-timecommodities costs for new unit at Harris Branch station. ($17,040)
Community Partnerships and Special EventsAn increase of $15,004 is included in the Budget for rental expenses for One-StopShop office space at the One Texas Center. $15,004
The Budget reallocates one Stores Specialist from Professional Standards andPractices to maintain standby fleet readiness. 1.00 $51,006
One Operations Manager, two Operations Supervisors, and one Paramedic arereallocated from Opeations to consolidate support functions. 4.00 $501,260
Professional Practices and StandardsThe Budget reallocates one Operations Manager from Operations to managequality assurance functions. 1.00 $141,049
One Stores Specialist is reallocated to Community Partnerships and Special Eventsto maintain standby fleet readiness. (1.00) ($51,006)
An increase in the amount of $340,774 is included in the Budget to addressstructural deficit that impacted five ACC cadets, the Deputy Medical Director, andone Patient Account Supervisor. $340,774
The Budget includes a decrease of $29,336 for one-time start-up costs for theCommunity Health Paramedic Program. ($29,336)
Billing ServicesThe Budget reallocates one Customer Care Program Manager from SupportServices to manage billing functions. 1.00 $112,544
Support ServicesOne Customer Care Program Manager is reallocated to Billing Services to managebilling functions. (1.00) ($112,544)
The Budget reallocates one Clinical Specialist from Operations to manage businessanalysis and research functions. 1.00 $119,455
One Paramedic is reallocated to Operations to reflect the discontinuation ofrecruitment responsibilities. (1.00) ($77,460)
2012-13 Proposed Budget, Austin, TX
Volume I | 33
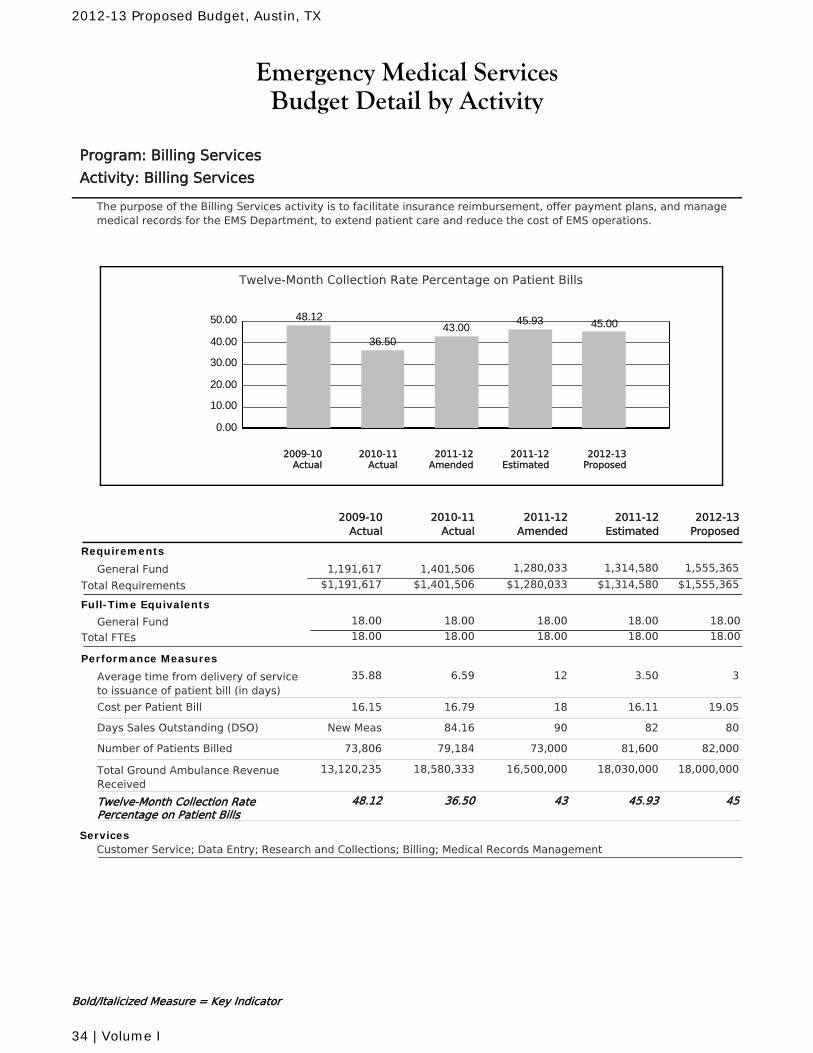
Emergency Medical ServicesBudget Detail by Activity
Program: Billing Services
Activity: Billing Services
The purpose of the Billing Services activity is to facilitate insurance reimbursement, offer payment plans, and managemedical records for the EMS Department, to extend patient care and reduce the cost of EMS operations.
Twelve-Month Collection Rate Percentage on Patient Bills
0.00
10.00
20.00
30.00
40.00
50.00 48.12
36.5043.00
45.93 45.00
2010-11Actual
2012-13Proposed
2011-12Amended
2011-12Estimated
2009-10Actual
2011-12Amended
2010-11Actual
2011-12Estimated
2012-13Proposed
2009-10Actual
Requirements
General Fund 1,280,033 1,314,580 1,555,3651,401,5061,191,617
$1,280,033 $1,314,580 $1,555,365Total Requirements $1,401,506$1,191,617
Full-Time Equivalents
General Fund 18.00 18.00 18.00 18.0018.00
Total FTEs 18.00 18.00 18.00 18.0018.00
Performance Measures
Average time from delivery of serviceto issuance of patient bill (in days)
126.59 3.50 335.88
Cost per Patient Bill 1816.79 16.11 19.0516.15
Days Sales Outstanding (DSO) 9084.16 82 80New Meas
Number of Patients Billed 73,00079,184 81,600 82,00073,806
Total Ground Ambulance RevenueReceived
16,500,00018,580,333 18,030,000 18,000,00013,120,235
Twelve-Month Collection RatePercentage on Patient Bills
4336.50 45.93 4548.12
ServicesCustomer Service; Data Entry; Research and Collections; Billing; Medical Records Management
Bold/Italicized Measure = Key Indicator
2012-13 Proposed Budget, Austin, TX
34 | Volume I
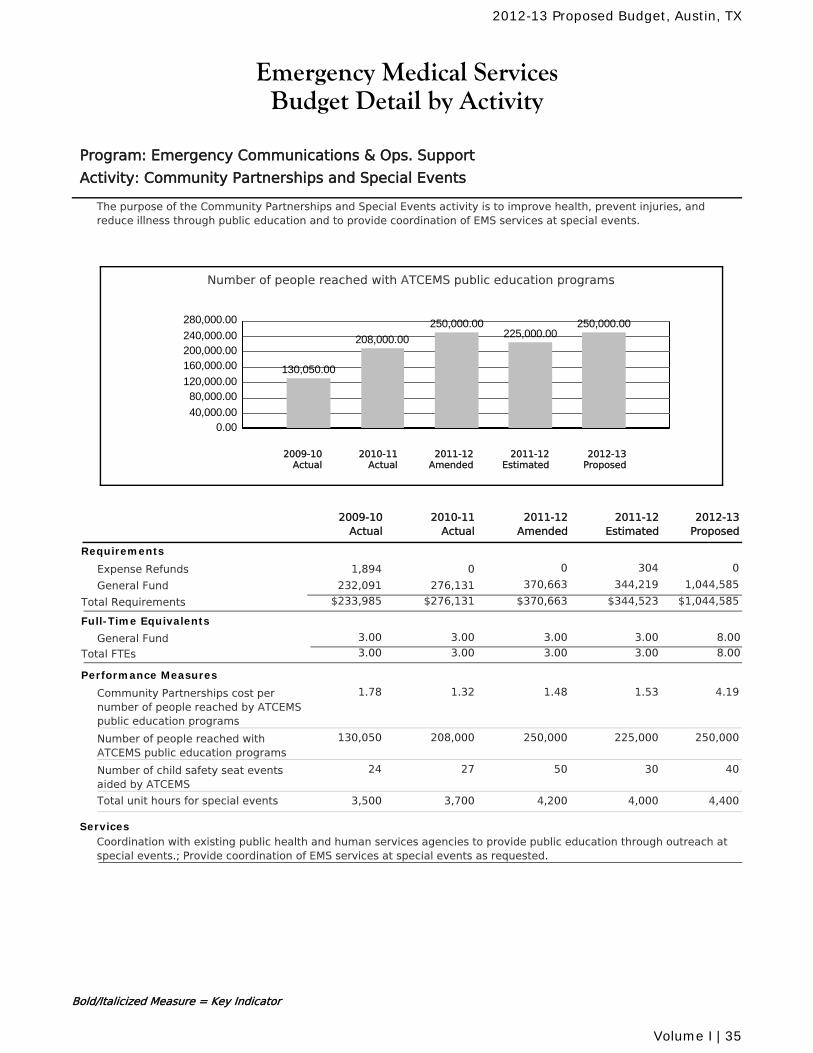
Emergency Medical ServicesBudget Detail by Activity
Program: Emergency Communications & Ops. Support
Activity: Community Partnerships and Special Events
The purpose of the Community Partnerships and Special Events activity is to improve health, prevent injuries, andreduce illness through public education and to provide coordination of EMS services at special events.
Number of people reached with ATCEMS public education programs
0.0040,000.00
80,000.00120,000.00
160,000.00200,000.00240,000.00
280,000.00
130,050.00
208,000.00
250,000.00225,000.00
250,000.00
2010-11Actual
2012-13Proposed
2011-12Amended
2011-12Estimated
2009-10Actual
2011-12Amended
2010-11Actual
2011-12Estimated
2012-13Proposed
2009-10Actual
Requirements
Expense Refunds 0 304 001,894
General Fund 370,663 344,219 1,044,585276,131232,091
$370,663 $344,523 $1,044,585Total Requirements $276,131$233,985
Full-Time Equivalents
General Fund 3.00 3.00 3.00 8.003.00
Total FTEs 3.00 3.00 3.00 8.003.00
Performance Measures
Community Partnerships cost pernumber of people reached by ATCEMSpublic education programs
1.481.32 1.53 4.191.78
Number of people reached withATCEMS public education programs
250,000208,000 225,000 250,000130,050
Number of child safety seat eventsaided by ATCEMS
5027 30 4024
Total unit hours for special events 4,2003,700 4,000 4,4003,500
ServicesCoordination with existing public health and human services agencies to provide public education through outreach atspecial events.; Provide coordination of EMS services at special events as requested.
Bold/Italicized Measure = Key Indicator
2012-13 Proposed Budget, Austin, TX
Volume I | 35
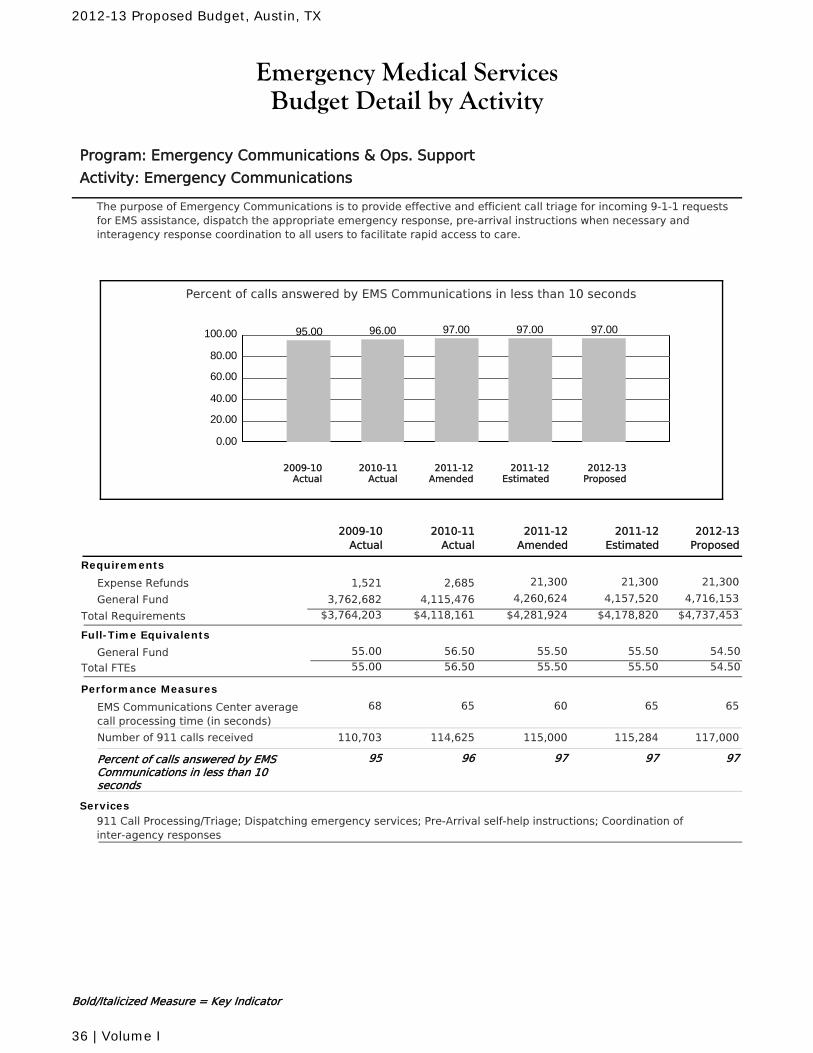
Emergency Medical ServicesBudget Detail by Activity
Program: Emergency Communications & Ops. Support
Activity: Emergency Communications
The purpose of Emergency Communications is to provide effective and efficient call triage for incoming 9-1-1 requestsfor EMS assistance, dispatch the appropriate emergency response, pre-arrival instructions when necessary andinteragency response coordination to all users to facilitate rapid access to care.
Percent of calls answered by EMS Communications in less than 10 seconds
0.00
20.00
40.00
60.00
80.00
100.00 95.00 96.00 97.00 97.00 97.00
2010-11Actual
2012-13Proposed
2011-12Amended
2011-12Estimated
2009-10Actual
2011-12Amended
2010-11Actual
2011-12Estimated
2012-13Proposed
2009-10Actual
Requirements
Expense Refunds 21,300 21,300 21,3002,6851,521
General Fund 4,260,624 4,157,520 4,716,1534,115,4763,762,682
$4,281,924 $4,178,820 $4,737,453Total Requirements $4,118,161$3,764,203
Full-Time Equivalents
General Fund 56.50 55.50 55.50 54.5055.00
Total FTEs 56.50 55.50 55.50 54.5055.00
Performance Measures
EMS Communications Center averagecall processing time (in seconds)
6065 65 6568
Number of 911 calls received 115,000114,625 115,284 117,000110,703
Percent of calls answered by EMSCommunications in less than 10seconds
9796 97 9795
Services911 Call Processing/Triage; Dispatching emergency services; Pre-Arrival self-help instructions; Coordination ofinter-agency responses
Bold/Italicized Measure = Key Indicator
2012-13 Proposed Budget, Austin, TX
36 | Volume I
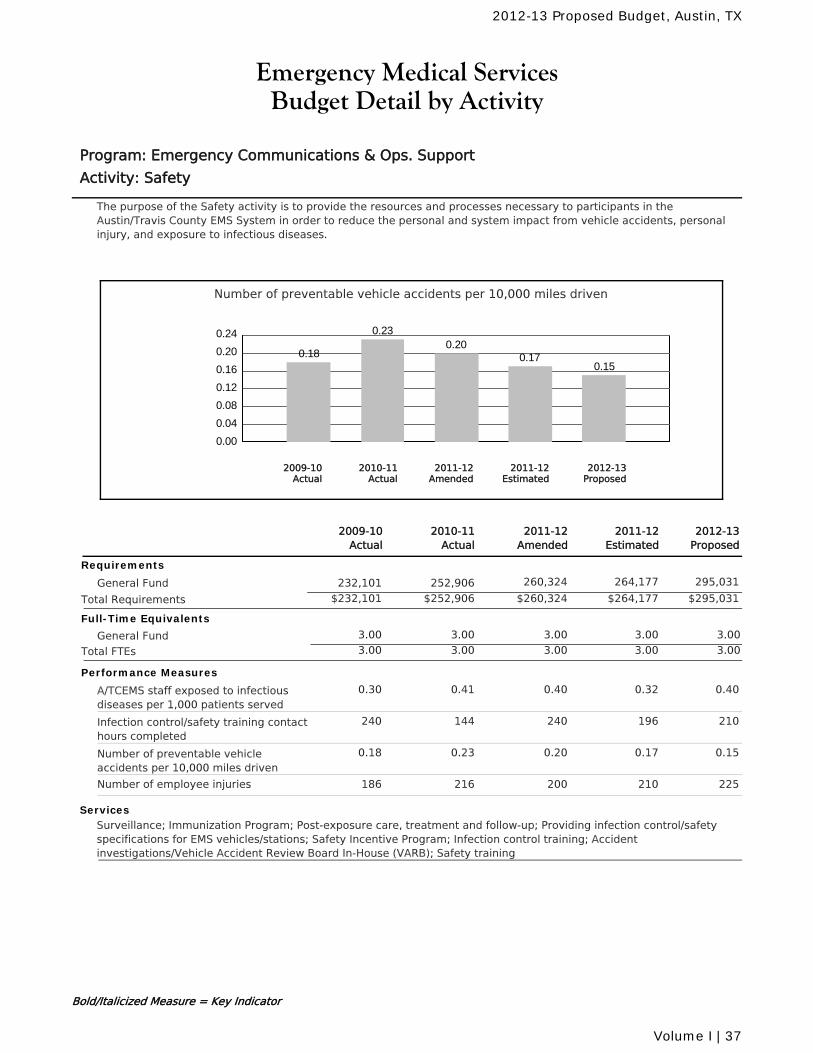
Emergency Medical ServicesBudget Detail by Activity
Program: Emergency Communications & Ops. Support
Activity: Safety
The purpose of the Safety activity is to provide the resources and processes necessary to participants in theAustin/Travis County EMS System in order to reduce the personal and system impact from vehicle accidents, personalinjury, and exposure to infectious diseases.
Number of preventable vehicle accidents per 10,000 miles driven
0.00
0.04
0.08
0.12
0.16
0.20
0.24
0.18
0.230.20
0.170.15
2010-11Actual
2012-13Proposed
2011-12Amended
2011-12Estimated
2009-10Actual
2011-12Amended
2010-11Actual
2011-12Estimated
2012-13Proposed
2009-10Actual
Requirements
General Fund 260,324 264,177 295,031252,906232,101
$260,324 $264,177 $295,031Total Requirements $252,906$232,101
Full-Time Equivalents
General Fund 3.00 3.00 3.00 3.003.00
Total FTEs 3.00 3.00 3.00 3.003.00
Performance Measures
A/TCEMS staff exposed to infectiousdiseases per 1,000 patients served
0.400.41 0.32 0.400.30
Infection control/safety training contacthours completed
240144 196 210240
Number of preventable vehicleaccidents per 10,000 miles driven
0.200.23 0.17 0.150.18
Number of employee injuries 200216 210 225186
ServicesSurveillance; Immunization Program; Post-exposure care, treatment and follow-up; Providing infection control/safetyspecifications for EMS vehicles/stations; Safety Incentive Program; Infection control training; Accidentinvestigations/Vehicle Accident Review Board In-House (VARB); Safety training
Bold/Italicized Measure = Key Indicator
2012-13 Proposed Budget, Austin, TX
Volume I | 37
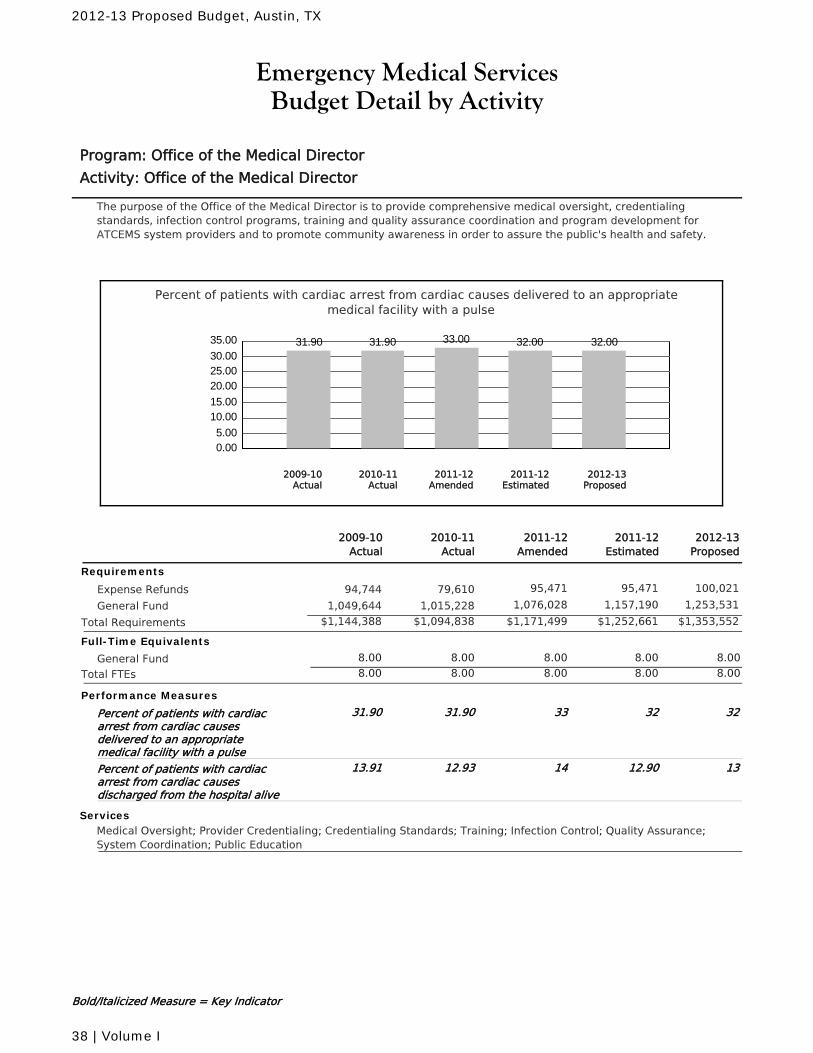
Emergency Medical ServicesBudget Detail by Activity
Program: Office of the Medical Director
Activity: Office of the Medical Director
The purpose of the Office of the Medical Director is to provide comprehensive medical oversight, credentialingstandards, infection control programs, training and quality assurance coordination and program development forATCEMS system providers and to promote community awareness in order to assure the public's health and safety.
Percent of patients with cardiac arrest from cardiac causes delivered to an appropriatemedical facility with a pulse
0.005.00
10.0015.00
20.0025.0030.00
35.00 31.90 31.90 33.00 32.00 32.00
2010-11Actual
2012-13Proposed
2011-12Amended
2011-12Estimated
2009-10Actual
2011-12Amended
2010-11Actual
2011-12Estimated
2012-13Proposed
2009-10Actual
Requirements
Expense Refunds 95,471 95,471 100,02179,61094,744
General Fund 1,076,028 1,157,190 1,253,5311,015,2281,049,644
$1,171,499 $1,252,661 $1,353,552Total Requirements $1,094,838$1,144,388
Full-Time Equivalents
General Fund 8.00 8.00 8.00 8.008.00
Total FTEs 8.00 8.00 8.00 8.008.00
Performance Measures
Percent of patients with cardiacarrest from cardiac causesdelivered to an appropriatemedical facility with a pulse
3331.90 32 3231.90
Percent of patients with cardiacarrest from cardiac causesdischarged from the hospital alive
1412.93 12.90 1313.91
ServicesMedical Oversight; Provider Credentialing; Credentialing Standards; Training; Infection Control; Quality Assurance;System Coordination; Public Education
Bold/Italicized Measure = Key Indicator
2012-13 Proposed Budget, Austin, TX
38 | Volume I
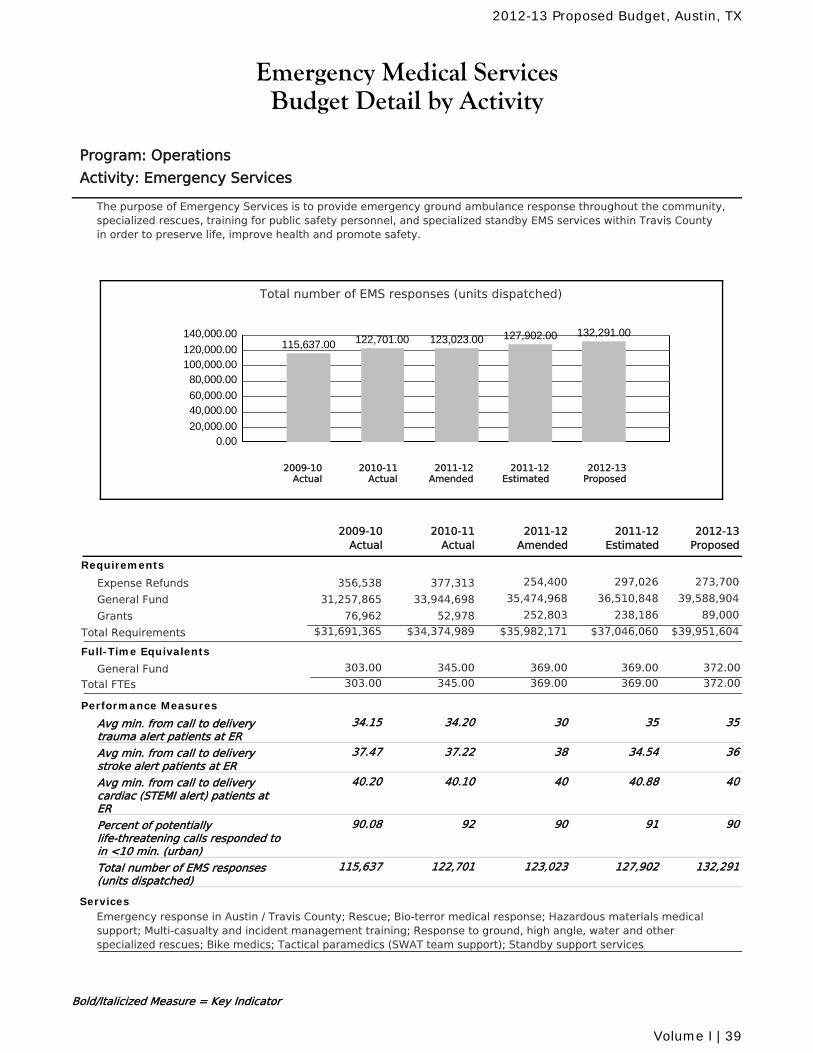
Emergency Medical ServicesBudget Detail by Activity
Program: Operations
Activity: Emergency Services
The purpose of Emergency Services is to provide emergency ground ambulance response throughout the community,specialized rescues, training for public safety personnel, and specialized standby EMS services within Travis Countyin order to preserve life, improve health and promote safety.
Total number of EMS responses (units dispatched)
0.0020,000.00
40,000.0060,000.00
80,000.00100,000.00120,000.00
140,000.00115,637.00 122,701.00 123,023.00 127,902.00 132,291.00
2010-11Actual
2012-13Proposed
2011-12Amended
2011-12Estimated
2009-10Actual
2011-12Amended
2010-11Actual
2011-12Estimated
2012-13Proposed
2009-10Actual
Requirements
Expense Refunds 254,400 297,026 273,700377,313356,538
General Fund 35,474,968 36,510,848 39,588,90433,944,69831,257,865
Grants 252,803 238,186 89,00052,97876,962
$35,982,171 $37,046,060 $39,951,604Total Requirements $34,374,989$31,691,365
Full-Time Equivalents
General Fund 345.00 369.00 369.00 372.00303.00
Total FTEs 345.00 369.00 369.00 372.00303.00
Performance Measures
Avg min. from call to deliverytrauma alert patients at ER
3034.20 35 3534.15
Avg min. from call to deliverystroke alert patients at ER
3837.22 34.54 3637.47
Avg min. from call to deliverycardiac (STEMI alert) patients atER
4040.10 40.88 4040.20
Percent of potentiallylife-threatening calls responded toin <10 min. (urban)
9092 91 9090.08
Total number of EMS responses(units dispatched)
123,023122,701 127,902 132,291115,637
ServicesEmergency response in Austin / Travis County; Rescue; Bio-terror medical response; Hazardous materials medicalsupport; Multi-casualty and incident management training; Response to ground, high angle, water and otherspecialized rescues; Bike medics; Tactical paramedics (SWAT team support); Standby support services
Bold/Italicized Measure = Key Indicator
2012-13 Proposed Budget, Austin, TX
Volume I | 39
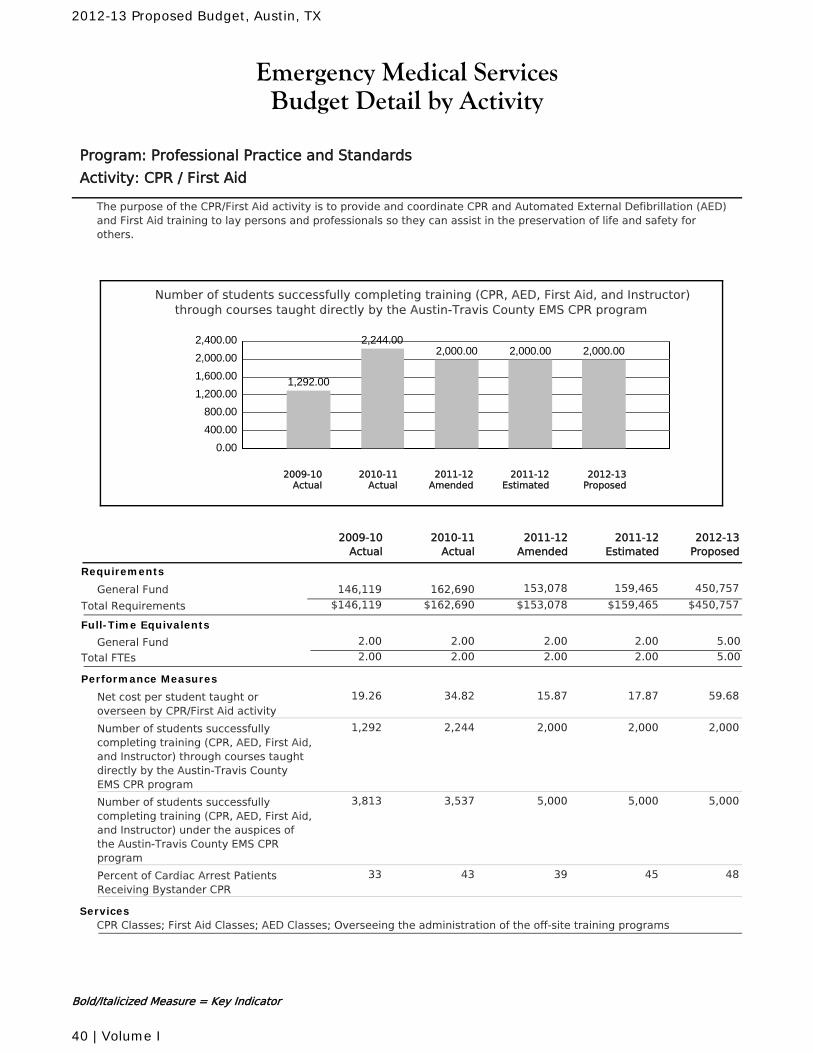
Emergency Medical ServicesBudget Detail by Activity
Program: Professional Practice and Standards
Activity: CPR / First Aid
The purpose of the CPR/First Aid activity is to provide and coordinate CPR and Automated External Defibrillation (AED)and First Aid training to lay persons and professionals so they can assist in the preservation of life and safety forothers.
Number of students successfully completing training (CPR, AED, First Aid, and Instructor)through courses taught directly by the Austin-Travis County EMS CPR program
0.00
400.00
800.00
1,200.00
1,600.00
2,000.00
2,400.00
1,292.00
2,244.002,000.00 2,000.00 2,000.00
2010-11Actual
2012-13Proposed
2011-12Amended
2011-12Estimated
2009-10Actual
2011-12Amended
2010-11Actual
2011-12Estimated
2012-13Proposed
2009-10Actual
Requirements
General Fund 153,078 159,465 450,757162,690146,119
$153,078 $159,465 $450,757Total Requirements $162,690$146,119
Full-Time Equivalents
General Fund 2.00 2.00 2.00 5.002.00
Total FTEs 2.00 2.00 2.00 5.002.00
Performance Measures
Net cost per student taught oroverseen by CPR/First Aid activity
15.8734.82 17.87 59.6819.26
Number of students successfullycompleting training (CPR, AED, First Aid,and Instructor) through courses taughtdirectly by the Austin-Travis CountyEMS CPR program
2,0002,244 2,000 2,0001,292
Number of students successfullycompleting training (CPR, AED, First Aid,and Instructor) under the auspices ofthe Austin-Travis County EMS CPRprogram
5,0003,537 5,000 5,0003,813
Percent of Cardiac Arrest PatientsReceiving Bystander CPR
3943 45 4833
ServicesCPR Classes; First Aid Classes; AED Classes; Overseeing the administration of the off-site training programs
Bold/Italicized Measure = Key Indicator
2012-13 Proposed Budget, Austin, TX
40 | Volume I
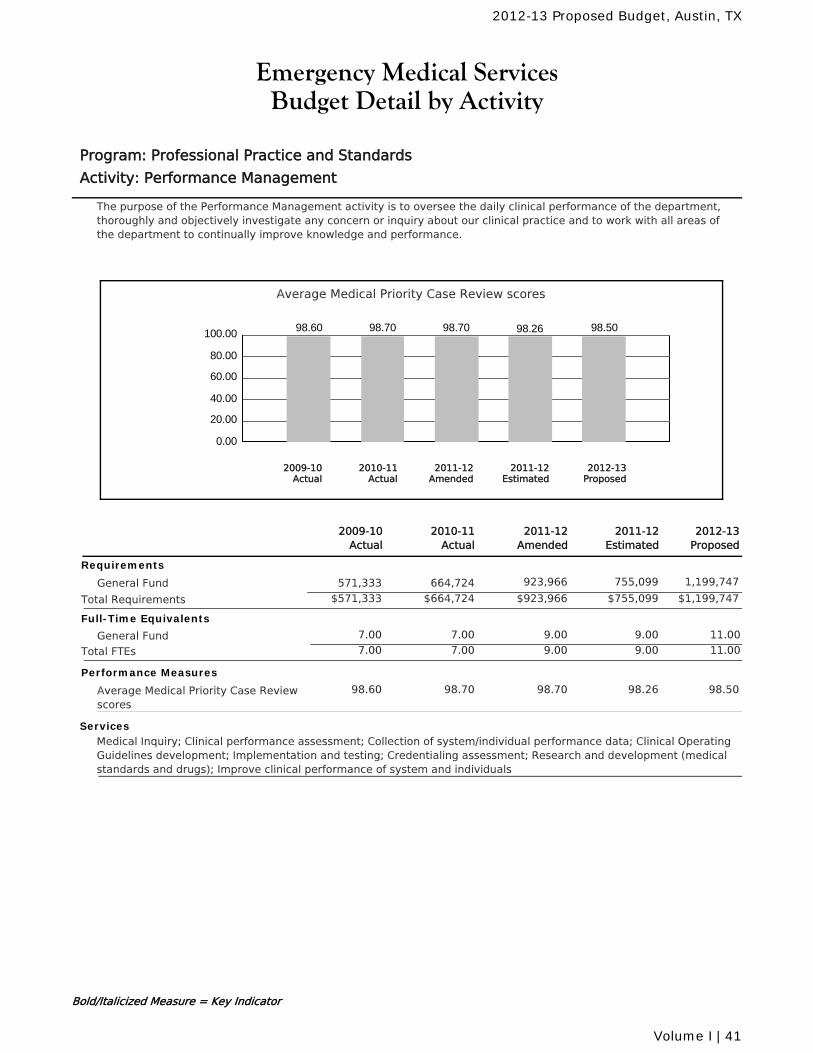
Emergency Medical ServicesBudget Detail by Activity
Program: Professional Practice and Standards
Activity: Performance Management
The purpose of the Performance Management activity is to oversee the daily clinical performance of the department,thoroughly and objectively investigate any concern or inquiry about our clinical practice and to work with all areas ofthe department to continually improve knowledge and performance.
Average Medical Priority Case Review scores
0.00
20.00
40.00
60.00
80.00
100.00 98.60 98.70 98.70 98.26 98.50
2010-11Actual
2012-13Proposed
2011-12Amended
2011-12Estimated
2009-10Actual
2011-12Amended
2010-11Actual
2011-12Estimated
2012-13Proposed
2009-10Actual
Requirements
General Fund 923,966 755,099 1,199,747664,724571,333
$923,966 $755,099 $1,199,747Total Requirements $664,724$571,333
Full-Time Equivalents
General Fund 7.00 9.00 9.00 11.007.00
Total FTEs 7.00 9.00 9.00 11.007.00
Performance Measures
Average Medical Priority Case Reviewscores
98.7098.70 98.26 98.5098.60
ServicesMedical Inquiry; Clinical performance assessment; Collection of system/individual performance data; Clinical OperatingGuidelines development; Implementation and testing; Credentialing assessment; Research and development (medicalstandards and drugs); Improve clinical performance of system and individuals
Bold/Italicized Measure = Key Indicator
2012-13 Proposed Budget, Austin, TX
Volume I | 41
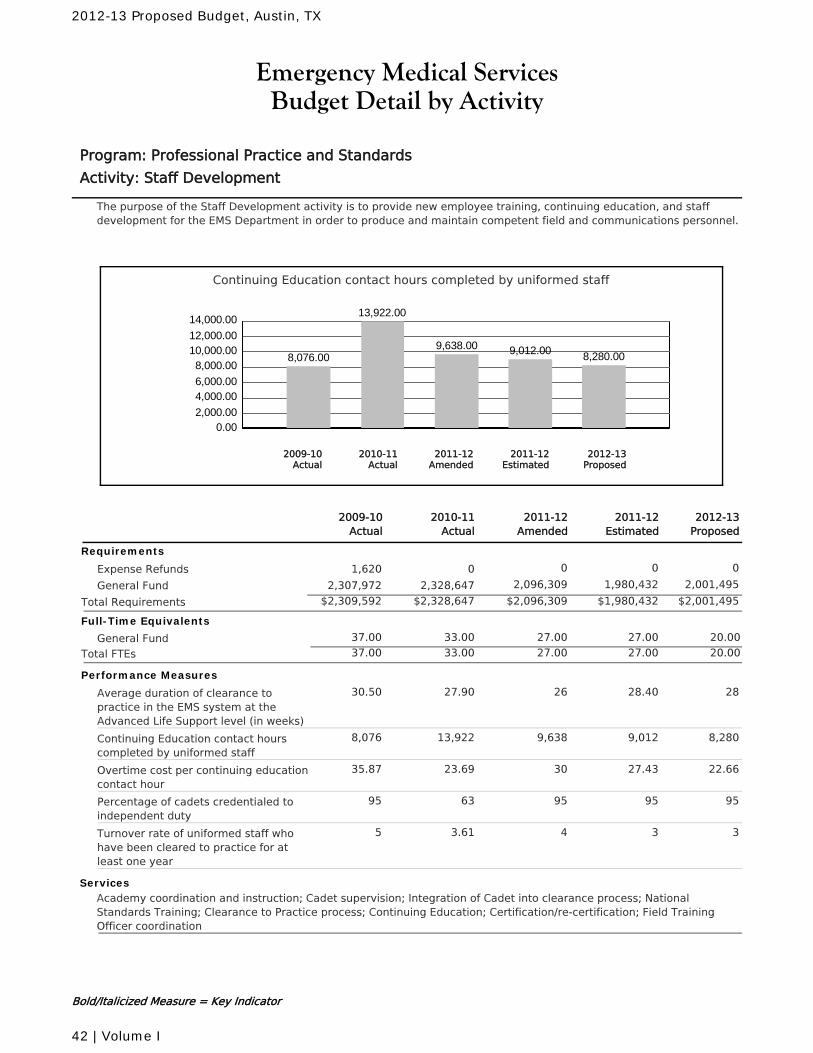
Emergency Medical ServicesBudget Detail by Activity
Program: Professional Practice and Standards
Activity: Staff Development
The purpose of the Staff Development activity is to provide new employee training, continuing education, and staffdevelopment for the EMS Department in order to produce and maintain competent field and communications personnel.
Continuing Education contact hours completed by uniformed staff
0.002,000.00
4,000.006,000.00
8,000.0010,000.0012,000.00
14,000.00
8,076.00
13,922.00
9,638.00 9,012.00 8,280.00
2010-11Actual
2012-13Proposed
2011-12Amended
2011-12Estimated
2009-10Actual
2011-12Amended
2010-11Actual
2011-12Estimated
2012-13Proposed
2009-10Actual
Requirements
Expense Refunds 0 0 001,620
General Fund 2,096,309 1,980,432 2,001,4952,328,6472,307,972
$2,096,309 $1,980,432 $2,001,495Total Requirements $2,328,647$2,309,592
Full-Time Equivalents
General Fund 33.00 27.00 27.00 20.0037.00
Total FTEs 33.00 27.00 27.00 20.0037.00
Performance Measures
Average duration of clearance topractice in the EMS system at theAdvanced Life Support level (in weeks)
2627.90 28.40 2830.50
Continuing Education contact hourscompleted by uniformed staff
9,63813,922 9,012 8,2808,076
Overtime cost per continuing educationcontact hour
3023.69 27.43 22.6635.87
Percentage of cadets credentialed toindependent duty
9563 95 9595
Turnover rate of uniformed staff whohave been cleared to practice for atleast one year
43.61 3 35
ServicesAcademy coordination and instruction; Cadet supervision; Integration of Cadet into clearance process; NationalStandards Training; Clearance to Practice process; Continuing Education; Certification/re-certification; Field TrainingOfficer coordination
Bold/Italicized Measure = Key Indicator
2012-13 Proposed Budget, Austin, TX
42 | Volume I
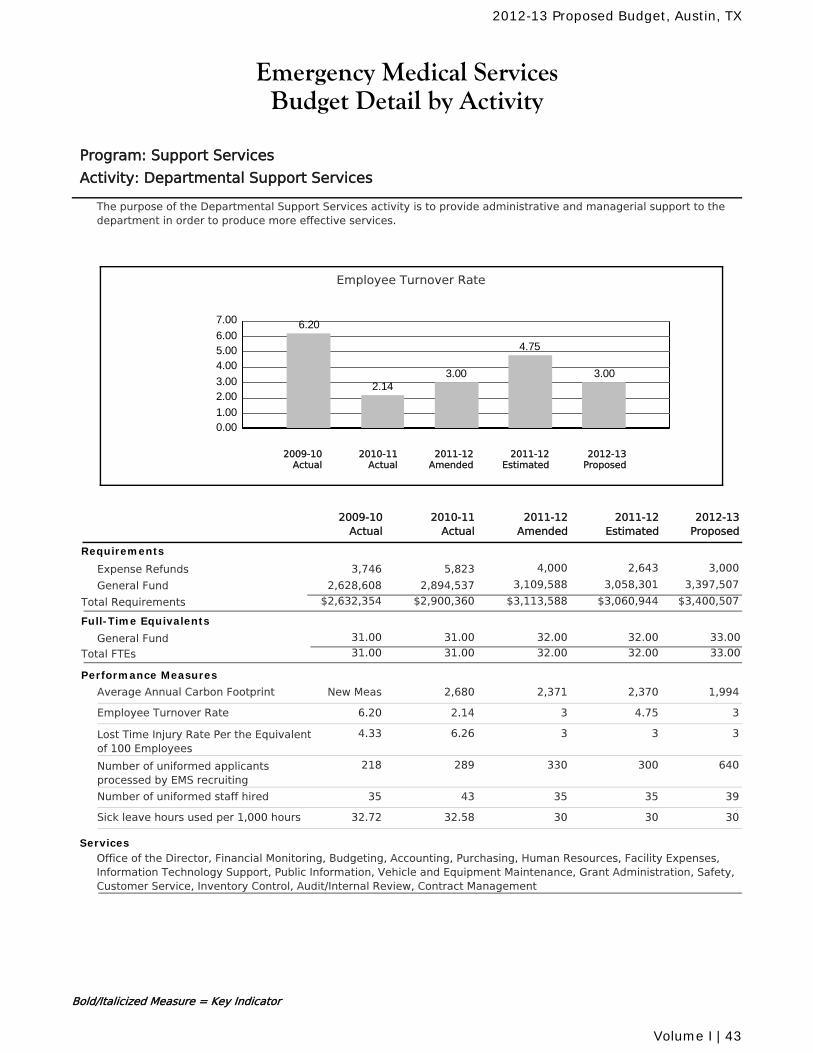
Emergency Medical ServicesBudget Detail by Activity
Program: Support Services
Activity: Departmental Support Services
The purpose of the Departmental Support Services activity is to provide administrative and managerial support to thedepartment in order to produce more effective services.
Employee Turnover Rate
0.001.00
2.003.00
4.005.006.00
7.00 6.20
2.143.00
4.75
3.00
2010-11Actual
2012-13Proposed
2011-12Amended
2011-12Estimated
2009-10Actual
2011-12Amended
2010-11Actual
2011-12Estimated
2012-13Proposed
2009-10Actual
Requirements
Expense Refunds 4,000 2,643 3,0005,8233,746
General Fund 3,109,588 3,058,301 3,397,5072,894,5372,628,608
$3,113,588 $3,060,944 $3,400,507Total Requirements $2,900,360$2,632,354
Full-Time Equivalents
General Fund 31.00 32.00 32.00 33.0031.00
Total FTEs 31.00 32.00 32.00 33.0031.00
Performance Measures
Average Annual Carbon Footprint 2,3712,680 2,370 1,994New Meas
Employee Turnover Rate 32.14 4.75 36.20
Lost Time Injury Rate Per the Equivalentof 100 Employees
36.26 3 34.33
Number of uniformed applicantsprocessed by EMS recruiting
330289 300 640218
Number of uniformed staff hired 3543 35 3935
Sick leave hours used per 1,000 hours 3032.58 30 3032.72
ServicesOffice of the Director, Financial Monitoring, Budgeting, Accounting, Purchasing, Human Resources, Facility Expenses,Information Technology Support, Public Information, Vehicle and Equipment Maintenance, Grant Administration, Safety,Customer Service, Inventory Control, Audit/Internal Review, Contract Management
Bold/Italicized Measure = Key Indicator
2012-13 Proposed Budget, Austin, TX
Volume I | 43
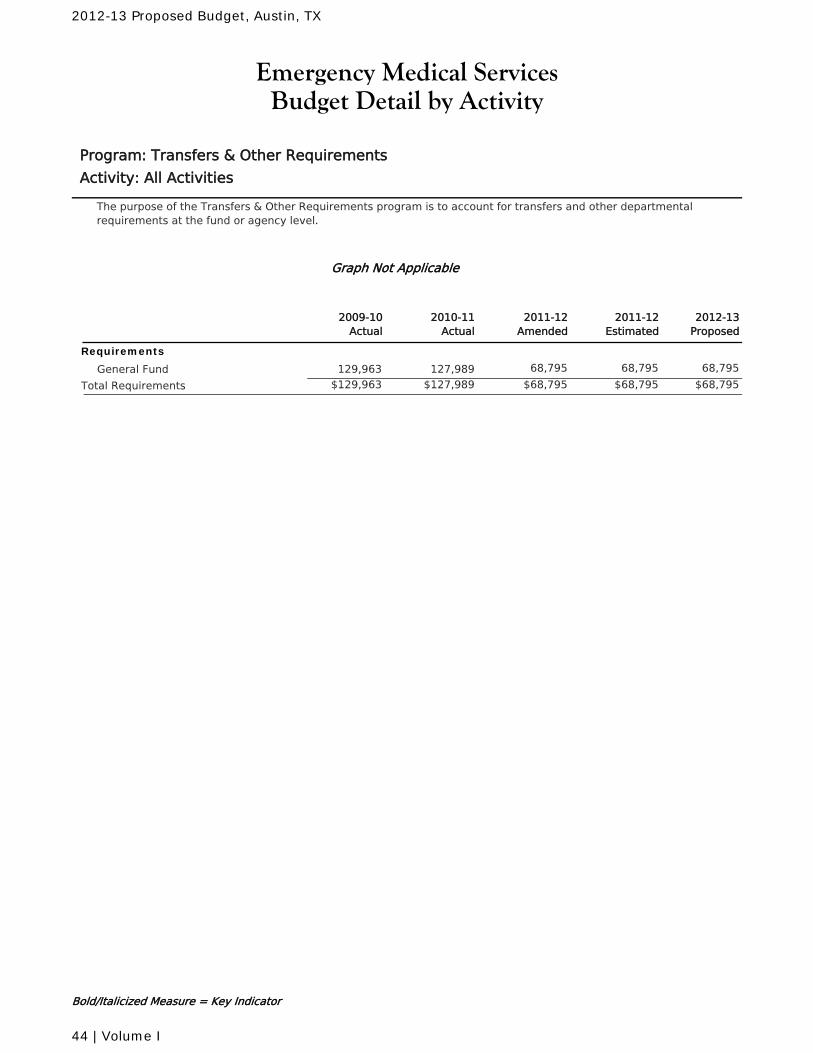
Emergency Medical ServicesBudget Detail by Activity
Program: Transfers & Other Requirements
Activity: All Activities
The purpose of the Transfers & Other Requirements program is to account for transfers and other departmentalrequirements at the fund or agency level.
Graph Not Applicable
2011-12Amended
2010-11Actual
2011-12Estimated
2012-13Proposed
2009-10Actual
Requirements
General Fund 68,795 68,795 68,795127,989129,963
$68,795 $68,795 $68,795Total Requirements $127,989$129,963
Bold/Italicized Measure = Key Indicator
2012-13 Proposed Budget, Austin, TX
44 | Volume I
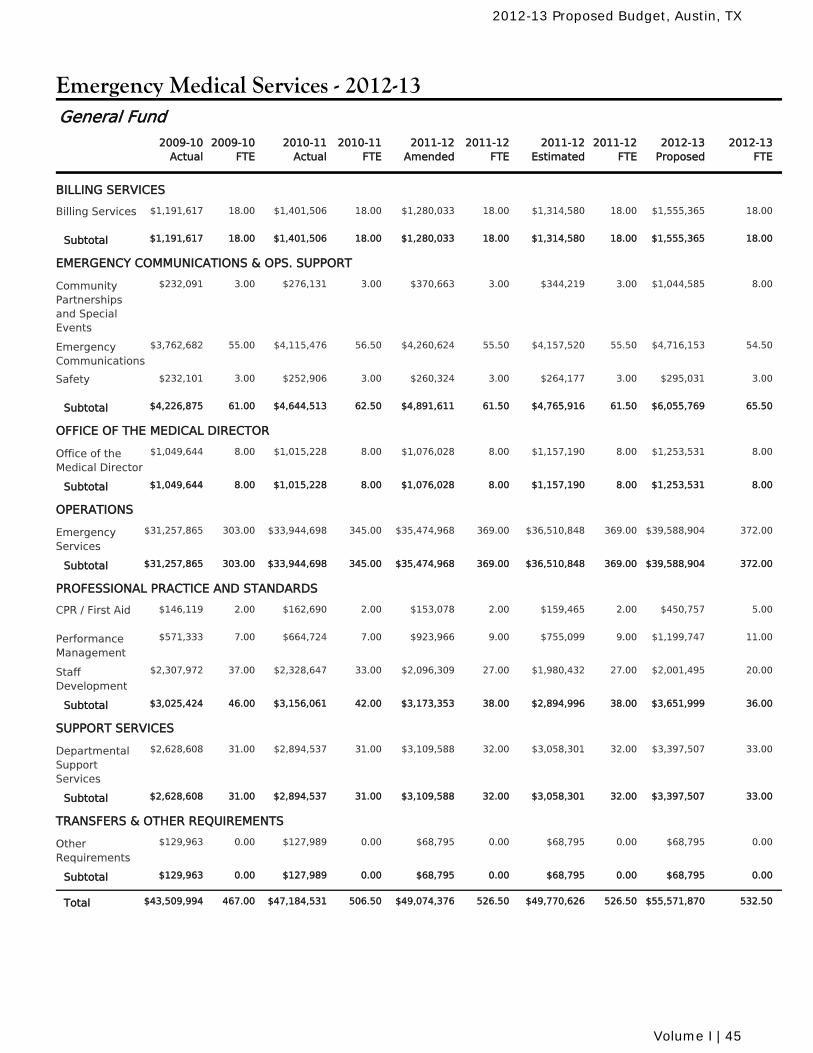
Emergency Medical Services - 2012-13
2010-11Actual
2010-11FTE
2011-12Amended
2011-12FTE
2011-12Estimated
2011-12FTE
2009-10Actual
2009-10FTE
2012-13Proposed
2012-13FTE
General Fund
BILLING SERVICES
$1,401,506 18.00 $1,280,033 18.00 $1,314,580 18.00Billing Services 18.00 $1,555,365 18.00$1,191,617
$1,401,506 18.00 $1,280,033 18.00 $1,314,580 18.00Subtotal 18.00 $1,555,365 18.00$1,191,617
EMERGENCY COMMUNICATIONS & OPS. SUPPORT
$276,131 3.00 $370,663 3.00 $344,219 3.00CommunityPartnershipsand SpecialEvents
3.00 $1,044,585 8.00$232,091
$4,115,476 56.50 $4,260,624 55.50 $4,157,520 55.50EmergencyCommunications
55.00 $4,716,153 54.50$3,762,682
$252,906 3.00 $260,324 3.00 $264,177 3.00Safety 3.00 $295,031 3.00$232,101
$4,644,513 62.50 $4,891,611 61.50 $4,765,916 61.50Subtotal 61.00 $6,055,769 65.50$4,226,875
OFFICE OF THE MEDICAL DIRECTOR
$1,015,228 8.00 $1,076,028 8.00 $1,157,190 8.00Office of theMedical Director
8.00 $1,253,531 8.00$1,049,644
$1,015,228 8.00 $1,076,028 8.00 $1,157,190 8.00Subtotal 8.00 $1,253,531 8.00$1,049,644
OPERATIONS
$33,944,698 345.00 $35,474,968 369.00 $36,510,848 369.00EmergencyServices
303.00 $39,588,904 372.00$31,257,865
$33,944,698 345.00 $35,474,968 369.00 $36,510,848 369.00Subtotal 303.00 $39,588,904 372.00$31,257,865
PROFESSIONAL PRACTICE AND STANDARDS
$162,690 2.00 $153,078 2.00 $159,465 2.00CPR / First Aid 2.00 $450,757 5.00$146,119
$664,724 7.00 $923,966 9.00 $755,099 9.00PerformanceManagement
7.00 $1,199,747 11.00$571,333
$2,328,647 33.00 $2,096,309 27.00 $1,980,432 27.00StaffDevelopment
37.00 $2,001,495 20.00$2,307,972
$3,156,061 42.00 $3,173,353 38.00 $2,894,996 38.00Subtotal 46.00 $3,651,999 36.00$3,025,424
SUPPORT SERVICES
$2,894,537 31.00 $3,109,588 32.00 $3,058,301 32.00DepartmentalSupportServices
31.00 $3,397,507 33.00$2,628,608
$2,894,537 31.00 $3,109,588 32.00 $3,058,301 32.00Subtotal 31.00 $3,397,507 33.00$2,628,608
TRANSFERS & OTHER REQUIREMENTS
$127,989 0.00 $68,795 0.00 $68,795 0.00OtherRequirements
0.00 $68,795 0.00$129,963
$127,989 0.00 $68,795 0.00 $68,795 0.00Subtotal 0.00 $68,795 0.00$129,963
$47,184,531 506.50 $49,074,376 526.50 $49,770,626 526.50Total 467.00 $55,571,870 532.50$43,509,994
2012-13 Proposed Budget, Austin, TX
Volume I | 45
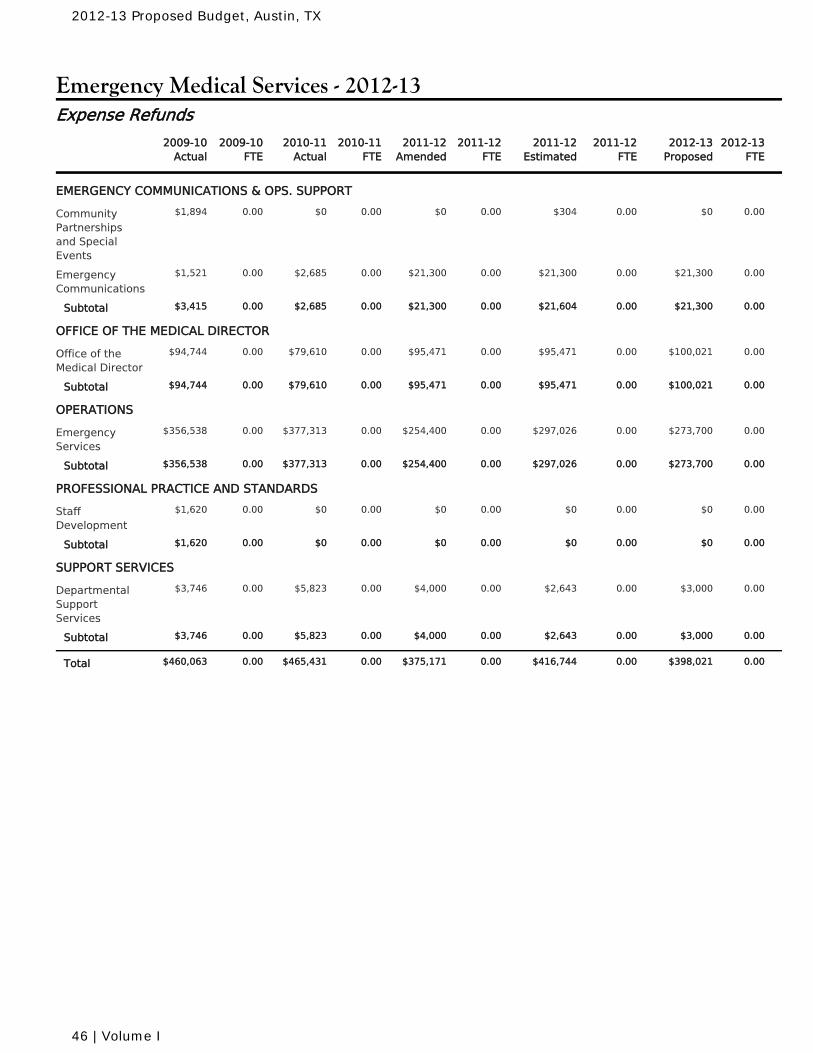
Emergency Medical Services - 2012-13
2010-11Actual
2010-11FTE
2011-12Amended
2011-12FTE
2011-12Estimated
2011-12FTE
2009-10Actual
2009-10FTE
2012-13Proposed
2012-13FTE
Expense Refunds
EMERGENCY COMMUNICATIONS & OPS. SUPPORT
$0 0.00 $0 0.00 $304 0.00CommunityPartnershipsand SpecialEvents
0.00 $0 0.00$1,894
$2,685 0.00 $21,300 0.00 $21,300 0.00EmergencyCommunications
0.00 $21,300 0.00$1,521
$2,685 0.00 $21,300 0.00 $21,604 0.00Subtotal 0.00 $21,300 0.00$3,415
OFFICE OF THE MEDICAL DIRECTOR
$79,610 0.00 $95,471 0.00 $95,471 0.00Office of theMedical Director
0.00 $100,021 0.00$94,744
$79,610 0.00 $95,471 0.00 $95,471 0.00Subtotal 0.00 $100,021 0.00$94,744
OPERATIONS
$377,313 0.00 $254,400 0.00 $297,026 0.00EmergencyServices
0.00 $273,700 0.00$356,538
$377,313 0.00 $254,400 0.00 $297,026 0.00Subtotal 0.00 $273,700 0.00$356,538
PROFESSIONAL PRACTICE AND STANDARDS
$0 0.00 $0 0.00 $0 0.00StaffDevelopment
0.00 $0 0.00$1,620
$0 0.00 $0 0.00 $0 0.00Subtotal 0.00 $0 0.00$1,620
SUPPORT SERVICES
$5,823 0.00 $4,000 0.00 $2,643 0.00DepartmentalSupportServices
0.00 $3,000 0.00$3,746
$5,823 0.00 $4,000 0.00 $2,643 0.00Subtotal 0.00 $3,000 0.00$3,746
$465,431 0.00 $375,171 0.00 $416,744 0.00Total 0.00 $398,021 0.00$460,063
2012-13 Proposed Budget, Austin, TX
46 | Volume I
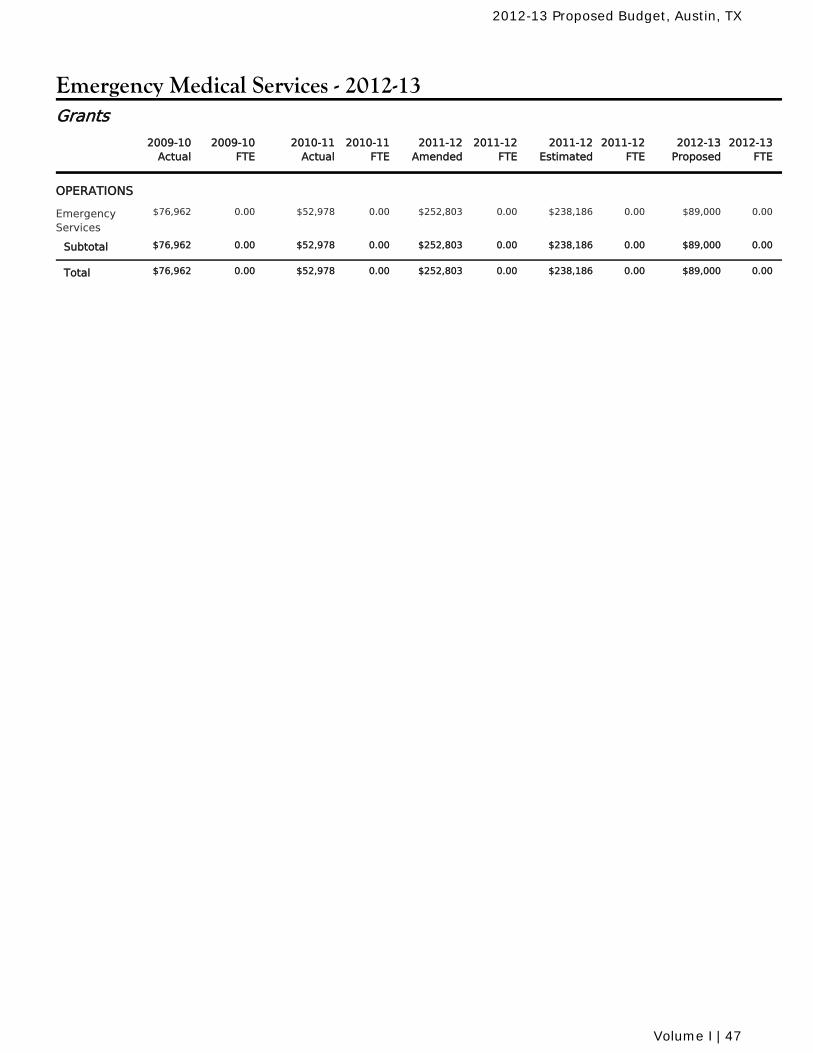
Emergency Medical Services - 2012-13
2010-11Actual
2010-11FTE
2011-12Amended
2011-12FTE
2011-12Estimated
2011-12FTE
2009-10Actual
2009-10FTE
2012-13Proposed
2012-13FTE
Grants
OPERATIONS
$52,978 0.00 $252,803 0.00 $238,186 0.00EmergencyServices
0.00 $89,000 0.00$76,962
$52,978 0.00 $252,803 0.00 $238,186 0.00Subtotal 0.00 $89,000 0.00$76,962
$52,978 0.00 $252,803 0.00 $238,186 0.00Total 0.00 $89,000 0.00$76,962
2012-13 Proposed Budget, Austin, TX
Volume I | 47

2012-13 Proposed Budget, Austin, TX
48 | Volume I
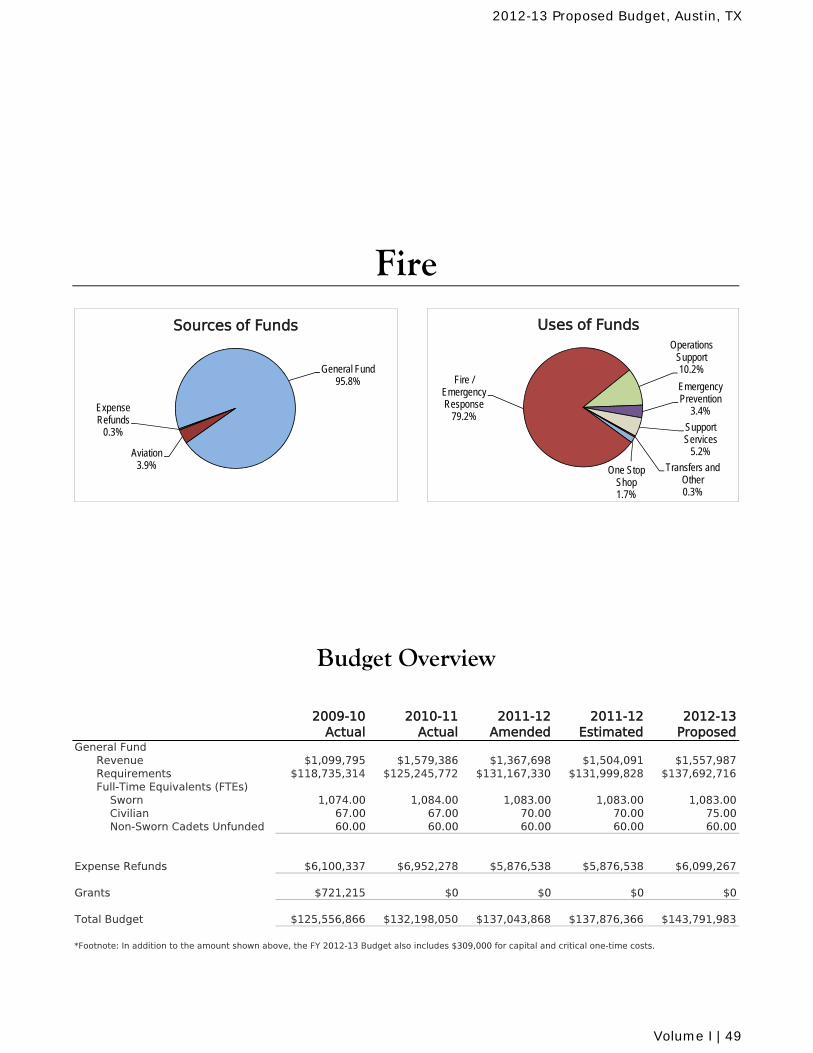
2009-10 Actual
2010-11 Actual
2011-12 Amended
2011-12 Estimated
2012-13 Proposed
General FundRevenue $1,099,795 $1,579,386 $1,367,698 $1,504,091 $1,557,987Requirements $118,735,314 $125,245,772 $131,167,330 $131,999,828 $137,692,716Full-Time Equivalents (FTEs) Sworn 1,074.00 1,084.00 1,083.00 1,083.00 1,083.00 Civilian 67.00 67.00 70.00 70.00 75.00 Non-Sworn Cadets Unfunded 60.00 60.00 60.00 60.00 60.00
Expense Refunds $6,100,337 $6,952,278 $5,876,538 $5,876,538 $6,099,267
Grants $721,215 $0 $0 $0 $0
Total Budget $125,556,866 $132,198,050 $137,043,868 $137,876,366 $143,791,983
*Footnote: In addition to the amount shown above, the FY 2012-13 Budget also includes $309,000 for capital and critical one-time costs.
Budget Overview
Fire
General Fund95.8%
Aviation3.9%
Expense Refunds
0.3%
Sources of Funds
One Stop Shop1.7%
Fire / Emergency Response
79.2%
Operations Support10.2%
Emergency Prevention
3.4%
Support Services
5.2%
Transfers and Other0.3%
Uses of Funds
2012-13 Proposed Budget, Austin, TX
Volume I | 49
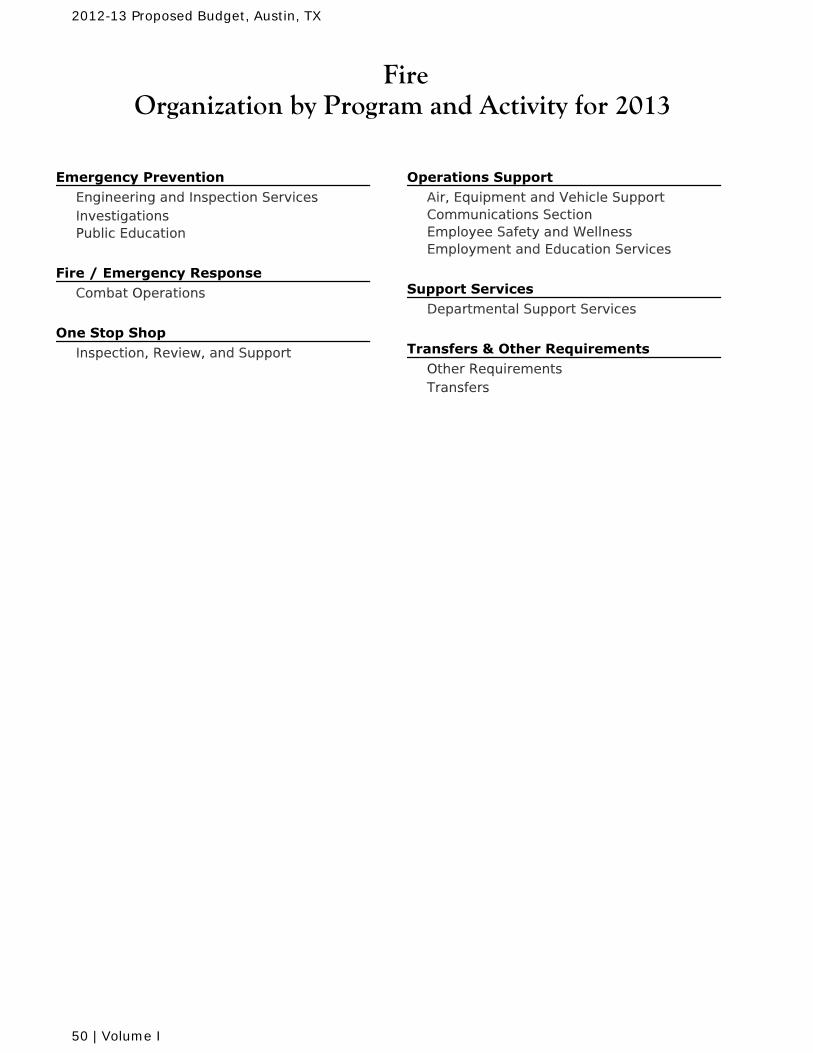
FireOrganization by Program and Activity for 2013
Emergency Prevention Engineering and Inspection ServicesInvestigationsPublic Education
Fire / Emergency Response Combat Operations
One Stop Shop Inspection, Review, and Support
Operations Support Air, Equipment and Vehicle SupportCommunications SectionEmployee Safety and WellnessEmployment and Education Services
Support Services Departmental Support Services
Transfers & Other Requirements Other RequirementsTransfers
2012-13 Proposed Budget, Austin, TX
50 | Volume I
FireMission and Goals for 2013
Mission
The central mission of the Austin Fire Department is the preservation of life and property.
Goals
Deliver comprehensive safety and medical first responder services of the highest quality.
Maintain rapid overall response, with arrival of first unit on scene within 8 minutes of callreceipt by AFD or EMS dispatch center for at least 85% of emergency incidents.Prevent death from cardiac arrest by obtaining a return of spontaneous circulation afterapplication of CPR and/or automated external defibrillators for at least 42% of patients.
Support and maintain a safe, healthy, well-trained and high performing workforce.
Minimize time lost from work by maintaining a lost time injury rate less than 5.2.
Prevent fire deaths and property loss through fire prevention, public education, and emergencyresponse.
Reduce fire deaths to zero.Ensure at least 82% of structure fires are confined to room of origin.
Recruit, hire, and train the best qualified and most skilled workforce, one that is representative ofthe community we serve.
Increase the diversity of incoming cadet classes.Maintain at least 95% of Combat Operations positions fully staffed.
Hold ourselves accountable to the community for demonstrable results.
Achieve at least 90% satisfaction levels among City survey respondents reporting contact withAFD in the past year.
2012-13 Proposed Budget, Austin, TX
Volume I | 51
MessagThe Austipreventiodepartmename.” Wand comp Firefighte“Firefight
We are pindicate tlives of caafter CPR We have sworn peFirefighte In Septemconsumedmention tragic eveposed bypartnersheducationTexas arehow to pand outliaddition, to have a The Austtoward ou Respectfu
Rhoda Ma
ge from then Fire Depart
on, preparednent’s central We are commpassionately a
er Coitt Kesser of the Yea
pleased that they are satisardiac patienand/or the a
45 fire statirsonnel. Sinc
ers and 45 cad
mber 2011, d nearly 7,00the extensivents of Septe wildfire. The
hip of agencin campaign ea. The progrrotect themsnes steps fothe Austin Fill firefighters
in Fire Depaur goal of bec
ully submitted
ae Kerr, Fire C
Au
e Directortment is comness, and effmission, we
mitted to servas possible.
sler is an exar” by the Ve
89 percent sfied with thts is demonspplication of
ons placed ace January 20dets to our ra
Travis Coun00 acres andve damage ember remine Wildland Tes that custocalled “Read
ram tasks hoselves and thor a safe evire Departme certified in m
rtment apprcoming the be
d,
Chief
ustin Fir
r mmitted to cre
ective emergalso say thaving our com
xample of outerans of For
of the residee overall qua
strated by 45an Automate
around the c012, we haveanks.
nty saw six d destroyed done in Bas
nd us all of tTaskforce in Tomized a nady, Set, Go!meowners wheir propertyacuation if o
ent will be thmanaging wil
eciates the sest fire depar
re Depa
eating safer cgency respont, “Our missi
mmunity as ef
ur commitmreign Wars (V
now in conwas honorthe Emergand for sfirefightersDay to raisexample ofseen in Departmenthe Public for our “adthe daily sthose who
ents respondality of fire s percent exped External D
ity, and we ce started two
major fires57 homes, n
strop Countyhe ongoing tTravis Counttional 2012 ” for the Cith action ste
y during a wione is orderee first in the dfires.
support we rtment in the
artment
communities nse. While thion goes beyfficiently, effe
ent to the cVFW) at both ntention for thred for his wency Service
starting the s shave their se money fof our ability tthe award
nt computer Technology
dded time sigelection of oare on leave
ding to the Cervices. Furt
periencing spoDefibrillator (A
currently havo academy cl
s that not to y. The threat ty is a public
Central eps on ildfire, ed. In State
receive frome country.
t
through is is the
yond our ectively,
community. the local and
he VFW’s natwork as a foues Pipe and
St. Baldricheads in hon
or children fito work more
presented programmer
Institute. Chagn-up” systemff-duty Firefig.
City’s 2011 cther, our succontaneous reAED).
ve 1,083 unilasses, addin
m Austin citiz
Coitt was nd state level;tional award.
unding membDrum Associ
ck’s event wnor of St. Patghting cance
e efficiently cto Austin
r Chas Randas was recogm that streamghters to fill
community scess in savineturn of circu
form and 75ng 39 probati
zens. We con
amed he is . Coitt ber of ation, where trick’s er. An an be
Fire dal by gnized mlines in for
urvey ng the lation
5 non-onary
ntinue
2012-13 Proposed Budget, Austin, TX
52 | Volume I
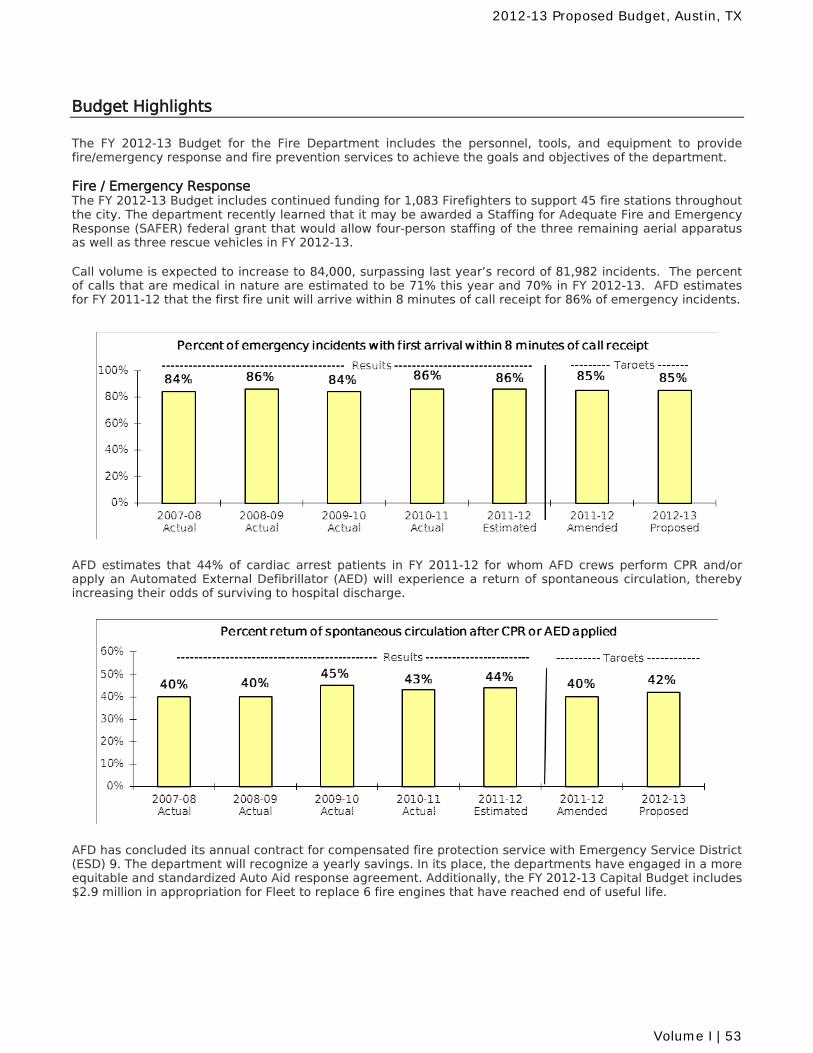
Budget Highlights
The FY 2012-13 Budget for the Fire Department includes the personnel, tools, and equipment to provide fire/emergency response and fire prevention services to achieve the goals and objectives of the department. Fire / Emergency Response The FY 2012-13 Budget includes continued funding for 1,083 Firefighters to support 45 fire stations throughout the city. The department recently learned that it may be awarded a Staffing for Adequate Fire and Emergency Response (SAFER) federal grant that would allow four-person staffing of the three remaining aerial apparatus as well as three rescue vehicles in FY 2012-13. Call volume is expected to increase to 84,000, surpassing last year’s record of 81,982 incidents. The percent of calls that are medical in nature are estimated to be 71% this year and 70% in FY 2012-13. AFD estimates for FY 2011-12 that the first fire unit will arrive within 8 minutes of call receipt for 86% of emergency incidents.
AFD estimates that 44% of cardiac arrest patients in FY 2011-12 for whom AFD crews perform CPR and/or apply an Automated External Defibrillator (AED) will experience a return of spontaneous circulation, thereby increasing their odds of surviving to hospital discharge.
AFD has concluded its annual contract for compensated fire protection service with Emergency Service District (ESD) 9. The department will recognize a yearly savings. In its place, the departments have engaged in a more equitable and standardized Auto Aid response agreement. Additionally, the FY 2012-13 Capital Budget includes $2.9 million in appropriation for Fleet to replace 6 fire engines that have reached end of useful life.
2012-13 Proposed Budget, Austin, TX
Volume I | 53
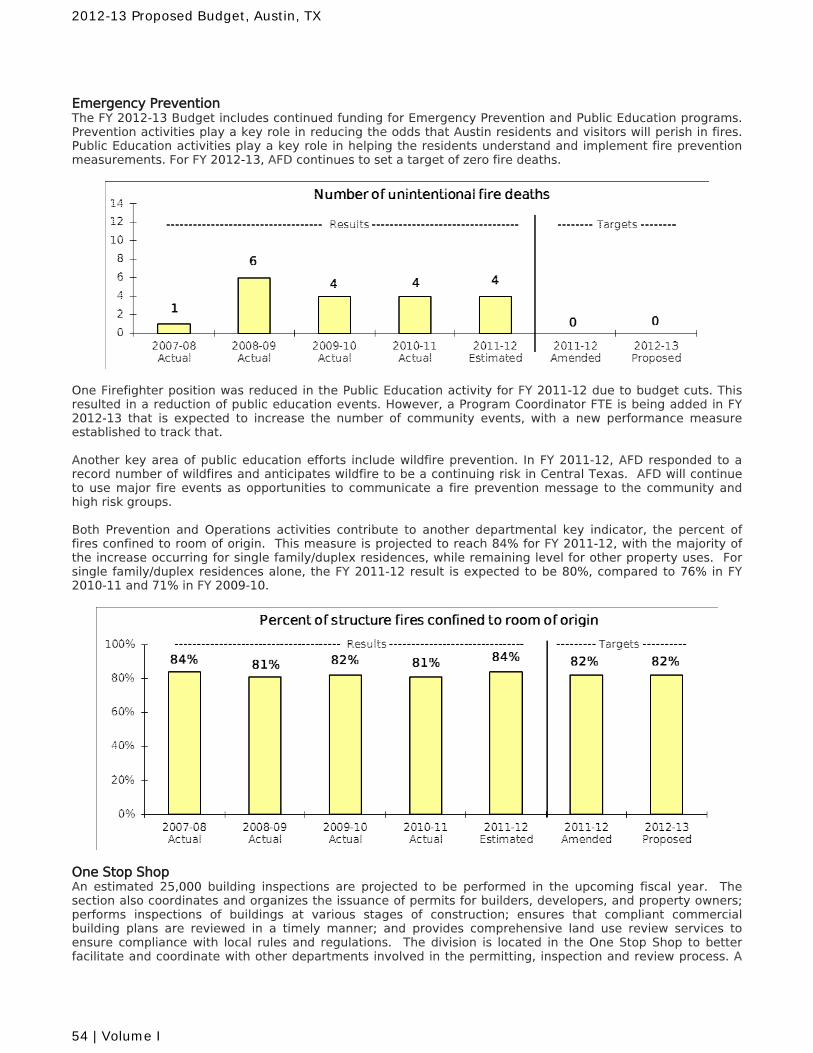
Emergency Prevention The FY 2012-13 Budget includes continued funding for Emergency Prevention and Public Education programs. Prevention activities play a key role in reducing the odds that Austin residents and visitors will perish in fires. Public Education activities play a key role in helping the residents understand and implement fire prevention measurements. For FY 2012-13, AFD continues to set a target of zero fire deaths.
One Firefighter position was reduced in the Public Education activity for FY 2011-12 due to budget cuts. This resulted in a reduction of public education events. However, a Program Coordinator FTE is being added in FY 2012-13 that is expected to increase the number of community events, with a new performance measure established to track that. Another key area of public education efforts include wildfire prevention. In FY 2011-12, AFD responded to a record number of wildfires and anticipates wildfire to be a continuing risk in Central Texas. AFD will continue to use major fire events as opportunities to communicate a fire prevention message to the community and high risk groups. Both Prevention and Operations activities contribute to another departmental key indicator, the percent of fires confined to room of origin. This measure is projected to reach 84% for FY 2011-12, with the majority of the increase occurring for single family/duplex residences, while remaining level for other property uses. For single family/duplex residences alone, the FY 2011-12 result is expected to be 80%, compared to 76% in FY 2010-11 and 71% in FY 2009-10.
One Stop Shop An estimated 25,000 building inspections are projected to be performed in the upcoming fiscal year. The section also coordinates and organizes the issuance of permits for builders, developers, and property owners; performs inspections of buildings at various stages of construction; ensures that compliant commercial building plans are reviewed in a timely manner; and provides comprehensive land use review services to ensure compliance with local rules and regulations. The division is located in the One Stop Shop to better facilitate and coordinate with other departments involved in the permitting, inspection and review process. A
2012-13 Proposed Budget, Austin, TX
54 | Volume I
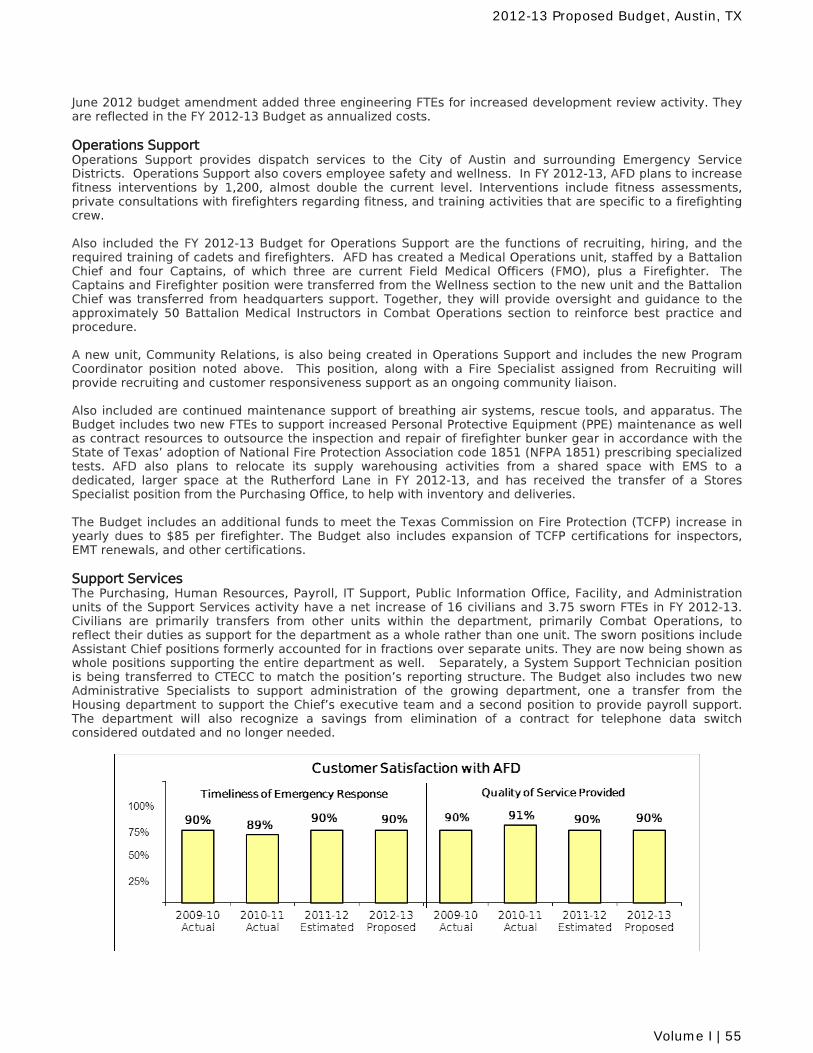
June 2012 budget amendment added three engineering FTEs for increased development review activity. They are reflected in the FY 2012-13 Budget as annualized costs. Operations Support Operations Support provides dispatch services to the City of Austin and surrounding Emergency Service Districts. Operations Support also covers employee safety and wellness. In FY 2012-13, AFD plans to increase fitness interventions by 1,200, almost double the current level. Interventions include fitness assessments, private consultations with firefighters regarding fitness, and training activities that are specific to a firefighting crew. Also included the FY 2012-13 Budget for Operations Support are the functions of recruiting, hiring, and the required training of cadets and firefighters. AFD has created a Medical Operations unit, staffed by a Battalion Chief and four Captains, of which three are current Field Medical Officers (FMO), plus a Firefighter. The Captains and Firefighter position were transferred from the Wellness section to the new unit and the Battalion Chief was transferred from headquarters support. Together, they will provide oversight and guidance to the approximately 50 Battalion Medical Instructors in Combat Operations section to reinforce best practice and procedure. A new unit, Community Relations, is also being created in Operations Support and includes the new Program Coordinator position noted above. This position, along with a Fire Specialist assigned from Recruiting will provide recruiting and customer responsiveness support as an ongoing community liaison. Also included are continued maintenance support of breathing air systems, rescue tools, and apparatus. The Budget includes two new FTEs to support increased Personal Protective Equipment (PPE) maintenance as well as contract resources to outsource the inspection and repair of firefighter bunker gear in accordance with the State of Texas’ adoption of National Fire Protection Association code 1851 (NFPA 1851) prescribing specialized tests. AFD also plans to relocate its supply warehousing activities from a shared space with EMS to a dedicated, larger space at the Rutherford Lane in FY 2012-13, and has received the transfer of a Stores Specialist position from the Purchasing Office, to help with inventory and deliveries. The Budget includes an additional funds to meet the Texas Commission on Fire Protection (TCFP) increase in yearly dues to $85 per firefighter. The Budget also includes expansion of TCFP certifications for inspectors, EMT renewals, and other certifications. Support Services The Purchasing, Human Resources, Payroll, IT Support, Public Information Office, Facility, and Administration units of the Support Services activity have a net increase of 16 civilians and 3.75 sworn FTEs in FY 2012-13. Civilians are primarily transfers from other units within the department, primarily Combat Operations, to reflect their duties as support for the department as a whole rather than one unit. The sworn positions include Assistant Chief positions formerly accounted for in fractions over separate units. They are now being shown as whole positions supporting the entire department as well. Separately, a System Support Technician position is being transferred to CTECC to match the position’s reporting structure. The Budget also includes two new Administrative Specialists to support administration of the growing department, one a transfer from the Housing department to support the Chief’s executive team and a second position to provide payroll support. The department will also recognize a savings from elimination of a contract for telephone data switch considered outdated and no longer needed.
2012-13 Proposed Budget, Austin, TX
Volume I | 55
Customer Satisfaction Customer satisfaction is a fundamental measure of AFD’s performance and an outcome dependent on the contribution from all sections in the department. In the most recent survey, 89% of AFD customers expressed satisfaction with timeliness of emergency response and 91% expressed satisfaction with the quality of services. AFD remains strongly committed to a high level of service. Revenue For the FY 2012-13 Budget, the department is forecasting a net revenue increase over the FY 2011-12 budgeted amount. Fee revenues are projected to increase 3 to 4 percent, partly from increases in fees commensurate with increased firefighter salary costs for providing the inspection services, and partly from increased development trends. The department also collects revenue from a service coverage agreement between the City of Austin and the City of Sunset Valley for fire service coverage. The amount, which is calculated based on property value confirmed later in the budget process, may vary from a budgeted amount, which is projected to remain flat. Historically, the revenue has been between $400,000 and $500,000. Employee Salary and Benefits The FY 2012-13 Budget includes a 3% base wage increase, an additional 1% retirement contribution increase, plus step increase for all sworn positions in the amount of $4.1 million per the City Council approved contract. The Budget also includes a 3% wage adjustment for non–sworn positions and a market rate adjustment. The Budget also includes an insurance contribution increase for all positions. Non-sworn positions are also receiving a reallocation for contributions to the pension system of $0.4 Million. This contribution was previously shown at the General Fund budget level. Additional Budget Due to an unusually high number of persistent vacancies in sworn positions, a $0.5 million increase in the overtime budget is required for the FY 2012-13 Budget. An additional $150,000 is also needed in backfill costs to cover an extended two weeks of cadet training per class. The Austin Fire Department has scheduled two cadet classes to be begin in FY 2012-13 with one class of 40 Fire Cadets scheduled to graduate late in the fiscal year.
2012-13 Proposed Budget, Austin, TX
56 | Volume I
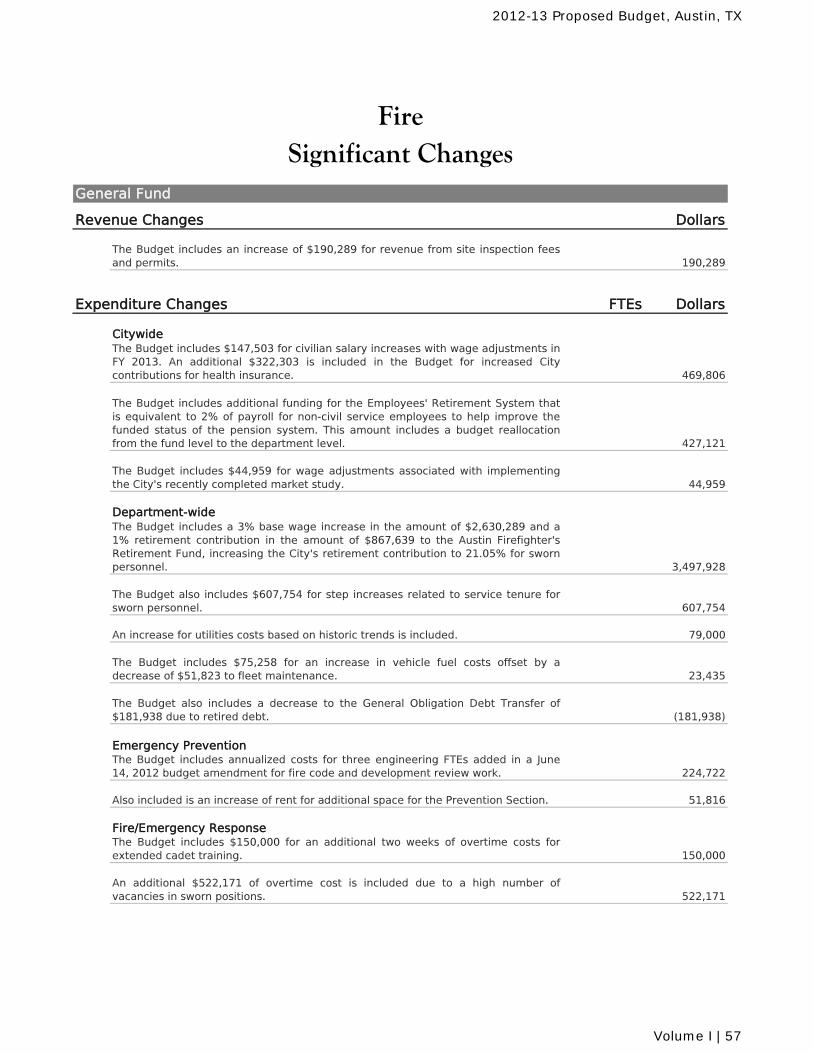
Revenue Changes Dollars
The Budget includes an increase of $190,289 for revenue from site inspection feesand permits. 190,289
Expenditure Changes FTEs Dollars
CitywideThe Budget includes $147,503 for civilian salary increases with wage adjustments inFY 2013. An additional $322,303 is included in the Budget for increased Citycontributions for health insurance. 469,806
The Budget includes additional funding for the Employees' Retirement System thatis equivalent to 2% of payroll for non-civil service employees to help improve thefunded status of the pension system. This amount includes a budget reallocationfrom the fund level to the department level. 427,121
The Budget includes $44,959 for wage adjustments associated with implementingthe City's recently completed market study. 44,959 Department-wideThe Budget includes a 3% base wage increase in the amount of $2,630,289 and a1% retirement contribution in the amount of $867,639 to the Austin Firefighter'sRetirement Fund, increasing the City's retirement contribution to 21.05% for swornpersonnel. 3,497,928
The Budget also includes $607,754 for step increases related to service tenure forsworn personnel. 607,754
An increase for utilities costs based on historic trends is included. 79,000
The Budget includes $75,258 for an increase in vehicle fuel costs offset by adecrease of $51,823 to fleet maintenance. 23,435
The Budget also includes a decrease to the General Obligation Debt Transfer of$181,938 due to retired debt. (181,938)
Emergency Prevention The Budget includes annualized costs for three engineering FTEs added in a June14, 2012 budget amendment for fire code and development review work. 224,722
Also included is an increase of rent for additional space for the Prevention Section. 51,816
Fire/Emergency ResponseThe Budget includes $150,000 for an additional two weeks of overtime costs forextended cadet training. 150,000
An additional $522,171 of overtime cost is included due to a high number ofvacancies in sworn positions. 522,171
Significant ChangesFire
General Fund
2012-13 Proposed Budget, Austin, TX
Volume I | 57
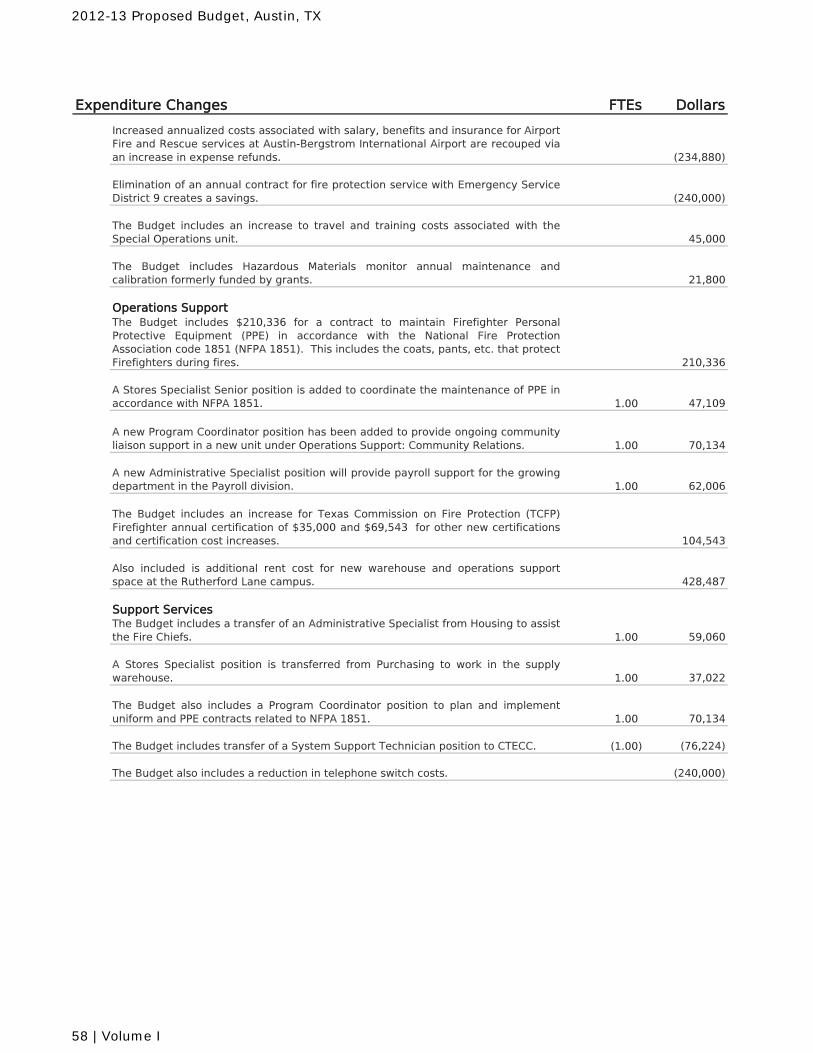
Expenditure Changes FTEs Dollars
Increased annualized costs associated with salary, benefits and insurance for AirportFire and Rescue services at Austin-Bergstrom International Airport are recouped viaan increase in expense refunds. (234,880)
Elimination of an annual contract for fire protection service with Emergency ServiceDistrict 9 creates a savings. (240,000)
The Budget includes an increase to travel and training costs associated with theSpecial Operations unit. 45,000
The Budget includes Hazardous Materials monitor annual maintenance andcalibration formerly funded by grants. 21,800
Operations SupportThe Budget includes $210,336 for a contract to maintain Firefighter PersonalProtective Equipment (PPE) in accordance with the National Fire ProtectionAssociation code 1851 (NFPA 1851). This includes the coats, pants, etc. that protectFirefighters during fires. 210,336
A Stores Specialist Senior position is added to coordinate the maintenance of PPE inaccordance with NFPA 1851. 1.00 47,109
A new Program Coordinator position has been added to provide ongoing communityliaison support in a new unit under Operations Support: Community Relations. 1.00 70,134
A new Administrative Specialist position will provide payroll support for the growingdepartment in the Payroll division. 1.00 62,006
The Budget includes an increase for Texas Commission on Fire Protection (TCFP)Firefighter annual certification of $35,000 and $69,543 for other new certificationsand certification cost increases. 104,543
Also included is additional rent cost for new warehouse and operations supportspace at the Rutherford Lane campus. 428,487
Support ServicesThe Budget includes a transfer of an Administrative Specialist from Housing to assistthe Fire Chiefs. 1.00 59,060
A Stores Specialist position is transferred from Purchasing to work in the supplywarehouse. 1.00 37,022
The Budget also includes a Program Coordinator position to plan and implementuniform and PPE contracts related to NFPA 1851. 1.00 70,134
The Budget includes transfer of a System Support Technician position to CTECC. (1.00) (76,224)
The Budget also includes a reduction in telephone switch costs. (240,000)
2012-13 Proposed Budget, Austin, TX
58 | Volume I
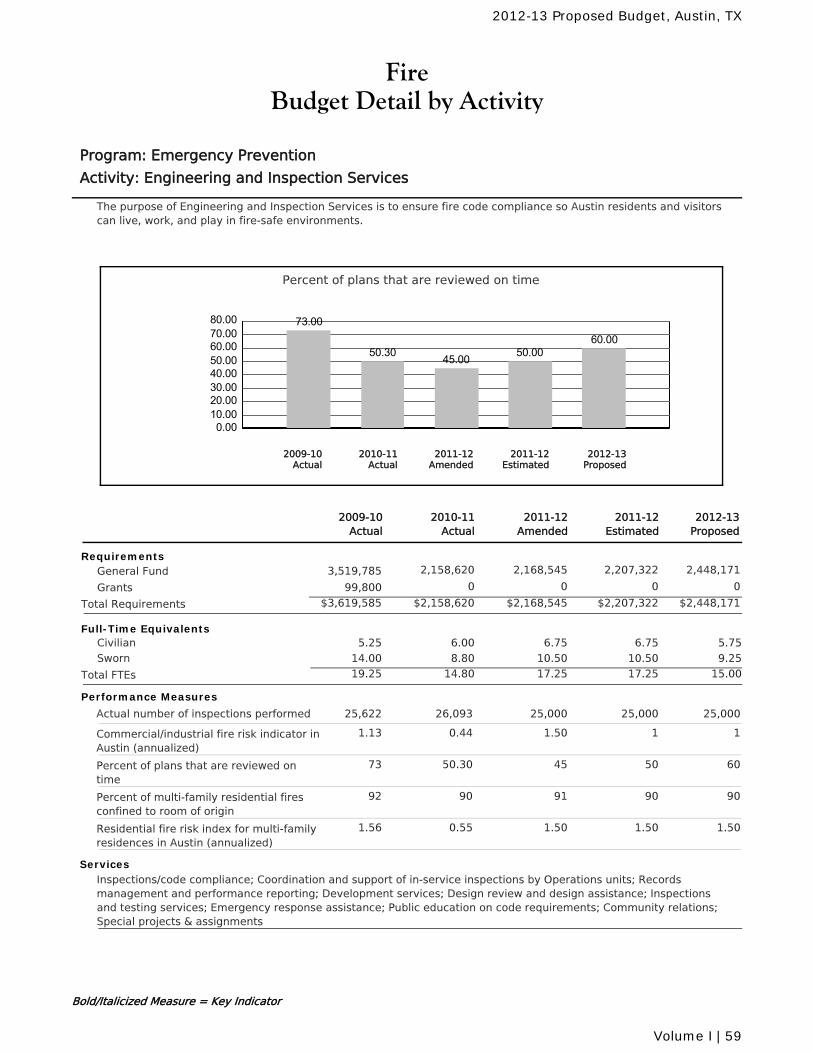
FireBudget Detail by Activity
Program: Emergency Prevention
Activity: Engineering and Inspection Services
The purpose of Engineering and Inspection Services is to ensure fire code compliance so Austin residents and visitorscan live, work, and play in fire-safe environments.
Percent of plans that are reviewed on time
0.0010.0020.0030.0040.0050.0060.0070.0080.00 73.00
50.30 45.00 50.0060.00
2010-11Actual
2012-13Proposed
2011-12Amended
2011-12Estimated
2009-10Actual
2011-12Amended
2010-11Actual
2011-12Estimated
2012-13Proposed
2009-10Actual
RequirementsGeneral Fund 2,158,620 2,168,545 2,207,322 2,448,1713,519,785
Grants 0 0 0 099,800
Total Requirements $2,158,620 $2,207,322 $2,448,171$2,168,545$3,619,585
Full-Time Equivalents6.00 6.75 6.75 5.75Civilian 5.25
8.80 10.50 10.50 9.25Sworn 14.00
Total FTEs 14.80 17.25 15.0017.2519.25
Performance Measures
Actual number of inspections performed 25,00026,093 25,000 25,00025,622
Commercial/industrial fire risk indicator inAustin (annualized)
1.500.44 1 11.13
Percent of plans that are reviewed ontime
4550.30 50 6073
Percent of multi-family residential firesconfined to room of origin
9190 90 9092
Residential fire risk index for multi-familyresidences in Austin (annualized)
1.500.55 1.50 1.501.56
ServicesInspections/code compliance; Coordination and support of in-service inspections by Operations units; Recordsmanagement and performance reporting; Development services; Design review and design assistance; Inspectionsand testing services; Emergency response assistance; Public education on code requirements; Community relations;Special projects & assignments
Bold/Italicized Measure = Key Indicator
2012-13 Proposed Budget, Austin, TX
Volume I | 59
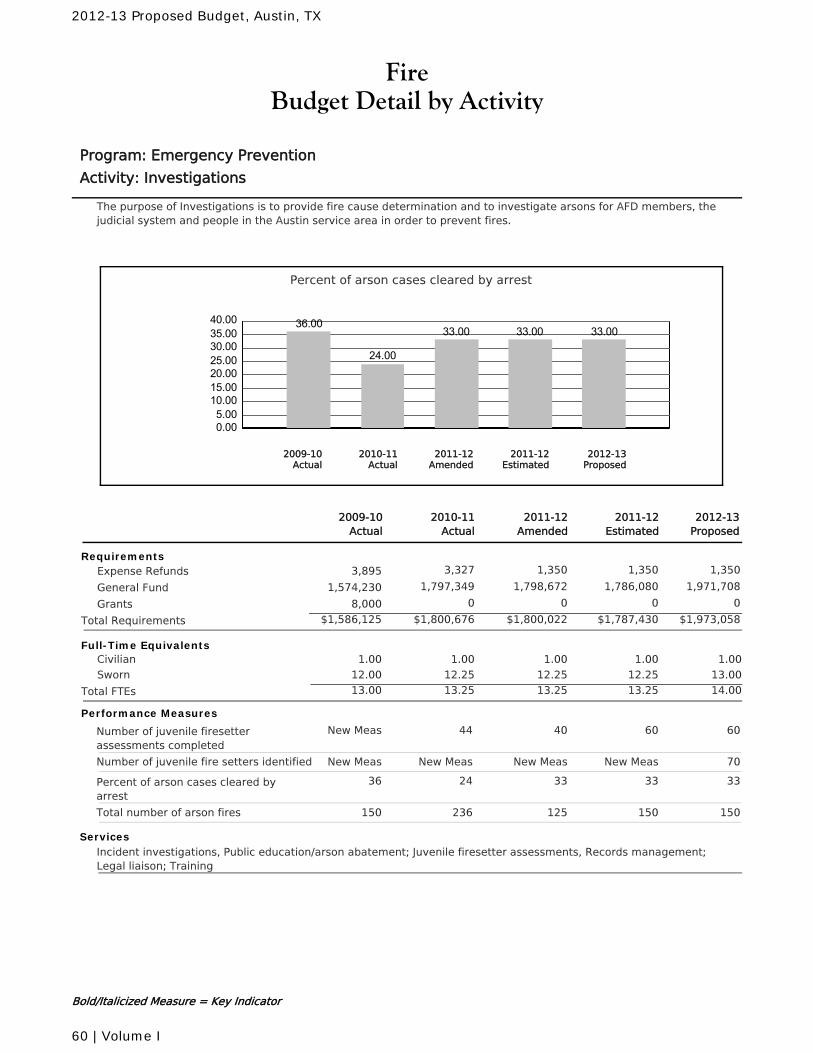
FireBudget Detail by Activity
Program: Emergency Prevention
Activity: Investigations
The purpose of Investigations is to provide fire cause determination and to investigate arsons for AFD members, thejudicial system and people in the Austin service area in order to prevent fires.
Percent of arson cases cleared by arrest
0.005.0010.0015.0020.0025.0030.0035.0040.00 36.00
24.00
33.00 33.00 33.00
2010-11Actual
2012-13Proposed
2011-12Amended
2011-12Estimated
2009-10Actual
2011-12Amended
2010-11Actual
2011-12Estimated
2012-13Proposed
2009-10Actual
RequirementsExpense Refunds 3,327 1,350 1,350 1,3503,895
General Fund 1,797,349 1,798,672 1,786,080 1,971,7081,574,230
Grants 0 0 0 08,000
Total Requirements $1,800,676 $1,787,430 $1,973,058$1,800,022$1,586,125
Full-Time Equivalents1.00 1.00 1.00 1.00Civilian 1.00
12.25 12.25 12.25 13.00Sworn 12.00
Total FTEs 13.25 13.25 14.0013.2513.00
Performance Measures
Number of juvenile firesetterassessments completed
4044 60 60New Meas
Number of juvenile fire setters identified New MeasNew Meas New Meas 70New Meas
Percent of arson cases cleared byarrest
3324 33 3336
Total number of arson fires 125236 150 150150
ServicesIncident investigations, Public education/arson abatement; Juvenile firesetter assessments, Records management;Legal liaison; Training
Bold/Italicized Measure = Key Indicator
2012-13 Proposed Budget, Austin, TX
60 | Volume I
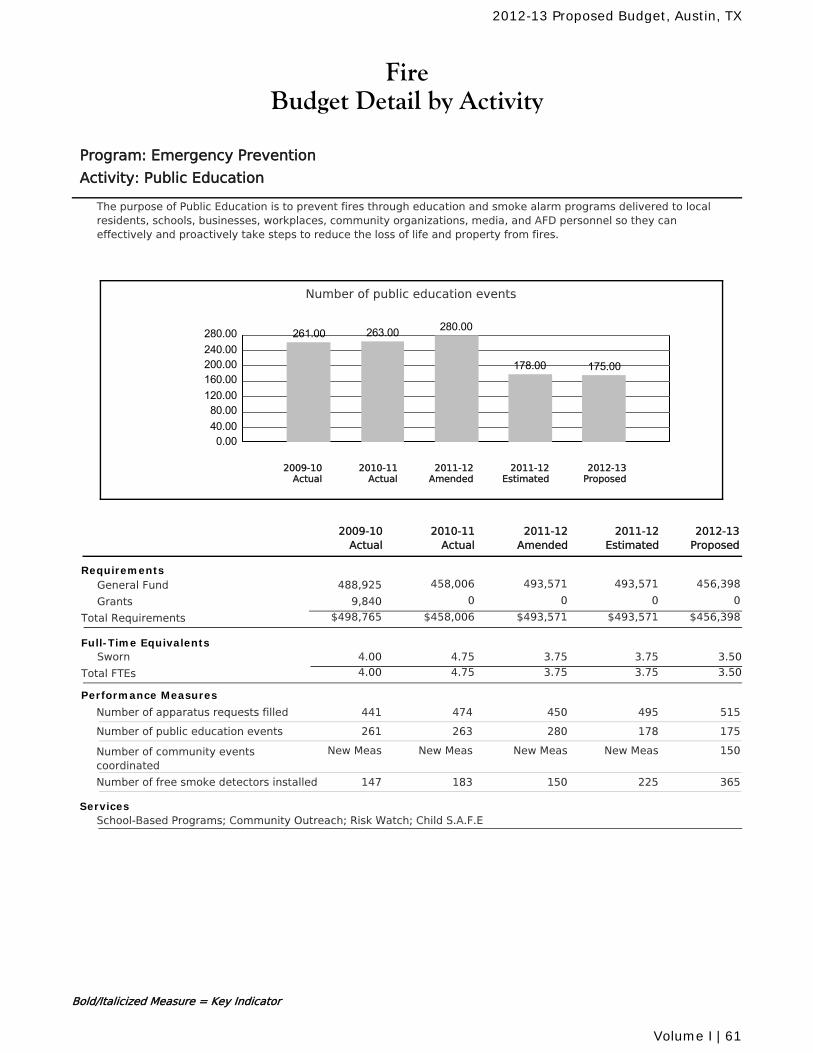
FireBudget Detail by Activity
Program: Emergency Prevention
Activity: Public Education
The purpose of Public Education is to prevent fires through education and smoke alarm programs delivered to localresidents, schools, businesses, workplaces, community organizations, media, and AFD personnel so they caneffectively and proactively take steps to reduce the loss of life and property from fires.
Number of public education events
0.0040.0080.00120.00160.00200.00240.00280.00 261.00 263.00 280.00
178.00 175.00
2010-11Actual
2012-13Proposed
2011-12Amended
2011-12Estimated
2009-10Actual
2011-12Amended
2010-11Actual
2011-12Estimated
2012-13Proposed
2009-10Actual
RequirementsGeneral Fund 458,006 493,571 493,571 456,398488,925
Grants 0 0 0 09,840
Total Requirements $458,006 $493,571 $456,398$493,571$498,765
Full-Time Equivalents4.75 3.75 3.75 3.50Sworn 4.00
Total FTEs 4.75 3.75 3.503.754.00
Performance Measures
Number of apparatus requests filled 450474 495 515441
Number of public education events 280263 178 175261
Number of community eventscoordinated
New MeasNew Meas New Meas 150New Meas
Number of free smoke detectors installed 150183 225 365147
ServicesSchool-Based Programs; Community Outreach; Risk Watch; Child S.A.F.E
Bold/Italicized Measure = Key Indicator
2012-13 Proposed Budget, Austin, TX
Volume I | 61
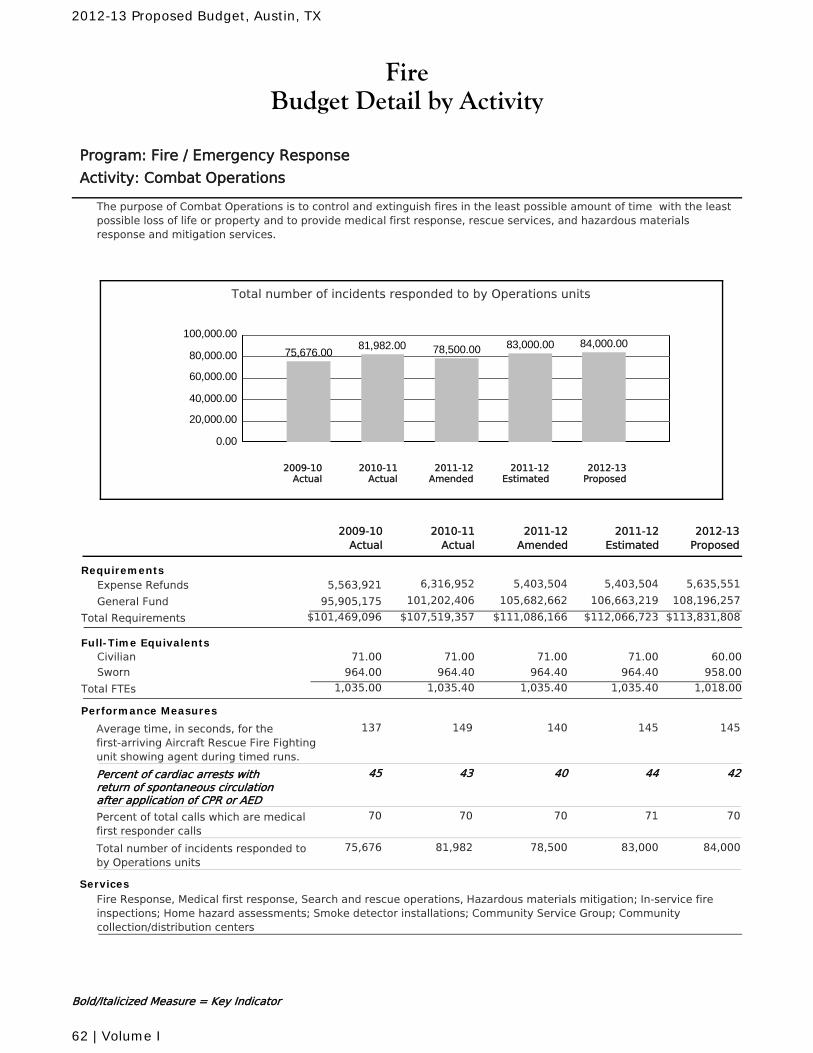
FireBudget Detail by Activity
Program: Fire / Emergency Response
Activity: Combat Operations
The purpose of Combat Operations is to control and extinguish fires in the least possible amount of time with the leastpossible loss of life or property and to provide medical first response, rescue services, and hazardous materialsresponse and mitigation services.
Total number of incidents responded to by Operations units
0.00
20,000.00
40,000.00
60,000.00
80,000.00
100,000.00
75,676.0081,982.00 78,500.00 83,000.00 84,000.00
2010-11Actual
2012-13Proposed
2011-12Amended
2011-12Estimated
2009-10Actual
2011-12Amended
2010-11Actual
2011-12Estimated
2012-13Proposed
2009-10Actual
RequirementsExpense Refunds 6,316,952 5,403,504 5,403,504 5,635,5515,563,921
General Fund 101,202,406 105,682,662 106,663,219 108,196,25795,905,175
Total Requirements $107,519,357 $112,066,723 $113,831,808$111,086,166$101,469,096
Full-Time Equivalents71.00 71.00 71.00 60.00Civilian 71.00
964.40 964.40 964.40 958.00Sworn 964.00
Total FTEs 1,035.40 1,035.40 1,018.001,035.401,035.00
Performance Measures
Average time, in seconds, for thefirst-arriving Aircraft Rescue Fire Fightingunit showing agent during timed runs.
140149 145 145137
Percent of cardiac arrests withreturn of spontaneous circulationafter application of CPR or AED
4043 44 4245
Percent of total calls which are medicalfirst responder calls
7070 71 7070
Total number of incidents responded toby Operations units
78,50081,982 83,000 84,00075,676
ServicesFire Response, Medical first response, Search and rescue operations, Hazardous materials mitigation; In-service fireinspections; Home hazard assessments; Smoke detector installations; Community Service Group; Communitycollection/distribution centers
Bold/Italicized Measure = Key Indicator
2012-13 Proposed Budget, Austin, TX
62 | Volume I
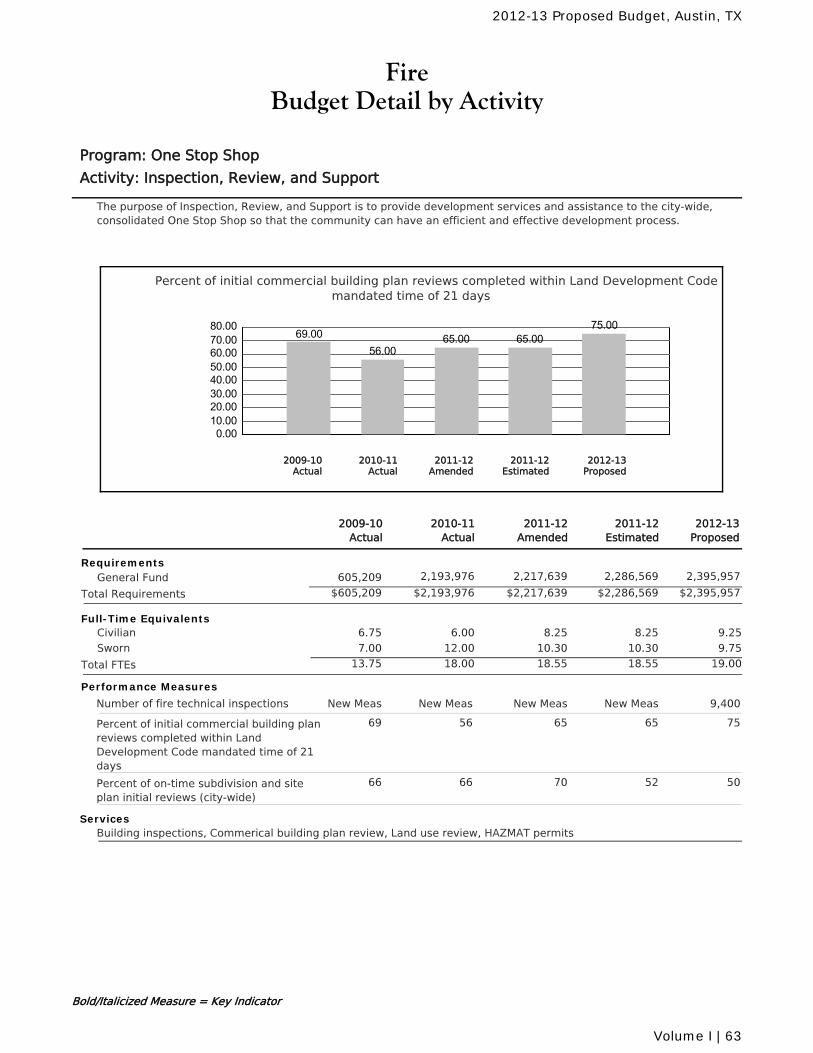
FireBudget Detail by Activity
Program: One Stop Shop
Activity: Inspection, Review, and Support
The purpose of Inspection, Review, and Support is to provide development services and assistance to the city-wide,consolidated One Stop Shop so that the community can have an efficient and effective development process.
Percent of initial commercial building plan reviews completed within Land Development Codemandated time of 21 days
0.0010.0020.0030.0040.0050.0060.0070.0080.00
69.0056.00
65.00 65.0075.00
2010-11Actual
2012-13Proposed
2011-12Amended
2011-12Estimated
2009-10Actual
2011-12Amended
2010-11Actual
2011-12Estimated
2012-13Proposed
2009-10Actual
RequirementsGeneral Fund 2,193,976 2,217,639 2,286,569 2,395,957605,209
Total Requirements $2,193,976 $2,286,569 $2,395,957$2,217,639$605,209
Full-Time Equivalents6.00 8.25 8.25 9.25Civilian 6.75
12.00 10.30 10.30 9.75Sworn 7.00
Total FTEs 18.00 18.55 19.0018.5513.75
Performance Measures
Number of fire technical inspections New MeasNew Meas New Meas 9,400New Meas
Percent of initial commercial building planreviews completed within LandDevelopment Code mandated time of 21days
6556 65 7569
Percent of on-time subdivision and siteplan initial reviews (city-wide)
7066 52 5066
ServicesBuilding inspections, Commerical building plan review, Land use review, HAZMAT permits
Bold/Italicized Measure = Key Indicator
2012-13 Proposed Budget, Austin, TX
Volume I | 63
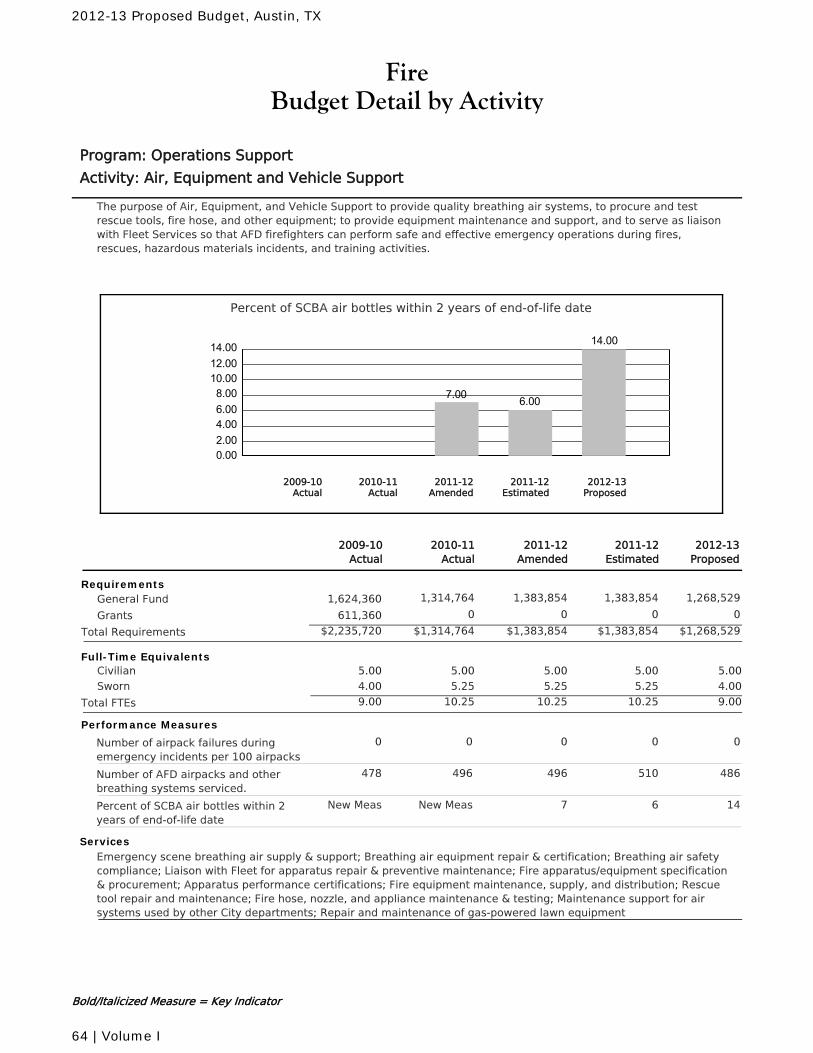
FireBudget Detail by Activity
Program: Operations Support
Activity: Air, Equipment and Vehicle Support
The purpose of Air, Equipment, and Vehicle Support to provide quality breathing air systems, to procure and testrescue tools, fire hose, and other equipment; to provide equipment maintenance and support, and to serve as liaisonwith Fleet Services so that AFD firefighters can perform safe and effective emergency operations during fires,rescues, hazardous materials incidents, and training activities.
Percent of SCBA air bottles within 2 years of end-of-life date
0.002.004.006.008.0010.0012.0014.00
7.00 6.00
14.00
2010-11Actual
2012-13Proposed
2011-12Amended
2011-12Estimated
2009-10Actual
2011-12Amended
2010-11Actual
2011-12Estimated
2012-13Proposed
2009-10Actual
RequirementsGeneral Fund 1,314,764 1,383,854 1,383,854 1,268,5291,624,360
Grants 0 0 0 0611,360
Total Requirements $1,314,764 $1,383,854 $1,268,529$1,383,854$2,235,720
Full-Time Equivalents5.00 5.00 5.00 5.00Civilian 5.00
5.25 5.25 5.25 4.00Sworn 4.00
Total FTEs 10.25 10.25 9.0010.259.00
Performance Measures
Number of airpack failures duringemergency incidents per 100 airpacks
00 0 00
Number of AFD airpacks and otherbreathing systems serviced.
496496 510 486478
Percent of SCBA air bottles within 2years of end-of-life date
7New Meas 6 14New Meas
ServicesEmergency scene breathing air supply & support; Breathing air equipment repair & certification; Breathing air safetycompliance; Liaison with Fleet for apparatus repair & preventive maintenance; Fire apparatus/equipment specification& procurement; Apparatus performance certifications; Fire equipment maintenance, supply, and distribution; Rescuetool repair and maintenance; Fire hose, nozzle, and appliance maintenance & testing; Maintenance support for airsystems used by other City departments; Repair and maintenance of gas-powered lawn equipment
Bold/Italicized Measure = Key Indicator
2012-13 Proposed Budget, Austin, TX
64 | Volume I
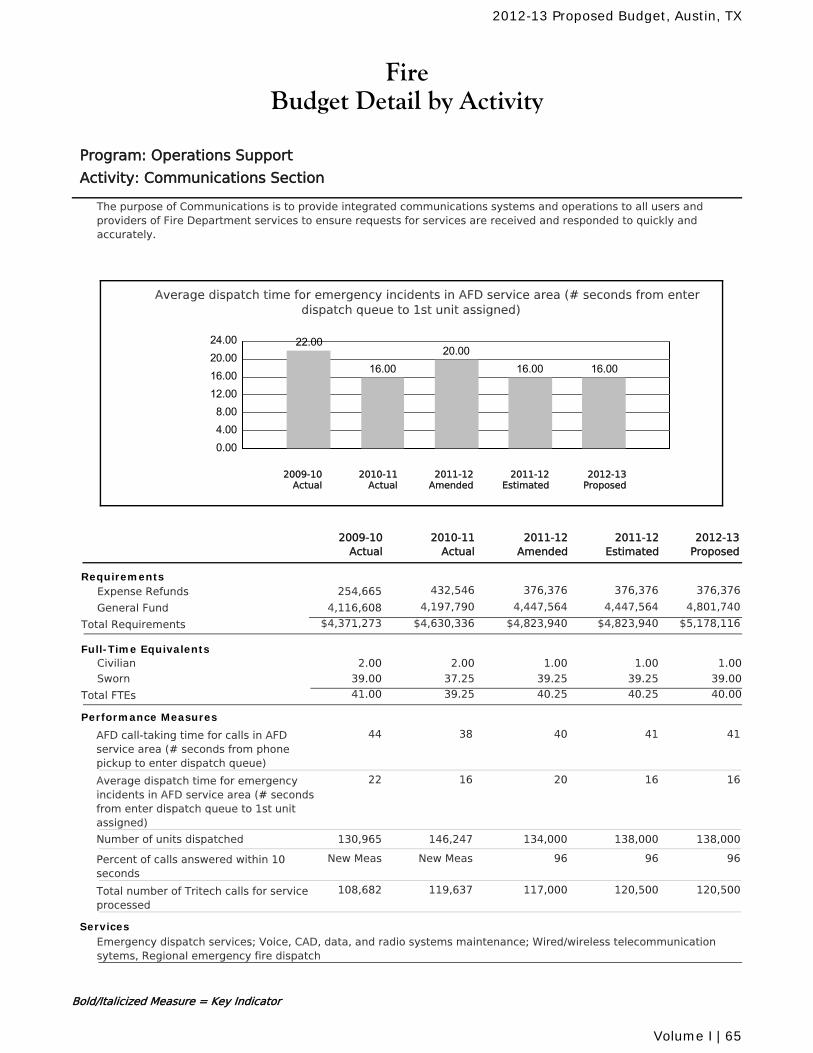
FireBudget Detail by Activity
Program: Operations Support
Activity: Communications Section
The purpose of Communications is to provide integrated communications systems and operations to all users andproviders of Fire Department services to ensure requests for services are received and responded to quickly andaccurately.
Average dispatch time for emergency incidents in AFD service area (# seconds from enterdispatch queue to 1st unit assigned)
0.004.008.0012.0016.0020.0024.00 22.00
16.0020.00
16.00 16.00
2010-11Actual
2012-13Proposed
2011-12Amended
2011-12Estimated
2009-10Actual
2011-12Amended
2010-11Actual
2011-12Estimated
2012-13Proposed
2009-10Actual
RequirementsExpense Refunds 432,546 376,376 376,376 376,376254,665
General Fund 4,197,790 4,447,564 4,447,564 4,801,7404,116,608
Total Requirements $4,630,336 $4,823,940 $5,178,116$4,823,940$4,371,273
Full-Time Equivalents2.00 1.00 1.00 1.00Civilian 2.00
37.25 39.25 39.25 39.00Sworn 39.00
Total FTEs 39.25 40.25 40.0040.2541.00
Performance Measures
AFD call-taking time for calls in AFDservice area (# seconds from phonepickup to enter dispatch queue)
4038 41 4144
Average dispatch time for emergencyincidents in AFD service area (# secondsfrom enter dispatch queue to 1st unitassigned)
2016 16 1622
Number of units dispatched 134,000146,247 138,000 138,000130,965
Percent of calls answered within 10seconds
96New Meas 96 96New Meas
Total number of Tritech calls for serviceprocessed
117,000119,637 120,500 120,500108,682
ServicesEmergency dispatch services; Voice, CAD, data, and radio systems maintenance; Wired/wireless telecommunicationsytems, Regional emergency fire dispatch
Bold/Italicized Measure = Key Indicator
2012-13 Proposed Budget, Austin, TX
Volume I | 65
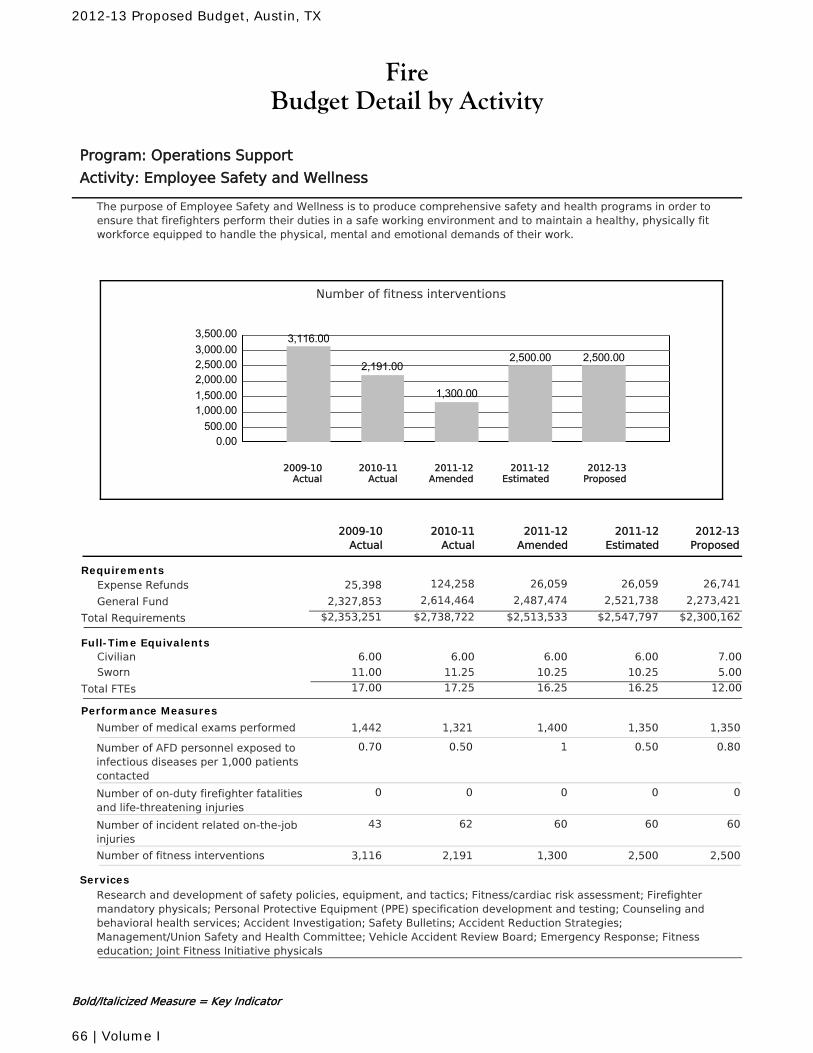
FireBudget Detail by Activity
Program: Operations Support
Activity: Employee Safety and Wellness
The purpose of Employee Safety and Wellness is to produce comprehensive safety and health programs in order toensure that firefighters perform their duties in a safe working environment and to maintain a healthy, physically fitworkforce equipped to handle the physical, mental and emotional demands of their work.
Number of fitness interventions
0.00500.00
1,000.001,500.002,000.002,500.003,000.003,500.00 3,116.00
2,191.00
1,300.00
2,500.00 2,500.00
2010-11Actual
2012-13Proposed
2011-12Amended
2011-12Estimated
2009-10Actual
2011-12Amended
2010-11Actual
2011-12Estimated
2012-13Proposed
2009-10Actual
RequirementsExpense Refunds 124,258 26,059 26,059 26,74125,398
General Fund 2,614,464 2,487,474 2,521,738 2,273,4212,327,853
Total Requirements $2,738,722 $2,547,797 $2,300,162$2,513,533$2,353,251
Full-Time Equivalents6.00 6.00 6.00 7.00Civilian 6.00
11.25 10.25 10.25 5.00Sworn 11.00
Total FTEs 17.25 16.25 12.0016.2517.00
Performance Measures
Number of medical exams performed 1,4001,321 1,350 1,3501,442
Number of AFD personnel exposed toinfectious diseases per 1,000 patientscontacted
10.50 0.50 0.800.70
Number of on-duty firefighter fatalitiesand life-threatening injuries
00 0 00
Number of incident related on-the-jobinjuries
6062 60 6043
Number of fitness interventions 1,3002,191 2,500 2,5003,116
ServicesResearch and development of safety policies, equipment, and tactics; Fitness/cardiac risk assessment; Firefightermandatory physicals; Personal Protective Equipment (PPE) specification development and testing; Counseling andbehavioral health services; Accident Investigation; Safety Bulletins; Accident Reduction Strategies;Management/Union Safety and Health Committee; Vehicle Accident Review Board; Emergency Response; Fitnesseducation; Joint Fitness Initiative physicals
Bold/Italicized Measure = Key Indicator
2012-13 Proposed Budget, Austin, TX
66 | Volume I
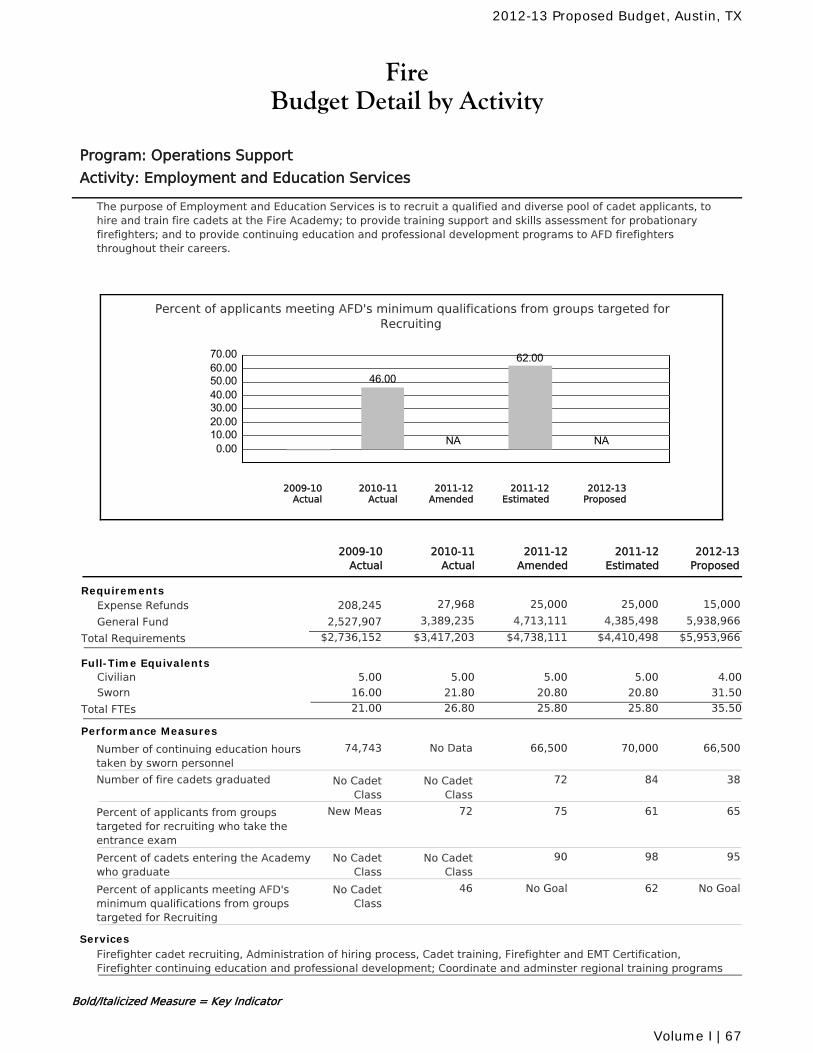
FireBudget Detail by Activity
Program: Operations Support
Activity: Employment and Education Services
The purpose of Employment and Education Services is to recruit a qualified and diverse pool of cadet applicants, tohire and train fire cadets at the Fire Academy; to provide training support and skills assessment for probationaryfirefighters; and to provide continuing education and professional development programs to AFD firefightersthroughout their careers.
Percent of applicants meeting AFD's minimum qualifications from groups targeted forRecruiting
0.0010.0020.0030.0040.0050.0060.0070.00
46.00
NA
62.00
NA
2010-11Actual
2012-13Proposed
2011-12Amended
2011-12Estimated
2009-10Actual
2011-12Amended
2010-11Actual
2011-12Estimated
2012-13Proposed
2009-10Actual
RequirementsExpense Refunds 27,968 25,000 25,000 15,000208,245
General Fund 3,389,235 4,713,111 4,385,498 5,938,9662,527,907
Total Requirements $3,417,203 $4,410,498 $5,953,966$4,738,111$2,736,152
Full-Time Equivalents5.00 5.00 5.00 4.00Civilian 5.00
21.80 20.80 20.80 31.50Sworn 16.00
Total FTEs 26.80 25.80 35.5025.8021.00
Performance Measures
Number of continuing education hourstaken by sworn personnel
66,500No Data 70,000 66,50074,743
Number of fire cadets graduated 72No CadetClass
84 38No CadetClass
Percent of applicants from groupstargeted for recruiting who take theentrance exam
7572 61 65New Meas
Percent of cadets entering the Academywho graduate
90No CadetClass
98 95No CadetClass
Percent of applicants meeting AFD'sminimum qualifications from groupstargeted for Recruiting
No Goal46 62 No GoalNo CadetClass
ServicesFirefighter cadet recruiting, Administration of hiring process, Cadet training, Firefighter and EMT Certification,Firefighter continuing education and professional development; Coordinate and adminster regional training programs
Bold/Italicized Measure = Key Indicator
2012-13 Proposed Budget, Austin, TX
Volume I | 67
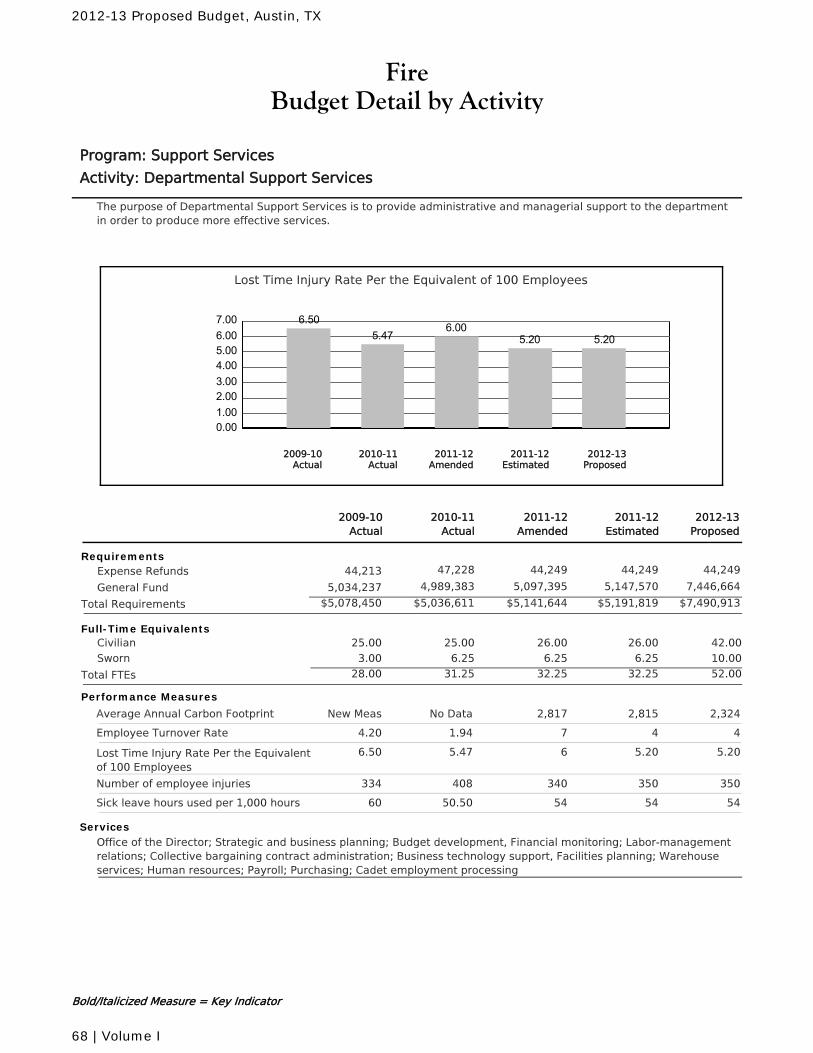
FireBudget Detail by Activity
Program: Support Services
Activity: Departmental Support Services
The purpose of Departmental Support Services is to provide administrative and managerial support to the departmentin order to produce more effective services.
Lost Time Injury Rate Per the Equivalent of 100 Employees
0.001.002.003.004.005.006.007.00 6.50
5.476.00
5.20 5.20
2010-11Actual
2012-13Proposed
2011-12Amended
2011-12Estimated
2009-10Actual
2011-12Amended
2010-11Actual
2011-12Estimated
2012-13Proposed
2009-10Actual
RequirementsExpense Refunds 47,228 44,249 44,249 44,24944,213
General Fund 4,989,383 5,097,395 5,147,570 7,446,6645,034,237
Total Requirements $5,036,611 $5,191,819 $7,490,913$5,141,644$5,078,450
Full-Time Equivalents25.00 26.00 26.00 42.00Civilian 25.00
6.25 6.25 6.25 10.00Sworn 3.00
Total FTEs 31.25 32.25 52.0032.2528.00
Performance Measures
Average Annual Carbon Footprint 2,817No Data 2,815 2,324New Meas
Employee Turnover Rate 71.94 4 44.20
Lost Time Injury Rate Per the Equivalentof 100 Employees
65.47 5.20 5.206.50
Number of employee injuries 340408 350 350334
Sick leave hours used per 1,000 hours 5450.50 54 5460
ServicesOffice of the Director; Strategic and business planning; Budget development, Financial monitoring; Labor-managementrelations; Collective bargaining contract administration; Business technology support, Facilities planning; Warehouseservices; Human resources; Payroll; Purchasing; Cadet employment processing
Bold/Italicized Measure = Key Indicator
2012-13 Proposed Budget, Austin, TX
68 | Volume I
FireBudget Detail by Activity
Program: Transfers & Other Requirements
Activity: All Activities
The purpose of the Transfers & Other Requirements program is to account for transfers and other departmentalrequirements at the fund or agency level.
Graph Not Applicable
2011-12Amended
2010-11Actual
2011-12Estimated
2012-13Proposed
2009-10Actual
RequirementsGeneral Fund 929,779 676,843 676,843 494,9051,011,026
Total Requirements $929,779 $676,843 $494,905$676,843$1,011,026
Bold/Italicized Measure = Key Indicator
2012-13 Proposed Budget, Austin, TX
Volume I | 69
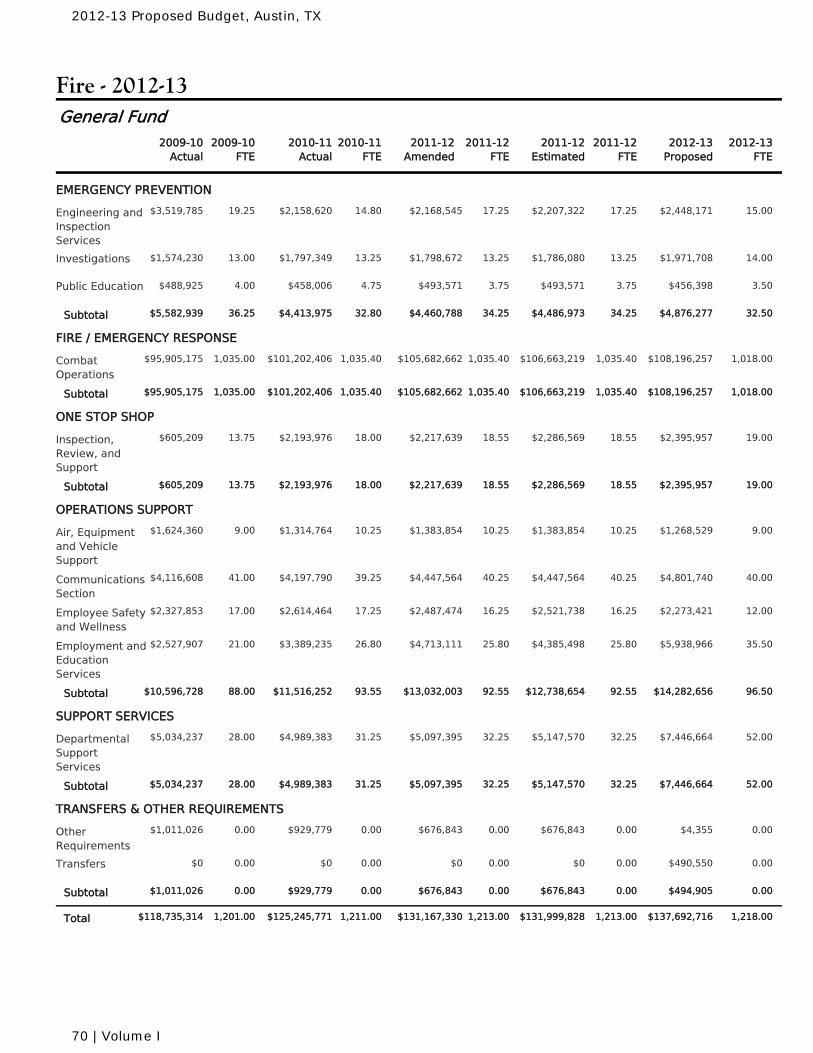
Fire - 2012-13
2010-11Actual
2010-11FTE
2011-12Amended
2011-12FTE
2011-12Estimated
2011-12FTE
2009-10Actual
2009-10FTE
2012-13Proposed
2012-13FTE
General Fund
EMERGENCY PREVENTION
$2,158,620 14.80 $2,168,545 17.25 $2,207,322 17.25Engineering andInspectionServices
19.25 $2,448,171 15.00$3,519,785
$1,797,349 13.25 $1,798,672 13.25 $1,786,080 13.25Investigations 13.00 $1,971,708 14.00$1,574,230
$458,006 4.75 $493,571 3.75 $493,571 3.75Public Education 4.00 $456,398 3.50$488,925
$4,413,975 32.80 $4,460,788 34.25 $4,486,973 34.25Subtotal 36.25 $4,876,277 32.50$5,582,939
FIRE / EMERGENCY RESPONSE
$101,202,406 1,035.40 $105,682,662 1,035.40 $106,663,219 1,035.40CombatOperations
1,035.00 $108,196,257 1,018.00$95,905,175
$101,202,406 1,035.40 $105,682,662 1,035.40 $106,663,219 1,035.40Subtotal 1,035.00 $108,196,257 1,018.00$95,905,175
ONE STOP SHOP
$2,193,976 18.00 $2,217,639 18.55 $2,286,569 18.55Inspection,Review, andSupport
13.75 $2,395,957 19.00$605,209
$2,193,976 18.00 $2,217,639 18.55 $2,286,569 18.55Subtotal 13.75 $2,395,957 19.00$605,209
OPERATIONS SUPPORT
$1,314,764 10.25 $1,383,854 10.25 $1,383,854 10.25Air, Equipmentand VehicleSupport
9.00 $1,268,529 9.00$1,624,360
$4,197,790 39.25 $4,447,564 40.25 $4,447,564 40.25CommunicationsSection
41.00 $4,801,740 40.00$4,116,608
$2,614,464 17.25 $2,487,474 16.25 $2,521,738 16.25Employee Safetyand Wellness
17.00 $2,273,421 12.00$2,327,853
$3,389,235 26.80 $4,713,111 25.80 $4,385,498 25.80Employment andEducationServices
21.00 $5,938,966 35.50$2,527,907
$11,516,252 93.55 $13,032,003 92.55 $12,738,654 92.55Subtotal 88.00 $14,282,656 96.50$10,596,728
SUPPORT SERVICES
$4,989,383 31.25 $5,097,395 32.25 $5,147,570 32.25DepartmentalSupportServices
28.00 $7,446,664 52.00$5,034,237
$4,989,383 31.25 $5,097,395 32.25 $5,147,570 32.25Subtotal 28.00 $7,446,664 52.00$5,034,237
TRANSFERS & OTHER REQUIREMENTS
$929,779 0.00 $676,843 0.00 $676,843 0.00OtherRequirements
0.00 $4,355 0.00$1,011,026
$0 0.00 $0 0.00 $0 0.00Transfers 0.00 $490,550 0.00$0
$929,779 0.00 $676,843 0.00 $676,843 0.00Subtotal 0.00 $494,905 0.00$1,011,026
$125,245,771 1,211.00 $131,167,330 1,213.00 $131,999,828 1,213.00Total 1,201.00 $137,692,716 1,218.00$118,735,314
2012-13 Proposed Budget, Austin, TX
70 | Volume I
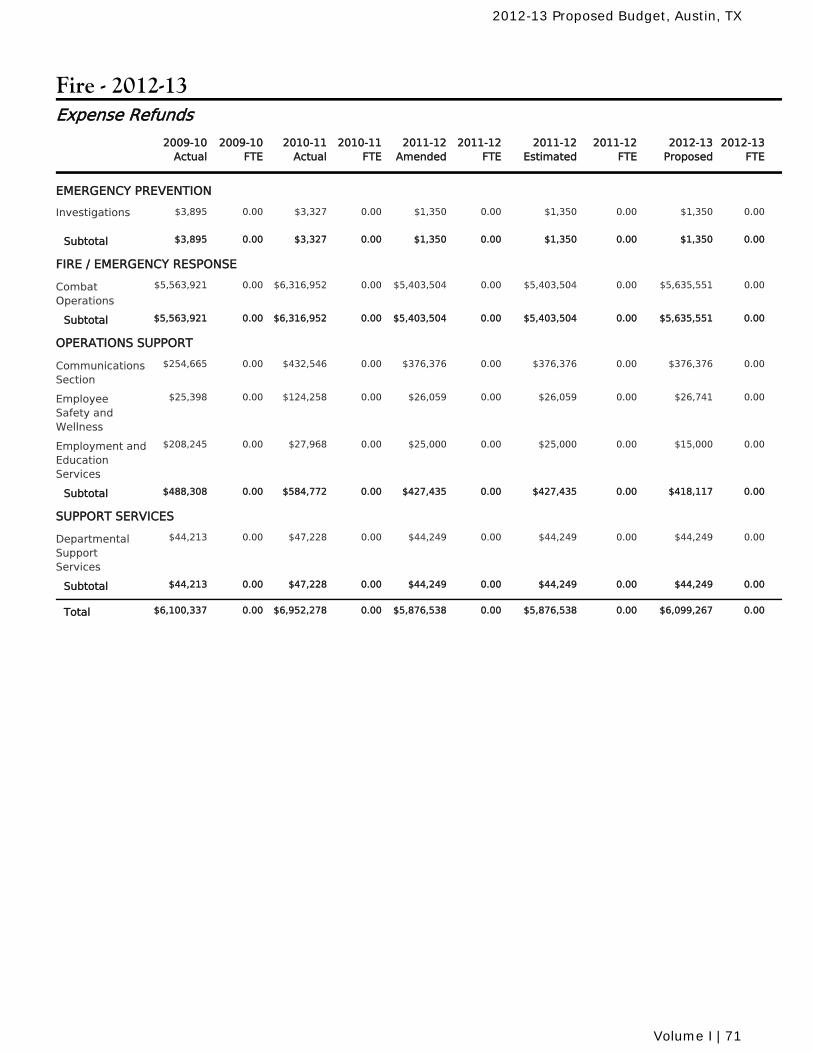
Fire - 2012-13
2010-11Actual
2010-11FTE
2011-12Amended
2011-12FTE
2011-12Estimated
2011-12FTE
2009-10Actual
2009-10FTE
2012-13Proposed
2012-13FTE
Expense Refunds
EMERGENCY PREVENTION
$3,327 0.00 $1,350 0.00 $1,350 0.00Investigations 0.00 $1,350 0.00$3,895
$3,327 0.00 $1,350 0.00 $1,350 0.00Subtotal 0.00 $1,350 0.00$3,895
FIRE / EMERGENCY RESPONSE
$6,316,952 0.00 $5,403,504 0.00 $5,403,504 0.00CombatOperations
0.00 $5,635,551 0.00$5,563,921
$6,316,952 0.00 $5,403,504 0.00 $5,403,504 0.00Subtotal 0.00 $5,635,551 0.00$5,563,921
OPERATIONS SUPPORT
$432,546 0.00 $376,376 0.00 $376,376 0.00CommunicationsSection
0.00 $376,376 0.00$254,665
$124,258 0.00 $26,059 0.00 $26,059 0.00EmployeeSafety andWellness
0.00 $26,741 0.00$25,398
$27,968 0.00 $25,000 0.00 $25,000 0.00Employment andEducationServices
0.00 $15,000 0.00$208,245
$584,772 0.00 $427,435 0.00 $427,435 0.00Subtotal 0.00 $418,117 0.00$488,308
SUPPORT SERVICES
$47,228 0.00 $44,249 0.00 $44,249 0.00DepartmentalSupportServices
0.00 $44,249 0.00$44,213
$47,228 0.00 $44,249 0.00 $44,249 0.00Subtotal 0.00 $44,249 0.00$44,213
$6,952,278 0.00 $5,876,538 0.00 $5,876,538 0.00Total 0.00 $6,099,267 0.00$6,100,337
2012-13 Proposed Budget, Austin, TX
Volume I | 71
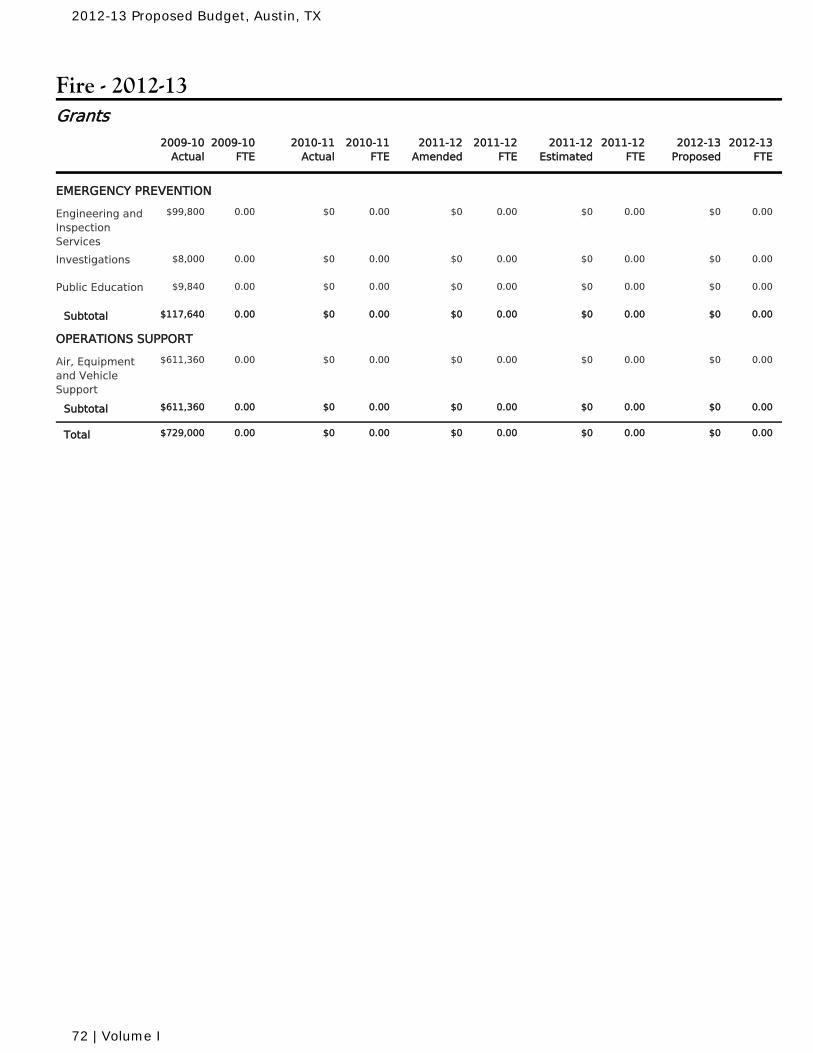
Fire - 2012-13
2010-11Actual
2010-11FTE
2011-12Amended
2011-12FTE
2011-12Estimated
2011-12FTE
2009-10Actual
2009-10FTE
2012-13Proposed
2012-13FTE
Grants
EMERGENCY PREVENTION
$0 0.00 $0 0.00 $0 0.00Engineering andInspectionServices
0.00 $0 0.00$99,800
$0 0.00 $0 0.00 $0 0.00Investigations 0.00 $0 0.00$8,000
$0 0.00 $0 0.00 $0 0.00Public Education 0.00 $0 0.00$9,840
$0 0.00 $0 0.00 $0 0.00Subtotal 0.00 $0 0.00$117,640
OPERATIONS SUPPORT
$0 0.00 $0 0.00 $0 0.00Air, Equipmentand VehicleSupport
0.00 $0 0.00$611,360
$0 0.00 $0 0.00 $0 0.00Subtotal 0.00 $0 0.00$611,360
$0 0.00 $0 0.00 $0 0.00Total 0.00 $0 0.00$729,000
2012-13 Proposed Budget, Austin, TX
72 | Volume I
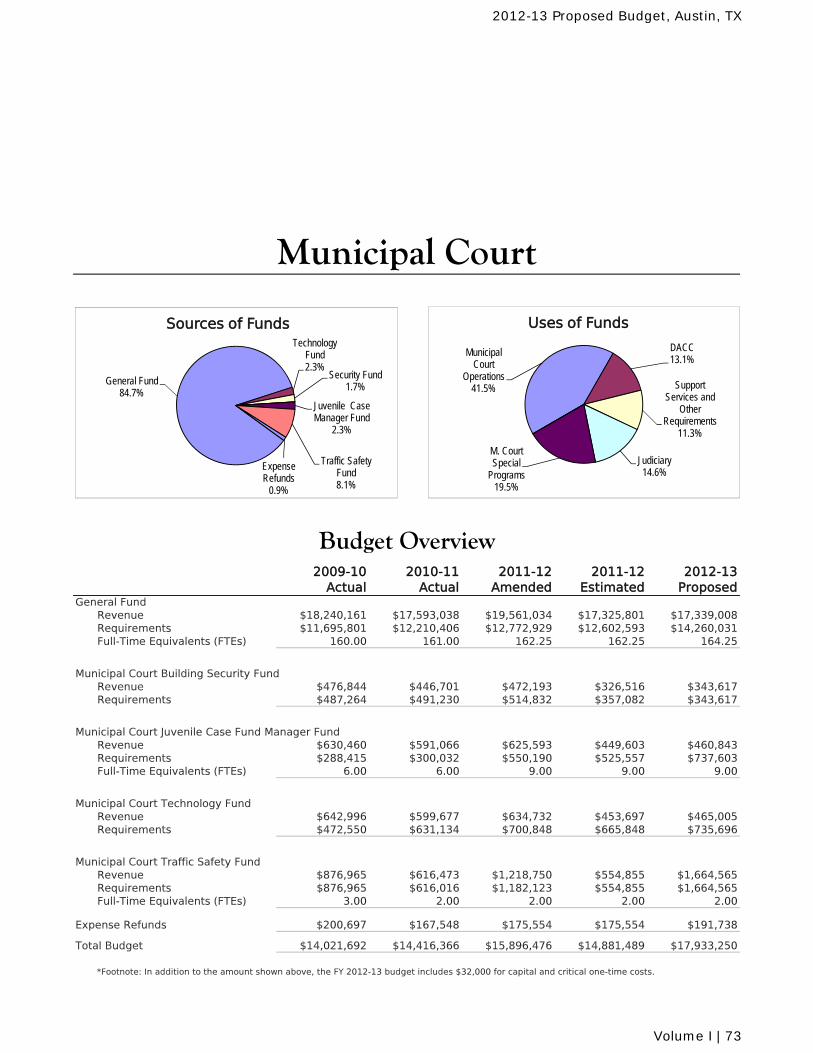
2009-10Actual
2010-11Actual
2011-12 Amended
2011-12 Estimated
2012-13Proposed
General FundRevenue $18,240,161 $17,593,038 $19,561,034 $17,325,801 $17,339,008Requirements $11,695,801 $12,210,406 $12,772,929 $12,602,593 $14,260,031Full-Time Equivalents (FTEs) 160.00 161.00 162.25 162.25 164.25
Municipal Court Building Security FundRevenue $476,844 $446,701 $472,193 $326,516 $343,617Requirements $487,264 $491,230 $514,832 $357,082 $343,617
Municipal Court Juvenile Case Fund Manager FundRevenue $630,460 $591,066 $625,593 $449,603 $460,843Requirements $288,415 $300,032 $550,190 $525,557 $737,603Full-Time Equivalents (FTEs) 6.00 6.00 9.00 9.00 9.00
Municipal Court Technology FundRevenue $642,996 $599,677 $634,732 $453,697 $465,005Requirements $472,550 $631,134 $700,848 $665,848 $735,696
Municipal Court Traffic Safety FundRevenue $876,965 $616,473 $1,218,750 $554,855 $1,664,565Requirements $876,965 $616,016 $1,182,123 $554,855 $1,664,565Full-Time Equivalents (FTEs) 3.00 2.00 2.00 2.00 2.00
Expense Refunds $200,697 $167,548 $175,554 $175,554 $191,738
Total Budget $14,021,692 $14,416,366 $15,896,476 $14,881,489 $17,933,250
*Footnote: In addition to the amount shown above, the FY 2012-13 budget includes $32,000 for capital and critical one-time costs.
Budget Overview
Municipal Court
General Fund84.7%
Technology Fund2.3%
Security Fund1.7%
Juvenile Case Manager Fund
2.3%
Traffic Safety Fund8.1%
Expense Refunds
0.9%
Sources of Funds
Municipal Court
Operations41.5%
DACC13.1%
Support Services and
Other Requirements
11.3%
Judiciary14.6%
M. Court Special
Programs19.5%
Uses of Funds
2012-13 Proposed Budget, Austin, TX
Volume I | 73
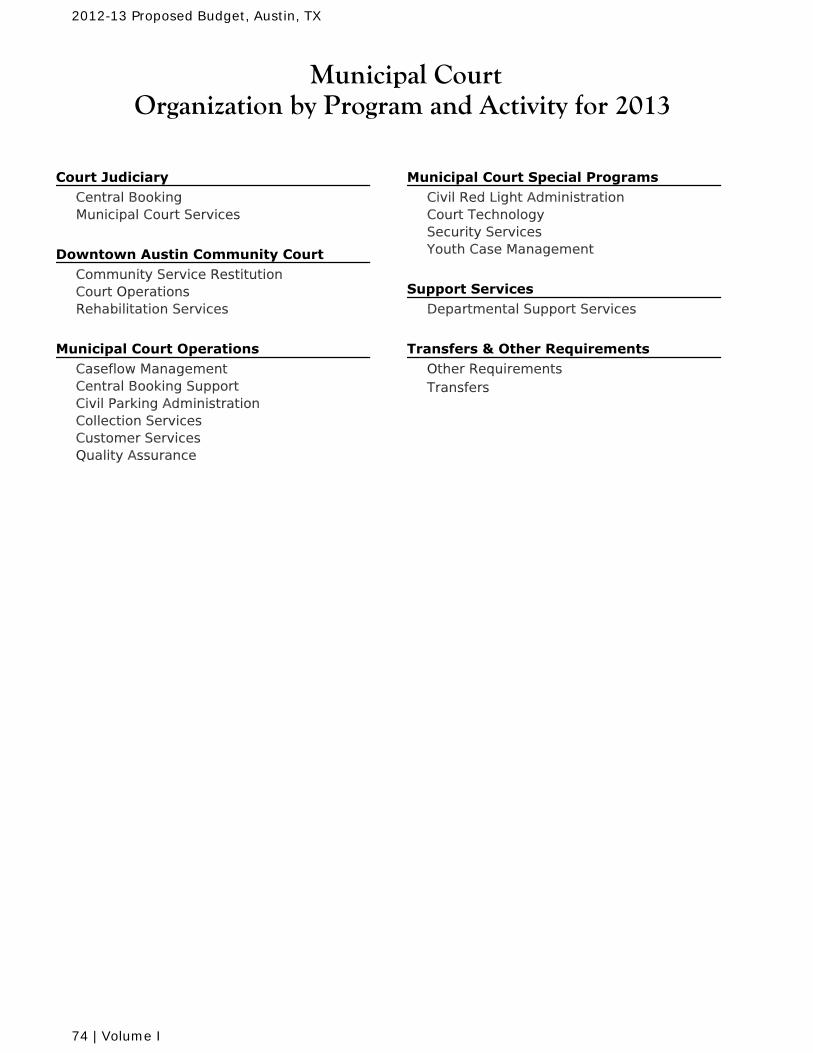
Municipal CourtOrganization by Program and Activity for 2013
Court Judiciary Central BookingMunicipal Court Services
Downtown Austin Community Court Community Service RestitutionCourt OperationsRehabilitation Services
Municipal Court Operations Caseflow ManagementCentral Booking SupportCivil Parking AdministrationCollection ServicesCustomer ServicesQuality Assurance
Municipal Court Special Programs Civil Red Light AdministrationCourt TechnologySecurity ServicesYouth Case Management
Support Services Departmental Support Services
Transfers & Other Requirements Other RequirementsTransfers
2012-13 Proposed Budget, Austin, TX
74 | Volume I
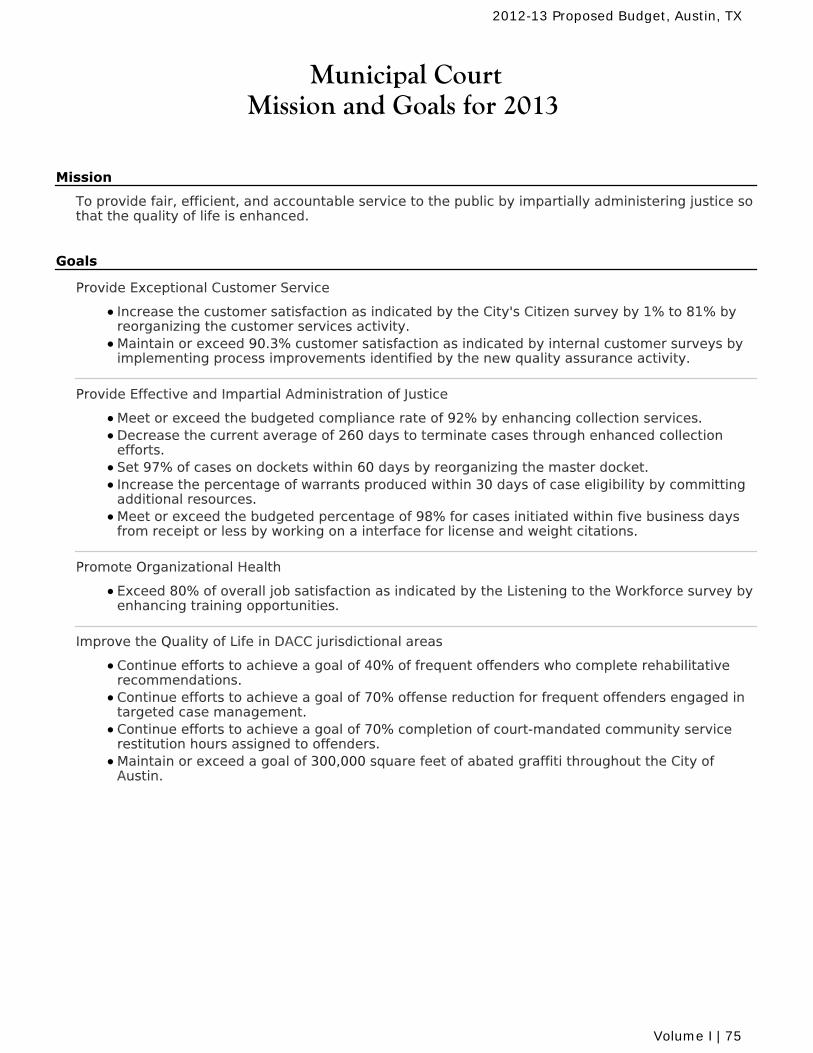
Municipal CourtMission and Goals for 2013
Mission
To provide fair, efficient, and accountable service to the public by impartially administering justice sothat the quality of life is enhanced.
Goals
Provide Exceptional Customer Service
Increase the customer satisfaction as indicated by the City's Citizen survey by 1% to 81% byreorganizing the customer services activity.Maintain or exceed 90.3% customer satisfaction as indicated by internal customer surveys byimplementing process improvements identified by the new quality assurance activity.
Provide Effective and Impartial Administration of Justice
Meet or exceed the budgeted compliance rate of 92% by enhancing collection services.Decrease the current average of 260 days to terminate cases through enhanced collectionefforts.Set 97% of cases on dockets within 60 days by reorganizing the master docket.Increase the percentage of warrants produced within 30 days of case eligibility by committingadditional resources.Meet or exceed the budgeted percentage of 98% for cases initiated within five business daysfrom receipt or less by working on a interface for license and weight citations.
Promote Organizational Health
Exceed 80% of overall job satisfaction as indicated by the Listening to the Workforce survey byenhancing training opportunities.
Improve the Quality of Life in DACC jurisdictional areas
Continue efforts to achieve a goal of 40% of frequent offenders who complete rehabilitativerecommendations.Continue efforts to achieve a goal of 70% offense reduction for frequent offenders engaged intargeted case management.Continue efforts to achieve a goal of 70% completion of court-mandated community servicerestitution hours assigned to offenders. Maintain or exceed a goal of 300,000 square feet of abated graffiti throughout the City ofAustin.
2012-13 Proposed Budget, Austin, TX
Volume I | 75
Municipal Court
Message from the Director
The Municipal Court and the Downtown Austin Community Court constitute the judicial branch of the City of Austin municipal government. They provide all magistration services for the Travis County jail and handle class ‘C’ misdemeanor cases filed by a number of City departments, Austin Independent School District (AISD) and the Texas Alcoholic Beverage Commission. Cases that are filed in these courts include: traffic, city ordinance, state code, parking, and red light camera violations. It is anticipated that 340,036 new cases will be filed in the Austin Municipal Court in FY 2012-13. The Courts provide a number of options other than fine payment for defendants to address their citations. Some options include driving safety, deferred disposition (probation) for motor vehicles and bicycles, payment plans and community service. For those pleading “not guilty”, jury or judge trials are arranged. A Teen Court program is another option for juveniles. The Downtown Austin Community Court (DACC) was established in 1999 to improve the community’s quality of life and public order through effective and creative sentencing of public nuisance-type violators such as aggressive solicitation, public intoxication, simple assault, disorderly conduct and possession of drug paraphernalia. It operates within a defined geographical jurisdictional area. In addition to the downtown courthouse, court services are available at two substations, at the DACC location on 6th Street, by mail, by fax, and online. Challenges for FY 2012-13 The Court’s vision is to be the most effective, efficient and impartial municipal court in Texas. It, along with the City’s aspiration to be the best-managed city in the country, has created an environment of innovation and continuous improvement with which to address current and upcoming challenges. The courts have identified the following areas on which to concentrate over the next couple of years: * Designing, construction and relocating to a new main courthouse to be located on St. Johns Ave; * Service efficiencies that are economical in the long run but require up-front resources, whether time, money
or both, and a number of inter-departmental or outside entity projects or programs that will require Court resources;
* Refocus on the handling of repeat offenders at DACC who require extensive resources; and * Technological upgrades or replacement will be needed for the telephone system and case management
computer program. The telephone system is not customer or service friendly and Municipal Court has been notified that its current case management system will only be supported for another two to three years.
The current courthouse facility was constructed in 1953 and no longer has adequate space for Court operations and staff. In 2006, Austin voters approved funding for a new courthouse as part of the 2006 Bond Program and a building on Interstate 35 at St. Johns Avenue was purchased in 2007. The Municipal Court and Northeast Substation project currently has staff completing conceptual plans to evaluate options under consideration for the most appropriate use of space to meet City and departmental needs. The Municipal Court in partnership with Austin Police Department has a total of $23 million from the 2006 Bond Program. Conclusion Overall, Court has made every effort to identify needs to meet its goals and objectives that focus on exceptional customer service, organizational health, and providing effective and impartial administration of justice.
Rebecca Stark Clerk of the Municipal Court
2012-13 Proposed Budget, Austin, TX
76 | Volume I
Municipal Court
Message from the Director - DACC
The Downtown Austin Community Court (DACC) works collaboratively to address the quality of life issues of all residents in the downtown Austin community through the swift, creative sentencing of public order offenders. In FY 2008-09, DACC identified a group of individuals designated as frequent offenders. A frequent offender is defined as an individual who has had 25 or more legal cases with the court and has had at least one active case in the last two years; 76 frequent offenders have cycled through the Community Court since the courts implementation in October 1999. To engage these offenders, DACC implemented the Targeted Case Management program (TCM) in FY 2010-11, with the goal of providing wraparound services in collaboration with other community efforts, such as the Ending Community Homeless Coalitions’ 100 Homes Campaign, Road to Recovery (formerly named Project Recovery), a three-way partnership between DACC, Austin Travis County Integral Care and Travis County Criminal Justice Planning, Partnership Housing, a four-way partnership between DACC, Caritas, Foundation Communities and the Downtown Austin Alliance, as well as the City of Austin’s continued efforts to secure additional permanent supportive housing for individuals with the highest needs. Through the above mentioned partnerships and the development of a continuum of intense, wraparound services available to individuals with the highest needs, the department has been successful in decreasing the amount of cases acquired by frequent offenders who were actively engaged in case management, and will permanently house a total of 20 individuals at Foundation Communities by the end of FY 2011-12. The FY 2012-13 Budget has been developed to address the needs of frequent offenders, the majority of which are homeless and are dealing with medical, mental health and substance abuse issues; many of them also having extensive criminal histories. Progress continues with the Targeted Case Management program which will allow DACC to reach the goal of stabilizing and housing the priority group of 280 frequent offenders, as well as addressing the needs of individuals that may become frequent offenders if the Court does not proactively engage them in the community before they are arrested or cited. In conclusion, the Downtown Austin Community Court will continue towards its goal of becoming the Best Managed Community Court in the nation by fulfilling its mission to collaboratively address the needs of all residents in downtown Austin and surrounding communities. The Court will continue striving towards success in intensively serving and stabilizing repeat offenders through the improvement of a robust rehabilitation program and by working closely with stakeholders to improve the safety and quality of life for defendants, the community, and the citizens of Austin alike.
Peter Valdez Court Administrator, Downtown Austin Community Court
2012-13 Proposed Budget, Austin, TX
Volume I | 77
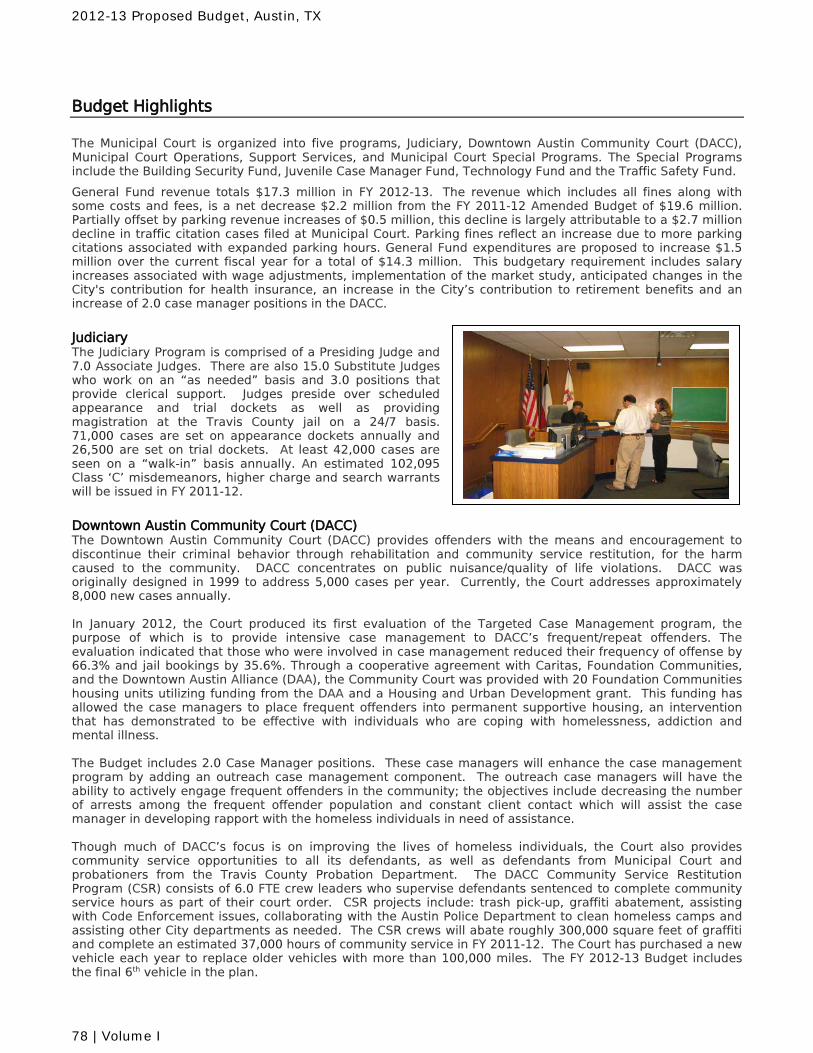
Budget Highlights
The Municipal Court is organized into five programs, Judiciary, Downtown Austin Community Court (DACC), Municipal Court Operations, Support Services, and Municipal Court Special Programs. The Special Programs include the Building Security Fund, Juvenile Case Manager Fund, Technology Fund and the Traffic Safety Fund. General Fund revenue totals $17.3 million in FY 2012-13. The revenue which includes all fines along with some costs and fees, is a net decrease $2.2 million from the FY 2011-12 Amended Budget of $19.6 million. Partially offset by parking revenue increases of $0.5 million, this decline is largely attributable to a $2.7 million decline in traffic citation cases filed at Municipal Court. Parking fines reflect an increase due to more parking citations associated with expanded parking hours. General Fund expenditures are proposed to increase $1.5 million over the current fiscal year for a total of $14.3 million. This budgetary requirement includes salary increases associated with wage adjustments, implementation of the market study, anticipated changes in the City's contribution for health insurance, an increase in the City’s contribution to retirement benefits and an increase of 2.0 case manager positions in the DACC.
Judiciary The Judiciary Program is comprised of a Presiding Judge and 7.0 Associate Judges. There are also 15.0 Substitute Judges who work on an “as needed” basis and 3.0 positions that provide clerical support. Judges preside over scheduled appearance and trial dockets as well as providing magistration at the Travis County jail on a 24/7 basis. 71,000 cases are set on appearance dockets annually and 26,500 are set on trial dockets. At least 42,000 cases are seen on a “walk-in” basis annually. An estimated 102,095 Class ‘C’ misdemeanors, higher charge and search warrants will be issued in FY 2011-12.
Downtown Austin Community Court (DACC) The Downtown Austin Community Court (DACC) provides offenders with the means and encouragement to discontinue their criminal behavior through rehabilitation and community service restitution, for the harm caused to the community. DACC concentrates on public nuisance/quality of life violations. DACC was originally designed in 1999 to address 5,000 cases per year. Currently, the Court addresses approximately 8,000 new cases annually. In January 2012, the Court produced its first evaluation of the Targeted Case Management program, the purpose of which is to provide intensive case management to DACC’s frequent/repeat offenders. The evaluation indicated that those who were involved in case management reduced their frequency of offense by 66.3% and jail bookings by 35.6%. Through a cooperative agreement with Caritas, Foundation Communities, and the Downtown Austin Alliance (DAA), the Community Court was provided with 20 Foundation Communities housing units utilizing funding from the DAA and a Housing and Urban Development grant. This funding has allowed the case managers to place frequent offenders into permanent supportive housing, an intervention that has demonstrated to be effective with individuals who are coping with homelessness, addiction and mental illness. The Budget includes 2.0 Case Manager positions. These case managers will enhance the case management program by adding an outreach case management component. The outreach case managers will have the ability to actively engage frequent offenders in the community; the objectives include decreasing the number of arrests among the frequent offender population and constant client contact which will assist the case manager in developing rapport with the homeless individuals in need of assistance. Though much of DACC’s focus is on improving the lives of homeless individuals, the Court also provides community service opportunities to all its defendants, as well as defendants from Municipal Court and probationers from the Travis County Probation Department. The DACC Community Service Restitution Program (CSR) consists of 6.0 FTE crew leaders who supervise defendants sentenced to complete community service hours as part of their court order. CSR projects include: trash pick-up, graffiti abatement, assisting with Code Enforcement issues, collaborating with the Austin Police Department to clean homeless camps and assisting other City departments as needed. The CSR crews will abate roughly 300,000 square feet of graffiti and complete an estimated 37,000 hours of community service in FY 2011-12. The Court has purchased a new vehicle each year to replace older vehicles with more than 100,000 miles. The FY 2012-13 Budget includes the final 6th vehicle in the plan.
2012-13 Proposed Budget, Austin, TX
78 | Volume I
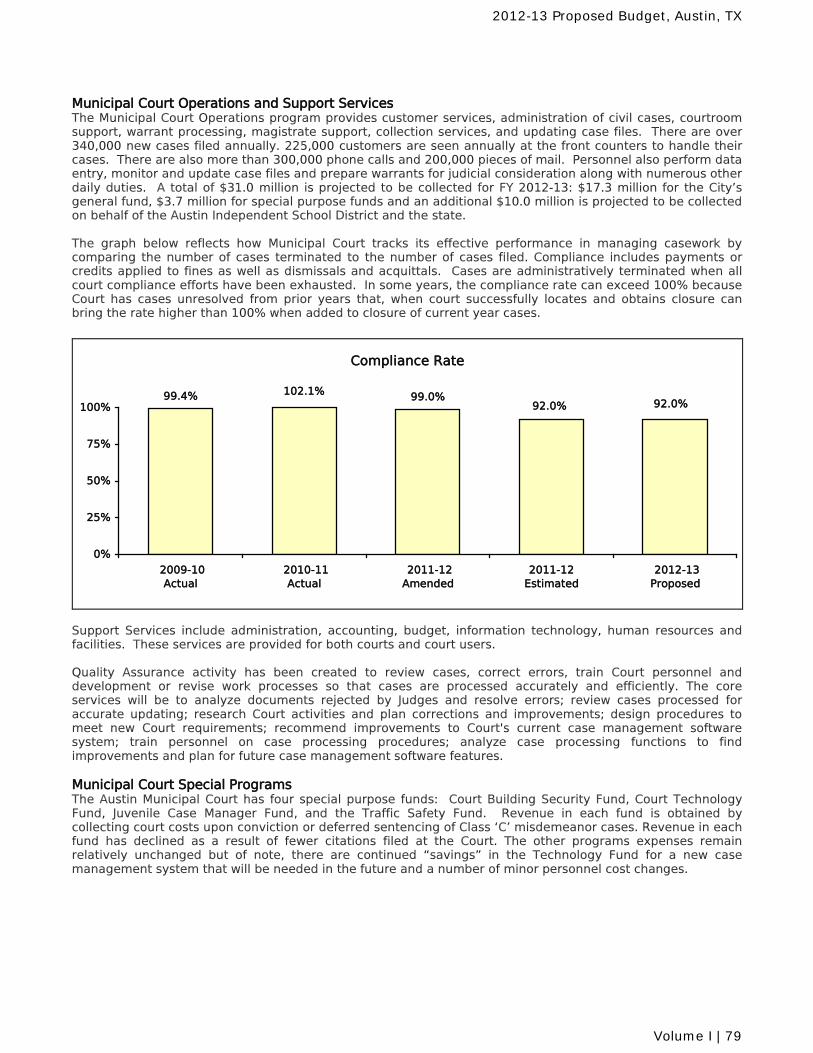
Municipal Court Operations and Support Services The Municipal Court Operations program provides customer services, administration of civil cases, courtroom support, warrant processing, magistrate support, collection services, and updating case files. There are over 340,000 new cases filed annually. 225,000 customers are seen annually at the front counters to handle their cases. There are also more than 300,000 phone calls and 200,000 pieces of mail. Personnel also perform data entry, monitor and update case files and prepare warrants for judicial consideration along with numerous other daily duties. A total of $31.0 million is projected to be collected for FY 2012-13: $17.3 million for the City’s general fund, $3.7 million for special purpose funds and an additional $10.0 million is projected to be collected on behalf of the Austin Independent School District and the state. The graph below reflects how Municipal Court tracks its effective performance in managing casework by comparing the number of cases terminated to the number of cases filed. Compliance includes payments or credits applied to fines as well as dismissals and acquittals. Cases are administratively terminated when all court compliance efforts have been exhausted. In some years, the compliance rate can exceed 100% because Court has cases unresolved from prior years that, when court successfully locates and obtains closure can bring the rate higher than 100% when added to closure of current year cases.
Compliance Rate
92.0%92.0%99.0%102.1%99.4%
0%
25%
50%
75%
100%
2009-10 Actual
2010-11 Actual
2011-12 Amended
2011-12 Estimated
2012-13 Proposed
Support Services include administration, accounting, budget, information technology, human resources and facilities. These services are provided for both courts and court users. Quality Assurance activity has been created to review cases, correct errors, train Court personnel and development or revise work processes so that cases are processed accurately and efficiently. The core services will be to analyze documents rejected by Judges and resolve errors; review cases processed for accurate updating; research Court activities and plan corrections and improvements; design procedures to meet new Court requirements; recommend improvements to Court's current case management software system; train personnel on case processing procedures; analyze case processing functions to find improvements and plan for future case management software features. Municipal Court Special Programs The Austin Municipal Court has four special purpose funds: Court Building Security Fund, Court Technology Fund, Juvenile Case Manager Fund, and the Traffic Safety Fund. Revenue in each fund is obtained by collecting court costs upon conviction or deferred sentencing of Class ‘C’ misdemeanor cases. Revenue in each fund has declined as a result of fewer citations filed at the Court. The other programs expenses remain relatively unchanged but of note, there are continued “savings” in the Technology Fund for a new case management system that will be needed in the future and a number of minor personnel cost changes.
2012-13 Proposed Budget, Austin, TX
Volume I | 79
Other Funds
Municipal Court Building Security Fund The purpose of the fund is to provide funding to enhance courthouse security. Revenue is derived from a $3 security fee authorized under Article 102.017 of the Code of Criminal Procedure paid by a defendant convicted of an offense or receiving deferred disposition. The revenue collected is directly related to the number of convictions and deferred dispositions resulting from Class ‘C’ misdemeanor cases filed. The primary requirement of the fund is to enhance courthouse security. Use of the funds collected is limited to security personnel, security enhancements and training. Municipal Court Juvenile Case Manager Fund This fund provides for the administration of juvenile dockets and to assist with the provision of alternative sentencing for youth. The case manager program is designed to hold youth offenders accountable for their actions and enhance public safety. Revenue is derived from a $4 fee authorized under Article 102.0174 of the Code of Criminal Procedure paid by defendants convicted of fine-only misdemeanors. Prior to FY 2011-12, the funding could only be used for juvenile case manager salaries and benefits. Legislation in 2011 expanded its permitted use to supplies and services. The Budget includes salary increases associated with wage adjustments, implementation of the market study, anticipated changes in the City's contribution for health insurance and an increase in the City’s contribution to retirement benefits. Also included in the Budget is $150,000 for the implementation of a pilot program for juvenile Class C cases through an interlocal with Travis County. Municipal Court Technology Fund The purpose of the fund is to provide funding to enhance court technology. Revenue is derived from a $4 technology fee authorized under Article 102.0172 of the Code of Criminal Procedure paid by a defendant convicted of a misdemeanor offense or receiving deferred disposition. The revenue collected is directly related to the number of convictions and deferrals resulting from Class ‘C’ misdemeanor charges. The primary requirement of the fund is to finance the purchase and maintenance of technological enhancements and the resulting maintenance for municipal courts. Use of the funds collected is limited to court technology. During FY 2012-13, funds will be used for projects within the Municipal Court Technology Plan. There are continued “savings” in the fund for a new case management system that will be needed in the future. Municipal Court Traffic Safety Fund Currently there are 10 cameras operational at key intersections across the City. The City’s portion of the revenue from the $75 penalty for each violation (as well as a $25 late fee for violations not paid with 30 days) may be used to fund traffic safety programs. State law requires half of the net revenue generated by a Red Light Camera Program be sent to the state. The City must deposit its share of net revenue into a special account used only to fund traffic safety programs including pedestrian safety programs, public safety programs, intersection improvements and traffic enforcement. Expenditures and revenues have been projected to increase due to recommendations to relocate or add up to 5 cameras. The Austin Police Department studies crash data and makes these recommendations for additional cameras.
2012-13 Proposed Budget, Austin, TX
80 | Volume I
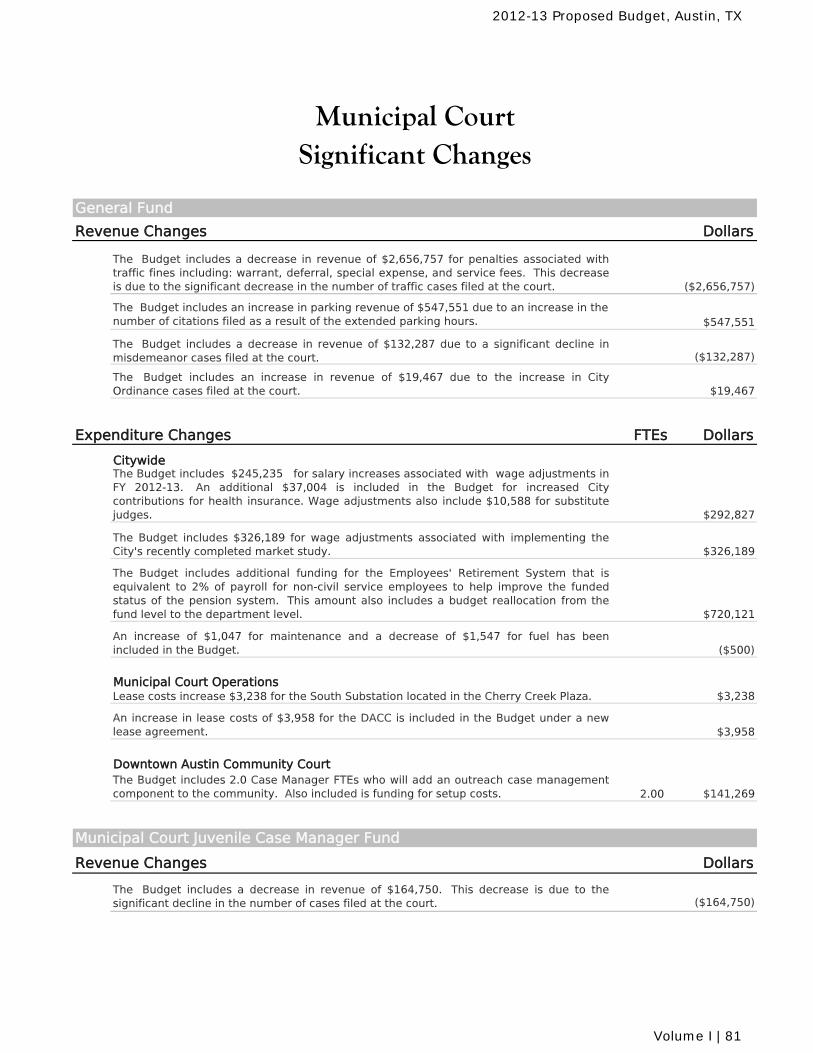
Revenue Changes Dollars
The Budget includes a decrease in revenue of $2,656,757 for penalties associated withtraffic fines including: warrant, deferral, special expense, and service fees. This decreaseis due to the significant decrease in the number of traffic cases filed at the court. ($2,656,757)
The Budget includes an increase in parking revenue of $547,551 due to an increase in the number of citations filed as a result of the extended parking hours. $547,551
The Budget includes a decrease in revenue of $132,287 due to a significant decline inmisdemeanor cases filed at the court. ($132,287)
The Budget includes an increase in revenue of $19,467 due to the increase in CityOrdinance cases filed at the court. $19,467
Expenditure Changes FTEs Dollars
CitywideThe Budget includes $245,235 for salary increases associated with wage adjustments inFY 2012-13. An additional $37,004 is included in the Budget for increased Citycontributions for health insurance. Wage adjustments also include $10,588 for substitutejudges. $292,827
The Budget includes $326,189 for wage adjustments associated with implementing theCity's recently completed market study. $326,189
The Budget includes additional funding for the Employees' Retirement System that isequivalent to 2% of payroll for non-civil service employees to help improve the fundedstatus of the pension system. This amount also includes a budget reallocation from thefund level to the department level. $720,121
An increase of $1,047 for maintenance and a decrease of $1,547 for fuel has beenincluded in the Budget. ($500)
Municipal Court OperationsLease costs increase $3,238 for the South Substation located in the Cherry Creek Plaza. $3,238
An increase in lease costs of $3,958 for the DACC is included in the Budget under a newlease agreement. $3,958
Downtown Austin Community CourtThe Budget includes 2.0 Case Manager FTEs who will add an outreach case managementcomponent to the community. Also included is funding for setup costs. 2.00 $141,269
Municipal Court Juvenile Case Manager Fund
Revenue Changes Dollars
The Budget includes a decrease in revenue of $164,750. This decrease is due to thesignificant decline in the number of cases filed at the court. ($164,750)
Significant ChangesMunicipal Court
General Fund
2012-13 Proposed Budget, Austin, TX
Volume I | 81
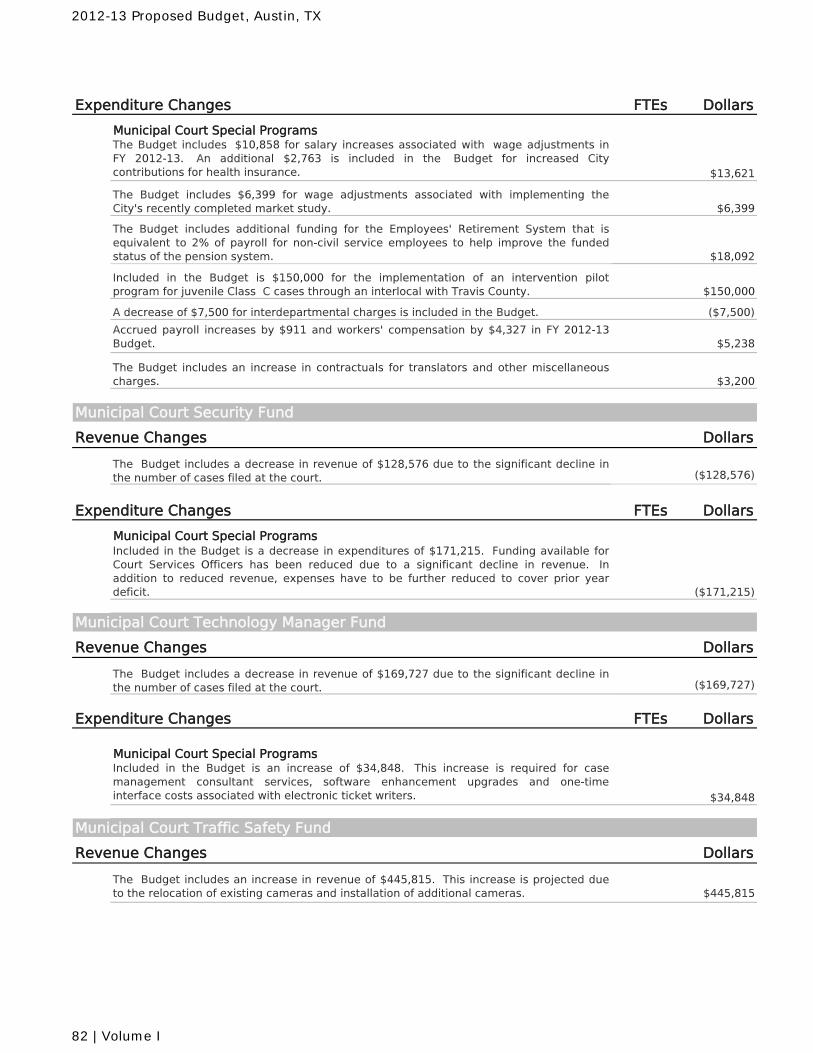
Expenditure Changes FTEs Dollars
Municipal Court Special ProgramsThe Budget includes $10,858 for salary increases associated with wage adjustments inFY 2012-13. An additional $2,763 is included in the Budget for increased Citycontributions for health insurance. $13,621
The Budget includes $6,399 for wage adjustments associated with implementing theCity's recently completed market study. $6,399
The Budget includes additional funding for the Employees' Retirement System that isequivalent to 2% of payroll for non-civil service employees to help improve the fundedstatus of the pension system. $18,092
Included in the Budget is $150,000 for the implementation of an intervention pilotprogram for juvenile Class C cases through an interlocal with Travis County. $150,000
A decrease of $7,500 for interdepartmental charges is included in the Budget. ($7,500)
Accrued payroll increases by $911 and workers' compensation by $4,327 in FY 2012-13Budget. $5,238
The Budget includes an increase in contractuals for translators and other miscellaneouscharges. $3,200
Municipal Court Security Fund
Revenue Changes Dollars
The Budget includes a decrease in revenue of $128,576 due to the significant decline inthe number of cases filed at the court. ($128,576)
Expenditure Changes FTEs Dollars
Municipal Court Special ProgramsIncluded in the Budget is a decrease in expenditures of $171,215. Funding available forCourt Services Officers has been reduced due to a significant decline in revenue. Inaddition to reduced revenue, expenses have to be further reduced to cover prior yeardeficit. ($171,215)
Municipal Court Technology Manager Fund
Revenue Changes Dollars
The Budget includes a decrease in revenue of $169,727 due to the significant decline inthe number of cases filed at the court. ($169,727)
Expenditure Changes FTEs Dollars
Municipal Court Special ProgramsIncluded in the Budget is an increase of $34,848. This increase is required for casemanagement consultant services, software enhancement upgrades and one-timeinterface costs associated with electronic ticket writers. $34,848
Municipal Court Traffic Safety Fund
Revenue Changes Dollars
The Budget includes an increase in revenue of $445,815. This increase is projected dueto the relocation of existing cameras and installation of additional cameras. $445,815
2012-13 Proposed Budget, Austin, TX
82 | Volume I
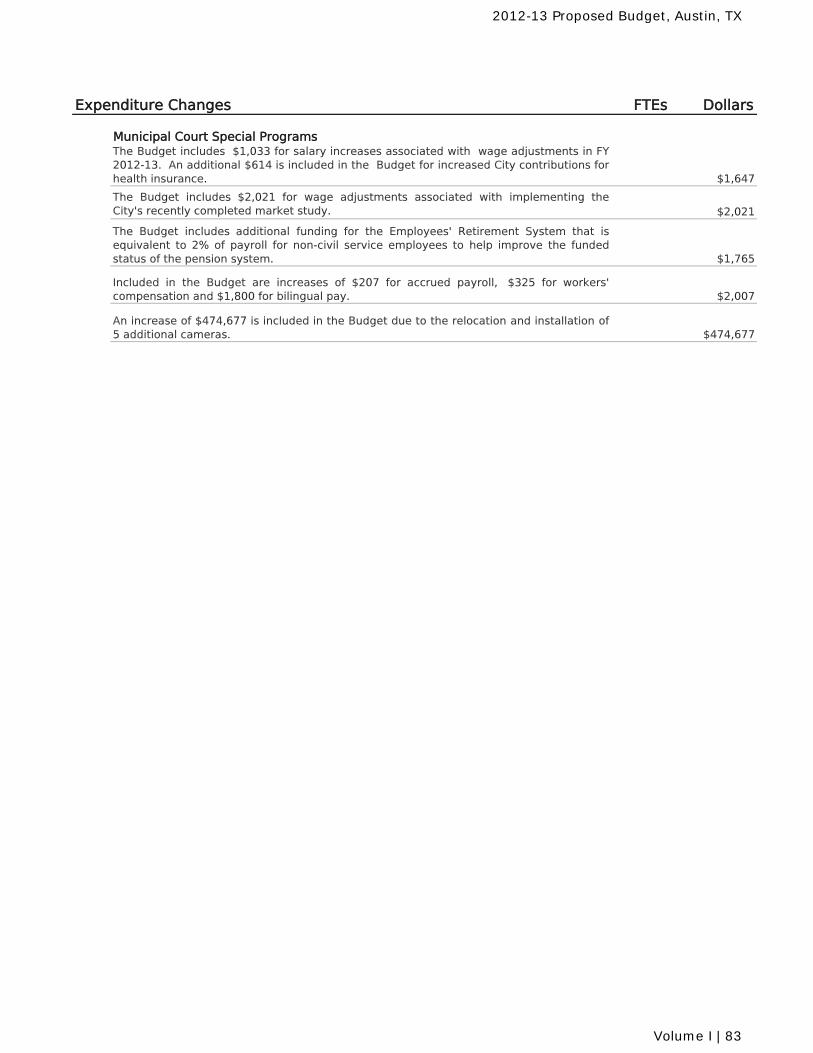
Expenditure Changes FTEs Dollars
Municipal Court Special ProgramsThe Budget includes $1,033 for salary increases associated with wage adjustments in FY2012-13. An additional $614 is included in the Budget for increased City contributions forhealth insurance. $1,647
The Budget includes $2,021 for wage adjustments associated with implementing theCity's recently completed market study. $2,021
The Budget includes additional funding for the Employees' Retirement System that isequivalent to 2% of payroll for non-civil service employees to help improve the fundedstatus of the pension system. $1,765
Included in the Budget are increases of $207 for accrued payroll, $325 for workers'compensation and $1,800 for bilingual pay. $2,007
An increase of $474,677 is included in the Budget due to the relocation and installation of5 additional cameras. $474,677
2012-13 Proposed Budget, Austin, TX
Volume I | 83
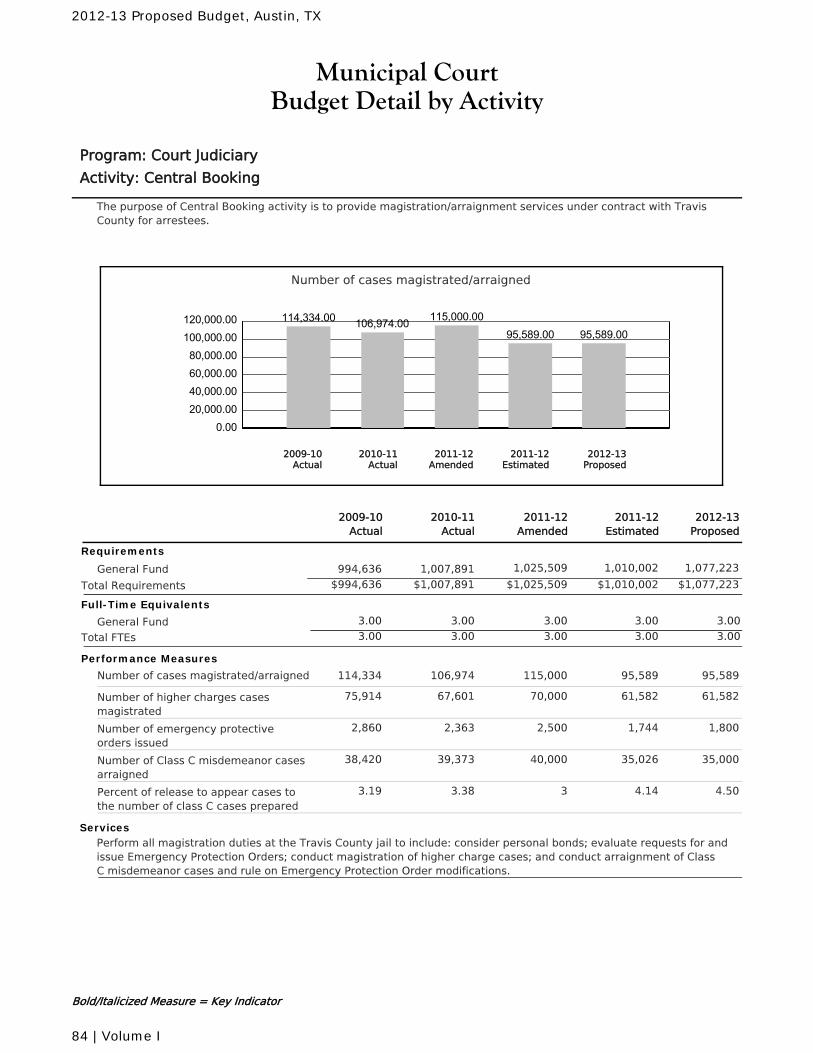
Municipal CourtBudget Detail by Activity
Program: Court Judiciary
Activity: Central Booking
The purpose of Central Booking activity is to provide magistration/arraignment services under contract with TravisCounty for arrestees.
Number of cases magistrated/arraigned
0.0020,000.0040,000.0060,000.0080,000.00
100,000.00120,000.00 114,334.00 106,974.00 115,000.00
95,589.00 95,589.00
2010-11Actual
2012-13Proposed
2011-12Amended
2011-12Estimated
2009-10Actual
2011-12Amended
2010-11Actual
2011-12Estimated
2012-13Proposed
2009-10Actual
Requirements
General Fund 1,025,509 1,010,002 1,077,2231,007,891994,636
$1,025,509 $1,010,002 $1,077,223Total Requirements $1,007,891$994,636
Full-Time Equivalents
General Fund 3.00 3.00 3.00 3.003.00
Total FTEs 3.00 3.00 3.00 3.003.00
Performance Measures
Number of cases magistrated/arraigned 115,000106,974 95,589 95,589114,334
Number of higher charges casesmagistrated
70,00067,601 61,582 61,58275,914
Number of emergency protectiveorders issued
2,5002,363 1,744 1,8002,860
Number of Class C misdemeanor casesarraigned
40,00039,373 35,026 35,00038,420
Percent of release to appear cases tothe number of class C cases prepared
33.38 4.14 4.503.19
ServicesPerform all magistration duties at the Travis County jail to include: consider personal bonds; evaluate requests for andissue Emergency Protection Orders; conduct magistration of higher charge cases; and conduct arraignment of ClassC misdemeanor cases and rule on Emergency Protection Order modifications.
Bold/Italicized Measure = Key Indicator
2012-13 Proposed Budget, Austin, TX
84 | Volume I
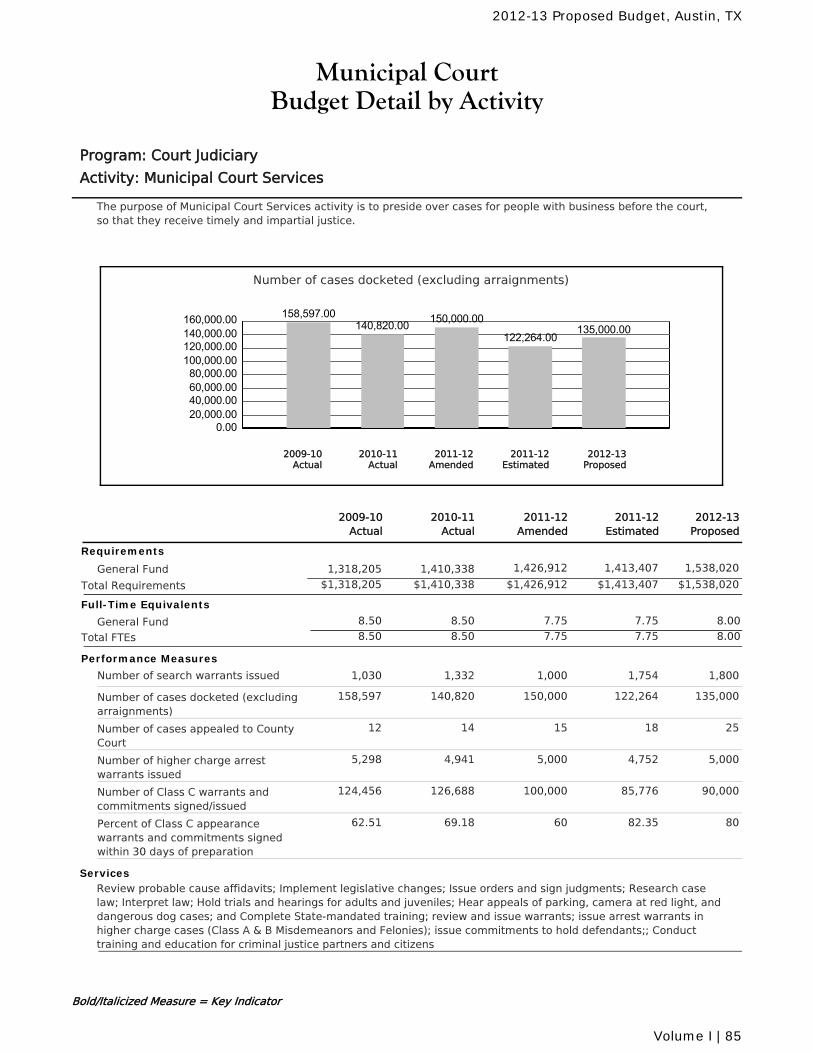
Municipal CourtBudget Detail by Activity
Program: Court Judiciary
Activity: Municipal Court Services
The purpose of Municipal Court Services activity is to preside over cases for people with business before the court,so that they receive timely and impartial justice.
Number of cases docketed (excluding arraignments)
0.0020,000.0040,000.0060,000.0080,000.00
100,000.00120,000.00140,000.00160,000.00 158,597.00
140,820.00 150,000.00
122,264.00135,000.00
2010-11Actual
2012-13Proposed
2011-12Amended
2011-12Estimated
2009-10Actual
2011-12Amended
2010-11Actual
2011-12Estimated
2012-13Proposed
2009-10Actual
Requirements
General Fund 1,426,912 1,413,407 1,538,0201,410,3381,318,205
$1,426,912 $1,413,407 $1,538,020Total Requirements $1,410,338$1,318,205
Full-Time Equivalents
General Fund 8.50 7.75 7.75 8.008.50
Total FTEs 8.50 7.75 7.75 8.008.50
Performance Measures
Number of search warrants issued 1,0001,332 1,754 1,8001,030
Number of cases docketed (excludingarraignments)
150,000140,820 122,264 135,000158,597
Number of cases appealed to CountyCourt
1514 18 2512
Number of higher charge arrestwarrants issued
5,0004,941 4,752 5,0005,298
Number of Class C warrants andcommitments signed/issued
100,000126,688 85,776 90,000124,456
Percent of Class C appearancewarrants and commitments signedwithin 30 days of preparation
6069.18 82.35 8062.51
ServicesReview probable cause affidavits; Implement legislative changes; Issue orders and sign judgments; Research caselaw; Interpret law; Hold trials and hearings for adults and juveniles; Hear appeals of parking, camera at red light, anddangerous dog cases; and Complete State-mandated training; review and issue warrants; issue arrest warrants inhigher charge cases (Class A & B Misdemeanors and Felonies); issue commitments to hold defendants;; Conducttraining and education for criminal justice partners and citizens
Bold/Italicized Measure = Key Indicator
2012-13 Proposed Budget, Austin, TX
Volume I | 85
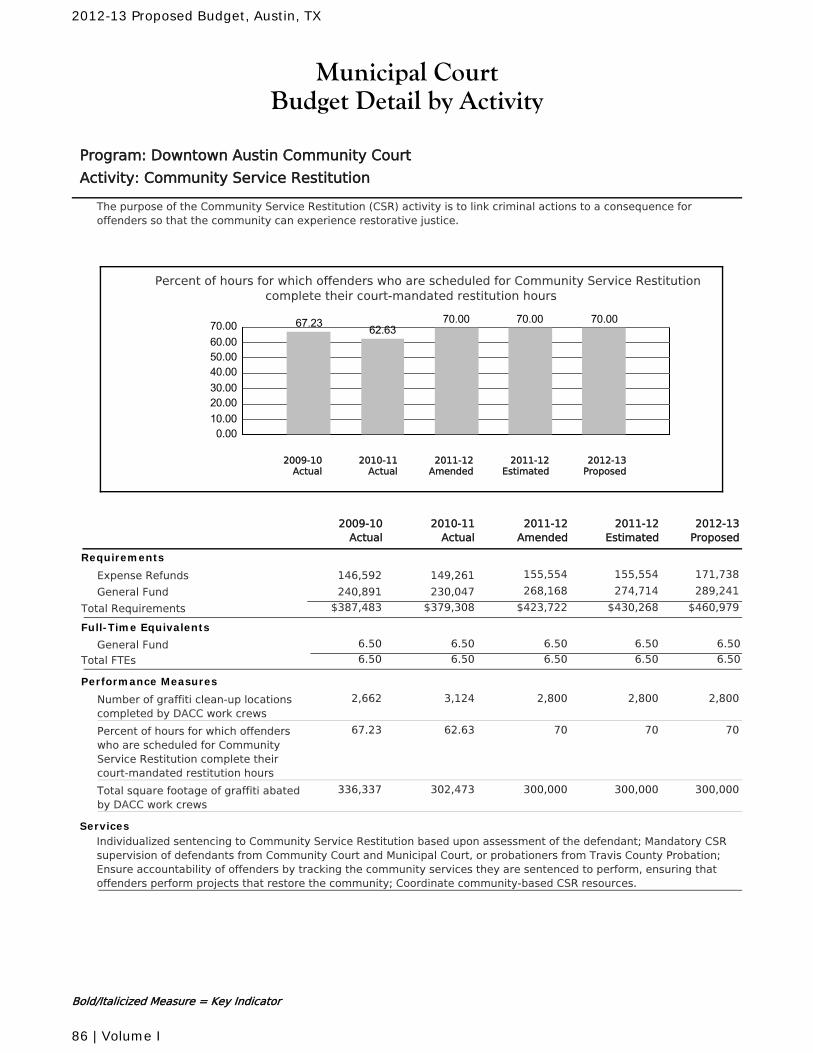
Municipal CourtBudget Detail by Activity
Program: Downtown Austin Community Court
Activity: Community Service Restitution
The purpose of the Community Service Restitution (CSR) activity is to link criminal actions to a consequence foroffenders so that the community can experience restorative justice.
Percent of hours for which offenders who are scheduled for Community Service Restitutioncomplete their court-mandated restitution hours
0.0010.0020.0030.0040.0050.0060.0070.00 67.23 62.63
70.00 70.00 70.00
2010-11Actual
2012-13Proposed
2011-12Amended
2011-12Estimated
2009-10Actual
2011-12Amended
2010-11Actual
2011-12Estimated
2012-13Proposed
2009-10Actual
Requirements
Expense Refunds 155,554 155,554 171,738149,261146,592
General Fund 268,168 274,714 289,241230,047240,891
$423,722 $430,268 $460,979Total Requirements $379,308$387,483
Full-Time Equivalents
General Fund 6.50 6.50 6.50 6.506.50
Total FTEs 6.50 6.50 6.50 6.506.50
Performance Measures
Number of graffiti clean-up locationscompleted by DACC work crews
2,8003,124 2,800 2,8002,662
Percent of hours for which offenderswho are scheduled for CommunityService Restitution complete theircourt-mandated restitution hours
7062.63 70 7067.23
Total square footage of graffiti abatedby DACC work crews
300,000302,473 300,000 300,000336,337
ServicesIndividualized sentencing to Community Service Restitution based upon assessment of the defendant; Mandatory CSRsupervision of defendants from Community Court and Municipal Court, or probationers from Travis County Probation;Ensure accountability of offenders by tracking the community services they are sentenced to perform, ensuring thatoffenders perform projects that restore the community; Coordinate community-based CSR resources.
Bold/Italicized Measure = Key Indicator
2012-13 Proposed Budget, Austin, TX
86 | Volume I
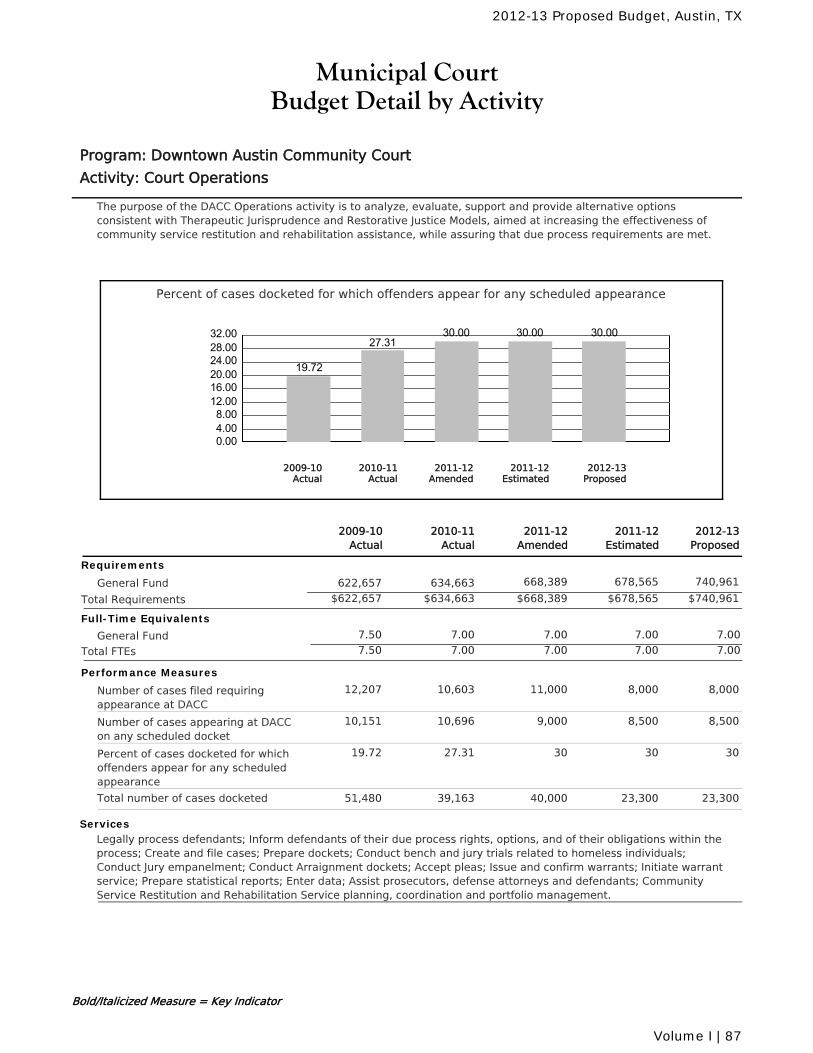
Municipal CourtBudget Detail by Activity
Program: Downtown Austin Community Court
Activity: Court Operations
The purpose of the DACC Operations activity is to analyze, evaluate, support and provide alternative optionsconsistent with Therapeutic Jurisprudence and Restorative Justice Models, aimed at increasing the effectiveness ofcommunity service restitution and rehabilitation assistance, while assuring that due process requirements are met.
Percent of cases docketed for which offenders appear for any scheduled appearance
0.004.008.00
12.0016.0020.0024.0028.0032.00
19.72
27.3130.00 30.00 30.00
2010-11Actual
2012-13Proposed
2011-12Amended
2011-12Estimated
2009-10Actual
2011-12Amended
2010-11Actual
2011-12Estimated
2012-13Proposed
2009-10Actual
Requirements
General Fund 668,389 678,565 740,961634,663622,657
$668,389 $678,565 $740,961Total Requirements $634,663$622,657
Full-Time Equivalents
General Fund 7.00 7.00 7.00 7.007.50
Total FTEs 7.00 7.00 7.00 7.007.50
Performance Measures
Number of cases filed requiringappearance at DACC
11,00010,603 8,000 8,00012,207
Number of cases appearing at DACCon any scheduled docket
9,00010,696 8,500 8,50010,151
Percent of cases docketed for whichoffenders appear for any scheduledappearance
3027.31 30 3019.72
Total number of cases docketed 40,00039,163 23,300 23,30051,480
ServicesLegally process defendants; Inform defendants of their due process rights, options, and of their obligations within theprocess; Create and file cases; Prepare dockets; Conduct bench and jury trials related to homeless individuals;Conduct Jury empanelment; Conduct Arraignment dockets; Accept pleas; Issue and confirm warrants; Initiate warrantservice; Prepare statistical reports; Enter data; Assist prosecutors, defense attorneys and defendants; CommunityService Restitution and Rehabilitation Service planning, coordination and portfolio management.
Bold/Italicized Measure = Key Indicator
2012-13 Proposed Budget, Austin, TX
Volume I | 87
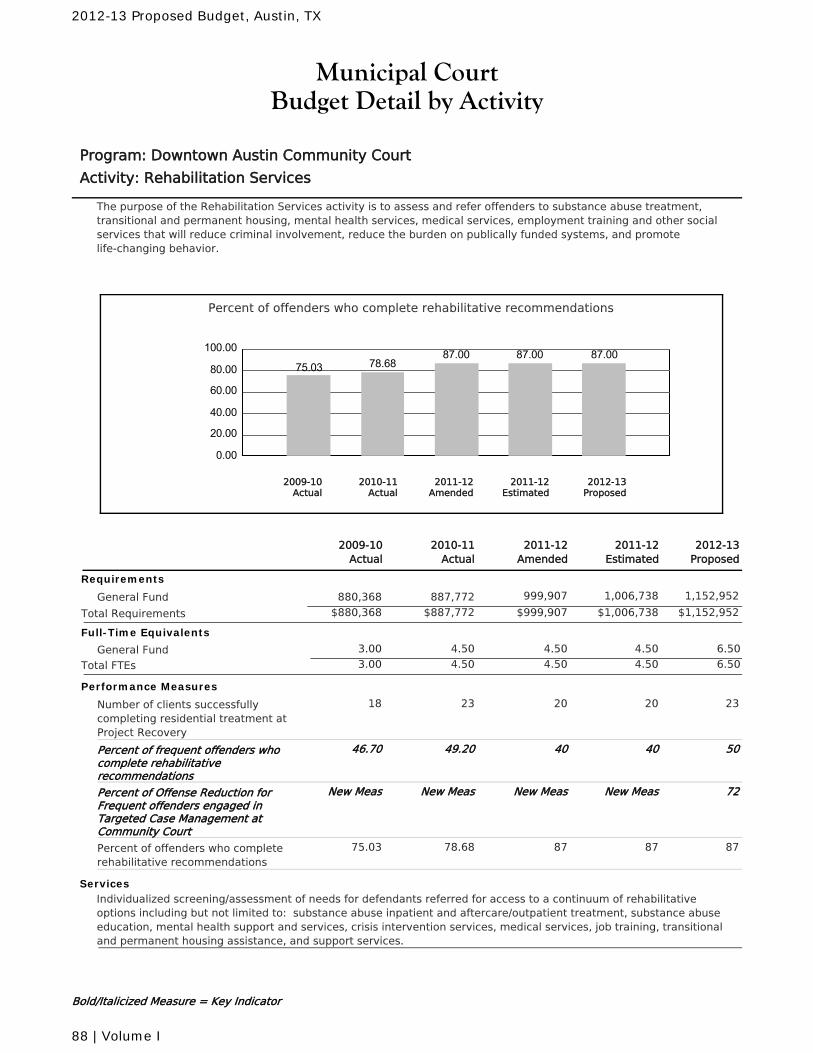
Municipal CourtBudget Detail by Activity
Program: Downtown Austin Community Court
Activity: Rehabilitation Services
The purpose of the Rehabilitation Services activity is to assess and refer offenders to substance abuse treatment,transitional and permanent housing, mental health services, medical services, employment training and other socialservices that will reduce criminal involvement, reduce the burden on publically funded systems, and promotelife-changing behavior.
Percent of offenders who complete rehabilitative recommendations
0.00
20.00
40.00
60.00
80.00
100.00
75.03 78.6887.00 87.00 87.00
2010-11Actual
2012-13Proposed
2011-12Amended
2011-12Estimated
2009-10Actual
2011-12Amended
2010-11Actual
2011-12Estimated
2012-13Proposed
2009-10Actual
Requirements
General Fund 999,907 1,006,738 1,152,952887,772880,368
$999,907 $1,006,738 $1,152,952Total Requirements $887,772$880,368
Full-Time Equivalents
General Fund 4.50 4.50 4.50 6.503.00
Total FTEs 4.50 4.50 4.50 6.503.00
Performance Measures
Number of clients successfullycompleting residential treatment atProject Recovery
2023 20 2318
Percent of frequent offenders whocomplete rehabilitativerecommendations
4049.20 40 5046.70
Percent of Offense Reduction forFrequent offenders engaged inTargeted Case Management atCommunity Court
New MeasNew Meas New Meas 72New Meas
Percent of offenders who completerehabilitative recommendations
8778.68 87 8775.03
ServicesIndividualized screening/assessment of needs for defendants referred for access to a continuum of rehabilitativeoptions including but not limited to: substance abuse inpatient and aftercare/outpatient treatment, substance abuseeducation, mental health support and services, crisis intervention services, medical services, job training, transitionaland permanent housing assistance, and support services.
Bold/Italicized Measure = Key Indicator
2012-13 Proposed Budget, Austin, TX
88 | Volume I
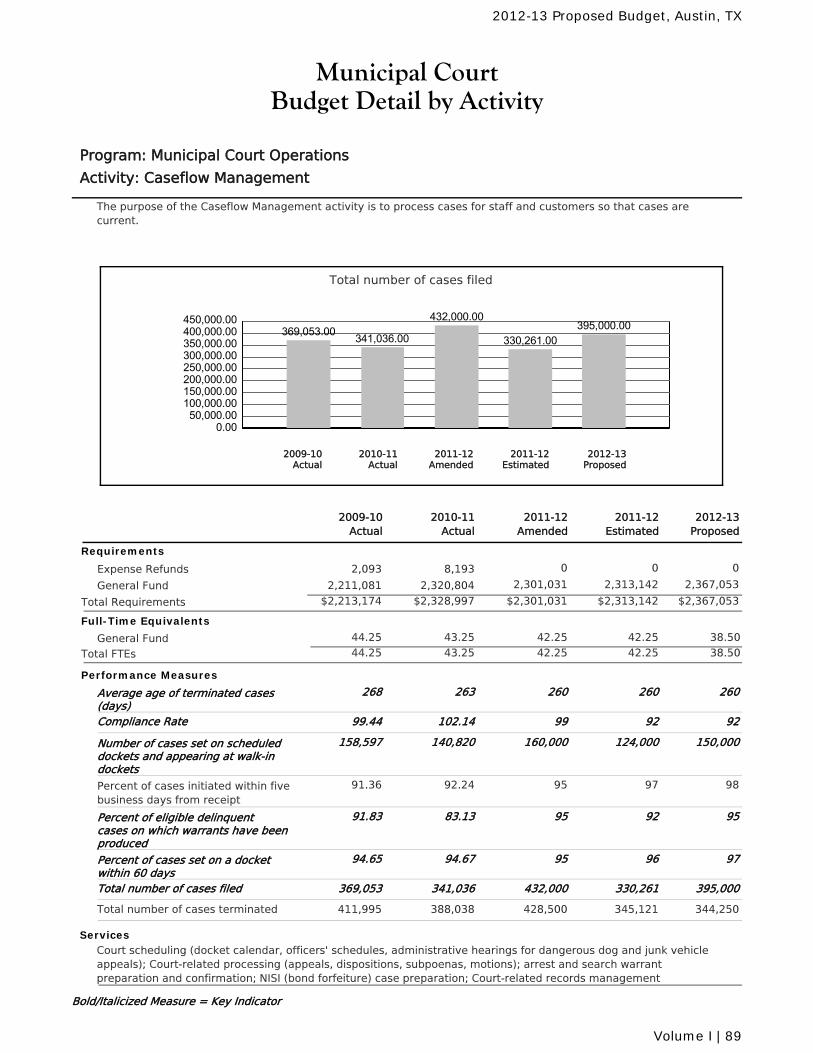
Municipal CourtBudget Detail by Activity
Program: Municipal Court Operations
Activity: Caseflow Management
The purpose of the Caseflow Management activity is to process cases for staff and customers so that cases arecurrent.
Total number of cases filed
0.0050,000.00
100,000.00150,000.00200,000.00250,000.00300,000.00350,000.00400,000.00450,000.00
369,053.00 341,036.00
432,000.00
330,261.00395,000.00
2010-11Actual
2012-13Proposed
2011-12Amended
2011-12Estimated
2009-10Actual
2011-12Amended
2010-11Actual
2011-12Estimated
2012-13Proposed
2009-10Actual
Requirements
Expense Refunds 0 0 08,1932,093
General Fund 2,301,031 2,313,142 2,367,0532,320,8042,211,081
$2,301,031 $2,313,142 $2,367,053Total Requirements $2,328,997$2,213,174
Full-Time Equivalents
General Fund 43.25 42.25 42.25 38.5044.25
Total FTEs 43.25 42.25 42.25 38.5044.25
Performance Measures
Average age of terminated cases(days)
260263 260 260268
Compliance Rate 99102.14 92 9299.44
Number of cases set on scheduleddockets and appearing at walk-indockets
160,000140,820 124,000 150,000158,597
Percent of cases initiated within fivebusiness days from receipt
9592.24 97 9891.36
Percent of eligible delinquentcases on which warrants have beenproduced
9583.13 92 9591.83
Percent of cases set on a docketwithin 60 days
9594.67 96 9794.65
Total number of cases filed 432,000341,036 330,261 395,000369,053
Total number of cases terminated 428,500388,038 345,121 344,250411,995
ServicesCourt scheduling (docket calendar, officers' schedules, administrative hearings for dangerous dog and junk vehicleappeals); Court-related processing (appeals, dispositions, subpoenas, motions); arrest and search warrantpreparation and confirmation; NISI (bond forfeiture) case preparation; Court-related records management
Bold/Italicized Measure = Key Indicator
2012-13 Proposed Budget, Austin, TX
Volume I | 89
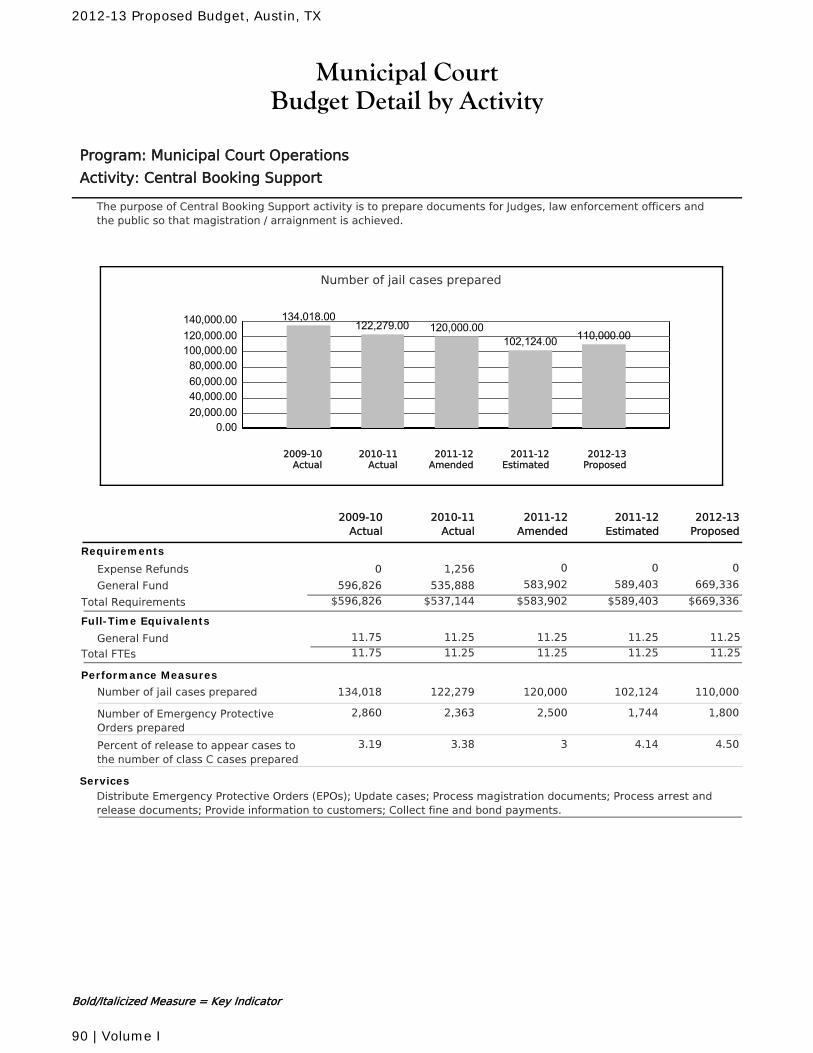
Municipal CourtBudget Detail by Activity
Program: Municipal Court Operations
Activity: Central Booking Support
The purpose of Central Booking Support activity is to prepare documents for Judges, law enforcement officers andthe public so that magistration / arraignment is achieved.
Number of jail cases prepared
0.0020,000.0040,000.0060,000.0080,000.00
100,000.00120,000.00140,000.00 134,018.00
122,279.00 120,000.00102,124.00 110,000.00
2010-11Actual
2012-13Proposed
2011-12Amended
2011-12Estimated
2009-10Actual
2011-12Amended
2010-11Actual
2011-12Estimated
2012-13Proposed
2009-10Actual
Requirements
Expense Refunds 0 0 01,2560
General Fund 583,902 589,403 669,336535,888596,826
$583,902 $589,403 $669,336Total Requirements $537,144$596,826
Full-Time Equivalents
General Fund 11.25 11.25 11.25 11.2511.75
Total FTEs 11.25 11.25 11.25 11.2511.75
Performance Measures
Number of jail cases prepared 120,000122,279 102,124 110,000134,018
Number of Emergency ProtectiveOrders prepared
2,5002,363 1,744 1,8002,860
Percent of release to appear cases tothe number of class C cases prepared
33.38 4.14 4.503.19
ServicesDistribute Emergency Protective Orders (EPOs); Update cases; Process magistration documents; Process arrest andrelease documents; Provide information to customers; Collect fine and bond payments.
Bold/Italicized Measure = Key Indicator
2012-13 Proposed Budget, Austin, TX
90 | Volume I
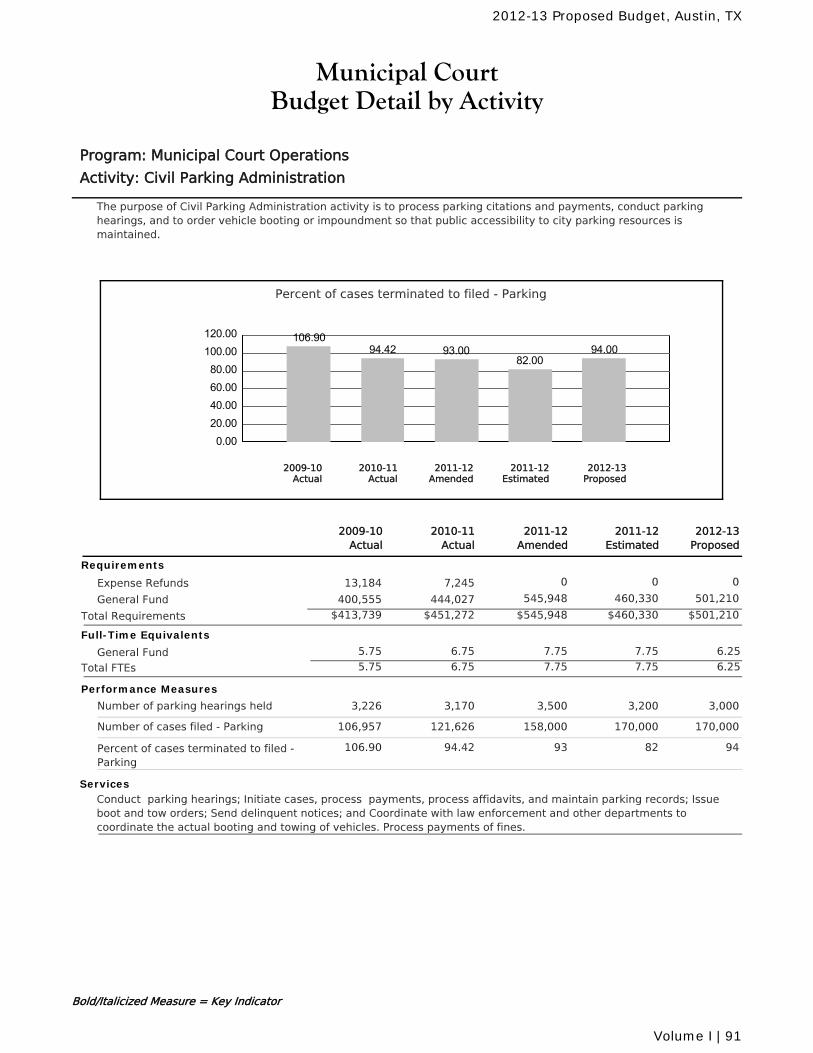
Municipal CourtBudget Detail by Activity
Program: Municipal Court Operations
Activity: Civil Parking Administration
The purpose of Civil Parking Administration activity is to process parking citations and payments, conduct parkinghearings, and to order vehicle booting or impoundment so that public accessibility to city parking resources ismaintained.
Percent of cases terminated to filed - Parking
0.0020.0040.0060.0080.00
100.00120.00 106.90
94.42 93.0082.00
94.00
2010-11Actual
2012-13Proposed
2011-12Amended
2011-12Estimated
2009-10Actual
2011-12Amended
2010-11Actual
2011-12Estimated
2012-13Proposed
2009-10Actual
Requirements
Expense Refunds 0 0 07,24513,184
General Fund 545,948 460,330 501,210444,027400,555
$545,948 $460,330 $501,210Total Requirements $451,272$413,739
Full-Time Equivalents
General Fund 6.75 7.75 7.75 6.255.75
Total FTEs 6.75 7.75 7.75 6.255.75
Performance Measures
Number of parking hearings held 3,5003,170 3,200 3,0003,226
Number of cases filed - Parking 158,000121,626 170,000 170,000106,957
Percent of cases terminated to filed -Parking
9394.42 82 94106.90
ServicesConduct parking hearings; Initiate cases, process payments, process affidavits, and maintain parking records; Issueboot and tow orders; Send delinquent notices; and Coordinate with law enforcement and other departments tocoordinate the actual booting and towing of vehicles. Process payments of fines.
Bold/Italicized Measure = Key Indicator
2012-13 Proposed Budget, Austin, TX
Volume I | 91
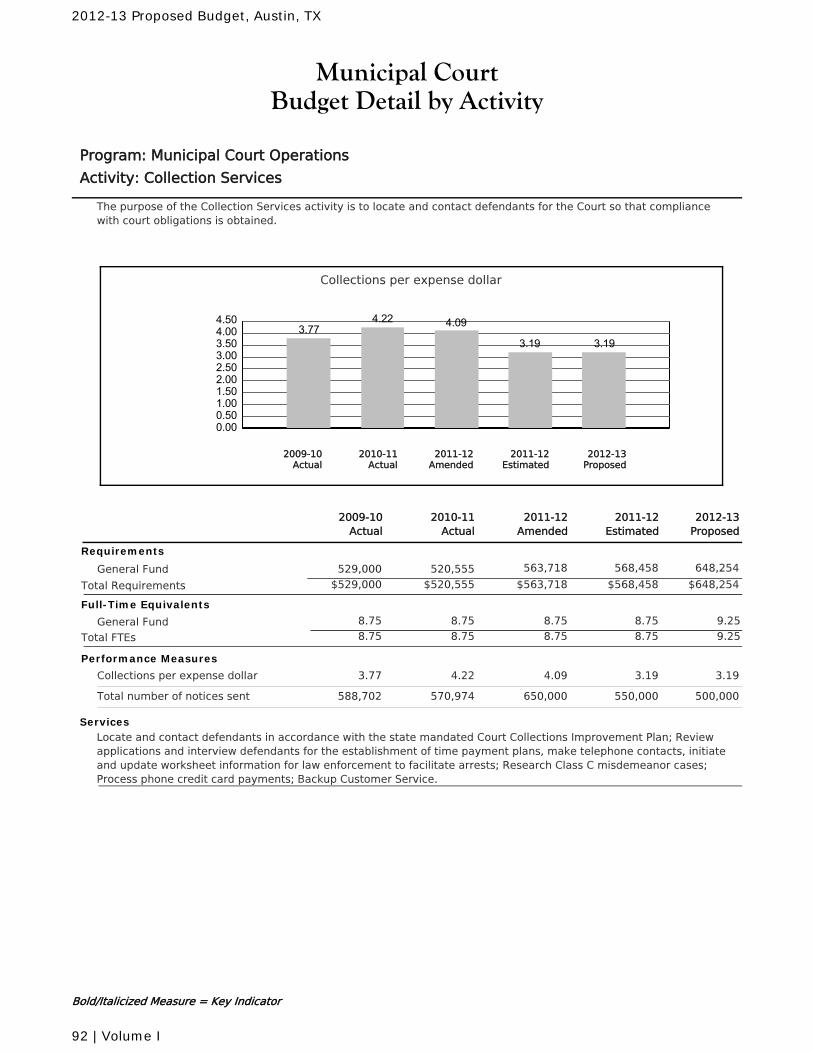
Municipal CourtBudget Detail by Activity
Program: Municipal Court Operations
Activity: Collection Services
The purpose of the Collection Services activity is to locate and contact defendants for the Court so that compliancewith court obligations is obtained.
Collections per expense dollar
0.000.501.001.502.002.503.003.504.004.50
3.774.22 4.09
3.19 3.19
2010-11Actual
2012-13Proposed
2011-12Amended
2011-12Estimated
2009-10Actual
2011-12Amended
2010-11Actual
2011-12Estimated
2012-13Proposed
2009-10Actual
Requirements
General Fund 563,718 568,458 648,254520,555529,000
$563,718 $568,458 $648,254Total Requirements $520,555$529,000
Full-Time Equivalents
General Fund 8.75 8.75 8.75 9.258.75
Total FTEs 8.75 8.75 8.75 9.258.75
Performance Measures
Collections per expense dollar 4.094.22 3.19 3.193.77
Total number of notices sent 650,000570,974 550,000 500,000588,702
ServicesLocate and contact defendants in accordance with the state mandated Court Collections Improvement Plan; Reviewapplications and interview defendants for the establishment of time payment plans, make telephone contacts, initiateand update worksheet information for law enforcement to facilitate arrests; Research Class C misdemeanor cases;Process phone credit card payments; Backup Customer Service.
Bold/Italicized Measure = Key Indicator
2012-13 Proposed Budget, Austin, TX
92 | Volume I
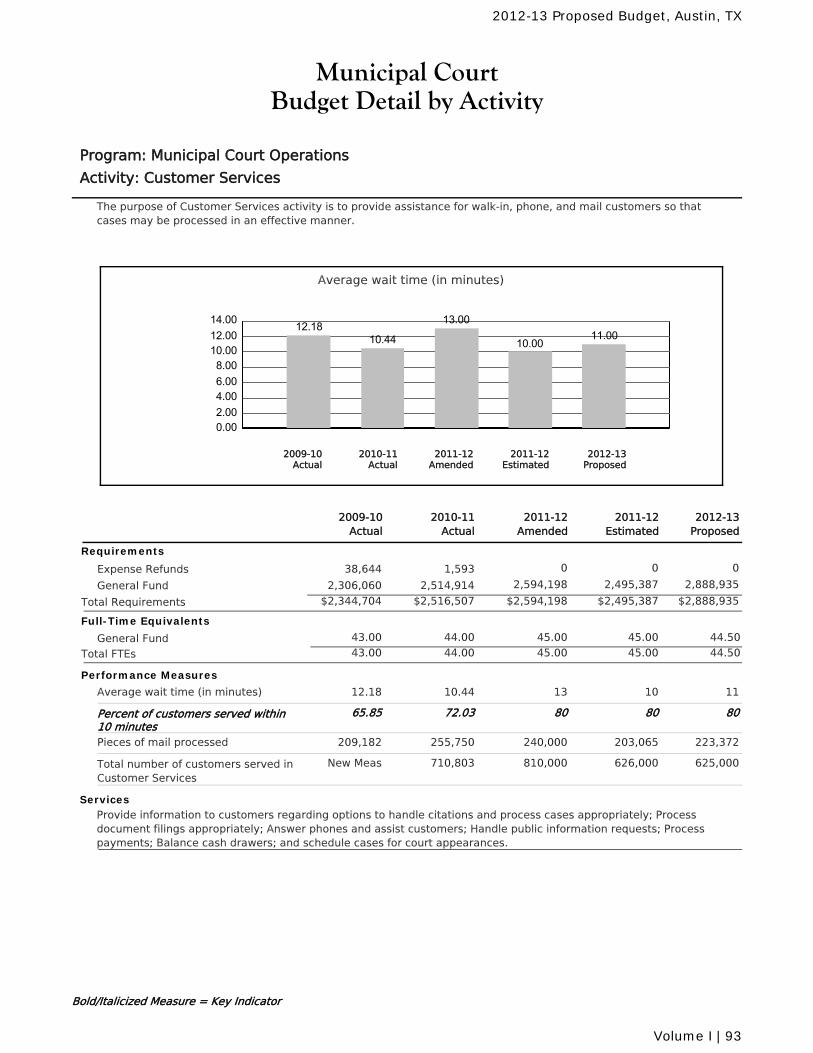
Municipal CourtBudget Detail by Activity
Program: Municipal Court Operations
Activity: Customer Services
The purpose of Customer Services activity is to provide assistance for walk-in, phone, and mail customers so thatcases may be processed in an effective manner.
Average wait time (in minutes)
0.002.004.006.008.00
10.0012.0014.00 12.18
10.44
13.00
10.0011.00
2010-11Actual
2012-13Proposed
2011-12Amended
2011-12Estimated
2009-10Actual
2011-12Amended
2010-11Actual
2011-12Estimated
2012-13Proposed
2009-10Actual
Requirements
Expense Refunds 0 0 01,59338,644
General Fund 2,594,198 2,495,387 2,888,9352,514,9142,306,060
$2,594,198 $2,495,387 $2,888,935Total Requirements $2,516,507$2,344,704
Full-Time Equivalents
General Fund 44.00 45.00 45.00 44.5043.00
Total FTEs 44.00 45.00 45.00 44.5043.00
Performance Measures
Average wait time (in minutes) 1310.44 10 1112.18
Percent of customers served within10 minutes
8072.03 80 8065.85
Pieces of mail processed 240,000255,750 203,065 223,372209,182
Total number of customers served inCustomer Services
810,000710,803 626,000 625,000New Meas
ServicesProvide information to customers regarding options to handle citations and process cases appropriately; Processdocument filings appropriately; Answer phones and assist customers; Handle public information requests; Processpayments; Balance cash drawers; and schedule cases for court appearances.
Bold/Italicized Measure = Key Indicator
2012-13 Proposed Budget, Austin, TX
Volume I | 93
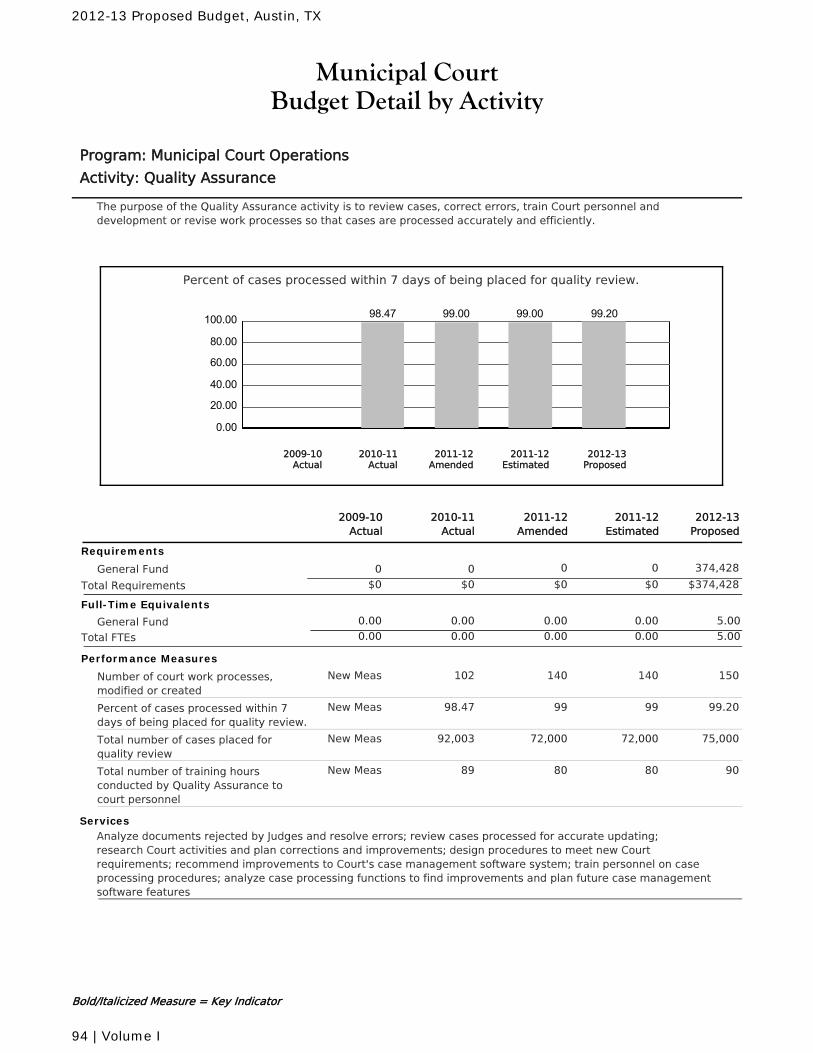
Municipal CourtBudget Detail by Activity
Program: Municipal Court Operations
Activity: Quality Assurance
The purpose of the Quality Assurance activity is to review cases, correct errors, train Court personnel anddevelopment or revise work processes so that cases are processed accurately and efficiently.
Percent of cases processed within 7 days of being placed for quality review.
0.00
20.00
40.00
60.00
80.00
100.00 98.47 99.00 99.00 99.20
2010-11Actual
2012-13Proposed
2011-12Amended
2011-12Estimated
2009-10Actual
2011-12Amended
2010-11Actual
2011-12Estimated
2012-13Proposed
2009-10Actual
Requirements
General Fund 0 0 374,42800
$0 $0 $374,428Total Requirements $0$0
Full-Time Equivalents
General Fund 0.00 0.00 0.00 5.000.00
Total FTEs 0.00 0.00 0.00 5.000.00
Performance Measures
Number of court work processes,modified or created
140102 140 150New Meas
Percent of cases processed within 7days of being placed for quality review.
9998.47 99 99.20New Meas
Total number of cases placed forquality review
72,00092,003 72,000 75,000New Meas
Total number of training hoursconducted by Quality Assurance tocourt personnel
8089 80 90New Meas
ServicesAnalyze documents rejected by Judges and resolve errors; review cases processed for accurate updating;research Court activities and plan corrections and improvements; design procedures to meet new Courtrequirements; recommend improvements to Court's case management software system; train personnel on caseprocessing procedures; analyze case processing functions to find improvements and plan future case managementsoftware features
Bold/Italicized Measure = Key Indicator
2012-13 Proposed Budget, Austin, TX
94 | Volume I
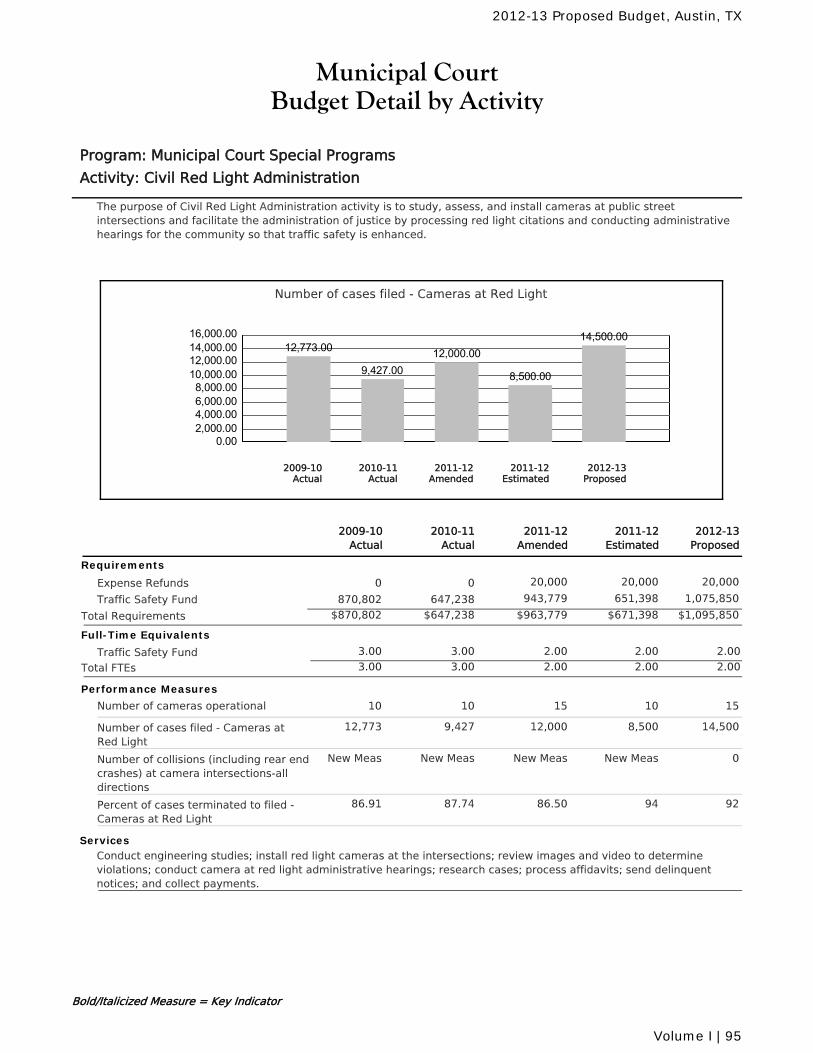
Municipal CourtBudget Detail by Activity
Program: Municipal Court Special Programs
Activity: Civil Red Light Administration
The purpose of Civil Red Light Administration activity is to study, assess, and install cameras at public streetintersections and facilitate the administration of justice by processing red light citations and conducting administrativehearings for the community so that traffic safety is enhanced.
Number of cases filed - Cameras at Red Light
0.002,000.004,000.006,000.008,000.00
10,000.0012,000.0014,000.0016,000.00
12,773.00
9,427.0012,000.00
8,500.00
14,500.00
2010-11Actual
2012-13Proposed
2011-12Amended
2011-12Estimated
2009-10Actual
2011-12Amended
2010-11Actual
2011-12Estimated
2012-13Proposed
2009-10Actual
Requirements
Expense Refunds 20,000 20,000 20,00000
Traffic Safety Fund 943,779 651,398 1,075,850647,238870,802
$963,779 $671,398 $1,095,850Total Requirements $647,238$870,802
Full-Time Equivalents
Traffic Safety Fund 3.00 2.00 2.00 2.003.00
Total FTEs 3.00 2.00 2.00 2.003.00
Performance Measures
Number of cameras operational 1510 10 1510
Number of cases filed - Cameras atRed Light
12,0009,427 8,500 14,50012,773
Number of collisions (including rear endcrashes) at camera intersections-alldirections
New MeasNew Meas New Meas 0New Meas
Percent of cases terminated to filed -Cameras at Red Light
86.5087.74 94 9286.91
ServicesConduct engineering studies; install red light cameras at the intersections; review images and video to determineviolations; conduct camera at red light administrative hearings; research cases; process affidavits; send delinquentnotices; and collect payments.
Bold/Italicized Measure = Key Indicator
2012-13 Proposed Budget, Austin, TX
Volume I | 95
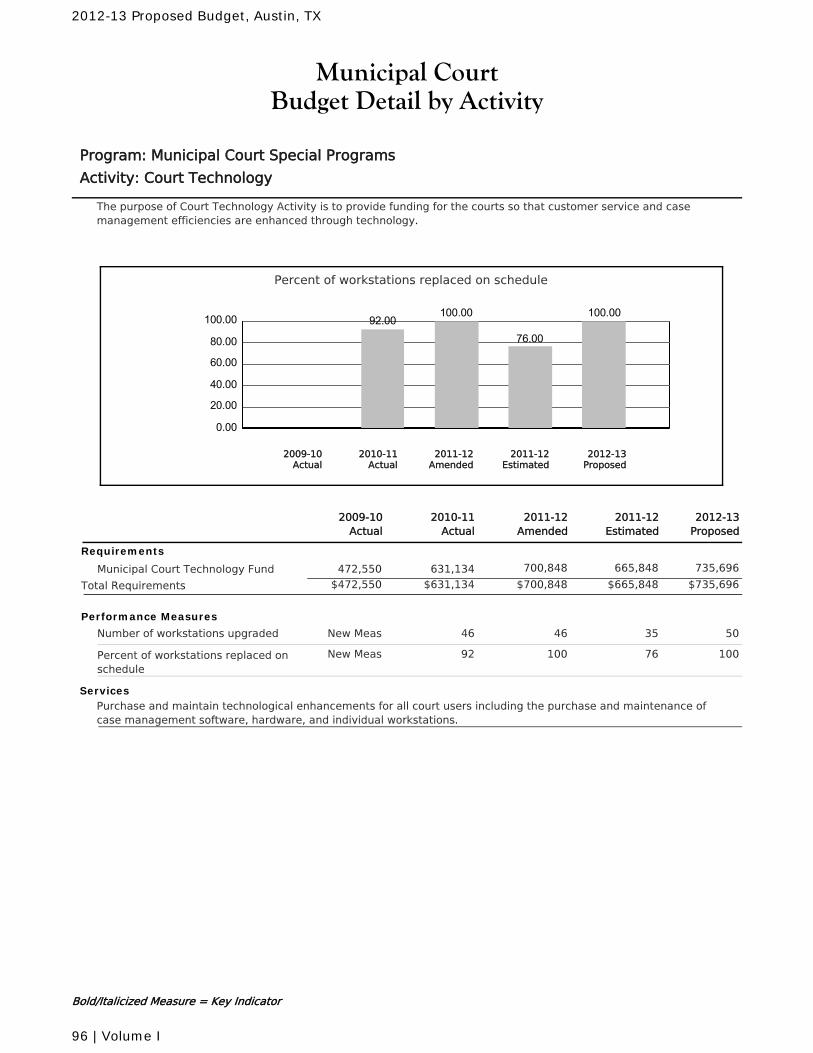
Municipal CourtBudget Detail by Activity
Program: Municipal Court Special Programs
Activity: Court Technology
The purpose of Court Technology Activity is to provide funding for the courts so that customer service and casemanagement efficiencies are enhanced through technology.
Percent of workstations replaced on schedule
0.00
20.00
40.00
60.00
80.00
100.00 92.00100.00
76.00
100.00
2010-11Actual
2012-13Proposed
2011-12Amended
2011-12Estimated
2009-10Actual
2011-12Amended
2010-11Actual
2011-12Estimated
2012-13Proposed
2009-10Actual
Requirements
Municipal Court Technology Fund 700,848 665,848 735,696631,134472,550
$700,848 $665,848 $735,696Total Requirements $631,134$472,550
Performance Measures
Number of workstations upgraded 4646 35 50New Meas
Percent of workstations replaced onschedule
10092 76 100New Meas
ServicesPurchase and maintain technological enhancements for all court users including the purchase and maintenance ofcase management software, hardware, and individual workstations.
Bold/Italicized Measure = Key Indicator
2012-13 Proposed Budget, Austin, TX
96 | Volume I
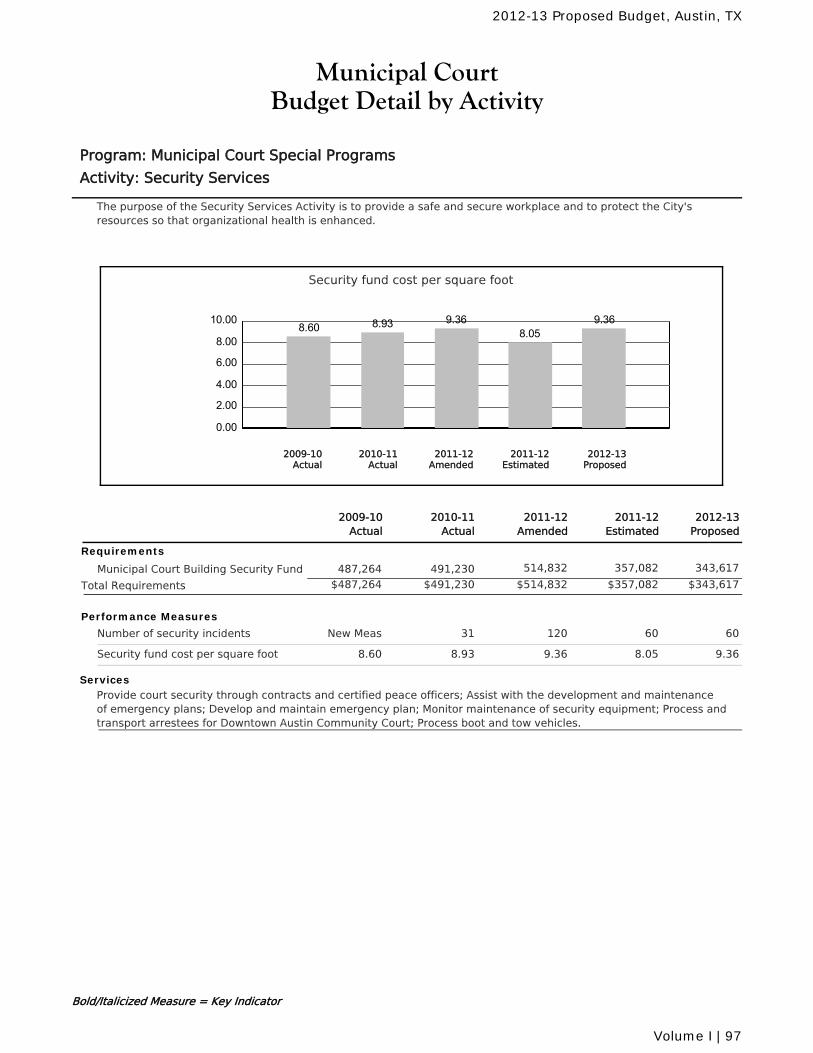
Municipal CourtBudget Detail by Activity
Program: Municipal Court Special Programs
Activity: Security Services
The purpose of the Security Services Activity is to provide a safe and secure workplace and to protect the City'sresources so that organizational health is enhanced.
Security fund cost per square foot
0.00
2.00
4.00
6.00
8.00
10.008.60 8.93 9.36
8.059.36
2010-11Actual
2012-13Proposed
2011-12Amended
2011-12Estimated
2009-10Actual
2011-12Amended
2010-11Actual
2011-12Estimated
2012-13Proposed
2009-10Actual
Requirements
Municipal Court Building Security Fund 514,832 357,082 343,617491,230487,264
$514,832 $357,082 $343,617Total Requirements $491,230$487,264
Performance Measures
Number of security incidents 12031 60 60New Meas
Security fund cost per square foot 9.368.93 8.05 9.368.60
ServicesProvide court security through contracts and certified peace officers; Assist with the development and maintenanceof emergency plans; Develop and maintain emergency plan; Monitor maintenance of security equipment; Process andtransport arrestees for Downtown Austin Community Court; Process boot and tow vehicles.
Bold/Italicized Measure = Key Indicator
2012-13 Proposed Budget, Austin, TX
Volume I | 97
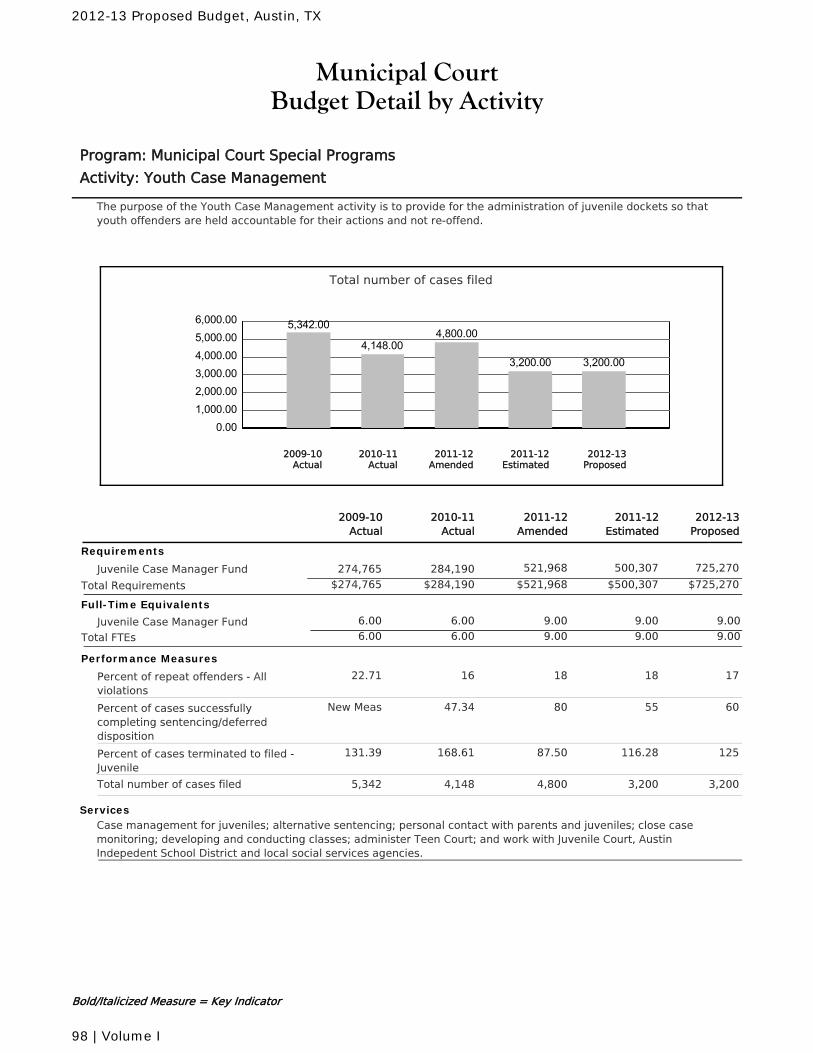
Municipal CourtBudget Detail by Activity
Program: Municipal Court Special Programs
Activity: Youth Case Management
The purpose of the Youth Case Management activity is to provide for the administration of juvenile dockets so thatyouth offenders are held accountable for their actions and not re-offend.
Total number of cases filed
0.001,000.002,000.003,000.004,000.005,000.006,000.00 5,342.00
4,148.004,800.00
3,200.00 3,200.00
2010-11Actual
2012-13Proposed
2011-12Amended
2011-12Estimated
2009-10Actual
2011-12Amended
2010-11Actual
2011-12Estimated
2012-13Proposed
2009-10Actual
Requirements
Juvenile Case Manager Fund 521,968 500,307 725,270284,190274,765
$521,968 $500,307 $725,270Total Requirements $284,190$274,765
Full-Time Equivalents
Juvenile Case Manager Fund 6.00 9.00 9.00 9.006.00
Total FTEs 6.00 9.00 9.00 9.006.00
Performance Measures
Percent of repeat offenders - Allviolations
1816 18 1722.71
Percent of cases successfullycompleting sentencing/deferreddisposition
8047.34 55 60New Meas
Percent of cases terminated to filed -Juvenile
87.50168.61 116.28 125131.39
Total number of cases filed 4,8004,148 3,200 3,2005,342
ServicesCase management for juveniles; alternative sentencing; personal contact with parents and juveniles; close casemonitoring; developing and conducting classes; administer Teen Court; and work with Juvenile Court, AustinIndepedent School District and local social services agencies.
Bold/Italicized Measure = Key Indicator
2012-13 Proposed Budget, Austin, TX
98 | Volume I
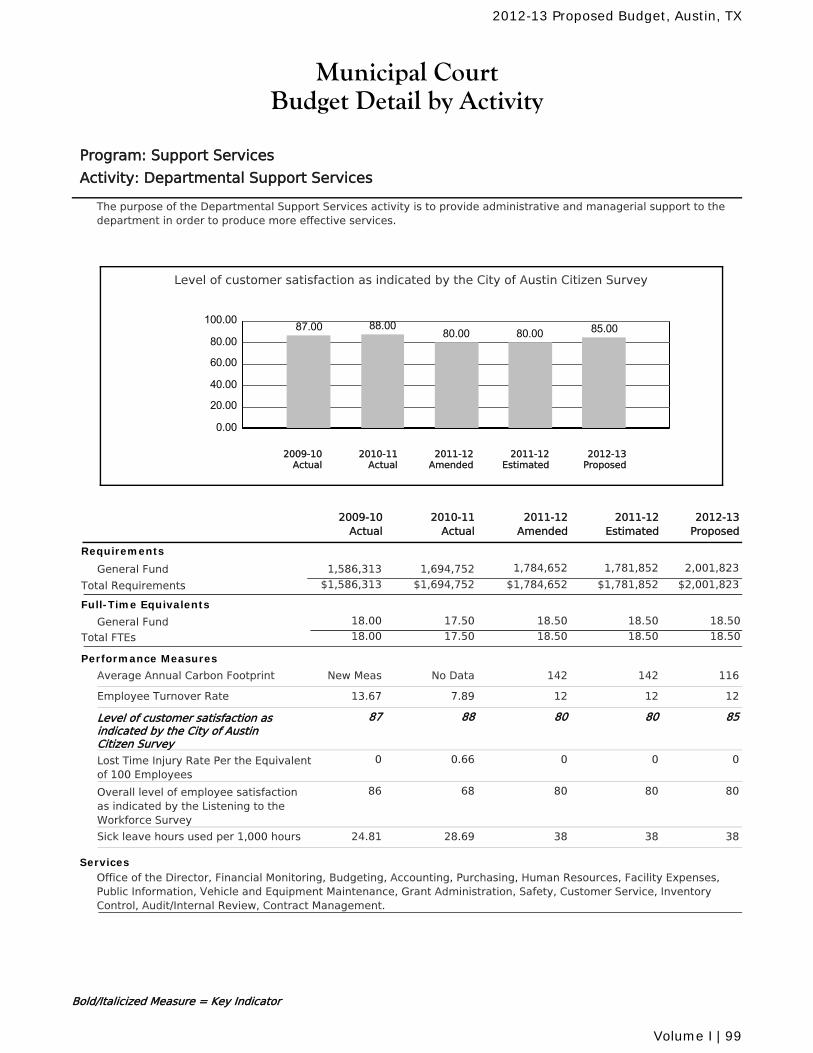
Municipal CourtBudget Detail by Activity
Program: Support Services
Activity: Departmental Support Services
The purpose of the Departmental Support Services activity is to provide administrative and managerial support to thedepartment in order to produce more effective services.
Level of customer satisfaction as indicated by the City of Austin Citizen Survey
0.00
20.00
40.00
60.00
80.00
100.00 87.00 88.0080.00 80.00 85.00
2010-11Actual
2012-13Proposed
2011-12Amended
2011-12Estimated
2009-10Actual
2011-12Amended
2010-11Actual
2011-12Estimated
2012-13Proposed
2009-10Actual
Requirements
General Fund 1,784,652 1,781,852 2,001,8231,694,7521,586,313
$1,784,652 $1,781,852 $2,001,823Total Requirements $1,694,752$1,586,313
Full-Time Equivalents
General Fund 17.50 18.50 18.50 18.5018.00
Total FTEs 17.50 18.50 18.50 18.5018.00
Performance Measures
Average Annual Carbon Footprint 142No Data 142 116New Meas
Employee Turnover Rate 127.89 12 1213.67
Level of customer satisfaction asindicated by the City of AustinCitizen Survey
8088 80 8587
Lost Time Injury Rate Per the Equivalentof 100 Employees
00.66 0 00
Overall level of employee satisfactionas indicated by the Listening to theWorkforce Survey
8068 80 8086
Sick leave hours used per 1,000 hours 3828.69 38 3824.81
ServicesOffice of the Director, Financial Monitoring, Budgeting, Accounting, Purchasing, Human Resources, Facility Expenses,Public Information, Vehicle and Equipment Maintenance, Grant Administration, Safety, Customer Service, InventoryControl, Audit/Internal Review, Contract Management.
Bold/Italicized Measure = Key Indicator
2012-13 Proposed Budget, Austin, TX
Volume I | 99
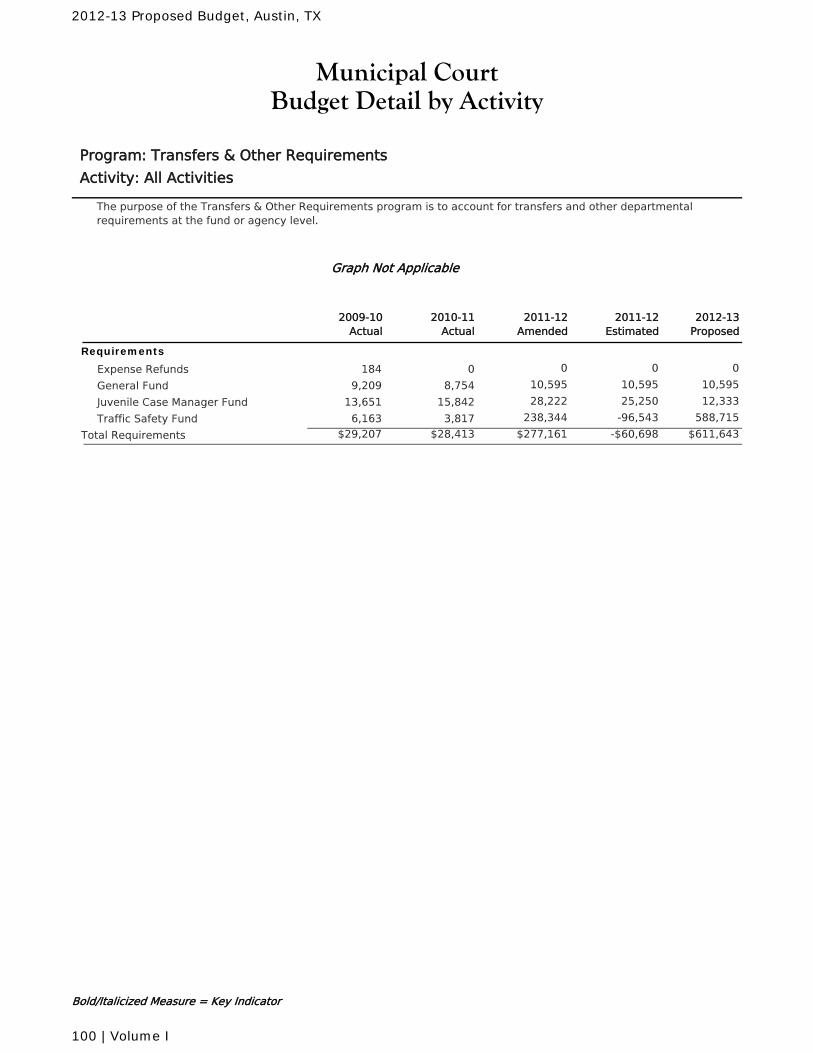
Municipal CourtBudget Detail by Activity
Program: Transfers & Other Requirements
Activity: All Activities
The purpose of the Transfers & Other Requirements program is to account for transfers and other departmentalrequirements at the fund or agency level.
Graph Not Applicable
2011-12Amended
2010-11Actual
2011-12Estimated
2012-13Proposed
2009-10Actual
Requirements
Expense Refunds 0 0 00184
General Fund 10,595 10,595 10,5958,7549,209
Juvenile Case Manager Fund 28,222 25,250 12,33315,84213,651
Traffic Safety Fund 238,344 -96,543 588,7153,8176,163
$277,161 -$60,698 $611,643Total Requirements $28,413$29,207
Bold/Italicized Measure = Key Indicator
2012-13 Proposed Budget, Austin, TX
100 | Volume I
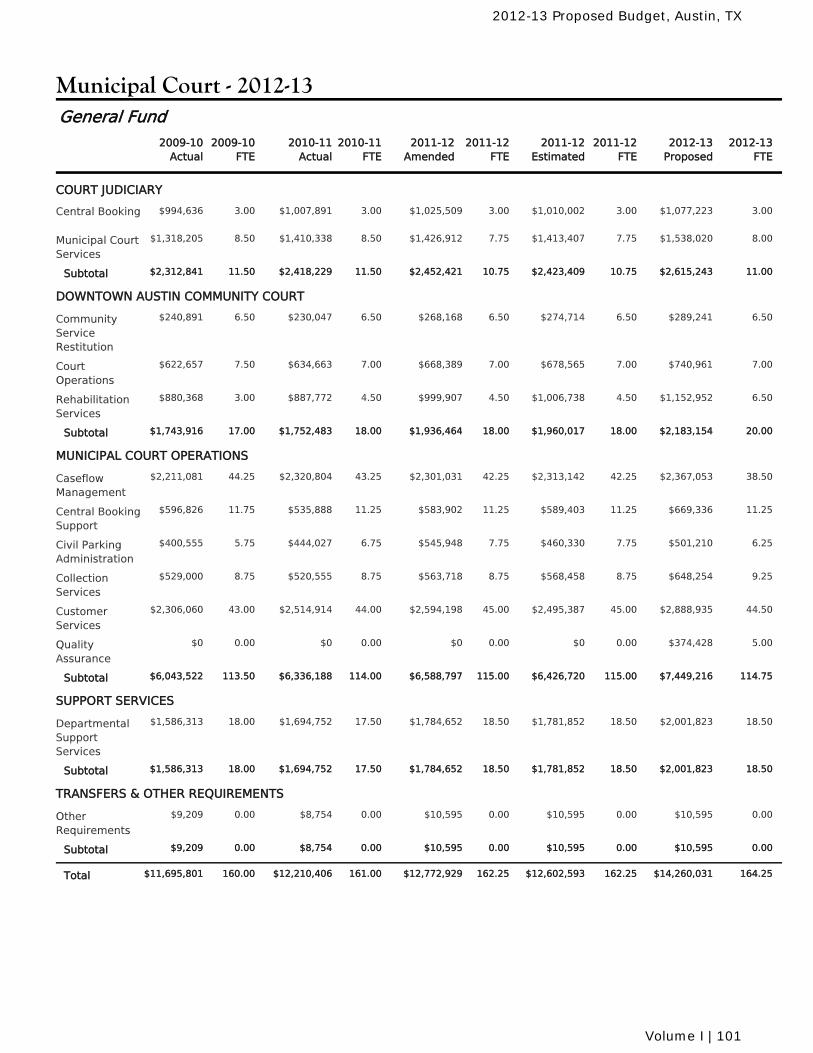
Municipal Court - 2012-13
2010-11Actual
2010-11FTE
2011-12Amended
2011-12FTE
2011-12Estimated
2011-12FTE
2009-10Actual
2009-10FTE
2012-13Proposed
2012-13FTE
General Fund
COURT JUDICIARY
$1,007,891 3.00 $1,025,509 3.00 $1,010,002 3.00Central Booking 3.00 $1,077,223 3.00$994,636
$1,410,338 8.50 $1,426,912 7.75 $1,413,407 7.75Municipal CourtServices
8.50 $1,538,020 8.00$1,318,205
$2,418,229 11.50 $2,452,421 10.75 $2,423,409 10.75Subtotal 11.50 $2,615,243 11.00$2,312,841
DOWNTOWN AUSTIN COMMUNITY COURT
$230,047 6.50 $268,168 6.50 $274,714 6.50CommunityServiceRestitution
6.50 $289,241 6.50$240,891
$634,663 7.00 $668,389 7.00 $678,565 7.00CourtOperations
7.50 $740,961 7.00$622,657
$887,772 4.50 $999,907 4.50 $1,006,738 4.50RehabilitationServices
3.00 $1,152,952 6.50$880,368
$1,752,483 18.00 $1,936,464 18.00 $1,960,017 18.00Subtotal 17.00 $2,183,154 20.00$1,743,916
MUNICIPAL COURT OPERATIONS
$2,320,804 43.25 $2,301,031 42.25 $2,313,142 42.25CaseflowManagement
44.25 $2,367,053 38.50$2,211,081
$535,888 11.25 $583,902 11.25 $589,403 11.25Central BookingSupport
11.75 $669,336 11.25$596,826
$444,027 6.75 $545,948 7.75 $460,330 7.75Civil ParkingAdministration
5.75 $501,210 6.25$400,555
$520,555 8.75 $563,718 8.75 $568,458 8.75CollectionServices
8.75 $648,254 9.25$529,000
$2,514,914 44.00 $2,594,198 45.00 $2,495,387 45.00CustomerServices
43.00 $2,888,935 44.50$2,306,060
$0 0.00 $0 0.00 $0 0.00QualityAssurance
0.00 $374,428 5.00$0
$6,336,188 114.00 $6,588,797 115.00 $6,426,720 115.00Subtotal 113.50 $7,449,216 114.75$6,043,522
SUPPORT SERVICES
$1,694,752 17.50 $1,784,652 18.50 $1,781,852 18.50DepartmentalSupportServices
18.00 $2,001,823 18.50$1,586,313
$1,694,752 17.50 $1,784,652 18.50 $1,781,852 18.50Subtotal 18.00 $2,001,823 18.50$1,586,313
TRANSFERS & OTHER REQUIREMENTS
$8,754 0.00 $10,595 0.00 $10,595 0.00OtherRequirements
0.00 $10,595 0.00$9,209
$8,754 0.00 $10,595 0.00 $10,595 0.00Subtotal 0.00 $10,595 0.00$9,209
$12,210,406 161.00 $12,772,929 162.25 $12,602,593 162.25Total 160.00 $14,260,031 164.25$11,695,801
2012-13 Proposed Budget, Austin, TX
Volume I | 101
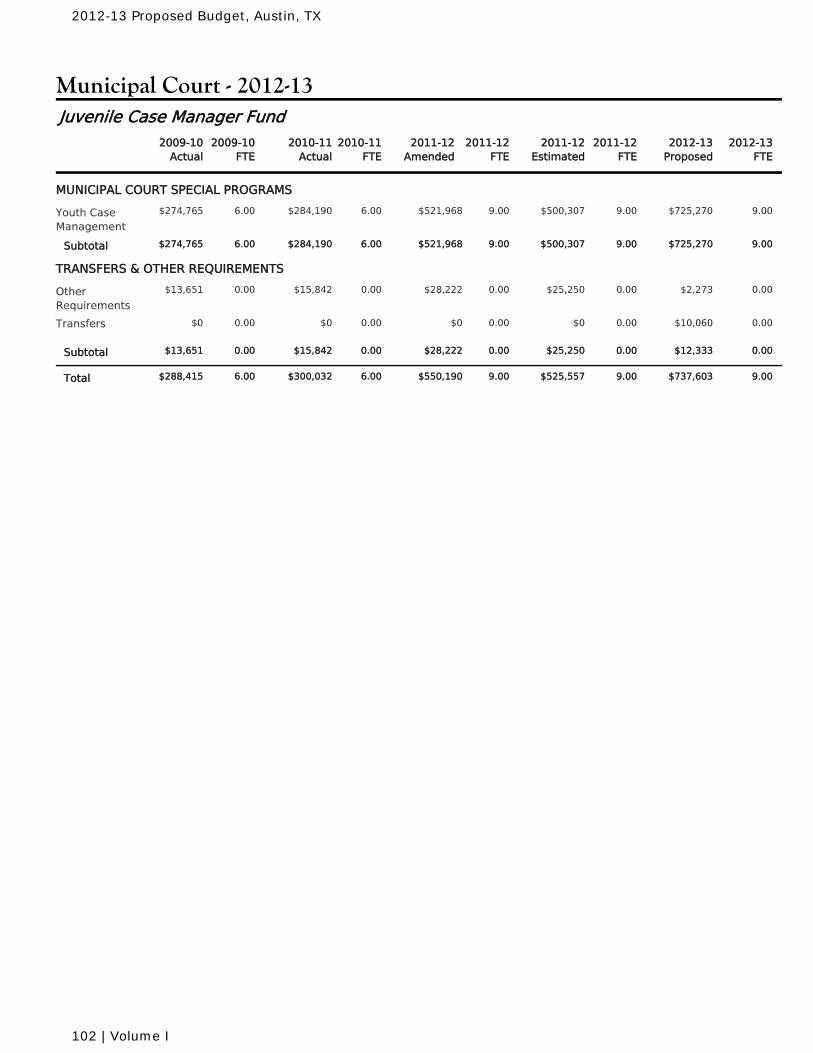
Municipal Court - 2012-13
2010-11Actual
2010-11FTE
2011-12Amended
2011-12FTE
2011-12Estimated
2011-12FTE
2009-10Actual
2009-10FTE
2012-13Proposed
2012-13FTE
Juvenile Case Manager Fund
MUNICIPAL COURT SPECIAL PROGRAMS
$284,190 6.00 $521,968 9.00 $500,307 9.00Youth CaseManagement
6.00 $725,270 9.00$274,765
$284,190 6.00 $521,968 9.00 $500,307 9.00Subtotal 6.00 $725,270 9.00$274,765
TRANSFERS & OTHER REQUIREMENTS
$15,842 0.00 $28,222 0.00 $25,250 0.00OtherRequirements
0.00 $2,273 0.00$13,651
$0 0.00 $0 0.00 $0 0.00Transfers 0.00 $10,060 0.00$0
$15,842 0.00 $28,222 0.00 $25,250 0.00Subtotal 0.00 $12,333 0.00$13,651
$300,032 6.00 $550,190 9.00 $525,557 9.00Total 6.00 $737,603 9.00$288,415
2012-13 Proposed Budget, Austin, TX
102 | Volume I
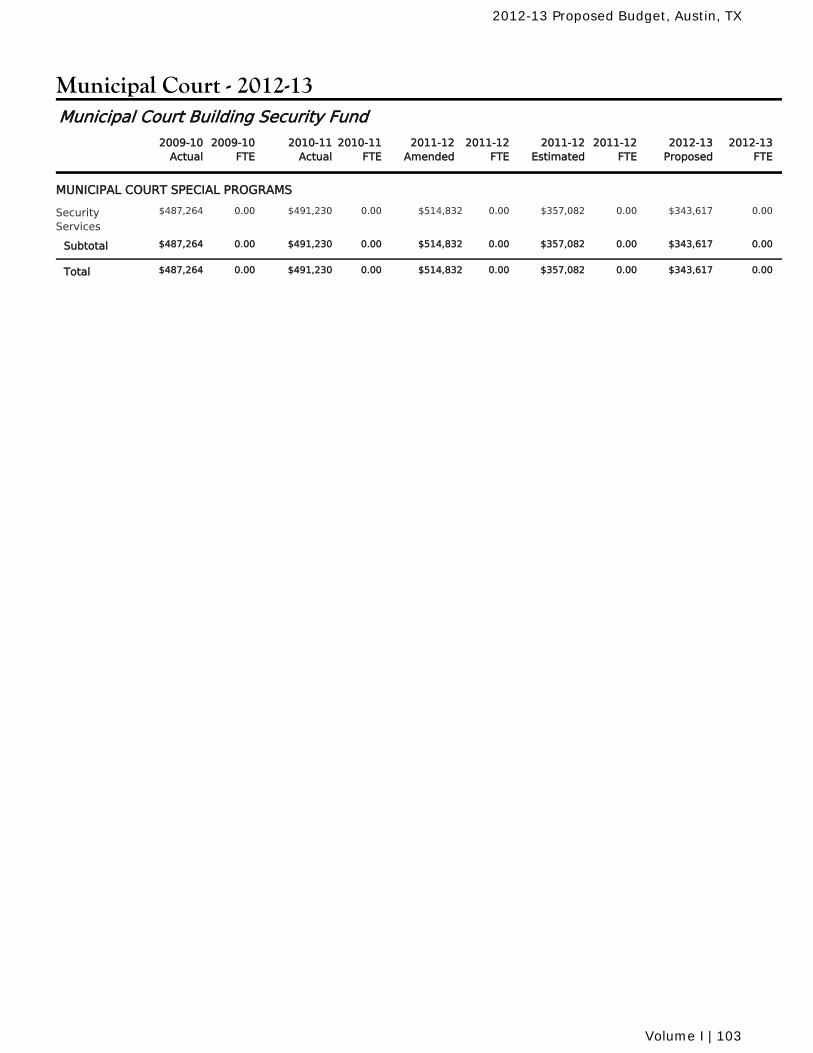
Municipal Court - 2012-13
2010-11Actual
2010-11FTE
2011-12Amended
2011-12FTE
2011-12Estimated
2011-12FTE
2009-10Actual
2009-10FTE
2012-13Proposed
2012-13FTE
Municipal Court Building Security Fund
MUNICIPAL COURT SPECIAL PROGRAMS
$491,230 0.00 $514,832 0.00 $357,082 0.00SecurityServices
0.00 $343,617 0.00$487,264
$491,230 0.00 $514,832 0.00 $357,082 0.00Subtotal 0.00 $343,617 0.00$487,264
$491,230 0.00 $514,832 0.00 $357,082 0.00Total 0.00 $343,617 0.00$487,264
2012-13 Proposed Budget, Austin, TX
Volume I | 103
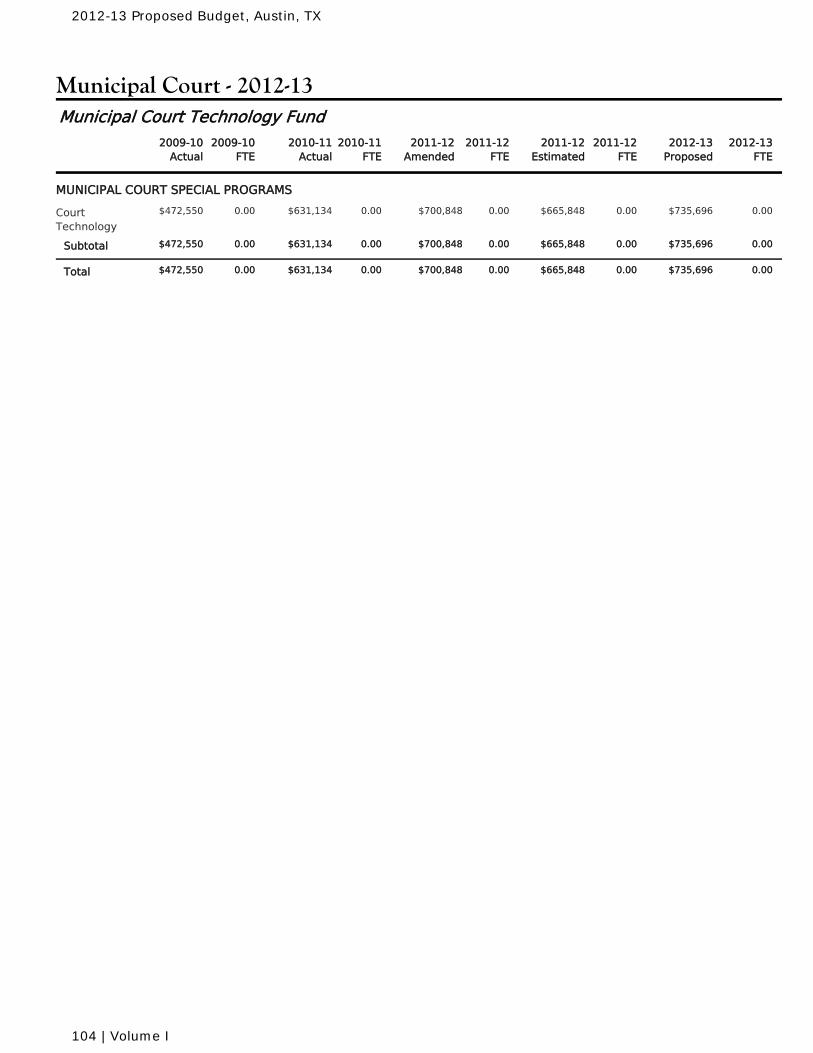
Municipal Court - 2012-13
2010-11Actual
2010-11FTE
2011-12Amended
2011-12FTE
2011-12Estimated
2011-12FTE
2009-10Actual
2009-10FTE
2012-13Proposed
2012-13FTE
Municipal Court Technology Fund
MUNICIPAL COURT SPECIAL PROGRAMS
$631,134 0.00 $700,848 0.00 $665,848 0.00CourtTechnology
0.00 $735,696 0.00$472,550
$631,134 0.00 $700,848 0.00 $665,848 0.00Subtotal 0.00 $735,696 0.00$472,550
$631,134 0.00 $700,848 0.00 $665,848 0.00Total 0.00 $735,696 0.00$472,550
2012-13 Proposed Budget, Austin, TX
104 | Volume I
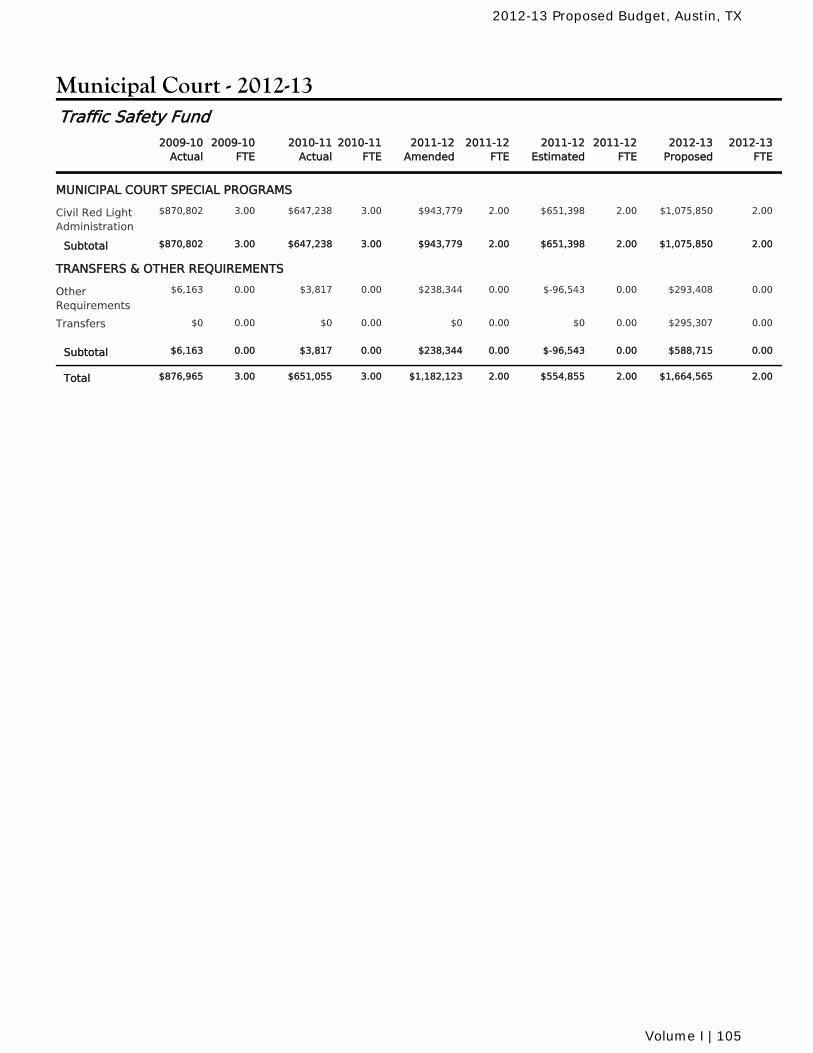
Municipal Court - 2012-13
2010-11Actual
2010-11FTE
2011-12Amended
2011-12FTE
2011-12Estimated
2011-12FTE
2009-10Actual
2009-10FTE
2012-13Proposed
2012-13FTE
Traffic Safety Fund
MUNICIPAL COURT SPECIAL PROGRAMS
$647,238 3.00 $943,779 2.00 $651,398 2.00Civil Red LightAdministration
3.00 $1,075,850 2.00$870,802
$647,238 3.00 $943,779 2.00 $651,398 2.00Subtotal 3.00 $1,075,850 2.00$870,802
TRANSFERS & OTHER REQUIREMENTS
$3,817 0.00 $238,344 0.00 $-96,543 0.00OtherRequirements
0.00 $293,408 0.00$6,163
$0 0.00 $0 0.00 $0 0.00Transfers 0.00 $295,307 0.00$0
$3,817 0.00 $238,344 0.00 $-96,543 0.00Subtotal 0.00 $588,715 0.00$6,163
$651,055 3.00 $1,182,123 2.00 $554,855 2.00Total 3.00 $1,664,565 2.00$876,965
2012-13 Proposed Budget, Austin, TX
Volume I | 105
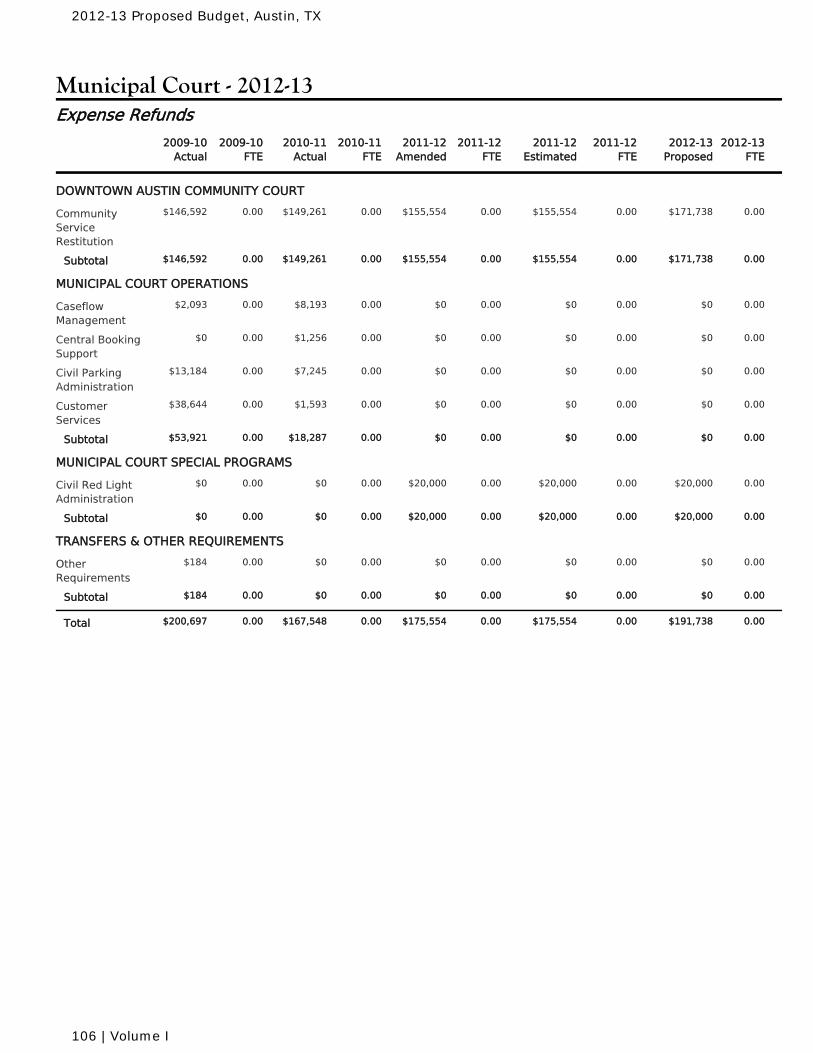
Municipal Court - 2012-13
2010-11Actual
2010-11FTE
2011-12Amended
2011-12FTE
2011-12Estimated
2011-12FTE
2009-10Actual
2009-10FTE
2012-13Proposed
2012-13FTE
Expense Refunds
DOWNTOWN AUSTIN COMMUNITY COURT
$149,261 0.00 $155,554 0.00 $155,554 0.00CommunityServiceRestitution
0.00 $171,738 0.00$146,592
$149,261 0.00 $155,554 0.00 $155,554 0.00Subtotal 0.00 $171,738 0.00$146,592
MUNICIPAL COURT OPERATIONS
$8,193 0.00 $0 0.00 $0 0.00CaseflowManagement
0.00 $0 0.00$2,093
$1,256 0.00 $0 0.00 $0 0.00Central BookingSupport
0.00 $0 0.00$0
$7,245 0.00 $0 0.00 $0 0.00Civil ParkingAdministration
0.00 $0 0.00$13,184
$1,593 0.00 $0 0.00 $0 0.00CustomerServices
0.00 $0 0.00$38,644
$18,287 0.00 $0 0.00 $0 0.00Subtotal 0.00 $0 0.00$53,921
MUNICIPAL COURT SPECIAL PROGRAMS
$0 0.00 $20,000 0.00 $20,000 0.00Civil Red LightAdministration
0.00 $20,000 0.00$0
$0 0.00 $20,000 0.00 $20,000 0.00Subtotal 0.00 $20,000 0.00$0
TRANSFERS & OTHER REQUIREMENTS
$0 0.00 $0 0.00 $0 0.00OtherRequirements
0.00 $0 0.00$184
$0 0.00 $0 0.00 $0 0.00Subtotal 0.00 $0 0.00$184
$167,548 0.00 $175,554 0.00 $175,554 0.00Total 0.00 $191,738 0.00$200,697
2012-13 Proposed Budget, Austin, TX
106 | Volume I
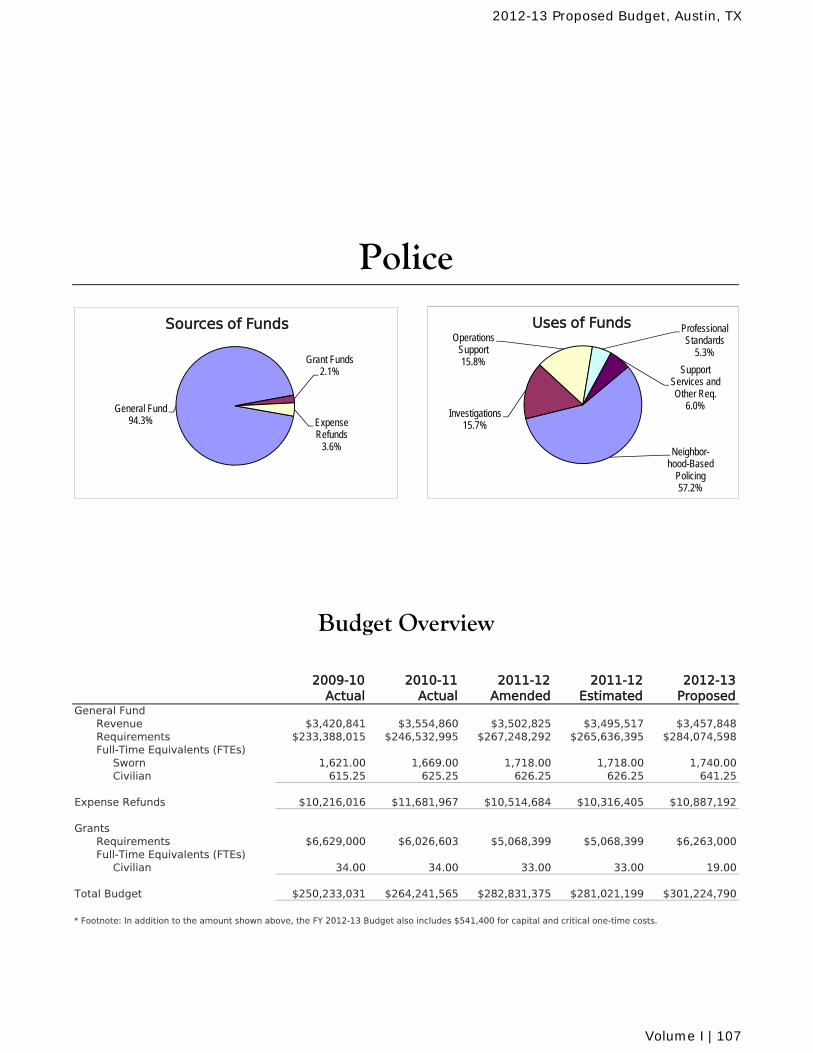
2009-10 Actual
2010-11 Actual
2011-12 Amended
2011-12 Estimated
2012-13 Proposed
General FundRevenue $3,420,841 $3,554,860 $3,502,825 $3,495,517 $3,457,848Requirements $233,388,015 $246,532,995 $267,248,292 $265,636,395 $284,074,598Full-Time Equivalents (FTEs) Sworn 1,621.00 1,669.00 1,718.00 1,718.00 1,740.00 Civilian 615.25 625.25 626.25 626.25 641.25
Expense Refunds $10,216,016 $11,681,967 $10,514,684 $10,316,405 $10,887,192
GrantsRequirements $6,629,000 $6,026,603 $5,068,399 $5,068,399 $6,263,000Full-Time Equivalents (FTEs) Civilian 34.00 34.00 33.00 33.00 19.00
Total Budget $250,233,031 $264,241,565 $282,831,375 $281,021,199 $301,224,790
Budget Overview
Police
* Footnote: In addition to the amount shown above, the FY 2012-13 Budget also includes $541,400 for capital and critical one-time costs.
General Fund94.3%
Grant Funds2.1%
Expense Refunds
3.6%
Sources of Funds
Neighbor-hood-Based
Policing57.2%
Investigations15.7%
Operations Support15.8%
Professional Standards
5.3%
Support Services and Other Req.
6.0%
Uses of Funds
2012-13 Proposed Budget, Austin, TX
Volume I | 107
PoliceOrganization by Program and Activity for 2013
Investigations Centralized InvestigationsOrganized Crime
Neighborhood-Based Policing Community PartnershipsPatrolPatrol SupportSpecialized Patrol and Events PlanningTraffic Enforcement
Operations Support Air OperationsCommunicationsForensics Science ServicesSpecial OperationsStrategic SupportVictim Services
Professional Standards Internal AffairsRecruitingTraining
Support Services Departmental Support Services
Transfers & Other Requirements Other Requirements
2012-13 Proposed Budget, Austin, TX
108 | Volume I
PoliceMission and Goals for 2013
Mission
The mission of the Police Department is to keep you, your family and our community safe.
Goals
Reduce the violent crime rate by 1%.
Reduce the property crime rate by 1%.
Improve traffic safety.
Reduce traffic fatality rate by 1%.Reduce serious-injury collision rate by 3%.Reduce DWI-related fatality rate by 3%.
Demonstrate professionalism and skills competency among police employees.
Reduce the rate of citizen complaints by 2%.Increase the percentage of residents who are satisfied with the overall quality of policeservices by 2%.Increase the average number of training hours per employee by 2 hours.
Use Intelligence-Led Policing to increase efficiency in service delivery.
Maintain a 7:00 response time to emergency and urgent calls.Increase the percent of Part I crimes cleared by 2%.Reduce the Part II crime rate by 1%.
2012-13 Proposed Budget, Austin, TX
Volume I | 109
Police
Message from the Director
The Austin Police Department (APD) continues its mission to keep you, your family and our community safe. Our vision of being the safest big city in America is built around a strong commitment to neighborhood-based policing. The emphasis includes continued efforts to reduce crime, improve service delivery, increase attention to traffic safety and quality of life initiatives, and improve efficiency and effectiveness through professional development, process improvements, technology changes and volunteerism.
The Austin Police Department provides quality police services to the citizens of Austin, Texas, in a variety of ways. Officers assigned to patrol and field operations respond to calls for service, provide traffic control, and assist citizens in solving neighborhood problems to enhance their quality of life. Highway Enforcement officers conduct investigations of serious injury collisions, special traffic initiatives, abandoned vehicle removal, and DWI enforcement. APD has a number of specialized units committed to keeping Austin safe, including the Gang Suppression unit, Auto Theft Interdiction unit, Child Abuse unit, Financial Crimes unit, High Tech Crime unit, Homicide unit, Special Events unit, and Training and Recruiting units. The department also has civilian support units including Forensics, Crime Analysis and Crime Records, Human Resources, Financial Management and 9-1-1 Communications as well as units that provide community outreach through the Police Activities League and Police Explorer Post, Citizens’ Police Academy, Blue Santa and the National Night Out Program.
The department seeks to align its budget to address a number of horizon issues. Those goals include proactively responding to crime trends and maintaining quality police services in a changing environment; addressing the support services workload that corresponds with increased numbers of officers; upgrading technology so that police employees can effectively meet the increased demand for service; reducing risk by enhancing the training of police employees; ensuring police employees have access to high quality equipment and reliable vehicles so they can focus on customer service; and improving police facilities to support the efficient provision of services and encourage community access to police operations.
The Austin Police Department is committed to the use of best practices to reduce crime, enhance citizen safety, manage traffic safety, and to provide professionally trained staff so that Austin makes strides toward being the best managed city in the nation.
Art Acevedo, Chief of Police
2012-13 Proposed Budget, Austin, TX
110 | Volume I
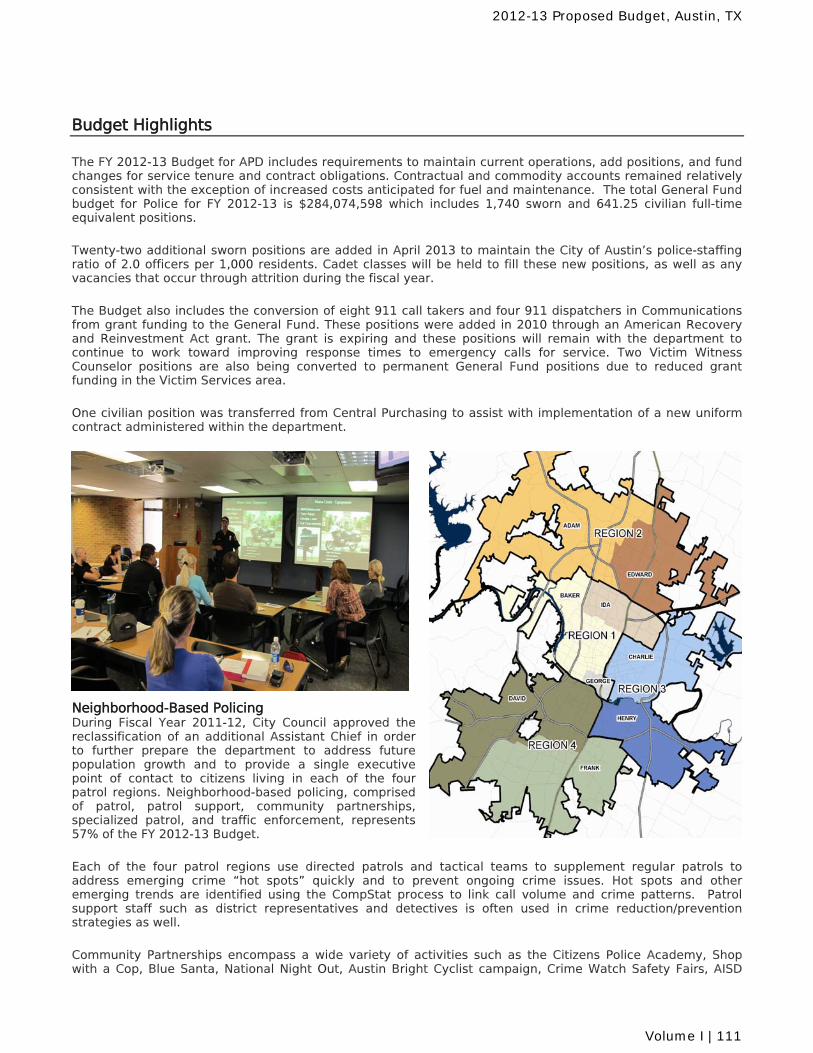
Budget Highlights
The FY 2012-13 Budget for APD includes requirements to maintain current operations, add positions, and fund changes for service tenure and contract obligations. Contractual and commodity accounts remained relatively consistent with the exception of increased costs anticipated for fuel and maintenance. The total General Fund budget for Police for FY 2012-13 is $284,074,598 which includes 1,740 sworn and 641.25 civilian full-time equivalent positions.
Twenty-two additional sworn positions are added in April 2013 to maintain the City of Austin’s police-staffing ratio of 2.0 officers per 1,000 residents. Cadet classes will be held to fill these new positions, as well as any vacancies that occur through attrition during the fiscal year.
The Budget also includes the conversion of eight 911 call takers and four 911 dispatchers in Communications from grant funding to the General Fund. These positions were added in 2010 through an American Recovery and Reinvestment Act grant. The grant is expiring and these positions will remain with the department to continue to work toward improving response times to emergency calls for service. Two Victim Witness Counselor positions are also being converted to permanent General Fund positions due to reduced grant funding in the Victim Services area.
One civilian position was transferred from Central Purchasing to assist with implementation of a new uniform contract administered within the department.
Neighborhood-Based Policing During Fiscal Year 2011-12, City Council approved the reclassification of an additional Assistant Chief in order to further prepare the department to address future population growth and to provide a single executive point of contact to citizens living in each of the four patrol regions. Neighborhood-based policing, comprised of patrol, patrol support, community partnerships, specialized patrol, and traffic enforcement, represents 57% of the FY 2012-13 Budget.
Each of the four patrol regions use directed patrols and tactical teams to supplement regular patrols to address emerging crime “hot spots” quickly and to prevent ongoing crime issues. Hot spots and other emerging trends are identified using the CompStat process to link call volume and crime patterns. Patrol support staff such as district representatives and detectives is often used in crime reduction/prevention strategies as well.
Community Partnerships encompass a wide variety of activities such as the Citizens Police Academy, Shop with a Cop, Blue Santa, National Night Out, Austin Bright Cyclist campaign, Crime Watch Safety Fairs, AISD
2012-13 Proposed Budget, Austin, TX
Volume I | 111

Reading Programs, Middle School Soccer competitions, PAL Basketball Clinics and Boxing Camps, and Police Explorer Competitions. The Citizen’s Police Academy is a fourteen-week program that is designed to give the public a working knowledge of the Austin Police Department. Each session consists of fourteen consecutive Tuesday night classes at City of Austin facilities. The instruction is comprehensive and each week separate areas of the department are covered.
Officers use the Bright Cyclist campaign to inform cyclists of bicycle laws. The goal of the campaign is to raise awareness and reduce the number of cyclists riding without proper lighting. Last year, the City piloted the Austin Bright Cyclist program, reducing the number of citations issued to cyclists for riding without a light from 158 to 90 within one year.
Austin Explorers are youth ages 14-20 in the 9th grade or higher who are mentored by police officers in various areas of law enforcement. In May of this year, the Austin Explorers brought home awards from the 23rd Annual Texas Law Enforcement Explorer Advisors Association (TLEEAA) state competition in Waxahachie. Over 120 teams from around Texas participated in this event, which included several different scenarios involving practical application of law enforcement knowledge and investigative skills. APD’s Explorers won first place in white collar crime investigations, first place in robbery in progress and second place in intoxicated driver scenarios.
There have been 31 traffic fatalities in Austin through the end of May. The Highway Enforcement unit has worked several initiatives in an attempt to reduce traffic related fatalities including a pedestrian initiative as well as several no-refusal initiatives aimed at intoxicated drivers. The Special Events unit will be moving to One Texas Center to provide a one-stop shop for permitting for the City. Funding for the office location is being provided in the FY 2010-13 Budget. Investigations Investigations for FY 2012-13 account for 16% of the department’s budget and include Centralized Investigations and Organized Crime. Centralized Investigations focuses on crimes such as homicide, robbery, sex crimes, property, high tech, auto theft, burglary and domestic violence. Organized Crime focuses on criminal activity related to gangs, narcotics and human trafficking. The table below is an example from a CompStat report used by the department to assess monthly and yearly trends in violent crimes such as homicides, robberies, and aggravated assault with and without family violence. The table shows that through the week ending May 24th, violent crime is down 7% citywide for the calendar year 2012 compared to the same period in 2011. The table also shows 41.6% of the cases for 2012 have been cleared.
2012-13 Proposed Budget, Austin, TX
112 | Volume I
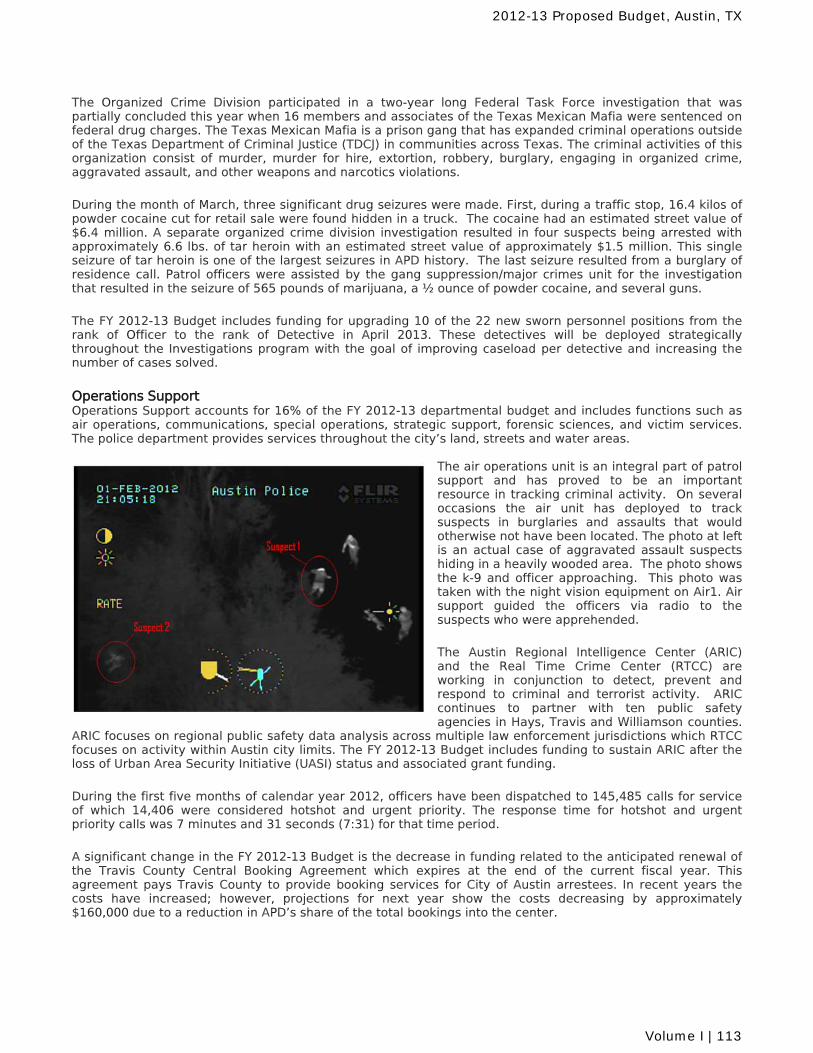
The Organized Crime Division participated in a two-year long Federal Task Force investigation that was partially concluded this year when 16 members and associates of the Texas Mexican Mafia were sentenced on federal drug charges. The Texas Mexican Mafia is a prison gang that has expanded criminal operations outside of the Texas Department of Criminal Justice (TDCJ) in communities across Texas. The criminal activities of this organization consist of murder, murder for hire, extortion, robbery, burglary, engaging in organized crime, aggravated assault, and other weapons and narcotics violations.
During the month of March, three significant drug seizures were made. First, during a traffic stop, 16.4 kilos of powder cocaine cut for retail sale were found hidden in a truck. The cocaine had an estimated street value of $6.4 million. A separate organized crime division investigation resulted in four suspects being arrested with approximately 6.6 lbs. of tar heroin with an estimated street value of approximately $1.5 million. This single seizure of tar heroin is one of the largest seizures in APD history. The last seizure resulted from a burglary of residence call. Patrol officers were assisted by the gang suppression/major crimes unit for the investigation that resulted in the seizure of 565 pounds of marijuana, a ½ ounce of powder cocaine, and several guns.
The FY 2012-13 Budget includes funding for upgrading 10 of the 22 new sworn personnel positions from the rank of Officer to the rank of Detective in April 2013. These detectives will be deployed strategically throughout the Investigations program with the goal of improving caseload per detective and increasing the number of cases solved.
Operations Support Operations Support accounts for 16% of the FY 2012-13 departmental budget and includes functions such as air operations, communications, special operations, strategic support, forensic sciences, and victim services. The police department provides services throughout the city’s land, streets and water areas.
The air operations unit is an integral part of patrol support and has proved to be an important resource in tracking criminal activity. On several occasions the air unit has deployed to track suspects in burglaries and assaults that would otherwise not have been located. The photo at left is an actual case of aggravated assault suspects hiding in a heavily wooded area. The photo shows the k-9 and officer approaching. This photo was taken with the night vision equipment on Air1. Air support guided the officers via radio to the suspects who were apprehended.
The Austin Regional Intelligence Center (ARIC) and the Real Time Crime Center (RTCC) are working in conjunction to detect, prevent and respond to criminal and terrorist activity. ARIC continues to partner with ten public safety agencies in Hays, Travis and Williamson counties.
ARIC focuses on regional public safety data analysis across multiple law enforcement jurisdictions which RTCC focuses on activity within Austin city limits. The FY 2012-13 Budget includes funding to sustain ARIC after the loss of Urban Area Security Initiative (UASI) status and associated grant funding.
During the first five months of calendar year 2012, officers have been dispatched to 145,485 calls for service of which 14,406 were considered hotshot and urgent priority. The response time for hotshot and urgent priority calls was 7 minutes and 31 seconds (7:31) for that time period.
A significant change in the FY 2012-13 Budget is the decrease in funding related to the anticipated renewal of the Travis County Central Booking Agreement which expires at the end of the current fiscal year. This agreement pays Travis County to provide booking services for City of Austin arrestees. In recent years the costs have increased; however, projections for next year show the costs decreasing by approximately $160,000 due to a reduction in APD’s share of the total bookings into the center.
2012-13 Proposed Budget, Austin, TX
Volume I | 113
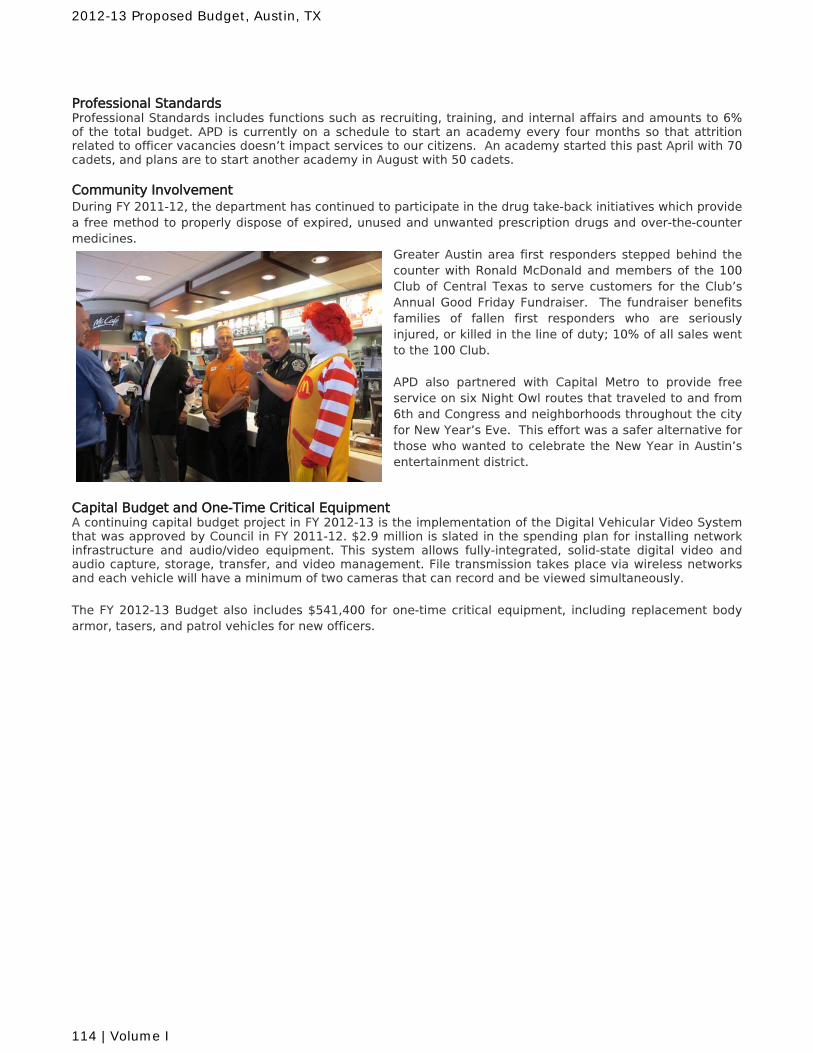
Professional Standards Professional Standards includes functions such as recruiting, training, and internal affairs and amounts to 6% of the total budget. APD is currently on a schedule to start an academy every four months so that attrition related to officer vacancies doesn’t impact services to our citizens. An academy started this past April with 70 cadets, and plans are to start another academy in August with 50 cadets. Community Involvement During FY 2011-12, the department has continued to participate in the drug take-back initiatives which provide a free method to properly dispose of expired, unused and unwanted prescription drugs and over-the-counter medicines.
Greater Austin area first responders stepped behind the counter with Ronald McDonald and members of the 100 Club of Central Texas to serve customers for the Club’s Annual Good Friday Fundraiser. The fundraiser benefits families of fallen first responders who are seriously injured, or killed in the line of duty; 10% of all sales went to the 100 Club. APD also partnered with Capital Metro to provide free service on six Night Owl routes that traveled to and from 6th and Congress and neighborhoods throughout the city for New Year’s Eve. This effort was a safer alternative for those who wanted to celebrate the New Year in Austin’s entertainment district.
Capital Budget and One-Time Critical Equipment A continuing capital budget project in FY 2012-13 is the implementation of the Digital Vehicular Video System that was approved by Council in FY 2011-12. $2.9 million is slated in the spending plan for installing network infrastructure and audio/video equipment. This system allows fully-integrated, solid-state digital video and audio capture, storage, transfer, and video management. File transmission takes place via wireless networks and each vehicle will have a minimum of two cameras that can record and be viewed simultaneously. The FY 2012-13 Budget also includes $541,400 for one-time critical equipment, including replacement body armor, tasers, and patrol vehicles for new officers.
2012-13 Proposed Budget, Austin, TX
114 | Volume I
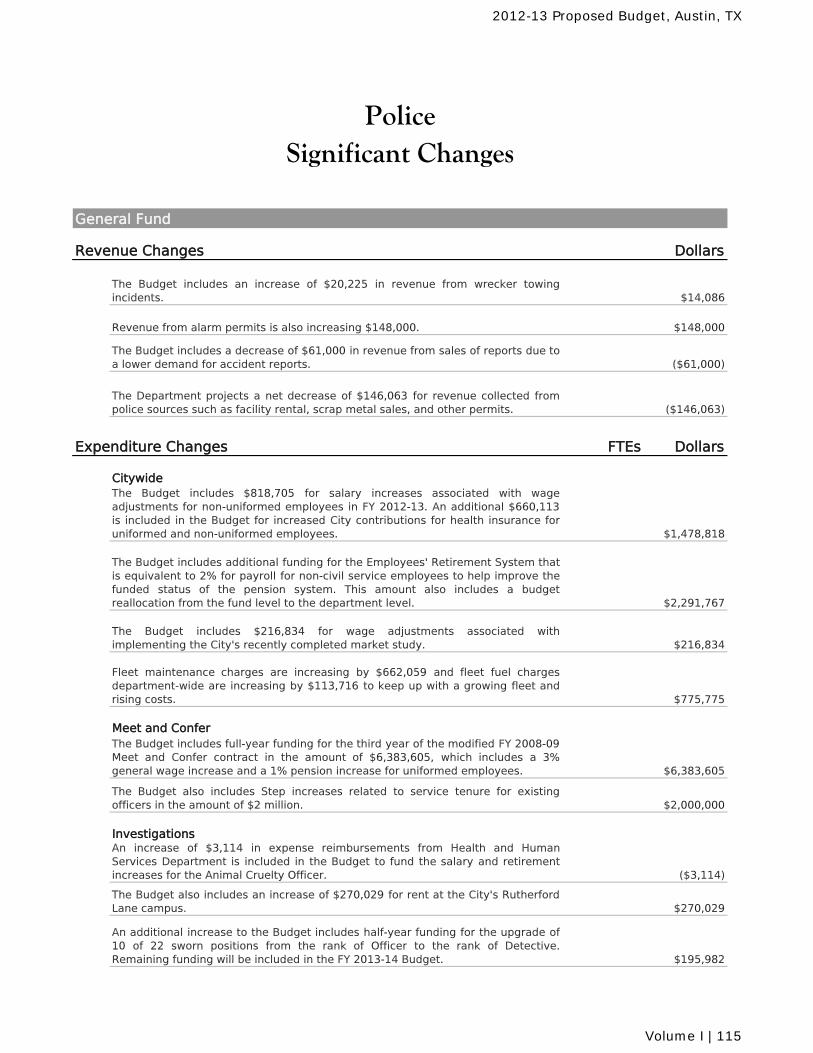
Revenue Changes Dollars
The Budget includes an increase of $20,225 in revenue from wrecker towingincidents. $14,086
Revenue from alarm permits is also increasing $148,000. $148,000
The Budget includes a decrease of $61,000 in revenue from sales of reports due toa lower demand for accident reports. ($61,000)
The Department projects a net decrease of $146,063 for revenue collected frompolice sources such as facility rental, scrap metal sales, and other permits. ($146,063)
Expenditure Changes FTEs Dollars
CitywideThe Budget includes $818,705 for salary increases associated with wageadjustments for non-uniformed employees in FY 2012-13. An additional $660,113is included in the Budget for increased City contributions for health insurance foruniformed and non-uniformed employees. $1,478,818
The Budget includes additional funding for the Employees' Retirement System thatis equivalent to 2% for payroll for non-civil service employees to help improve thefunded status of the pension system. This amount also includes a budgetreallocation from the fund level to the department level. $2,291,767
The Budget includes $216,834 for wage adjustments associated withimplementing the City's recently completed market study. $216,834
Fleet maintenance charges are increasing by $662,059 and fleet fuel chargesdepartment-wide are increasing by $113,716 to keep up with a growing fleet andrising costs. $775,775
Meet and ConferThe Budget includes full-year funding for the third year of the modified FY 2008-09Meet and Confer contract in the amount of $6,383,605, which includes a 3%general wage increase and a 1% pension increase for uniformed employees. $6,383,605
The Budget also includes Step increases related to service tenure for existingofficers in the amount of $2 million. $2,000,000
InvestigationsAn increase of $3,114 in expense reimbursements from Health and HumanServices Department is included in the Budget to fund the salary and retirementincreases for the Animal Cruelty Officer. ($3,114)
The Budget also includes an increase of $270,029 for rent at the City's RutherfordLane campus. $270,029
An additional increase to the Budget includes half-year funding for the upgrade of10 of 22 sworn positions from the rank of Officer to the rank of Detective.Remaining funding will be included in the FY 2013-14 Budget. $195,982
Significant ChangesPolice
General Fund
2012-13 Proposed Budget, Austin, TX
Volume I | 115
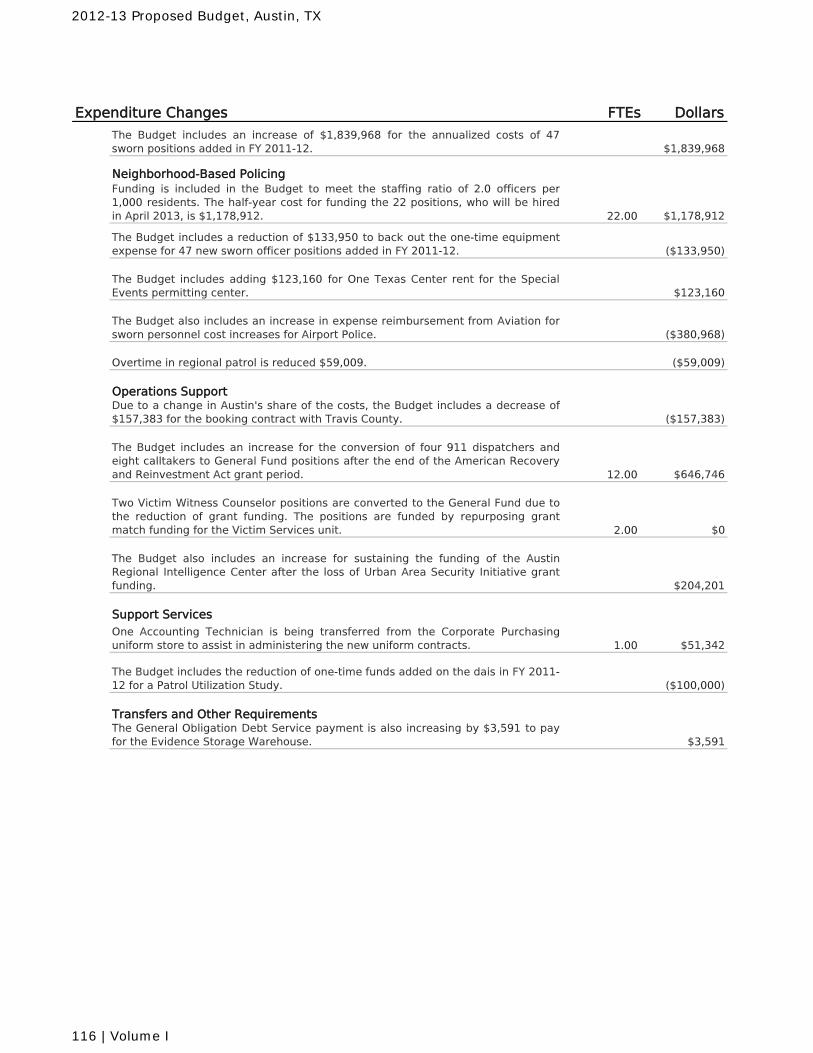
Expenditure Changes FTEs Dollars
The Budget includes an increase of $1,839,968 for the annualized costs of 47sworn positions added in FY 2011-12. $1,839,968
Neighborhood-Based PolicingFunding is included in the Budget to meet the staffing ratio of 2.0 officers per1,000 residents. The half-year cost for funding the 22 positions, who will be hiredin April 2013, is $1,178,912. 22.00 $1,178,912
The Budget includes a reduction of $133,950 to back out the one-time equipmentexpense for 47 new sworn officer positions added in FY 2011-12. ($133,950)
The Budget includes adding $123,160 for One Texas Center rent for the SpecialEvents permitting center. $123,160
The Budget also includes an increase in expense reimbursement from Aviation forsworn personnel cost increases for Airport Police. ($380,968)
Overtime in regional patrol is reduced $59,009. ($59,009)
Operations SupportDue to a change in Austin's share of the costs, the Budget includes a decrease of$157,383 for the booking contract with Travis County. ($157,383)
The Budget includes an increase for the conversion of four 911 dispatchers andeight calltakers to General Fund positions after the end of the American Recoveryand Reinvestment Act grant period. 12.00 $646,746
Two Victim Witness Counselor positions are converted to the General Fund due tothe reduction of grant funding. The positions are funded by repurposing grantmatch funding for the Victim Services unit. 2.00 $0
The Budget also includes an increase for sustaining the funding of the AustinRegional Intelligence Center after the loss of Urban Area Security Initiative grantfunding. $204,201
Support ServicesOne Accounting Technician is being transferred from the Corporate Purchasinguniform store to assist in administering the new uniform contracts. 1.00 $51,342
The Budget includes the reduction of one-time funds added on the dais in FY 2011-12 for a Patrol Utilization Study. ($100,000)
Transfers and Other RequirementsThe General Obligation Debt Service payment is also increasing by $3,591 to payfor the Evidence Storage Warehouse. $3,591
2012-13 Proposed Budget, Austin, TX
116 | Volume I
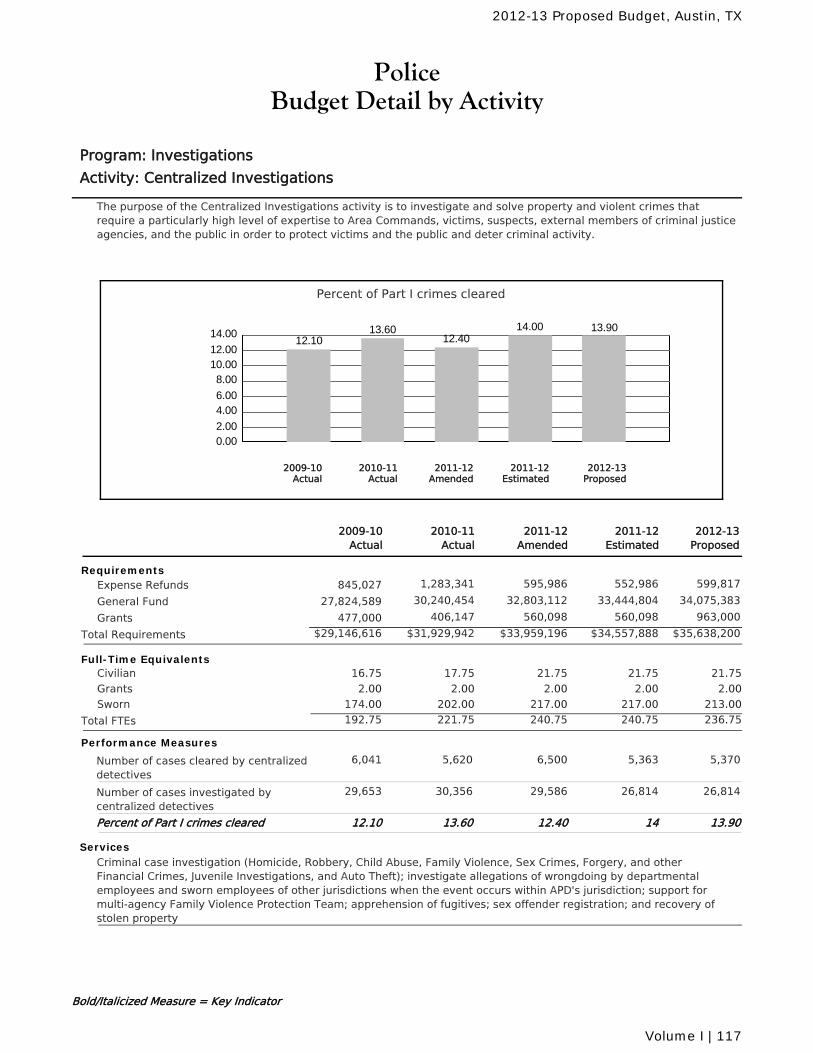
PoliceBudget Detail by Activity
Program: Investigations
Activity: Centralized Investigations
The purpose of the Centralized Investigations activity is to investigate and solve property and violent crimes thatrequire a particularly high level of expertise to Area Commands, victims, suspects, external members of criminal justiceagencies, and the public in order to protect victims and the public and deter criminal activity.
Percent of Part I crimes cleared
0.002.00
4.006.00
8.0010.0012.00
14.0012.10
13.6012.40
14.00 13.90
2010-11Actual
2012-13Proposed
2011-12Amended
2011-12Estimated
2009-10Actual
2011-12Amended
2010-11Actual
2011-12Estimated
2012-13Proposed
2009-10Actual
RequirementsExpense Refunds 1,283,341 595,986 552,986 599,817845,027
General Fund 30,240,454 32,803,112 33,444,804 34,075,38327,824,589
Grants 406,147 560,098 560,098 963,000477,000
Total Requirements $31,929,942 $34,557,888 $35,638,200$33,959,196$29,146,616
Full-Time Equivalents17.75 21.75 21.75 21.75Civilian 16.75
2.00 2.00 2.00 2.00Grants 2.00
202.00 217.00 217.00 213.00Sworn 174.00
Total FTEs 221.75 240.75 236.75240.75192.75
Performance Measures
Number of cases cleared by centralizeddetectives
6,5005,620 5,363 5,3706,041
Number of cases investigated bycentralized detectives
29,58630,356 26,814 26,81429,653
Percent of Part I crimes cleared 12.4013.60 14 13.9012.10
ServicesCriminal case investigation (Homicide, Robbery, Child Abuse, Family Violence, Sex Crimes, Forgery, and otherFinancial Crimes, Juvenile Investigations, and Auto Theft); investigate allegations of wrongdoing by departmentalemployees and sworn employees of other jurisdictions when the event occurs within APD's jurisdiction; support formulti-agency Family Violence Protection Team; apprehension of fugitives; sex offender registration; and recovery ofstolen property
Bold/Italicized Measure = Key Indicator
2012-13 Proposed Budget, Austin, TX
Volume I | 117
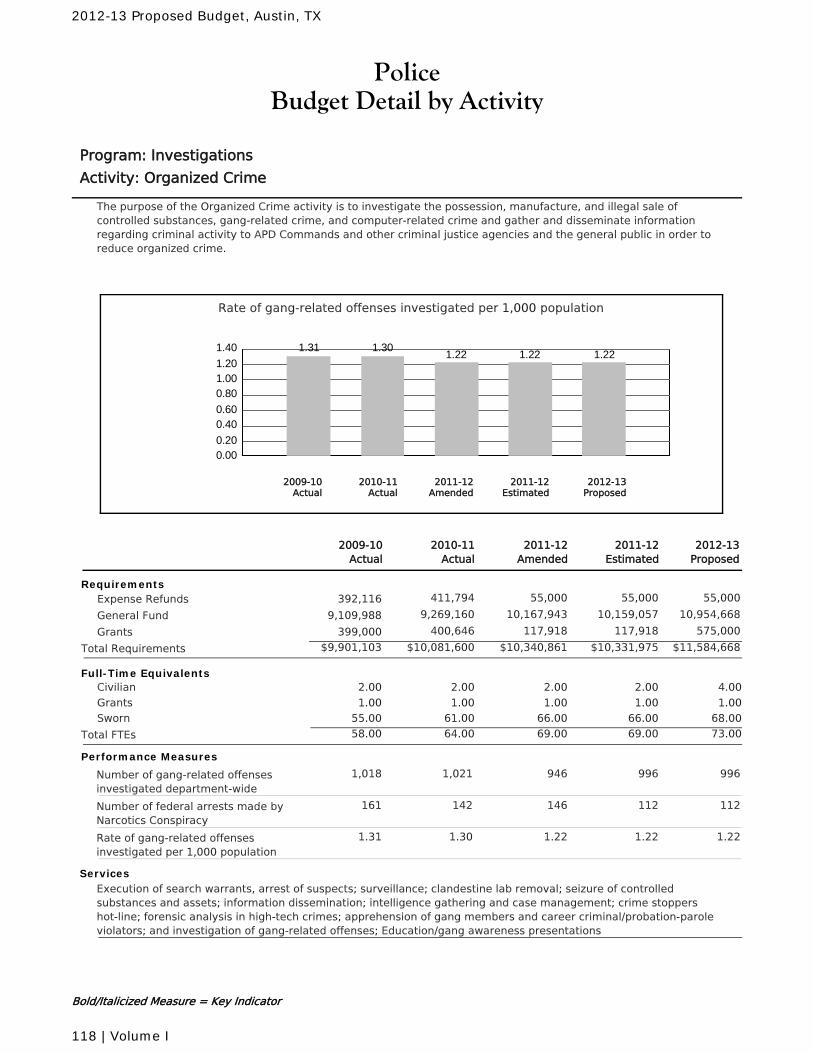
PoliceBudget Detail by Activity
Program: Investigations
Activity: Organized Crime
The purpose of the Organized Crime activity is to investigate the possession, manufacture, and illegal sale ofcontrolled substances, gang-related crime, and computer-related crime and gather and disseminate informationregarding criminal activity to APD Commands and other criminal justice agencies and the general public in order toreduce organized crime.
Rate of gang-related offenses investigated per 1,000 population
0.000.20
0.400.60
0.801.001.20
1.40 1.31 1.301.22 1.22 1.22
2010-11Actual
2012-13Proposed
2011-12Amended
2011-12Estimated
2009-10Actual
2011-12Amended
2010-11Actual
2011-12Estimated
2012-13Proposed
2009-10Actual
RequirementsExpense Refunds 411,794 55,000 55,000 55,000392,116
General Fund 9,269,160 10,167,943 10,159,057 10,954,6689,109,988
Grants 400,646 117,918 117,918 575,000399,000
Total Requirements $10,081,600 $10,331,975 $11,584,668$10,340,861$9,901,103
Full-Time Equivalents2.00 2.00 2.00 4.00Civilian 2.00
1.00 1.00 1.00 1.00Grants 1.00
61.00 66.00 66.00 68.00Sworn 55.00
Total FTEs 64.00 69.00 73.0069.0058.00
Performance Measures
Number of gang-related offensesinvestigated department-wide
9461,021 996 9961,018
Number of federal arrests made byNarcotics Conspiracy
146142 112 112161
Rate of gang-related offensesinvestigated per 1,000 population
1.221.30 1.22 1.221.31
ServicesExecution of search warrants, arrest of suspects; surveillance; clandestine lab removal; seizure of controlledsubstances and assets; information dissemination; intelligence gathering and case management; crime stoppershot-line; forensic analysis in high-tech crimes; apprehension of gang members and career criminal/probation-paroleviolators; and investigation of gang-related offenses; Education/gang awareness presentations
Bold/Italicized Measure = Key Indicator
2012-13 Proposed Budget, Austin, TX
118 | Volume I
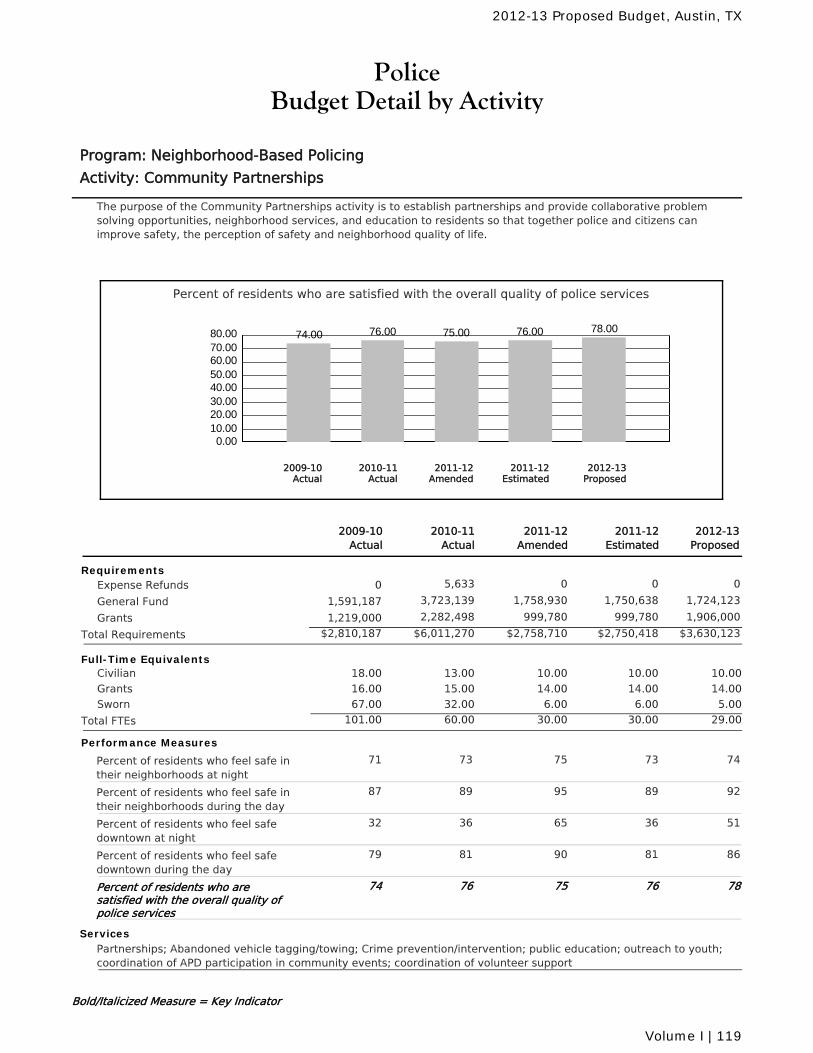
PoliceBudget Detail by Activity
Program: Neighborhood-Based Policing
Activity: Community Partnerships
The purpose of the Community Partnerships activity is to establish partnerships and provide collaborative problemsolving opportunities, neighborhood services, and education to residents so that together police and citizens canimprove safety, the perception of safety and neighborhood quality of life.
Percent of residents who are satisfied with the overall quality of police services
0.0010.0020.0030.0040.0050.0060.0070.0080.00 74.00 76.00 75.00 76.00 78.00
2010-11Actual
2012-13Proposed
2011-12Amended
2011-12Estimated
2009-10Actual
2011-12Amended
2010-11Actual
2011-12Estimated
2012-13Proposed
2009-10Actual
RequirementsExpense Refunds 5,633 0 0 00
General Fund 3,723,139 1,758,930 1,750,638 1,724,1231,591,187
Grants 2,282,498 999,780 999,780 1,906,0001,219,000
Total Requirements $6,011,270 $2,750,418 $3,630,123$2,758,710$2,810,187
Full-Time Equivalents13.00 10.00 10.00 10.00Civilian 18.00
15.00 14.00 14.00 14.00Grants 16.00
32.00 6.00 6.00 5.00Sworn 67.00
Total FTEs 60.00 30.00 29.0030.00101.00
Performance Measures
Percent of residents who feel safe intheir neighborhoods at night
7573 73 7471
Percent of residents who feel safe intheir neighborhoods during the day
9589 89 9287
Percent of residents who feel safedowntown at night
6536 36 5132
Percent of residents who feel safedowntown during the day
9081 81 8679
Percent of residents who aresatisfied with the overall quality ofpolice services
7576 76 7874
ServicesPartnerships; Abandoned vehicle tagging/towing; Crime prevention/intervention; public education; outreach to youth;coordination of APD participation in community events; coordination of volunteer support
Bold/Italicized Measure = Key Indicator
2012-13 Proposed Budget, Austin, TX
Volume I | 119
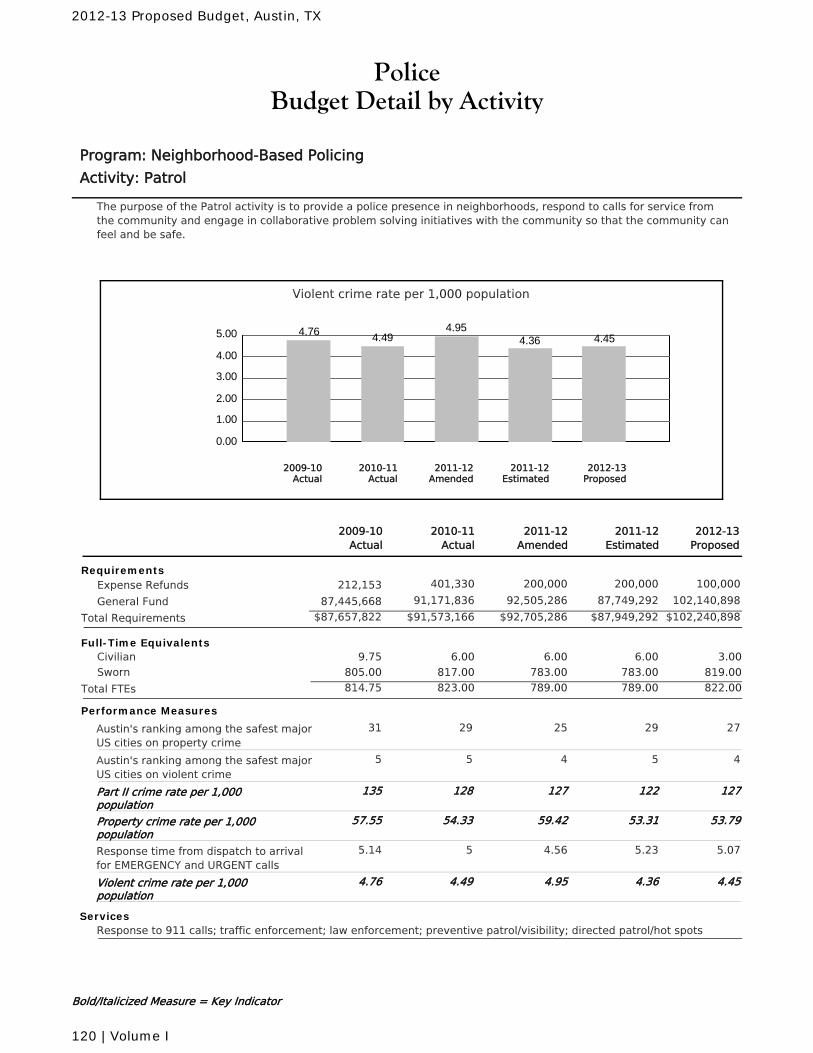
PoliceBudget Detail by Activity
Program: Neighborhood-Based Policing
Activity: Patrol
The purpose of the Patrol activity is to provide a police presence in neighborhoods, respond to calls for service fromthe community and engage in collaborative problem solving initiatives with the community so that the community canfeel and be safe.
Violent crime rate per 1,000 population
0.00
1.00
2.00
3.00
4.00
5.00 4.76 4.494.95
4.36 4.45
2010-11Actual
2012-13Proposed
2011-12Amended
2011-12Estimated
2009-10Actual
2011-12Amended
2010-11Actual
2011-12Estimated
2012-13Proposed
2009-10Actual
RequirementsExpense Refunds 401,330 200,000 200,000 100,000212,153
General Fund 91,171,836 92,505,286 87,749,292 102,140,89887,445,668
Total Requirements $91,573,166 $87,949,292 $102,240,898$92,705,286$87,657,822
Full-Time Equivalents6.00 6.00 6.00 3.00Civilian 9.75
817.00 783.00 783.00 819.00Sworn 805.00
Total FTEs 823.00 789.00 822.00789.00814.75
Performance Measures
Austin's ranking among the safest majorUS cities on property crime
2529 29 2731
Austin's ranking among the safest majorUS cities on violent crime
45 5 45
Part II crime rate per 1,000population
127128 122 127135
Property crime rate per 1,000population
59.4254.33 53.31 53.7957.55
Response time from dispatch to arrivalfor EMERGENCY and URGENT calls
4.565 5.23 5.075.14
Violent crime rate per 1,000population
4.954.49 4.36 4.454.76
ServicesResponse to 911 calls; traffic enforcement; law enforcement; preventive patrol/visibility; directed patrol/hot spots
Bold/Italicized Measure = Key Indicator
2012-13 Proposed Budget, Austin, TX
120 | Volume I
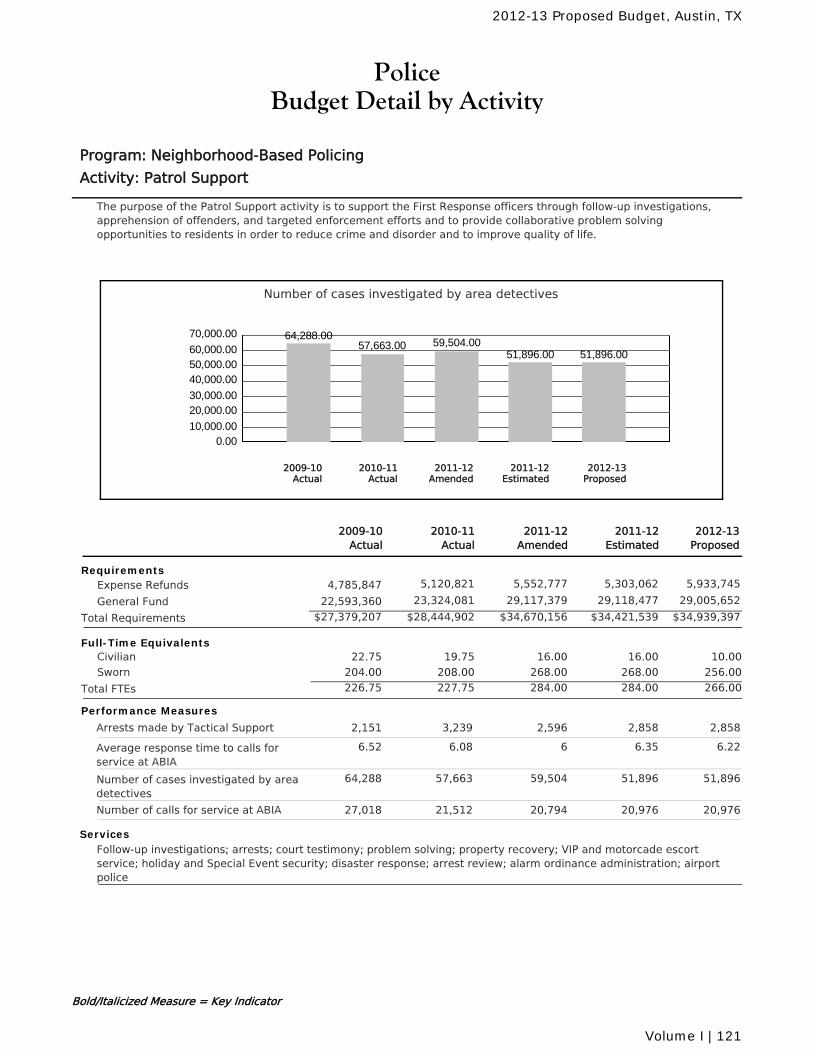
PoliceBudget Detail by Activity
Program: Neighborhood-Based Policing
Activity: Patrol Support
The purpose of the Patrol Support activity is to support the First Response officers through follow-up investigations,apprehension of offenders, and targeted enforcement efforts and to provide collaborative problem solvingopportunities to residents in order to reduce crime and disorder and to improve quality of life.
Number of cases investigated by area detectives
0.0010,000.00
20,000.0030,000.00
40,000.0050,000.0060,000.00
70,000.00 64,288.0057,663.00 59,504.00
51,896.00 51,896.00
2010-11Actual
2012-13Proposed
2011-12Amended
2011-12Estimated
2009-10Actual
2011-12Amended
2010-11Actual
2011-12Estimated
2012-13Proposed
2009-10Actual
RequirementsExpense Refunds 5,120,821 5,552,777 5,303,062 5,933,7454,785,847
General Fund 23,324,081 29,117,379 29,118,477 29,005,65222,593,360
Total Requirements $28,444,902 $34,421,539 $34,939,397$34,670,156$27,379,207
Full-Time Equivalents19.75 16.00 16.00 10.00Civilian 22.75
208.00 268.00 268.00 256.00Sworn 204.00
Total FTEs 227.75 284.00 266.00284.00226.75
Performance Measures
Arrests made by Tactical Support 2,5963,239 2,858 2,8582,151
Average response time to calls forservice at ABIA
66.08 6.35 6.226.52
Number of cases investigated by areadetectives
59,50457,663 51,896 51,89664,288
Number of calls for service at ABIA 20,79421,512 20,976 20,97627,018
ServicesFollow-up investigations; arrests; court testimony; problem solving; property recovery; VIP and motorcade escortservice; holiday and Special Event security; disaster response; arrest review; alarm ordinance administration; airportpolice
Bold/Italicized Measure = Key Indicator
2012-13 Proposed Budget, Austin, TX
Volume I | 121
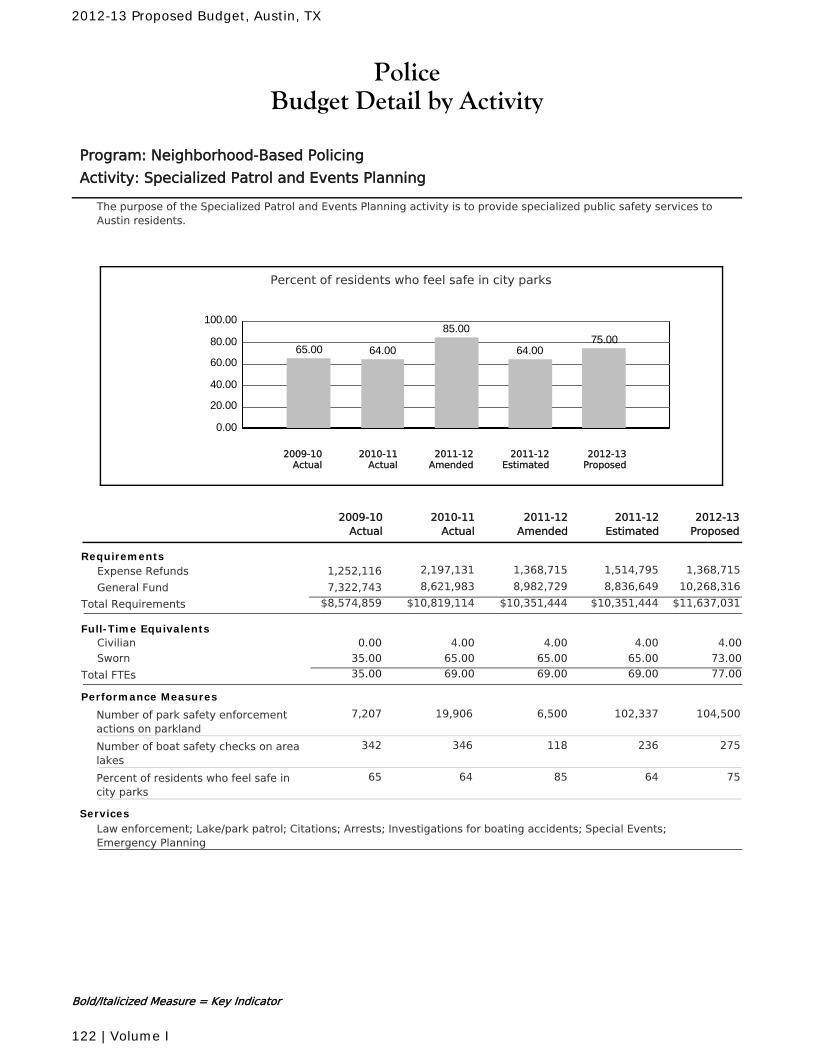
PoliceBudget Detail by Activity
Program: Neighborhood-Based Policing
Activity: Specialized Patrol and Events Planning
The purpose of the Specialized Patrol and Events Planning activity is to provide specialized public safety services toAustin residents.
Percent of residents who feel safe in city parks
0.00
20.00
40.00
60.00
80.00
100.00
65.00 64.00
85.00
64.0075.00
2010-11Actual
2012-13Proposed
2011-12Amended
2011-12Estimated
2009-10Actual
2011-12Amended
2010-11Actual
2011-12Estimated
2012-13Proposed
2009-10Actual
RequirementsExpense Refunds 2,197,131 1,368,715 1,514,795 1,368,7151,252,116
General Fund 8,621,983 8,982,729 8,836,649 10,268,3167,322,743
Total Requirements $10,819,114 $10,351,444 $11,637,031$10,351,444$8,574,859
Full-Time Equivalents4.00 4.00 4.00 4.00Civilian 0.00
65.00 65.00 65.00 73.00Sworn 35.00
Total FTEs 69.00 69.00 77.0069.0035.00
Performance Measures
Number of park safety enforcementactions on parkland
6,50019,906 102,337 104,5007,207
Number of boat safety checks on arealakes
118346 236 275342
Percent of residents who feel safe incity parks
8564 64 7565
ServicesLaw enforcement; Lake/park patrol; Citations; Arrests; Investigations for boating accidents; Special Events;Emergency Planning
Bold/Italicized Measure = Key Indicator
2012-13 Proposed Budget, Austin, TX
122 | Volume I
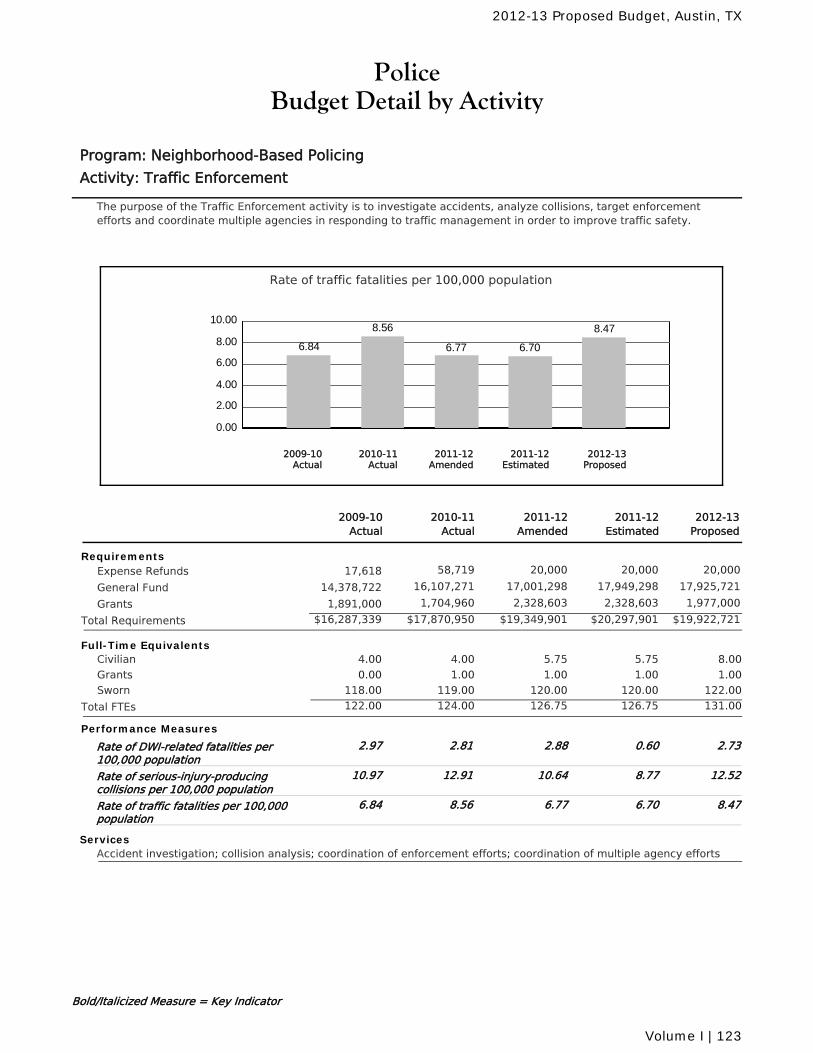
PoliceBudget Detail by Activity
Program: Neighborhood-Based Policing
Activity: Traffic Enforcement
The purpose of the Traffic Enforcement activity is to investigate accidents, analyze collisions, target enforcementefforts and coordinate multiple agencies in responding to traffic management in order to improve traffic safety.
Rate of traffic fatalities per 100,000 population
0.00
2.00
4.00
6.00
8.00
10.00
6.84
8.56
6.77 6.70
8.47
2010-11Actual
2012-13Proposed
2011-12Amended
2011-12Estimated
2009-10Actual
2011-12Amended
2010-11Actual
2011-12Estimated
2012-13Proposed
2009-10Actual
RequirementsExpense Refunds 58,719 20,000 20,000 20,00017,618
General Fund 16,107,271 17,001,298 17,949,298 17,925,72114,378,722
Grants 1,704,960 2,328,603 2,328,603 1,977,0001,891,000
Total Requirements $17,870,950 $20,297,901 $19,922,721$19,349,901$16,287,339
Full-Time Equivalents4.00 5.75 5.75 8.00Civilian 4.00
1.00 1.00 1.00 1.00Grants 0.00
119.00 120.00 120.00 122.00Sworn 118.00
Total FTEs 124.00 126.75 131.00126.75122.00
Performance Measures
Rate of DWI-related fatalities per100,000 population
2.882.81 0.60 2.732.97
Rate of serious-injury-producingcollisions per 100,000 population
10.6412.91 8.77 12.5210.97
Rate of traffic fatalities per 100,000population
6.778.56 6.70 8.476.84
ServicesAccident investigation; collision analysis; coordination of enforcement efforts; coordination of multiple agency efforts
Bold/Italicized Measure = Key Indicator
2012-13 Proposed Budget, Austin, TX
Volume I | 123
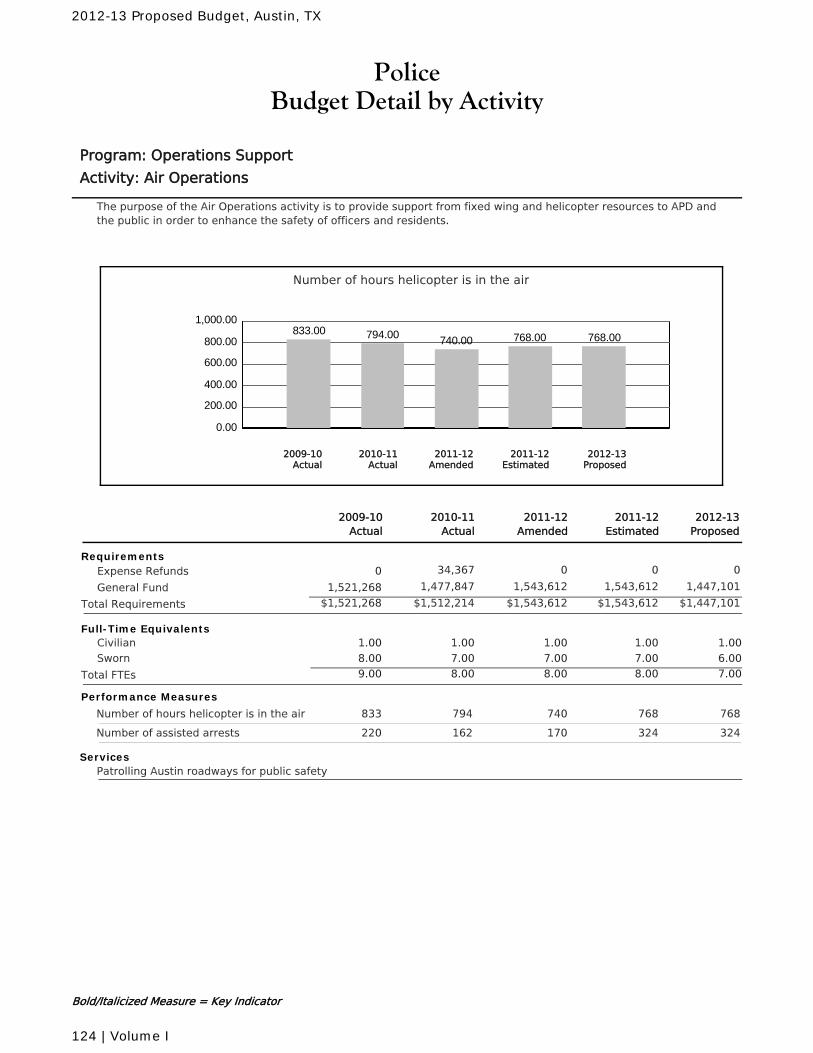
PoliceBudget Detail by Activity
Program: Operations Support
Activity: Air Operations
The purpose of the Air Operations activity is to provide support from fixed wing and helicopter resources to APD andthe public in order to enhance the safety of officers and residents.
Number of hours helicopter is in the air
0.00
200.00
400.00
600.00
800.00
1,000.00833.00 794.00 740.00 768.00 768.00
2010-11Actual
2012-13Proposed
2011-12Amended
2011-12Estimated
2009-10Actual
2011-12Amended
2010-11Actual
2011-12Estimated
2012-13Proposed
2009-10Actual
RequirementsExpense Refunds 34,367 0 0 00
General Fund 1,477,847 1,543,612 1,543,612 1,447,1011,521,268
Total Requirements $1,512,214 $1,543,612 $1,447,101$1,543,612$1,521,268
Full-Time Equivalents1.00 1.00 1.00 1.00Civilian 1.00
7.00 7.00 7.00 6.00Sworn 8.00
Total FTEs 8.00 8.00 7.008.009.00
Performance Measures
Number of hours helicopter is in the air 740794 768 768833
Number of assisted arrests 170162 324 324220
ServicesPatrolling Austin roadways for public safety
Bold/Italicized Measure = Key Indicator
2012-13 Proposed Budget, Austin, TX
124 | Volume I
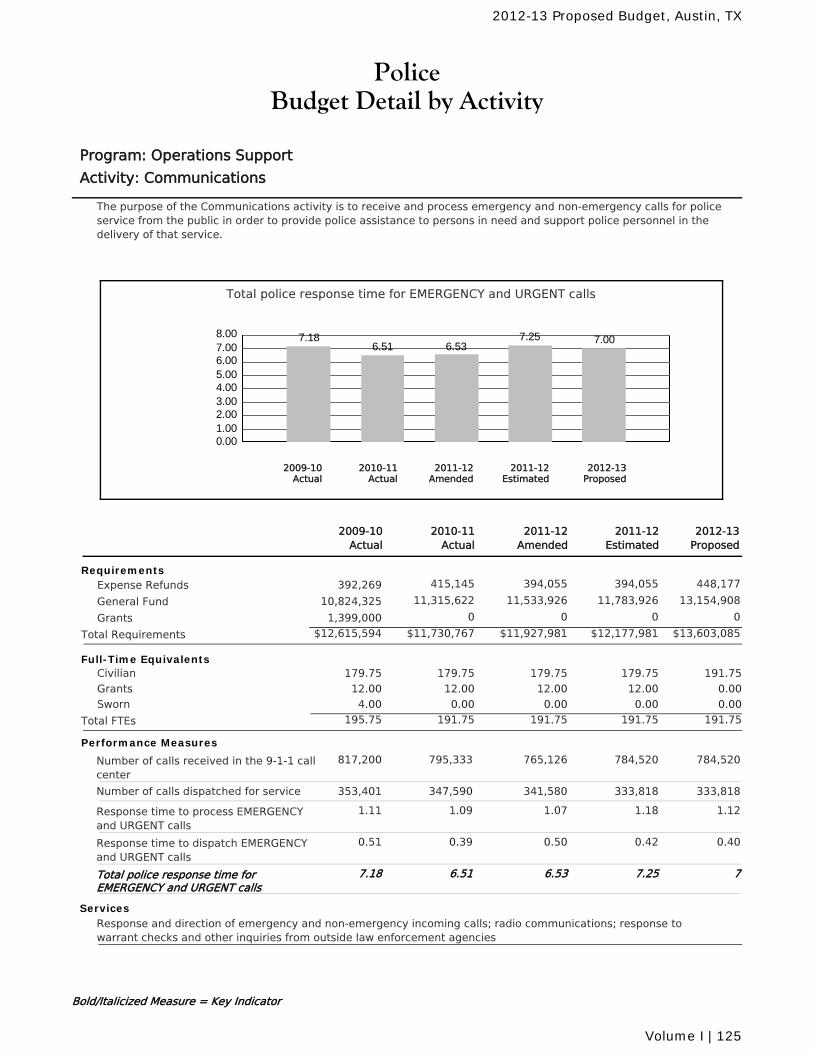
PoliceBudget Detail by Activity
Program: Operations Support
Activity: Communications
The purpose of the Communications activity is to receive and process emergency and non-emergency calls for policeservice from the public in order to provide police assistance to persons in need and support police personnel in thedelivery of that service.
Total police response time for EMERGENCY and URGENT calls
0.001.002.003.004.005.006.007.008.00 7.18
6.51 6.537.25 7.00
2010-11Actual
2012-13Proposed
2011-12Amended
2011-12Estimated
2009-10Actual
2011-12Amended
2010-11Actual
2011-12Estimated
2012-13Proposed
2009-10Actual
RequirementsExpense Refunds 415,145 394,055 394,055 448,177392,269
General Fund 11,315,622 11,533,926 11,783,926 13,154,90810,824,325
Grants 0 0 0 01,399,000
Total Requirements $11,730,767 $12,177,981 $13,603,085$11,927,981$12,615,594
Full-Time Equivalents179.75 179.75 179.75 191.75Civilian 179.75
12.00 12.00 12.00 0.00Grants 12.00
0.00 0.00 0.00 0.00Sworn 4.00
Total FTEs 191.75 191.75 191.75191.75195.75
Performance Measures
Number of calls received in the 9-1-1 callcenter
765,126795,333 784,520 784,520817,200
Number of calls dispatched for service 341,580347,590 333,818 333,818353,401
Response time to process EMERGENCYand URGENT calls
1.071.09 1.18 1.121.11
Response time to dispatch EMERGENCYand URGENT calls
0.500.39 0.42 0.400.51
Total police response time forEMERGENCY and URGENT calls
6.536.51 7.25 77.18
ServicesResponse and direction of emergency and non-emergency incoming calls; radio communications; response towarrant checks and other inquiries from outside law enforcement agencies
Bold/Italicized Measure = Key Indicator
2012-13 Proposed Budget, Austin, TX
Volume I | 125
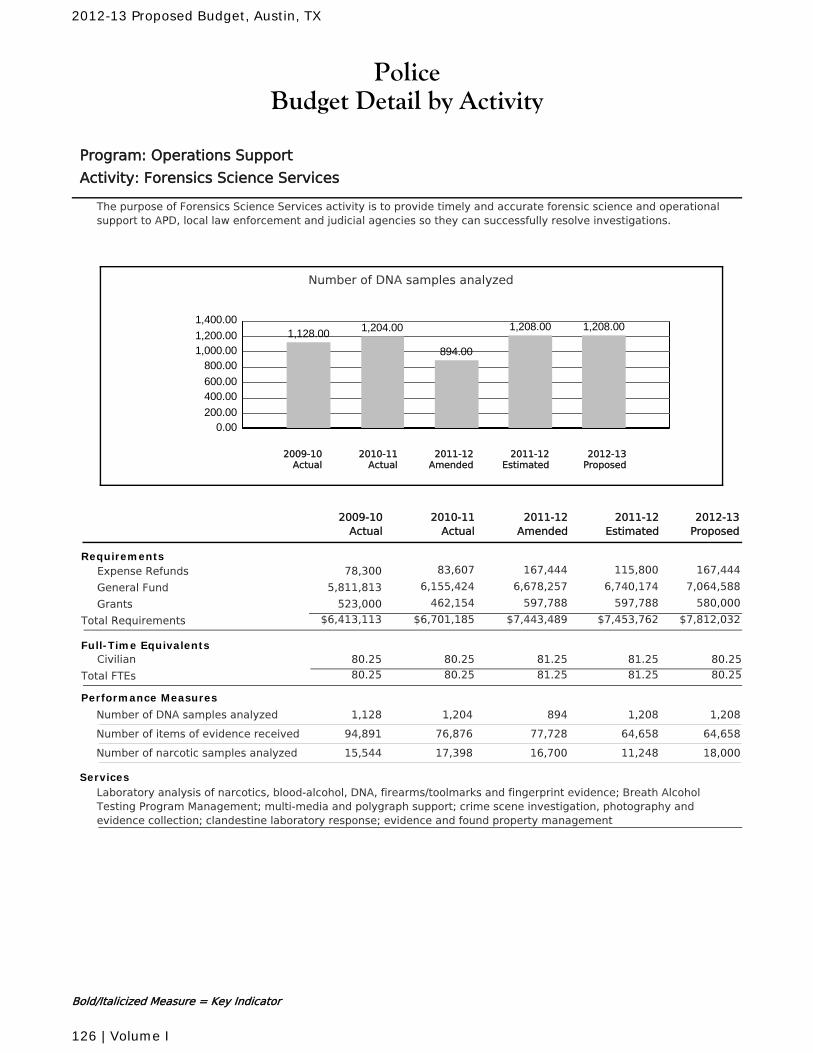
PoliceBudget Detail by Activity
Program: Operations Support
Activity: Forensics Science Services
The purpose of Forensics Science Services activity is to provide timely and accurate forensic science and operationalsupport to APD, local law enforcement and judicial agencies so they can successfully resolve investigations.
Number of DNA samples analyzed
0.00200.00
400.00600.00
800.001,000.001,200.00
1,400.001,128.00 1,204.00
894.00
1,208.00 1,208.00
2010-11Actual
2012-13Proposed
2011-12Amended
2011-12Estimated
2009-10Actual
2011-12Amended
2010-11Actual
2011-12Estimated
2012-13Proposed
2009-10Actual
RequirementsExpense Refunds 83,607 167,444 115,800 167,44478,300
General Fund 6,155,424 6,678,257 6,740,174 7,064,5885,811,813
Grants 462,154 597,788 597,788 580,000523,000
Total Requirements $6,701,185 $7,453,762 $7,812,032$7,443,489$6,413,113
Full-Time Equivalents80.25 81.25 81.25 80.25Civilian 80.25
Total FTEs 80.25 81.25 80.2581.2580.25
Performance Measures
Number of DNA samples analyzed 8941,204 1,208 1,2081,128
Number of items of evidence received 77,72876,876 64,658 64,65894,891
Number of narcotic samples analyzed 16,70017,398 11,248 18,00015,544
ServicesLaboratory analysis of narcotics, blood-alcohol, DNA, firearms/toolmarks and fingerprint evidence; Breath AlcoholTesting Program Management; multi-media and polygraph support; crime scene investigation, photography andevidence collection; clandestine laboratory response; evidence and found property management
Bold/Italicized Measure = Key Indicator
2012-13 Proposed Budget, Austin, TX
126 | Volume I
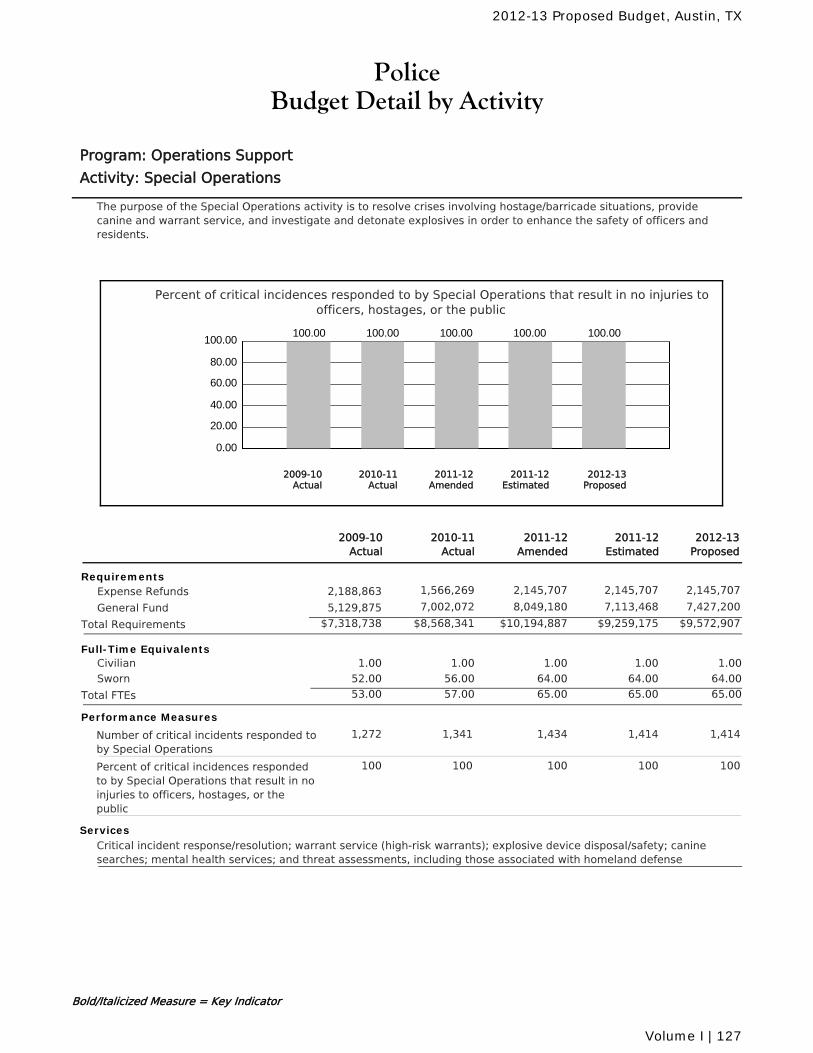
PoliceBudget Detail by Activity
Program: Operations Support
Activity: Special Operations
The purpose of the Special Operations activity is to resolve crises involving hostage/barricade situations, providecanine and warrant service, and investigate and detonate explosives in order to enhance the safety of officers andresidents.
Percent of critical incidences responded to by Special Operations that result in no injuries toofficers, hostages, or the public
0.00
20.00
40.00
60.00
80.00
100.00100.00 100.00 100.00 100.00 100.00
2010-11Actual
2012-13Proposed
2011-12Amended
2011-12Estimated
2009-10Actual
2011-12Amended
2010-11Actual
2011-12Estimated
2012-13Proposed
2009-10Actual
RequirementsExpense Refunds 1,566,269 2,145,707 2,145,707 2,145,7072,188,863
General Fund 7,002,072 8,049,180 7,113,468 7,427,2005,129,875
Total Requirements $8,568,341 $9,259,175 $9,572,907$10,194,887$7,318,738
Full-Time Equivalents1.00 1.00 1.00 1.00Civilian 1.00
56.00 64.00 64.00 64.00Sworn 52.00
Total FTEs 57.00 65.00 65.0065.0053.00
Performance Measures
Number of critical incidents responded toby Special Operations
1,4341,341 1,414 1,4141,272
Percent of critical incidences respondedto by Special Operations that result in noinjuries to officers, hostages, or thepublic
100100 100 100100
ServicesCritical incident response/resolution; warrant service (high-risk warrants); explosive device disposal/safety; caninesearches; mental health services; and threat assessments, including those associated with homeland defense
Bold/Italicized Measure = Key Indicator
2012-13 Proposed Budget, Austin, TX
Volume I | 127
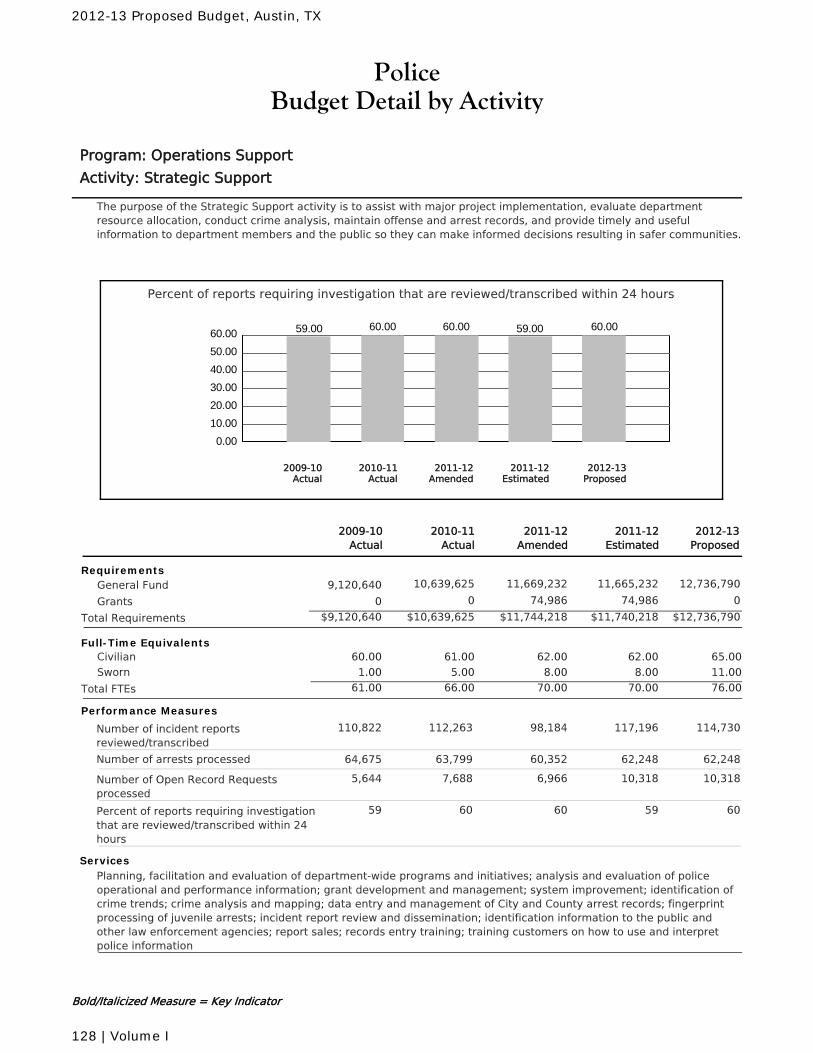
PoliceBudget Detail by Activity
Program: Operations Support
Activity: Strategic Support
The purpose of the Strategic Support activity is to assist with major project implementation, evaluate departmentresource allocation, conduct crime analysis, maintain offense and arrest records, and provide timely and usefulinformation to department members and the public so they can make informed decisions resulting in safer communities.
Percent of reports requiring investigation that are reviewed/transcribed within 24 hours
0.00
10.00
20.00
30.00
40.00
50.00
60.00 59.00 60.00 60.00 59.00 60.00
2010-11Actual
2012-13Proposed
2011-12Amended
2011-12Estimated
2009-10Actual
2011-12Amended
2010-11Actual
2011-12Estimated
2012-13Proposed
2009-10Actual
RequirementsGeneral Fund 10,639,625 11,669,232 11,665,232 12,736,7909,120,640
Grants 0 74,986 74,986 00
Total Requirements $10,639,625 $11,740,218 $12,736,790$11,744,218$9,120,640
Full-Time Equivalents61.00 62.00 62.00 65.00Civilian 60.00
5.00 8.00 8.00 11.00Sworn 1.00
Total FTEs 66.00 70.00 76.0070.0061.00
Performance Measures
Number of incident reportsreviewed/transcribed
98,184112,263 117,196 114,730110,822
Number of arrests processed 60,35263,799 62,248 62,24864,675
Number of Open Record Requestsprocessed
6,9667,688 10,318 10,3185,644
Percent of reports requiring investigationthat are reviewed/transcribed within 24hours
6060 59 6059
ServicesPlanning, facilitation and evaluation of department-wide programs and initiatives; analysis and evaluation of policeoperational and performance information; grant development and management; system improvement; identification ofcrime trends; crime analysis and mapping; data entry and management of City and County arrest records; fingerprintprocessing of juvenile arrests; incident report review and dissemination; identification information to the public andother law enforcement agencies; report sales; records entry training; training customers on how to use and interpretpolice information
Bold/Italicized Measure = Key Indicator
2012-13 Proposed Budget, Austin, TX
128 | Volume I
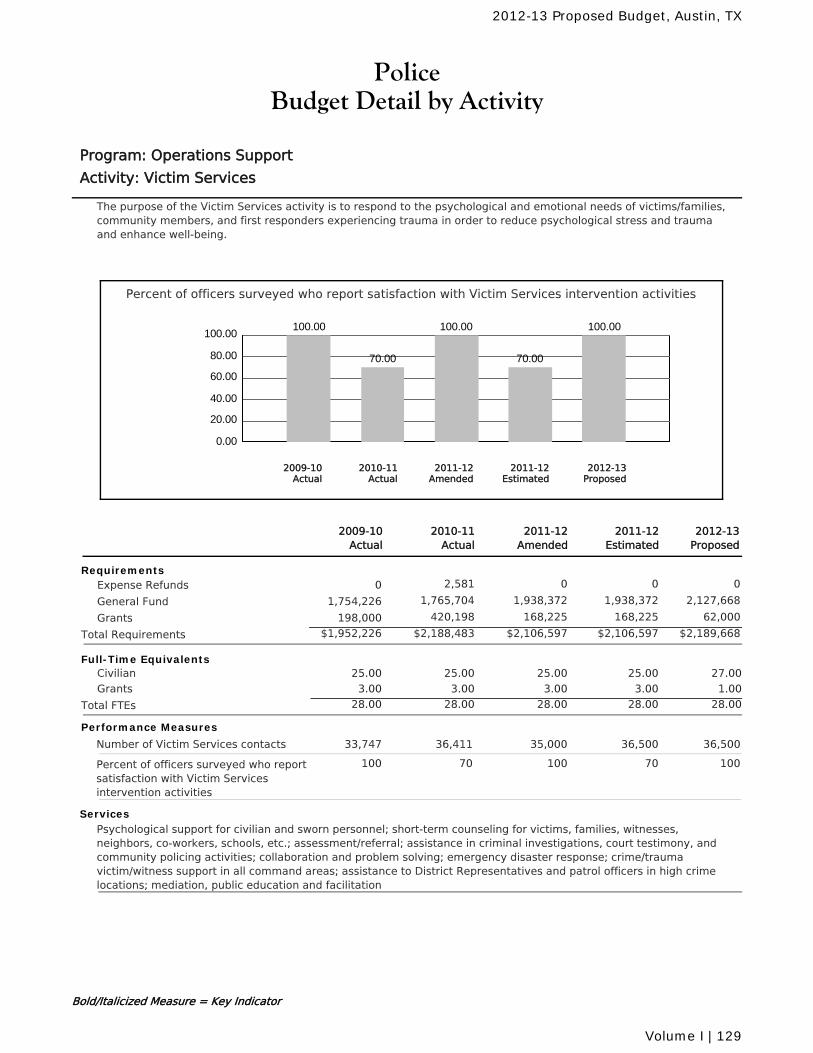
PoliceBudget Detail by Activity
Program: Operations Support
Activity: Victim Services
The purpose of the Victim Services activity is to respond to the psychological and emotional needs of victims/families,community members, and first responders experiencing trauma in order to reduce psychological stress and traumaand enhance well-being.
Percent of officers surveyed who report satisfaction with Victim Services intervention activities
0.00
20.00
40.00
60.00
80.00
100.00100.00
70.00
100.00
70.00
100.00
2010-11Actual
2012-13Proposed
2011-12Amended
2011-12Estimated
2009-10Actual
2011-12Amended
2010-11Actual
2011-12Estimated
2012-13Proposed
2009-10Actual
RequirementsExpense Refunds 2,581 0 0 00
General Fund 1,765,704 1,938,372 1,938,372 2,127,6681,754,226
Grants 420,198 168,225 168,225 62,000198,000
Total Requirements $2,188,483 $2,106,597 $2,189,668$2,106,597$1,952,226
Full-Time Equivalents25.00 25.00 25.00 27.00Civilian 25.00
3.00 3.00 3.00 1.00Grants 3.00
Total FTEs 28.00 28.00 28.0028.0028.00
Performance Measures
Number of Victim Services contacts 35,00036,411 36,500 36,50033,747
Percent of officers surveyed who reportsatisfaction with Victim Servicesintervention activities
10070 70 100100
ServicesPsychological support for civilian and sworn personnel; short-term counseling for victims, families, witnesses,neighbors, co-workers, schools, etc.; assessment/referral; assistance in criminal investigations, court testimony, andcommunity policing activities; collaboration and problem solving; emergency disaster response; crime/traumavictim/witness support in all command areas; assistance to District Representatives and patrol officers in high crimelocations; mediation, public education and facilitation
Bold/Italicized Measure = Key Indicator
2012-13 Proposed Budget, Austin, TX
Volume I | 129
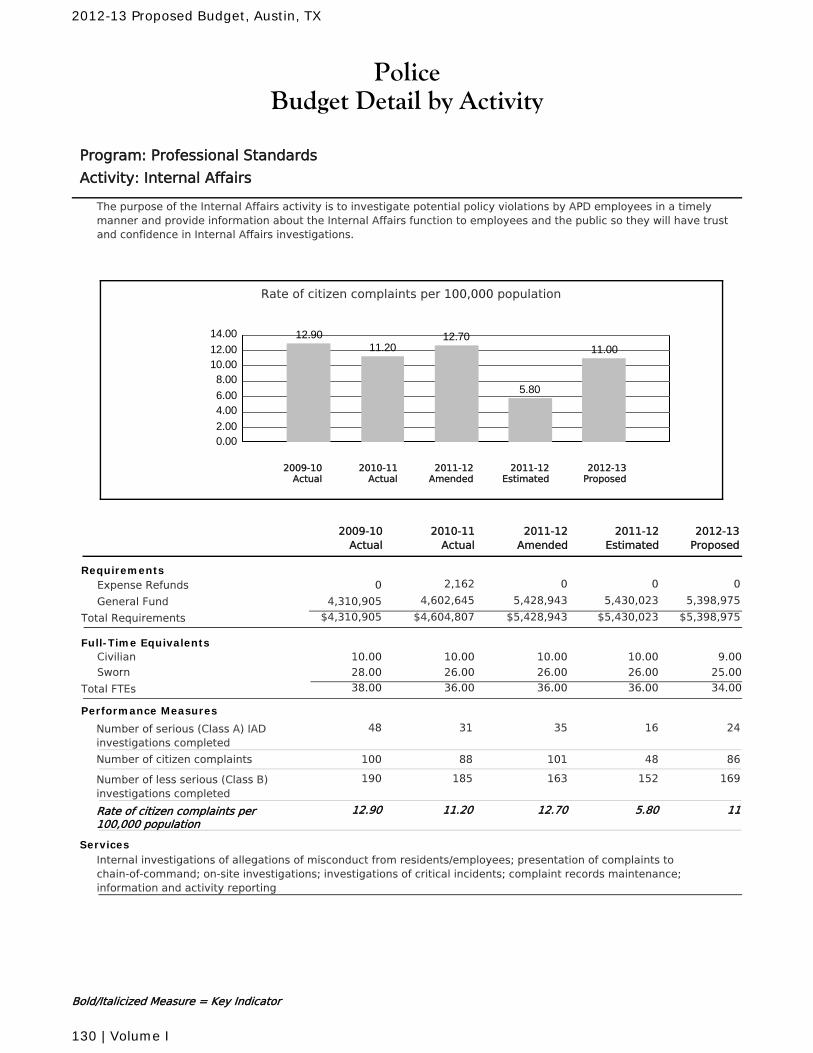
PoliceBudget Detail by Activity
Program: Professional Standards
Activity: Internal Affairs
The purpose of the Internal Affairs activity is to investigate potential policy violations by APD employees in a timelymanner and provide information about the Internal Affairs function to employees and the public so they will have trustand confidence in Internal Affairs investigations.
Rate of citizen complaints per 100,000 population
0.002.00
4.006.00
8.0010.0012.00
14.00 12.9011.20
12.70
5.80
11.00
2010-11Actual
2012-13Proposed
2011-12Amended
2011-12Estimated
2009-10Actual
2011-12Amended
2010-11Actual
2011-12Estimated
2012-13Proposed
2009-10Actual
RequirementsExpense Refunds 2,162 0 0 00
General Fund 4,602,645 5,428,943 5,430,023 5,398,9754,310,905
Total Requirements $4,604,807 $5,430,023 $5,398,975$5,428,943$4,310,905
Full-Time Equivalents10.00 10.00 10.00 9.00Civilian 10.00
26.00 26.00 26.00 25.00Sworn 28.00
Total FTEs 36.00 36.00 34.0036.0038.00
Performance Measures
Number of serious (Class A) IADinvestigations completed
3531 16 2448
Number of citizen complaints 10188 48 86100
Number of less serious (Class B)investigations completed
163185 152 169190
Rate of citizen complaints per100,000 population
12.7011.20 5.80 1112.90
ServicesInternal investigations of allegations of misconduct from residents/employees; presentation of complaints tochain-of-command; on-site investigations; investigations of critical incidents; complaint records maintenance;information and activity reporting
Bold/Italicized Measure = Key Indicator
2012-13 Proposed Budget, Austin, TX
130 | Volume I

PoliceBudget Detail by Activity
Program: Professional Standards
Activity: Recruiting
The purpose of the Recruiting activity is to recruit and screen for diverse, qualified and professional police applicantsso the APD can have the personnel resources necessary to maintain authorized staffing and meet its goals.
Percent of authorized sworn positions filled
0.00
20.00
40.00
60.00
80.00
100.00 98.00 96.00 97.00 95.00 95.00
2010-11Actual
2012-13Proposed
2011-12Amended
2011-12Estimated
2009-10Actual
2011-12Amended
2010-11Actual
2011-12Estimated
2012-13Proposed
2009-10Actual
RequirementsGeneral Fund 1,497,339 1,790,450 1,782,636 1,665,5431,279,435
Total Requirements $1,497,339 $1,782,636 $1,665,543$1,790,450$1,279,435
Full-Time Equivalents1.00 1.00 1.00 1.00Civilian 1.00
12.00 12.00 12.00 10.00Sworn 12.00
Total FTEs 13.00 13.00 11.0013.0013.00
Performance Measures
Number of applicants selected for cadetclass
120120 150 12025
Percent of authorized sworn positionsfilled
9796 95 9598
Percent of cadets entering the academywho are historically minority
No Goal28 15 No Goal36
ServicesApplicant recruitment; Testing and screening of applicants; Background investigations of applicants
Bold/Italicized Measure = Key Indicator
2012-13 Proposed Budget, Austin, TX
Volume I | 131
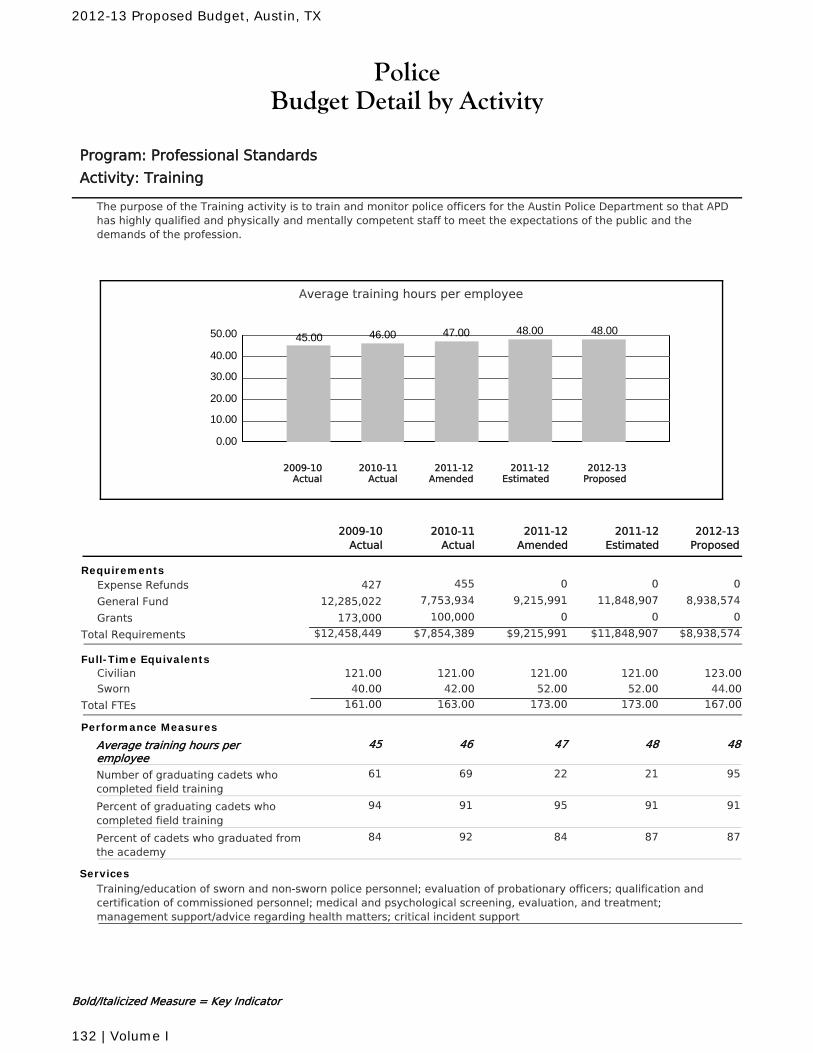
PoliceBudget Detail by Activity
Program: Professional Standards
Activity: Training
The purpose of the Training activity is to train and monitor police officers for the Austin Police Department so that APDhas highly qualified and physically and mentally competent staff to meet the expectations of the public and thedemands of the profession.
Average training hours per employee
0.00
10.00
20.00
30.00
40.00
50.00 45.00 46.00 47.00 48.00 48.00
2010-11Actual
2012-13Proposed
2011-12Amended
2011-12Estimated
2009-10Actual
2011-12Amended
2010-11Actual
2011-12Estimated
2012-13Proposed
2009-10Actual
RequirementsExpense Refunds 455 0 0 0427
General Fund 7,753,934 9,215,991 11,848,907 8,938,57412,285,022
Grants 100,000 0 0 0173,000
Total Requirements $7,854,389 $11,848,907 $8,938,574$9,215,991$12,458,449
Full-Time Equivalents121.00 121.00 121.00 123.00Civilian 121.00
42.00 52.00 52.00 44.00Sworn 40.00
Total FTEs 163.00 173.00 167.00173.00161.00
Performance Measures
Average training hours peremployee
4746 48 4845
Number of graduating cadets whocompleted field training
2269 21 9561
Percent of graduating cadets whocompleted field training
9591 91 9194
Percent of cadets who graduated fromthe academy
8492 87 8784
ServicesTraining/education of sworn and non-sworn police personnel; evaluation of probationary officers; qualification andcertification of commissioned personnel; medical and psychological screening, evaluation, and treatment;management support/advice regarding health matters; critical incident support
Bold/Italicized Measure = Key Indicator
2012-13 Proposed Budget, Austin, TX
132 | Volume I
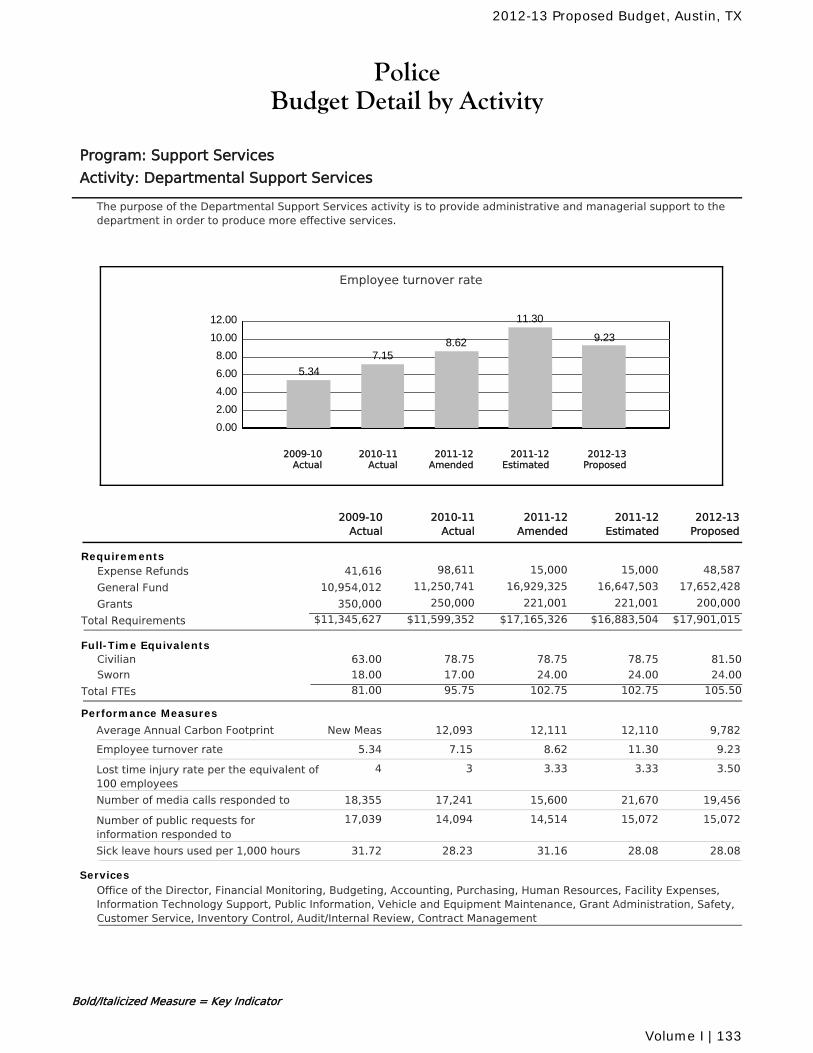
PoliceBudget Detail by Activity
Program: Support Services
Activity: Departmental Support Services
The purpose of the Departmental Support Services activity is to provide administrative and managerial support to thedepartment in order to produce more effective services.
Employee turnover rate
0.00
2.00
4.00
6.00
8.00
10.00
12.00
5.34
7.158.62
11.30
9.23
2010-11Actual
2012-13Proposed
2011-12Amended
2011-12Estimated
2009-10Actual
2011-12Amended
2010-11Actual
2011-12Estimated
2012-13Proposed
2009-10Actual
RequirementsExpense Refunds 98,611 15,000 15,000 48,58741,616
General Fund 11,250,741 16,929,325 16,647,503 17,652,42810,954,012
Grants 250,000 221,001 221,001 200,000350,000
Total Requirements $11,599,352 $16,883,504 $17,901,015$17,165,326$11,345,627
Full-Time Equivalents78.75 78.75 78.75 81.50Civilian 63.00
17.00 24.00 24.00 24.00Sworn 18.00
Total FTEs 95.75 102.75 105.50102.7581.00
Performance Measures
Average Annual Carbon Footprint 12,11112,093 12,110 9,782New Meas
Employee turnover rate 8.627.15 11.30 9.235.34
Lost time injury rate per the equivalent of100 employees
3.333 3.33 3.504
Number of media calls responded to 15,60017,241 21,670 19,45618,355
Number of public requests forinformation responded to
14,51414,094 15,072 15,07217,039
Sick leave hours used per 1,000 hours 31.1628.23 28.08 28.0831.72
ServicesOffice of the Director, Financial Monitoring, Budgeting, Accounting, Purchasing, Human Resources, Facility Expenses,Information Technology Support, Public Information, Vehicle and Equipment Maintenance, Grant Administration, Safety,Customer Service, Inventory Control, Audit/Internal Review, Contract Management
Bold/Italicized Measure = Key Indicator
2012-13 Proposed Budget, Austin, TX
Volume I | 133
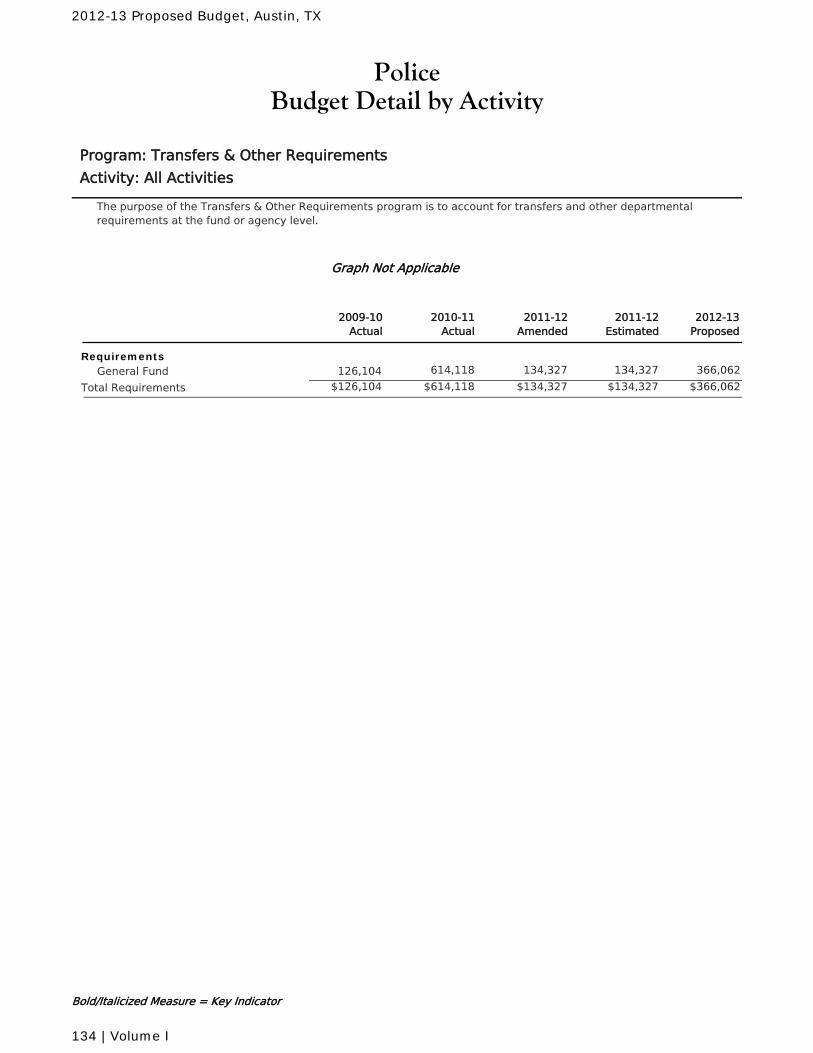
PoliceBudget Detail by Activity
Program: Transfers & Other Requirements
Activity: All Activities
The purpose of the Transfers & Other Requirements program is to account for transfers and other departmentalrequirements at the fund or agency level.
Graph Not Applicable
2011-12Amended
2010-11Actual
2011-12Estimated
2012-13Proposed
2009-10Actual
RequirementsGeneral Fund 614,118 134,327 134,327 366,062126,104
Total Requirements $614,118 $134,327 $366,062$134,327$126,104
Bold/Italicized Measure = Key Indicator
2012-13 Proposed Budget, Austin, TX
134 | Volume I
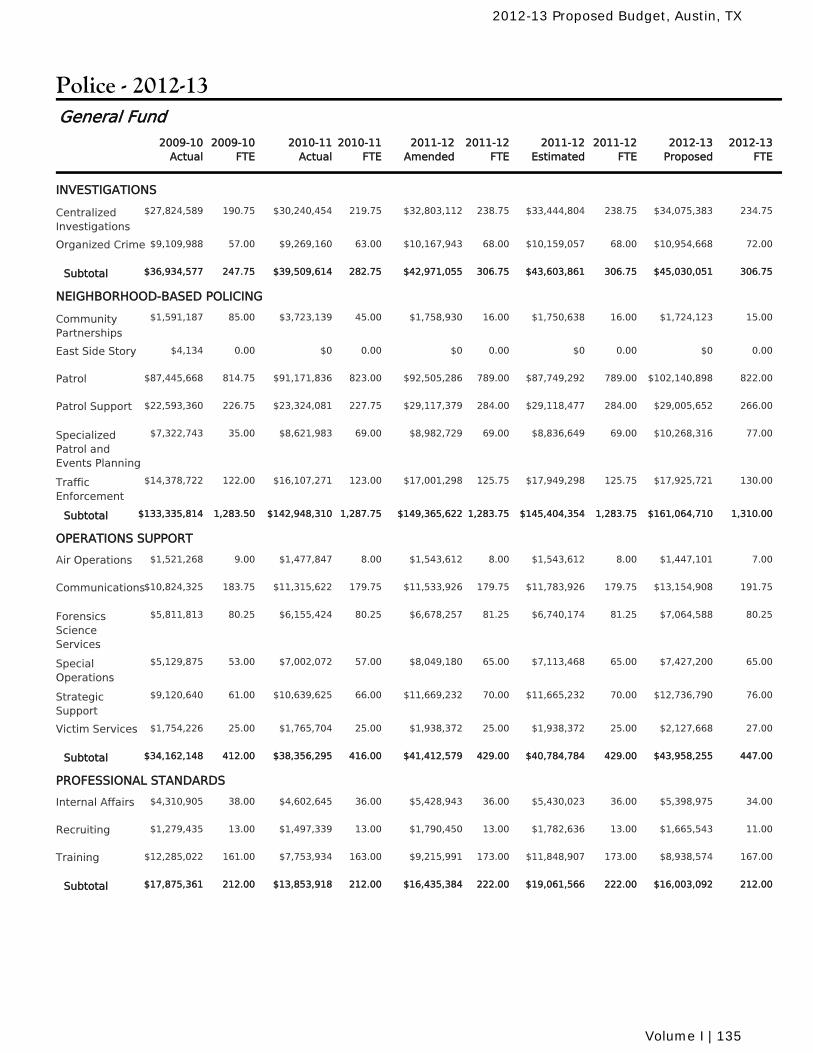
Police - 2012-13
2010-11Actual
2010-11FTE
2011-12Amended
2011-12FTE
2011-12Estimated
2011-12FTE
2009-10Actual
2009-10FTE
2012-13Proposed
2012-13FTE
General Fund
INVESTIGATIONS
$30,240,454 219.75 $32,803,112 238.75 $33,444,804 238.75CentralizedInvestigations
190.75 $34,075,383 234.75$27,824,589
$9,269,160 63.00 $10,167,943 68.00 $10,159,057 68.00Organized Crime 57.00 $10,954,668 72.00$9,109,988
$39,509,614 282.75 $42,971,055 306.75 $43,603,861 306.75Subtotal 247.75 $45,030,051 306.75$36,934,577
NEIGHBORHOOD-BASED POLICING
$3,723,139 45.00 $1,758,930 16.00 $1,750,638 16.00CommunityPartnerships
85.00 $1,724,123 15.00$1,591,187
$0 0.00 $0 0.00 $0 0.00East Side Story 0.00 $0 0.00$4,134
$91,171,836 823.00 $92,505,286 789.00 $87,749,292 789.00Patrol 814.75 $102,140,898 822.00$87,445,668
$23,324,081 227.75 $29,117,379 284.00 $29,118,477 284.00Patrol Support 226.75 $29,005,652 266.00$22,593,360
$8,621,983 69.00 $8,982,729 69.00 $8,836,649 69.00SpecializedPatrol andEvents Planning
35.00 $10,268,316 77.00$7,322,743
$16,107,271 123.00 $17,001,298 125.75 $17,949,298 125.75TrafficEnforcement
122.00 $17,925,721 130.00$14,378,722
$142,948,310 1,287.75 $149,365,622 1,283.75 $145,404,354 1,283.75Subtotal 1,283.50 $161,064,710 1,310.00$133,335,814
OPERATIONS SUPPORT
$1,477,847 8.00 $1,543,612 8.00 $1,543,612 8.00Air Operations 9.00 $1,447,101 7.00$1,521,268
$11,315,622 179.75 $11,533,926 179.75 $11,783,926 179.75Communications 183.75 $13,154,908 191.75$10,824,325
$6,155,424 80.25 $6,678,257 81.25 $6,740,174 81.25ForensicsScienceServices
80.25 $7,064,588 80.25$5,811,813
$7,002,072 57.00 $8,049,180 65.00 $7,113,468 65.00SpecialOperations
53.00 $7,427,200 65.00$5,129,875
$10,639,625 66.00 $11,669,232 70.00 $11,665,232 70.00StrategicSupport
61.00 $12,736,790 76.00$9,120,640
$1,765,704 25.00 $1,938,372 25.00 $1,938,372 25.00Victim Services 25.00 $2,127,668 27.00$1,754,226
$38,356,295 416.00 $41,412,579 429.00 $40,784,784 429.00Subtotal 412.00 $43,958,255 447.00$34,162,148
PROFESSIONAL STANDARDS
$4,602,645 36.00 $5,428,943 36.00 $5,430,023 36.00Internal Affairs 38.00 $5,398,975 34.00$4,310,905
$1,497,339 13.00 $1,790,450 13.00 $1,782,636 13.00Recruiting 13.00 $1,665,543 11.00$1,279,435
$7,753,934 163.00 $9,215,991 173.00 $11,848,907 173.00Training 161.00 $8,938,574 167.00$12,285,022
$13,853,918 212.00 $16,435,384 222.00 $19,061,566 222.00Subtotal 212.00 $16,003,092 212.00$17,875,361
2012-13 Proposed Budget, Austin, TX
Volume I | 135
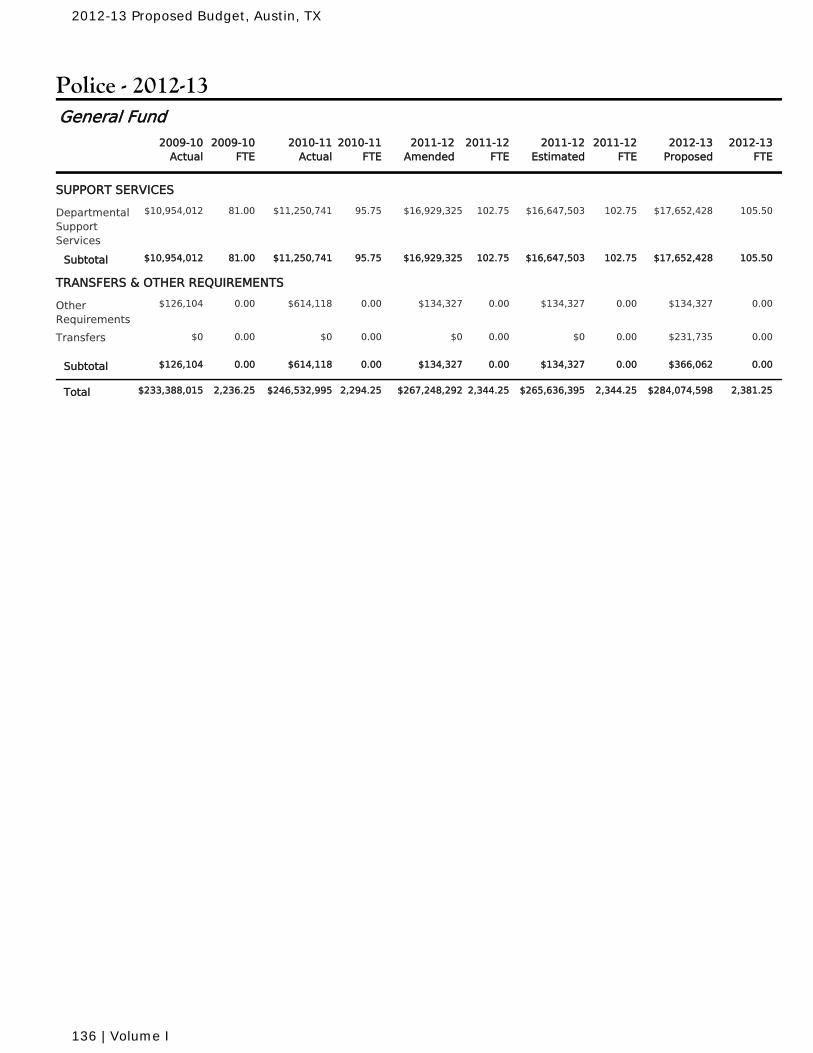
Police - 2012-13
2010-11Actual
2010-11FTE
2011-12Amended
2011-12FTE
2011-12Estimated
2011-12FTE
2009-10Actual
2009-10FTE
2012-13Proposed
2012-13FTE
General Fund
SUPPORT SERVICES
$11,250,741 95.75 $16,929,325 102.75 $16,647,503 102.75DepartmentalSupportServices
81.00 $17,652,428 105.50$10,954,012
$11,250,741 95.75 $16,929,325 102.75 $16,647,503 102.75Subtotal 81.00 $17,652,428 105.50$10,954,012
TRANSFERS & OTHER REQUIREMENTS
$614,118 0.00 $134,327 0.00 $134,327 0.00OtherRequirements
0.00 $134,327 0.00$126,104
$0 0.00 $0 0.00 $0 0.00Transfers 0.00 $231,735 0.00$0
$614,118 0.00 $134,327 0.00 $134,327 0.00Subtotal 0.00 $366,062 0.00$126,104
$246,532,995 2,294.25 $267,248,292 2,344.25 $265,636,395 2,344.25Total 2,236.25 $284,074,598 2,381.25$233,388,015
2012-13 Proposed Budget, Austin, TX
136 | Volume I
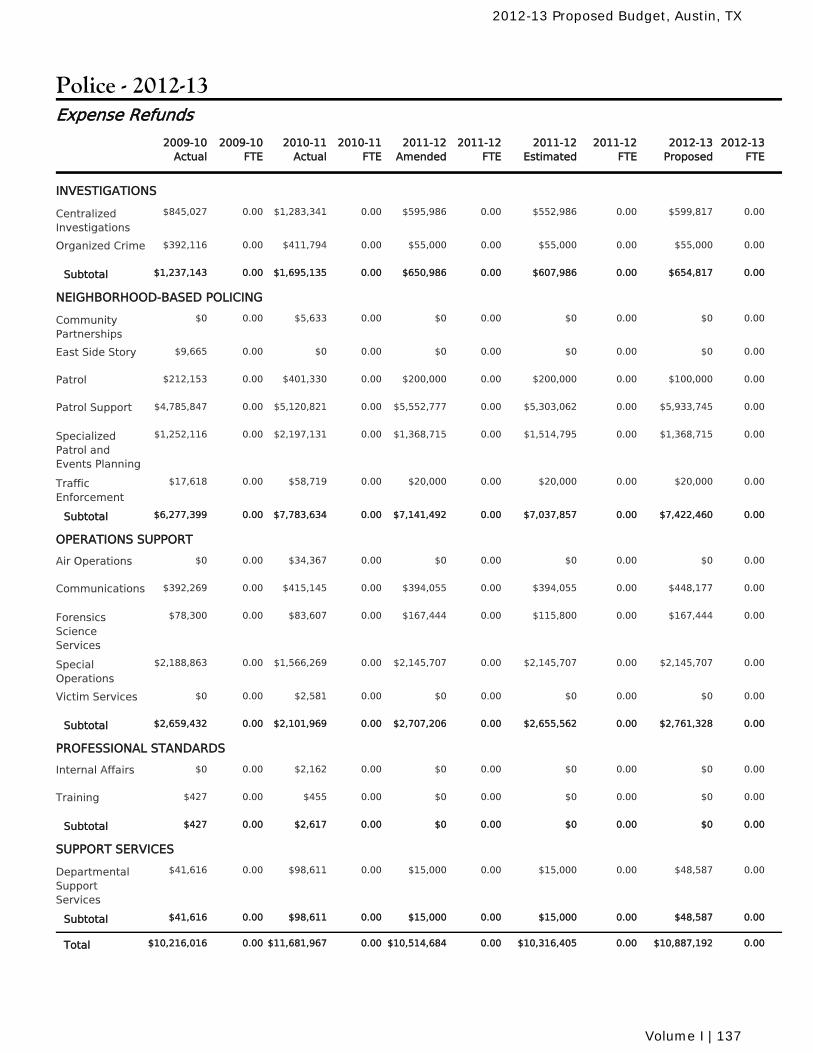
Police - 2012-13
2010-11Actual
2010-11FTE
2011-12Amended
2011-12FTE
2011-12Estimated
2011-12FTE
2009-10Actual
2009-10FTE
2012-13Proposed
2012-13FTE
Expense Refunds
INVESTIGATIONS
$1,283,341 0.00 $595,986 0.00 $552,986 0.00CentralizedInvestigations
0.00 $599,817 0.00$845,027
$411,794 0.00 $55,000 0.00 $55,000 0.00Organized Crime 0.00 $55,000 0.00$392,116
$1,695,135 0.00 $650,986 0.00 $607,986 0.00Subtotal 0.00 $654,817 0.00$1,237,143
NEIGHBORHOOD-BASED POLICING
$5,633 0.00 $0 0.00 $0 0.00CommunityPartnerships
0.00 $0 0.00$0
$0 0.00 $0 0.00 $0 0.00East Side Story 0.00 $0 0.00$9,665
$401,330 0.00 $200,000 0.00 $200,000 0.00Patrol 0.00 $100,000 0.00$212,153
$5,120,821 0.00 $5,552,777 0.00 $5,303,062 0.00Patrol Support 0.00 $5,933,745 0.00$4,785,847
$2,197,131 0.00 $1,368,715 0.00 $1,514,795 0.00SpecializedPatrol andEvents Planning
0.00 $1,368,715 0.00$1,252,116
$58,719 0.00 $20,000 0.00 $20,000 0.00TrafficEnforcement
0.00 $20,000 0.00$17,618
$7,783,634 0.00 $7,141,492 0.00 $7,037,857 0.00Subtotal 0.00 $7,422,460 0.00$6,277,399
OPERATIONS SUPPORT
$34,367 0.00 $0 0.00 $0 0.00Air Operations 0.00 $0 0.00$0
$415,145 0.00 $394,055 0.00 $394,055 0.00Communications 0.00 $448,177 0.00$392,269
$83,607 0.00 $167,444 0.00 $115,800 0.00ForensicsScienceServices
0.00 $167,444 0.00$78,300
$1,566,269 0.00 $2,145,707 0.00 $2,145,707 0.00SpecialOperations
0.00 $2,145,707 0.00$2,188,863
$2,581 0.00 $0 0.00 $0 0.00Victim Services 0.00 $0 0.00$0
$2,101,969 0.00 $2,707,206 0.00 $2,655,562 0.00Subtotal 0.00 $2,761,328 0.00$2,659,432
PROFESSIONAL STANDARDS
$2,162 0.00 $0 0.00 $0 0.00Internal Affairs 0.00 $0 0.00$0
$455 0.00 $0 0.00 $0 0.00Training 0.00 $0 0.00$427
$2,617 0.00 $0 0.00 $0 0.00Subtotal 0.00 $0 0.00$427
SUPPORT SERVICES
$98,611 0.00 $15,000 0.00 $15,000 0.00DepartmentalSupportServices
0.00 $48,587 0.00$41,616
$98,611 0.00 $15,000 0.00 $15,000 0.00Subtotal 0.00 $48,587 0.00$41,616
$11,681,967 0.00 $10,514,684 0.00 $10,316,405 0.00Total 0.00 $10,887,192 0.00$10,216,016
2012-13 Proposed Budget, Austin, TX
Volume I | 137
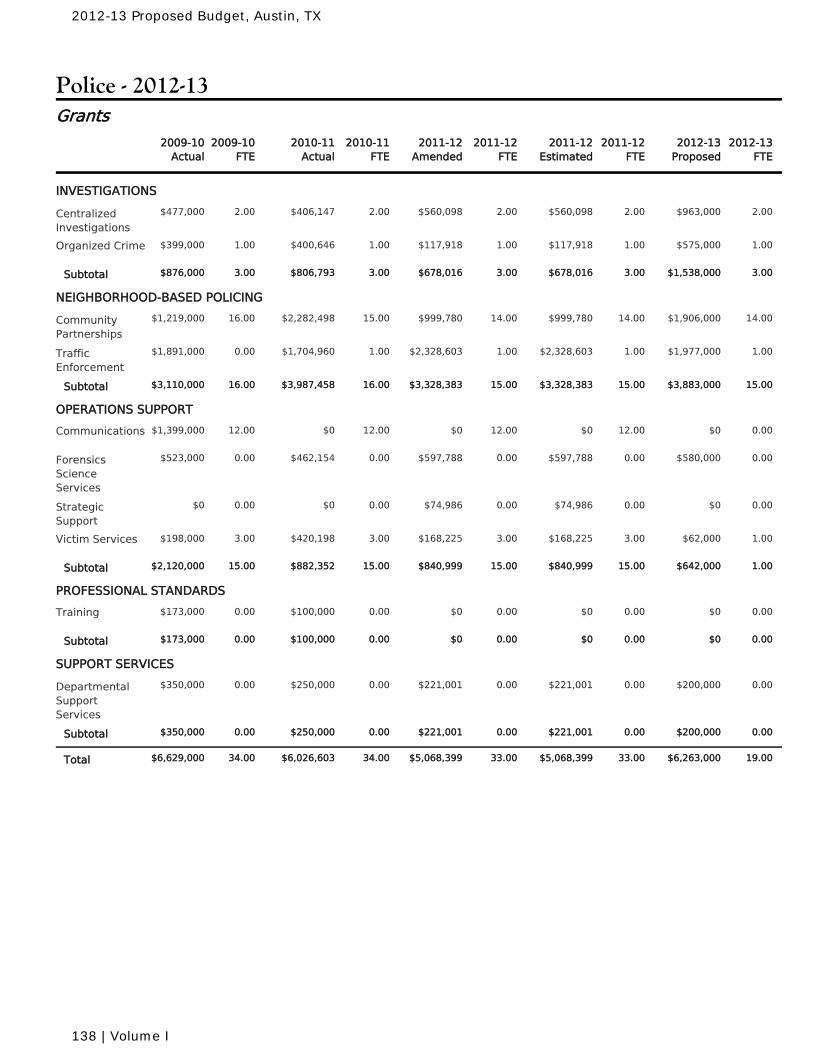
Police - 2012-13
2010-11Actual
2010-11FTE
2011-12Amended
2011-12FTE
2011-12Estimated
2011-12FTE
2009-10Actual
2009-10FTE
2012-13Proposed
2012-13FTE
Grants
INVESTIGATIONS
$406,147 2.00 $560,098 2.00 $560,098 2.00CentralizedInvestigations
2.00 $963,000 2.00$477,000
$400,646 1.00 $117,918 1.00 $117,918 1.00Organized Crime 1.00 $575,000 1.00$399,000
$806,793 3.00 $678,016 3.00 $678,016 3.00Subtotal 3.00 $1,538,000 3.00$876,000
NEIGHBORHOOD-BASED POLICING
$2,282,498 15.00 $999,780 14.00 $999,780 14.00CommunityPartnerships
16.00 $1,906,000 14.00$1,219,000
$1,704,960 1.00 $2,328,603 1.00 $2,328,603 1.00TrafficEnforcement
0.00 $1,977,000 1.00$1,891,000
$3,987,458 16.00 $3,328,383 15.00 $3,328,383 15.00Subtotal 16.00 $3,883,000 15.00$3,110,000
OPERATIONS SUPPORT
$0 12.00 $0 12.00 $0 12.00Communications 12.00 $0 0.00$1,399,000
$462,154 0.00 $597,788 0.00 $597,788 0.00ForensicsScienceServices
0.00 $580,000 0.00$523,000
$0 0.00 $74,986 0.00 $74,986 0.00StrategicSupport
0.00 $0 0.00$0
$420,198 3.00 $168,225 3.00 $168,225 3.00Victim Services 3.00 $62,000 1.00$198,000
$882,352 15.00 $840,999 15.00 $840,999 15.00Subtotal 15.00 $642,000 1.00$2,120,000
PROFESSIONAL STANDARDS
$100,000 0.00 $0 0.00 $0 0.00Training 0.00 $0 0.00$173,000
$100,000 0.00 $0 0.00 $0 0.00Subtotal 0.00 $0 0.00$173,000
SUPPORT SERVICES
$250,000 0.00 $221,001 0.00 $221,001 0.00DepartmentalSupportServices
0.00 $200,000 0.00$350,000
$250,000 0.00 $221,001 0.00 $221,001 0.00Subtotal 0.00 $200,000 0.00$350,000
$6,026,603 34.00 $5,068,399 33.00 $5,068,399 33.00Total 34.00 $6,263,000 19.00$6,629,000
2012-13 Proposed Budget, Austin, TX
138 | Volume I
City of Austin
2012-2013 Proposed
Budget
Volume I Community Services

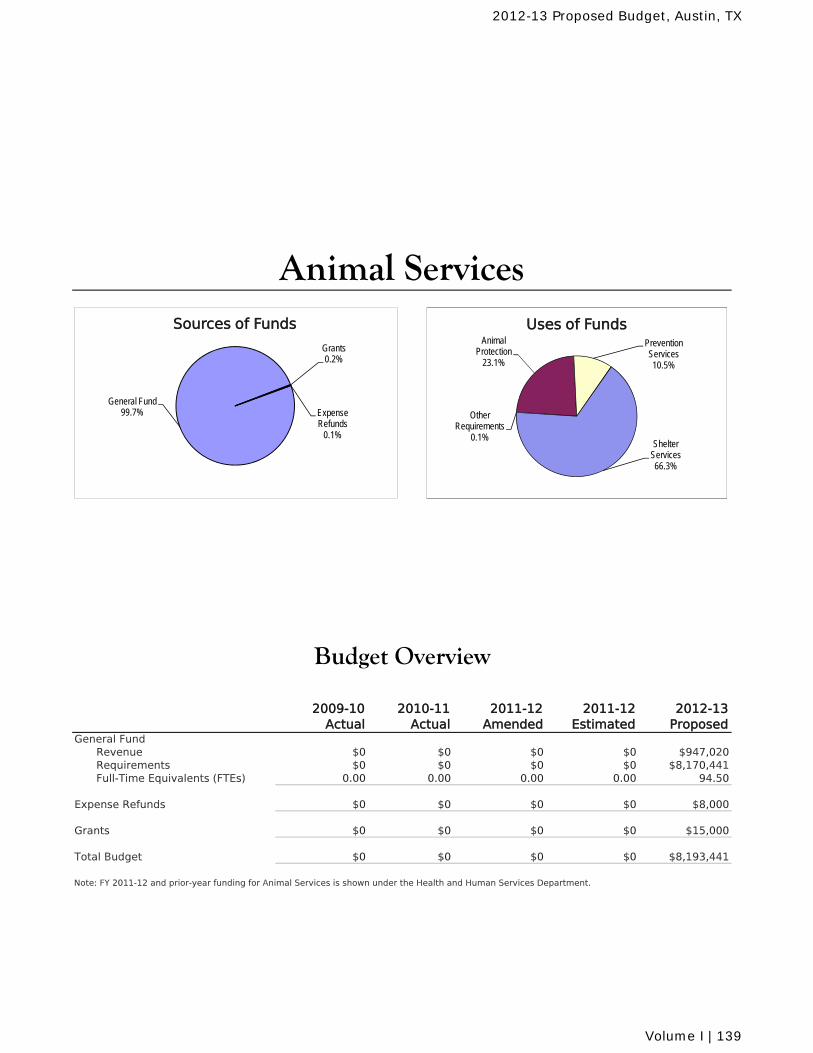
2009-10 Actual
2010-11 Actual
2011-12 Amended
2011-12 Estimated
2012-13 Proposed
General FundRevenue $0 $0 $0 $0 $947,020Requirements $0 $0 $0 $0 $8,170,441Full-Time Equivalents (FTEs) 0.00 0.00 0.00 0.00 94.50
Expense Refunds $0 $0 $0 $0 $8,000
Grants $0 $0 $0 $0 $15,000
Total Budget $0 $0 $0 $0 $8,193,441
Budget Overview
Animal Services
Note: FY 2011-12 and prior-year funding for Animal Services is shown under the Health and Human Services Department.
General Fund99.7%
Grants0.2%
Expense Refunds
0.1%
Sources of FundsAnimal
Protection 23.1%
Prevention Services 10.5%
Shelter Services 66.3%
Other Requirements
0.1%
Uses of Funds
2012-13 Proposed Budget, Austin, TX
Volume I | 139
Animal ServicesOrganization by Program and Activity for 2013
Animal Services Office Animal ProtectionPrevention ServicesShelter Services
Transfers & Other Requirements Other Requirements
2012-13 Proposed Budget, Austin, TX
140 | Volume I

Animal ServicesMission and Goals for 2013
Mission
To prevent animal homelessness and promote humane, compassionate treatment of animals byenforcing regulations, providing a safety net for lost or homeless animals, and achieving liveoutcomes for at least 90% of sheltered pets.
Goals
Maintain and sustain a live outcome rate of 90%.
Increase the number of animals spayed or neutered in the community from 5,019 to 7,000 by 2014.
Improve collaborations with community partners by increasing the number of total live-outcomeanimals transferred to placement partners from 25% to 30% by 2015.
2012-13 Proposed Budget, Austin, TX
Volume I | 141
Animal Services
Message from the Director
The Animal Services Office (ASO) operates the first no-kill municipal shelter in the nation and the largest municipal animal shelter in Central Texas. Maintaining no-kill status means that ASO will not euthanize any adoptable companion animal that enters the center.
ASO has been successful because it has increased the animal foster program, worked closely with partners to transfer animals out of the center, and increased the number of animals adopted. ASO also recognizes the importance of preventing the growth of the animal population and has increased spay-and-neuter and owner education programs as part of this effort. Maintaining no-kill status will require ASO and the City’s sustained commitment and represents the paramount challenge faced by ASO. Other unanticipated challenges have also recently emerged as a result of ASO’s move from Town Lake Animal Center (TLAC) to the new Austin Animal Center in November 2011. The Austin Animal Center is 6,000 square feet larger than TLAC and is configured much differently, which has necessitated a significant change in ASO’s workflow and operations. In addition, the ratio of kennels for cats and dogs has changed, resulting in a shortage of space for sheltered dogs.
Although ASO has been successful at reaching the no-kill goal, it has been at a greater cost than what was anticipated by Council, City management and staff, and community advocates. Overcoming the barriers to no-kill has resulted in increased operational costs, primarily in the form of overtime and temporary-employee expenses.
As we move forward into FY 2012-13, ASO will continue to work hard to sustain the recent success of reaching no-kill status.
Abigail Smith,
Chief Animal Services Officer
2012-13 Proposed Budget, Austin, TX
142 | Volume I
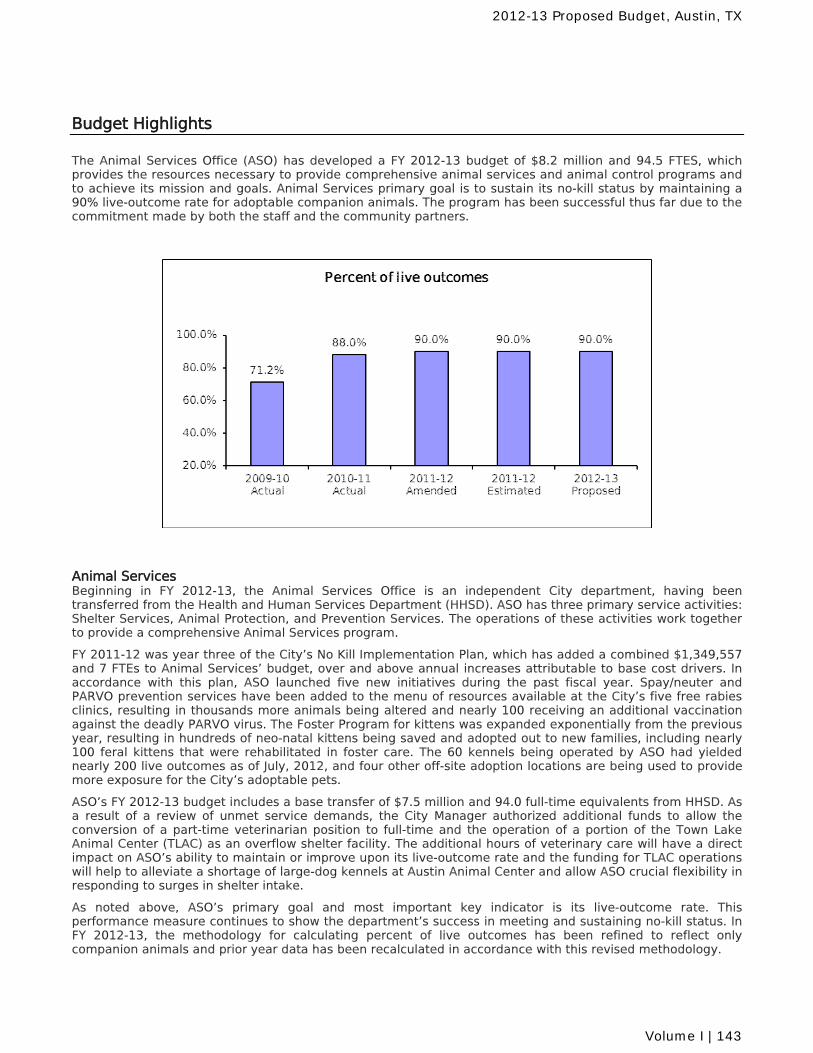
Budget Highlights
The Animal Services Office (ASO) has developed a FY 2012-13 budget of $8.2 million and 94.5 FTES, which provides the resources necessary to provide comprehensive animal services and animal control programs and to achieve its mission and goals. Animal Services primary goal is to sustain its no-kill status by maintaining a 90% live-outcome rate for adoptable companion animals. The program has been successful thus far due to the commitment made by both the staff and the community partners.
Animal Services Beginning in FY 2012-13, the Animal Services Office is an independent City department, having been transferred from the Health and Human Services Department (HHSD). ASO has three primary service activities: Shelter Services, Animal Protection, and Prevention Services. The operations of these activities work together to provide a comprehensive Animal Services program.
FY 2011-12 was year three of the City’s No Kill Implementation Plan, which has added a combined $1,349,557 and 7 FTEs to Animal Services’ budget, over and above annual increases attributable to base cost drivers. In accordance with this plan, ASO launched five new initiatives during the past fiscal year. Spay/neuter and PARVO prevention services have been added to the menu of resources available at the City’s five free rabies clinics, resulting in thousands more animals being altered and nearly 100 receiving an additional vaccination against the deadly PARVO virus. The Foster Program for kittens was expanded exponentially from the previous year, resulting in hundreds of neo-natal kittens being saved and adopted out to new families, including nearly 100 feral kittens that were rehabilitated in foster care. The 60 kennels being operated by ASO had yielded nearly 200 live outcomes as of July, 2012, and four other off-site adoption locations are being used to provide more exposure for the City’s adoptable pets.
ASO’s FY 2012-13 budget includes a base transfer of $7.5 million and 94.0 full-time equivalents from HHSD. As a result of a review of unmet service demands, the City Manager authorized additional funds to allow the conversion of a part-time veterinarian position to full-time and the operation of a portion of the Town Lake Animal Center (TLAC) as an overflow shelter facility. The additional hours of veterinary care will have a direct impact on ASO’s ability to maintain or improve upon its live-outcome rate and the funding for TLAC operations will help to alleviate a shortage of large-dog kennels at Austin Animal Center and allow ASO crucial flexibility in responding to surges in shelter intake.
As noted above, ASO’s primary goal and most important key indicator is its live-outcome rate. This performance measure continues to show the department’s success in meeting and sustaining no-kill status. In FY 2012-13, the methodology for calculating percent of live outcomes has been refined to reflect only companion animals and prior year data has been recalculated in accordance with this revised methodology.
2012-13 Proposed Budget, Austin, TX
Volume I | 143
Revenue ASO’s General Fund revenue for FY 2012-13 is projected at $947,000, a net decrease of $91,000 from FY 2011-12 levels. There are four components of this projected decrease:
Funding received according to the terms of an interlocal agreement with Travis County is expected to be $23,000 less than in the previous year.
The animal rescue fee, which was historically charged to community partners for animals transferred from the shelter and generated only nominal revenue, is being eliminated.
Projected revenue from animal identification fees is being reduced due to operational changes. All adopted animals receive a microchip before leaving the shelter and this cost will be accounted for through adoption charges. The only remaining animal-identification revenue will be generated from rabies clinic attendees and owners reclaiming their pets.
Adoption fees are being changed from a flat-rate structure to a sliding scale which, although projected to generate 20% less revenue, will provide ASO with increased flexibility to increase live outcomes.
2012-13 Proposed Budget, Austin, TX
144 | Volume I
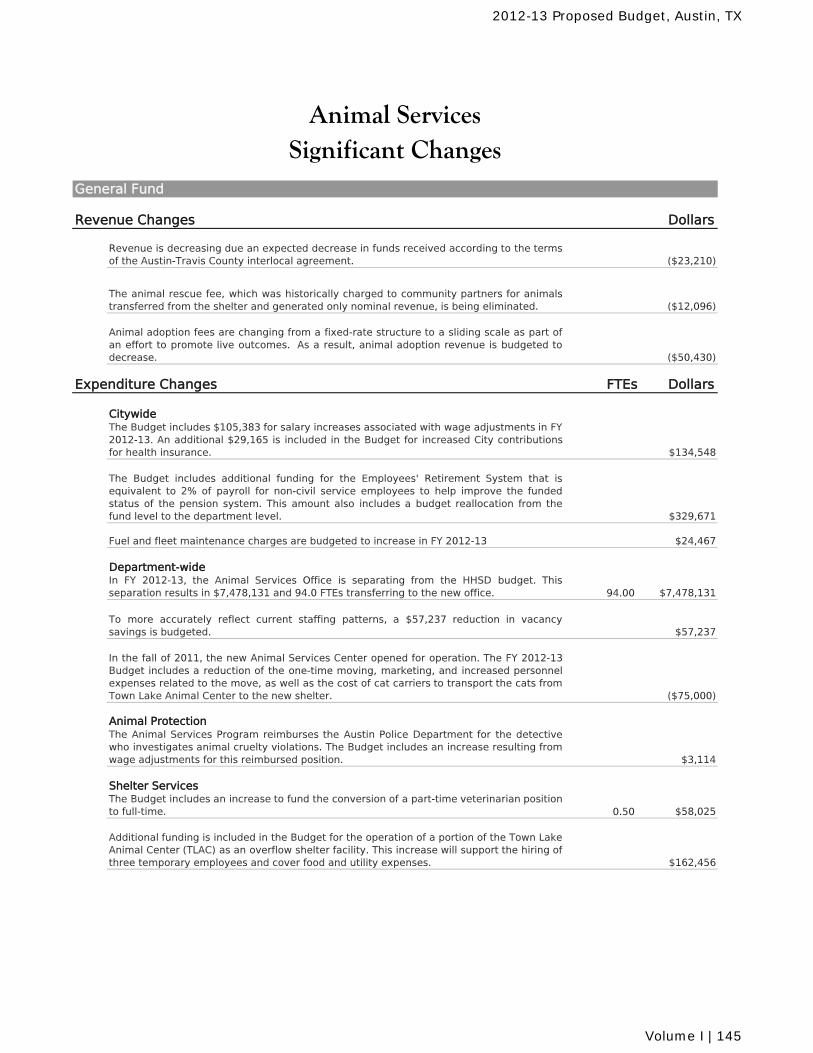
General Fund
Revenue Changes Dollars
Revenue is decreasing due an expected decrease in funds received according to the termsof the Austin-Travis County interlocal agreement. ($23,210)
The animal rescue fee, which was historically charged to community partners for animalstransferred from the shelter and generated only nominal revenue, is being eliminated. ($12,096)
Animal adoption fees are changing from a fixed-rate structure to a sliding scale as part ofan effort to promote live outcomes. As a result, animal adoption revenue is budgeted todecrease. ($50,430)
Expenditure Changes FTEs Dollars
CitywideThe Budget includes $105,383 for salary increases associated with wage adjustments in FY2012-13. An additional $29,165 is included in the Budget for increased City contributionsfor health insurance. $134,548
The Budget includes additional funding for the Employees' Retirement System that isequivalent to 2% of payroll for non-civil service employees to help improve the fundedstatus of the pension system. This amount also includes a budget reallocation from thefund level to the department level. $329,671
Fuel and fleet maintenance charges are budgeted to increase in FY 2012-13. $24,467
Department-wideIn FY 2012-13, the Animal Services Office is separating from the HHSD budget. Thisseparation results in $7,478,131 and 94.0 FTEs transferring to the new office. 94.00 $7,478,131
To more accurately reflect current staffing patterns, a $57,237 reduction in vacancysavings is budgeted. $57,237
In the fall of 2011, the new Animal Services Center opened for operation. The FY 2012-13Budget includes a reduction of the one-time moving, marketing, and increased personnelexpenses related to the move, as well as the cost of cat carriers to transport the cats fromTown Lake Animal Center to the new shelter. ($75,000)
Animal ProtectionThe Animal Services Program reimburses the Austin Police Department for the detectivewho investigates animal cruelty violations. The Budget includes an increase resulting fromwage adjustments for this reimbursed position. $3,114
Shelter ServicesThe Budget includes an increase to fund the conversion of a part-time veterinarian positionto full-time. 0.50 $58,025
Additional funding is included in the Budget for the operation of a portion of the Town LakeAnimal Center (TLAC) as an overflow shelter facility. This increase will support the hiring ofthree temporary employees and cover food and utility expenses. $162,456
Significant ChangesAnimal Services
2012-13 Proposed Budget, Austin, TX
Volume I | 145
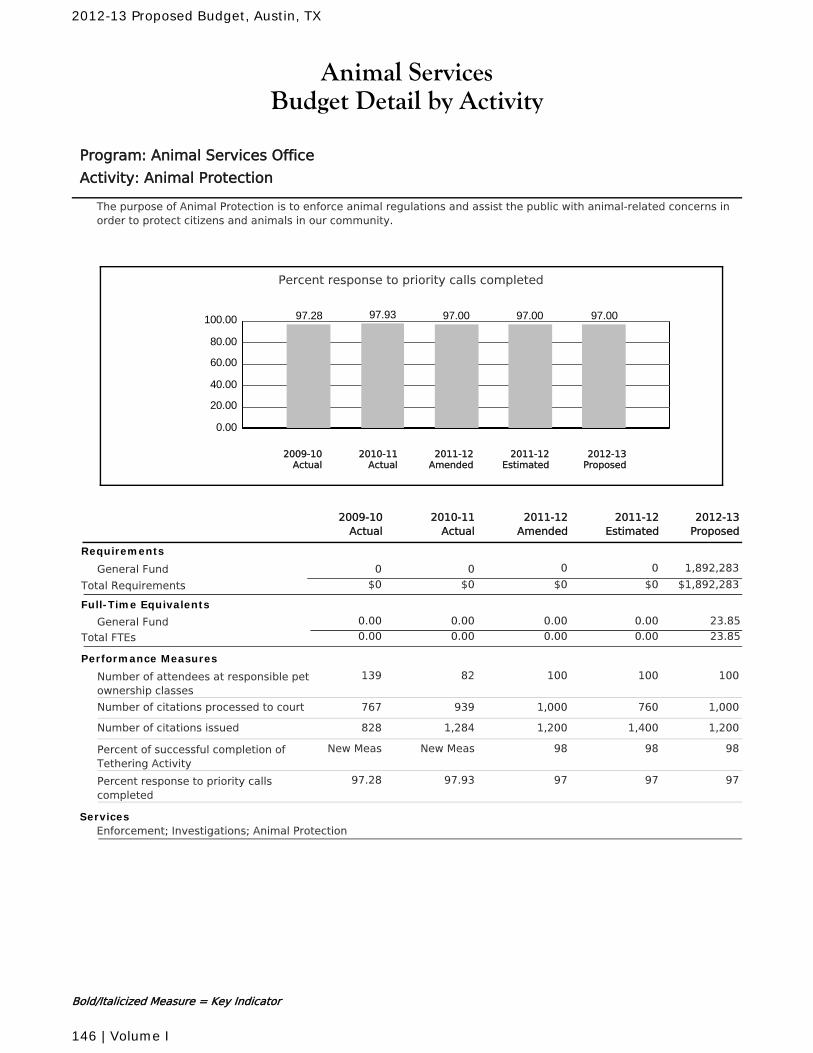
Animal ServicesBudget Detail by Activity
Program: Animal Services Office
Activity: Animal Protection
The purpose of Animal Protection is to enforce animal regulations and assist the public with animal-related concerns inorder to protect citizens and animals in our community.
Percent response to priority calls completed
0.00
20.00
40.00
60.00
80.00
100.00 97.28 97.93 97.00 97.00 97.00
2010-11Actual
2012-13Proposed
2011-12Amended
2011-12Estimated
2009-10Actual
2011-12Amended
2010-11Actual
2011-12Estimated
2012-13Proposed
2009-10Actual
Requirements
General Fund 0 0 1,892,28300
$0 $0 $1,892,283Total Requirements $0$0
Full-Time Equivalents
General Fund 0.00 0.00 0.00 23.850.00
Total FTEs 0.00 0.00 0.00 23.850.00
Performance Measures
Number of attendees at responsible petownership classes
10082 100 100139
Number of citations processed to court 1,000939 760 1,000767
Number of citations issued 1,2001,284 1,400 1,200828
Percent of successful completion ofTethering Activity
98New Meas 98 98New Meas
Percent response to priority callscompleted
9797.93 97 9797.28
ServicesEnforcement; Investigations; Animal Protection
Bold/Italicized Measure = Key Indicator
2012-13 Proposed Budget, Austin, TX
146 | Volume I
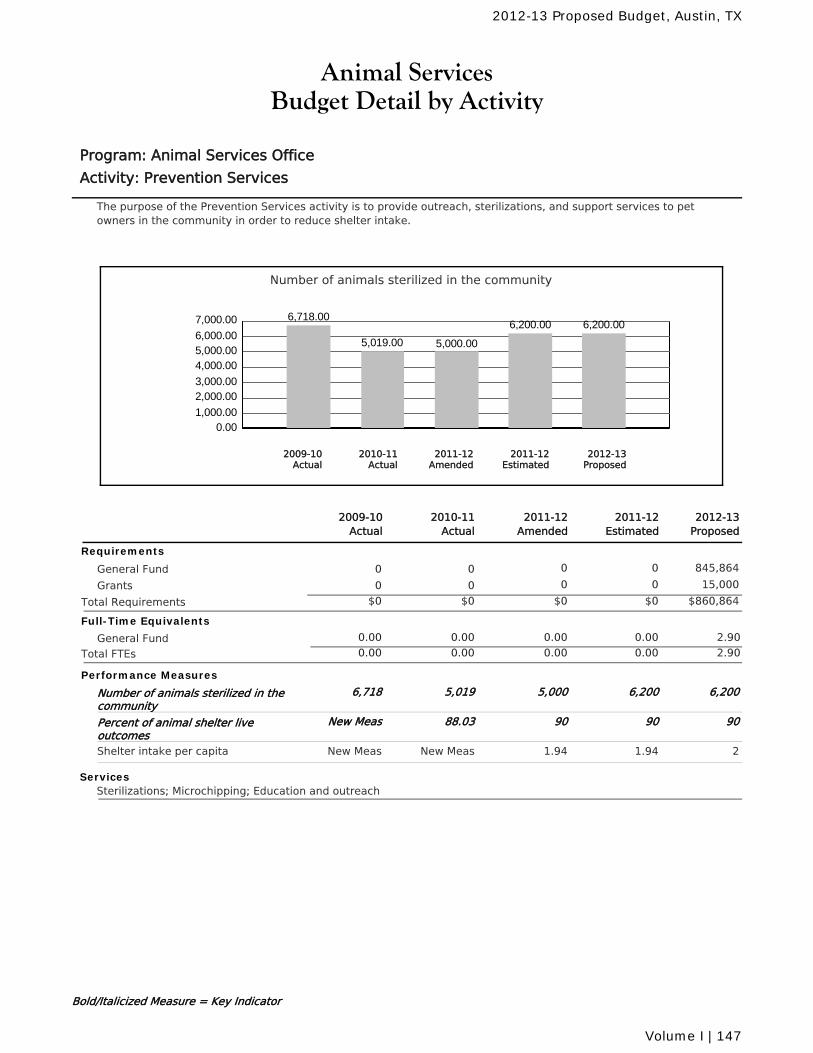
Animal ServicesBudget Detail by Activity
Program: Animal Services Office
Activity: Prevention Services
The purpose of the Prevention Services activity is to provide outreach, sterilizations, and support services to petowners in the community in order to reduce shelter intake.
Number of animals sterilized in the community
0.001,000.00
2,000.003,000.00
4,000.005,000.006,000.00
7,000.00 6,718.00
5,019.00 5,000.00
6,200.00 6,200.00
2010-11Actual
2012-13Proposed
2011-12Amended
2011-12Estimated
2009-10Actual
2011-12Amended
2010-11Actual
2011-12Estimated
2012-13Proposed
2009-10Actual
Requirements
General Fund 0 0 845,86400
Grants 0 0 15,00000
$0 $0 $860,864Total Requirements $0$0
Full-Time Equivalents
General Fund 0.00 0.00 0.00 2.900.00
Total FTEs 0.00 0.00 0.00 2.900.00
Performance Measures
Number of animals sterilized in thecommunity
5,0005,019 6,200 6,2006,718
Percent of animal shelter liveoutcomes
9088.03 90 90New Meas
Shelter intake per capita 1.94New Meas 1.94 2New Meas
ServicesSterilizations; Microchipping; Education and outreach
Bold/Italicized Measure = Key Indicator
2012-13 Proposed Budget, Austin, TX
Volume I | 147
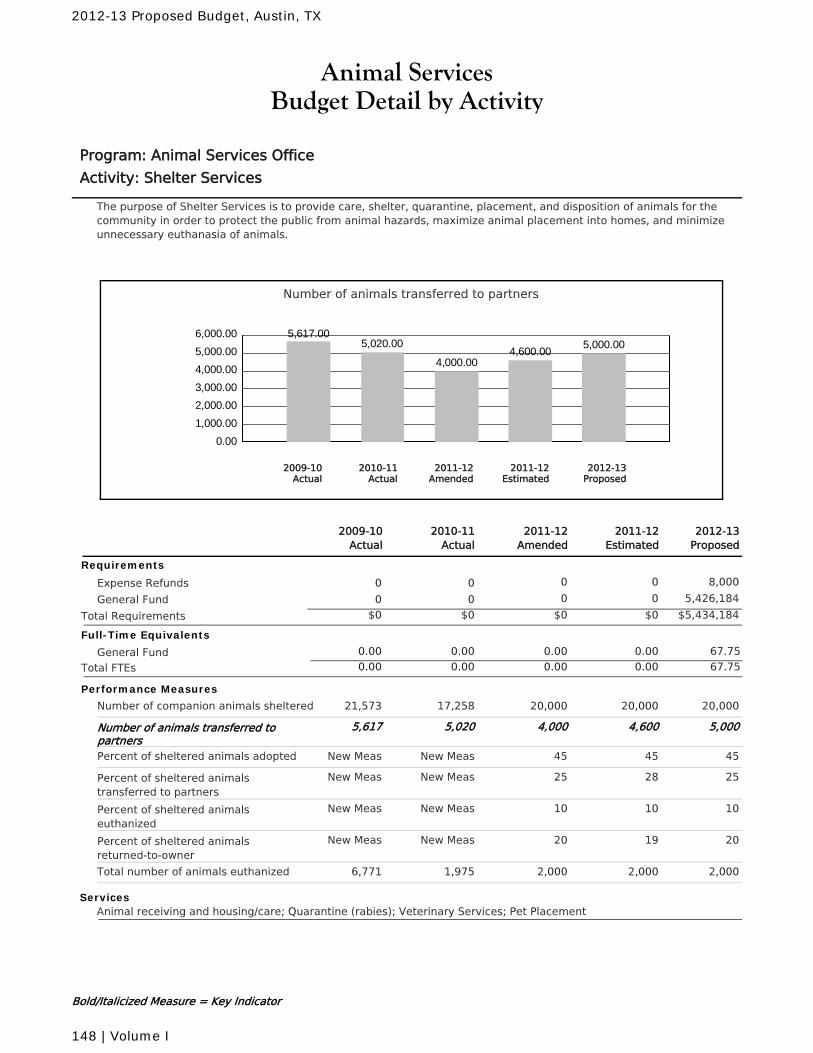
Animal ServicesBudget Detail by Activity
Program: Animal Services Office
Activity: Shelter Services
The purpose of Shelter Services is to provide care, shelter, quarantine, placement, and disposition of animals for thecommunity in order to protect the public from animal hazards, maximize animal placement into homes, and minimizeunnecessary euthanasia of animals.
Number of animals transferred to partners
0.00
1,000.00
2,000.00
3,000.00
4,000.00
5,000.00
6,000.00 5,617.005,020.00
4,000.004,600.00
5,000.00
2010-11Actual
2012-13Proposed
2011-12Amended
2011-12Estimated
2009-10Actual
2011-12Amended
2010-11Actual
2011-12Estimated
2012-13Proposed
2009-10Actual
Requirements
Expense Refunds 0 0 8,00000
General Fund 0 0 5,426,18400
$0 $0 $5,434,184Total Requirements $0$0
Full-Time Equivalents
General Fund 0.00 0.00 0.00 67.750.00
Total FTEs 0.00 0.00 0.00 67.750.00
Performance Measures
Number of companion animals sheltered 20,00017,258 20,000 20,00021,573
Number of animals transferred topartners
4,0005,020 4,600 5,0005,617
Percent of sheltered animals adopted 45New Meas 45 45New Meas
Percent of sheltered animalstransferred to partners
25New Meas 28 25New Meas
Percent of sheltered animalseuthanized
10New Meas 10 10New Meas
Percent of sheltered animalsreturned-to-owner
20New Meas 19 20New Meas
Total number of animals euthanized 2,0001,975 2,000 2,0006,771
ServicesAnimal receiving and housing/care; Quarantine (rabies); Veterinary Services; Pet Placement
Bold/Italicized Measure = Key Indicator
2012-13 Proposed Budget, Austin, TX
148 | Volume I
Animal ServicesBudget Detail by Activity
Program: Transfers & Other Requirements
Activity: All Activities
The purpose of the Transfers & Other Requirements program is to account for transfers and other departmentalrequirements at the fund or agency level.
Graph Not Applicable
2011-12Amended
2010-11Actual
2011-12Estimated
2012-13Proposed
2009-10Actual
Requirements
General Fund 0 0 6,11000
$0 $0 $6,110Total Requirements $0$0
Bold/Italicized Measure = Key Indicator
2012-13 Proposed Budget, Austin, TX
Volume I | 149
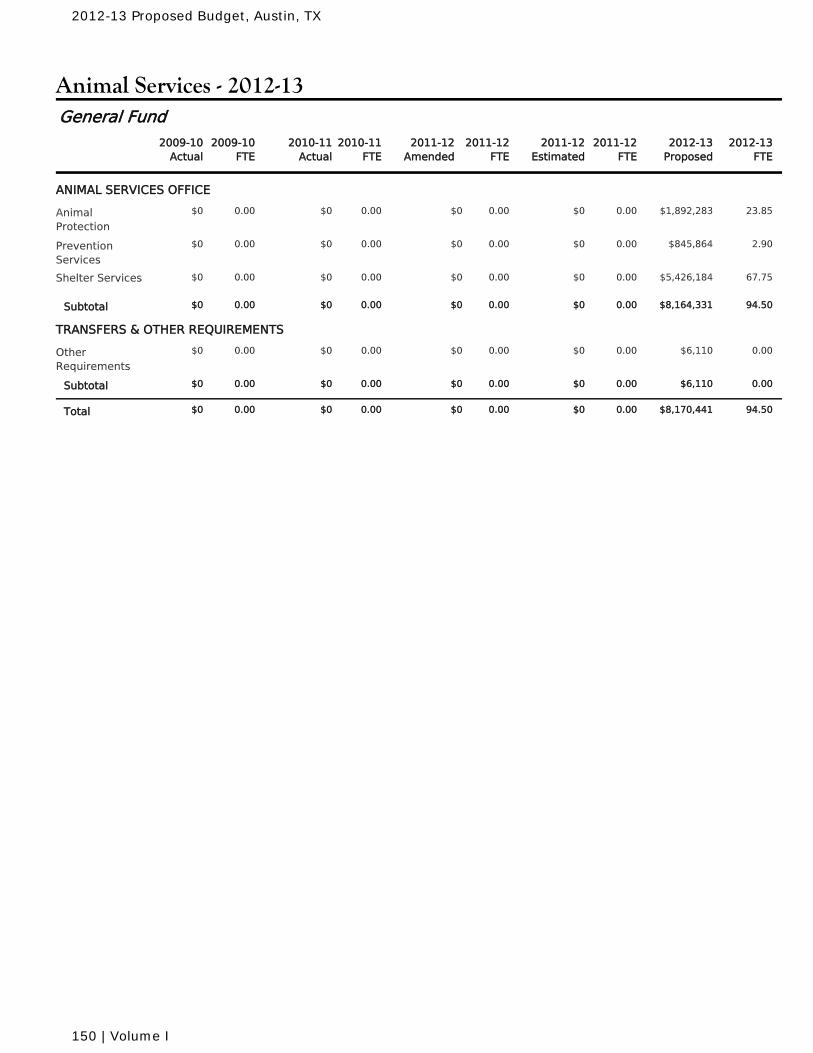
Animal Services - 2012-13
2010-11Actual
2010-11FTE
2011-12Amended
2011-12FTE
2011-12Estimated
2011-12FTE
2009-10Actual
2009-10FTE
2012-13Proposed
2012-13FTE
General Fund
ANIMAL SERVICES OFFICE
$0 0.00 $0 0.00 $0 0.00AnimalProtection
0.00 $1,892,283 23.85$0
$0 0.00 $0 0.00 $0 0.00PreventionServices
0.00 $845,864 2.90$0
$0 0.00 $0 0.00 $0 0.00Shelter Services 0.00 $5,426,184 67.75$0
$0 0.00 $0 0.00 $0 0.00Subtotal 0.00 $8,164,331 94.50$0
TRANSFERS & OTHER REQUIREMENTS
$0 0.00 $0 0.00 $0 0.00OtherRequirements
0.00 $6,110 0.00$0
$0 0.00 $0 0.00 $0 0.00Subtotal 0.00 $6,110 0.00$0
$0 0.00 $0 0.00 $0 0.00Total 0.00 $8,170,441 94.50$0
2012-13 Proposed Budget, Austin, TX
150 | Volume I

Animal Services - 2012-13
2010-11Actual
2010-11FTE
2011-12Amended
2011-12FTE
2011-12Estimated
2011-12FTE
2009-10Actual
2009-10FTE
2012-13Proposed
2012-13FTE
Expense Refunds
ANIMAL SERVICES OFFICE
$0 0.00 $0 0.00 $0 0.00Shelter Services 0.00 $8,000 0.00$0
$0 0.00 $0 0.00 $0 0.00Subtotal 0.00 $8,000 0.00$0
$0 0.00 $0 0.00 $0 0.00Total 0.00 $8,000 0.00$0
2012-13 Proposed Budget, Austin, TX
Volume I | 151
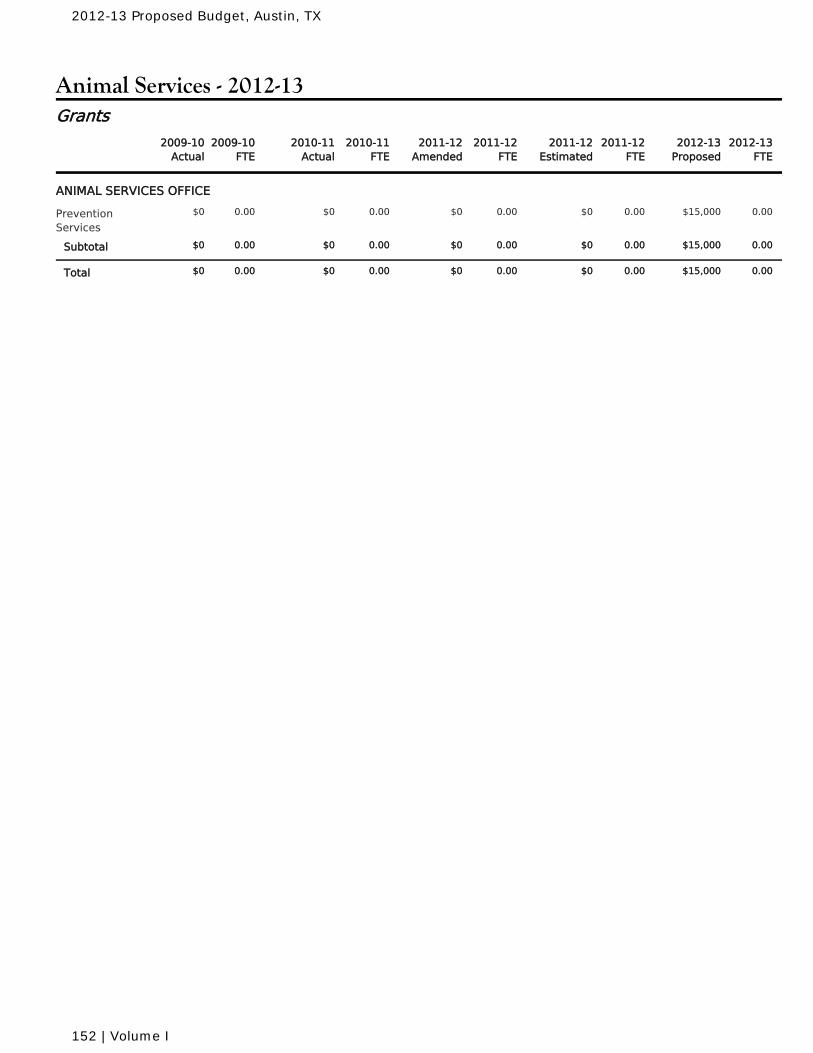
Animal Services - 2012-13
2010-11Actual
2010-11FTE
2011-12Amended
2011-12FTE
2011-12Estimated
2011-12FTE
2009-10Actual
2009-10FTE
2012-13Proposed
2012-13FTE
Grants
ANIMAL SERVICES OFFICE
$0 0.00 $0 0.00 $0 0.00PreventionServices
0.00 $15,000 0.00$0
$0 0.00 $0 0.00 $0 0.00Subtotal 0.00 $15,000 0.00$0
$0 0.00 $0 0.00 $0 0.00Total 0.00 $15,000 0.00$0
2012-13 Proposed Budget, Austin, TX
152 | Volume I
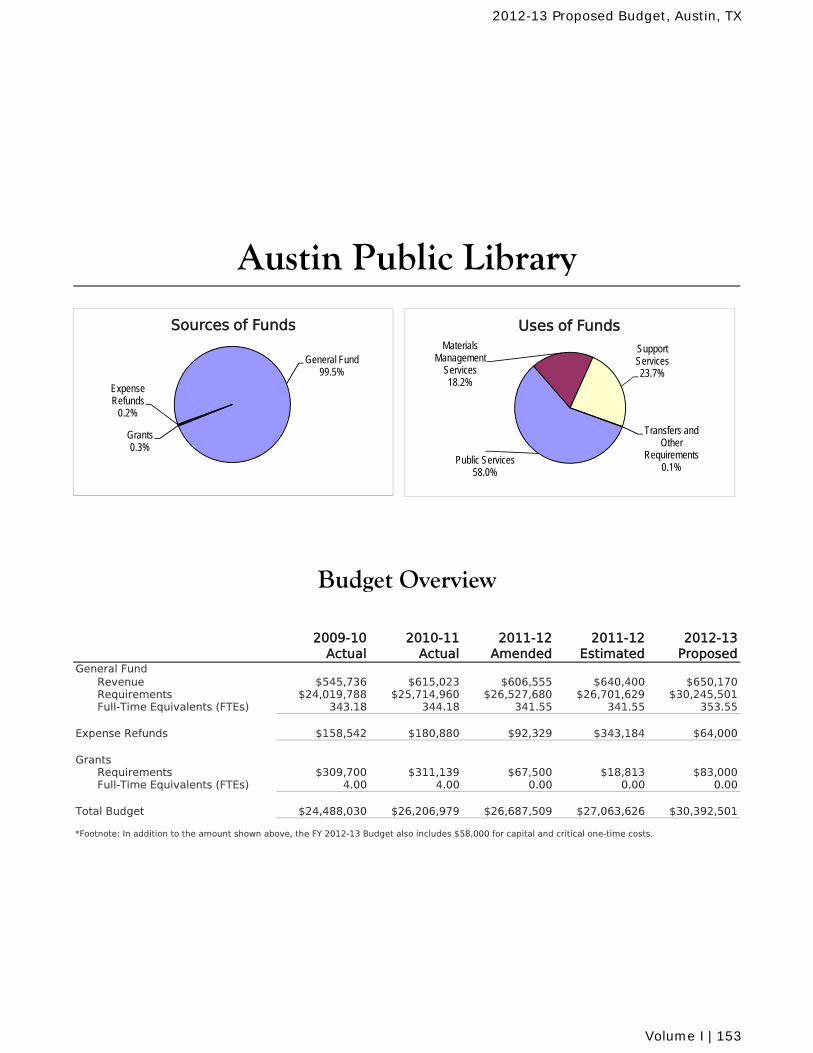
2009-10 Actual
2010-11 Actual
2011-12 Amended
2011-12 Estimated
2012-13 Proposed
General FundRevenue $545,736 $615,023 $606,555 $640,400 $650,170Requirements $24,019,788 $25,714,960 $26,527,680 $26,701,629 $30,245,501Full-Time Equivalents (FTEs) 343.18 344.18 341.55 341.55 353.55
Expense Refunds $158,542 $180,880 $92,329 $343,184 $64,000
GrantsRequirements $309,700 $311,139 $67,500 $18,813 $83,000Full-Time Equivalents (FTEs) 4.00 4.00 0.00 0.00 0.00
Total Budget $24,488,030 $26,206,979 $26,687,509 $27,063,626 $30,392,501
Budget Overview
Austin Public Library
*Footnote: In addition to the amount shown above, the FY 2012-13 Budget also includes $58,000 for capital and critical one-time costs.
Public Services58.0%
Materials Management
Services18.2%
Support Services23.7%
Transfers and Other
Requirements0.1%
Uses of Funds
General Fund99.5%
Grants0.3%
Expense Refunds
0.2%
Sources of Funds
2012-13 Proposed Budget, Austin, TX
Volume I | 153
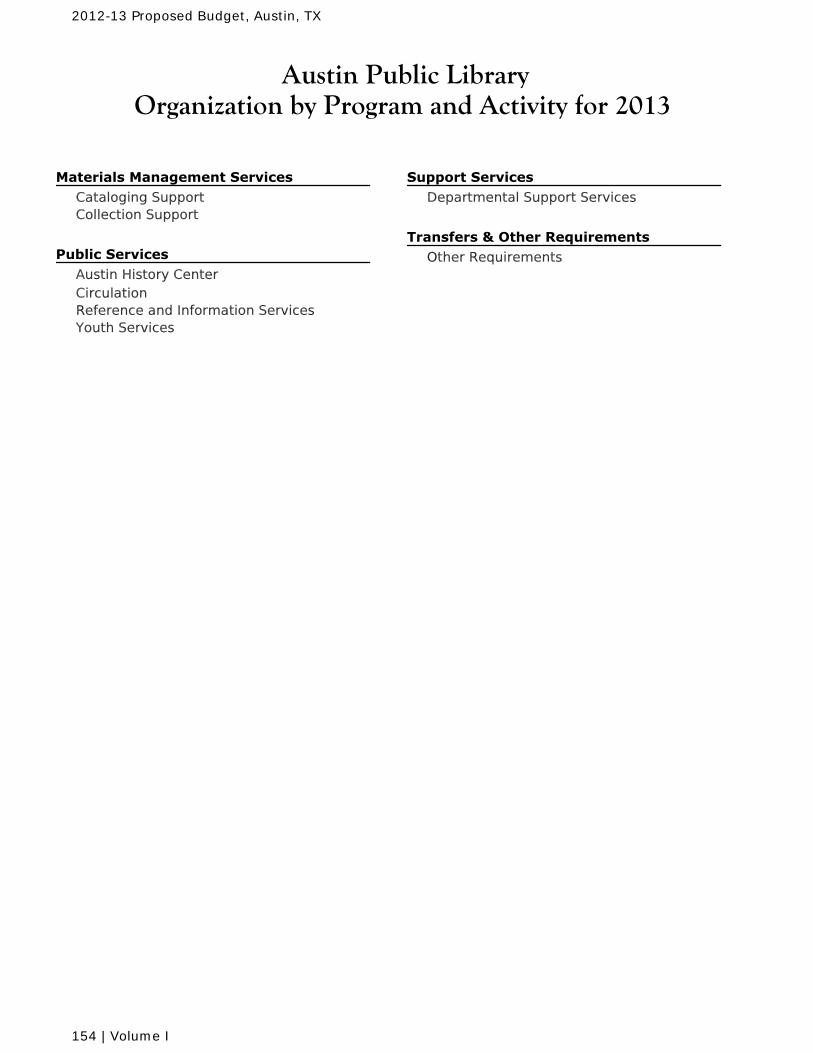
Austin Public LibraryOrganization by Program and Activity for 2013
Materials Management Services Cataloging SupportCollection Support
Public Services Austin History CenterCirculationReference and Information ServicesYouth Services
Support Services Departmental Support Services
Transfers & Other Requirements Other Requirements
2012-13 Proposed Budget, Austin, TX
154 | Volume I
Austin Public LibraryMission and Goals for 2013
Mission
The mission of the Austin Public Library is to provide easy access to books and information for allages, through responsive professionals, engaging programs, and state of the art technology in a safeand friendly environment.
Goals
Provide clean, safe facilities.
80% of citizens responding to the Citizen Survey will rate their satisfaction with cleanliness oflibrary facilities as satisfied or very satisfied. 83% of library staff responding to the Listening to the Workforce survey will indicate that thedepartment demonstrates adequate concern for employee safety.
Provide easy access to information and services.
Circulation per capita will reach at least 6.27. Web hits will reach at least 20,600,000.Program attendance will reach at least 130,000.
Improve services based on customer input.
Data from the Counting Opinions customer satisfaction survey database will be reviewedannually to guide decision-making. 75% of citizens responding to the Citizen Survey will rate their overall satisfaction with thequality of city libraries as satisfied or very satisfied.
Develop a well-trained, customer-oriented workforce.
70% of library staff responding to the Listening to the Workforce survey will indicate thattraining has helped improve on-the-job skills. 75% of library staff responding to the Listening to the Workforce survey will indicate they haveused skills learned in training offered by the department.
2012-13 Proposed Budget, Austin, TX
Volume I | 155
Austin Public Library
Message from the Director
The Austin Public Library’s vision is to help make Austin a dynamic creative center and the most livable city in the country. We are committed to providing easy access to books and information for all ages, through responsive professionals, engaging programs, and state-of-the-art technology in a safe and friendly environment. In 1926, the Austin Public Library opened in a rented room at 819 Congress with 500 donated volumes and a volunteer Librarian. Since that time, the Austin Public Library has seen the appointment of 4 subsequent Library Directors and has grown to encompass 20 branch libraries, the John Henry Faulk Central Library and the Austin History Center. We circulate over 4.6 million items a year and more than 3.5 million customers visit our libraries. We have completed the Schematic Design phase of the New Central Library project, ensuring throughout the process that Austin’s next central library will truly be a library for the future. The Design Development phase is currently in process and the completed package will be presented to the City Council on September 27, 2012. The Austin Public Library’s customers have access to a wide variety of resources, programs and services to meet their needs. The Austin Public Library has fewer staff per service hour than almost all of our peer libraries; however, we continue to be a model for leading edge programs and services, many of which have received state and national recognition. The Library’s used bookstore, Recycled Reads, has become a model for other libraries across the country and has been featured in the Texas Library Journal. It is an active participant in the City of Austin Zero Waste Plan ensuring that obsolete materials are handled in an environmentally responsible way. In the past year, 210,000 books and materials were sold or recycled. Since its opening, more than 130 tons of material has been diverted out of landfills. Over the past year, every library division and work group selected a best managed project that would transform the service they provide, including the library’s over-arching project to create a state of the art website with the goal of making the interface as simple to use as Google, with access to library and city resources and services, databases, and Internet sites. Other functionality will include online payment of fees, video and mobile phone apps. The library was able to secure a contract to implement this project and the new site should go live in the fall of 2012. The Library launched the addition of downloadable materials—the ability to stream and download books with a library card—to our collection to immediate success. We are currently circulating over 13,000 downloadable books and audiobooks per month. We plan to add both downloadable music and video formats in the upcoming months. Despite these milestones, the Austin Public Library will face some important issues in the coming years. The area that presents the greatest challenge for us is building and maintaining sustainability for the library system. The two core areas in which sustainability is critical to the library’s future are our collections and our facilities. Continued investment in our materials budget is critical to growing and sustaining our collection. Additionally, as our twenty-four facilities have aged, the need for upkeep has increased accordingly. Austin is becoming a major urban area and the criminal activities typically experienced in similar areas of our nation are being felt by staff and customers and in our building inventory. Library management responded by installing both interior and exterior security surveillance cameras at all locations by the end of 2012. Meeting evolving customer needs and keeping pace with shifts in customer demographics is also a challenge. Activities, products, and services have exploded in the digital world and customers expect the library to provide access to information in digital formats while maintaining traditional library service. Our goal is to achieve a balance between the two. Regardless of the challenges, the Austin Public Library is focused on the future and on our goal to become the best managed library in the country. Every area of the library continues to develop and implement processes to improve systems and services to enable the Library to be as effective and efficient as possible. As a result, Austin Public Library continues to be acknowledged for its leading edge programs and services.
Brenda Branch, Director
2012-13 Proposed Budget, Austin, TX
156 | Volume I
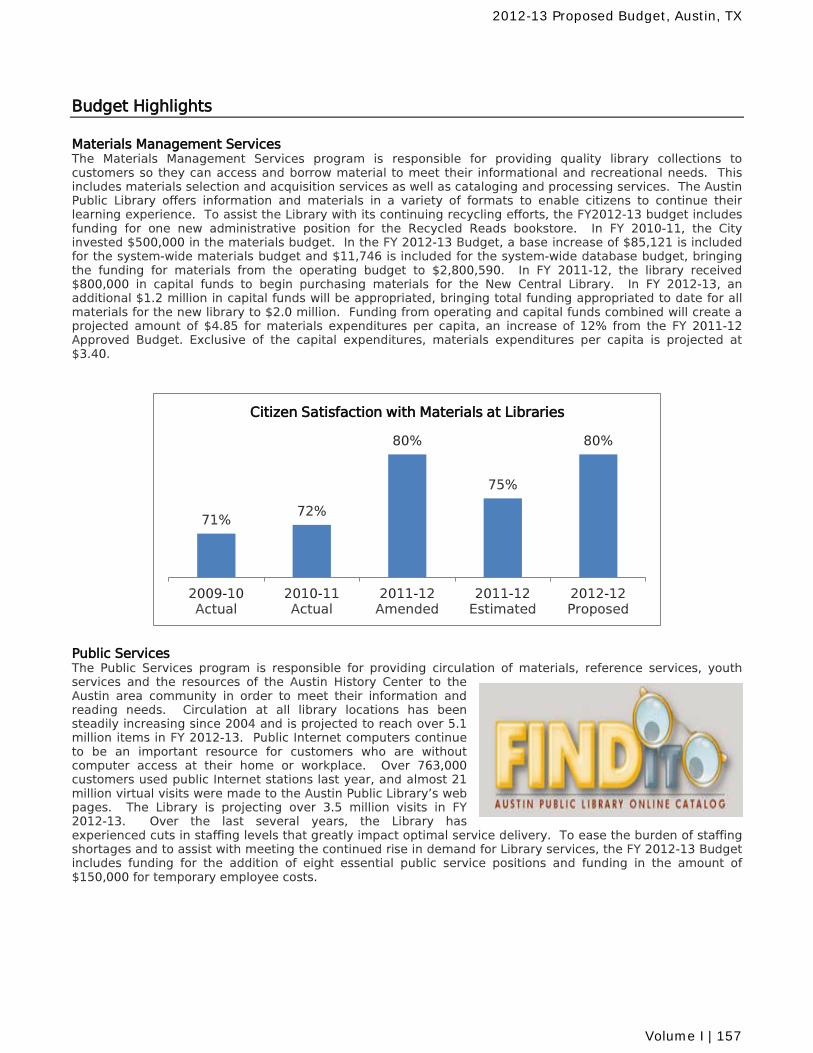
Budget Highlights
Materials Management Services The Materials Management Services program is responsible for providing quality library collections to customers so they can access and borrow material to meet their informational and recreational needs. This includes materials selection and acquisition services as well as cataloging and processing services. The Austin Public Library offers information and materials in a variety of formats to enable citizens to continue their learning experience. To assist the Library with its continuing recycling efforts, the FY2012-13 budget includes funding for one new administrative position for the Recycled Reads bookstore. In FY 2010-11, the City invested $500,000 in the materials budget. In the FY 2012-13 Budget, a base increase of $85,121 is included for the system-wide materials budget and $11,746 is included for the system-wide database budget, bringing the funding for materials from the operating budget to $2,800,590. In FY 2011-12, the library received $800,000 in capital funds to begin purchasing materials for the New Central Library. In FY 2012-13, an additional $1.2 million in capital funds will be appropriated, bringing total funding appropriated to date for all materials for the new library to $2.0 million. Funding from operating and capital funds combined will create a projected amount of $4.85 for materials expenditures per capita, an increase of 12% from the FY 2011-12 Approved Budget. Exclusive of the capital expenditures, materials expenditures per capita is projected at $3.40.
71%72%
80%
75%
80%
2009-10Actual
2010-11Actual
2011-12Amended
2011-12Estimated
2012-12Proposed
Citizen Satisfaction with Materials at Libraries
Public Services The Public Services program is responsible for providing circulation of materials, reference services, youth services and the resources of the Austin History Center to the Austin area community in order to meet their information and reading needs. Circulation at all library locations has been steadily increasing since 2004 and is projected to reach over 5.1 million items in FY 2012-13. Public Internet computers continue to be an important resource for customers who are without computer access at their home or workplace. Over 763,000 customers used public Internet stations last year, and almost 21 million virtual visits were made to the Austin Public Library’s web pages. The Library is projecting over 3.5 million visits in FY 2012-13. Over the last several years, the Library has experienced cuts in staffing levels that greatly impact optimal service delivery. To ease the burden of staffing shortages and to assist with meeting the continued rise in demand for Library services, the FY 2012-13 Budget includes funding for the addition of eight essential public service positions and funding in the amount of $150,000 for temporary employee costs.
2012-13 Proposed Budget, Austin, TX
Volume I | 157
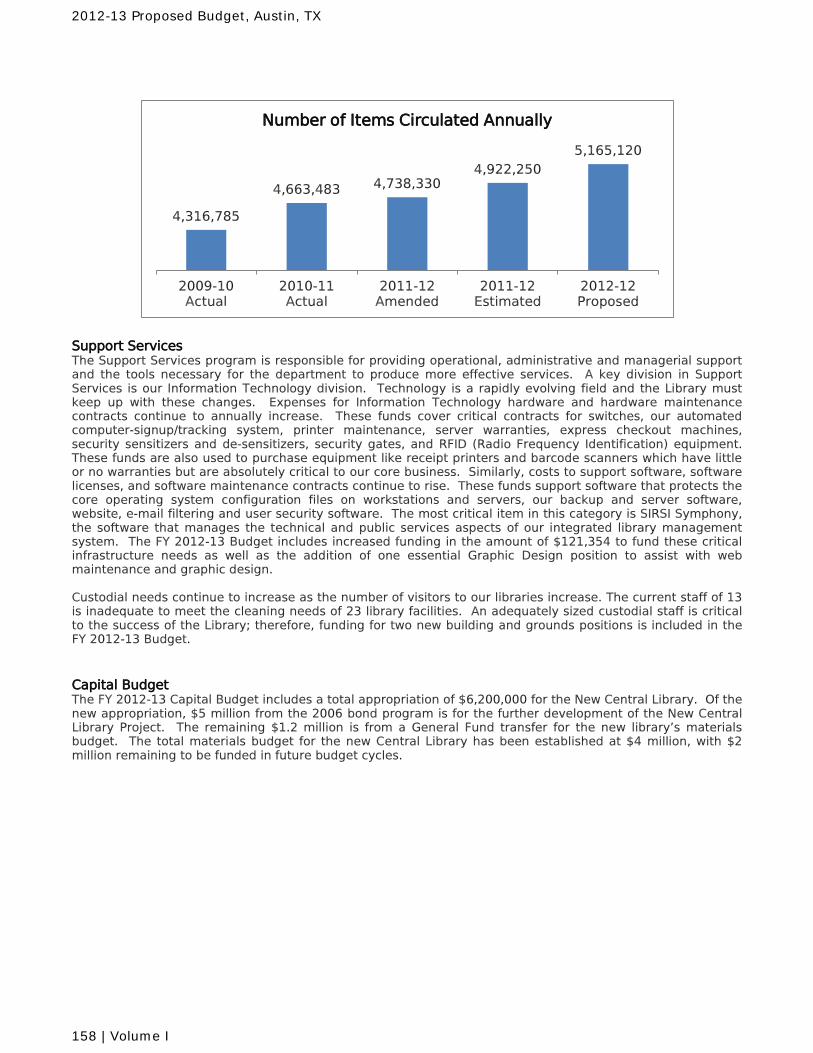
4,316,785
4,663,483 4,738,330 4,922,250
5,165,120
2009-10Actual
2010-11Actual
2011-12Amended
2011-12Estimated
2012-12Proposed
Number of Items Circulated Annually
Support Services The Support Services program is responsible for providing operational, administrative and managerial support and the tools necessary for the department to produce more effective services. A key division in Support Services is our Information Technology division. Technology is a rapidly evolving field and the Library must keep up with these changes. Expenses for Information Technology hardware and hardware maintenance contracts continue to annually increase. These funds cover critical contracts for switches, our automated computer-signup/tracking system, printer maintenance, server warranties, express checkout machines, security sensitizers and de-sensitizers, security gates, and RFID (Radio Frequency Identification) equipment. These funds are also used to purchase equipment like receipt printers and barcode scanners which have little or no warranties but are absolutely critical to our core business. Similarly, costs to support software, software licenses, and software maintenance contracts continue to rise. These funds support software that protects the core operating system configuration files on workstations and servers, our backup and server software, website, e-mail filtering and user security software. The most critical item in this category is SIRSI Symphony, the software that manages the technical and public services aspects of our integrated library management system. The FY 2012-13 Budget includes increased funding in the amount of $121,354 to fund these critical infrastructure needs as well as the addition of one essential Graphic Design position to assist with web maintenance and graphic design. Custodial needs continue to increase as the number of visitors to our libraries increase. The current staff of 13 is inadequate to meet the cleaning needs of 23 library facilities. An adequately sized custodial staff is critical to the success of the Library; therefore, funding for two new building and grounds positions is included in the FY 2012-13 Budget. Capital Budget The FY 2012-13 Capital Budget includes a total appropriation of $6,200,000 for the New Central Library. Of the new appropriation, $5 million from the 2006 bond program is for the further development of the New Central Library Project. The remaining $1.2 million is from a General Fund transfer for the new library’s materials budget. The total materials budget for the new Central Library has been established at $4 million, with $2 million remaining to be funded in future budget cycles.
2012-13 Proposed Budget, Austin, TX
158 | Volume I
Revenue Changes Dollars
The Budget includes an increase in revenue of $51,820 from library fines due toimproved collection methods for overdue materials. This is slightly offset by adecrease of $8,205 in revenue for miscellaneous fees due to decreased customerdemand. $43,615
Expenditure Changes FTEs Dollars
CitywideThe Budget includes $530,968 for salary increases associated with wageadjustments in FY 2013. An additional $108,431 is included in the Budget forincreased City contributions for health insurance. $639,399
The Budget includes $376,890 in wage adjustments associated with implementingthe City's recently completed market study. $376,890
is equivalent to 2% of payroll for non-civil service employees to help improve thefunded status of the pension system. This amount also includes a budgetreallocation from the fund level to the department level. $1,489,729
Materials Management ServicesThe Budget includes base cost increases in the amount of $85,121 for system-widematerials, $41,200 for cataloging and processing, and $11,746 for electronicdatabases. $138,067
The Budget also includes an increase in the amount of $20,218 for a softwarecontract to upgrade the Library's online catalog. $20,218
One new Administrative Assistant position is included the budget to support theongoing activities within the Library system. 1.00 $47,519
Public ServicesThe Budget includes a net decrease in funding for three projects funded at the St.John Community Center in FY 2011-12. Funding still remains in FY 2012-13 forADA compliant automatic door opening systems. Total project costs are sharedwith Health and Human Services and Parks and Recreation. ($16,071)
As a result of projected rate increases for water and wastewater services, theBudget includes an increase of $17,395. $17,395
Also included in the Budget is an increase of $3,150 to replace funding lost fromthe termination of the Interlibrary Loan grant. $3,150
The Budget includes $150,000 in dedicated funding for temporary employees. $150,000
Funding for eight essential positions is included in the budget. These positionswill offer critical support to existing Library staff. 8.00 $378,427
Significant ChangesAustin Public Library
General Fund
2012-13 Proposed Budget, Austin, TX
Volume II | 159
Expenditure Changes FTEs Dollars
Support ServicesAn increase of $8,988 is included in the Budget to maintain a departmentalinventory of information technology hardware and hardware maintenancecontracts, as well as $44,670 to fund increases to information technology softwaremaintenance contracts and increases for the renewal of annual software licenses. $53,658
Included in the Budget is an increase of $2,439 for projected rate increases forwater and wastewater services. $2,439
An incremental increase of $6,380 is included to reflect $19,481 for preventativefleet maintenance offset by a decrease of $13,101 for fuel. $6,380
Also included in the Budget is an increase of $28,329 to replace funding lost fromthe terminations of the Interlibrary Loan grant $28,329
The Budget includes funding for two custodial positions and one Graphic Designer. 3.00 $161,010
Department-wideThe Budget includes an incremental increase of $7,282 for terminal pay for sixemployees scheduled to retire in FY 2012-13. $7,282
Also included in the Budget is an increase of $214,000 to reduce the department'svacancy savings amount to zero. $214,000
2012-13 Proposed Budget, Austin, TX
160 | Volume II
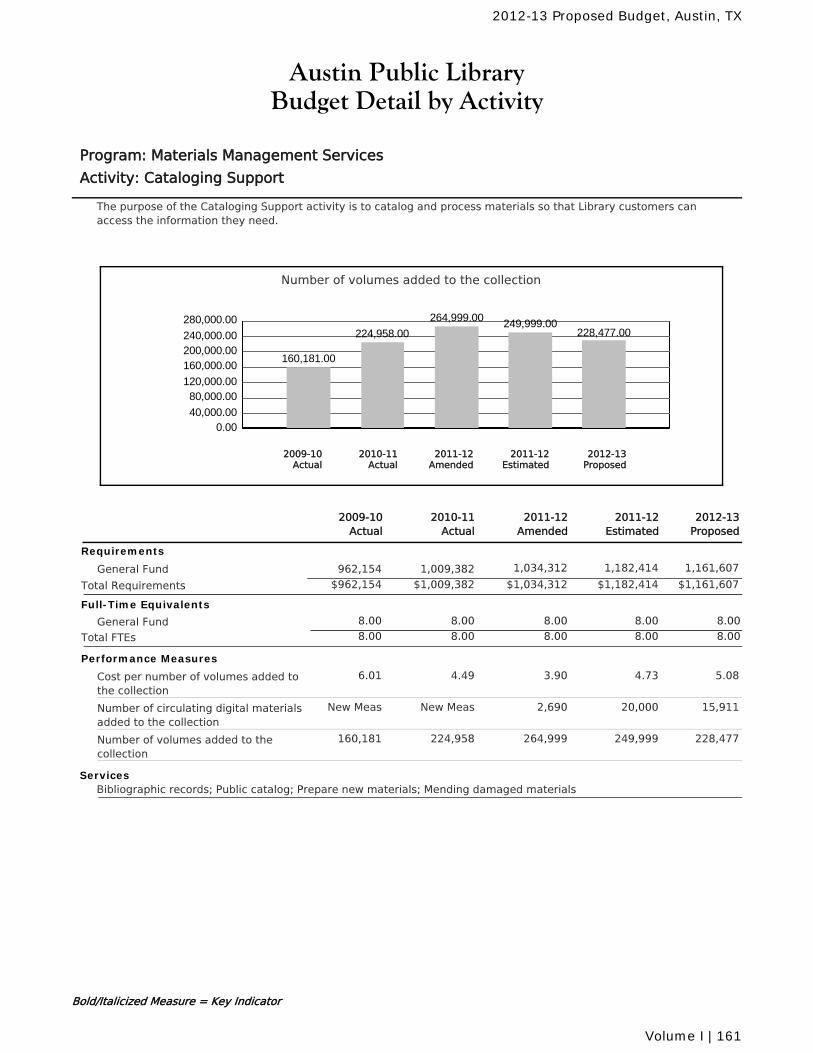
Austin Public LibraryBudget Detail by Activity
Program: Materials Management Services
Activity: Cataloging Support
The purpose of the Cataloging Support activity is to catalog and process materials so that Library customers canaccess the information they need.
Number of volumes added to the collection
0.0040,000.00
80,000.00120,000.00
160,000.00200,000.00240,000.00
280,000.00
160,181.00
224,958.00
264,999.00 249,999.00228,477.00
2010-11Actual
2012-13Proposed
2011-12Amended
2011-12Estimated
2009-10Actual
2011-12Amended
2010-11Actual
2011-12Estimated
2012-13Proposed
2009-10Actual
Requirements
General Fund 1,034,312 1,182,414 1,161,6071,009,382962,154
$1,034,312 $1,182,414 $1,161,607Total Requirements $1,009,382$962,154
Full-Time Equivalents
General Fund 8.00 8.00 8.00 8.008.00
Total FTEs 8.00 8.00 8.00 8.008.00
Performance Measures
Cost per number of volumes added tothe collection
3.904.49 4.73 5.086.01
Number of circulating digital materialsadded to the collection
2,690New Meas 20,000 15,911New Meas
Number of volumes added to thecollection
264,999224,958 249,999 228,477160,181
ServicesBibliographic records; Public catalog; Prepare new materials; Mending damaged materials
Bold/Italicized Measure = Key Indicator
2012-13 Proposed Budget, Austin, TX
Volume I | 161
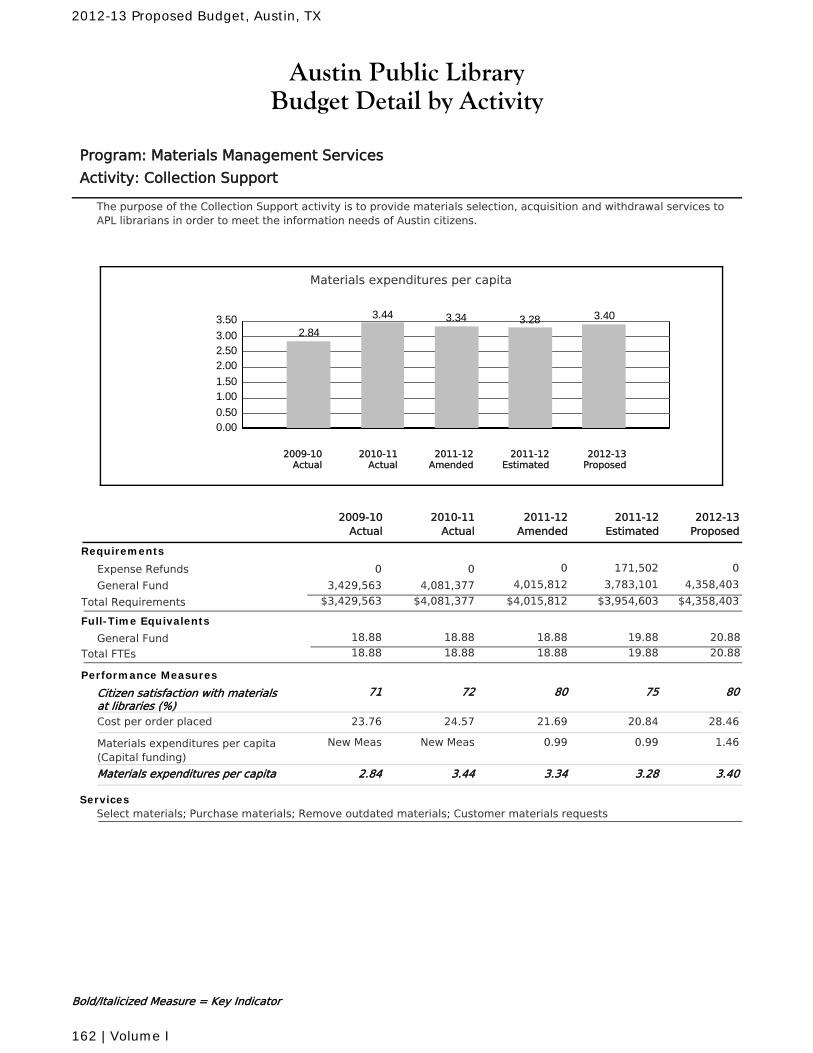
Austin Public LibraryBudget Detail by Activity
Program: Materials Management Services
Activity: Collection Support
The purpose of the Collection Support activity is to provide materials selection, acquisition and withdrawal services toAPL librarians in order to meet the information needs of Austin citizens.
Materials expenditures per capita
0.000.50
1.001.50
2.002.503.00
3.502.84
3.44 3.34 3.28 3.40
2010-11Actual
2012-13Proposed
2011-12Amended
2011-12Estimated
2009-10Actual
2011-12Amended
2010-11Actual
2011-12Estimated
2012-13Proposed
2009-10Actual
Requirements
Expense Refunds 0 171,502 000
General Fund 4,015,812 3,783,101 4,358,4034,081,3773,429,563
$4,015,812 $3,954,603 $4,358,403Total Requirements $4,081,377$3,429,563
Full-Time Equivalents
General Fund 18.88 18.88 19.88 20.8818.88
Total FTEs 18.88 18.88 19.88 20.8818.88
Performance Measures
Citizen satisfaction with materialsat libraries (%)
8072 75 8071
Cost per order placed 21.6924.57 20.84 28.4623.76
Materials expenditures per capita(Capital funding)
0.99New Meas 0.99 1.46New Meas
Materials expenditures per capita 3.343.44 3.28 3.402.84
ServicesSelect materials; Purchase materials; Remove outdated materials; Customer materials requests
Bold/Italicized Measure = Key Indicator
2012-13 Proposed Budget, Austin, TX
162 | Volume I
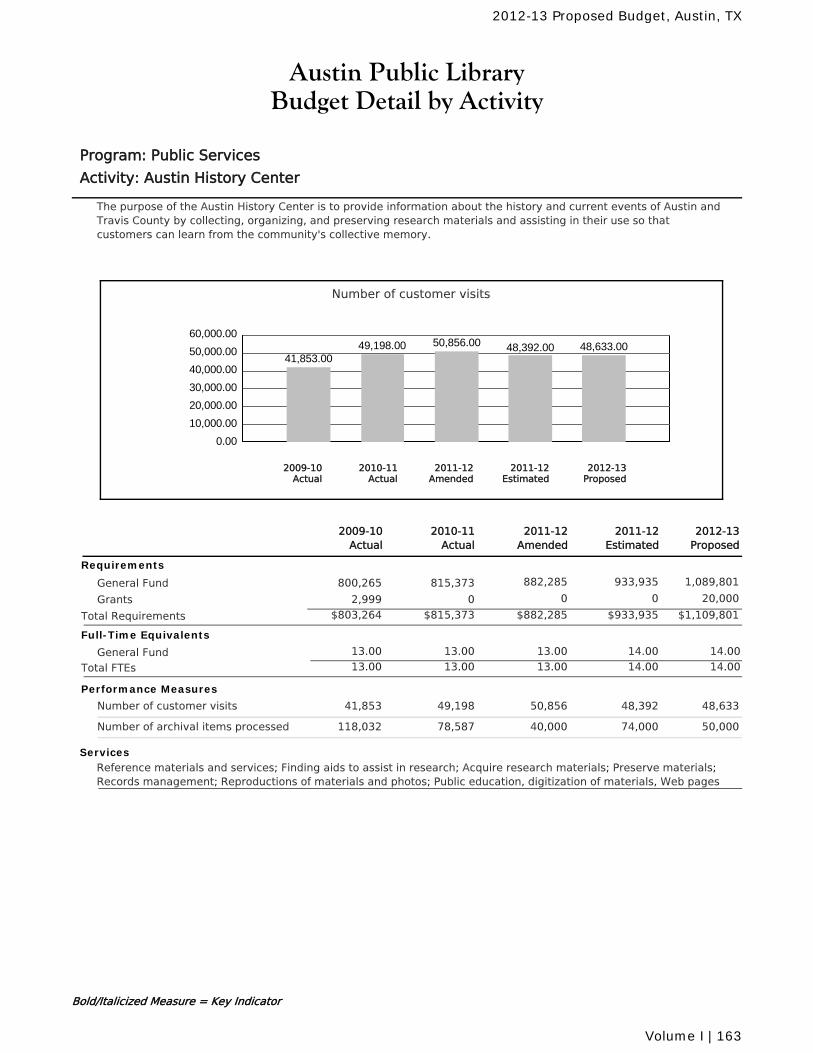
Austin Public LibraryBudget Detail by Activity
Program: Public Services
Activity: Austin History Center
The purpose of the Austin History Center is to provide information about the history and current events of Austin andTravis County by collecting, organizing, and preserving research materials and assisting in their use so thatcustomers can learn from the community's collective memory.
Number of customer visits
0.00
10,000.00
20,000.00
30,000.00
40,000.00
50,000.00
60,000.00
41,853.0049,198.00 50,856.00 48,392.00 48,633.00
2010-11Actual
2012-13Proposed
2011-12Amended
2011-12Estimated
2009-10Actual
2011-12Amended
2010-11Actual
2011-12Estimated
2012-13Proposed
2009-10Actual
Requirements
General Fund 882,285 933,935 1,089,801815,373800,265
Grants 0 0 20,00002,999
$882,285 $933,935 $1,109,801Total Requirements $815,373$803,264
Full-Time Equivalents
General Fund 13.00 13.00 14.00 14.0013.00
Total FTEs 13.00 13.00 14.00 14.0013.00
Performance Measures
Number of customer visits 50,85649,198 48,392 48,63341,853
Number of archival items processed 40,00078,587 74,000 50,000118,032
ServicesReference materials and services; Finding aids to assist in research; Acquire research materials; Preserve materials;Records management; Reproductions of materials and photos; Public education, digitization of materials, Web pages
Bold/Italicized Measure = Key Indicator
2012-13 Proposed Budget, Austin, TX
Volume I | 163
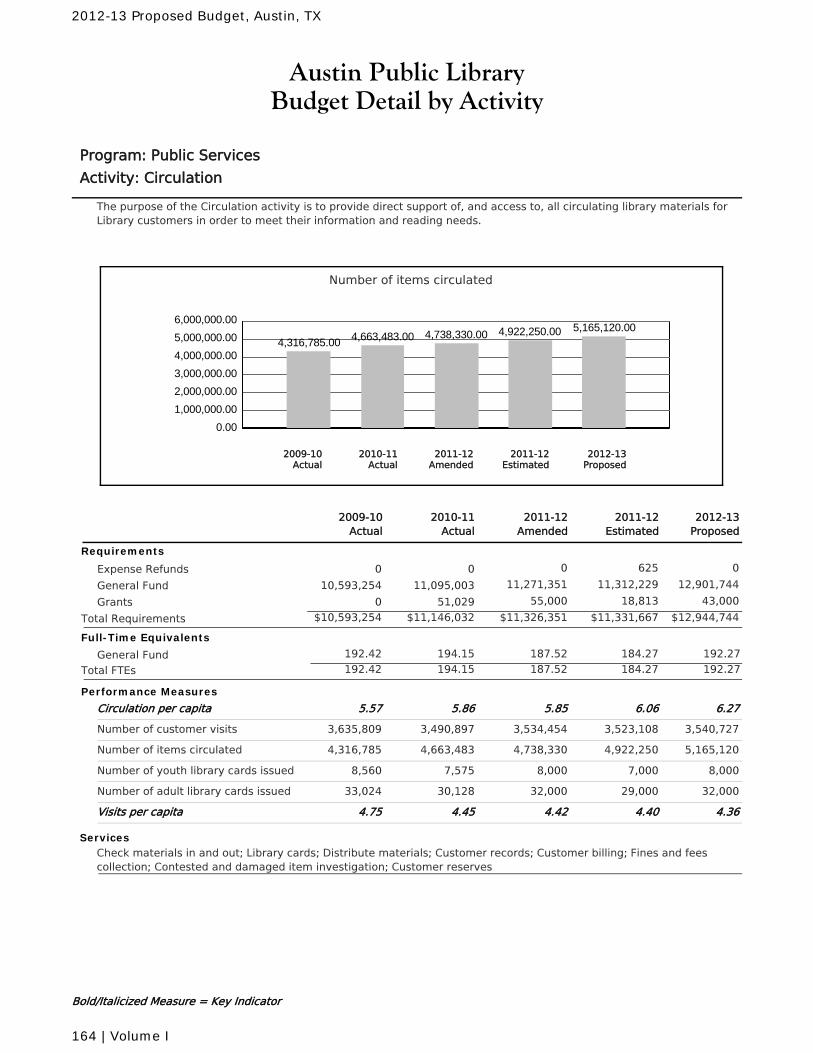
Austin Public LibraryBudget Detail by Activity
Program: Public Services
Activity: Circulation
The purpose of the Circulation activity is to provide direct support of, and access to, all circulating library materials forLibrary customers in order to meet their information and reading needs.
Number of items circulated
0.00
1,000,000.00
2,000,000.00
3,000,000.00
4,000,000.00
5,000,000.00
6,000,000.00
4,316,785.00 4,663,483.00 4,738,330.00 4,922,250.00 5,165,120.00
2010-11Actual
2012-13Proposed
2011-12Amended
2011-12Estimated
2009-10Actual
2011-12Amended
2010-11Actual
2011-12Estimated
2012-13Proposed
2009-10Actual
Requirements
Expense Refunds 0 625 000
General Fund 11,271,351 11,312,229 12,901,74411,095,00310,593,254
Grants 55,000 18,813 43,00051,0290
$11,326,351 $11,331,667 $12,944,744Total Requirements $11,146,032$10,593,254
Full-Time Equivalents
General Fund 194.15 187.52 184.27 192.27192.42
Total FTEs 194.15 187.52 184.27 192.27192.42
Performance Measures
Circulation per capita 5.855.86 6.06 6.275.57
Number of customer visits 3,534,4543,490,897 3,523,108 3,540,7273,635,809
Number of items circulated 4,738,3304,663,483 4,922,250 5,165,1204,316,785
Number of youth library cards issued 8,0007,575 7,000 8,0008,560
Number of adult library cards issued 32,00030,128 29,000 32,00033,024
Visits per capita 4.424.45 4.40 4.364.75
ServicesCheck materials in and out; Library cards; Distribute materials; Customer records; Customer billing; Fines and feescollection; Contested and damaged item investigation; Customer reserves
Bold/Italicized Measure = Key Indicator
2012-13 Proposed Budget, Austin, TX
164 | Volume I
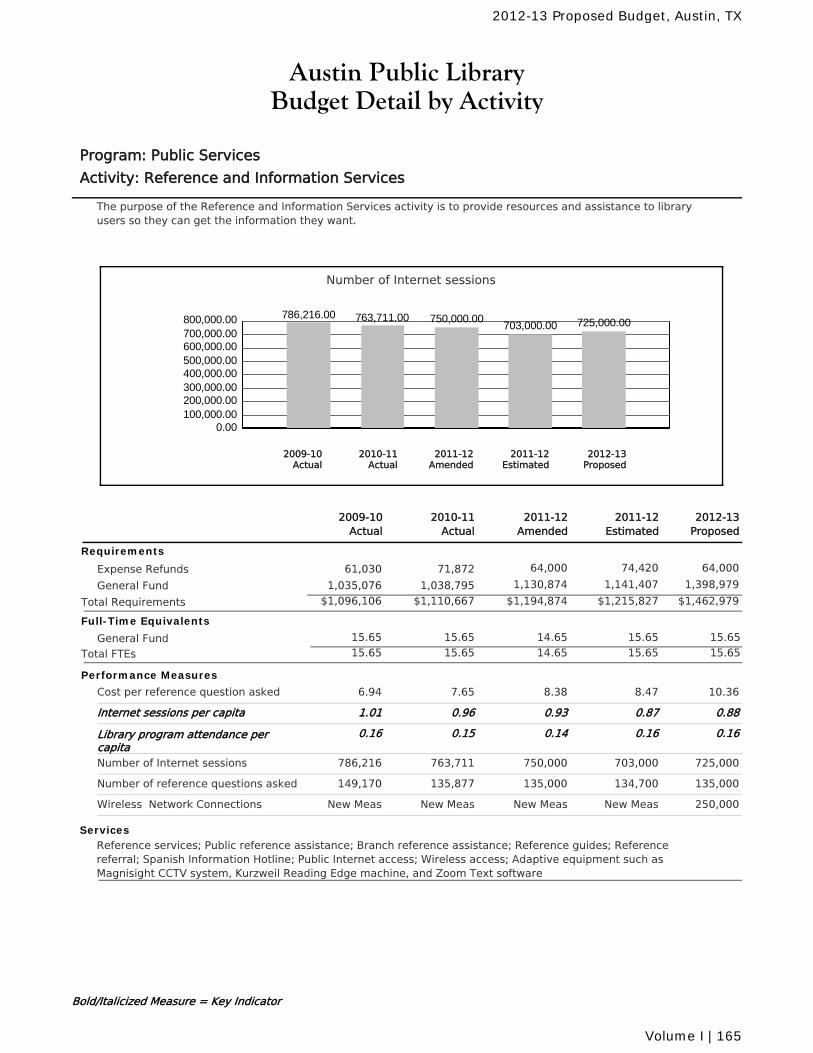
Austin Public LibraryBudget Detail by Activity
Program: Public Services
Activity: Reference and Information Services
The purpose of the Reference and Information Services activity is to provide resources and assistance to libraryusers so they can get the information they want.
Number of Internet sessions
0.00100,000.00200,000.00300,000.00400,000.00500,000.00600,000.00700,000.00800,000.00 786,216.00 763,711.00 750,000.00
703,000.00 725,000.00
2010-11Actual
2012-13Proposed
2011-12Amended
2011-12Estimated
2009-10Actual
2011-12Amended
2010-11Actual
2011-12Estimated
2012-13Proposed
2009-10Actual
Requirements
Expense Refunds 64,000 74,420 64,00071,87261,030
General Fund 1,130,874 1,141,407 1,398,9791,038,7951,035,076
$1,194,874 $1,215,827 $1,462,979Total Requirements $1,110,667$1,096,106
Full-Time Equivalents
General Fund 15.65 14.65 15.65 15.6515.65
Total FTEs 15.65 14.65 15.65 15.6515.65
Performance Measures
Cost per reference question asked 8.387.65 8.47 10.366.94
Internet sessions per capita 0.930.96 0.87 0.881.01
Library program attendance percapita
0.140.15 0.16 0.160.16
Number of Internet sessions 750,000763,711 703,000 725,000786,216
Number of reference questions asked 135,000135,877 134,700 135,000149,170
Wireless Network Connections New MeasNew Meas New Meas 250,000New Meas
ServicesReference services; Public reference assistance; Branch reference assistance; Reference guides; Referencereferral; Spanish Information Hotline; Public Internet access; Wireless access; Adaptive equipment such asMagnisight CCTV system, Kurzweil Reading Edge machine, and Zoom Text software
Bold/Italicized Measure = Key Indicator
2012-13 Proposed Budget, Austin, TX
Volume I | 165
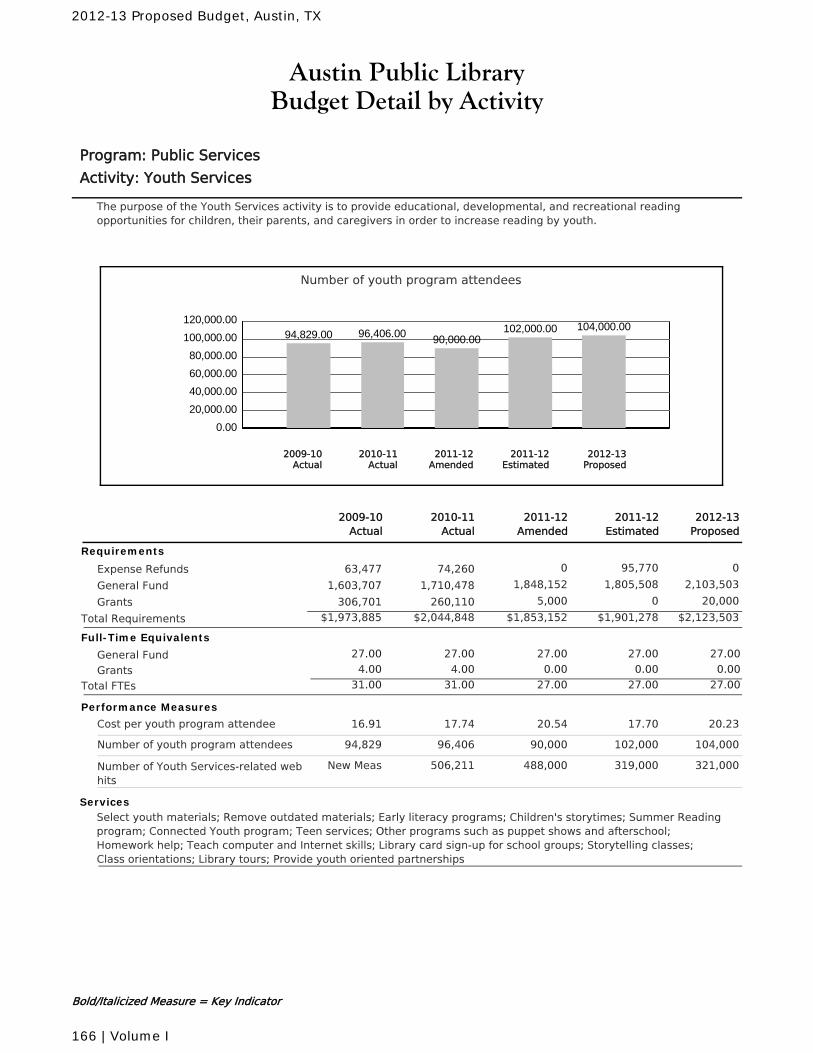
Austin Public LibraryBudget Detail by Activity
Program: Public Services
Activity: Youth Services
The purpose of the Youth Services activity is to provide educational, developmental, and recreational readingopportunities for children, their parents, and caregivers in order to increase reading by youth.
Number of youth program attendees
0.00
20,000.00
40,000.00
60,000.00
80,000.00
100,000.00
120,000.0094,829.00 96,406.00 90,000.00
102,000.00 104,000.00
2010-11Actual
2012-13Proposed
2011-12Amended
2011-12Estimated
2009-10Actual
2011-12Amended
2010-11Actual
2011-12Estimated
2012-13Proposed
2009-10Actual
Requirements
Expense Refunds 0 95,770 074,26063,477
General Fund 1,848,152 1,805,508 2,103,5031,710,4781,603,707
Grants 5,000 0 20,000260,110306,701
$1,853,152 $1,901,278 $2,123,503Total Requirements $2,044,848$1,973,885
Full-Time Equivalents
General Fund 27.00 27.00 27.00 27.0027.00
Grants 4.00 0.00 0.00 0.004.00
Total FTEs 31.00 27.00 27.00 27.0031.00
Performance Measures
Cost per youth program attendee 20.5417.74 17.70 20.2316.91
Number of youth program attendees 90,00096,406 102,000 104,00094,829
Number of Youth Services-related webhits
488,000506,211 319,000 321,000New Meas
ServicesSelect youth materials; Remove outdated materials; Early literacy programs; Children's storytimes; Summer Readingprogram; Connected Youth program; Teen services; Other programs such as puppet shows and afterschool;Homework help; Teach computer and Internet skills; Library card sign-up for school groups; Storytelling classes;Class orientations; Library tours; Provide youth oriented partnerships
Bold/Italicized Measure = Key Indicator
2012-13 Proposed Budget, Austin, TX
166 | Volume I
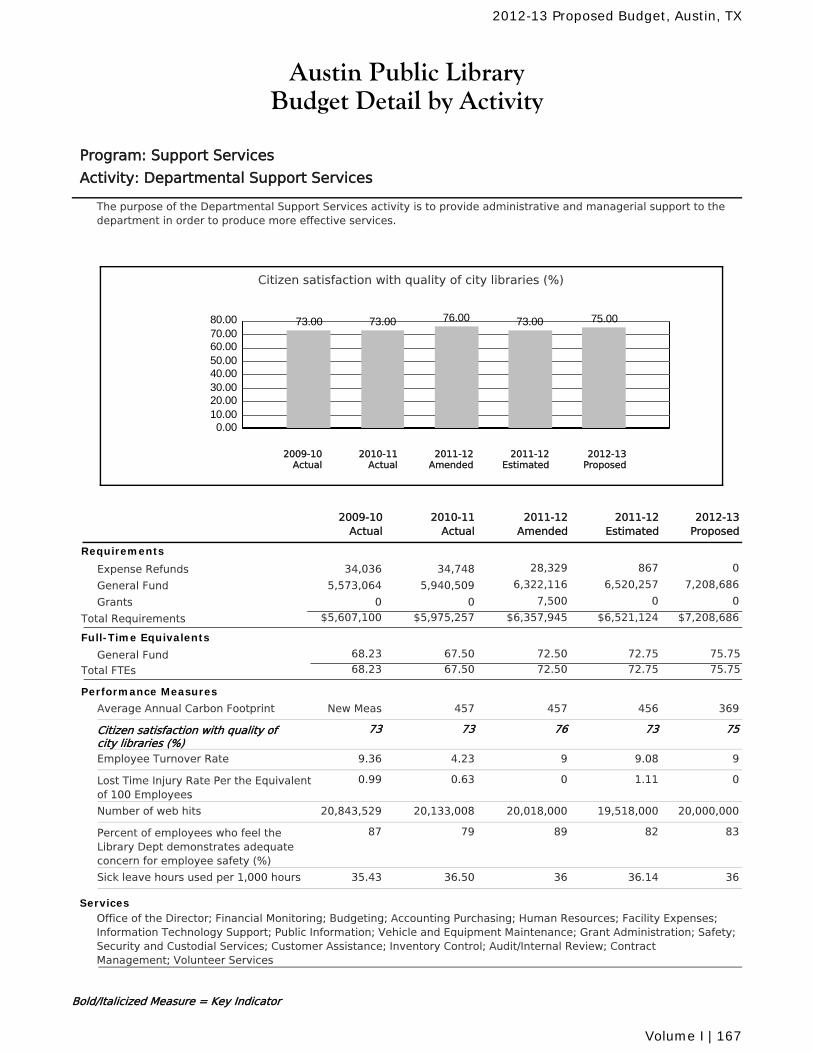
Austin Public LibraryBudget Detail by Activity
Program: Support Services
Activity: Departmental Support Services
The purpose of the Departmental Support Services activity is to provide administrative and managerial support to thedepartment in order to produce more effective services.
Citizen satisfaction with quality of city libraries (%)
0.0010.0020.0030.0040.0050.0060.0070.0080.00 73.00 73.00 76.00 73.00 75.00
2010-11Actual
2012-13Proposed
2011-12Amended
2011-12Estimated
2009-10Actual
2011-12Amended
2010-11Actual
2011-12Estimated
2012-13Proposed
2009-10Actual
Requirements
Expense Refunds 28,329 867 034,74834,036
General Fund 6,322,116 6,520,257 7,208,6865,940,5095,573,064
Grants 7,500 0 000
$6,357,945 $6,521,124 $7,208,686Total Requirements $5,975,257$5,607,100
Full-Time Equivalents
General Fund 67.50 72.50 72.75 75.7568.23
Total FTEs 67.50 72.50 72.75 75.7568.23
Performance Measures
Average Annual Carbon Footprint 457457 456 369New Meas
Citizen satisfaction with quality ofcity libraries (%)
7673 73 7573
Employee Turnover Rate 94.23 9.08 99.36
Lost Time Injury Rate Per the Equivalentof 100 Employees
00.63 1.11 00.99
Number of web hits 20,018,00020,133,008 19,518,000 20,000,00020,843,529
Percent of employees who feel theLibrary Dept demonstrates adequateconcern for employee safety (%)
8979 82 8387
Sick leave hours used per 1,000 hours 3636.50 36.14 3635.43
ServicesOffice of the Director; Financial Monitoring; Budgeting; Accounting Purchasing; Human Resources; Facility Expenses;Information Technology Support; Public Information; Vehicle and Equipment Maintenance; Grant Administration; Safety;Security and Custodial Services; Customer Assistance; Inventory Control; Audit/Internal Review; ContractManagement; Volunteer Services
Bold/Italicized Measure = Key Indicator
2012-13 Proposed Budget, Austin, TX
Volume I | 167
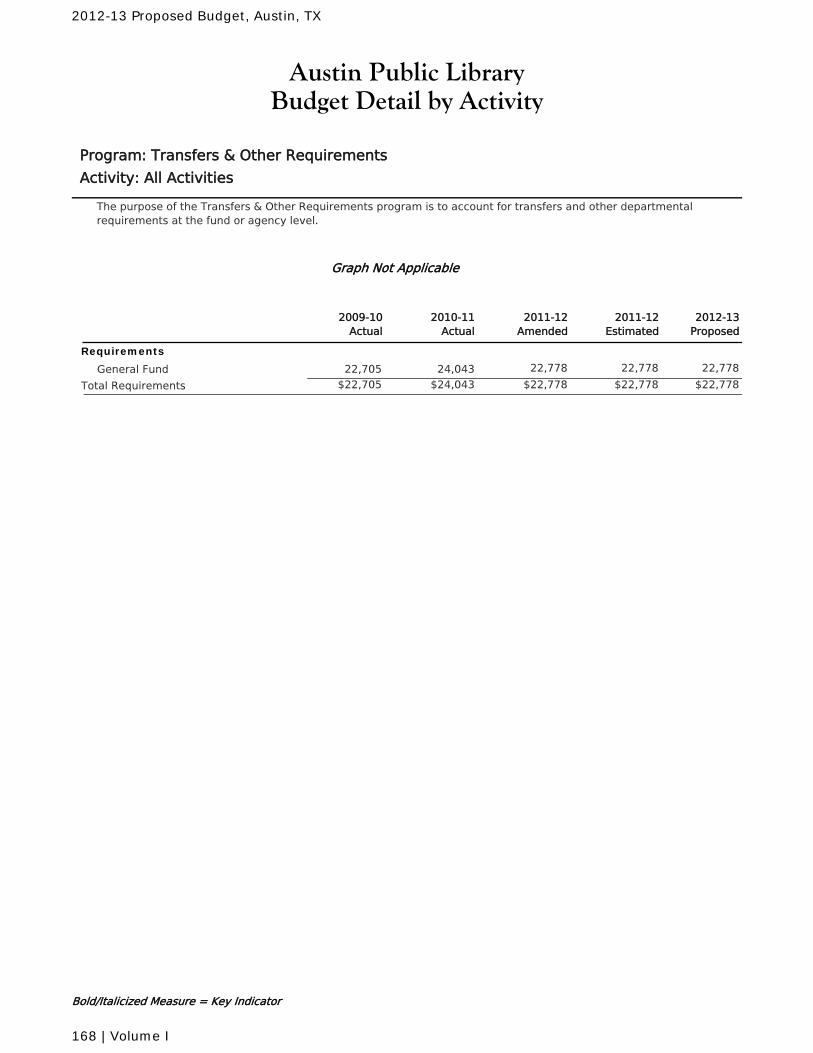
Austin Public LibraryBudget Detail by Activity
Program: Transfers & Other Requirements
Activity: All Activities
The purpose of the Transfers & Other Requirements program is to account for transfers and other departmentalrequirements at the fund or agency level.
Graph Not Applicable
2011-12Amended
2010-11Actual
2011-12Estimated
2012-13Proposed
2009-10Actual
Requirements
General Fund 22,778 22,778 22,77824,04322,705
$22,778 $22,778 $22,778Total Requirements $24,043$22,705
Bold/Italicized Measure = Key Indicator
2012-13 Proposed Budget, Austin, TX
168 | Volume I
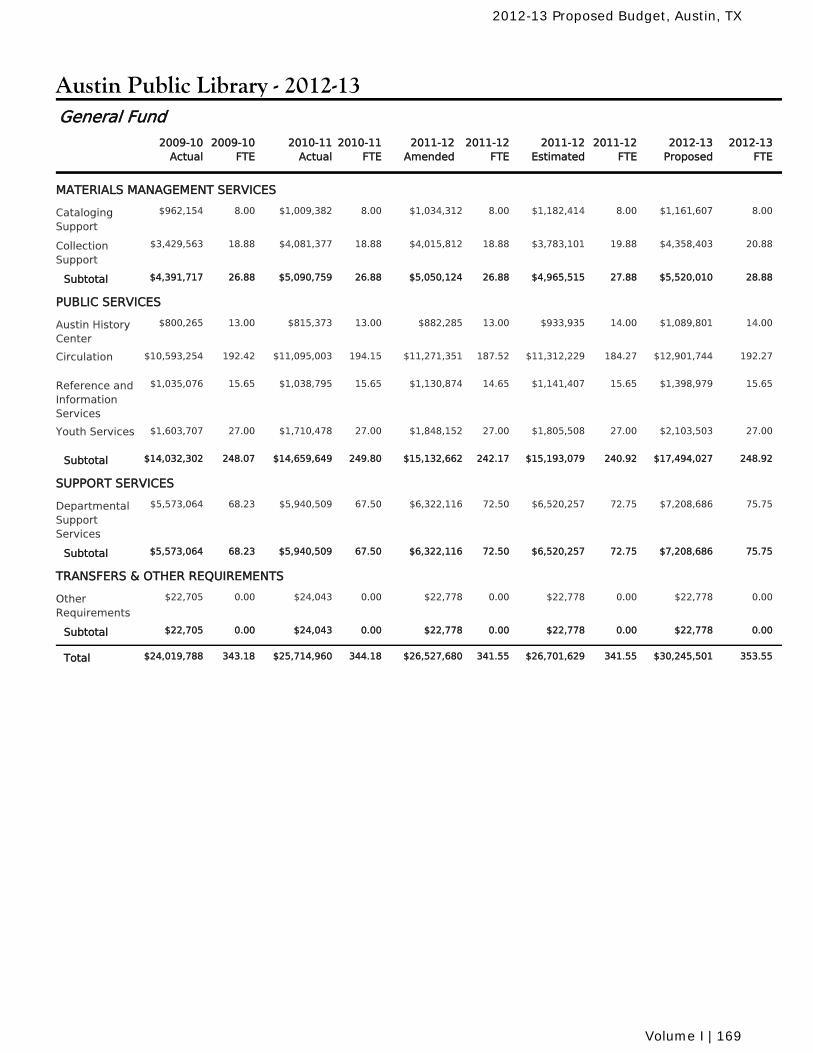
Austin Public Library - 2012-13
2010-11Actual
2010-11FTE
2011-12Amended
2011-12FTE
2011-12Estimated
2011-12FTE
2009-10Actual
2009-10FTE
2012-13Proposed
2012-13FTE
General Fund
MATERIALS MANAGEMENT SERVICES
$1,009,382 8.00 $1,034,312 8.00 $1,182,414 8.00CatalogingSupport
8.00 $1,161,607 8.00$962,154
$4,081,377 18.88 $4,015,812 18.88 $3,783,101 19.88CollectionSupport
18.88 $4,358,403 20.88$3,429,563
$5,090,759 26.88 $5,050,124 26.88 $4,965,515 27.88Subtotal 26.88 $5,520,010 28.88$4,391,717
PUBLIC SERVICES
$815,373 13.00 $882,285 13.00 $933,935 14.00Austin HistoryCenter
13.00 $1,089,801 14.00$800,265
$11,095,003 194.15 $11,271,351 187.52 $11,312,229 184.27Circulation 192.42 $12,901,744 192.27$10,593,254
$1,038,795 15.65 $1,130,874 14.65 $1,141,407 15.65Reference andInformationServices
15.65 $1,398,979 15.65$1,035,076
$1,710,478 27.00 $1,848,152 27.00 $1,805,508 27.00Youth Services 27.00 $2,103,503 27.00$1,603,707
$14,659,649 249.80 $15,132,662 242.17 $15,193,079 240.92Subtotal 248.07 $17,494,027 248.92$14,032,302
SUPPORT SERVICES
$5,940,509 67.50 $6,322,116 72.50 $6,520,257 72.75DepartmentalSupportServices
68.23 $7,208,686 75.75$5,573,064
$5,940,509 67.50 $6,322,116 72.50 $6,520,257 72.75Subtotal 68.23 $7,208,686 75.75$5,573,064
TRANSFERS & OTHER REQUIREMENTS
$24,043 0.00 $22,778 0.00 $22,778 0.00OtherRequirements
0.00 $22,778 0.00$22,705
$24,043 0.00 $22,778 0.00 $22,778 0.00Subtotal 0.00 $22,778 0.00$22,705
$25,714,960 344.18 $26,527,680 341.55 $26,701,629 341.55Total 343.18 $30,245,501 353.55$24,019,788
2012-13 Proposed Budget, Austin, TX
Volume I | 169
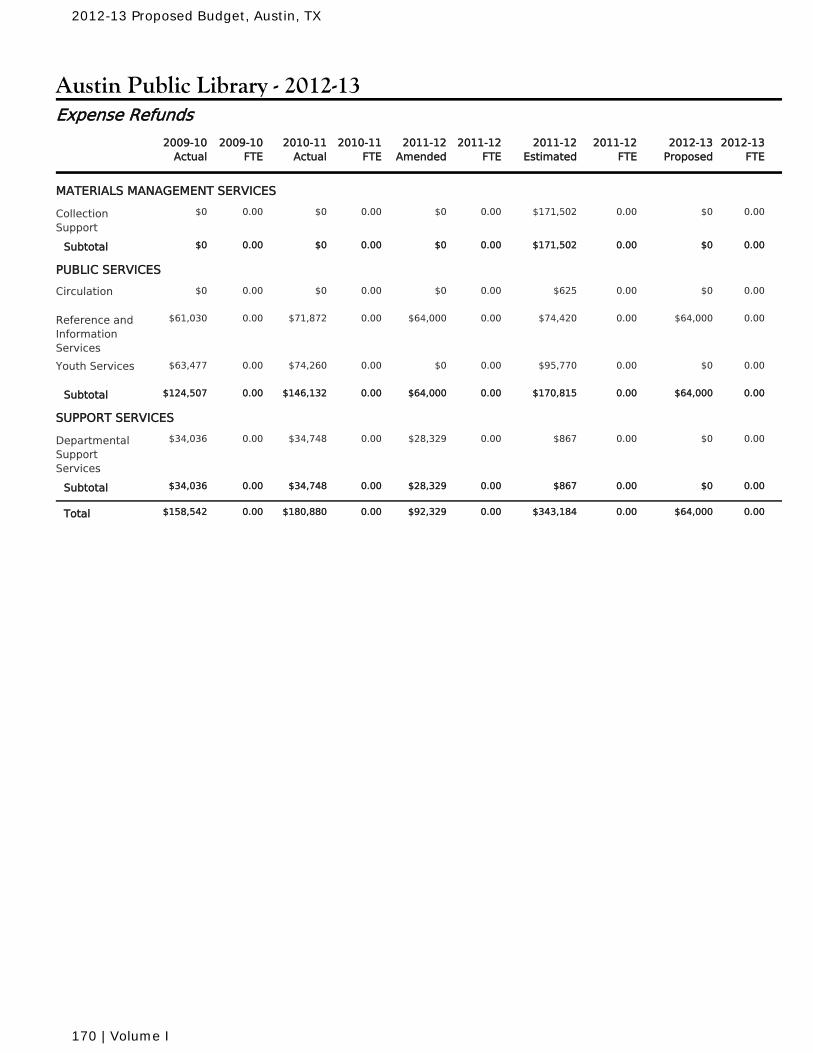
Austin Public Library - 2012-13
2010-11Actual
2010-11FTE
2011-12Amended
2011-12FTE
2011-12Estimated
2011-12FTE
2009-10Actual
2009-10FTE
2012-13Proposed
2012-13FTE
Expense Refunds
MATERIALS MANAGEMENT SERVICES
$0 0.00 $0 0.00 $171,502 0.00CollectionSupport
0.00 $0 0.00$0
$0 0.00 $0 0.00 $171,502 0.00Subtotal 0.00 $0 0.00$0
PUBLIC SERVICES
$0 0.00 $0 0.00 $625 0.00Circulation 0.00 $0 0.00$0
$71,872 0.00 $64,000 0.00 $74,420 0.00Reference andInformationServices
0.00 $64,000 0.00$61,030
$74,260 0.00 $0 0.00 $95,770 0.00Youth Services 0.00 $0 0.00$63,477
$146,132 0.00 $64,000 0.00 $170,815 0.00Subtotal 0.00 $64,000 0.00$124,507
SUPPORT SERVICES
$34,748 0.00 $28,329 0.00 $867 0.00DepartmentalSupportServices
0.00 $0 0.00$34,036
$34,748 0.00 $28,329 0.00 $867 0.00Subtotal 0.00 $0 0.00$34,036
$180,880 0.00 $92,329 0.00 $343,184 0.00Total 0.00 $64,000 0.00$158,542
2012-13 Proposed Budget, Austin, TX
170 | Volume I
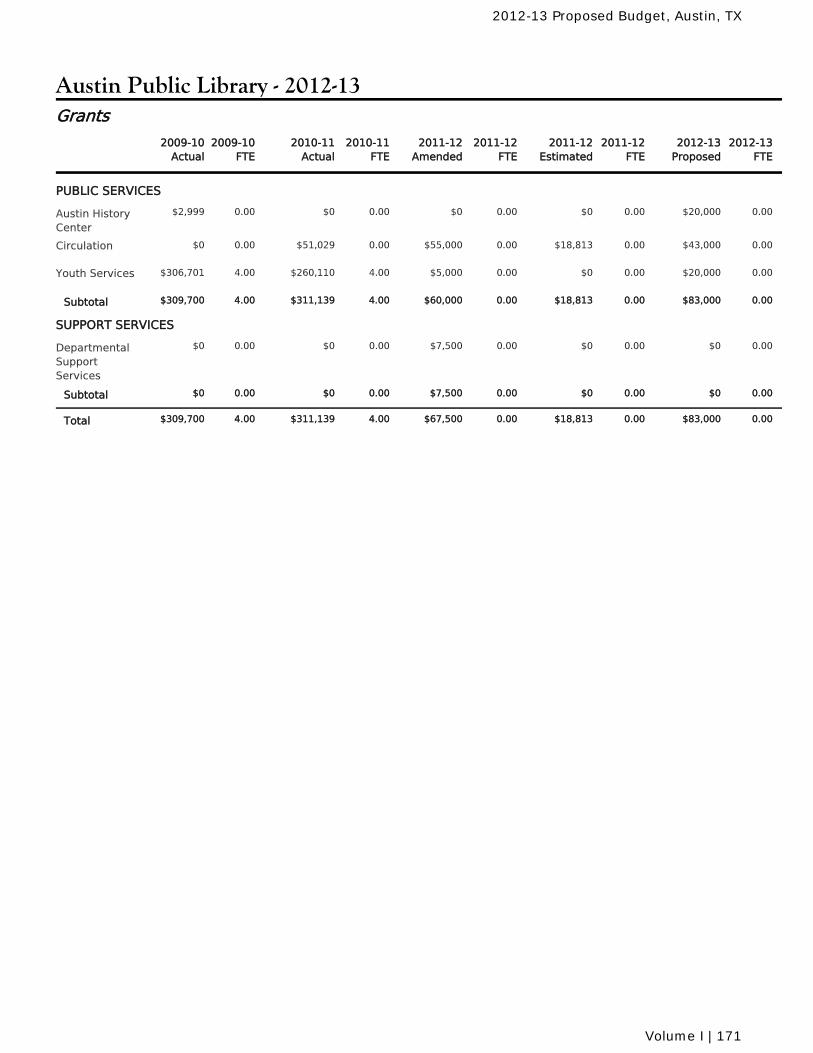
Austin Public Library - 2012-13
2010-11Actual
2010-11FTE
2011-12Amended
2011-12FTE
2011-12Estimated
2011-12FTE
2009-10Actual
2009-10FTE
2012-13Proposed
2012-13FTE
Grants
PUBLIC SERVICES
$0 0.00 $0 0.00 $0 0.00Austin HistoryCenter
0.00 $20,000 0.00$2,999
$51,029 0.00 $55,000 0.00 $18,813 0.00Circulation 0.00 $43,000 0.00$0
$260,110 4.00 $5,000 0.00 $0 0.00Youth Services 4.00 $20,000 0.00$306,701
$311,139 4.00 $60,000 0.00 $18,813 0.00Subtotal 4.00 $83,000 0.00$309,700
SUPPORT SERVICES
$0 0.00 $7,500 0.00 $0 0.00DepartmentalSupportServices
0.00 $0 0.00$0
$0 0.00 $7,500 0.00 $0 0.00Subtotal 0.00 $0 0.00$0
$311,139 4.00 $67,500 0.00 $18,813 0.00Total 4.00 $83,000 0.00$309,700
2012-13 Proposed Budget, Austin, TX
Volume I | 171

2012-13 Proposed Budget, Austin, TX
172 | Volume I
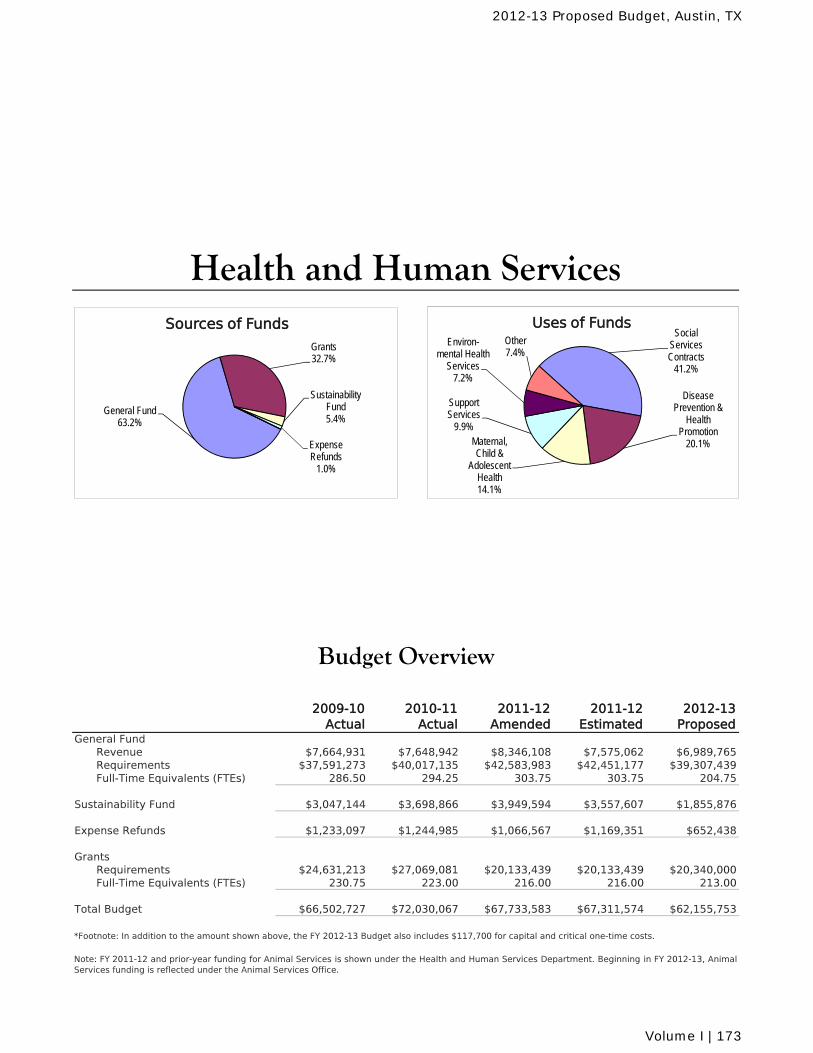
2009-10 Actual
2010-11 Actual
2011-12 Amended
2011-12 Estimated
2012-13 Proposed
General FundRevenue $7,664,931 $7,648,942 $8,346,108 $7,575,062 $6,989,765Requirements $37,591,273 $40,017,135 $42,583,983 $42,451,177 $39,307,439Full-Time Equivalents (FTEs) 286.50 294.25 303.75 303.75 204.75
Sustainability Fund $3,047,144 $3,698,866 $3,949,594 $3,557,607 $1,855,876
Expense Refunds $1,233,097 $1,244,985 $1,066,567 $1,169,351 $652,438
GrantsRequirements $24,631,213 $27,069,081 $20,133,439 $20,133,439 $20,340,000Full-Time Equivalents (FTEs) 230.75 223.00 216.00 216.00 213.00
Total Budget $66,502,727 $72,030,067 $67,733,583 $67,311,574 $62,155,753
Budget Overview
Health and Human Services
Note: FY 2011-12 and prior-year funding for Animal Services is shown under the Health and Human Services Department. Beginning in FY 2012-13, AnimalServices funding is reflected under the Animal Services Office.
*Footnote: In addition to the amount shown above, the FY 2012-13 Budget also includes $117,700 for capital and critical one-time costs.
General Fund63.2%
Grants32.7%
Sustainability Fund5.4%
Expense Refunds
1.0%
Sources of FundsSocial
Services Contracts
41.2%
Disease Prevention &
Health Promotion
20.1%Maternal, Child &
Adolescent Health14.1%
Support Services
9.9%
Environ-mental Health
Services7.2%
Other7.4%
Uses of Funds
2012-13 Proposed Budget, Austin, TX
Volume I | 173
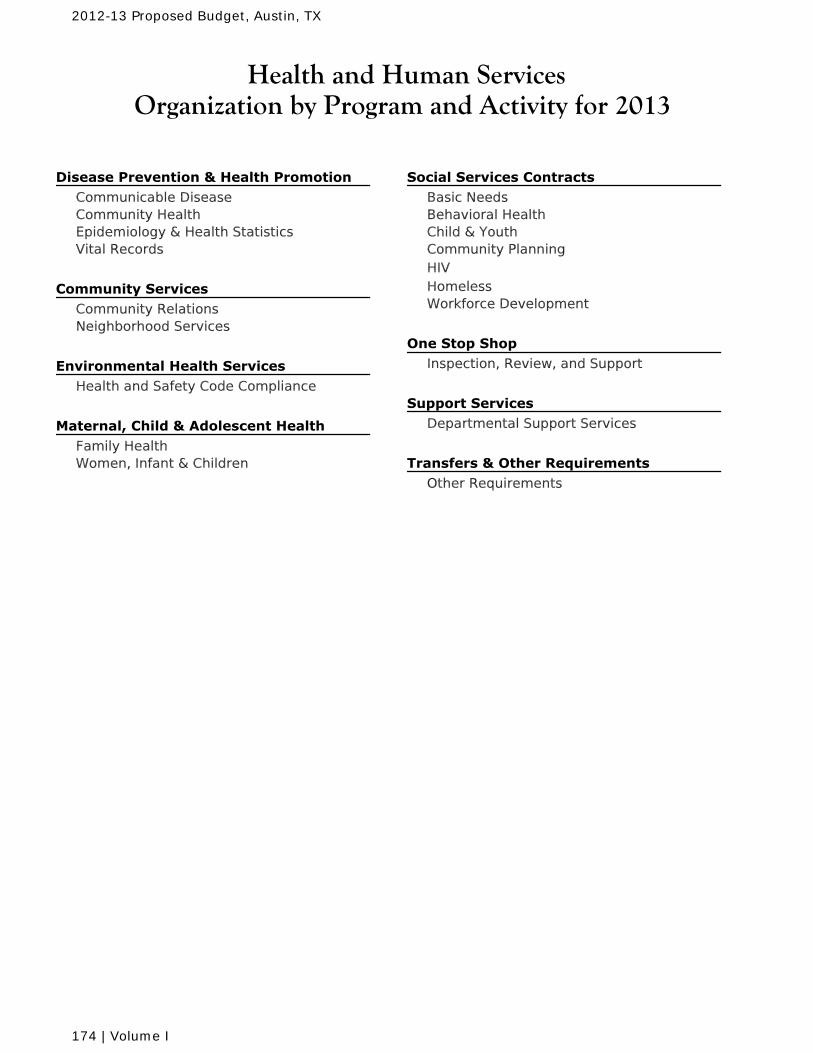
Health and Human ServicesOrganization by Program and Activity for 2013
Disease Prevention & Health Promotion Communicable DiseaseCommunity HealthEpidemiology & Health StatisticsVital Records
Community Services Community RelationsNeighborhood Services
Environmental Health Services Health and Safety Code Compliance
Maternal, Child & Adolescent Health Family HealthWomen, Infant & Children
Social Services Contracts Basic NeedsBehavioral HealthChild & YouthCommunity PlanningHIVHomelessWorkforce Development
One Stop Shop Inspection, Review, and Support
Support Services Departmental Support Services
Transfers & Other Requirements Other Requirements
2012-13 Proposed Budget, Austin, TX
174 | Volume I
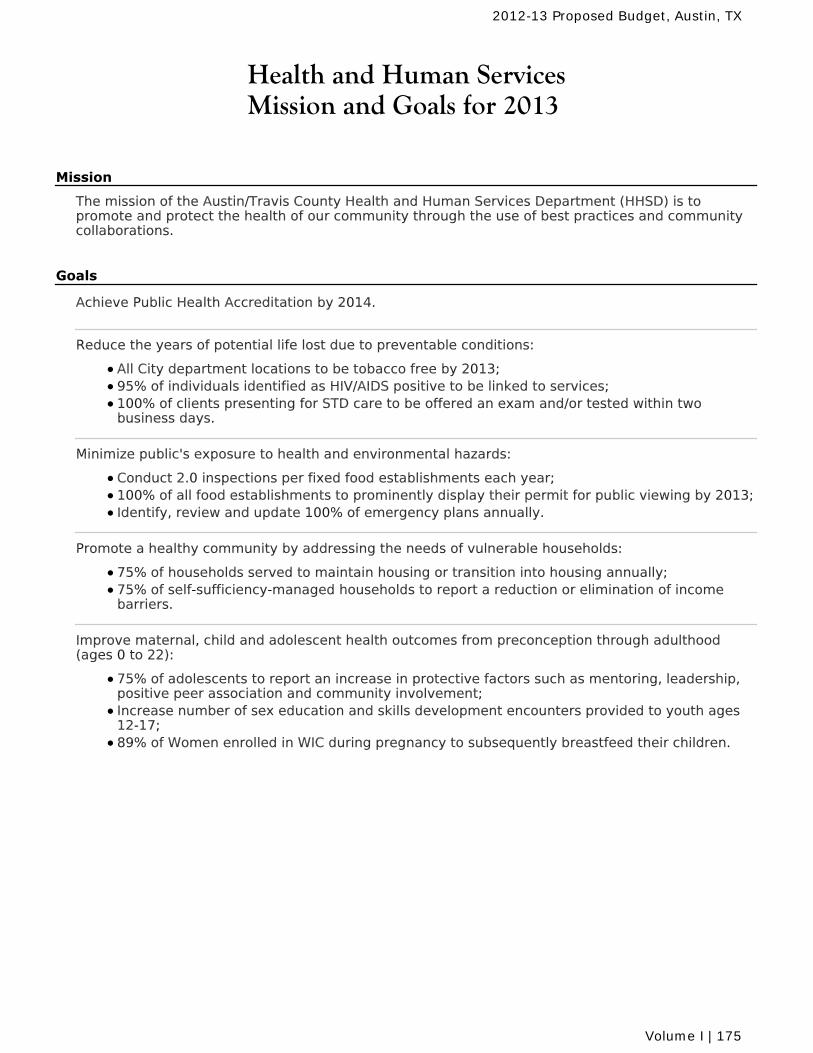
Health and Human ServicesMission and Goals for 2013
Mission
The mission of the Austin/Travis County Health and Human Services Department (HHSD) is topromote and protect the health of our community through the use of best practices and communitycollaborations.
Goals
Achieve Public Health Accreditation by 2014.
Reduce the years of potential life lost due to preventable conditions:
All City department locations to be tobacco free by 2013;95% of individuals identified as HIV/AIDS positive to be linked to services;100% of clients presenting for STD care to be offered an exam and/or tested within twobusiness days.
Minimize public's exposure to health and environmental hazards:
Conduct 2.0 inspections per fixed food establishments each year;100% of all food establishments to prominently display their permit for public viewing by 2013;Identify, review and update 100% of emergency plans annually.
Promote a healthy community by addressing the needs of vulnerable households:
75% of households served to maintain housing or transition into housing annually;75% of self-sufficiency-managed households to report a reduction or elimination of incomebarriers.
Improve maternal, child and adolescent health outcomes from preconception through adulthood(ages 0 to 22):
75% of adolescents to report an increase in protective factors such as mentoring, leadership,positive peer association and community involvement;Increase number of sex education and skills development encounters provided to youth ages12-17;89% of Women enrolled in WIC during pregnancy to subsequently breastfeed their children.
2012-13 Proposed Budget, Austin, TX
Volume I | 175
Health and Human Services
Message from the Director
Every day, in every part of our community, the Austin/Travis County Health and Human Services Department (HHSD) protects residents from infectious diseases and environmental threats, and educates these residents about the benefits of healthful behaviors in avoiding chronic diseases. HHSD offers a variety of services to the community through direct service provision and in partnership with community organizations to achieve the Department’s mission to promote and protect a healthy community through the use of best practices and community partnerships. HHSD’s major specific accomplishments in FY 2011-12 include the completion of the critical health indicators report and the community health assessment and a Departmental reorganization that builds the infrastructure to operate a comprehensive public health department.
In FY 2012-13, the HHSD programs and activities will align with the new organizational structure, creating a budget that better reflects the services provided. In FY 2012-13, the new Community Services Program will focus primarily on the direct services offered through HHSD, including services offered at the neighborhood centers, the day-labor site and through the African-American Quality of Life program. The new Environmental Health Services Program encompasses the work of our sanitarians, regulation-enforcement teams, inspectors, and staff who permit the fixed and mobile food establishments and pools in the community. The services provided by the new Maternal, Child & Adolescent Health Program focus on improving preconception health and access to prenatal care, while providing positive developmental opportunities for youth in our communities. Finally, the new Disease Prevention and Health Promotion Program encompasses the remaining public health services provided by the Department, including Communicable Disease, Vital Records, Community Health, and Epidemiology and Health Statistics.
As a vital component of its effort to promote the public safety of our community, in FY 2011-12 HHSD has provided over 45,000 immunizations and vaccines; 18,000 STD tests (as well as care and treatment for those who tested positive); issued over 12,000 food, pool and temporary events permits; and conducted approximately 2,000 disease surveillance investigations. The department will continue to address the needs of the community through the FY 2012-13 Budget, which includes funding for increased operational costs and expanded services. The department will continue to focus on the changing demands of Austin and Travis County residents and will work in collaboration with our community partners to address the burden of disease as identified by the community health indicators report and the service gaps identified through the community health assessment process.
HHSD staff are committed to providing comprehensive services that match the needs of the community. The framework that is in place will allow for improved services and collaborations in HHSD’s efforts to make Austin the healthiest community in the nation.
Carlos Rivera, Director
2012-13 Proposed Budget, Austin, TX
176 | Volume I
Budget Highlights
The Health and Human Services Department (HHSD) has developed a budget that includes the resources to provide public health protection and prevention services, social services, youth development and employment services, and support services, and to achieve the goals and objectives of the department. HHSD’s FY 2012-13 General Fund-supported budget totals $39.3 million and 204.75 FTEs. In addition, the Department’s budget includes $20.3 million in grant funding, supporting 213 FTEs, and $1.9 million from the Sustainability Fund to support contracts with partners providing workforce development services. Social Services Contracts The Social Services Contracts program includes funding for myriad service areas including: basic needs, child and youth services, homelessness, behavioral health, HIV, community planning efforts, and workforce development. Through the Social Services Contracts Program, which includes $25.5 million in contracts to service providers, HHSD anticipates that 3,700 homeless persons and 2,461 workforce development clients will receive services. The Department will receive $841,000 to maintain the mental health interlocal agreement with Austin/Travis County Integral Care (ATCIC); however, $253,000 in FY 2011-12 one-time funding for the substance abuse contract has not been included. The Social Service Contracts program receives funding from the General Fund, Sustainability Fund and various grants. In FY 2012-13, $1.3 million formerly provided by the Sustainability Fund will be sourced from the General Fund. This reallocation does not affect the total $25.5 million appropriation. Community Services The Community Services program both provides direct services to clients and links them to other services available throughout the community. In FY 2012-13, it is anticipated that 68,000 individuals will receive basic needs services at the neighborhood centers. The Department’s budget is being reduced by $18,000 to reflect the removal of one-time expenditures related to maintenance costs for St. John’s Neighborhood Center, a shared facility with Library, Parks and Recreation, and the Austin Independent School District (AISD). As a result of a review of unmet service demands, the City Manager authorized the addition of a Public Health Nurse position to the Department’s General Fund budget. Originally grant-funded, this position was supported last year with one-time funding from the Sustainability Fund. This nurse serves 2,887 unduplicated clients annually at the South Austin Neighborhood Center, providing blood-pressure and blood-sugar screening as well as educational outreach regarding diabetes and hypertension. Disease Prevention and Health Promotion
The Disease Prevention and Health Promotion (DPHP) program provides an array of services through the Communicable Disease, Community Health, Epidemiology & Health Statistics, and Vital Records activities. These activities focus on services that screen for and prevent illnesses and other health issues. Other services provided by the DPHP program include the issuance of birth and death certificates; testing for many communicable diseases; counseling; educational outreach and testing for HIV, STDs, and chronic diseases; and public health emergency- preparedness activities and education. DPHP will receive $12.5 million in combined General Fund and grant funding to continue these services in FY 2012-13. As a result of the City Manager’s review of unmet service
demands, this program’s Toxicologist and Community Development Manager positions will be transferred to the General Fund, necessitating a $170,000 increase in personnel funding. These core infrastructure positions have been funded by the Public Health and Emergency Preparedness grant, which has experienced continued reductions since 2009. Transferring these positions to the General Fund ensures that they will be appropriately and consistently funded and allows the Department to use remaining grant funds to support other programmatic staff. Specifically, a Marketing Representative B position and HHSD Program Coordinator position will be able to again be funded by this grant. Revenue related to Medicaid reimbursements is expected to decrease $111,000 in the coming fiscal year due to increases in community resources such as “minute clinics” that provide immunization services and in the number of clients visiting their primary care providers for these services. HHSD is also amending its immunization fee structure from a visit- to a dosage-based model. For non-Medicaid clients who can afford it,
2012-13 Proposed Budget, Austin, TX
Volume I | 177
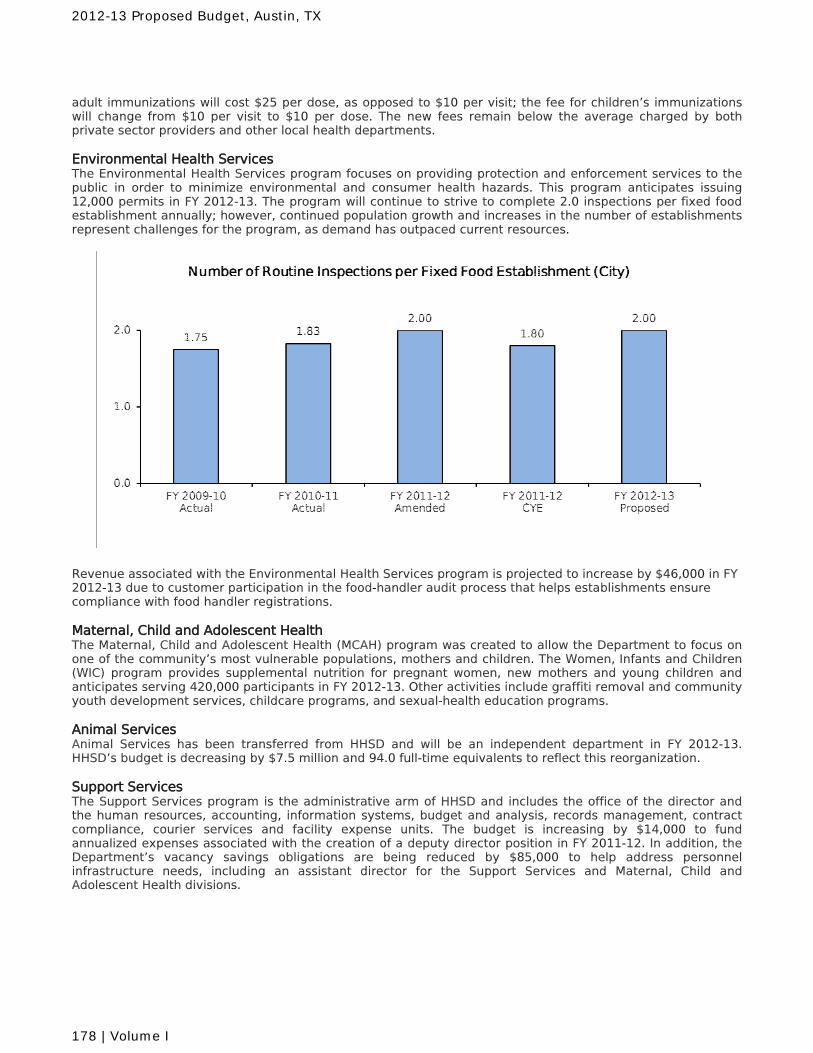
adult immunizations will cost $25 per dose, as opposed to $10 per visit; the fee for children’s immunizations will change from $10 per visit to $10 per dose. The new fees remain below the average charged by both private sector providers and other local health departments. Environmental Health Services The Environmental Health Services program focuses on providing protection and enforcement services to the public in order to minimize environmental and consumer health hazards. This program anticipates issuing 12,000 permits in FY 2012-13. The program will continue to strive to complete 2.0 inspections per fixed food establishment annually; however, continued population growth and increases in the number of establishments represent challenges for the program, as demand has outpaced current resources.
Revenue associated with the Environmental Health Services program is projected to increase by $46,000 in FY 2012-13 due to customer participation in the food-handler audit process that helps establishments ensure compliance with food handler registrations. Maternal, Child and Adolescent Health The Maternal, Child and Adolescent Health (MCAH) program was created to allow the Department to focus on one of the community’s most vulnerable populations, mothers and children. The Women, Infants and Children (WIC) program provides supplemental nutrition for pregnant women, new mothers and young children and anticipates serving 420,000 participants in FY 2012-13. Other activities include graffiti removal and community youth development services, childcare programs, and sexual-health education programs. Animal Services Animal Services has been transferred from HHSD and will be an independent department in FY 2012-13. HHSD’s budget is decreasing by $7.5 million and 94.0 full-time equivalents to reflect this reorganization. Support Services The Support Services program is the administrative arm of HHSD and includes the office of the director and the human resources, accounting, information systems, budget and analysis, records management, contract compliance, courier services and facility expense units. The budget is increasing by $14,000 to fund annualized expenses associated with the creation of a deputy director position in FY 2011-12. In addition, the Department’s vacancy savings obligations are being reduced by $85,000 to help address personnel infrastructure needs, including an assistant director for the Support Services and Maternal, Child and Adolescent Health divisions.
2012-13 Proposed Budget, Austin, TX
178 | Volume I
Department-wide Grant Support HHSD’s operations are currently supported by over $20 million in grant funding. As the City’s personnel and insurance costs increase, however, grant funding seldom keeps pace. Several of the Department’s statutory functions are primarily funded by grants and require General Fund grant support to offset personnel cost increases. The FY 2012-13 budget includes a $322,000 increase in grant support for positions in the Tuberculosis, Immunizations, WIC, HIV Surveillance, and Sexually Transmitted Disease programs. Other Revenue HHSD General Fund revenue for FY 2012-13 is projected to be $6,989,764, which is a net decrease of $1.4 million from the budgeted FY 2011-12 level. While it reflects the revenue impacts discussed above, this net decrease is primarily driven by the transfer of Animal Services and its $1 million of associated revenue. Other fee and revenue adjustments include the elimination of the permitting fee for vending machines and the institution of a $5 fee for an additional copy of an immunization record.
2012-13 Proposed Budget, Austin, TX
Volume I | 179
Revenue Changes Dollars
The Budget includes a net decrease of $643,940 in revenue related to theinterlocal agreement with Travis County. $627,790 in budgeted revenue istransferring to the new Animal Services Office; the remainder is a net decreasebased on the cost model calculation for the interlocal agreement. ($643,940)
Revenue from animal-related fees is decreasing by $387,456 due to the transfer ofthe Animal Service Office. ($387,456)
Estimated revenue from sources within the Environmental Health Servicesprogram are being adjusted based on historical data and projected demand,including temporary food booth permit, food establishment permit, mobile foodvendor permit, licensing inspection, food manager training, food handler permit,food sampling permit and after hours/weekend inspection revenue. $45,754
The Disease Prevention and Health Promotion program is projecting a $115,784decrease in revenue, primarily as a result of reduced Medicaid and Medicarereimbursements. ($115,784)
The Budget includes a revenue decrease of $254,918 from The Vital Recordsprogram, primarily due to the decrease in demand for birth and death certificatesand the state mandate for funeral directors to order death certificates directlyfrom the state. ($254,918)
The Health and Human Services Department (HHSD) is amending its immunizationfee schedule from a visit- to a dosage-based model. For non-Medicaid clients whocan afford it, adult immunizations will cost $25 per dose, as opposed to $10 pervisit; the fee for children’s immunizations will change from $10 per visit to $10 perdose. The Department is not budgeting any revenue impact from this adjustment,as the effect of the increased fees may be offset by reduced demand. $0
The Department is eliminating its permitting fee for vending machines. It is alsoinstituting a $5 fee for each additional copy of an immunization record. The netimpact of both changes is projected to be negligible. $0
Expenditure Changes FTEs Dollars
CitywideThe Budget includes $421,530 for salary increases associated with wageadjustments in FY 2013. An additional $61,499 is included in the Budget forincreased City contributions for health insurance. $483,029
The Budget includes additional funding for the Employees' Retirement System thatis equivalent to 2% of payroll for non-civil service employees to help improve thefunded status of the pension system. This amount also includes a budgetreallocation from the fund level to the department level. $1,142,984
The Budget includes $37,622 for wage adjustments associated with implementingthe City's recently completed market study. $37,622
Significant ChangesHealth and Human Services
General Fund
2012-13 Proposed Budget, Austin, TX
180 | Volume I
Expenditure Changes FTEs Dollars
Department-wideTo account for faster growth in City personnel costs than in grant awards, HHSD isbudgeting an additonal $322,446 in grant support for FY 2012-13. $322,446
The Budget reflects a $64,079 increase associated with terminal pay to account foranticipated retirements in FY 2012-13. $64,079
Department commodity costs such as paint, cleaning supplies, office supplies,small tools, and computer maintenance continue to increase as a result ofinflationary pressure. HHSD's budget for these items is increasing to keep pacewith expenditures. $36,065
The Budget includes an increase of $85,000 to eliminate the vacancy savingsassociated with essential positions that are anticipated to be filled in FY 2012-13. $85,000
As a result of a review of unmet service demands, the City Manager approvedadditional funds to provide for the cost of professional registrations andmemberships. $8,300
Animal ServicesIn FY 2012-13, Animal Services is becoming an independent department, resultingin a net transfer of 94.0 FTEs and $7,478,131 in funding to the new AnimalServices Office. (94.00) ($7,478,131)
Community ServicesA Public Health Nurse position, funded last year through one-time support from theSustainabiltiy Fund, is being added to the Department's General Budget inaccordance with the City Manager's review of unmet service demands. $86,892
The Budget includes a reduction of $18,092 in one-time maintenance funding forSt. John Community Center. ($18,092)
For FY 2012-13, five employees are being transferred to the Community ServiceBlock Grant (CSBG): 2 Neighborhood Liaisons, 1 Social Worker, 1 Community JobCounselor, and 1 Community Worker. These positions were funded by theSustainability Fund in FY 2011-12; therefore, there is no impact to FY 2012-13General Fund requirements. (5.00) $0
Disease Prevention & Health Promotion (DPHP)As a result of a review of unmet service demands, the City Manager has approvedthe transfer of a grant-funded Toxicologist position and a partially grant-fundedCommunity Development Manager position to the Department's General Fundbudget in FY 2012-13. 2.00 $170,339
An HHSD Program Coordinator and a Marketing Representative B position arebeing transferred to the Public Health and Emergency Preparedness grant. Thesepositions were funded by the Sustainability Fund in FY 2011-12; therefore, there isno impact to HHSD's FY 2012-13 General Fund requirements. (2.00) $0
The Budget includes a reduction equal to the one-time cost associated withsoftware system upgrades for the TB Clinic's digital X-ray system. ($10,000)
Environmental HealthHHSD's budget is decreasing as a result of reduced rental allocations forDepartment-occupied space at Rutherford Lane and One Texas Center. ($69,311)
Maternal, Child & Adolescent HealthThe Budget includes additional funding to reflect the transfer of the HollyNeighborhood Youth Programs to HHSD from Austin Energy. $95,020
2012-13 Proposed Budget, Austin, TX
Volume I | 181
Expenditure Changes FTEs Dollars
Social Service ContractsFunding for contracts with agencies providing basic needs and homeless services,and for the African American Youth Resource Center, will come from the GeneralFund, rather than the Sustainability Fund, in FY 2012-13. $1,467,510
The Budget includes the removal of a one-time increase in FY 2011-12appropriations of $253,265 to extend funding to the Austin Travis County IntegralCare (ATCIC) substance abuse contract. ($253,265)
To restore full-year funding for the ATCIC Main Interlocal agreement, HHSD isbudgeting an additional $840,581 in FY 2012-13. $840,581
FY 2011-12 HHSD received one-time funding of $250,000 for a contract withSouthwest Keys, which is being eliminated from the FY 2012-13 Budget. ($250,000)
Support ServicesDuring FY 2011-12, an HHSD Assistant Director position was reclassed to DeputyDirector. This change requires an addiitonal $14,048 to fund the annualization ofpersonnel costs. $14,048
HHSD is eliminating one-time FY 2011-12 funding for six months of utility costs atthe Town Lake Animal Center. ($53,500)
2012-13 Proposed Budget, Austin, TX
182 | Volume I
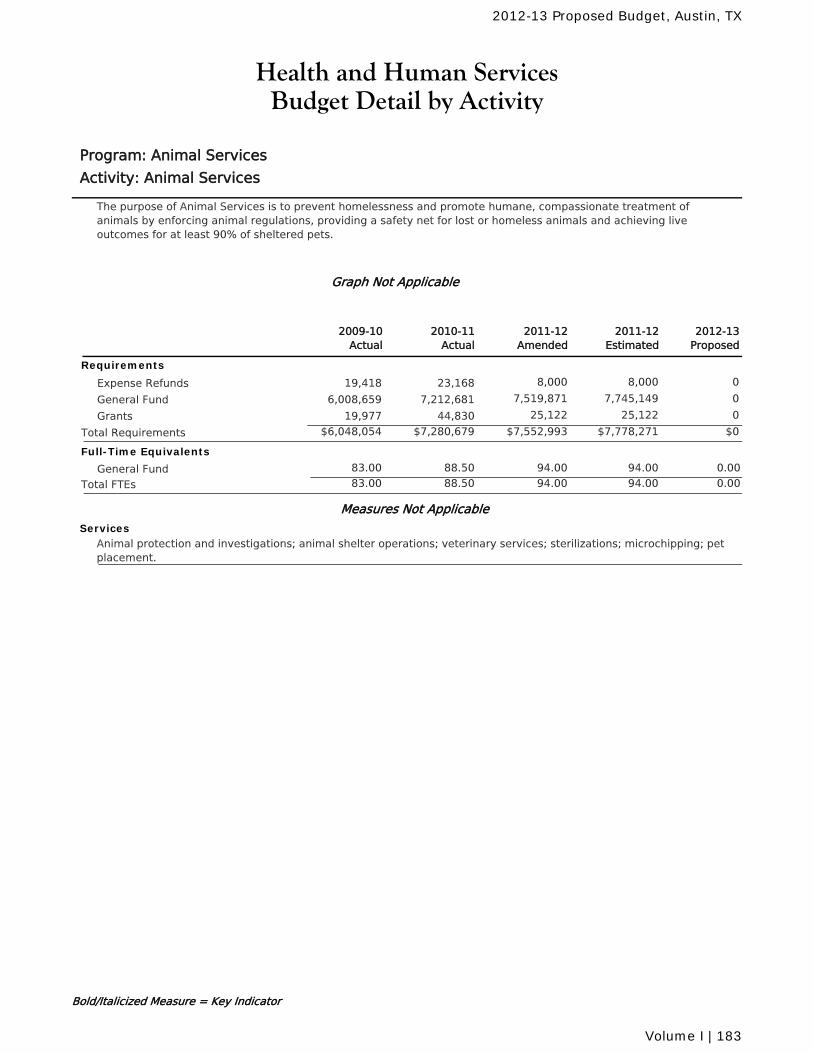
Health and Human ServicesBudget Detail by Activity
Program: Animal Services
Activity: Animal Services
The purpose of Animal Services is to prevent homelessness and promote humane, compassionate treatment ofanimals by enforcing animal regulations, providing a safety net for lost or homeless animals and achieving liveoutcomes for at least 90% of sheltered pets.
Graph Not Applicable
2011-12Amended
2010-11Actual
2011-12Estimated
2012-13Proposed
2009-10Actual
Requirements
Expense Refunds 8,000 8,000 023,16819,418
General Fund 7,519,871 7,745,149 07,212,6816,008,659
Grants 25,122 25,122 044,83019,977
$7,552,993 $7,778,271 $0Total Requirements $7,280,679$6,048,054
Full-Time Equivalents
General Fund 88.50 94.00 94.00 0.0083.00
Total FTEs 88.50 94.00 94.00 0.0083.00
Measures Not Applicable
ServicesAnimal protection and investigations; animal shelter operations; veterinary services; sterilizations; microchipping; petplacement.
Bold/Italicized Measure = Key Indicator
2012-13 Proposed Budget, Austin, TX
Volume I | 183
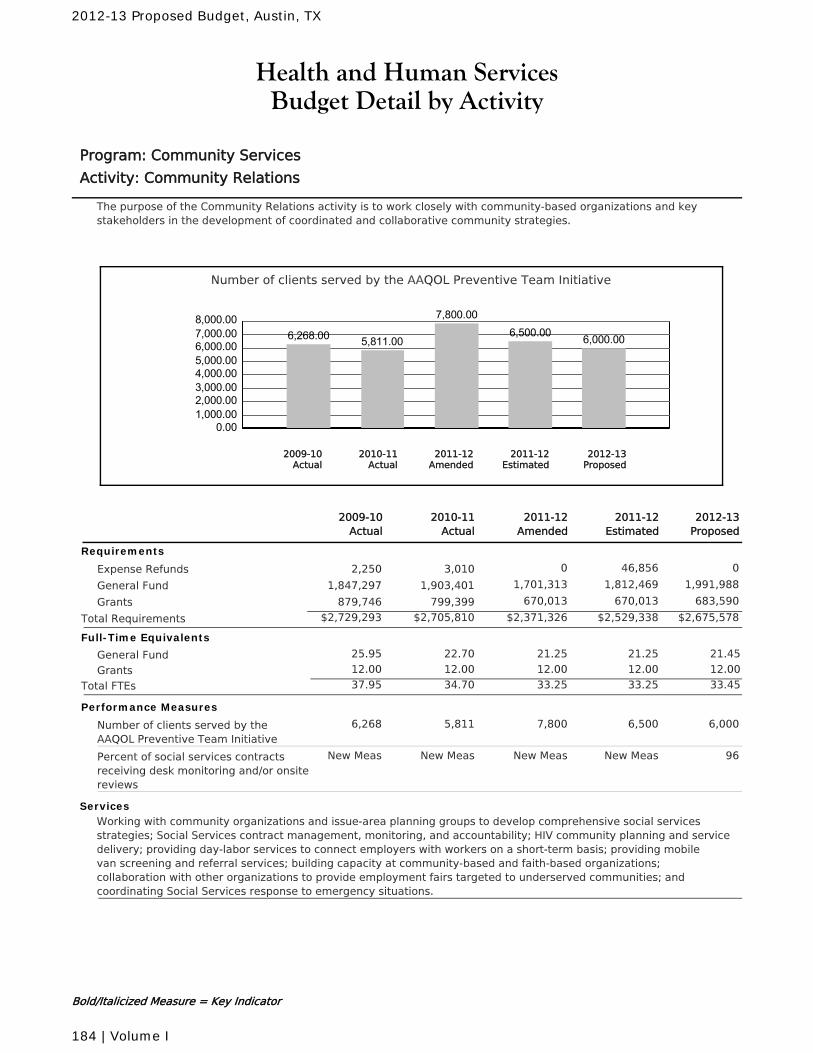
Health and Human ServicesBudget Detail by Activity
Program: Community Services
Activity: Community Relations
The purpose of the Community Relations activity is to work closely with community-based organizations and keystakeholders in the development of coordinated and collaborative community strategies.
Number of clients served by the AAQOL Preventive Team Initiative
0.001,000.002,000.003,000.004,000.005,000.006,000.007,000.008,000.00
6,268.00 5,811.00
7,800.006,500.00 6,000.00
2010-11Actual
2012-13Proposed
2011-12Amended
2011-12Estimated
2009-10Actual
2011-12Amended
2010-11Actual
2011-12Estimated
2012-13Proposed
2009-10Actual
Requirements
Expense Refunds 0 46,856 03,0102,250
General Fund 1,701,313 1,812,469 1,991,9881,903,4011,847,297
Grants 670,013 670,013 683,590799,399879,746
$2,371,326 $2,529,338 $2,675,578Total Requirements $2,705,810$2,729,293
Full-Time Equivalents
General Fund 22.70 21.25 21.25 21.4525.95
Grants 12.00 12.00 12.00 12.0012.00
Total FTEs 34.70 33.25 33.25 33.4537.95
Performance Measures
Number of clients served by theAAQOL Preventive Team Initiative
7,8005,811 6,500 6,0006,268
Percent of social services contractsreceiving desk monitoring and/or onsitereviews
New MeasNew Meas New Meas 96New Meas
ServicesWorking with community organizations and issue-area planning groups to develop comprehensive social servicesstrategies; Social Services contract management, monitoring, and accountability; HIV community planning and servicedelivery; providing day-labor services to connect employers with workers on a short-term basis; providing mobilevan screening and referral services; building capacity at community-based and faith-based organizations;collaboration with other organizations to provide employment fairs targeted to underserved communities; andcoordinating Social Services response to emergency situations.
Bold/Italicized Measure = Key Indicator
2012-13 Proposed Budget, Austin, TX
184 | Volume I
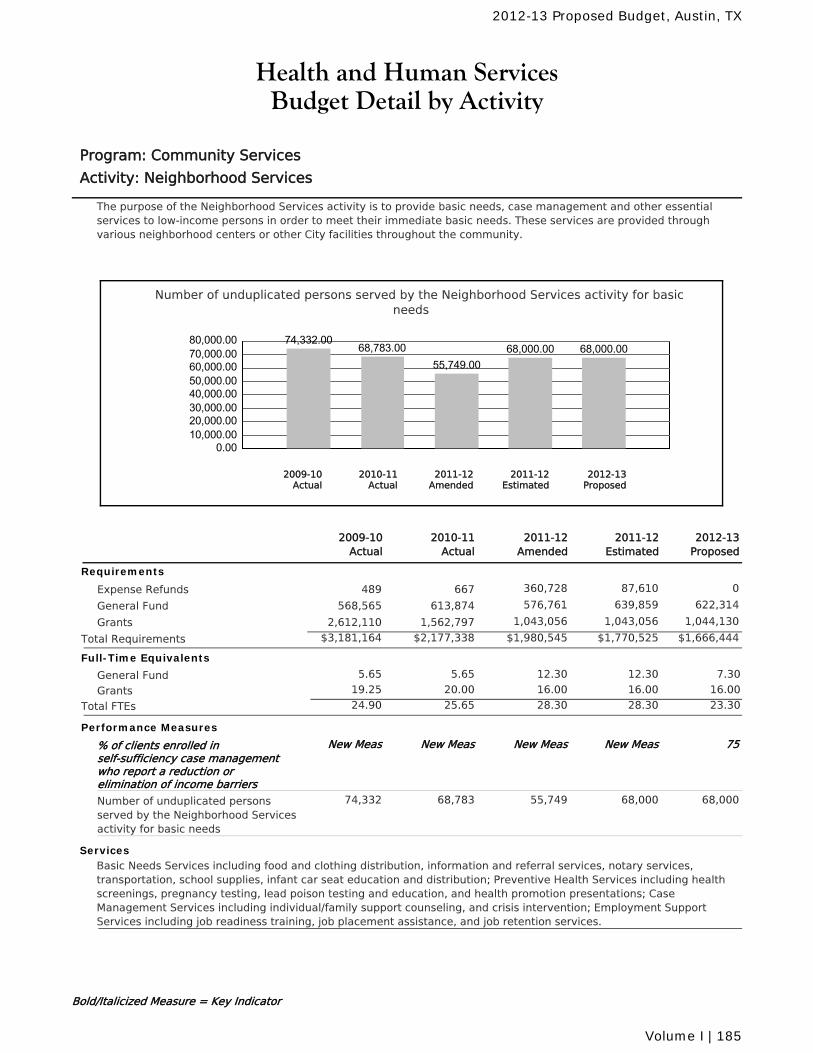
Health and Human ServicesBudget Detail by Activity
Program: Community Services
Activity: Neighborhood Services
The purpose of the Neighborhood Services activity is to provide basic needs, case management and other essentialservices to low-income persons in order to meet their immediate basic needs. These services are provided throughvarious neighborhood centers or other City facilities throughout the community.
Number of unduplicated persons served by the Neighborhood Services activity for basicneeds
0.0010,000.0020,000.0030,000.0040,000.0050,000.0060,000.0070,000.0080,000.00 74,332.00
68,783.0055,749.00
68,000.00 68,000.00
2010-11Actual
2012-13Proposed
2011-12Amended
2011-12Estimated
2009-10Actual
2011-12Amended
2010-11Actual
2011-12Estimated
2012-13Proposed
2009-10Actual
Requirements
Expense Refunds 360,728 87,610 0667489
General Fund 576,761 639,859 622,314613,874568,565
Grants 1,043,056 1,043,056 1,044,1301,562,7972,612,110
$1,980,545 $1,770,525 $1,666,444Total Requirements $2,177,338$3,181,164
Full-Time Equivalents
General Fund 5.65 12.30 12.30 7.305.65
Grants 20.00 16.00 16.00 16.0019.25
Total FTEs 25.65 28.30 28.30 23.3024.90
Performance Measures
% of clients enrolled inself-sufficiency case managementwho report a reduction orelimination of income barriers
New MeasNew Meas New Meas 75New Meas
Number of unduplicated personsserved by the Neighborhood Servicesactivity for basic needs
55,74968,783 68,000 68,00074,332
ServicesBasic Needs Services including food and clothing distribution, information and referral services, notary services,transportation, school supplies, infant car seat education and distribution; Preventive Health Services including healthscreenings, pregnancy testing, lead poison testing and education, and health promotion presentations; CaseManagement Services including individual/family support counseling, and crisis intervention; Employment SupportServices including job readiness training, job placement assistance, and job retention services.
Bold/Italicized Measure = Key Indicator
2012-13 Proposed Budget, Austin, TX
Volume I | 185
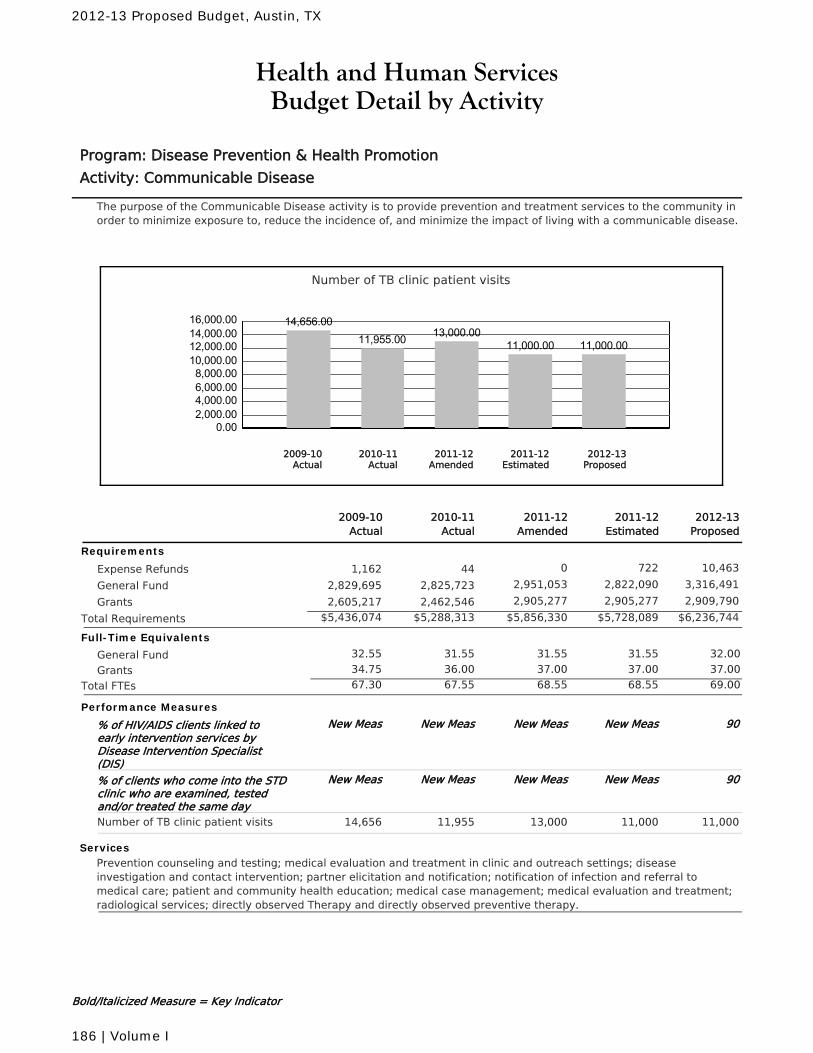
Health and Human ServicesBudget Detail by Activity
Program: Disease Prevention & Health Promotion
Activity: Communicable Disease
The purpose of the Communicable Disease activity is to provide prevention and treatment services to the community inorder to minimize exposure to, reduce the incidence of, and minimize the impact of living with a communicable disease.
Number of TB clinic patient visits
0.002,000.004,000.006,000.008,000.00
10,000.0012,000.0014,000.0016,000.00 14,656.00
11,955.00 13,000.0011,000.00 11,000.00
2010-11Actual
2012-13Proposed
2011-12Amended
2011-12Estimated
2009-10Actual
2011-12Amended
2010-11Actual
2011-12Estimated
2012-13Proposed
2009-10Actual
Requirements
Expense Refunds 0 722 10,463441,162
General Fund 2,951,053 2,822,090 3,316,4912,825,7232,829,695
Grants 2,905,277 2,905,277 2,909,7902,462,5462,605,217
$5,856,330 $5,728,089 $6,236,744Total Requirements $5,288,313$5,436,074
Full-Time Equivalents
General Fund 31.55 31.55 31.55 32.0032.55
Grants 36.00 37.00 37.00 37.0034.75
Total FTEs 67.55 68.55 68.55 69.0067.30
Performance Measures
% of HIV/AIDS clients linked toearly intervention services byDisease Intervention Specialist(DIS)
New MeasNew Meas New Meas 90New Meas
% of clients who come into the STDclinic who are examined, testedand/or treated the same day
New MeasNew Meas New Meas 90New Meas
Number of TB clinic patient visits 13,00011,955 11,000 11,00014,656
ServicesPrevention counseling and testing; medical evaluation and treatment in clinic and outreach settings; diseaseinvestigation and contact intervention; partner elicitation and notification; notification of infection and referral tomedical care; patient and community health education; medical case management; medical evaluation and treatment;radiological services; directly observed Therapy and directly observed preventive therapy.
Bold/Italicized Measure = Key Indicator
2012-13 Proposed Budget, Austin, TX
186 | Volume I
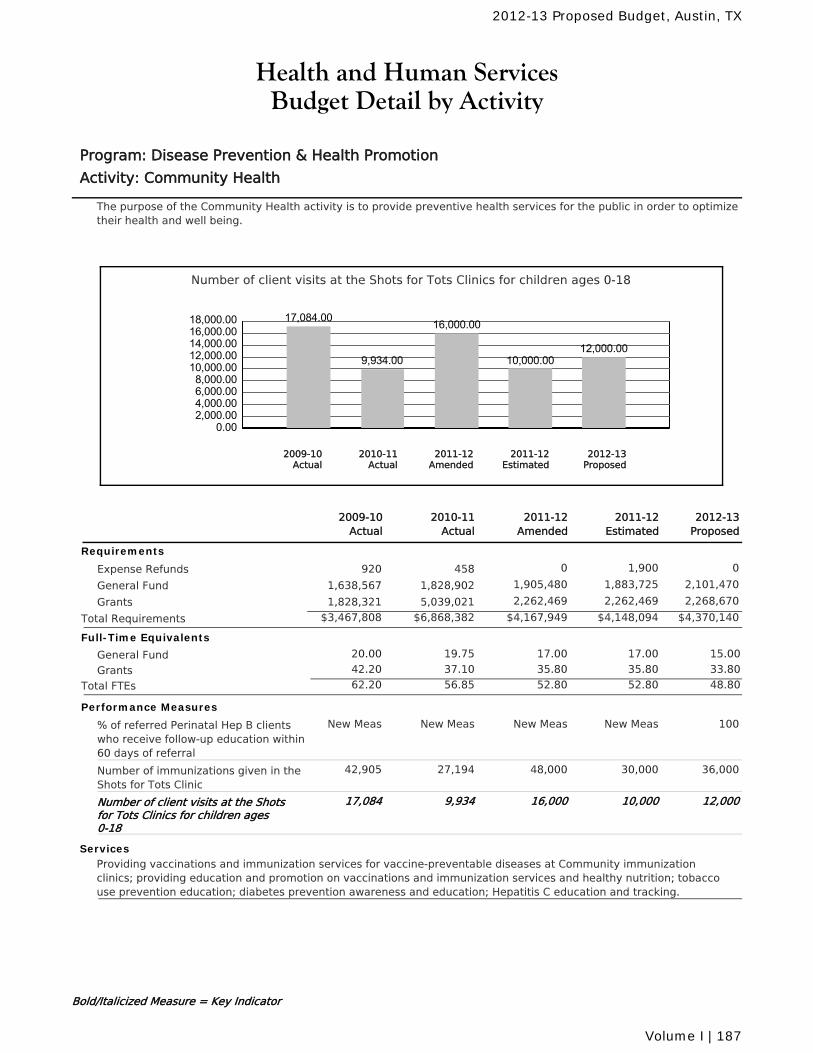
Health and Human ServicesBudget Detail by Activity
Program: Disease Prevention & Health Promotion
Activity: Community Health
The purpose of the Community Health activity is to provide preventive health services for the public in order to optimizetheir health and well being.
Number of client visits at the Shots for Tots Clinics for children ages 0-18
0.002,000.004,000.006,000.008,000.00
10,000.0012,000.0014,000.0016,000.0018,000.00 17,084.00
9,934.00
16,000.00
10,000.0012,000.00
2010-11Actual
2012-13Proposed
2011-12Amended
2011-12Estimated
2009-10Actual
2011-12Amended
2010-11Actual
2011-12Estimated
2012-13Proposed
2009-10Actual
Requirements
Expense Refunds 0 1,900 0458920
General Fund 1,905,480 1,883,725 2,101,4701,828,9021,638,567
Grants 2,262,469 2,262,469 2,268,6705,039,0211,828,321
$4,167,949 $4,148,094 $4,370,140Total Requirements $6,868,382$3,467,808
Full-Time Equivalents
General Fund 19.75 17.00 17.00 15.0020.00
Grants 37.10 35.80 35.80 33.8042.20
Total FTEs 56.85 52.80 52.80 48.8062.20
Performance Measures
% of referred Perinatal Hep B clientswho receive follow-up education within60 days of referral
New MeasNew Meas New Meas 100New Meas
Number of immunizations given in theShots for Tots Clinic
48,00027,194 30,000 36,00042,905
Number of client visits at the Shotsfor Tots Clinics for children ages0-18
16,0009,934 10,000 12,00017,084
ServicesProviding vaccinations and immunization services for vaccine-preventable diseases at Community immunizationclinics; providing education and promotion on vaccinations and immunization services and healthy nutrition; tobaccouse prevention education; diabetes prevention awareness and education; Hepatitis C education and tracking.
Bold/Italicized Measure = Key Indicator
2012-13 Proposed Budget, Austin, TX
Volume I | 187
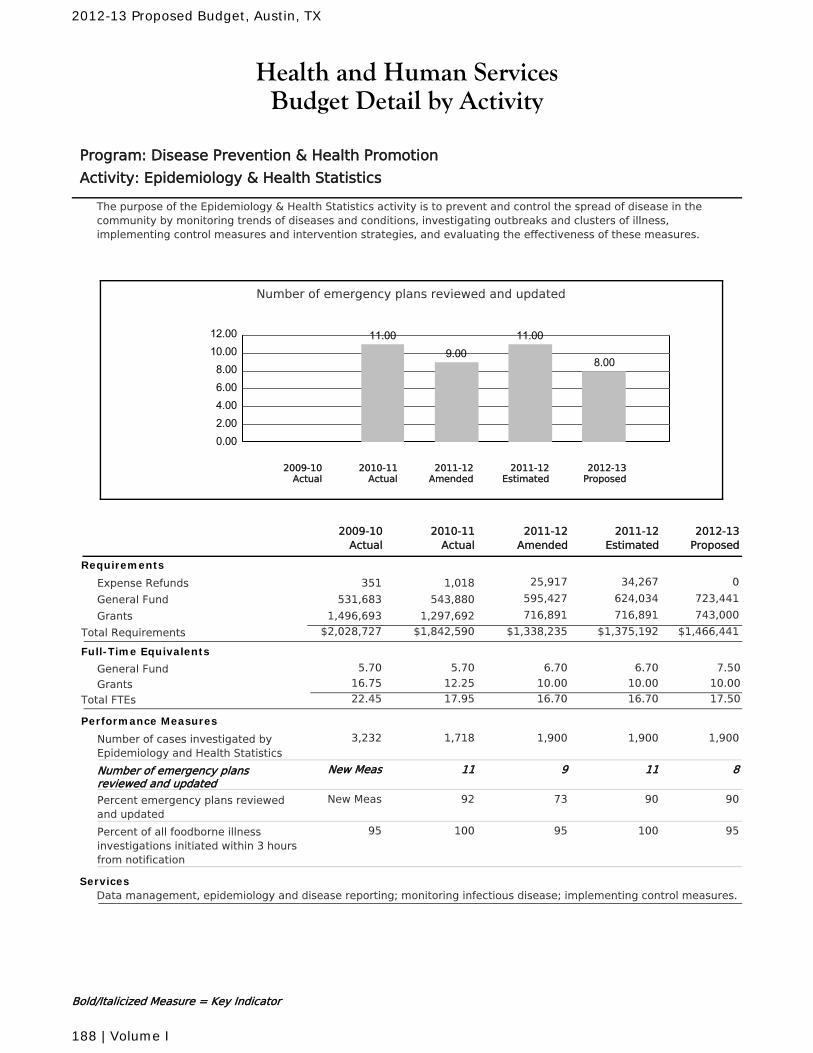
Health and Human ServicesBudget Detail by Activity
Program: Disease Prevention & Health Promotion
Activity: Epidemiology & Health Statistics
The purpose of the Epidemiology & Health Statistics activity is to prevent and control the spread of disease in thecommunity by monitoring trends of diseases and conditions, investigating outbreaks and clusters of illness,implementing control measures and intervention strategies, and evaluating the effectiveness of these measures.
Number of emergency plans reviewed and updated
0.002.004.006.008.00
10.0012.00 11.00
9.0011.00
8.00
2010-11Actual
2012-13Proposed
2011-12Amended
2011-12Estimated
2009-10Actual
2011-12Amended
2010-11Actual
2011-12Estimated
2012-13Proposed
2009-10Actual
Requirements
Expense Refunds 25,917 34,267 01,018351
General Fund 595,427 624,034 723,441543,880531,683
Grants 716,891 716,891 743,0001,297,6921,496,693
$1,338,235 $1,375,192 $1,466,441Total Requirements $1,842,590$2,028,727
Full-Time Equivalents
General Fund 5.70 6.70 6.70 7.505.70
Grants 12.25 10.00 10.00 10.0016.75
Total FTEs 17.95 16.70 16.70 17.5022.45
Performance Measures
Number of cases investigated byEpidemiology and Health Statistics
1,9001,718 1,900 1,9003,232
Number of emergency plansreviewed and updated
911 11 8New Meas
Percent emergency plans reviewedand updated
7392 90 90New Meas
Percent of all foodborne illnessinvestigations initiated within 3 hoursfrom notification
95100 100 9595
ServicesData management, epidemiology and disease reporting; monitoring infectious disease; implementing control measures.
Bold/Italicized Measure = Key Indicator
2012-13 Proposed Budget, Austin, TX
188 | Volume I
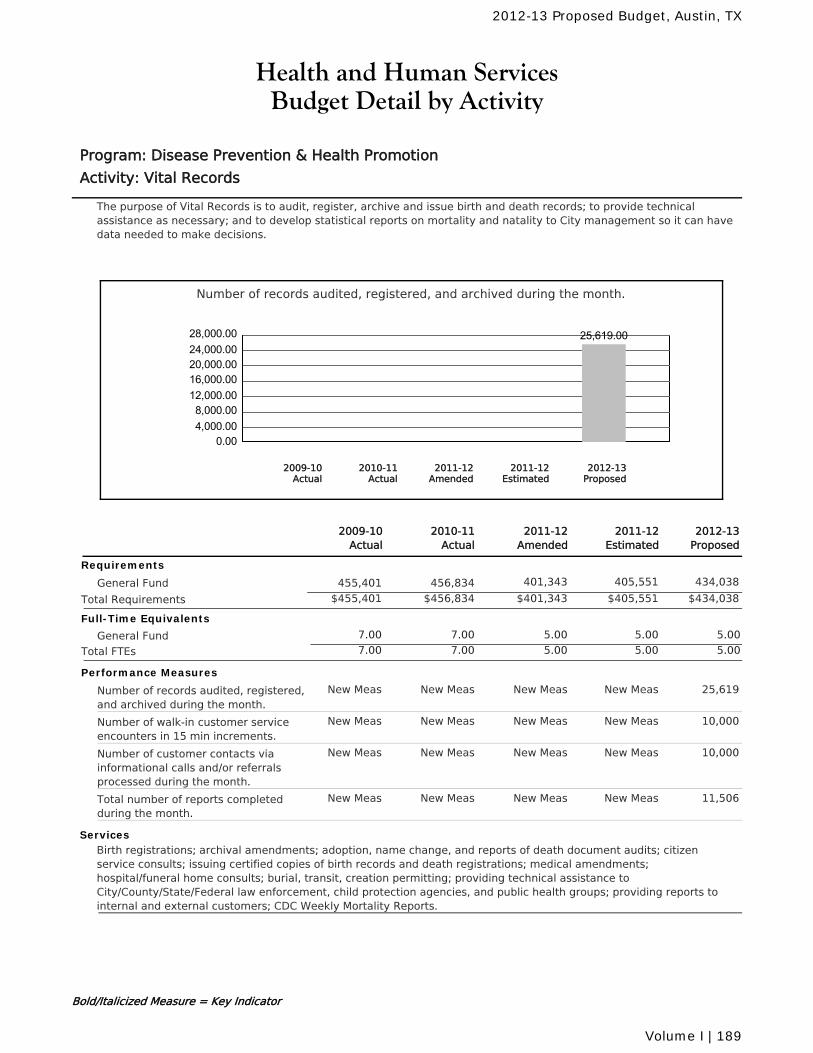
Health and Human ServicesBudget Detail by Activity
Program: Disease Prevention & Health Promotion
Activity: Vital Records
The purpose of Vital Records is to audit, register, archive and issue birth and death records; to provide technicalassistance as necessary; and to develop statistical reports on mortality and natality to City management so it can havedata needed to make decisions.
Number of records audited, registered, and archived during the month.
0.004,000.008,000.00
12,000.0016,000.0020,000.0024,000.0028,000.00 25,619.00
2010-11Actual
2012-13Proposed
2011-12Amended
2011-12Estimated
2009-10Actual
2011-12Amended
2010-11Actual
2011-12Estimated
2012-13Proposed
2009-10Actual
Requirements
General Fund 401,343 405,551 434,038456,834455,401
$401,343 $405,551 $434,038Total Requirements $456,834$455,401
Full-Time Equivalents
General Fund 7.00 5.00 5.00 5.007.00
Total FTEs 7.00 5.00 5.00 5.007.00
Performance Measures
Number of records audited, registered,and archived during the month.
New MeasNew Meas New Meas 25,619New Meas
Number of walk-in customer serviceencounters in 15 min increments.
New MeasNew Meas New Meas 10,000New Meas
Number of customer contacts viainformational calls and/or referralsprocessed during the month.
New MeasNew Meas New Meas 10,000New Meas
Total number of reports completedduring the month.
New MeasNew Meas New Meas 11,506New Meas
ServicesBirth registrations; archival amendments; adoption, name change, and reports of death document audits; citizenservice consults; issuing certified copies of birth records and death registrations; medical amendments;hospital/funeral home consults; burial, transit, creation permitting; providing technical assistance toCity/County/State/Federal law enforcement, child protection agencies, and public health groups; providing reports tointernal and external customers; CDC Weekly Mortality Reports.
Bold/Italicized Measure = Key Indicator
2012-13 Proposed Budget, Austin, TX
Volume I | 189
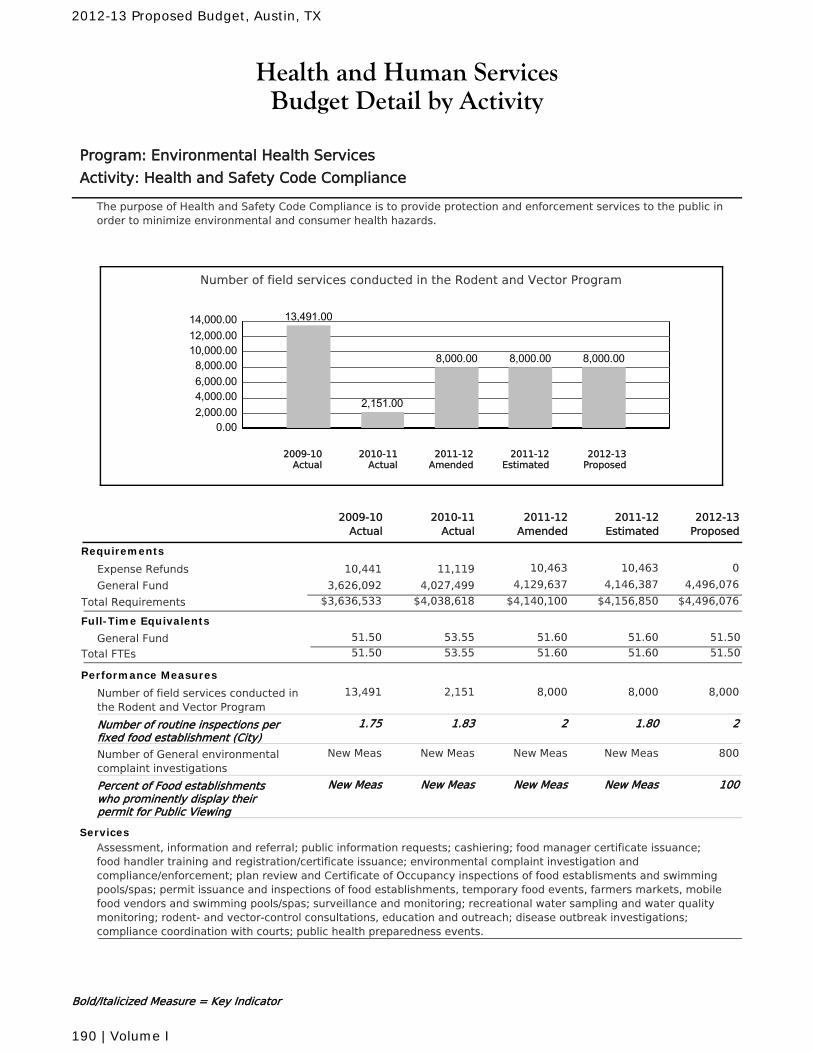
Health and Human ServicesBudget Detail by Activity
Program: Environmental Health Services
Activity: Health and Safety Code Compliance
The purpose of Health and Safety Code Compliance is to provide protection and enforcement services to the public inorder to minimize environmental and consumer health hazards.
Number of field services conducted in the Rodent and Vector Program
0.002,000.004,000.006,000.008,000.00
10,000.0012,000.0014,000.00 13,491.00
2,151.00
8,000.00 8,000.00 8,000.00
2010-11Actual
2012-13Proposed
2011-12Amended
2011-12Estimated
2009-10Actual
2011-12Amended
2010-11Actual
2011-12Estimated
2012-13Proposed
2009-10Actual
Requirements
Expense Refunds 10,463 10,463 011,11910,441
General Fund 4,129,637 4,146,387 4,496,0764,027,4993,626,092
$4,140,100 $4,156,850 $4,496,076Total Requirements $4,038,618$3,636,533
Full-Time Equivalents
General Fund 53.55 51.60 51.60 51.5051.50
Total FTEs 53.55 51.60 51.60 51.5051.50
Performance Measures
Number of field services conducted inthe Rodent and Vector Program
8,0002,151 8,000 8,00013,491
Number of routine inspections perfixed food establishment (City)
21.83 1.80 21.75
Number of General environmentalcomplaint investigations
New MeasNew Meas New Meas 800New Meas
Percent of Food establishmentswho prominently display theirpermit for Public Viewing
New MeasNew Meas New Meas 100New Meas
ServicesAssessment, information and referral; public information requests; cashiering; food manager certificate issuance;food handler training and registration/certificate issuance; environmental complaint investigation andcompliance/enforcement; plan review and Certificate of Occupancy inspections of food establisments and swimmingpools/spas; permit issuance and inspections of food establishments, temporary food events, farmers markets, mobilefood vendors and swimming pools/spas; surveillance and monitoring; recreational water sampling and water qualitymonitoring; rodent- and vector-control consultations, education and outreach; disease outbreak investigations;compliance coordination with courts; public health preparedness events.
Bold/Italicized Measure = Key Indicator
2012-13 Proposed Budget, Austin, TX
190 | Volume I
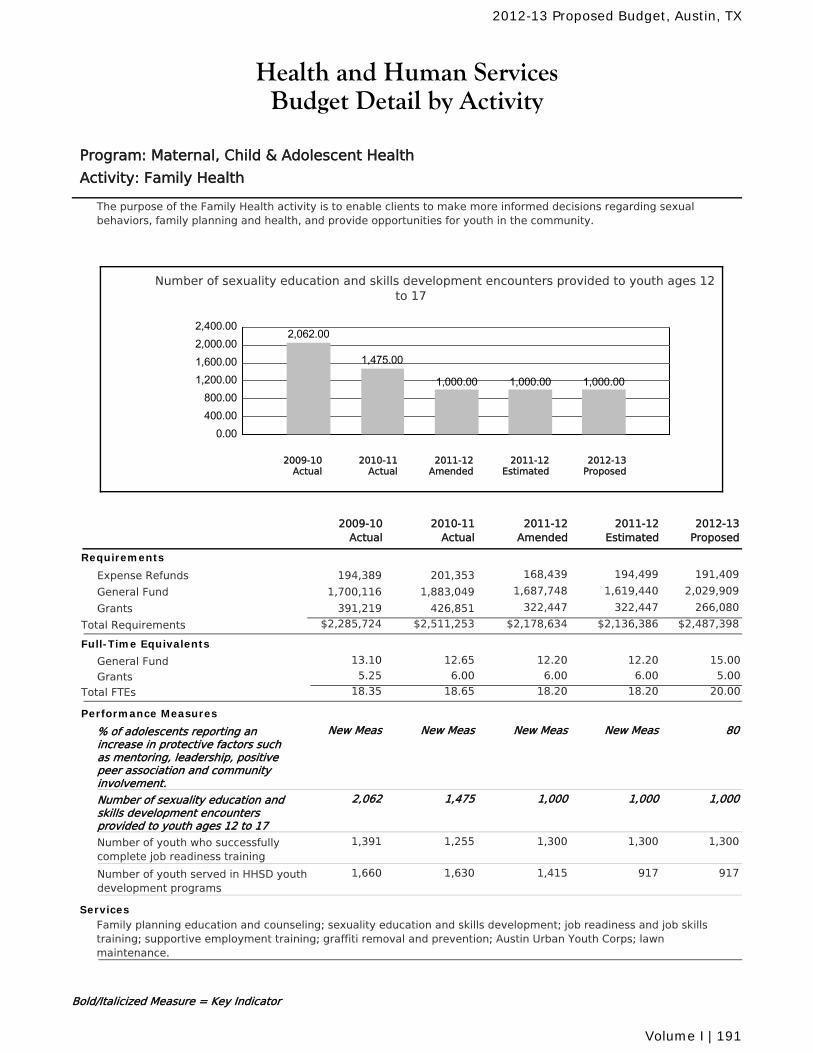
Health and Human ServicesBudget Detail by Activity
Program: Maternal, Child & Adolescent Health
Activity: Family Health
The purpose of the Family Health activity is to enable clients to make more informed decisions regarding sexualbehaviors, family planning and health, and provide opportunities for youth in the community.
Number of sexuality education and skills development encounters provided to youth ages 12to 17
0.00400.00800.00
1,200.001,600.002,000.002,400.00
2,062.00
1,475.00
1,000.00 1,000.00 1,000.00
2010-11Actual
2012-13Proposed
2011-12Amended
2011-12Estimated
2009-10Actual
2011-12Amended
2010-11Actual
2011-12Estimated
2012-13Proposed
2009-10Actual
Requirements
Expense Refunds 168,439 194,499 191,409201,353194,389
General Fund 1,687,748 1,619,440 2,029,9091,883,0491,700,116
Grants 322,447 322,447 266,080426,851391,219
$2,178,634 $2,136,386 $2,487,398Total Requirements $2,511,253$2,285,724
Full-Time Equivalents
General Fund 12.65 12.20 12.20 15.0013.10
Grants 6.00 6.00 6.00 5.005.25
Total FTEs 18.65 18.20 18.20 20.0018.35
Performance Measures
% of adolescents reporting anincrease in protective factors suchas mentoring, leadership, positivepeer association and communityinvolvement.
New MeasNew Meas New Meas 80New Meas
Number of sexuality education andskills development encountersprovided to youth ages 12 to 17
1,0001,475 1,000 1,0002,062
Number of youth who successfullycomplete job readiness training
1,3001,255 1,300 1,3001,391
Number of youth served in HHSD youthdevelopment programs
1,4151,630 917 9171,660
ServicesFamily planning education and counseling; sexuality education and skills development; job readiness and job skillstraining; supportive employment training; graffiti removal and prevention; Austin Urban Youth Corps; lawnmaintenance.
Bold/Italicized Measure = Key Indicator
2012-13 Proposed Budget, Austin, TX
Volume I | 191
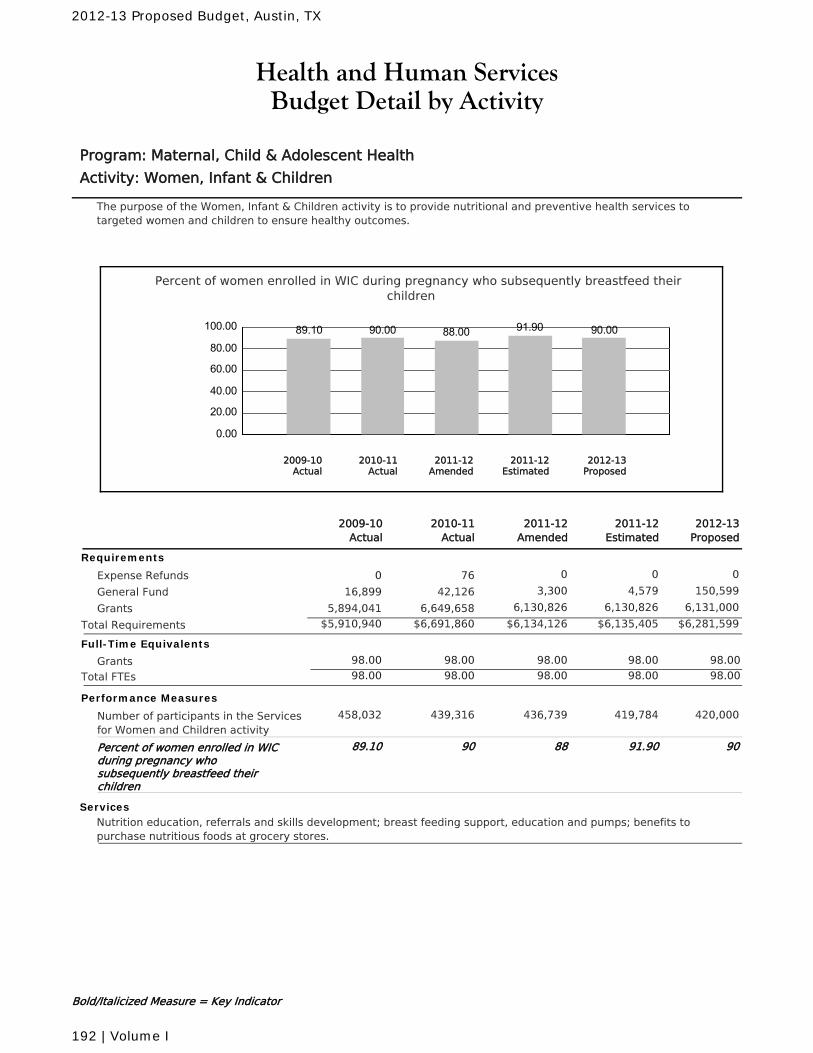
Health and Human ServicesBudget Detail by Activity
Program: Maternal, Child & Adolescent Health
Activity: Women, Infant & Children
The purpose of the Women, Infant & Children activity is to provide nutritional and preventive health services totargeted women and children to ensure healthy outcomes.
Percent of women enrolled in WIC during pregnancy who subsequently breastfeed theirchildren
0.00
20.00
40.00
60.00
80.00
100.00 89.10 90.00 88.00 91.90 90.00
2010-11Actual
2012-13Proposed
2011-12Amended
2011-12Estimated
2009-10Actual
2011-12Amended
2010-11Actual
2011-12Estimated
2012-13Proposed
2009-10Actual
Requirements
Expense Refunds 0 0 0760
General Fund 3,300 4,579 150,59942,12616,899
Grants 6,130,826 6,130,826 6,131,0006,649,6585,894,041
$6,134,126 $6,135,405 $6,281,599Total Requirements $6,691,860$5,910,940
Full-Time Equivalents
Grants 98.00 98.00 98.00 98.0098.00
Total FTEs 98.00 98.00 98.00 98.0098.00
Performance Measures
Number of participants in the Servicesfor Women and Children activity
436,739439,316 419,784 420,000458,032
Percent of women enrolled in WICduring pregnancy whosubsequently breastfeed theirchildren
8890 91.90 9089.10
ServicesNutrition education, referrals and skills development; breast feeding support, education and pumps; benefits topurchase nutritious foods at grocery stores.
Bold/Italicized Measure = Key Indicator
2012-13 Proposed Budget, Austin, TX
192 | Volume I
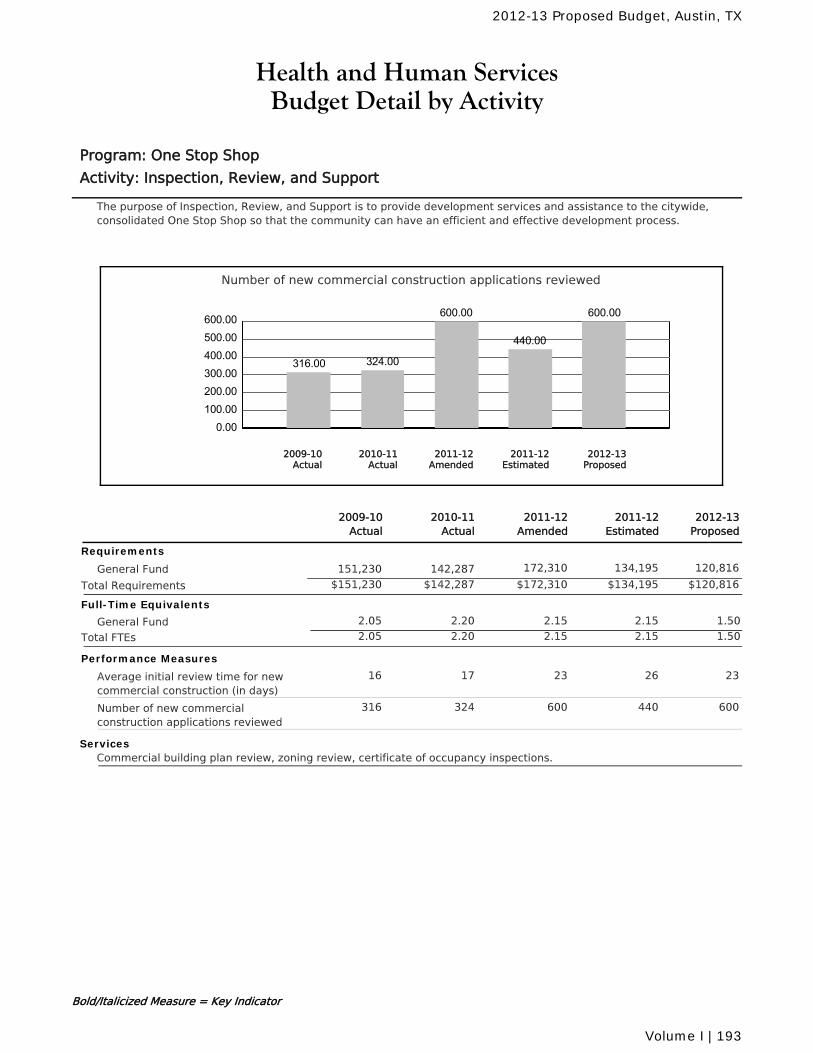
Health and Human ServicesBudget Detail by Activity
Program: One Stop Shop
Activity: Inspection, Review, and Support
The purpose of Inspection, Review, and Support is to provide development services and assistance to the citywide,consolidated One Stop Shop so that the community can have an efficient and effective development process.
Number of new commercial construction applications reviewed
0.00100.00200.00300.00400.00500.00600.00
316.00 324.00
600.00
440.00
600.00
2010-11Actual
2012-13Proposed
2011-12Amended
2011-12Estimated
2009-10Actual
2011-12Amended
2010-11Actual
2011-12Estimated
2012-13Proposed
2009-10Actual
Requirements
General Fund 172,310 134,195 120,816142,287151,230
$172,310 $134,195 $120,816Total Requirements $142,287$151,230
Full-Time Equivalents
General Fund 2.20 2.15 2.15 1.502.05
Total FTEs 2.20 2.15 2.15 1.502.05
Performance Measures
Average initial review time for newcommercial construction (in days)
2317 26 2316
Number of new commercialconstruction applications reviewed
600324 440 600316
ServicesCommercial building plan review, zoning review, certificate of occupancy inspections.
Bold/Italicized Measure = Key Indicator
2012-13 Proposed Budget, Austin, TX
Volume I | 193
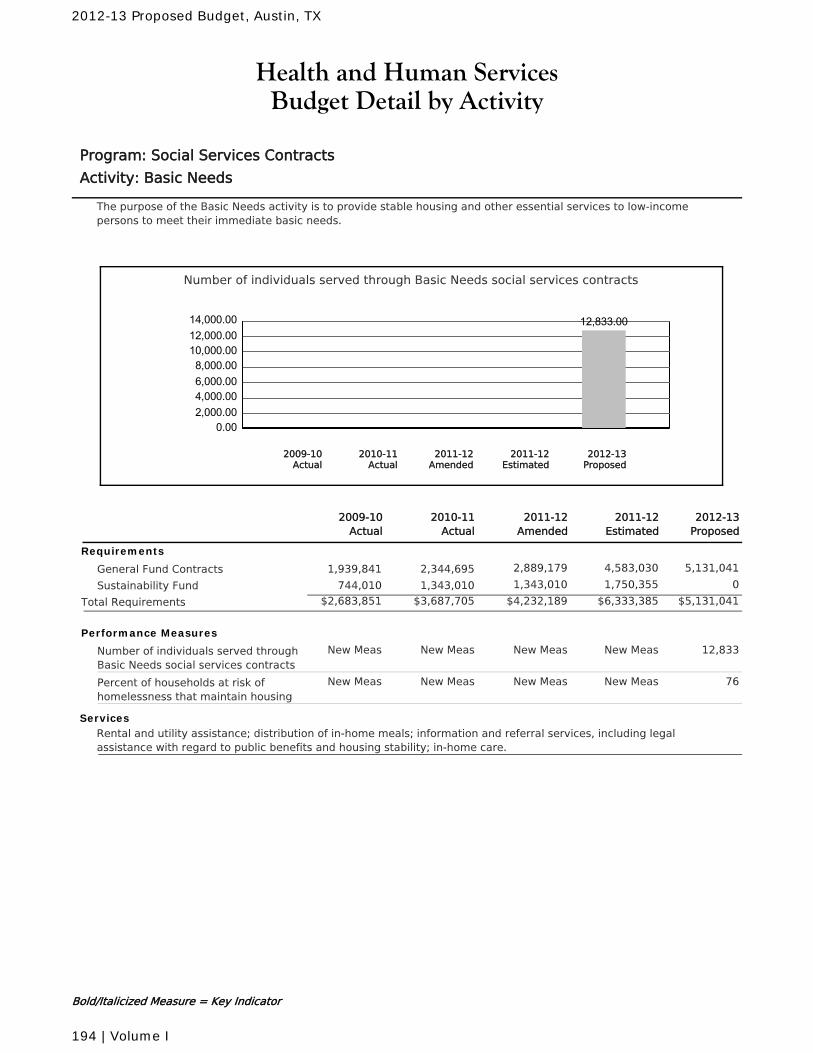
Health and Human ServicesBudget Detail by Activity
Program: Social Services Contracts
Activity: Basic Needs
The purpose of the Basic Needs activity is to provide stable housing and other essential services to low-incomepersons to meet their immediate basic needs.
Number of individuals served through Basic Needs social services contracts
0.002,000.004,000.006,000.008,000.00
10,000.0012,000.0014,000.00 12,833.00
2010-11Actual
2012-13Proposed
2011-12Amended
2011-12Estimated
2009-10Actual
2011-12Amended
2010-11Actual
2011-12Estimated
2012-13Proposed
2009-10Actual
Requirements
General Fund Contracts 2,889,179 4,583,030 5,131,0412,344,6951,939,841
Sustainability Fund 1,343,010 1,750,355 01,343,010744,010
$4,232,189 $6,333,385 $5,131,041Total Requirements $3,687,705$2,683,851
Performance Measures
Number of individuals served throughBasic Needs social services contracts
New MeasNew Meas New Meas 12,833New Meas
Percent of households at risk ofhomelessness that maintain housing
New MeasNew Meas New Meas 76New Meas
ServicesRental and utility assistance; distribution of in-home meals; information and referral services, including legalassistance with regard to public benefits and housing stability; in-home care.
Bold/Italicized Measure = Key Indicator
2012-13 Proposed Budget, Austin, TX
194 | Volume I
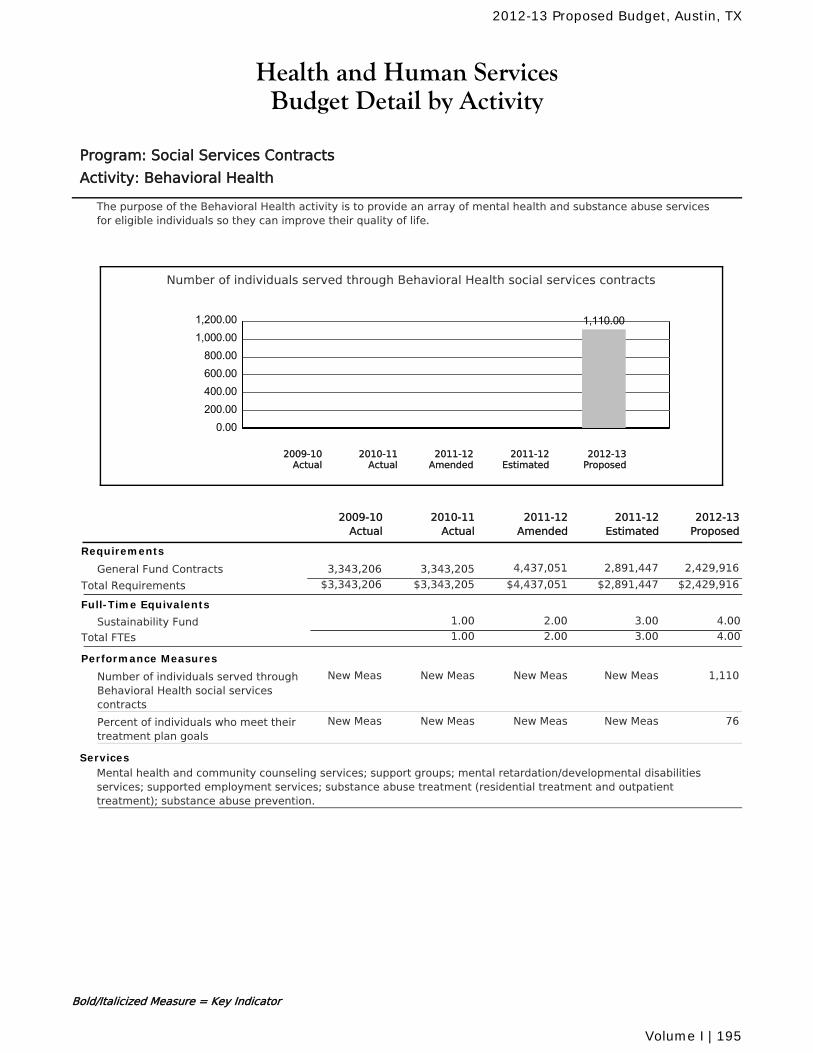
Health and Human ServicesBudget Detail by Activity
Program: Social Services Contracts
Activity: Behavioral Health
The purpose of the Behavioral Health activity is to provide an array of mental health and substance abuse servicesfor eligible individuals so they can improve their quality of life.
Number of individuals served through Behavioral Health social services contracts
0.00200.00400.00600.00800.00
1,000.001,200.00 1,110.00
2010-11Actual
2012-13Proposed
2011-12Amended
2011-12Estimated
2009-10Actual
2011-12Amended
2010-11Actual
2011-12Estimated
2012-13Proposed
2009-10Actual
Requirements
General Fund Contracts 4,437,051 2,891,447 2,429,9163,343,2053,343,206
$4,437,051 $2,891,447 $2,429,916Total Requirements $3,343,205$3,343,206
Full-Time Equivalents
Sustainability Fund 1.00 2.00 3.00 4.00
Total FTEs 1.00 2.00 3.00 4.00
Performance Measures
Number of individuals served throughBehavioral Health social servicescontracts
New MeasNew Meas New Meas 1,110New Meas
Percent of individuals who meet theirtreatment plan goals
New MeasNew Meas New Meas 76New Meas
ServicesMental health and community counseling services; support groups; mental retardation/developmental disabilitiesservices; supported employment services; substance abuse treatment (residential treatment and outpatienttreatment); substance abuse prevention.
Bold/Italicized Measure = Key Indicator
2012-13 Proposed Budget, Austin, TX
Volume I | 195
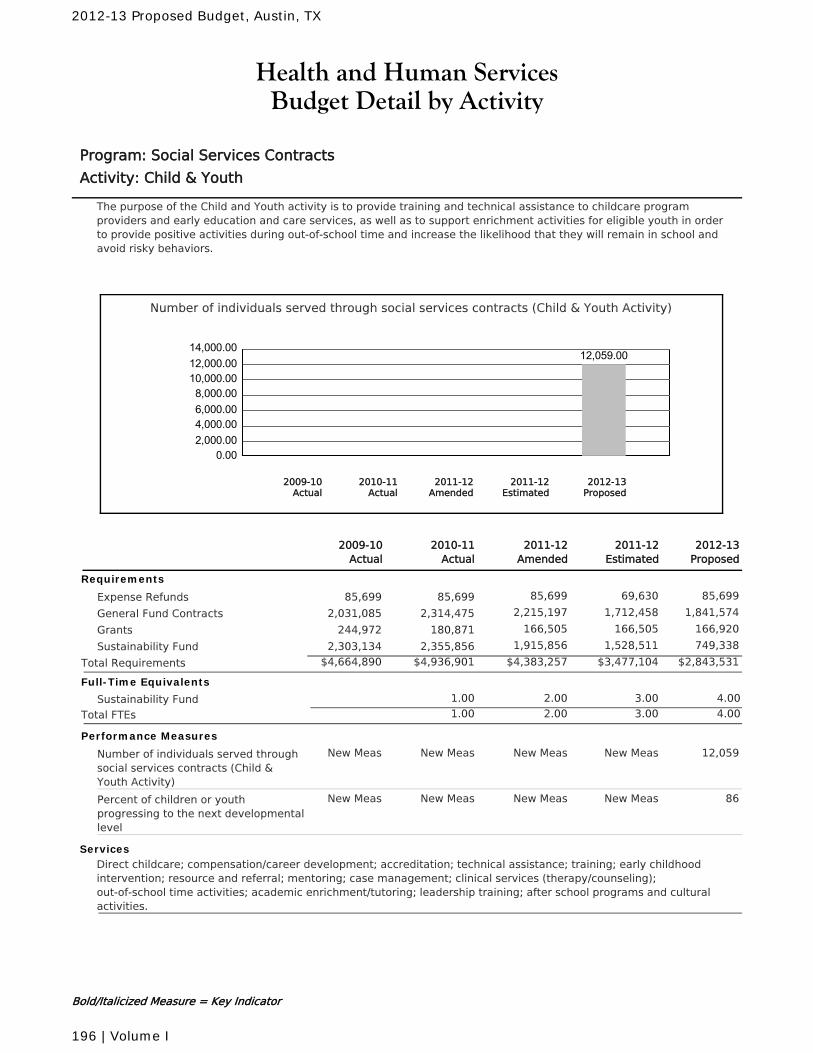
Health and Human ServicesBudget Detail by Activity
Program: Social Services Contracts
Activity: Child & Youth
The purpose of the Child and Youth activity is to provide training and technical assistance to childcare programproviders and early education and care services, as well as to support enrichment activities for eligible youth in orderto provide positive activities during out-of-school time and increase the likelihood that they will remain in school andavoid risky behaviors.
Number of individuals served through social services contracts (Child & Youth Activity)
0.002,000.004,000.006,000.008,000.00
10,000.0012,000.0014,000.00
12,059.00
2010-11Actual
2012-13Proposed
2011-12Amended
2011-12Estimated
2009-10Actual
2011-12Amended
2010-11Actual
2011-12Estimated
2012-13Proposed
2009-10Actual
Requirements
Expense Refunds 85,699 69,630 85,69985,69985,699
General Fund Contracts 2,215,197 1,712,458 1,841,5742,314,4752,031,085
Grants 166,505 166,505 166,920180,871244,972
Sustainability Fund 1,915,856 1,528,511 749,3382,355,8562,303,134
$4,383,257 $3,477,104 $2,843,531Total Requirements $4,936,901$4,664,890
Full-Time Equivalents
Sustainability Fund 1.00 2.00 3.00 4.00
Total FTEs 1.00 2.00 3.00 4.00
Performance Measures
Number of individuals served throughsocial services contracts (Child &Youth Activity)
New MeasNew Meas New Meas 12,059New Meas
Percent of children or youthprogressing to the next developmentallevel
New MeasNew Meas New Meas 86New Meas
ServicesDirect childcare; compensation/career development; accreditation; technical assistance; training; early childhoodintervention; resource and referral; mentoring; case management; clinical services (therapy/counseling);out-of-school time activities; academic enrichment/tutoring; leadership training; after school programs and culturalactivities.
Bold/Italicized Measure = Key Indicator
2012-13 Proposed Budget, Austin, TX
196 | Volume I
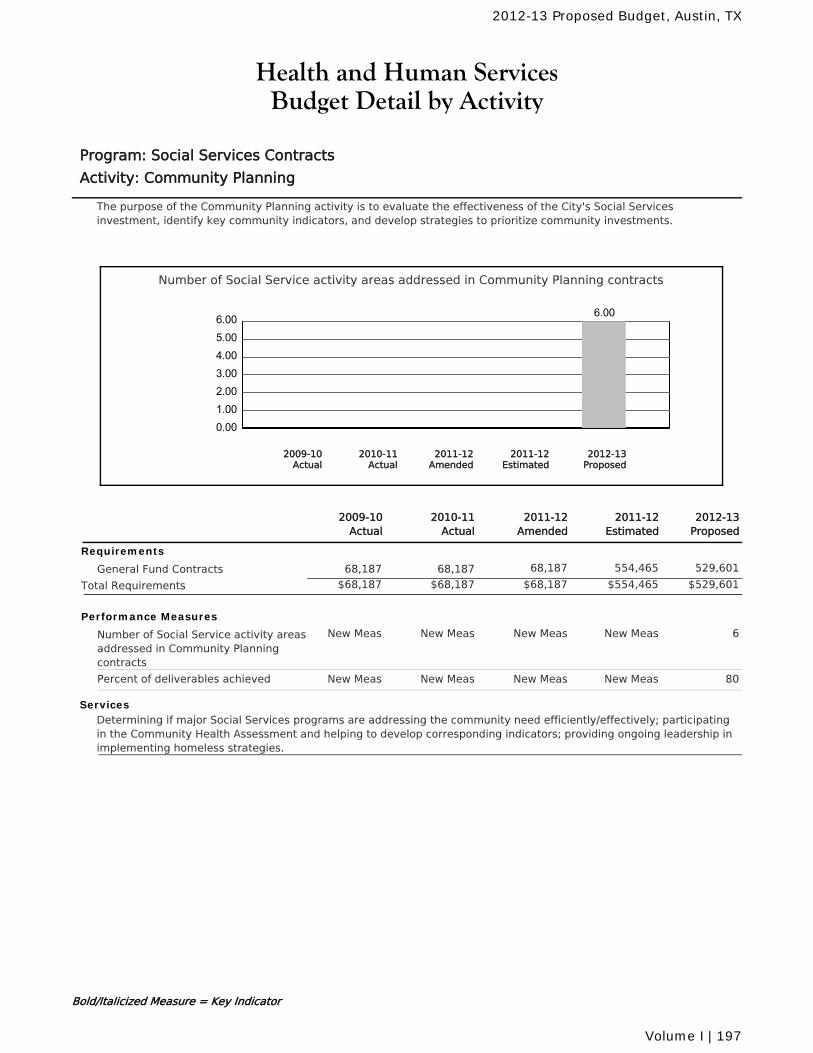
Health and Human ServicesBudget Detail by Activity
Program: Social Services Contracts
Activity: Community Planning
The purpose of the Community Planning activity is to evaluate the effectiveness of the City's Social Servicesinvestment, identify key community indicators, and develop strategies to prioritize community investments.
Number of Social Service activity areas addressed in Community Planning contracts
0.001.002.003.004.005.006.00 6.00
2010-11Actual
2012-13Proposed
2011-12Amended
2011-12Estimated
2009-10Actual
2011-12Amended
2010-11Actual
2011-12Estimated
2012-13Proposed
2009-10Actual
Requirements
General Fund Contracts 68,187 554,465 529,60168,18768,187
$68,187 $554,465 $529,601Total Requirements $68,187$68,187
Performance Measures
Number of Social Service activity areasaddressed in Community Planningcontracts
New MeasNew Meas New Meas 6New Meas
Percent of deliverables achieved New MeasNew Meas New Meas 80New Meas
ServicesDetermining if major Social Services programs are addressing the community need efficiently/effectively; participatingin the Community Health Assessment and helping to develop corresponding indicators; providing ongoing leadership inimplementing homeless strategies.
Bold/Italicized Measure = Key Indicator
2012-13 Proposed Budget, Austin, TX
Volume I | 197
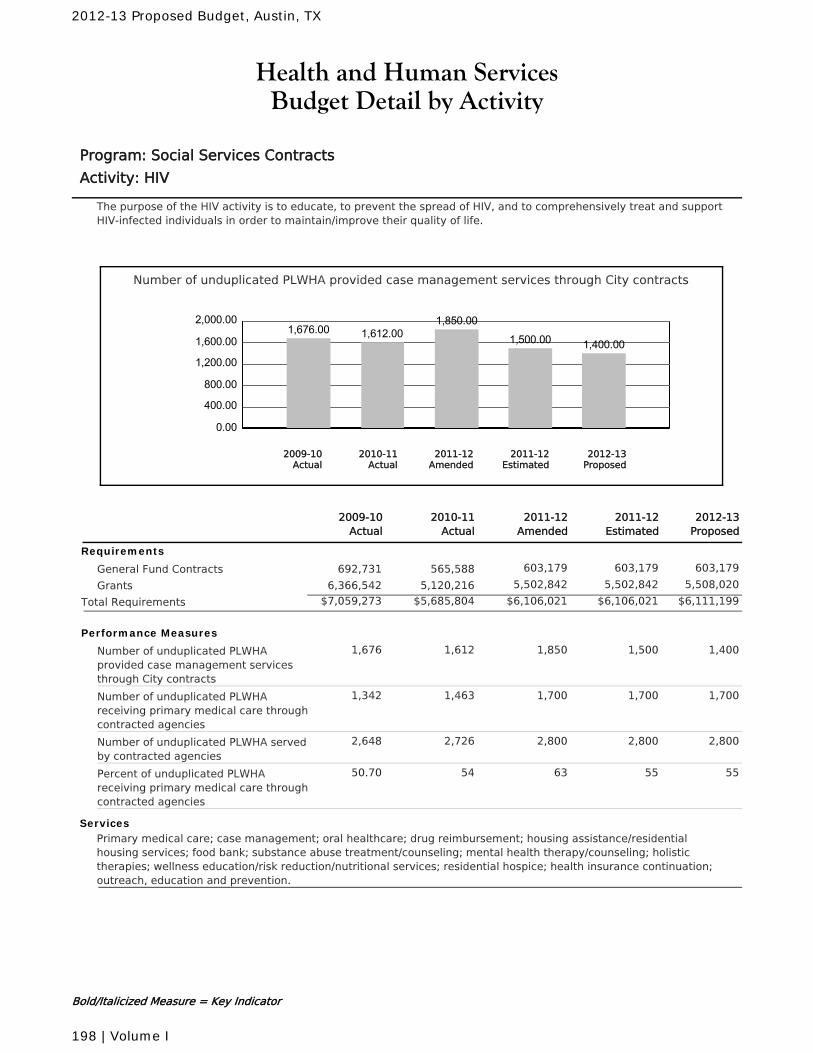
Health and Human ServicesBudget Detail by Activity
Program: Social Services Contracts
Activity: HIV
The purpose of the HIV activity is to educate, to prevent the spread of HIV, and to comprehensively treat and supportHIV-infected individuals in order to maintain/improve their quality of life.
Number of unduplicated PLWHA provided case management services through City contracts
0.00
400.00
800.00
1,200.00
1,600.00
2,000.001,676.00 1,612.00
1,850.00
1,500.00 1,400.00
2010-11Actual
2012-13Proposed
2011-12Amended
2011-12Estimated
2009-10Actual
2011-12Amended
2010-11Actual
2011-12Estimated
2012-13Proposed
2009-10Actual
Requirements
General Fund Contracts 603,179 603,179 603,179565,588692,731
Grants 5,502,842 5,502,842 5,508,0205,120,2166,366,542
$6,106,021 $6,106,021 $6,111,199Total Requirements $5,685,804$7,059,273
Performance Measures
Number of unduplicated PLWHAprovided case management servicesthrough City contracts
1,8501,612 1,500 1,4001,676
Number of unduplicated PLWHAreceiving primary medical care throughcontracted agencies
1,7001,463 1,700 1,7001,342
Number of unduplicated PLWHA servedby contracted agencies
2,8002,726 2,800 2,8002,648
Percent of unduplicated PLWHAreceiving primary medical care throughcontracted agencies
6354 55 5550.70
ServicesPrimary medical care; case management; oral healthcare; drug reimbursement; housing assistance/residentialhousing services; food bank; substance abuse treatment/counseling; mental health therapy/counseling; holistictherapies; wellness education/risk reduction/nutritional services; residential hospice; health insurance continuation;outreach, education and prevention.
Bold/Italicized Measure = Key Indicator
2012-13 Proposed Budget, Austin, TX
198 | Volume I
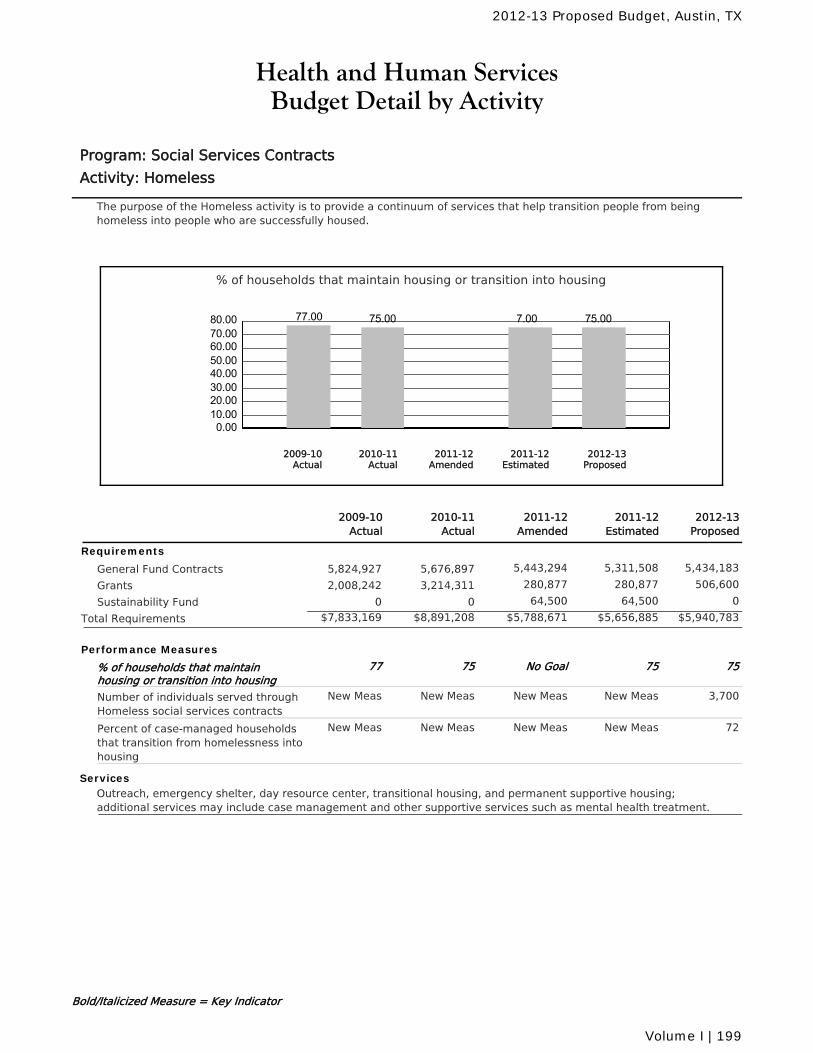
Health and Human ServicesBudget Detail by Activity
Program: Social Services Contracts
Activity: Homeless
The purpose of the Homeless activity is to provide a continuum of services that help transition people from beinghomeless into people who are successfully housed.
% of households that maintain housing or transition into housing
0.0010.0020.0030.0040.0050.0060.0070.0080.00 77.00 75.00
7.00 75.00
2010-11Actual
2012-13Proposed
2011-12Amended
2011-12Estimated
2009-10Actual
2011-12Amended
2010-11Actual
2011-12Estimated
2012-13Proposed
2009-10Actual
Requirements
General Fund Contracts 5,443,294 5,311,508 5,434,1835,676,8975,824,927
Grants 280,877 280,877 506,6003,214,3112,008,242
Sustainability Fund 64,500 64,500 000
$5,788,671 $5,656,885 $5,940,783Total Requirements $8,891,208$7,833,169
Performance Measures
% of households that maintainhousing or transition into housing
No Goal75 75 7577
Number of individuals served throughHomeless social services contracts
New MeasNew Meas New Meas 3,700New Meas
Percent of case-managed householdsthat transition from homelessness intohousing
New MeasNew Meas New Meas 72New Meas
ServicesOutreach, emergency shelter, day resource center, transitional housing, and permanent supportive housing;additional services may include case management and other supportive services such as mental health treatment.
Bold/Italicized Measure = Key Indicator
2012-13 Proposed Budget, Austin, TX
Volume I | 199
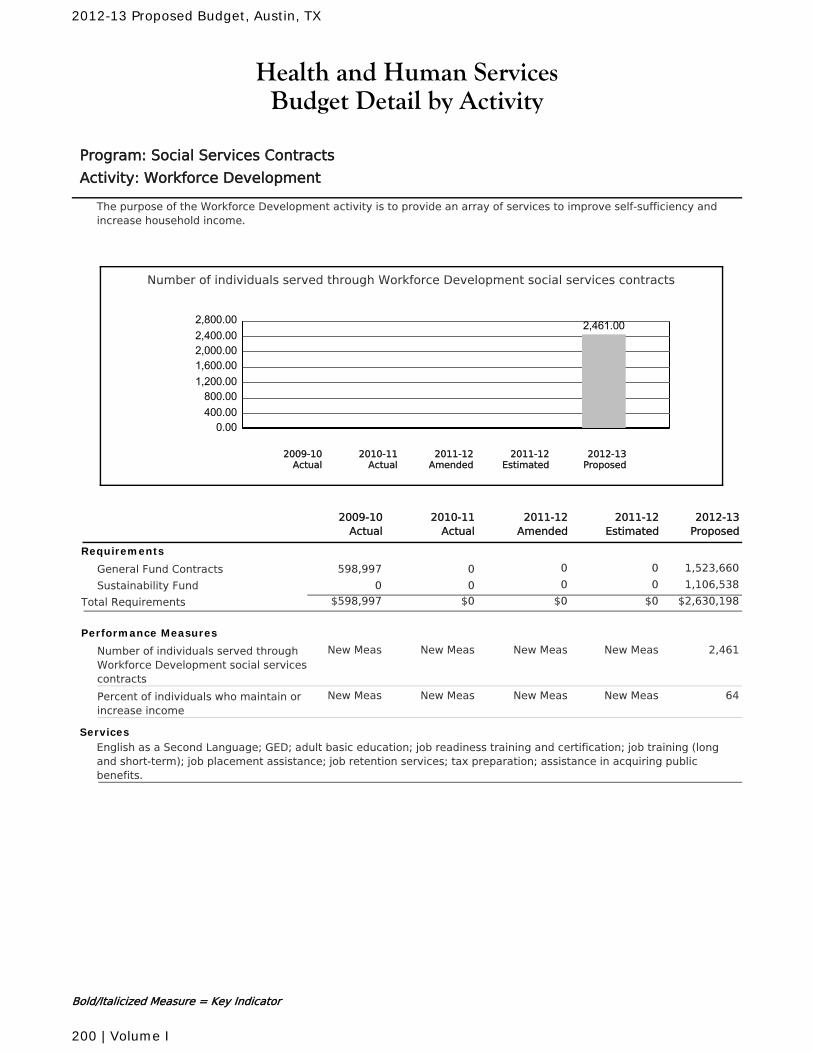
Health and Human ServicesBudget Detail by Activity
Program: Social Services Contracts
Activity: Workforce Development
The purpose of the Workforce Development activity is to provide an array of services to improve self-sufficiency andincrease household income.
Number of individuals served through Workforce Development social services contracts
0.00400.00800.00
1,200.001,600.002,000.002,400.002,800.00 2,461.00
2010-11Actual
2012-13Proposed
2011-12Amended
2011-12Estimated
2009-10Actual
2011-12Amended
2010-11Actual
2011-12Estimated
2012-13Proposed
2009-10Actual
Requirements
General Fund Contracts 0 0 1,523,6600598,997
Sustainability Fund 0 0 1,106,53800
$0 $0 $2,630,198Total Requirements $0$598,997
Performance Measures
Number of individuals served throughWorkforce Development social servicescontracts
New MeasNew Meas New Meas 2,461New Meas
Percent of individuals who maintain orincrease income
New MeasNew Meas New Meas 64New Meas
ServicesEnglish as a Second Language; GED; adult basic education; job readiness training and certification; job training (longand short-term); job placement assistance; job retention services; tax preparation; assistance in acquiring publicbenefits.
Bold/Italicized Measure = Key Indicator
2012-13 Proposed Budget, Austin, TX
200 | Volume I
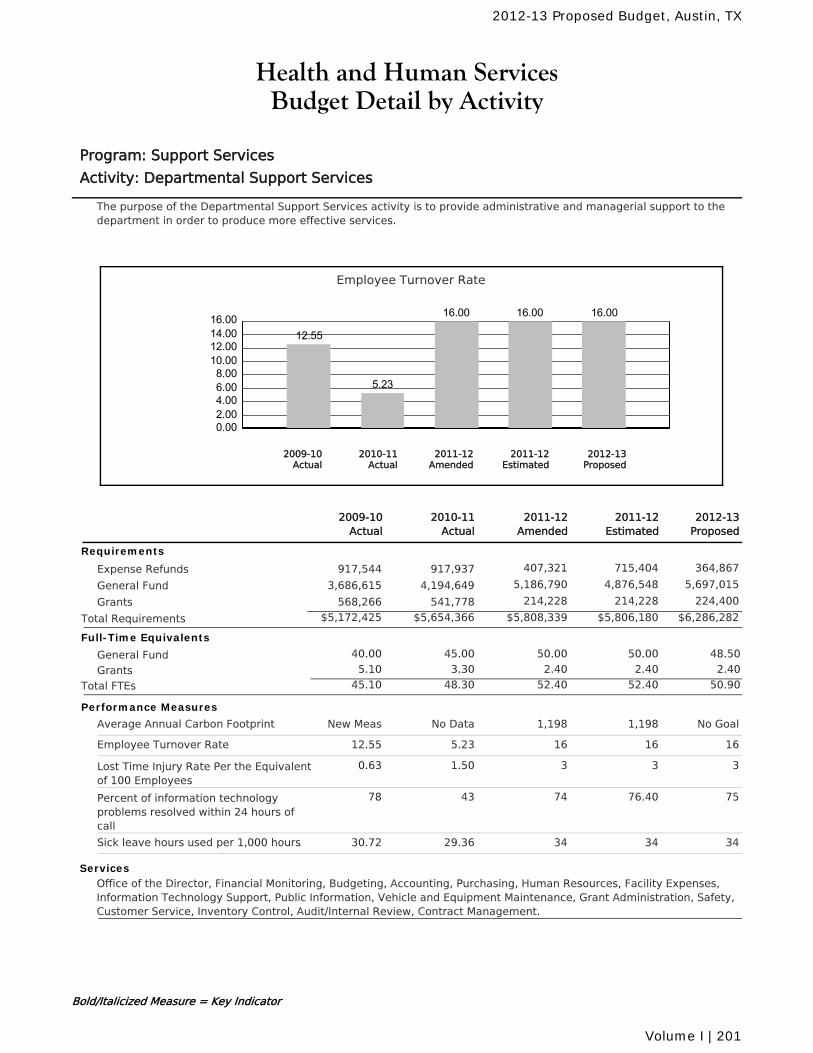
Health and Human ServicesBudget Detail by Activity
Program: Support Services
Activity: Departmental Support Services
The purpose of the Departmental Support Services activity is to provide administrative and managerial support to thedepartment in order to produce more effective services.
Employee Turnover Rate
0.002.004.006.008.00
10.0012.0014.0016.00
12.55
5.23
16.00 16.00 16.00
2010-11Actual
2012-13Proposed
2011-12Amended
2011-12Estimated
2009-10Actual
2011-12Amended
2010-11Actual
2011-12Estimated
2012-13Proposed
2009-10Actual
Requirements
Expense Refunds 407,321 715,404 364,867917,937917,544
General Fund 5,186,790 4,876,548 5,697,0154,194,6493,686,615
Grants 214,228 214,228 224,400541,778568,266
$5,808,339 $5,806,180 $6,286,282Total Requirements $5,654,366$5,172,425
Full-Time Equivalents
General Fund 45.00 50.00 50.00 48.5040.00
Grants 3.30 2.40 2.40 2.405.10
Total FTEs 48.30 52.40 52.40 50.9045.10
Performance Measures
Average Annual Carbon Footprint 1,198No Data 1,198 No GoalNew Meas
Employee Turnover Rate 165.23 16 1612.55
Lost Time Injury Rate Per the Equivalentof 100 Employees
31.50 3 30.63
Percent of information technologyproblems resolved within 24 hours ofcall
7443 76.40 7578
Sick leave hours used per 1,000 hours 3429.36 34 3430.72
ServicesOffice of the Director, Financial Monitoring, Budgeting, Accounting, Purchasing, Human Resources, Facility Expenses,Information Technology Support, Public Information, Vehicle and Equipment Maintenance, Grant Administration, Safety,Customer Service, Inventory Control, Audit/Internal Review, Contract Management.
Bold/Italicized Measure = Key Indicator
2012-13 Proposed Budget, Austin, TX
Volume I | 201
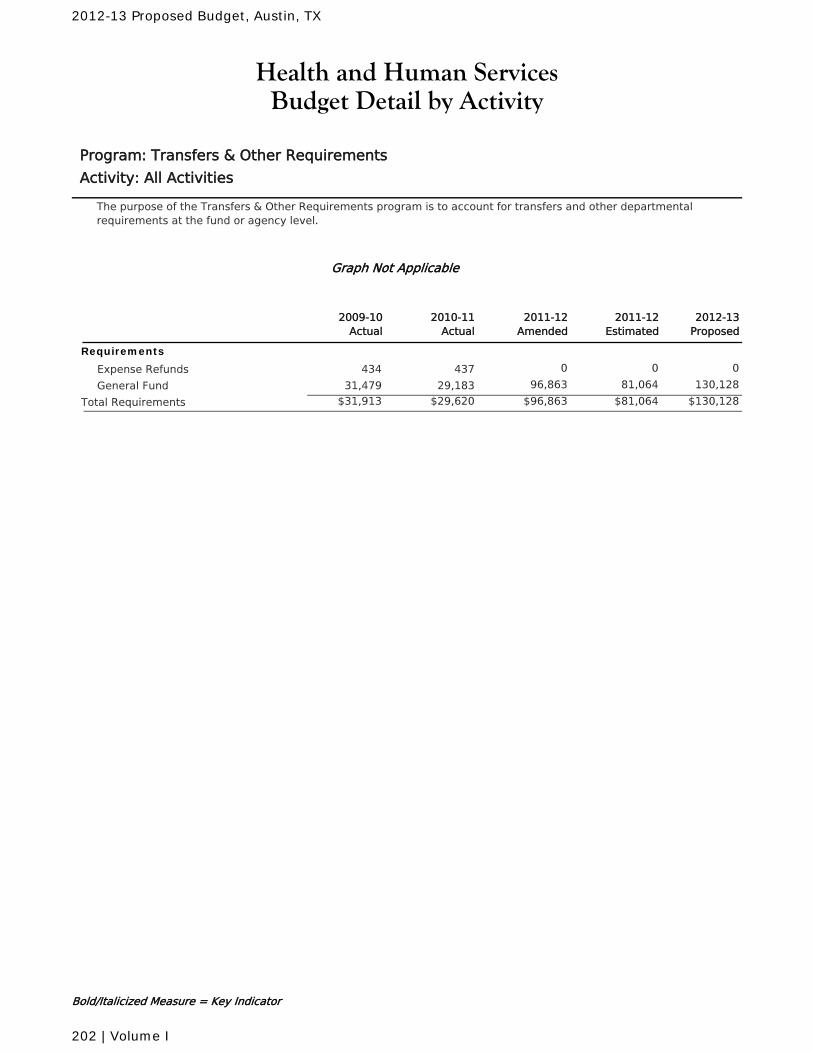
Health and Human ServicesBudget Detail by Activity
Program: Transfers & Other Requirements
Activity: All Activities
The purpose of the Transfers & Other Requirements program is to account for transfers and other departmentalrequirements at the fund or agency level.
Graph Not Applicable
2011-12Amended
2010-11Actual
2011-12Estimated
2012-13Proposed
2009-10Actual
Requirements
Expense Refunds 0 0 0437434
General Fund 96,863 81,064 130,12829,18331,479
$96,863 $81,064 $130,128Total Requirements $29,620$31,913
Bold/Italicized Measure = Key Indicator
2012-13 Proposed Budget, Austin, TX
202 | Volume I
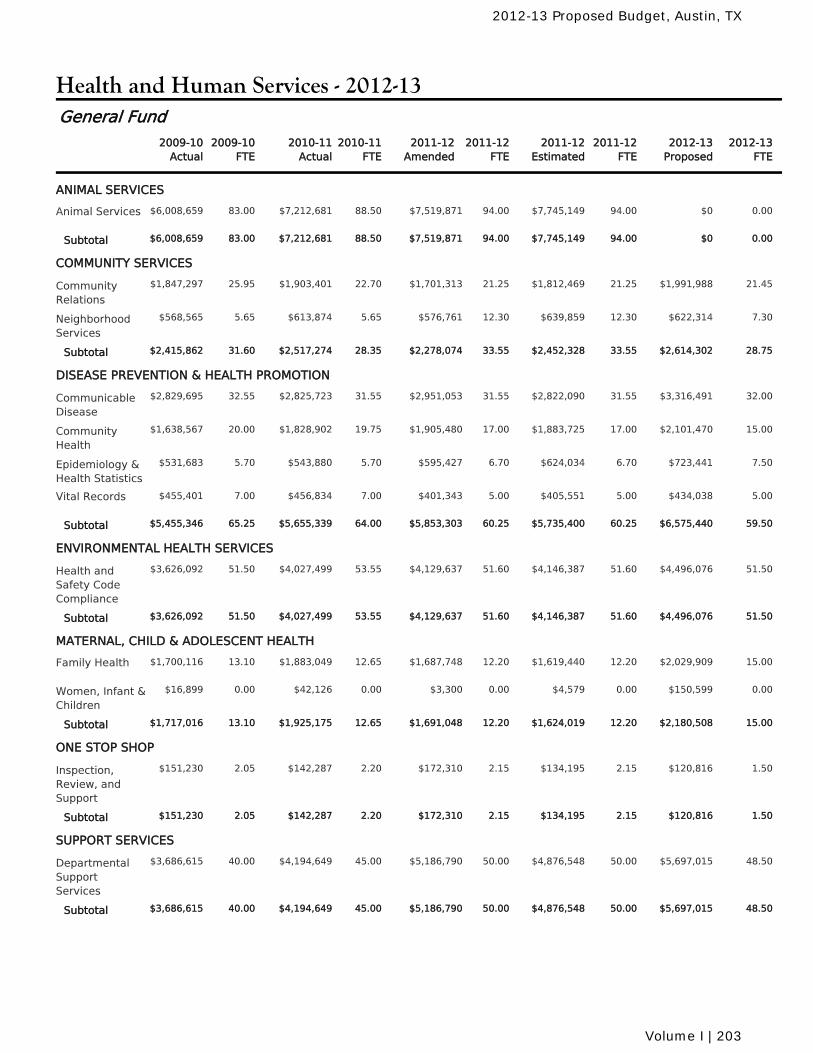
Health and Human Services - 2012-13
2010-11Actual
2010-11FTE
2011-12Amended
2011-12FTE
2011-12Estimated
2011-12FTE
2009-10Actual
2009-10FTE
2012-13Proposed
2012-13FTE
General Fund
ANIMAL SERVICES
$7,212,681 88.50 $7,519,871 94.00 $7,745,149 94.00Animal Services 83.00 $0 0.00$6,008,659
$7,212,681 88.50 $7,519,871 94.00 $7,745,149 94.00Subtotal 83.00 $0 0.00$6,008,659
COMMUNITY SERVICES
$1,903,401 22.70 $1,701,313 21.25 $1,812,469 21.25CommunityRelations
25.95 $1,991,988 21.45$1,847,297
$613,874 5.65 $576,761 12.30 $639,859 12.30NeighborhoodServices
5.65 $622,314 7.30$568,565
$2,517,274 28.35 $2,278,074 33.55 $2,452,328 33.55Subtotal 31.60 $2,614,302 28.75$2,415,862
DISEASE PREVENTION & HEALTH PROMOTION
$2,825,723 31.55 $2,951,053 31.55 $2,822,090 31.55CommunicableDisease
32.55 $3,316,491 32.00$2,829,695
$1,828,902 19.75 $1,905,480 17.00 $1,883,725 17.00CommunityHealth
20.00 $2,101,470 15.00$1,638,567
$543,880 5.70 $595,427 6.70 $624,034 6.70Epidemiology &Health Statistics
5.70 $723,441 7.50$531,683
$456,834 7.00 $401,343 5.00 $405,551 5.00Vital Records 7.00 $434,038 5.00$455,401
$5,655,339 64.00 $5,853,303 60.25 $5,735,400 60.25Subtotal 65.25 $6,575,440 59.50$5,455,346
ENVIRONMENTAL HEALTH SERVICES
$4,027,499 53.55 $4,129,637 51.60 $4,146,387 51.60Health andSafety CodeCompliance
51.50 $4,496,076 51.50$3,626,092
$4,027,499 53.55 $4,129,637 51.60 $4,146,387 51.60Subtotal 51.50 $4,496,076 51.50$3,626,092
MATERNAL, CHILD & ADOLESCENT HEALTH
$1,883,049 12.65 $1,687,748 12.20 $1,619,440 12.20Family Health 13.10 $2,029,909 15.00$1,700,116
$42,126 0.00 $3,300 0.00 $4,579 0.00Women, Infant &Children
0.00 $150,599 0.00$16,899
$1,925,175 12.65 $1,691,048 12.20 $1,624,019 12.20Subtotal 13.10 $2,180,508 15.00$1,717,016
ONE STOP SHOP
$142,287 2.20 $172,310 2.15 $134,195 2.15Inspection,Review, andSupport
2.05 $120,816 1.50$151,230
$142,287 2.20 $172,310 2.15 $134,195 2.15Subtotal 2.05 $120,816 1.50$151,230
SUPPORT SERVICES
$4,194,649 45.00 $5,186,790 50.00 $4,876,548 50.00DepartmentalSupportServices
40.00 $5,697,015 48.50$3,686,615
$4,194,649 45.00 $5,186,790 50.00 $4,876,548 50.00Subtotal 40.00 $5,697,015 48.50$3,686,615
2012-13 Proposed Budget, Austin, TX
Volume I | 203
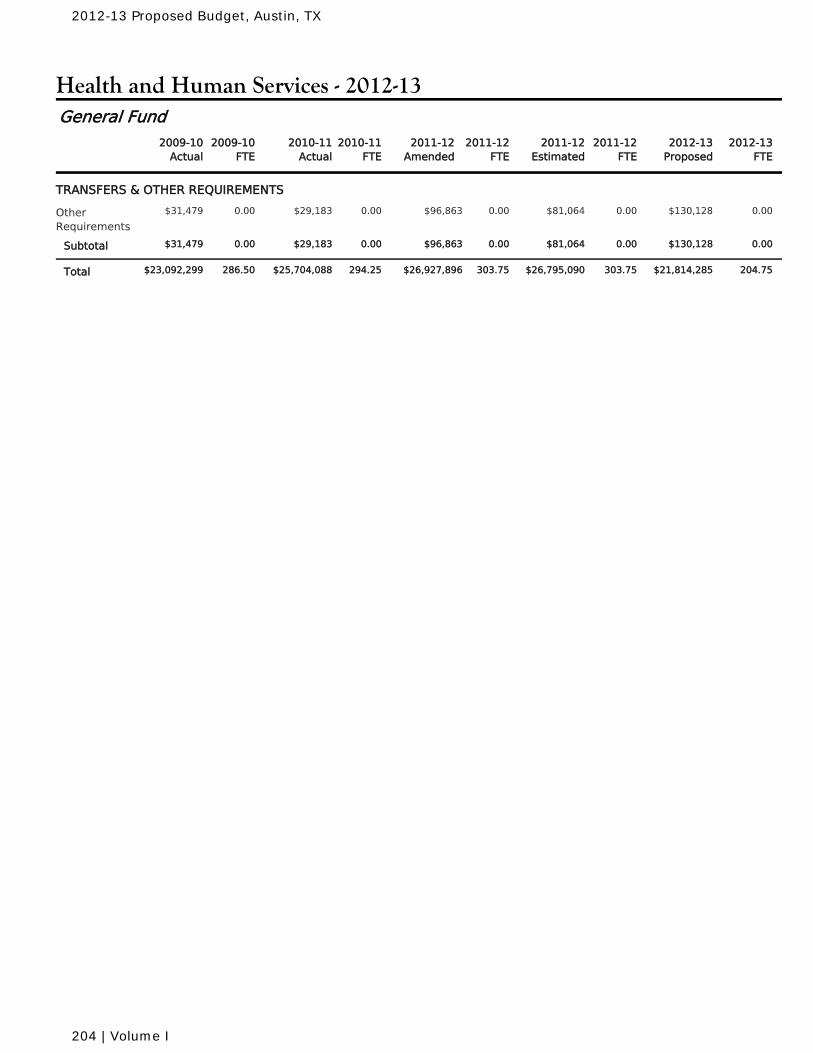
Health and Human Services - 2012-13
2010-11Actual
2010-11FTE
2011-12Amended
2011-12FTE
2011-12Estimated
2011-12FTE
2009-10Actual
2009-10FTE
2012-13Proposed
2012-13FTE
General Fund
TRANSFERS & OTHER REQUIREMENTS
$29,183 0.00 $96,863 0.00 $81,064 0.00OtherRequirements
0.00 $130,128 0.00$31,479
$29,183 0.00 $96,863 0.00 $81,064 0.00Subtotal 0.00 $130,128 0.00$31,479
$25,704,088 294.25 $26,927,896 303.75 $26,795,090 303.75Total 286.50 $21,814,285 204.75$23,092,299
2012-13 Proposed Budget, Austin, TX
204 | Volume I
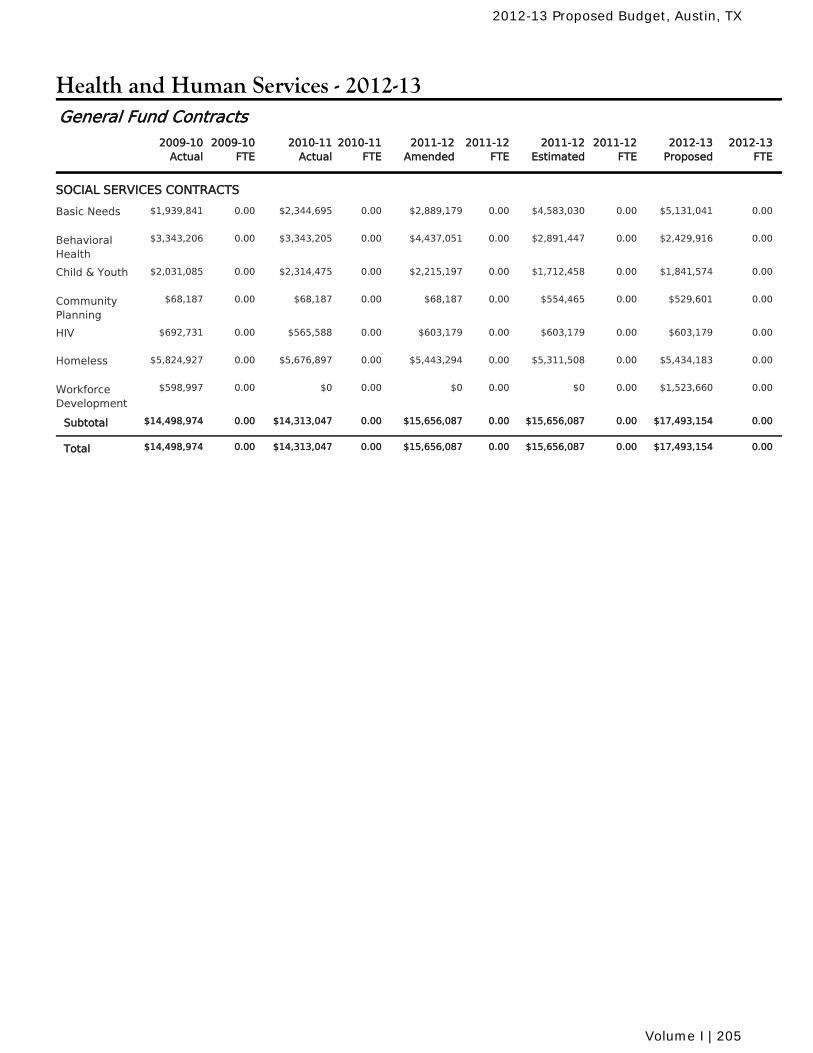
Health and Human Services - 2012-13
2010-11Actual
2010-11FTE
2011-12Amended
2011-12FTE
2011-12Estimated
2011-12FTE
2009-10Actual
2009-10FTE
2012-13Proposed
2012-13FTE
General Fund Contracts
SOCIAL SERVICES CONTRACTS
$2,344,695 0.00 $2,889,179 0.00 $4,583,030 0.00Basic Needs 0.00 $5,131,041 0.00$1,939,841
$3,343,205 0.00 $4,437,051 0.00 $2,891,447 0.00BehavioralHealth
0.00 $2,429,916 0.00$3,343,206
$2,314,475 0.00 $2,215,197 0.00 $1,712,458 0.00Child & Youth 0.00 $1,841,574 0.00$2,031,085
$68,187 0.00 $68,187 0.00 $554,465 0.00CommunityPlanning
0.00 $529,601 0.00$68,187
$565,588 0.00 $603,179 0.00 $603,179 0.00HIV 0.00 $603,179 0.00$692,731
$5,676,897 0.00 $5,443,294 0.00 $5,311,508 0.00Homeless 0.00 $5,434,183 0.00$5,824,927
$0 0.00 $0 0.00 $0 0.00WorkforceDevelopment
0.00 $1,523,660 0.00$598,997
$14,313,047 0.00 $15,656,087 0.00 $15,656,087 0.00Subtotal 0.00 $17,493,154 0.00$14,498,974
$14,313,047 0.00 $15,656,087 0.00 $15,656,087 0.00Total 0.00 $17,493,154 0.00$14,498,974
2012-13 Proposed Budget, Austin, TX
Volume I | 205
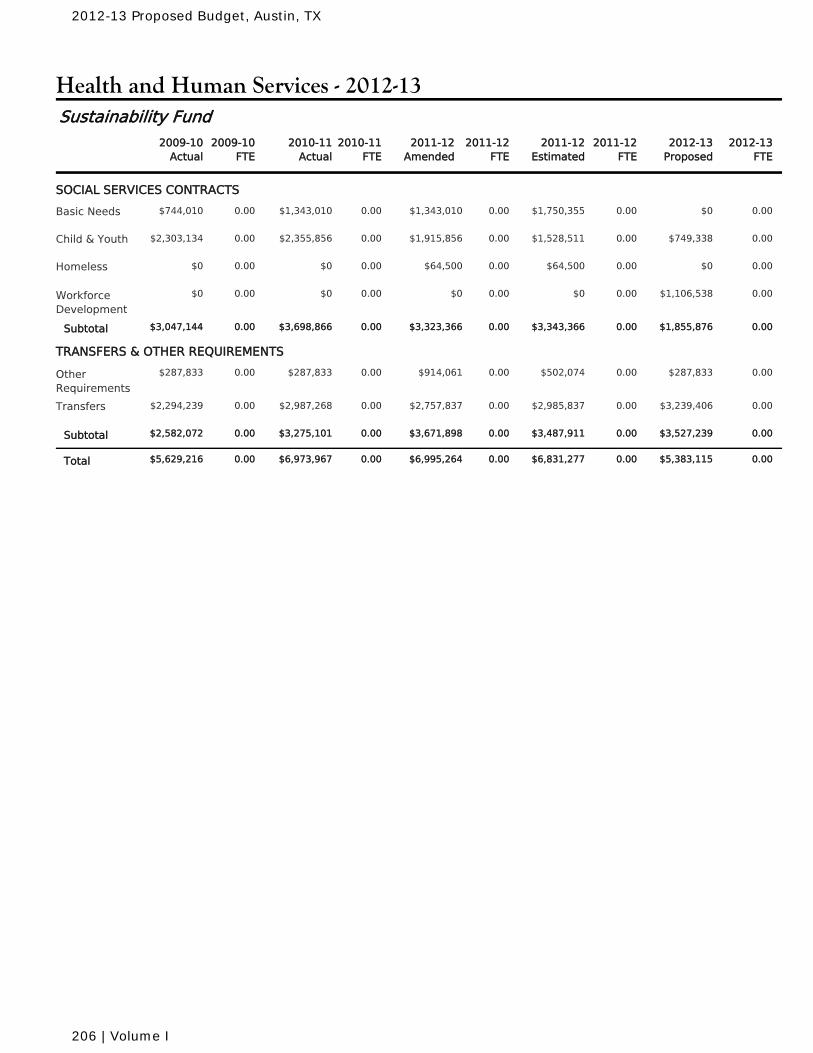
Health and Human Services - 2012-13
2010-11Actual
2010-11FTE
2011-12Amended
2011-12FTE
2011-12Estimated
2011-12FTE
2009-10Actual
2009-10FTE
2012-13Proposed
2012-13FTE
Sustainability Fund
SOCIAL SERVICES CONTRACTS
$1,343,010 0.00 $1,343,010 0.00 $1,750,355 0.00Basic Needs 0.00 $0 0.00$744,010
$2,355,856 0.00 $1,915,856 0.00 $1,528,511 0.00Child & Youth 0.00 $749,338 0.00$2,303,134
$0 0.00 $64,500 0.00 $64,500 0.00Homeless 0.00 $0 0.00$0
$0 0.00 $0 0.00 $0 0.00WorkforceDevelopment
0.00 $1,106,538 0.00$0
$3,698,866 0.00 $3,323,366 0.00 $3,343,366 0.00Subtotal 0.00 $1,855,876 0.00$3,047,144
TRANSFERS & OTHER REQUIREMENTS
$287,833 0.00 $914,061 0.00 $502,074 0.00OtherRequirements
0.00 $287,833 0.00$287,833
$2,987,268 0.00 $2,757,837 0.00 $2,985,837 0.00Transfers 0.00 $3,239,406 0.00$2,294,239
$3,275,101 0.00 $3,671,898 0.00 $3,487,911 0.00Subtotal 0.00 $3,527,239 0.00$2,582,072
$6,973,967 0.00 $6,995,264 0.00 $6,831,277 0.00Total 0.00 $5,383,115 0.00$5,629,216
2012-13 Proposed Budget, Austin, TX
206 | Volume I
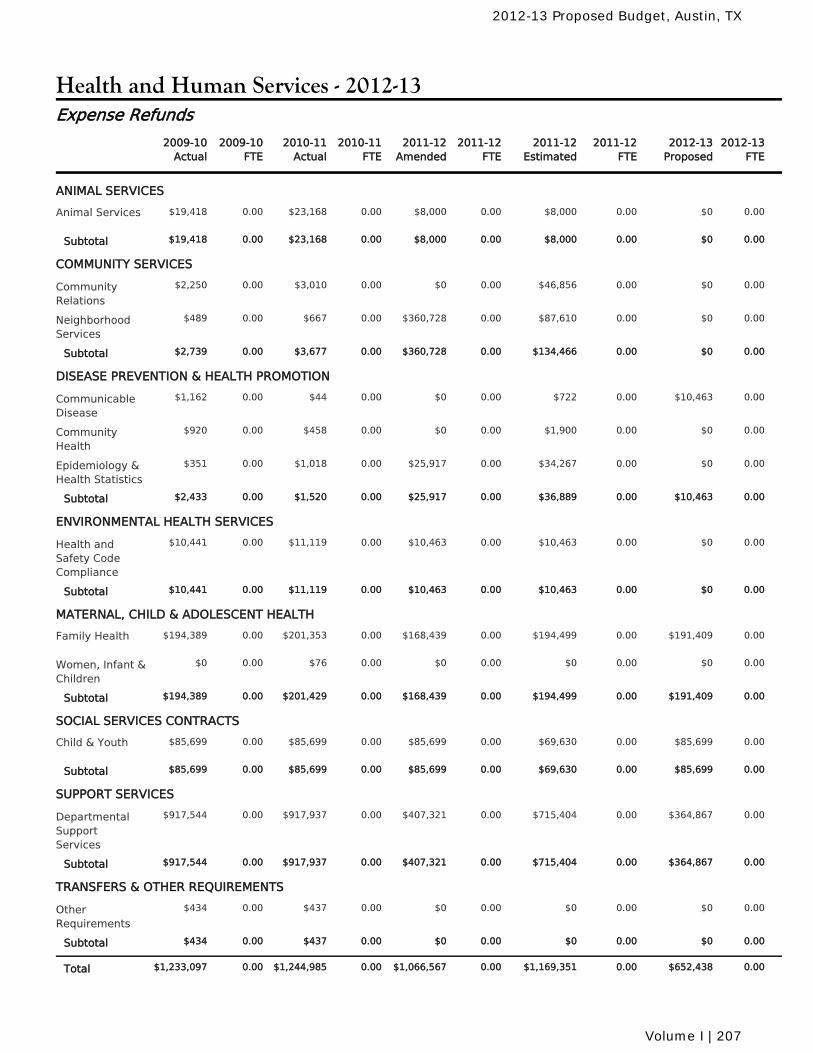
Health and Human Services - 2012-13
2010-11Actual
2010-11FTE
2011-12Amended
2011-12FTE
2011-12Estimated
2011-12FTE
2009-10Actual
2009-10FTE
2012-13Proposed
2012-13FTE
Expense Refunds
ANIMAL SERVICES
$23,168 0.00 $8,000 0.00 $8,000 0.00Animal Services 0.00 $0 0.00$19,418
$23,168 0.00 $8,000 0.00 $8,000 0.00Subtotal 0.00 $0 0.00$19,418
COMMUNITY SERVICES
$3,010 0.00 $0 0.00 $46,856 0.00CommunityRelations
0.00 $0 0.00$2,250
$667 0.00 $360,728 0.00 $87,610 0.00NeighborhoodServices
0.00 $0 0.00$489
$3,677 0.00 $360,728 0.00 $134,466 0.00Subtotal 0.00 $0 0.00$2,739
DISEASE PREVENTION & HEALTH PROMOTION
$44 0.00 $0 0.00 $722 0.00CommunicableDisease
0.00 $10,463 0.00$1,162
$458 0.00 $0 0.00 $1,900 0.00CommunityHealth
0.00 $0 0.00$920
$1,018 0.00 $25,917 0.00 $34,267 0.00Epidemiology &Health Statistics
0.00 $0 0.00$351
$1,520 0.00 $25,917 0.00 $36,889 0.00Subtotal 0.00 $10,463 0.00$2,433
ENVIRONMENTAL HEALTH SERVICES
$11,119 0.00 $10,463 0.00 $10,463 0.00Health andSafety CodeCompliance
0.00 $0 0.00$10,441
$11,119 0.00 $10,463 0.00 $10,463 0.00Subtotal 0.00 $0 0.00$10,441
MATERNAL, CHILD & ADOLESCENT HEALTH
$201,353 0.00 $168,439 0.00 $194,499 0.00Family Health 0.00 $191,409 0.00$194,389
$76 0.00 $0 0.00 $0 0.00Women, Infant &Children
0.00 $0 0.00$0
$201,429 0.00 $168,439 0.00 $194,499 0.00Subtotal 0.00 $191,409 0.00$194,389
SOCIAL SERVICES CONTRACTS
$85,699 0.00 $85,699 0.00 $69,630 0.00Child & Youth 0.00 $85,699 0.00$85,699
$85,699 0.00 $85,699 0.00 $69,630 0.00Subtotal 0.00 $85,699 0.00$85,699
SUPPORT SERVICES
$917,937 0.00 $407,321 0.00 $715,404 0.00DepartmentalSupportServices
0.00 $364,867 0.00$917,544
$917,937 0.00 $407,321 0.00 $715,404 0.00Subtotal 0.00 $364,867 0.00$917,544
TRANSFERS & OTHER REQUIREMENTS
$437 0.00 $0 0.00 $0 0.00OtherRequirements
0.00 $0 0.00$434
$437 0.00 $0 0.00 $0 0.00Subtotal 0.00 $0 0.00$434
$1,244,985 0.00 $1,066,567 0.00 $1,169,351 0.00Total 0.00 $652,438 0.00$1,233,097
2012-13 Proposed Budget, Austin, TX
Volume I | 207
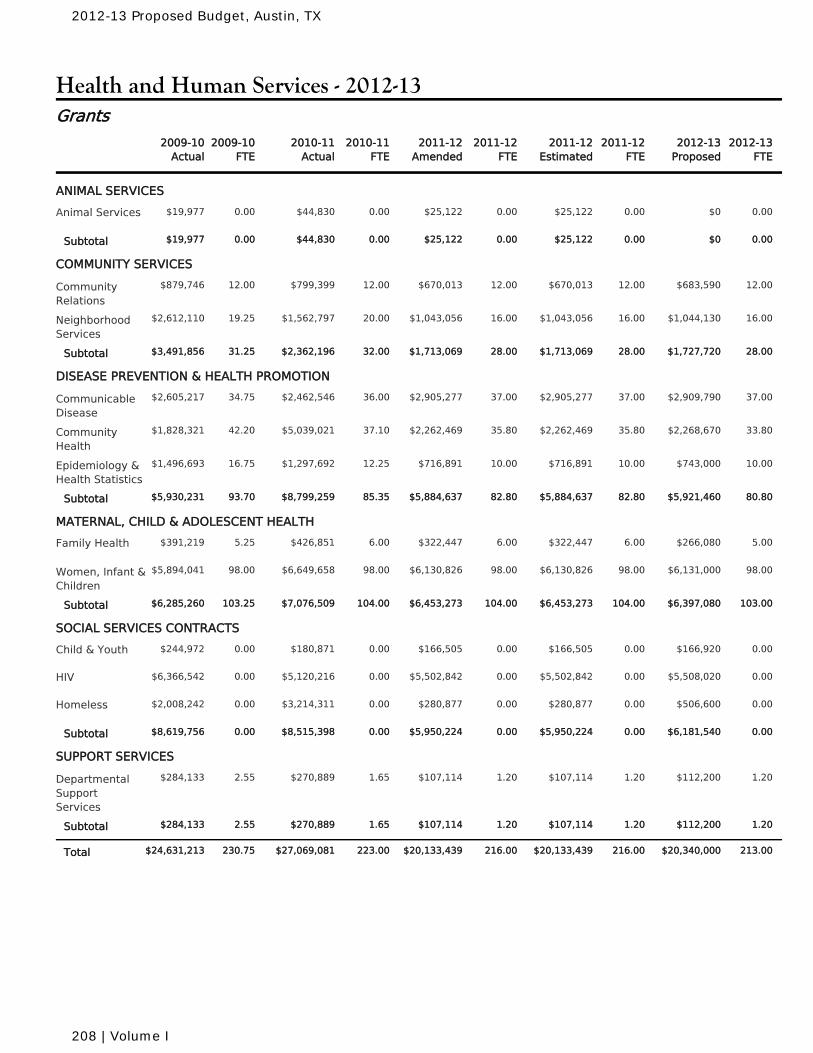
Health and Human Services - 2012-13
2010-11Actual
2010-11FTE
2011-12Amended
2011-12FTE
2011-12Estimated
2011-12FTE
2009-10Actual
2009-10FTE
2012-13Proposed
2012-13FTE
Grants
ANIMAL SERVICES
$44,830 0.00 $25,122 0.00 $25,122 0.00Animal Services 0.00 $0 0.00$19,977
$44,830 0.00 $25,122 0.00 $25,122 0.00Subtotal 0.00 $0 0.00$19,977
COMMUNITY SERVICES
$799,399 12.00 $670,013 12.00 $670,013 12.00CommunityRelations
12.00 $683,590 12.00$879,746
$1,562,797 20.00 $1,043,056 16.00 $1,043,056 16.00NeighborhoodServices
19.25 $1,044,130 16.00$2,612,110
$2,362,196 32.00 $1,713,069 28.00 $1,713,069 28.00Subtotal 31.25 $1,727,720 28.00$3,491,856
DISEASE PREVENTION & HEALTH PROMOTION
$2,462,546 36.00 $2,905,277 37.00 $2,905,277 37.00CommunicableDisease
34.75 $2,909,790 37.00$2,605,217
$5,039,021 37.10 $2,262,469 35.80 $2,262,469 35.80CommunityHealth
42.20 $2,268,670 33.80$1,828,321
$1,297,692 12.25 $716,891 10.00 $716,891 10.00Epidemiology &Health Statistics
16.75 $743,000 10.00$1,496,693
$8,799,259 85.35 $5,884,637 82.80 $5,884,637 82.80Subtotal 93.70 $5,921,460 80.80$5,930,231
MATERNAL, CHILD & ADOLESCENT HEALTH
$426,851 6.00 $322,447 6.00 $322,447 6.00Family Health 5.25 $266,080 5.00$391,219
$6,649,658 98.00 $6,130,826 98.00 $6,130,826 98.00Women, Infant &Children
98.00 $6,131,000 98.00$5,894,041
$7,076,509 104.00 $6,453,273 104.00 $6,453,273 104.00Subtotal 103.25 $6,397,080 103.00$6,285,260
SOCIAL SERVICES CONTRACTS
$180,871 0.00 $166,505 0.00 $166,505 0.00Child & Youth 0.00 $166,920 0.00$244,972
$5,120,216 0.00 $5,502,842 0.00 $5,502,842 0.00HIV 0.00 $5,508,020 0.00$6,366,542
$3,214,311 0.00 $280,877 0.00 $280,877 0.00Homeless 0.00 $506,600 0.00$2,008,242
$8,515,398 0.00 $5,950,224 0.00 $5,950,224 0.00Subtotal 0.00 $6,181,540 0.00$8,619,756
SUPPORT SERVICES
$270,889 1.65 $107,114 1.20 $107,114 1.20DepartmentalSupportServices
2.55 $112,200 1.20$284,133
$270,889 1.65 $107,114 1.20 $107,114 1.20Subtotal 2.55 $112,200 1.20$284,133
$27,069,081 223.00 $20,133,439 216.00 $20,133,439 216.00Total 230.75 $20,340,000 213.00$24,631,213
2012-13 Proposed Budget, Austin, TX
208 | Volume I
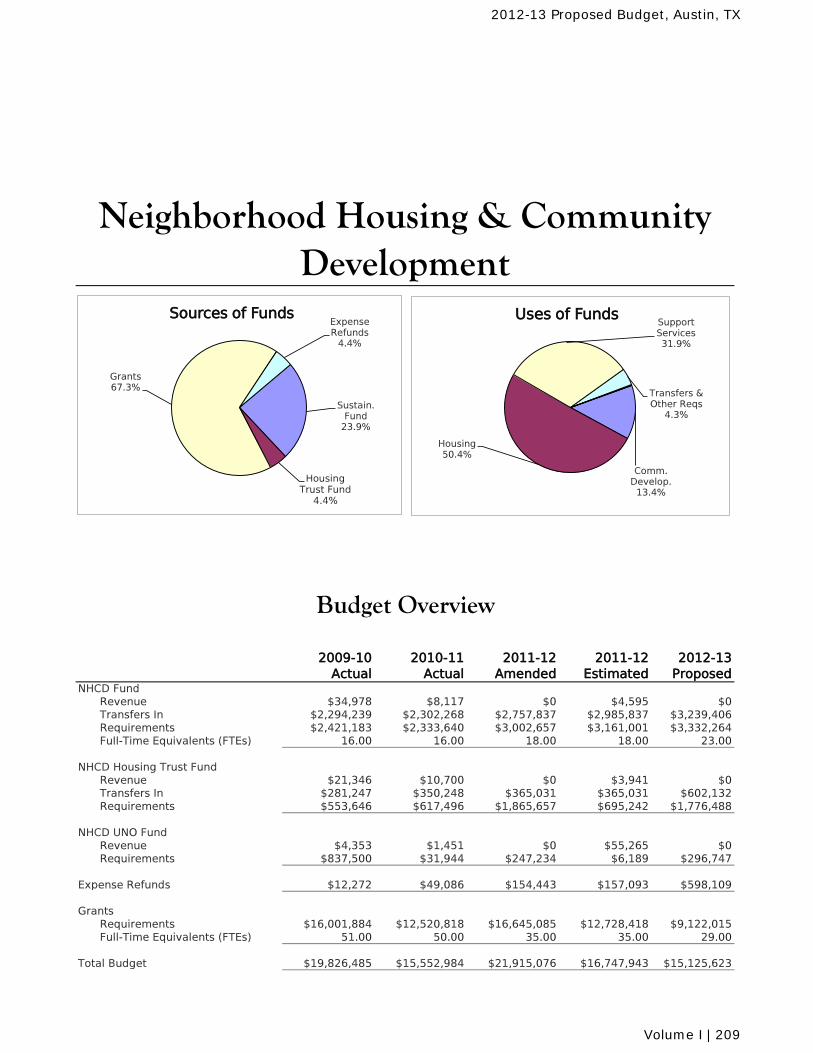
2009-10 Actual
2010-11 Actual
2011-12 Amended
2011-12Estimated
2012-13 Proposed
NHCD FundRevenue $34,978 $8,117 $0 $4,595 $0Transfers In $2,294,239 $2,302,268 $2,757,837 $2,985,837 $3,239,406Requirements $2,421,183 $2,333,640 $3,002,657 $3,161,001 $3,332,264Full-Time Equivalents (FTEs) 16.00 16.00 18.00 18.00 23.00
NHCD Housing Trust FundRevenue $21,346 $10,700 $0 $3,941 $0Transfers In $281,247 $350,248 $365,031 $365,031 $602,132Requirements $553,646 $617,496 $1,865,657 $695,242 $1,776,488
NHCD UNO FundRevenue $4,353 $1,451 $0 $55,265 $0Requirements $837,500 $31,944 $247,234 $6,189 $296,747
Expense Refunds $12,272 $49,086 $154,443 $157,093 $598,109
GrantsRequirements $16,001,884 $12,520,818 $16,645,085 $12,728,418 $9,122,015Full-Time Equivalents (FTEs) 51.00 50.00 35.00 35.00 29.00
Total Budget $19,826,485 $15,552,984 $21,915,076 $16,747,943 $15,125,623
Neighborhood Housing & Community Development
Budget Overview
Sustain. Fund
23.9%
Housing Trust Fund
4.4%
Grants 67.3%
Expense Refunds
4.4%
Sources of Funds
Comm. Develop.
13.4%
Housing 50.4%
Support Services 31.9%
Transfers & Other Reqs
4.3%
Uses of Funds
2012-13 Proposed Budget, Austin, TX
Volume I | 209
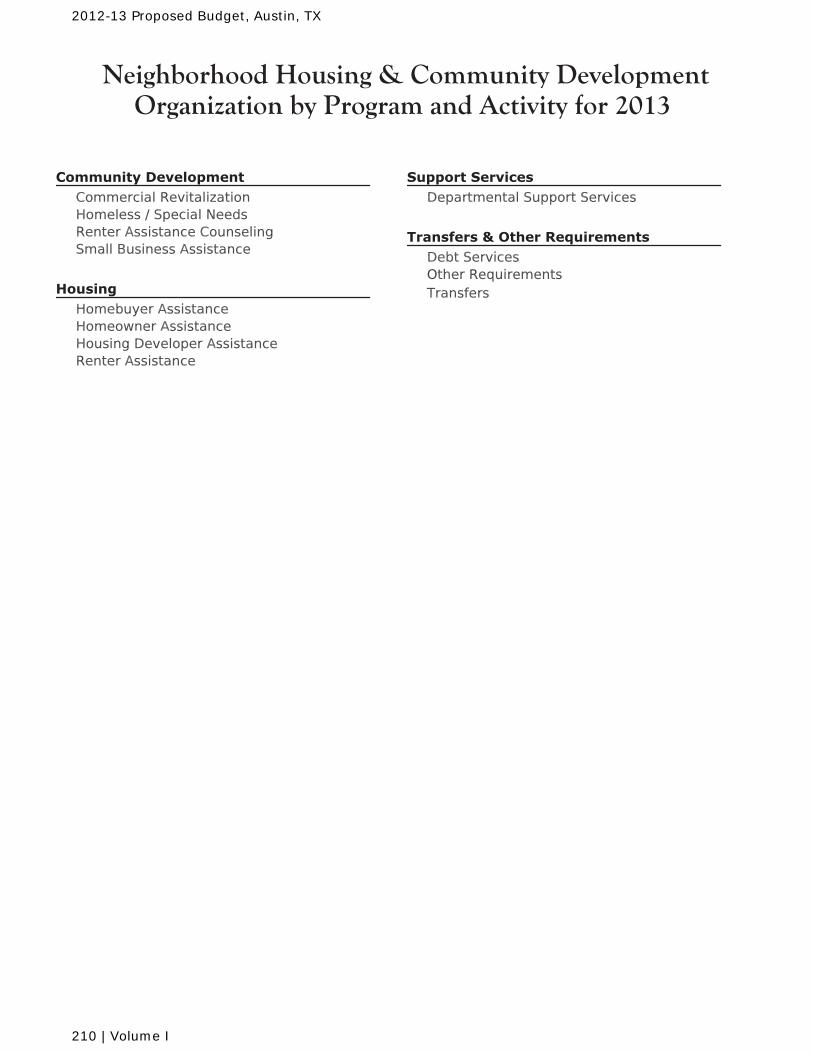
Neighborhood Housing & Community DevelopmentOrganization by Program and Activity for 2013
Commercial RevitalizationHomeless / Special NeedsRenter Assistance CounselingSmall Business Assistance
Homebuyer AssistanceHomeowner AssistanceHousing Developer AssistanceRenter Assistance
Departmental Support Services
Debt ServicesOther RequirementsTransfers
2012-13 Proposed Budget, Austin, TX
210 | Volume I
Neighborhood Housing & Community DevelopmentMission and Goals for 2013
The purpose of the Neighborhood Housing and Community Development Department is to providehousing, community and small business development services to benefit eligible residents so theycan have access to livable neighborhoods and can increase their opportunities for self-sufficiency.
50 percent of all rental units produced under housing gap finance programs will assist households at50 percent of median family income (MFI) or below.
50 percent of all units produced will have affordability periods of 30 years or more.
60 percent of all units produced under home ownership opportunity programs will assist householdsat 60 percent of median family income (MFI) or below.
100 percent of units produced under home ownership opportunity programs will result in anaffordability period of 10 years.
60 percent of jobs created or retained will be held by low or moderate income individuals.
2012-13 Proposed Budget, Austin, TX
Volume I | 211
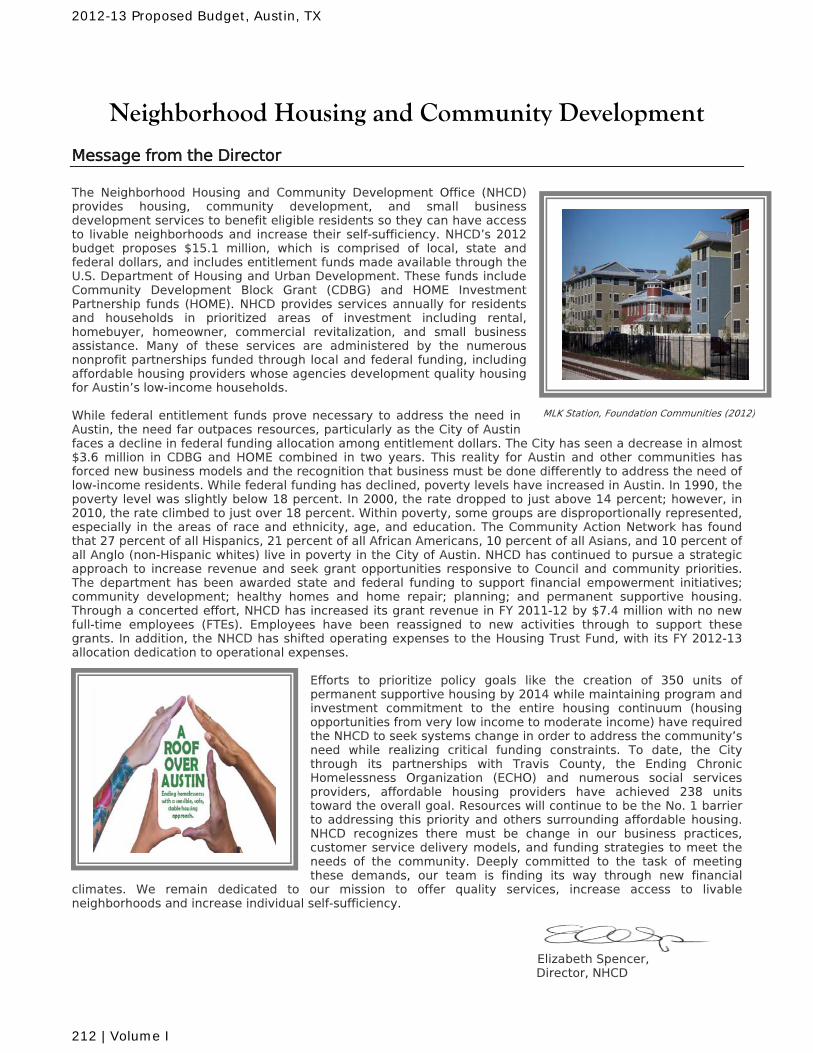
MLK Station, Foundation Communities (2012)
Neighborhood Housing and Community Development
Message from the Director
The Neighborhood Housing and Community Development Office (NHCD) provides housing, community development, and small business development services to benefit eligible residents so they can have access to livable neighborhoods and increase their self-sufficiency. NHCD’s 2012 budget proposes $15.1 million, which is comprised of local, state and federal dollars, and includes entitlement funds made available through the U.S. Department of Housing and Urban Development. These funds include Community Development Block Grant (CDBG) and HOME Investment Partnership funds (HOME). NHCD provides services annually for residents and households in prioritized areas of investment including rental, homebuyer, homeowner, commercial revitalization, and small business assistance. Many of these services are administered by the numerous nonprofit partnerships funded through local and federal funding, including affordable housing providers whose agencies development quality housing for Austin’s low-income households. While federal entitlement funds prove necessary to address the need in Austin, the need far outpaces resources, particularly as the City of Austin faces a decline in federal funding allocation among entitlement dollars. The City has seen a decrease in almost $3.6 million in CDBG and HOME combined in two years. This reality for Austin and other communities has forced new business models and the recognition that business must be done differently to address the need of low-income residents. While federal funding has declined, poverty levels have increased in Austin. In 1990, the poverty level was slightly below 18 percent. In 2000, the rate dropped to just above 14 percent; however, in 2010, the rate climbed to just over 18 percent. Within poverty, some groups are disproportionally represented, especially in the areas of race and ethnicity, age, and education. The Community Action Network has found that 27 percent of all Hispanics, 21 percent of all African Americans, 10 percent of all Asians, and 10 percent of all Anglo (non-Hispanic whites) live in poverty in the City of Austin. NHCD has continued to pursue a strategic approach to increase revenue and seek grant opportunities responsive to Council and community priorities. The department has been awarded state and federal funding to support financial empowerment initiatives; community development; healthy homes and home repair; planning; and permanent supportive housing. Through a concerted effort, NHCD has increased its grant revenue in FY 2011-12 by $7.4 million with no new full-time employees (FTEs). Employees have been reassigned to new activities through to support these grants. In addition, the NHCD has shifted operating expenses to the Housing Trust Fund, with its FY 2012-13 allocation dedication to operational expenses.
Efforts to prioritize policy goals like the creation of 350 units of permanent supportive housing by 2014 while maintaining program and investment commitment to the entire housing continuum (housing opportunities from very low income to moderate income) have required the NHCD to seek systems change in order to address the community’s need while realizing critical funding constraints. To date, the City through its partnerships with Travis County, the Ending Chronic Homelessness Organization (ECHO) and numerous social services providers, affordable housing providers have achieved 238 units toward the overall goal. Resources will continue to be the No. 1 barrier to addressing this priority and others surrounding affordable housing. NHCD recognizes there must be change in our business practices, customer service delivery models, and funding strategies to meet the needs of the community. Deeply committed to the task of meeting these demands, our team is finding its way through new financial
climates. We remain dedicated to our mission to offer quality services, increase access to livable neighborhoods and increase individual self-sufficiency.
Elizabeth Spencer,
Director, NHCD
2012-13 Proposed Budget, Austin, TX
212 | Volume I
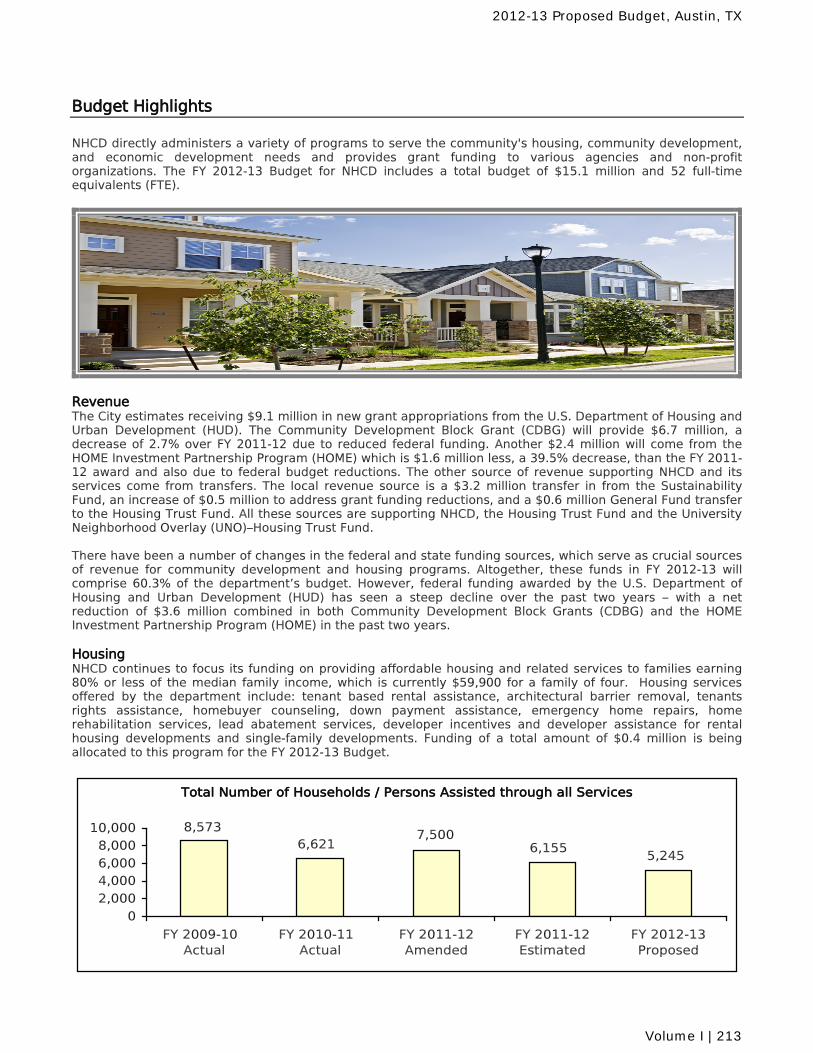
Budget Highlights
NHCD directly administers a variety of programs to serve the community's housing, community development, and economic development needs and provides grant funding to various agencies and non-profit organizations. The FY 2012-13 Budget for NHCD includes a total budget of $15.1 million and 52 full-time equivalents (FTE).
Revenue The City estimates receiving $9.1 million in new grant appropriations from the U.S. Department of Housing and Urban Development (HUD). The Community Development Block Grant (CDBG) will provide $6.7 million, a decrease of 2.7% over FY 2011-12 due to reduced federal funding. Another $2.4 million will come from the HOME Investment Partnership Program (HOME) which is $1.6 million less, a 39.5% decrease, than the FY 2011-12 award and also due to federal budget reductions. The other source of revenue supporting NHCD and its services come from transfers. The local revenue source is a $3.2 million transfer in from the Sustainability Fund, an increase of $0.5 million to address grant funding reductions, and a $0.6 million General Fund transfer to the Housing Trust Fund. All these sources are supporting NHCD, the Housing Trust Fund and the University Neighborhood Overlay (UNO)–Housing Trust Fund. There have been a number of changes in the federal and state funding sources, which serve as crucial sources of revenue for community development and housing programs. Altogether, these funds in FY 2012-13 will comprise 60.3% of the department’s budget. However, federal funding awarded by the U.S. Department of Housing and Urban Development (HUD) has seen a steep decline over the past two years – with a net reduction of $3.6 million combined in both Community Development Block Grants (CDBG) and the HOME Investment Partnership Program (HOME) in the past two years. Housing NHCD continues to focus its funding on providing affordable housing and related services to families earning 80% or less of the median family income, which is currently $59,900 for a family of four. Housing services offered by the department include: tenant based rental assistance, architectural barrier removal, tenants rights assistance, homebuyer counseling, down payment assistance, emergency home repairs, home rehabilitation services, lead abatement services, developer incentives and developer assistance for rental housing developments and single-family developments. Funding of a total amount of $0.4 million is being allocated to this program for the FY 2012-13 Budget.
Total Number of Households / Persons Assisted through all Services
5,2456,155
7,5006,621
8,573
02,0004,0006,0008,000
10,000
FY 2009-10 Actual
FY 2010-11 Actual
FY 2011-12 Amended
FY 2011-12 Estimated
FY 2012-13 Proposed
2012-13 Proposed Budget, Austin, TX
Volume I | 213
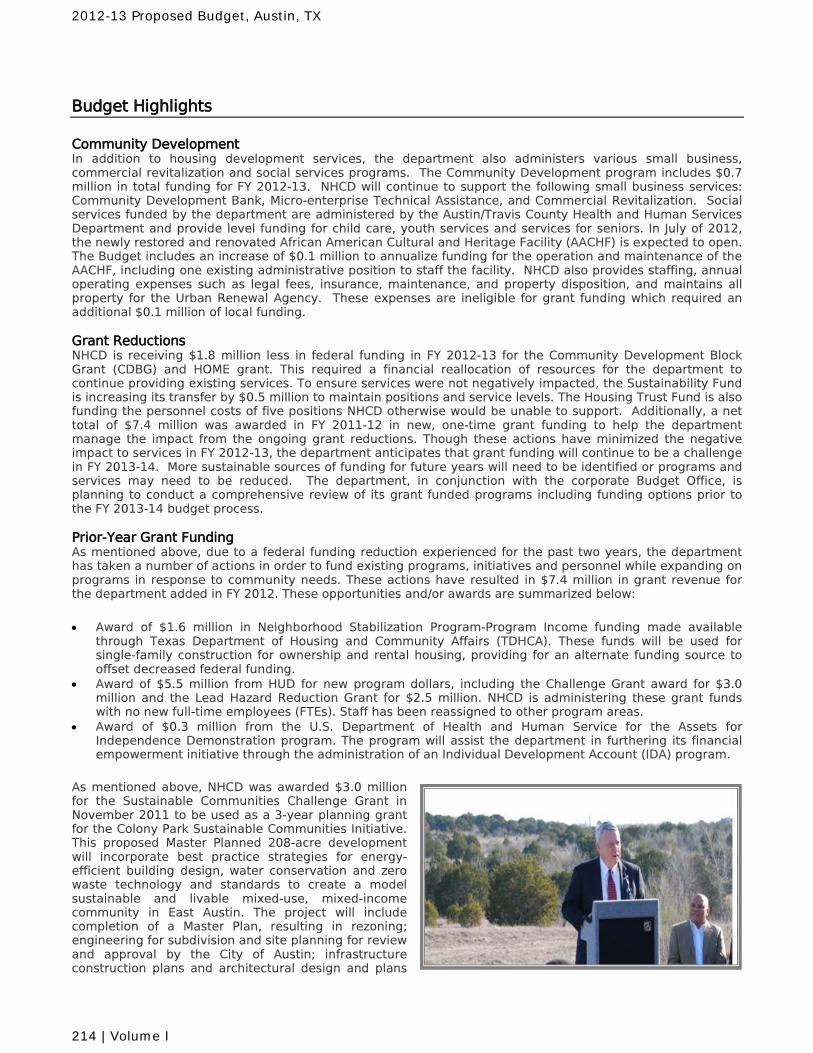
Budget Highlights
Community Development In addition to housing development services, the department also administers various small business, commercial revitalization and social services programs. The Community Development program includes $0.7 million in total funding for FY 2012-13. NHCD will continue to support the following small business services: Community Development Bank, Micro-enterprise Technical Assistance, and Commercial Revitalization. Social services funded by the department are administered by the Austin/Travis County Health and Human Services Department and provide level funding for child care, youth services and services for seniors. In July of 2012, the newly restored and renovated African American Cultural and Heritage Facility (AACHF) is expected to open. The Budget includes an increase of $0.1 million to annualize funding for the operation and maintenance of the AACHF, including one existing administrative position to staff the facility. NHCD also provides staffing, annual operating expenses such as legal fees, insurance, maintenance, and property disposition, and maintains all property for the Urban Renewal Agency. These expenses are ineligible for grant funding which required an additional $0.1 million of local funding. Grant Reductions NHCD is receiving $1.8 million less in federal funding in FY 2012-13 for the Community Development Block Grant (CDBG) and HOME grant. This required a financial reallocation of resources for the department to continue providing existing services. To ensure services were not negatively impacted, the Sustainability Fund is increasing its transfer by $0.5 million to maintain positions and service levels. The Housing Trust Fund is also funding the personnel costs of five positions NHCD otherwise would be unable to support. Additionally, a net total of $7.4 million was awarded in FY 2011-12 in new, one-time grant funding to help the department manage the impact from the ongoing grant reductions. Though these actions have minimized the negative impact to services in FY 2012-13, the department anticipates that grant funding will continue to be a challenge in FY 2013-14. More sustainable sources of funding for future years will need to be identified or programs and services may need to be reduced. The department, in conjunction with the corporate Budget Office, is planning to conduct a comprehensive review of its grant funded programs including funding options prior to the FY 2013-14 budget process. Prior-Year Grant Funding As mentioned above, due to a federal funding reduction experienced for the past two years, the department has taken a number of actions in order to fund existing programs, initiatives and personnel while expanding on programs in response to community needs. These actions have resulted in $7.4 million in grant revenue for the department added in FY 2012. These opportunities and/or awards are summarized below:
• Award of $1.6 million in Neighborhood Stabilization Program-Program Income funding made available through Texas Department of Housing and Community Affairs (TDHCA). These funds will be used for single-family construction for ownership and rental housing, providing for an alternate funding source to offset decreased federal funding.
• Award of $5.5 million from HUD for new program dollars, including the Challenge Grant award for $3.0 million and the Lead Hazard Reduction Grant for $2.5 million. NHCD is administering these grant funds with no new full-time employees (FTEs). Staff has been reassigned to other program areas.
• Award of $0.3 million from the U.S. Department of Health and Human Service for the Assets for Independence Demonstration program. The program will assist the department in furthering its financial empowerment initiative through the administration of an Individual Development Account (IDA) program.
As mentioned above, NHCD was awarded $3.0 million for the Sustainable Communities Challenge Grant in November 2011 to be used as a 3-year planning grant for the Colony Park Sustainable Communities Initiative. This proposed Master Planned 208-acre development will incorporate best practice strategies for energy-efficient building design, water conservation and zero waste technology and standards to create a model sustainable and livable mixed-use, mixed-income community in East Austin. The project will include completion of a Master Plan, resulting in rezoning; engineering for subdivision and site planning for review and approval by the City of Austin; infrastructure construction plans and architectural design and plans
2012-13 Proposed Budget, Austin, TX
214 | Volume I
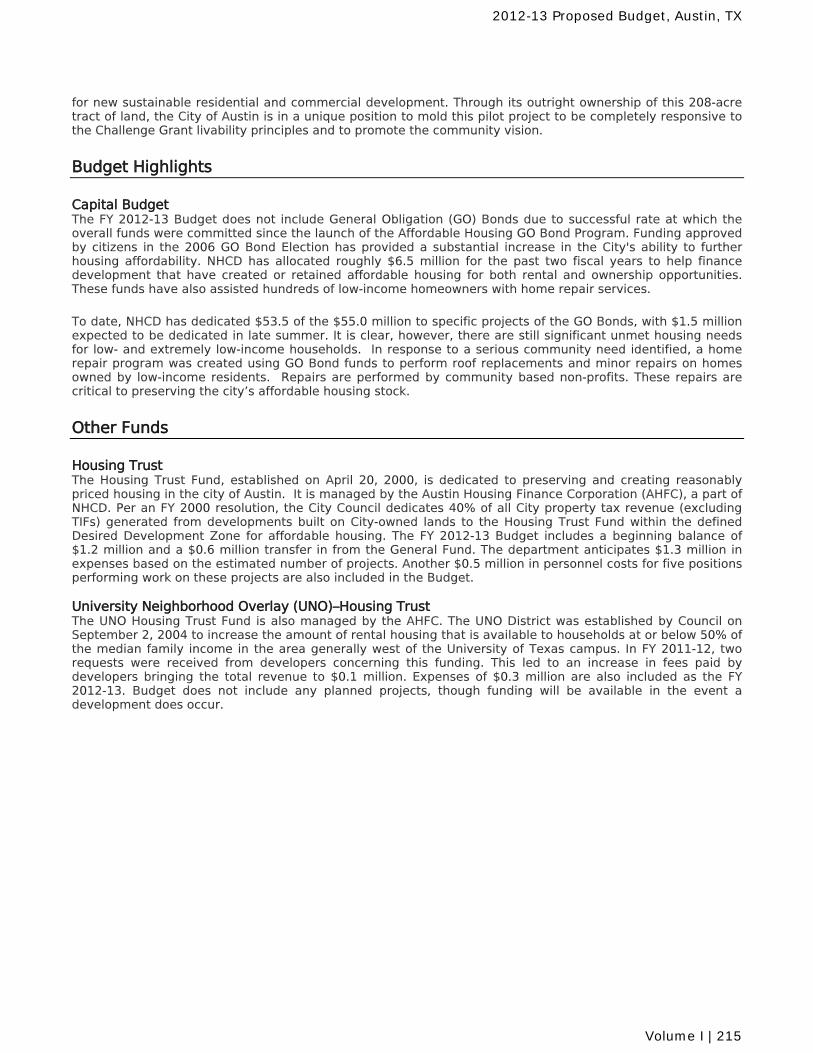
for new sustainable residential and commercial development. Through its outright ownership of this 208-acre tract of land, the City of Austin is in a unique position to mold this pilot project to be completely responsive to the Challenge Grant livability principles and to promote the community vision.
Budget Highlights
Capital Budget The FY 2012-13 Budget does not include General Obligation (GO) Bonds due to successful rate at which the overall funds were committed since the launch of the Affordable Housing GO Bond Program. Funding approved by citizens in the 2006 GO Bond Election has provided a substantial increase in the City's ability to further housing affordability. NHCD has allocated roughly $6.5 million for the past two fiscal years to help finance development that have created or retained affordable housing for both rental and ownership opportunities. These funds have also assisted hundreds of low-income homeowners with home repair services.
To date, NHCD has dedicated $53.5 of the $55.0 million to specific projects of the GO Bonds, with $1.5 million expected to be dedicated in late summer. It is clear, however, there are still significant unmet housing needs for low- and extremely low-income households. In response to a serious community need identified, a home repair program was created using GO Bond funds to perform roof replacements and minor repairs on homes owned by low-income residents. Repairs are performed by community based non-profits. These repairs are critical to preserving the city’s affordable housing stock.
Other Funds
Housing Trust The Housing Trust Fund, established on April 20, 2000, is dedicated to preserving and creating reasonably priced housing in the city of Austin. It is managed by the Austin Housing Finance Corporation (AHFC), a part of NHCD. Per an FY 2000 resolution, the City Council dedicates 40% of all City property tax revenue (excluding TIFs) generated from developments built on City-owned lands to the Housing Trust Fund within the defined Desired Development Zone for affordable housing. The FY 2012-13 Budget includes a beginning balance of $1.2 million and a $0.6 million transfer in from the General Fund. The department anticipates $1.3 million in expenses based on the estimated number of projects. Another $0.5 million in personnel costs for five positions performing work on these projects are also included in the Budget. University Neighborhood Overlay (UNO)–Housing Trust The UNO Housing Trust Fund is also managed by the AHFC. The UNO District was established by Council on September 2, 2004 to increase the amount of rental housing that is available to households at or below 50% of the median family income in the area generally west of the University of Texas campus. In FY 2011-12, two requests were received from developers concerning this funding. This led to an increase in fees paid by developers bringing the total revenue to $0.1 million. Expenses of $0.3 million are also included as the FY 2012-13. Budget does not include any planned projects, though funding will be available in the event a development does occur.
2012-13 Proposed Budget, Austin, TX
Volume I | 215
NHCD Fund
Revenue Changes Dollars
The Budget includes an increase of $481,569 in the transfer from the SustainabilityFund in order to fully fund FY 2013 expenditures. $481,569
Expenditure Changes FTEs Dollars
CitywideThe Budget includes $36,375 for salary increases associated with wage adjustmentsin FY 2013. An additional $5,526 is included in the Budget for increased Citycontributions for health insurance. $41,901
The Budget includes additional funding for the Employees' Retirement System that isequivalent to 2% of payroll for non-civil service employees to help improve thefunded status of the pension system. $28,237
The Budget includes $2,487 for wage adjustments associated with implementing theCity's recently completed market study. $2,487
Community DevelopmentThis program budget is decreasing a net of $58,995 largely due to the reallocation ofthe Commercial Revitalization and Preservation funding to Support Services program. ($58,995)
The African American Cultural and Heritage Facility is opening in FY 2012. Toannualize funding for the facility, one Administrative Senior position is transferring infrom the Community Development Block Grant and additional ongoing operatingcosts are also included in the Budget. 1.00 $93,100
Staffing and maintaining the Urban Renewal Agency, including outside legal counselfees, insurance and property maintenance, requires an increase of $116,000 in localfunding for the Budget. $116,000
The Budget also includes ongoing funding for general building maintenance,including $31,682 for the upkeep of the Connelly-Yerwood house. $31,682
HousingOne position in the amount of $80,104 is transferring to the Support Servicesprogram due to federal grant funding reductions in FY 2013. The personnel costs willbe funded through the Housing Trust Fund resulting in zero budget impact to theDepartment through an expense refund of the same amount. 1.00 $0
Support ServicesBudgets for proposed planning activities for commercial revitalization andpreservation, foreclosure prevention and Spanish homebuyer services are increasingby a total of $148,572. A net reduction of $162,387 for decreases to the HousingAuthority of the City of Austin interlocal agreement and interdepartmental charges. ($13,815)
The educational travel Budget is increasing $14,673 program wide. $14,673
One Administrative Specialist position is transferring to the Austin Fire Department(AFD) for the FY 2013 Budget. This is offset through a decrease in expense refunds ofthe same amount based on the full-time work this position was providing AFD duringthe prior year Budget. (1.00) $0
Significant ChangesNeighborhood Housing & Community Development
2012-13 Proposed Budget, Austin, TX
216 | Volume I
Expenditure Changes FTEs Dollars
Four positions in the amount of $385,060 are transferring to the Support Servicesprogram due to federal grant funding reductions in FY 2013. The personnel costs willbe funded through the Housing Trust Fund resulting in zero budget impact to theDepartment through an expense refund of the same amount. 4.00 $0
Housing Trust Fund
Revenue Changes Dollars
The Budget includes an increase of $237,101 in the transfer from the General Fundbased on estimate of property values. $237,101
Expenditure Changes FTEs Dollars
The program requirements are decreasing to bring the budget back in line withhistorical spending levels based on the estimated number of projects. ($554,333)
Five positions are transferring to the Neighborhood Housing and CommunityDevelopment Office due to federal grant funding reductions in FY 2013. Theirpersonnel costs of $465,164 will be fully funded by the Housing Trust Fund throughan expense refund. $465,164
University Neighborhood Overlay - Housing Trust Fund
Expenditure Changes FTEs Dollars
The program requirements are increasing based on a higher number of anticipateddevelopments occurring than in the previous year. $49,513
Grants
The Community Development Block Grant (CDBG) award is decreasing in the amountof $185,108 for the FY 2013 Budget. This amount has been offset by the reduction ofpublic services, administrative funds, and debt service due to refinancing of the east11th and 12th Street Section 108 loan. In addition, four positions have beentransferred to the Neighborhood Housing and Community Development Departmentdue to this decrease in federal grant funding. (4.00) ($185,108)
The HOME Investment Partnership grant award is decreasing in the amount of$1,587,962 for the FY 2013 Budget. This includes one position being transferred tothe Neighborhood Housing and Community Development Department due to thisdecrease in federal grant funding. (1.00) (1,587,962)
The African American Cultural and Heritage Facility is opening in FY 2012. OneAdministrative Senior position is transferring in from the Community BlockDevelopment Grant to provide staffing for this facility. (1.00) (53,321)
2012-13 Proposed Budget, Austin, TX
Volume I | 217
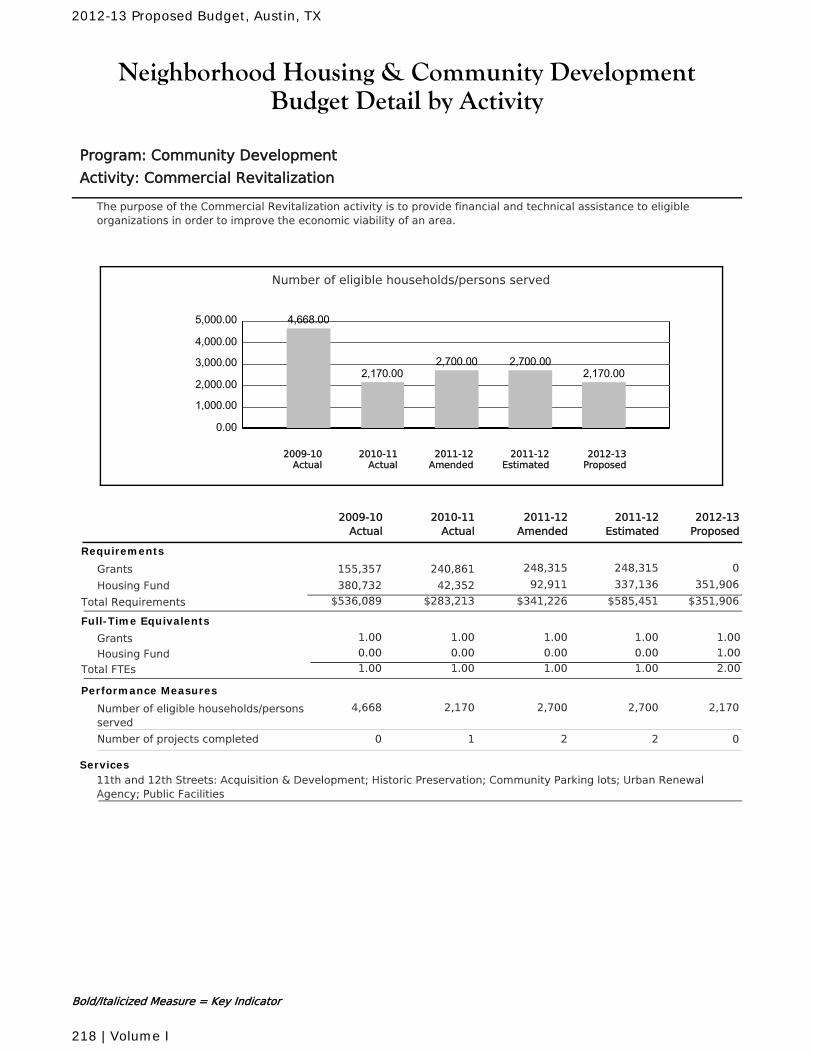
Neighborhood Housing & Community DevelopmentBudget Detail by Activity
Program: Community Development
Activity: Commercial Revitalization
The purpose of the Commercial Revitalization activity is to provide financial and technical assistance to eligibleorganizations in order to improve the economic viability of an area.
Number of eligible households/persons served
0.00
1,000.00
2,000.00
3,000.00
4,000.00
5,000.00 4,668.00
2,170.002,700.00 2,700.00
2,170.00
2010-11Actual
2012-13Proposed
2011-12Amended
2011-12Estimated
2009-10Actual
2011-12Amended
2010-11Actual
2011-12Estimated
2012-13Proposed
2009-10Actual
Requirements
Grants 248,315 248,315 0240,861155,357
Housing Fund 92,911 337,136 351,90642,352380,732
$341,226 $585,451 $351,906Total Requirements $283,213$536,089
Full-Time Equivalents
Grants 1.00 1.00 1.00 1.001.00
Housing Fund 0.00 0.00 0.00 1.000.00
Total FTEs 1.00 1.00 1.00 2.001.00
Performance Measures
Number of eligible households/personsserved
2,7002,170 2,700 2,1704,668
Number of projects completed 21 2 00
Services11th and 12th Streets: Acquisition & Development; Historic Preservation; Community Parking lots; Urban RenewalAgency; Public Facilities
Bold/Italicized Measure = Key Indicator
2012-13 Proposed Budget, Austin, TX
218 | Volume I
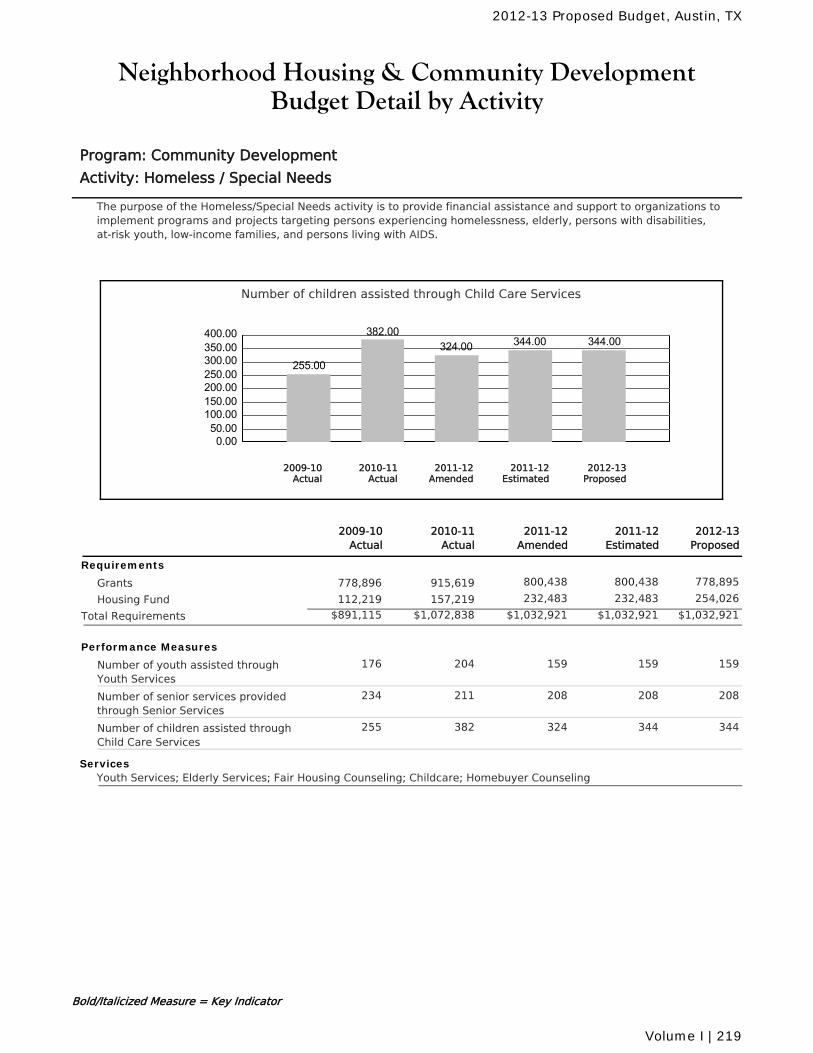
Neighborhood Housing & Community DevelopmentBudget Detail by Activity
Program: Community Development
Activity: Homeless / Special Needs
The purpose of the Homeless/Special Needs activity is to provide financial assistance and support to organizations toimplement programs and projects targeting persons experiencing homelessness, elderly, persons with disabilities,at-risk youth, low-income families, and persons living with AIDS.
Number of children assisted through Child Care Services
0.0050.00
100.00150.00200.00250.00300.00350.00400.00
255.00
382.00324.00 344.00 344.00
2010-11Actual
2012-13Proposed
2011-12Amended
2011-12Estimated
2009-10Actual
2011-12Amended
2010-11Actual
2011-12Estimated
2012-13Proposed
2009-10Actual
Requirements
Grants 800,438 800,438 778,895915,619778,896
Housing Fund 232,483 232,483 254,026157,219112,219
$1,032,921 $1,032,921 $1,032,921Total Requirements $1,072,838$891,115
Performance Measures
Number of youth assisted throughYouth Services
159204 159 159176
Number of senior services providedthrough Senior Services
208211 208 208234
Number of children assisted throughChild Care Services
324382 344 344255
ServicesYouth Services; Elderly Services; Fair Housing Counseling; Childcare; Homebuyer Counseling
Bold/Italicized Measure = Key Indicator
2012-13 Proposed Budget, Austin, TX
Volume I | 219
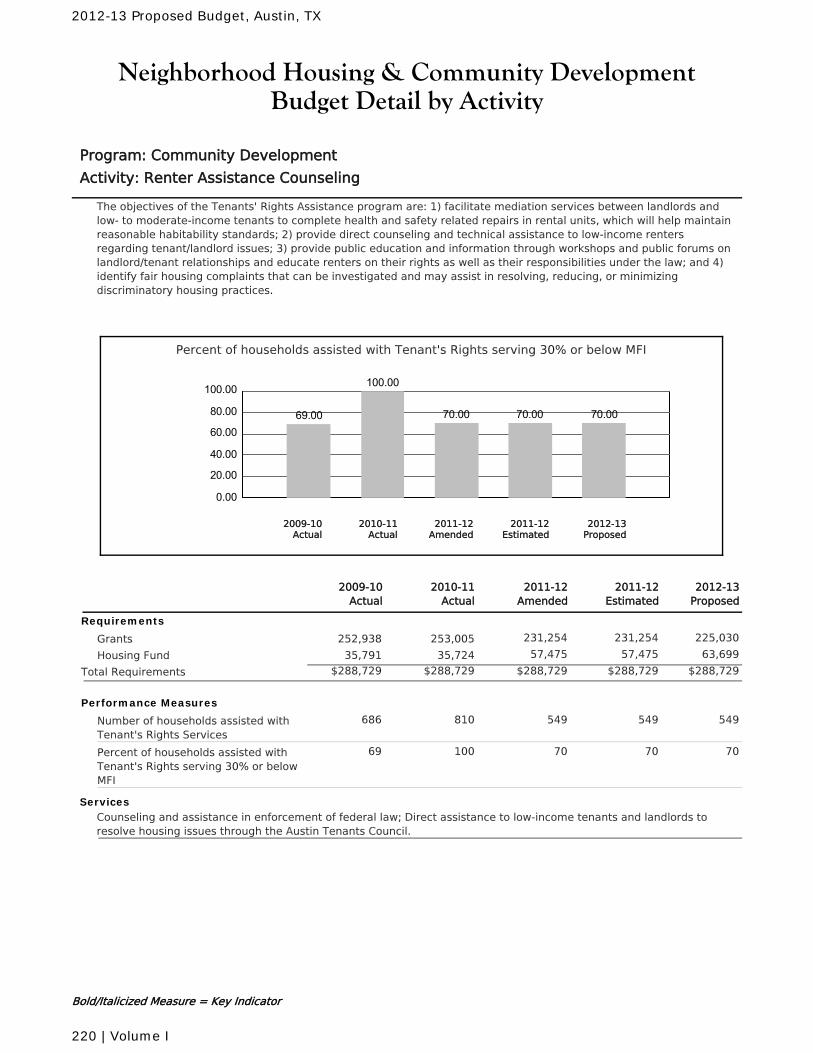
Neighborhood Housing & Community DevelopmentBudget Detail by Activity
Program: Community Development
Activity: Renter Assistance Counseling
The objectives of the Tenants' Rights Assistance program are: 1) facilitate mediation services between landlords andlow- to moderate-income tenants to complete health and safety related repairs in rental units, which will help maintainreasonable habitability standards; 2) provide direct counseling and technical assistance to low-income rentersregarding tenant/landlord issues; 3) provide public education and information through workshops and public forums onlandlord/tenant relationships and educate renters on their rights as well as their responsibilities under the law; and 4)identify fair housing complaints that can be investigated and may assist in resolving, reducing, or minimizingdiscriminatory housing practices.
Percent of households assisted with Tenant's Rights serving 30% or below MFI
0.00
20.00
40.00
60.00
80.00
100.00
69.00
100.00
70.00 70.00 70.00
2010-11Actual
2012-13Proposed
2011-12Amended
2011-12Estimated
2009-10Actual
2011-12Amended
2010-11Actual
2011-12Estimated
2012-13Proposed
2009-10Actual
Requirements
Grants 231,254 231,254 225,030253,005252,938
Housing Fund 57,475 57,475 63,69935,72435,791
$288,729 $288,729 $288,729Total Requirements $288,729$288,729
Performance Measures
Number of households assisted withTenant's Rights Services
549810 549 549686
Percent of households assisted withTenant's Rights serving 30% or belowMFI
70100 70 7069
ServicesCounseling and assistance in enforcement of federal law; Direct assistance to low-income tenants and landlords toresolve housing issues through the Austin Tenants Council.
Bold/Italicized Measure = Key Indicator
2012-13 Proposed Budget, Austin, TX
220 | Volume I
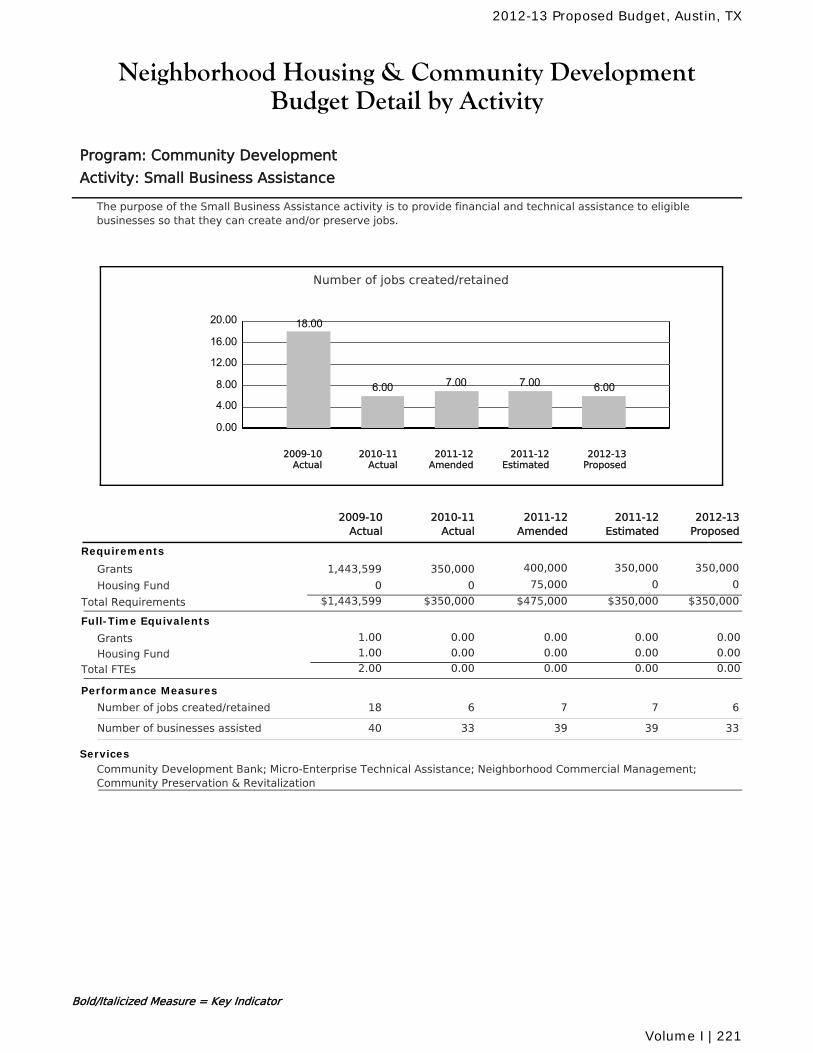
Neighborhood Housing & Community DevelopmentBudget Detail by Activity
Program: Community Development
Activity: Small Business Assistance
The purpose of the Small Business Assistance activity is to provide financial and technical assistance to eligiblebusinesses so that they can create and/or preserve jobs.
Number of jobs created/retained
0.00
4.00
8.00
12.00
16.00
20.00 18.00
6.00 7.00 7.00 6.00
2010-11Actual
2012-13Proposed
2011-12Amended
2011-12Estimated
2009-10Actual
2011-12Amended
2010-11Actual
2011-12Estimated
2012-13Proposed
2009-10Actual
Requirements
Grants 400,000 350,000 350,000350,0001,443,599
Housing Fund 75,000 0 000
$475,000 $350,000 $350,000Total Requirements $350,000$1,443,599
Full-Time Equivalents
Grants 0.00 0.00 0.00 0.001.00
Housing Fund 0.00 0.00 0.00 0.001.00
Total FTEs 0.00 0.00 0.00 0.002.00
Performance Measures
Number of jobs created/retained 76 7 618
Number of businesses assisted 3933 39 3340
ServicesCommunity Development Bank; Micro-Enterprise Technical Assistance; Neighborhood Commercial Management;Community Preservation & Revitalization
Bold/Italicized Measure = Key Indicator
2012-13 Proposed Budget, Austin, TX
Volume I | 221
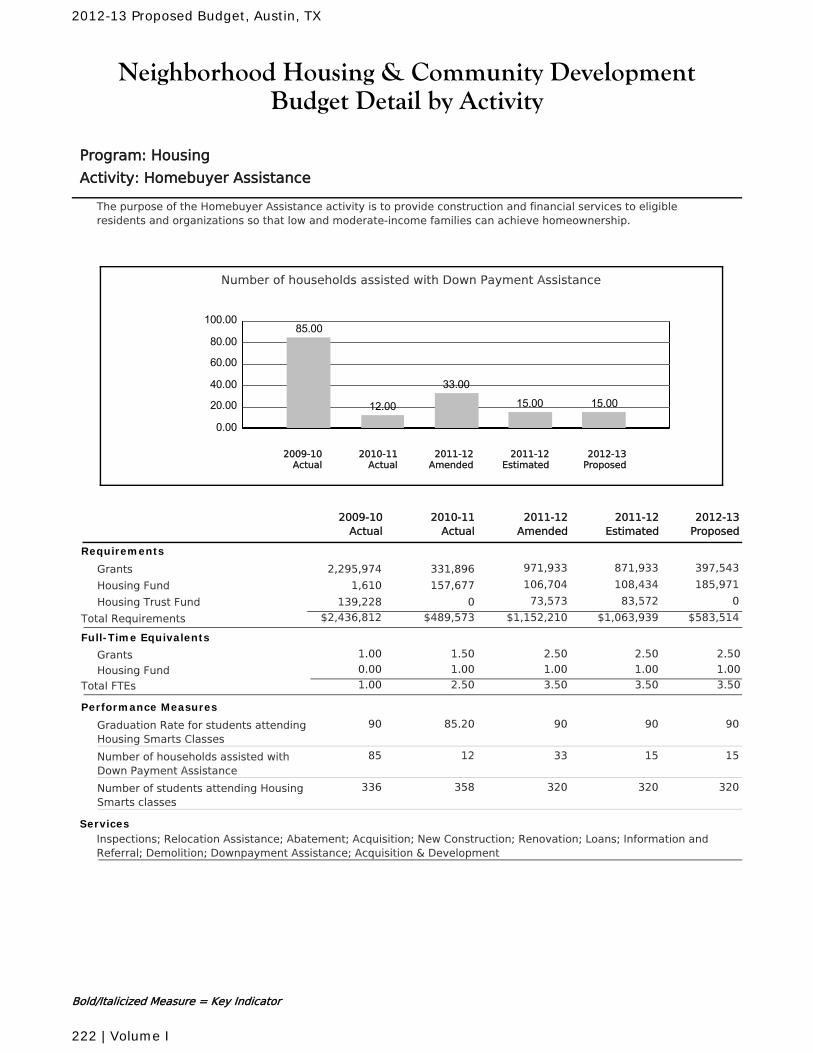
Neighborhood Housing & Community DevelopmentBudget Detail by Activity
Program: Housing
Activity: Homebuyer Assistance
The purpose of the Homebuyer Assistance activity is to provide construction and financial services to eligibleresidents and organizations so that low and moderate-income families can achieve homeownership.
Number of households assisted with Down Payment Assistance
0.00
20.00
40.00
60.00
80.00
100.0085.00
12.00
33.00
15.00 15.00
2010-11Actual
2012-13Proposed
2011-12Amended
2011-12Estimated
2009-10Actual
2011-12Amended
2010-11Actual
2011-12Estimated
2012-13Proposed
2009-10Actual
Requirements
Grants 971,933 871,933 397,543331,8962,295,974
Housing Fund 106,704 108,434 185,971157,6771,610
Housing Trust Fund 73,573 83,572 00139,228
$1,152,210 $1,063,939 $583,514Total Requirements $489,573$2,436,812
Full-Time Equivalents
Grants 1.50 2.50 2.50 2.501.00
Housing Fund 1.00 1.00 1.00 1.000.00
Total FTEs 2.50 3.50 3.50 3.501.00
Performance Measures
Graduation Rate for students attendingHousing Smarts Classes
9085.20 90 9090
Number of households assisted withDown Payment Assistance
3312 15 1585
Number of students attending HousingSmarts classes
320358 320 320336
ServicesInspections; Relocation Assistance; Abatement; Acquisition; New Construction; Renovation; Loans; Information andReferral; Demolition; Downpayment Assistance; Acquisition & Development
Bold/Italicized Measure = Key Indicator
2012-13 Proposed Budget, Austin, TX
222 | Volume I
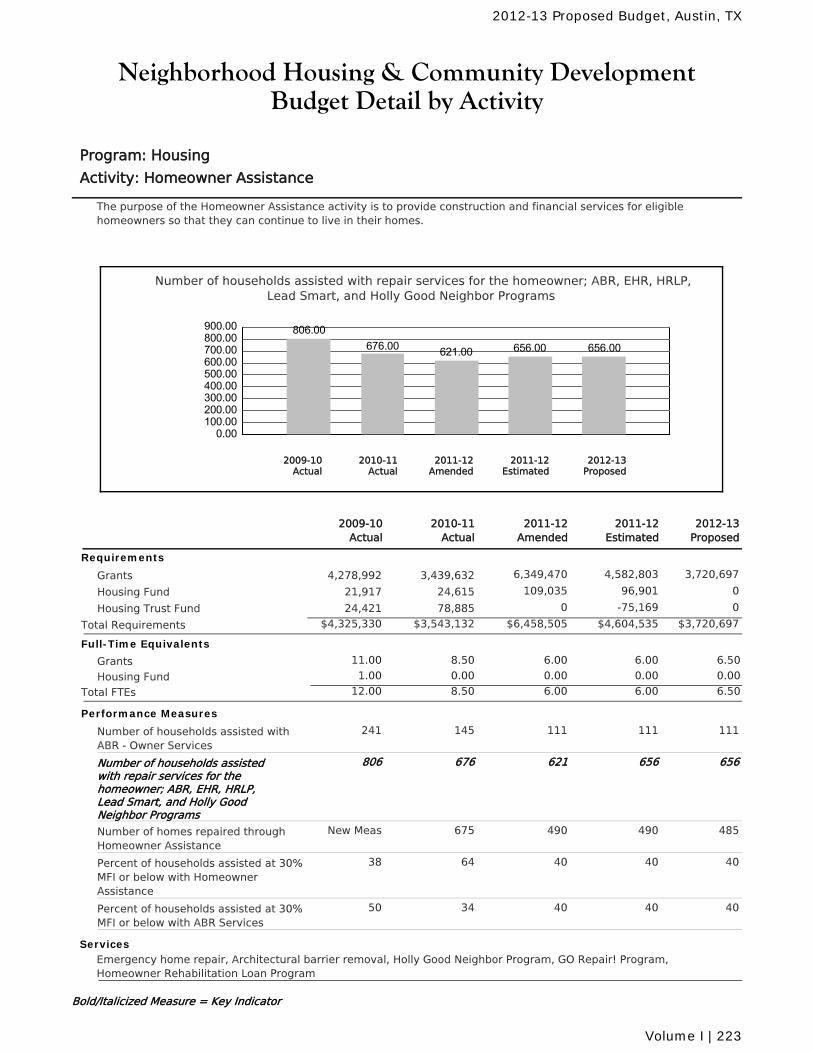
Neighborhood Housing & Community DevelopmentBudget Detail by Activity
Program: Housing
Activity: Homeowner Assistance
The purpose of the Homeowner Assistance activity is to provide construction and financial services for eligiblehomeowners so that they can continue to live in their homes.
Number of households assisted with repair services for the homeowner; ABR, EHR, HRLP,Lead Smart, and Holly Good Neighbor Programs
0.00100.00200.00300.00400.00500.00600.00700.00800.00900.00 806.00
676.00 621.00 656.00 656.00
2010-11Actual
2012-13Proposed
2011-12Amended
2011-12Estimated
2009-10Actual
2011-12Amended
2010-11Actual
2011-12Estimated
2012-13Proposed
2009-10Actual
Requirements
Grants 6,349,470 4,582,803 3,720,6973,439,6324,278,992
Housing Fund 109,035 96,901 024,61521,917
Housing Trust Fund 0 -75,169 078,88524,421
$6,458,505 $4,604,535 $3,720,697Total Requirements $3,543,132$4,325,330
Full-Time Equivalents
Grants 8.50 6.00 6.00 6.5011.00
Housing Fund 0.00 0.00 0.00 0.001.00
Total FTEs 8.50 6.00 6.00 6.5012.00
Performance Measures
Number of households assisted withABR - Owner Services
111145 111 111241
Number of households assistedwith repair services for thehomeowner; ABR, EHR, HRLP,Lead Smart, and Holly GoodNeighbor Programs
621676 656 656806
Number of homes repaired throughHomeowner Assistance
490675 490 485New Meas
Percent of households assisted at 30%MFI or below with HomeownerAssistance
4064 40 4038
Percent of households assisted at 30%MFI or below with ABR Services
4034 40 4050
ServicesEmergency home repair, Architectural barrier removal, Holly Good Neighbor Program, GO Repair! Program,Homeowner Rehabilitation Loan Program
Bold/Italicized Measure = Key Indicator
2012-13 Proposed Budget, Austin, TX
Volume I | 223
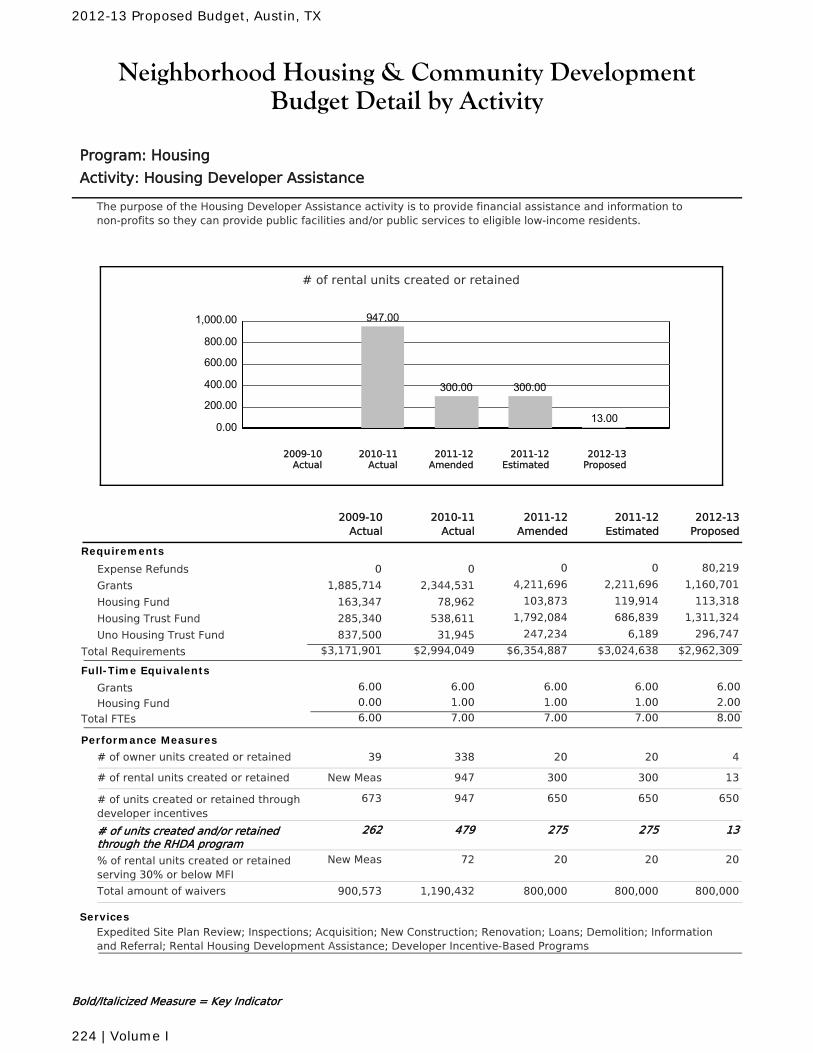
Neighborhood Housing & Community DevelopmentBudget Detail by Activity
Program: Housing
Activity: Housing Developer Assistance
The purpose of the Housing Developer Assistance activity is to provide financial assistance and information tonon-profits so they can provide public facilities and/or public services to eligible low-income residents.
# of rental units created or retained
0.00
200.00
400.00
600.00
800.00
1,000.00 947.00
300.00 300.00
13.00
2010-11Actual
2012-13Proposed
2011-12Amended
2011-12Estimated
2009-10Actual
2011-12Amended
2010-11Actual
2011-12Estimated
2012-13Proposed
2009-10Actual
Requirements
Expense Refunds 0 0 80,21900
Grants 4,211,696 2,211,696 1,160,7012,344,5311,885,714
Housing Fund 103,873 119,914 113,31878,962163,347
Housing Trust Fund 1,792,084 686,839 1,311,324538,611285,340
Uno Housing Trust Fund 247,234 6,189 296,74731,945837,500
$6,354,887 $3,024,638 $2,962,309Total Requirements $2,994,049$3,171,901
Full-Time Equivalents
Grants 6.00 6.00 6.00 6.006.00
Housing Fund 1.00 1.00 1.00 2.000.00
Total FTEs 7.00 7.00 7.00 8.006.00
Performance Measures
# of owner units created or retained 20338 20 439
# of rental units created or retained 300947 300 13New Meas
# of units created or retained throughdeveloper incentives
650947 650 650673
# of units created and/or retainedthrough the RHDA program
275479 275 13262
% of rental units created or retainedserving 30% or below MFI
2072 20 20New Meas
Total amount of waivers 800,0001,190,432 800,000 800,000900,573
ServicesExpedited Site Plan Review; Inspections; Acquisition; New Construction; Renovation; Loans; Demolition; Informationand Referral; Rental Housing Development Assistance; Developer Incentive-Based Programs
Bold/Italicized Measure = Key Indicator
2012-13 Proposed Budget, Austin, TX
224 | Volume I
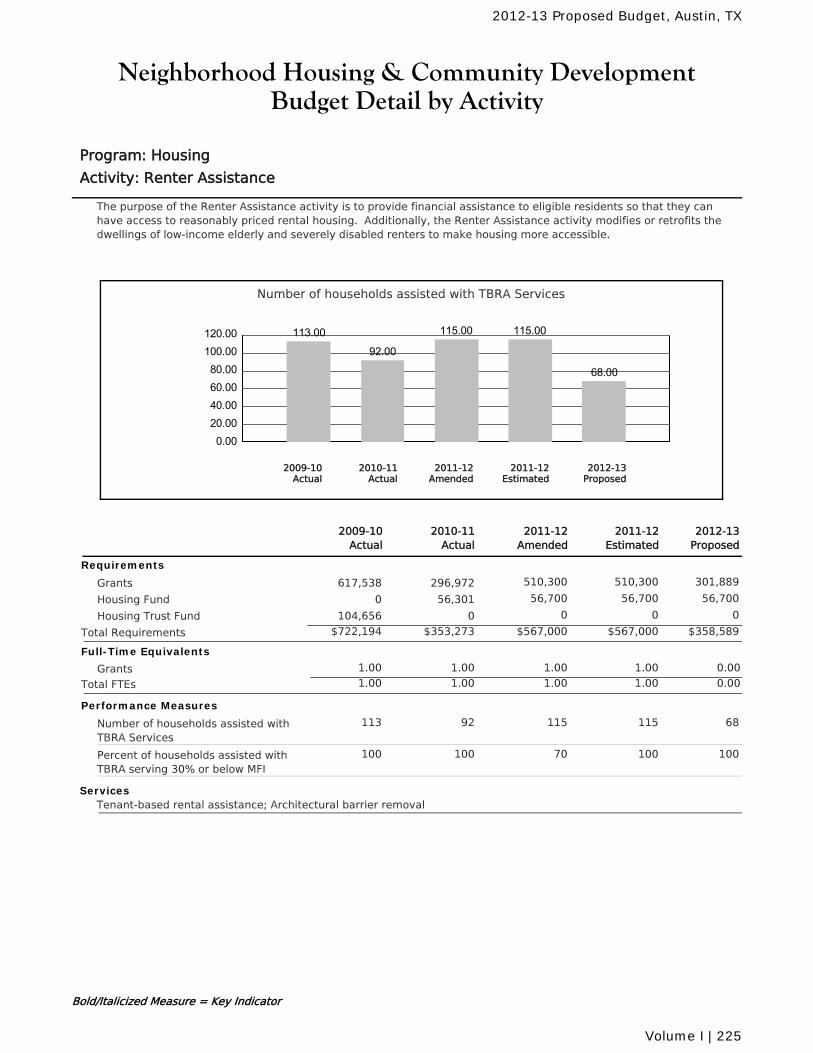
Neighborhood Housing & Community DevelopmentBudget Detail by Activity
Program: Housing
Activity: Renter Assistance
The purpose of the Renter Assistance activity is to provide financial assistance to eligible residents so that they canhave access to reasonably priced rental housing. Additionally, the Renter Assistance activity modifies or retrofits thedwellings of low-income elderly and severely disabled renters to make housing more accessible.
Number of households assisted with TBRA Services
0.0020.0040.0060.0080.00
100.00120.00 113.00
92.00
115.00 115.00
68.00
2010-11Actual
2012-13Proposed
2011-12Amended
2011-12Estimated
2009-10Actual
2011-12Amended
2010-11Actual
2011-12Estimated
2012-13Proposed
2009-10Actual
Requirements
Grants 510,300 510,300 301,889296,972617,538
Housing Fund 56,700 56,700 56,70056,3010
Housing Trust Fund 0 0 00104,656
$567,000 $567,000 $358,589Total Requirements $353,273$722,194
Full-Time Equivalents
Grants 1.00 1.00 1.00 0.001.00
Total FTEs 1.00 1.00 1.00 0.001.00
Performance Measures
Number of households assisted withTBRA Services
11592 115 68113
Percent of households assisted withTBRA serving 30% or below MFI
70100 100 100100
ServicesTenant-based rental assistance; Architectural barrier removal
Bold/Italicized Measure = Key Indicator
2012-13 Proposed Budget, Austin, TX
Volume I | 225
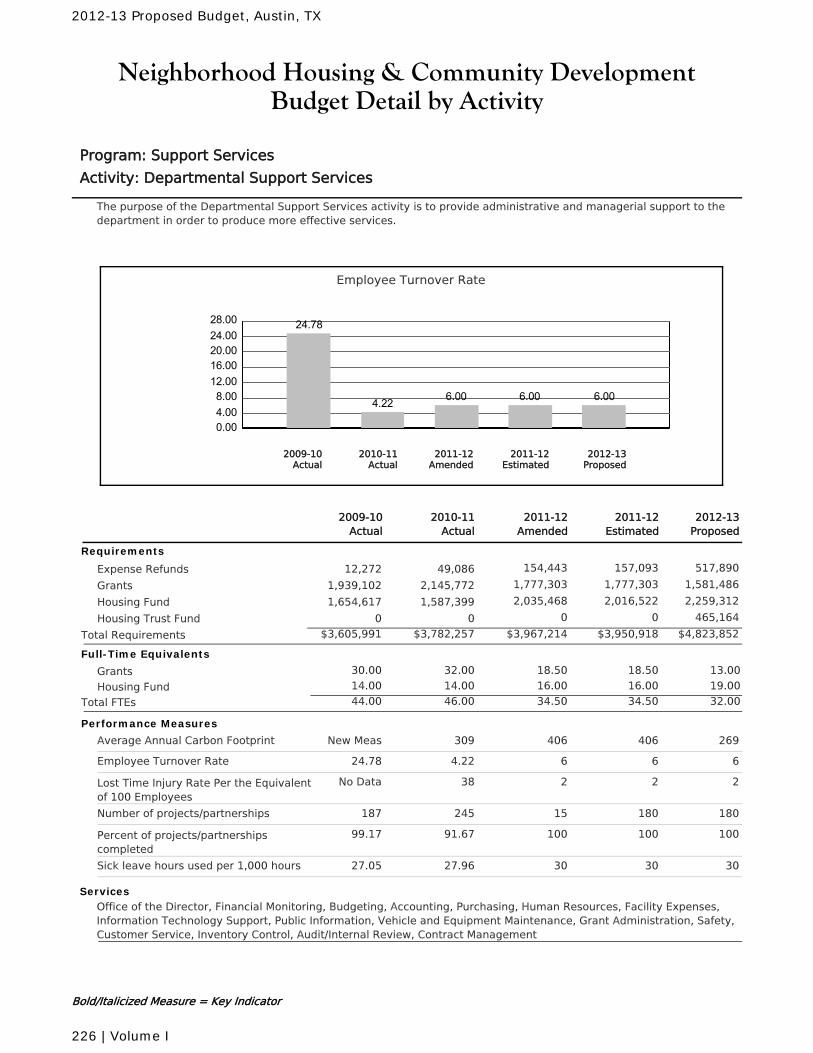
Neighborhood Housing & Community DevelopmentBudget Detail by Activity
Program: Support Services
Activity: Departmental Support Services
The purpose of the Departmental Support Services activity is to provide administrative and managerial support to thedepartment in order to produce more effective services.
Employee Turnover Rate
0.004.008.00
12.0016.0020.0024.0028.00 24.78
4.22 6.00 6.00 6.00
2010-11Actual
2012-13Proposed
2011-12Amended
2011-12Estimated
2009-10Actual
2011-12Amended
2010-11Actual
2011-12Estimated
2012-13Proposed
2009-10Actual
Requirements
Expense Refunds 154,443 157,093 517,89049,08612,272
Grants 1,777,303 1,777,303 1,581,4862,145,7721,939,102
Housing Fund 2,035,468 2,016,522 2,259,3121,587,3991,654,617
Housing Trust Fund 0 0 465,16400
$3,967,214 $3,950,918 $4,823,852Total Requirements $3,782,257$3,605,991
Full-Time Equivalents
Grants 32.00 18.50 18.50 13.0030.00
Housing Fund 14.00 16.00 16.00 19.0014.00
Total FTEs 46.00 34.50 34.50 32.0044.00
Performance Measures
Average Annual Carbon Footprint 406309 406 269New Meas
Employee Turnover Rate 64.22 6 624.78
Lost Time Injury Rate Per the Equivalentof 100 Employees
238 2 2No Data
Number of projects/partnerships 15245 180 180187
Percent of projects/partnershipscompleted
10091.67 100 10099.17
Sick leave hours used per 1,000 hours 3027.96 30 3027.05
ServicesOffice of the Director, Financial Monitoring, Budgeting, Accounting, Purchasing, Human Resources, Facility Expenses,Information Technology Support, Public Information, Vehicle and Equipment Maintenance, Grant Administration, Safety,Customer Service, Inventory Control, Audit/Internal Review, Contract Management
Bold/Italicized Measure = Key Indicator
2012-13 Proposed Budget, Austin, TX
226 | Volume I
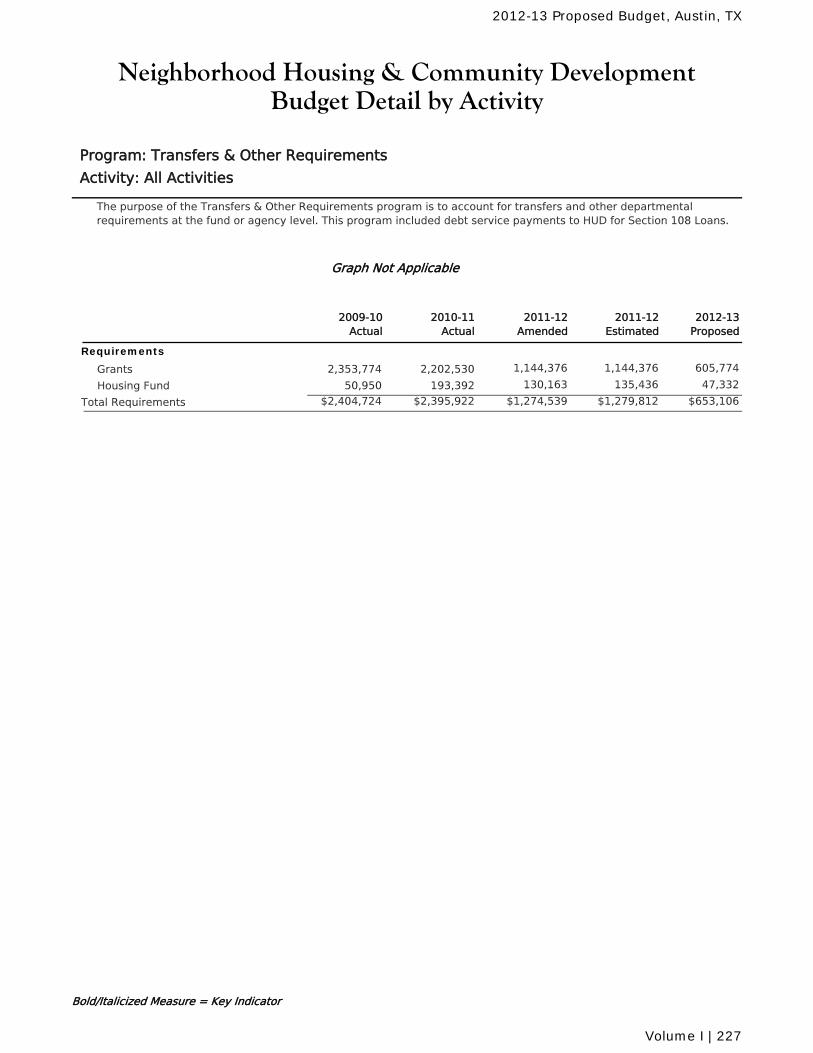
Neighborhood Housing & Community DevelopmentBudget Detail by Activity
Program: Transfers & Other Requirements
Activity: All Activities
The purpose of the Transfers & Other Requirements program is to account for transfers and other departmentalrequirements at the fund or agency level. This program included debt service payments to HUD for Section 108 Loans.
Graph Not Applicable
2011-12Amended
2010-11Actual
2011-12Estimated
2012-13Proposed
2009-10Actual
Requirements
Grants 1,144,376 1,144,376 605,7742,202,5302,353,774
Housing Fund 130,163 135,436 47,332193,39250,950
$1,274,539 $1,279,812 $653,106Total Requirements $2,395,922$2,404,724
Bold/Italicized Measure = Key Indicator
2012-13 Proposed Budget, Austin, TX
Volume I | 227
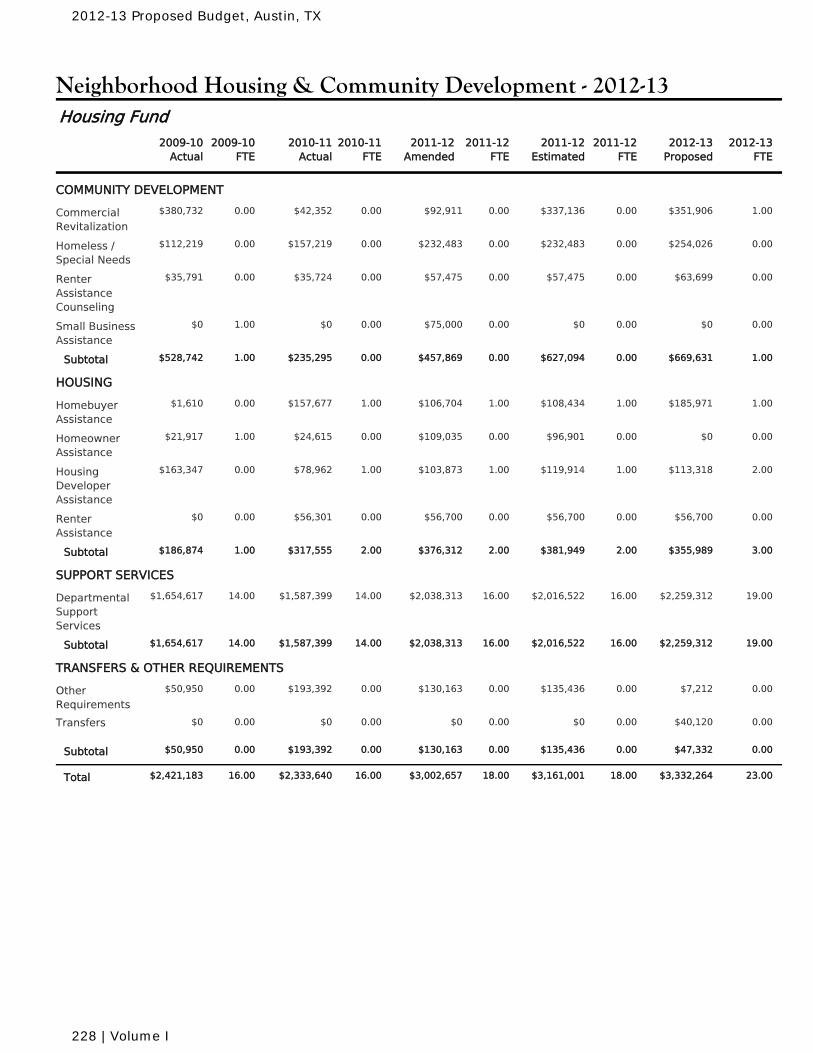
Neighborhood Housing & Community Development - 2012-13
2010-11Actual
2010-11FTE
2011-12Amended
2011-12FTE
2011-12Estimated
2011-12FTE
2009-10Actual
2009-10FTE
2012-13Proposed
2012-13FTE
Housing Fund
COMMUNITY DEVELOPMENT
$42,352 0.00 $92,911 0.00 $337,136 0.00CommercialRevitalization
0.00 $351,906 1.00$380,732
$157,219 0.00 $232,483 0.00 $232,483 0.00Homeless /Special Needs
0.00 $254,026 0.00$112,219
$35,724 0.00 $57,475 0.00 $57,475 0.00RenterAssistanceCounseling
0.00 $63,699 0.00$35,791
$0 0.00 $75,000 0.00 $0 0.00Small BusinessAssistance
1.00 $0 0.00$0
$235,295 0.00 $457,869 0.00 $627,094 0.00Subtotal 1.00 $669,631 1.00$528,742
HOUSING
$157,677 1.00 $106,704 1.00 $108,434 1.00HomebuyerAssistance
0.00 $185,971 1.00$1,610
$24,615 0.00 $109,035 0.00 $96,901 0.00HomeownerAssistance
1.00 $0 0.00$21,917
$78,962 1.00 $103,873 1.00 $119,914 1.00HousingDeveloperAssistance
0.00 $113,318 2.00$163,347
$56,301 0.00 $56,700 0.00 $56,700 0.00RenterAssistance
0.00 $56,700 0.00$0
$317,555 2.00 $376,312 2.00 $381,949 2.00Subtotal 1.00 $355,989 3.00$186,874
SUPPORT SERVICES
$1,587,399 14.00 $2,038,313 16.00 $2,016,522 16.00DepartmentalSupportServices
14.00 $2,259,312 19.00$1,654,617
$1,587,399 14.00 $2,038,313 16.00 $2,016,522 16.00Subtotal 14.00 $2,259,312 19.00$1,654,617
TRANSFERS & OTHER REQUIREMENTS
$193,392 0.00 $130,163 0.00 $135,436 0.00OtherRequirements
0.00 $7,212 0.00$50,950
$0 0.00 $0 0.00 $0 0.00Transfers 0.00 $40,120 0.00$0
$193,392 0.00 $130,163 0.00 $135,436 0.00Subtotal 0.00 $47,332 0.00$50,950
$2,333,640 16.00 $3,002,657 18.00 $3,161,001 18.00Total 16.00 $3,332,264 23.00$2,421,183
2012-13 Proposed Budget, Austin, TX
228 | Volume I
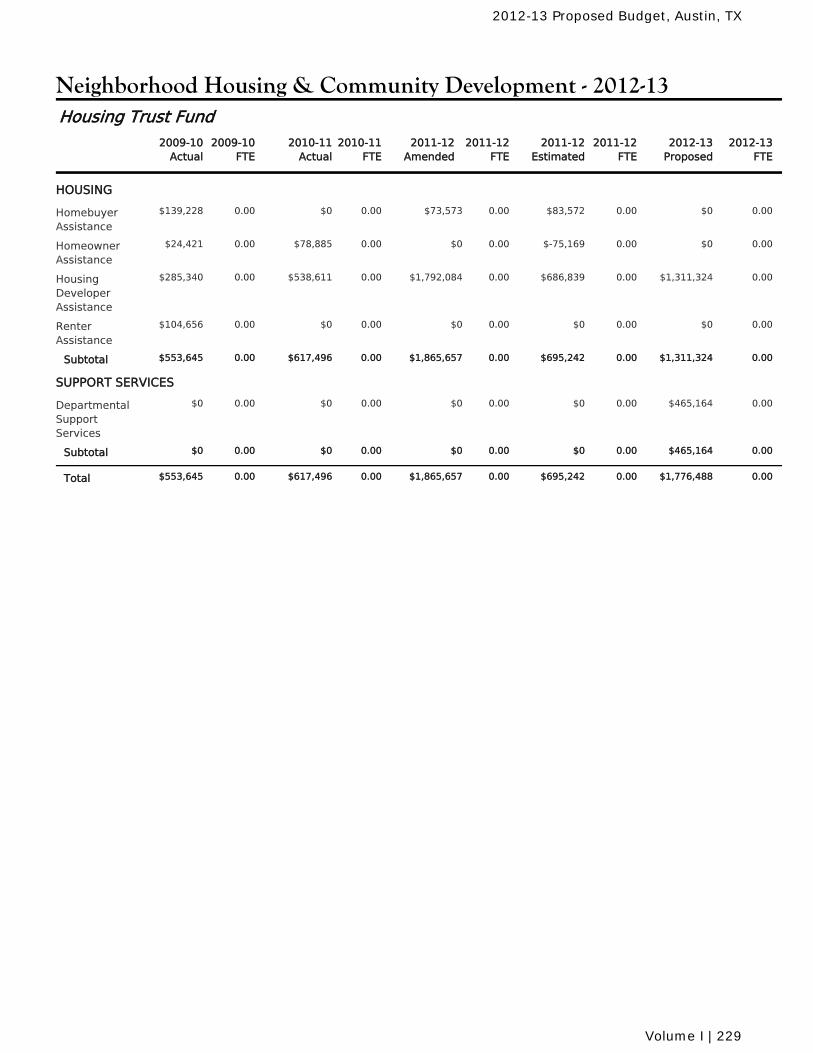
Neighborhood Housing & Community Development - 2012-13
2010-11Actual
2010-11FTE
2011-12Amended
2011-12FTE
2011-12Estimated
2011-12FTE
2009-10Actual
2009-10FTE
2012-13Proposed
2012-13FTE
Housing Trust Fund
HOUSING
$0 0.00 $73,573 0.00 $83,572 0.00HomebuyerAssistance
0.00 $0 0.00$139,228
$78,885 0.00 $0 0.00 $-75,169 0.00HomeownerAssistance
0.00 $0 0.00$24,421
$538,611 0.00 $1,792,084 0.00 $686,839 0.00HousingDeveloperAssistance
0.00 $1,311,324 0.00$285,340
$0 0.00 $0 0.00 $0 0.00RenterAssistance
0.00 $0 0.00$104,656
$617,496 0.00 $1,865,657 0.00 $695,242 0.00Subtotal 0.00 $1,311,324 0.00$553,645
SUPPORT SERVICES
$0 0.00 $0 0.00 $0 0.00DepartmentalSupportServices
0.00 $465,164 0.00$0
$0 0.00 $0 0.00 $0 0.00Subtotal 0.00 $465,164 0.00$0
$617,496 0.00 $1,865,657 0.00 $695,242 0.00Total 0.00 $1,776,488 0.00$553,645
2012-13 Proposed Budget, Austin, TX
Volume I | 229
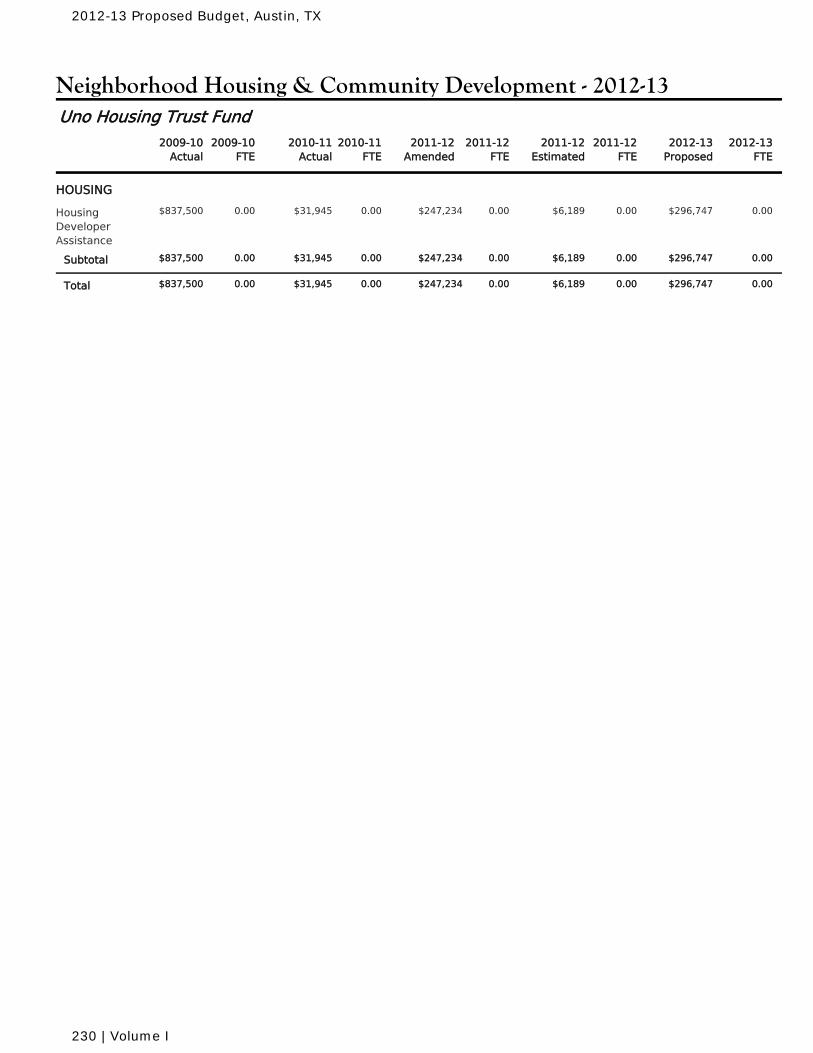
Neighborhood Housing & Community Development - 2012-13
2010-11Actual
2010-11FTE
2011-12Amended
2011-12FTE
2011-12Estimated
2011-12FTE
2009-10Actual
2009-10FTE
2012-13Proposed
2012-13FTE
Uno Housing Trust Fund
HOUSING
$31,945 0.00 $247,234 0.00 $6,189 0.00HousingDeveloperAssistance
0.00 $296,747 0.00$837,500
$31,945 0.00 $247,234 0.00 $6,189 0.00Subtotal 0.00 $296,747 0.00$837,500
$31,945 0.00 $247,234 0.00 $6,189 0.00Total 0.00 $296,747 0.00$837,500
2012-13 Proposed Budget, Austin, TX
230 | Volume I
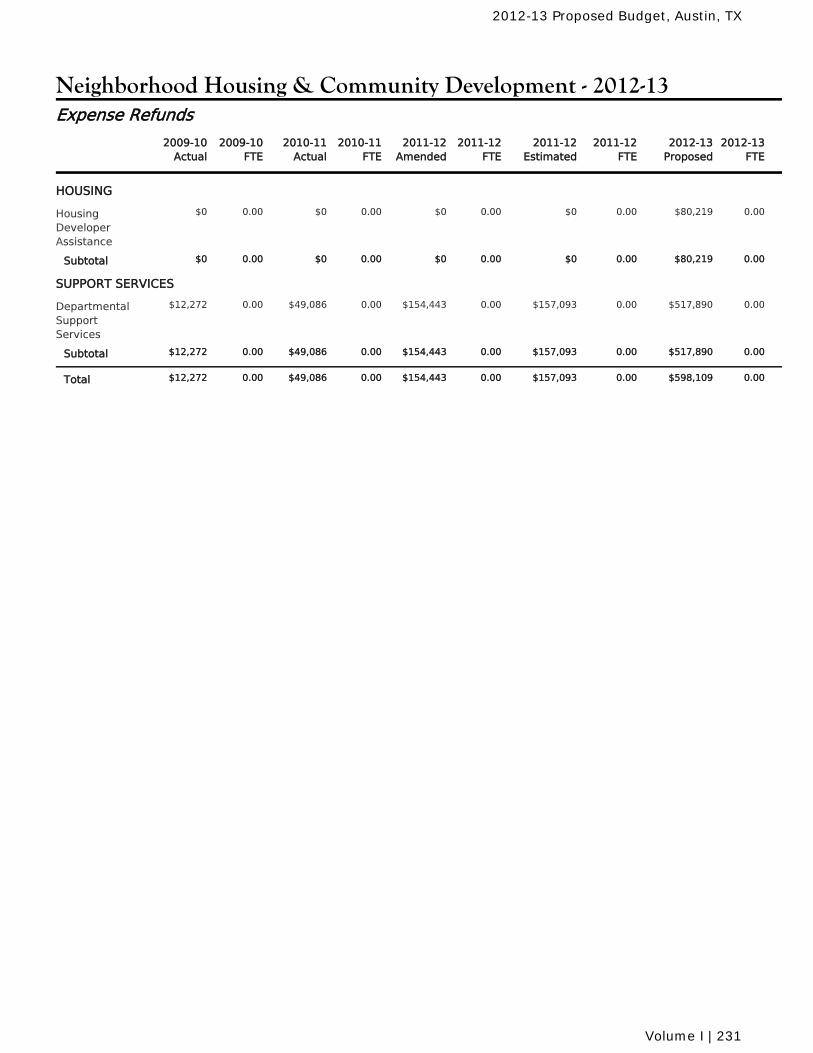
Neighborhood Housing & Community Development - 2012-13
2010-11Actual
2010-11FTE
2011-12Amended
2011-12FTE
2011-12Estimated
2011-12FTE
2009-10Actual
2009-10FTE
2012-13Proposed
2012-13FTE
Expense Refunds
HOUSING
$0 0.00 $0 0.00 $0 0.00HousingDeveloperAssistance
0.00 $80,219 0.00$0
$0 0.00 $0 0.00 $0 0.00Subtotal 0.00 $80,219 0.00$0
SUPPORT SERVICES
$49,086 0.00 $154,443 0.00 $157,093 0.00DepartmentalSupportServices
0.00 $517,890 0.00$12,272
$49,086 0.00 $154,443 0.00 $157,093 0.00Subtotal 0.00 $517,890 0.00$12,272
$49,086 0.00 $154,443 0.00 $157,093 0.00Total 0.00 $598,109 0.00$12,272
2012-13 Proposed Budget, Austin, TX
Volume I | 231
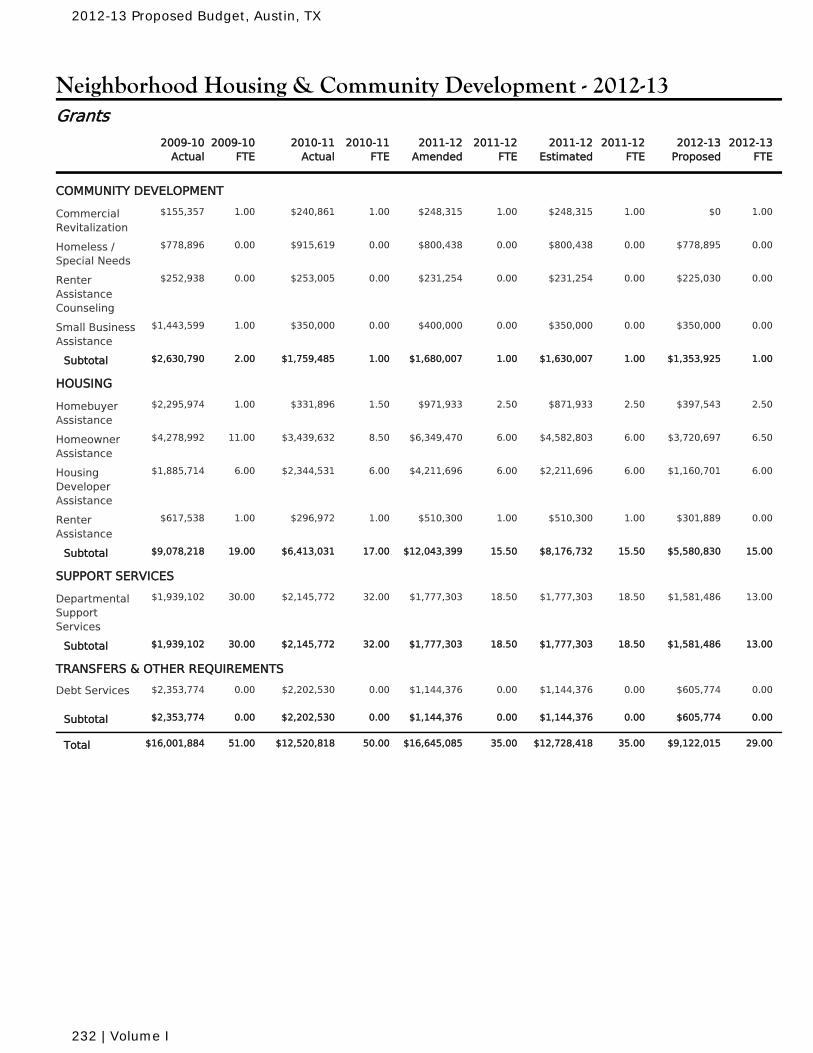
Neighborhood Housing & Community Development - 2012-13
2010-11Actual
2010-11FTE
2011-12Amended
2011-12FTE
2011-12Estimated
2011-12FTE
2009-10Actual
2009-10FTE
2012-13Proposed
2012-13FTE
Grants
COMMUNITY DEVELOPMENT
$240,861 1.00 $248,315 1.00 $248,315 1.00CommercialRevitalization
1.00 $0 1.00$155,357
$915,619 0.00 $800,438 0.00 $800,438 0.00Homeless /Special Needs
0.00 $778,895 0.00$778,896
$253,005 0.00 $231,254 0.00 $231,254 0.00RenterAssistanceCounseling
0.00 $225,030 0.00$252,938
$350,000 0.00 $400,000 0.00 $350,000 0.00Small BusinessAssistance
1.00 $350,000 0.00$1,443,599
$1,759,485 1.00 $1,680,007 1.00 $1,630,007 1.00Subtotal 2.00 $1,353,925 1.00$2,630,790
HOUSING
$331,896 1.50 $971,933 2.50 $871,933 2.50HomebuyerAssistance
1.00 $397,543 2.50$2,295,974
$3,439,632 8.50 $6,349,470 6.00 $4,582,803 6.00HomeownerAssistance
11.00 $3,720,697 6.50$4,278,992
$2,344,531 6.00 $4,211,696 6.00 $2,211,696 6.00HousingDeveloperAssistance
6.00 $1,160,701 6.00$1,885,714
$296,972 1.00 $510,300 1.00 $510,300 1.00RenterAssistance
1.00 $301,889 0.00$617,538
$6,413,031 17.00 $12,043,399 15.50 $8,176,732 15.50Subtotal 19.00 $5,580,830 15.00$9,078,218
SUPPORT SERVICES
$2,145,772 32.00 $1,777,303 18.50 $1,777,303 18.50DepartmentalSupportServices
30.00 $1,581,486 13.00$1,939,102
$2,145,772 32.00 $1,777,303 18.50 $1,777,303 18.50Subtotal 30.00 $1,581,486 13.00$1,939,102
TRANSFERS & OTHER REQUIREMENTS
$2,202,530 0.00 $1,144,376 0.00 $1,144,376 0.00Debt Services 0.00 $605,774 0.00$2,353,774
$2,202,530 0.00 $1,144,376 0.00 $1,144,376 0.00Subtotal 0.00 $605,774 0.00$2,353,774
$12,520,818 50.00 $16,645,085 35.00 $12,728,418 35.00Total 51.00 $9,122,015 29.00$16,001,884
2012-13 Proposed Budget, Austin, TX
232 | Volume I
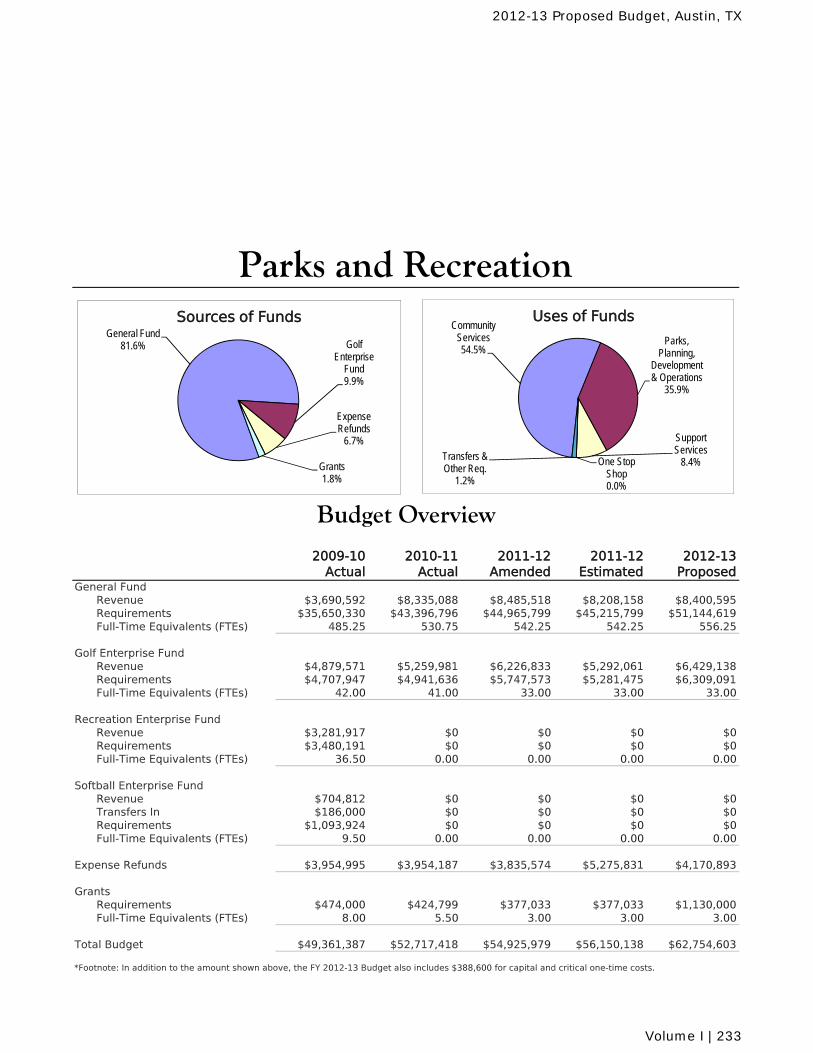
2009-10 Actual
2010-11 Actual
2011-12 Amended
2011-12 Estimated
2012-13 Proposed
General FundRevenue $3,690,592 $8,335,088 $8,485,518 $8,208,158 $8,400,595Requirements $35,650,330 $43,396,796 $44,965,799 $45,215,799 $51,144,619Full-Time Equivalents (FTEs) 485.25 530.75 542.25 542.25 556.25
Golf Enterprise FundRevenue $4,879,571 $5,259,981 $6,226,833 $5,292,061 $6,429,138Requirements $4,707,947 $4,941,636 $5,747,573 $5,281,475 $6,309,091Full-Time Equivalents (FTEs) 42.00 41.00 33.00 33.00 33.00
Recreation Enterprise FundRevenue $3,281,917 $0 $0 $0 $0Requirements $3,480,191 $0 $0 $0 $0Full-Time Equivalents (FTEs) 36.50 0.00 0.00 0.00 0.00
Softball Enterprise FundRevenue $704,812 $0 $0 $0 $0Transfers In $186,000 $0 $0 $0 $0Requirements $1,093,924 $0 $0 $0 $0Full-Time Equivalents (FTEs) 9.50 0.00 0.00 0.00 0.00
Expense Refunds $3,954,995 $3,954,187 $3,835,574 $5,275,831 $4,170,893
GrantsRequirements $474,000 $424,799 $377,033 $377,033 $1,130,000Full-Time Equivalents (FTEs) 8.00 5.50 3.00 3.00 3.00
Total Budget $49,361,387 $52,717,418 $54,925,979 $56,150,138 $62,754,603
*Footnote: In addition to the amount shown above, the FY 2012-13 Budget also includes $388,600 for capital and critical one-time costs.
Budget Overview
Parks and Recreation
General Fund81.6%
Golf Enterprise Fund
10.0%
Expense Refunds
6.7%
Grants1.8%
Sources of Funds
Community Services55.1%
Parks, Planning,
Development & Operations
36.3%
Support Services
8.5%One Stop Shop
0.0%
Uses of FundsGeneral Fund
81.6% Golf Enterprise
Fund9.9%
Expense Refunds
6.7%
Grants1.8%
Sources of FundsCommunity
Services54.5%
Parks, Planning,
Development & Operations
35.9%
Support Services
8.4%One Stop Shop0.0%
Transfers & Other Req.
1.2%
Uses of Funds
2012-13 Proposed Budget, Austin, TX
Volume I | 233
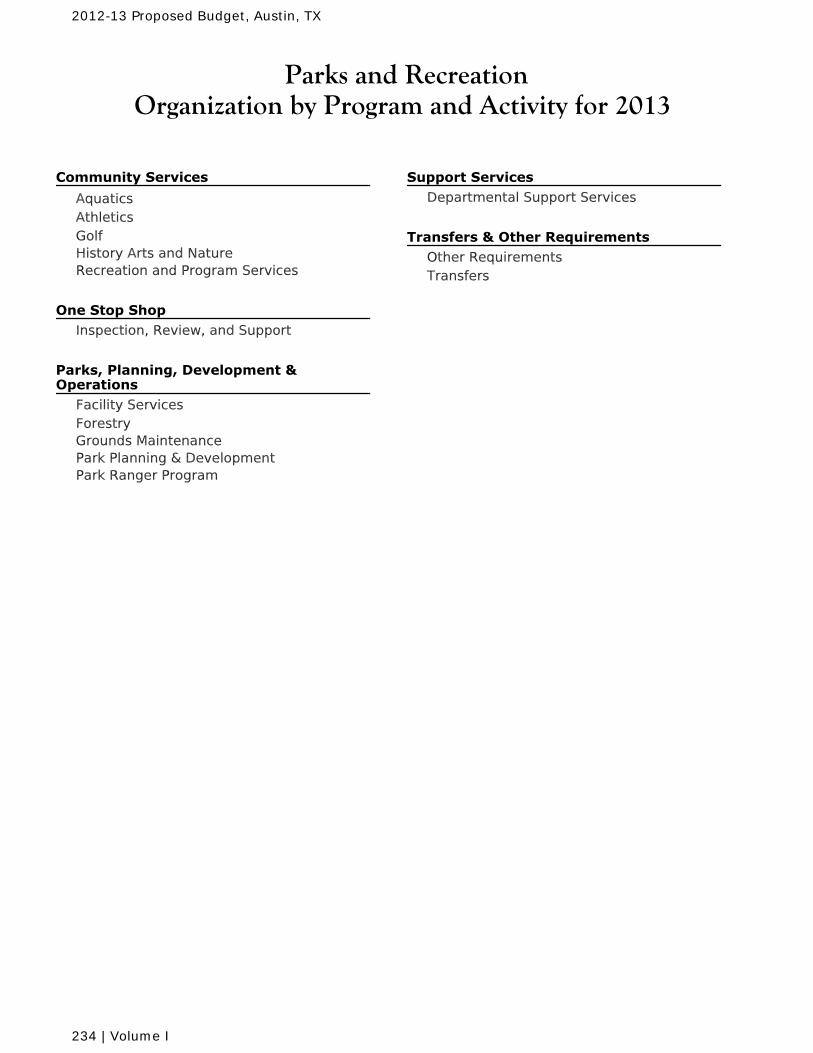
Parks and RecreationOrganization by Program and Activity for 2013
Community Services AquaticsAthleticsGolfHistory Arts and NatureRecreation and Program Services
One Stop Shop Inspection, Review, and Support
Parks, Planning, Development &Operations
Facility ServicesForestryGrounds MaintenancePark Planning & DevelopmentPark Ranger Program
Support Services Departmental Support Services
Transfers & Other Requirements Other RequirementsTransfers
2012-13 Proposed Budget, Austin, TX
234 | Volume I
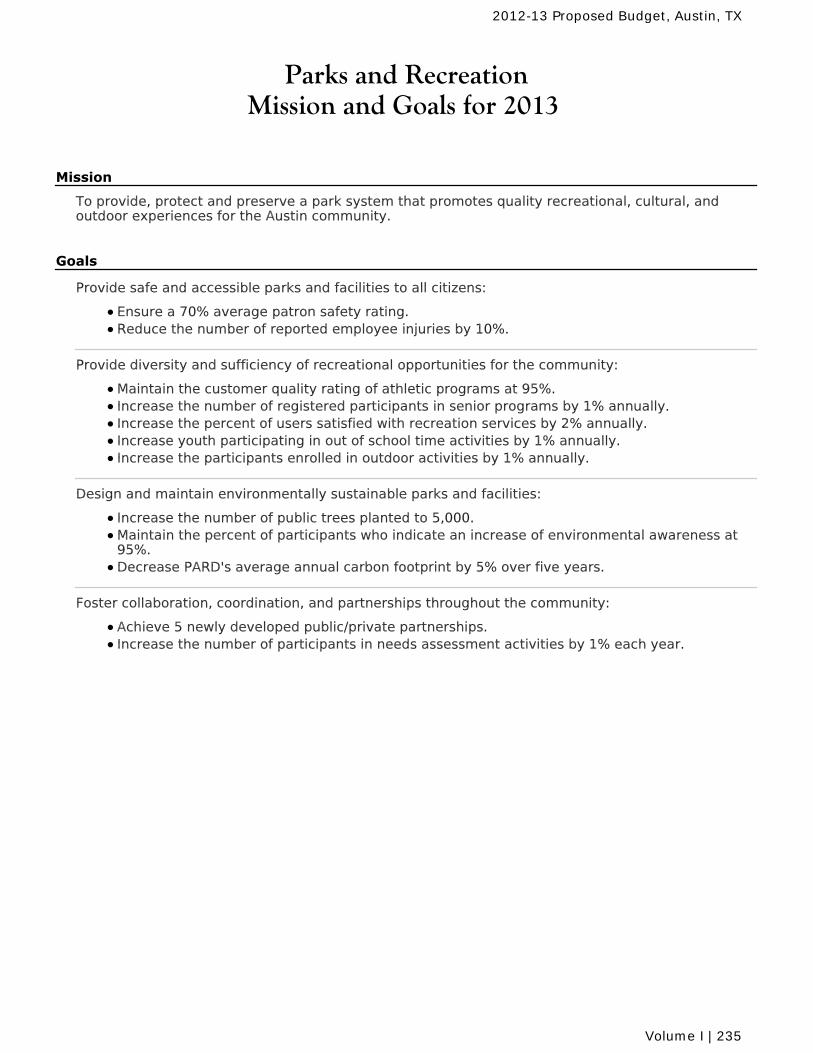
Parks and RecreationMission and Goals for 2013
Mission
To provide, protect and preserve a park system that promotes quality recreational, cultural, andoutdoor experiences for the Austin community.
Goals
Provide safe and accessible parks and facilities to all citizens:
Ensure a 70% average patron safety rating.Reduce the number of reported employee injuries by 10%.
Provide diversity and sufficiency of recreational opportunities for the community:
Maintain the customer quality rating of athletic programs at 95%. Increase the number of registered participants in senior programs by 1% annually. Increase the percent of users satisfied with recreation services by 2% annually. Increase youth participating in out of school time activities by 1% annually. Increase the participants enrolled in outdoor activities by 1% annually.
Design and maintain environmentally sustainable parks and facilities:
Increase the number of public trees planted to 5,000.Maintain the percent of participants who indicate an increase of environmental awareness at95%.Decrease PARD's average annual carbon footprint by 5% over five years.
Foster collaboration, coordination, and partnerships throughout the community:
Achieve 5 newly developed public/private partnerships. Increase the number of participants in needs assessment activities by 1% each year.
2012-13 Proposed Budget, Austin, TX
Volume I | 235
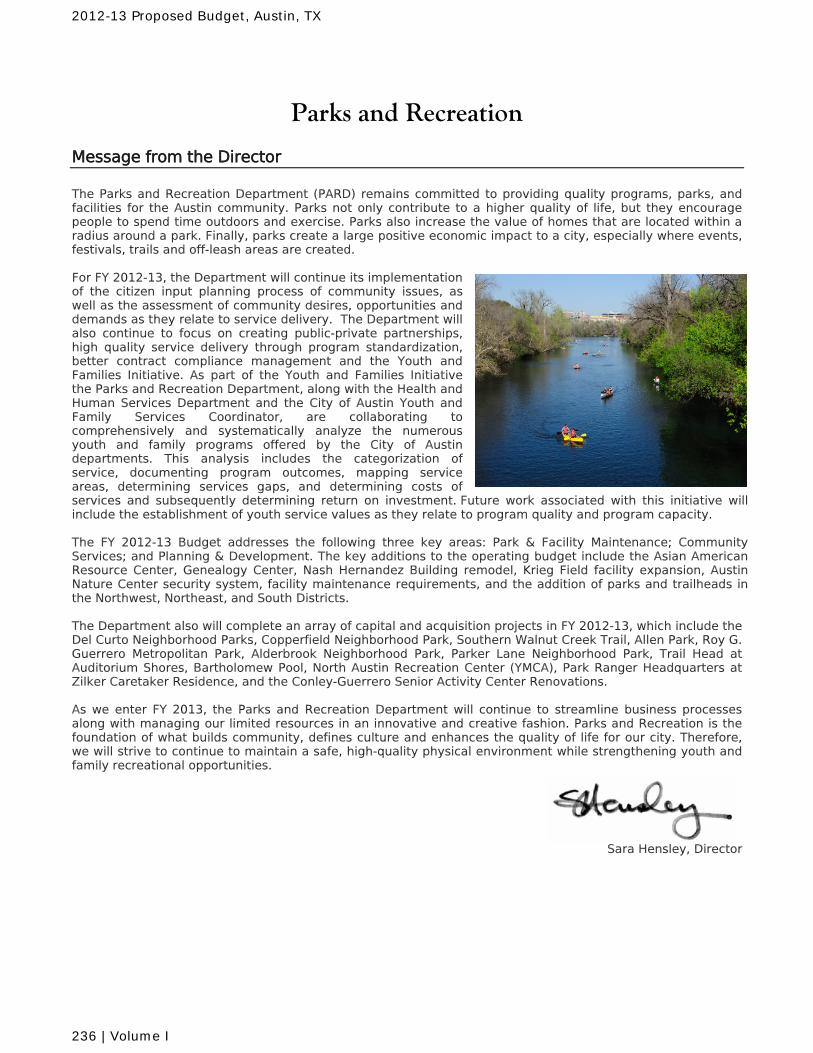
Parks and Recreation
Message from the Director
The Parks and Recreation Department (PARD) remains committed to providing quality programs, parks, and facilities for the Austin community. Parks not only contribute to a higher quality of life, but they encourage people to spend time outdoors and exercise. Parks also increase the value of homes that are located within a radius around a park. Finally, parks create a large positive economic impact to a city, especially where events, festivals, trails and off-leash areas are created. For FY 2012-13, the Department will continue its implementation of the citizen input planning process of community issues, as well as the assessment of community desires, opportunities and demands as they relate to service delivery. The Department will also continue to focus on creating public-private partnerships, high quality service delivery through program standardization, better contract compliance management and the Youth and Families Initiative. As part of the Youth and Families Initiative the Parks and Recreation Department, along with the Health and Human Services Department and the City of Austin Youth and Family Services Coordinator, are collaborating to comprehensively and systematically analyze the numerous youth and family programs offered by the City of Austin departments. This analysis includes the categorization of service, documenting program outcomes, mapping service areas, determining services gaps, and determining costs of services and subsequently determining return on investment. Future work associated with this initiative will include the establishment of youth service values as they relate to program quality and program capacity. The FY 2012-13 Budget addresses the following three key areas: Park & Facility Maintenance; Community Services; and Planning & Development. The key additions to the operating budget include the Asian American Resource Center, Genealogy Center, Nash Hernandez Building remodel, Krieg Field facility expansion, Austin Nature Center security system, facility maintenance requirements, and the addition of parks and trailheads in the Northwest, Northeast, and South Districts. The Department also will complete an array of capital and acquisition projects in FY 2012-13, which include the Del Curto Neighborhood Parks, Copperfield Neighborhood Park, Southern Walnut Creek Trail, Allen Park, Roy G. Guerrero Metropolitan Park, Alderbrook Neighborhood Park, Parker Lane Neighborhood Park, Trail Head at Auditorium Shores, Bartholomew Pool, North Austin Recreation Center (YMCA), Park Ranger Headquarters at Zilker Caretaker Residence, and the Conley-Guerrero Senior Activity Center Renovations. As we enter FY 2013, the Parks and Recreation Department will continue to streamline business processes along with managing our limited resources in an innovative and creative fashion. Parks and Recreation is the foundation of what builds community, defines culture and enhances the quality of life for our city. Therefore, we will strive to continue to maintain a safe, high-quality physical environment while strengthening youth and family recreational opportunities.
Sara Hensley, Director
2012-13 Proposed Budget, Austin, TX
236 | Volume I
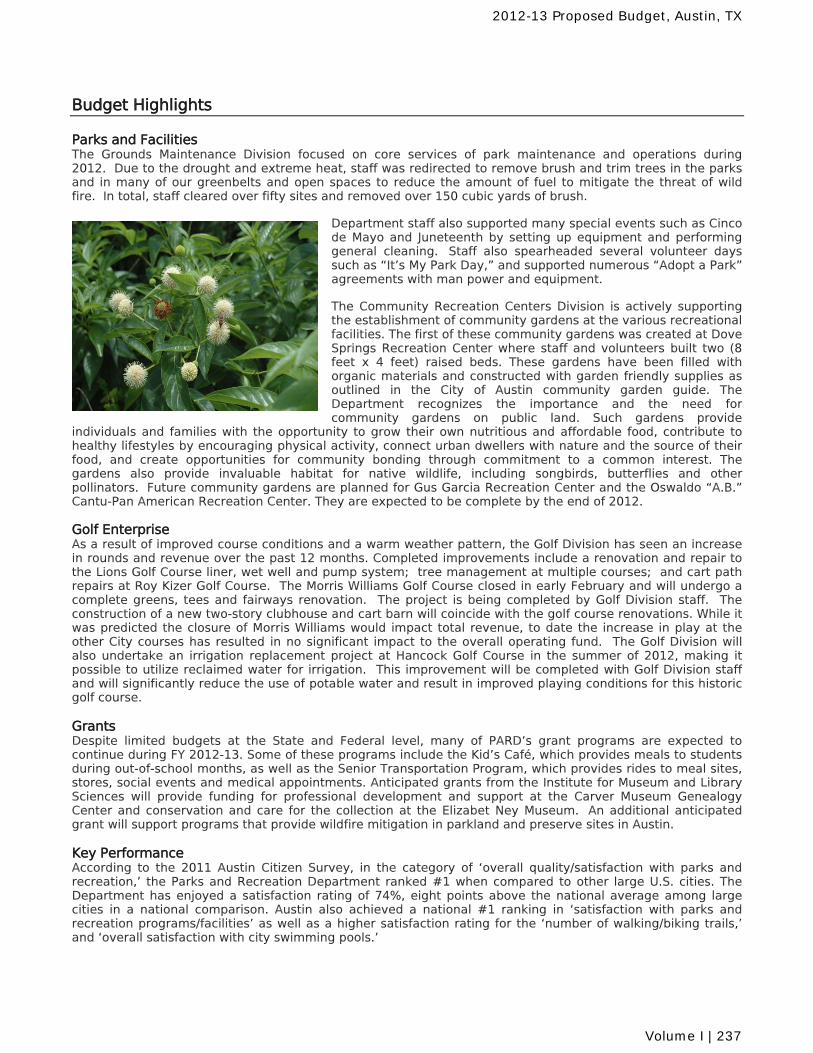
Budget Highlights Parks and Facilities The Grounds Maintenance Division focused on core services of park maintenance and operations during 2012. Due to the drought and extreme heat, staff was redirected to remove brush and trim trees in the parks and in many of our greenbelts and open spaces to reduce the amount of fuel to mitigate the threat of wild fire. In total, staff cleared over fifty sites and removed over 150 cubic yards of brush.
Department staff also supported many special events such as Cinco de Mayo and Juneteenth by setting up equipment and performing general cleaning. Staff also spearheaded several volunteer days such as “It’s My Park Day,” and supported numerous “Adopt a Park” agreements with man power and equipment.
The Community Recreation Centers Division is actively supporting the establishment of community gardens at the various recreational facilities. The first of these community gardens was created at Dove Springs Recreation Center where staff and volunteers built two (8 feet x 4 feet) raised beds. These gardens have been filled with organic materials and constructed with garden friendly supplies as outlined in the City of Austin community garden guide. The Department recognizes the importance and the need for community gardens on public land. Such gardens provide
individuals and families with the opportunity to grow their own nutritious and affordable food, contribute to healthy lifestyles by encouraging physical activity, connect urban dwellers with nature and the source of their food, and create opportunities for community bonding through commitment to a common interest. The gardens also provide invaluable habitat for native wildlife, including songbirds, butterflies and other pollinators. Future community gardens are planned for Gus Garcia Recreation Center and the Oswaldo “A.B.” Cantu-Pan American Recreation Center. They are expected to be complete by the end of 2012.
Golf Enterprise As a result of improved course conditions and a warm weather pattern, the Golf Division has seen an increase in rounds and revenue over the past 12 months. Completed improvements include a renovation and repair to the Lions Golf Course liner, wet well and pump system; tree management at multiple courses; and cart path repairs at Roy Kizer Golf Course. The Morris Williams Golf Course closed in early February and will undergo a complete greens, tees and fairways renovation. The project is being completed by Golf Division staff. The construction of a new two-story clubhouse and cart barn will coincide with the golf course renovations. While it was predicted the closure of Morris Williams would impact total revenue, to date the increase in play at the other City courses has resulted in no significant impact to the overall operating fund. The Golf Division will also undertake an irrigation replacement project at Hancock Golf Course in the summer of 2012, making it possible to utilize reclaimed water for irrigation. This improvement will be completed with Golf Division staff and will significantly reduce the use of potable water and result in improved playing conditions for this historic golf course. Grants Despite limited budgets at the State and Federal level, many of PARD’s grant programs are expected to continue during FY 2012-13. Some of these programs include the Kid’s Café, which provides meals to students during out-of-school months, as well as the Senior Transportation Program, which provides rides to meal sites, stores, social events and medical appointments. Anticipated grants from the Institute for Museum and Library Sciences will provide funding for professional development and support at the Carver Museum Genealogy Center and conservation and care for the collection at the Elizabet Ney Museum. An additional anticipated grant will support programs that provide wildfire mitigation in parkland and preserve sites in Austin. Key Performance According to the 2011 Austin Citizen Survey, in the category of ‘overall quality/satisfaction with parks and recreation,’ the Parks and Recreation Department ranked #1 when compared to other large U.S. cities. The Department has enjoyed a satisfaction rating of 74%, eight points above the national average among large cities in a national comparison. Austin also achieved a national #1 ranking in ‘satisfaction with parks and recreation programs/facilities’ as well as a higher satisfaction rating for the ‘number of walking/biking trails,’ and ‘overall satisfaction with city swimming pools.’
2012-13 Proposed Budget, Austin, TX
Volume I | 237
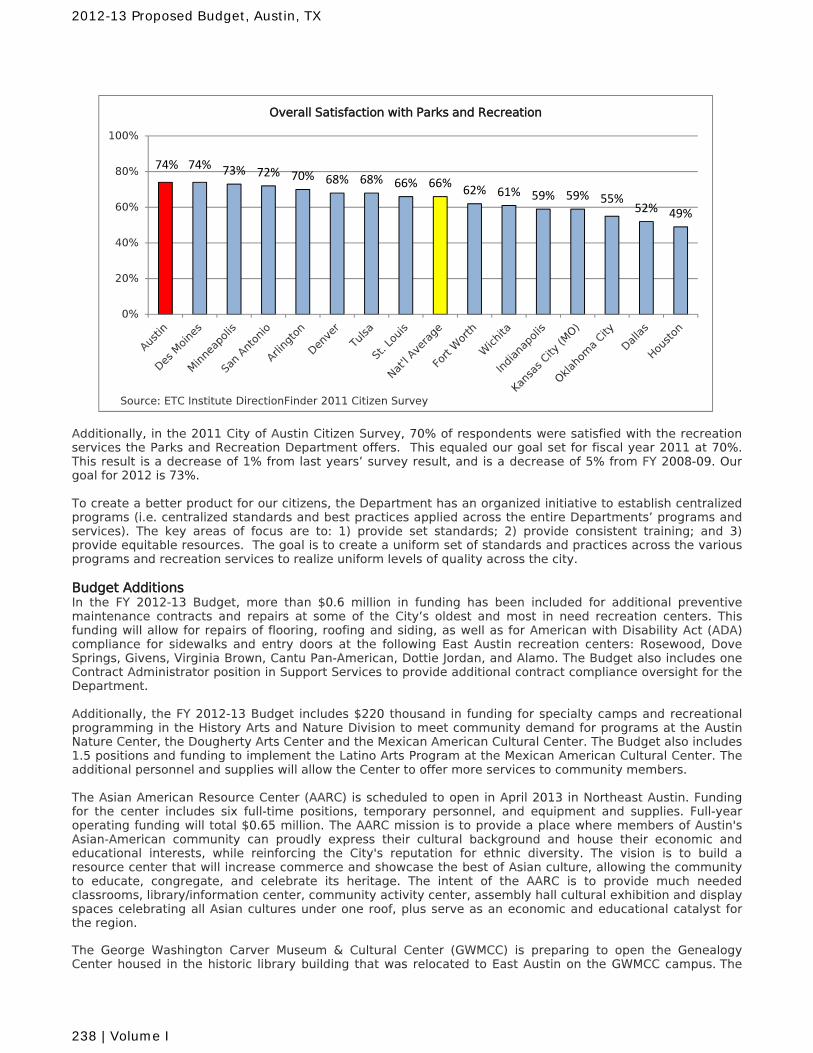
Additionally, in the 2011 City of Austin Citizen Survey, 70% of respondents were satisfied with the recreation services the Parks and Recreation Department offers. This equaled our goal set for fiscal year 2011 at 70%. This result is a decrease of 1% from last years’ survey result, and is a decrease of 5% from FY 2008-09. Our goal for 2012 is 73%. To create a better product for our citizens, the Department has an organized initiative to establish centralized programs (i.e. centralized standards and best practices applied across the entire Departments’ programs and services). The key areas of focus are to: 1) provide set standards; 2) provide consistent training; and 3) provide equitable resources. The goal is to create a uniform set of standards and practices across the various programs and recreation services to realize uniform levels of quality across the city. Budget Additions In the FY 2012-13 Budget, more than $0.6 million in funding has been included for additional preventive maintenance contracts and repairs at some of the City’s oldest and most in need recreation centers. This funding will allow for repairs of flooring, roofing and siding, as well as for American with Disability Act (ADA) compliance for sidewalks and entry doors at the following East Austin recreation centers: Rosewood, Dove Springs, Givens, Virginia Brown, Cantu Pan-American, Dottie Jordan, and Alamo. The Budget also includes one Contract Administrator position in Support Services to provide additional contract compliance oversight for the Department. Additionally, the FY 2012-13 Budget includes $220 thousand in funding for specialty camps and recreational programming in the History Arts and Nature Division to meet community demand for programs at the Austin Nature Center, the Dougherty Arts Center and the Mexican American Cultural Center. The Budget also includes 1.5 positions and funding to implement the Latino Arts Program at the Mexican American Cultural Center. The additional personnel and supplies will allow the Center to offer more services to community members. The Asian American Resource Center (AARC) is scheduled to open in April 2013 in Northeast Austin. Funding for the center includes six full-time positions, temporary personnel, and equipment and supplies. Full-year operating funding will total $0.65 million. The AARC mission is to provide a place where members of Austin's Asian-American community can proudly express their cultural background and house their economic and educational interests, while reinforcing the City's reputation for ethnic diversity. The vision is to build a resource center that will increase commerce and showcase the best of Asian culture, allowing the community to educate, congregate, and celebrate its heritage. The intent of the AARC is to provide much needed classrooms, library/information center, community activity center, assembly hall cultural exhibition and display spaces celebrating all Asian cultures under one roof, plus serve as an economic and educational catalyst for the region.
The George Washington Carver Museum & Cultural Center (GWMCC) is preparing to open the Genealogy Center housed in the historic library building that was relocated to East Austin on the GWMCC campus. The
74% 74% 73% 72% 70% 68% 68% 66% 66%62% 61% 59% 59% 55%
52% 49%
0%
20%
40%
60%
80%
100%
Overall Satisfaction with Parks and Recreation
Source: ETC Institute DirectionFinder 2011 Citizen Survey
2012-13 Proposed Budget, Austin, TX
238 | Volume I
$150 thousand operating budget funds 1.5 full-time positions and supplies. It will serve as the physical resource to the community on genealogy research and preservation focusing on, but not limited to, persons of African descent. The Center will be a portal of comprehensive information and resource of reference materials on the history of persons of African descent. The Center will serve as a place to explore, excite and educate the importance of your ancestral linkage. It will also be a place to network, preserve, and celebrate community heritage. It will be open to anyone seeking to learn more about whom they are and where they came from. It will have programming that will focus on seniors and the intergenerational experiences.
The Nash Hernandez facility located in Central East Austin is a City-owned building that was formerly occupied by the Austin Fire Department and Labor Relations. Once completed, the renovated building will house the Aquatics and Program Administrative staff for PARD. The FY 2012-13 Budget includes funding for several new or expanded park areas:
Alderbrook (Lamplight) Park is a 2-acre park acquired with 2006 Bond funds for the infill park acquisition and development plan. Services include trails, picnic areas, and restrooms.
South Walnut Creek Park and Trailheads are located from Jonny Morris Road/Daffan Lane to Govalle Neighborhood Park. This 7-mile creek system is one of the longest in the Austin area with numerous parks along its banks. The objective is to link these spaces into a contiguous greenway trail system.
Allen Park is a 15-acre site acquired from Travis County. The City will take over operations of the park
in October 2012.
The expansion of services to the Yett Creek Park will include a 40-acre dog park, trail, and picnic area.
Del Curto is a 2-acre park which has been enhanced to include a playscape, picnic area, walking trails, drinking fountains, and basketball courts.
Parker Lane is a 2-acre high profile park that was acquired in 2012 with 2006 Bond funds for infill park
acquisition and development. Amenities include trails, picnic areas, and playgrounds.
FM 969 (John Trevino Jr. Metro Park at Morrison Ranch) is a former cattle ranch that was purchased to acquire land along the Colorado River for preservation and recreational purposes.
Copperfield Neighborhood Park is a 9-acre park which occupies a portion of tracts that make up the
Walnut Creek Greenbelt. Capital Budget and One-Time Critical Equipment In April 2012, the Trail Foundation completed the renovation of Johnson Creek to give it the beauty and functionality that the trail and its enthusiasts deserve. This project is a high-priority multiphase enhancement because it is a key gathering place and a major trailhead. Auditorium Shores and Butler Park at Town Lake Metropolitan Park plan will be moving into phases 3 and 4 of construction. Plans include a new trailhead, new restroom facilities, workout areas, parking expansion and gazebo/pavilion. In addition, a replacement off-leash area will be built on the west end of Auditorium Shores. Amenities will include play areas, water access and mulched areas.
The Aquatic Division accomplished major renovations to the historic Deep Eddy Pool in 2012. Deep Eddy Pool was constructed nearly 100 years ago and until this year, has only received minor repair work. By hosting several community meetings and gathering stakeholder input, a design for the facility was developed. The facility was reopened in time for the summer season and has been enjoyed by many residents and visitors. The Aquatic Division also completed the renovation of Rosewood Pool. Rosewood pool was constructed in 1932 and received a major facelift which includes the replacement of the pool deck, return lines, and tiles. Additionally, the Aquatic Division worked diligently to ensure that all swimming pools were upgraded with ADA access. The FY 2012-13 Capital Budget includes a spending plan of $28.8 million, the majority of which is from the City’s 2006 Bond Program. This spending includes improvements to the Conley-Guerrero Senior Activity Center, renovation of Bartholomew pool, trail improvements near the Shoal Creek Greenbelt, a new playscape at Dove Springs Park and many other projects. There is also a capital grant from the Texas Parks and Wildlife Urban Outdoor Recreation program for $1 million for improvements at Auditorium Shores. The Budget also includes $388,600 for one-time critical equipment including vehicles and brush chippers for park maintenance, recreational equipment for facilities, and furniture and fixtures for the Asian American Resource Center.
2012-13 Proposed Budget, Austin, TX
Volume I | 239
General Fund
Revenue Changes Dollars
The Budget includes a $109,356 decrease in revenue from the elimination of theTrail of Lights 5K Run; a $71,181 decrease in Softball slow pitch league andSoftball field rental play, and a $98,913 decrease in PARD registration fees andvarious other charges. PARD expects an increase in revenue of $194,527 fromfacility rentals, entry fees, and boat concession sales. ($84,923)
Expenditure Changes FTEs Dollars
CitywideThe Budget includes $765,026 for salary increases associated with employee wageadjustments in FY 2013. An additional $168,790 is included in the Budget forincreased City contributions for health insurance. $933,816
The Budget includes additional funding for the Employees' Retirement System thatis equivalent to 2% of payroll for non-civil service employees to help improve thefunded status of the pension system. This amount also includes a budgetreallocation from the fund level to the department level. $2,222,762 The Budget includes $648,324 for wage adjustments associated withimplementing the City's recently completed market study. $648,324
There is a decrease of $15,296 for fuel and an increase of $213,599 for vehiclemaintenance. $198,303
Community ServicesThere is a decrease of one-time costs from FY 2012 for PARD's portion of the St.John Community Center Maintenance Interlocal Agreement with AustinIndependent School District. ($10,137)
Full-year funding is added for contractuals and commodities needed formaintenance and turf management at the Krieg Field expansion including seeding,fertilization, sodding, and field preparation for 11 newly-renovated softball fields, 4newly-added volleyball fields and 1 new multipurpose field. $15,000
The Budget includes partial-year funding for 6 positions to staff the new AsianAmerican Resource Center slated to open in April 2013. Three Cultural Artspositions are needed for the facility that includes a language book library,classrooms, activity center, and cultural exhibition space. Also added is an EventCoordinator, an Administrative Specialist, and a Building Grounds Assistant,funding for temporary employees and for commodities and contractuals to run thecenter. 6.00 $493,925
The Budget also includes funding for the installation and annual maintenance of anew fire protection and security system for the Austin Nature Center WildlifeBuilding. $4,200
Funding is allocated for staffing the Genealogy Center in the newly-renovatedhistoric building at the Carver property, slated to open January 2013. Full-yearfunding includes a Museum Site Coordinator, an Administrative Specialist andrelated commodities and contractuals. 2.00 $149,593
The Budget also includes full-year funding for Phase I implementation of the LatinoArts Residency program at the Mexican American Cultural Center. One CulturalArts Coordinator and a par-time Exhibit Specialist are included, as well as fundingfor supplies. 1.50 $138,581
Significant ChangesParks and Recreation
2012-13 Proposed Budget, Austin, TX
240 | Volume I
Expenditure Changes FTEs Dollars
The Budget includes additional funding for the History Arts and Nature Division tobring specialty programming up to demand levels at the Austin Nature Center, theDougherty Arts Center and the Mexican American Cultural Center. Fundingincludes temporary personnel and supplies. $219,650
Additional funding is required in the Aquatics Division for pool operations,including chemicals and utilities. $37,500
PARD is renovating the Nash Hernandez building to house Aquatics and Programadministrative staff. Funding is required for a part-time Building and GroundsAssistant for 11 pay periods. Commodities and contractuals are also needed tosupply and service the facility. 0.50 $40,732
The Budget includes $20,000 for wages for temporary employees to staff the newmultipurpose facility addition at Turner Roberts Recreation Center. $20,000
Midnight Basketball is increasing $40,000 to expand the program from eightmonths to year-round. $40,000
Parks, Planning, Development & OperationsThe Northwest District Parks Grounds Maintenance requires the addition of twoParks Grounds Assistant positions along with commodities and contractuals tomaintain new amenities including 8 miles of Southern Walnut Creek Trail andtrailheads, 2 acres at Alderbrook Park, 15 acres at Allen Park and the addition ofan off-leash dog area at Yett Creek Park. 2.00 $189,993
The South District Parks Grounds Maintenance requires the addition of one ParksGrounds Assistant position along with commodities and contractuals to maintainnew amenities at a 2-acre pocket park at Parker Lane and another 2-acre pocketpark at Del Curto. The increase includes maintenance of walking trails, picnicareas, playgrounds, basketball courts, restrooms, drinking fountains, as well astrash removal, mowing, and tree care. 1.00 $76,534
The Northeast District Parks Grounds Maintenance requires the addition of oneParks Grounds Assistant position along with commodities and contractuals tomaintain new amenities for a 65-acre park located near FM 969, and the 9-acreCopperfield Park. Includes maintenance of trails, picnic areas, playgrounds, multi-purpose fields, restrooms, drinking fountains, parking lot, mowing, and tree care. 1.00 $82,584
Increased funding is required on existing City contracts for maintenance of parkfacilities. Funding will cover increased costs for inspections and maintenancewhich is required by adoption of State and local code requirements. These include$12,938 for backflow prevention inspection, $10,990 for electrical systemsinspection, $78,000 for fire protection systems inspection, and $50,000 for boilerinspections and maintenance. $151,928
Additional funding for facility maintenance and repair contracts is included forsome of the City's oldest recreation centers in East Austin. Rosewood $123,000;Dove Springs $55,000; Givens $145,000; Virginia Brown $40,000; Cantu Pan-American $45,000; Dottie Jordan $20,000; Alamo $50,000; and $22,000 forpermits and fees. $500,000
The Budget includes the annualized cost of adding 1 Landscape Architect II forcommunity projects in an FY 2011-12 budget amendment from the dais. $25,966
The Budget also includes an increase for purchase of lake buoys and signs for lakeareas. $5,000
The Budget includes a reduction in rent at the Rutherford Lane facility. ($7,539)
Support Services
One System Support Technician position is being transferred from PARD toCommunications and Technology Management. (1.00) ($85,932)
2012-13 Proposed Budget, Austin, TX
Volume I | 241
Expenditure Changes FTEs Dollars
One Contract Administrator is added to the Budget for enhancing contractcompliance. 1.00 $88,037
Golf Enterprise Fund
Revenue Changes Dollars
The Budget includes an increase in revenue from the following sources: anincrease of $94,049 in Golf green fees from various facilities; an increase of$48,980 from food concessions; an increase of $29,711 from various othercharges; an increase of $21,553 from Golf cart rentals; an increase of $10,149from range sales; an increase of $8,979 from athletic sales; an increase of $2,084from muni lease fee surcharge; an increase of $1,704 in PARD annual fees, and adecrease of $14,904 in other concession sales. $202,305
Expenditure Changes FTEs Dollars
CitywideThe Budget includes $48,832 for salary increases associated with wageadjustments in FY 2013. An additional $10,131 is included in the Budget forincreased City contributions for health insurance. $58,963
The Budget includes an increase of $30,381 for fuel and a decrease of $2,677 forvehicle maintenance. $27,704
The Budget includes additional funding for the Employees' Retirement System thatis equivalent to 2% of payroll for non-civil service employees to help improve thefunded status of the pension system. $15,745
The Budget includes $23,890 for wage adjustments associated with implementingthe City's recently completed market study. $23,890
GolfThe Budget includes $56,000 for pay increases for temporary employees at theClay Kizer Pro Shop to align with the Golf industry. Additional revenue generatedwill help sustain the increase in temporary payroll. $56,000
The Budget also includes $139,920 for operations of the Hancock Pro Shop. TheGolf Division assumed the daily operations of the pro shop in February 2012. $139,920
Due to an increase in the rate of reclaimed water, the Budget includes $12,000 atJimmy Clay and Roy Kizer Golf Courses. $12,000
To help maintain a high quality golf course for the public, the Budget also includes$108,800 for temporary employees to assist in maintaining the 200-acre MorrisWilliams Golf Course including mowing, aerification, fertilization, weed control, andmanicuring the golf course. $108,700
The Budget includes $18,000 for pay increases for temporary employees at theMorris Williams Pro Shop to align with Golf industry. Revenue generated will helpsustain the increase in temporary payroll. $18,000
Transfers and Other RequirementsThe transfer to the Communications and Technology Management Fund isdecreasing by $35,257 in FY 2012-13. ($35,257)
The Budget includes an increase of $2,185 for Administrative Support Services, adecrease of $2,286 for Workers Compensation, and an increase of $6,151 forAccrued Payroll. $6,050
There is an increase of $129,721 to repay debt used to purchase approximately300 replacement Golf carts. $129,721
2012-13 Proposed Budget, Austin, TX
242 | Volume I
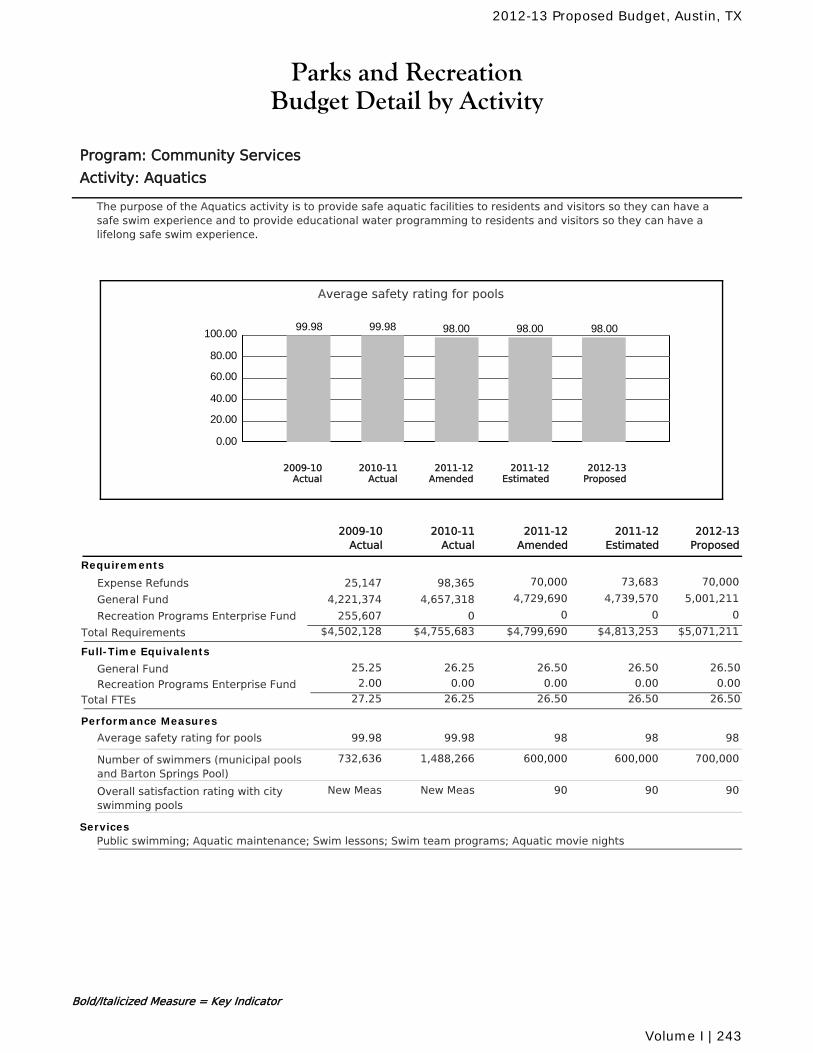
Parks and RecreationBudget Detail by Activity
Program: Community Services
Activity: Aquatics
The purpose of the Aquatics activity is to provide safe aquatic facilities to residents and visitors so they can have asafe swim experience and to provide educational water programming to residents and visitors so they can have alifelong safe swim experience.
Average safety rating for pools
0.00
20.00
40.00
60.00
80.00
100.0099.98 99.98 98.00 98.00 98.00
2010-11Actual
2012-13Proposed
2011-12Amended
2011-12Estimated
2009-10Actual
2011-12Amended
2010-11Actual
2011-12Estimated
2012-13Proposed
2009-10Actual
Requirements
Expense Refunds 70,000 73,683 70,00098,36525,147
General Fund 4,729,690 4,739,570 5,001,2114,657,3184,221,374
Recreation Programs Enterprise Fund 0 0 00255,607
$4,799,690 $4,813,253 $5,071,211Total Requirements $4,755,683$4,502,128
Full-Time Equivalents
General Fund 26.25 26.50 26.50 26.5025.25
Recreation Programs Enterprise Fund 0.00 0.00 0.00 0.002.00
Total FTEs 26.25 26.50 26.50 26.5027.25
Performance Measures
Average safety rating for pools 9899.98 98 9899.98
Number of swimmers (municipal poolsand Barton Springs Pool)
600,0001,488,266 600,000 700,000732,636
Overall satisfaction rating with cityswimming pools
90New Meas 90 90New Meas
ServicesPublic swimming; Aquatic maintenance; Swim lessons; Swim team programs; Aquatic movie nights
Bold/Italicized Measure = Key Indicator
2012-13 Proposed Budget, Austin, TX
Volume I | 243
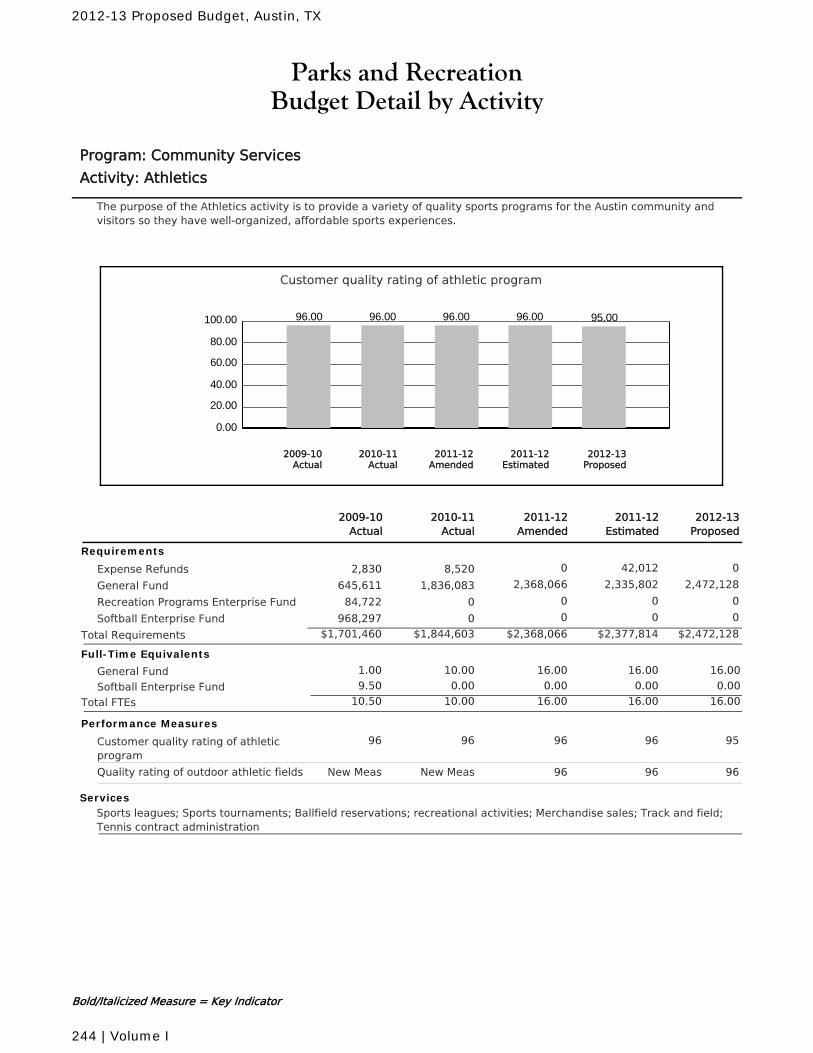
Parks and RecreationBudget Detail by Activity
Program: Community Services
Activity: Athletics
The purpose of the Athletics activity is to provide a variety of quality sports programs for the Austin community andvisitors so they have well-organized, affordable sports experiences.
Customer quality rating of athletic program
0.00
20.00
40.00
60.00
80.00
100.00 96.00 96.00 96.00 96.00 95.00
2010-11Actual
2012-13Proposed
2011-12Amended
2011-12Estimated
2009-10Actual
2011-12Amended
2010-11Actual
2011-12Estimated
2012-13Proposed
2009-10Actual
Requirements
Expense Refunds 0 42,012 08,5202,830
General Fund 2,368,066 2,335,802 2,472,1281,836,083645,611
Recreation Programs Enterprise Fund 0 0 0084,722
Softball Enterprise Fund 0 0 00968,297
$2,368,066 $2,377,814 $2,472,128Total Requirements $1,844,603$1,701,460
Full-Time Equivalents
General Fund 10.00 16.00 16.00 16.001.00
Softball Enterprise Fund 0.00 0.00 0.00 0.009.50
Total FTEs 10.00 16.00 16.00 16.0010.50
Performance Measures
Customer quality rating of athleticprogram
9696 96 9596
Quality rating of outdoor athletic fields 96New Meas 96 96New Meas
ServicesSports leagues; Sports tournaments; Ballfield reservations; recreational activities; Merchandise sales; Track and field;Tennis contract administration
Bold/Italicized Measure = Key Indicator
2012-13 Proposed Budget, Austin, TX
244 | Volume I
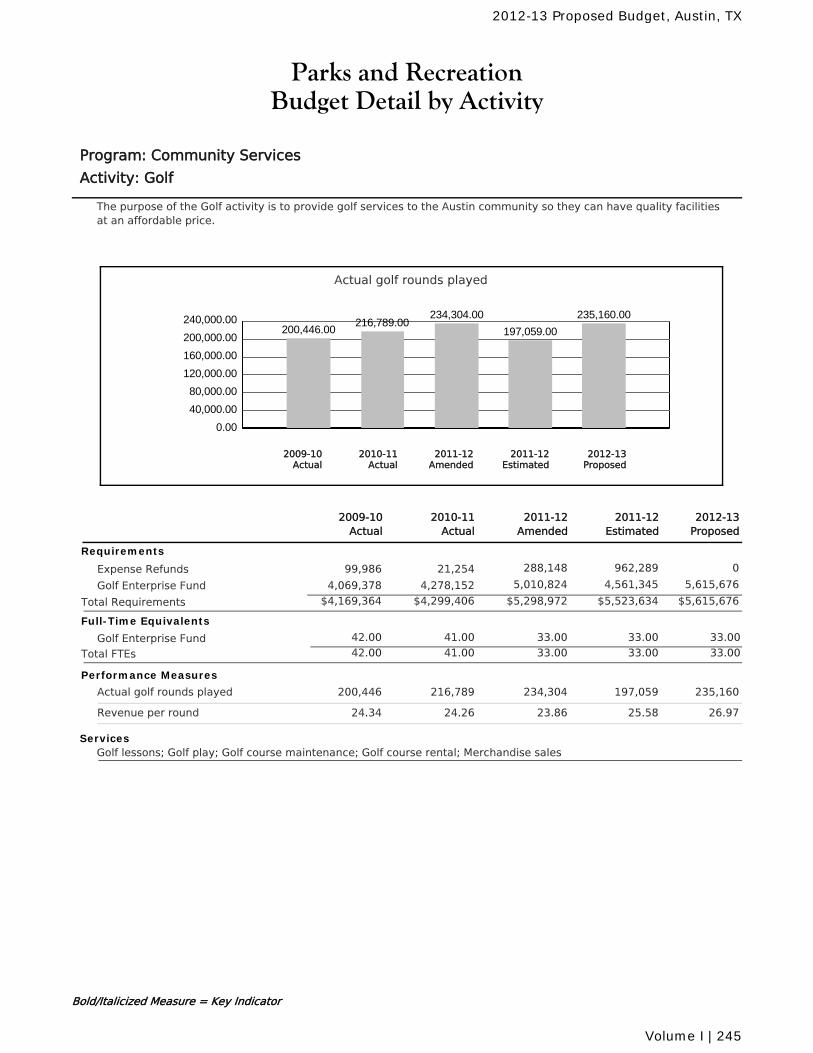
Parks and RecreationBudget Detail by Activity
Program: Community Services
Activity: Golf
The purpose of the Golf activity is to provide golf services to the Austin community so they can have quality facilitiesat an affordable price.
Actual golf rounds played
0.00
40,000.00
80,000.00
120,000.00
160,000.00
200,000.00
240,000.00200,446.00
216,789.00234,304.00
197,059.00
235,160.00
2010-11Actual
2012-13Proposed
2011-12Amended
2011-12Estimated
2009-10Actual
2011-12Amended
2010-11Actual
2011-12Estimated
2012-13Proposed
2009-10Actual
Requirements
Expense Refunds 288,148 962,289 021,25499,986
Golf Enterprise Fund 5,010,824 4,561,345 5,615,6764,278,1524,069,378
$5,298,972 $5,523,634 $5,615,676Total Requirements $4,299,406$4,169,364
Full-Time Equivalents
Golf Enterprise Fund 41.00 33.00 33.00 33.0042.00
Total FTEs 41.00 33.00 33.00 33.0042.00
Performance Measures
Actual golf rounds played 234,304216,789 197,059 235,160200,446
Revenue per round 23.8624.26 25.58 26.9724.34
ServicesGolf lessons; Golf play; Golf course maintenance; Golf course rental; Merchandise sales
Bold/Italicized Measure = Key Indicator
2012-13 Proposed Budget, Austin, TX
Volume I | 245
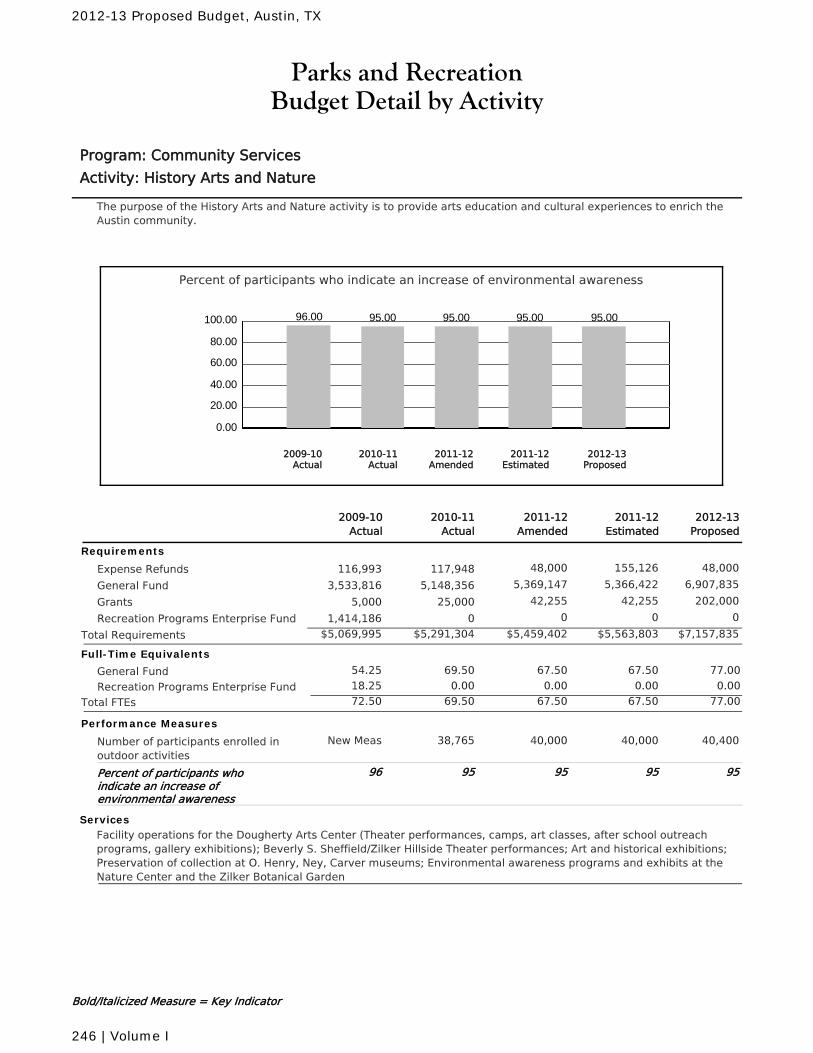
Parks and RecreationBudget Detail by Activity
Program: Community Services
Activity: History Arts and Nature
The purpose of the History Arts and Nature activity is to provide arts education and cultural experiences to enrich theAustin community.
Percent of participants who indicate an increase of environmental awareness
0.00
20.00
40.00
60.00
80.00
100.00 96.00 95.00 95.00 95.00 95.00
2010-11Actual
2012-13Proposed
2011-12Amended
2011-12Estimated
2009-10Actual
2011-12Amended
2010-11Actual
2011-12Estimated
2012-13Proposed
2009-10Actual
Requirements
Expense Refunds 48,000 155,126 48,000117,948116,993
General Fund 5,369,147 5,366,422 6,907,8355,148,3563,533,816
Grants 42,255 42,255 202,00025,0005,000
Recreation Programs Enterprise Fund 0 0 001,414,186
$5,459,402 $5,563,803 $7,157,835Total Requirements $5,291,304$5,069,995
Full-Time Equivalents
General Fund 69.50 67.50 67.50 77.0054.25
Recreation Programs Enterprise Fund 0.00 0.00 0.00 0.0018.25
Total FTEs 69.50 67.50 67.50 77.0072.50
Performance Measures
Number of participants enrolled inoutdoor activities
40,00038,765 40,000 40,400New Meas
Percent of participants whoindicate an increase ofenvironmental awareness
9595 95 9596
ServicesFacility operations for the Dougherty Arts Center (Theater performances, camps, art classes, after school outreachprograms, gallery exhibitions); Beverly S. Sheffield/Zilker Hillside Theater performances; Art and historical exhibitions;Preservation of collection at O. Henry, Ney, Carver museums; Environmental awareness programs and exhibits at theNature Center and the Zilker Botanical Garden
Bold/Italicized Measure = Key Indicator
2012-13 Proposed Budget, Austin, TX
246 | Volume I
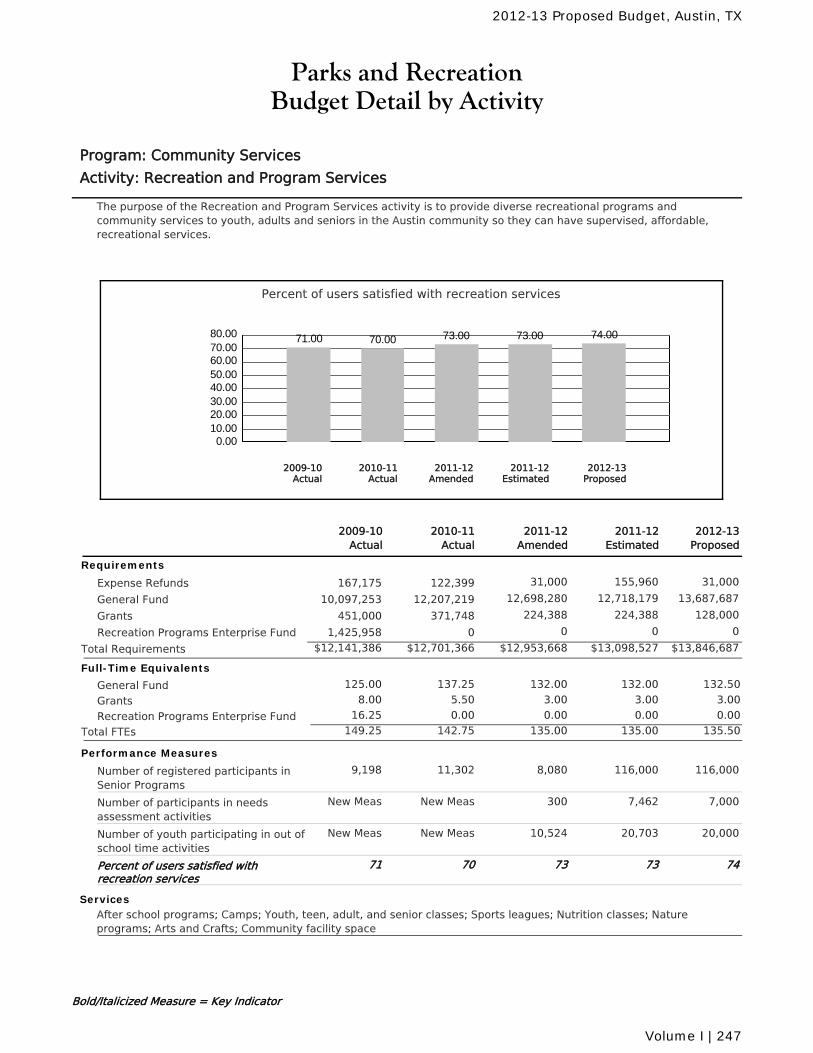
Parks and RecreationBudget Detail by Activity
Program: Community Services
Activity: Recreation and Program Services
The purpose of the Recreation and Program Services activity is to provide diverse recreational programs andcommunity services to youth, adults and seniors in the Austin community so they can have supervised, affordable,recreational services.
Percent of users satisfied with recreation services
0.0010.0020.0030.0040.0050.0060.0070.0080.00 71.00 70.00 73.00 73.00 74.00
2010-11Actual
2012-13Proposed
2011-12Amended
2011-12Estimated
2009-10Actual
2011-12Amended
2010-11Actual
2011-12Estimated
2012-13Proposed
2009-10Actual
Requirements
Expense Refunds 31,000 155,960 31,000122,399167,175
General Fund 12,698,280 12,718,179 13,687,68712,207,21910,097,253
Grants 224,388 224,388 128,000371,748451,000
Recreation Programs Enterprise Fund 0 0 001,425,958
$12,953,668 $13,098,527 $13,846,687Total Requirements $12,701,366$12,141,386
Full-Time Equivalents
General Fund 137.25 132.00 132.00 132.50125.00
Grants 5.50 3.00 3.00 3.008.00
Recreation Programs Enterprise Fund 0.00 0.00 0.00 0.0016.25
Total FTEs 142.75 135.00 135.00 135.50149.25
Performance Measures
Number of registered participants inSenior Programs
8,08011,302 116,000 116,0009,198
Number of participants in needsassessment activities
300New Meas 7,462 7,000New Meas
Number of youth participating in out ofschool time activities
10,524New Meas 20,703 20,000New Meas
Percent of users satisfied withrecreation services
7370 73 7471
ServicesAfter school programs; Camps; Youth, teen, adult, and senior classes; Sports leagues; Nutrition classes; Natureprograms; Arts and Crafts; Community facility space
Bold/Italicized Measure = Key Indicator
2012-13 Proposed Budget, Austin, TX
Volume I | 247
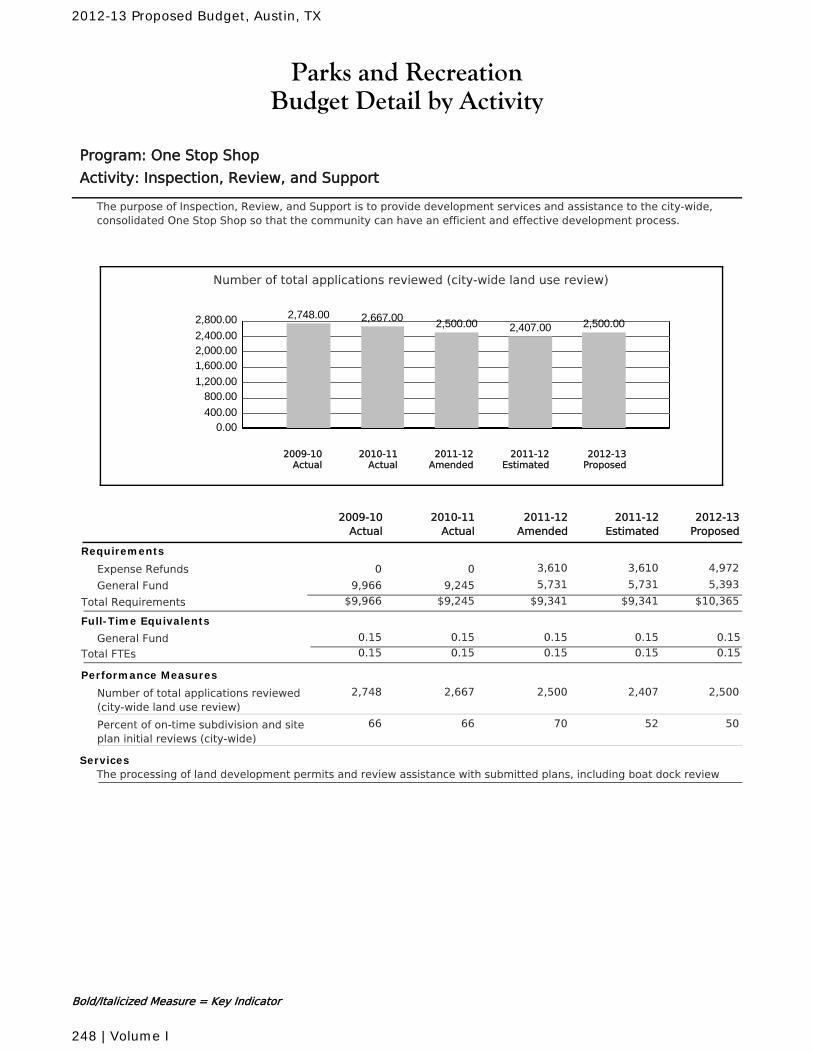
Parks and RecreationBudget Detail by Activity
Program: One Stop Shop
Activity: Inspection, Review, and Support
The purpose of Inspection, Review, and Support is to provide development services and assistance to the city-wide,consolidated One Stop Shop so that the community can have an efficient and effective development process.
Number of total applications reviewed (city-wide land use review)
0.00400.00
800.001,200.00
1,600.002,000.002,400.00
2,800.00 2,748.00 2,667.00 2,500.00 2,407.00 2,500.00
2010-11Actual
2012-13Proposed
2011-12Amended
2011-12Estimated
2009-10Actual
2011-12Amended
2010-11Actual
2011-12Estimated
2012-13Proposed
2009-10Actual
Requirements
Expense Refunds 3,610 3,610 4,97200
General Fund 5,731 5,731 5,3939,2459,966
$9,341 $9,341 $10,365Total Requirements $9,245$9,966
Full-Time Equivalents
General Fund 0.15 0.15 0.15 0.150.15
Total FTEs 0.15 0.15 0.15 0.150.15
Performance Measures
Number of total applications reviewed(city-wide land use review)
2,5002,667 2,407 2,5002,748
Percent of on-time subdivision and siteplan initial reviews (city-wide)
7066 52 5066
ServicesThe processing of land development permits and review assistance with submitted plans, including boat dock review
Bold/Italicized Measure = Key Indicator
2012-13 Proposed Budget, Austin, TX
248 | Volume I
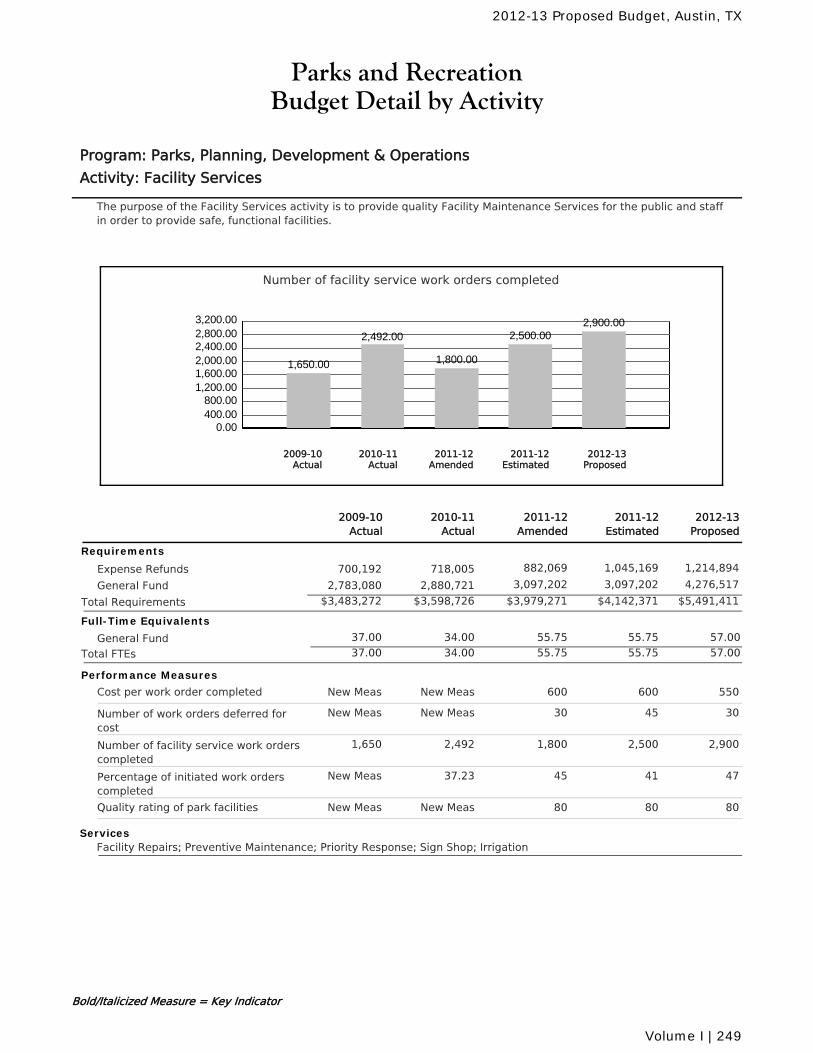
Parks and RecreationBudget Detail by Activity
Program: Parks, Planning, Development & Operations
Activity: Facility Services
The purpose of the Facility Services activity is to provide quality Facility Maintenance Services for the public and staffin order to provide safe, functional facilities.
Number of facility service work orders completed
0.00400.00800.00
1,200.001,600.002,000.002,400.002,800.003,200.00
1,650.00
2,492.00
1,800.00
2,500.002,900.00
2010-11Actual
2012-13Proposed
2011-12Amended
2011-12Estimated
2009-10Actual
2011-12Amended
2010-11Actual
2011-12Estimated
2012-13Proposed
2009-10Actual
Requirements
Expense Refunds 882,069 1,045,169 1,214,894718,005700,192
General Fund 3,097,202 3,097,202 4,276,5172,880,7212,783,080
$3,979,271 $4,142,371 $5,491,411Total Requirements $3,598,726$3,483,272
Full-Time Equivalents
General Fund 34.00 55.75 55.75 57.0037.00
Total FTEs 34.00 55.75 55.75 57.0037.00
Performance Measures
Cost per work order completed 600New Meas 600 550New Meas
Number of work orders deferred forcost
30New Meas 45 30New Meas
Number of facility service work orderscompleted
1,8002,492 2,500 2,9001,650
Percentage of initiated work orderscompleted
4537.23 41 47New Meas
Quality rating of park facilities 80New Meas 80 80New Meas
ServicesFacility Repairs; Preventive Maintenance; Priority Response; Sign Shop; Irrigation
Bold/Italicized Measure = Key Indicator
2012-13 Proposed Budget, Austin, TX
Volume I | 249

Parks and RecreationBudget Detail by Activity
Program: Parks, Planning, Development & Operations
Activity: Forestry
The purpose of the Forestry activity is to provide public tree care services in order to provide the Austin communitywith a safe and healthy urban forest.
Number of acres in PARD preserves
0.00400.00
800.001,200.00
1,600.002,000.002,400.00
2,800.00 2,491.30 2,513.26 2,513.26 2,513.26 2,513.26
2010-11Actual
2012-13Proposed
2011-12Amended
2011-12Estimated
2009-10Actual
2011-12Amended
2010-11Actual
2011-12Estimated
2012-13Proposed
2009-10Actual
Requirements
Expense Refunds 0 260,000 129,47172,33161,925
General Fund 1,576,176 1,496,933 1,670,4311,494,4181,440,474
Grants 50,000 50,000 50,00015,5700
$1,626,176 $1,806,933 $1,849,902Total Requirements $1,582,319$1,502,399
Full-Time Equivalents
General Fund 25.00 24.00 24.00 24.0025.00
Total FTEs 25.00 24.00 24.00 24.0025.00
Performance Measures
Number of public/private trees plantedon public property
4505,320 3,773 5,0000
Number of acres in PARD preserves 2,513.262,513.26 2,513.26 2,513.262,491.30
ServicesPublic tree care; tree planting; mow targeted rights-of-ways; prepare oak wilt suppression plans for citizens andassist with implementation; prepare and implement oak wilt suppression plan for parkland
Bold/Italicized Measure = Key Indicator
2012-13 Proposed Budget, Austin, TX
250 | Volume I

Parks and RecreationBudget Detail by Activity
Program: Parks, Planning, Development & Operations
Activity: Grounds Maintenance
The purpose of the Grounds Maintenance activity is to conduct routine park maintenance in order to provide the Austincommunity with clean, safe, and well-maintained parks.
Citizen satisfaction with the appearance of park grounds
0.00
20.00
40.00
60.00
80.00
100.00
70.00 69.00
85.00
70.00 70.00
2010-11Actual
2012-13Proposed
2011-12Amended
2011-12Estimated
2009-10Actual
2011-12Amended
2010-11Actual
2011-12Estimated
2012-13Proposed
2009-10Actual
Requirements
Expense Refunds 940,610 1,059,910 964,1911,206,3791,168,554
General Fund 8,905,838 8,981,438 10,143,6238,753,8207,764,169
$9,846,448 $10,041,348 $11,107,814Total Requirements $9,960,199$8,932,723
Full-Time Equivalents
General Fund 114.25 120.25 120.25 124.00111.25
Total FTEs 114.25 120.25 120.25 124.00111.25
Performance Measures
Citizen satisfaction with theappearance of park grounds
8569 70 7070
Number of developed park acreage 12,472.3812,471.68 12,237.01 12,237.0112,275.77
Percent of Users Satisfied with theAppearance of Park Grounds In Austin
8569.40 70 70No Data
Ratio of developed andundeveloped park acres pergrounds maintenance FTE
161173.99 161 161New Meas
ServicesDaily park service; Park outdoor repairs/improvements; Mowing/weed trimming; Trail maintenance; Emergency stormdamage; Park inspections; Athletic field maintenance; Equipment maintenance; Playscape maintenance; Contractgraffiti removal
Bold/Italicized Measure = Key Indicator
2012-13 Proposed Budget, Austin, TX
Volume I | 251
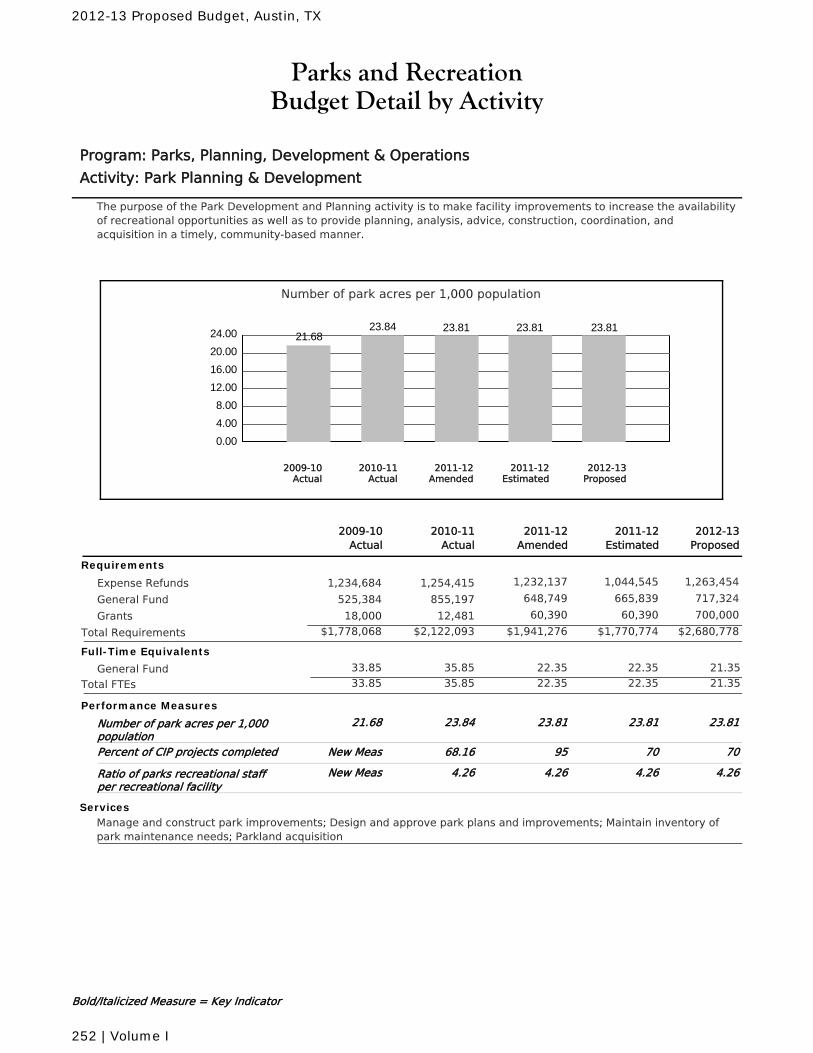
Parks and RecreationBudget Detail by Activity
Program: Parks, Planning, Development & Operations
Activity: Park Planning & Development
The purpose of the Park Development and Planning activity is to make facility improvements to increase the availabilityof recreational opportunities as well as to provide planning, analysis, advice, construction, coordination, andacquisition in a timely, community-based manner.
Number of park acres per 1,000 population
0.00
4.00
8.00
12.00
16.00
20.00
24.00 21.6823.84 23.81 23.81 23.81
2010-11Actual
2012-13Proposed
2011-12Amended
2011-12Estimated
2009-10Actual
2011-12Amended
2010-11Actual
2011-12Estimated
2012-13Proposed
2009-10Actual
Requirements
Expense Refunds 1,232,137 1,044,545 1,263,4541,254,4151,234,684
General Fund 648,749 665,839 717,324855,197525,384
Grants 60,390 60,390 700,00012,48118,000
$1,941,276 $1,770,774 $2,680,778Total Requirements $2,122,093$1,778,068
Full-Time Equivalents
General Fund 35.85 22.35 22.35 21.3533.85
Total FTEs 35.85 22.35 22.35 21.3533.85
Performance Measures
Number of park acres per 1,000population
23.8123.84 23.81 23.8121.68
Percent of CIP projects completed 9568.16 70 70New Meas
Ratio of parks recreational staffper recreational facility
4.264.26 4.26 4.26New Meas
ServicesManage and construct park improvements; Design and approve park plans and improvements; Maintain inventory ofpark maintenance needs; Parkland acquisition
Bold/Italicized Measure = Key Indicator
2012-13 Proposed Budget, Austin, TX
252 | Volume I
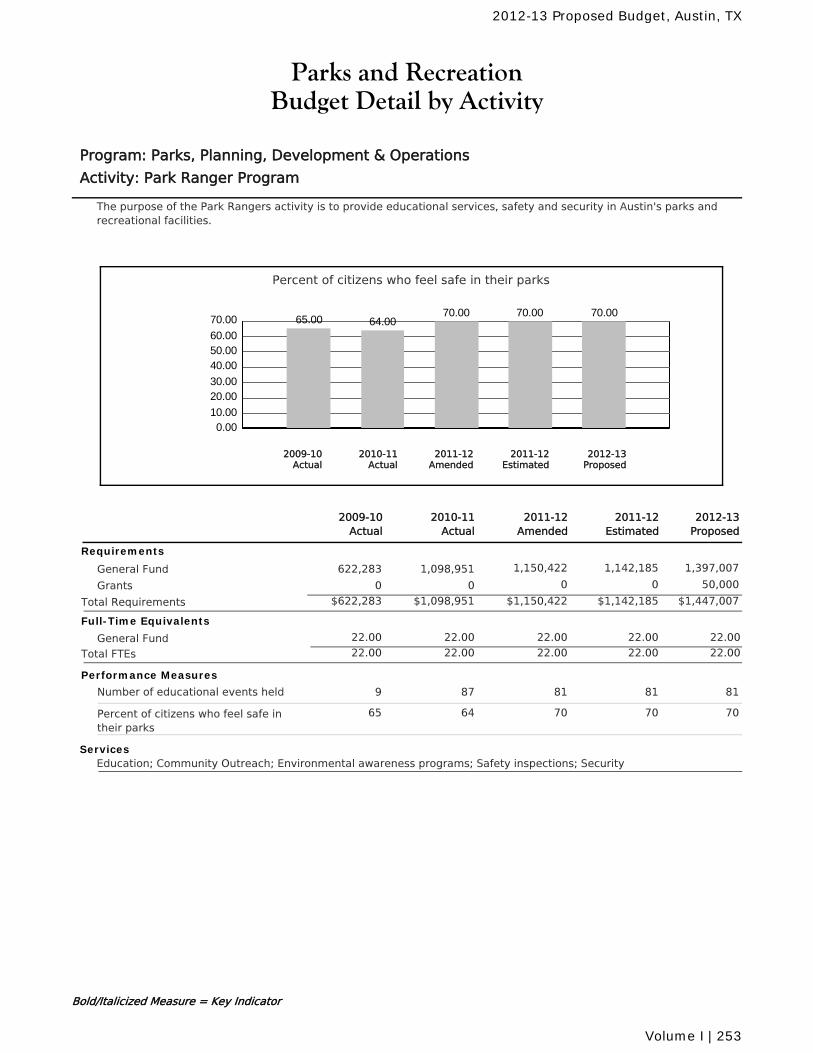
Parks and RecreationBudget Detail by Activity
Program: Parks, Planning, Development & Operations
Activity: Park Ranger Program
The purpose of the Park Rangers activity is to provide educational services, safety and security in Austin's parks andrecreational facilities.
Percent of citizens who feel safe in their parks
0.0010.00
20.0030.00
40.0050.0060.00
70.00 65.00 64.0070.00 70.00 70.00
2010-11Actual
2012-13Proposed
2011-12Amended
2011-12Estimated
2009-10Actual
2011-12Amended
2010-11Actual
2011-12Estimated
2012-13Proposed
2009-10Actual
Requirements
General Fund 1,150,422 1,142,185 1,397,0071,098,951622,283
Grants 0 0 50,00000
$1,150,422 $1,142,185 $1,447,007Total Requirements $1,098,951$622,283
Full-Time Equivalents
General Fund 22.00 22.00 22.00 22.0022.00
Total FTEs 22.00 22.00 22.00 22.0022.00
Performance Measures
Number of educational events held 8187 81 819
Percent of citizens who feel safe intheir parks
7064 70 7065
ServicesEducation; Community Outreach; Environmental awareness programs; Safety inspections; Security
Bold/Italicized Measure = Key Indicator
2012-13 Proposed Budget, Austin, TX
Volume I | 253
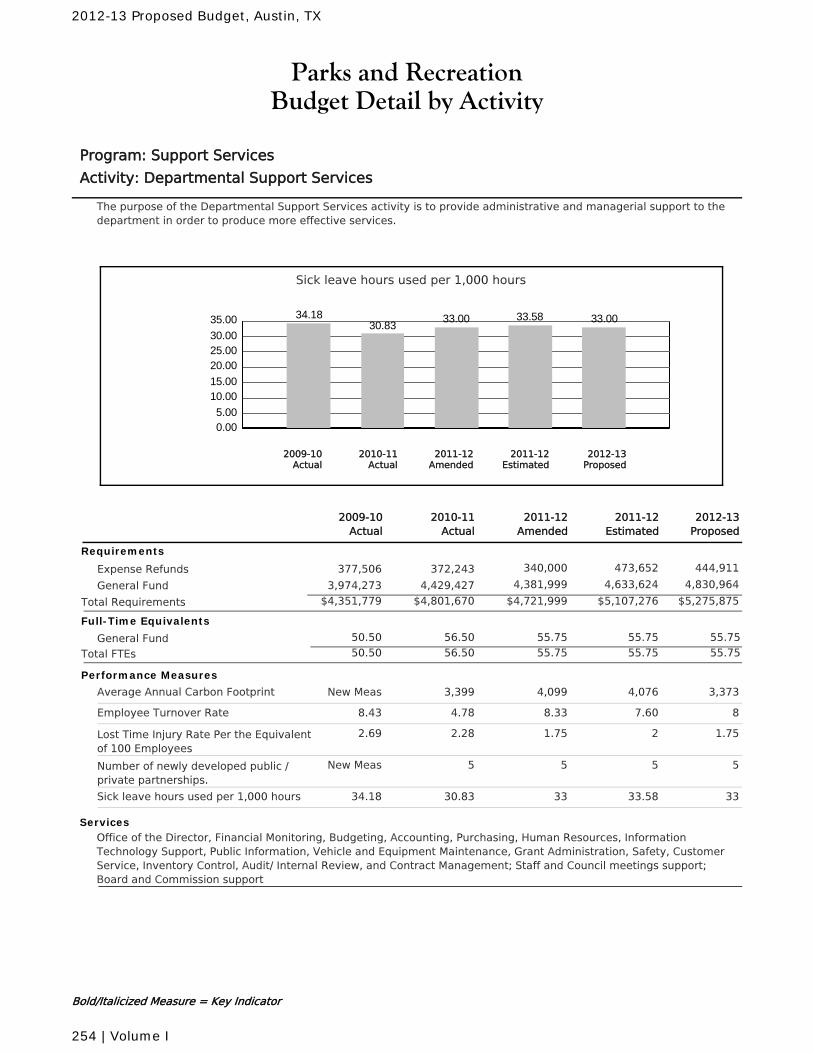
Parks and RecreationBudget Detail by Activity
Program: Support Services
Activity: Departmental Support Services
The purpose of the Departmental Support Services activity is to provide administrative and managerial support to thedepartment in order to produce more effective services.
Sick leave hours used per 1,000 hours
0.005.00
10.0015.00
20.0025.0030.00
35.00 34.1830.83
33.00 33.58 33.00
2010-11Actual
2012-13Proposed
2011-12Amended
2011-12Estimated
2009-10Actual
2011-12Amended
2010-11Actual
2011-12Estimated
2012-13Proposed
2009-10Actual
Requirements
Expense Refunds 340,000 473,652 444,911372,243377,506
General Fund 4,381,999 4,633,624 4,830,9644,429,4273,974,273
$4,721,999 $5,107,276 $5,275,875Total Requirements $4,801,670$4,351,779
Full-Time Equivalents
General Fund 56.50 55.75 55.75 55.7550.50
Total FTEs 56.50 55.75 55.75 55.7550.50
Performance Measures
Average Annual Carbon Footprint 4,0993,399 4,076 3,373New Meas
Employee Turnover Rate 8.334.78 7.60 88.43
Lost Time Injury Rate Per the Equivalentof 100 Employees
1.752.28 2 1.752.69
Number of newly developed public /private partnerships.
55 5 5New Meas
Sick leave hours used per 1,000 hours 3330.83 33.58 3334.18
ServicesOffice of the Director, Financial Monitoring, Budgeting, Accounting, Purchasing, Human Resources, InformationTechnology Support, Public Information, Vehicle and Equipment Maintenance, Grant Administration, Safety, CustomerService, Inventory Control, Audit/ Internal Review, and Contract Management; Staff and Council meetings support;Board and Commission support
Bold/Italicized Measure = Key Indicator
2012-13 Proposed Budget, Austin, TX
254 | Volume I
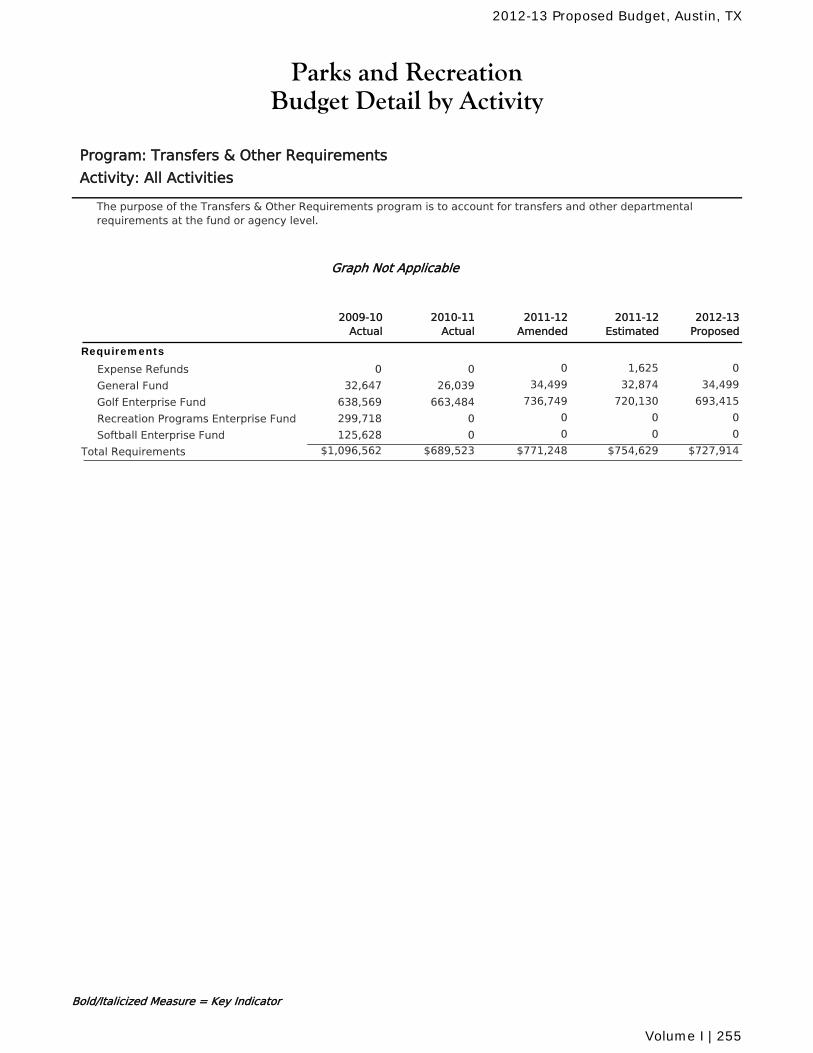
Parks and RecreationBudget Detail by Activity
Program: Transfers & Other Requirements
Activity: All Activities
The purpose of the Transfers & Other Requirements program is to account for transfers and other departmentalrequirements at the fund or agency level.
Graph Not Applicable
2011-12Amended
2010-11Actual
2011-12Estimated
2012-13Proposed
2009-10Actual
Requirements
Expense Refunds 0 1,625 000
General Fund 34,499 32,874 34,49926,03932,647
Golf Enterprise Fund 736,749 720,130 693,415663,484638,569
Recreation Programs Enterprise Fund 0 0 00299,718
Softball Enterprise Fund 0 0 00125,628
$771,248 $754,629 $727,914Total Requirements $689,523$1,096,562
Bold/Italicized Measure = Key Indicator
2012-13 Proposed Budget, Austin, TX
Volume I | 255
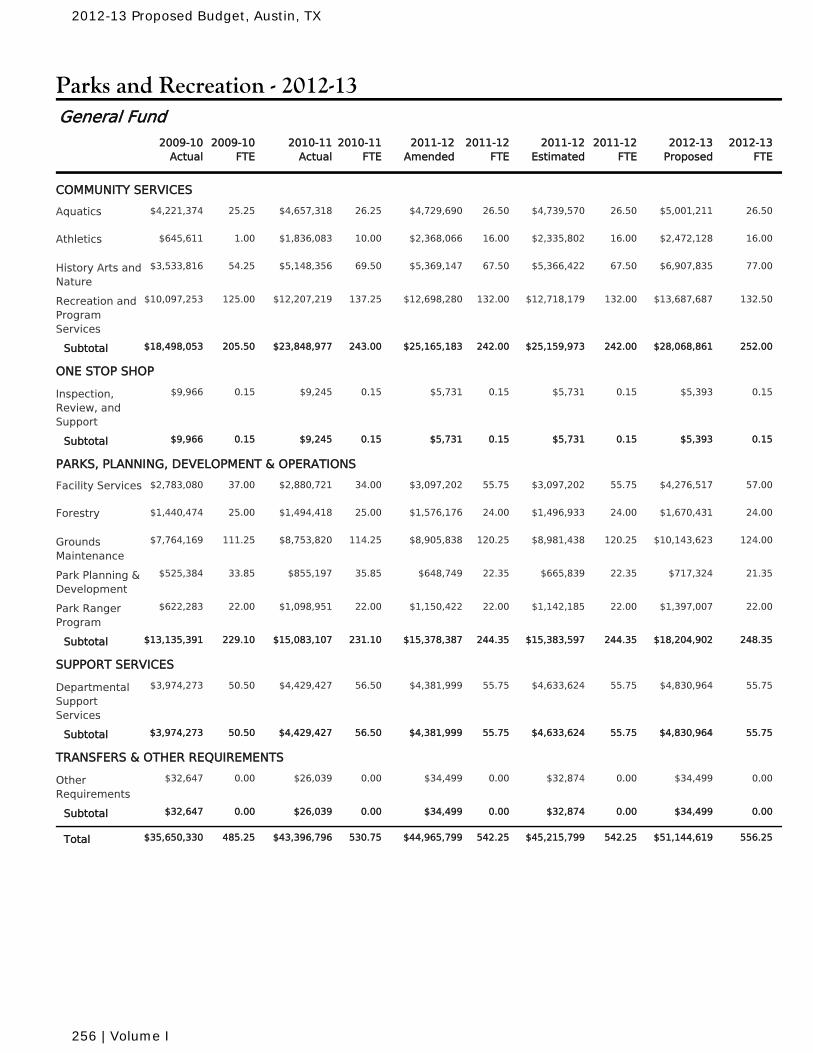
Parks and Recreation - 2012-13
2010-11Actual
2010-11FTE
2011-12Amended
2011-12FTE
2011-12Estimated
2011-12FTE
2009-10Actual
2009-10FTE
2012-13Proposed
2012-13FTE
General Fund
COMMUNITY SERVICES
$4,657,318 26.25 $4,729,690 26.50 $4,739,570 26.50Aquatics 25.25 $5,001,211 26.50$4,221,374
$1,836,083 10.00 $2,368,066 16.00 $2,335,802 16.00Athletics 1.00 $2,472,128 16.00$645,611
$5,148,356 69.50 $5,369,147 67.50 $5,366,422 67.50History Arts andNature
54.25 $6,907,835 77.00$3,533,816
$12,207,219 137.25 $12,698,280 132.00 $12,718,179 132.00Recreation andProgramServices
125.00 $13,687,687 132.50$10,097,253
$23,848,977 243.00 $25,165,183 242.00 $25,159,973 242.00Subtotal 205.50 $28,068,861 252.00$18,498,053
ONE STOP SHOP
$9,245 0.15 $5,731 0.15 $5,731 0.15Inspection,Review, andSupport
0.15 $5,393 0.15$9,966
$9,245 0.15 $5,731 0.15 $5,731 0.15Subtotal 0.15 $5,393 0.15$9,966
PARKS, PLANNING, DEVELOPMENT & OPERATIONS
$2,880,721 34.00 $3,097,202 55.75 $3,097,202 55.75Facility Services 37.00 $4,276,517 57.00$2,783,080
$1,494,418 25.00 $1,576,176 24.00 $1,496,933 24.00Forestry 25.00 $1,670,431 24.00$1,440,474
$8,753,820 114.25 $8,905,838 120.25 $8,981,438 120.25GroundsMaintenance
111.25 $10,143,623 124.00$7,764,169
$855,197 35.85 $648,749 22.35 $665,839 22.35Park Planning &Development
33.85 $717,324 21.35$525,384
$1,098,951 22.00 $1,150,422 22.00 $1,142,185 22.00Park RangerProgram
22.00 $1,397,007 22.00$622,283
$15,083,107 231.10 $15,378,387 244.35 $15,383,597 244.35Subtotal 229.10 $18,204,902 248.35$13,135,391
SUPPORT SERVICES
$4,429,427 56.50 $4,381,999 55.75 $4,633,624 55.75DepartmentalSupportServices
50.50 $4,830,964 55.75$3,974,273
$4,429,427 56.50 $4,381,999 55.75 $4,633,624 55.75Subtotal 50.50 $4,830,964 55.75$3,974,273
TRANSFERS & OTHER REQUIREMENTS
$26,039 0.00 $34,499 0.00 $32,874 0.00OtherRequirements
0.00 $34,499 0.00$32,647
$26,039 0.00 $34,499 0.00 $32,874 0.00Subtotal 0.00 $34,499 0.00$32,647
$43,396,796 530.75 $44,965,799 542.25 $45,215,799 542.25Total 485.25 $51,144,619 556.25$35,650,330
2012-13 Proposed Budget, Austin, TX
256 | Volume I
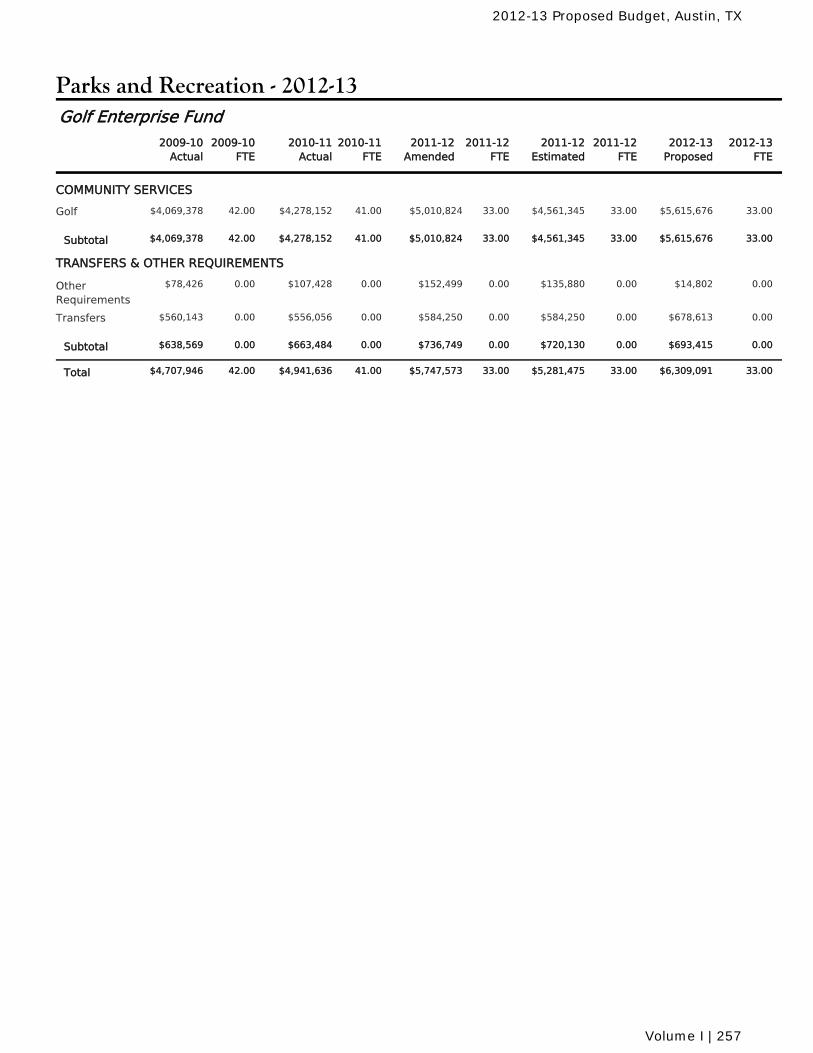
Parks and Recreation - 2012-13
2010-11Actual
2010-11FTE
2011-12Amended
2011-12FTE
2011-12Estimated
2011-12FTE
2009-10Actual
2009-10FTE
2012-13Proposed
2012-13FTE
Golf Enterprise Fund
COMMUNITY SERVICES
$4,278,152 41.00 $5,010,824 33.00 $4,561,345 33.00Golf 42.00 $5,615,676 33.00$4,069,378
$4,278,152 41.00 $5,010,824 33.00 $4,561,345 33.00Subtotal 42.00 $5,615,676 33.00$4,069,378
TRANSFERS & OTHER REQUIREMENTS
$107,428 0.00 $152,499 0.00 $135,880 0.00OtherRequirements
0.00 $14,802 0.00$78,426
$556,056 0.00 $584,250 0.00 $584,250 0.00Transfers 0.00 $678,613 0.00$560,143
$663,484 0.00 $736,749 0.00 $720,130 0.00Subtotal 0.00 $693,415 0.00$638,569
$4,941,636 41.00 $5,747,573 33.00 $5,281,475 33.00Total 42.00 $6,309,091 33.00$4,707,946
2012-13 Proposed Budget, Austin, TX
Volume I | 257
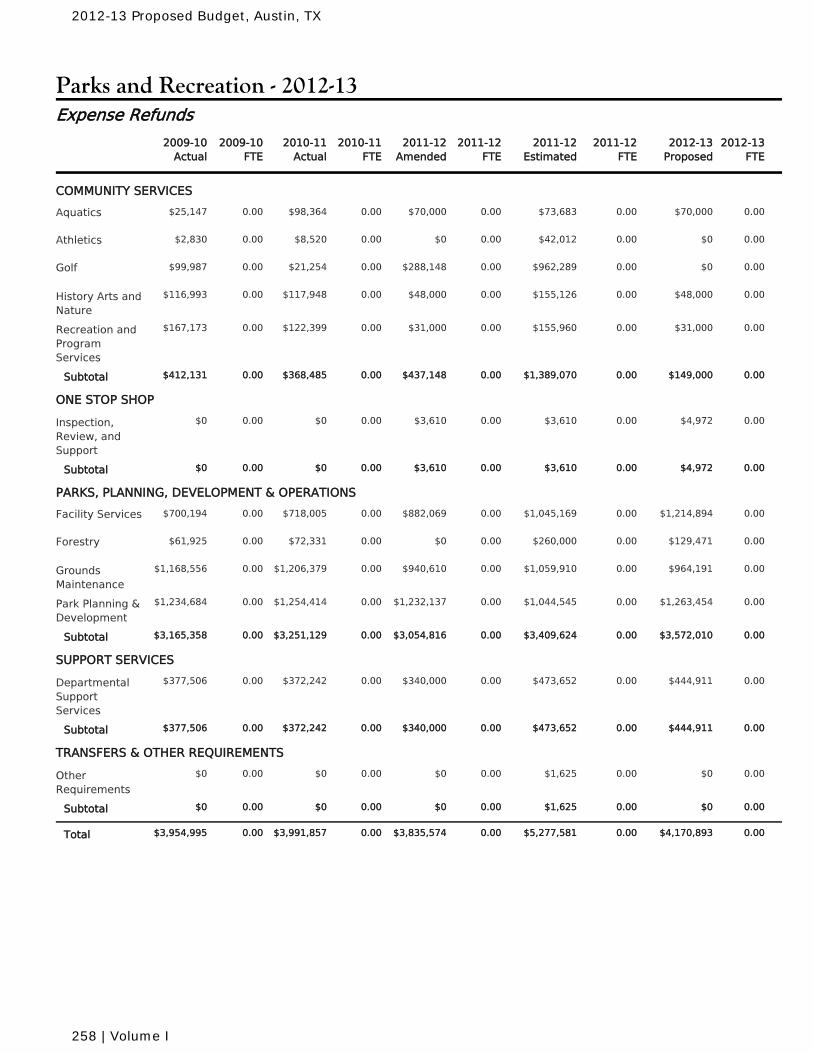
Parks and Recreation - 2012-13
2010-11Actual
2010-11FTE
2011-12Amended
2011-12FTE
2011-12Estimated
2011-12FTE
2009-10Actual
2009-10FTE
2012-13Proposed
2012-13FTE
Expense Refunds
COMMUNITY SERVICES
$98,364 0.00 $70,000 0.00 $73,683 0.00Aquatics 0.00 $70,000 0.00$25,147
$8,520 0.00 $0 0.00 $42,012 0.00Athletics 0.00 $0 0.00$2,830
$21,254 0.00 $288,148 0.00 $962,289 0.00Golf 0.00 $0 0.00$99,987
$117,948 0.00 $48,000 0.00 $155,126 0.00History Arts andNature
0.00 $48,000 0.00$116,993
$122,399 0.00 $31,000 0.00 $155,960 0.00Recreation andProgramServices
0.00 $31,000 0.00$167,173
$368,485 0.00 $437,148 0.00 $1,389,070 0.00Subtotal 0.00 $149,000 0.00$412,131
ONE STOP SHOP
$0 0.00 $3,610 0.00 $3,610 0.00Inspection,Review, andSupport
0.00 $4,972 0.00$0
$0 0.00 $3,610 0.00 $3,610 0.00Subtotal 0.00 $4,972 0.00$0
PARKS, PLANNING, DEVELOPMENT & OPERATIONS
$718,005 0.00 $882,069 0.00 $1,045,169 0.00Facility Services 0.00 $1,214,894 0.00$700,194
$72,331 0.00 $0 0.00 $260,000 0.00Forestry 0.00 $129,471 0.00$61,925
$1,206,379 0.00 $940,610 0.00 $1,059,910 0.00GroundsMaintenance
0.00 $964,191 0.00$1,168,556
$1,254,414 0.00 $1,232,137 0.00 $1,044,545 0.00Park Planning &Development
0.00 $1,263,454 0.00$1,234,684
$3,251,129 0.00 $3,054,816 0.00 $3,409,624 0.00Subtotal 0.00 $3,572,010 0.00$3,165,358
SUPPORT SERVICES
$372,242 0.00 $340,000 0.00 $473,652 0.00DepartmentalSupportServices
0.00 $444,911 0.00$377,506
$372,242 0.00 $340,000 0.00 $473,652 0.00Subtotal 0.00 $444,911 0.00$377,506
TRANSFERS & OTHER REQUIREMENTS
$0 0.00 $0 0.00 $1,625 0.00OtherRequirements
0.00 $0 0.00$0
$0 0.00 $0 0.00 $1,625 0.00Subtotal 0.00 $0 0.00$0
$3,991,857 0.00 $3,835,574 0.00 $5,277,581 0.00Total 0.00 $4,170,893 0.00$3,954,995
2012-13 Proposed Budget, Austin, TX
258 | Volume I
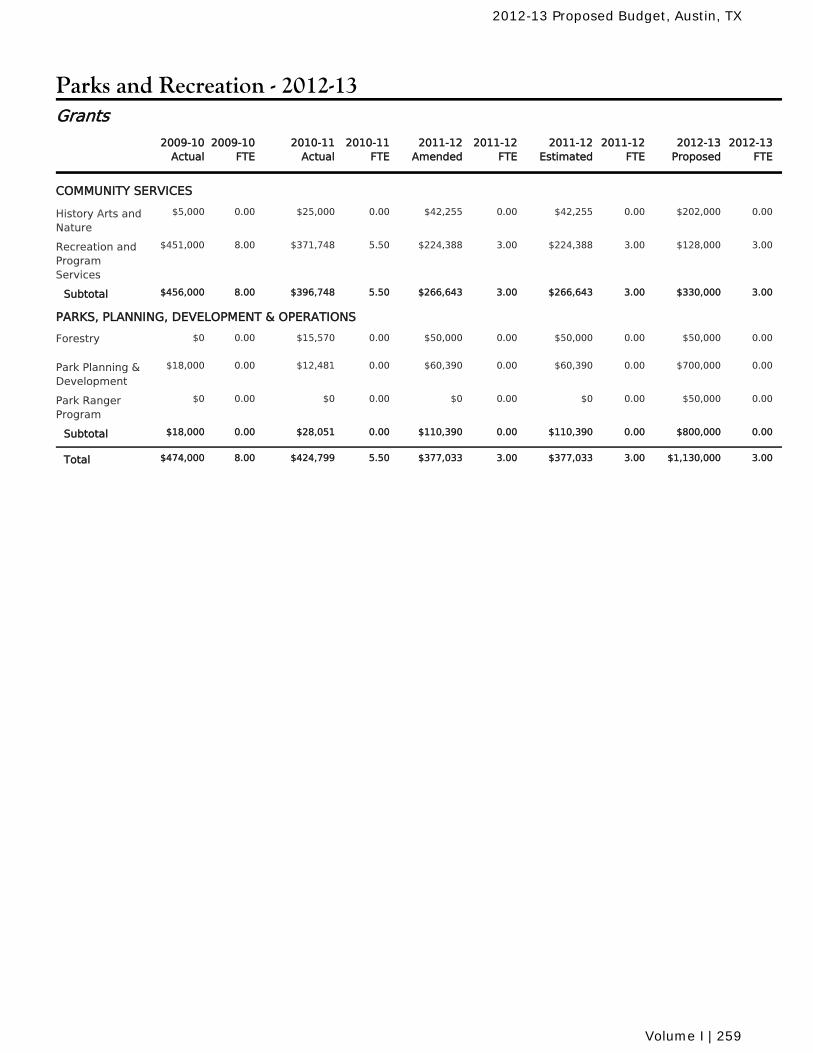
Parks and Recreation - 2012-13
2010-11Actual
2010-11FTE
2011-12Amended
2011-12FTE
2011-12Estimated
2011-12FTE
2009-10Actual
2009-10FTE
2012-13Proposed
2012-13FTE
Grants
COMMUNITY SERVICES
$25,000 0.00 $42,255 0.00 $42,255 0.00History Arts andNature
0.00 $202,000 0.00$5,000
$371,748 5.50 $224,388 3.00 $224,388 3.00Recreation andProgramServices
8.00 $128,000 3.00$451,000
$396,748 5.50 $266,643 3.00 $266,643 3.00Subtotal 8.00 $330,000 3.00$456,000
PARKS, PLANNING, DEVELOPMENT & OPERATIONS
$15,570 0.00 $50,000 0.00 $50,000 0.00Forestry 0.00 $50,000 0.00$0
$12,481 0.00 $60,390 0.00 $60,390 0.00Park Planning &Development
0.00 $700,000 0.00$18,000
$0 0.00 $0 0.00 $0 0.00Park RangerProgram
0.00 $50,000 0.00$0
$28,051 0.00 $110,390 0.00 $110,390 0.00Subtotal 0.00 $800,000 0.00$18,000
$424,799 5.50 $377,033 3.00 $377,033 3.00Total 8.00 $1,130,000 3.00$474,000
2012-13 Proposed Budget, Austin, TX
Volume I | 259

2012-13 Proposed Budget, Austin, TX
260 | Volume I

City of Austin
2012-2013 Proposed
Budget
Volume I Infrastructure

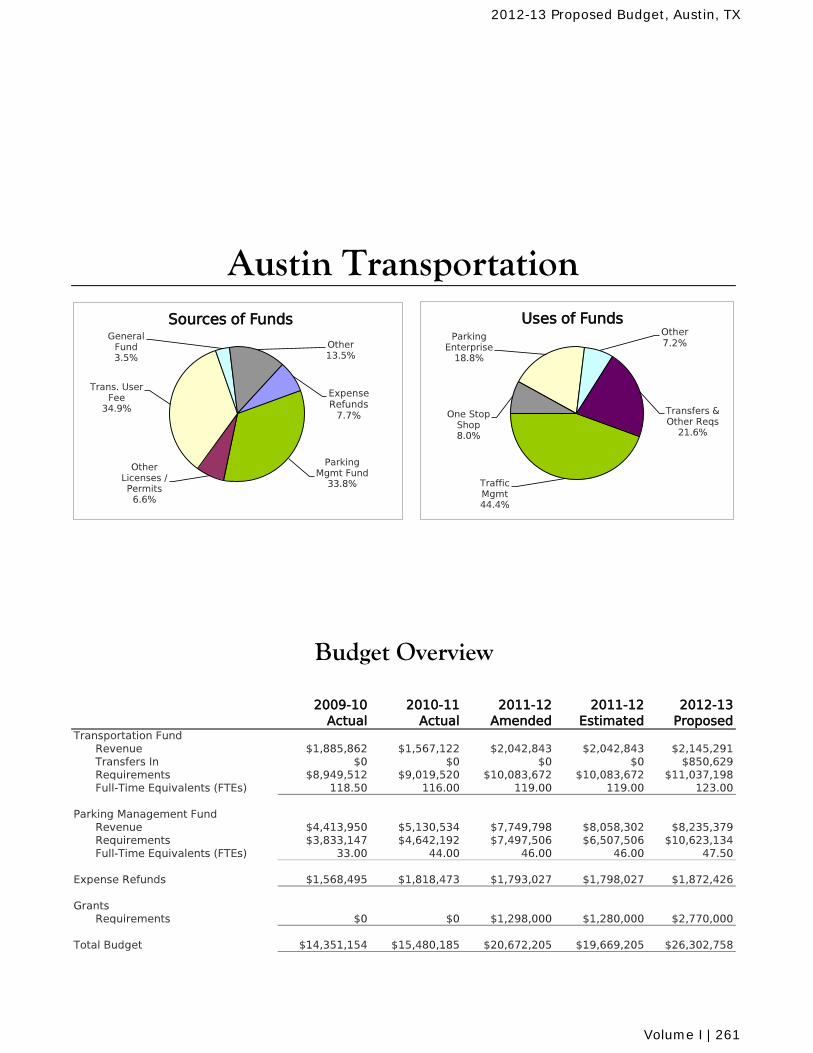
2009-10Actual
2010-11 Actual
2011-12 Amended
2011-12 Estimated
2012-13 Proposed
Transportation FundRevenue $1,885,862 $1,567,122 $2,042,843 $2,042,843 $2,145,291Transfers In $0 $0 $0 $0 $850,629Requirements $8,949,512 $9,019,520 $10,083,672 $10,083,672 $11,037,198Full-Time Equivalents (FTEs) 118.50 116.00 119.00 119.00 123.00
Parking Management FundRevenue $4,413,950 $5,130,534 $7,749,798 $8,058,302 $8,235,379Requirements $3,833,147 $4,642,192 $7,497,506 $6,507,506 $10,623,134Full-Time Equivalents (FTEs) 33.00 44.00 46.00 46.00 47.50
Expense Refunds $1,568,495 $1,818,473 $1,793,027 $1,798,027 $1,872,426
GrantsRequirements $0 $0 $1,298,000 $1,280,000 $2,770,000
Total Budget $14,351,154 $15,480,185 $20,672,205 $19,669,205 $26,302,758
Austin Transportation
Budget Overview
Parking Mgmt Fund
33.8%
Other Licenses / Permits
6.6%
Trans. User Fee
34.9%
General Fund 3.5%
Other 13.5%
Expense Refunds
7.7%
Sources of Funds
Traffic Mgmt 44.4%
One Stop Shop 8.0%
Parking Enterprise
18.8%
Other 7.2%
Transfers & Other Reqs
21.6%
Uses of Funds
2012-13 Proposed Budget, Austin, TX
Volume I | 261
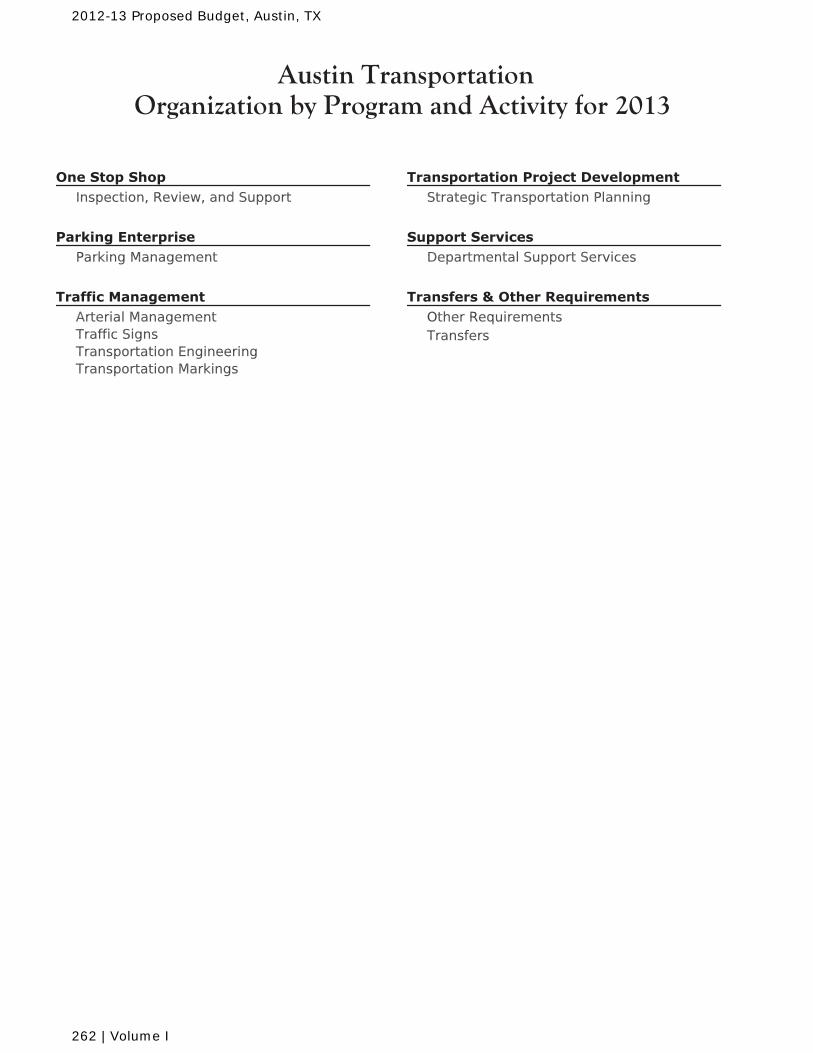
Austin TransportationOrganization by Program and Activity for 2013
Inspection, Review, and Support
Parking Management
Arterial ManagementTraffic SignsTransportation EngineeringTransportation Markings
Strategic Transportation Planning
Departmental Support Services
Other RequirementsTransfers
2012-13 Proposed Budget, Austin, TX
262 | Volume I
Austin TransportationMission and Goals for 2013
The mission of the Austin Transportation Department is to deliver a safe, reliable and sustainabletransportation system that enhances the environment and economic strength of the region whileconducting business in a customer focused and transparent manner.
Establish Austin as having the safest transportation system in the state.
Conduct road safety audits for the top 25 accident locations within Austin each year andinvestigate all fatal crashes and implement appropriate solutions.Maintain the number of incidents in work zones within the right-of-way at zero.Facilitate and plan special events without major incidents or injury to guests.
Optimize roadway throughput for all roadway users by coordinating system improvements.
Increase the percent of residents "satisfied" or "very satisfied" with the traffic signal timing onmajor city streets to more than 44%.Perform maintenance on 10% of traffic sign inventory annually.Re-stripe 50% of center line miles on arterials and collectors annually.Reduce travel time by at least 5% at key intersections and arterials addressed.Reduce the percentage of per capita use of private automobiles by increasing the use ofalternative modes of transportation.
Institute a proactive approach to transportation planning, traffic engineering, and traffic control.
Reduce the number of device-oriented, e.g. (signs, signals, meters) citizen requests by 10%.Increase the percent of residents "satisfied" or "very satisfied" with the traffic flow on majorcity streets from 27% to 39%.Perform preventative maintenance on all school zone-indicator signals.
2012-13 Proposed Budget, Austin, TX
Volume I | 263
Austin Transportation
Message from the Director
Your Austin Transportation Department (ATD) serves the citizens of Austin as their advocate for improved mobility throughout our region. In the past year, ATD has sought to strengthen its focus on regional multi-modal mobility issues that affect the current and future health of our community. We have continued to refine our strategic approach towards addressing our significant transportation challenges within the Austin region.
Since our establishment in FY 2008-09, we have sought to analyze and understand our city’s significant mobility challenge – routinely identified by the Greater Austin Chamber of Commerce as the top challenge to the long-term sustainability of this region. Working with our partner transportation agencies within the Capital Area Metropolitan Planning Organization, we have helped the community to understand that our region suffers from a severe deficit in mobility capacity. Simply put, our region’s transportation infrastructure (roads, transit, pedestrian and bicycle networks) are not sufficient to meet current travel demands nor are they sufficient to meet our future demands as our population doubles over the next 30 to 40 years. This deficit in mobility capacity, directly contributes to the increasing unaffordability of our community due to the increasing pressure on close-in real estate markets to meet the increasing demands, thus leading to sprawl. ATD is pursuing a strategic approach to meeting our region’s mobility needs. We know that the identified capacity deficit creates a ring of congestion surrounding our community’s core (central Austin, the University District, Capitol Complex, and Downtown Austin). We also know that within that core area, the ability to widen existing roadway infrastructure is severely limited due to existing land use developments, cultural resources, and a lack of community support. ATD’s approach is to advocate for projects that complete the regional mobility grid in the outer transportation network to better allow trips not destined for the core to travel around the community, avoiding those portions of the network that demonstrate our greatest capacity deficit. At the same time, ATD will continue to advocate for mobility projects that focus on moving people rather than simply vehicles, into and out of our region’s core in a manner that reflects our community values as identified in the Imagine Austin Comprehensive Plan. This means focusing our efforts on infrastructure projects that emphasize the use of transit, van and carpool, pedestrian, and bicycle options for reaching centrally located activities. In the past year, we have worked to deploy the 2010 Mobility Bond Program, advancing a number of significant corridor development efforts such as the IH 35 Corridor Project, which has received statewide and national recognition. Likewise, we have developed corridor plans for Airport Boulevard, Riverside Drive, and Lamar/Burnet. We are also successfully working with the Union Pacific Railroad to finally bring quiet zones to the MOPAC rail corridor so that our surrounding neighborhoods will be less impacted by freight activities. In addition to the Bond Program, ATD is the City of Austin’s lead in developing an Urban Rail proposal for our community. This past year, we worked with our regional partners (Lone Star Rail and Capital Metro) to develop an update to the regional high capacity transit system known as Project Connect. Specifically on Urban Rail, we brought to Council a recommendation on prioritized elements of an Urban Rail system plan. In the coming fiscal year, we will continue our work to refine the plan and will complete the formal alternatives analysis and environmental process necessary to apply for Federal New Starts grant funding. In the following pages, budget highlights for ATD’s FY 2012-13 Budget proposal are provided. With this budget, ATD anticipates continued improvements throughout the transportation portfolio, including in our signal/arterial management, parking management, right-of-way and event management programs; as well as in our more traditional roadway signs, markings, project development and traffic engineering responsibilities.
Robert Spillar, P.E. Transportation Director
2012-13 Proposed Budget, Austin, TX
264 | Volume I
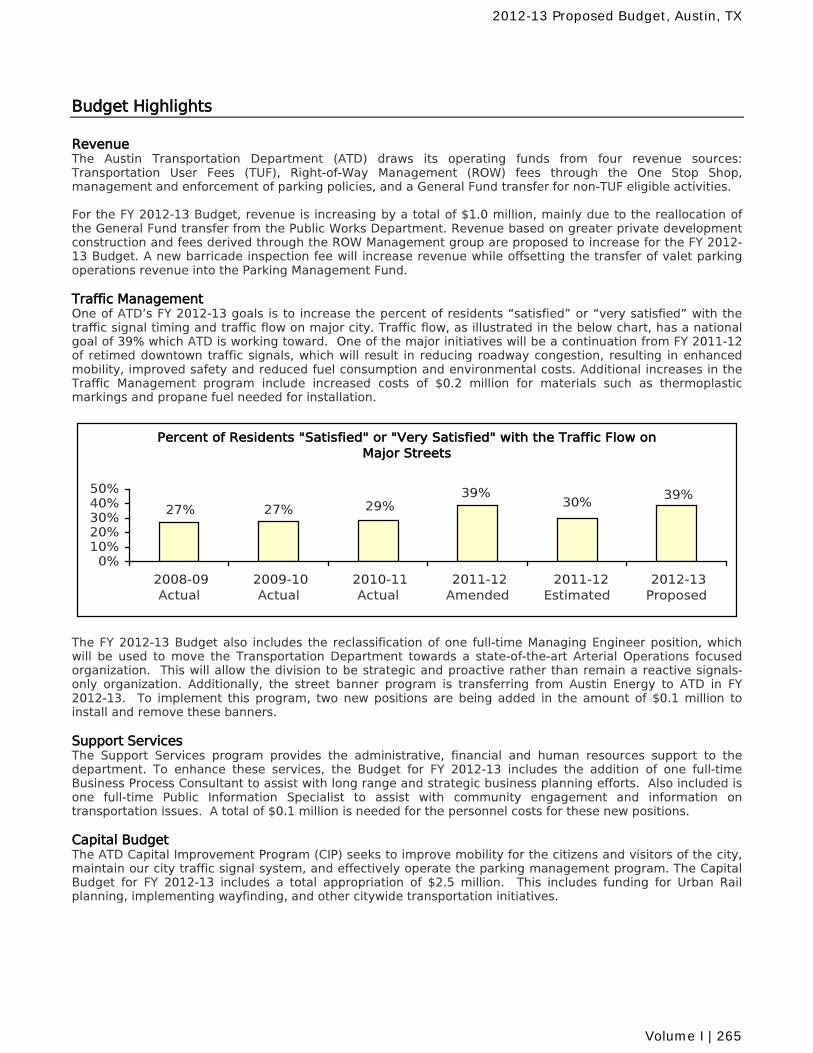
Budget Highlights
Revenue The Austin Transportation Department (ATD) draws its operating funds from four revenue sources: Transportation User Fees (TUF), Right-of-Way Management (ROW) fees through the One Stop Shop, management and enforcement of parking policies, and a General Fund transfer for non-TUF eligible activities. For the FY 2012-13 Budget, revenue is increasing by a total of $1.0 million, mainly due to the reallocation of the General Fund transfer from the Public Works Department. Revenue based on greater private development construction and fees derived through the ROW Management group are proposed to increase for the FY 2012-13 Budget. A new barricade inspection fee will increase revenue while offsetting the transfer of valet parking operations revenue into the Parking Management Fund. Traffic Management One of ATD’s FY 2012-13 goals is to increase the percent of residents “satisfied” or “very satisfied” with the traffic signal timing and traffic flow on major city. Traffic flow, as illustrated in the below chart, has a national goal of 39% which ATD is working toward. One of the major initiatives will be a continuation from FY 2011-12 of retimed downtown traffic signals, which will result in reducing roadway congestion, resulting in enhanced mobility, improved safety and reduced fuel consumption and environmental costs. Additional increases in the Traffic Management program include increased costs of $0.2 million for materials such as thermoplastic markings and propane fuel needed for installation.
Percent of Residents "Satisfied" or "Very Satisfied" with the Traffic Flow on Major Streets
39%30%
39%29%27%27%
0%10%20%30%40%50%
2008-09 Actual
2009-10 Actual
2010-11 Actual
2011-12 Amended
2011-12 Estimated
2012-13 Proposed
The FY 2012-13 Budget also includes the reclassification of one full-time Managing Engineer position, which will be used to move the Transportation Department towards a state-of-the-art Arterial Operations focused organization. This will allow the division to be strategic and proactive rather than remain a reactive signals-only organization. Additionally, the street banner program is transferring from Austin Energy to ATD in FY 2012-13. To implement this program, two new positions are being added in the amount of $0.1 million to install and remove these banners. Support Services The Support Services program provides the administrative, financial and human resources support to the department. To enhance these services, the Budget for FY 2012-13 includes the addition of one full-time Business Process Consultant to assist with long range and strategic business planning efforts. Also included is one full-time Public Information Specialist to assist with community engagement and information on transportation issues. A total of $0.1 million is needed for the personnel costs for these new positions. Capital Budget The ATD Capital Improvement Program (CIP) seeks to improve mobility for the citizens and visitors of the city, maintain our city traffic signal system, and effectively operate the parking management program. The Capital Budget for FY 2012-13 includes a total appropriation of $2.5 million. This includes funding for Urban Rail planning, implementing wayfinding, and other citywide transportation initiatives.
2012-13 Proposed Budget, Austin, TX
Volume I | 265
Other Funds
Parking Management Fund This fund realizes all its revenue from pay stations, parking meters, and transportation permitting from taxicabs, chauffeurs and limousines. In the FY 2012-13 Budget, total parking revenue is increasing approximately $0.5 million based largely on revenue from parking fees and the Car2Go program. Additionally, revenue realized by the fund is to be reinvested back into the transportation system and in the downtown area. A total of $2.5 million is transferring to the Capital Budget to provide increased funding for studying urban rail, implementation of the second phase of wayfinding, and other various downtown and transportation initiatives. To assist with these transportation initiatives, $0.2 million is included in the FY 2012-13 Budget for 2.50 temporary employees. These temporary employees will provide community outreach, develop communication materials, and create graphic designs for public documents for both urban rail and Project Connect, the multi-jurisdictional effort to coordinate transportation issues, The FY 2012-13 Budget also includes increasing administrative and program support including one new Ground Transportation Officer position and one part-time Administrative Specialist position and related costs in the Vehicles for Hire unit to assist with valet parking enforcement. The FY 2012-13 budget also includes the purchase of one SUV hybrid vehicle for the Ground Transportation Officer and two replacement vehicles in the Parking Enforcement program. Lastly, funding of $0.2 million for two Environmental Program Coordinator positions, which transferred from Austin Energy Department in FY 2011-12 for the Clean Air Program, is now being included in the FY 2012-13 Budget.
2012-13 Proposed Budget, Austin, TX
266 | Volume I
Revenue Changes Dollars
The Budget includes an increase of $102,448 for revenue from increased afterhours inspection fees, new capital improvement project barricade inspection fees,license agreement revenue and general permitting and inspection. $102,448
The Budget includes an allocation of $850,629 for revenue from the General Fundtransfer being reallocated to the Austin Transportation Department based on ananalysis of Transportation User Fee eligible projects. $850,629
Expenditure Changes FTEs Dollars
CitywideThe Budget includes $200,864 for salary increases associated with wageadjustments in FY 2013. An additional $36,533 is included in the Budget forincreased City contributions for health insurance. $237,397
The Budget includes additional funding for the Employees' Retirement System thatis equivalent to 2% of payroll for non-civil service employees to help improve thefunded status of the pension system. $129,341
In previous years, the Public Works Department budgeted the entire supplementalpension funding for the Employees' Retirement System for the AustinTransportation Department (ATD). This funding is being reallocated to ATD for theBudget, thereby reducing the total pension budget. $555,188
Traffic ManagementThis Budget includes an increase of $44,772 for the annualized costs of adding anew markings crew added in the prior year Budget. $44,772
Included in the Budget is an increase of $166,000 for the purchase of additionalthermoplastic markings material and propane fuel needed for its installation. Thisincrease annualizes the materials cost of the markings crew added last year. $166,000
A total of $98,642 will be reimbursed by the Parking Management Fund formarkings installation related to striping parking spaces. ($98,642)
For the Transportation Engineering activity, the Budget includes a reduction of$45,000 for prior year retirements and additional reductions for the one-timepurchase of minor tools, equipment and computer hardware. ($86,000)
The Budget also includes an increase in expense refunds for work associated withreviewing street parking signs and markings for compliance with all codes andordinances. ($108,642)
The Traffic Signs activity is assuming the tasks for installing and removing streetbanners from Austin Energy. The street banner function requires two new positions for implementation. 2.00 $117,255
Significant ChangesAustin Transportation
Transportation Fund
2012-13 Proposed Budget, Austin, TX
Volume I | 267
Expenditure Changes FTEs Dollars
The Traffic Management Program has a net reduction of $223,000 for a one-timeexpense for security improvements at the service center on Toomey Road andreduction in capital for prior-year vehicle purchases. ($223,000)
The Traffic Signals program is reclassifying an Engineer C position to a ManagingEngineer position for a net impact of $22,972. $22,972
The Budget reflects the backing out of costs for replacing computer hardware andone vehicle purchased in the prior year. ($55,566)
Transportation Project DevelopmentThe Budget includes a decrease in CIP reimbursements of $65,000 for workrelated to the 2010 Strategic Mobility Bond. $65,000
Personnel savings for this program are decreasing due to the program anticipatingno vacancies occurring during the FY 2013 Budget. $58,143
One Stop ShopThe One Stop Shop includes an interdepartmental charge for services provided tothe Parking Management Fund ($60,000)
The Budget includes a decrease of $35,000 for a vehicle purchased in the prioryear. ($35,000)
This Budget also includes an increase of $85,908 in lease costs for the co-locationof the Office of Special Events with other City departments to streamline the Cityevent planning and logistics. $85,908
Support ServicesThe Support Services program has an increase of one position for a BusinessProcess Consultant to assist with long range and strategic business efforts. Thisposition will be reimbursed from the Parking Management Fund for 50% of theposition cost. 1.00 $48,101
This program also includes one new Public Information Specialist to assist withcommunity engagement and information on transportation issues. 1.00 $71,713
The Budget also includes a reduction of $6,000 for prior year computer hardwarepurchases. ($6,000)
Revenue Changes Dollars
The Budget includes an increase of $58,640 for revenue from parking pay stationand meter revenue based on prior year collections from pay stations. $58,640
The Budget includes an increase of $358,400 for revenue from the Austin CarShare program. $358,400
The Budget includes an increase of $10,000 for revenue from interest earned. $10,000
The Budget includes an increase of $58,541 for revenue from an increase intransportation permits for limousine licenses. $58,541
Parking Management Fund
2012-13 Proposed Budget, Austin, TX
268 | Volume I
Expenditure Changes FTEs Dollars
CitywideThe Budget includes $53,757 for salary increases associated with wageadjustments in FY 2013. An additional $14,122 is included in the Budget forincreased City contributions for health insurance. $67,879
The Budget includes $2,959 for wage adjustments associated with implementingthe City's recently completed market study. $2,959
The Budget includes additional funding for the Employees' Retirement System thatis equivalent to 2% of payroll for non-civil service employees to help improve thefunded status of the pension system. $33,363
Parking EnterpriseIncluded in this Budget is the addition of one new Ground Transportation Officerposition and uniform costs in the Vehicles for Hire unit to assist with valet parkingenforcement. 1.00 $49,880
This Budget includes the addition of a 0.5 Administrative Specialist and relatedcomputer and office costs to assist with the vehicles for hire and valet parkingprogram. 0.50 $31,195
Based on the work in public information services needed for urban rail and ProjectConnect, $200,000 for temporary employees is included in the Budget. $200,000
Terminal pay for an anticipated retirements, two replacement vehicles andbudgets for increased telephone communications costs due to an increase of 150pay stations are included in the Budget. This is partially offset with a reduction inexpenses for consultants and spare meter parts. $163,500
The Parking Management program also has an increase of $48,101 to reimburse50% of the cost for a Business Process Consultant position in the AustinTransportation Department. $48,101
Interdepartmental charges are increasing by $295,828 for engineering, signs andmarking support provided to the Austin Transportation Department. $295,828
A net reduction in interdepartmental charges of $221,027 is included in theBudget for two positions related to the City's Clean Air program that transferredfrom Austin Energy to the Transportation Department in the FY 2012 Budget andtwo temporary public information positions working on urban rail. $221,027
Cost for fleet and fuel products for the Fund are increasing by $53,311. $53,311
Department-wideThe Budget includes funding increases for the creation of two new capitalimprovement projects; $1,000,000 is for Transportation Initiatives citywide and$300,000 is for Downtown Initiatives to implement way-finding. $1,300,000
The annual other requirements for Administrative Support, CTM Support, AccruedPayroll and Compensation Program are decreasing a net total of $139,814. ($139,814)
Transfers and Other RequirementsThe transfer for the Great Streets program is increasing based on proposed paystation and meter revenue for the downtown core area. $783,019
2012-13 Proposed Budget, Austin, TX
Volume I | 269
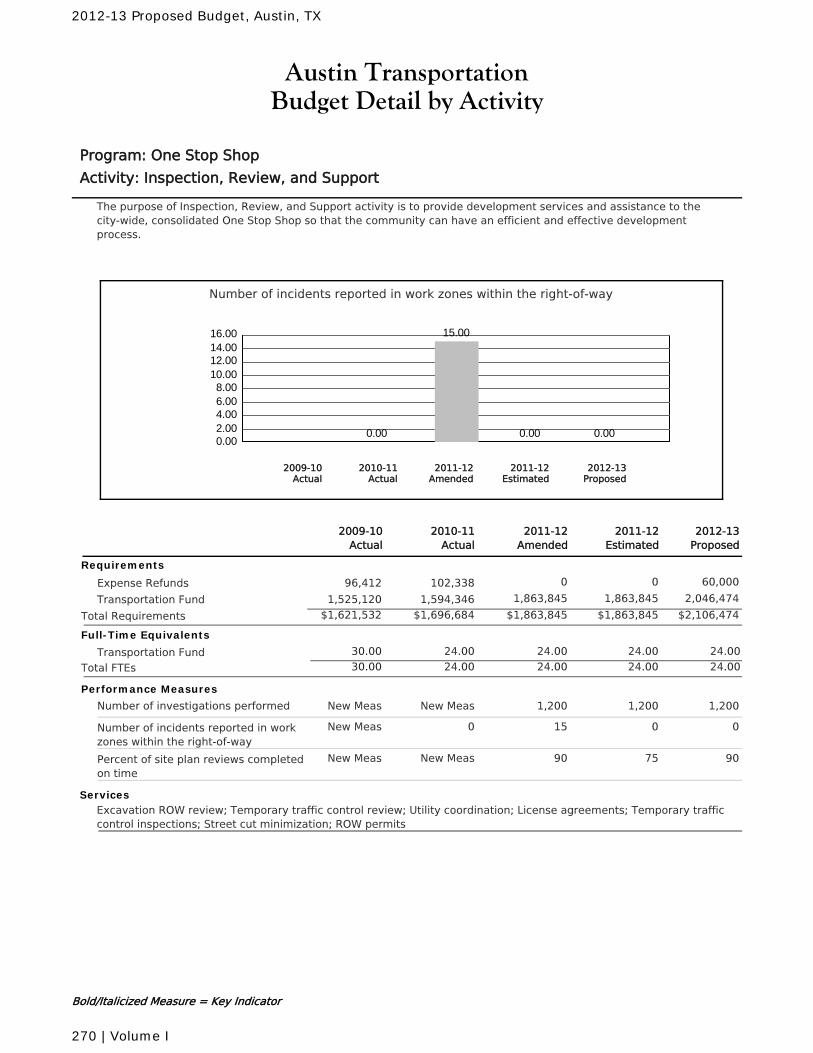
Austin TransportationBudget Detail by Activity
Program: One Stop Shop
Activity: Inspection, Review, and Support
The purpose of Inspection, Review, and Support activity is to provide development services and assistance to thecity-wide, consolidated One Stop Shop so that the community can have an efficient and effective developmentprocess.
Number of incidents reported in work zones within the right-of-way
0.002.004.006.008.00
10.0012.0014.0016.00
0.00
15.00
0.00 0.00
2010-11Actual
2012-13Proposed
2011-12Amended
2011-12Estimated
2009-10Actual
2011-12Amended
2010-11Actual
2011-12Estimated
2012-13Proposed
2009-10Actual
Requirements
Expense Refunds 0 0 60,000102,33896,412
Transportation Fund 1,863,845 1,863,845 2,046,4741,594,3461,525,120
$1,863,845 $1,863,845 $2,106,474Total Requirements $1,696,684$1,621,532
Full-Time Equivalents
Transportation Fund 24.00 24.00 24.00 24.0030.00
Total FTEs 24.00 24.00 24.00 24.0030.00
Performance Measures
Number of investigations performed 1,200New Meas 1,200 1,200New Meas
Number of incidents reported in workzones within the right-of-way
150 0 0New Meas
Percent of site plan reviews completedon time
90New Meas 75 90New Meas
ServicesExcavation ROW review; Temporary traffic control review; Utility coordination; License agreements; Temporary trafficcontrol inspections; Street cut minimization; ROW permits
Bold/Italicized Measure = Key Indicator
2012-13 Proposed Budget, Austin, TX
270 | Volume I
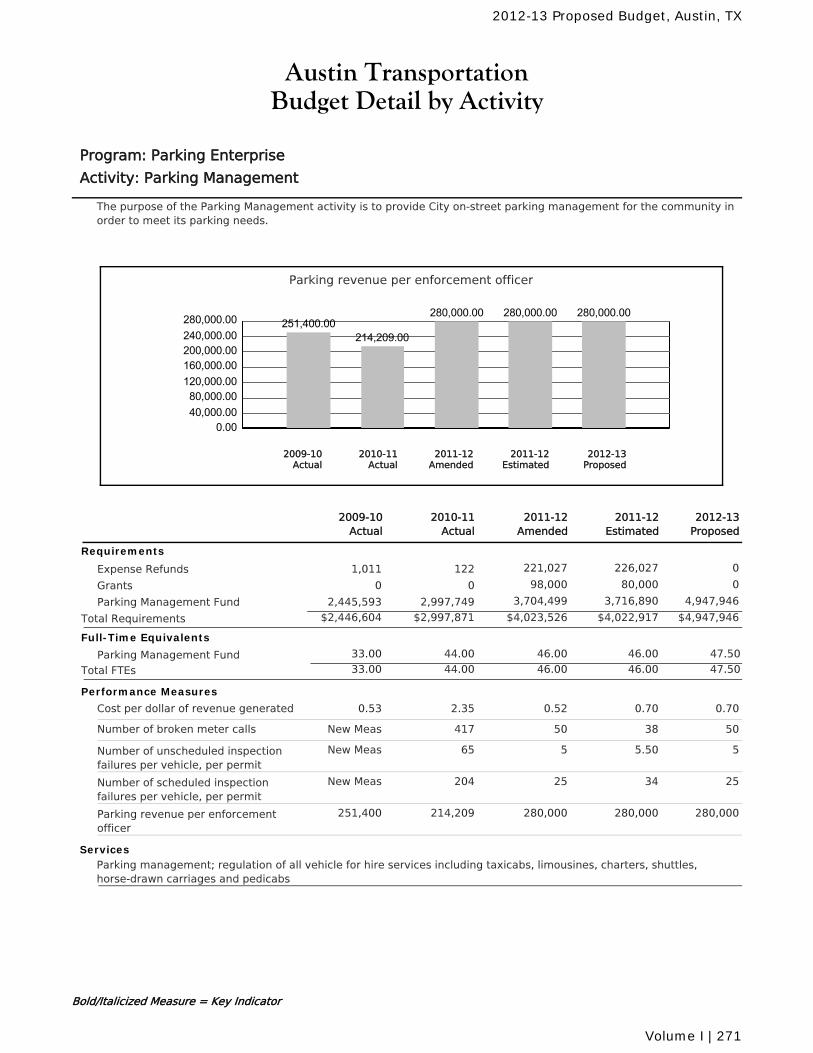
Austin TransportationBudget Detail by Activity
Program: Parking Enterprise
Activity: Parking Management
The purpose of the Parking Management activity is to provide City on-street parking management for the community inorder to meet its parking needs.
Parking revenue per enforcement officer
0.0040,000.0080,000.00
120,000.00160,000.00200,000.00240,000.00280,000.00 251,400.00
214,209.00
280,000.00 280,000.00 280,000.00
2010-11Actual
2012-13Proposed
2011-12Amended
2011-12Estimated
2009-10Actual
2011-12Amended
2010-11Actual
2011-12Estimated
2012-13Proposed
2009-10Actual
Requirements
Expense Refunds 221,027 226,027 01221,011
Grants 98,000 80,000 000
Parking Management Fund 3,704,499 3,716,890 4,947,9462,997,7492,445,593
$4,023,526 $4,022,917 $4,947,946Total Requirements $2,997,871$2,446,604
Full-Time Equivalents
Parking Management Fund 44.00 46.00 46.00 47.5033.00
Total FTEs 44.00 46.00 46.00 47.5033.00
Performance Measures
Cost per dollar of revenue generated 0.522.35 0.70 0.700.53
Number of broken meter calls 50417 38 50New Meas
Number of unscheduled inspectionfailures per vehicle, per permit
565 5.50 5New Meas
Number of scheduled inspectionfailures per vehicle, per permit
25204 34 25New Meas
Parking revenue per enforcementofficer
280,000214,209 280,000 280,000251,400
ServicesParking management; regulation of all vehicle for hire services including taxicabs, limousines, charters, shuttles,horse-drawn carriages and pedicabs
Bold/Italicized Measure = Key Indicator
2012-13 Proposed Budget, Austin, TX
Volume I | 271
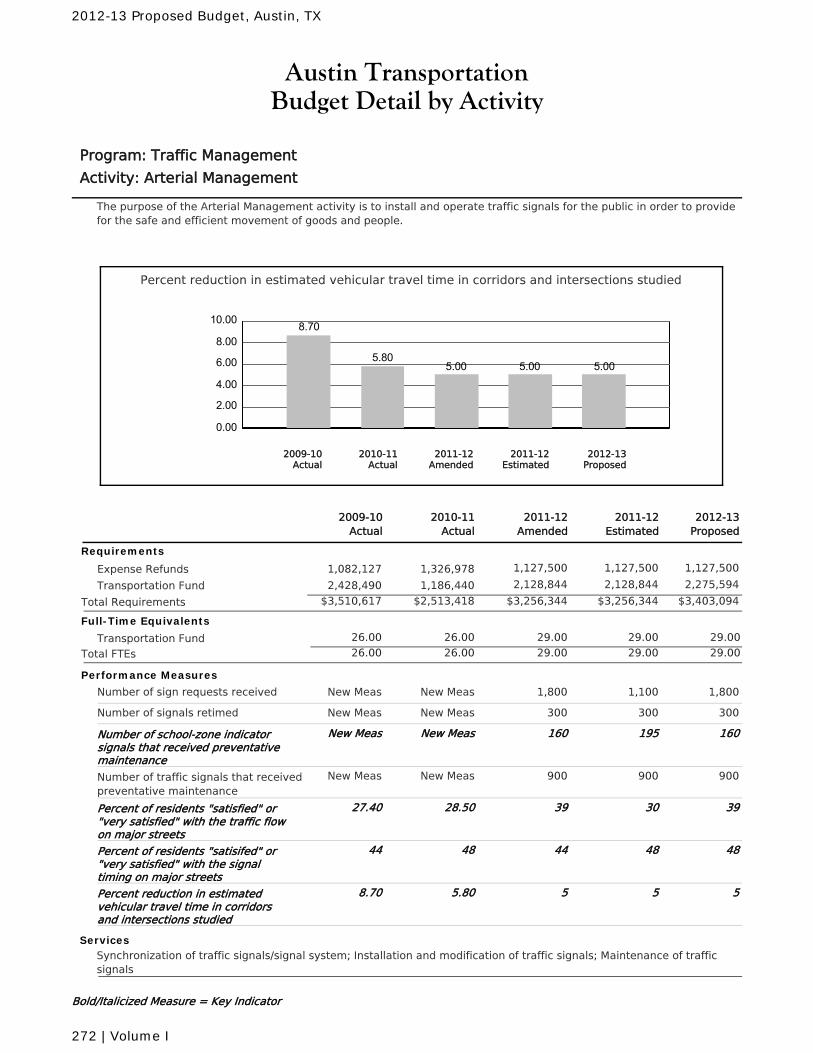
Austin TransportationBudget Detail by Activity
Program: Traffic Management
Activity: Arterial Management
The purpose of the Arterial Management activity is to install and operate traffic signals for the public in order to providefor the safe and efficient movement of goods and people.
Percent reduction in estimated vehicular travel time in corridors and intersections studied
0.00
2.00
4.00
6.00
8.00
10.00 8.70
5.805.00 5.00 5.00
2010-11Actual
2012-13Proposed
2011-12Amended
2011-12Estimated
2009-10Actual
2011-12Amended
2010-11Actual
2011-12Estimated
2012-13Proposed
2009-10Actual
Requirements
Expense Refunds 1,127,500 1,127,500 1,127,5001,326,9781,082,127
Transportation Fund 2,128,844 2,128,844 2,275,5941,186,4402,428,490
$3,256,344 $3,256,344 $3,403,094Total Requirements $2,513,418$3,510,617
Full-Time Equivalents
Transportation Fund 26.00 29.00 29.00 29.0026.00
Total FTEs 26.00 29.00 29.00 29.0026.00
Performance Measures
Number of sign requests received 1,800New Meas 1,100 1,800New Meas
Number of signals retimed 300New Meas 300 300New Meas
Number of school-zone indicatorsignals that received preventativemaintenance
160New Meas 195 160New Meas
Number of traffic signals that receivedpreventative maintenance
900New Meas 900 900New Meas
Percent of residents "satisfied" or"very satisfied" with the traffic flowon major streets
3928.50 30 3927.40
Percent of residents "satisifed" or"very satisfied" with the signaltiming on major streets
4448 48 4844
Percent reduction in estimatedvehicular travel time in corridorsand intersections studied
55.80 5 58.70
ServicesSynchronization of traffic signals/signal system; Installation and modification of traffic signals; Maintenance of trafficsignals
Bold/Italicized Measure = Key Indicator
2012-13 Proposed Budget, Austin, TX
272 | Volume I
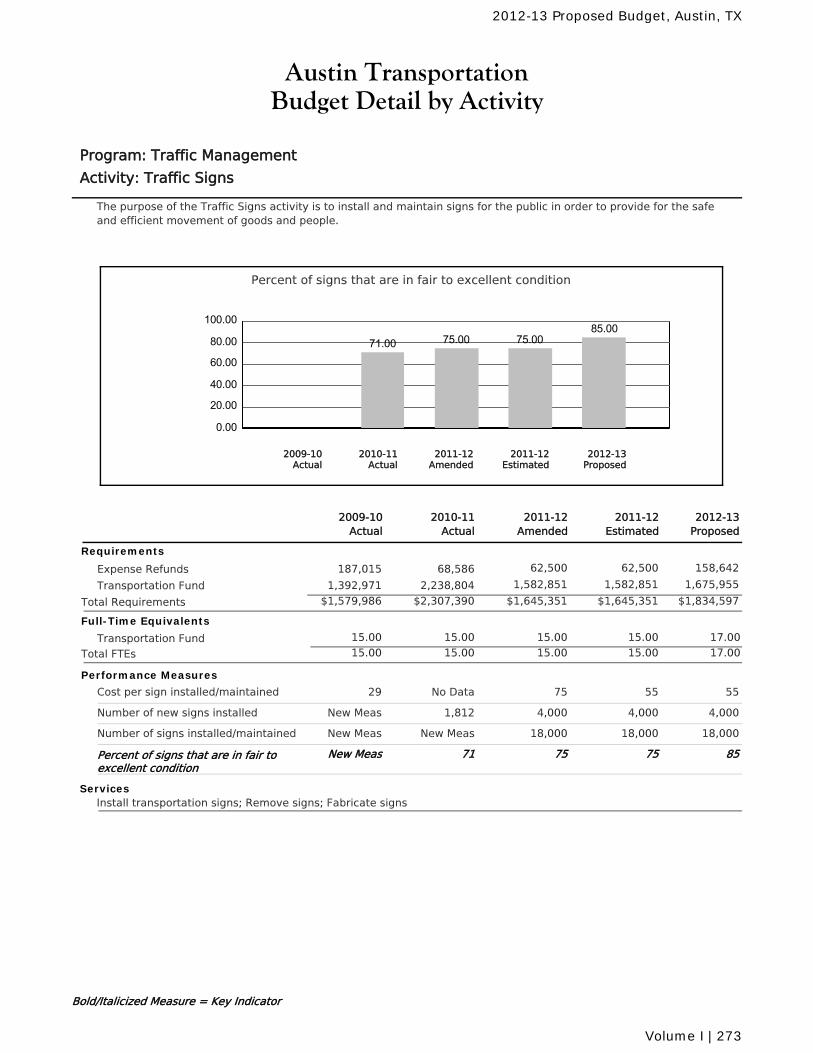
Austin TransportationBudget Detail by Activity
Program: Traffic Management
Activity: Traffic Signs
The purpose of the Traffic Signs activity is to install and maintain signs for the public in order to provide for the safeand efficient movement of goods and people.
Percent of signs that are in fair to excellent condition
0.00
20.00
40.00
60.00
80.00
100.00
71.00 75.00 75.0085.00
2010-11Actual
2012-13Proposed
2011-12Amended
2011-12Estimated
2009-10Actual
2011-12Amended
2010-11Actual
2011-12Estimated
2012-13Proposed
2009-10Actual
Requirements
Expense Refunds 62,500 62,500 158,64268,586187,015
Transportation Fund 1,582,851 1,582,851 1,675,9552,238,8041,392,971
$1,645,351 $1,645,351 $1,834,597Total Requirements $2,307,390$1,579,986
Full-Time Equivalents
Transportation Fund 15.00 15.00 15.00 17.0015.00
Total FTEs 15.00 15.00 15.00 17.0015.00
Performance Measures
Cost per sign installed/maintained 75No Data 55 5529
Number of new signs installed 4,0001,812 4,000 4,000New Meas
Number of signs installed/maintained 18,000New Meas 18,000 18,000New Meas
Percent of signs that are in fair toexcellent condition
7571 75 85New Meas
ServicesInstall transportation signs; Remove signs; Fabricate signs
Bold/Italicized Measure = Key Indicator
2012-13 Proposed Budget, Austin, TX
Volume I | 273
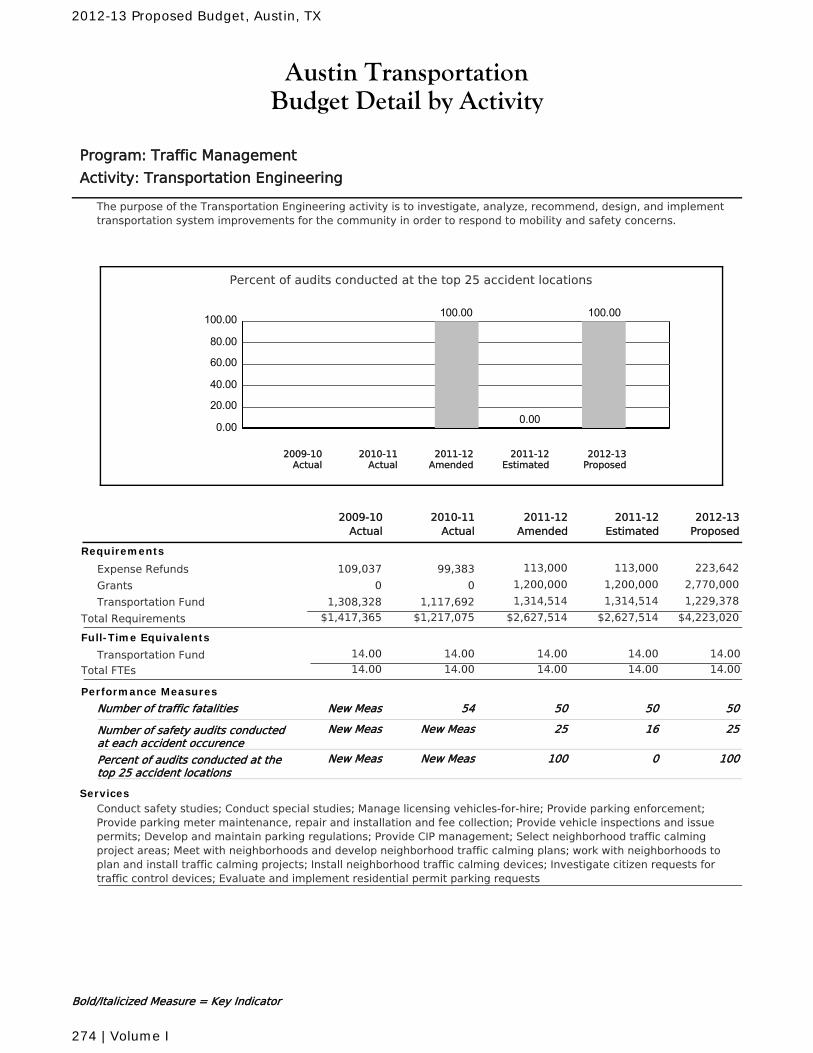
Austin TransportationBudget Detail by Activity
Program: Traffic Management
Activity: Transportation Engineering
The purpose of the Transportation Engineering activity is to investigate, analyze, recommend, design, and implementtransportation system improvements for the community in order to respond to mobility and safety concerns.
Percent of audits conducted at the top 25 accident locations
0.00
20.00
40.00
60.00
80.00
100.00 100.00
0.00
100.00
2010-11Actual
2012-13Proposed
2011-12Amended
2011-12Estimated
2009-10Actual
2011-12Amended
2010-11Actual
2011-12Estimated
2012-13Proposed
2009-10Actual
Requirements
Expense Refunds 113,000 113,000 223,64299,383109,037
Grants 1,200,000 1,200,000 2,770,00000
Transportation Fund 1,314,514 1,314,514 1,229,3781,117,6921,308,328
$2,627,514 $2,627,514 $4,223,020Total Requirements $1,217,075$1,417,365
Full-Time Equivalents
Transportation Fund 14.00 14.00 14.00 14.0014.00
Total FTEs 14.00 14.00 14.00 14.0014.00
Performance Measures
Number of traffic fatalities 5054 50 50New Meas
Number of safety audits conductedat each accident occurence
25New Meas 16 25New Meas
Percent of audits conducted at thetop 25 accident locations
100New Meas 0 100New Meas
ServicesConduct safety studies; Conduct special studies; Manage licensing vehicles-for-hire; Provide parking enforcement;Provide parking meter maintenance, repair and installation and fee collection; Provide vehicle inspections and issuepermits; Develop and maintain parking regulations; Provide CIP management; Select neighborhood traffic calmingproject areas; Meet with neighborhoods and develop neighborhood traffic calming plans; work with neighborhoods toplan and install traffic calming projects; Install neighborhood traffic calming devices; Investigate citizen requests fortraffic control devices; Evaluate and implement residential permit parking requests
Bold/Italicized Measure = Key Indicator
2012-13 Proposed Budget, Austin, TX
274 | Volume I
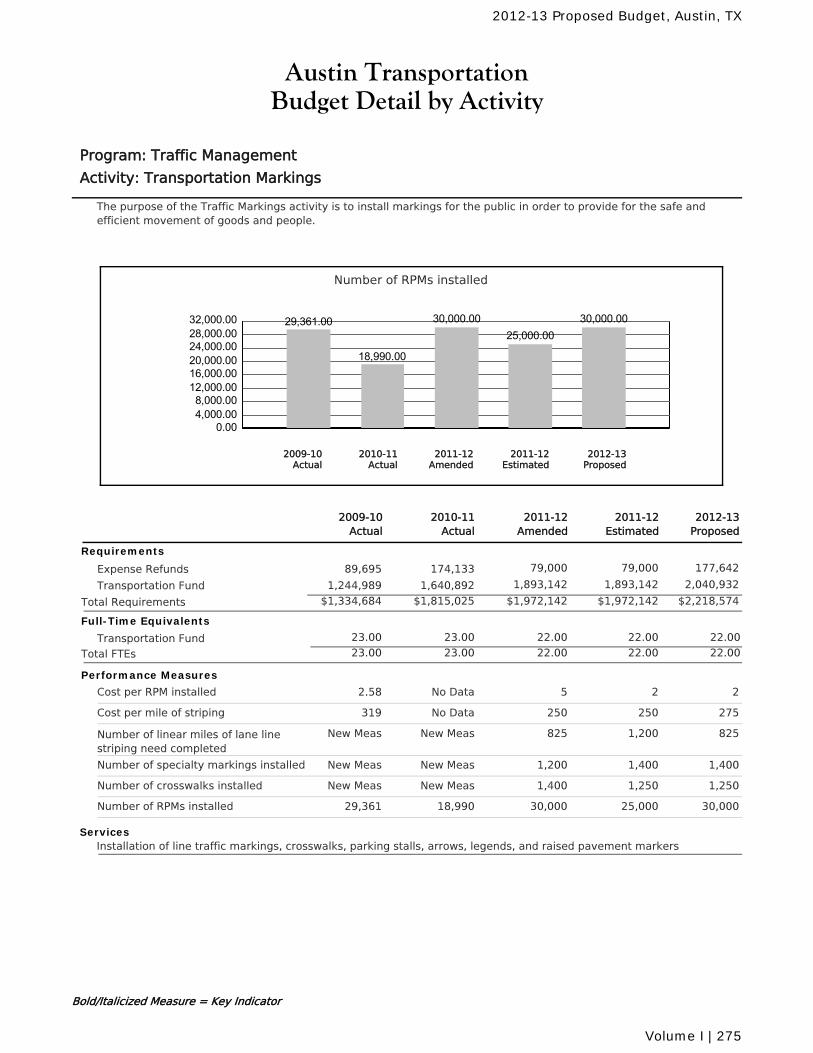
Austin TransportationBudget Detail by Activity
Program: Traffic Management
Activity: Transportation Markings
The purpose of the Traffic Markings activity is to install markings for the public in order to provide for the safe andefficient movement of goods and people.
Number of RPMs installed
0.004,000.008,000.00
12,000.0016,000.0020,000.0024,000.0028,000.0032,000.00 29,361.00
18,990.00
30,000.0025,000.00
30,000.00
2010-11Actual
2012-13Proposed
2011-12Amended
2011-12Estimated
2009-10Actual
2011-12Amended
2010-11Actual
2011-12Estimated
2012-13Proposed
2009-10Actual
Requirements
Expense Refunds 79,000 79,000 177,642174,13389,695
Transportation Fund 1,893,142 1,893,142 2,040,9321,640,8921,244,989
$1,972,142 $1,972,142 $2,218,574Total Requirements $1,815,025$1,334,684
Full-Time Equivalents
Transportation Fund 23.00 22.00 22.00 22.0023.00
Total FTEs 23.00 22.00 22.00 22.0023.00
Performance Measures
Cost per RPM installed 5No Data 2 22.58
Cost per mile of striping 250No Data 250 275319
Number of linear miles of lane linestriping need completed
825New Meas 1,200 825New Meas
Number of specialty markings installed 1,200New Meas 1,400 1,400New Meas
Number of crosswalks installed 1,400New Meas 1,250 1,250New Meas
Number of RPMs installed 30,00018,990 25,000 30,00029,361
ServicesInstallation of line traffic markings, crosswalks, parking stalls, arrows, legends, and raised pavement markers
Bold/Italicized Measure = Key Indicator
2012-13 Proposed Budget, Austin, TX
Volume I | 275
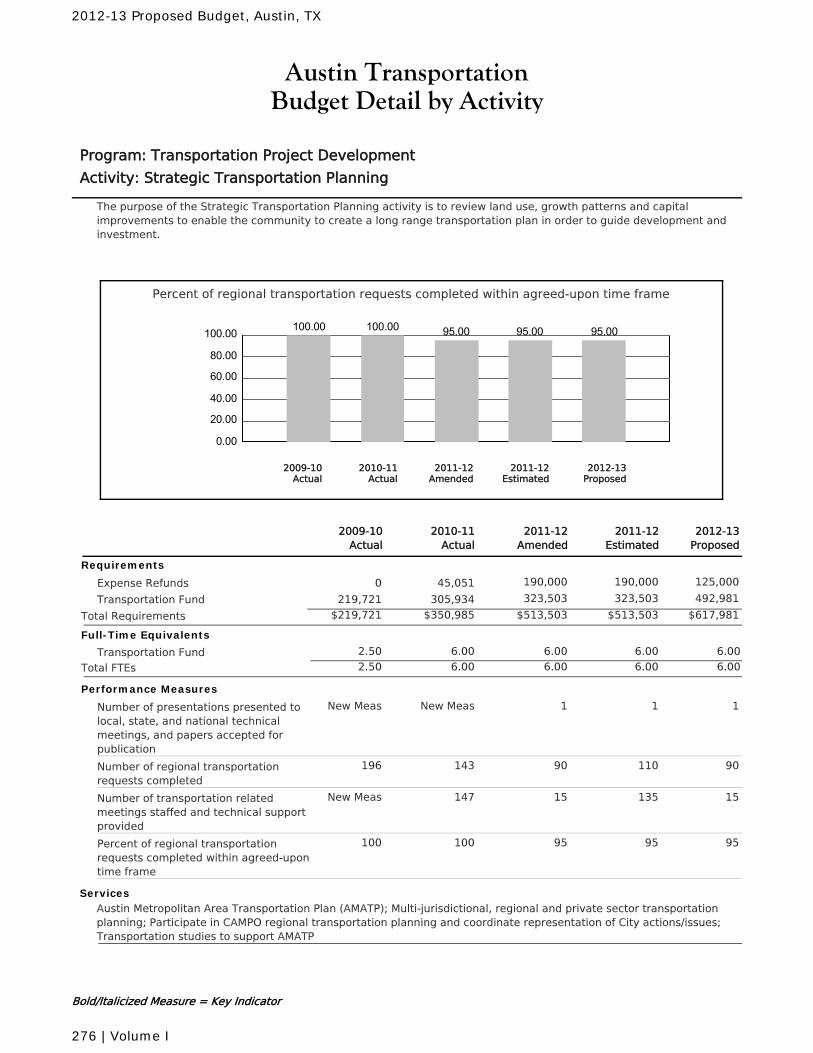
Austin TransportationBudget Detail by Activity
Program: Transportation Project Development
Activity: Strategic Transportation Planning
The purpose of the Strategic Transportation Planning activity is to review land use, growth patterns and capitalimprovements to enable the community to create a long range transportation plan in order to guide development andinvestment.
Percent of regional transportation requests completed within agreed-upon time frame
0.00
20.00
40.00
60.00
80.00
100.00 100.00 100.00 95.00 95.00 95.00
2010-11Actual
2012-13Proposed
2011-12Amended
2011-12Estimated
2009-10Actual
2011-12Amended
2010-11Actual
2011-12Estimated
2012-13Proposed
2009-10Actual
Requirements
Expense Refunds 190,000 190,000 125,00045,0510
Transportation Fund 323,503 323,503 492,981305,934219,721
$513,503 $513,503 $617,981Total Requirements $350,985$219,721
Full-Time Equivalents
Transportation Fund 6.00 6.00 6.00 6.002.50
Total FTEs 6.00 6.00 6.00 6.002.50
Performance Measures
Number of presentations presented tolocal, state, and national technicalmeetings, and papers accepted forpublication
1New Meas 1 1New Meas
Number of regional transportationrequests completed
90143 110 90196
Number of transportation relatedmeetings staffed and technical supportprovided
15147 135 15New Meas
Percent of regional transportationrequests completed within agreed-upontime frame
95100 95 95100
ServicesAustin Metropolitan Area Transportation Plan (AMATP); Multi-jurisdictional, regional and private sector transportationplanning; Participate in CAMPO regional transportation planning and coordinate representation of City actions/issues;Transportation studies to support AMATP
Bold/Italicized Measure = Key Indicator
2012-13 Proposed Budget, Austin, TX
276 | Volume I
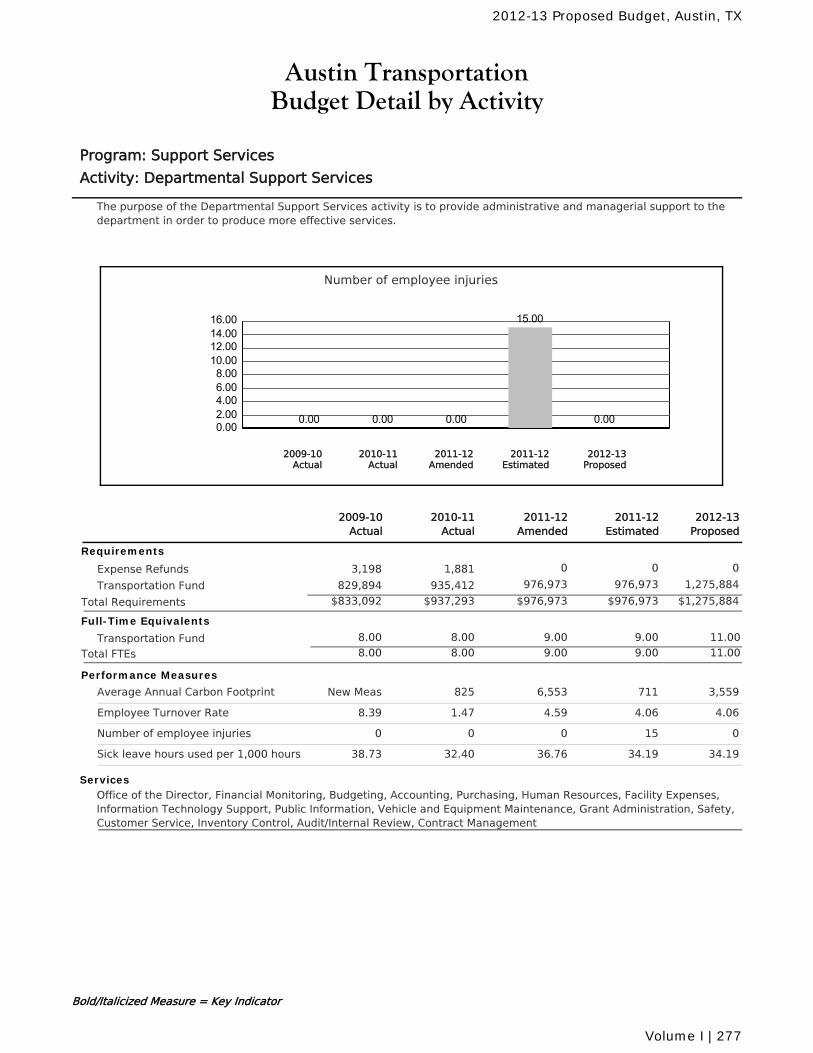
Austin TransportationBudget Detail by Activity
Program: Support Services
Activity: Departmental Support Services
The purpose of the Departmental Support Services activity is to provide administrative and managerial support to thedepartment in order to produce more effective services.
Number of employee injuries
0.002.004.006.008.00
10.0012.0014.0016.00
0.00 0.00 0.00
15.00
0.00
2010-11Actual
2012-13Proposed
2011-12Amended
2011-12Estimated
2009-10Actual
2011-12Amended
2010-11Actual
2011-12Estimated
2012-13Proposed
2009-10Actual
Requirements
Expense Refunds 0 0 01,8813,198
Transportation Fund 976,973 976,973 1,275,884935,412829,894
$976,973 $976,973 $1,275,884Total Requirements $937,293$833,092
Full-Time Equivalents
Transportation Fund 8.00 9.00 9.00 11.008.00
Total FTEs 8.00 9.00 9.00 11.008.00
Performance Measures
Average Annual Carbon Footprint 6,553825 711 3,559New Meas
Employee Turnover Rate 4.591.47 4.06 4.068.39
Number of employee injuries 00 15 00
Sick leave hours used per 1,000 hours 36.7632.40 34.19 34.1938.73
ServicesOffice of the Director, Financial Monitoring, Budgeting, Accounting, Purchasing, Human Resources, Facility Expenses,Information Technology Support, Public Information, Vehicle and Equipment Maintenance, Grant Administration, Safety,Customer Service, Inventory Control, Audit/Internal Review, Contract Management
Bold/Italicized Measure = Key Indicator
2012-13 Proposed Budget, Austin, TX
Volume I | 277
Austin TransportationBudget Detail by Activity
Program: Transfers & Other Requirements
Activity: All Activities
The purpose of the Transfers and Other Requirements program is to account for transfers and other departmentalrequirements at the fund or agency level.
Graph Not Applicable
2011-12Amended
2010-11Actual
2011-12Estimated
2012-13Proposed
2009-10Actual
Requirements
Parking Management Fund 3,793,007 2,790,616 5,675,1881,644,4431,387,554
$3,793,007 $2,790,616 $5,675,188Total Requirements $1,644,443$1,387,554
Bold/Italicized Measure = Key Indicator
2012-13 Proposed Budget, Austin, TX
278 | Volume I
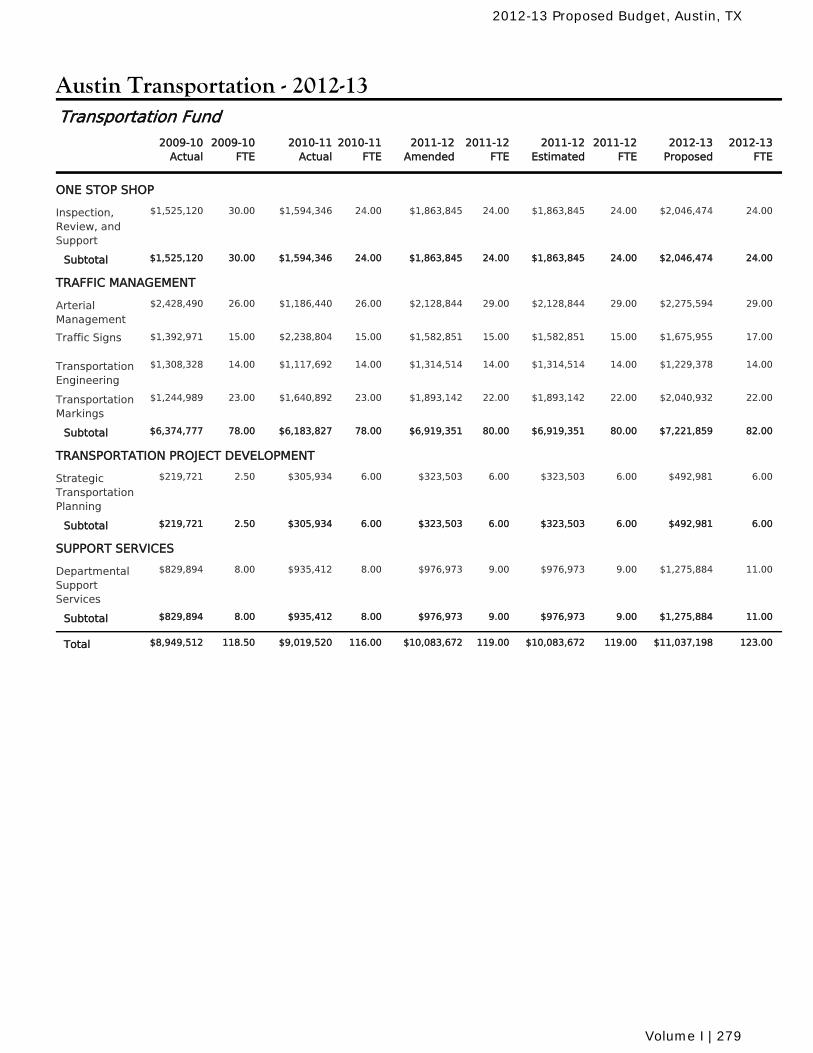
Austin Transportation - 2012-13
2010-11Actual
2010-11FTE
2011-12Amended
2011-12FTE
2011-12Estimated
2011-12FTE
2009-10Actual
2009-10FTE
2012-13Proposed
2012-13FTE
Transportation Fund
ONE STOP SHOP
$1,594,346 24.00 $1,863,845 24.00 $1,863,845 24.00Inspection,Review, andSupport
30.00 $2,046,474 24.00$1,525,120
$1,594,346 24.00 $1,863,845 24.00 $1,863,845 24.00Subtotal 30.00 $2,046,474 24.00$1,525,120
TRAFFIC MANAGEMENT
$1,186,440 26.00 $2,128,844 29.00 $2,128,844 29.00ArterialManagement
26.00 $2,275,594 29.00$2,428,490
$2,238,804 15.00 $1,582,851 15.00 $1,582,851 15.00Traffic Signs 15.00 $1,675,955 17.00$1,392,971
$1,117,692 14.00 $1,314,514 14.00 $1,314,514 14.00TransportationEngineering
14.00 $1,229,378 14.00$1,308,328
$1,640,892 23.00 $1,893,142 22.00 $1,893,142 22.00TransportationMarkings
23.00 $2,040,932 22.00$1,244,989
$6,183,827 78.00 $6,919,351 80.00 $6,919,351 80.00Subtotal 78.00 $7,221,859 82.00$6,374,777
TRANSPORTATION PROJECT DEVELOPMENT
$305,934 6.00 $323,503 6.00 $323,503 6.00StrategicTransportationPlanning
2.50 $492,981 6.00$219,721
$305,934 6.00 $323,503 6.00 $323,503 6.00Subtotal 2.50 $492,981 6.00$219,721
SUPPORT SERVICES
$935,412 8.00 $976,973 9.00 $976,973 9.00DepartmentalSupportServices
8.00 $1,275,884 11.00$829,894
$935,412 8.00 $976,973 9.00 $976,973 9.00Subtotal 8.00 $1,275,884 11.00$829,894
$9,019,520 116.00 $10,083,672 119.00 $10,083,672 119.00Total 118.50 $11,037,198 123.00$8,949,512
2012-13 Proposed Budget, Austin, TX
Volume I | 279
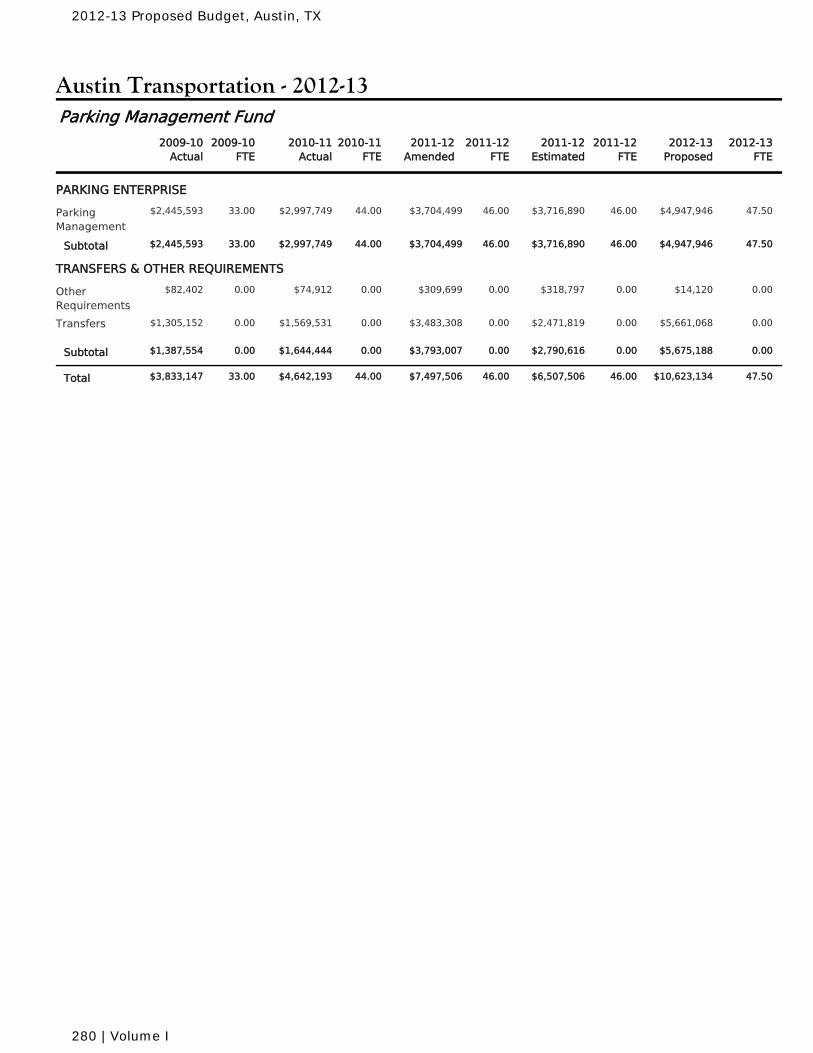
Austin Transportation - 2012-13
2010-11Actual
2010-11FTE
2011-12Amended
2011-12FTE
2011-12Estimated
2011-12FTE
2009-10Actual
2009-10FTE
2012-13Proposed
2012-13FTE
Parking Management Fund
PARKING ENTERPRISE
$2,997,749 44.00 $3,704,499 46.00 $3,716,890 46.00ParkingManagement
33.00 $4,947,946 47.50$2,445,593
$2,997,749 44.00 $3,704,499 46.00 $3,716,890 46.00Subtotal 33.00 $4,947,946 47.50$2,445,593
TRANSFERS & OTHER REQUIREMENTS
$74,912 0.00 $309,699 0.00 $318,797 0.00OtherRequirements
0.00 $14,120 0.00$82,402
$1,569,531 0.00 $3,483,308 0.00 $2,471,819 0.00Transfers 0.00 $5,661,068 0.00$1,305,152
$1,644,444 0.00 $3,793,007 0.00 $2,790,616 0.00Subtotal 0.00 $5,675,188 0.00$1,387,554
$4,642,193 44.00 $7,497,506 46.00 $6,507,506 46.00Total 33.00 $10,623,134 47.50$3,833,147
2012-13 Proposed Budget, Austin, TX
280 | Volume I
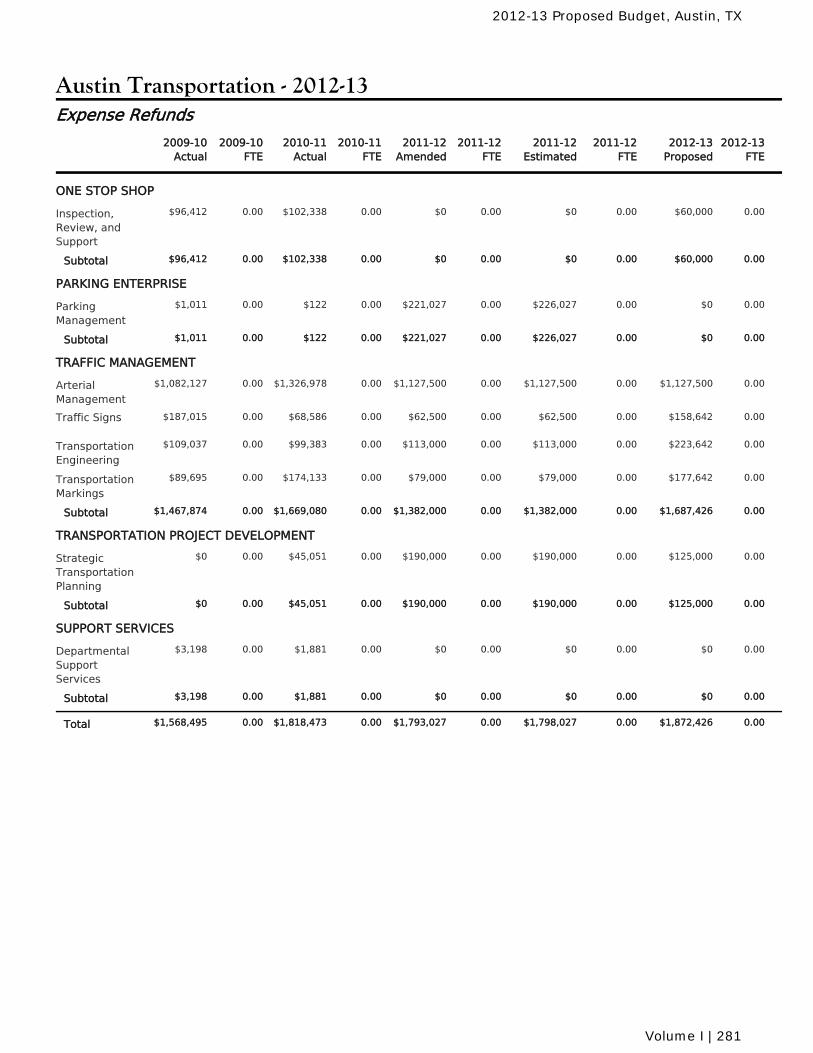
Austin Transportation - 2012-13
2010-11Actual
2010-11FTE
2011-12Amended
2011-12FTE
2011-12Estimated
2011-12FTE
2009-10Actual
2009-10FTE
2012-13Proposed
2012-13FTE
Expense Refunds
ONE STOP SHOP
$102,338 0.00 $0 0.00 $0 0.00Inspection,Review, andSupport
0.00 $60,000 0.00$96,412
$102,338 0.00 $0 0.00 $0 0.00Subtotal 0.00 $60,000 0.00$96,412
PARKING ENTERPRISE
$122 0.00 $221,027 0.00 $226,027 0.00ParkingManagement
0.00 $0 0.00$1,011
$122 0.00 $221,027 0.00 $226,027 0.00Subtotal 0.00 $0 0.00$1,011
TRAFFIC MANAGEMENT
$1,326,978 0.00 $1,127,500 0.00 $1,127,500 0.00ArterialManagement
0.00 $1,127,500 0.00$1,082,127
$68,586 0.00 $62,500 0.00 $62,500 0.00Traffic Signs 0.00 $158,642 0.00$187,015
$99,383 0.00 $113,000 0.00 $113,000 0.00TransportationEngineering
0.00 $223,642 0.00$109,037
$174,133 0.00 $79,000 0.00 $79,000 0.00TransportationMarkings
0.00 $177,642 0.00$89,695
$1,669,080 0.00 $1,382,000 0.00 $1,382,000 0.00Subtotal 0.00 $1,687,426 0.00$1,467,874
TRANSPORTATION PROJECT DEVELOPMENT
$45,051 0.00 $190,000 0.00 $190,000 0.00StrategicTransportationPlanning
0.00 $125,000 0.00$0
$45,051 0.00 $190,000 0.00 $190,000 0.00Subtotal 0.00 $125,000 0.00$0
SUPPORT SERVICES
$1,881 0.00 $0 0.00 $0 0.00DepartmentalSupportServices
0.00 $0 0.00$3,198
$1,881 0.00 $0 0.00 $0 0.00Subtotal 0.00 $0 0.00$3,198
$1,818,473 0.00 $1,793,027 0.00 $1,798,027 0.00Total 0.00 $1,872,426 0.00$1,568,495
2012-13 Proposed Budget, Austin, TX
Volume I | 281
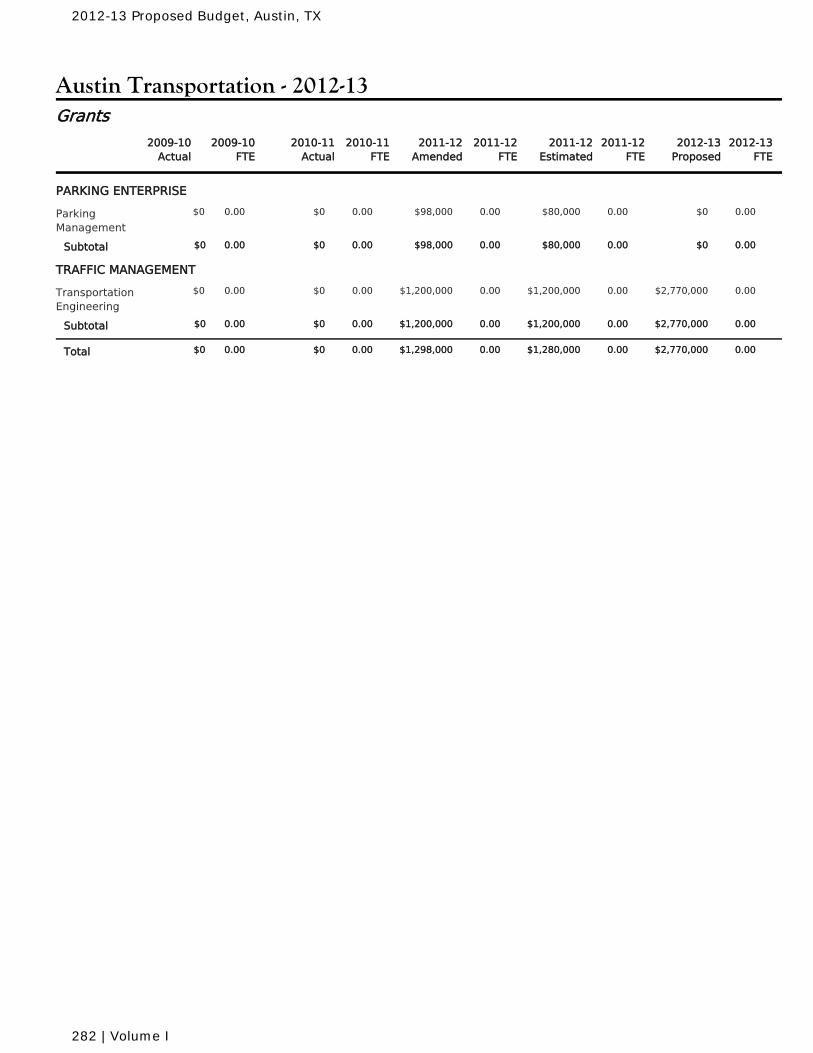
Austin Transportation - 2012-13
2010-11Actual
2010-11FTE
2011-12Amended
2011-12FTE
2011-12Estimated
2011-12FTE
2009-10Actual
2009-10FTE
2012-13Proposed
2012-13FTE
Grants
PARKING ENTERPRISE
$0 0.00 $98,000 0.00 $80,000 0.00ParkingManagement
0.00 $0 0.00$0
$0 0.00 $98,000 0.00 $80,000 0.00Subtotal 0.00 $0 0.00$0
TRAFFIC MANAGEMENT
$0 0.00 $1,200,000 0.00 $1,200,000 0.00TransportationEngineering
0.00 $2,770,000 0.00$0
$0 0.00 $1,200,000 0.00 $1,200,000 0.00Subtotal 0.00 $2,770,000 0.00$0
$0 0.00 $1,298,000 0.00 $1,280,000 0.00Total 0.00 $2,770,000 0.00$0
2012-13 Proposed Budget, Austin, TX
282 | Volume I
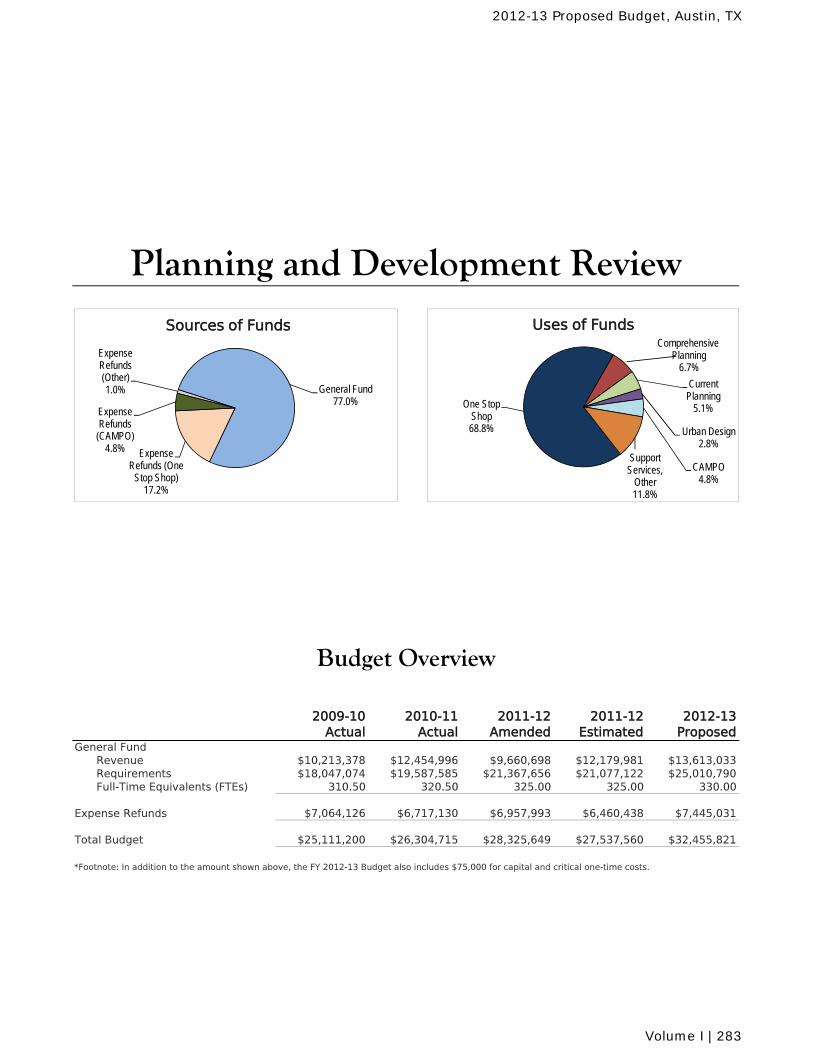
2009-10 Actual
2010-11 Actual
2011-12 Amended
2011-12 Estimated
2012-13 Proposed
General FundRevenue $10,213,378 $12,454,996 $9,660,698 $12,179,981 $13,613,033Requirements $18,047,074 $19,587,585 $21,367,656 $21,077,122 $25,010,790Full-Time Equivalents (FTEs) 310.50 320.50 325.00 325.00 330.00
Expense Refunds $7,064,126 $6,717,130 $6,957,993 $6,460,438 $7,445,031
Total Budget $25,111,200 $26,304,715 $28,325,649 $27,537,560 $32,455,821
*Footnote: In addition to the amount shown above, the FY 2012-13 Budget also includes $75,000 for capital and critical one-time costs.
Budget Overview
Planning and Development Review
General Fund77.0%
Expense Refunds (One
Stop Shop)17.2%
Expense Refunds
(CAMPO)4.8%
Expense Refunds (Other)1.0%
Sources of Funds
One Stop Shop68.8%
Current Planning
5.1%
Urban Design2.8%
CAMPO 4.8%
Support Services,
Other11.8%
Uses of FundsComprehensive
Planning6.7%
2012-13 Proposed Budget, Austin, TX
Volume I | 283
Planning and Development ReviewOrganization by Program and Activity for 2013
CAMPO
Neighborhood Assistance CenterNeighborhood Planning
AnnexationCode AmendmentZoning Case Management
Building InspectionCommercial Building Plan ReviewDevelopment Assistance CenterLand Use ReviewPermit CenterResidential ReviewSite/Subdivision Inspection
Urban Design
Departmental Support Services
Other Requirements
2012-13 Proposed Budget, Austin, TX
284 | Volume I
Planning and Development ReviewMission and Goals for 2013
Mission
The purpose of the Planning and Development Review Department (PDRD) is to provide planning,preservation, design, comprehensive development review and inspection services to make Austinthe most livable city in the country.
Goals
Implement the Imagine Austin comprehensive plan including a comprehensive revision to the AustinLand Development Code.
Complete neighborhood plans for all urban core planning areas by 2016.
Implement all urban core neighborhood plans through rezoning by 2016.
Ensure a more compact and well-designed city through planning initiatives such as the DowntownPlan, the Waller Creek District Master Plan and the East Riverside Corridor Master Plan.
Provide the public with a single One Stop Shop location for development needs to promote efficientuse of citizen and City staff time and resources.
2012-13 Proposed Budget, Austin, TX
Volume I | 285
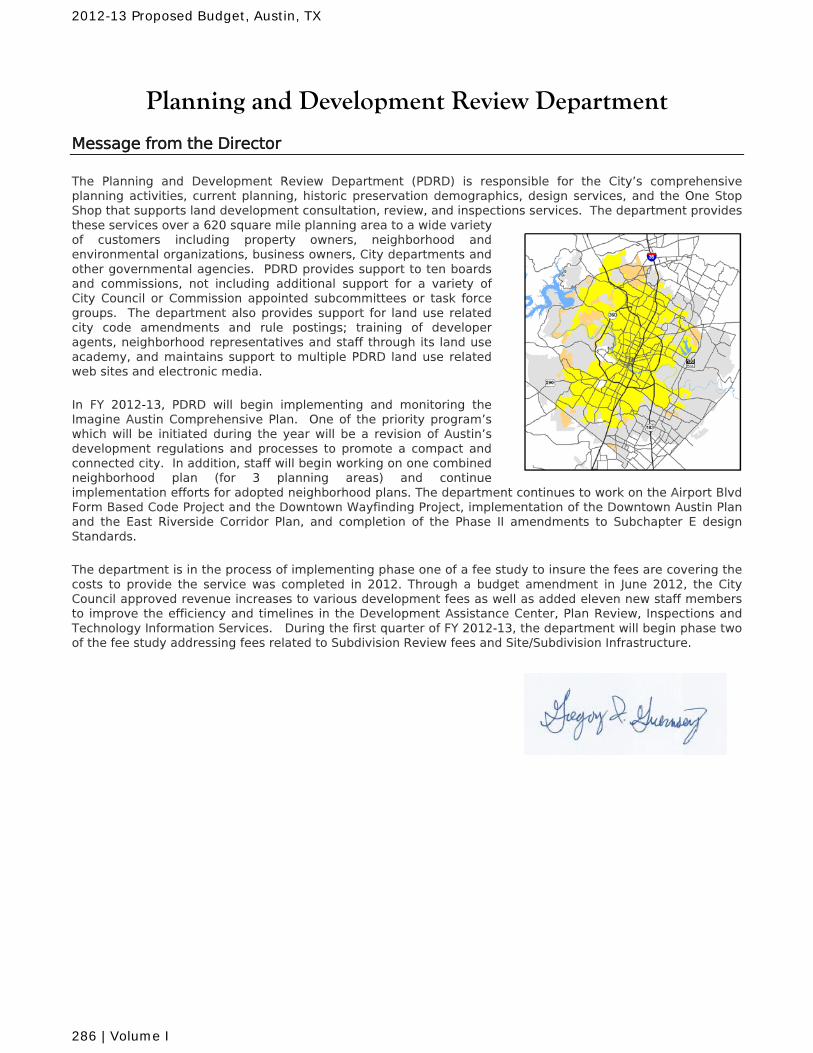
Planning and Development Review Department
Message from the Director
The Planning and Development Review Department (PDRD) is responsible for the City’s comprehensive planning activities, current planning, historic preservation demographics, design services, and the One Stop Shop that supports land development consultation, review, and inspections services. The department provides these services over a 620 square mile planning area to a wide variety of customers including property owners, neighborhood and environmental organizations, business owners, City departments and other governmental agencies. PDRD provides support to ten boards and commissions, not including additional support for a variety of City Council or Commission appointed subcommittees or task force groups. The department also provides support for land use related city code amendments and rule postings; training of developer agents, neighborhood representatives and staff through its land use academy, and maintains support to multiple PDRD land use related web sites and electronic media.
In FY 2012-13, PDRD will begin implementing and monitoring the Imagine Austin Comprehensive Plan. One of the priority program’s which will be initiated during the year will be a revision of Austin’s development regulations and processes to promote a compact and connected city. In addition, staff will begin working on one combined neighborhood plan (for 3 planning areas) and continue implementation efforts for adopted neighborhood plans. The department continues to work on the Airport Blvd Form Based Code Project and the Downtown Wayfinding Project, implementation of the Downtown Austin Plan and the East Riverside Corridor Plan, and completion of the Phase II amendments to Subchapter E design Standards.
The department is in the process of implementing phase one of a fee study to insure the fees are covering the costs to provide the service was completed in 2012. Through a budget amendment in June 2012, the City Council approved revenue increases to various development fees as well as added eleven new staff members to improve the efficiency and timelines in the Development Assistance Center, Plan Review, Inspections and Technology Information Services. During the first quarter of FY 2012-13, the department will begin phase two of the fee study addressing fees related to Subdivision Review fees and Site/Subdivision Infrastructure.
2012-13 Proposed Budget, Austin, TX
286 | Volume I
Budget Highlights
Comprehensive Planning The Comprehensive Planning Program is organized to develop, maintain, and implement the citywide comprehensive plan, more detailed neighborhood plans and other small area plans. It also provides planning support services such as GIS mapping and demographic/economic projections and analysis to other divisions within PDRD and other City of Austin departments. The Budget includes resources to begin implementation, evaluation, and monitoring of the Imagine Austin Comprehensive Plan, including the annual report required by the City Charter. In FY 2012-13 the department is adding three new positions, a Development Services Division Manager, a Planner Senior and an Administrative Assistant which will help ensure the new Code relates to the adopted plan, coordinate with other City Department’s process and procedures, and make sure all interested stakeholders are part of the process. The Budget also includes funding to begin a neighborhood plan for three planning areas and to continue the implementation and maintenance (amendments) of the 45 adopted neighborhood plans.
Percent of Neighborhood Participants Satisfied with the Neighborhood Planning Process
83.370.0 70.0
94.090.5
70.070.070.0 70.0 70.0
0.0%
20.0%
40.0%
60.0%
80.0%
100.0%
2009-10 Actual
2010-11 Actual
2011-12Amended
2011-12Estimated
2012-13Proposed
Current Planning The Current Planning Program is organized to process zoning text and map amendments; promote and coordinate historic preservation; and develop and maintain the City’s three-year municipal annexation plan (MAP). This division also oversees amendments to the City Code regarding land use and site development regulation. The historic preservation program continues to facilitate implementation of local historic districts, process historic zoning cases and demolition permits, and amend the historic zoning process as directed by City Council. The annexation division also continues to process annexation requests, start on new MAP annexation areas and continue work on Municipal Utility District (MUD) proposals. FY 2011-12 saw a significant number and size of MUDs approach the City as candidates for limited purpose annexation. The coming year is expected to be much more modest.
One Stop Shop The One Stop Shop (OSS) was created to serve as a central location where the community could address all of its development needs including review, permitting, and inspections. The OSS is comprised of several divisions located within the same building at One Texas Center designed to work together to ensure that development in Austin meets both long and short term planning goals. Depending on the complexity of the project and the experience of the applicant, the development process can begin in the Development Assistance Center, where a broad spectrum of technical staff provides specific guidance on their project. A more experienced applicant can apply directly to the Land Use Review division which consists of site plan, subdivision, transportation, drainage/water quality, notification and environmental review staff.
83.3
2012-13 Proposed Budget, Austin, TX
Volume I | 287
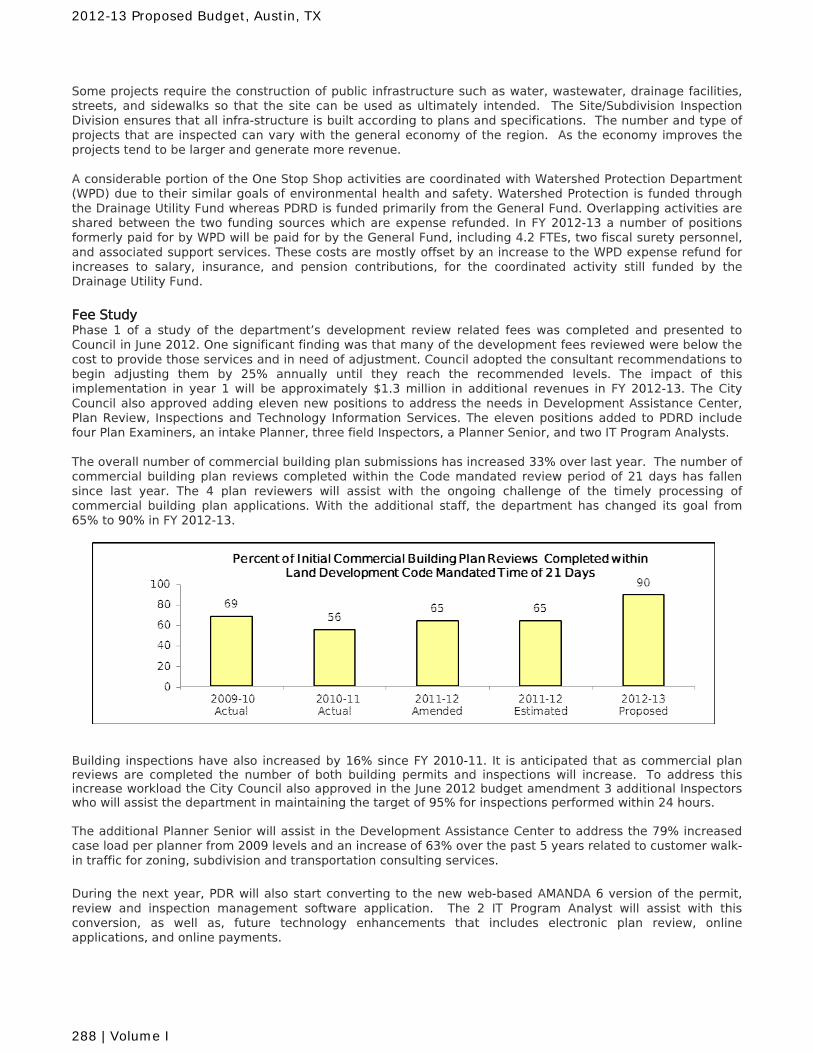
Some projects require the construction of public infrastructure such as water, wastewater, drainage facilities, streets, and sidewalks so that the site can be used as ultimately intended. The Site/Subdivision Inspection Division ensures that all infra-structure is built according to plans and specifications. The number and type of projects that are inspected can vary with the general economy of the region. As the economy improves the projects tend to be larger and generate more revenue. A considerable portion of the One Stop Shop activities are coordinated with Watershed Protection Department (WPD) due to their similar goals of environmental health and safety. Watershed Protection is funded through the Drainage Utility Fund whereas PDRD is funded primarily from the General Fund. Overlapping activities are shared between the two funding sources which are expense refunded. In FY 2012-13 a number of positions formerly paid for by WPD will be paid for by the General Fund, including 4.2 FTEs, two fiscal surety personnel, and associated support services. These costs are mostly offset by an increase to the WPD expense refund for increases to salary, insurance, and pension contributions, for the coordinated activity still funded by the Drainage Utility Fund.
Fee Study Phase 1 of a study of the department’s development review related fees was completed and presented to Council in June 2012. One significant finding was that many of the development fees reviewed were below the cost to provide those services and in need of adjustment. Council adopted the consultant recommendations to begin adjusting them by 25% annually until they reach the recommended levels. The impact of this implementation in year 1 will be approximately $1.3 million in additional revenues in FY 2012-13. The City Council also approved adding eleven new positions to address the needs in Development Assistance Center, Plan Review, Inspections and Technology Information Services. The eleven positions added to PDRD include four Plan Examiners, an intake Planner, three field Inspectors, a Planner Senior, and two IT Program Analysts. The overall number of commercial building plan submissions has increased 33% over last year. The number of commercial building plan reviews completed within the Code mandated review period of 21 days has fallen since last year. The 4 plan reviewers will assist with the ongoing challenge of the timely processing of commercial building plan applications. With the additional staff, the department has changed its goal from 65% to 90% in FY 2012-13.
Building inspections have also increased by 16% since FY 2010-11. It is anticipated that as commercial plan reviews are completed the number of both building permits and inspections will increase. To address this increase workload the City Council also approved in the June 2012 budget amendment 3 additional Inspectors who will assist the department in maintaining the target of 95% for inspections performed within 24 hours. The additional Planner Senior will assist in the Development Assistance Center to address the 79% increased case load per planner from 2009 levels and an increase of 63% over the past 5 years related to customer walk-in traffic for zoning, subdivision and transportation consulting services.
During the next year, PDR will also start converting to the new web-based AMANDA 6 version of the permit, review and inspection management software application. The 2 IT Program Analyst will assist with this conversion, as well as, future technology enhancements that includes electronic plan review, online applications, and online payments.
2012-13 Proposed Budget, Austin, TX
288 | Volume I
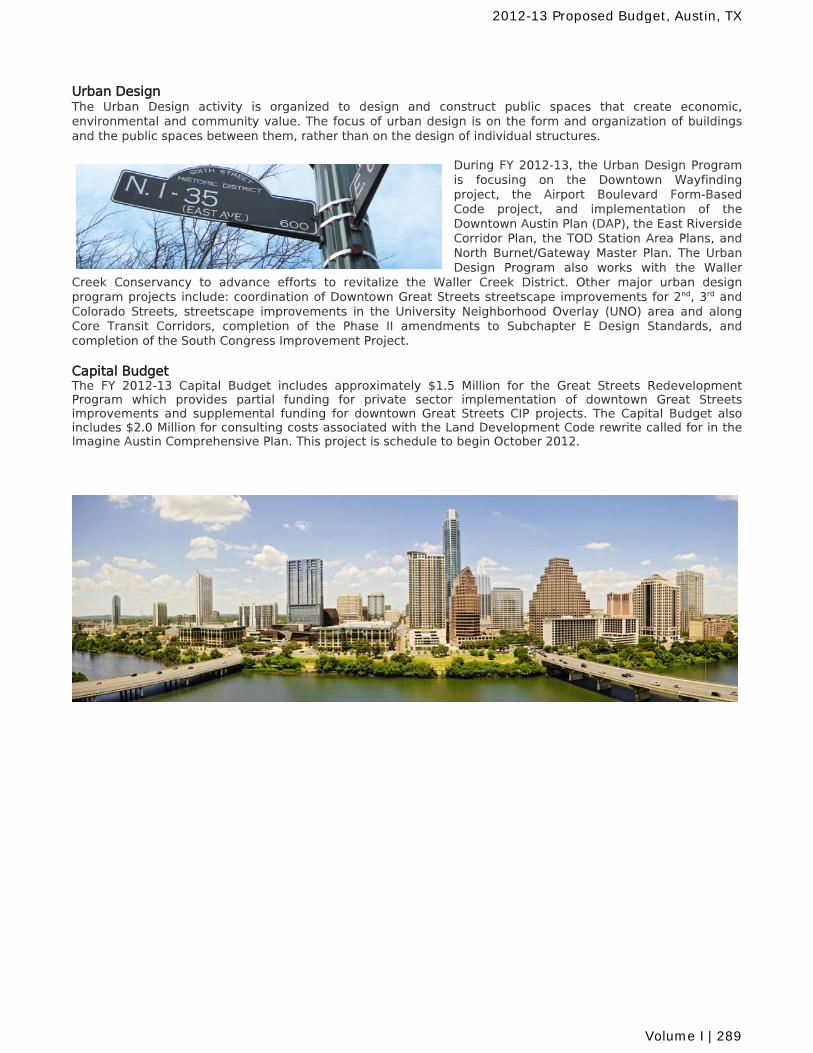
Urban Design The Urban Design activity is organized to design and construct public spaces that create economic, environmental and community value. The focus of urban design is on the form and organization of buildings and the public spaces between them, rather than on the design of individual structures.
During FY 2012-13, the Urban Design Program is focusing on the Downtown Wayfinding project, the Airport Boulevard Form-Based Code project, and implementation of the Downtown Austin Plan (DAP), the East Riverside Corridor Plan, the TOD Station Area Plans, and North Burnet/Gateway Master Plan. The Urban Design Program also works with the Waller
Creek Conservancy to advance efforts to revitalize the Waller Creek District. Other major urban design program projects include: coordination of Downtown Great Streets streetscape improvements for 2nd, 3rd and Colorado Streets, streetscape improvements in the University Neighborhood Overlay (UNO) area and along Core Transit Corridors, completion of the Phase II amendments to Subchapter E Design Standards, and completion of the South Congress Improvement Project. Capital Budget The FY 2012-13 Capital Budget includes approximately $1.5 Million for the Great Streets Redevelopment Program which provides partial funding for private sector implementation of downtown Great Streets improvements and supplemental funding for downtown Great Streets CIP projects. The Capital Budget also includes $2.0 Million for consulting costs associated with the Land Development Code rewrite called for in the Imagine Austin Comprehensive Plan. This project is schedule to begin October 2012.
2012-13 Proposed Budget, Austin, TX
Volume I | 289
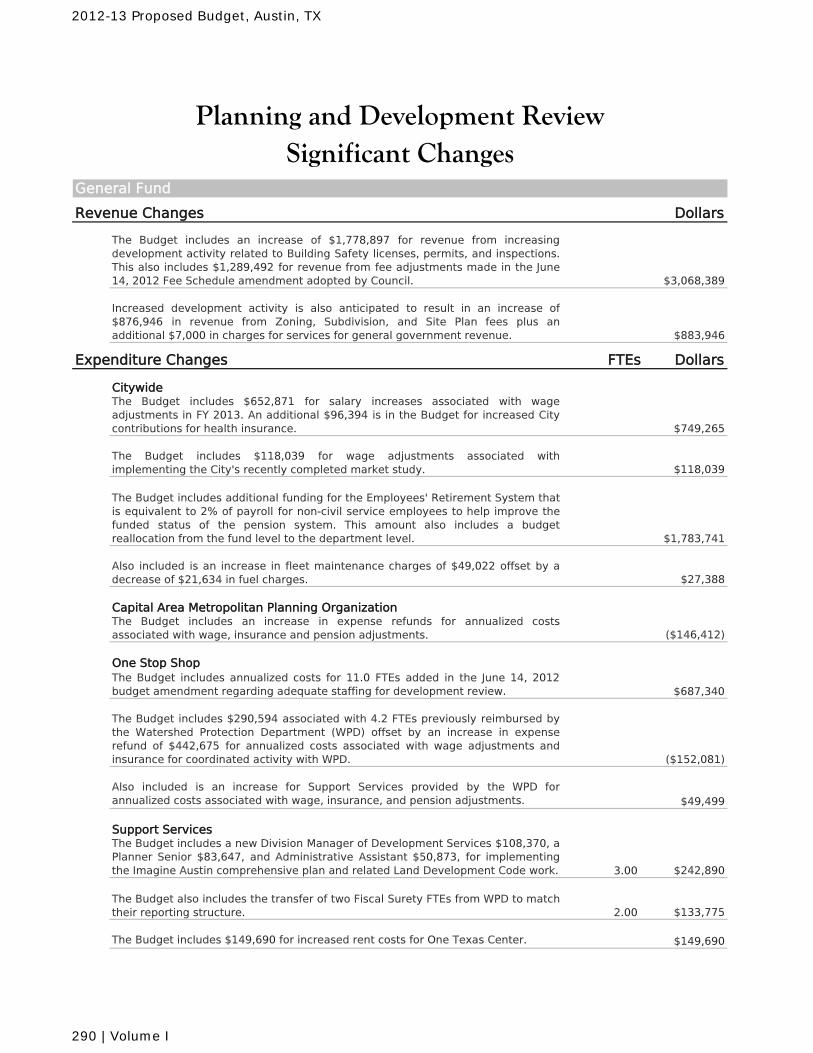
General Fund
Revenue Changes Dollars
The Budget includes an increase of $1,778,897 for revenue from increasingdevelopment activity related to Building Safety licenses, permits, and inspections.This also includes $1,289,492 for revenue from fee adjustments made in the June14, 2012 Fee Schedule amendment adopted by Council. $3,068,389
Increased development activity is also anticipated to result in an increase of$876,946 in revenue from Zoning, Subdivision, and Site Plan fees plus anadditional $7,000 in charges for services for general government revenue. $883,946
Expenditure Changes FTEs Dollars
CitywideThe Budget includes $652,871 for salary increases associated with wageadjustments in FY 2013. An additional $96,394 is in the Budget for increased Citycontributions for health insurance. $749,265
The Budget includes $118,039 for wage adjustments associated withimplementing the City's recently completed market study. $118,039
The Budget includes additional funding for the Employees' Retirement System thatis equivalent to 2% of payroll for non-civil service employees to help improve thefunded status of the pension system. This amount also includes a budgetreallocation from the fund level to the department level. $1,783,741
Also included is an increase in fleet maintenance charges of $49,022 offset by adecrease of $21,634 in fuel charges. $27,388
Capital Area Metropolitan Planning OrganizationThe Budget includes an increase in expense refunds for annualized costsassociated with wage, insurance and pension adjustments. ($146,412)
One Stop ShopThe Budget includes annualized costs for 11.0 FTEs added in the June 14, 2012budget amendment regarding adequate staffing for development review. $687,340
The Budget includes $290,594 associated with 4.2 FTEs previously reimbursed bythe Watershed Protection Department (WPD) offset by an increase in expenserefund of $442,675 for annualized costs associated with wage adjustments andinsurance for coordinated activity with WPD. ($152,081)
Also included is an increase for Support Services provided by the WPD forannualized costs associated with wage, insurance, and pension adjustments. $49,499
Support ServicesThe Budget includes a new Division Manager of Development Services $108,370, aPlanner Senior $83,647, and Administrative Assistant $50,873, for implementingthe Imagine Austin comprehensive plan and related Land Development Code work. 3.00 $242,890
The Budget also includes the transfer of two Fiscal Surety FTEs from WPD to matchtheir reporting structure. 2.00 $133,775
The Budget includes $149,690 for increased rent costs for One Texas Center. $149,690
Planning and Development ReviewSignificant Changes
2012-13 Proposed Budget, Austin, TX
290 | Volume I
Planning and Development ReviewBudget Detail by Activity
Program: Capital Area Metropolitan Planning Organization (CAMPO)
Activity: CAMPO
The Capital Area Metropolitan Planning Office is a federally funded program. Because CAMPO is not a City department,program measures and key indicators are not available.
Graph Not Applicable
2011-12Amended
2010-11Actual
2011-12Estimated
2012-13Proposed
2009-10Actual
Requirements
Expense Refunds 1,381,045 1,381,045 1,552,3581,254,6391,272,495
$1,381,045 $1,381,045 $1,552,358Total Requirements $1,254,639$1,272,495
Full-Time Equivalents
General Fund 16.00 16.00 16.00 16.0016.00
Total FTEs 16.00 16.00 16.00 16.0016.00
Measures Not Applicable
ServicesRegional metropolitan transportation planning services
Bold/Italicized Measure = Key Indicator
2012-13 Proposed Budget, Austin, TX
Volume I | 291
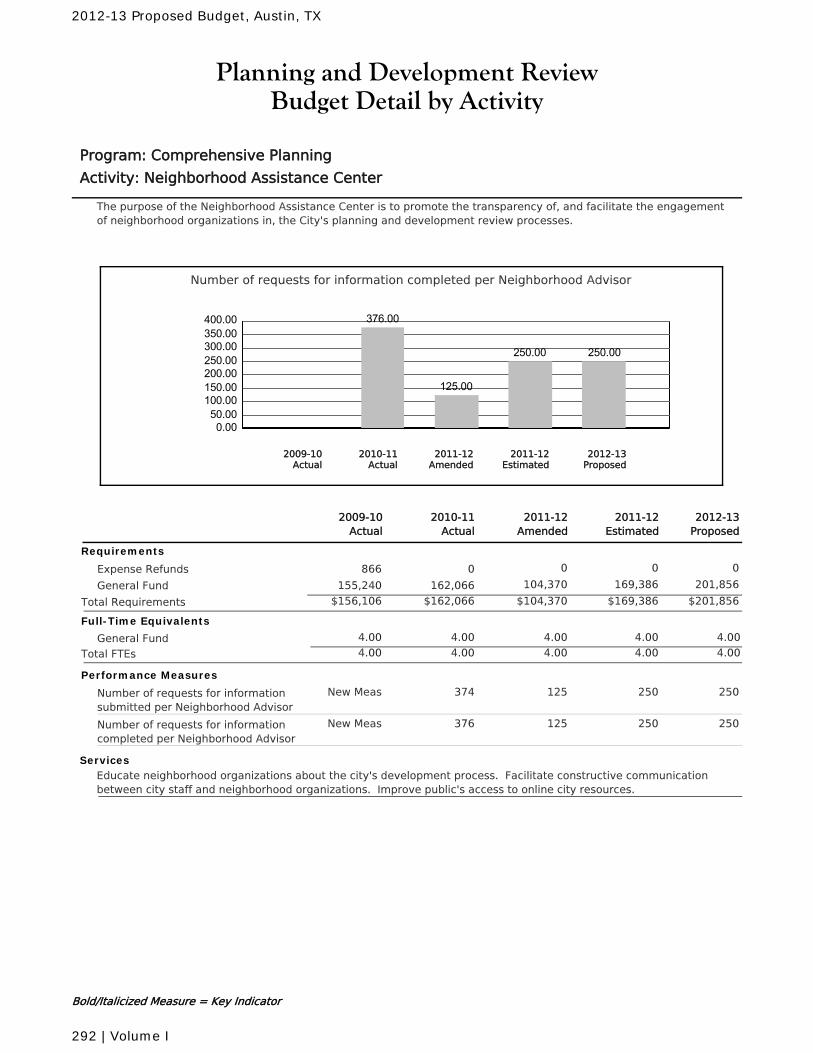
Planning and Development ReviewBudget Detail by Activity
Program: Comprehensive Planning
Activity: Neighborhood Assistance Center
The purpose of the Neighborhood Assistance Center is to promote the transparency of, and facilitate the engagementof neighborhood organizations in, the City's planning and development review processes.
Number of requests for information completed per Neighborhood Advisor
0.0050.00100.00150.00200.00250.00300.00350.00400.00 376.00
125.00
250.00 250.00
2010-11Actual
2012-13Proposed
2011-12Amended
2011-12Estimated
2009-10Actual
2011-12Amended
2010-11Actual
2011-12Estimated
2012-13Proposed
2009-10Actual
Requirements
Expense Refunds 0 0 00866
General Fund 104,370 169,386 201,856162,066155,240
$104,370 $169,386 $201,856Total Requirements $162,066$156,106
Full-Time Equivalents
General Fund 4.00 4.00 4.00 4.004.00
Total FTEs 4.00 4.00 4.00 4.004.00
Performance Measures
Number of requests for informationsubmitted per Neighborhood Advisor
125374 250 250New Meas
Number of requests for informationcompleted per Neighborhood Advisor
125376 250 250New Meas
ServicesEducate neighborhood organizations about the city's development process. Facilitate constructive communicationbetween city staff and neighborhood organizations. Improve public's access to online city resources.
Bold/Italicized Measure = Key Indicator
2012-13 Proposed Budget, Austin, TX
292 | Volume I
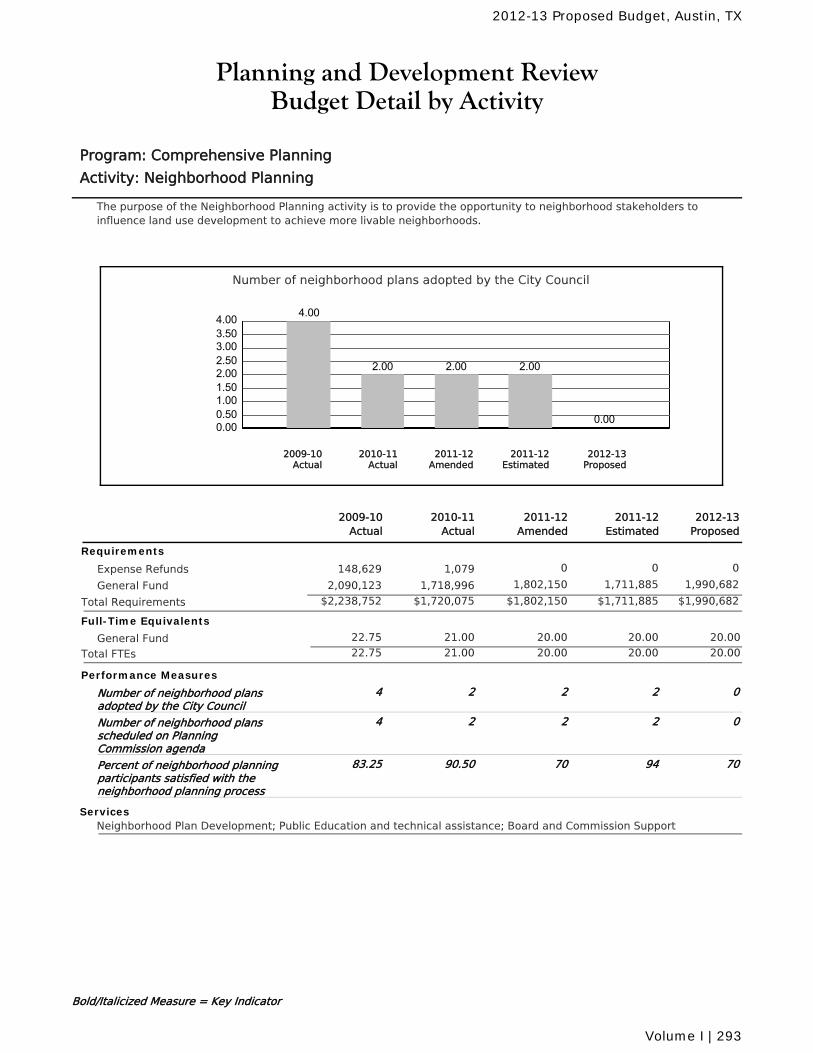
Planning and Development ReviewBudget Detail by Activity
Program: Comprehensive Planning
Activity: Neighborhood Planning
The purpose of the Neighborhood Planning activity is to provide the opportunity to neighborhood stakeholders toinfluence land use development to achieve more livable neighborhoods.
Number of neighborhood plans adopted by the City Council
0.000.501.001.502.002.503.003.504.00 4.00
2.00 2.00 2.00
0.00
2010-11Actual
2012-13Proposed
2011-12Amended
2011-12Estimated
2009-10Actual
2011-12Amended
2010-11Actual
2011-12Estimated
2012-13Proposed
2009-10Actual
Requirements
Expense Refunds 0 0 01,079148,629
General Fund 1,802,150 1,711,885 1,990,6821,718,9962,090,123
$1,802,150 $1,711,885 $1,990,682Total Requirements $1,720,075$2,238,752
Full-Time Equivalents
General Fund 21.00 20.00 20.00 20.0022.75
Total FTEs 21.00 20.00 20.00 20.0022.75
Performance Measures
Number of neighborhood plansadopted by the City Council
22 2 04
Number of neighborhood plansscheduled on PlanningCommission agenda
22 2 04
Percent of neighborhood planningparticipants satisfied with theneighborhood planning process
7090.50 94 7083.25
ServicesNeighborhood Plan Development; Public Education and technical assistance; Board and Commission Support
Bold/Italicized Measure = Key Indicator
2012-13 Proposed Budget, Austin, TX
Volume I | 293
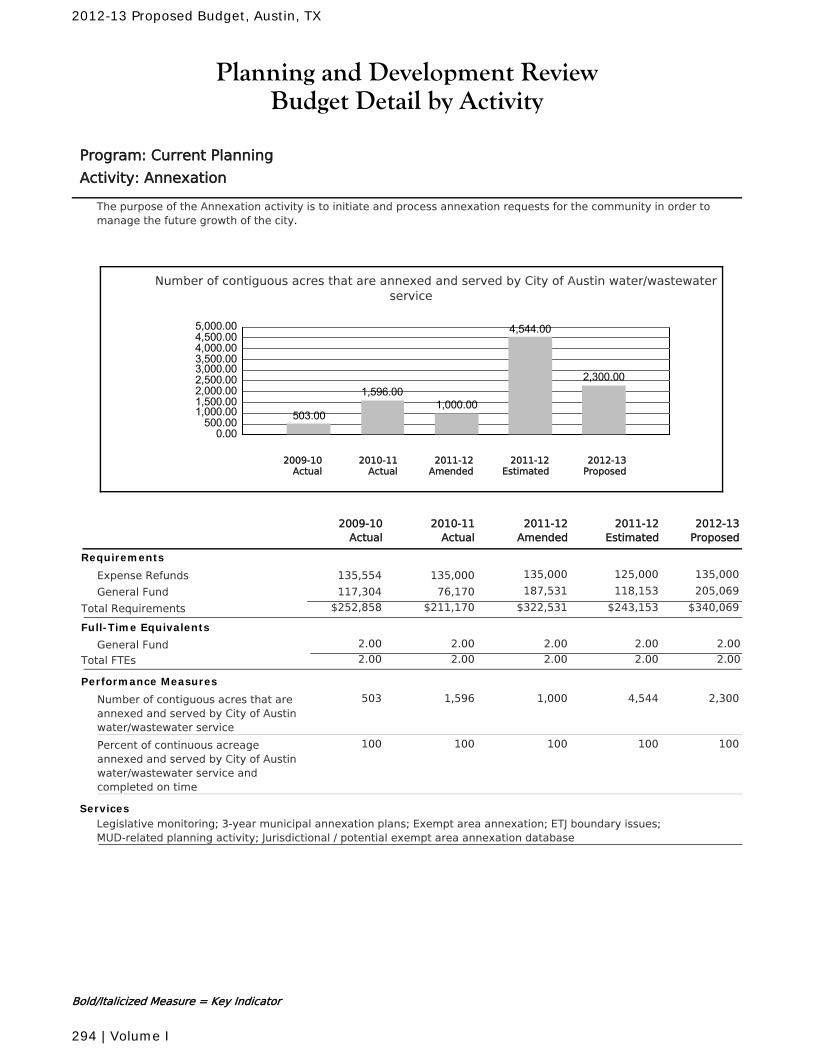
Planning and Development ReviewBudget Detail by Activity
Program: Current Planning
Activity: Annexation
The purpose of the Annexation activity is to initiate and process annexation requests for the community in order tomanage the future growth of the city.
Number of contiguous acres that are annexed and served by City of Austin water/wastewaterservice
0.00500.00
1,000.001,500.002,000.002,500.003,000.003,500.004,000.004,500.005,000.00
503.00
1,596.001,000.00
4,544.00
2,300.00
2010-11Actual
2012-13Proposed
2011-12Amended
2011-12Estimated
2009-10Actual
2011-12Amended
2010-11Actual
2011-12Estimated
2012-13Proposed
2009-10Actual
Requirements
Expense Refunds 135,000 125,000 135,000135,000135,554
General Fund 187,531 118,153 205,06976,170117,304
$322,531 $243,153 $340,069Total Requirements $211,170$252,858
Full-Time Equivalents
General Fund 2.00 2.00 2.00 2.002.00
Total FTEs 2.00 2.00 2.00 2.002.00
Performance Measures
Number of contiguous acres that areannexed and served by City of Austinwater/wastewater service
1,0001,596 4,544 2,300503
Percent of continuous acreageannexed and served by City of Austinwater/wastewater service andcompleted on time
100100 100 100100
ServicesLegislative monitoring; 3-year municipal annexation plans; Exempt area annexation; ETJ boundary issues;MUD-related planning activity; Jurisdictional / potential exempt area annexation database
Bold/Italicized Measure = Key Indicator
2012-13 Proposed Budget, Austin, TX
294 | Volume I
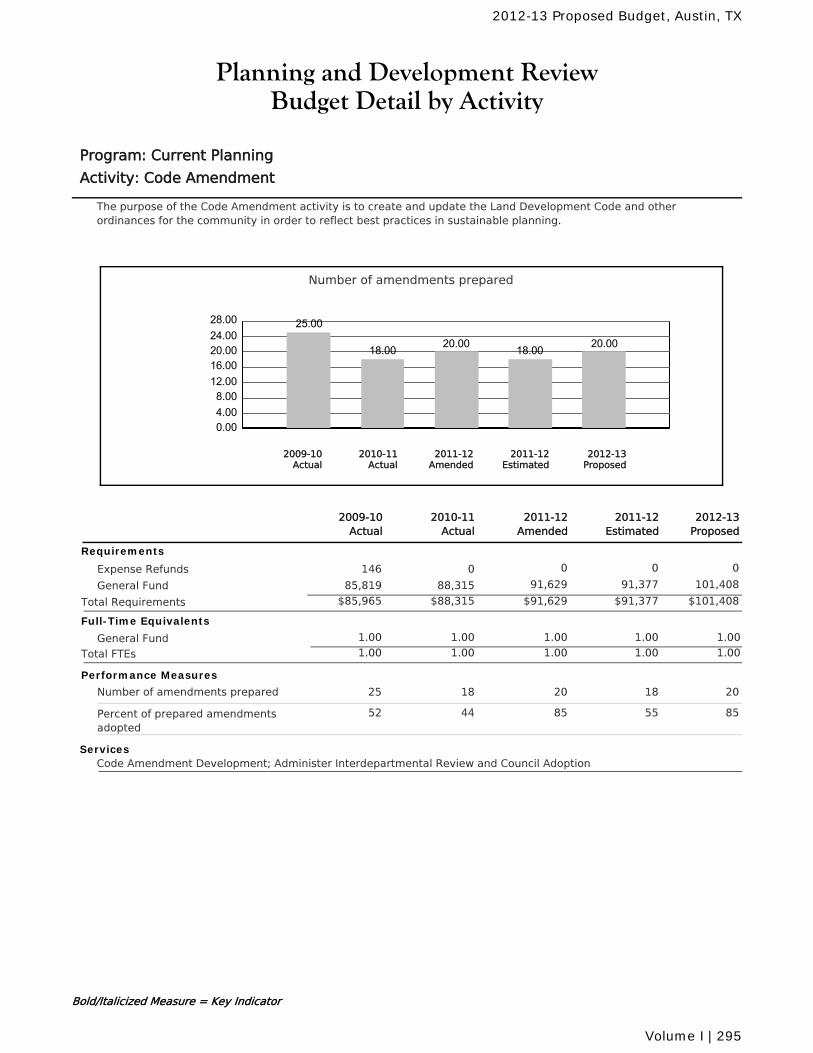
Planning and Development ReviewBudget Detail by Activity
Program: Current Planning
Activity: Code Amendment
The purpose of the Code Amendment activity is to create and update the Land Development Code and otherordinances for the community in order to reflect best practices in sustainable planning.
Number of amendments prepared
0.004.008.0012.0016.0020.0024.0028.00 25.00
18.00 20.00 18.00 20.00
2010-11Actual
2012-13Proposed
2011-12Amended
2011-12Estimated
2009-10Actual
2011-12Amended
2010-11Actual
2011-12Estimated
2012-13Proposed
2009-10Actual
Requirements
Expense Refunds 0 0 00146
General Fund 91,629 91,377 101,40888,31585,819
$91,629 $91,377 $101,408Total Requirements $88,315$85,965
Full-Time Equivalents
General Fund 1.00 1.00 1.00 1.001.00
Total FTEs 1.00 1.00 1.00 1.001.00
Performance Measures
Number of amendments prepared 2018 18 2025
Percent of prepared amendmentsadopted
8544 55 8552
ServicesCode Amendment Development; Administer Interdepartmental Review and Council Adoption
Bold/Italicized Measure = Key Indicator
2012-13 Proposed Budget, Austin, TX
Volume I | 295
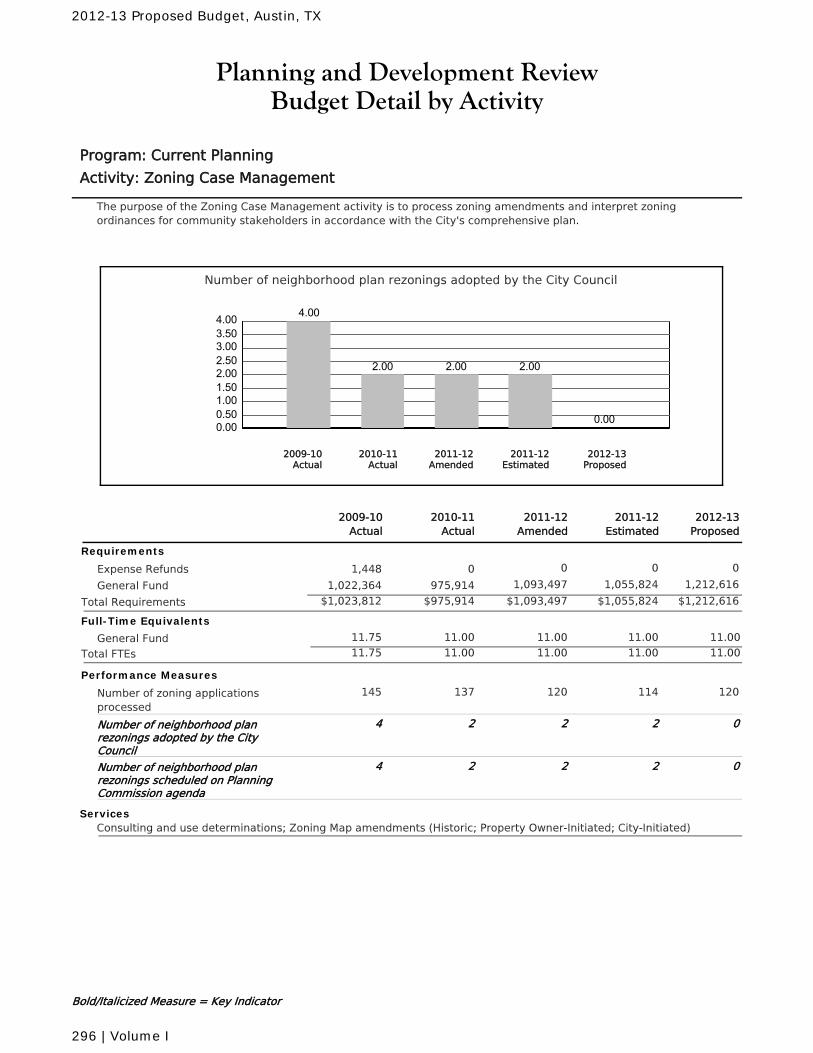
Planning and Development ReviewBudget Detail by Activity
Program: Current Planning
Activity: Zoning Case Management
The purpose of the Zoning Case Management activity is to process zoning amendments and interpret zoningordinances for community stakeholders in accordance with the City's comprehensive plan.
Number of neighborhood plan rezonings adopted by the City Council
0.000.501.001.502.002.503.003.504.00 4.00
2.00 2.00 2.00
0.00
2010-11Actual
2012-13Proposed
2011-12Amended
2011-12Estimated
2009-10Actual
2011-12Amended
2010-11Actual
2011-12Estimated
2012-13Proposed
2009-10Actual
Requirements
Expense Refunds 0 0 001,448
General Fund 1,093,497 1,055,824 1,212,616975,9141,022,364
$1,093,497 $1,055,824 $1,212,616Total Requirements $975,914$1,023,812
Full-Time Equivalents
General Fund 11.00 11.00 11.00 11.0011.75
Total FTEs 11.00 11.00 11.00 11.0011.75
Performance Measures
Number of zoning applicationsprocessed
120137 114 120145
Number of neighborhood planrezonings adopted by the CityCouncil
22 2 04
Number of neighborhood planrezonings scheduled on PlanningCommission agenda
22 2 04
ServicesConsulting and use determinations; Zoning Map amendments (Historic; Property Owner-Initiated; City-Initiated)
Bold/Italicized Measure = Key Indicator
2012-13 Proposed Budget, Austin, TX
296 | Volume I
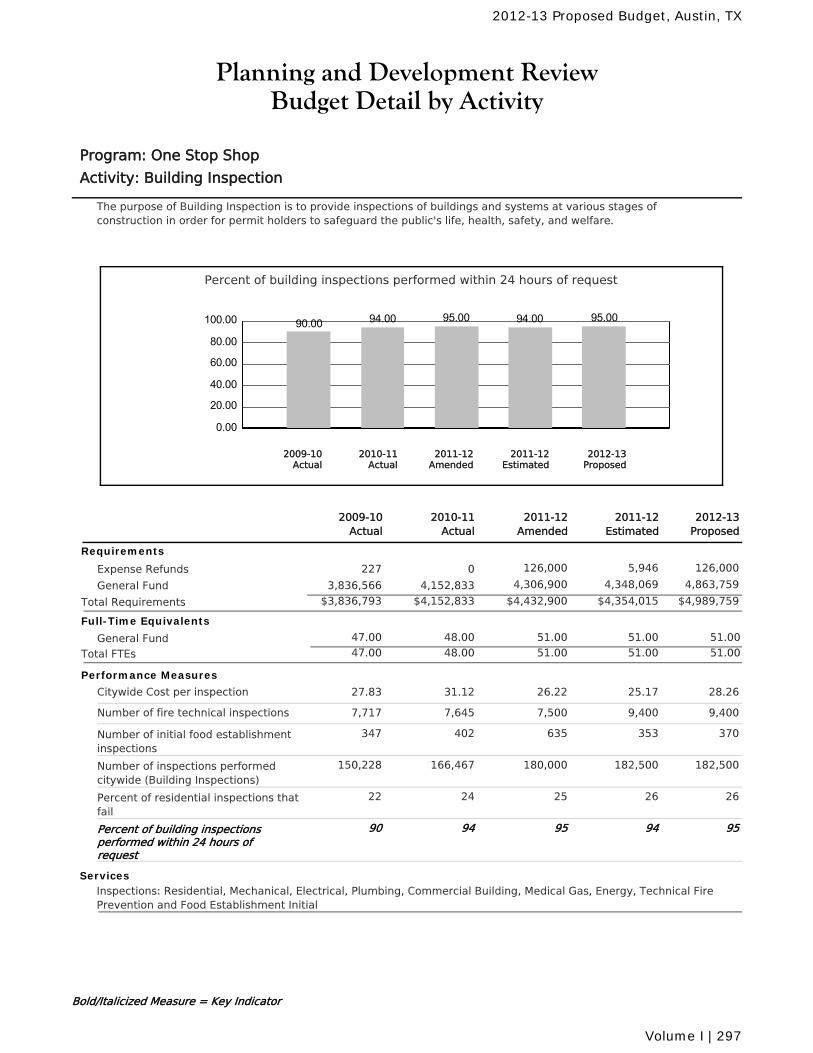
Planning and Development ReviewBudget Detail by Activity
Program: One Stop Shop
Activity: Building Inspection
The purpose of Building Inspection is to provide inspections of buildings and systems at various stages ofconstruction in order for permit holders to safeguard the public's life, health, safety, and welfare.
Percent of building inspections performed within 24 hours of request
0.00
20.00
40.00
60.00
80.00
100.00 90.00 94.00 95.00 94.00 95.00
2010-11Actual
2012-13Proposed
2011-12Amended
2011-12Estimated
2009-10Actual
2011-12Amended
2010-11Actual
2011-12Estimated
2012-13Proposed
2009-10Actual
Requirements
Expense Refunds 126,000 5,946 126,0000227
General Fund 4,306,900 4,348,069 4,863,7594,152,8333,836,566
$4,432,900 $4,354,015 $4,989,759Total Requirements $4,152,833$3,836,793
Full-Time Equivalents
General Fund 48.00 51.00 51.00 51.0047.00
Total FTEs 48.00 51.00 51.00 51.0047.00
Performance Measures
Citywide Cost per inspection 26.2231.12 25.17 28.2627.83
Number of fire technical inspections 7,5007,645 9,400 9,4007,717
Number of initial food establishmentinspections
635402 353 370347
Number of inspections performedcitywide (Building Inspections)
180,000166,467 182,500 182,500150,228
Percent of residential inspections thatfail
2524 26 2622
Percent of building inspectionsperformed within 24 hours ofrequest
9594 94 9590
ServicesInspections: Residential, Mechanical, Electrical, Plumbing, Commercial Building, Medical Gas, Energy, Technical FirePrevention and Food Establishment Initial
Bold/Italicized Measure = Key Indicator
2012-13 Proposed Budget, Austin, TX
Volume I | 297
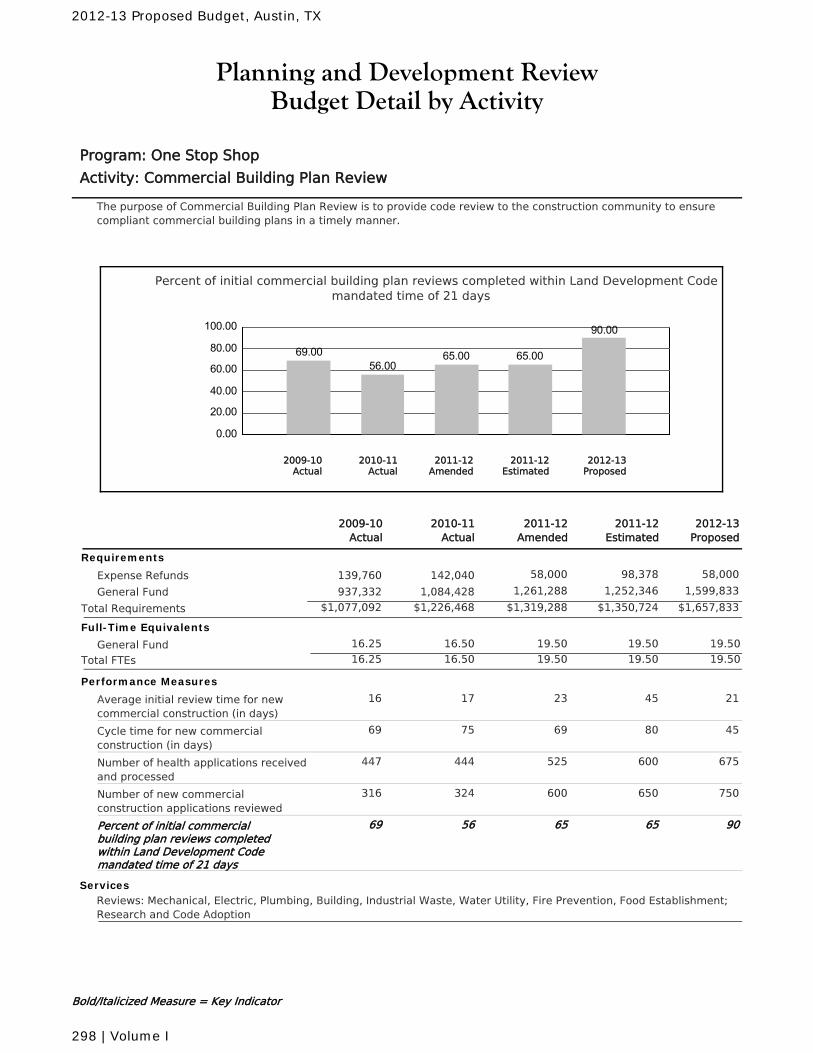
Planning and Development ReviewBudget Detail by Activity
Program: One Stop Shop
Activity: Commercial Building Plan Review
The purpose of Commercial Building Plan Review is to provide code review to the construction community to ensurecompliant commercial building plans in a timely manner.
Percent of initial commercial building plan reviews completed within Land Development Codemandated time of 21 days
0.00
20.00
40.00
60.00
80.00
100.00
69.0056.00
65.00 65.00
90.00
2010-11Actual
2012-13Proposed
2011-12Amended
2011-12Estimated
2009-10Actual
2011-12Amended
2010-11Actual
2011-12Estimated
2012-13Proposed
2009-10Actual
Requirements
Expense Refunds 58,000 98,378 58,000142,040139,760
General Fund 1,261,288 1,252,346 1,599,8331,084,428937,332
$1,319,288 $1,350,724 $1,657,833Total Requirements $1,226,468$1,077,092
Full-Time Equivalents
General Fund 16.50 19.50 19.50 19.5016.25
Total FTEs 16.50 19.50 19.50 19.5016.25
Performance Measures
Average initial review time for newcommercial construction (in days)
2317 45 2116
Cycle time for new commercialconstruction (in days)
6975 80 4569
Number of health applications receivedand processed
525444 600 675447
Number of new commercialconstruction applications reviewed
600324 650 750316
Percent of initial commercialbuilding plan reviews completedwithin Land Development Codemandated time of 21 days
6556 65 9069
ServicesReviews: Mechanical, Electric, Plumbing, Building, Industrial Waste, Water Utility, Fire Prevention, Food Establishment;Research and Code Adoption
Bold/Italicized Measure = Key Indicator
2012-13 Proposed Budget, Austin, TX
298 | Volume I
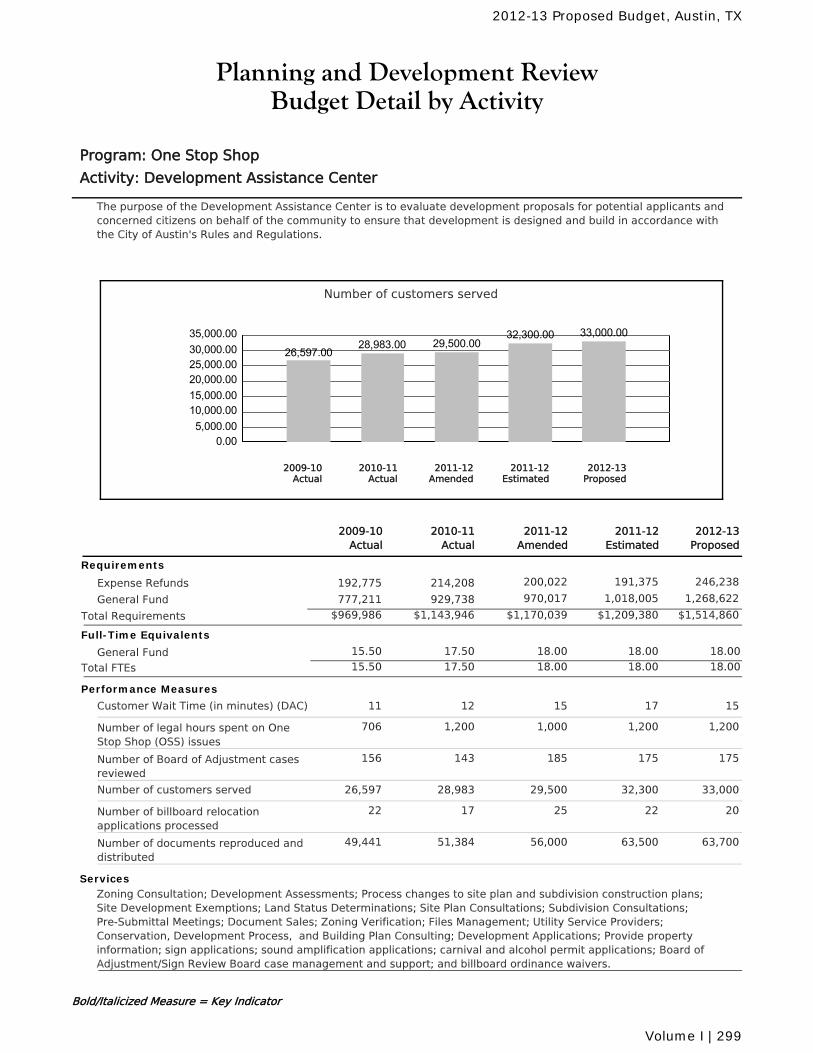
Planning and Development ReviewBudget Detail by Activity
Program: One Stop Shop
Activity: Development Assistance Center
The purpose of the Development Assistance Center is to evaluate development proposals for potential applicants andconcerned citizens on behalf of the community to ensure that development is designed and build in accordance withthe City of Austin's Rules and Regulations.
Number of customers served
0.005,000.0010,000.0015,000.0020,000.0025,000.0030,000.0035,000.00
26,597.0028,983.00 29,500.00
32,300.00 33,000.00
2010-11Actual
2012-13Proposed
2011-12Amended
2011-12Estimated
2009-10Actual
2011-12Amended
2010-11Actual
2011-12Estimated
2012-13Proposed
2009-10Actual
Requirements
Expense Refunds 200,022 191,375 246,238214,208192,775
General Fund 970,017 1,018,005 1,268,622929,738777,211
$1,170,039 $1,209,380 $1,514,860Total Requirements $1,143,946$969,986
Full-Time Equivalents
General Fund 17.50 18.00 18.00 18.0015.50
Total FTEs 17.50 18.00 18.00 18.0015.50
Performance Measures
Customer Wait Time (in minutes) (DAC) 1512 17 1511
Number of legal hours spent on OneStop Shop (OSS) issues
1,0001,200 1,200 1,200706
Number of Board of Adjustment casesreviewed
185143 175 175156
Number of customers served 29,50028,983 32,300 33,00026,597
Number of billboard relocationapplications processed
2517 22 2022
Number of documents reproduced anddistributed
56,00051,384 63,500 63,70049,441
ServicesZoning Consultation; Development Assessments; Process changes to site plan and subdivision construction plans;Site Development Exemptions; Land Status Determinations; Site Plan Consultations; Subdivision Consultations;Pre-Submittal Meetings; Document Sales; Zoning Verification; Files Management; Utility Service Providers;Conservation, Development Process, and Building Plan Consulting; Development Applications; Provide propertyinformation; sign applications; sound amplification applications; carnival and alcohol permit applications; Board ofAdjustment/Sign Review Board case management and support; and billboard ordinance waivers.
Bold/Italicized Measure = Key Indicator
2012-13 Proposed Budget, Austin, TX
Volume I | 299
Planning and Development ReviewBudget Detail by Activity
Program: One Stop Shop
Activity: Inspection, Review, and Support
The purpose of Inspection, Review, and Support is to provide program support to OSS staff and citizens in order topromote efficient performance and service to meet the One Stop Shop program objectives.
Graph Not Applicable
2011-12Amended
2010-11Actual
2011-12Estimated
2012-13Proposed
2009-10Actual
Requirements
Expense Refunds 0 0 00152,084
General Fund 0 0 00326,845
$0 $0 $0Total Requirements $0$478,929
Full-Time Equivalents
General Fund 0.00 0.00 0.00 0.005.25
Total FTEs 0.00 0.00 0.00 0.005.25
Measures Not Applicable
ServicesAdministrative Support; Rules Posting; Procedures Enforcement; Research; Analysis; Legal Advice; WebsiteDevelopment Support; HB 1445 Support; Board Support; Commission Support; Council support; AMANDA Support
Bold/Italicized Measure = Key Indicator
2012-13 Proposed Budget, Austin, TX
300 | Volume I
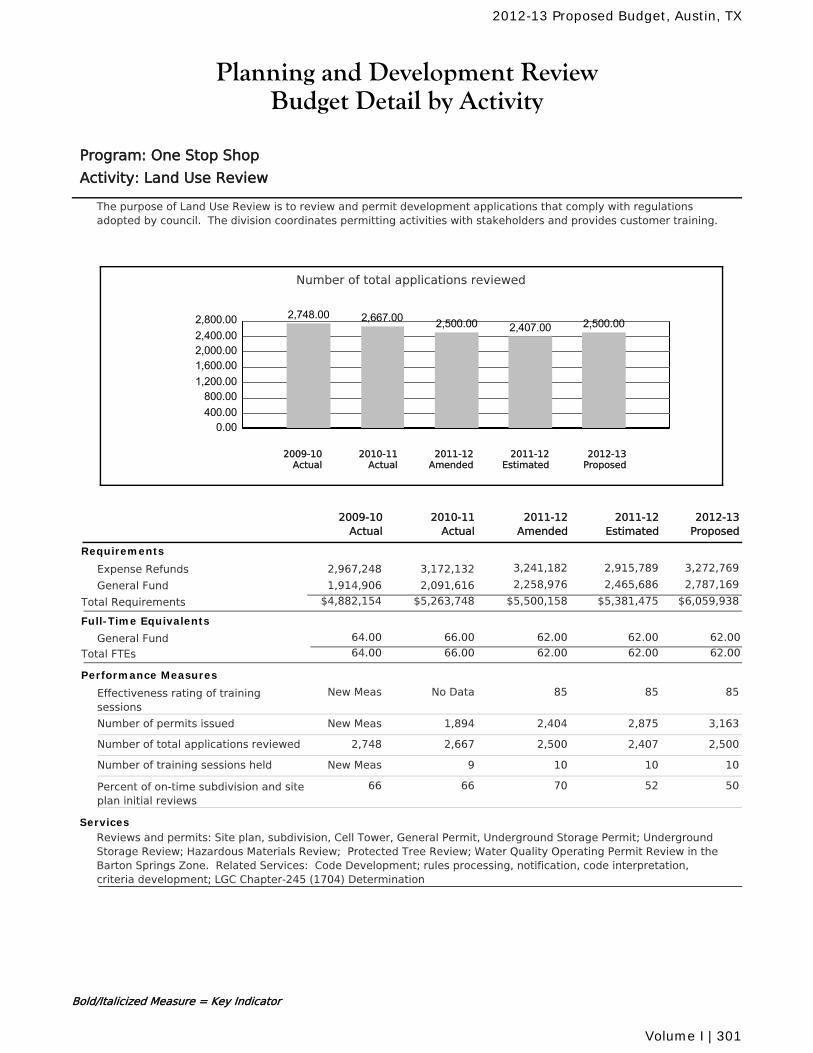
Planning and Development ReviewBudget Detail by Activity
Program: One Stop Shop
Activity: Land Use Review
The purpose of Land Use Review is to review and permit development applications that comply with regulationsadopted by council. The division coordinates permitting activities with stakeholders and provides customer training.
Number of total applications reviewed
0.00400.00800.00
1,200.001,600.002,000.002,400.002,800.00 2,748.00 2,667.00 2,500.00 2,407.00 2,500.00
2010-11Actual
2012-13Proposed
2011-12Amended
2011-12Estimated
2009-10Actual
2011-12Amended
2010-11Actual
2011-12Estimated
2012-13Proposed
2009-10Actual
Requirements
Expense Refunds 3,241,182 2,915,789 3,272,7693,172,1322,967,248
General Fund 2,258,976 2,465,686 2,787,1692,091,6161,914,906
$5,500,158 $5,381,475 $6,059,938Total Requirements $5,263,748$4,882,154
Full-Time Equivalents
General Fund 66.00 62.00 62.00 62.0064.00
Total FTEs 66.00 62.00 62.00 62.0064.00
Performance Measures
Effectiveness rating of trainingsessions
85No Data 85 85New Meas
Number of permits issued 2,4041,894 2,875 3,163New Meas
Number of total applications reviewed 2,5002,667 2,407 2,5002,748
Number of training sessions held 109 10 10New Meas
Percent of on-time subdivision and siteplan initial reviews
7066 52 5066
ServicesReviews and permits: Site plan, subdivision, Cell Tower, General Permit, Underground Storage Permit; UndergroundStorage Review; Hazardous Materials Review; Protected Tree Review; Water Quality Operating Permit Review in theBarton Springs Zone. Related Services: Code Development; rules processing, notification, code interpretation,criteria development; LGC Chapter-245 (1704) Determination
Bold/Italicized Measure = Key Indicator
2012-13 Proposed Budget, Austin, TX
Volume I | 301
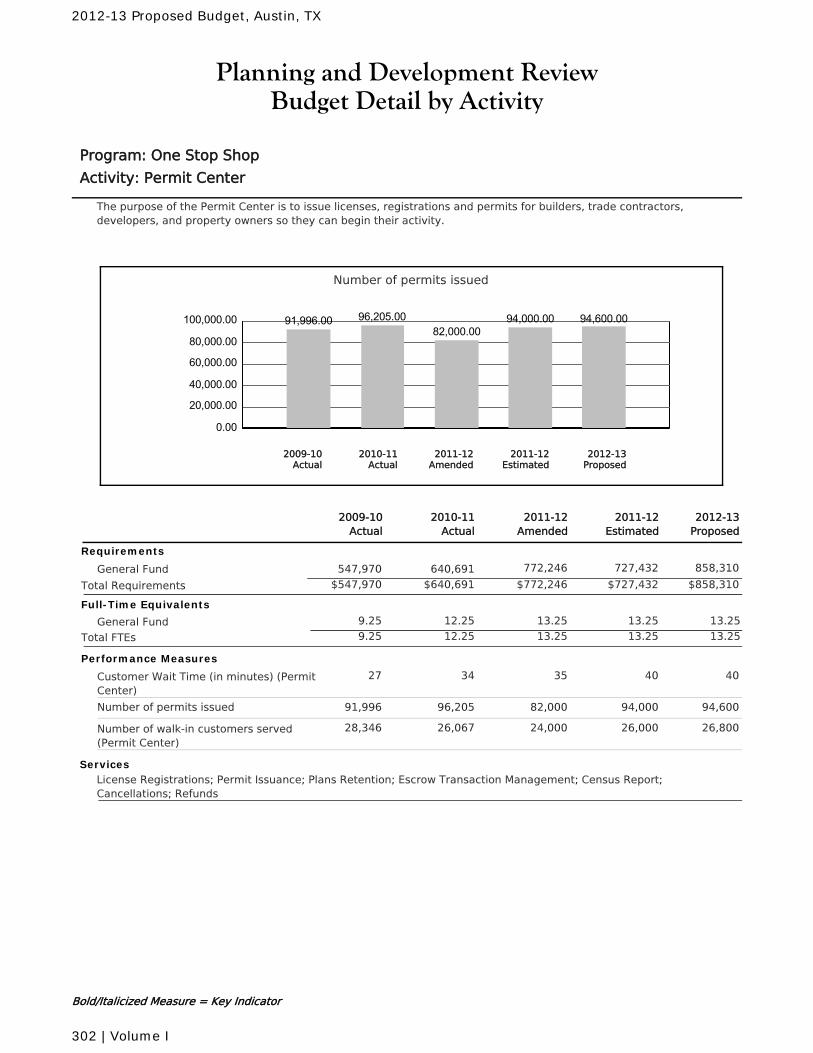
Planning and Development ReviewBudget Detail by Activity
Program: One Stop Shop
Activity: Permit Center
The purpose of the Permit Center is to issue licenses, registrations and permits for builders, trade contractors,developers, and property owners so they can begin their activity.
Number of permits issued
0.00
20,000.00
40,000.00
60,000.00
80,000.00
100,000.00 91,996.00 96,205.0082,000.00
94,000.00 94,600.00
2010-11Actual
2012-13Proposed
2011-12Amended
2011-12Estimated
2009-10Actual
2011-12Amended
2010-11Actual
2011-12Estimated
2012-13Proposed
2009-10Actual
Requirements
General Fund 772,246 727,432 858,310640,691547,970
$772,246 $727,432 $858,310Total Requirements $640,691$547,970
Full-Time Equivalents
General Fund 12.25 13.25 13.25 13.259.25
Total FTEs 12.25 13.25 13.25 13.259.25
Performance Measures
Customer Wait Time (in minutes) (PermitCenter)
3534 40 4027
Number of permits issued 82,00096,205 94,000 94,60091,996
Number of walk-in customers served(Permit Center)
24,00026,067 26,000 26,80028,346
ServicesLicense Registrations; Permit Issuance; Plans Retention; Escrow Transaction Management; Census Report;Cancellations; Refunds
Bold/Italicized Measure = Key Indicator
2012-13 Proposed Budget, Austin, TX
302 | Volume I
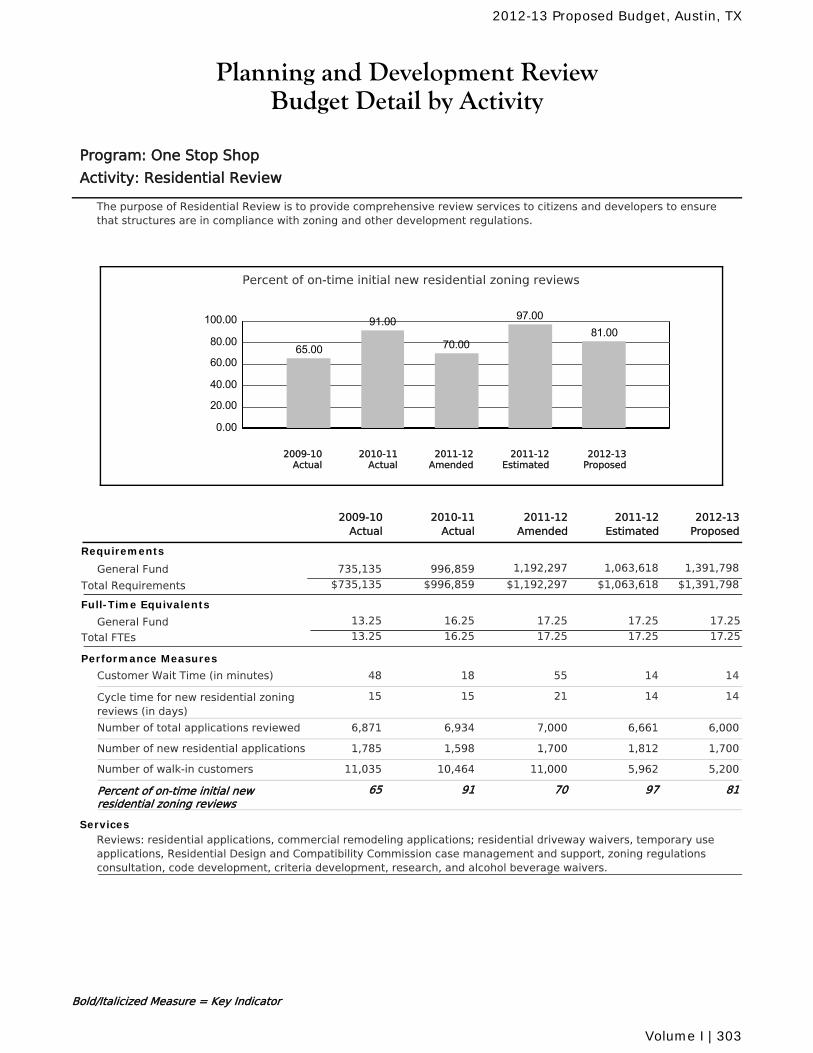
Planning and Development ReviewBudget Detail by Activity
Program: One Stop Shop
Activity: Residential Review
The purpose of Residential Review is to provide comprehensive review services to citizens and developers to ensurethat structures are in compliance with zoning and other development regulations.
Percent of on-time initial new residential zoning reviews
0.00
20.00
40.00
60.00
80.00
100.00
65.00
91.00
70.00
97.0081.00
2010-11Actual
2012-13Proposed
2011-12Amended
2011-12Estimated
2009-10Actual
2011-12Amended
2010-11Actual
2011-12Estimated
2012-13Proposed
2009-10Actual
Requirements
General Fund 1,192,297 1,063,618 1,391,798996,859735,135
$1,192,297 $1,063,618 $1,391,798Total Requirements $996,859$735,135
Full-Time Equivalents
General Fund 16.25 17.25 17.25 17.2513.25
Total FTEs 16.25 17.25 17.25 17.2513.25
Performance Measures
Customer Wait Time (in minutes) 5518 14 1448
Cycle time for new residential zoningreviews (in days)
2115 14 1415
Number of total applications reviewed 7,0006,934 6,661 6,0006,871
Number of new residential applications 1,7001,598 1,812 1,7001,785
Number of walk-in customers 11,00010,464 5,962 5,20011,035
Percent of on-time initial newresidential zoning reviews
7091 97 8165
ServicesReviews: residential applications, commercial remodeling applications; residential driveway waivers, temporary useapplications, Residential Design and Compatibility Commission case management and support, zoning regulationsconsultation, code development, criteria development, research, and alcohol beverage waivers.
Bold/Italicized Measure = Key Indicator
2012-13 Proposed Budget, Austin, TX
Volume I | 303
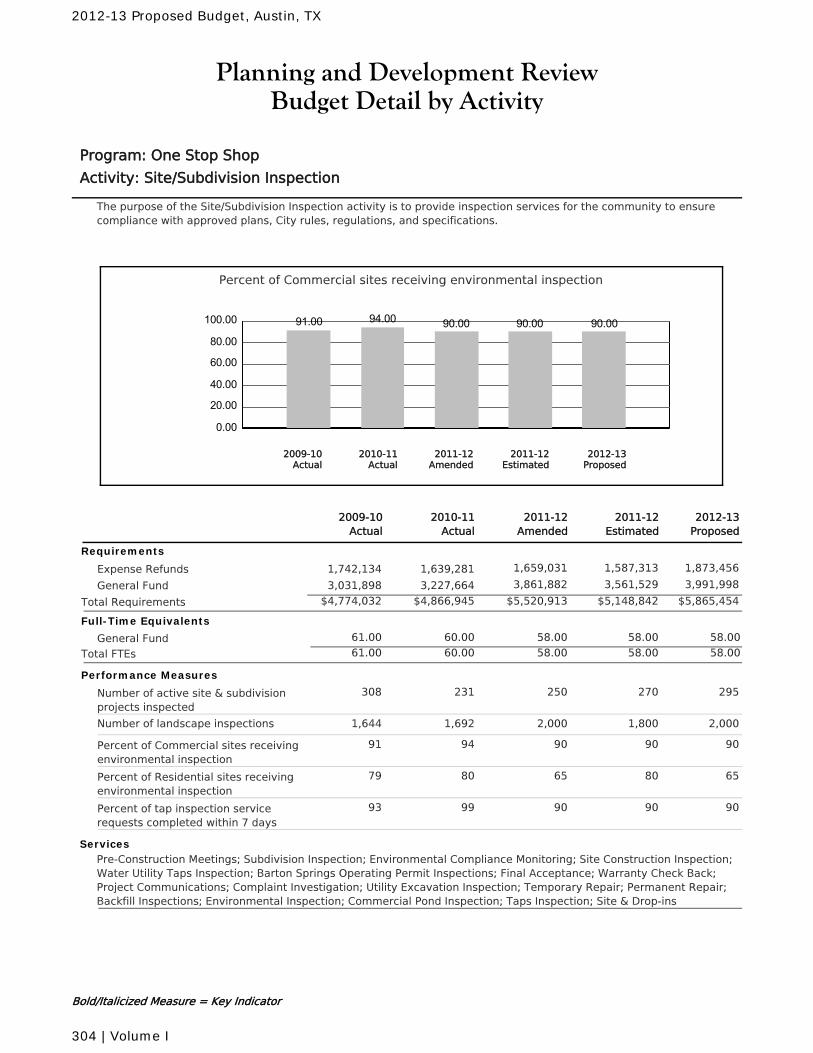
Planning and Development ReviewBudget Detail by Activity
Program: One Stop Shop
Activity: Site/Subdivision Inspection
The purpose of the Site/Subdivision Inspection activity is to provide inspection services for the community to ensurecompliance with approved plans, City rules, regulations, and specifications.
Percent of Commercial sites receiving environmental inspection
0.00
20.00
40.00
60.00
80.00
100.00 91.00 94.00 90.00 90.00 90.00
2010-11Actual
2012-13Proposed
2011-12Amended
2011-12Estimated
2009-10Actual
2011-12Amended
2010-11Actual
2011-12Estimated
2012-13Proposed
2009-10Actual
Requirements
Expense Refunds 1,659,031 1,587,313 1,873,4561,639,2811,742,134
General Fund 3,861,882 3,561,529 3,991,9983,227,6643,031,898
$5,520,913 $5,148,842 $5,865,454Total Requirements $4,866,945$4,774,032
Full-Time Equivalents
General Fund 60.00 58.00 58.00 58.0061.00
Total FTEs 60.00 58.00 58.00 58.0061.00
Performance Measures
Number of active site & subdivisionprojects inspected
250231 270 295308
Number of landscape inspections 2,0001,692 1,800 2,0001,644
Percent of Commercial sites receivingenvironmental inspection
9094 90 9091
Percent of Residential sites receivingenvironmental inspection
6580 80 6579
Percent of tap inspection servicerequests completed within 7 days
9099 90 9093
ServicesPre-Construction Meetings; Subdivision Inspection; Environmental Compliance Monitoring; Site Construction Inspection;Water Utility Taps Inspection; Barton Springs Operating Permit Inspections; Final Acceptance; Warranty Check Back;Project Communications; Complaint Investigation; Utility Excavation Inspection; Temporary Repair; Permanent Repair;Backfill Inspections; Environmental Inspection; Commercial Pond Inspection; Taps Inspection; Site & Drop-ins
Bold/Italicized Measure = Key Indicator
2012-13 Proposed Budget, Austin, TX
304 | Volume I
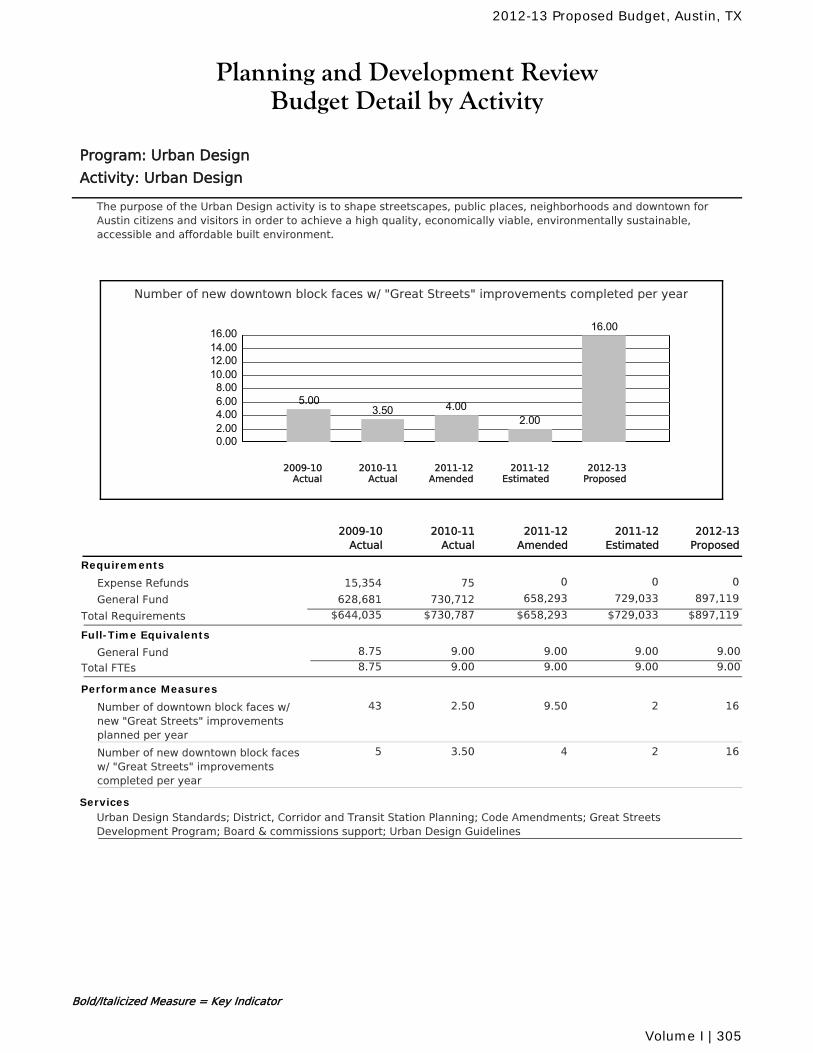
Planning and Development ReviewBudget Detail by Activity
Program: Urban Design
Activity: Urban Design
The purpose of the Urban Design activity is to shape streetscapes, public places, neighborhoods and downtown forAustin citizens and visitors in order to achieve a high quality, economically viable, environmentally sustainable,accessible and affordable built environment.
Number of new downtown block faces w/ "Great Streets" improvements completed per year
0.002.004.006.008.0010.0012.0014.0016.00
5.003.50 4.00
2.00
16.00
2010-11Actual
2012-13Proposed
2011-12Amended
2011-12Estimated
2009-10Actual
2011-12Amended
2010-11Actual
2011-12Estimated
2012-13Proposed
2009-10Actual
Requirements
Expense Refunds 0 0 07515,354
General Fund 658,293 729,033 897,119730,712628,681
$658,293 $729,033 $897,119Total Requirements $730,787$644,035
Full-Time Equivalents
General Fund 9.00 9.00 9.00 9.008.75
Total FTEs 9.00 9.00 9.00 9.008.75
Performance Measures
Number of downtown block faces w/new "Great Streets" improvementsplanned per year
9.502.50 2 1643
Number of new downtown block facesw/ "Great Streets" improvementscompleted per year
43.50 2 165
ServicesUrban Design Standards; District, Corridor and Transit Station Planning; Code Amendments; Great StreetsDevelopment Program; Board & commissions support; Urban Design Guidelines
Bold/Italicized Measure = Key Indicator
2012-13 Proposed Budget, Austin, TX
Volume I | 305
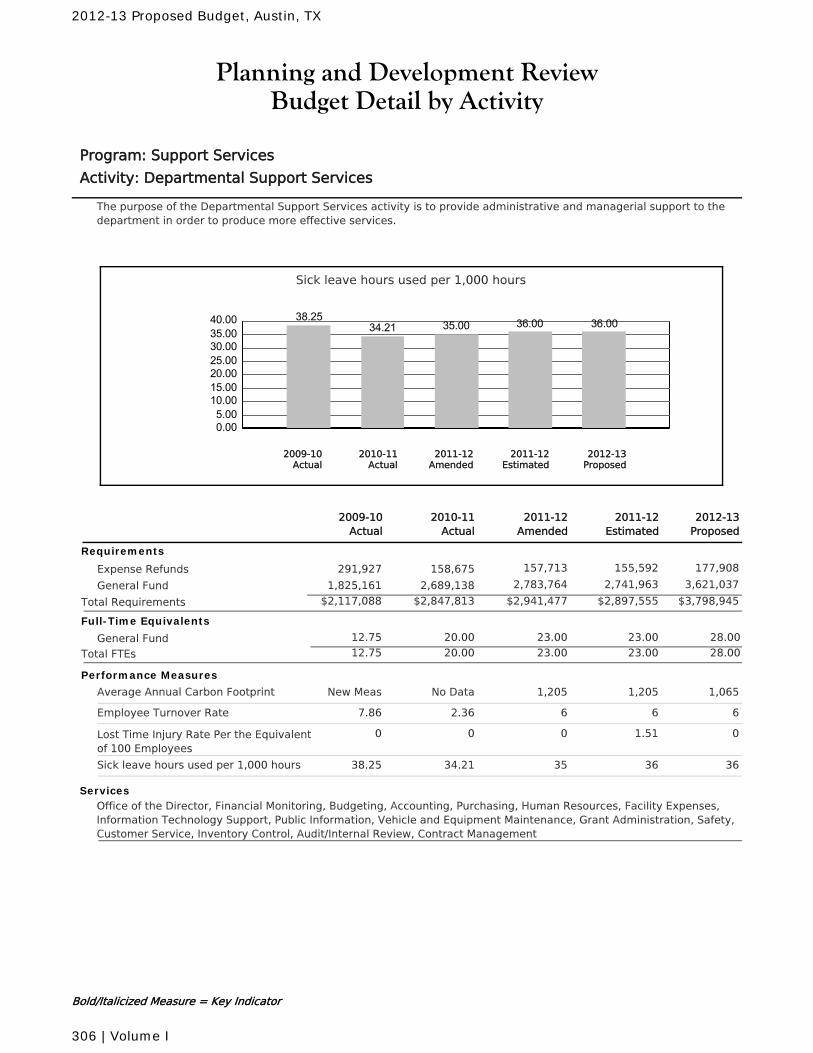
Planning and Development ReviewBudget Detail by Activity
Program: Support Services
Activity: Departmental Support Services
The purpose of the Departmental Support Services activity is to provide administrative and managerial support to thedepartment in order to produce more effective services.
Sick leave hours used per 1,000 hours
0.005.0010.0015.0020.0025.0030.0035.0040.00 38.25
34.21 35.00 36.00 36.00
2010-11Actual
2012-13Proposed
2011-12Amended
2011-12Estimated
2009-10Actual
2011-12Amended
2010-11Actual
2011-12Estimated
2012-13Proposed
2009-10Actual
Requirements
Expense Refunds 157,713 155,592 177,908158,675291,927
General Fund 2,783,764 2,741,963 3,621,0372,689,1381,825,161
$2,941,477 $2,897,555 $3,798,945Total Requirements $2,847,813$2,117,088
Full-Time Equivalents
General Fund 20.00 23.00 23.00 28.0012.75
Total FTEs 20.00 23.00 23.00 28.0012.75
Performance Measures
Average Annual Carbon Footprint 1,205No Data 1,205 1,065New Meas
Employee Turnover Rate 62.36 6 67.86
Lost Time Injury Rate Per the Equivalentof 100 Employees
00 1.51 00
Sick leave hours used per 1,000 hours 3534.21 36 3638.25
ServicesOffice of the Director, Financial Monitoring, Budgeting, Accounting, Purchasing, Human Resources, Facility Expenses,Information Technology Support, Public Information, Vehicle and Equipment Maintenance, Grant Administration, Safety,Customer Service, Inventory Control, Audit/Internal Review, Contract Management
Bold/Italicized Measure = Key Indicator
2012-13 Proposed Budget, Austin, TX
306 | Volume I
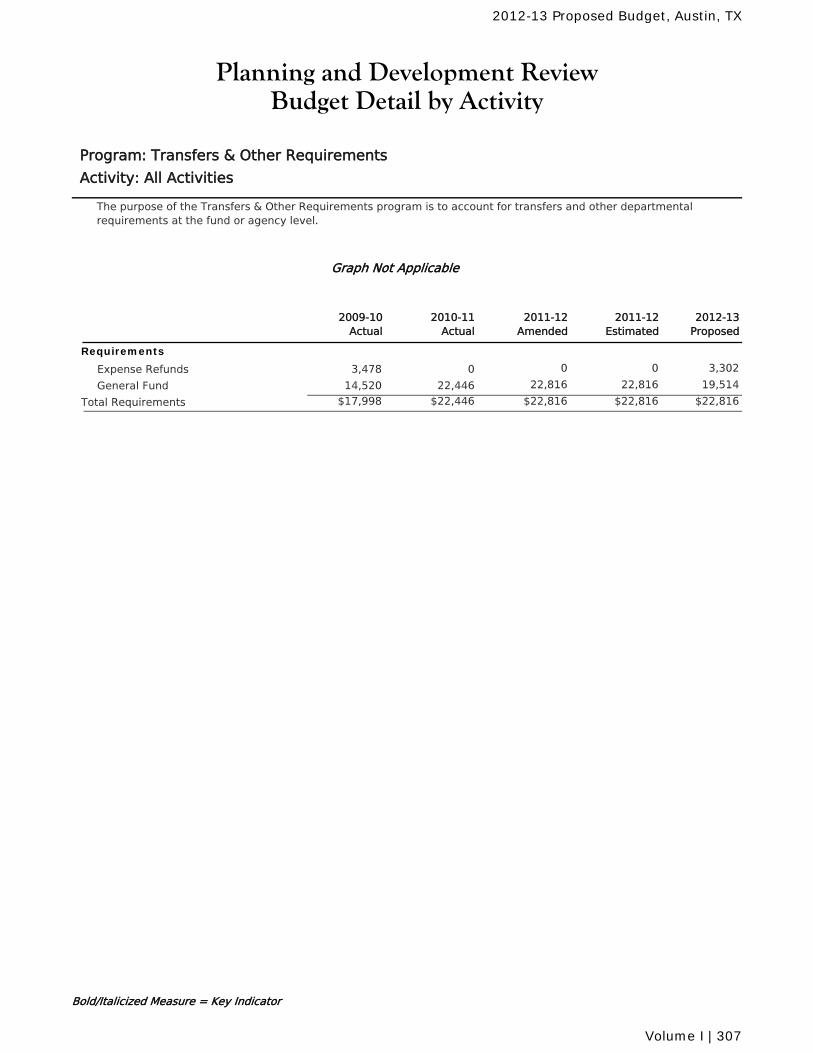
Planning and Development ReviewBudget Detail by Activity
Program: Transfers & Other Requirements
Activity: All Activities
The purpose of the Transfers & Other Requirements program is to account for transfers and other departmentalrequirements at the fund or agency level.
Graph Not Applicable
2011-12Amended
2010-11Actual
2011-12Estimated
2012-13Proposed
2009-10Actual
Requirements
Expense Refunds 0 0 3,30203,478
General Fund 22,816 22,816 19,51422,44614,520
$22,816 $22,816 $22,816Total Requirements $22,446$17,998
Bold/Italicized Measure = Key Indicator
2012-13 Proposed Budget, Austin, TX
Volume I | 307
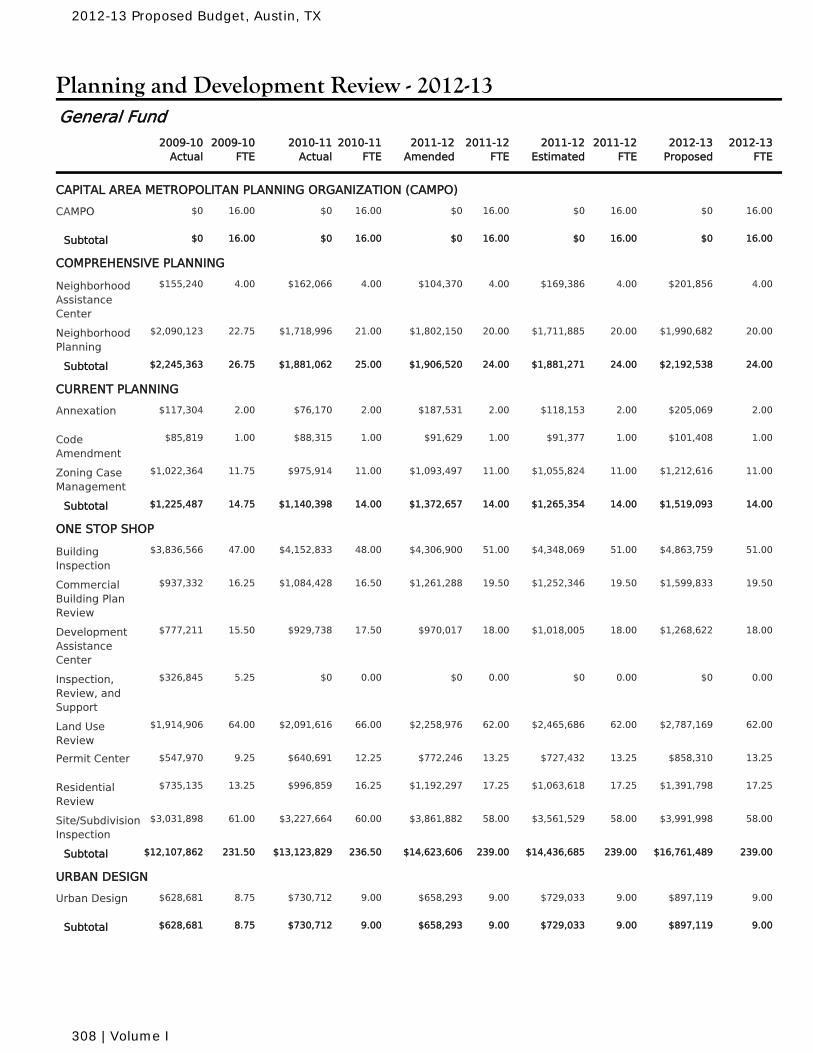
Planning and Development Review - 2012-13
2010-11Actual
2010-11FTE
2011-12Amended
2011-12FTE
2011-12Estimated
2011-12FTE
2009-10Actual
2009-10FTE
2012-13Proposed
2012-13FTE
General Fund
CAPITAL AREA METROPOLITAN PLANNING ORGANIZATION (CAMPO)
$0 16.00 $0 16.00 $0 16.00CAMPO 16.00 $0 16.00$0
$0 16.00 $0 16.00 $0 16.00Subtotal 16.00 $0 16.00$0
COMPREHENSIVE PLANNING
$162,066 4.00 $104,370 4.00 $169,386 4.00NeighborhoodAssistanceCenter
4.00 $201,856 4.00$155,240
$1,718,996 21.00 $1,802,150 20.00 $1,711,885 20.00NeighborhoodPlanning
22.75 $1,990,682 20.00$2,090,123
$1,881,062 25.00 $1,906,520 24.00 $1,881,271 24.00Subtotal 26.75 $2,192,538 24.00$2,245,363
CURRENT PLANNING
$76,170 2.00 $187,531 2.00 $118,153 2.00Annexation 2.00 $205,069 2.00$117,304
$88,315 1.00 $91,629 1.00 $91,377 1.00CodeAmendment
1.00 $101,408 1.00$85,819
$975,914 11.00 $1,093,497 11.00 $1,055,824 11.00Zoning CaseManagement
11.75 $1,212,616 11.00$1,022,364
$1,140,398 14.00 $1,372,657 14.00 $1,265,354 14.00Subtotal 14.75 $1,519,093 14.00$1,225,487
ONE STOP SHOP
$4,152,833 48.00 $4,306,900 51.00 $4,348,069 51.00BuildingInspection
47.00 $4,863,759 51.00$3,836,566
$1,084,428 16.50 $1,261,288 19.50 $1,252,346 19.50CommercialBuilding PlanReview
16.25 $1,599,833 19.50$937,332
$929,738 17.50 $970,017 18.00 $1,018,005 18.00DevelopmentAssistanceCenter
15.50 $1,268,622 18.00$777,211
$0 0.00 $0 0.00 $0 0.00Inspection,Review, andSupport
5.25 $0 0.00$326,845
$2,091,616 66.00 $2,258,976 62.00 $2,465,686 62.00Land UseReview
64.00 $2,787,169 62.00$1,914,906
$640,691 12.25 $772,246 13.25 $727,432 13.25Permit Center 9.25 $858,310 13.25$547,970
$996,859 16.25 $1,192,297 17.25 $1,063,618 17.25ResidentialReview
13.25 $1,391,798 17.25$735,135
$3,227,664 60.00 $3,861,882 58.00 $3,561,529 58.00Site/SubdivisionInspection
61.00 $3,991,998 58.00$3,031,898
$13,123,829 236.50 $14,623,606 239.00 $14,436,685 239.00Subtotal 231.50 $16,761,489 239.00$12,107,862
URBAN DESIGN
$730,712 9.00 $658,293 9.00 $729,033 9.00Urban Design 8.75 $897,119 9.00$628,681
$730,712 9.00 $658,293 9.00 $729,033 9.00Subtotal 8.75 $897,119 9.00$628,681
2012-13 Proposed Budget, Austin, TX
308 | Volume I
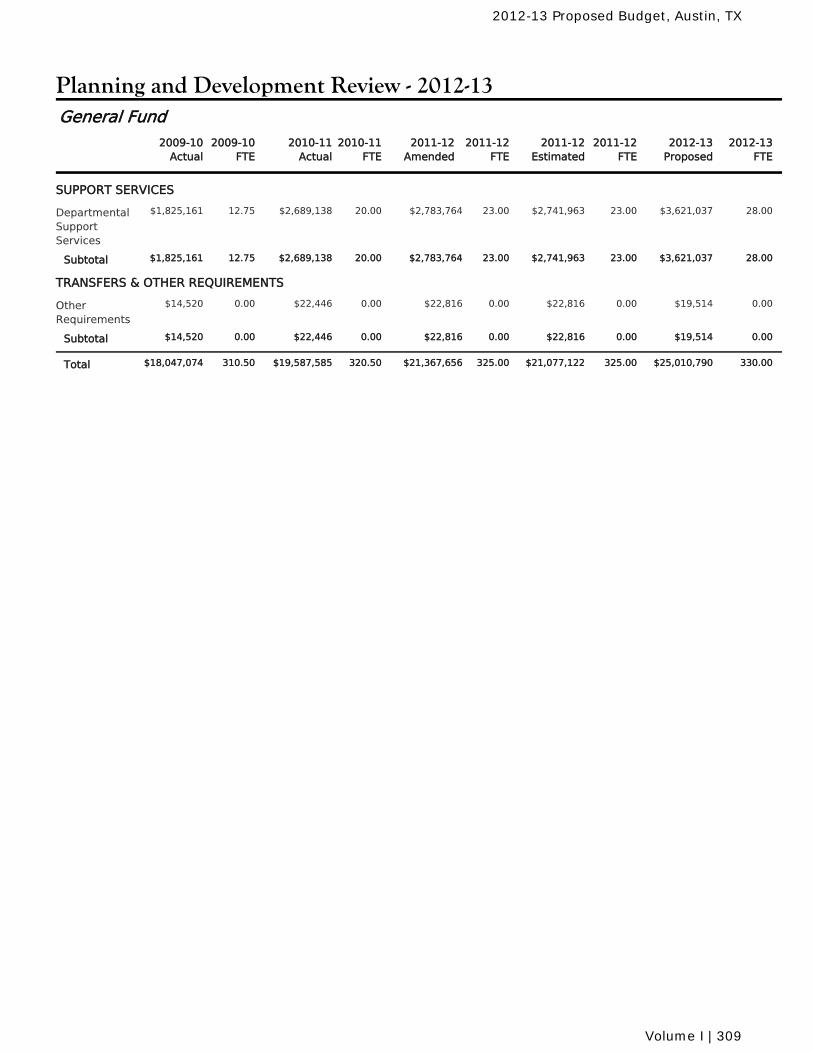
Planning and Development Review - 2012-13
2010-11Actual
2010-11FTE
2011-12Amended
2011-12FTE
2011-12Estimated
2011-12FTE
2009-10Actual
2009-10FTE
2012-13Proposed
2012-13FTE
General Fund
SUPPORT SERVICES
$2,689,138 20.00 $2,783,764 23.00 $2,741,963 23.00DepartmentalSupportServices
12.75 $3,621,037 28.00$1,825,161
$2,689,138 20.00 $2,783,764 23.00 $2,741,963 23.00Subtotal 12.75 $3,621,037 28.00$1,825,161
TRANSFERS & OTHER REQUIREMENTS
$22,446 0.00 $22,816 0.00 $22,816 0.00OtherRequirements
0.00 $19,514 0.00$14,520
$22,446 0.00 $22,816 0.00 $22,816 0.00Subtotal 0.00 $19,514 0.00$14,520
$19,587,585 320.50 $21,367,656 325.00 $21,077,122 325.00Total 310.50 $25,010,790 330.00$18,047,074
2012-13 Proposed Budget, Austin, TX
Volume I | 309
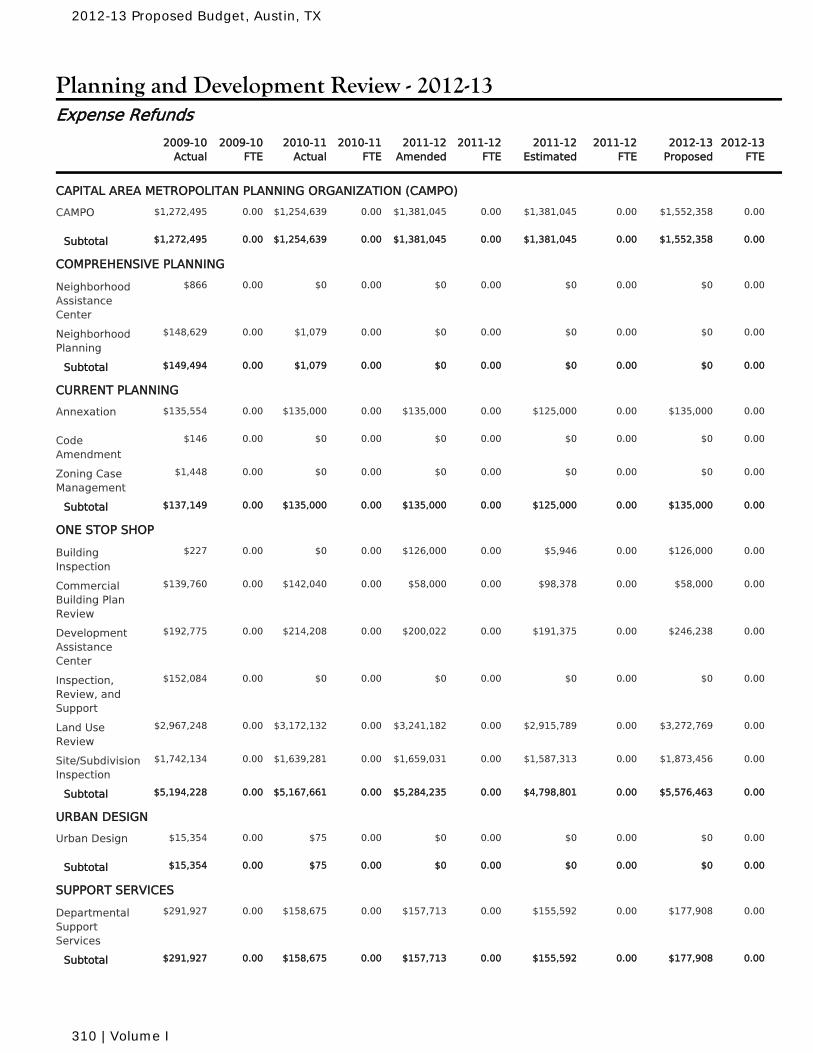
Planning and Development Review - 2012-13
2010-11Actual
2010-11FTE
2011-12Amended
2011-12FTE
2011-12Estimated
2011-12FTE
2009-10Actual
2009-10FTE
2012-13Proposed
2012-13FTE
Expense Refunds
CAPITAL AREA METROPOLITAN PLANNING ORGANIZATION (CAMPO)
$1,254,639 0.00 $1,381,045 0.00 $1,381,045 0.00CAMPO 0.00 $1,552,358 0.00$1,272,495
$1,254,639 0.00 $1,381,045 0.00 $1,381,045 0.00Subtotal 0.00 $1,552,358 0.00$1,272,495
COMPREHENSIVE PLANNING
$0 0.00 $0 0.00 $0 0.00NeighborhoodAssistanceCenter
0.00 $0 0.00$866
$1,079 0.00 $0 0.00 $0 0.00NeighborhoodPlanning
0.00 $0 0.00$148,629
$1,079 0.00 $0 0.00 $0 0.00Subtotal 0.00 $0 0.00$149,494
CURRENT PLANNING
$135,000 0.00 $135,000 0.00 $125,000 0.00Annexation 0.00 $135,000 0.00$135,554
$0 0.00 $0 0.00 $0 0.00CodeAmendment
0.00 $0 0.00$146
$0 0.00 $0 0.00 $0 0.00Zoning CaseManagement
0.00 $0 0.00$1,448
$135,000 0.00 $135,000 0.00 $125,000 0.00Subtotal 0.00 $135,000 0.00$137,149
ONE STOP SHOP
$0 0.00 $126,000 0.00 $5,946 0.00BuildingInspection
0.00 $126,000 0.00$227
$142,040 0.00 $58,000 0.00 $98,378 0.00CommercialBuilding PlanReview
0.00 $58,000 0.00$139,760
$214,208 0.00 $200,022 0.00 $191,375 0.00DevelopmentAssistanceCenter
0.00 $246,238 0.00$192,775
$0 0.00 $0 0.00 $0 0.00Inspection,Review, andSupport
0.00 $0 0.00$152,084
$3,172,132 0.00 $3,241,182 0.00 $2,915,789 0.00Land UseReview
0.00 $3,272,769 0.00$2,967,248
$1,639,281 0.00 $1,659,031 0.00 $1,587,313 0.00Site/SubdivisionInspection
0.00 $1,873,456 0.00$1,742,134
$5,167,661 0.00 $5,284,235 0.00 $4,798,801 0.00Subtotal 0.00 $5,576,463 0.00$5,194,228
URBAN DESIGN
$75 0.00 $0 0.00 $0 0.00Urban Design 0.00 $0 0.00$15,354
$75 0.00 $0 0.00 $0 0.00Subtotal 0.00 $0 0.00$15,354
SUPPORT SERVICES
$158,675 0.00 $157,713 0.00 $155,592 0.00DepartmentalSupportServices
0.00 $177,908 0.00$291,927
$158,675 0.00 $157,713 0.00 $155,592 0.00Subtotal 0.00 $177,908 0.00$291,927
2012-13 Proposed Budget, Austin, TX
310 | Volume I
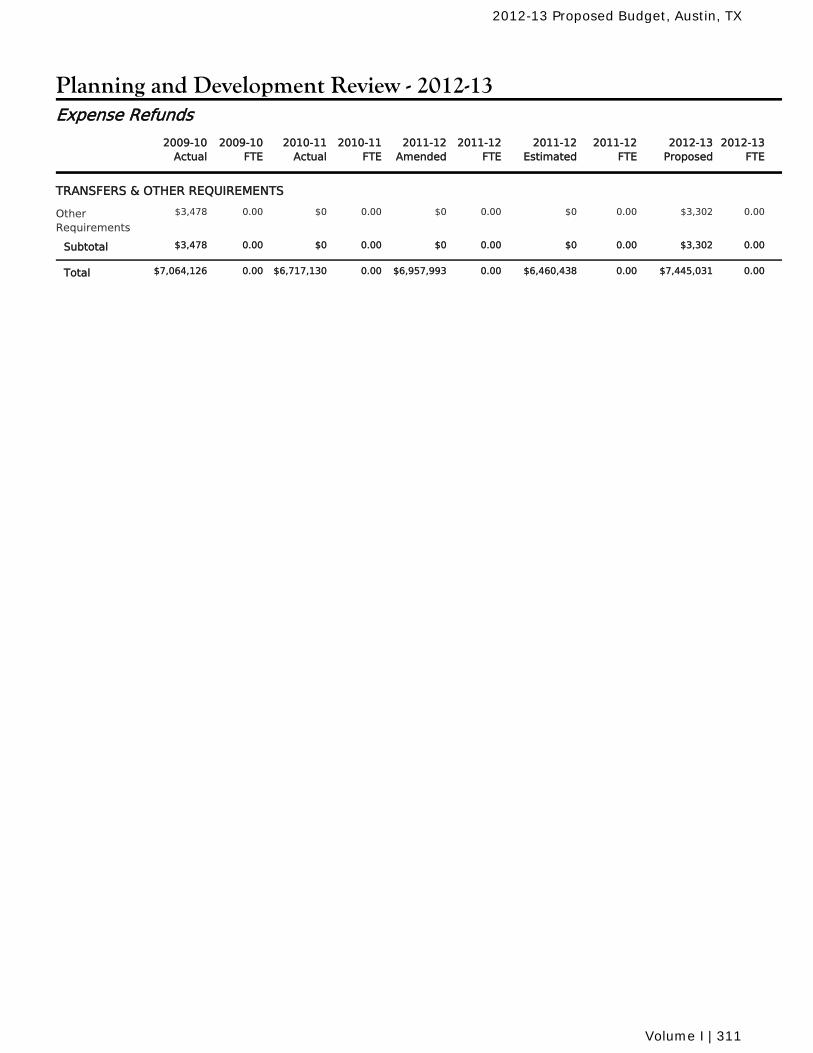
Planning and Development Review - 2012-13
2010-11Actual
2010-11FTE
2011-12Amended
2011-12FTE
2011-12Estimated
2011-12FTE
2009-10Actual
2009-10FTE
2012-13Proposed
2012-13FTE
Expense Refunds
TRANSFERS & OTHER REQUIREMENTS
$0 0.00 $0 0.00 $0 0.00OtherRequirements
0.00 $3,302 0.00$3,478
$0 0.00 $0 0.00 $0 0.00Subtotal 0.00 $3,302 0.00$3,478
$6,717,130 0.00 $6,957,993 0.00 $6,460,438 0.00Total 0.00 $7,445,031 0.00$7,064,126
2012-13 Proposed Budget, Austin, TX
Volume I | 311

2012-13 Proposed Budget, Austin, TX
312 | Volume I
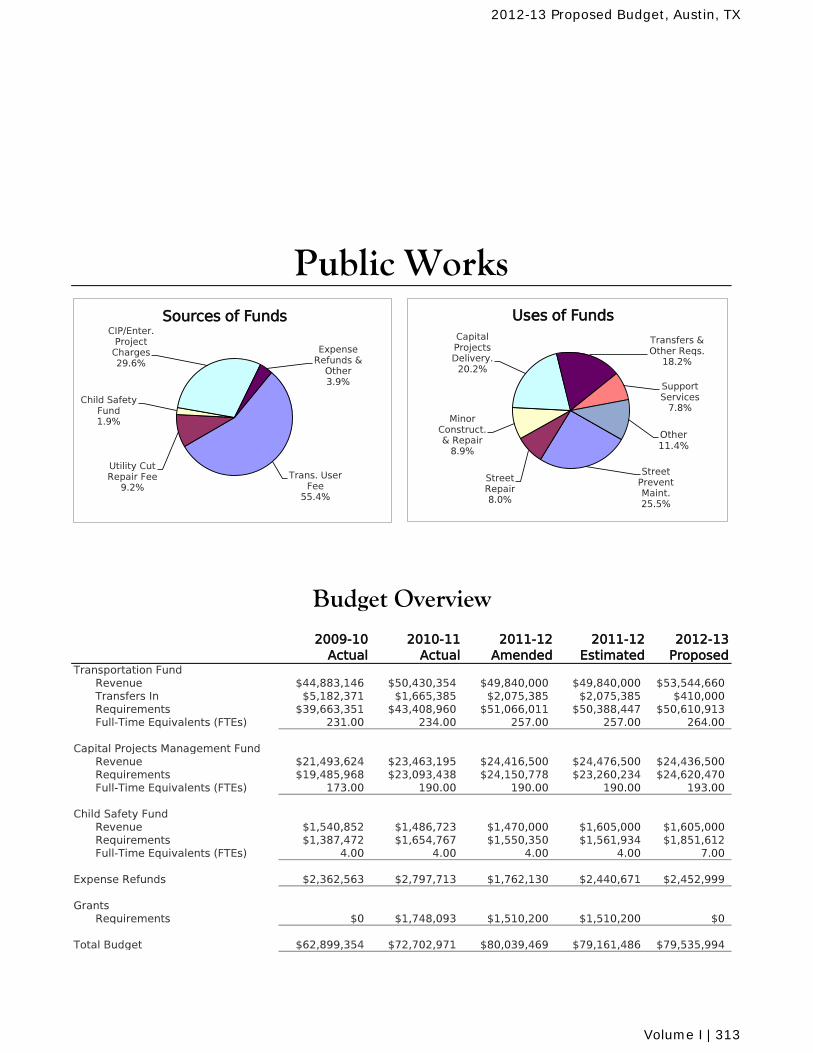
2009-10 Actual
2010-11 Actual
2011-12 Amended
2011-12 Estimated
2012-13 Proposed
Transportation FundRevenue $44,883,146 $50,430,354 $49,840,000 $49,840,000 $53,544,660Transfers In $5,182,371 $1,665,385 $2,075,385 $2,075,385 $410,000Requirements $39,663,351 $43,408,960 $51,066,011 $50,388,447 $50,610,913Full-Time Equivalents (FTEs) 231.00 234.00 257.00 257.00 264.00
Capital Projects Management FundRevenue $21,493,624 $23,463,195 $24,416,500 $24,476,500 $24,436,500Requirements $19,485,968 $23,093,438 $24,150,778 $23,260,234 $24,620,470Full-Time Equivalents (FTEs) 173.00 190.00 190.00 190.00 193.00
Child Safety FundRevenue $1,540,852 $1,486,723 $1,470,000 $1,605,000 $1,605,000Requirements $1,387,472 $1,654,767 $1,550,350 $1,561,934 $1,851,612Full-Time Equivalents (FTEs) 4.00 4.00 4.00 4.00 7.00
Expense Refunds $2,362,563 $2,797,713 $1,762,130 $2,440,671 $2,452,999
GrantsRequirements $0 $1,748,093 $1,510,200 $1,510,200 $0
Total Budget $62,899,354 $72,702,971 $80,039,469 $79,161,486 $79,535,994
Budget Overview
Public Works
Trans. User Fee
55.4%
Utility Cut Repair Fee
9.2%
Child Safety Fund 1.9%
CIP/Enter. Project
Charges 29.6%
Expense Refunds &
Other 3.9%
Sources of Funds
Street Prevent Maint. 25.5%
Street Repair 8.0%
Minor Construct. & Repair
8.9%
Capital Projects Delivery.
20.2%
Transfers & Other Reqs.
18.2%
Support Services
7.8%
Other 11.4%
Uses of Funds
2012-13 Proposed Budget, Austin, TX
Volume I | 313
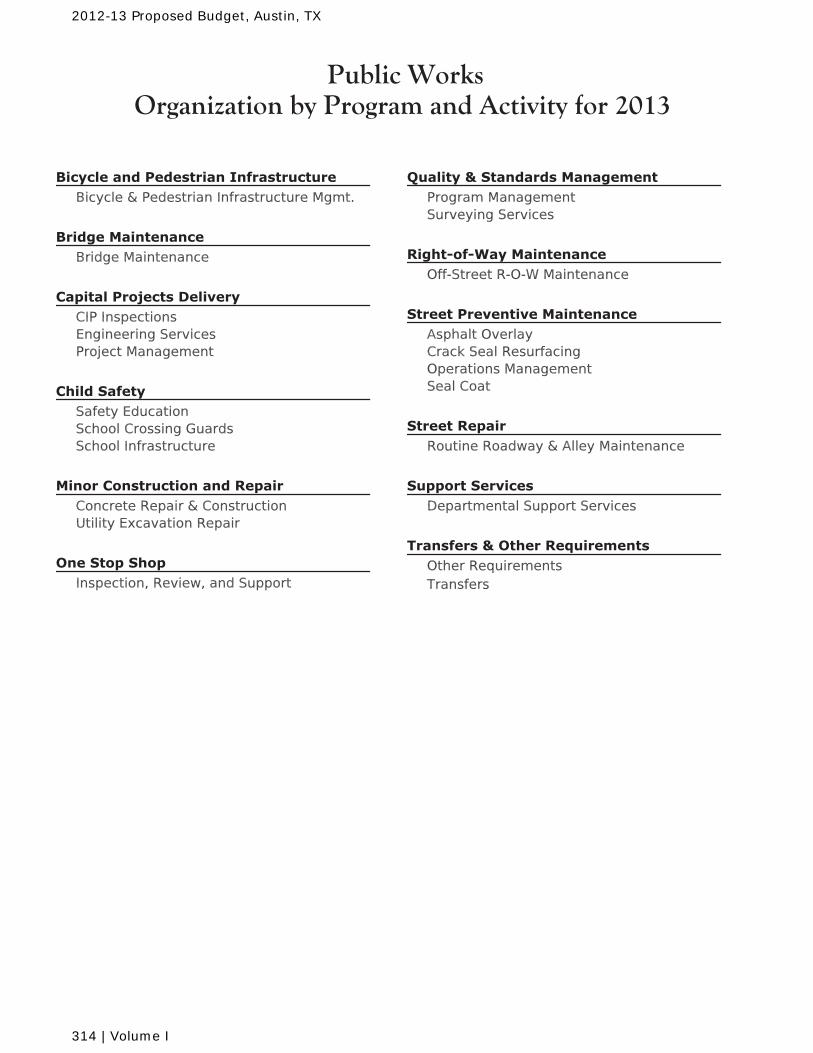
Public WorksOrganization by Program and Activity for 2013
Bicycle & Pedestrian Infrastructure Mgmt.
Bridge Maintenance
CIP InspectionsEngineering ServicesProject Management
Safety EducationSchool Crossing GuardsSchool Infrastructure
Concrete Repair & ConstructionUtility Excavation Repair
Inspection, Review, and Support
Program ManagementSurveying Services
Off-Street R-O-W Maintenance
Asphalt OverlayCrack Seal ResurfacingOperations ManagementSeal Coat
Routine Roadway & Alley Maintenance
Departmental Support Services
Other RequirementsTransfers
2012-13 Proposed Budget, Austin, TX
314 | Volume I
Public WorksMission and Goals for 2013
The mission of the Public Works Department is to provide an integrated approach to thedevelopment, design, construction, and maintenance of the City's infrastructure systems thatsupport an exceptional quality of life in an environmentally sustainable manner.
Maintain and improve the quality of Austin's streets.
Increase the street inventory in Fair to Excellent condition to 80% by 2018.Provide preventive maintenance on 10% of the roadway inventory annually.
Ensure a safe and efficient multi-modal transportation system.
Program 100% of bicycle, pedestrian and road projects in the approved annual schedule.Increase accessibility and connectivity of existing sidewalk infrastructure by adding 14,000linear feet of sidewalks and 100 curb ramps annually. Provide crossing guard coverage for all designated school crossings 100% of the time.
Implement Capital Improvement Program (CIP) projects on time, within budget, and with highquality.
80% of projects managed by Public Works will be completed in accordance with the acceptedbaseline schedule.Non-user requested change orders will make up less than 5% of total construction contractawards.
Ensure quality design and construction of infrastructure.
90% of projects managed by Public Works will pass the one-year warranty inspection withoutsignificant construction deficiencies.
2012-13 Proposed Budget, Austin, TX
Volume I | 315
Public Works
Message from the Director
Your Public Works Department (PWD) provides a wide array of services, projects and maintenance activities for Austin’s residents and businesses. Our four primary service areas are street and bridge maintenance and repair; design and delivery of capital improvement projects; neighborhood connectivity activities including planning and construction of bicycle and pedestrian facilities and implementation of the child safety program including school zone improvement projects and the provision of crossing guards for neighborhood schools. Service delivery in these areas are challenged by an aging and expanding roadway infrastructure, continued growth of the city of Austin’s geographic area, and uncertainties in the costs of materials. PWD will continue to implement creative, innovative, and sustainable strategies to address the City’s needs for mobility, safety, and facilities development that obtain the best value for the resources available. In recognition of these efforts, PWD has received 15 major regional, state, and national awards over the past 18 months. PWD will enhance its Child Safety services with the consolidation of all Safe Routes to School assets within the department.
The efforts to provide street and bridge improvements and maintenance of the Right-of-Way (ROW) draw from the City’s Transportation Fund. PWD is recommending a small increase in the Transportation User Fee for FY 2011-12, which is the primary funding source for the Fund. The additional resources will enable the department to improve its maintenance of the public right of way though both traditional and innovative means. Several new approaches to traffic calming are being fielded in partnership with the Transportation Department. Partial depth reconstruction, an economical method to extend the lifespan of our roadways, was tested in FY 2011-12 and will be more fully implemented in the coming year. Additional uses of reclaimed and recycled materials, along with added emphasis on emissions reductions will continue to reduce the environmental impact of our operations. The result of these efforts is that PWD has reached its goal to reduce the number of unsatisfactory pavements to under 20% five years ahead of schedule.
FY 2012-13 will be a strong year for capital construction. PWD will continue work on several iconic projects. The boardwalk at Lady Bird Lake, started late in FY 2011-12, will be in full construction mode. Initiation of work on the new Central Library is currently forecasted for late in the fiscal year. Repairs to Barton Springs Pool will be made, preserving this piece of Austin for generations to come. PWD will also continue its Accelerate Austin program to rebuild our infrastructure. Utilities replacements, flood control efforts, and facility construction will also continue. Our Neighborhood Partnering Program is also hitting its stride, with over thirty active community generated projects in the pipeline. PWD’s requirements to support the Capital Improvement Program are funded by capital project revenues, which are managed through the Capital Project Management Fund (CPMF). Due to the sustained level of activity, PWD is requesting two additional staff resources to provide expanded project cost estimating and project control activities.
The Child Safety Fund (CSF) receives revenues from vehicle registrations and from traffic violations that occur in school zones, and provides the funding source to pay for crossing guards and school zone safety improvements. The FY 2011-12 Budget includes a pay increase of 3% for the crossing guards that work at various schools in Austin. The increase is recommended to help reduce the staffing turnover rate that the program experiences and retain the experience necessary to keep our children safe traveling to and from school.
Howard Lazarus, P.E. Public Works Director
2012-13 Proposed Budget, Austin, TX
316 | Volume I
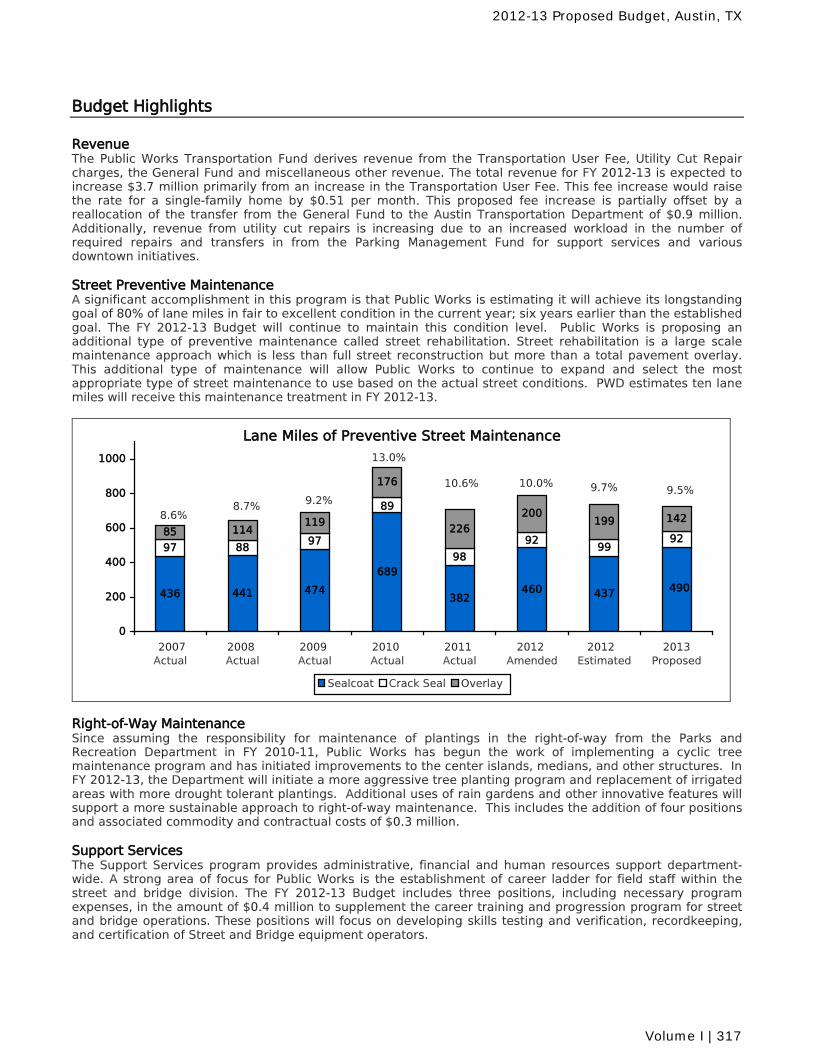
Budget Highlights
Revenue The Public Works Transportation Fund derives revenue from the Transportation User Fee, Utility Cut Repair charges, the General Fund and miscellaneous other revenue. The total revenue for FY 2012-13 is expected to increase $3.7 million primarily from an increase in the Transportation User Fee. This fee increase would raise the rate for a single-family home by $0.51 per month. This proposed fee increase is partially offset by a reallocation of the transfer from the General Fund to the Austin Transportation Department of $0.9 million. Additionally, revenue from utility cut repairs is increasing due to an increased workload in the number of required repairs and transfers in from the Parking Management Fund for support services and various downtown initiatives. Street Preventive Maintenance A significant accomplishment in this program is that Public Works is estimating it will achieve its longstanding goal of 80% of lane miles in fair to excellent condition in the current year; six years earlier than the established goal. The FY 2012-13 Budget will continue to maintain this condition level. Public Works is proposing an additional type of preventive maintenance called street rehabilitation. Street rehabilitation is a large scale maintenance approach which is less than full street reconstruction but more than a total pavement overlay. This additional type of maintenance will allow Public Works to continue to expand and select the most appropriate type of street maintenance to use based on the actual street conditions. PWD estimates ten lane miles will receive this maintenance treatment in FY 2012-13.
Lane Miles of Preventive Street Maintenance
436 441 474
689
437
97 8897 92
460382
490
98
92
89
99
11485119
176
226200
199 142
0
200
400
600
800
1000
2007 Actual
2008 Actual
2009 Actual
2010 Actual
2011 Actual
2012 Amended
2012 Estimated
2013Proposed
Sealcoat Crack Seal Overlay
8.6%
9.5%
13.0%
10.6% 9.7%9.2%8.7%
10.0%
Right-of-Way Maintenance Since assuming the responsibility for maintenance of plantings in the right-of-way from the Parks and Recreation Department in FY 2010-11, Public Works has begun the work of implementing a cyclic tree maintenance program and has initiated improvements to the center islands, medians, and other structures. In FY 2012-13, the Department will initiate a more aggressive tree planting program and replacement of irrigated areas with more drought tolerant plantings. Additional uses of rain gardens and other innovative features will support a more sustainable approach to right-of-way maintenance. This includes the addition of four positions and associated commodity and contractual costs of $0.3 million. Support Services The Support Services program provides administrative, financial and human resources support department-wide. A strong area of focus for Public Works is the establishment of career ladder for field staff within the street and bridge division. The FY 2012-13 Budget includes three positions, including necessary program expenses, in the amount of $0.4 million to supplement the career training and progression program for street and bridge operations. These positions will focus on developing skills testing and verification, recordkeeping, and certification of Street and Bridge equipment operators.
2012-13 Proposed Budget, Austin, TX
Volume I | 317
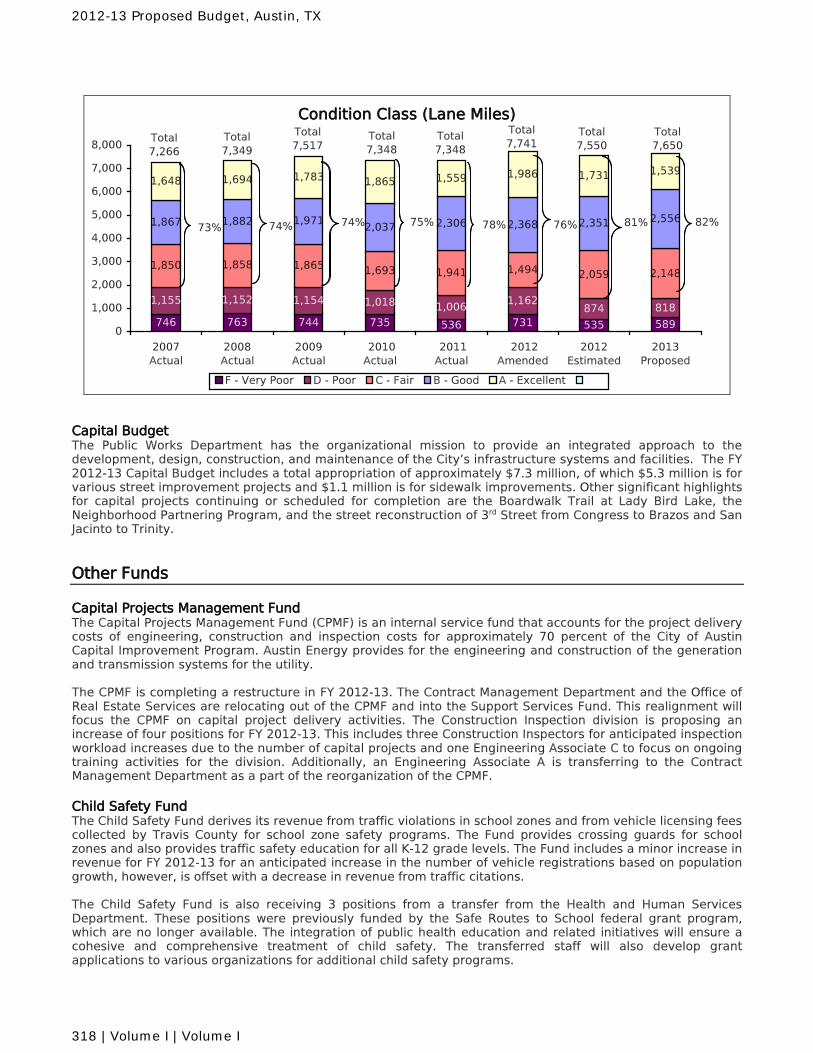
Condition Class (Lane Miles)
746 763 744 735 536 731 535 589
1,155 1,152 1,154 1,018 1,006 1,162874 818
1,850 1,858 1,865 1,693 1,941 1,494 2,059 2,148
1,867 1,882 1,9712,037 2,306 2,368 2,351 2,556
1,648 1,694 1,783 1,865 1,559 1,986 1,731 1,539
0
1,000
2,000
3,000
4,000
5,000
6,000
7,000
8,000
2007 Actual
2008 Actual
2009 Actual
2010 Actual
2011 Actual
2012 Amended
2012Estimated
2013Proposed
F - Very Poor D - Poor C - Fair B - Good A - Excellent
Total7,650
Total7,348
Total7,266
Total7,517
81%75%74% 74% 76%78%
Total7,348
Total7,550
82%
Total7,741
73%
Total7,349
Capital Budget The Public Works Department has the organizational mission to provide an integrated approach to the development, design, construction, and maintenance of the City’s infrastructure systems and facilities. The FY 2012-13 Capital Budget includes a total appropriation of approximately $7.3 million, of which $5.3 million is for various street improvement projects and $1.1 million is for sidewalk improvements. Other significant highlights for capital projects continuing or scheduled for completion are the Boardwalk Trail at Lady Bird Lake, the Neighborhood Partnering Program, and the street reconstruction of 3rd Street from Congress to Brazos and San Jacinto to Trinity. Other Funds Capital Projects Management Fund The Capital Projects Management Fund (CPMF) is an internal service fund that accounts for the project delivery costs of engineering, construction and inspection costs for approximately 70 percent of the City of Austin Capital Improvement Program. Austin Energy provides for the engineering and construction of the generation and transmission systems for the utility. The CPMF is completing a restructure in FY 2012-13. The Contract Management Department and the Office of Real Estate Services are relocating out of the CPMF and into the Support Services Fund. This realignment will focus the CPMF on capital project delivery activities. The Construction Inspection division is proposing an increase of four positions for FY 2012-13. This includes three Construction Inspectors for anticipated inspection workload increases due to the number of capital projects and one Engineering Associate C to focus on ongoing training activities for the division. Additionally, an Engineering Associate A is transferring to the Contract Management Department as a part of the reorganization of the CPMF. Child Safety Fund The Child Safety Fund derives its revenue from traffic violations in school zones and from vehicle licensing fees collected by Travis County for school zone safety programs. The Fund provides crossing guards for school zones and also provides traffic safety education for all K-12 grade levels. The Fund includes a minor increase in revenue for FY 2012-13 for an anticipated increase in the number of vehicle registrations based on population growth, however, is offset with a decrease in revenue from traffic citations. The Child Safety Fund is also receiving 3 positions from a transfer from the Health and Human Services Department. These positions were previously funded by the Safe Routes to School federal grant program, which are no longer available. The integration of public health education and related initiatives will ensure a cohesive and comprehensive treatment of child safety. The transferred staff will also develop grant applications to various organizations for additional child safety programs.
2012-13 Proposed Budget, Austin, TX
318 | Volume I | Volume I
Transportation Fund
Revenue Changes Dollars
The Budget includes an increase of $2,987,601 for revenue from an increase in theTransportation User Fee and an increase in the customer base based on populationgrowth. $2,987,601
The Budget includes an increase of $667,059 for revenue from the expected increasein workload on Utility Cut projects for the Austin Water Utility. $667,059
The Budget includes a decrease of $1,665,385 for revenue from the General Fundtransfer being reallocated from Public Works Department to the AustinTransportation Department to support non-Transportation User Fee eligible programsand activities. ($1,665,385)
Expenditure Changes FTEs Dollars
CitywideThe Budget includes $358,651 for salary increases associated with wage adjustmentsin FY 2013. An additional $78,999 is included in the Budget for increased Citycontributions for health insurance. $437,650
The Budget includes additional funding for the Employees' Retirement System that isequivalent to 2% of payroll for non-civil service employees to help improve thefunded status of the pension system. $241,731
The Budget includes $51,785 for wage adjustments associated with implementingthe City's recently completed market study. $51,785
In previous years, the Public Works Department budgeted the entire supplementalpension funding for the Employees' Retirement System for the Austin TransportationDepartment (ATD). This funding is being reallocated to ATD for the Budget, therebyreducing the total pension budget. ($555,188)
Minor Construction and RepairOne position has been reallocated to the Street Preventative Maintenance Program inorder to meet changes in workloads, duties and work types. (1.00) ($64,978)
In FY 2012, there are non-cost of living salary increases as a result of reclassificationsof non-supervisory field positions amounting to personnel costs of $79,860. $79,860
The overtime budget is decreasing $300,000 and reallocated to the temporaryemployee and asphalt materials budgets for a net impact of zero. $0
Personnel costs and benefits associated with temporary employees are increasing toassist this staff working to diminish the backlog of unrepaired utility cuts whilepermanent staff handle the day-to-day workload. $387,148
Budgeted commodities are increasing a net $161,655 largely due to an increase inthe asphalt materials, based on need and increased cost. $161,655
Expense Refunds are increasing a net $354,741 due to a decrease ininterdepartmental charges and refunds, along with an increased reimbursement ofCIP charges and department overhead distribution. ($354,741)
Public WorksSignificant Changes
2012-13 Proposed Budget, Austin, TX
Volume I | 319
Expenditure Changes FTEs Dollars
The Non-CIP budget is decreasing due to the removal of completed one-time capitalpurchases from the prior year budget. ($212,000)
Right-of-Way MaintenanceFour new Street and Bridge Operations Technician positions are included in the FY2013 Budget to form a new street tree maintenance and planting crew. 4.00 $225,563
Positions added in FY 2012 included an increase in personnel savings due to thepositions being hired during the middle of the year. These savings are beingeliminated from the FY 2013 Budget. $63,327
An overall net increase in contractuals largely for rental equipment, other equipment,grounds maintenance and interdepartmental charges for estimated work to becompleted to support the new street tree maintenance and tree planting crew isincluded in the Budget. $113,400
An interdepartmental expense refund from Austin Resource Recovery (ARR) has beenincluded in the FY 2013 Budget to inspect and notify ARR of obstruction in blindcorners and in the right-of-ways. ($200,000)
One-time purchases of capital items from the prior year budget have been removedfrom the FY 2013 Budget. ($151,000)
Street Preventative MaintenanceOne position has been reallocated from the Minor Construction and Repair programin order to meet changes in workloads, duties and work types. 1.00 $64,978
One position is being transferred in from the Support Services program in order tomeet the business processes needs relating to the implementation of a work ordersystem. This is partially offset with the transfer of one position to Support Servicesto meet the technological improvements needs relating to a work order system. $35,871
Salaries and related personnel costs are increasing for departmental reclassificationsof non-supervisory field positions. Based on positions filled in the current year, thesereclassifications total $170,098 including benefits. $170,098
Positions added in FY 2012 included an increase in personnel savings due to thepositions being hired during the middle of the year. These savings are beingeliminated from the FY 2013 Budget. $137,018
Personnel costs for seasonal and temporary employees have been added based onthe department's estimated workload. $93,639
One-time capital costs completed in the prior year for vehicles, replacement rollersand solar arrow boards are being removed from the Budget. ($147,000)
The prior year Budget included $1,500,000 for a first-time pilot street rehabilitationproject to be done by contract. For FY 2013, this is being deferred to evaluate theeffectiveness of the pilot project. ($1,500,000)
The Budget includes a total net decrease of $1,069,939 in contracted services forasphalt overlay street preventative maintenance due to the increased cost percontracted lane mile while maintaining the condition class of lane miles in fair toexcellent condition at 80% or greater. ($1,069,939)
Street RepairPersonnel cost increases resulting from department initiated position reclassificationsof non-supervisory field staff in the prior year are included in the Budget. $131,813
2012-13 Proposed Budget, Austin, TX
320 | Volume I
Expenditure Changes FTEs Dollars
Support ServicesThe Non-CIP Capital category has decreased due to eliminating one-time purchasesmade in the prior year budget. ($113,000)
The Support Services program is increasing by 3 positions for $192,370 to providetraining, certification and administration of a new career progression initiative for theStreet and Bridge Operations field staff. Also included are increases in office rental,utilities, educational materials, program management services and various officesupplies for this new program. 3.00 $442,140
Transfers and Other RequirementsThe transfer to the Sustainability Fund is eliminated from the FY 2013 Budget. ($518,828)
The FY 2013 Budget includes an increased transfer of $880,000 to the Public WorksTechnology CIP to continue with the Department's multi-phase work order trackingand infrastructure management technology project. This is partially offset with adecrease in the transfer to CIP for Public Works facilities made in the prior year.
$185,000
General Obligation Debt Service transfer is decreasing $164,348 due to departmentaldebt being retired. ($164,348)
The Budget includes a net increase in Fleet maintenance costs that are partiallyoffset by reduced fuel costs based on the department consumption for FY 2013. $22,207
Transfers for CTM Support, CTECC, Workers' Compensation, UCSO Billing Support andTrunked Radio are increasing by a net total of $232,680 for the Budget. $232,680
The transfer for City Administrative Support is increasing based on the reorganizationof the Capital Projects Management Fund. $1,569,699
Capital Projects Management Fund
Revenue Changes
The Budget includes a decrease of $20,000 in revenue from CIP project chargesbased on the estimated number of projects for the upcoming fiscal year. ($20,000)
Expenditure Changes
CitywideThe Budget includes $463,516 for salary increases associated with wage adjustmentsin FY 2013. An additional $58,330 is included in the Budget for increased Citycontributions for health insurance. $521,846
The Budget includes additional funding for the Employees' Retirement System that isequivalent to 2% of payroll for non-civil service employees to help improve thefunded status of the pension system. $277,385
The Budget includes $12,474 for wage adjustments associated with implementing the City's recently completed market study. $12,474
In previous years, the Public Works Department budgeted the entire supplementalpension funding for the Employees' Retirement System for the Contract ManagementDepartment (CMD). This funding is being reallocated to CMD for the Budget, therebyreducing the total pension budget. ($388,925)
2012-13 Proposed Budget, Austin, TX
Volume I | 321
Expenditure Changes FTEs Dollars
Capital Projects Deliverypositions are new Inspectors to help with a general increase in workload.Additionally, one new position, an Engineering Associate C, is added to act as adivision-wide trainer for all inspection activities. 4.00 $316,709
Five new Ford Escape Hybrids are being purchased for the Construction Inspectiondivision at an estimated cost of $32,000 each. This is partially offset with a reductionof one-time capital costs from the prior year. ($218,000)
Support ServicesOne vacant Engineer Associate A position is transferring to the Contract ManagementDepartment as part of the reorganization of the Capital Projects Management Fund. (1.00) ($73,087)
Department-wideA reduction in the minor computer hardware spending is included in the Budget. ($76,879)
Transfers for Workers' Compensation, Liability Reserve, City Administrative Supportand Trunked Radio are decreasing for the Budget. This decrease is partially offset bya $59,626 increase in the Communications and Technology Management transfer. ($83,205)
The Budget includes a net increase in personnel and contracutal costs for skill basedpay, blingual pay, cell phone stipends and rent for office space . $140,848
The Budget includes a net increase in Fleet maintenance costs that are partiallyoffset by reduced fuel costs based on department consumption for FY 2013. $21,471
Child Safety Fund
Revenue Changes
The Budget includes an increase of $135,000 for revenue from greater parkingcitations and vehicle registration fees associated with a general increase in thepopulation. $135,000
Expenditure Changes
CitywideThe Budget includes $6,084 for salary increases associated with wage adjustments inFY 2013. An additional $1,228 is included in the Budget for increased Citycontributions for health insurance. $7,312
The Budget includes additional funding for the Employees' Retirement System that isequivalent to 2% of payroll for non-civil service employees to help improve thefunded status of the pension system. $4,458
The Budget includes $818 for wage adjustments associated with implementing theCity's recently completed market study. $818
Child SafetyA Public Health Educator I, Public Health Educator II and Administrative Seniorpositions are transferring to the Fund from the Health and Human ServicesDepartment to work on child safety education and programs. 3.00 $195,704
The Budget includes a $110,000 increase in the crossing guard budget to cover newlocations in addition to the increased costs associated with a pay increase forcrossing guards. $110,000
The Budget includes a reduction of capital equipment for the purchase of areplacement van in the prior year. ($32,000)
2012-13 Proposed Budget, Austin, TX
322 | Volume I
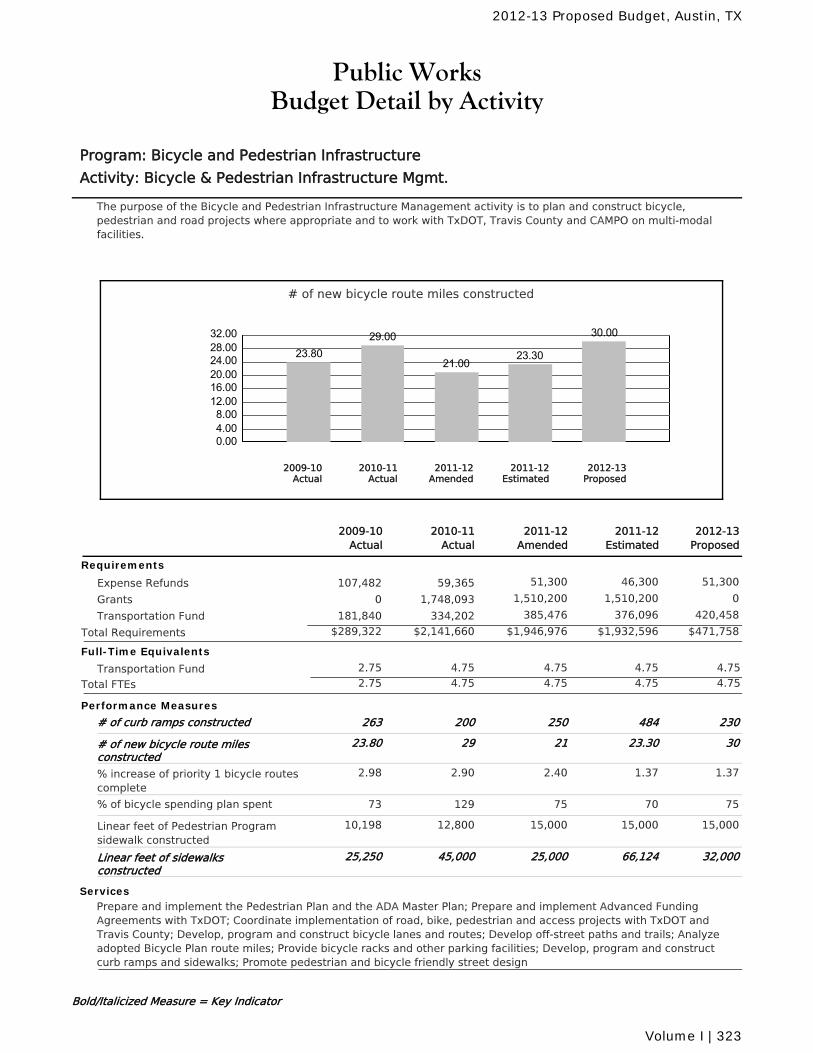
Public WorksBudget Detail by Activity
Program: Bicycle and Pedestrian Infrastructure
Activity: Bicycle & Pedestrian Infrastructure Mgmt.
The purpose of the Bicycle and Pedestrian Infrastructure Management activity is to plan and construct bicycle,pedestrian and road projects where appropriate and to work with TxDOT, Travis County and CAMPO on multi-modalfacilities.
# of new bicycle route miles constructed
0.004.008.0012.0016.0020.0024.0028.0032.00
23.8029.00
21.0023.30
30.00
2010-11Actual
2012-13Proposed
2011-12Amended
2011-12Estimated
2009-10Actual
2011-12Amended
2010-11Actual
2011-12Estimated
2012-13Proposed
2009-10Actual
Requirements
Expense Refunds 51,300 46,300 51,30059,365107,482
Grants 1,510,200 1,510,200 01,748,0930
Transportation Fund 385,476 376,096 420,458334,202181,840
$1,946,976 $1,932,596 $471,758Total Requirements $2,141,660$289,322
Full-Time Equivalents
Transportation Fund 4.75 4.75 4.75 4.752.75
Total FTEs 4.75 4.75 4.75 4.752.75
Performance Measures
# of curb ramps constructed 250200 484 230263
# of new bicycle route milesconstructed
2129 23.30 3023.80
% increase of priority 1 bicycle routescomplete
2.402.90 1.37 1.372.98
% of bicycle spending plan spent 75129 70 7573
Linear feet of Pedestrian Programsidewalk constructed
15,00012,800 15,000 15,00010,198
Linear feet of sidewalksconstructed
25,00045,000 66,124 32,00025,250
ServicesPrepare and implement the Pedestrian Plan and the ADA Master Plan; Prepare and implement Advanced FundingAgreements with TxDOT; Coordinate implementation of road, bike, pedestrian and access projects with TxDOT andTravis County; Develop, program and construct bicycle lanes and routes; Develop off-street paths and trails; Analyzeadopted Bicycle Plan route miles; Provide bicycle racks and other parking facilities; Develop, program and constructcurb ramps and sidewalks; Promote pedestrian and bicycle friendly street design
Bold/Italicized Measure = Key Indicator
2012-13 Proposed Budget, Austin, TX
Volume I | 323
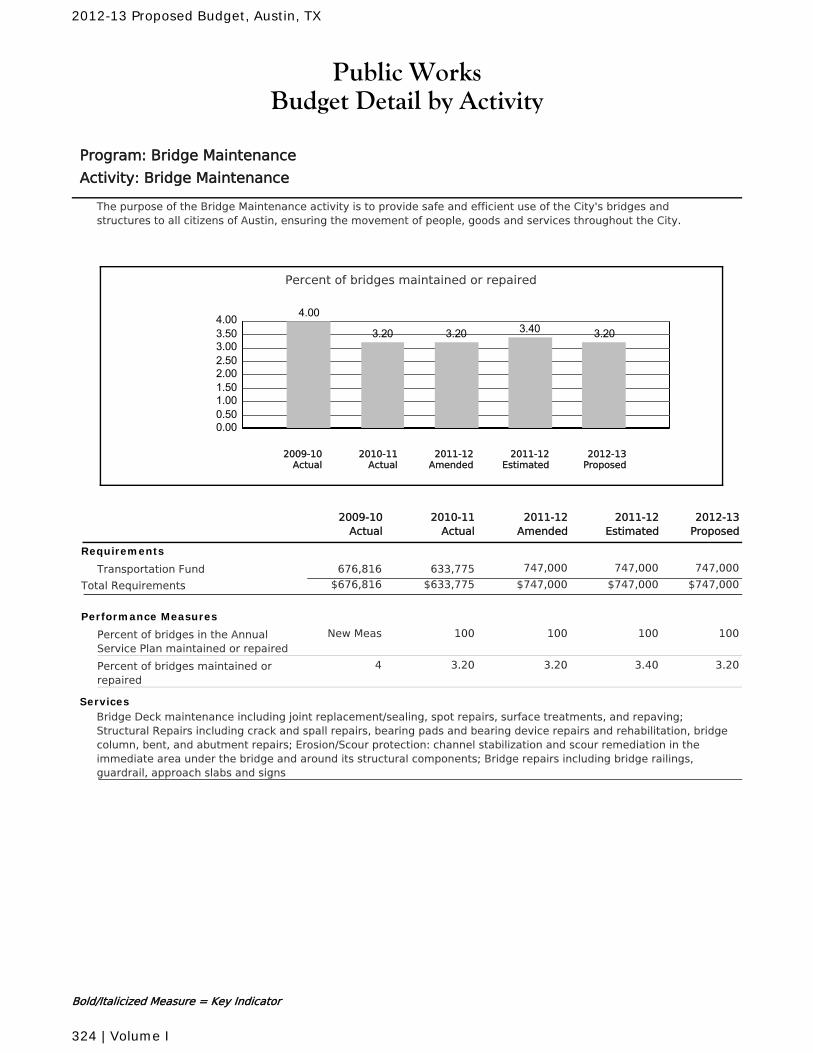
Public WorksBudget Detail by Activity
Program: Bridge Maintenance
Activity: Bridge Maintenance
The purpose of the Bridge Maintenance activity is to provide safe and efficient use of the City's bridges andstructures to all citizens of Austin, ensuring the movement of people, goods and services throughout the City.
Percent of bridges maintained or repaired
0.000.501.001.502.002.503.003.504.00 4.00
3.20 3.20 3.40 3.20
2010-11Actual
2012-13Proposed
2011-12Amended
2011-12Estimated
2009-10Actual
2011-12Amended
2010-11Actual
2011-12Estimated
2012-13Proposed
2009-10Actual
Requirements
Transportation Fund 747,000 747,000 747,000633,775676,816
$747,000 $747,000 $747,000Total Requirements $633,775$676,816
Performance Measures
Percent of bridges in the AnnualService Plan maintained or repaired
100100 100 100New Meas
Percent of bridges maintained orrepaired
3.203.20 3.40 3.204
ServicesBridge Deck maintenance including joint replacement/sealing, spot repairs, surface treatments, and repaving;Structural Repairs including crack and spall repairs, bearing pads and bearing device repairs and rehabilitation, bridgecolumn, bent, and abutment repairs; Erosion/Scour protection: channel stabilization and scour remediation in theimmediate area under the bridge and around its structural components; Bridge repairs including bridge railings,guardrail, approach slabs and signs
Bold/Italicized Measure = Key Indicator
2012-13 Proposed Budget, Austin, TX
324 | Volume I
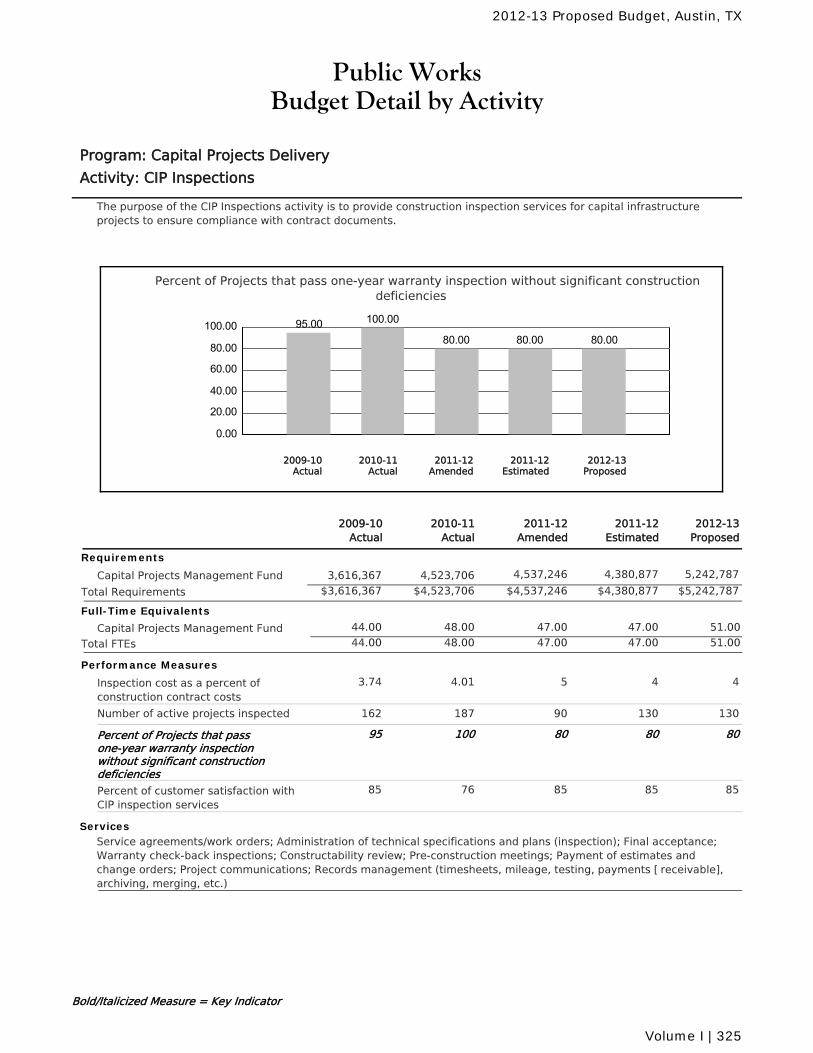
Public WorksBudget Detail by Activity
Program: Capital Projects Delivery
Activity: CIP Inspections
The purpose of the CIP Inspections activity is to provide construction inspection services for capital infrastructureprojects to ensure compliance with contract documents.
Percent of Projects that pass one-year warranty inspection without significant constructiondeficiencies
0.00
20.00
40.00
60.00
80.00
100.00 95.00 100.00
80.00 80.00 80.00
2010-11Actual
2012-13Proposed
2011-12Amended
2011-12Estimated
2009-10Actual
2011-12Amended
2010-11Actual
2011-12Estimated
2012-13Proposed
2009-10Actual
Requirements
Capital Projects Management Fund 4,537,246 4,380,877 5,242,7874,523,7063,616,367
$4,537,246 $4,380,877 $5,242,787Total Requirements $4,523,706$3,616,367
Full-Time Equivalents
Capital Projects Management Fund 48.00 47.00 47.00 51.0044.00
Total FTEs 48.00 47.00 47.00 51.0044.00
Performance Measures
Inspection cost as a percent ofconstruction contract costs
54.01 4 43.74
Number of active projects inspected 90187 130 130162
Percent of Projects that passone-year warranty inspectionwithout significant constructiondeficiencies
80100 80 8095
Percent of customer satisfaction withCIP inspection services
8576 85 8585
ServicesService agreements/work orders; Administration of technical specifications and plans (inspection); Final acceptance;Warranty check-back inspections; Constructability review; Pre-construction meetings; Payment of estimates andchange orders; Project communications; Records management (timesheets, mileage, testing, payments [receivable],archiving, merging, etc.)
Bold/Italicized Measure = Key Indicator
2012-13 Proposed Budget, Austin, TX
Volume I | 325
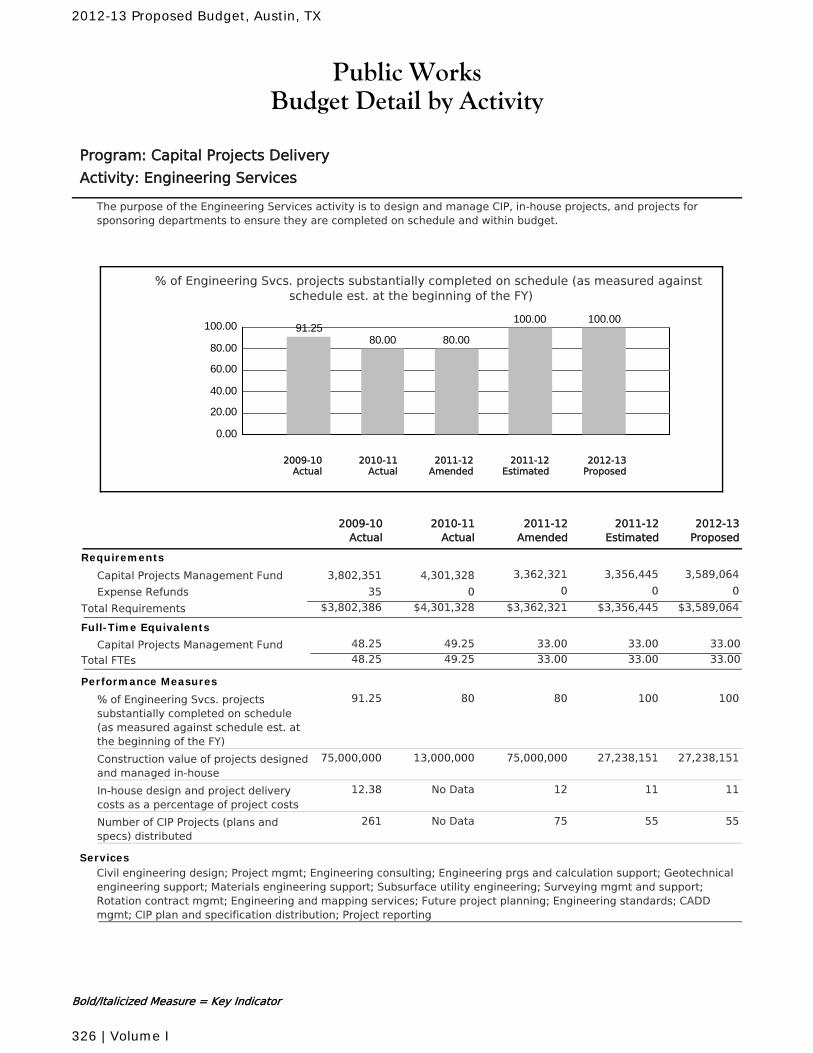
Public WorksBudget Detail by Activity
Program: Capital Projects Delivery
Activity: Engineering Services
The purpose of the Engineering Services activity is to design and manage CIP, in-house projects, and projects forsponsoring departments to ensure they are completed on schedule and within budget.
% of Engineering Svcs. projects substantially completed on schedule (as measured againstschedule est. at the beginning of the FY)
0.00
20.00
40.00
60.00
80.00
100.00 91.2580.00 80.00
100.00 100.00
2010-11Actual
2012-13Proposed
2011-12Amended
2011-12Estimated
2009-10Actual
2011-12Amended
2010-11Actual
2011-12Estimated
2012-13Proposed
2009-10Actual
Requirements
Capital Projects Management Fund 3,362,321 3,356,445 3,589,0644,301,3283,802,351
Expense Refunds 0 0 0035
$3,362,321 $3,356,445 $3,589,064Total Requirements $4,301,328$3,802,386
Full-Time Equivalents
Capital Projects Management Fund 49.25 33.00 33.00 33.0048.25
Total FTEs 49.25 33.00 33.00 33.0048.25
Performance Measures
% of Engineering Svcs. projectssubstantially completed on schedule(as measured against schedule est. atthe beginning of the FY)
8080 100 10091.25
Construction value of projects designedand managed in-house
75,000,00013,000,000 27,238,151 27,238,15175,000,000
In-house design and project deliverycosts as a percentage of project costs
12No Data 11 1112.38
Number of CIP Projects (plans andspecs) distributed
75No Data 55 55261
ServicesCivil engineering design; Project mgmt; Engineering consulting; Engineering prgs and calculation support; Geotechnicalengineering support; Materials engineering support; Subsurface utility engineering; Surveying mgmt and support;Rotation contract mgmt; Engineering and mapping services; Future project planning; Engineering standards; CADDmgmt; CIP plan and specification distribution; Project reporting
Bold/Italicized Measure = Key Indicator
2012-13 Proposed Budget, Austin, TX
326 | Volume I
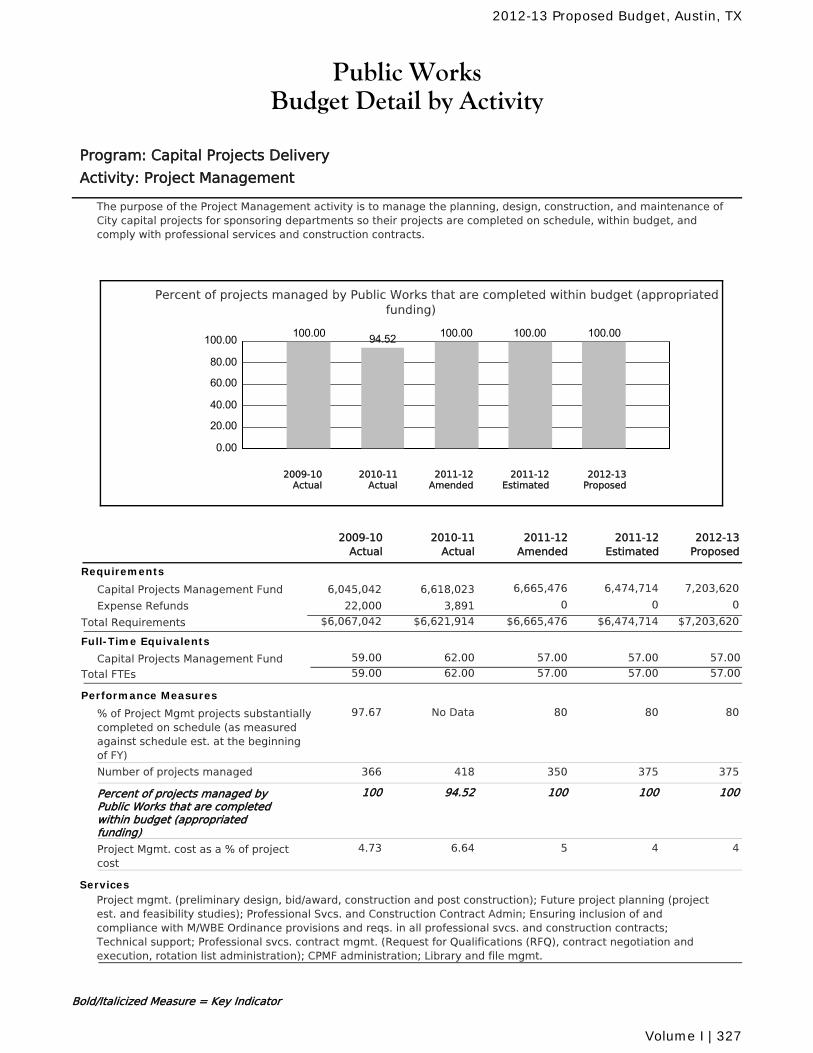
Public WorksBudget Detail by Activity
Program: Capital Projects Delivery
Activity: Project Management
The purpose of the Project Management activity is to manage the planning, design, construction, and maintenance ofCity capital projects for sponsoring departments so their projects are completed on schedule, within budget, andcomply with professional services and construction contracts.
Percent of projects managed by Public Works that are completed within budget (appropriatedfunding)
0.00
20.00
40.00
60.00
80.00
100.00 100.00 94.52 100.00 100.00 100.00
2010-11Actual
2012-13Proposed
2011-12Amended
2011-12Estimated
2009-10Actual
2011-12Amended
2010-11Actual
2011-12Estimated
2012-13Proposed
2009-10Actual
Requirements
Capital Projects Management Fund 6,665,476 6,474,714 7,203,6206,618,0236,045,042
Expense Refunds 0 0 03,89122,000
$6,665,476 $6,474,714 $7,203,620Total Requirements $6,621,914$6,067,042
Full-Time Equivalents
Capital Projects Management Fund 62.00 57.00 57.00 57.0059.00
Total FTEs 62.00 57.00 57.00 57.0059.00
Performance Measures
% of Project Mgmt projects substantiallycompleted on schedule (as measuredagainst schedule est. at the beginningof FY)
80No Data 80 8097.67
Number of projects managed 350418 375 375366
Percent of projects managed byPublic Works that are completedwithin budget (appropriatedfunding)
10094.52 100 100100
Project Mgmt. cost as a % of projectcost
56.64 4 44.73
ServicesProject mgmt. (preliminary design, bid/award, construction and post construction); Future project planning (projectest. and feasibility studies); Professional Svcs. and Construction Contract Admin; Ensuring inclusion of andcompliance with M/WBE Ordinance provisions and reqs. in all professional svcs. and construction contracts;Technical support; Professional svcs. contract mgmt. (Request for Qualifications (RFQ), contract negotiation andexecution, rotation list administration); CPMF administration; Library and file mgmt.
Bold/Italicized Measure = Key Indicator
2012-13 Proposed Budget, Austin, TX
Volume I | 327
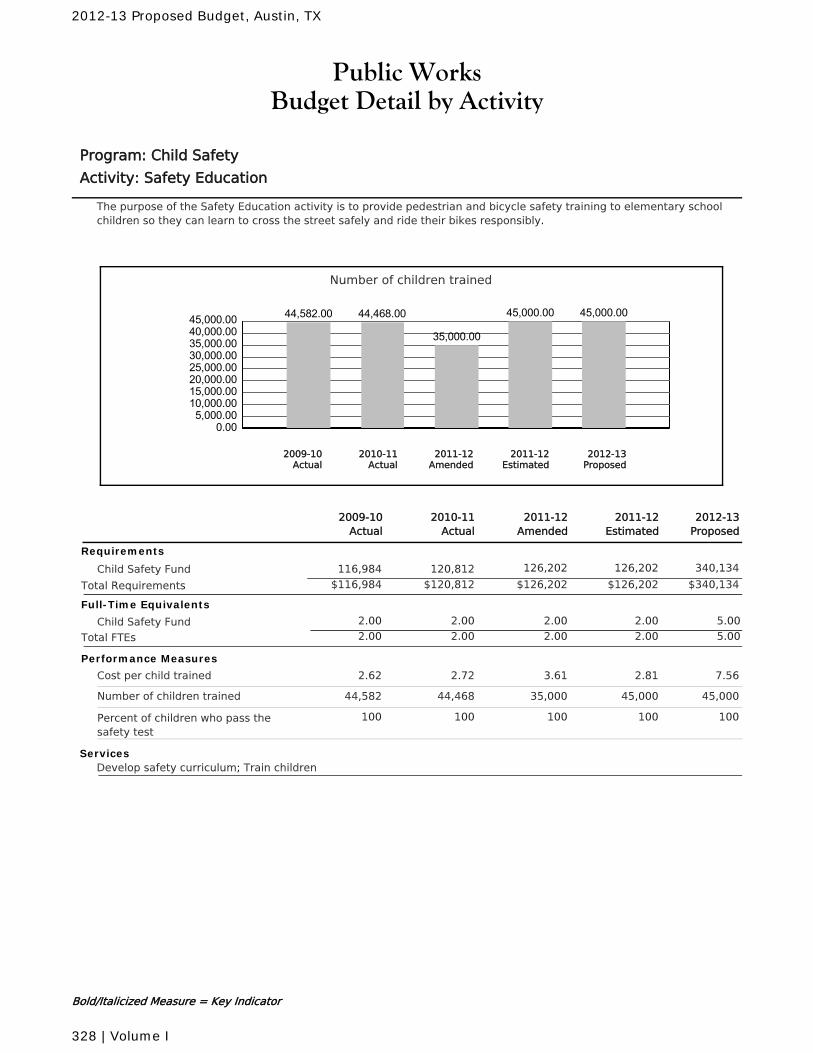
Public WorksBudget Detail by Activity
Program: Child Safety
Activity: Safety Education
The purpose of the Safety Education activity is to provide pedestrian and bicycle safety training to elementary schoolchildren so they can learn to cross the street safely and ride their bikes responsibly.
Number of children trained
0.005,000.0010,000.0015,000.0020,000.0025,000.0030,000.0035,000.0040,000.0045,000.00 44,582.00 44,468.00
35,000.00
45,000.00 45,000.00
2010-11Actual
2012-13Proposed
2011-12Amended
2011-12Estimated
2009-10Actual
2011-12Amended
2010-11Actual
2011-12Estimated
2012-13Proposed
2009-10Actual
Requirements
Child Safety Fund 126,202 126,202 340,134120,812116,984
$126,202 $126,202 $340,134Total Requirements $120,812$116,984
Full-Time Equivalents
Child Safety Fund 2.00 2.00 2.00 5.002.00
Total FTEs 2.00 2.00 2.00 5.002.00
Performance Measures
Cost per child trained 3.612.72 2.81 7.562.62
Number of children trained 35,00044,468 45,000 45,00044,582
Percent of children who pass thesafety test
100100 100 100100
ServicesDevelop safety curriculum; Train children
Bold/Italicized Measure = Key Indicator
2012-13 Proposed Budget, Austin, TX
328 | Volume I

Public WorksBudget Detail by Activity
Program: Child Safety
Activity: School Crossing Guards
The purpose of the School Crossing Guards activity is to provide crossing guards for school districts in the city limitsso that guards are present at all warranted locations throughout the year when school is in operation.
Percent of hours that warranted school crossing locations are covered
0.00
20.00
40.00
60.00
80.00
100.00 99.00 98.00 100.00 99.00 99.00
2010-11Actual
2012-13Proposed
2011-12Amended
2011-12Estimated
2009-10Actual
2011-12Amended
2010-11Actual
2011-12Estimated
2012-13Proposed
2009-10Actual
Requirements
Child Safety Fund 1,353,346 1,361,346 1,450,9501,251,1411,201,983
$1,353,346 $1,361,346 $1,450,950Total Requirements $1,251,141$1,201,983
Full-Time Equivalents
Child Safety Fund 2.00 2.00 2.00 2.002.00
Total FTEs 2.00 2.00 2.00 2.002.00
Performance Measures
Activity cost per location 8,0086,194 6,361.43 6,308.487,112
Number of children injured at warrantedlocations
00 0 00
Number of warranted locations staffed 169202 214 230171
Percent of hours that warrantedschool crossing locations arecovered
10098 99 9999
ServicesProvide school crossing guards; Train crossing guards
Bold/Italicized Measure = Key Indicator
2012-13 Proposed Budget, Austin, TX
Volume I | 329
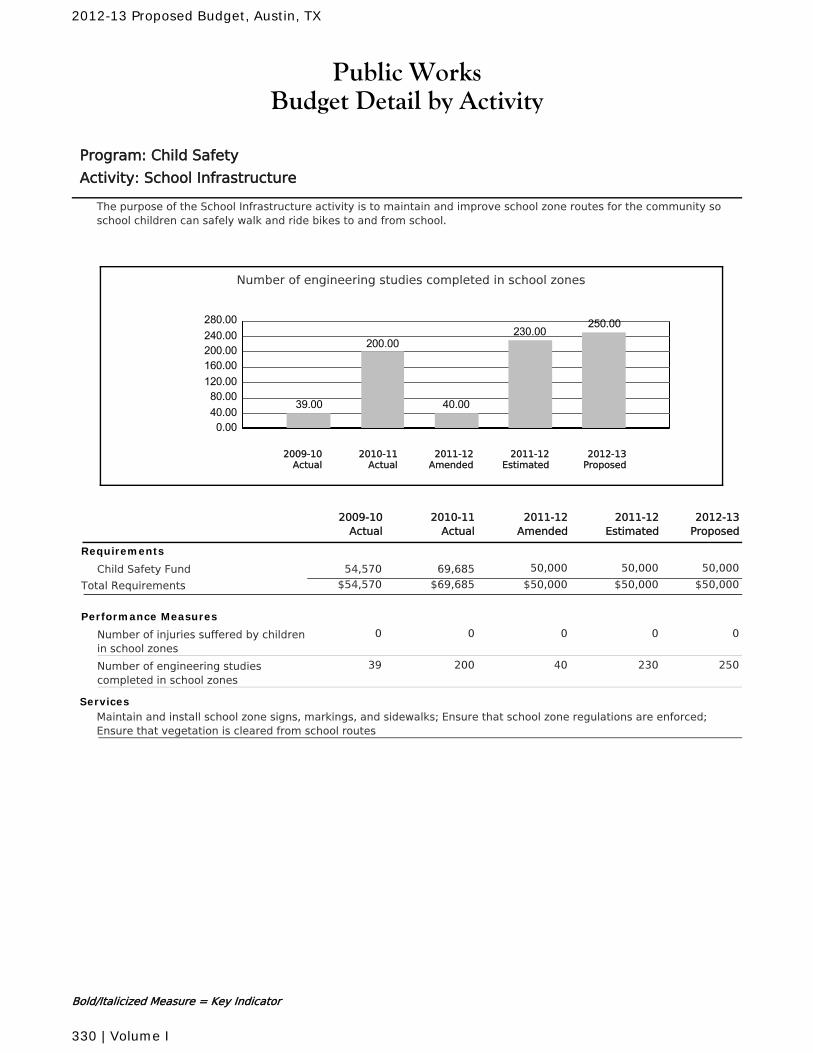
Public WorksBudget Detail by Activity
Program: Child Safety
Activity: School Infrastructure
The purpose of the School Infrastructure activity is to maintain and improve school zone routes for the community soschool children can safely walk and ride bikes to and from school.
Number of engineering studies completed in school zones
0.0040.0080.00120.00160.00200.00240.00280.00
39.00
200.00
40.00
230.00250.00
2010-11Actual
2012-13Proposed
2011-12Amended
2011-12Estimated
2009-10Actual
2011-12Amended
2010-11Actual
2011-12Estimated
2012-13Proposed
2009-10Actual
Requirements
Child Safety Fund 50,000 50,000 50,00069,68554,570
$50,000 $50,000 $50,000Total Requirements $69,685$54,570
Performance Measures
Number of injuries suffered by childrenin school zones
00 0 00
Number of engineering studiescompleted in school zones
40200 230 25039
ServicesMaintain and install school zone signs, markings, and sidewalks; Ensure that school zone regulations are enforced;Ensure that vegetation is cleared from school routes
Bold/Italicized Measure = Key Indicator
2012-13 Proposed Budget, Austin, TX
330 | Volume I
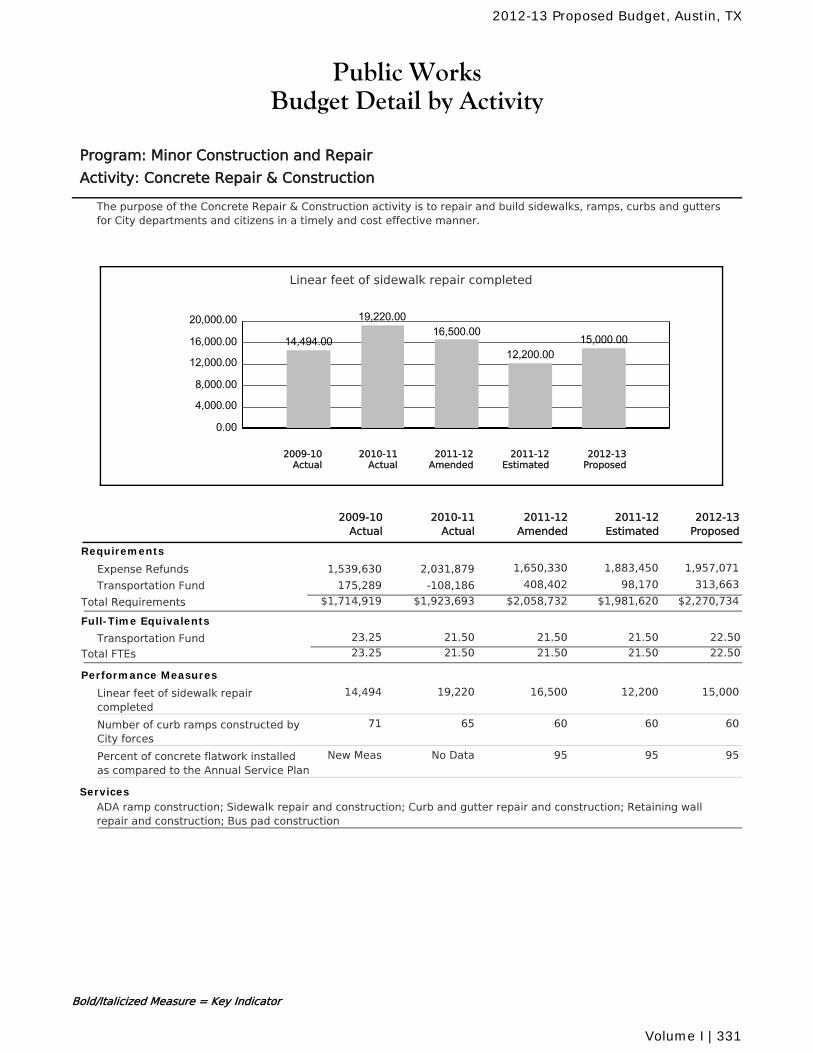
Public WorksBudget Detail by Activity
Program: Minor Construction and Repair
Activity: Concrete Repair & Construction
The purpose of the Concrete Repair & Construction activity is to repair and build sidewalks, ramps, curbs and guttersfor City departments and citizens in a timely and cost effective manner.
Linear feet of sidewalk repair completed
0.00
4,000.00
8,000.00
12,000.00
16,000.00
20,000.00
14,494.00
19,220.0016,500.00
12,200.0015,000.00
2010-11Actual
2012-13Proposed
2011-12Amended
2011-12Estimated
2009-10Actual
2011-12Amended
2010-11Actual
2011-12Estimated
2012-13Proposed
2009-10Actual
Requirements
Expense Refunds 1,650,330 1,883,450 1,957,0712,031,8791,539,630
Transportation Fund 408,402 98,170 313,663-108,186175,289
$2,058,732 $1,981,620 $2,270,734Total Requirements $1,923,693$1,714,919
Full-Time Equivalents
Transportation Fund 21.50 21.50 21.50 22.5023.25
Total FTEs 21.50 21.50 21.50 22.5023.25
Performance Measures
Linear feet of sidewalk repaircompleted
16,50019,220 12,200 15,00014,494
Number of curb ramps constructed byCity forces
6065 60 6071
Percent of concrete flatwork installedas compared to the Annual Service Plan
95No Data 95 95New Meas
ServicesADA ramp construction; Sidewalk repair and construction; Curb and gutter repair and construction; Retaining wallrepair and construction; Bus pad construction
Bold/Italicized Measure = Key Indicator
2012-13 Proposed Budget, Austin, TX
Volume I | 331
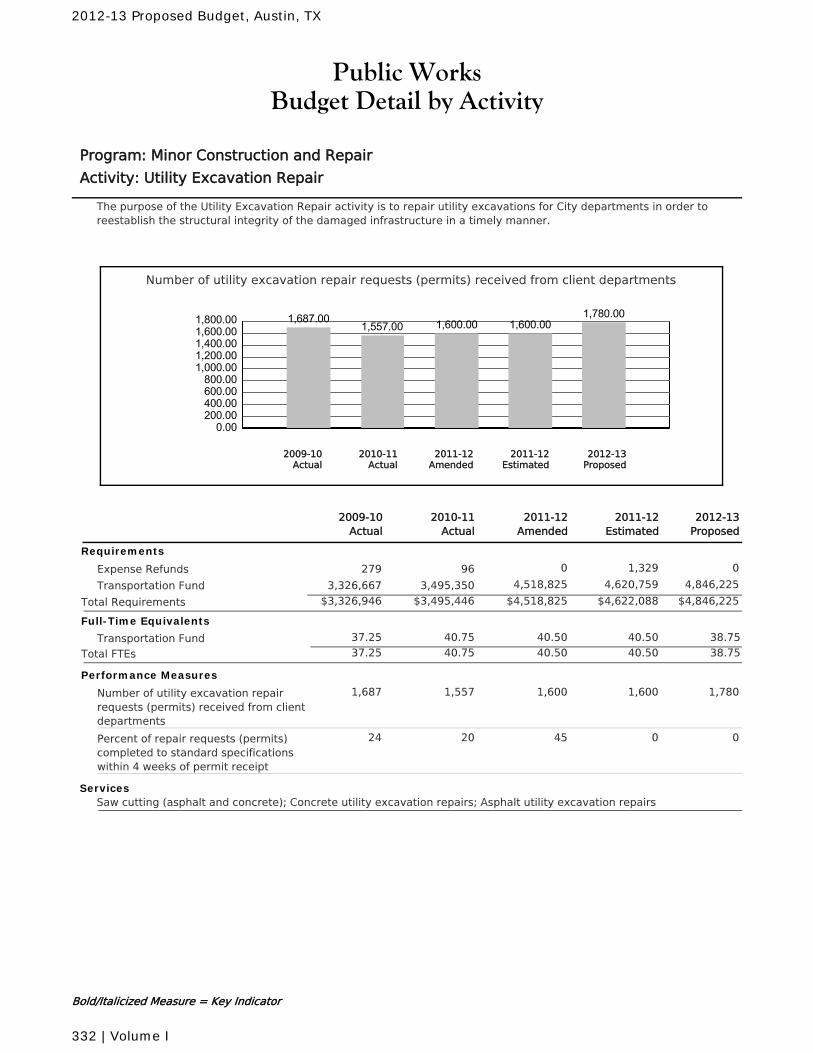
Public WorksBudget Detail by Activity
Program: Minor Construction and Repair
Activity: Utility Excavation Repair
The purpose of the Utility Excavation Repair activity is to repair utility excavations for City departments in order toreestablish the structural integrity of the damaged infrastructure in a timely manner.
Number of utility excavation repair requests (permits) received from client departments
0.00200.00400.00600.00800.00
1,000.001,200.001,400.001,600.001,800.00 1,687.00
1,557.00 1,600.00 1,600.001,780.00
2010-11Actual
2012-13Proposed
2011-12Amended
2011-12Estimated
2009-10Actual
2011-12Amended
2010-11Actual
2011-12Estimated
2012-13Proposed
2009-10Actual
Requirements
Expense Refunds 0 1,329 096279
Transportation Fund 4,518,825 4,620,759 4,846,2253,495,3503,326,667
$4,518,825 $4,622,088 $4,846,225Total Requirements $3,495,446$3,326,946
Full-Time Equivalents
Transportation Fund 40.75 40.50 40.50 38.7537.25
Total FTEs 40.75 40.50 40.50 38.7537.25
Performance Measures
Number of utility excavation repairrequests (permits) received from clientdepartments
1,6001,557 1,600 1,7801,687
Percent of repair requests (permits)completed to standard specificationswithin 4 weeks of permit receipt
4520 0 024
ServicesSaw cutting (asphalt and concrete); Concrete utility excavation repairs; Asphalt utility excavation repairs
Bold/Italicized Measure = Key Indicator
2012-13 Proposed Budget, Austin, TX
332 | Volume I
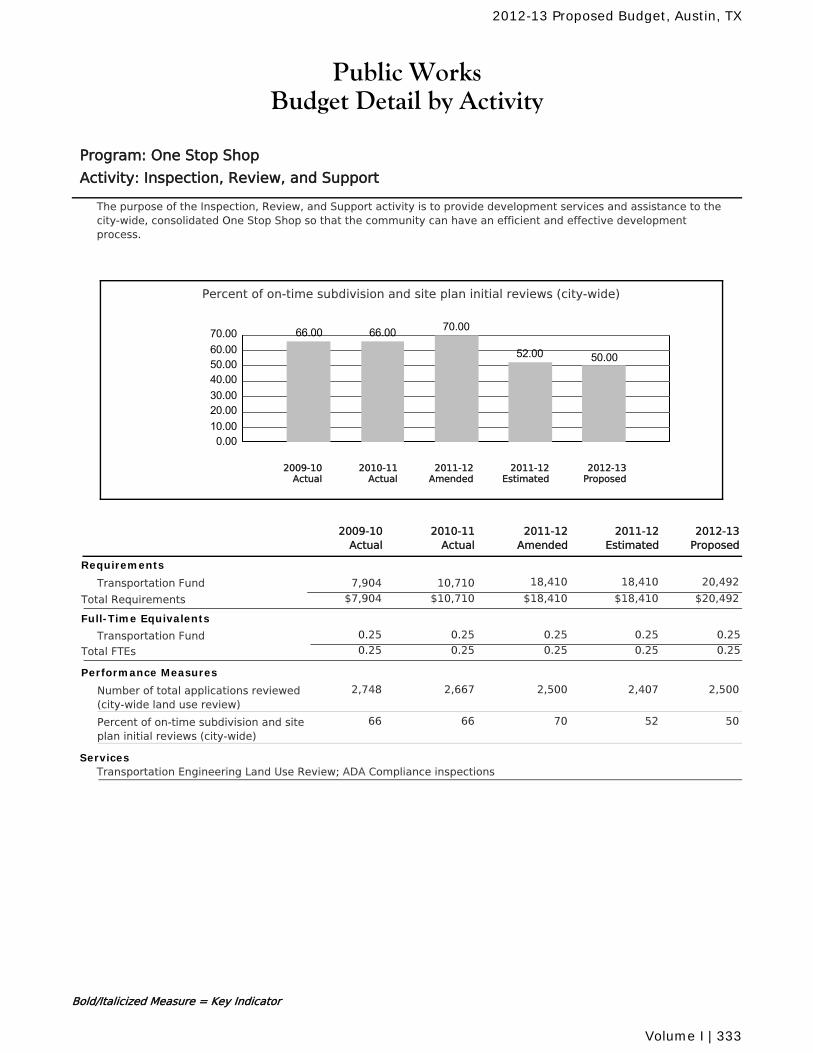
Public WorksBudget Detail by Activity
Program: One Stop Shop
Activity: Inspection, Review, and Support
The purpose of the Inspection, Review, and Support activity is to provide development services and assistance to thecity-wide, consolidated One Stop Shop so that the community can have an efficient and effective developmentprocess.
Percent of on-time subdivision and site plan initial reviews (city-wide)
0.0010.0020.0030.0040.0050.0060.0070.00 66.00 66.00 70.00
52.00 50.00
2010-11Actual
2012-13Proposed
2011-12Amended
2011-12Estimated
2009-10Actual
2011-12Amended
2010-11Actual
2011-12Estimated
2012-13Proposed
2009-10Actual
Requirements
Transportation Fund 18,410 18,410 20,49210,7107,904
$18,410 $18,410 $20,492Total Requirements $10,710$7,904
Full-Time Equivalents
Transportation Fund 0.25 0.25 0.25 0.250.25
Total FTEs 0.25 0.25 0.25 0.250.25
Performance Measures
Number of total applications reviewed(city-wide land use review)
2,5002,667 2,407 2,5002,748
Percent of on-time subdivision and siteplan initial reviews (city-wide)
7066 52 5066
ServicesTransportation Engineering Land Use Review; ADA Compliance inspections
Bold/Italicized Measure = Key Indicator
2012-13 Proposed Budget, Austin, TX
Volume I | 333
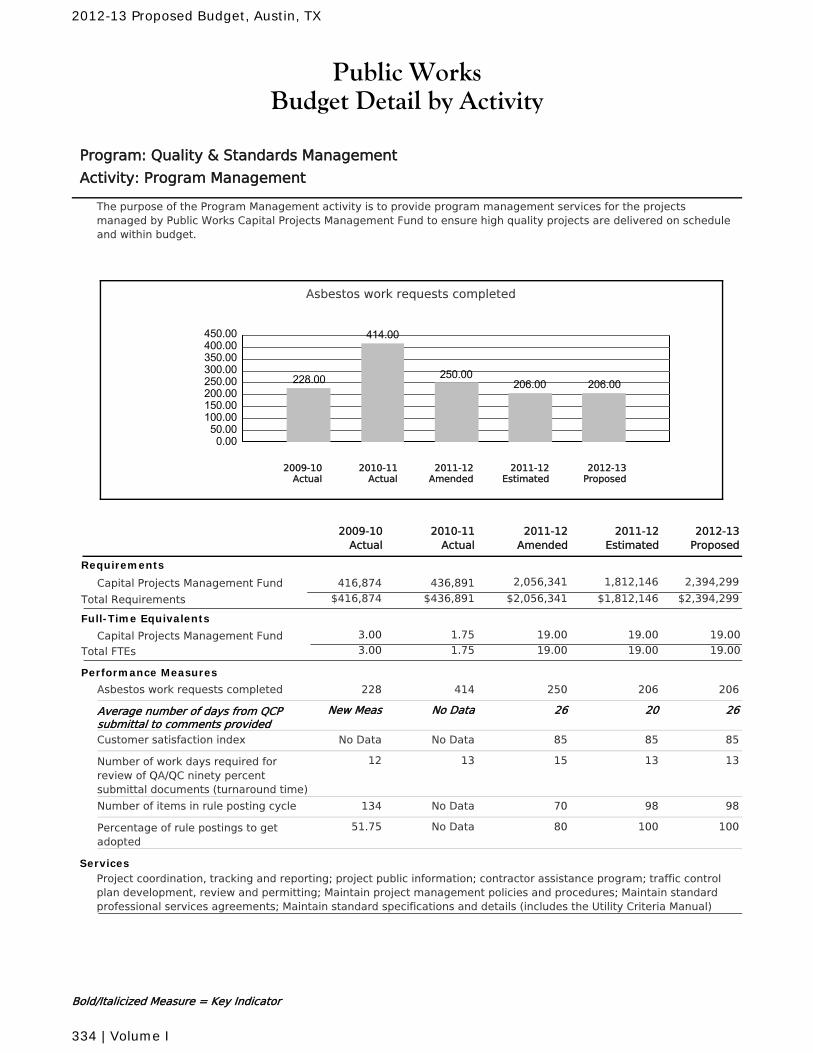
Public WorksBudget Detail by Activity
Program: Quality & Standards Management
Activity: Program Management
The purpose of the Program Management activity is to provide program management services for the projectsmanaged by Public Works Capital Projects Management Fund to ensure high quality projects are delivered on scheduleand within budget.
Asbestos work requests completed
0.0050.00100.00150.00200.00250.00300.00350.00400.00450.00
228.00
414.00
250.00206.00 206.00
2010-11Actual
2012-13Proposed
2011-12Amended
2011-12Estimated
2009-10Actual
2011-12Amended
2010-11Actual
2011-12Estimated
2012-13Proposed
2009-10Actual
Requirements
Capital Projects Management Fund 2,056,341 1,812,146 2,394,299436,891416,874
$2,056,341 $1,812,146 $2,394,299Total Requirements $436,891$416,874
Full-Time Equivalents
Capital Projects Management Fund 1.75 19.00 19.00 19.003.00
Total FTEs 1.75 19.00 19.00 19.003.00
Performance Measures
Asbestos work requests completed 250414 206 206228
Average number of days from QCPsubmittal to comments provided
26No Data 20 26New Meas
Customer satisfaction index 85No Data 85 85No Data
Number of work days required forreview of QA/QC ninety percentsubmittal documents (turnaround time)
1513 13 1312
Number of items in rule posting cycle 70No Data 98 98134
Percentage of rule postings to getadopted
80No Data 100 10051.75
ServicesProject coordination, tracking and reporting; project public information; contractor assistance program; traffic controlplan development, review and permitting; Maintain project management policies and procedures; Maintain standardprofessional services agreements; Maintain standard specifications and details (includes the Utility Criteria Manual)
Bold/Italicized Measure = Key Indicator
2012-13 Proposed Budget, Austin, TX
334 | Volume I
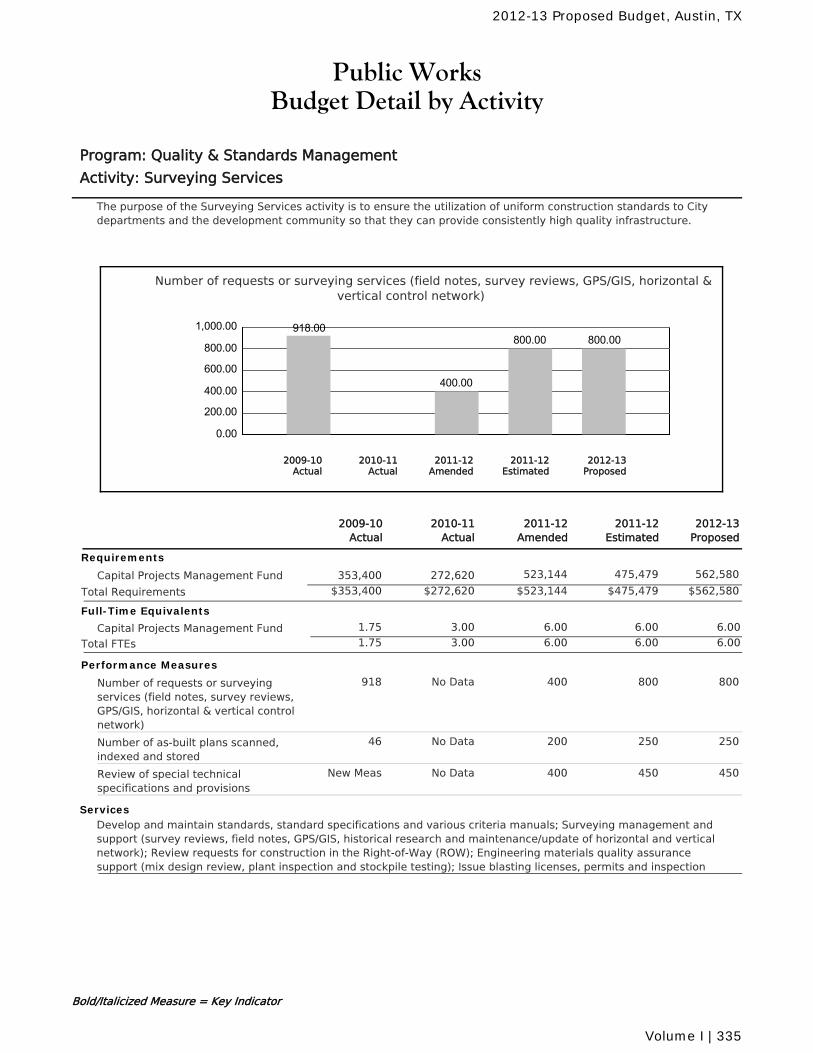
Public WorksBudget Detail by Activity
Program: Quality & Standards Management
Activity: Surveying Services
The purpose of the Surveying Services activity is to ensure the utilization of uniform construction standards to Citydepartments and the development community so that they can provide consistently high quality infrastructure.
Number of requests or surveying services (field notes, survey reviews, GPS/GIS, horizontal &vertical control network)
0.00
200.00
400.00
600.00
800.00
1,000.00 918.00
400.00
800.00 800.00
2010-11Actual
2012-13Proposed
2011-12Amended
2011-12Estimated
2009-10Actual
2011-12Amended
2010-11Actual
2011-12Estimated
2012-13Proposed
2009-10Actual
Requirements
Capital Projects Management Fund 523,144 475,479 562,580272,620353,400
$523,144 $475,479 $562,580Total Requirements $272,620$353,400
Full-Time Equivalents
Capital Projects Management Fund 3.00 6.00 6.00 6.001.75
Total FTEs 3.00 6.00 6.00 6.001.75
Performance Measures
Number of requests or surveyingservices (field notes, survey reviews,GPS/GIS, horizontal & vertical controlnetwork)
400No Data 800 800918
Number of as-built plans scanned,indexed and stored
200No Data 250 25046
Review of special technicalspecifications and provisions
400No Data 450 450New Meas
ServicesDevelop and maintain standards, standard specifications and various criteria manuals; Surveying management andsupport (survey reviews, field notes, GPS/GIS, historical research and maintenance/update of horizontal and verticalnetwork); Review requests for construction in the Right-of-Way (ROW); Engineering materials quality assurancesupport (mix design review, plant inspection and stockpile testing); Issue blasting licenses, permits and inspection
Bold/Italicized Measure = Key Indicator
2012-13 Proposed Budget, Austin, TX
Volume I | 335
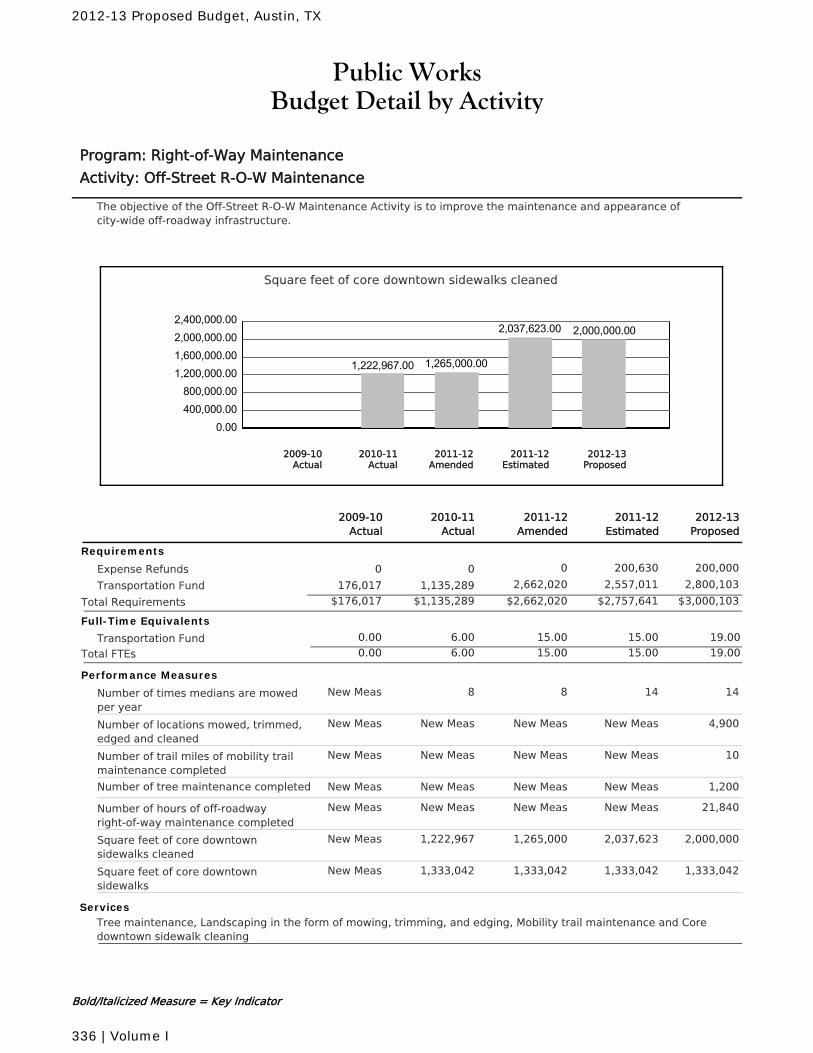
Public WorksBudget Detail by Activity
Program: Right-of-Way Maintenance
Activity: Off-Street R-O-W Maintenance
The objective of the Off-Street R-O-W Maintenance Activity is to improve the maintenance and appearance ofcity-wide off-roadway infrastructure.
Square feet of core downtown sidewalks cleaned
0.00400,000.00800,000.00
1,200,000.001,600,000.002,000,000.002,400,000.00
1,222,967.00 1,265,000.00
2,037,623.00 2,000,000.00
2010-11Actual
2012-13Proposed
2011-12Amended
2011-12Estimated
2009-10Actual
2011-12Amended
2010-11Actual
2011-12Estimated
2012-13Proposed
2009-10Actual
Requirements
Expense Refunds 0 200,630 200,00000
Transportation Fund 2,662,020 2,557,011 2,800,1031,135,289176,017
$2,662,020 $2,757,641 $3,000,103Total Requirements $1,135,289$176,017
Full-Time Equivalents
Transportation Fund 6.00 15.00 15.00 19.000.00
Total FTEs 6.00 15.00 15.00 19.000.00
Performance Measures
Number of times medians are mowedper year
88 14 14New Meas
Number of locations mowed, trimmed,edged and cleaned
New MeasNew Meas New Meas 4,900New Meas
Number of trail miles of mobility trailmaintenance completed
New MeasNew Meas New Meas 10New Meas
Number of tree maintenance completed New MeasNew Meas New Meas 1,200New Meas
Number of hours of off-roadwayright-of-way maintenance completed
New MeasNew Meas New Meas 21,840New Meas
Square feet of core downtownsidewalks cleaned
1,265,0001,222,967 2,037,623 2,000,000New Meas
Square feet of core downtownsidewalks
1,333,0421,333,042 1,333,042 1,333,042New Meas
ServicesTree maintenance, Landscaping in the form of mowing, trimming, and edging, Mobility trail maintenance and Coredowntown sidewalk cleaning
Bold/Italicized Measure = Key Indicator
2012-13 Proposed Budget, Austin, TX
336 | Volume I
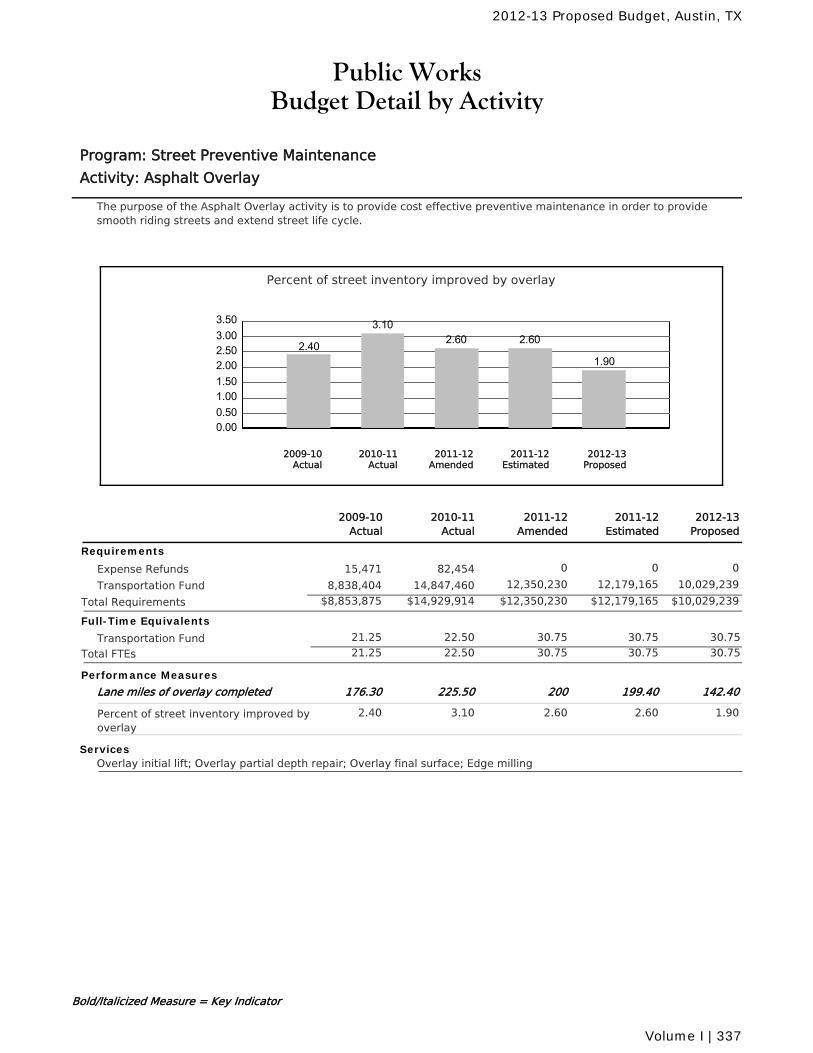
Public WorksBudget Detail by Activity
Program: Street Preventive Maintenance
Activity: Asphalt Overlay
The purpose of the Asphalt Overlay activity is to provide cost effective preventive maintenance in order to providesmooth riding streets and extend street life cycle.
Percent of street inventory improved by overlay
0.000.501.001.502.002.503.003.50
2.40
3.102.60 2.60
1.90
2010-11Actual
2012-13Proposed
2011-12Amended
2011-12Estimated
2009-10Actual
2011-12Amended
2010-11Actual
2011-12Estimated
2012-13Proposed
2009-10Actual
Requirements
Expense Refunds 0 0 082,45415,471
Transportation Fund 12,350,230 12,179,165 10,029,23914,847,4608,838,404
$12,350,230 $12,179,165 $10,029,239Total Requirements $14,929,914$8,853,875
Full-Time Equivalents
Transportation Fund 22.50 30.75 30.75 30.7521.25
Total FTEs 22.50 30.75 30.75 30.7521.25
Performance Measures
Lane miles of overlay completed 200225.50 199.40 142.40176.30
Percent of street inventory improved byoverlay
2.603.10 2.60 1.902.40
ServicesOverlay initial lift; Overlay partial depth repair; Overlay final surface; Edge milling
Bold/Italicized Measure = Key Indicator
2012-13 Proposed Budget, Austin, TX
Volume I | 337
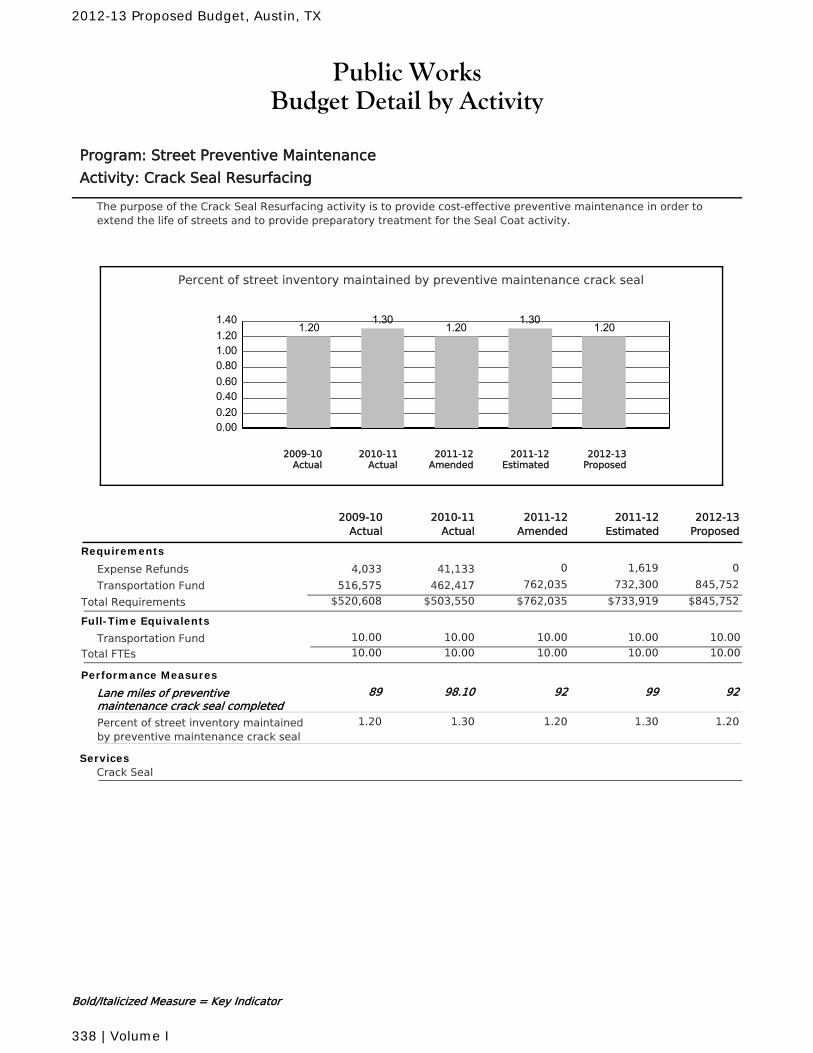
Public WorksBudget Detail by Activity
Program: Street Preventive Maintenance
Activity: Crack Seal Resurfacing
The purpose of the Crack Seal Resurfacing activity is to provide cost-effective preventive maintenance in order toextend the life of streets and to provide preparatory treatment for the Seal Coat activity.
Percent of street inventory maintained by preventive maintenance crack seal
0.000.200.400.600.801.001.201.40
1.201.30
1.201.30
1.20
2010-11Actual
2012-13Proposed
2011-12Amended
2011-12Estimated
2009-10Actual
2011-12Amended
2010-11Actual
2011-12Estimated
2012-13Proposed
2009-10Actual
Requirements
Expense Refunds 0 1,619 041,1334,033
Transportation Fund 762,035 732,300 845,752462,417516,575
$762,035 $733,919 $845,752Total Requirements $503,550$520,608
Full-Time Equivalents
Transportation Fund 10.00 10.00 10.00 10.0010.00
Total FTEs 10.00 10.00 10.00 10.0010.00
Performance Measures
Lane miles of preventivemaintenance crack seal completed
9298.10 99 9289
Percent of street inventory maintainedby preventive maintenance crack seal
1.201.30 1.30 1.201.20
ServicesCrack Seal
Bold/Italicized Measure = Key Indicator
2012-13 Proposed Budget, Austin, TX
338 | Volume I
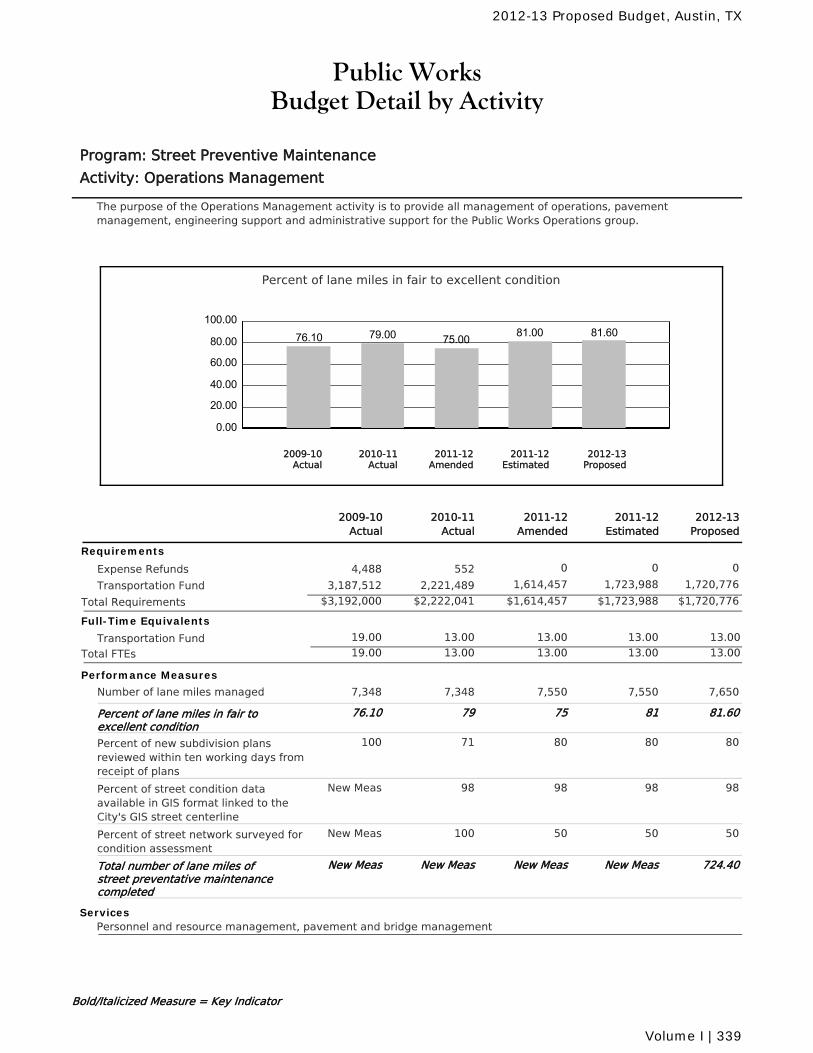
Public WorksBudget Detail by Activity
Program: Street Preventive Maintenance
Activity: Operations Management
The purpose of the Operations Management activity is to provide all management of operations, pavementmanagement, engineering support and administrative support for the Public Works Operations group.
Percent of lane miles in fair to excellent condition
0.00
20.00
40.00
60.00
80.00
100.0076.10 79.00 75.00 81.00 81.60
2010-11Actual
2012-13Proposed
2011-12Amended
2011-12Estimated
2009-10Actual
2011-12Amended
2010-11Actual
2011-12Estimated
2012-13Proposed
2009-10Actual
Requirements
Expense Refunds 0 0 05524,488
Transportation Fund 1,614,457 1,723,988 1,720,7762,221,4893,187,512
$1,614,457 $1,723,988 $1,720,776Total Requirements $2,222,041$3,192,000
Full-Time Equivalents
Transportation Fund 13.00 13.00 13.00 13.0019.00
Total FTEs 13.00 13.00 13.00 13.0019.00
Performance Measures
Number of lane miles managed 7,5507,348 7,550 7,6507,348
Percent of lane miles in fair toexcellent condition
7579 81 81.6076.10
Percent of new subdivision plansreviewed within ten working days fromreceipt of plans
8071 80 80100
Percent of street condition dataavailable in GIS format linked to theCity's GIS street centerline
9898 98 98New Meas
Percent of street network surveyed forcondition assessment
50100 50 50New Meas
Total number of lane miles ofstreet preventative maintenancecompleted
New MeasNew Meas New Meas 724.40New Meas
ServicesPersonnel and resource management, pavement and bridge management
Bold/Italicized Measure = Key Indicator
2012-13 Proposed Budget, Austin, TX
Volume I | 339
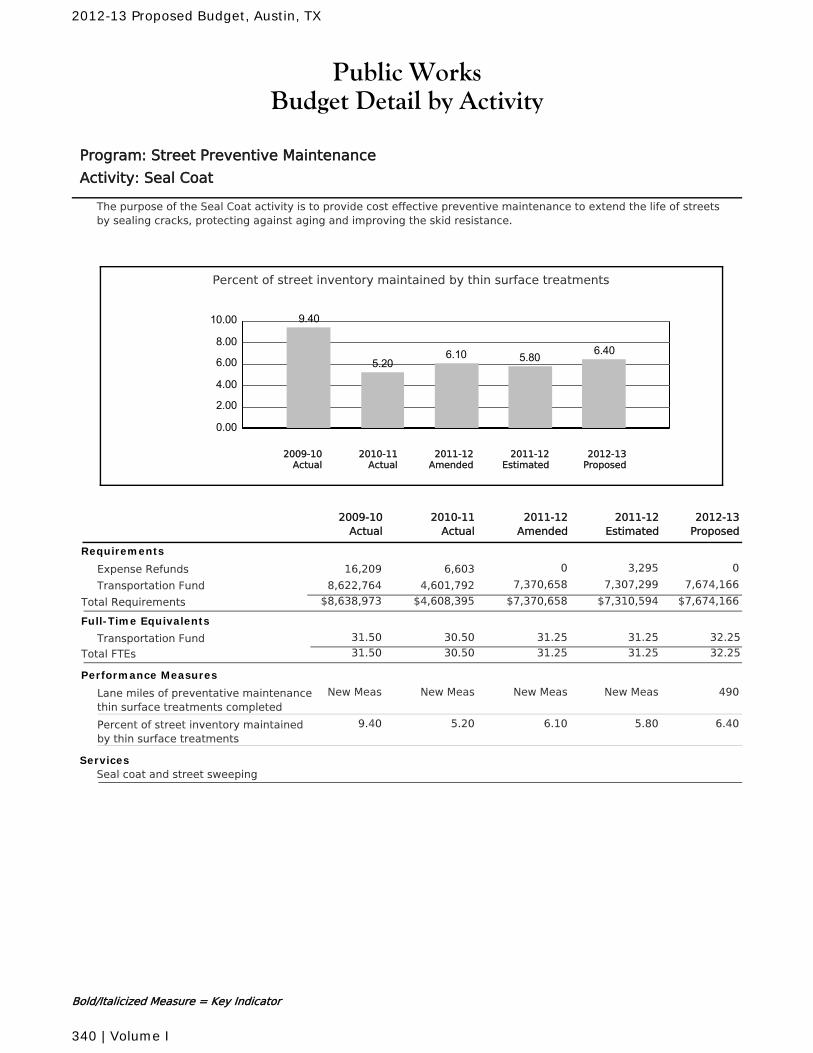
Public WorksBudget Detail by Activity
Program: Street Preventive Maintenance
Activity: Seal Coat
The purpose of the Seal Coat activity is to provide cost effective preventive maintenance to extend the life of streetsby sealing cracks, protecting against aging and improving the skid resistance.
Percent of street inventory maintained by thin surface treatments
0.00
2.00
4.00
6.00
8.00
10.00 9.40
5.206.10 5.80 6.40
2010-11Actual
2012-13Proposed
2011-12Amended
2011-12Estimated
2009-10Actual
2011-12Amended
2010-11Actual
2011-12Estimated
2012-13Proposed
2009-10Actual
Requirements
Expense Refunds 0 3,295 06,60316,209
Transportation Fund 7,370,658 7,307,299 7,674,1664,601,7928,622,764
$7,370,658 $7,310,594 $7,674,166Total Requirements $4,608,395$8,638,973
Full-Time Equivalents
Transportation Fund 30.50 31.25 31.25 32.2531.50
Total FTEs 30.50 31.25 31.25 32.2531.50
Performance Measures
Lane miles of preventative maintenancethin surface treatments completed
New MeasNew Meas New Meas 490New Meas
Percent of street inventory maintainedby thin surface treatments
6.105.20 5.80 6.409.40
ServicesSeal coat and street sweeping
Bold/Italicized Measure = Key Indicator
2012-13 Proposed Budget, Austin, TX
340 | Volume I
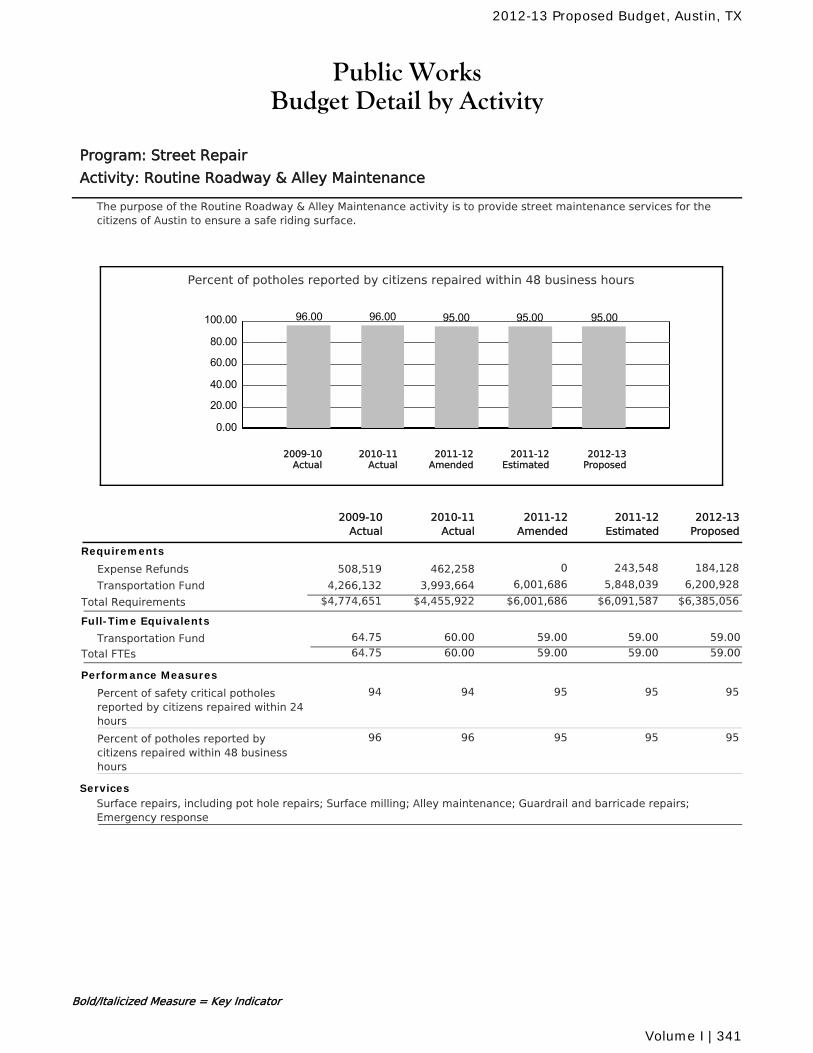
Public WorksBudget Detail by Activity
Program: Street Repair
Activity: Routine Roadway & Alley Maintenance
The purpose of the Routine Roadway & Alley Maintenance activity is to provide street maintenance services for thecitizens of Austin to ensure a safe riding surface.
Percent of potholes reported by citizens repaired within 48 business hours
0.00
20.00
40.00
60.00
80.00
100.00 96.00 96.00 95.00 95.00 95.00
2010-11Actual
2012-13Proposed
2011-12Amended
2011-12Estimated
2009-10Actual
2011-12Amended
2010-11Actual
2011-12Estimated
2012-13Proposed
2009-10Actual
Requirements
Expense Refunds 0 243,548 184,128462,258508,519
Transportation Fund 6,001,686 5,848,039 6,200,9283,993,6644,266,132
$6,001,686 $6,091,587 $6,385,056Total Requirements $4,455,922$4,774,651
Full-Time Equivalents
Transportation Fund 60.00 59.00 59.00 59.0064.75
Total FTEs 60.00 59.00 59.00 59.0064.75
Performance Measures
Percent of safety critical potholesreported by citizens repaired within 24hours
9594 95 9594
Percent of potholes reported bycitizens repaired within 48 businesshours
9596 95 9596
ServicesSurface repairs, including pot hole repairs; Surface milling; Alley maintenance; Guardrail and barricade repairs;Emergency response
Bold/Italicized Measure = Key Indicator
2012-13 Proposed Budget, Austin, TX
Volume I | 341
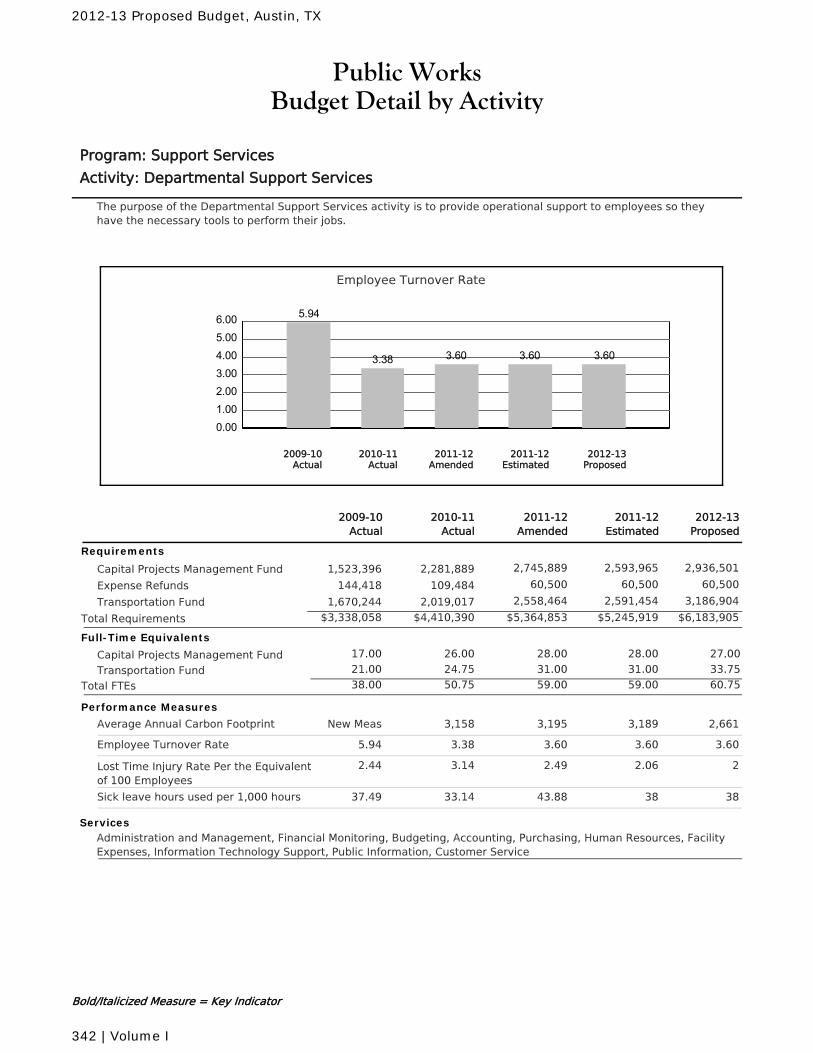
Public WorksBudget Detail by Activity
Program: Support Services
Activity: Departmental Support Services
The purpose of the Departmental Support Services activity is to provide operational support to employees so theyhave the necessary tools to perform their jobs.
Employee Turnover Rate
0.001.002.003.004.005.006.00 5.94
3.38 3.60 3.60 3.60
2010-11Actual
2012-13Proposed
2011-12Amended
2011-12Estimated
2009-10Actual
2011-12Amended
2010-11Actual
2011-12Estimated
2012-13Proposed
2009-10Actual
Requirements
Capital Projects Management Fund 2,745,889 2,593,965 2,936,5012,281,8891,523,396
Expense Refunds 60,500 60,500 60,500109,484144,418
Transportation Fund 2,558,464 2,591,454 3,186,9042,019,0171,670,244
$5,364,853 $5,245,919 $6,183,905Total Requirements $4,410,390$3,338,058
Full-Time Equivalents
Capital Projects Management Fund 26.00 28.00 28.00 27.0017.00
Transportation Fund 24.75 31.00 31.00 33.7521.00
Total FTEs 50.75 59.00 59.00 60.7538.00
Performance Measures
Average Annual Carbon Footprint 3,1953,158 3,189 2,661New Meas
Employee Turnover Rate 3.603.38 3.60 3.605.94
Lost Time Injury Rate Per the Equivalentof 100 Employees
2.493.14 2.06 22.44
Sick leave hours used per 1,000 hours 43.8833.14 38 3837.49
ServicesAdministration and Management, Financial Monitoring, Budgeting, Accounting, Purchasing, Human Resources, FacilityExpenses, Information Technology Support, Public Information, Customer Service
Bold/Italicized Measure = Key Indicator
2012-13 Proposed Budget, Austin, TX
342 | Volume I
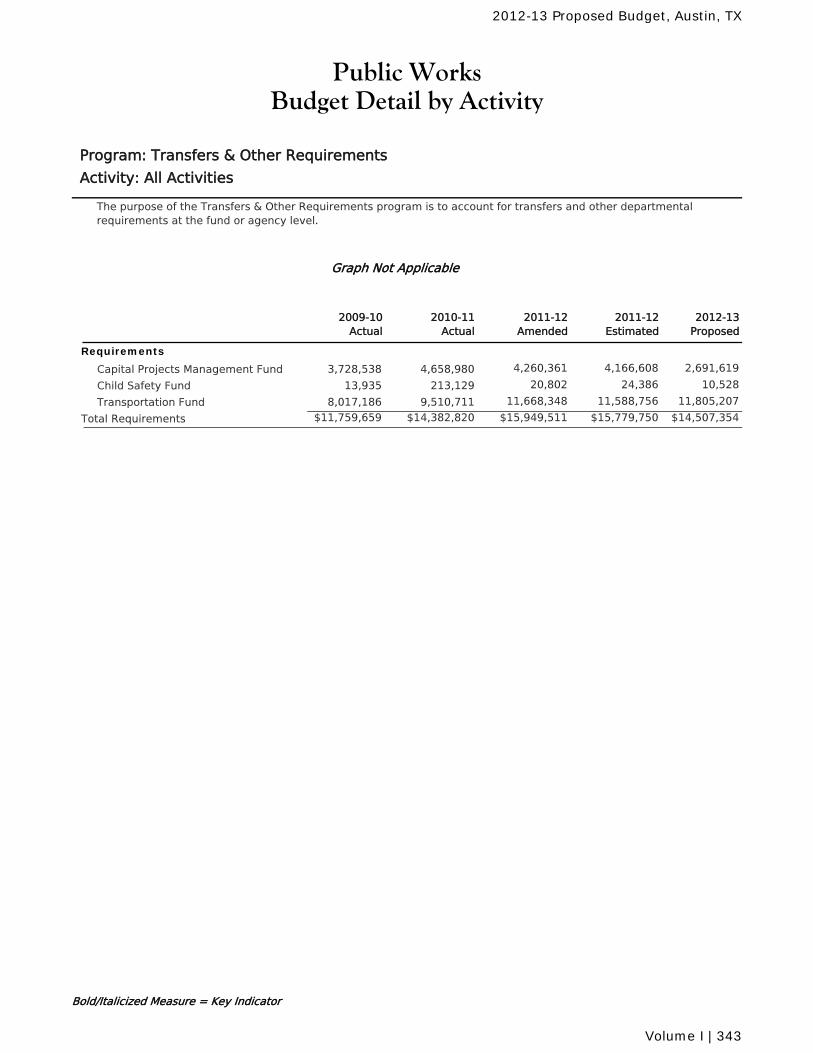
Public WorksBudget Detail by Activity
Program: Transfers & Other Requirements
Activity: All Activities
The purpose of the Transfers & Other Requirements program is to account for transfers and other departmentalrequirements at the fund or agency level.
Graph Not Applicable
2011-12Amended
2010-11Actual
2011-12Estimated
2012-13Proposed
2009-10Actual
Requirements
Capital Projects Management Fund 4,260,361 4,166,608 2,691,6194,658,9803,728,538
Child Safety Fund 20,802 24,386 10,528213,12913,935
Transportation Fund 11,668,348 11,588,756 11,805,2079,510,7118,017,186
$15,949,511 $15,779,750 $14,507,354Total Requirements $14,382,820$11,759,659
Bold/Italicized Measure = Key Indicator
2012-13 Proposed Budget, Austin, TX
Volume I | 343
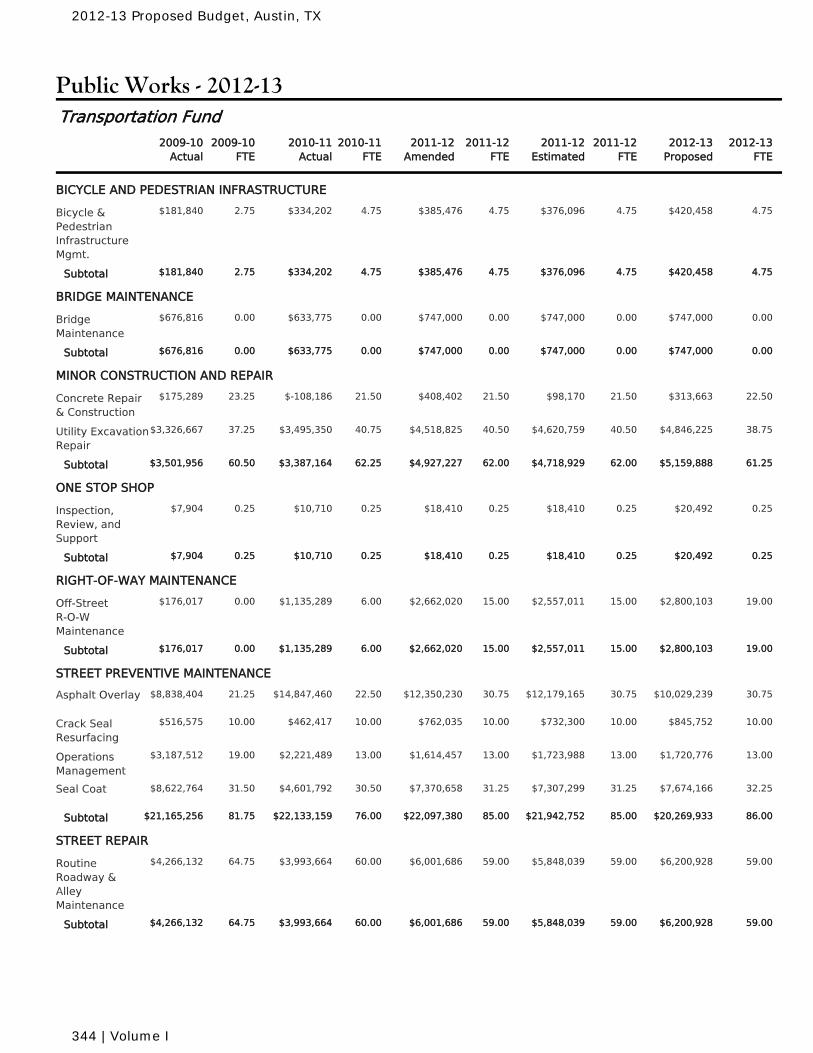
Public Works - 2012-13
2010-11Actual
2010-11FTE
2011-12Amended
2011-12FTE
2011-12Estimated
2011-12FTE
2009-10Actual
2009-10FTE
2012-13Proposed
2012-13FTE
Transportation Fund
BICYCLE AND PEDESTRIAN INFRASTRUCTURE
$334,202 4.75 $385,476 4.75 $376,096 4.75Bicycle &PedestrianInfrastructureMgmt.
2.75 $420,458 4.75$181,840
$334,202 4.75 $385,476 4.75 $376,096 4.75Subtotal 2.75 $420,458 4.75$181,840
BRIDGE MAINTENANCE
$633,775 0.00 $747,000 0.00 $747,000 0.00BridgeMaintenance
0.00 $747,000 0.00$676,816
$633,775 0.00 $747,000 0.00 $747,000 0.00Subtotal 0.00 $747,000 0.00$676,816
MINOR CONSTRUCTION AND REPAIR
$-108,186 21.50 $408,402 21.50 $98,170 21.50Concrete Repair& Construction
23.25 $313,663 22.50$175,289
$3,495,350 40.75 $4,518,825 40.50 $4,620,759 40.50Utility ExcavationRepair
37.25 $4,846,225 38.75$3,326,667
$3,387,164 62.25 $4,927,227 62.00 $4,718,929 62.00Subtotal 60.50 $5,159,888 61.25$3,501,956
ONE STOP SHOP
$10,710 0.25 $18,410 0.25 $18,410 0.25Inspection,Review, andSupport
0.25 $20,492 0.25$7,904
$10,710 0.25 $18,410 0.25 $18,410 0.25Subtotal 0.25 $20,492 0.25$7,904
RIGHT-OF-WAY MAINTENANCE
$1,135,289 6.00 $2,662,020 15.00 $2,557,011 15.00Off-StreetR-O-WMaintenance
0.00 $2,800,103 19.00$176,017
$1,135,289 6.00 $2,662,020 15.00 $2,557,011 15.00Subtotal 0.00 $2,800,103 19.00$176,017
STREET PREVENTIVE MAINTENANCE
$14,847,460 22.50 $12,350,230 30.75 $12,179,165 30.75Asphalt Overlay 21.25 $10,029,239 30.75$8,838,404
$462,417 10.00 $762,035 10.00 $732,300 10.00Crack SealResurfacing
10.00 $845,752 10.00$516,575
$2,221,489 13.00 $1,614,457 13.00 $1,723,988 13.00OperationsManagement
19.00 $1,720,776 13.00$3,187,512
$4,601,792 30.50 $7,370,658 31.25 $7,307,299 31.25Seal Coat 31.50 $7,674,166 32.25$8,622,764
$22,133,159 76.00 $22,097,380 85.00 $21,942,752 85.00Subtotal 81.75 $20,269,933 86.00$21,165,256
STREET REPAIR
$3,993,664 60.00 $6,001,686 59.00 $5,848,039 59.00RoutineRoadway &AlleyMaintenance
64.75 $6,200,928 59.00$4,266,132
$3,993,664 60.00 $6,001,686 59.00 $5,848,039 59.00Subtotal 64.75 $6,200,928 59.00$4,266,132
2012-13 Proposed Budget, Austin, TX
344 | Volume I
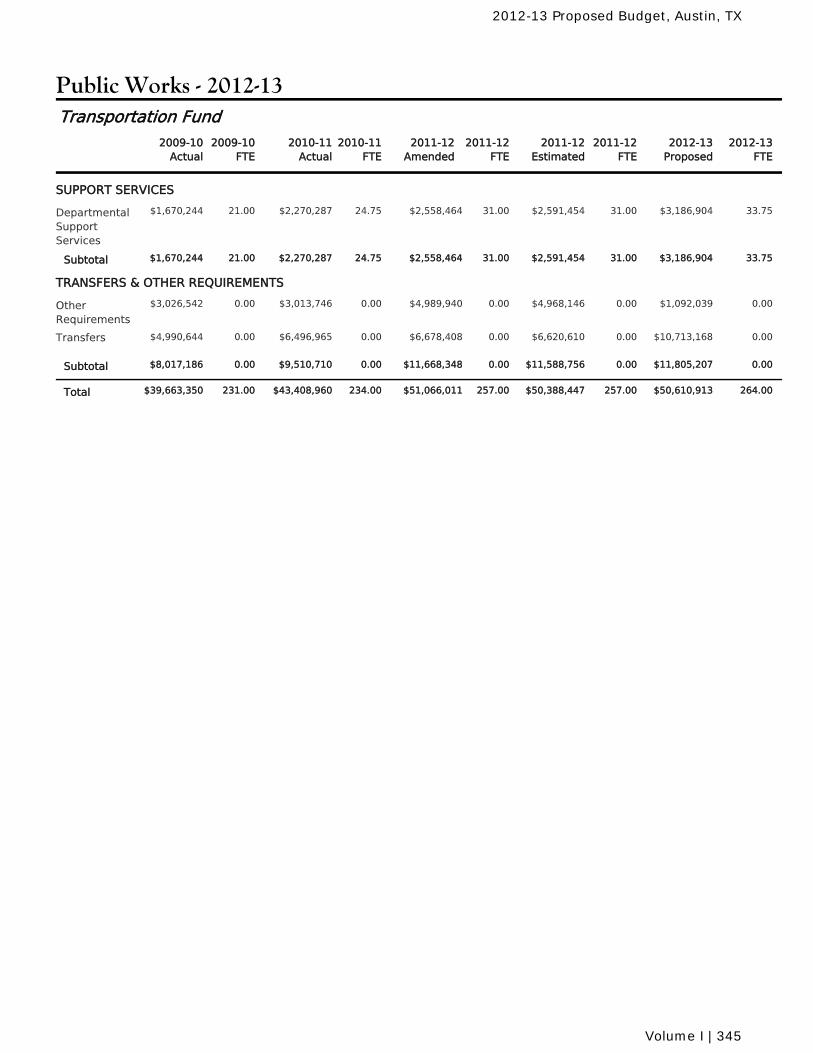
Public Works - 2012-13
2010-11Actual
2010-11FTE
2011-12Amended
2011-12FTE
2011-12Estimated
2011-12FTE
2009-10Actual
2009-10FTE
2012-13Proposed
2012-13FTE
Transportation Fund
SUPPORT SERVICES
$2,270,287 24.75 $2,558,464 31.00 $2,591,454 31.00DepartmentalSupportServices
21.00 $3,186,904 33.75$1,670,244
$2,270,287 24.75 $2,558,464 31.00 $2,591,454 31.00Subtotal 21.00 $3,186,904 33.75$1,670,244
TRANSFERS & OTHER REQUIREMENTS
$3,013,746 0.00 $4,989,940 0.00 $4,968,146 0.00OtherRequirements
0.00 $1,092,039 0.00$3,026,542
$6,496,965 0.00 $6,678,408 0.00 $6,620,610 0.00Transfers 0.00 $10,713,168 0.00$4,990,644
$9,510,710 0.00 $11,668,348 0.00 $11,588,756 0.00Subtotal 0.00 $11,805,207 0.00$8,017,186
$43,408,960 234.00 $51,066,011 257.00 $50,388,447 257.00Total 231.00 $50,610,913 264.00$39,663,350
2012-13 Proposed Budget, Austin, TX
Volume I | 345
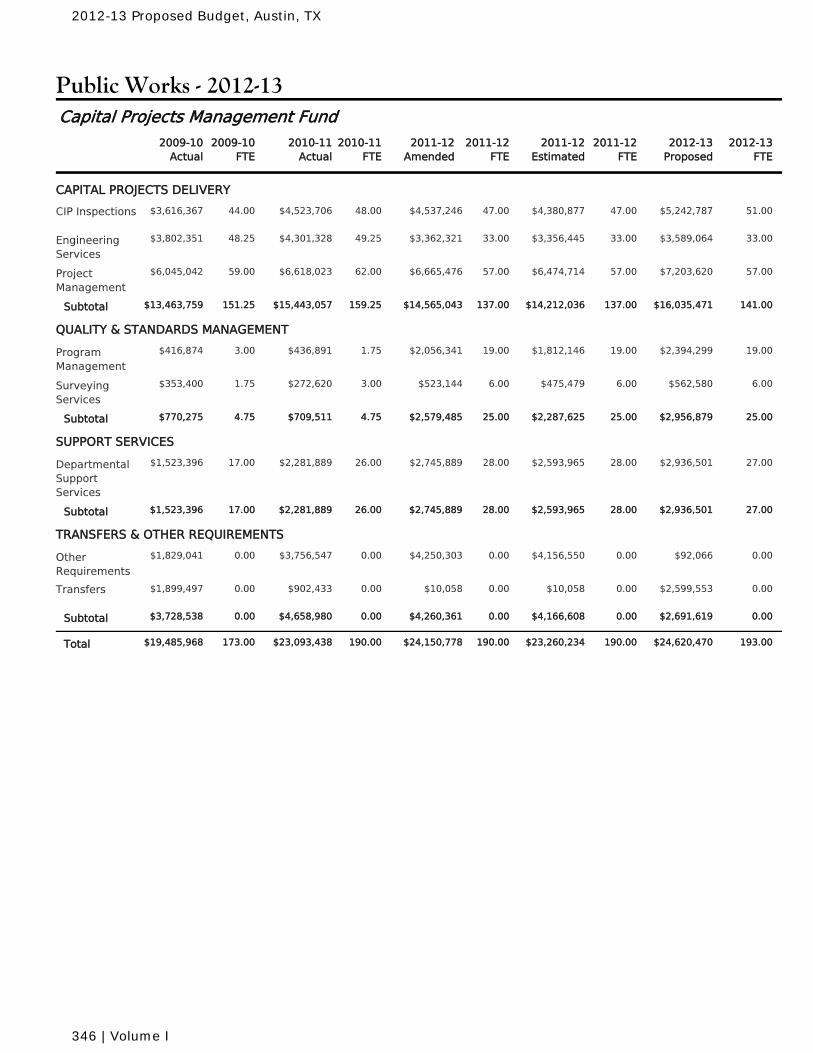
Public Works - 2012-13
2010-11Actual
2010-11FTE
2011-12Amended
2011-12FTE
2011-12Estimated
2011-12FTE
2009-10Actual
2009-10FTE
2012-13Proposed
2012-13FTE
Capital Projects Management Fund
CAPITAL PROJECTS DELIVERY
$4,523,706 48.00 $4,537,246 47.00 $4,380,877 47.00CIP Inspections 44.00 $5,242,787 51.00$3,616,367
$4,301,328 49.25 $3,362,321 33.00 $3,356,445 33.00EngineeringServices
48.25 $3,589,064 33.00$3,802,351
$6,618,023 62.00 $6,665,476 57.00 $6,474,714 57.00ProjectManagement
59.00 $7,203,620 57.00$6,045,042
$15,443,057 159.25 $14,565,043 137.00 $14,212,036 137.00Subtotal 151.25 $16,035,471 141.00$13,463,759
QUALITY & STANDARDS MANAGEMENT
$436,891 1.75 $2,056,341 19.00 $1,812,146 19.00ProgramManagement
3.00 $2,394,299 19.00$416,874
$272,620 3.00 $523,144 6.00 $475,479 6.00SurveyingServices
1.75 $562,580 6.00$353,400
$709,511 4.75 $2,579,485 25.00 $2,287,625 25.00Subtotal 4.75 $2,956,879 25.00$770,275
SUPPORT SERVICES
$2,281,889 26.00 $2,745,889 28.00 $2,593,965 28.00DepartmentalSupportServices
17.00 $2,936,501 27.00$1,523,396
$2,281,889 26.00 $2,745,889 28.00 $2,593,965 28.00Subtotal 17.00 $2,936,501 27.00$1,523,396
TRANSFERS & OTHER REQUIREMENTS
$3,756,547 0.00 $4,250,303 0.00 $4,156,550 0.00OtherRequirements
0.00 $92,066 0.00$1,829,041
$902,433 0.00 $10,058 0.00 $10,058 0.00Transfers 0.00 $2,599,553 0.00$1,899,497
$4,658,980 0.00 $4,260,361 0.00 $4,166,608 0.00Subtotal 0.00 $2,691,619 0.00$3,728,538
$23,093,438 190.00 $24,150,778 190.00 $23,260,234 190.00Total 173.00 $24,620,470 193.00$19,485,968
2012-13 Proposed Budget, Austin, TX
346 | Volume I
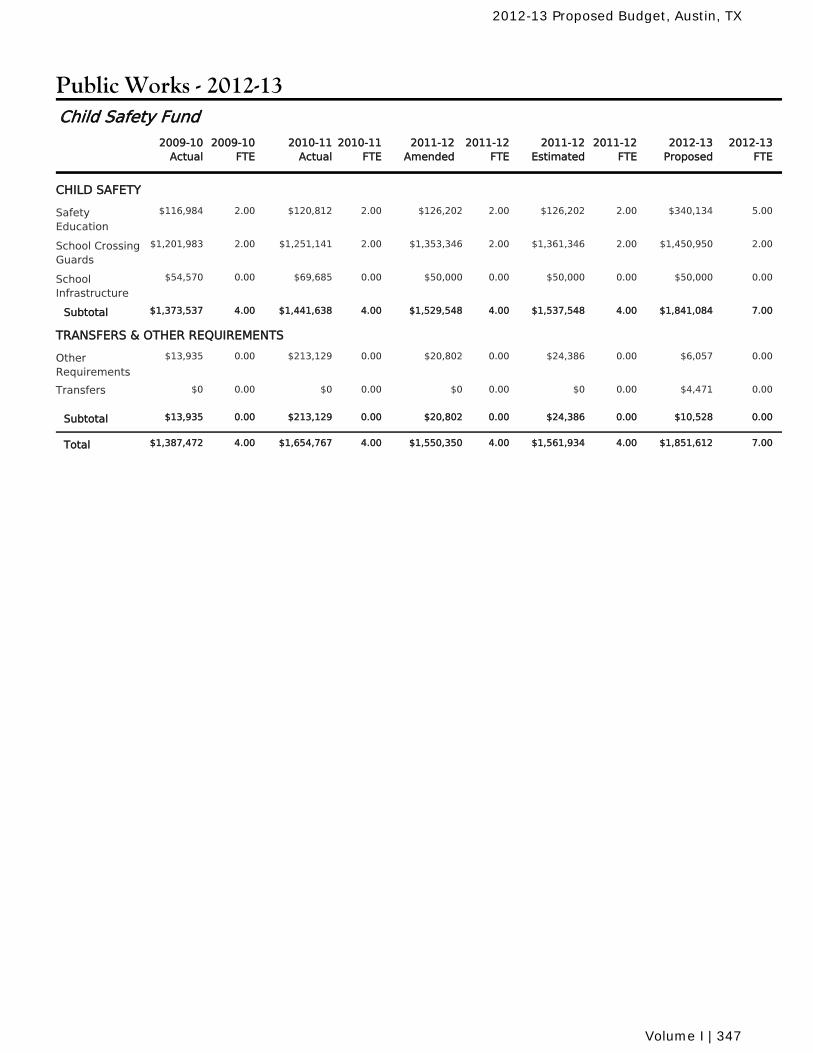
Public Works - 2012-13
2010-11Actual
2010-11FTE
2011-12Amended
2011-12FTE
2011-12Estimated
2011-12FTE
2009-10Actual
2009-10FTE
2012-13Proposed
2012-13FTE
Child Safety Fund
CHILD SAFETY
$120,812 2.00 $126,202 2.00 $126,202 2.00SafetyEducation
2.00 $340,134 5.00$116,984
$1,251,141 2.00 $1,353,346 2.00 $1,361,346 2.00School CrossingGuards
2.00 $1,450,950 2.00$1,201,983
$69,685 0.00 $50,000 0.00 $50,000 0.00SchoolInfrastructure
0.00 $50,000 0.00$54,570
$1,441,638 4.00 $1,529,548 4.00 $1,537,548 4.00Subtotal 4.00 $1,841,084 7.00$1,373,537
TRANSFERS & OTHER REQUIREMENTS
$213,129 0.00 $20,802 0.00 $24,386 0.00OtherRequirements
0.00 $6,057 0.00$13,935
$0 0.00 $0 0.00 $0 0.00Transfers 0.00 $4,471 0.00$0
$213,129 0.00 $20,802 0.00 $24,386 0.00Subtotal 0.00 $10,528 0.00$13,935
$1,654,767 4.00 $1,550,350 4.00 $1,561,934 4.00Total 4.00 $1,851,612 7.00$1,387,472
2012-13 Proposed Budget, Austin, TX
Volume I | 347
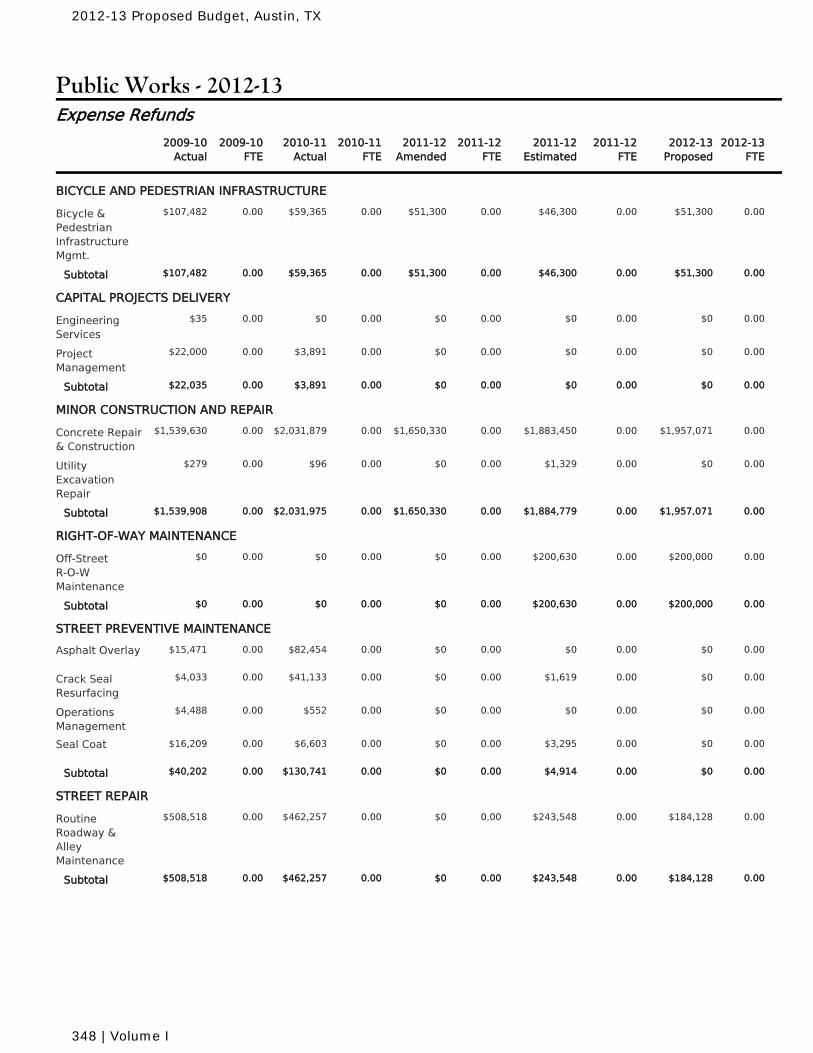
Public Works - 2012-13
2010-11Actual
2010-11FTE
2011-12Amended
2011-12FTE
2011-12Estimated
2011-12FTE
2009-10Actual
2009-10FTE
2012-13Proposed
2012-13FTE
Expense Refunds
BICYCLE AND PEDESTRIAN INFRASTRUCTURE
$59,365 0.00 $51,300 0.00 $46,300 0.00Bicycle &PedestrianInfrastructureMgmt.
0.00 $51,300 0.00$107,482
$59,365 0.00 $51,300 0.00 $46,300 0.00Subtotal 0.00 $51,300 0.00$107,482
CAPITAL PROJECTS DELIVERY
$0 0.00 $0 0.00 $0 0.00EngineeringServices
0.00 $0 0.00$35
$3,891 0.00 $0 0.00 $0 0.00ProjectManagement
0.00 $0 0.00$22,000
$3,891 0.00 $0 0.00 $0 0.00Subtotal 0.00 $0 0.00$22,035
MINOR CONSTRUCTION AND REPAIR
$2,031,879 0.00 $1,650,330 0.00 $1,883,450 0.00Concrete Repair& Construction
0.00 $1,957,071 0.00$1,539,630
$96 0.00 $0 0.00 $1,329 0.00UtilityExcavationRepair
0.00 $0 0.00$279
$2,031,975 0.00 $1,650,330 0.00 $1,884,779 0.00Subtotal 0.00 $1,957,071 0.00$1,539,908
RIGHT-OF-WAY MAINTENANCE
$0 0.00 $0 0.00 $200,630 0.00Off-StreetR-O-WMaintenance
0.00 $200,000 0.00$0
$0 0.00 $0 0.00 $200,630 0.00Subtotal 0.00 $200,000 0.00$0
STREET PREVENTIVE MAINTENANCE
$82,454 0.00 $0 0.00 $0 0.00Asphalt Overlay 0.00 $0 0.00$15,471
$41,133 0.00 $0 0.00 $1,619 0.00Crack SealResurfacing
0.00 $0 0.00$4,033
$552 0.00 $0 0.00 $0 0.00OperationsManagement
0.00 $0 0.00$4,488
$6,603 0.00 $0 0.00 $3,295 0.00Seal Coat 0.00 $0 0.00$16,209
$130,741 0.00 $0 0.00 $4,914 0.00Subtotal 0.00 $0 0.00$40,202
STREET REPAIR
$462,257 0.00 $0 0.00 $243,548 0.00RoutineRoadway &AlleyMaintenance
0.00 $184,128 0.00$508,518
$462,257 0.00 $0 0.00 $243,548 0.00Subtotal 0.00 $184,128 0.00$508,518
2012-13 Proposed Budget, Austin, TX
348 | Volume I
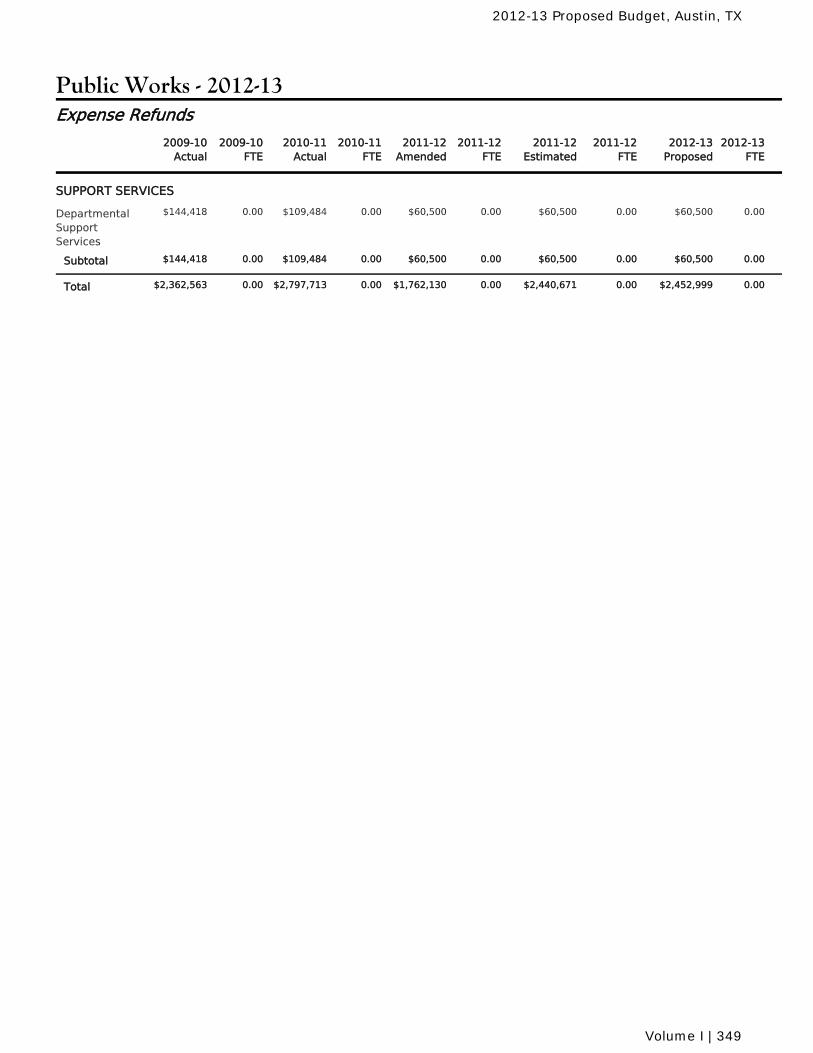
Public Works - 2012-13
2010-11Actual
2010-11FTE
2011-12Amended
2011-12FTE
2011-12Estimated
2011-12FTE
2009-10Actual
2009-10FTE
2012-13Proposed
2012-13FTE
Expense Refunds
SUPPORT SERVICES
$109,484 0.00 $60,500 0.00 $60,500 0.00DepartmentalSupportServices
0.00 $60,500 0.00$144,418
$109,484 0.00 $60,500 0.00 $60,500 0.00Subtotal 0.00 $60,500 0.00$144,418
$2,797,713 0.00 $1,762,130 0.00 $2,440,671 0.00Total 0.00 $2,452,999 0.00$2,362,563
2012-13 Proposed Budget, Austin, TX
Volume I | 349
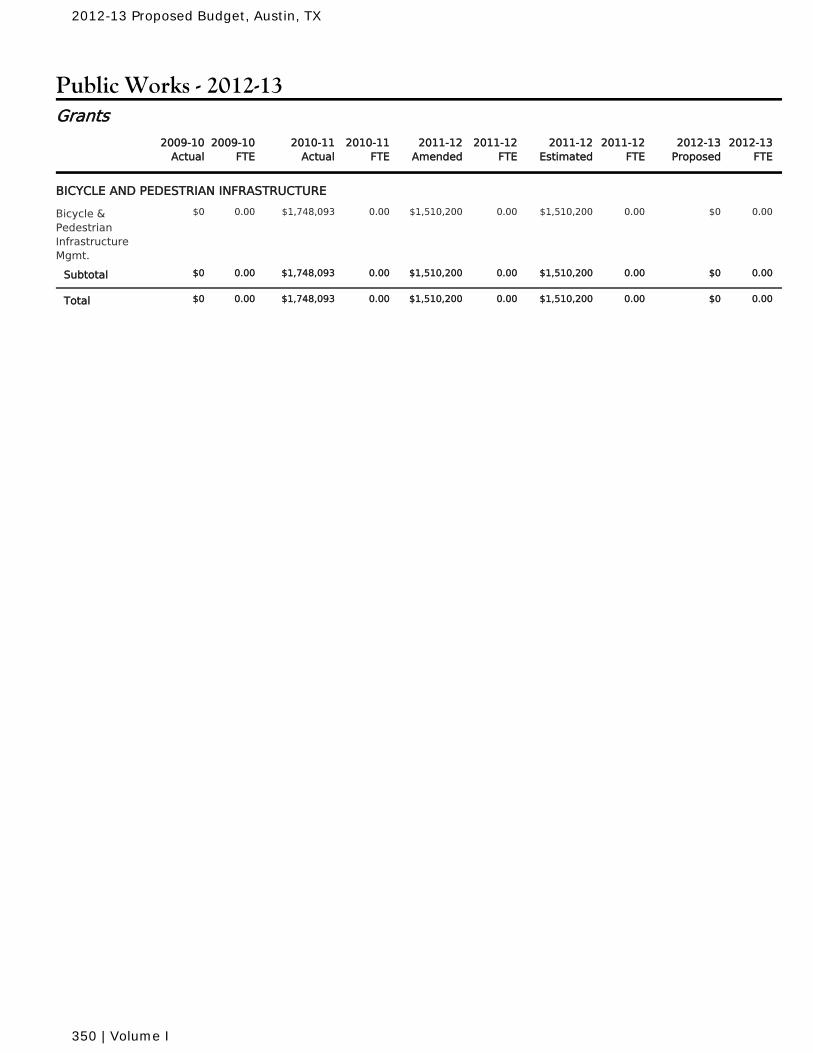
Public Works - 2012-13
2010-11Actual
2010-11FTE
2011-12Amended
2011-12FTE
2011-12Estimated
2011-12FTE
2009-10Actual
2009-10FTE
2012-13Proposed
2012-13FTE
Grants
BICYCLE AND PEDESTRIAN INFRASTRUCTURE
$1,748,093 0.00 $1,510,200 0.00 $1,510,200 0.00Bicycle &PedestrianInfrastructureMgmt.
0.00 $0 0.00$0
$1,748,093 0.00 $1,510,200 0.00 $1,510,200 0.00Subtotal 0.00 $0 0.00$0
$1,748,093 0.00 $1,510,200 0.00 $1,510,200 0.00Total 0.00 $0 0.00$0
2012-13 Proposed Budget, Austin, TX
350 | Volume I
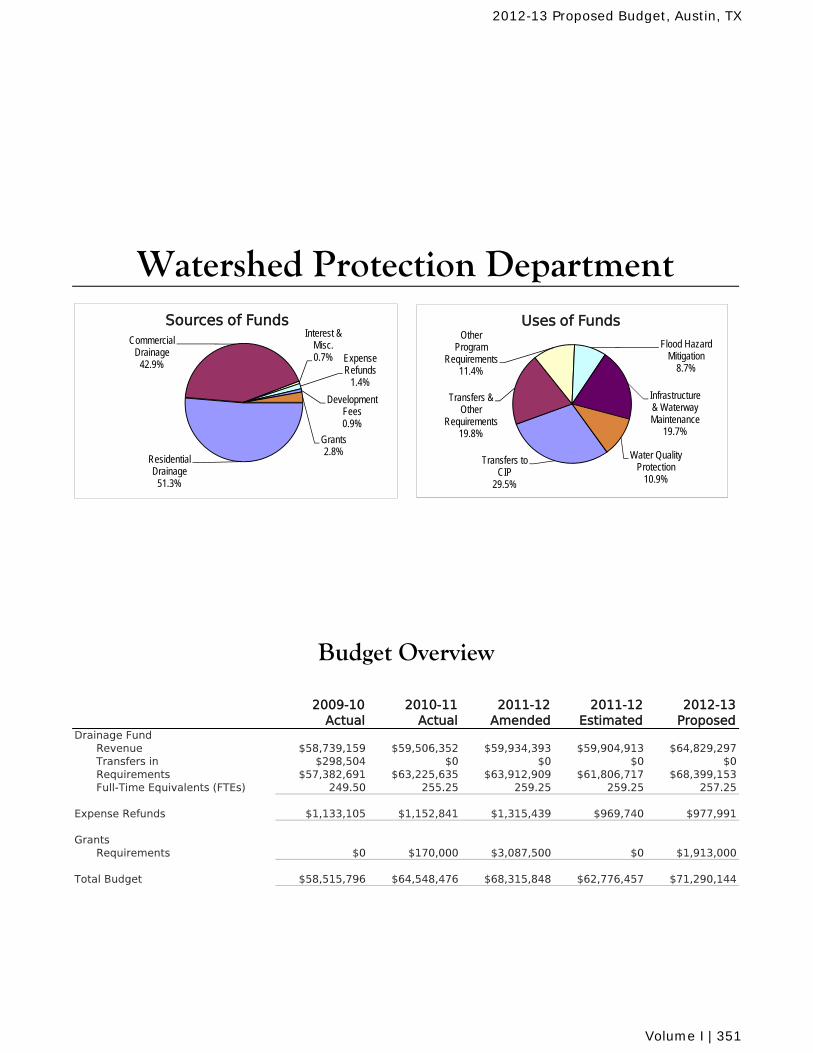
2009-10 Actual
2010-11 Actual
2011-12 Amended
2011-12 Estimated
2012-13 Proposed
Drainage FundRevenue $58,739,159 $59,506,352 $59,934,393 $59,904,913 $64,829,297Transfers in $298,504 $0 $0 $0 $0Requirements $57,382,691 $63,225,635 $63,912,909 $61,806,717 $68,399,153Full-Time Equivalents (FTEs) 249.50 255.25 259.25 259.25 257.25
Expense Refunds $1,133,105 $1,152,841 $1,315,439 $969,740 $977,991
GrantsRequirements $0 $170,000 $3,087,500 $0 $1,913,000
Total Budget $58,515,796 $64,548,476 $68,315,848 $62,776,457 $71,290,144
Budget Overview
Watershed Protection Department
Residential Drainage
51.3%
Commercial Drainage
42.9%
Interest & Misc.0.7% Expense
Refunds1.4%
Development Fees0.9%
Grants2.8%
Sources of Funds
Transfers to CIP
29.5%
Transfers & Other
Requirements19.8%
Other Program
Requirements 11.4%
Flood Hazard Mitigation
8.7%
Infrastructure & Waterway Maintenance
19.7%
Water Quality Protection
10.9%
Uses of Funds
2012-13 Proposed Budget, Austin, TX
Volume I | 351
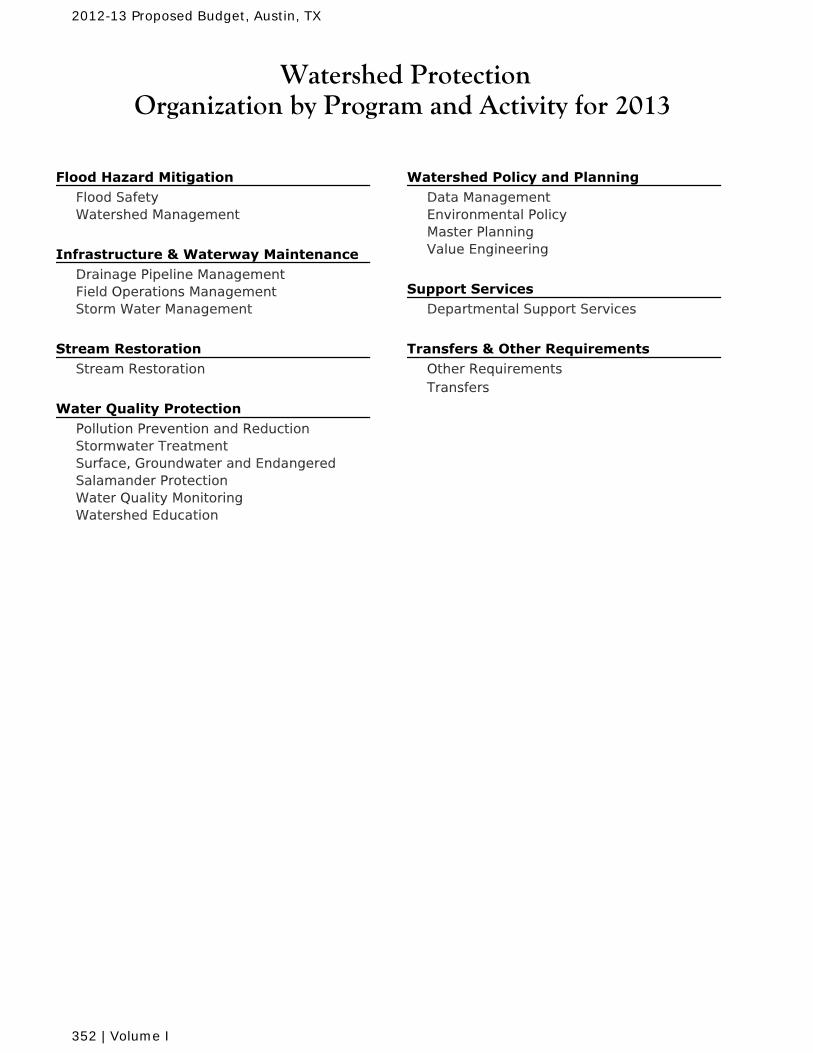
Watershed ProtectionOrganization by Program and Activity for 2013
Flood Hazard Mitigation Flood SafetyWatershed Management
Infrastructure & Waterway Maintenance Drainage Pipeline ManagementField Operations ManagementStorm Water Management
Stream Restoration Stream Restoration
Water Quality Protection Pollution Prevention and ReductionStormwater TreatmentSurface, Groundwater and EndangeredSalamander ProtectionWater Quality MonitoringWatershed Education
Watershed Policy and Planning Data ManagementEnvironmental PolicyMaster PlanningValue Engineering
Support Services Departmental Support Services
Transfers & Other Requirements Other RequirementsTransfers
2012-13 Proposed Budget, Austin, TX
352 | Volume I
Watershed ProtectionMission and Goals for 2013
Mission
The purpose of the Watershed Protection Department is to protect lives, property, and theenvironment of our community by reducing the impact of flooding, erosion, and water pollution.
Goals
Reduce flood impacts to life and property.
Continue to increase flood protection of threatened structures through creek and drainagesystem improvements.Continue to alert the public of imminent flood hazards and enhance efforts to educate thepublic about flood hazards.Maintain or improve the City's participation requirements in the National Flood InsuranceProgram and Community Rating System.
Create a stable stream system that decreases property loss from erosion and increases thebeneficial uses of waterways.
Prepare design for 4,000 linear feet of stream channel repairs in FY 2013.
Maintain and improve water quality.
Construct water quality controls to reduce stormwater pollutants from 6,700 acres by FY 2013.Conduct business inspections and spill response to recover a total of 750,000 gallons and 500cubic yards of pollutants in FY 2013.Maintain or improve baseline levels of the Environmental Integrity Index (water, sediment andrecreational quality, aquatic habitat and physical integrity) in 100% of watersheds evaluated.
Provide adequate assessment and maintenance of drainage infrastructure.
Complete 1,500 feet of stream channel stabilization to provide increased erosion protection toproperty in FY 2013.As the inventory continues to increase, continue to maintain residential ponds so that 90% arefunctioning properly through FY 2013.Complete assessment of ten miles of storm drain infrastructure through FY 2013.
Maintain 100% of activities in compliance with Federal and State permits and regulatoryrequirements.
2012-13 Proposed Budget, Austin, TX
Volume I | 353
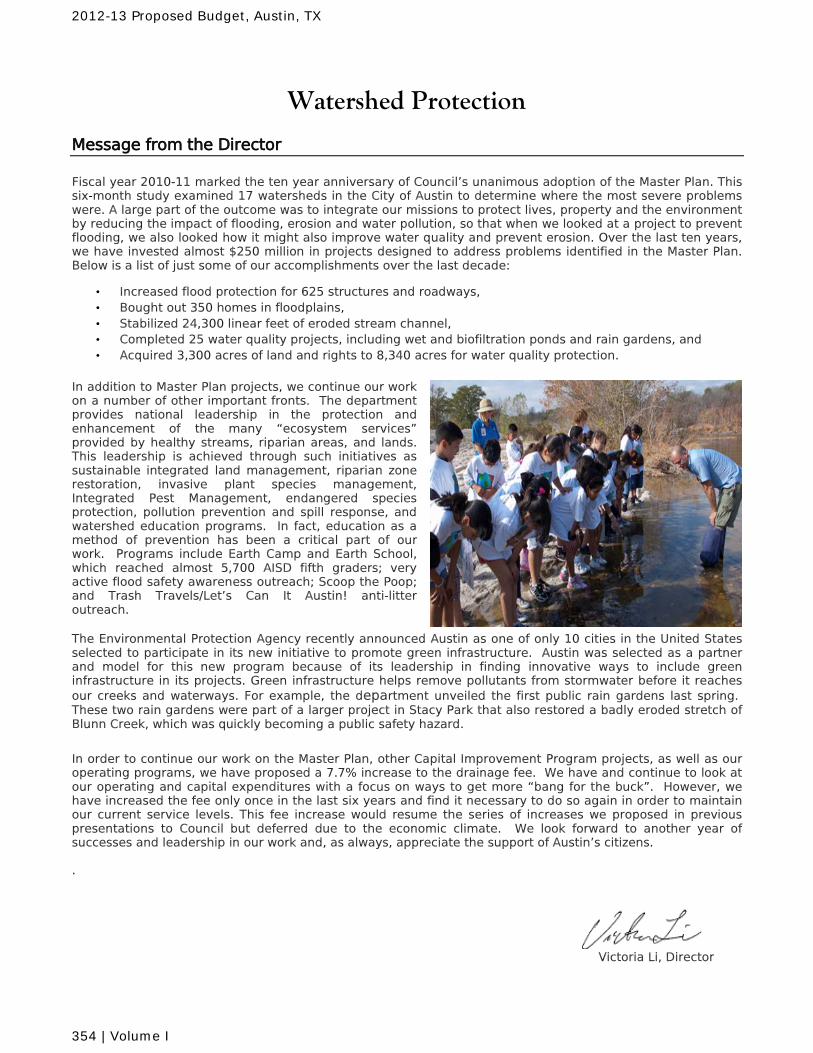
Watershed Protection
Message from the Director
Fiscal year 2010-11 marked the ten year anniversary of Council’s unanimous adoption of the Master Plan. This six-month study examined 17 watersheds in the City of Austin to determine where the most severe problems were. A large part of the outcome was to integrate our missions to protect lives, property and the environment by reducing the impact of flooding, erosion and water pollution, so that when we looked at a project to prevent flooding, we also looked how it might also improve water quality and prevent erosion. Over the last ten years, we have invested almost $250 million in projects designed to address problems identified in the Master Plan. Below is a list of just some of our accomplishments over the last decade:
• Increased flood protection for 625 structures and roadways, • Bought out 350 homes in floodplains, • Stabilized 24,300 linear feet of eroded stream channel, • Completed 25 water quality projects, including wet and biofiltration ponds and rain gardens, and • Acquired 3,300 acres of land and rights to 8,340 acres for water quality protection.
In addition to Master Plan projects, we continue our work on a number of other important fronts. The department provides national leadership in the protection and enhancement of the many “ecosystem services” provided by healthy streams, riparian areas, and lands. This leadership is achieved through such initiatives as sustainable integrated land management, riparian zone restoration, invasive plant species management, Integrated Pest Management, endangered species protection, pollution prevention and spill response, and watershed education programs. In fact, education as a method of prevention has been a critical part of our work. Programs include Earth Camp and Earth School, which reached almost 5,700 AISD fifth graders; very active flood safety awareness outreach; Scoop the Poop; and Trash Travels/Let’s Can It Austin! anti-litter outreach.
The Environmental Protection Agency recently announced Austin as one of only 10 cities in the United States selected to participate in its new initiative to promote green infrastructure. Austin was selected as a partner and model for this new program because of its leadership in finding innovative ways to include green infrastructure in its projects. Green infrastructure helps remove pollutants from stormwater before it reaches our creeks and waterways. For example, the department unveiled the first public rain gardens last spring. These two rain gardens were part of a larger project in Stacy Park that also restored a badly eroded stretch of Blunn Creek, which was quickly becoming a public safety hazard. In order to continue our work on the Master Plan, other Capital Improvement Program projects, as well as our operating programs, we have proposed a 7.7% increase to the drainage fee. We have and continue to look at our operating and capital expenditures with a focus on ways to get more “bang for the buck”. However, we have increased the fee only once in the last six years and find it necessary to do so again in order to maintain our current service levels. This fee increase would resume the series of increases we proposed in previous presentations to Council but deferred due to the economic climate. We look forward to another year of successes and leadership in our work and, as always, appreciate the support of Austin’s citizens. .
Victoria Li, Director
2012-13 Proposed Budget, Austin, TX
354 | Volume I
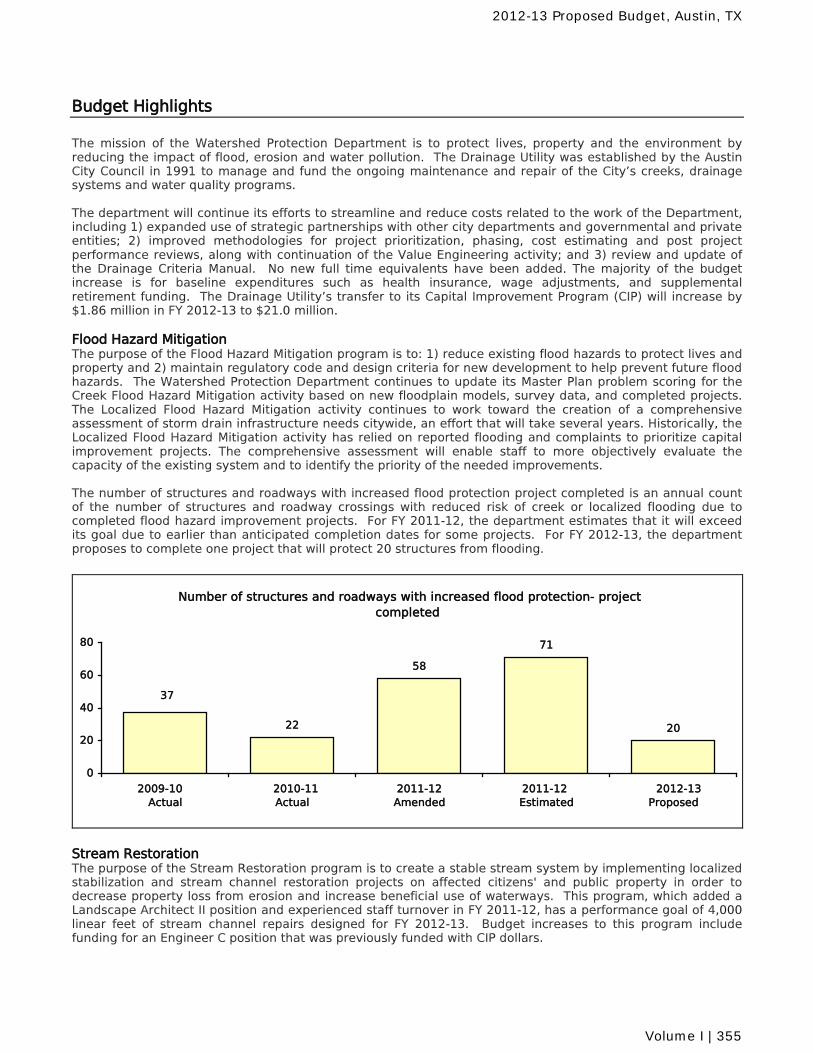
Budget Highlights
The mission of the Watershed Protection Department is to protect lives, property and the environment by reducing the impact of flood, erosion and water pollution. The Drainage Utility was established by the Austin City Council in 1991 to manage and fund the ongoing maintenance and repair of the City’s creeks, drainage systems and water quality programs. The department will continue its efforts to streamline and reduce costs related to the work of the Department, including 1) expanded use of strategic partnerships with other city departments and governmental and private entities; 2) improved methodologies for project prioritization, phasing, cost estimating and post project performance reviews, along with continuation of the Value Engineering activity; and 3) review and update of the Drainage Criteria Manual. No new full time equivalents have been added. The majority of the budget increase is for baseline expenditures such as health insurance, wage adjustments, and supplemental retirement funding. The Drainage Utility’s transfer to its Capital Improvement Program (CIP) will increase by $1.86 million in FY 2012-13 to $21.0 million. Flood Hazard Mitigation The purpose of the Flood Hazard Mitigation program is to: 1) reduce existing flood hazards to protect lives and property and 2) maintain regulatory code and design criteria for new development to help prevent future flood hazards. The Watershed Protection Department continues to update its Master Plan problem scoring for the Creek Flood Hazard Mitigation activity based on new floodplain models, survey data, and completed projects. The Localized Flood Hazard Mitigation activity continues to work toward the creation of a comprehensive assessment of storm drain infrastructure needs citywide, an effort that will take several years. Historically, the Localized Flood Hazard Mitigation activity has relied on reported flooding and complaints to prioritize capital improvement projects. The comprehensive assessment will enable staff to more objectively evaluate the capacity of the existing system and to identify the priority of the needed improvements. The number of structures and roadways with increased flood protection project completed is an annual count of the number of structures and roadway crossings with reduced risk of creek or localized flooding due to completed flood hazard improvement projects. For FY 2011-12, the department estimates that it will exceed its goal due to earlier than anticipated completion dates for some projects. For FY 2012-13, the department proposes to complete one project that will protect 20 structures from flooding.
Number of structures and roadways with increased flood protection- project completed
37
22
58
71
20
0
20
40
60
80
2009-10 Actual
2010-11 Actual
2011-12 Amended
2011-12 Estimated
2012-13 Proposed
Stream Restoration The purpose of the Stream Restoration program is to create a stable stream system by implementing localized stabilization and stream channel restoration projects on affected citizens' and public property in order to decrease property loss from erosion and increase beneficial use of waterways. This program, which added a Landscape Architect II position and experienced staff turnover in FY 2011-12, has a performance goal of 4,000 linear feet of stream channel repairs designed for FY 2012-13. Budget increases to this program include funding for an Engineer C position that was previously funded with CIP dollars.
2012-13 Proposed Budget, Austin, TX
Volume I | 355
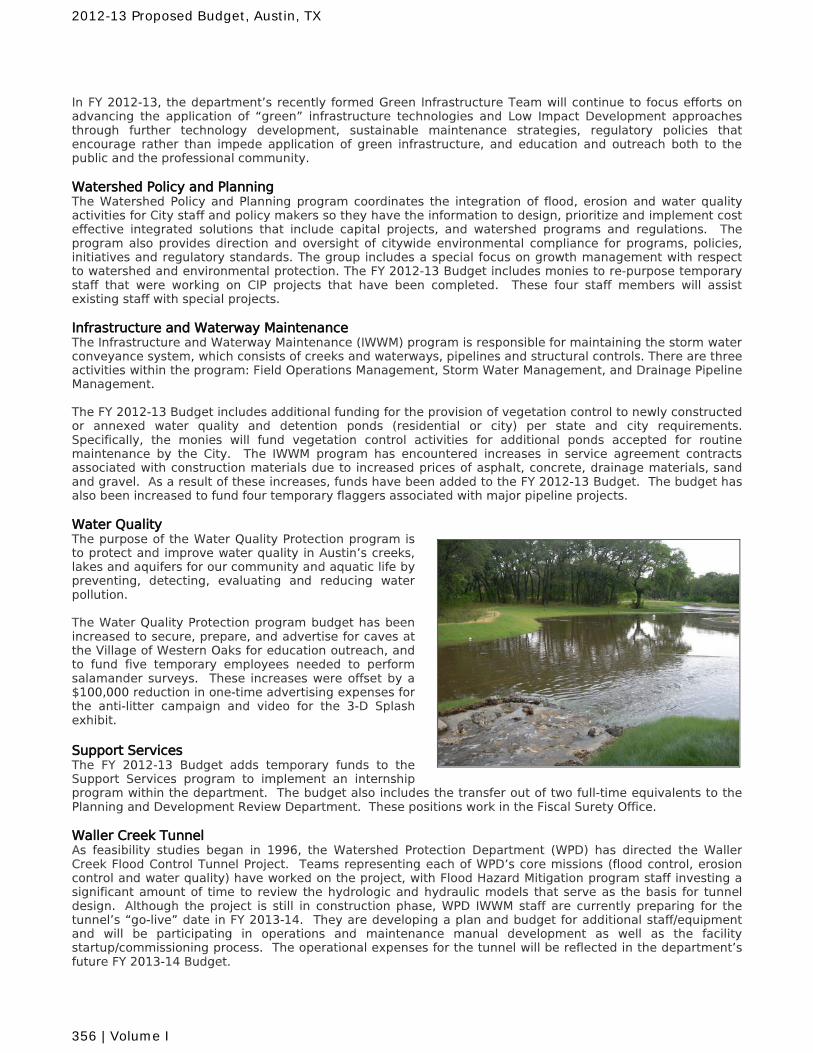
In FY 2012-13, the department’s recently formed Green Infrastructure Team will continue to focus efforts on advancing the application of “green” infrastructure technologies and Low Impact Development approaches through further technology development, sustainable maintenance strategies, regulatory policies that encourage rather than impede application of green infrastructure, and education and outreach both to the public and the professional community. Watershed Policy and Planning The Watershed Policy and Planning program coordinates the integration of flood, erosion and water quality activities for City staff and policy makers so they have the information to design, prioritize and implement cost effective integrated solutions that include capital projects, and watershed programs and regulations. The program also provides direction and oversight of citywide environmental compliance for programs, policies, initiatives and regulatory standards. The group includes a special focus on growth management with respect to watershed and environmental protection. The FY 2012-13 Budget includes monies to re-purpose temporary staff that were working on CIP projects that have been completed. These four staff members will assist existing staff with special projects. Infrastructure and Waterway Maintenance The Infrastructure and Waterway Maintenance (IWWM) program is responsible for maintaining the storm water conveyance system, which consists of creeks and waterways, pipelines and structural controls. There are three activities within the program: Field Operations Management, Storm Water Management, and Drainage Pipeline Management. The FY 2012-13 Budget includes additional funding for the provision of vegetation control to newly constructed or annexed water quality and detention ponds (residential or city) per state and city requirements. Specifically, the monies will fund vegetation control activities for additional ponds accepted for routine maintenance by the City. The IWWM program has encountered increases in service agreement contracts associated with construction materials due to increased prices of asphalt, concrete, drainage materials, sand and gravel. As a result of these increases, funds have been added to the FY 2012-13 Budget. The budget has also been increased to fund four temporary flaggers associated with major pipeline projects. Water Quality The purpose of the Water Quality Protection program is to protect and improve water quality in Austin’s creeks, lakes and aquifers for our community and aquatic life by preventing, detecting, evaluating and reducing water pollution. The Water Quality Protection program budget has been increased to secure, prepare, and advertise for caves at the Village of Western Oaks for education outreach, and to fund five temporary employees needed to perform salamander surveys. These increases were offset by a $100,000 reduction in one-time advertising expenses for the anti-litter campaign and video for the 3-D Splash exhibit. Support Services The FY 2012-13 Budget adds temporary funds to the Support Services program to implement an internship program within the department. The budget also includes the transfer out of two full-time equivalents to the Planning and Development Review Department. These positions work in the Fiscal Surety Office. Waller Creek Tunnel As feasibility studies began in 1996, the Watershed Protection Department (WPD) has directed the Waller Creek Flood Control Tunnel Project. Teams representing each of WPD’s core missions (flood control, erosion control and water quality) have worked on the project, with Flood Hazard Mitigation program staff investing a significant amount of time to review the hydrologic and hydraulic models that serve as the basis for tunnel design. Although the project is still in construction phase, WPD IWWM staff are currently preparing for the tunnel’s “go-live” date in FY 2013-14. They are developing a plan and budget for additional staff/equipment and will be participating in operations and maintenance manual development as well as the facility startup/commissioning process. The operational expenses for the tunnel will be reflected in the department’s future FY 2013-14 Budget.
2012-13 Proposed Budget, Austin, TX
356 | Volume I
Revenue The primary funding source for the Drainage Utility is the monthly drainage fee assessed to City of Austin utility customers. This fee is projected to provide approximately 98%, or $64 million, of the department’s $65 million revenue projected for the upcoming fiscal year. The FY 2012-13 Budget reflects a 7.7% increase to the base billing unit (equivalent residential unit), residential growth patterns in keeping with the City Demographer’s projections, and minimal growth in commercial accounts. Other revenue sources for the department include interest income and development revenue. The FY 2012-13 Budget for interest income was lowered to reflect current trends in interest rates. Tax exempt religious organizations may request exemption from the drainage fee per section 15-2-15 (2) of the Drainage Ordinance. The department works closely with the Religious Coalition to Assist the Homeless (RCAH) as the exempted drainage fees are directed to this umbrella organization for grant-making purposes. In FY 2011, $615,995 in drainage fees were collected by the organization. In turn, the RCAH granted $585,150 to the following 12 organizations to benefit homeless individuals: A New Entry, Inc.; Caritas; Casa Marianella; Foundation for the Homeless; Front Steps; Green Doors; LifeWorks; Mary House Catholic Worker; Project Transitions; Salvation Army; Texas Reach Out; Saint Louise House; and Trinity Center of Austin. Grant amounts ranged from $10,000 to $126,000. Capital Budget The FY 2012-13 Capital Budget includes a total new appropriation of $31.4 million. This appropriation includes funding for the Waller Creek Tunnel, erosion control, flood control improvement, localized drainage improvements, water quality remediation/protection projects, vehicle purchases, and database and GIS projects. The appropriation also includes 2006 General Obligation Bond funding for Watershed Protection Master Plan projects as well as Urban Watershed Structural Control funds from the water quality fee-in-lieu program.
2012-13 Proposed Budget, Austin, TX
Volume I | 357
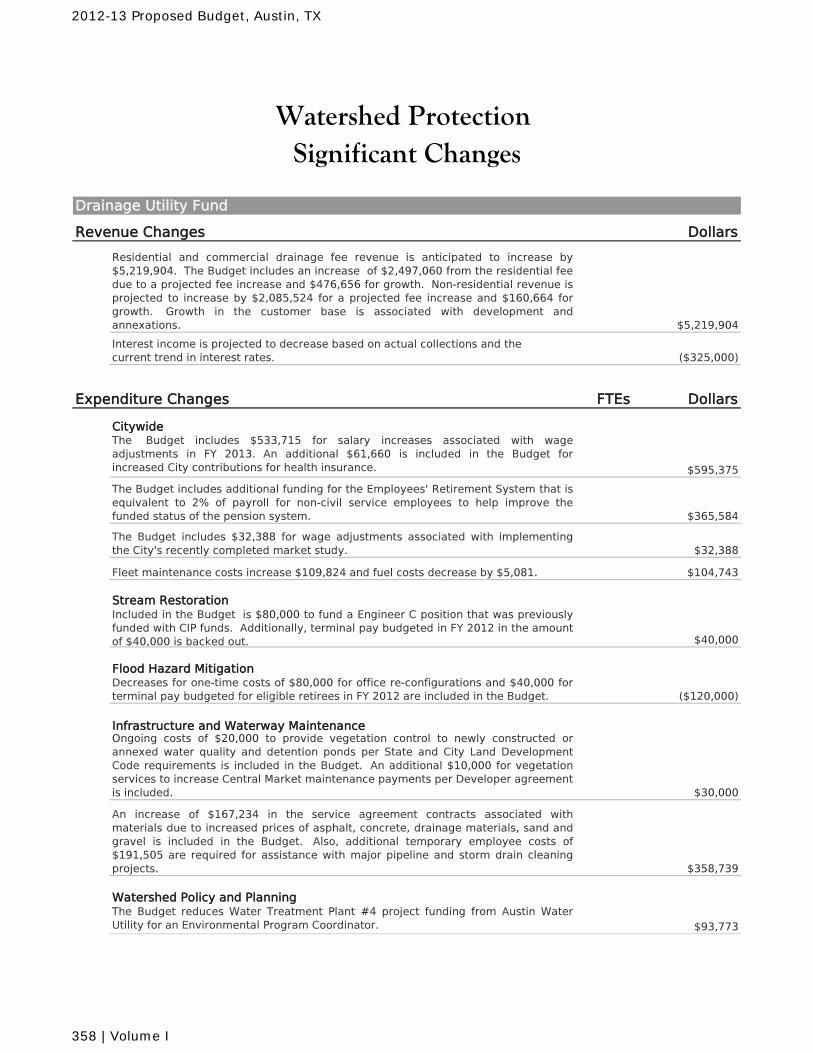
Revenue Changes Dollars
Residential and commercial drainage fee revenue is anticipated to increase by$5,219,904. The Budget includes an increase of $2,497,060 from the residential feedue to a projected fee increase and $476,656 for growth. Non-residential revenue isprojected to increase by $2,085,524 for a projected fee increase and $160,664 forgrowth. Growth in the customer base is associated with development andannexations. $5,219,904
Interest income is projected to decrease based on actual collections and thecurrent trend in interest rates. ($325,000)
Expenditure Changes FTEs Dollars
CitywideThe Budget includes $533,715 for salary increases associated with wageadjustments in FY 2013. An additional $61,660 is included in the Budget forincreased City contributions for health insurance. $595,375
The Budget includes additional funding for the Employees' Retirement System that isequivalent to 2% of payroll for non-civil service employees to help improve thefunded status of the pension system. $365,584
The Budget includes $32,388 for wage adjustments associated with implementingthe City's recently completed market study. $32,388
Fleet maintenance costs increase $109,824 and fuel costs decrease by $5,081. $104,743
Stream RestorationIncluded in the Budget is $80,000 to fund a Engineer C position that was previouslyfunded with CIP funds. Additionally, terminal pay budgeted in FY 2012 in the amountof $40,000 is backed out. $40,000
Flood Hazard MitigationDecreases for one-time costs of $80,000 for office re-configurations and $40,000 forterminal pay budgeted for eligible retirees in FY 2012 are included in the Budget. ($120,000)
Infrastructure and Waterway MaintenanceOngoing costs of $20,000 to provide vegetation control to newly constructed orannexed water quality and detention ponds per State and City Land DevelopmentCode requirements is included in the Budget. An additional $10,000 for vegetationservices to increase Central Market maintenance payments per Developer agreement is included. $30,000
An increase of $167,234 in the service agreement contracts associated withmaterials due to increased prices of asphalt, concrete, drainage materials, sand andgravel is included in the Budget. Also, additional temporary employee costs of$191,505 are required for assistance with major pipeline and storm drain cleaningprojects. $358,739
Watershed Policy and PlanningThe Budget reduces Water Treatment Plant #4 project funding from Austin WaterUtility for an Environmental Program Coordinator. $93,773
Significant ChangesWatershed Protection
Drainage Utility Fund
2012-13 Proposed Budget, Austin, TX
358 | Volume I
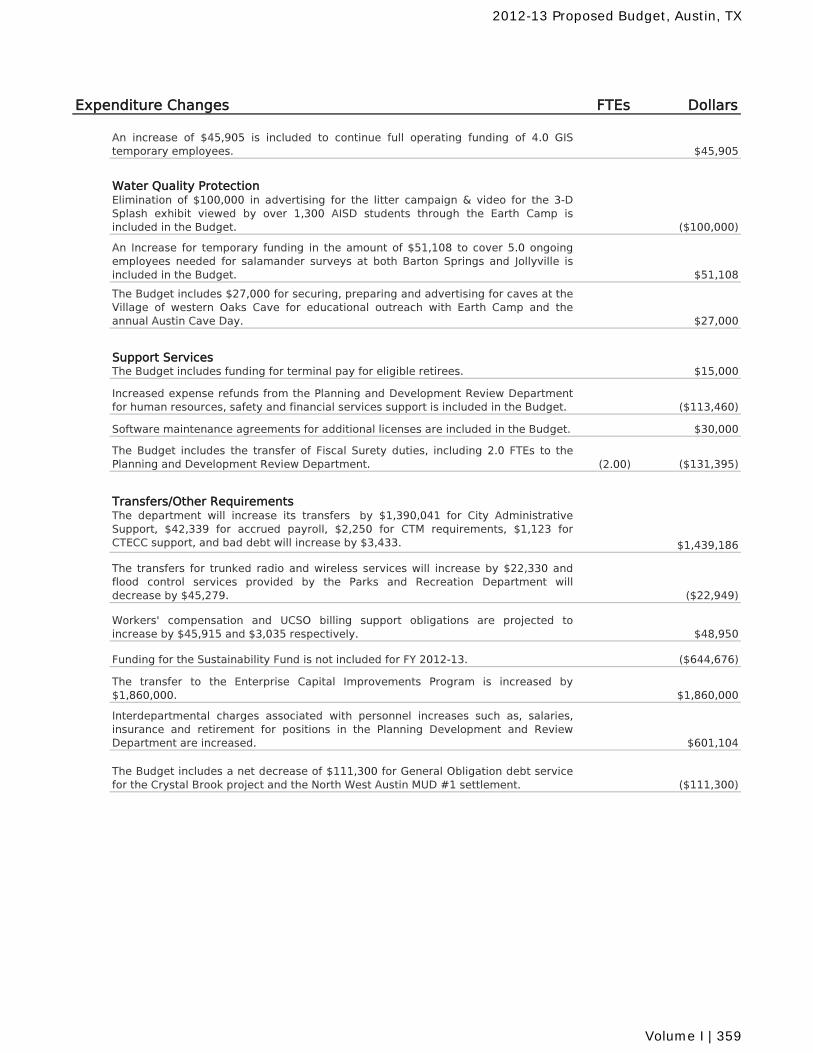
Expenditure Changes FTEs Dollars
An increase of $45,905 is included to continue full operating funding of 4.0 GIStemporary employees. $45,905
Water Quality ProtectionElimination of $100,000 in advertising for the litter campaign & video for the 3-DSplash exhibit viewed by over 1,300 AISD students through the Earth Camp isincluded in the Budget. ($100,000)
An Increase for temporary funding in the amount of $51,108 to cover 5.0 ongoingemployees needed for salamander surveys at both Barton Springs and Jollyville isincluded in the Budget. $51,108
The Budget includes $27,000 for securing, preparing and advertising for caves at theVillage of western Oaks Cave for educational outreach with Earth Camp and theannual Austin Cave Day. $27,000
Support ServicesThe Budget includes funding for terminal pay for eligible retirees. $15,000
Increased expense refunds from the Planning and Development Review Departmentfor human resources, safety and financial services support is included in the Budget. ($113,460)
Software maintenance agreements for additional licenses are included in the Budget. $30,000
The Budget includes the transfer of Fiscal Surety duties, including 2.0 FTEs to thePlanning and Development Review Department. (2.00) ($131,395)
Transfers/Other RequirementsThe department will increase its transfers by $1,390,041 for City AdministrativeSupport, $42,339 for accrued payroll, $2,250 for CTM requirements, $1,123 forCTECC support, and bad debt will increase by $3,433. $1,439,186
The transfers for trunked radio and wireless services will increase by $22,330 andflood control services provided by the Parks and Recreation Department willdecrease by $45,279. ($22,949)
Workers' compensation and UCSO billing support obligations are projected toincrease by $45,915 and $3,035 respectively. $48,950
Funding for the Sustainability Fund is not included for FY 2012-13. ($644,676)
The transfer to the Enterprise Capital Improvements Program is increased by$1,860,000. $1,860,000
Interdepartmental charges associated with personnel increases such as, salaries,insurance and retirement for positions in the Planning Development and ReviewDepartment are increased. $601,104
The Budget includes a net decrease of $111,300 for General Obligation debt servicefor the Crystal Brook project and the North West Austin MUD #1 settlement. ($111,300)
2012-13 Proposed Budget, Austin, TX
Volume I | 359
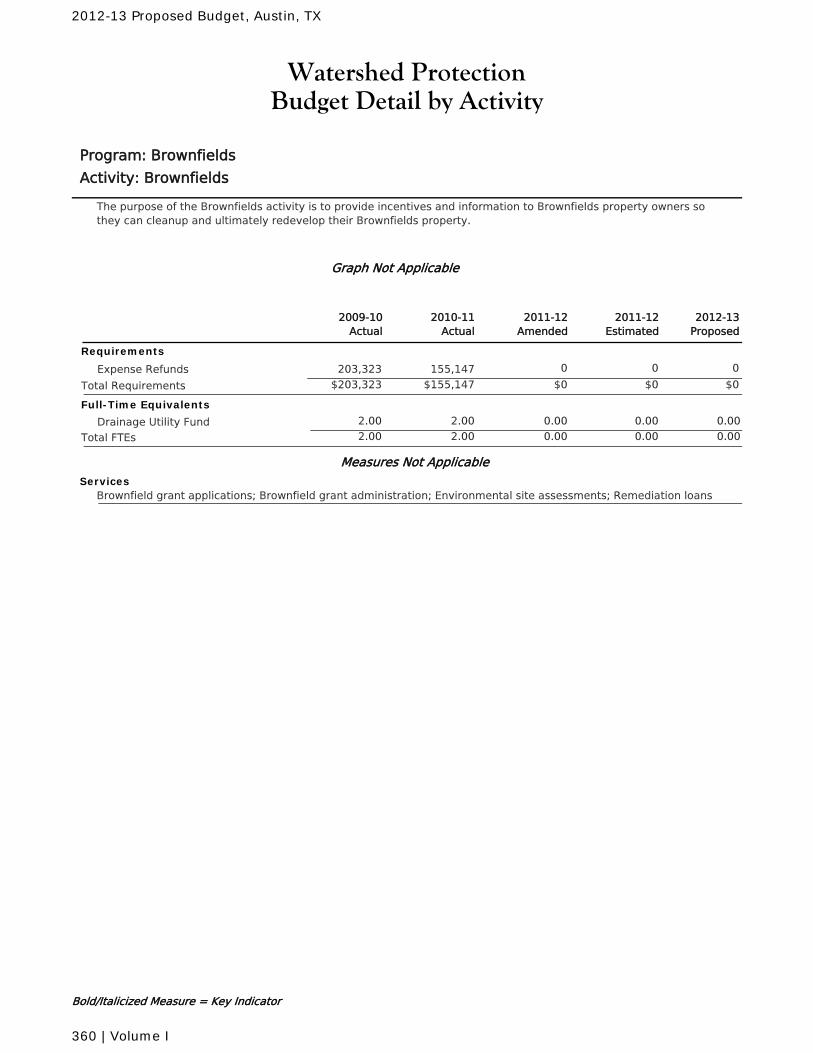
Watershed ProtectionBudget Detail by Activity
Program: Brownfields
Activity: Brownfields
The purpose of the Brownfields activity is to provide incentives and information to Brownfields property owners sothey can cleanup and ultimately redevelop their Brownfields property.
Graph Not Applicable
2011-12Amended
2010-11Actual
2011-12Estimated
2012-13Proposed
2009-10Actual
Requirements
Expense Refunds 0 0 0155,147203,323
$0 $0 $0Total Requirements $155,147$203,323
Full-Time Equivalents
Drainage Utility Fund 2.00 0.00 0.00 0.002.00
Total FTEs 2.00 0.00 0.00 0.002.00
Measures Not Applicable
ServicesBrownfield grant applications; Brownfield grant administration; Environmental site assessments; Remediation loans
Bold/Italicized Measure = Key Indicator
2012-13 Proposed Budget, Austin, TX
360 | Volume I
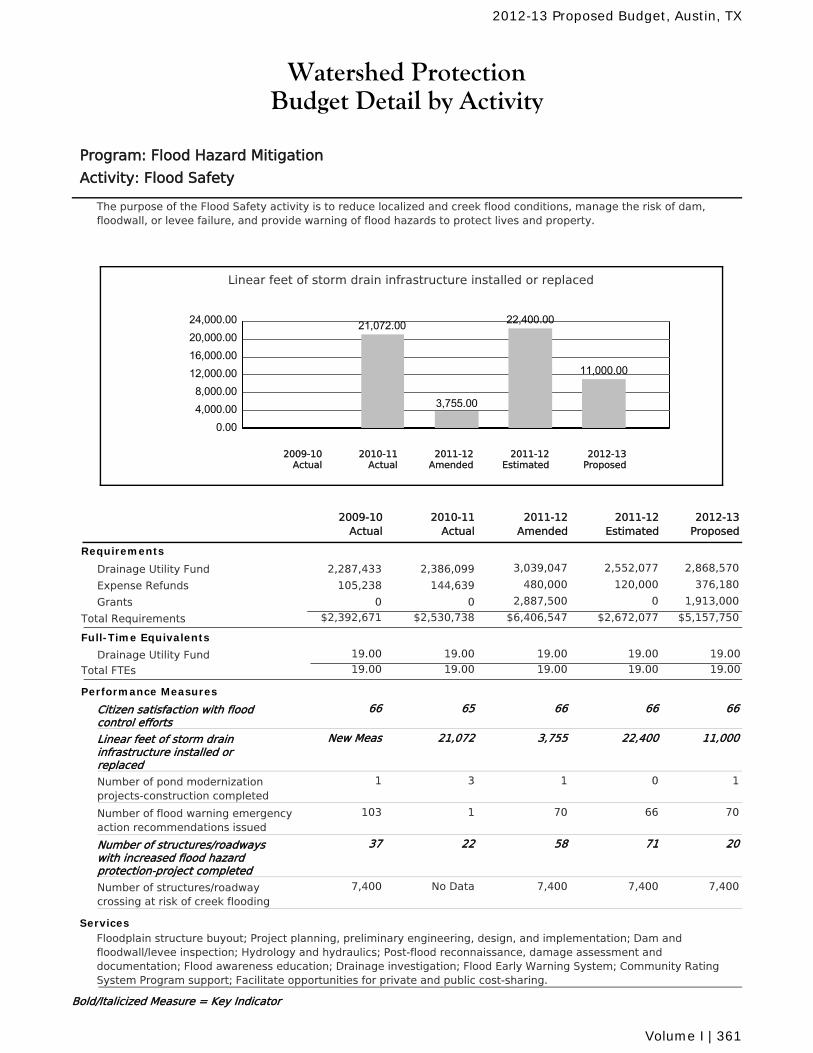
Watershed ProtectionBudget Detail by Activity
Program: Flood Hazard Mitigation
Activity: Flood Safety
The purpose of the Flood Safety activity is to reduce localized and creek flood conditions, manage the risk of dam,floodwall, or levee failure, and provide warning of flood hazards to protect lives and property.
Linear feet of storm drain infrastructure installed or replaced
0.004,000.008,000.00
12,000.0016,000.0020,000.0024,000.00 21,072.00
3,755.00
22,400.00
11,000.00
2010-11Actual
2012-13Proposed
2011-12Amended
2011-12Estimated
2009-10Actual
2011-12Amended
2010-11Actual
2011-12Estimated
2012-13Proposed
2009-10Actual
Requirements
Drainage Utility Fund 3,039,047 2,552,077 2,868,5702,386,0992,287,433
Expense Refunds 480,000 120,000 376,180144,639105,238
Grants 2,887,500 0 1,913,00000
$6,406,547 $2,672,077 $5,157,750Total Requirements $2,530,738$2,392,671
Full-Time Equivalents
Drainage Utility Fund 19.00 19.00 19.00 19.0019.00
Total FTEs 19.00 19.00 19.00 19.0019.00
Performance Measures
Citizen satisfaction with floodcontrol efforts
6665 66 6666
Linear feet of storm draininfrastructure installed orreplaced
3,75521,072 22,400 11,000New Meas
Number of pond modernizationprojects-construction completed
13 0 11
Number of flood warning emergencyaction recommendations issued
701 66 70103
Number of structures/roadwayswith increased flood hazardprotection-project completed
5822 71 2037
Number of structures/roadwaycrossing at risk of creek flooding
7,400No Data 7,400 7,4007,400
ServicesFloodplain structure buyout; Project planning, preliminary engineering, design, and implementation; Dam andfloodwall/levee inspection; Hydrology and hydraulics; Post-flood reconnaissance, damage assessment anddocumentation; Flood awareness education; Drainage investigation; Flood Early Warning System; Community RatingSystem Program support; Facilitate opportunities for private and public cost-sharing.
Bold/Italicized Measure = Key Indicator
2012-13 Proposed Budget, Austin, TX
Volume I | 361
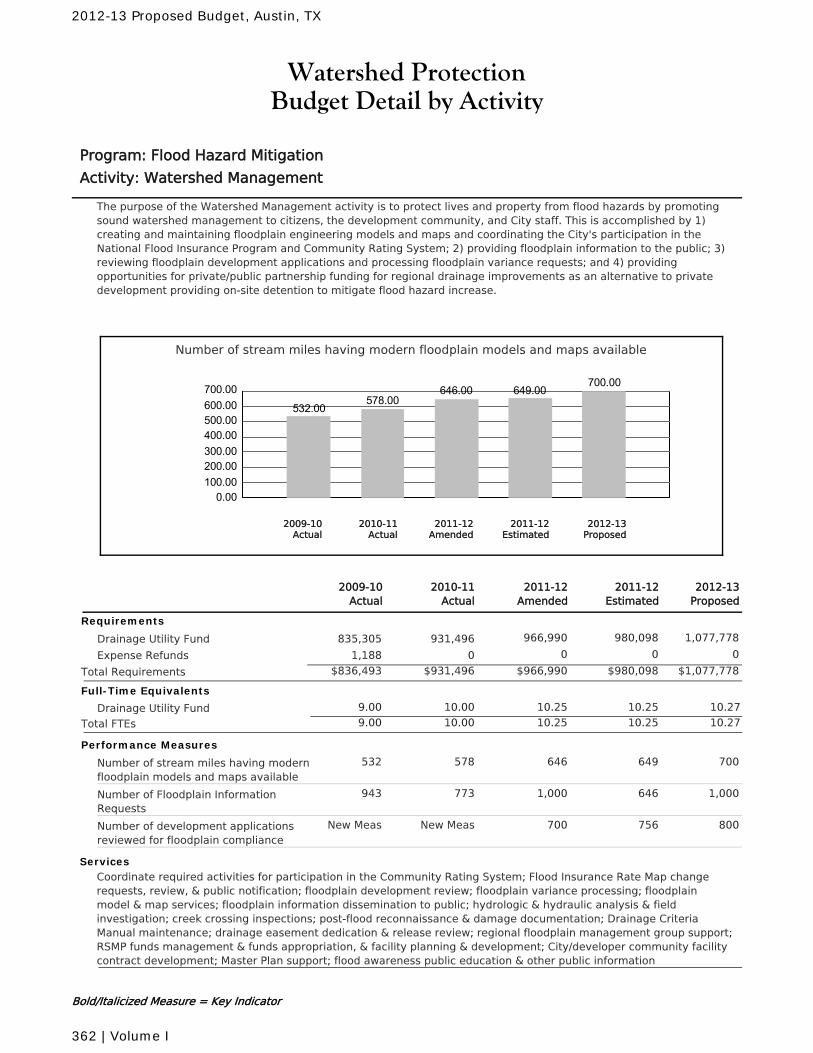
Watershed ProtectionBudget Detail by Activity
Program: Flood Hazard Mitigation
Activity: Watershed Management
The purpose of the Watershed Management activity is to protect lives and property from flood hazards by promotingsound watershed management to citizens, the development community, and City staff. This is accomplished by 1)creating and maintaining floodplain engineering models and maps and coordinating the City's participation in theNational Flood Insurance Program and Community Rating System; 2) providing floodplain information to the public; 3)reviewing floodplain development applications and processing floodplain variance requests; and 4) providingopportunities for private/public partnership funding for regional drainage improvements as an alternative to privatedevelopment providing on-site detention to mitigate flood hazard increase.
Number of stream miles having modern floodplain models and maps available
0.00100.00200.00300.00400.00500.00600.00700.00
532.00578.00
646.00 649.00700.00
2010-11Actual
2012-13Proposed
2011-12Amended
2011-12Estimated
2009-10Actual
2011-12Amended
2010-11Actual
2011-12Estimated
2012-13Proposed
2009-10Actual
Requirements
Drainage Utility Fund 966,990 980,098 1,077,778931,496835,305
Expense Refunds 0 0 001,188
$966,990 $980,098 $1,077,778Total Requirements $931,496$836,493
Full-Time Equivalents
Drainage Utility Fund 10.00 10.25 10.25 10.279.00
Total FTEs 10.00 10.25 10.25 10.279.00
Performance Measures
Number of stream miles having modernfloodplain models and maps available
646578 649 700532
Number of Floodplain InformationRequests
1,000773 646 1,000943
Number of development applicationsreviewed for floodplain compliance
700New Meas 756 800New Meas
ServicesCoordinate required activities for participation in the Community Rating System; Flood Insurance Rate Map changerequests, review, & public notification; floodplain development review; floodplain variance processing; floodplainmodel & map services; floodplain information dissemination to public; hydrologic & hydraulic analysis & fieldinvestigation; creek crossing inspections; post-flood reconnaissance & damage documentation; Drainage CriteriaManual maintenance; drainage easement dedication & release review; regional floodplain management group support;RSMP funds management & funds appropriation, & facility planning & development; City/developer community facilitycontract development; Master Plan support; flood awareness public education & other public information
Bold/Italicized Measure = Key Indicator
2012-13 Proposed Budget, Austin, TX
362 | Volume I
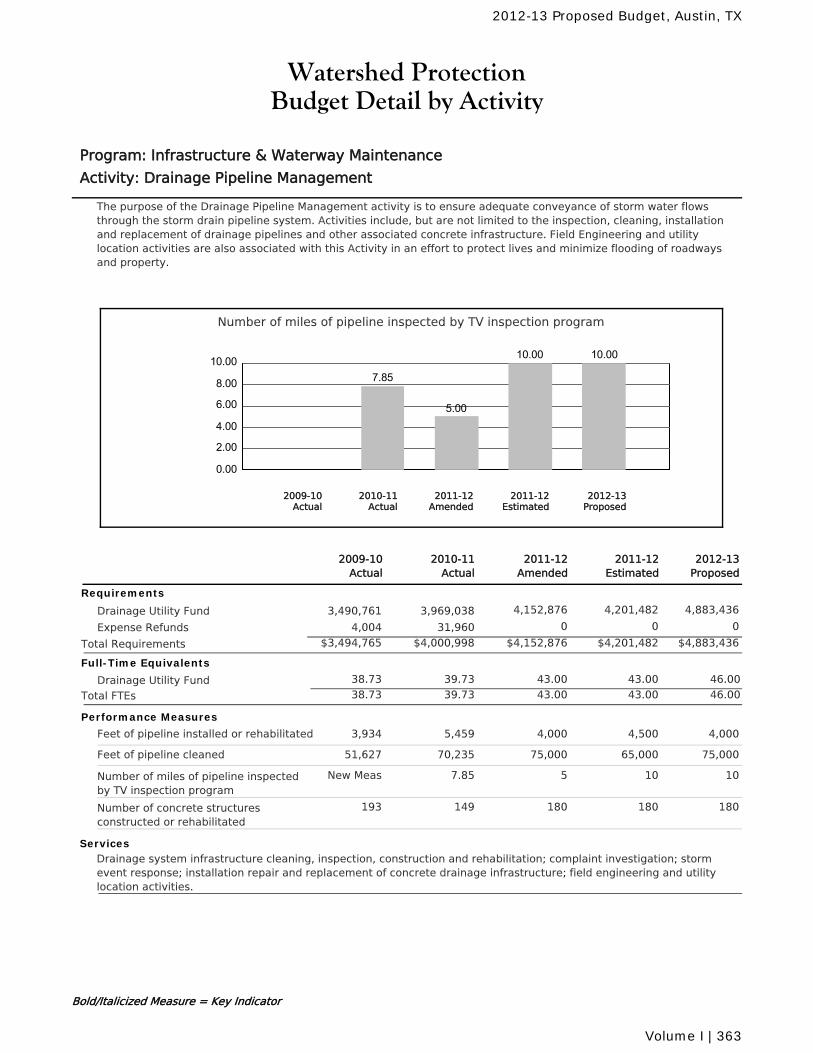
Watershed ProtectionBudget Detail by Activity
Program: Infrastructure & Waterway Maintenance
Activity: Drainage Pipeline Management
The purpose of the Drainage Pipeline Management activity is to ensure adequate conveyance of storm water flowsthrough the storm drain pipeline system. Activities include, but are not limited to the inspection, cleaning, installationand replacement of drainage pipelines and other associated concrete infrastructure. Field Engineering and utilitylocation activities are also associated with this Activity in an effort to protect lives and minimize flooding of roadwaysand property.
Number of miles of pipeline inspected by TV inspection program
0.00
2.00
4.00
6.00
8.00
10.007.85
5.00
10.00 10.00
2010-11Actual
2012-13Proposed
2011-12Amended
2011-12Estimated
2009-10Actual
2011-12Amended
2010-11Actual
2011-12Estimated
2012-13Proposed
2009-10Actual
Requirements
Drainage Utility Fund 4,152,876 4,201,482 4,883,4363,969,0383,490,761
Expense Refunds 0 0 031,9604,004
$4,152,876 $4,201,482 $4,883,436Total Requirements $4,000,998$3,494,765
Full-Time Equivalents
Drainage Utility Fund 39.73 43.00 43.00 46.0038.73
Total FTEs 39.73 43.00 43.00 46.0038.73
Performance Measures
Feet of pipeline installed or rehabilitated 4,0005,459 4,500 4,0003,934
Feet of pipeline cleaned 75,00070,235 65,000 75,00051,627
Number of miles of pipeline inspectedby TV inspection program
57.85 10 10New Meas
Number of concrete structuresconstructed or rehabilitated
180149 180 180193
ServicesDrainage system infrastructure cleaning, inspection, construction and rehabilitation; complaint investigation; stormevent response; installation repair and replacement of concrete drainage infrastructure; field engineering and utilitylocation activities.
Bold/Italicized Measure = Key Indicator
2012-13 Proposed Budget, Austin, TX
Volume I | 363
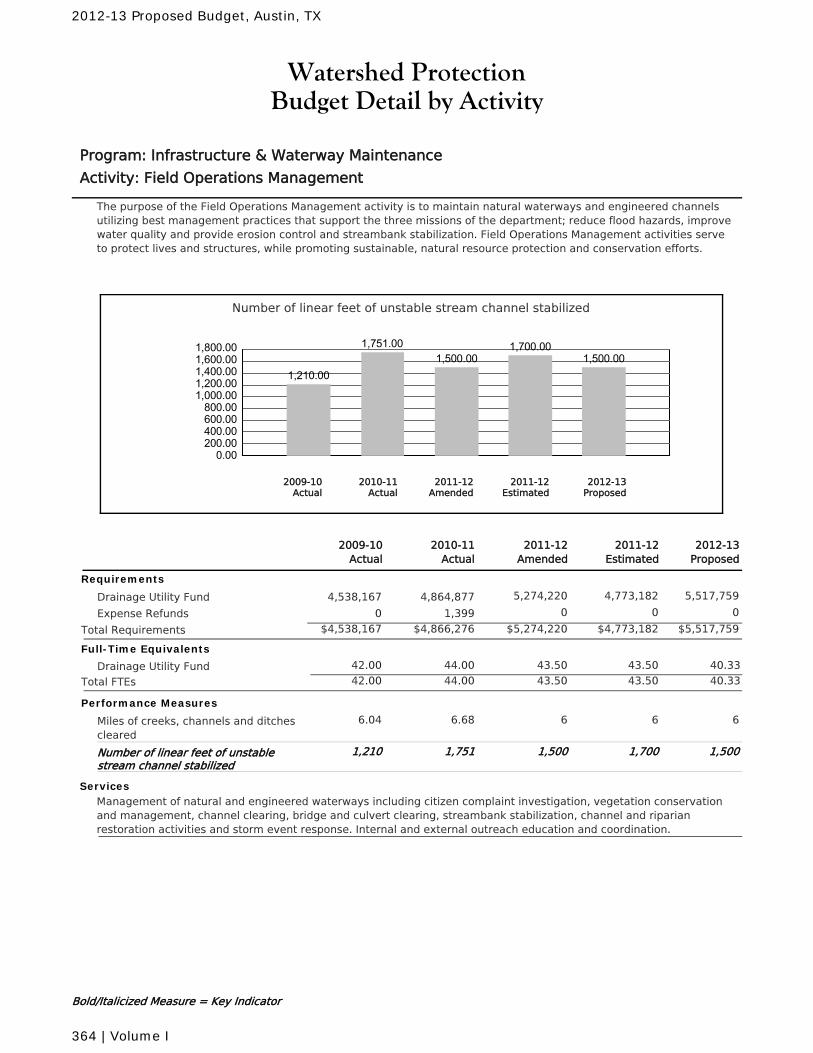
Watershed ProtectionBudget Detail by Activity
Program: Infrastructure & Waterway Maintenance
Activity: Field Operations Management
The purpose of the Field Operations Management activity is to maintain natural waterways and engineered channelsutilizing best management practices that support the three missions of the department; reduce flood hazards, improvewater quality and provide erosion control and streambank stabilization. Field Operations Management activities serveto protect lives and structures, while promoting sustainable, natural resource protection and conservation efforts.
Number of linear feet of unstable stream channel stabilized
0.00200.00400.00600.00800.00
1,000.001,200.001,400.001,600.001,800.00
1,210.00
1,751.001,500.00
1,700.001,500.00
2010-11Actual
2012-13Proposed
2011-12Amended
2011-12Estimated
2009-10Actual
2011-12Amended
2010-11Actual
2011-12Estimated
2012-13Proposed
2009-10Actual
Requirements
Drainage Utility Fund 5,274,220 4,773,182 5,517,7594,864,8774,538,167
Expense Refunds 0 0 01,3990
$5,274,220 $4,773,182 $5,517,759Total Requirements $4,866,276$4,538,167
Full-Time Equivalents
Drainage Utility Fund 44.00 43.50 43.50 40.3342.00
Total FTEs 44.00 43.50 43.50 40.3342.00
Performance Measures
Miles of creeks, channels and ditchescleared
66.68 6 66.04
Number of linear feet of unstablestream channel stabilized
1,5001,751 1,700 1,5001,210
ServicesManagement of natural and engineered waterways including citizen complaint investigation, vegetation conservationand management, channel clearing, bridge and culvert clearing, streambank stabilization, channel and riparianrestoration activities and storm event response. Internal and external outreach education and coordination.
Bold/Italicized Measure = Key Indicator
2012-13 Proposed Budget, Austin, TX
364 | Volume I
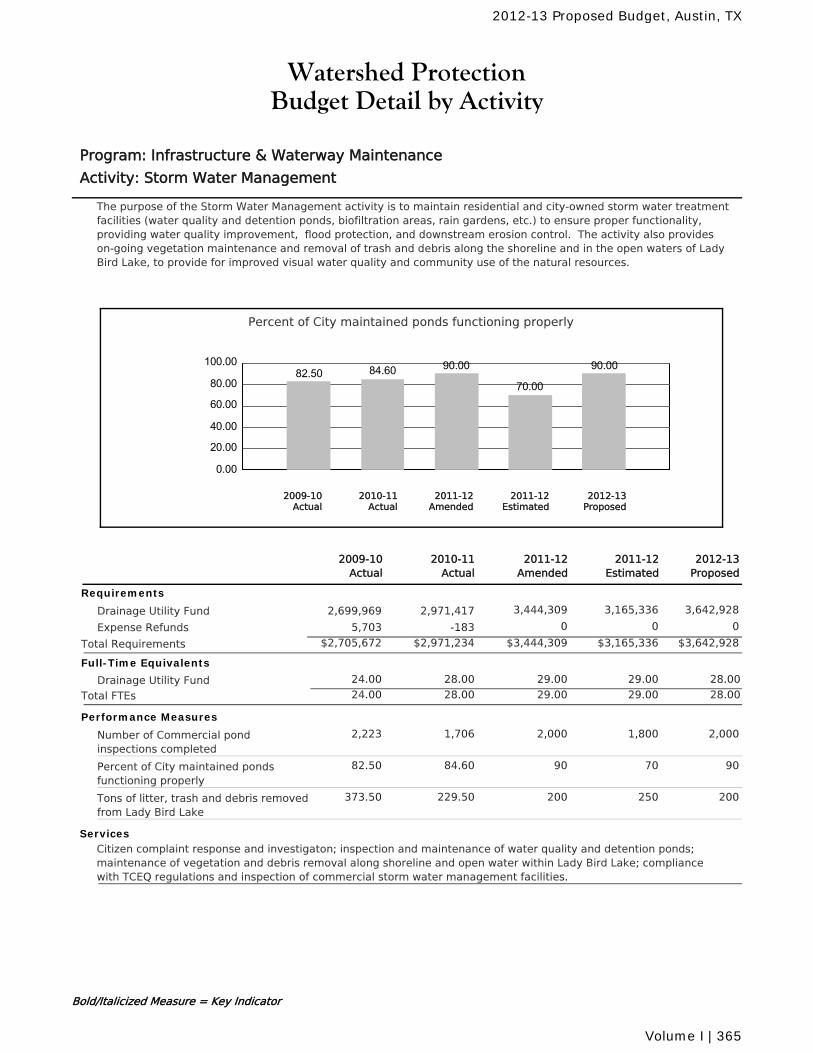
Watershed ProtectionBudget Detail by Activity
Program: Infrastructure & Waterway Maintenance
Activity: Storm Water Management
The purpose of the Storm Water Management activity is to maintain residential and city-owned storm water treatmentfacilities (water quality and detention ponds, biofiltration areas, rain gardens, etc.) to ensure proper functionality,providing water quality improvement, flood protection, and downstream erosion control. The activity also provideson-going vegetation maintenance and removal of trash and debris along the shoreline and in the open waters of LadyBird Lake, to provide for improved visual water quality and community use of the natural resources.
Percent of City maintained ponds functioning properly
0.00
20.00
40.00
60.00
80.00
100.0082.50 84.60 90.00
70.00
90.00
2010-11Actual
2012-13Proposed
2011-12Amended
2011-12Estimated
2009-10Actual
2011-12Amended
2010-11Actual
2011-12Estimated
2012-13Proposed
2009-10Actual
Requirements
Drainage Utility Fund 3,444,309 3,165,336 3,642,9282,971,4172,699,969
Expense Refunds 0 0 0-1835,703
$3,444,309 $3,165,336 $3,642,928Total Requirements $2,971,234$2,705,672
Full-Time Equivalents
Drainage Utility Fund 28.00 29.00 29.00 28.0024.00
Total FTEs 28.00 29.00 29.00 28.0024.00
Performance Measures
Number of Commercial pondinspections completed
2,0001,706 1,800 2,0002,223
Percent of City maintained pondsfunctioning properly
9084.60 70 9082.50
Tons of litter, trash and debris removedfrom Lady Bird Lake
200229.50 250 200373.50
ServicesCitizen complaint response and investigaton; inspection and maintenance of water quality and detention ponds;maintenance of vegetation and debris removal along shoreline and open water within Lady Bird Lake; compliancewith TCEQ regulations and inspection of commercial storm water management facilities.
Bold/Italicized Measure = Key Indicator
2012-13 Proposed Budget, Austin, TX
Volume I | 365
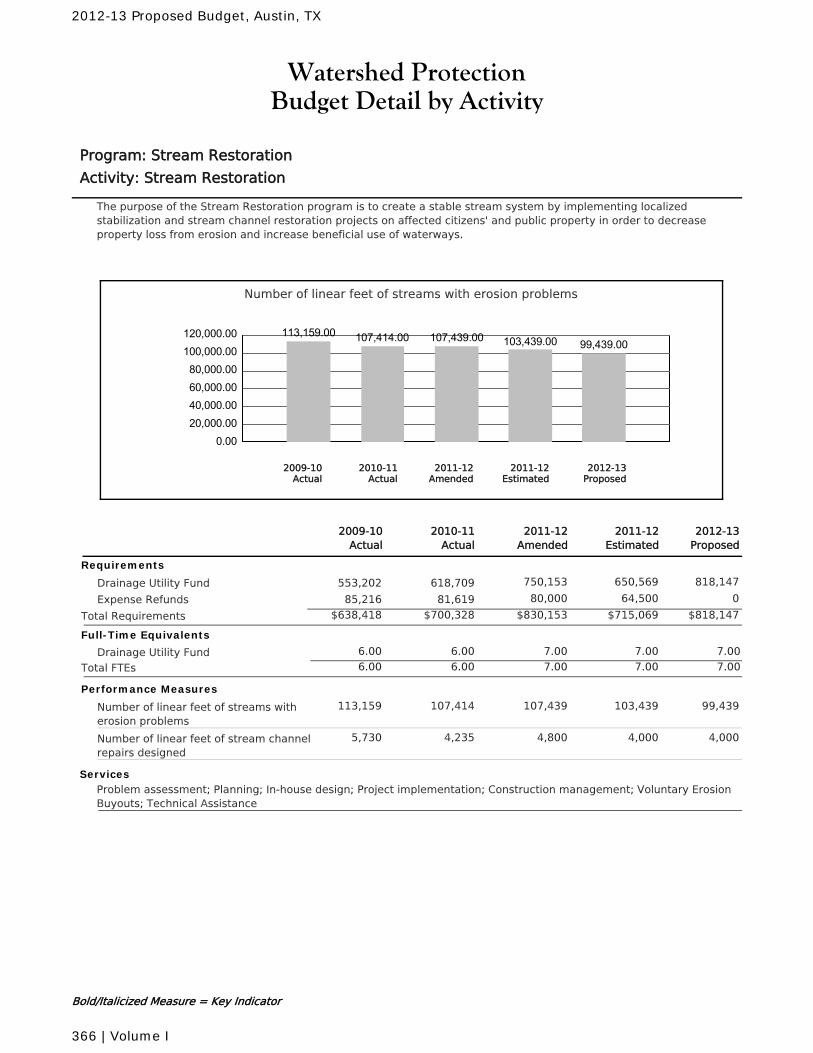
Watershed ProtectionBudget Detail by Activity
Program: Stream Restoration
Activity: Stream Restoration
The purpose of the Stream Restoration program is to create a stable stream system by implementing localizedstabilization and stream channel restoration projects on affected citizens' and public property in order to decreaseproperty loss from erosion and increase beneficial use of waterways.
Number of linear feet of streams with erosion problems
0.0020,000.0040,000.0060,000.0080,000.00
100,000.00120,000.00 113,159.00 107,414.00 107,439.00 103,439.00 99,439.00
2010-11Actual
2012-13Proposed
2011-12Amended
2011-12Estimated
2009-10Actual
2011-12Amended
2010-11Actual
2011-12Estimated
2012-13Proposed
2009-10Actual
Requirements
Drainage Utility Fund 750,153 650,569 818,147618,709553,202
Expense Refunds 80,000 64,500 081,61985,216
$830,153 $715,069 $818,147Total Requirements $700,328$638,418
Full-Time Equivalents
Drainage Utility Fund 6.00 7.00 7.00 7.006.00
Total FTEs 6.00 7.00 7.00 7.006.00
Performance Measures
Number of linear feet of streams witherosion problems
107,439107,414 103,439 99,439113,159
Number of linear feet of stream channelrepairs designed
4,8004,235 4,000 4,0005,730
ServicesProblem assessment; Planning; In-house design; Project implementation; Construction management; Voluntary ErosionBuyouts; Technical Assistance
Bold/Italicized Measure = Key Indicator
2012-13 Proposed Budget, Austin, TX
366 | Volume I
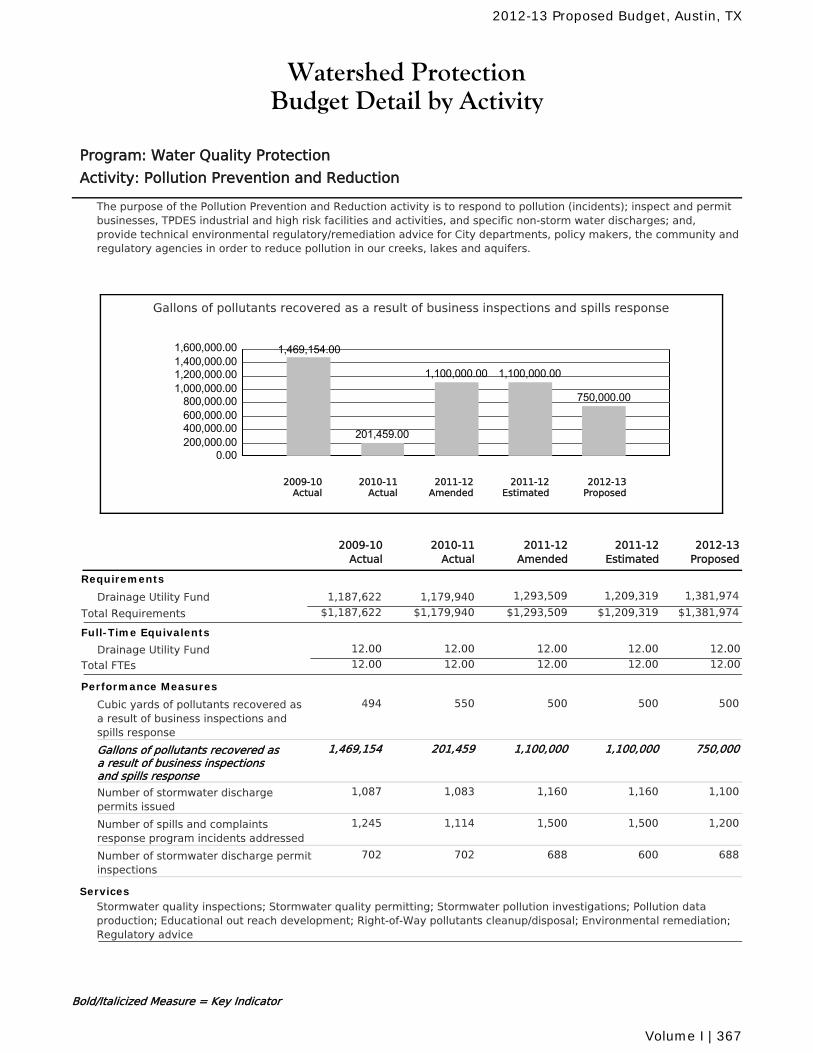
Watershed ProtectionBudget Detail by Activity
Program: Water Quality Protection
Activity: Pollution Prevention and Reduction
The purpose of the Pollution Prevention and Reduction activity is to respond to pollution (incidents); inspect and permitbusinesses, TPDES industrial and high risk facilities and activities, and specific non-storm water discharges; and,provide technical environmental regulatory/remediation advice for City departments, policy makers, the community andregulatory agencies in order to reduce pollution in our creeks, lakes and aquifers.
Gallons of pollutants recovered as a result of business inspections and spills response
0.00200,000.00400,000.00600,000.00800,000.00
1,000,000.001,200,000.001,400,000.001,600,000.00 1,469,154.00
201,459.00
1,100,000.00 1,100,000.00
750,000.00
2010-11Actual
2012-13Proposed
2011-12Amended
2011-12Estimated
2009-10Actual
2011-12Amended
2010-11Actual
2011-12Estimated
2012-13Proposed
2009-10Actual
Requirements
Drainage Utility Fund 1,293,509 1,209,319 1,381,9741,179,9401,187,622
$1,293,509 $1,209,319 $1,381,974Total Requirements $1,179,940$1,187,622
Full-Time Equivalents
Drainage Utility Fund 12.00 12.00 12.00 12.0012.00
Total FTEs 12.00 12.00 12.00 12.0012.00
Performance Measures
Cubic yards of pollutants recovered asa result of business inspections andspills response
500550 500 500494
Gallons of pollutants recovered asa result of business inspectionsand spills response
1,100,000201,459 1,100,000 750,0001,469,154
Number of stormwater dischargepermits issued
1,1601,083 1,160 1,1001,087
Number of spills and complaintsresponse program incidents addressed
1,5001,114 1,500 1,2001,245
Number of stormwater discharge permitinspections
688702 600 688702
ServicesStormwater quality inspections; Stormwater quality permitting; Stormwater pollution investigations; Pollution dataproduction; Educational out reach development; Right-of-Way pollutants cleanup/disposal; Environmental remediation;Regulatory advice
Bold/Italicized Measure = Key Indicator
2012-13 Proposed Budget, Austin, TX
Volume I | 367

Watershed ProtectionBudget Detail by Activity
Program: Water Quality Protection
Activity: Stormwater Treatment
The purpose of the Stormwater Treatment activity is to design, implement, and evaluate stormwater treatment systemsin order to reduce pollution in our creeks, lakes and aquifers.
Tons of total suspended solids (TSS) removed annually in drainage areas withpublicly-funded structural water quality controls (tons per year)
0.00100.00200.00300.00400.00500.00600.00700.00800.00
690.00 719.00 725.00 719.00 750.00
2010-11Actual
2012-13Proposed
2011-12Amended
2011-12Estimated
2009-10Actual
2011-12Amended
2010-11Actual
2011-12Estimated
2012-13Proposed
2009-10Actual
Requirements
Drainage Utility Fund 583,640 531,504 582,072545,491545,957
Expense Refunds 0 10,000 000
$583,640 $541,504 $582,072Total Requirements $545,491$545,957
Full-Time Equivalents
Drainage Utility Fund 4.75 5.00 5.00 5.004.75
Total FTEs 4.75 5.00 5.00 5.004.75
Performance Measures
Annual cost per pound of TSS removed 0.650.60 0.61 0.610.57
Tons of total suspended solids (TSS)removed annually in drainage areaswith publicly-funded structural waterquality controls (tons per year)
725719 719 750690
ServicesEngineering design; Project management; Project prioritization; Criteria development; Stormwater control evaluation
Bold/Italicized Measure = Key Indicator
2012-13 Proposed Budget, Austin, TX
368 | Volume I
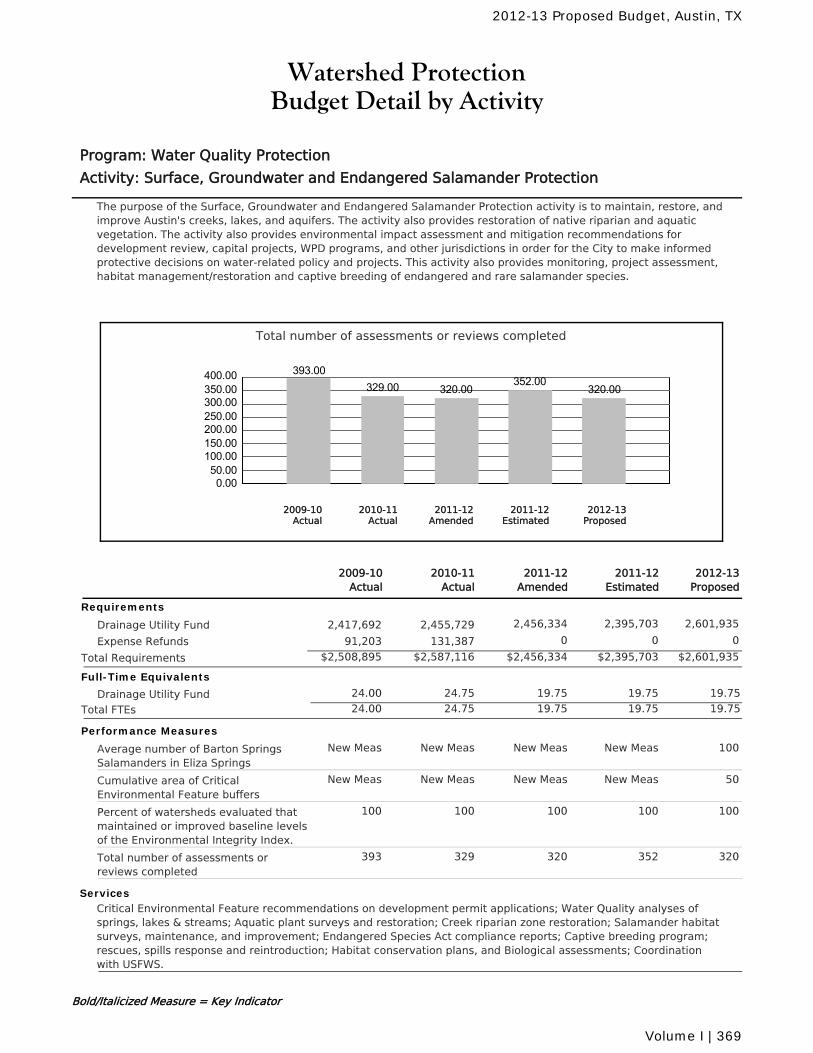
Watershed ProtectionBudget Detail by Activity
Program: Water Quality Protection
Activity: Surface, Groundwater and Endangered Salamander Protection
The purpose of the Surface, Groundwater and Endangered Salamander Protection activity is to maintain, restore, andimprove Austin's creeks, lakes, and aquifers. The activity also provides restoration of native riparian and aquaticvegetation. The activity also provides environmental impact assessment and mitigation recommendations fordevelopment review, capital projects, WPD programs, and other jurisdictions in order for the City to make informedprotective decisions on water-related policy and projects. This activity also provides monitoring, project assessment,habitat management/restoration and captive breeding of endangered and rare salamander species.
Total number of assessments or reviews completed
0.0050.00
100.00150.00200.00250.00300.00350.00400.00 393.00
329.00 320.00352.00
320.00
2010-11Actual
2012-13Proposed
2011-12Amended
2011-12Estimated
2009-10Actual
2011-12Amended
2010-11Actual
2011-12Estimated
2012-13Proposed
2009-10Actual
Requirements
Drainage Utility Fund 2,456,334 2,395,703 2,601,9352,455,7292,417,692
Expense Refunds 0 0 0131,38791,203
$2,456,334 $2,395,703 $2,601,935Total Requirements $2,587,116$2,508,895
Full-Time Equivalents
Drainage Utility Fund 24.75 19.75 19.75 19.7524.00
Total FTEs 24.75 19.75 19.75 19.7524.00
Performance Measures
Average number of Barton SpringsSalamanders in Eliza Springs
New MeasNew Meas New Meas 100New Meas
Cumulative area of CriticalEnvironmental Feature buffers
New MeasNew Meas New Meas 50New Meas
Percent of watersheds evaluated thatmaintained or improved baseline levelsof the Environmental Integrity Index.
100100 100 100100
Total number of assessments orreviews completed
320329 352 320393
ServicesCritical Environmental Feature recommendations on development permit applications; Water Quality analyses ofsprings, lakes & streams; Aquatic plant surveys and restoration; Creek riparian zone restoration; Salamander habitatsurveys, maintenance, and improvement; Endangered Species Act compliance reports; Captive breeding program;rescues, spills response and reintroduction; Habitat conservation plans, and Biological assessments; Coordinationwith USFWS.
Bold/Italicized Measure = Key Indicator
2012-13 Proposed Budget, Austin, TX
Volume I | 369
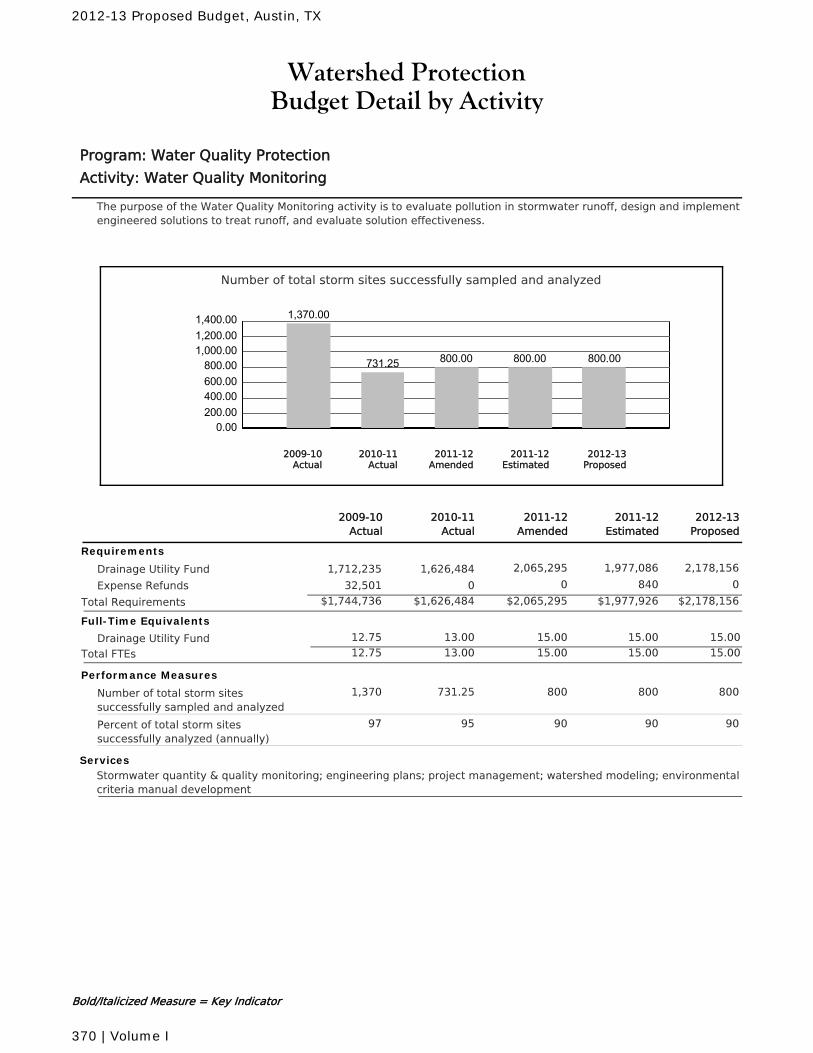
Watershed ProtectionBudget Detail by Activity
Program: Water Quality Protection
Activity: Water Quality Monitoring
The purpose of the Water Quality Monitoring activity is to evaluate pollution in stormwater runoff, design and implementengineered solutions to treat runoff, and evaluate solution effectiveness.
Number of total storm sites successfully sampled and analyzed
0.00200.00400.00600.00800.00
1,000.001,200.001,400.00 1,370.00
731.25 800.00 800.00 800.00
2010-11Actual
2012-13Proposed
2011-12Amended
2011-12Estimated
2009-10Actual
2011-12Amended
2010-11Actual
2011-12Estimated
2012-13Proposed
2009-10Actual
Requirements
Drainage Utility Fund 2,065,295 1,977,086 2,178,1561,626,4841,712,235
Expense Refunds 0 840 0032,501
$2,065,295 $1,977,926 $2,178,156Total Requirements $1,626,484$1,744,736
Full-Time Equivalents
Drainage Utility Fund 13.00 15.00 15.00 15.0012.75
Total FTEs 13.00 15.00 15.00 15.0012.75
Performance Measures
Number of total storm sitessuccessfully sampled and analyzed
800731.25 800 8001,370
Percent of total storm sitessuccessfully analyzed (annually)
9095 90 9097
ServicesStormwater quantity & quality monitoring; engineering plans; project management; watershed modeling; environmentalcriteria manual development
Bold/Italicized Measure = Key Indicator
2012-13 Proposed Budget, Austin, TX
370 | Volume I
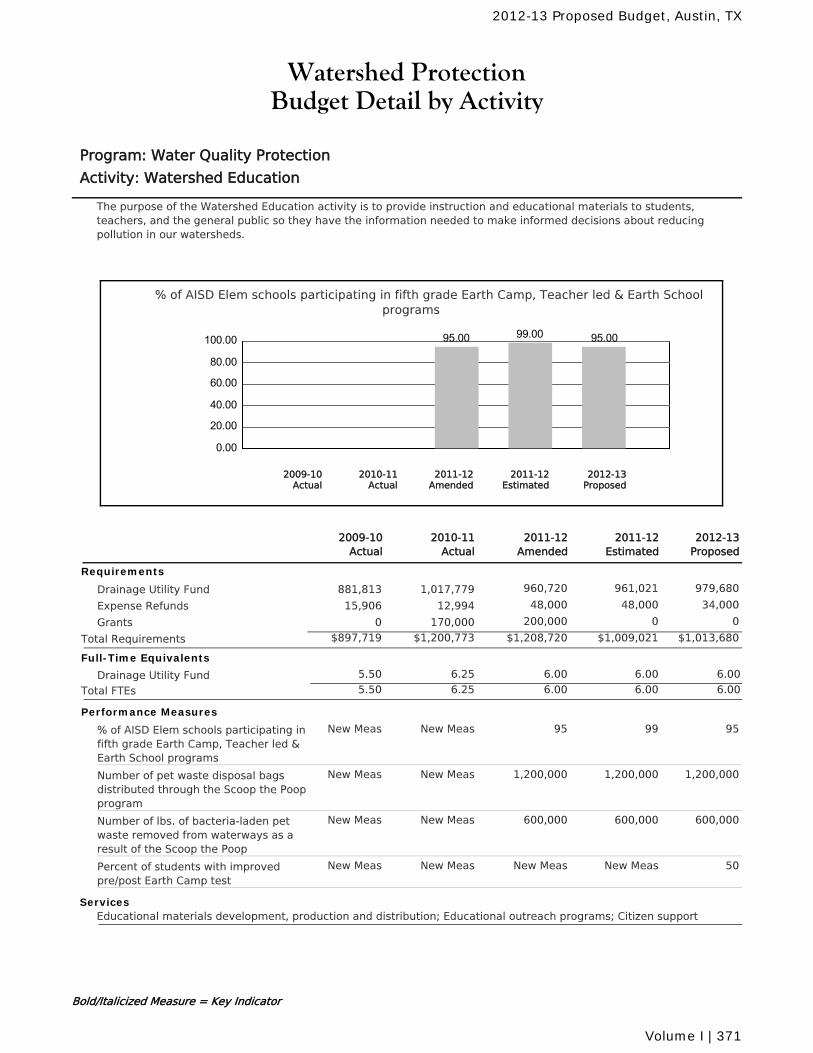
Watershed ProtectionBudget Detail by Activity
Program: Water Quality Protection
Activity: Watershed Education
The purpose of the Watershed Education activity is to provide instruction and educational materials to students,teachers, and the general public so they have the information needed to make informed decisions about reducingpollution in our watersheds.
% of AISD Elem schools participating in fifth grade Earth Camp, Teacher led & Earth Schoolprograms
0.00
20.00
40.00
60.00
80.00
100.00 95.00 99.00 95.00
2010-11Actual
2012-13Proposed
2011-12Amended
2011-12Estimated
2009-10Actual
2011-12Amended
2010-11Actual
2011-12Estimated
2012-13Proposed
2009-10Actual
Requirements
Drainage Utility Fund 960,720 961,021 979,6801,017,779881,813
Expense Refunds 48,000 48,000 34,00012,99415,906
Grants 200,000 0 0170,0000
$1,208,720 $1,009,021 $1,013,680Total Requirements $1,200,773$897,719
Full-Time Equivalents
Drainage Utility Fund 6.25 6.00 6.00 6.005.50
Total FTEs 6.25 6.00 6.00 6.005.50
Performance Measures
% of AISD Elem schools participating infifth grade Earth Camp, Teacher led &Earth School programs
95New Meas 99 95New Meas
Number of pet waste disposal bagsdistributed through the Scoop the Poopprogram
1,200,000New Meas 1,200,000 1,200,000New Meas
Number of lbs. of bacteria-laden petwaste removed from waterways as aresult of the Scoop the Poop
600,000New Meas 600,000 600,000New Meas
Percent of students with improvedpre/post Earth Camp test
New MeasNew Meas New Meas 50New Meas
ServicesEducational materials development, production and distribution; Educational outreach programs; Citizen support
Bold/Italicized Measure = Key Indicator
2012-13 Proposed Budget, Austin, TX
Volume I | 371
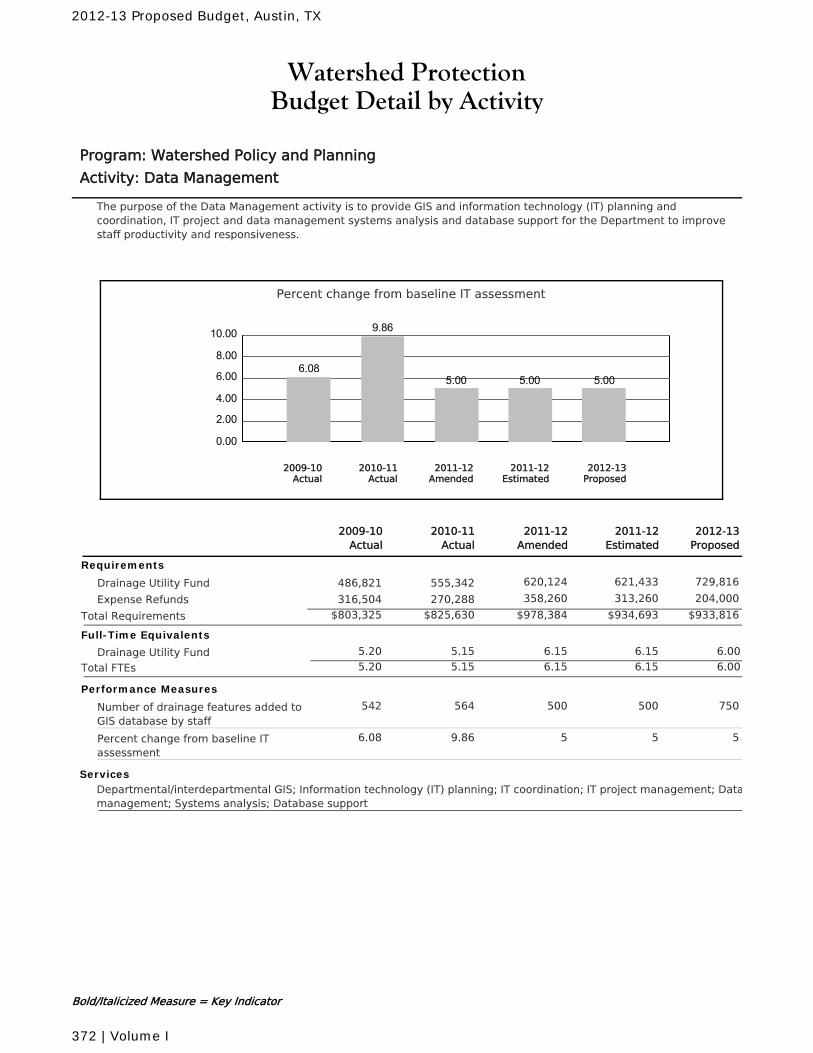
Watershed ProtectionBudget Detail by Activity
Program: Watershed Policy and Planning
Activity: Data Management
The purpose of the Data Management activity is to provide GIS and information technology (IT) planning andcoordination, IT project and data management systems analysis and database support for the Department to improvestaff productivity and responsiveness.
Percent change from baseline IT assessment
0.00
2.00
4.00
6.00
8.00
10.00
6.08
9.86
5.00 5.00 5.00
2010-11Actual
2012-13Proposed
2011-12Amended
2011-12Estimated
2009-10Actual
2011-12Amended
2010-11Actual
2011-12Estimated
2012-13Proposed
2009-10Actual
Requirements
Drainage Utility Fund 620,124 621,433 729,816555,342486,821
Expense Refunds 358,260 313,260 204,000270,288316,504
$978,384 $934,693 $933,816Total Requirements $825,630$803,325
Full-Time Equivalents
Drainage Utility Fund 5.15 6.15 6.15 6.005.20
Total FTEs 5.15 6.15 6.15 6.005.20
Performance Measures
Number of drainage features added toGIS database by staff
500564 500 750542
Percent change from baseline ITassessment
59.86 5 56.08
ServicesDepartmental/interdepartmental GIS; Information technology (IT) planning; IT coordination; IT project management; Datamanagement; Systems analysis; Database support
Bold/Italicized Measure = Key Indicator
2012-13 Proposed Budget, Austin, TX
372 | Volume I
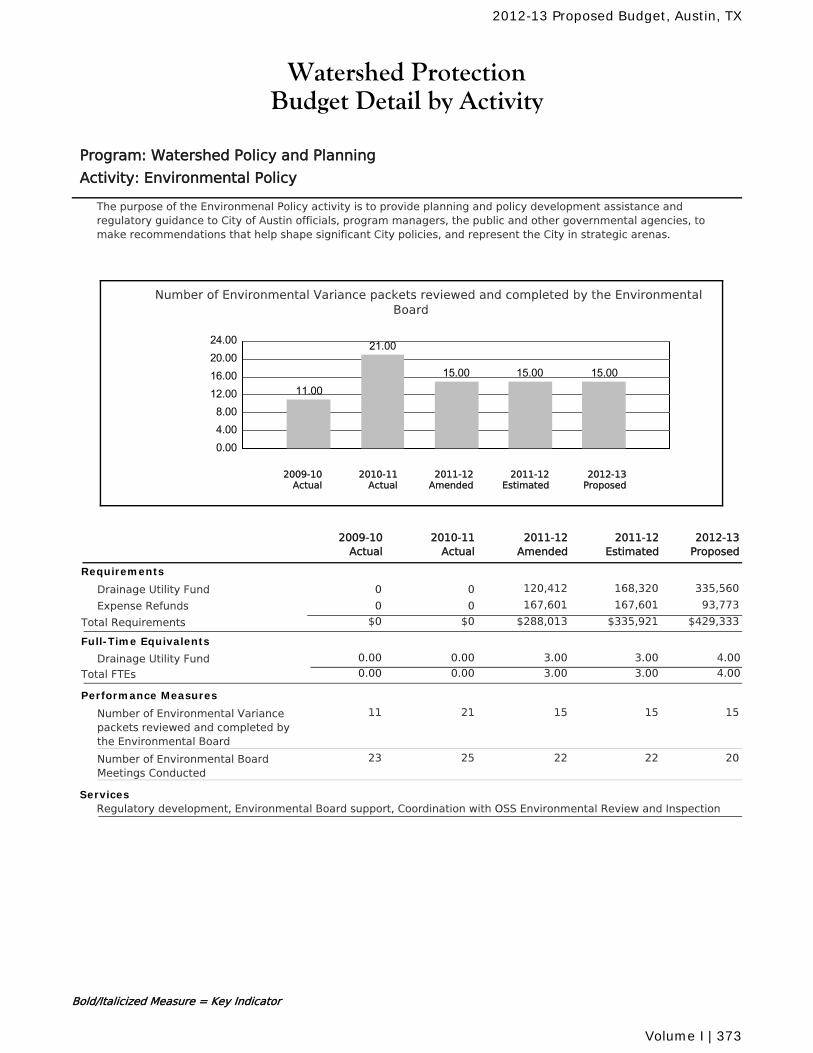
Watershed ProtectionBudget Detail by Activity
Program: Watershed Policy and Planning
Activity: Environmental Policy
The purpose of the Environmenal Policy activity is to provide planning and policy development assistance andregulatory guidance to City of Austin officials, program managers, the public and other governmental agencies, tomake recommendations that help shape significant City policies, and represent the City in strategic arenas.
Number of Environmental Variance packets reviewed and completed by the EnvironmentalBoard
0.004.008.00
12.0016.0020.0024.00
11.00
21.00
15.00 15.00 15.00
2010-11Actual
2012-13Proposed
2011-12Amended
2011-12Estimated
2009-10Actual
2011-12Amended
2010-11Actual
2011-12Estimated
2012-13Proposed
2009-10Actual
Requirements
Drainage Utility Fund 120,412 168,320 335,56000
Expense Refunds 167,601 167,601 93,77300
$288,013 $335,921 $429,333Total Requirements $0$0
Full-Time Equivalents
Drainage Utility Fund 0.00 3.00 3.00 4.000.00
Total FTEs 0.00 3.00 3.00 4.000.00
Performance Measures
Number of Environmental Variancepackets reviewed and completed bythe Environmental Board
1521 15 1511
Number of Environmental BoardMeetings Conducted
2225 22 2023
ServicesRegulatory development, Environmental Board support, Coordination with OSS Environmental Review and Inspection
Bold/Italicized Measure = Key Indicator
2012-13 Proposed Budget, Austin, TX
Volume I | 373
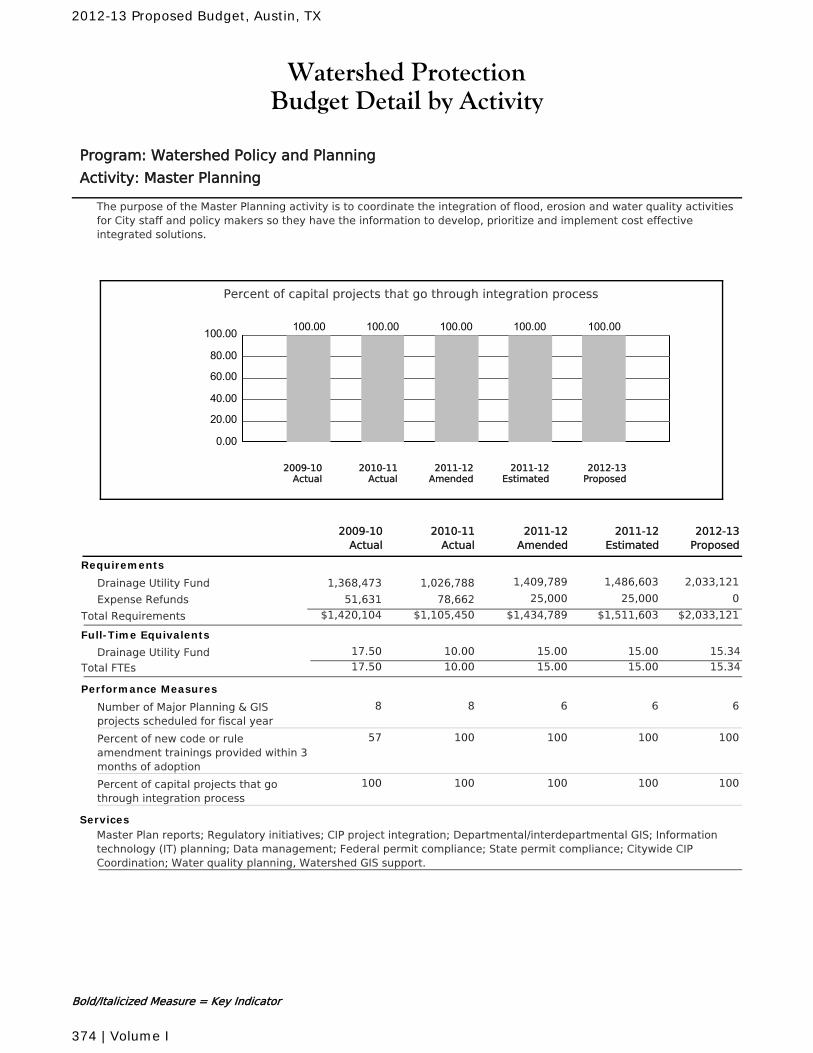
Watershed ProtectionBudget Detail by Activity
Program: Watershed Policy and Planning
Activity: Master Planning
The purpose of the Master Planning activity is to coordinate the integration of flood, erosion and water quality activitiesfor City staff and policy makers so they have the information to develop, prioritize and implement cost effectiveintegrated solutions.
Percent of capital projects that go through integration process
0.00
20.00
40.00
60.00
80.00
100.00 100.00 100.00 100.00 100.00 100.00
2010-11Actual
2012-13Proposed
2011-12Amended
2011-12Estimated
2009-10Actual
2011-12Amended
2010-11Actual
2011-12Estimated
2012-13Proposed
2009-10Actual
Requirements
Drainage Utility Fund 1,409,789 1,486,603 2,033,1211,026,7881,368,473
Expense Refunds 25,000 25,000 078,66251,631
$1,434,789 $1,511,603 $2,033,121Total Requirements $1,105,450$1,420,104
Full-Time Equivalents
Drainage Utility Fund 10.00 15.00 15.00 15.3417.50
Total FTEs 10.00 15.00 15.00 15.3417.50
Performance Measures
Number of Major Planning & GISprojects scheduled for fiscal year
68 6 68
Percent of new code or ruleamendment trainings provided within 3months of adoption
100100 100 10057
Percent of capital projects that gothrough integration process
100100 100 100100
ServicesMaster Plan reports; Regulatory initiatives; CIP project integration; Departmental/interdepartmental GIS; Informationtechnology (IT) planning; Data management; Federal permit compliance; State permit compliance; Citywide CIPCoordination; Water quality planning, Watershed GIS support.
Bold/Italicized Measure = Key Indicator
2012-13 Proposed Budget, Austin, TX
374 | Volume I
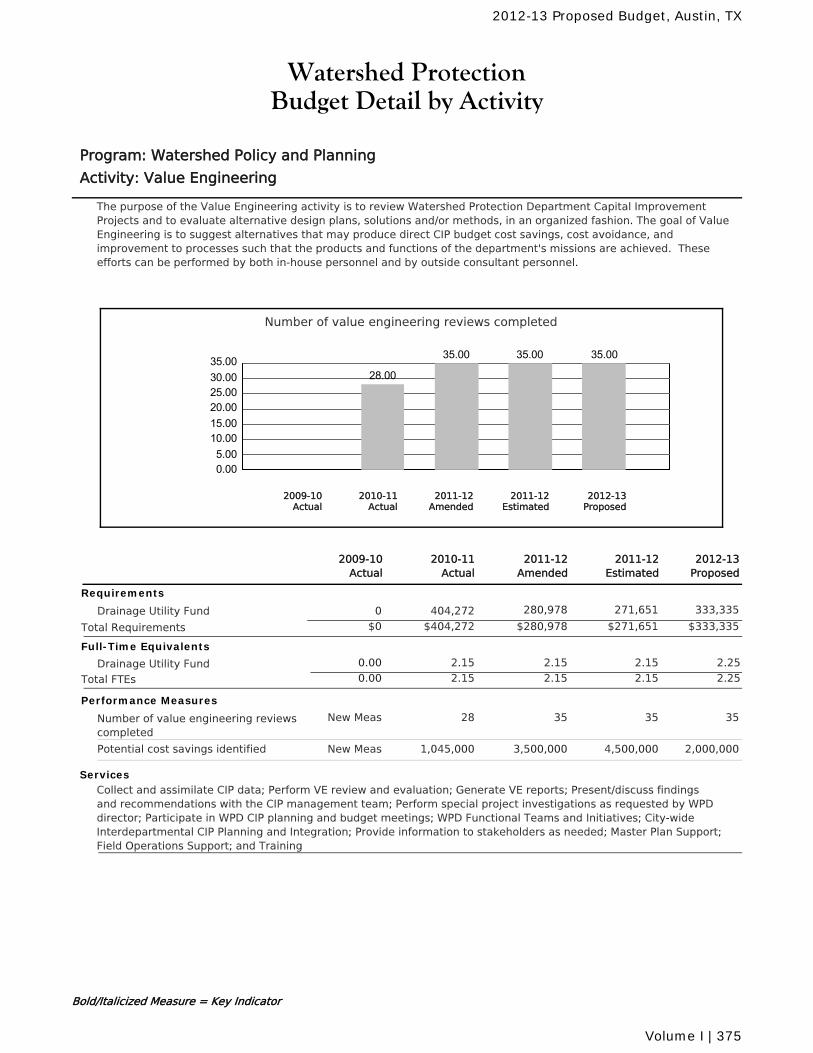
Watershed ProtectionBudget Detail by Activity
Program: Watershed Policy and Planning
Activity: Value Engineering
The purpose of the Value Engineering activity is to review Watershed Protection Department Capital ImprovementProjects and to evaluate alternative design plans, solutions and/or methods, in an organized fashion. The goal of ValueEngineering is to suggest alternatives that may produce direct CIP budget cost savings, cost avoidance, andimprovement to processes such that the products and functions of the department's missions are achieved. Theseefforts can be performed by both in-house personnel and by outside consultant personnel.
Number of value engineering reviews completed
0.005.00
10.0015.0020.0025.0030.0035.00
28.00
35.00 35.00 35.00
2010-11Actual
2012-13Proposed
2011-12Amended
2011-12Estimated
2009-10Actual
2011-12Amended
2010-11Actual
2011-12Estimated
2012-13Proposed
2009-10Actual
Requirements
Drainage Utility Fund 280,978 271,651 333,335404,2720
$280,978 $271,651 $333,335Total Requirements $404,272$0
Full-Time Equivalents
Drainage Utility Fund 2.15 2.15 2.15 2.250.00
Total FTEs 2.15 2.15 2.15 2.250.00
Performance Measures
Number of value engineering reviewscompleted
3528 35 35New Meas
Potential cost savings identified 3,500,0001,045,000 4,500,000 2,000,000New Meas
ServicesCollect and assimilate CIP data; Perform VE review and evaluation; Generate VE reports; Present/discuss findingsand recommendations with the CIP management team; Perform special project investigations as requested by WPDdirector; Participate in WPD CIP planning and budget meetings; WPD Functional Teams and Initiatives; City-wideInterdepartmental CIP Planning and Integration; Provide information to stakeholders as needed; Master Plan Support;Field Operations Support; and Training
Bold/Italicized Measure = Key Indicator
2012-13 Proposed Budget, Austin, TX
Volume I | 375
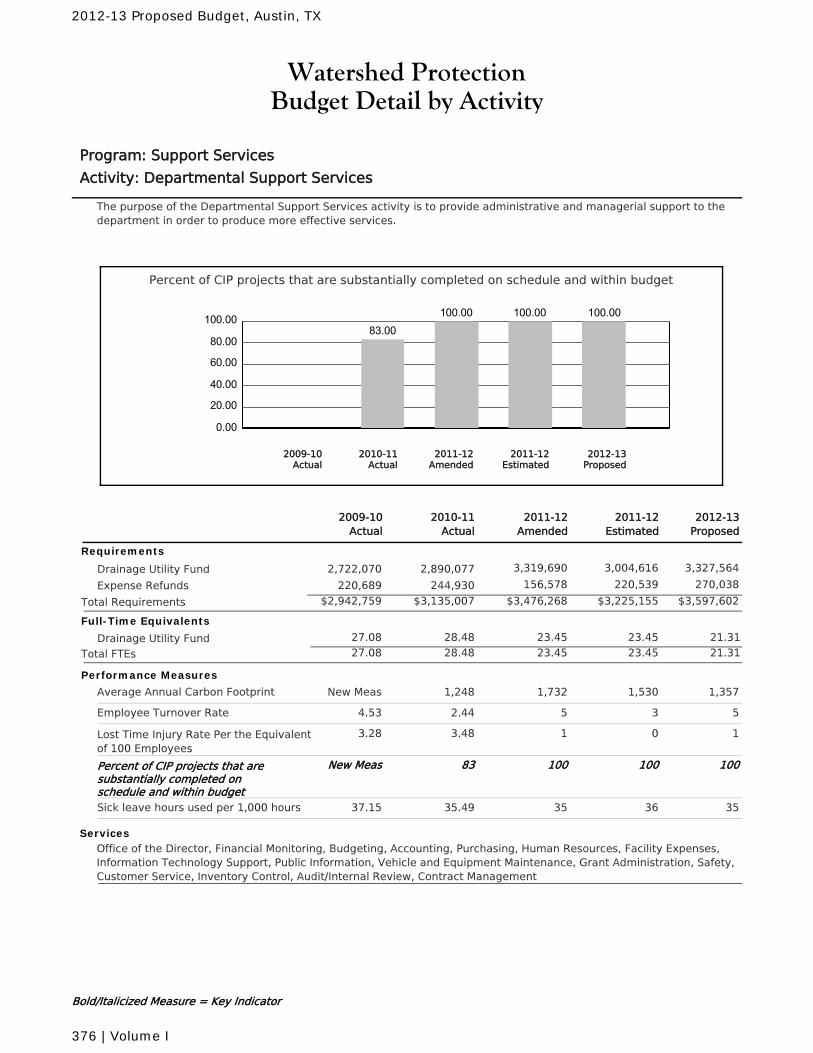
Watershed ProtectionBudget Detail by Activity
Program: Support Services
Activity: Departmental Support Services
The purpose of the Departmental Support Services activity is to provide administrative and managerial support to thedepartment in order to produce more effective services.
Percent of CIP projects that are substantially completed on schedule and within budget
0.00
20.00
40.00
60.00
80.00
100.0083.00
100.00 100.00 100.00
2010-11Actual
2012-13Proposed
2011-12Amended
2011-12Estimated
2009-10Actual
2011-12Amended
2010-11Actual
2011-12Estimated
2012-13Proposed
2009-10Actual
Requirements
Drainage Utility Fund 3,319,690 3,004,616 3,327,5642,890,0772,722,070
Expense Refunds 156,578 220,539 270,038244,930220,689
$3,476,268 $3,225,155 $3,597,602Total Requirements $3,135,007$2,942,759
Full-Time Equivalents
Drainage Utility Fund 28.48 23.45 23.45 21.3127.08
Total FTEs 28.48 23.45 23.45 21.3127.08
Performance Measures
Average Annual Carbon Footprint 1,7321,248 1,530 1,357New Meas
Employee Turnover Rate 52.44 3 54.53
Lost Time Injury Rate Per the Equivalentof 100 Employees
13.48 0 13.28
Percent of CIP projects that aresubstantially completed onschedule and within budget
10083 100 100New Meas
Sick leave hours used per 1,000 hours 3535.49 36 3537.15
ServicesOffice of the Director, Financial Monitoring, Budgeting, Accounting, Purchasing, Human Resources, Facility Expenses,Information Technology Support, Public Information, Vehicle and Equipment Maintenance, Grant Administration, Safety,Customer Service, Inventory Control, Audit/Internal Review, Contract Management
Bold/Italicized Measure = Key Indicator
2012-13 Proposed Budget, Austin, TX
376 | Volume I
Watershed ProtectionBudget Detail by Activity
Program: Transfers & Other Requirements
Activity: All Activities
The purpose of the Transfers & Other Requirements program is to account for transfers and other departmentalrequirements at the fund or agency level.
Graph Not Applicable
2011-12Amended
2010-11Actual
2011-12Estimated
2012-13Proposed
2009-10Actual
Requirements
Drainage Utility Fund 33,174,823 32,856,717 35,107,32235,782,09731,655,170
$33,174,823 $32,856,717 $35,107,322Total Requirements $35,782,097$31,655,170
Bold/Italicized Measure = Key Indicator
2012-13 Proposed Budget, Austin, TX
Volume I | 377
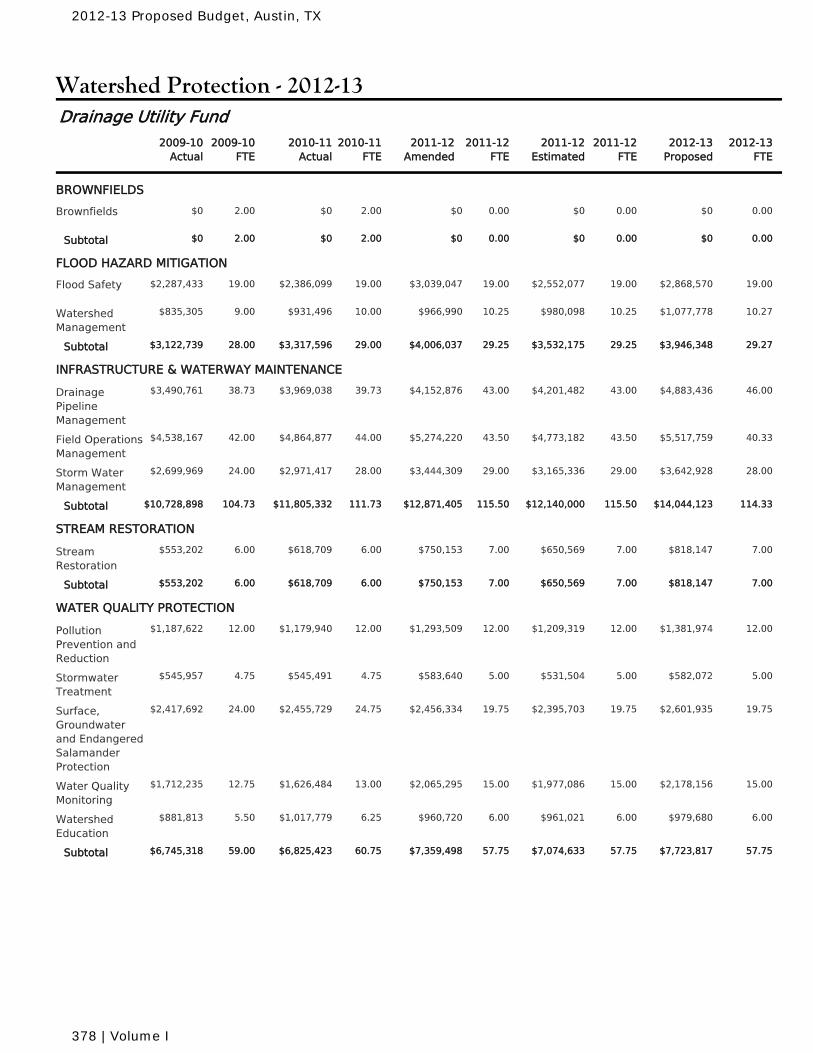
Watershed Protection - 2012-13
2010-11Actual
2010-11FTE
2011-12Amended
2011-12FTE
2011-12Estimated
2011-12FTE
2009-10Actual
2009-10FTE
2012-13Proposed
2012-13FTE
Drainage Utility Fund
BROWNFIELDS
$0 2.00 $0 0.00 $0 0.00Brownfields 2.00 $0 0.00$0
$0 2.00 $0 0.00 $0 0.00Subtotal 2.00 $0 0.00$0
FLOOD HAZARD MITIGATION
$2,386,099 19.00 $3,039,047 19.00 $2,552,077 19.00Flood Safety 19.00 $2,868,570 19.00$2,287,433
$931,496 10.00 $966,990 10.25 $980,098 10.25WatershedManagement
9.00 $1,077,778 10.27$835,305
$3,317,596 29.00 $4,006,037 29.25 $3,532,175 29.25Subtotal 28.00 $3,946,348 29.27$3,122,739
INFRASTRUCTURE & WATERWAY MAINTENANCE
$3,969,038 39.73 $4,152,876 43.00 $4,201,482 43.00DrainagePipelineManagement
38.73 $4,883,436 46.00$3,490,761
$4,864,877 44.00 $5,274,220 43.50 $4,773,182 43.50Field OperationsManagement
42.00 $5,517,759 40.33$4,538,167
$2,971,417 28.00 $3,444,309 29.00 $3,165,336 29.00Storm WaterManagement
24.00 $3,642,928 28.00$2,699,969
$11,805,332 111.73 $12,871,405 115.50 $12,140,000 115.50Subtotal 104.73 $14,044,123 114.33$10,728,898
STREAM RESTORATION
$618,709 6.00 $750,153 7.00 $650,569 7.00StreamRestoration
6.00 $818,147 7.00$553,202
$618,709 6.00 $750,153 7.00 $650,569 7.00Subtotal 6.00 $818,147 7.00$553,202
WATER QUALITY PROTECTION
$1,179,940 12.00 $1,293,509 12.00 $1,209,319 12.00PollutionPrevention andReduction
12.00 $1,381,974 12.00$1,187,622
$545,491 4.75 $583,640 5.00 $531,504 5.00StormwaterTreatment
4.75 $582,072 5.00$545,957
$2,455,729 24.75 $2,456,334 19.75 $2,395,703 19.75Surface,Groundwaterand EndangeredSalamanderProtection
24.00 $2,601,935 19.75$2,417,692
$1,626,484 13.00 $2,065,295 15.00 $1,977,086 15.00Water QualityMonitoring
12.75 $2,178,156 15.00$1,712,235
$1,017,779 6.25 $960,720 6.00 $961,021 6.00WatershedEducation
5.50 $979,680 6.00$881,813
$6,825,423 60.75 $7,359,498 57.75 $7,074,633 57.75Subtotal 59.00 $7,723,817 57.75$6,745,318
2012-13 Proposed Budget, Austin, TX
378 | Volume I
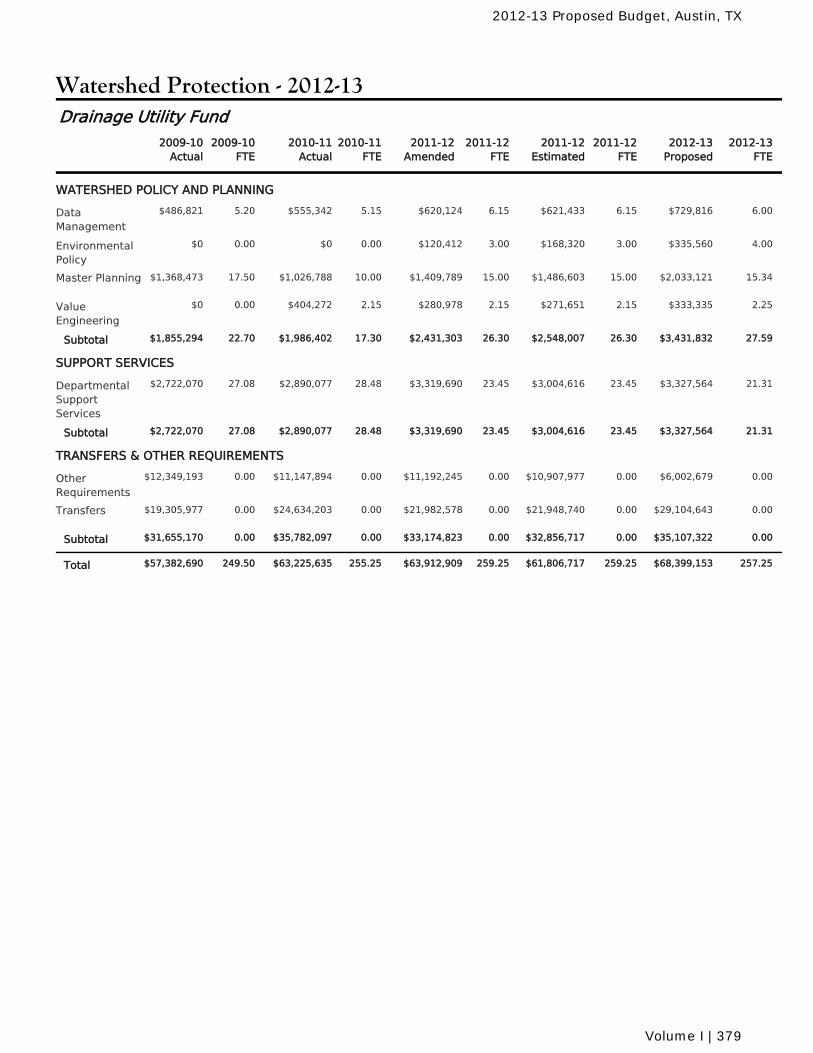
Watershed Protection - 2012-13
2010-11Actual
2010-11FTE
2011-12Amended
2011-12FTE
2011-12Estimated
2011-12FTE
2009-10Actual
2009-10FTE
2012-13Proposed
2012-13FTE
Drainage Utility Fund
WATERSHED POLICY AND PLANNING
$555,342 5.15 $620,124 6.15 $621,433 6.15DataManagement
5.20 $729,816 6.00$486,821
$0 0.00 $120,412 3.00 $168,320 3.00EnvironmentalPolicy
0.00 $335,560 4.00$0
$1,026,788 10.00 $1,409,789 15.00 $1,486,603 15.00Master Planning 17.50 $2,033,121 15.34$1,368,473
$404,272 2.15 $280,978 2.15 $271,651 2.15ValueEngineering
0.00 $333,335 2.25$0
$1,986,402 17.30 $2,431,303 26.30 $2,548,007 26.30Subtotal 22.70 $3,431,832 27.59$1,855,294
SUPPORT SERVICES
$2,890,077 28.48 $3,319,690 23.45 $3,004,616 23.45DepartmentalSupportServices
27.08 $3,327,564 21.31$2,722,070
$2,890,077 28.48 $3,319,690 23.45 $3,004,616 23.45Subtotal 27.08 $3,327,564 21.31$2,722,070
TRANSFERS & OTHER REQUIREMENTS
$11,147,894 0.00 $11,192,245 0.00 $10,907,977 0.00OtherRequirements
0.00 $6,002,679 0.00$12,349,193
$24,634,203 0.00 $21,982,578 0.00 $21,948,740 0.00Transfers 0.00 $29,104,643 0.00$19,305,977
$35,782,097 0.00 $33,174,823 0.00 $32,856,717 0.00Subtotal 0.00 $35,107,322 0.00$31,655,170
$63,225,635 255.25 $63,912,909 259.25 $61,806,717 259.25Total 249.50 $68,399,153 257.25$57,382,690
2012-13 Proposed Budget, Austin, TX
Volume I | 379
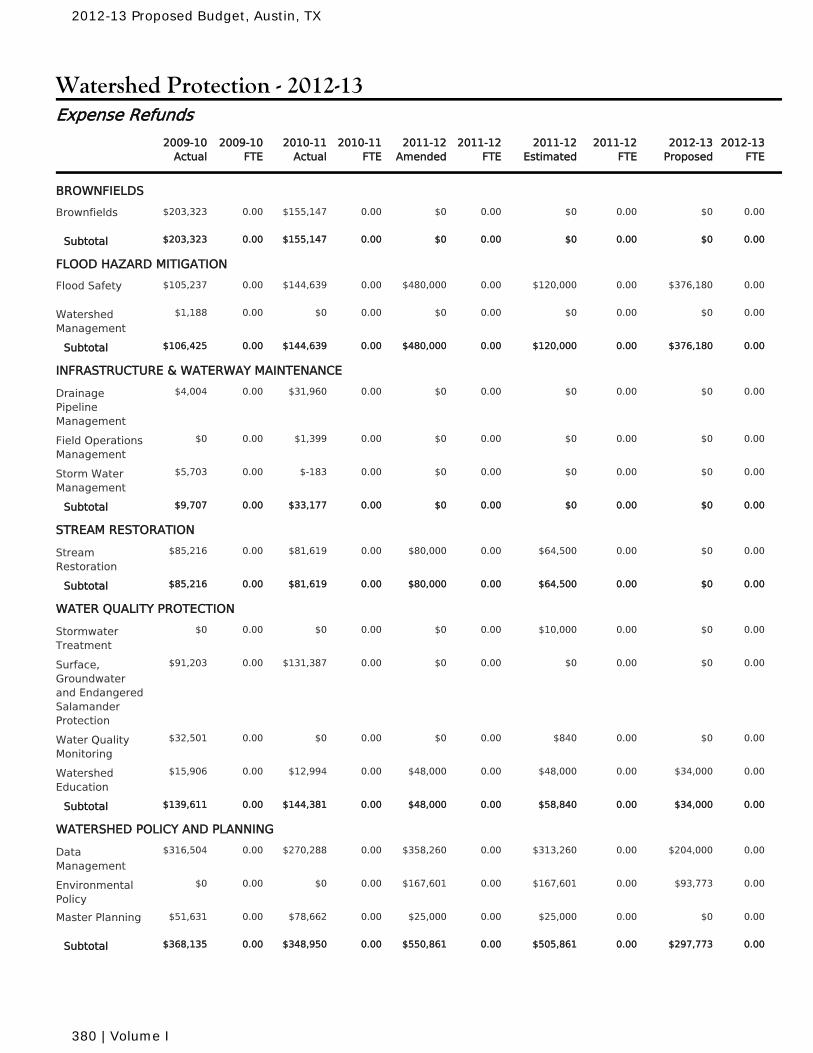
Watershed Protection - 2012-13
2010-11Actual
2010-11FTE
2011-12Amended
2011-12FTE
2011-12Estimated
2011-12FTE
2009-10Actual
2009-10FTE
2012-13Proposed
2012-13FTE
Expense Refunds
BROWNFIELDS
$155,147 0.00 $0 0.00 $0 0.00Brownfields 0.00 $0 0.00$203,323
$155,147 0.00 $0 0.00 $0 0.00Subtotal 0.00 $0 0.00$203,323
FLOOD HAZARD MITIGATION
$144,639 0.00 $480,000 0.00 $120,000 0.00Flood Safety 0.00 $376,180 0.00$105,237
$0 0.00 $0 0.00 $0 0.00WatershedManagement
0.00 $0 0.00$1,188
$144,639 0.00 $480,000 0.00 $120,000 0.00Subtotal 0.00 $376,180 0.00$106,425
INFRASTRUCTURE & WATERWAY MAINTENANCE
$31,960 0.00 $0 0.00 $0 0.00DrainagePipelineManagement
0.00 $0 0.00$4,004
$1,399 0.00 $0 0.00 $0 0.00Field OperationsManagement
0.00 $0 0.00$0
$-183 0.00 $0 0.00 $0 0.00Storm WaterManagement
0.00 $0 0.00$5,703
$33,177 0.00 $0 0.00 $0 0.00Subtotal 0.00 $0 0.00$9,707
STREAM RESTORATION
$81,619 0.00 $80,000 0.00 $64,500 0.00StreamRestoration
0.00 $0 0.00$85,216
$81,619 0.00 $80,000 0.00 $64,500 0.00Subtotal 0.00 $0 0.00$85,216
WATER QUALITY PROTECTION
$0 0.00 $0 0.00 $10,000 0.00StormwaterTreatment
0.00 $0 0.00$0
$131,387 0.00 $0 0.00 $0 0.00Surface,Groundwaterand EndangeredSalamanderProtection
0.00 $0 0.00$91,203
$0 0.00 $0 0.00 $840 0.00Water QualityMonitoring
0.00 $0 0.00$32,501
$12,994 0.00 $48,000 0.00 $48,000 0.00WatershedEducation
0.00 $34,000 0.00$15,906
$144,381 0.00 $48,000 0.00 $58,840 0.00Subtotal 0.00 $34,000 0.00$139,611
WATERSHED POLICY AND PLANNING
$270,288 0.00 $358,260 0.00 $313,260 0.00DataManagement
0.00 $204,000 0.00$316,504
$0 0.00 $167,601 0.00 $167,601 0.00EnvironmentalPolicy
0.00 $93,773 0.00$0
$78,662 0.00 $25,000 0.00 $25,000 0.00Master Planning 0.00 $0 0.00$51,631
$348,950 0.00 $550,861 0.00 $505,861 0.00Subtotal 0.00 $297,773 0.00$368,135
2012-13 Proposed Budget, Austin, TX
380 | Volume I
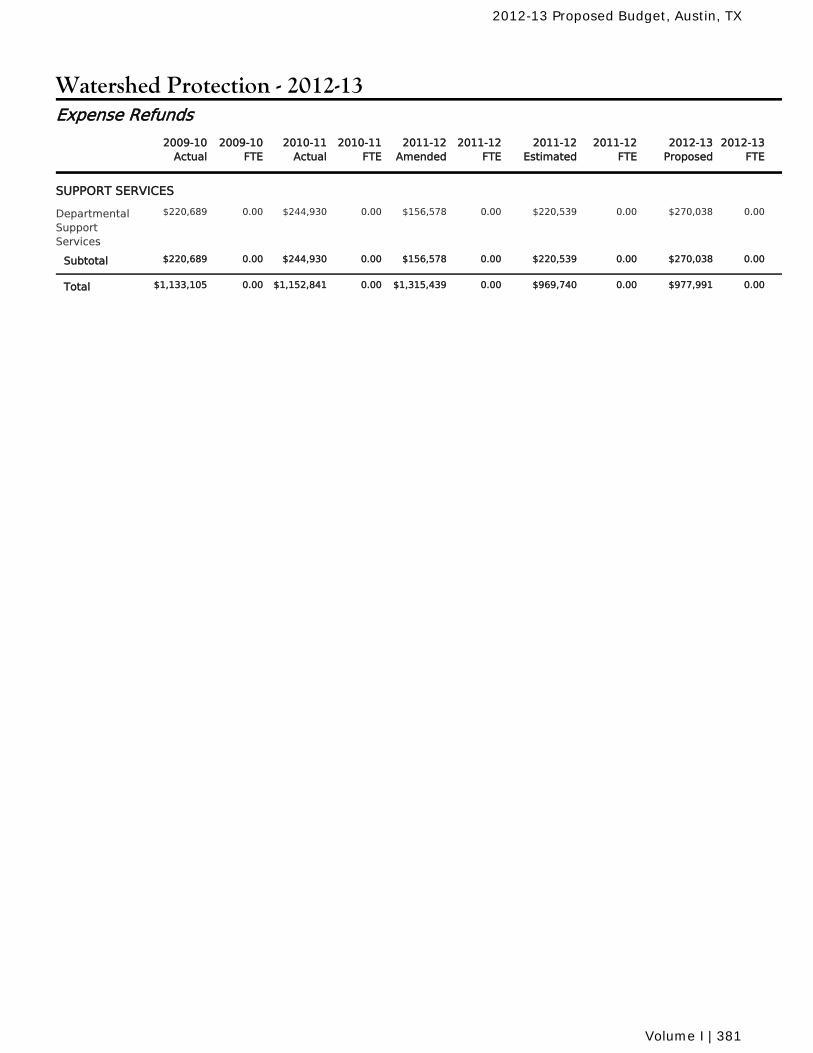
Watershed Protection - 2012-13
2010-11Actual
2010-11FTE
2011-12Amended
2011-12FTE
2011-12Estimated
2011-12FTE
2009-10Actual
2009-10FTE
2012-13Proposed
2012-13FTE
Expense Refunds
SUPPORT SERVICES
$244,930 0.00 $156,578 0.00 $220,539 0.00DepartmentalSupportServices
0.00 $270,038 0.00$220,689
$244,930 0.00 $156,578 0.00 $220,539 0.00Subtotal 0.00 $270,038 0.00$220,689
$1,152,841 0.00 $1,315,439 0.00 $969,740 0.00Total 0.00 $977,991 0.00$1,133,105
2012-13 Proposed Budget, Austin, TX
Volume I | 381
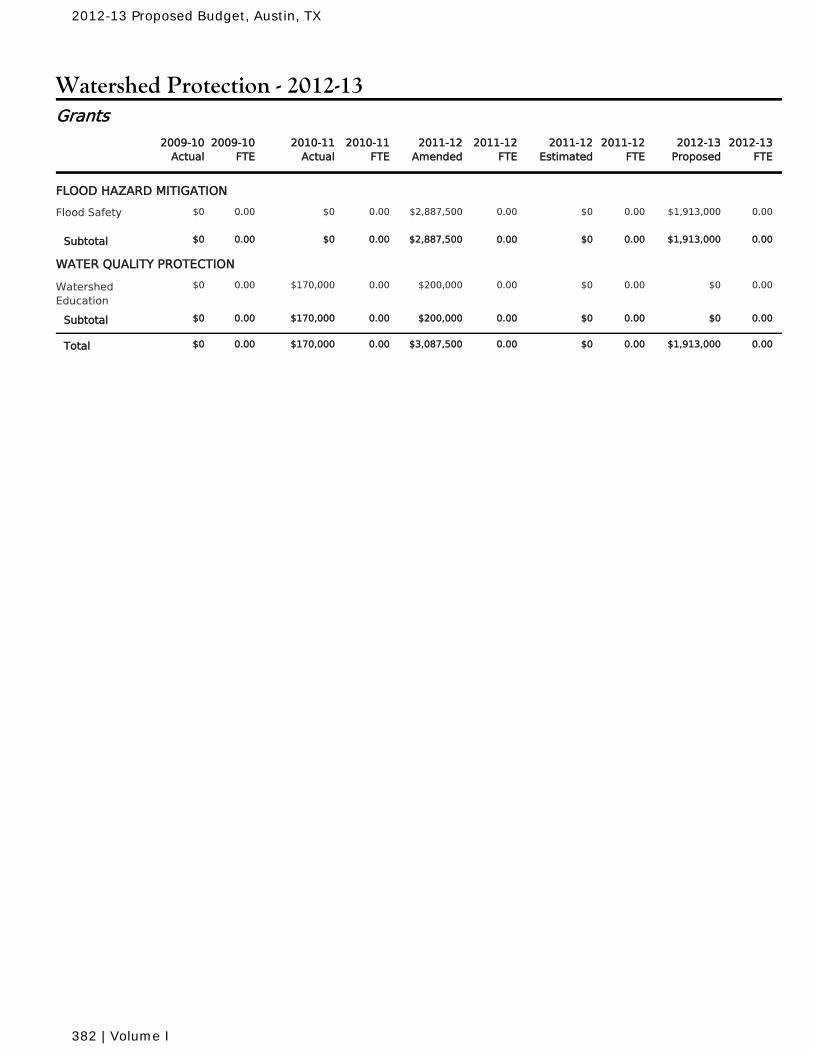
Watershed Protection - 2012-13
2010-11Actual
2010-11FTE
2011-12Amended
2011-12FTE
2011-12Estimated
2011-12FTE
2009-10Actual
2009-10FTE
2012-13Proposed
2012-13FTE
Grants
FLOOD HAZARD MITIGATION
$0 0.00 $2,887,500 0.00 $0 0.00Flood Safety 0.00 $1,913,000 0.00$0
$0 0.00 $2,887,500 0.00 $0 0.00Subtotal 0.00 $1,913,000 0.00$0
WATER QUALITY PROTECTION
$170,000 0.00 $200,000 0.00 $0 0.00WatershedEducation
0.00 $0 0.00$0
$170,000 0.00 $200,000 0.00 $0 0.00Subtotal 0.00 $0 0.00$0
$170,000 0.00 $3,087,500 0.00 $0 0.00Total 0.00 $1,913,000 0.00$0
2012-13 Proposed Budget, Austin, TX
382 | Volume I
City of Austin
2012-2013 Proposed
Budget
Volume I Utility/Major Enterprises

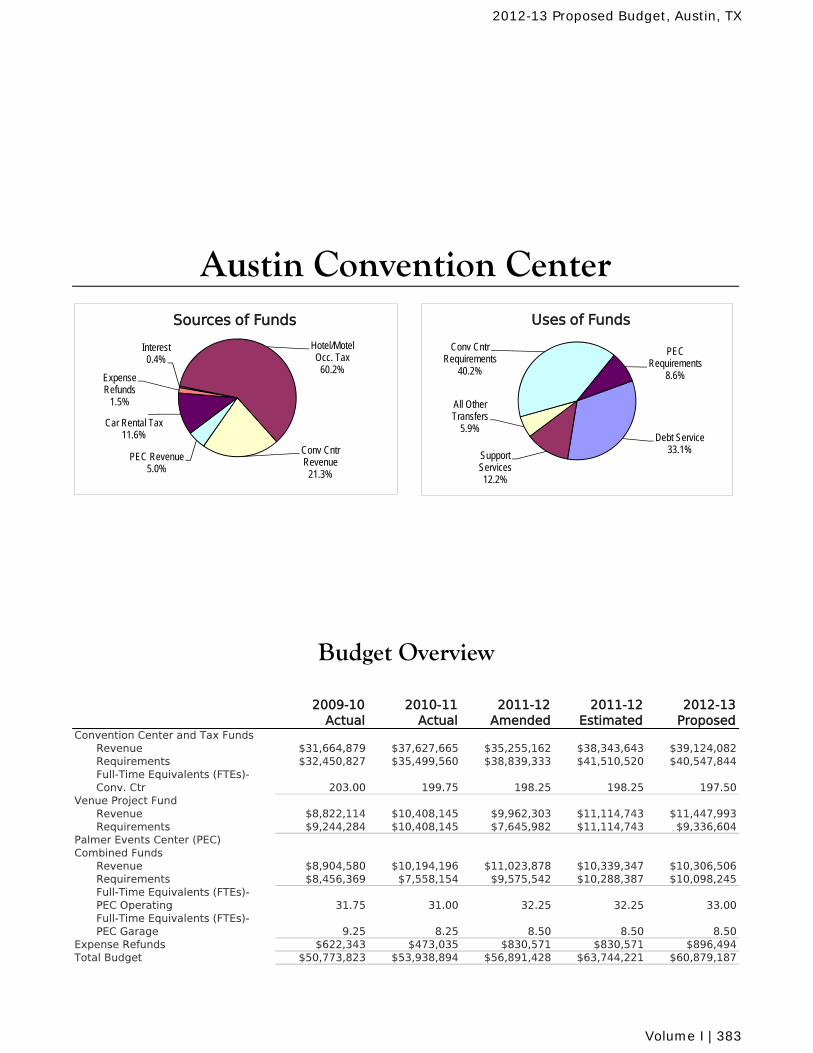
2009-10 Actual
2010-11 Actual
2011-12 Amended
2011-12 Estimated
2012-13 Proposed
Convention Center and Tax FundsRevenue $31,664,879 $37,627,665 $35,255,162 $38,343,643 $39,124,082Requirements $32,450,827 $35,499,560 $38,839,333 $41,510,520 $40,547,844Full-Time Equivalents (FTEs)-Conv. Ctr 203.00 199.75 198.25 198.25 197.50
Venue Project FundRevenue $8,822,114 $10,408,145 $9,962,303 $11,114,743 $11,447,993Requirements $9,244,284 $10,408,145 $7,645,982 $11,114,743 $9,336,604
Palmer Events Center (PEC)Combined Funds
Revenue $8,904,580 $10,194,196 $11,023,878 $10,339,347 $10,306,506Requirements $8,456,369 $7,558,154 $9,575,542 $10,288,387 $10,098,245Full-Time Equivalents (FTEs)-PEC Operating 31.75 31.00 32.25 32.25 33.00Full-Time Equivalents (FTEs)-PEC Garage 9.25 8.25 8.50 8.50 8.50
Expense Refunds $622,343 $473,035 $830,571 $830,571 $896,494Total Budget $50,773,823 $53,938,894 $56,891,428 $63,744,221 $60,879,187
Budget Overview
Austin Convention Center
Interest0.4%
Hotel/Motel Occ. Tax
60.2%
Conv Cntr Revenue
21.3%
PEC Revenue5.0%
Car Rental Tax11.6%
Expense Refunds
1.5%
Sources of Funds
Debt Service33.1%Support
Services12.2%
All Other Transfers
5.9%
Conv Cntr Requirements
40.2%
PEC Requirements
8.6%
Uses of Funds
2012-13 Proposed Budget, Austin, TX
Volume I | 383
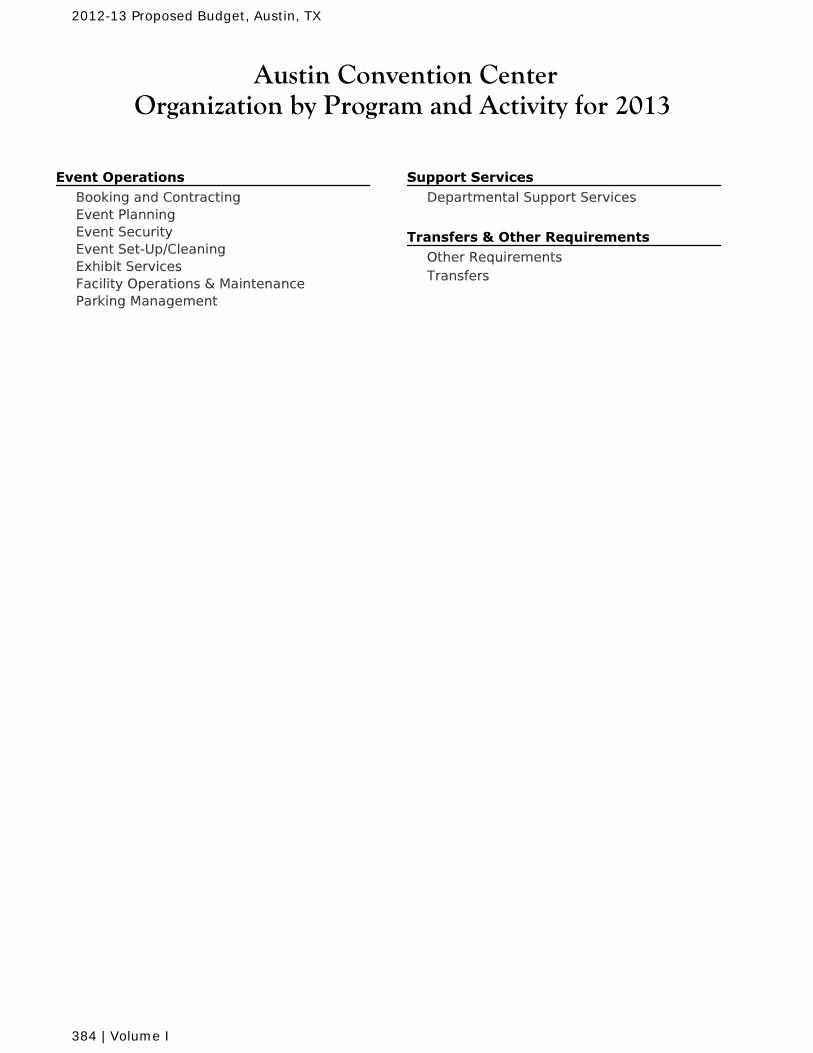
Austin Convention CenterOrganization by Program and Activity for 2013
Event Operations Booking and ContractingEvent PlanningEvent SecurityEvent Set-Up/CleaningExhibit ServicesFacility Operations & MaintenanceParking Management
Support Services Departmental Support Services
Transfers & Other Requirements Other RequirementsTransfers
2012-13 Proposed Budget, Austin, TX
384 | Volume I
Austin Convention CenterMission and Goals for 2013
Mission
The central mission of the Austin Convention Center Department is to provide outstanding eventfacilities and services to our customers so they can have a positive experience.
Goals
Achieve an overall customer satisfaction survey target of 4.53 (scale).
Continue the financial success of the department whereby total revenue exceeds requirements.
Maintain an minimum ending balance equivalent to 60 days of total requirements.
Continue to add to the local economy through Austin's hospitality industry.
Actual Hotel Occupancy Tax Collections in FY 2013 to meet or exceed actual collection in FY2012.
Invest in the workforce.
Average 26 hours of training per FTE.
2012-13 Proposed Budget, Austin, TX
Volume I | 385
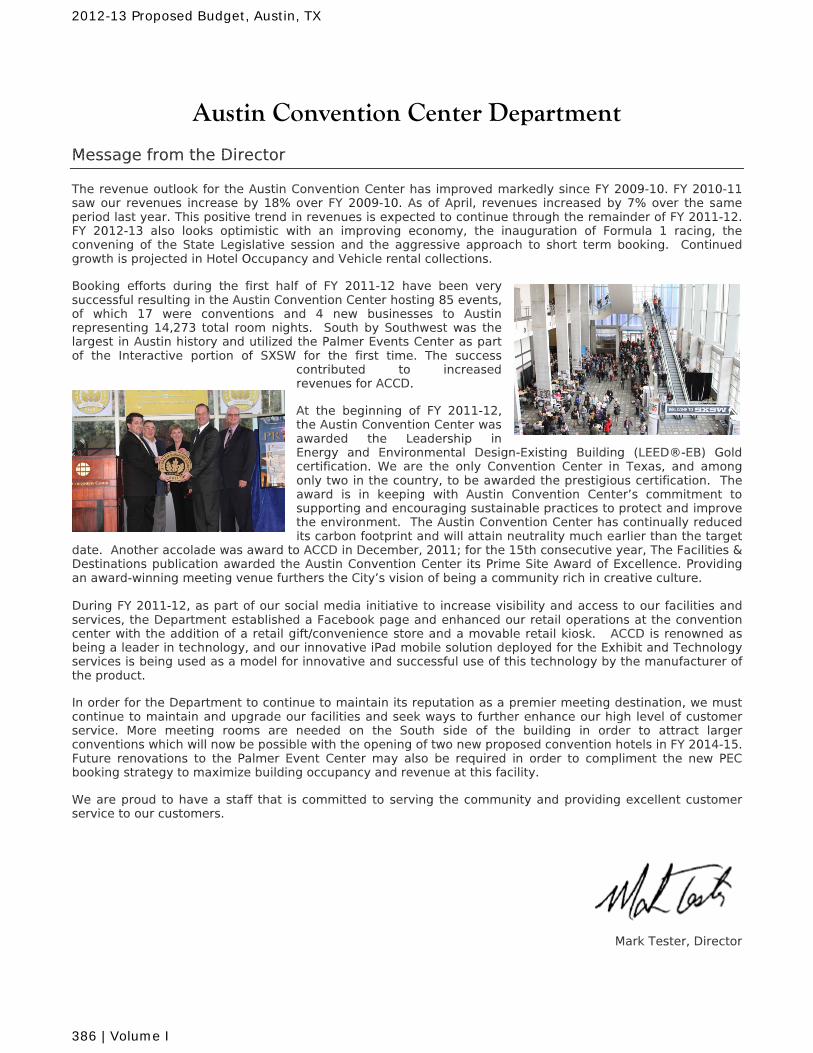
Austin Convention Center Department
Message from the Director
The revenue outlook for the Austin Convention Center has improved markedly since FY 2009-10. FY 2010-11 saw our revenues increase by 18% over FY 2009-10. As of April, revenues increased by 7% over the same period last year. This positive trend in revenues is expected to continue through the remainder of FY 2011-12. FY 2012-13 also looks optimistic with an improving economy, the inauguration of Formula 1 racing, the convening of the State Legislative session and the aggressive approach to short term booking. Continued growth is projected in Hotel Occupancy and Vehicle rental collections.
Booking efforts during the first half of FY 2011-12 have been very successful resulting in the Austin Convention Center hosting 85 events, of which 17 were conventions and 4 new businesses to Austin representing 14,273 total room nights. South by Southwest was the largest in Austin history and utilized the Palmer Events Center as part of the Interactive portion of SXSW for the first time. The success
contributed to increased revenues for ACCD.
At the beginning of FY 2011-12, the Austin Convention Center was awarded the Leadership in Energy and Environmental Design-Existing Building (LEED®-EB) Gold certification. We are the only Convention Center in Texas, and among only two in the country, to be awarded the prestigious certification. The award is in keeping with Austin Convention Center’s commitment to supporting and encouraging sustainable practices to protect and improve the environment. The Austin Convention Center has continually reduced its carbon footprint and will attain neutrality much earlier than the target
date. Another accolade was award to ACCD in December, 2011; for the 15th consecutive year, The Facilities & Destinations publication awarded the Austin Convention Center its Prime Site Award of Excellence. Providing an award-winning meeting venue furthers the City’s vision of being a community rich in creative culture. During FY 2011-12, as part of our social media initiative to increase visibility and access to our facilities and services, the Department established a Facebook page and enhanced our retail operations at the convention center with the addition of a retail gift/convenience store and a movable retail kiosk. ACCD is renowned as being a leader in technology, and our innovative iPad mobile solution deployed for the Exhibit and Technology services is being used as a model for innovative and successful use of this technology by the manufacturer of the product.
In order for the Department to continue to maintain its reputation as a premier meeting destination, we must continue to maintain and upgrade our facilities and seek ways to further enhance our high level of customer service. More meeting rooms are needed on the South side of the building in order to attract larger conventions which will now be possible with the opening of two new proposed convention hotels in FY 2014-15. Future renovations to the Palmer Event Center may also be required in order to compliment the new PEC booking strategy to maximize building occupancy and revenue at this facility.
We are proud to have a staff that is committed to serving the community and providing excellent customer service to our customers.
Mark Tester, Director
2012-13 Proposed Budget, Austin, TX
386 | Volume I
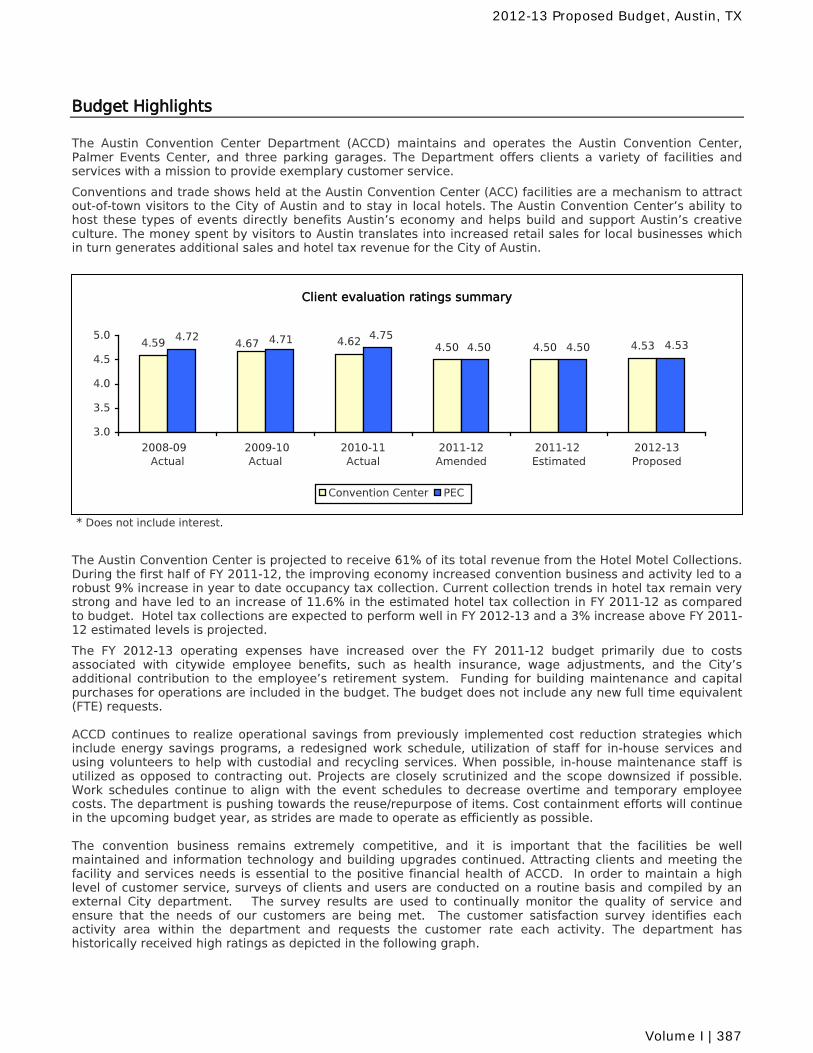
Budget Highlights
The Austin Convention Center Department (ACCD) maintains and operates the Austin Convention Center, Palmer Events Center, and three parking garages. The Department offers clients a variety of facilities and services with a mission to provide exemplary customer service. Conventions and trade shows held at the Austin Convention Center (ACC) facilities are a mechanism to attract out-of-town visitors to the City of Austin and to stay in local hotels. The Austin Convention Center’s ability to host these types of events directly benefits Austin’s economy and helps build and support Austin’s creative culture. The money spent by visitors to Austin translates into increased retail sales for local businesses which in turn generates additional sales and hotel tax revenue for the City of Austin.
* Does not include interest.
The Austin Convention Center is projected to receive 61% of its total revenue from the Hotel Motel Collections. During the first half of FY 2011-12, the improving economy increased convention business and activity led to a robust 9% increase in year to date occupancy tax collection. Current collection trends in hotel tax remain very strong and have led to an increase of 11.6% in the estimated hotel tax collection in FY 2011-12 as compared to budget. Hotel tax collections are expected to perform well in FY 2012-13 and a 3% increase above FY 2011-12 estimated levels is projected. The FY 2012-13 operating expenses have increased over the FY 2011-12 budget primarily due to costs associated with citywide employee benefits, such as health insurance, wage adjustments, and the City’s additional contribution to the employee’s retirement system. Funding for building maintenance and capital purchases for operations are included in the budget. The budget does not include any new full time equivalent (FTE) requests. ACCD continues to realize operational savings from previously implemented cost reduction strategies which include energy savings programs, a redesigned work schedule, utilization of staff for in-house services and using volunteers to help with custodial and recycling services. When possible, in-house maintenance staff is utilized as opposed to contracting out. Projects are closely scrutinized and the scope downsized if possible. Work schedules continue to align with the event schedules to decrease overtime and temporary employee costs. The department is pushing towards the reuse/repurpose of items. Cost containment efforts will continue in the upcoming budget year, as strides are made to operate as efficiently as possible. The convention business remains extremely competitive, and it is important that the facilities be well maintained and information technology and building upgrades continued. Attracting clients and meeting the facility and services needs is essential to the positive financial health of ACCD. In order to maintain a high level of customer service, surveys of clients and users are conducted on a routine basis and compiled by an external City department. The survey results are used to continually monitor the quality of service and ensure that the needs of our customers are being met. The customer satisfaction survey identifies each activity area within the department and requests the customer rate each activity. The department has historically received high ratings as depicted in the following graph.
Client evaluation ratings summary
4.59 4.62 4.50 4.534.504.674.72
4.534.504.504.754.71
3.0
3.5
4.0
4.5
5.0
2008-09 Actual
2009-10 Actual
2010-11 Actual
2011-12Amended
2011-12 Estimated
2012-13Proposed
Convention Center PEC
2012-13 Proposed Budget, Austin, TX
Volume I | 387
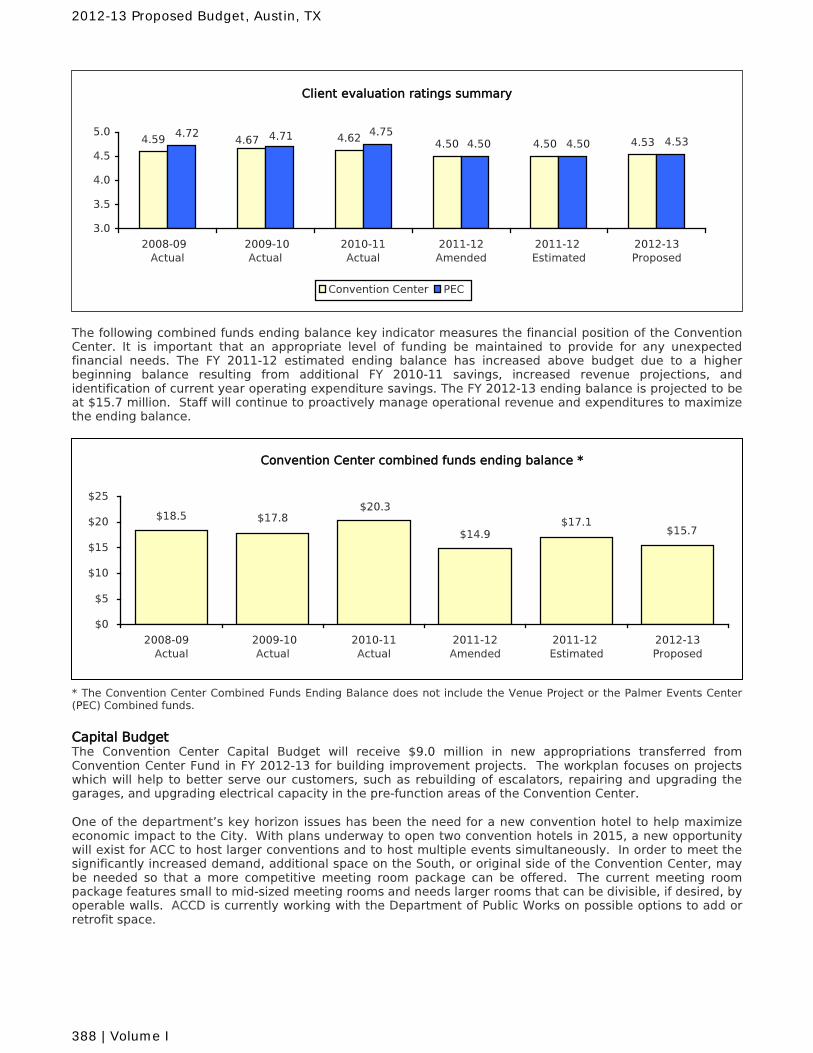
The following combined funds ending balance key indicator measures the financial position of the Convention Center. It is important that an appropriate level of funding be maintained to provide for any unexpected financial needs. The FY 2011-12 estimated ending balance has increased above budget due to a higher beginning balance resulting from additional FY 2010-11 savings, increased revenue projections, and identification of current year operating expenditure savings. The FY 2012-13 ending balance is projected to be at $15.7 million. Staff will continue to proactively manage operational revenue and expenditures to maximize the ending balance.
* The Convention Center Combined Funds Ending Balance does not include the Venue Project or the Palmer Events Center (PEC) Combined funds.
Capital Budget
The Convention Center Capital Budget will receive $9.0 million in new appropriations transferred from Convention Center Fund in FY 2012-13 for building improvement projects. The workplan focuses on projects which will help to better serve our customers, such as rebuilding of escalators, repairing and upgrading the garages, and upgrading electrical capacity in the pre-function areas of the Convention Center. One of the department’s key horizon issues has been the need for a new convention hotel to help maximize economic impact to the City. With plans underway to open two convention hotels in 2015, a new opportunity will exist for ACC to host larger conventions and to host multiple events simultaneously. In order to meet the significantly increased demand, additional space on the South, or original side of the Convention Center, may be needed so that a more competitive meeting room package can be offered. The current meeting room package features small to mid-sized meeting rooms and needs larger rooms that can be divisible, if desired, by operable walls. ACCD is currently working with the Department of Public Works on possible options to add or retrofit space.
Convention Center combined funds ending balance *
$17.1$14.9
$20.3$17.8$18.5
$15.7
$0
$5
$10
$15
$20
$25
2008-09 Actual
2009-10 Actual
2010-11 Actual
2011-12 Amended
2011-12 Estimated
2012-13 Proposed
Client evaluation ratings summary
4.59 4.62 4.50 4.534.504.674.72
4.534.504.504.754.71
3.0
3.5
4.0
4.5
5.0
2008-09 Actual
2009-10 Actual
2010-11 Actual
2011-12Amended
2011-12 Estimated
2012-13Proposed
Convention Center PEC
2012-13 Proposed Budget, Austin, TX
388 | Volume I
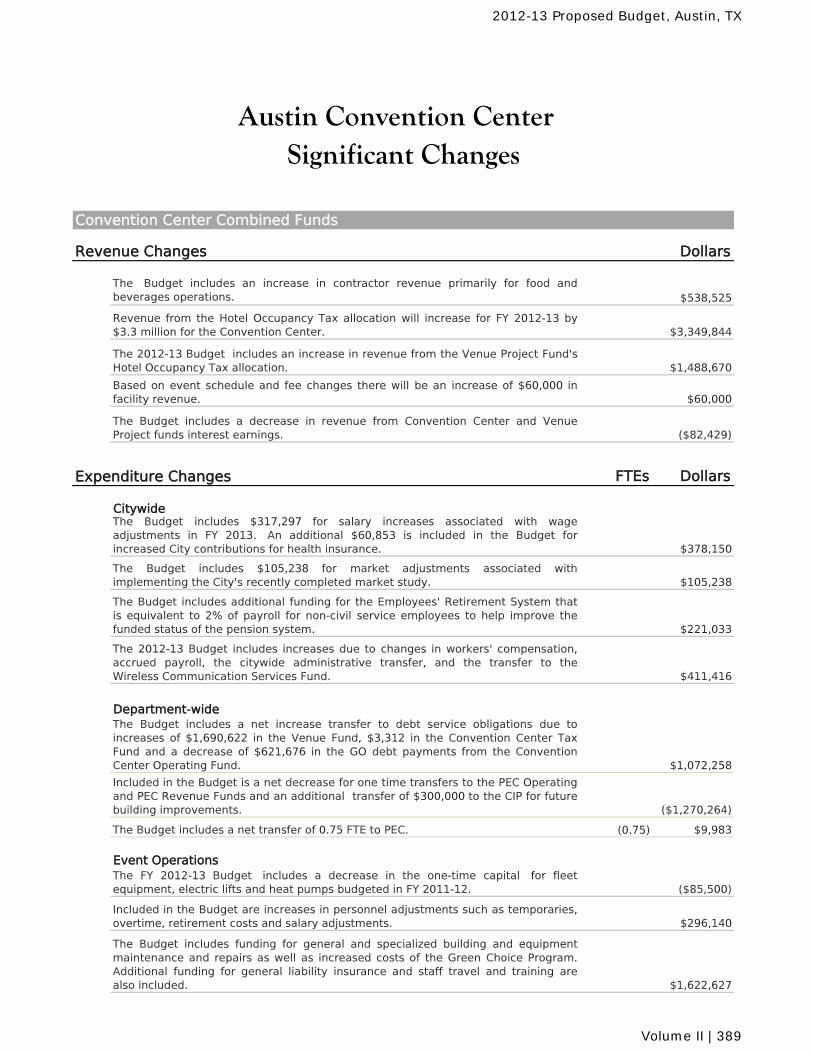
Convention Center Combined Funds
Revenue Changes Dollars
The Budget includes an increase in contractor revenue primarily for food andbeverages operations. $538,525
Revenue from the Hotel Occupancy Tax allocation will increase for FY 2012-13 by$3.3 million for the Convention Center. $3,349,844
The 2012-13 Budget includes an increase in revenue from the Venue Project Fund'sHotel Occupancy Tax allocation. $1,488,670
Based on event schedule and fee changes there will be an increase of $60,000 infacility revenue. $60,000
The Budget includes a decrease in revenue from Convention Center and VenueProject funds interest earnings. ($82,429)
Expenditure Changes FTEs Dollars
CitywideThe Budget includes $317,297 for salary increases associated with wageadjustments in FY 2013. An additional $60,853 is included in the Budget forincreased City contributions for health insurance. $378,150
The Budget includes $105,238 for market adjustments associated withimplementing the City's recently completed market study. $105,238
The Budget includes additional funding for the Employees' Retirement System thatis equivalent to 2% of payroll for non-civil service employees to help improve thefunded status of the pension system. $221,033
The 2012-13 Budget includes increases due to changes in workers' compensation,accrued payroll, the citywide administrative transfer, and the transfer to theWireless Communication Services Fund. $411,416
Department-wideThe Budget includes a net increase transfer to debt service obligations due toincreases of $1,690,622 in the Venue Fund, $3,312 in the Convention Center TaxFund and a decrease of $621,676 in the GO debt payments from the ConventionCenter Operating Fund. $1,072,258
Included in the Budget is a net decrease for one time transfers to the PEC Operatingand PEC Revenue Funds and an additional transfer of $300,000 to the CIP for futurebuilding improvements. ($1,270,264)
The Budget includes a net transfer of 0.75 FTE to PEC. (0.75) $9,983
Event OperationsThe FY 2012-13 Budget includes a decrease in the one-time capital for fleetequipment, electric lifts and heat pumps budgeted in FY 2011-12. ($85,500)
Included in the Budget are increases in personnel adjustments such as temporaries,overtime, retirement costs and salary adjustments. $296,140
The Budget includes funding for general and specialized building and equipmentmaintenance and repairs as well as increased costs of the Green Choice Program.Additional funding for general liability insurance and staff travel and training arealso included. $1,622,627
Significant ChangesAustin Convention Center
2012-13 Proposed Budget, Austin, TX
Volume II | 389
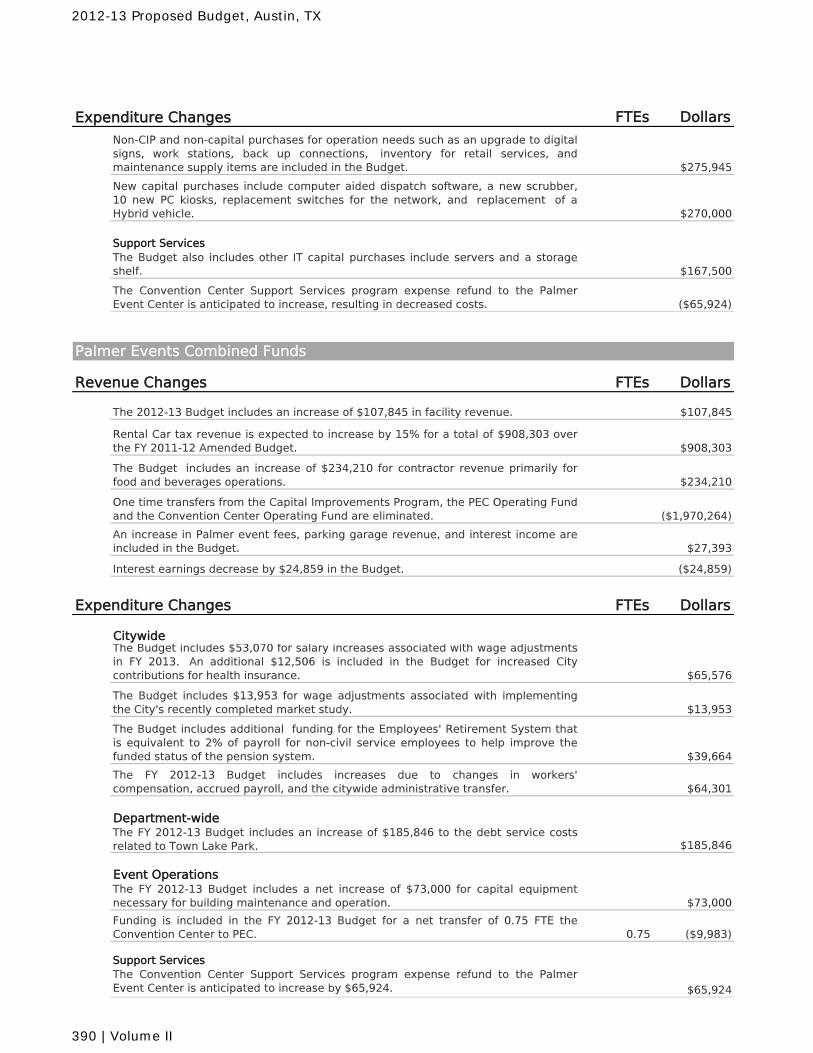
Expenditure Changes FTEs Dollars
Non-CIP and non-capital purchases for operation needs such as an upgrade to digitalsigns, work stations, back up connections, inventory for retail services, andmaintenance supply items are included in the Budget. $275,945
New capital purchases include computer aided dispatch software, a new scrubber,10 new PC kiosks, replacement switches for the network, and replacement of aHybrid vehicle. $270,000
Support ServicesThe Budget also includes other IT capital purchases include servers and a storageshelf. $167,500
The Convention Center Support Services program expense refund to the PalmerEvent Center is anticipated to increase, resulting in decreased costs. ($65,924)
Palmer Events Combined Funds
Revenue Changes FTEs Dollars
The 2012-13 Budget includes an increase of $107,845 in facility revenue. $107,845
Rental Car tax revenue is expected to increase by 15% for a total of $908,303 overthe FY 2011-12 Amended Budget. $908,303
The Budget includes an increase of $234,210 for contractor revenue primarily forfood and beverages operations. $234,210
One time transfers from the Capital Improvements Program, the PEC Operating Fundand the Convention Center Operating Fund are eliminated. ($1,970,264)
An increase in Palmer event fees, parking garage revenue, and interest income areincluded in the Budget. $27,393
Interest earnings decrease by $24,859 in the Budget. ($24,859)
Expenditure Changes FTEs Dollars
CitywideThe Budget includes $53,070 for salary increases associated with wage adjustmentsin FY 2013. An additional $12,506 is included in the Budget for increased Citycontributions for health insurance. $65,576
The Budget includes $13,953 for wage adjustments associated with implementingthe City's recently completed market study. $13,953
The Budget includes additional funding for the Employees' Retirement System thatis equivalent to 2% of payroll for non-civil service employees to help improve thefunded status of the pension system. $39,664
The FY 2012-13 Budget includes increases due to changes in workers'compensation, accrued payroll, and the citywide administrative transfer. $64,301
Department-wideThe FY 2012-13 Budget includes an increase of $185,846 to the debt service costsrelated to Town Lake Park. $185,846
Event OperationsThe FY 2012-13 Budget includes a net increase of $73,000 for capital equipmentnecessary for building maintenance and operation. $73,000
Funding is included in the FY 2012-13 Budget for a net transfer of 0.75 FTE theConvention Center to PEC. 0.75 ($9,983)
Support ServicesThe Convention Center Support Services program expense refund to the PalmerEvent Center is anticipated to increase by $65,924. $65,924
2012-13 Proposed Budget, Austin, TX
390 | Volume II
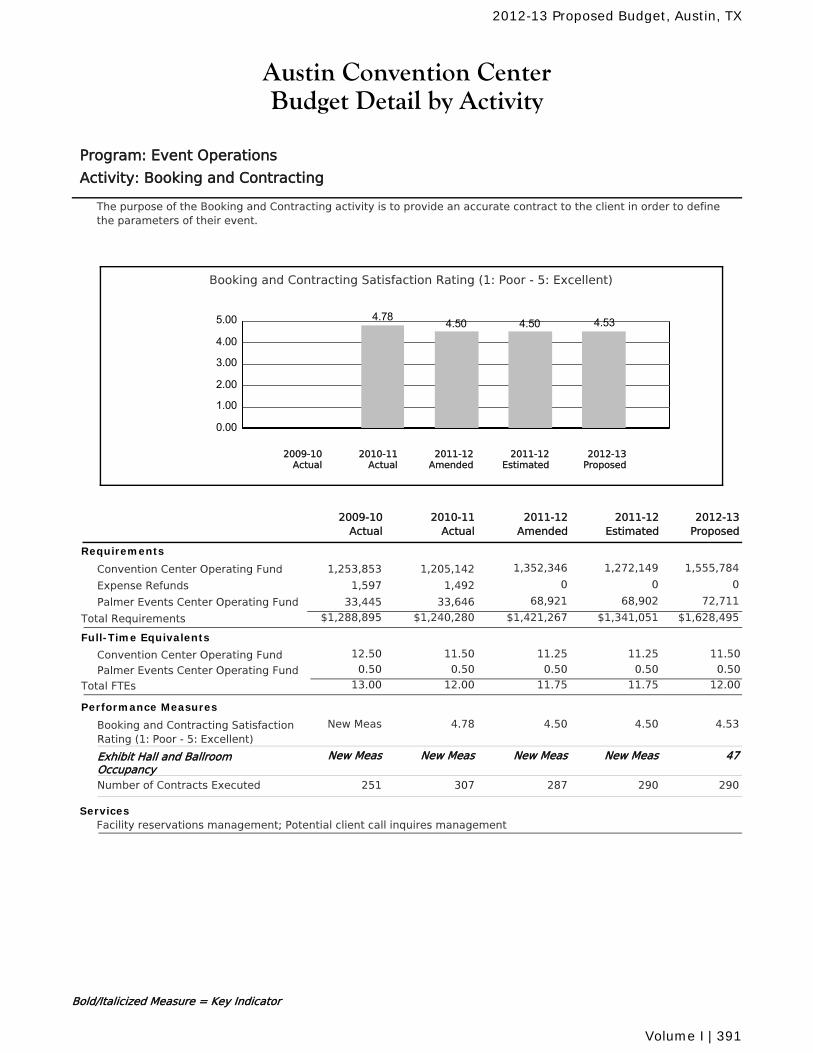
Austin Convention CenterBudget Detail by Activity
Program: Event Operations
Activity: Booking and Contracting
The purpose of the Booking and Contracting activity is to provide an accurate contract to the client in order to definethe parameters of their event.
Booking and Contracting Satisfaction Rating (1: Poor - 5: Excellent)
0.00
1.00
2.00
3.00
4.00
5.00 4.78 4.50 4.50 4.53
2010-11Actual
2012-13Proposed
2011-12Amended
2011-12Estimated
2009-10Actual
2011-12Amended
2010-11Actual
2011-12Estimated
2012-13Proposed
2009-10Actual
Requirements
Convention Center Operating Fund 1,352,346 1,272,149 1,555,7841,205,1421,253,853
Expense Refunds 0 0 01,4921,597
Palmer Events Center Operating Fund 68,921 68,902 72,71133,64633,445
$1,421,267 $1,341,051 $1,628,495Total Requirements $1,240,280$1,288,895
Full-Time Equivalents
Convention Center Operating Fund 11.50 11.25 11.25 11.5012.50
Palmer Events Center Operating Fund 0.50 0.50 0.50 0.500.50
Total FTEs 12.00 11.75 11.75 12.0013.00
Performance Measures
Booking and Contracting SatisfactionRating (1: Poor - 5: Excellent)
4.504.78 4.50 4.53New Meas
Exhibit Hall and BallroomOccupancy
New MeasNew Meas New Meas 47New Meas
Number of Contracts Executed 287307 290 290251
ServicesFacility reservations management; Potential client call inquires management
Bold/Italicized Measure = Key Indicator
2012-13 Proposed Budget, Austin, TX
Volume I | 391
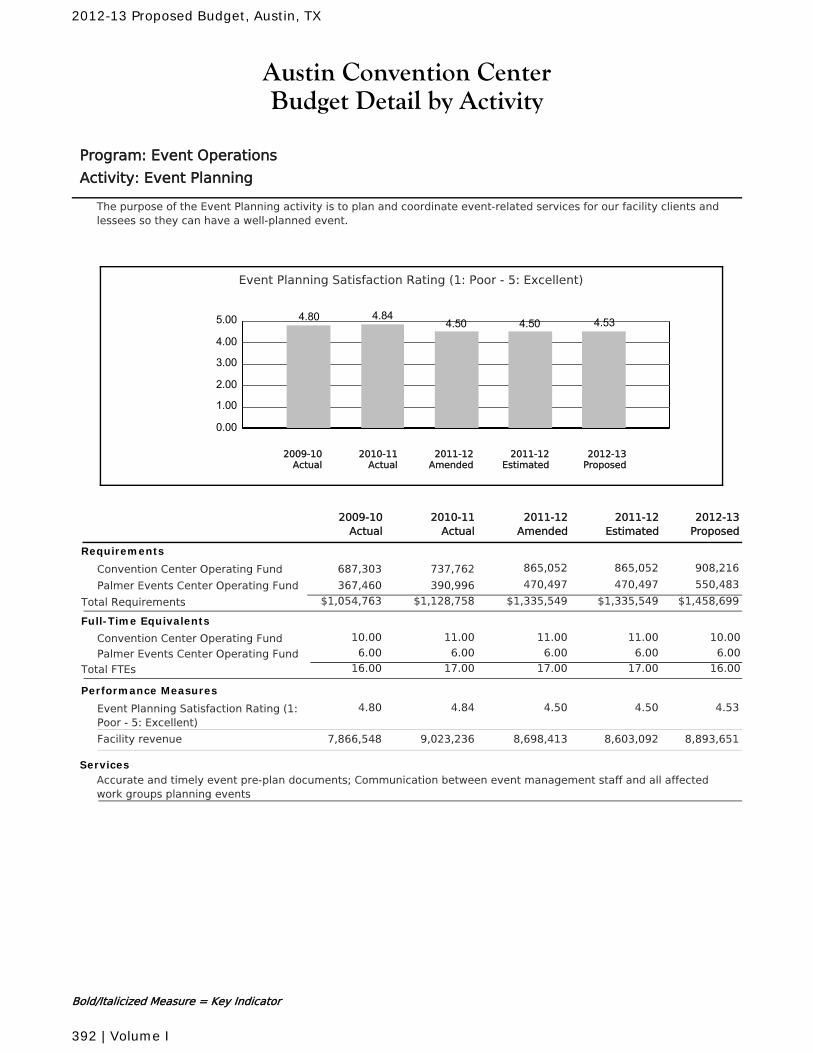
Austin Convention CenterBudget Detail by Activity
Program: Event Operations
Activity: Event Planning
The purpose of the Event Planning activity is to plan and coordinate event-related services for our facility clients andlessees so they can have a well-planned event.
Event Planning Satisfaction Rating (1: Poor - 5: Excellent)
0.00
1.00
2.00
3.00
4.00
5.00 4.80 4.844.50 4.50 4.53
2010-11Actual
2012-13Proposed
2011-12Amended
2011-12Estimated
2009-10Actual
2011-12Amended
2010-11Actual
2011-12Estimated
2012-13Proposed
2009-10Actual
Requirements
Convention Center Operating Fund 865,052 865,052 908,216737,762687,303
Palmer Events Center Operating Fund 470,497 470,497 550,483390,996367,460
$1,335,549 $1,335,549 $1,458,699Total Requirements $1,128,758$1,054,763
Full-Time Equivalents
Convention Center Operating Fund 11.00 11.00 11.00 10.0010.00
Palmer Events Center Operating Fund 6.00 6.00 6.00 6.006.00
Total FTEs 17.00 17.00 17.00 16.0016.00
Performance Measures
Event Planning Satisfaction Rating (1:Poor - 5: Excellent)
4.504.84 4.50 4.534.80
Facility revenue 8,698,4139,023,236 8,603,092 8,893,6517,866,548
ServicesAccurate and timely event pre-plan documents; Communication between event management staff and all affectedwork groups planning events
Bold/Italicized Measure = Key Indicator
2012-13 Proposed Budget, Austin, TX
392 | Volume I
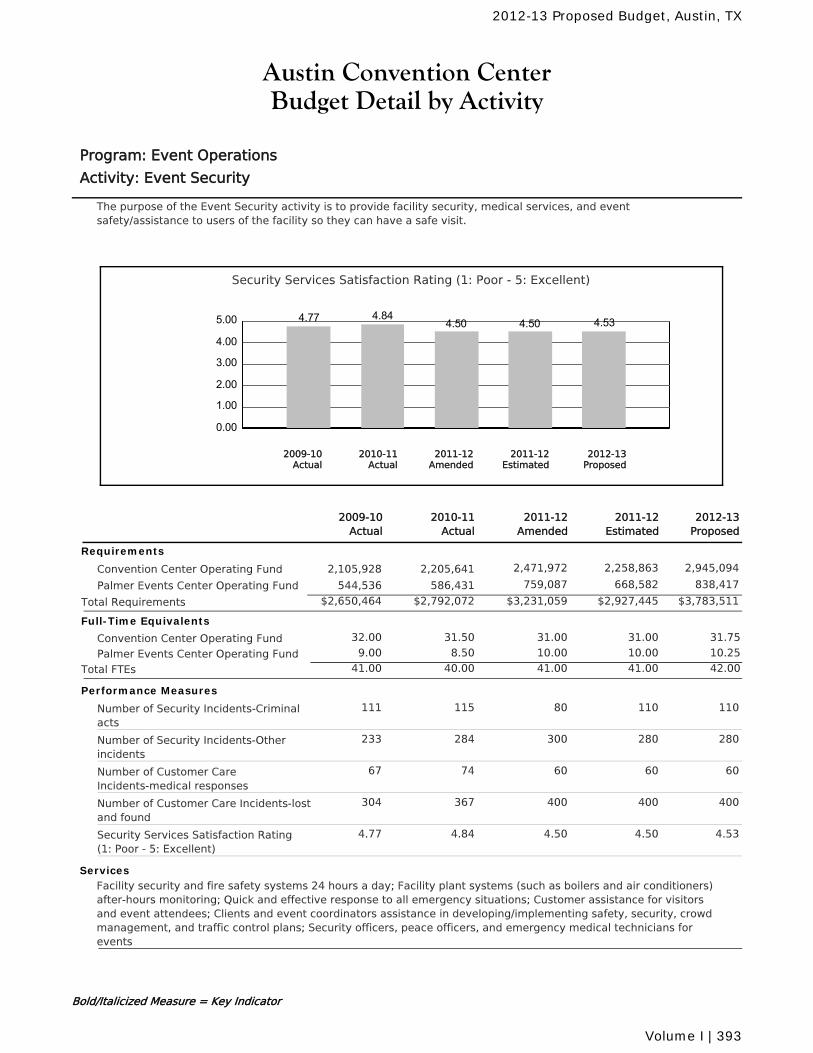
Austin Convention CenterBudget Detail by Activity
Program: Event Operations
Activity: Event Security
The purpose of the Event Security activity is to provide facility security, medical services, and eventsafety/assistance to users of the facility so they can have a safe visit.
Security Services Satisfaction Rating (1: Poor - 5: Excellent)
0.00
1.00
2.00
3.00
4.00
5.00 4.77 4.844.50 4.50 4.53
2010-11Actual
2012-13Proposed
2011-12Amended
2011-12Estimated
2009-10Actual
2011-12Amended
2010-11Actual
2011-12Estimated
2012-13Proposed
2009-10Actual
Requirements
Convention Center Operating Fund 2,471,972 2,258,863 2,945,0942,205,6412,105,928
Palmer Events Center Operating Fund 759,087 668,582 838,417586,431544,536
$3,231,059 $2,927,445 $3,783,511Total Requirements $2,792,072$2,650,464
Full-Time Equivalents
Convention Center Operating Fund 31.50 31.00 31.00 31.7532.00
Palmer Events Center Operating Fund 8.50 10.00 10.00 10.259.00
Total FTEs 40.00 41.00 41.00 42.0041.00
Performance Measures
Number of Security Incidents-Criminalacts
80115 110 110111
Number of Security Incidents-Otherincidents
300284 280 280233
Number of Customer CareIncidents-medical responses
6074 60 6067
Number of Customer Care Incidents-lostand found
400367 400 400304
Security Services Satisfaction Rating(1: Poor - 5: Excellent)
4.504.84 4.50 4.534.77
ServicesFacility security and fire safety systems 24 hours a day; Facility plant systems (such as boilers and air conditioners)after-hours monitoring; Quick and effective response to all emergency situations; Customer assistance for visitorsand event attendees; Clients and event coordinators assistance in developing/implementing safety, security, crowdmanagement, and traffic control plans; Security officers, peace officers, and emergency medical technicians forevents
Bold/Italicized Measure = Key Indicator
2012-13 Proposed Budget, Austin, TX
Volume I | 393
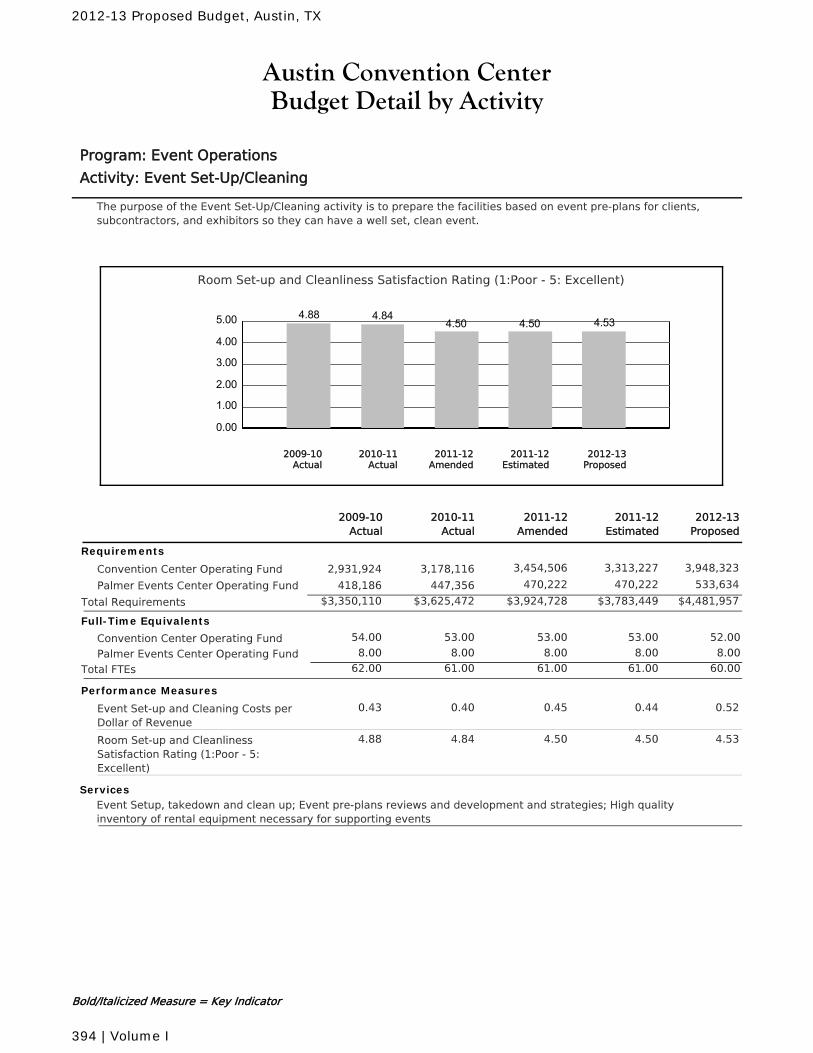
Austin Convention CenterBudget Detail by Activity
Program: Event Operations
Activity: Event Set-Up/Cleaning
The purpose of the Event Set-Up/Cleaning activity is to prepare the facilities based on event pre-plans for clients,subcontractors, and exhibitors so they can have a well set, clean event.
Room Set-up and Cleanliness Satisfaction Rating (1:Poor - 5: Excellent)
0.00
1.00
2.00
3.00
4.00
5.00 4.88 4.844.50 4.50 4.53
2010-11Actual
2012-13Proposed
2011-12Amended
2011-12Estimated
2009-10Actual
2011-12Amended
2010-11Actual
2011-12Estimated
2012-13Proposed
2009-10Actual
Requirements
Convention Center Operating Fund 3,454,506 3,313,227 3,948,3233,178,1162,931,924
Palmer Events Center Operating Fund 470,222 470,222 533,634447,356418,186
$3,924,728 $3,783,449 $4,481,957Total Requirements $3,625,472$3,350,110
Full-Time Equivalents
Convention Center Operating Fund 53.00 53.00 53.00 52.0054.00
Palmer Events Center Operating Fund 8.00 8.00 8.00 8.008.00
Total FTEs 61.00 61.00 61.00 60.0062.00
Performance Measures
Event Set-up and Cleaning Costs perDollar of Revenue
0.450.40 0.44 0.520.43
Room Set-up and CleanlinessSatisfaction Rating (1:Poor - 5:Excellent)
4.504.84 4.50 4.534.88
ServicesEvent Setup, takedown and clean up; Event pre-plans reviews and development and strategies; High qualityinventory of rental equipment necessary for supporting events
Bold/Italicized Measure = Key Indicator
2012-13 Proposed Budget, Austin, TX
394 | Volume I
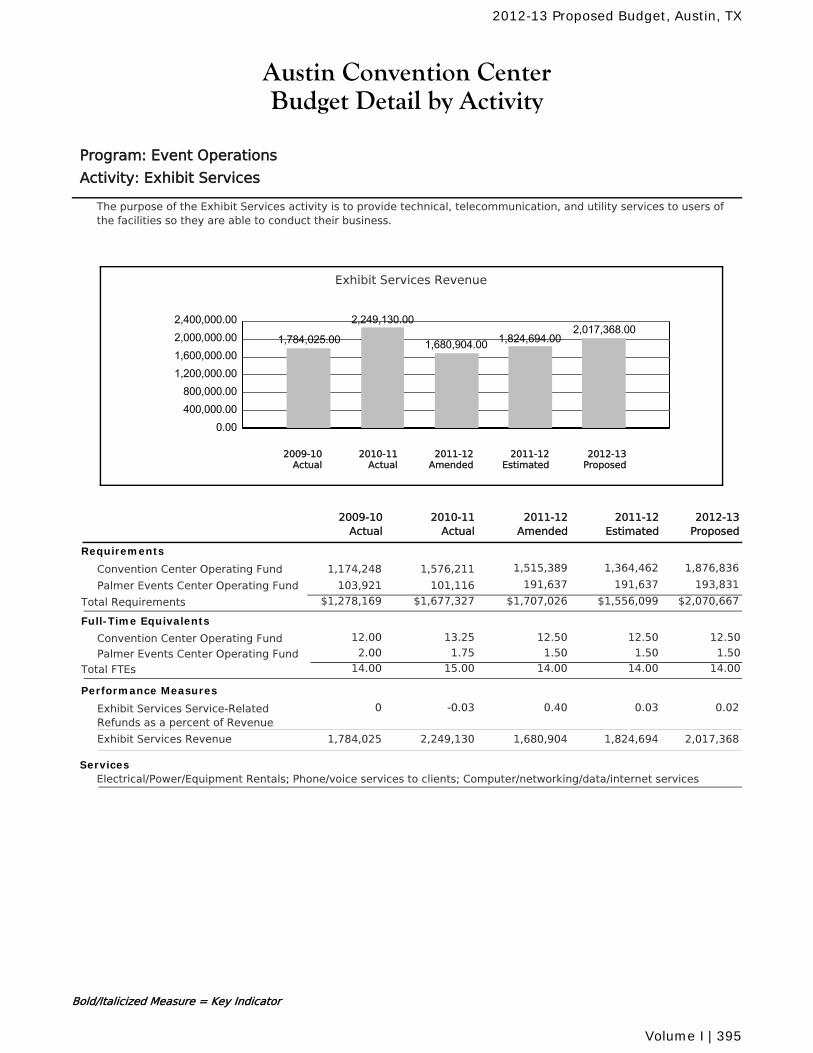
Austin Convention CenterBudget Detail by Activity
Program: Event Operations
Activity: Exhibit Services
The purpose of the Exhibit Services activity is to provide technical, telecommunication, and utility services to users ofthe facilities so they are able to conduct their business.
Exhibit Services Revenue
0.00400,000.00800,000.00
1,200,000.001,600,000.002,000,000.002,400,000.00
1,784,025.00
2,249,130.00
1,680,904.00 1,824,694.002,017,368.00
2010-11Actual
2012-13Proposed
2011-12Amended
2011-12Estimated
2009-10Actual
2011-12Amended
2010-11Actual
2011-12Estimated
2012-13Proposed
2009-10Actual
Requirements
Convention Center Operating Fund 1,515,389 1,364,462 1,876,8361,576,2111,174,248
Palmer Events Center Operating Fund 191,637 191,637 193,831101,116103,921
$1,707,026 $1,556,099 $2,070,667Total Requirements $1,677,327$1,278,169
Full-Time Equivalents
Convention Center Operating Fund 13.25 12.50 12.50 12.5012.00
Palmer Events Center Operating Fund 1.75 1.50 1.50 1.502.00
Total FTEs 15.00 14.00 14.00 14.0014.00
Performance Measures
Exhibit Services Service-RelatedRefunds as a percent of Revenue
0.40-0.03 0.03 0.020
Exhibit Services Revenue 1,680,9042,249,130 1,824,694 2,017,3681,784,025
ServicesElectrical/Power/Equipment Rentals; Phone/voice services to clients; Computer/networking/data/internet services
Bold/Italicized Measure = Key Indicator
2012-13 Proposed Budget, Austin, TX
Volume I | 395
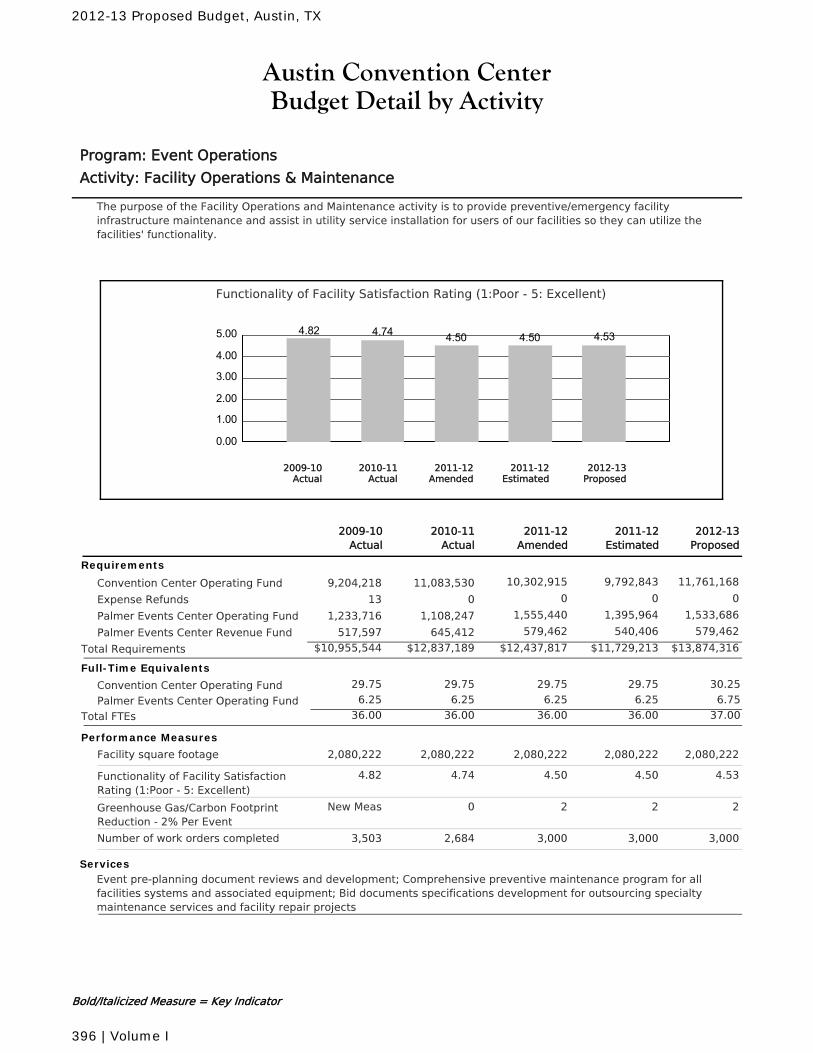
Austin Convention CenterBudget Detail by Activity
Program: Event Operations
Activity: Facility Operations & Maintenance
The purpose of the Facility Operations and Maintenance activity is to provide preventive/emergency facilityinfrastructure maintenance and assist in utility service installation for users of our facilities so they can utilize thefacilities' functionality.
Functionality of Facility Satisfaction Rating (1:Poor - 5: Excellent)
0.00
1.00
2.00
3.00
4.00
5.00 4.82 4.74 4.50 4.50 4.53
2010-11Actual
2012-13Proposed
2011-12Amended
2011-12Estimated
2009-10Actual
2011-12Amended
2010-11Actual
2011-12Estimated
2012-13Proposed
2009-10Actual
Requirements
Convention Center Operating Fund 10,302,915 9,792,843 11,761,16811,083,5309,204,218
Expense Refunds 0 0 0013
Palmer Events Center Operating Fund 1,555,440 1,395,964 1,533,6861,108,2471,233,716
Palmer Events Center Revenue Fund 579,462 540,406 579,462645,412517,597
$12,437,817 $11,729,213 $13,874,316Total Requirements $12,837,189$10,955,544
Full-Time Equivalents
Convention Center Operating Fund 29.75 29.75 29.75 30.2529.75
Palmer Events Center Operating Fund 6.25 6.25 6.25 6.756.25
Total FTEs 36.00 36.00 36.00 37.0036.00
Performance Measures
Facility square footage 2,080,2222,080,222 2,080,222 2,080,2222,080,222
Functionality of Facility SatisfactionRating (1:Poor - 5: Excellent)
4.504.74 4.50 4.534.82
Greenhouse Gas/Carbon FootprintReduction - 2% Per Event
20 2 2New Meas
Number of work orders completed 3,0002,684 3,000 3,0003,503
ServicesEvent pre-planning document reviews and development; Comprehensive preventive maintenance program for allfacilities systems and associated equipment; Bid documents specifications development for outsourcing specialtymaintenance services and facility repair projects
Bold/Italicized Measure = Key Indicator
2012-13 Proposed Budget, Austin, TX
396 | Volume I
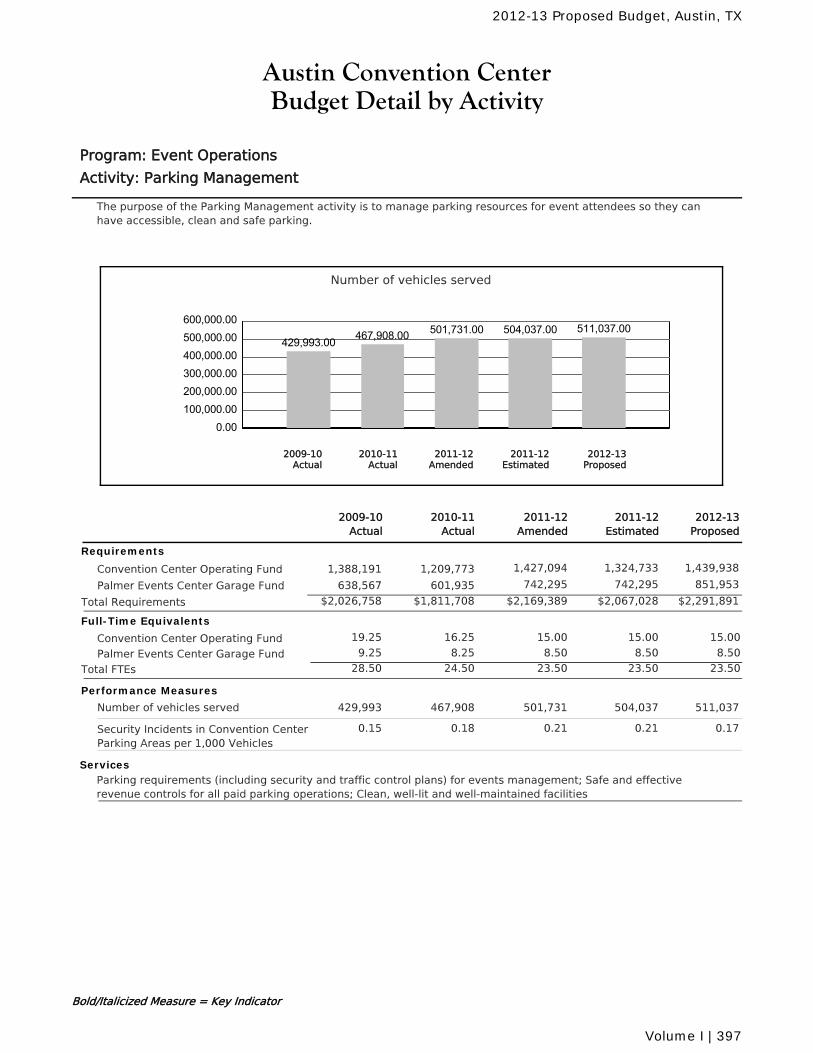
Austin Convention CenterBudget Detail by Activity
Program: Event Operations
Activity: Parking Management
The purpose of the Parking Management activity is to manage parking resources for event attendees so they canhave accessible, clean and safe parking.
Number of vehicles served
0.00100,000.00200,000.00300,000.00400,000.00500,000.00600,000.00
429,993.00 467,908.00 501,731.00 504,037.00 511,037.00
2010-11Actual
2012-13Proposed
2011-12Amended
2011-12Estimated
2009-10Actual
2011-12Amended
2010-11Actual
2011-12Estimated
2012-13Proposed
2009-10Actual
Requirements
Convention Center Operating Fund 1,427,094 1,324,733 1,439,9381,209,7731,388,191
Palmer Events Center Garage Fund 742,295 742,295 851,953601,935638,567
$2,169,389 $2,067,028 $2,291,891Total Requirements $1,811,708$2,026,758
Full-Time Equivalents
Convention Center Operating Fund 16.25 15.00 15.00 15.0019.25
Palmer Events Center Garage Fund 8.25 8.50 8.50 8.509.25
Total FTEs 24.50 23.50 23.50 23.5028.50
Performance Measures
Number of vehicles served 501,731467,908 504,037 511,037429,993
Security Incidents in Convention CenterParking Areas per 1,000 Vehicles
0.210.18 0.21 0.170.15
ServicesParking requirements (including security and traffic control plans) for events management; Safe and effectiverevenue controls for all paid parking operations; Clean, well-lit and well-maintained facilities
Bold/Italicized Measure = Key Indicator
2012-13 Proposed Budget, Austin, TX
Volume I | 397
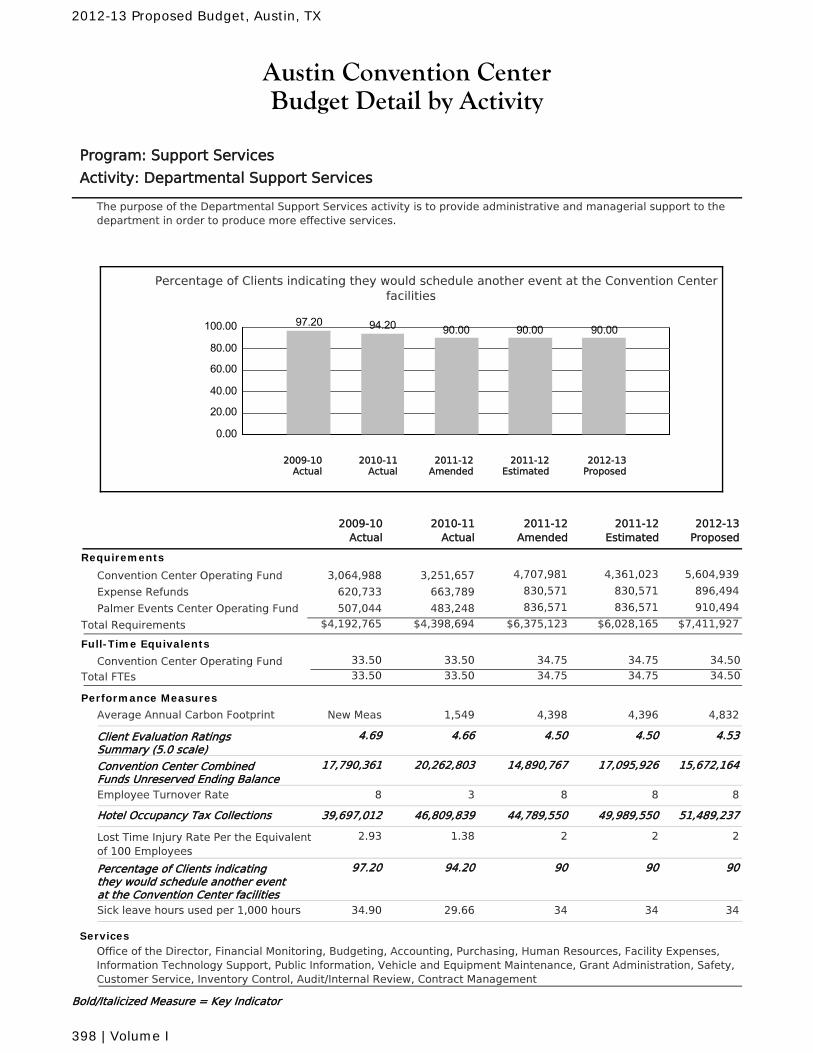
Austin Convention CenterBudget Detail by Activity
Program: Support Services
Activity: Departmental Support Services
The purpose of the Departmental Support Services activity is to provide administrative and managerial support to thedepartment in order to produce more effective services.
Percentage of Clients indicating they would schedule another event at the Convention Centerfacilities
0.00
20.00
40.00
60.00
80.00
100.00 97.20 94.20 90.00 90.00 90.00
2010-11Actual
2012-13Proposed
2011-12Amended
2011-12Estimated
2009-10Actual
2011-12Amended
2010-11Actual
2011-12Estimated
2012-13Proposed
2009-10Actual
Requirements
Convention Center Operating Fund 4,707,981 4,361,023 5,604,9393,251,6573,064,988
Expense Refunds 830,571 830,571 896,494663,789620,733
Palmer Events Center Operating Fund 836,571 836,571 910,494483,248507,044
$6,375,123 $6,028,165 $7,411,927Total Requirements $4,398,694$4,192,765
Full-Time Equivalents
Convention Center Operating Fund 33.50 34.75 34.75 34.5033.50
Total FTEs 33.50 34.75 34.75 34.5033.50
Performance Measures
Average Annual Carbon Footprint 4,3981,549 4,396 4,832New Meas
Client Evaluation RatingsSummary (5.0 scale)
4.504.66 4.50 4.534.69
Convention Center CombinedFunds Unreserved Ending Balance
14,890,76720,262,803 17,095,926 15,672,16417,790,361
Employee Turnover Rate 83 8 88
Hotel Occupancy Tax Collections 44,789,55046,809,839 49,989,550 51,489,23739,697,012
Lost Time Injury Rate Per the Equivalentof 100 Employees
21.38 2 22.93
Percentage of Clients indicatingthey would schedule another eventat the Convention Center facilities
9094.20 90 9097.20
Sick leave hours used per 1,000 hours 3429.66 34 3434.90
ServicesOffice of the Director, Financial Monitoring, Budgeting, Accounting, Purchasing, Human Resources, Facility Expenses,Information Technology Support, Public Information, Vehicle and Equipment Maintenance, Grant Administration, Safety,Customer Service, Inventory Control, Audit/Internal Review, Contract Management
Bold/Italicized Measure = Key Indicator
2012-13 Proposed Budget, Austin, TX
398 | Volume I
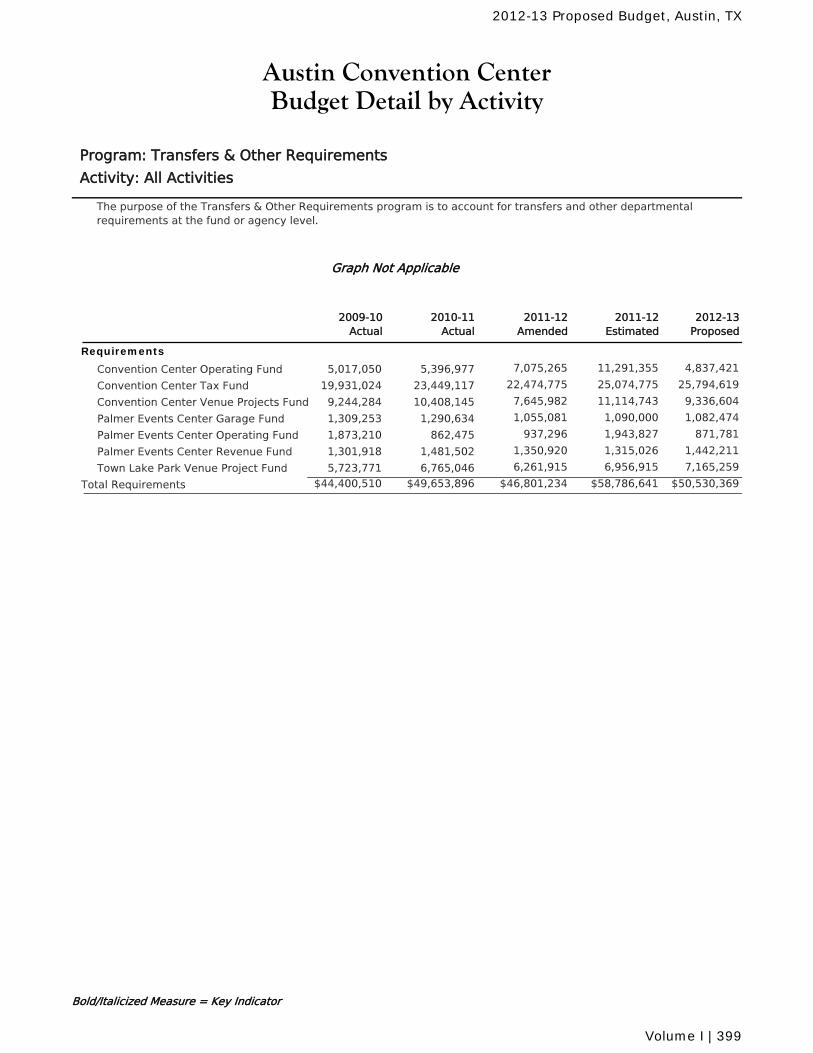
Austin Convention CenterBudget Detail by Activity
Program: Transfers & Other Requirements
Activity: All Activities
The purpose of the Transfers & Other Requirements program is to account for transfers and other departmentalrequirements at the fund or agency level.
Graph Not Applicable
2011-12Amended
2010-11Actual
2011-12Estimated
2012-13Proposed
2009-10Actual
Requirements
Convention Center Operating Fund 7,075,265 11,291,355 4,837,4215,396,9775,017,050
Convention Center Tax Fund 22,474,775 25,074,775 25,794,61923,449,11719,931,024
Convention Center Venue Projects Fund 7,645,982 11,114,743 9,336,60410,408,1459,244,284
Palmer Events Center Garage Fund 1,055,081 1,090,000 1,082,4741,290,6341,309,253
Palmer Events Center Operating Fund 937,296 1,943,827 871,781862,4751,873,210
Palmer Events Center Revenue Fund 1,350,920 1,315,026 1,442,2111,481,5021,301,918
Town Lake Park Venue Project Fund 6,261,915 6,956,915 7,165,2596,765,0465,723,771
$46,801,234 $58,786,641 $50,530,369Total Requirements $49,653,896$44,400,510
Bold/Italicized Measure = Key Indicator
2012-13 Proposed Budget, Austin, TX
Volume I | 399
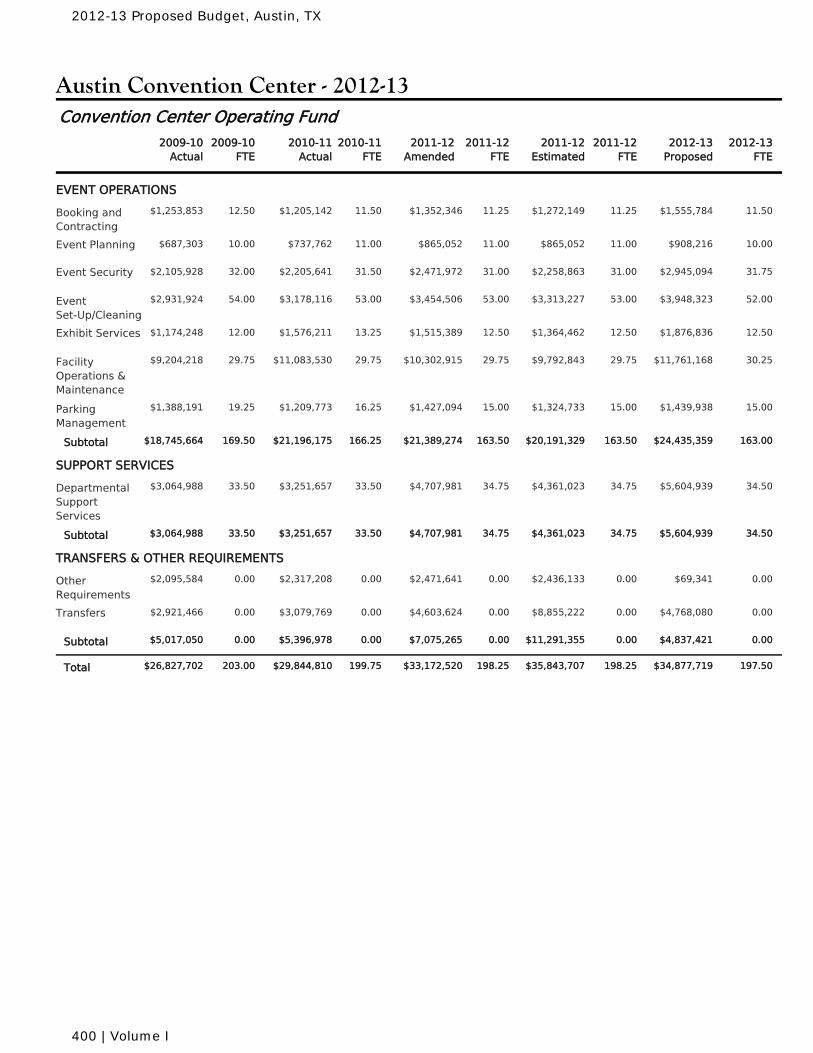
Austin Convention Center - 2012-13
2010-11Actual
2010-11FTE
2011-12Amended
2011-12FTE
2011-12Estimated
2011-12FTE
2009-10Actual
2009-10FTE
2012-13Proposed
2012-13FTE
Convention Center Operating Fund
EVENT OPERATIONS
$1,205,142 11.50 $1,352,346 11.25 $1,272,149 11.25Booking andContracting
12.50 $1,555,784 11.50$1,253,853
$737,762 11.00 $865,052 11.00 $865,052 11.00Event Planning 10.00 $908,216 10.00$687,303
$2,205,641 31.50 $2,471,972 31.00 $2,258,863 31.00Event Security 32.00 $2,945,094 31.75$2,105,928
$3,178,116 53.00 $3,454,506 53.00 $3,313,227 53.00EventSet-Up/Cleaning
54.00 $3,948,323 52.00$2,931,924
$1,576,211 13.25 $1,515,389 12.50 $1,364,462 12.50Exhibit Services 12.00 $1,876,836 12.50$1,174,248
$11,083,530 29.75 $10,302,915 29.75 $9,792,843 29.75FacilityOperations &Maintenance
29.75 $11,761,168 30.25$9,204,218
$1,209,773 16.25 $1,427,094 15.00 $1,324,733 15.00ParkingManagement
19.25 $1,439,938 15.00$1,388,191
$21,196,175 166.25 $21,389,274 163.50 $20,191,329 163.50Subtotal 169.50 $24,435,359 163.00$18,745,664
SUPPORT SERVICES
$3,251,657 33.50 $4,707,981 34.75 $4,361,023 34.75DepartmentalSupportServices
33.50 $5,604,939 34.50$3,064,988
$3,251,657 33.50 $4,707,981 34.75 $4,361,023 34.75Subtotal 33.50 $5,604,939 34.50$3,064,988
TRANSFERS & OTHER REQUIREMENTS
$2,317,208 0.00 $2,471,641 0.00 $2,436,133 0.00OtherRequirements
0.00 $69,341 0.00$2,095,584
$3,079,769 0.00 $4,603,624 0.00 $8,855,222 0.00Transfers 0.00 $4,768,080 0.00$2,921,466
$5,396,978 0.00 $7,075,265 0.00 $11,291,355 0.00Subtotal 0.00 $4,837,421 0.00$5,017,050
$29,844,810 199.75 $33,172,520 198.25 $35,843,707 198.25Total 203.00 $34,877,719 197.50$26,827,702
2012-13 Proposed Budget, Austin, TX
400 | Volume I
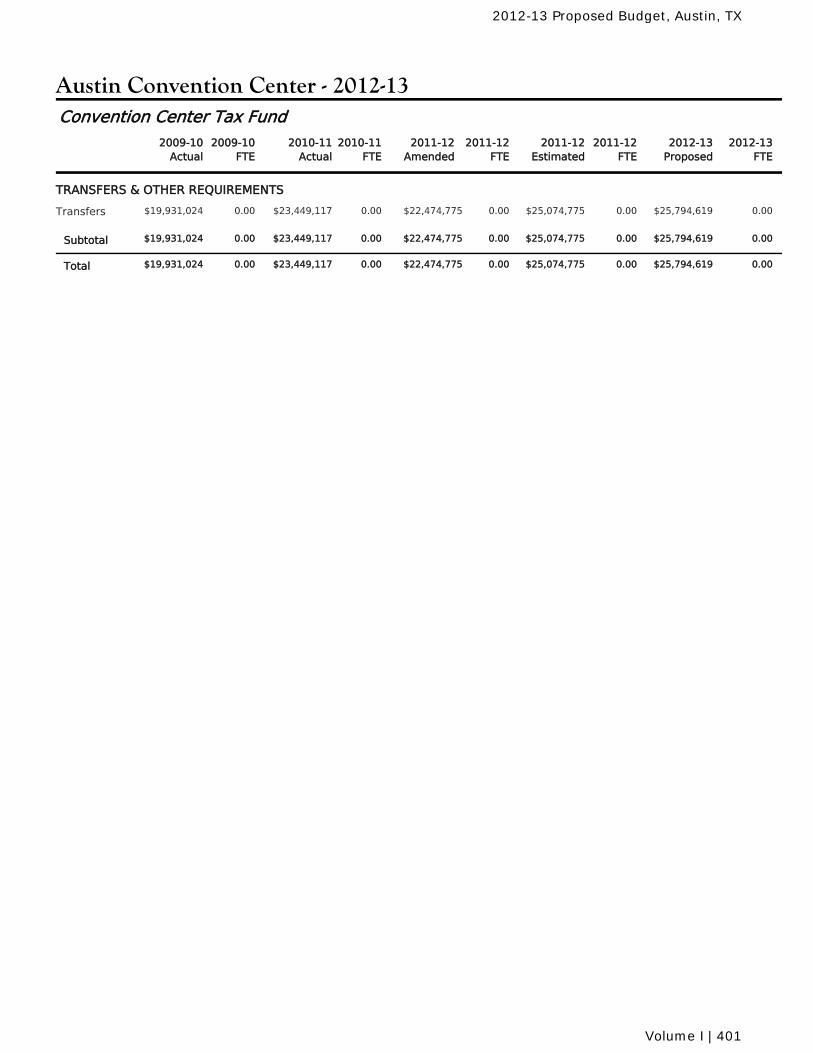
Austin Convention Center - 2012-13
2010-11Actual
2010-11FTE
2011-12Amended
2011-12FTE
2011-12Estimated
2011-12FTE
2009-10Actual
2009-10FTE
2012-13Proposed
2012-13FTE
Convention Center Tax Fund
TRANSFERS & OTHER REQUIREMENTS
$23,449,117 0.00 $22,474,775 0.00 $25,074,775 0.00Transfers 0.00 $25,794,619 0.00$19,931,024
$23,449,117 0.00 $22,474,775 0.00 $25,074,775 0.00Subtotal 0.00 $25,794,619 0.00$19,931,024
$23,449,117 0.00 $22,474,775 0.00 $25,074,775 0.00Total 0.00 $25,794,619 0.00$19,931,024
2012-13 Proposed Budget, Austin, TX
Volume I | 401
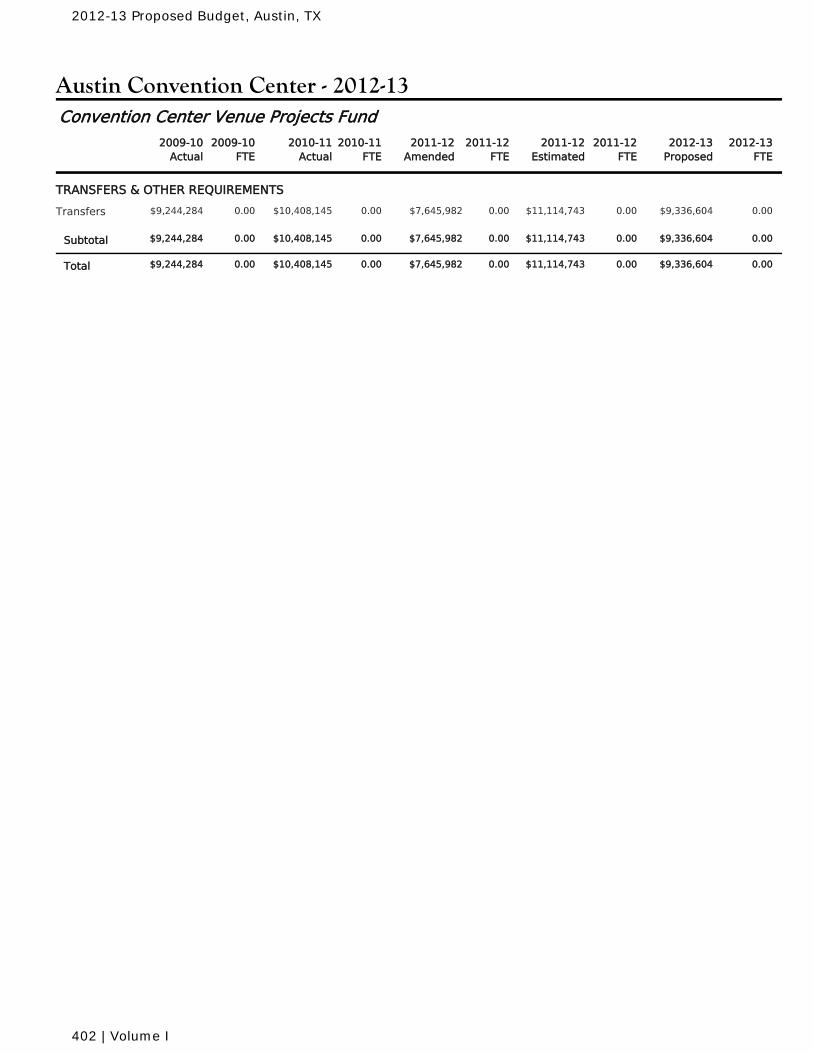
Austin Convention Center - 2012-13
2010-11Actual
2010-11FTE
2011-12Amended
2011-12FTE
2011-12Estimated
2011-12FTE
2009-10Actual
2009-10FTE
2012-13Proposed
2012-13FTE
Convention Center Venue Projects Fund
TRANSFERS & OTHER REQUIREMENTS
$10,408,145 0.00 $7,645,982 0.00 $11,114,743 0.00Transfers 0.00 $9,336,604 0.00$9,244,284
$10,408,145 0.00 $7,645,982 0.00 $11,114,743 0.00Subtotal 0.00 $9,336,604 0.00$9,244,284
$10,408,145 0.00 $7,645,982 0.00 $11,114,743 0.00Total 0.00 $9,336,604 0.00$9,244,284
2012-13 Proposed Budget, Austin, TX
402 | Volume I
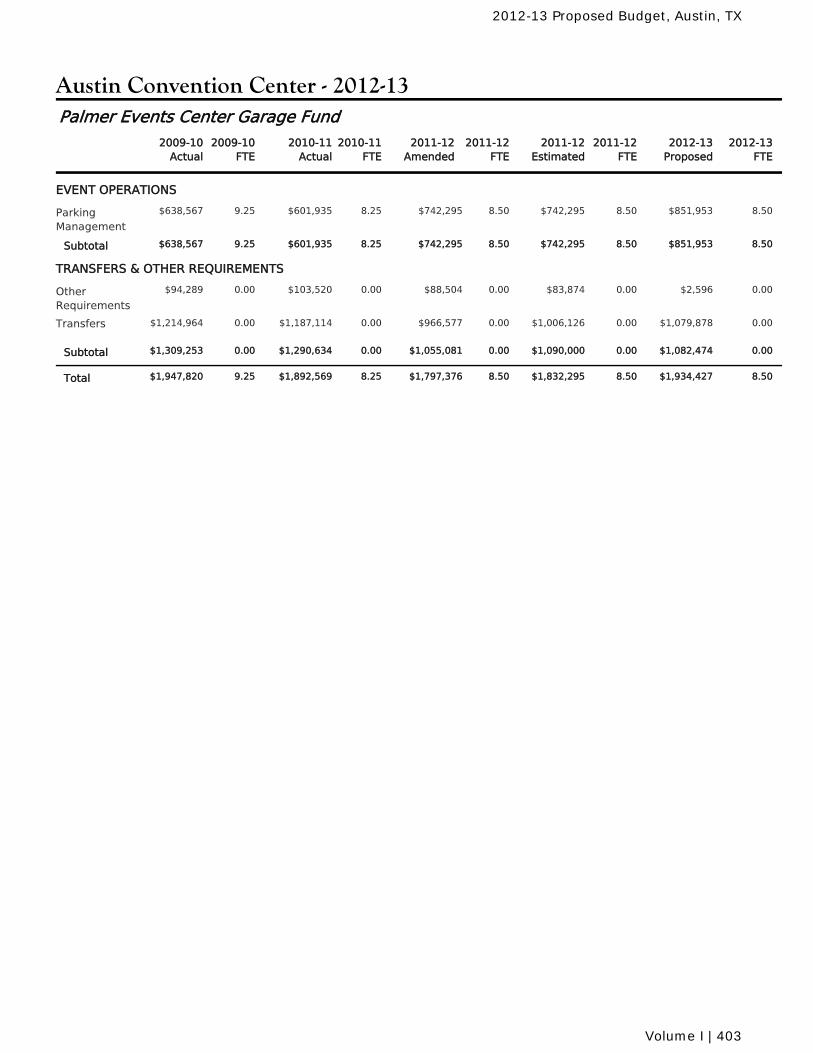
Austin Convention Center - 2012-13
2010-11Actual
2010-11FTE
2011-12Amended
2011-12FTE
2011-12Estimated
2011-12FTE
2009-10Actual
2009-10FTE
2012-13Proposed
2012-13FTE
Palmer Events Center Garage Fund
EVENT OPERATIONS
$601,935 8.25 $742,295 8.50 $742,295 8.50ParkingManagement
9.25 $851,953 8.50$638,567
$601,935 8.25 $742,295 8.50 $742,295 8.50Subtotal 9.25 $851,953 8.50$638,567
TRANSFERS & OTHER REQUIREMENTS
$103,520 0.00 $88,504 0.00 $83,874 0.00OtherRequirements
0.00 $2,596 0.00$94,289
$1,187,114 0.00 $966,577 0.00 $1,006,126 0.00Transfers 0.00 $1,079,878 0.00$1,214,964
$1,290,634 0.00 $1,055,081 0.00 $1,090,000 0.00Subtotal 0.00 $1,082,474 0.00$1,309,253
$1,892,569 8.25 $1,797,376 8.50 $1,832,295 8.50Total 9.25 $1,934,427 8.50$1,947,820
2012-13 Proposed Budget, Austin, TX
Volume I | 403
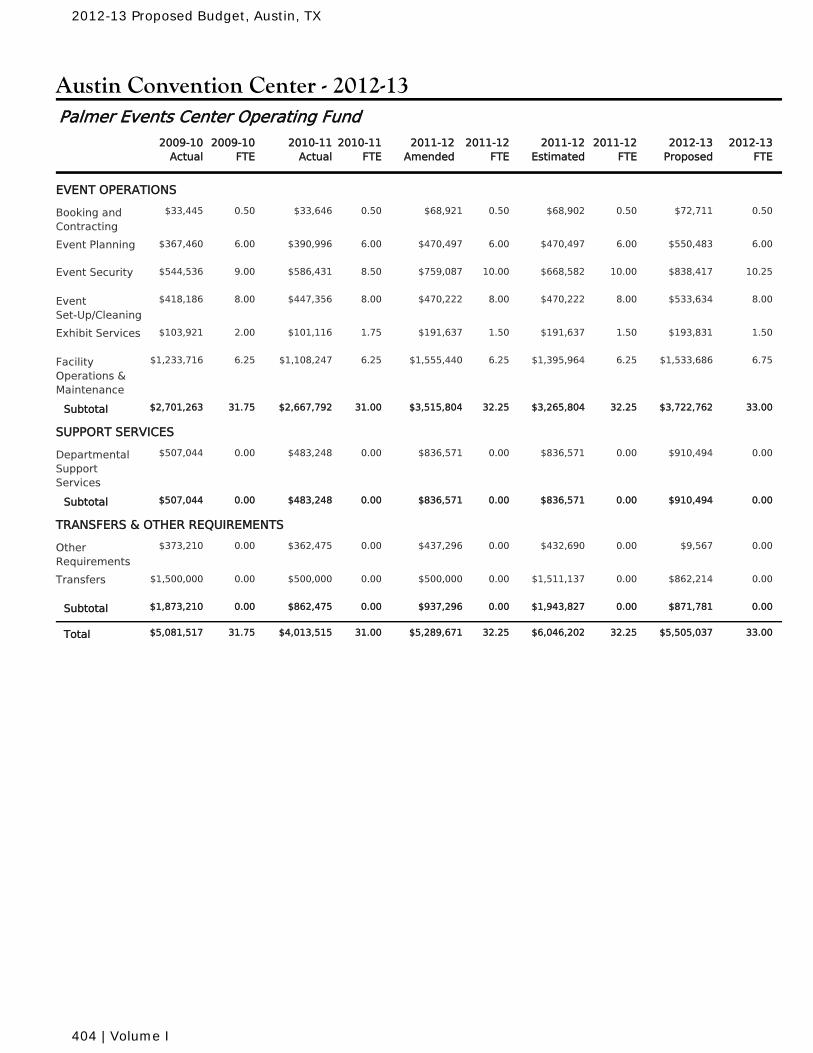
Austin Convention Center - 2012-13
2010-11Actual
2010-11FTE
2011-12Amended
2011-12FTE
2011-12Estimated
2011-12FTE
2009-10Actual
2009-10FTE
2012-13Proposed
2012-13FTE
Palmer Events Center Operating Fund
EVENT OPERATIONS
$33,646 0.50 $68,921 0.50 $68,902 0.50Booking andContracting
0.50 $72,711 0.50$33,445
$390,996 6.00 $470,497 6.00 $470,497 6.00Event Planning 6.00 $550,483 6.00$367,460
$586,431 8.50 $759,087 10.00 $668,582 10.00Event Security 9.00 $838,417 10.25$544,536
$447,356 8.00 $470,222 8.00 $470,222 8.00EventSet-Up/Cleaning
8.00 $533,634 8.00$418,186
$101,116 1.75 $191,637 1.50 $191,637 1.50Exhibit Services 2.00 $193,831 1.50$103,921
$1,108,247 6.25 $1,555,440 6.25 $1,395,964 6.25FacilityOperations &Maintenance
6.25 $1,533,686 6.75$1,233,716
$2,667,792 31.00 $3,515,804 32.25 $3,265,804 32.25Subtotal 31.75 $3,722,762 33.00$2,701,263
SUPPORT SERVICES
$483,248 0.00 $836,571 0.00 $836,571 0.00DepartmentalSupportServices
0.00 $910,494 0.00$507,044
$483,248 0.00 $836,571 0.00 $836,571 0.00Subtotal 0.00 $910,494 0.00$507,044
TRANSFERS & OTHER REQUIREMENTS
$362,475 0.00 $437,296 0.00 $432,690 0.00OtherRequirements
0.00 $9,567 0.00$373,210
$500,000 0.00 $500,000 0.00 $1,511,137 0.00Transfers 0.00 $862,214 0.00$1,500,000
$862,475 0.00 $937,296 0.00 $1,943,827 0.00Subtotal 0.00 $871,781 0.00$1,873,210
$4,013,515 31.00 $5,289,671 32.25 $6,046,202 32.25Total 31.75 $5,505,037 33.00$5,081,517
2012-13 Proposed Budget, Austin, TX
404 | Volume I
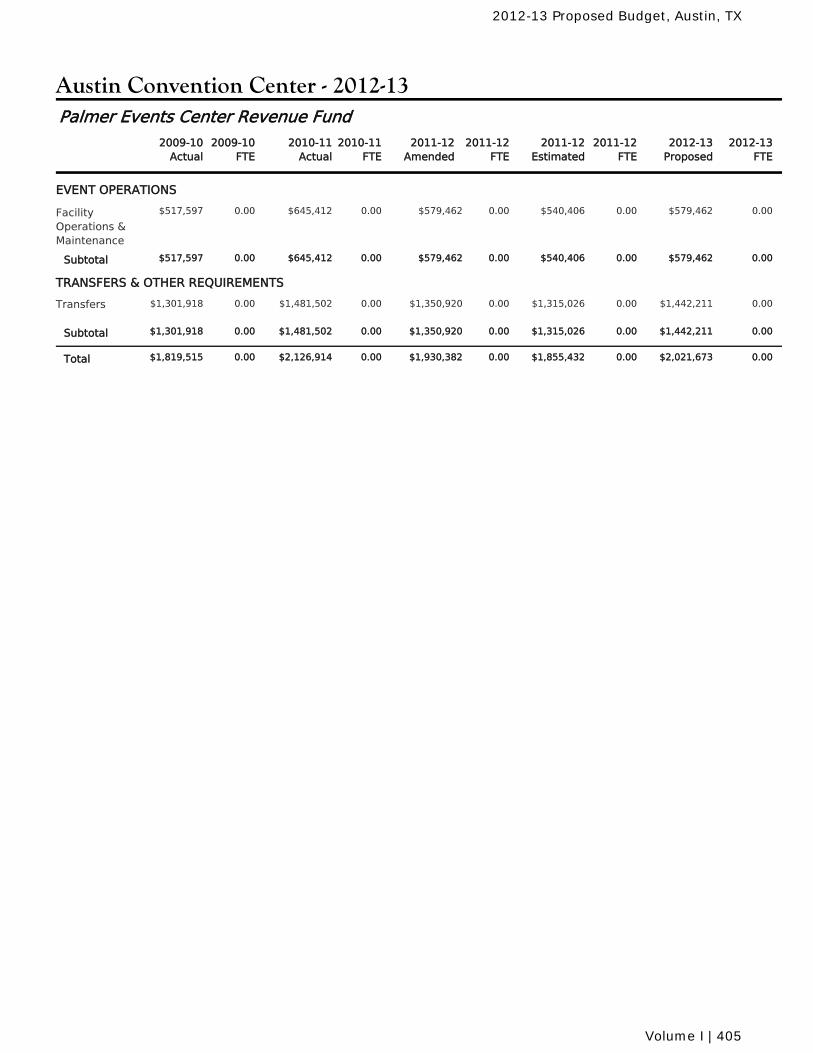
Austin Convention Center - 2012-13
2010-11Actual
2010-11FTE
2011-12Amended
2011-12FTE
2011-12Estimated
2011-12FTE
2009-10Actual
2009-10FTE
2012-13Proposed
2012-13FTE
Palmer Events Center Revenue Fund
EVENT OPERATIONS
$645,412 0.00 $579,462 0.00 $540,406 0.00FacilityOperations &Maintenance
0.00 $579,462 0.00$517,597
$645,412 0.00 $579,462 0.00 $540,406 0.00Subtotal 0.00 $579,462 0.00$517,597
TRANSFERS & OTHER REQUIREMENTS
$1,481,502 0.00 $1,350,920 0.00 $1,315,026 0.00Transfers 0.00 $1,442,211 0.00$1,301,918
$1,481,502 0.00 $1,350,920 0.00 $1,315,026 0.00Subtotal 0.00 $1,442,211 0.00$1,301,918
$2,126,914 0.00 $1,930,382 0.00 $1,855,432 0.00Total 0.00 $2,021,673 0.00$1,819,515
2012-13 Proposed Budget, Austin, TX
Volume I | 405
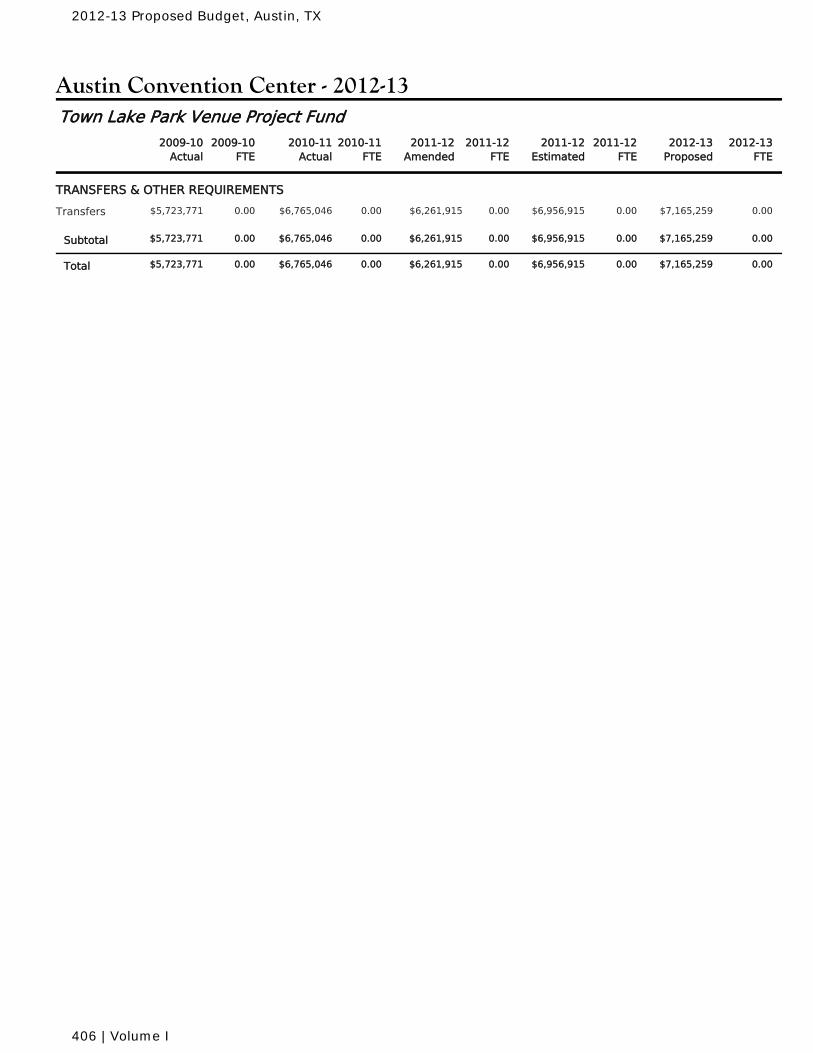
Austin Convention Center - 2012-13
2010-11Actual
2010-11FTE
2011-12Amended
2011-12FTE
2011-12Estimated
2011-12FTE
2009-10Actual
2009-10FTE
2012-13Proposed
2012-13FTE
Town Lake Park Venue Project Fund
TRANSFERS & OTHER REQUIREMENTS
$6,765,046 0.00 $6,261,915 0.00 $6,956,915 0.00Transfers 0.00 $7,165,259 0.00$5,723,771
$6,765,046 0.00 $6,261,915 0.00 $6,956,915 0.00Subtotal 0.00 $7,165,259 0.00$5,723,771
$6,765,046 0.00 $6,261,915 0.00 $6,956,915 0.00Total 0.00 $7,165,259 0.00$5,723,771
2012-13 Proposed Budget, Austin, TX
406 | Volume I
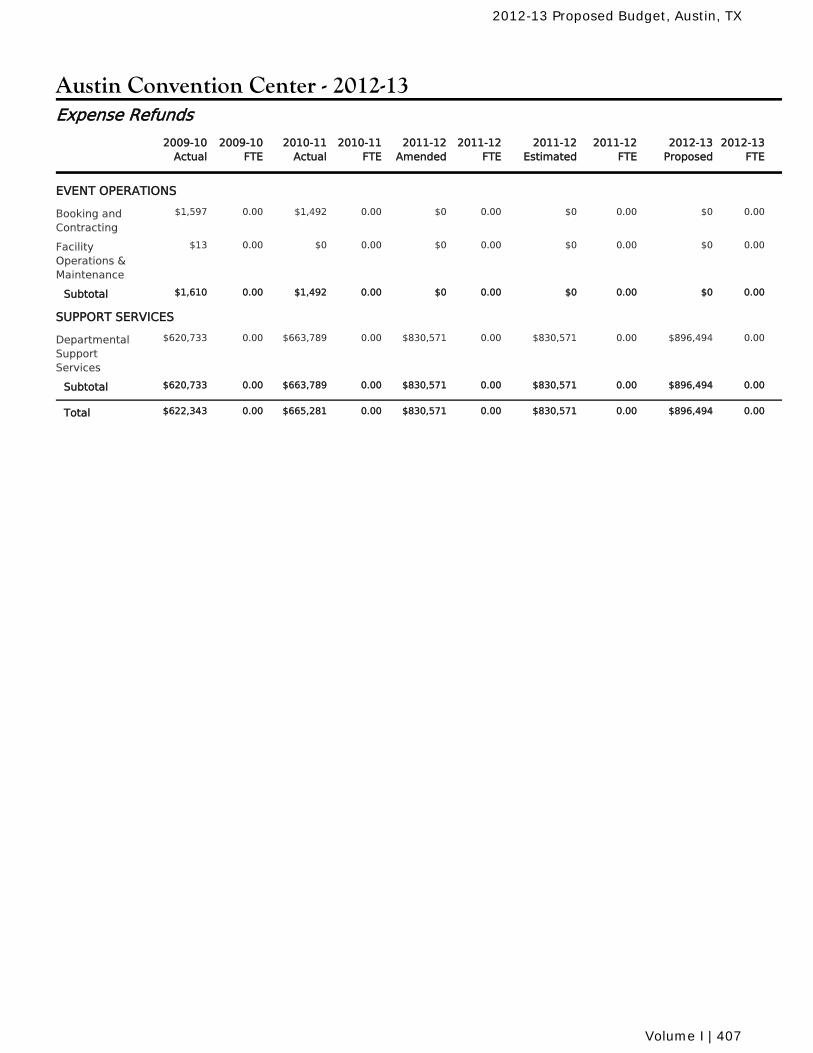
Austin Convention Center - 2012-13
2010-11Actual
2010-11FTE
2011-12Amended
2011-12FTE
2011-12Estimated
2011-12FTE
2009-10Actual
2009-10FTE
2012-13Proposed
2012-13FTE
Expense Refunds
EVENT OPERATIONS
$1,492 0.00 $0 0.00 $0 0.00Booking andContracting
0.00 $0 0.00$1,597
$0 0.00 $0 0.00 $0 0.00FacilityOperations &Maintenance
0.00 $0 0.00$13
$1,492 0.00 $0 0.00 $0 0.00Subtotal 0.00 $0 0.00$1,610
SUPPORT SERVICES
$663,789 0.00 $830,571 0.00 $830,571 0.00DepartmentalSupportServices
0.00 $896,494 0.00$620,733
$663,789 0.00 $830,571 0.00 $830,571 0.00Subtotal 0.00 $896,494 0.00$620,733
$665,281 0.00 $830,571 0.00 $830,571 0.00Total 0.00 $896,494 0.00$622,343
2012-13 Proposed Budget, Austin, TX
Volume I | 407

2012-13 Proposed Budget, Austin, TX
408 | Volume I
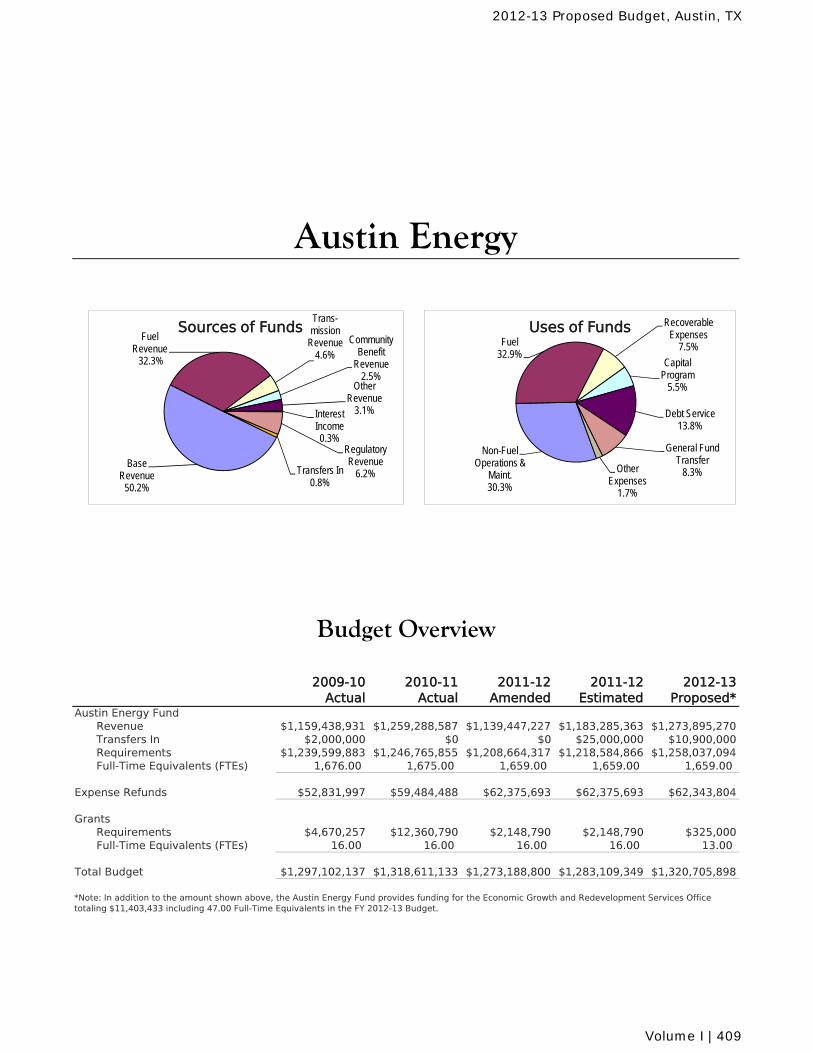
2009-10 Actual
2010-11 Actual
2011-12 Amended
2011-12 Estimated
2012-13 Proposed*
Austin Energy FundRevenue $1,159,438,931 $1,259,288,587 $1,139,447,227 $1,183,285,363 $1,273,895,270Transfers In $2,000,000 $0 $0 $25,000,000 $10,900,000Requirements $1,239,599,883 $1,246,765,855 $1,208,664,317 $1,218,584,866 $1,258,037,094Full-Time Equivalents (FTEs) 1,676.00 1,675.00 1,659.00 1,659.00 1,659.00
Expense Refunds $52,831,997 $59,484,488 $62,375,693 $62,375,693 $62,343,804
GrantsRequirements $4,670,257 $12,360,790 $2,148,790 $2,148,790 $325,000Full-Time Equivalents (FTEs) 16.00 16.00 16.00 16.00 13.00
Total Budget $1,297,102,137 $1,318,611,133 $1,273,188,800 $1,283,109,349 $1,320,705,898
Budget Overview
Austin Energy
*Note: In addition to the amount shown above, the Austin Energy Fund provides funding for the Economic Growth and Redevelopment Services Office totaling $11,403,433 including 47.00 Full-Time Equivalents in the FY 2012-13 Budget.
Base Revenue
50.2%
Fuel Revenue
32.3%
Trans-mission
Revenue4.6%
Community Benefit
Revenue2.5%
Other Revenue
3.1%Interest Income0.3%
Regulatory Revenue
6.2%Transfers In0.8%
Sources of Funds
Non-Fuel Operations &
Maint.30.3%
Fuel32.9%
Recoverable Expenses
7.5%
Capital Program
5.5%
Debt Service13.8%
General Fund Transfer
8.3%Other Expenses
1.7%
Uses of Funds
2012-13 Proposed Budget, Austin, TX
Volume I | 409
Austin EnergyOrganization by Program and Activity for 2013
311 City-Wide Call CenterBilling and Revenue MeasurementCustomer Contact Center
Conservation Rebates and IncentivesDemand Side Management
Distribution ServicesPower Delivery SupportTransmission Services
Fuel Expense
Nuclear and Coal Plants OperatingPower Production
Departmental Support Services
Interfund TransfersOther Requirements
2012-13 Proposed Budget, Austin, TX
410 | Volume I
Austin EnergyMission and Goals for 2013
The mission of the Austin Energy Department is to deliver clean, affordable, reliable energy andexcellent customer service.
Austin Energy is proactive in developing an understanding of its customers by monitoring indicatorsand conducting customer surveys.
Increase customer satisfaction above 83% on the American Customer Satisfaction Index (ACSI).
Austin Energy will create and sustain economic development by providing contract opportunities forlocal businesses, attracting new businesses, and supporting the development of a clean energyindustry.
Increase Minority and Women Owned Business Enterprise (MBE/WBE) participation forconstruction contracts to 12.9% for MBE and 12.6% for WBE.
Austin Energy will pursue best operating and maintenance practices for its electric delivery systemand power plants to ensure availability and reliability, which supports its Excellent Customer ServiceStrategy.
System Average Interruption Duration Index (SAIDI) at 60 minutes or less.System Average Interruption Frequency Index (SAIFI) at 0.8 interruptions.System Average Transmission Line Performance Index of 4.1 faults.
Maintain strong financial position in support of the Utility's Risk Management strategy and achieveimproved credit ratings as measured by bond ratings agencies.
Achieve the "AA" credit rating on separate lien electric utility system revenue bonds on theStandard & Poor's rating.
Supporting the Energy Resource Strategy, this strategic objective is addressed by the Austin Energylong-range energy resource plan and other emerging energy technology and energy-focusedprograms.
35% of renewable energy in generation portfolio by 2020.15% of energy efficiency by 2020.200 Megawatts (MW) of solar generation by 2020.800 Megawatts (MW) of peak demand savings by 2020.
This energy resource plan is designed to be flexible and dynamic. As circumstances change, the Citymust maintain the flexibility to modify elements to respond to a range of factors, including economicconditions, customer load, fuel prices and availability, infrastructure build-out, technologicaldevelopment, law and regulations, policy direction, and customer needs. The plan will be adaptedand modified to manage risk, maintain system and service reliability, achieve policy goals, and meetcustomer demand for excellence.
2012-13 Proposed Budget, Austin, TX
Volume I | 411
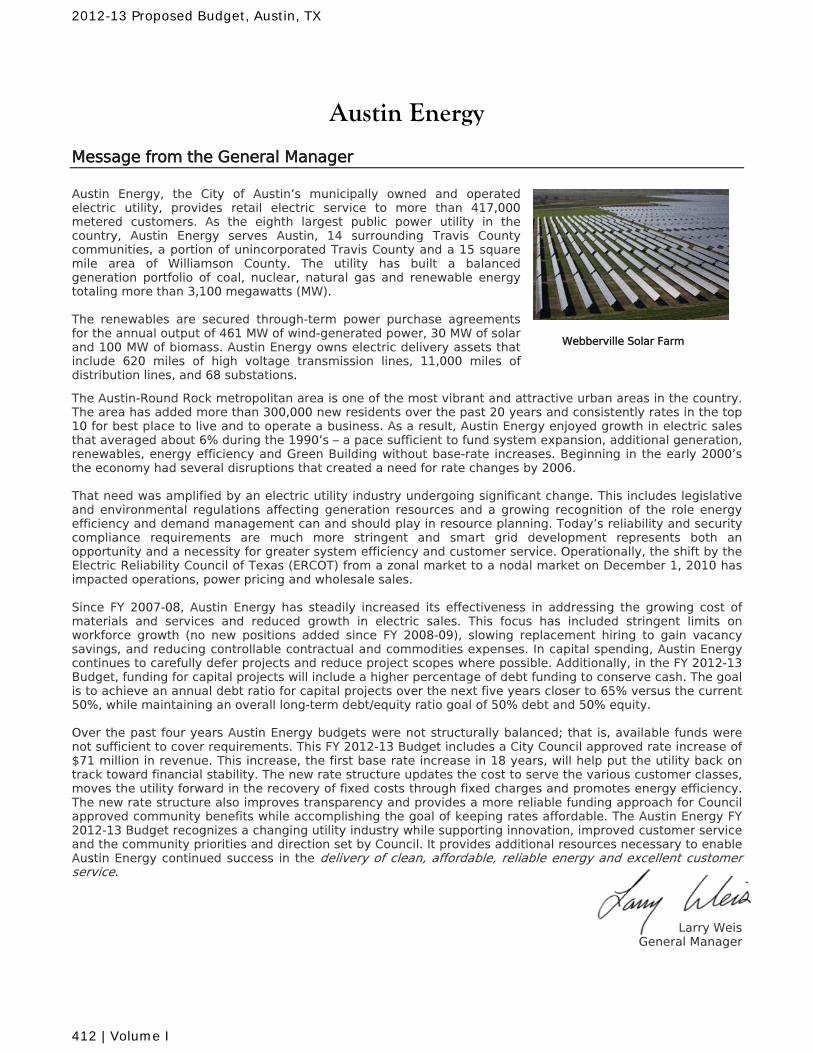
Austin Energy
Message from the General Manager
Austin Energy, the City of Austin’s municipally owned and operated electric utility, provides retail electric service to more than 417,000 metered customers. As the eighth largest public power utility in the country, Austin Energy serves Austin, 14 surrounding Travis County communities, a portion of unincorporated Travis County and a 15 square mile area of Williamson County. The utility has built a balanced generation portfolio of coal, nuclear, natural gas and renewable energy totaling more than 3,100 megawatts (MW). The renewables are secured through-term power purchase agreements for the annual output of 461 MW of wind-generated power, 30 MW of solar and 100 MW of biomass. Austin Energy owns electric delivery assets that include 620 miles of high voltage transmission lines, 11,000 miles of distribution lines, and 68 substations.
The Austin-Round Rock metropolitan area is one of the most vibrant and attractive urban areas in the country. The area has added more than 300,000 new residents over the past 20 years and consistently rates in the top 10 for best place to live and to operate a business. As a result, Austin Energy enjoyed growth in electric sales that averaged about 6% during the 1990’s – a pace sufficient to fund system expansion, additional generation, renewables, energy efficiency and Green Building without base-rate increases. Beginning in the early 2000’s the economy had several disruptions that created a need for rate changes by 2006. That need was amplified by an electric utility industry undergoing significant change. This includes legislative and environmental regulations affecting generation resources and a growing recognition of the role energy efficiency and demand management can and should play in resource planning. Today’s reliability and security compliance requirements are much more stringent and smart grid development represents both an opportunity and a necessity for greater system efficiency and customer service. Operationally, the shift by the Electric Reliability Council of Texas (ERCOT) from a zonal market to a nodal market on December 1, 2010 has impacted operations, power pricing and wholesale sales. Since FY 2007-08, Austin Energy has steadily increased its effectiveness in addressing the growing cost of materials and services and reduced growth in electric sales. This focus has included stringent limits on workforce growth (no new positions added since FY 2008-09), slowing replacement hiring to gain vacancy savings, and reducing controllable contractual and commodities expenses. In capital spending, Austin Energy continues to carefully defer projects and reduce project scopes where possible. Additionally, in the FY 2012-13 Budget, funding for capital projects will include a higher percentage of debt funding to conserve cash. The goal is to achieve an annual debt ratio for capital projects over the next five years closer to 65% versus the current 50%, while maintaining an overall long-term debt/equity ratio goal of 50% debt and 50% equity. Over the past four years Austin Energy budgets were not structurally balanced; that is, available funds were not sufficient to cover requirements. This FY 2012-13 Budget includes a City Council approved rate increase of $71 million in revenue. This increase, the first base rate increase in 18 years, will help put the utility back on track toward financial stability. The new rate structure updates the cost to serve the various customer classes, moves the utility forward in the recovery of fixed costs through fixed charges and promotes energy efficiency. The new rate structure also improves transparency and provides a more reliable funding approach for Council approved community benefits while accomplishing the goal of keeping rates affordable. The Austin Energy FY 2012-13 Budget recognizes a changing utility industry while supporting innovation, improved customer service and the community priorities and direction set by Council. It provides additional resources necessary to enable Austin Energy continued success in the delivery of clean, affordable, reliable energy and excellent customer service.
Larry Weis General Manager
Webberville Solar Farm
2012-13 Proposed Budget, Austin, TX
412 | Volume I
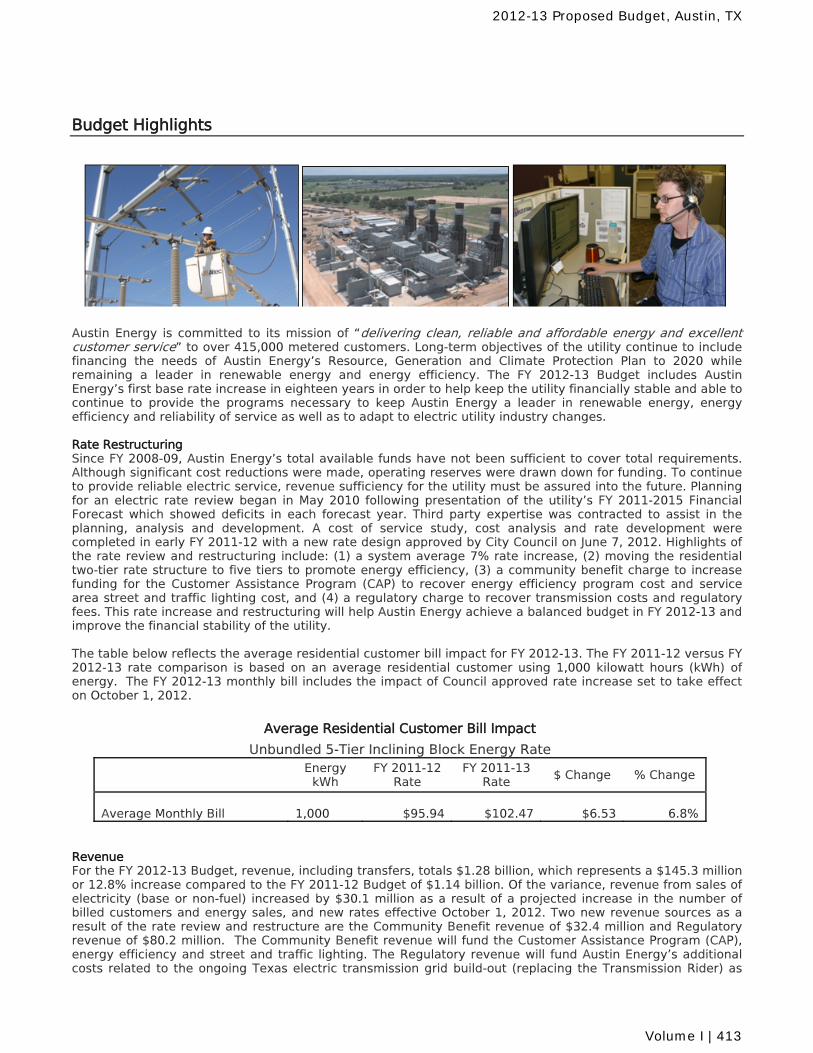
Budget Highlights
Austin Energy is committed to its mission of “delivering clean, reliable and affordable energy and excellent customer service” to over 415,000 metered customers. Long-term objectives of the utility continue to include financing the needs of Austin Energy’s Resource, Generation and Climate Protection Plan to 2020 while remaining a leader in renewable energy and energy efficiency. The FY 2012-13 Budget includes Austin Energy’s first base rate increase in eighteen years in order to help keep the utility financially stable and able to continue to provide the programs necessary to keep Austin Energy a leader in renewable energy, energy efficiency and reliability of service as well as to adapt to electric utility industry changes. Rate Restructuring Since FY 2008-09, Austin Energy’s total available funds have not been sufficient to cover total requirements. Although significant cost reductions were made, operating reserves were drawn down for funding. To continue to provide reliable electric service, revenue sufficiency for the utility must be assured into the future. Planning for an electric rate review began in May 2010 following presentation of the utility’s FY 2011-2015 Financial Forecast which showed deficits in each forecast year. Third party expertise was contracted to assist in the planning, analysis and development. A cost of service study, cost analysis and rate development were completed in early FY 2011-12 with a new rate design approved by City Council on June 7, 2012. Highlights of the rate review and restructuring include: (1) a system average 7% rate increase, (2) moving the residential two-tier rate structure to five tiers to promote energy efficiency, (3) a community benefit charge to increase funding for the Customer Assistance Program (CAP) to recover energy efficiency program cost and service area street and traffic lighting cost, and (4) a regulatory charge to recover transmission costs and regulatory fees. This rate increase and restructuring will help Austin Energy achieve a balanced budget in FY 2012-13 and improve the financial stability of the utility. The table below reflects the average residential customer bill impact for FY 2012-13. The FY 2011-12 versus FY 2012-13 rate comparison is based on an average residential customer using 1,000 kilowatt hours (kWh) of energy. The FY 2012-13 monthly bill includes the impact of Council approved rate increase set to take effect on October 1, 2012.
Average Residential Customer Bill Impact
Unbundled 5-Tier Inclining Block Energy Rate
Energy
kWh FY 2011-12
Rate FY 2011-13
Rate $ Change % Change
Average Monthly Bill 1,000 $95.94 $102.47 $6.53 6.8%
Revenue For the FY 2012-13 Budget, revenue, including transfers, totals $1.28 billion, which represents a $145.3 million or 12.8% increase compared to the FY 2011-12 Budget of $1.14 billion. Of the variance, revenue from sales of electricity (base or non-fuel) increased by $30.1 million as a result of a projected increase in the number of billed customers and energy sales, and new rates effective October 1, 2012. Two new revenue sources as a result of the rate review and restructure are the Community Benefit revenue of $32.4 million and Regulatory revenue of $80.2 million. The Community Benefit revenue will fund the Customer Assistance Program (CAP), energy efficiency and street and traffic lighting. The Regulatory revenue will fund Austin Energy’s additional costs related to the ongoing Texas electric transmission grid build-out (replacing the Transmission Rider) as
2012-13 Proposed Budget, Austin, TX
Volume I | 413
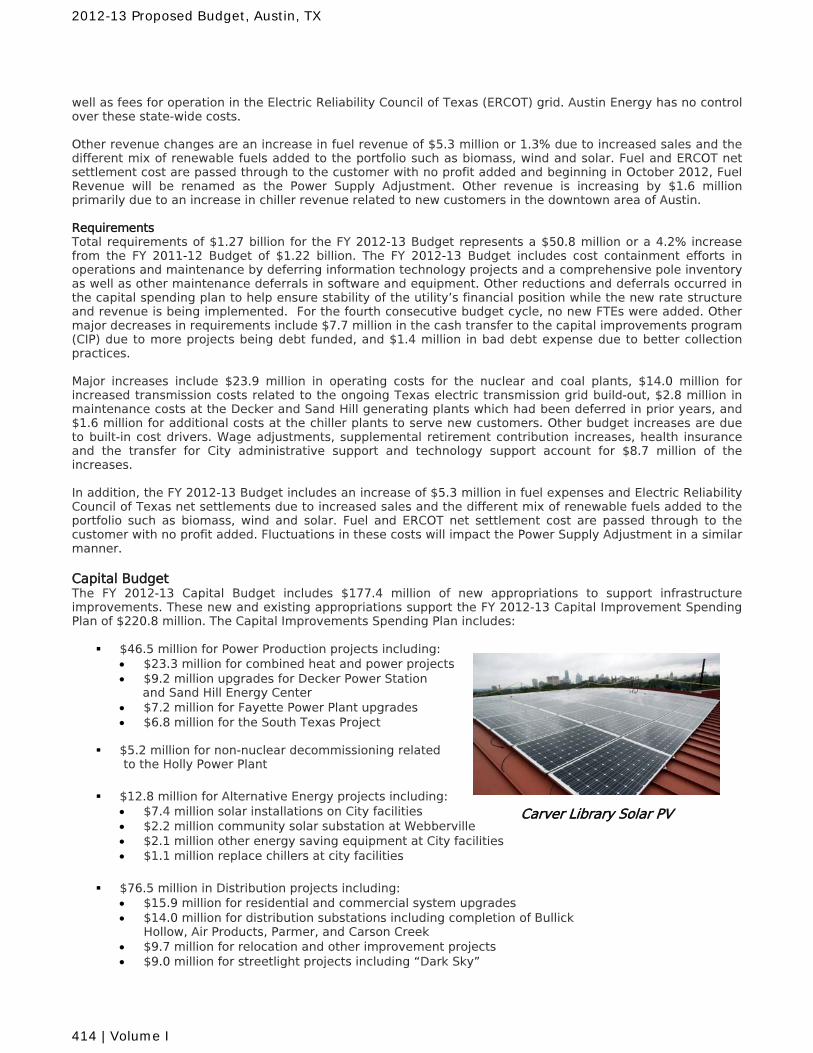
well as fees for operation in the Electric Reliability Council of Texas (ERCOT) grid. Austin Energy has no control over these state-wide costs. Other revenue changes are an increase in fuel revenue of $5.3 million or 1.3% due to increased sales and the different mix of renewable fuels added to the portfolio such as biomass, wind and solar. Fuel and ERCOT net settlement cost are passed through to the customer with no profit added and beginning in October 2012, Fuel Revenue will be renamed as the Power Supply Adjustment. Other revenue is increasing by $1.6 million primarily due to an increase in chiller revenue related to new customers in the downtown area of Austin. Requirements Total requirements of $1.27 billion for the FY 2012-13 Budget represents a $50.8 million or a 4.2% increase from the FY 2011-12 Budget of $1.22 billion. The FY 2012-13 Budget includes cost containment efforts in operations and maintenance by deferring information technology projects and a comprehensive pole inventory as well as other maintenance deferrals in software and equipment. Other reductions and deferrals occurred in the capital spending plan to help ensure stability of the utility’s financial position while the new rate structure and revenue is being implemented. For the fourth consecutive budget cycle, no new FTEs were added. Other major decreases in requirements include $7.7 million in the cash transfer to the capital improvements program (CIP) due to more projects being debt funded, and $1.4 million in bad debt expense due to better collection practices. Major increases include $23.9 million in operating costs for the nuclear and coal plants, $14.0 million for increased transmission costs related to the ongoing Texas electric transmission grid build-out, $2.8 million in maintenance costs at the Decker and Sand Hill generating plants which had been deferred in prior years, and $1.6 million for additional costs at the chiller plants to serve new customers. Other budget increases are due to built-in cost drivers. Wage adjustments, supplemental retirement contribution increases, health insurance and the transfer for City administrative support and technology support account for $8.7 million of the increases. In addition, the FY 2012-13 Budget includes an increase of $5.3 million in fuel expenses and Electric Reliability Council of Texas net settlements due to increased sales and the different mix of renewable fuels added to the portfolio such as biomass, wind and solar. Fuel and ERCOT net settlement cost are passed through to the customer with no profit added. Fluctuations in these costs will impact the Power Supply Adjustment in a similar manner. Capital Budget The FY 2012-13 Capital Budget includes $177.4 million of new appropriations to support infrastructure improvements. These new and existing appropriations support the FY 2012-13 Capital Improvement Spending Plan of $220.8 million. The Capital Improvements Spending Plan includes:
$46.5 million for Power Production projects including: $23.3 million for combined heat and power projects $9.2 million upgrades for Decker Power Station and Sand Hill Energy Center $7.2 million for Fayette Power Plant upgrades $6.8 million for the South Texas Project
$5.2 million for non-nuclear decommissioning related
to the Holly Power Plant
$12.8 million for Alternative Energy projects including:
$7.4 million solar installations on City facilities $2.2 million community solar substation at Webberville $2.1 million other energy saving equipment at City facilities $1.1 million replace chillers at city facilities
$76.5 million in Distribution projects including:
$15.9 million for residential and commercial system upgrades $14.0 million for distribution substations including completion of Bullick
Hollow, Air Products, Parmer, and Carson Creek $9.7 million for relocation and other improvement projects $9.0 million for streetlight projects including “Dark Sky”
Carver Library Solar PV
2012-13 Proposed Budget, Austin, TX
414 | Volume I
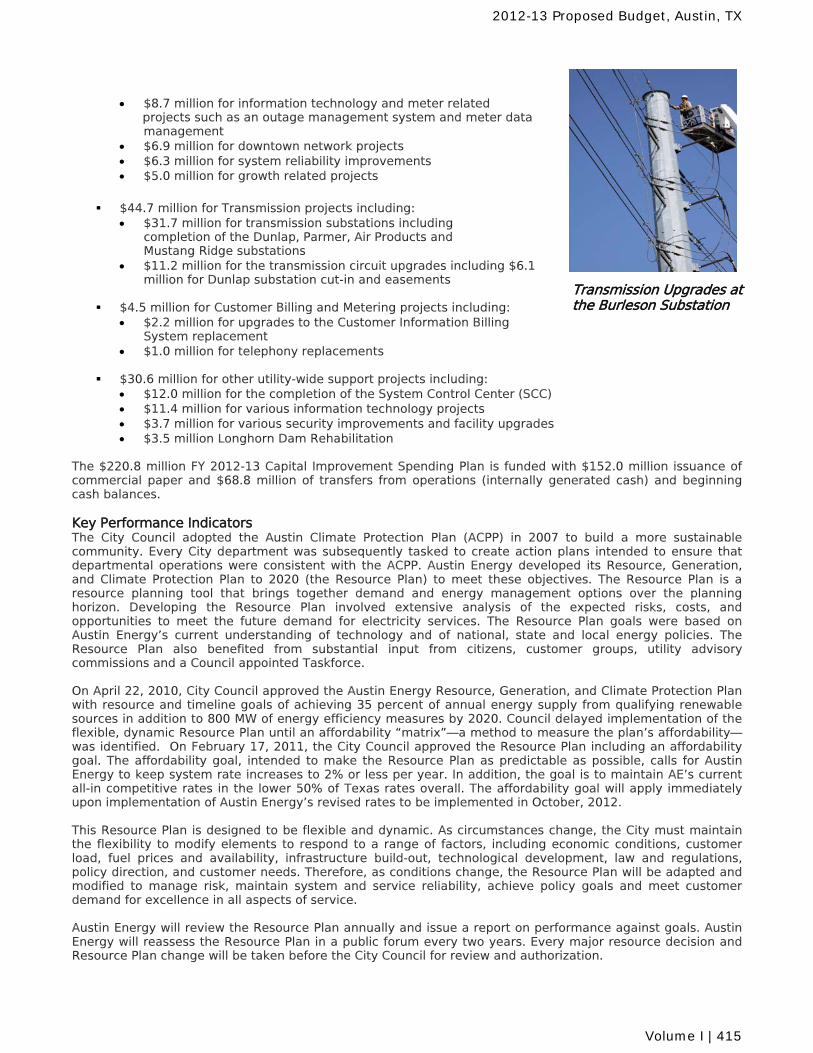
$8.7 million for information technology and meter related projects such as an outage management system and meter data
management $6.9 million for downtown network projects $6.3 million for system reliability improvements $5.0 million for growth related projects
$44.7 million for Transmission projects including:
$31.7 million for transmission substations including completion of the Dunlap, Parmer, Air Products and Mustang Ridge substations
$11.2 million for the transmission circuit upgrades including $6.1 million for Dunlap substation cut-in and easements
$4.5 million for Customer Billing and Metering projects including:
$2.2 million for upgrades to the Customer Information Billing System replacement
$1.0 million for telephony replacements $30.6 million for other utility-wide support projects including:
$12.0 million for the completion of the System Control Center (SCC) $11.4 million for various information technology projects $3.7 million for various security improvements and facility upgrades $3.5 million Longhorn Dam Rehabilitation
The $220.8 million FY 2012-13 Capital Improvement Spending Plan is funded with $152.0 million issuance of commercial paper and $68.8 million of transfers from operations (internally generated cash) and beginning cash balances. Key Performance Indicators The City Council adopted the Austin Climate Protection Plan (ACPP) in 2007 to build a more sustainable community. Every City department was subsequently tasked to create action plans intended to ensure that departmental operations were consistent with the ACPP. Austin Energy developed its Resource, Generation, and Climate Protection Plan to 2020 (the Resource Plan) to meet these objectives. The Resource Plan is a resource planning tool that brings together demand and energy management options over the planning horizon. Developing the Resource Plan involved extensive analysis of the expected risks, costs, and opportunities to meet the future demand for electricity services. The Resource Plan goals were based on Austin Energy’s current understanding of technology and of national, state and local energy policies. The Resource Plan also benefited from substantial input from citizens, customer groups, utility advisory commissions and a Council appointed Taskforce. On April 22, 2010, City Council approved the Austin Energy Resource, Generation, and Climate Protection Plan with resource and timeline goals of achieving 35 percent of annual energy supply from qualifying renewable sources in addition to 800 MW of energy efficiency measures by 2020. Council delayed implementation of the flexible, dynamic Resource Plan until an affordability “matrix”—a method to measure the plan’s affordability— was identified. On February 17, 2011, the City Council approved the Resource Plan including an affordability goal. The affordability goal, intended to make the Resource Plan as predictable as possible, calls for Austin Energy to keep system rate increases to 2% or less per year. In addition, the goal is to maintain AE’s current all-in competitive rates in the lower 50% of Texas rates overall. The affordability goal will apply immediately upon implementation of Austin Energy’s revised rates to be implemented in October, 2012. This Resource Plan is designed to be flexible and dynamic. As circumstances change, the City must maintain the flexibility to modify elements to respond to a range of factors, including economic conditions, customer load, fuel prices and availability, infrastructure build-out, technological development, law and regulations, policy direction, and customer needs. Therefore, as conditions change, the Resource Plan will be adapted and modified to manage risk, maintain system and service reliability, achieve policy goals and meet customer demand for excellence in all aspects of service. Austin Energy will review the Resource Plan annually and issue a report on performance against goals. Austin Energy will reassess the Resource Plan in a public forum every two years. Every major resource decision and Resource Plan change will be taken before the City Council for review and authorization.
Transmission Upgrades at the Burleson Substation
2012-13 Proposed Budget, Austin, TX
Volume I | 415
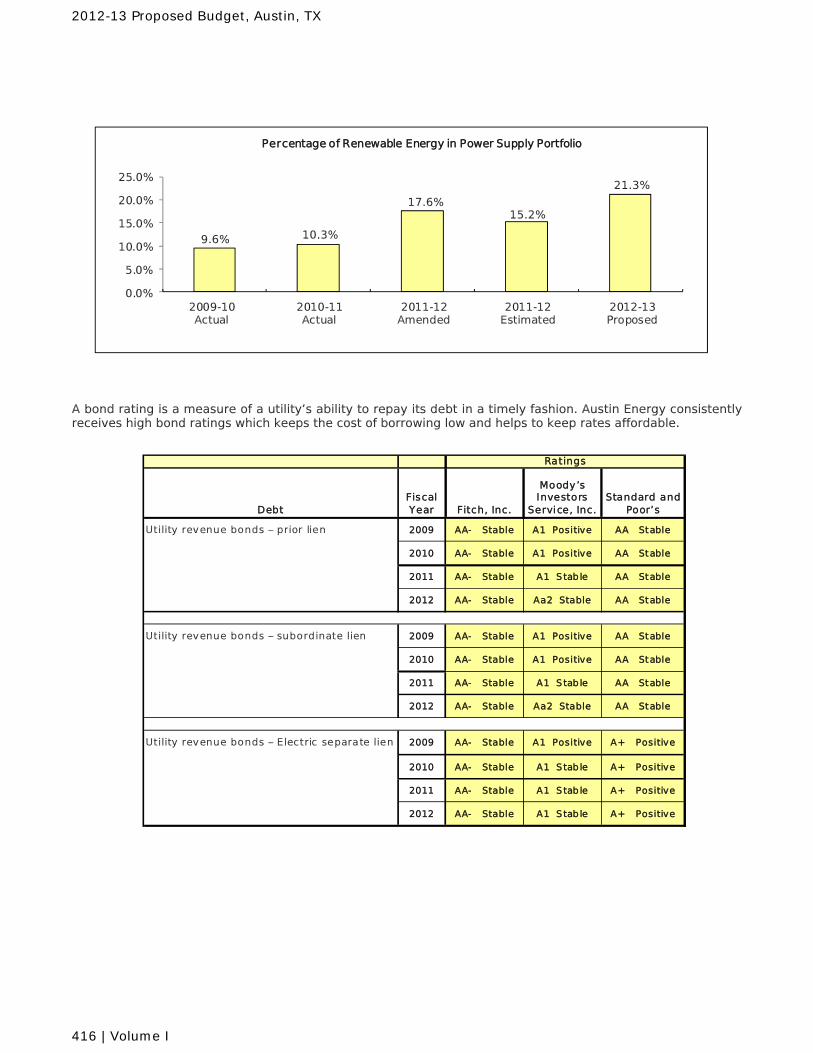
A bond rating is a measure of a utility’s ability to repay its debt in a timely fashion. Austin Energy consistently receives high bond ratings which keeps the cost of borrowing low and helps to keep rates affordable.
DebtFiscal Year Fitch, Inc.
Moody’s Investors
Service, Inc.Standard and
Poor’s
Utility revenue bonds – prior lien 2009 AA- Stable A1 Positive AA Stable
2010 AA- Stable A1 Positive AA Stable
2011 AA- Stable A1 S tab le AA Stable
2012 AA- Stable Aa2 Stable AA Stable
Utility revenue bonds – subordinate lien 2009 AA- Stable A1 Positive AA Stable
2010 AA- Stable A1 Positive AA Stable
2011 AA- Stable A1 S tab le AA Stable
2012 AA- Stable Aa2 Stable AA Stable
Utility revenue bonds – Electric separate lien 2009 AA- Stable A1 Positive A+ Positive
2010 AA- Stable A1 S tab le A+ Positive
2011 AA- Stable A1 S tab le A+ Positive
2012 AA- Stable A1 S tab le A+ Positive
Ratings
9.6% 10.3%
17.6%15.2%
21.3%
0.0%
5.0%
10.0%
15.0%
20.0%
25.0%
2009-10Actual
2010-11Actual
2011-12Amended
2011-12Estimated
2012-13Proposed
Percentage of Renewable Energy in Power Supply Portfolio
2012-13 Proposed Budget, Austin, TX
416 | Volume I
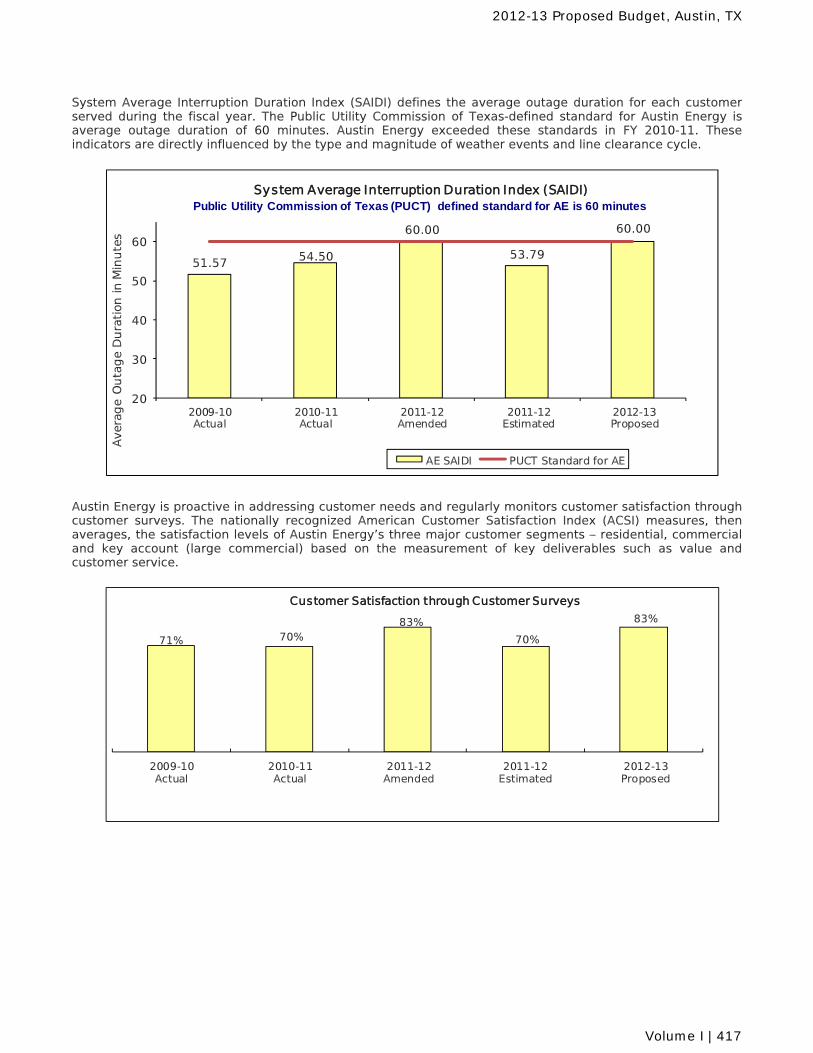
System Average Interruption Duration Index (SAIDI) defines the average outage duration for each customer served during the fiscal year. The Public Utility Commission of Texas-defined standard for Austin Energy is average outage duration of 60 minutes. Austin Energy exceeded these standards in FY 2010-11. These indicators are directly influenced by the type and magnitude of weather events and line clearance cycle. Austin Energy is proactive in addressing customer needs and regularly monitors customer satisfaction through customer surveys. The nationally recognized American Customer Satisfaction Index (ACSI) measures, then averages, the satisfaction levels of Austin Energy’s three major customer segments – residential, commercial and key account (large commercial) based on the measurement of key deliverables such as value and customer service.
51.57 54.50
60.00
53.79
60.00
20
30
40
50
60
2009-10Actual
2010-11Actual
2011-12Amended
2011-12Estimated
2012-13Proposed
Avera
ge O
uta
ge
Du
rati
on in
Min
ute
s
System Average Interruption Duration Index (SAIDI)
AE SAIDI PUCT Standard for AE
Public Utility Commission of Texas (PUCT) defined standard for AE is 60 minutes
71% 70%83%
70%
83%
2009-10Actual
2010-11Actual
2011-12Amended
2011-12Estimated
2012-13Proposed
Customer Satisfaction through Customer Surveys
2012-13 Proposed Budget, Austin, TX
Volume I | 417
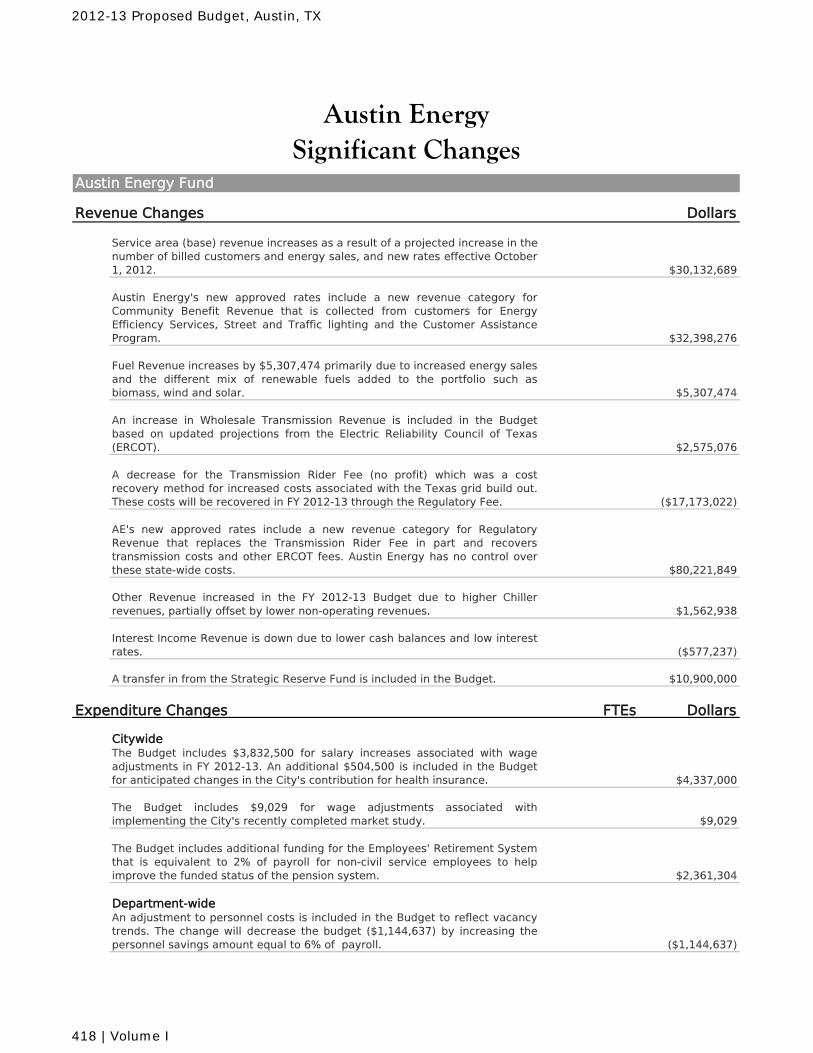
Austin Energy Fund
Revenue Changes Dollars
Service area (base) revenue increases as a result of a projected increase in the number of billed customers and energy sales, and new rates effective October1, 2012. $30,132,689
Austin Energy's new approved rates include a new revenue category forCommunity Benefit Revenue that is collected from customers for EnergyEfficiency Services, Street and Traffic lighting and the Customer AssistanceProgram. $32,398,276
Fuel Revenue increases by $5,307,474 primarily due to increased energy salesand the different mix of renewable fuels added to the portfolio such asbiomass, wind and solar. $5,307,474
An increase in Wholesale Transmission Revenue is included in the Budgetbased on updated projections from the Electric Reliability Council of Texas(ERCOT). $2,575,076
A decrease for the Transmission Rider Fee (no profit) which was a costrecovery method for increased costs associated with the Texas grid build out.These costs will be recovered in FY 2012-13 through the Regulatory Fee. ($17,173,022)
AE's new approved rates include a new revenue category for RegulatoryRevenue that replaces the Transmission Rider Fee in part and recoverstransmission costs and other ERCOT fees. Austin Energy has no control overthese state-wide costs. $80,221,849
Other Revenue increased in the FY 2012-13 Budget due to higher Chillerrevenues, partially offset by lower non-operating revenues. $1,562,938
Interest Income Revenue is down due to lower cash balances and low interestrates. ($577,237)
A transfer in from the Strategic Reserve Fund is included in the Budget. $10,900,000
Expenditure Changes FTEs Dollars
CitywideThe Budget includes $3,832,500 for salary increases associated with wageadjustments in FY 2012-13. An additional $504,500 is included in the Budgetfor anticipated changes in the City's contribution for health insurance. $4,337,000
The Budget includes $9,029 for wage adjustments associated withimplementing the City's recently completed market study. $9,029
The Budget includes additional funding for the Employees' Retirement Systemthat is equivalent to 2% of payroll for non-civil service employees to helpimprove the funded status of the pension system. $2,361,304
Department-wideAn adjustment to personnel costs is included in the Budget to reflect vacancytrends. The change will decrease the budget ($1,144,637) by increasing thepersonnel savings amount equal to 6% of payroll. ($1,144,637)
Significant ChangesAustin Energy
2012-13 Proposed Budget, Austin, TX
418 | Volume I
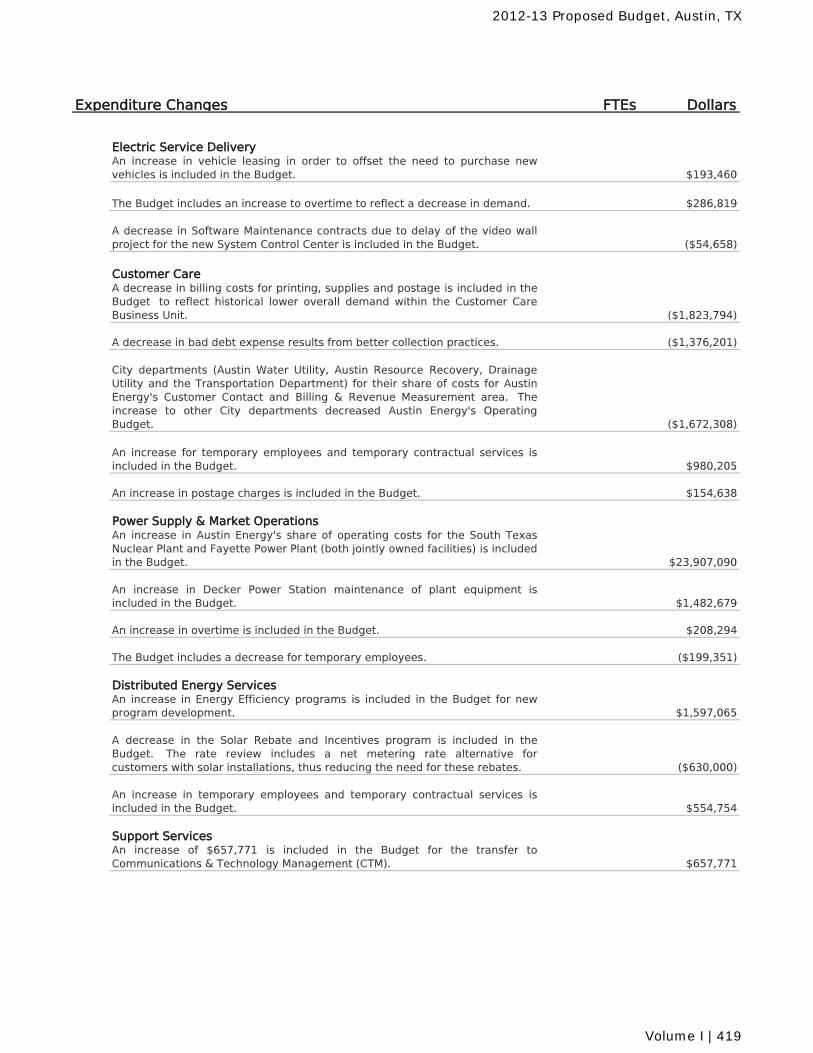
Expenditure Changes FTEs Dollars
Electric Service DeliveryAn increase in vehicle leasing in order to offset the need to purchase newvehicles is included in the Budget. $193,460
The Budget includes an increase to overtime to reflect a decrease in demand. $286,819
A decrease in Software Maintenance contracts due to delay of the video wallproject for the new System Control Center is included in the Budget. ($54,658)
Customer CareA decrease in billing costs for printing, supplies and postage is included in theBudget to reflect historical lower overall demand within the Customer CareBusiness Unit. ($1,823,794)
A decrease in bad debt expense results from better collection practices. ($1,376,201)
City departments (Austin Water Utility, Austin Resource Recovery, DrainageUtility and the Transportation Department) for their share of costs for AustinEnergy's Customer Contact and Billing & Revenue Measurement area. Theincrease to other City departments decreased Austin Energy's OperatingBudget. ($1,672,308)
An increase for temporary employees and temporary contractual services isincluded in the Budget. $980,205
An increase in postage charges is included in the Budget. $154,638
Power Supply & Market OperationsAn increase in Austin Energy's share of operating costs for the South TexasNuclear Plant and Fayette Power Plant (both jointly owned facilities) is includedin the Budget. $23,907,090
An increase in Decker Power Station maintenance of plant equipment isincluded in the Budget. $1,482,679
An increase in overtime is included in the Budget. $208,294
The Budget includes a decrease for temporary employees. ($199,351)
Distributed Energy ServicesAn increase in Energy Efficiency programs is included in the Budget for newprogram development. $1,597,065
A decrease in the Solar Rebate and Incentives program is included in theBudget. The rate review includes a net metering rate alternative forcustomers with solar installations, thus reducing the need for these rebates. ($630,000)
An increase in temporary employees and temporary contractual services isincluded in the Budget. $554,754
Support ServicesAn increase of $657,771 is included in the Budget for the transfer toCommunications & Technology Management (CTM). $657,771
2012-13 Proposed Budget, Austin, TX
Volume I | 419
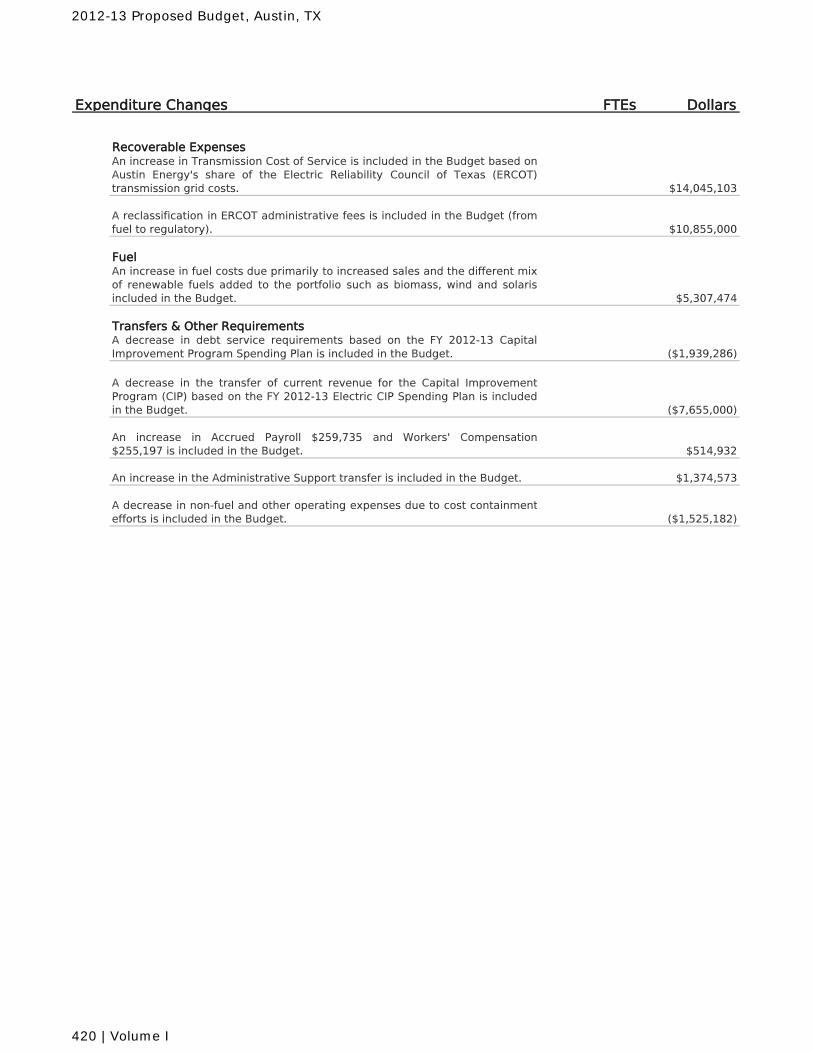
Expenditure Changes FTEs Dollars
Recoverable ExpensesAn increase in Transmission Cost of Service is included in the Budget based onAustin Energy's share of the Electric Reliability Council of Texas (ERCOT)transmission grid costs. $14,045,103
A reclassification in ERCOT administrative fees is included in the Budget (fromfuel to regulatory). $10,855,000
FuelAn increase in fuel costs due primarily to increased sales and the different mixof renewable fuels added to the portfolio such as biomass, wind and solarisincluded in the Budget. $5,307,474
Transfers & Other RequirementsA decrease in debt service requirements based on the FY 2012-13 CapitalImprovement Program Spending Plan is included in the Budget. ($1,939,286)
A decrease in the transfer of current revenue for the Capital ImprovementProgram (CIP) based on the FY 2012-13 Electric CIP Spending Plan is includedin the Budget. ($7,655,000)
An increase in Accrued Payroll $259,735 and Workers' Compensation$255,197 is included in the Budget. $514,932
An increase in the Administrative Support transfer is included in the Budget. $1,374,573
A decrease in non-fuel and other operating expenses due to cost containmentefforts is included in the Budget. ($1,525,182)
2012-13 Proposed Budget, Austin, TX
420 | Volume I
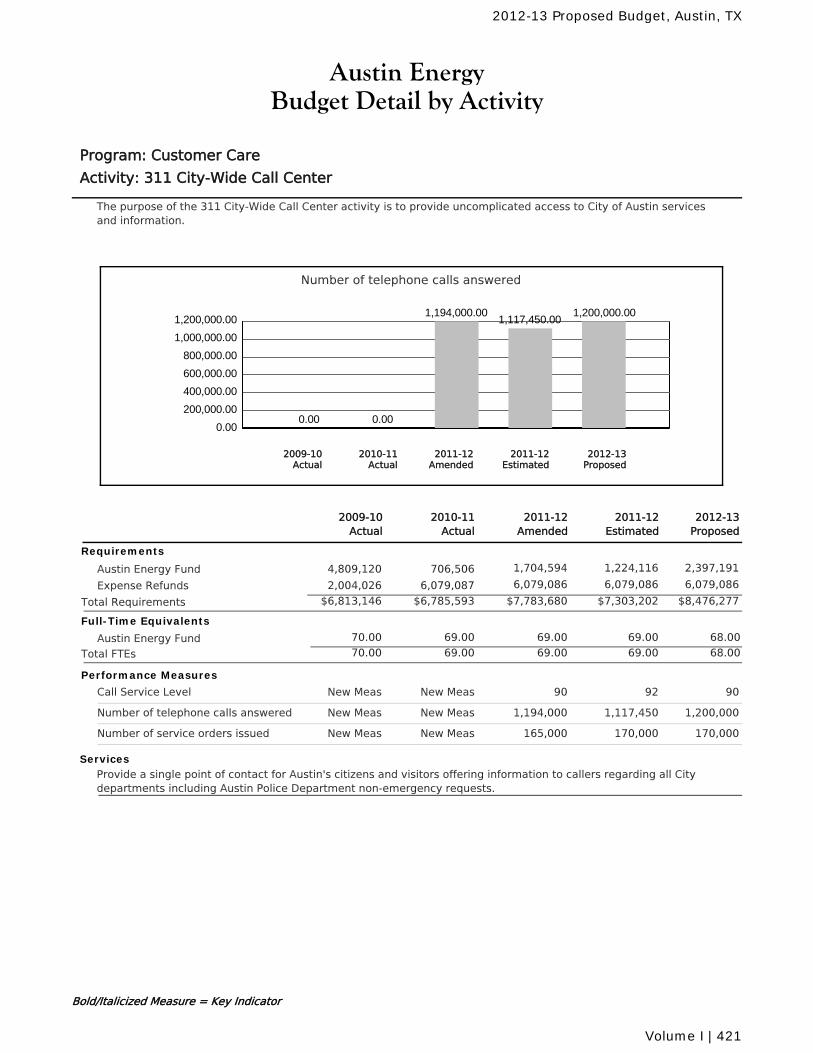
Austin EnergyBudget Detail by Activity
Program: Customer Care
Activity: 311 City-Wide Call Center
The purpose of the 311 City-Wide Call Center activity is to provide uncomplicated access to City of Austin servicesand information.
Number of telephone calls answered
0.00
200,000.00
400,000.00
600,000.00
800,000.00
1,000,000.00
1,200,000.00
0.00 0.00
1,194,000.001,117,450.00
1,200,000.00
2010-11Actual
2012-13Proposed
2011-12Amended
2011-12Estimated
2009-10Actual
2011-12Amended
2010-11Actual
2011-12Estimated
2012-13Proposed
2009-10Actual
Requirements
Austin Energy Fund 1,704,594 1,224,116 2,397,191706,5064,809,120
Expense Refunds 6,079,086 6,079,086 6,079,0866,079,0872,004,026
$7,783,680 $7,303,202 $8,476,277Total Requirements $6,785,593$6,813,146
Full-Time Equivalents
Austin Energy Fund 69.00 69.00 69.00 68.0070.00
Total FTEs 69.00 69.00 69.00 68.0070.00
Performance Measures
Call Service Level 90New Meas 92 90New Meas
Number of telephone calls answered 1,194,000New Meas 1,117,450 1,200,000New Meas
Number of service orders issued 165,000New Meas 170,000 170,000New Meas
ServicesProvide a single point of contact for Austin's citizens and visitors offering information to callers regarding all Citydepartments including Austin Police Department non-emergency requests.
Bold/Italicized Measure = Key Indicator
2012-13 Proposed Budget, Austin, TX
Volume I | 421
perezmi
Text Box
perezmi
Text Box
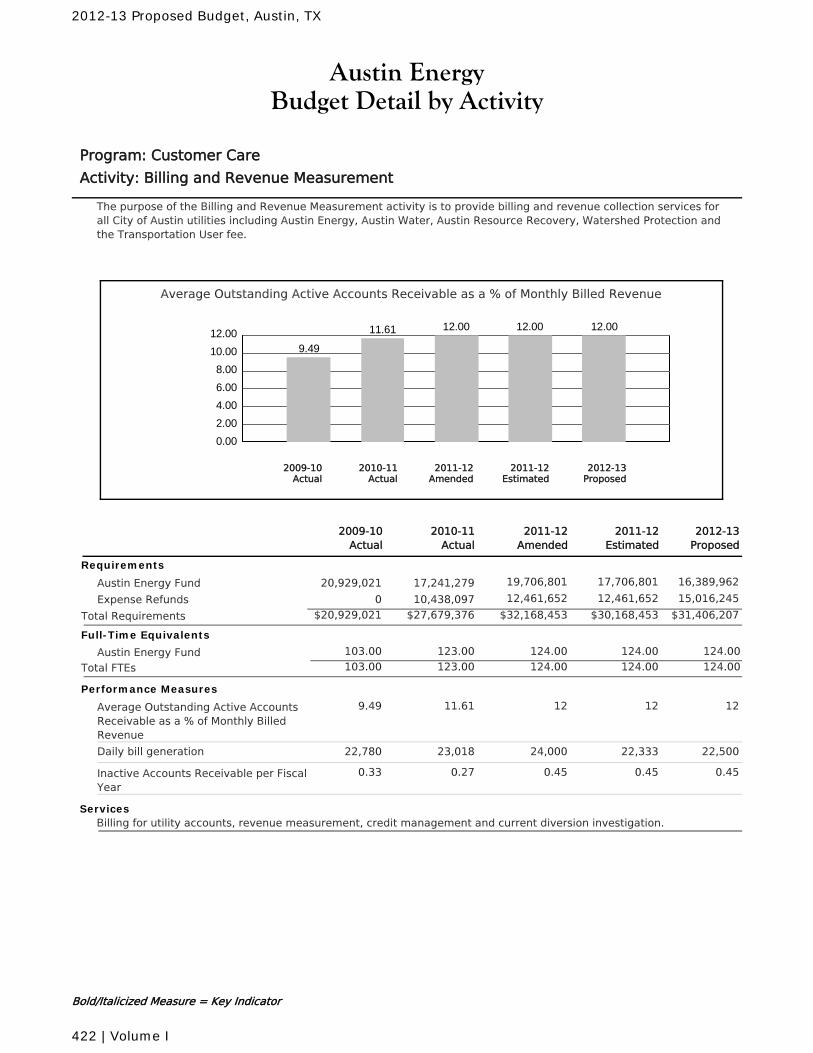
Austin EnergyBudget Detail by Activity
Program: Customer Care
Activity: Billing and Revenue Measurement
The purpose of the Billing and Revenue Measurement activity is to provide billing and revenue collection services forall City of Austin utilities including Austin Energy, Austin Water, Austin Resource Recovery, Watershed Protection andthe Transportation User fee.
Average Outstanding Active Accounts Receivable as a % of Monthly Billed Revenue
0.00
2.00
4.00
6.00
8.00
10.00
12.009.49
11.61 12.00 12.00 12.00
2010-11Actual
2012-13Proposed
2011-12Amended
2011-12Estimated
2009-10Actual
2011-12Amended
2010-11Actual
2011-12Estimated
2012-13Proposed
2009-10Actual
Requirements
Austin Energy Fund 19,706,801 17,706,801 16,389,96217,241,27920,929,021
Expense Refunds 12,461,652 12,461,652 15,016,24510,438,0970
$32,168,453 $30,168,453 $31,406,207Total Requirements $27,679,376$20,929,021
Full-Time Equivalents
Austin Energy Fund 123.00 124.00 124.00 124.00103.00
Total FTEs 123.00 124.00 124.00 124.00103.00
Performance Measures
Average Outstanding Active AccountsReceivable as a % of Monthly BilledRevenue
1211.61 12 129.49
Daily bill generation 24,00023,018 22,333 22,50022,780
Inactive Accounts Receivable per FiscalYear
0.450.27 0.45 0.450.33
ServicesBilling for utility accounts, revenue measurement, credit management and current diversion investigation.
Bold/Italicized Measure = Key Indicator
2012-13 Proposed Budget, Austin, TX
422 | Volume I
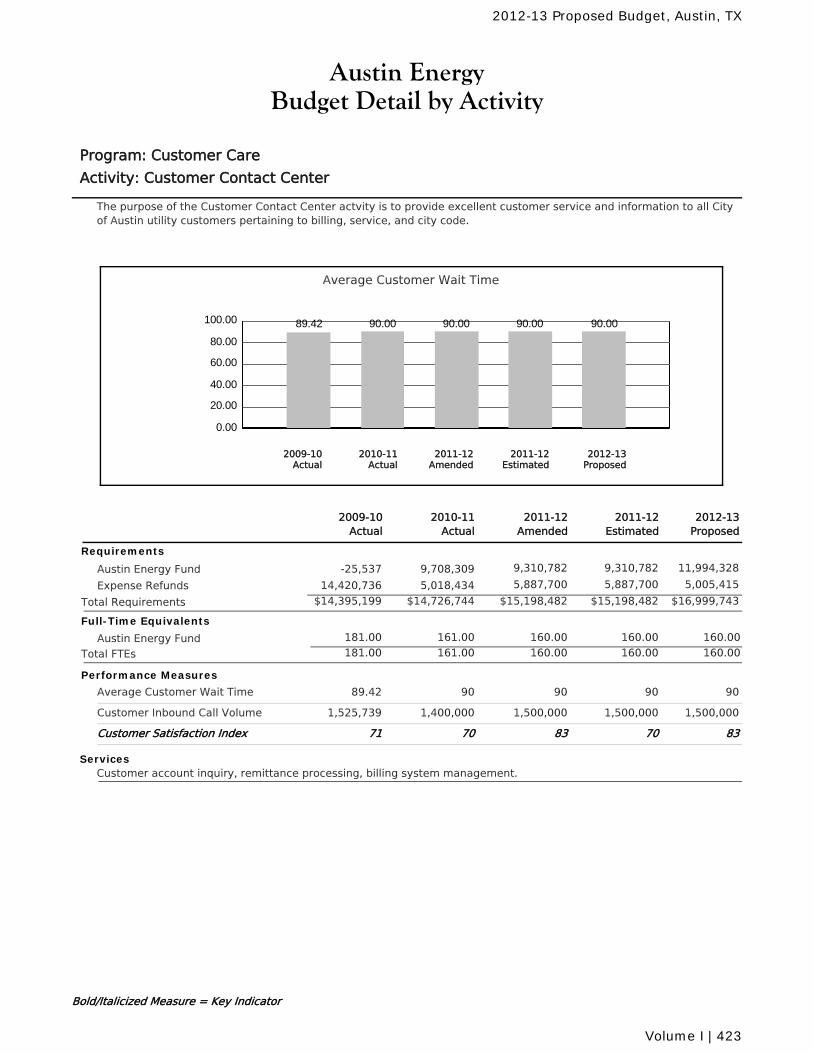
Austin EnergyBudget Detail by Activity
Program: Customer Care
Activity: Customer Contact Center
The purpose of the Customer Contact Center actvity is to provide excellent customer service and information to all Cityof Austin utility customers pertaining to billing, service, and city code.
Average Customer Wait Time
0.00
20.00
40.00
60.00
80.00
100.00 89.42 90.00 90.00 90.00 90.00
2010-11Actual
2012-13Proposed
2011-12Amended
2011-12Estimated
2009-10Actual
2011-12Amended
2010-11Actual
2011-12Estimated
2012-13Proposed
2009-10Actual
Requirements
Austin Energy Fund 9,310,782 9,310,782 11,994,3289,708,309-25,537
Expense Refunds 5,887,700 5,887,700 5,005,4155,018,43414,420,736
$15,198,482 $15,198,482 $16,999,743Total Requirements $14,726,744$14,395,199
Full-Time Equivalents
Austin Energy Fund 161.00 160.00 160.00 160.00181.00
Total FTEs 161.00 160.00 160.00 160.00181.00
Performance Measures
Average Customer Wait Time 9090 90 9089.42
Customer Inbound Call Volume 1,500,0001,400,000 1,500,000 1,500,0001,525,739
Customer Satisfaction Index 8370 70 8371
ServicesCustomer account inquiry, remittance processing, billing system management.
Bold/Italicized Measure = Key Indicator
2012-13 Proposed Budget, Austin, TX
Volume I | 423
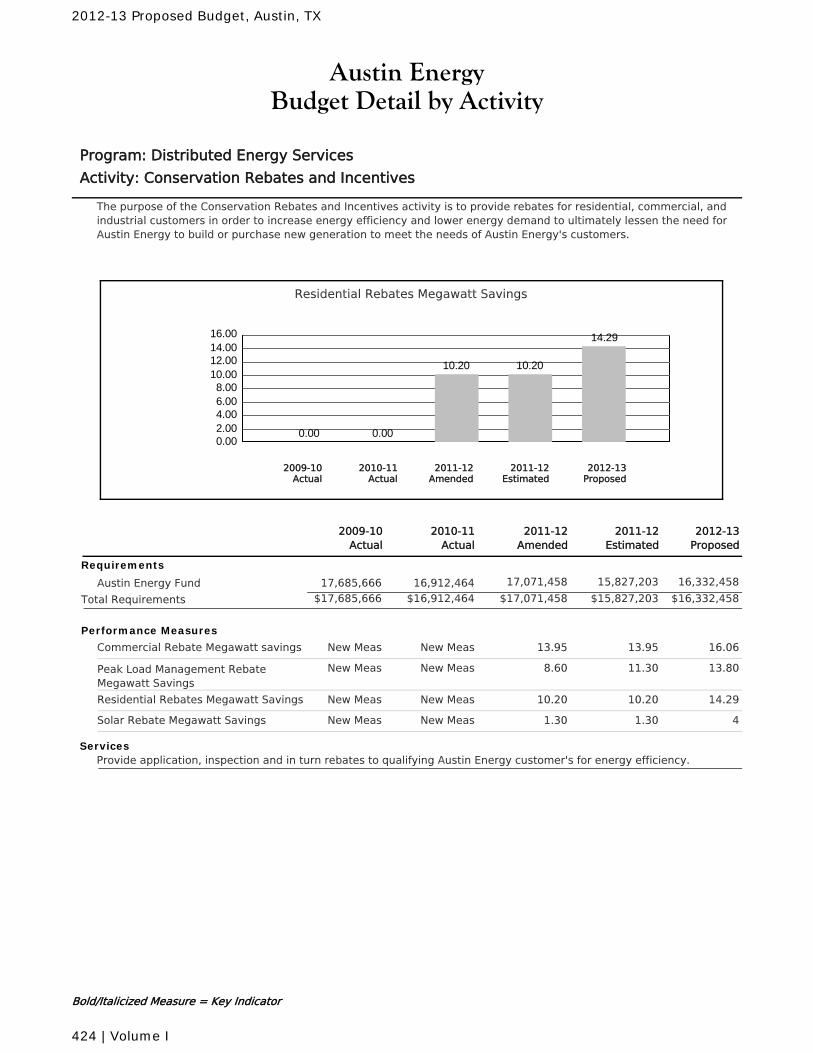
Austin EnergyBudget Detail by Activity
Program: Distributed Energy Services
Activity: Conservation Rebates and Incentives
The purpose of the Conservation Rebates and Incentives activity is to provide rebates for residential, commercial, andindustrial customers in order to increase energy efficiency and lower energy demand to ultimately lessen the need forAustin Energy to build or purchase new generation to meet the needs of Austin Energy's customers.
Residential Rebates Megawatt Savings
0.002.004.006.008.00
10.0012.0014.0016.00
0.00 0.00
10.20 10.20
14.29
2010-11Actual
2012-13Proposed
2011-12Amended
2011-12Estimated
2009-10Actual
2011-12Amended
2010-11Actual
2011-12Estimated
2012-13Proposed
2009-10Actual
Requirements
Austin Energy Fund 17,071,458 15,827,203 16,332,45816,912,46417,685,666
$17,071,458 $15,827,203 $16,332,458Total Requirements $16,912,464$17,685,666
Performance Measures
Commercial Rebate Megawatt savings 13.95New Meas 13.95 16.06New Meas
Peak Load Management RebateMegawatt Savings
8.60New Meas 11.30 13.80New Meas
Residential Rebates Megawatt Savings 10.20New Meas 10.20 14.29New Meas
Solar Rebate Megawatt Savings 1.30New Meas 1.30 4New Meas
ServicesProvide application, inspection and in turn rebates to qualifying Austin Energy customer's for energy efficiency.
Bold/Italicized Measure = Key Indicator
2012-13 Proposed Budget, Austin, TX
424 | Volume I
perezmi
Text Box
perezmi
Text Box
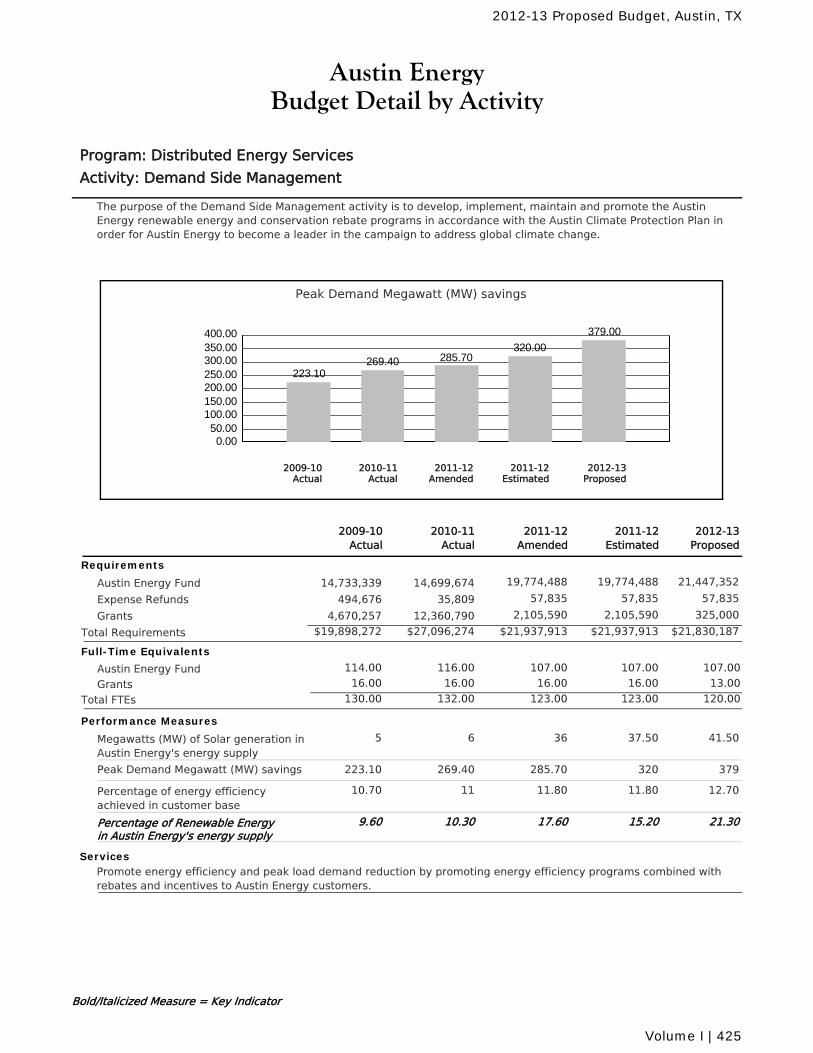
Austin EnergyBudget Detail by Activity
Program: Distributed Energy Services
Activity: Demand Side Management
The purpose of the Demand Side Management activity is to develop, implement, maintain and promote the AustinEnergy renewable energy and conservation rebate programs in accordance with the Austin Climate Protection Plan inorder for Austin Energy to become a leader in the campaign to address global climate change.
Peak Demand Megawatt (MW) savings
0.0050.00
100.00150.00200.00250.00300.00350.00400.00
223.10269.40 285.70
320.00
379.00
2010-11Actual
2012-13Proposed
2011-12Amended
2011-12Estimated
2009-10Actual
2011-12Amended
2010-11Actual
2011-12Estimated
2012-13Proposed
2009-10Actual
Requirements
Austin Energy Fund 19,774,488 19,774,488 21,447,35214,699,67414,733,339
Expense Refunds 57,835 57,835 57,83535,809494,676
Grants 2,105,590 2,105,590 325,00012,360,7904,670,257
$21,937,913 $21,937,913 $21,830,187Total Requirements $27,096,274$19,898,272
Full-Time Equivalents
Austin Energy Fund 116.00 107.00 107.00 107.00114.00
Grants 16.00 16.00 16.00 13.0016.00
Total FTEs 132.00 123.00 123.00 120.00130.00
Performance Measures
Megawatts (MW) of Solar generation inAustin Energy's energy supply
366 37.50 41.505
Peak Demand Megawatt (MW) savings 285.70269.40 320 379223.10
Percentage of energy efficiencyachieved in customer base
11.8011 11.80 12.7010.70
Percentage of Renewable Energyin Austin Energy's energy supply
17.6010.30 15.20 21.309.60
ServicesPromote energy efficiency and peak load demand reduction by promoting energy efficiency programs combined withrebates and incentives to Austin Energy customers.
Bold/Italicized Measure = Key Indicator
2012-13 Proposed Budget, Austin, TX
Volume I | 425
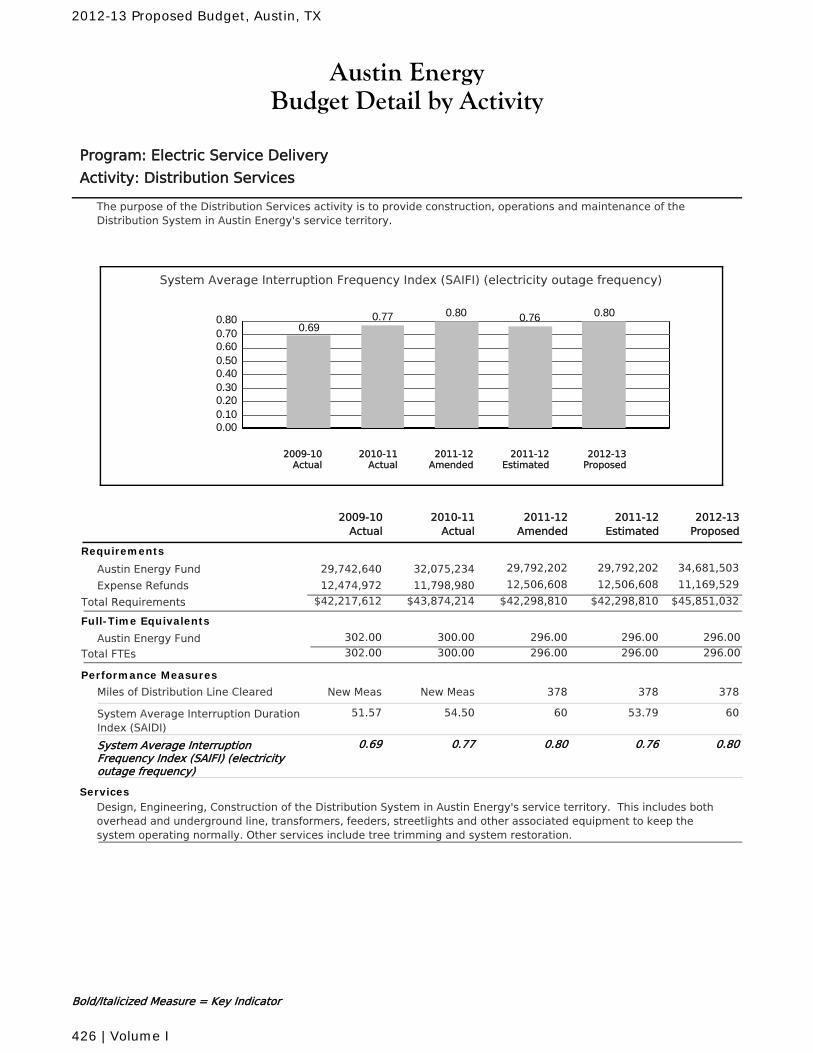
Austin EnergyBudget Detail by Activity
Program: Electric Service Delivery
Activity: Distribution Services
The purpose of the Distribution Services activity is to provide construction, operations and maintenance of theDistribution System in Austin Energy's service territory.
System Average Interruption Frequency Index (SAIFI) (electricity outage frequency)
0.000.100.200.300.400.500.600.700.80
0.690.77 0.80 0.76 0.80
2010-11Actual
2012-13Proposed
2011-12Amended
2011-12Estimated
2009-10Actual
2011-12Amended
2010-11Actual
2011-12Estimated
2012-13Proposed
2009-10Actual
Requirements
Austin Energy Fund 29,792,202 29,792,202 34,681,50332,075,23429,742,640
Expense Refunds 12,506,608 12,506,608 11,169,52911,798,98012,474,972
$42,298,810 $42,298,810 $45,851,032Total Requirements $43,874,214$42,217,612
Full-Time Equivalents
Austin Energy Fund 300.00 296.00 296.00 296.00302.00
Total FTEs 300.00 296.00 296.00 296.00302.00
Performance Measures
Miles of Distribution Line Cleared 378New Meas 378 378New Meas
System Average Interruption DurationIndex (SAIDI)
6054.50 53.79 6051.57
System Average InterruptionFrequency Index (SAIFI) (electricityoutage frequency)
0.800.77 0.76 0.800.69
ServicesDesign, Engineering, Construction of the Distribution System in Austin Energy's service territory. This includes bothoverhead and underground line, transformers, feeders, streetlights and other associated equipment to keep thesystem operating normally. Other services include tree trimming and system restoration.
Bold/Italicized Measure = Key Indicator
2012-13 Proposed Budget, Austin, TX
426 | Volume I
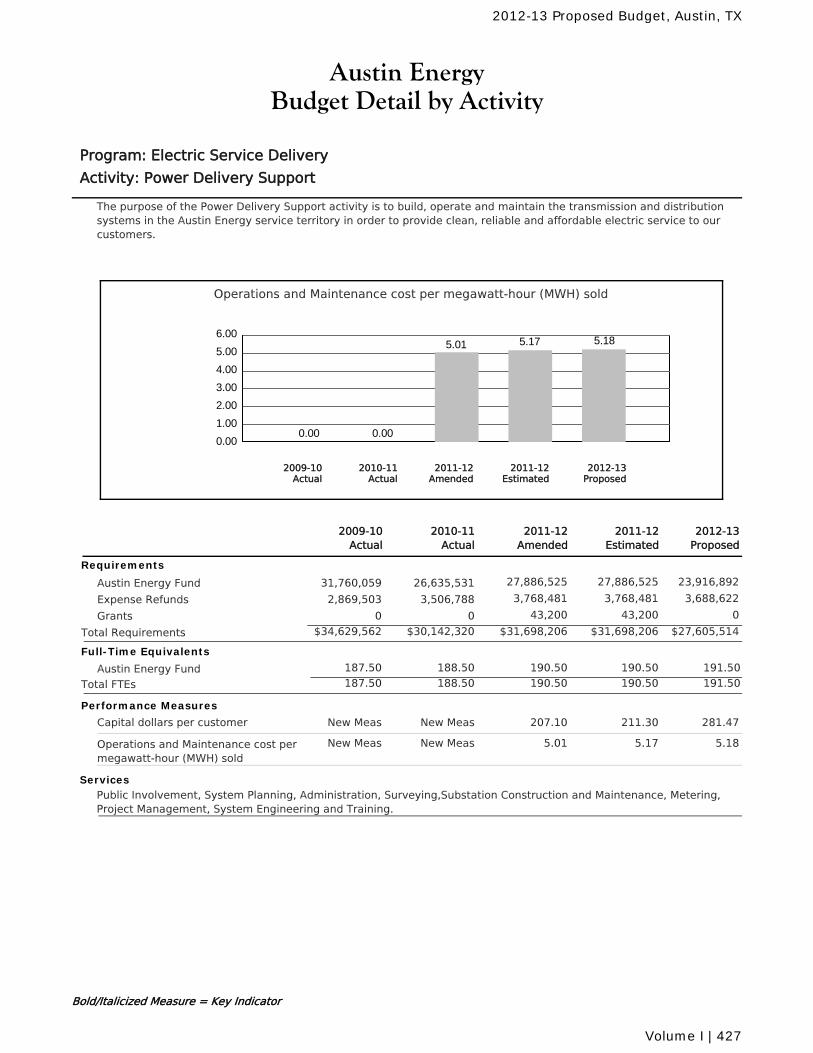
Austin EnergyBudget Detail by Activity
Program: Electric Service Delivery
Activity: Power Delivery Support
The purpose of the Power Delivery Support activity is to build, operate and maintain the transmission and distributionsystems in the Austin Energy service territory in order to provide clean, reliable and affordable electric service to ourcustomers.
Operations and Maintenance cost per megawatt-hour (MWH) sold
0.00
1.00
2.00
3.00
4.00
5.00
6.00
0.00 0.00
5.01 5.17 5.18
2010-11Actual
2012-13Proposed
2011-12Amended
2011-12Estimated
2009-10Actual
2011-12Amended
2010-11Actual
2011-12Estimated
2012-13Proposed
2009-10Actual
Requirements
Austin Energy Fund 27,886,525 27,886,525 23,916,89226,635,53131,760,059
Expense Refunds 3,768,481 3,768,481 3,688,6223,506,7882,869,503
Grants 43,200 43,200 000
$31,698,206 $31,698,206 $27,605,514Total Requirements $30,142,320$34,629,562
Full-Time Equivalents
Austin Energy Fund 188.50 190.50 190.50 191.50187.50
Total FTEs 188.50 190.50 190.50 191.50187.50
Performance Measures
Capital dollars per customer 207.10New Meas 211.30 281.47New Meas
Operations and Maintenance cost permegawatt-hour (MWH) sold
5.01New Meas 5.17 5.18New Meas
ServicesPublic Involvement, System Planning, Administration, Surveying,Substation Construction and Maintenance, Metering,Project Management, System Engineering and Training.
Bold/Italicized Measure = Key Indicator
2012-13 Proposed Budget, Austin, TX
Volume I | 427
perezmi
Text Box
perezmi
Text Box
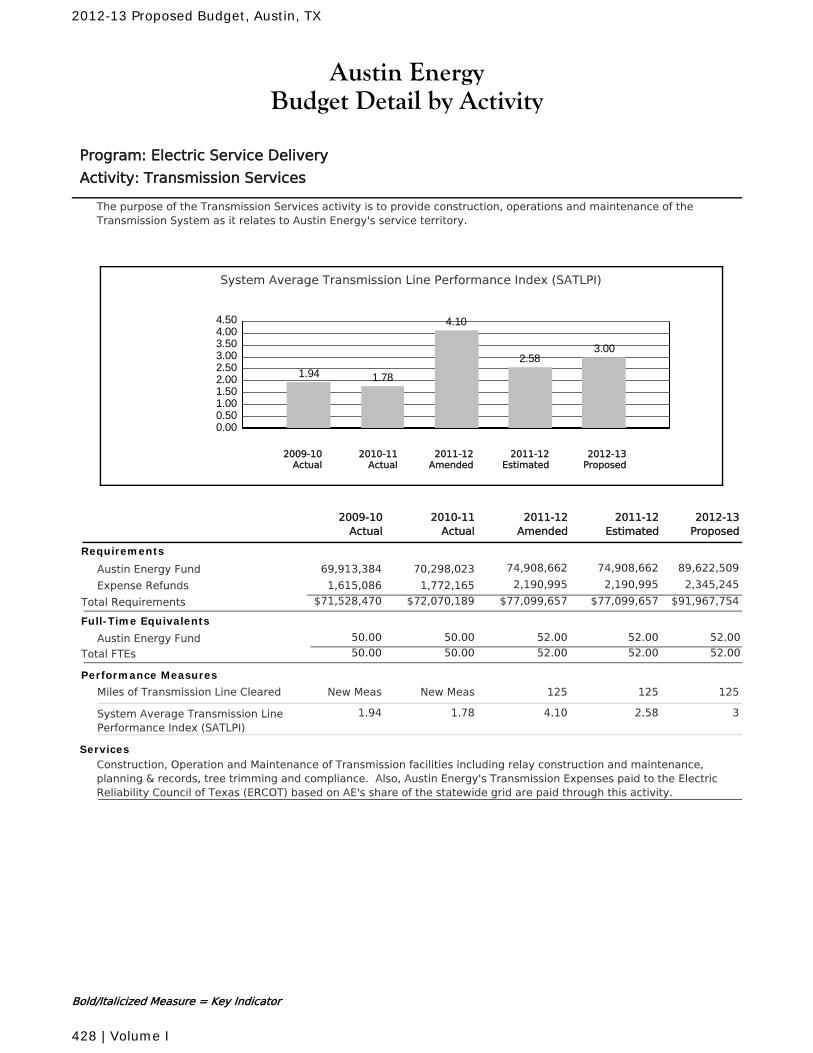
Austin EnergyBudget Detail by Activity
Program: Electric Service Delivery
Activity: Transmission Services
The purpose of the Transmission Services activity is to provide construction, operations and maintenance of theTransmission System as it relates to Austin Energy's service territory.
System Average Transmission Line Performance Index (SATLPI)
0.000.501.001.502.002.503.003.504.004.50
1.94 1.78
4.10
2.583.00
2010-11Actual
2012-13Proposed
2011-12Amended
2011-12Estimated
2009-10Actual
2011-12Amended
2010-11Actual
2011-12Estimated
2012-13Proposed
2009-10Actual
Requirements
Austin Energy Fund 74,908,662 74,908,662 89,622,50970,298,02369,913,384
Expense Refunds 2,190,995 2,190,995 2,345,2451,772,1651,615,086
$77,099,657 $77,099,657 $91,967,754Total Requirements $72,070,189$71,528,470
Full-Time Equivalents
Austin Energy Fund 50.00 52.00 52.00 52.0050.00
Total FTEs 50.00 52.00 52.00 52.0050.00
Performance Measures
Miles of Transmission Line Cleared 125New Meas 125 125New Meas
System Average Transmission LinePerformance Index (SATLPI)
4.101.78 2.58 31.94
ServicesConstruction, Operation and Maintenance of Transmission facilities including relay construction and maintenance,planning & records, tree trimming and compliance. Also, Austin Energy's Transmission Expenses paid to the ElectricReliability Council of Texas (ERCOT) based on AE's share of the statewide grid are paid through this activity.
Bold/Italicized Measure = Key Indicator
2012-13 Proposed Budget, Austin, TX
428 | Volume I
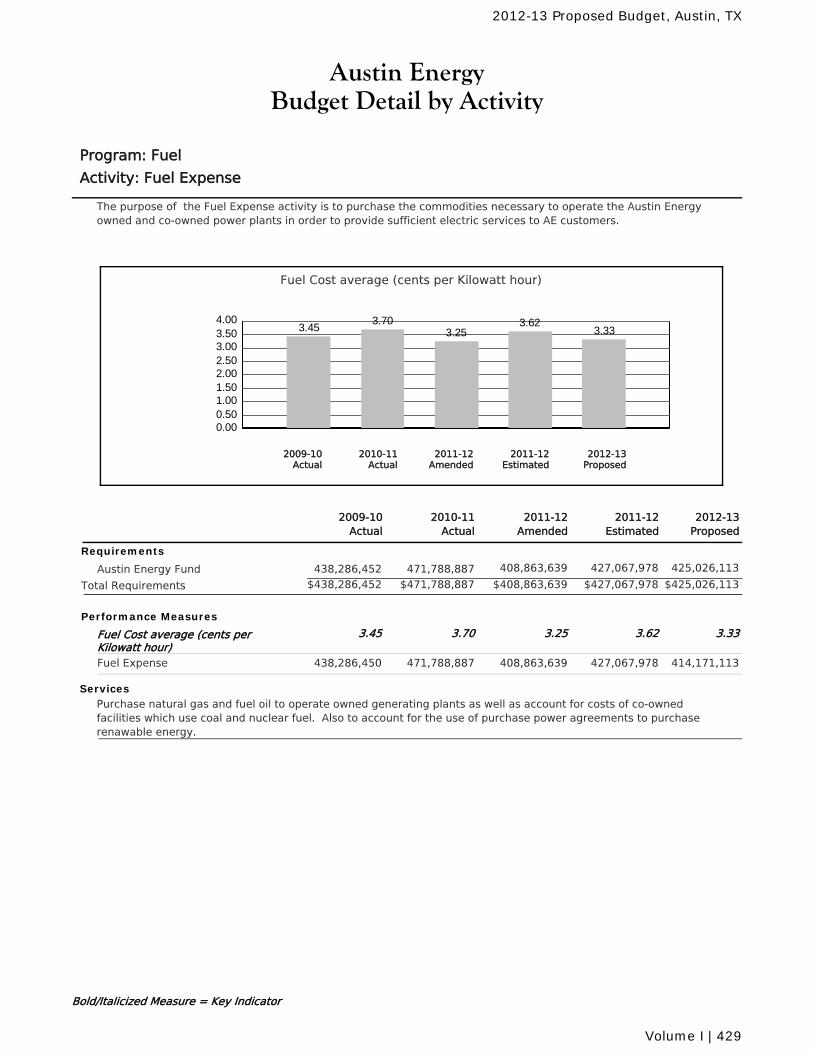
Austin EnergyBudget Detail by Activity
Program: Fuel
Activity: Fuel Expense
The purpose of the Fuel Expense activity is to purchase the commodities necessary to operate the Austin Energyowned and co-owned power plants in order to provide sufficient electric services to AE customers.
Fuel Cost average (cents per Kilowatt hour)
0.000.501.001.502.002.503.003.504.00
3.453.70
3.253.62
3.33
2010-11Actual
2012-13Proposed
2011-12Amended
2011-12Estimated
2009-10Actual
2011-12Amended
2010-11Actual
2011-12Estimated
2012-13Proposed
2009-10Actual
Requirements
Austin Energy Fund 408,863,639 427,067,978 425,026,113471,788,887438,286,452
$408,863,639 $427,067,978 $425,026,113Total Requirements $471,788,887$438,286,452
Performance Measures
Fuel Cost average (cents perKilowatt hour)
3.253.70 3.62 3.333.45
Fuel Expense 408,863,639471,788,887 427,067,978 414,171,113438,286,450
ServicesPurchase natural gas and fuel oil to operate owned generating plants as well as account for costs of co-ownedfacilities which use coal and nuclear fuel. Also to account for the use of purchase power agreements to purchaserenawable energy.
Bold/Italicized Measure = Key Indicator
2012-13 Proposed Budget, Austin, TX
Volume I | 429
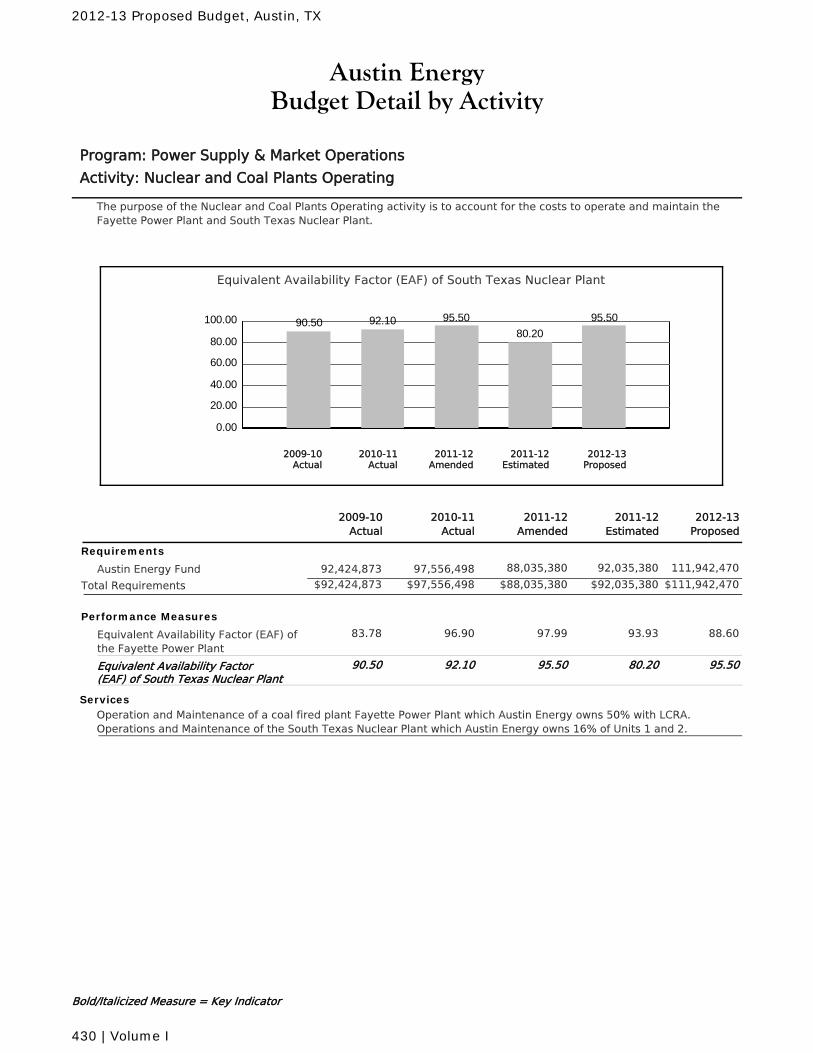
Austin EnergyBudget Detail by Activity
Program: Power Supply & Market Operations
Activity: Nuclear and Coal Plants Operating
The purpose of the Nuclear and Coal Plants Operating activity is to account for the costs to operate and maintain theFayette Power Plant and South Texas Nuclear Plant.
Equivalent Availability Factor (EAF) of South Texas Nuclear Plant
0.00
20.00
40.00
60.00
80.00
100.00 90.50 92.10 95.50
80.20
95.50
2010-11Actual
2012-13Proposed
2011-12Amended
2011-12Estimated
2009-10Actual
2011-12Amended
2010-11Actual
2011-12Estimated
2012-13Proposed
2009-10Actual
Requirements
Austin Energy Fund 88,035,380 92,035,380 111,942,47097,556,49892,424,873
$88,035,380 $92,035,380 $111,942,470Total Requirements $97,556,498$92,424,873
Performance Measures
Equivalent Availability Factor (EAF) ofthe Fayette Power Plant
97.9996.90 93.93 88.6083.78
Equivalent Availability Factor(EAF) of South Texas Nuclear Plant
95.5092.10 80.20 95.5090.50
ServicesOperation and Maintenance of a coal fired plant Fayette Power Plant which Austin Energy owns 50% with LCRA.Operations and Maintenance of the South Texas Nuclear Plant which Austin Energy owns 16% of Units 1 and 2.
Bold/Italicized Measure = Key Indicator
2012-13 Proposed Budget, Austin, TX
430 | Volume I
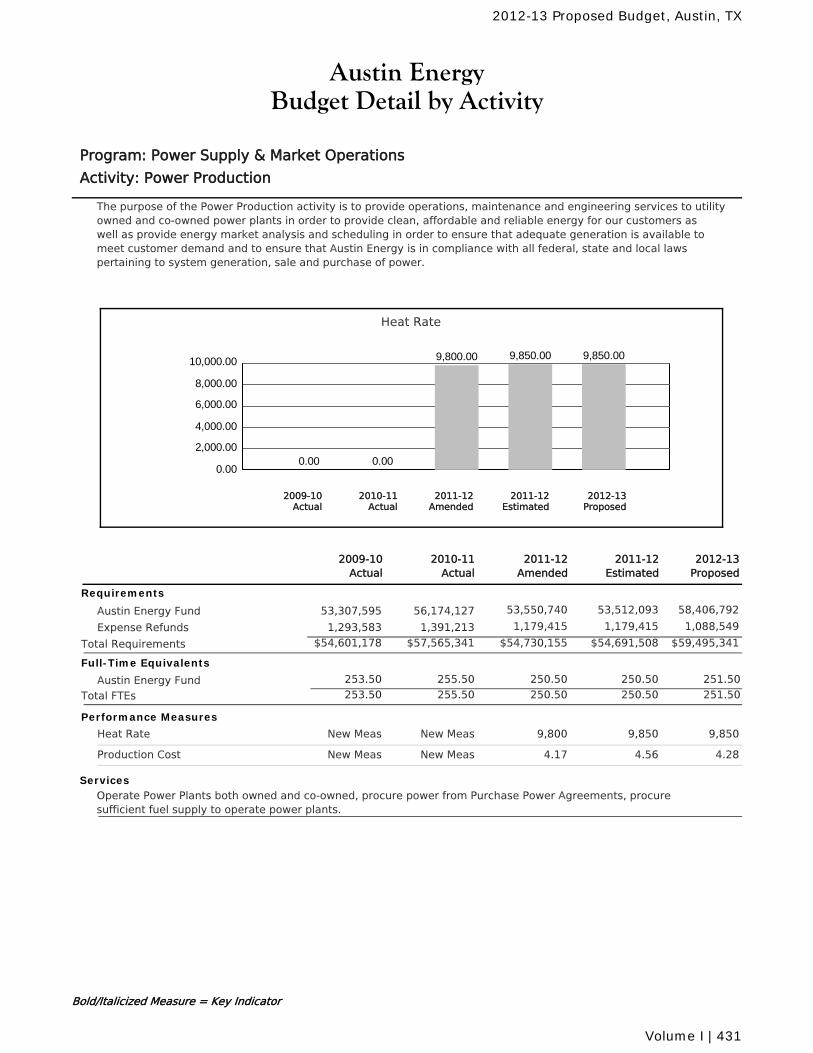
Austin EnergyBudget Detail by Activity
Program: Power Supply & Market Operations
Activity: Power Production
The purpose of the Power Production activity is to provide operations, maintenance and engineering services to utilityowned and co-owned power plants in order to provide clean, affordable and reliable energy for our customers aswell as provide energy market analysis and scheduling in order to ensure that adequate generation is available tomeet customer demand and to ensure that Austin Energy is in compliance with all federal, state and local lawspertaining to system generation, sale and purchase of power.
Heat Rate
0.00
2,000.00
4,000.00
6,000.00
8,000.00
10,000.00
0.00 0.00
9,800.00 9,850.00 9,850.00
2010-11Actual
2012-13Proposed
2011-12Amended
2011-12Estimated
2009-10Actual
2011-12Amended
2010-11Actual
2011-12Estimated
2012-13Proposed
2009-10Actual
Requirements
Austin Energy Fund 53,550,740 53,512,093 58,406,79256,174,12753,307,595
Expense Refunds 1,179,415 1,179,415 1,088,5491,391,2131,293,583
$54,730,155 $54,691,508 $59,495,341Total Requirements $57,565,341$54,601,178
Full-Time Equivalents
Austin Energy Fund 255.50 250.50 250.50 251.50253.50
Total FTEs 255.50 250.50 250.50 251.50253.50
Performance Measures
Heat Rate 9,800New Meas 9,850 9,850New Meas
Production Cost 4.17New Meas 4.56 4.28New Meas
ServicesOperate Power Plants both owned and co-owned, procure power from Purchase Power Agreements, procuresufficient fuel supply to operate power plants.
Bold/Italicized Measure = Key Indicator
2012-13 Proposed Budget, Austin, TX
Volume I | 431
perezmi
Text Box
perezmi
Text Box
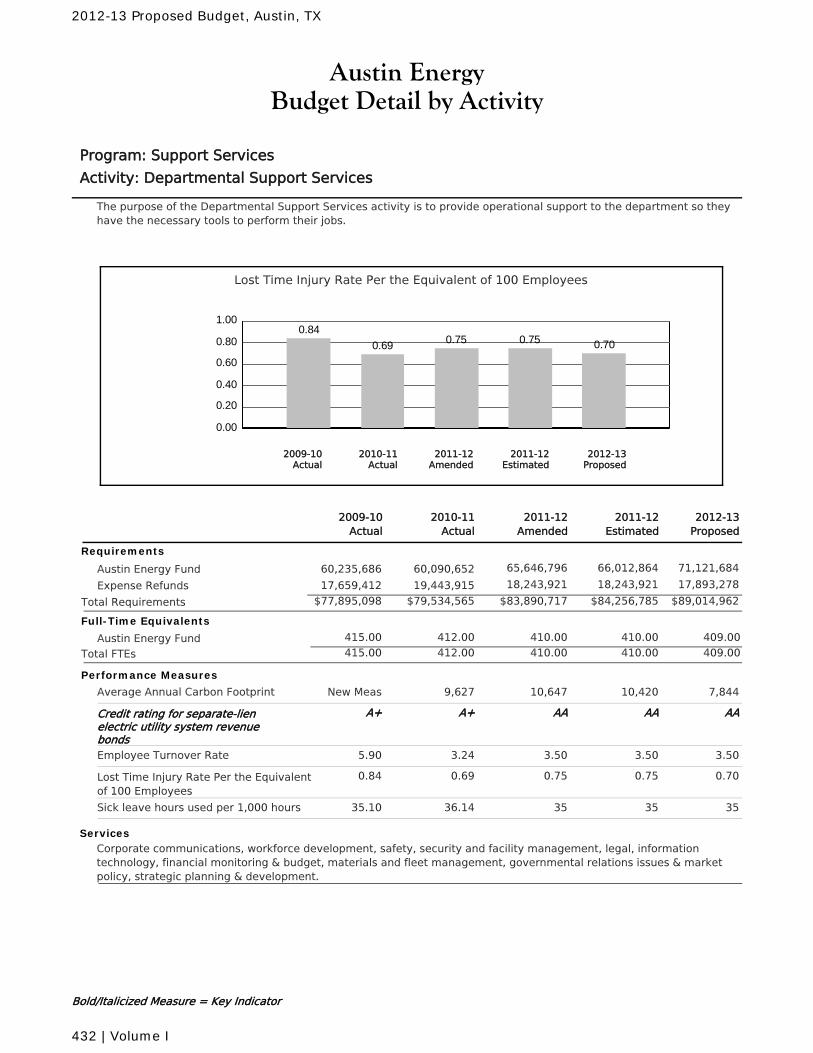
Austin EnergyBudget Detail by Activity
Program: Support Services
Activity: Departmental Support Services
The purpose of the Departmental Support Services activity is to provide operational support to the department so theyhave the necessary tools to perform their jobs.
Lost Time Injury Rate Per the Equivalent of 100 Employees
0.00
0.20
0.40
0.60
0.80
1.000.84
0.69 0.75 0.75 0.70
2010-11Actual
2012-13Proposed
2011-12Amended
2011-12Estimated
2009-10Actual
2011-12Amended
2010-11Actual
2011-12Estimated
2012-13Proposed
2009-10Actual
Requirements
Austin Energy Fund 65,646,796 66,012,864 71,121,68460,090,65260,235,686
Expense Refunds 18,243,921 18,243,921 17,893,27819,443,91517,659,412
$83,890,717 $84,256,785 $89,014,962Total Requirements $79,534,565$77,895,098
Full-Time Equivalents
Austin Energy Fund 412.00 410.00 410.00 409.00415.00
Total FTEs 412.00 410.00 410.00 409.00415.00
Performance Measures
Average Annual Carbon Footprint 10,6479,627 10,420 7,844New Meas
Credit rating for separate-lienelectric utility system revenuebonds
AAA+ AA AAA+
Employee Turnover Rate 3.503.24 3.50 3.505.90
Lost Time Injury Rate Per the Equivalentof 100 Employees
0.750.69 0.75 0.700.84
Sick leave hours used per 1,000 hours 3536.14 35 3535.10
ServicesCorporate communications, workforce development, safety, security and facility management, legal, informationtechnology, financial monitoring & budget, materials and fleet management, governmental relations issues & marketpolicy, strategic planning & development.
Bold/Italicized Measure = Key Indicator
2012-13 Proposed Budget, Austin, TX
432 | Volume I
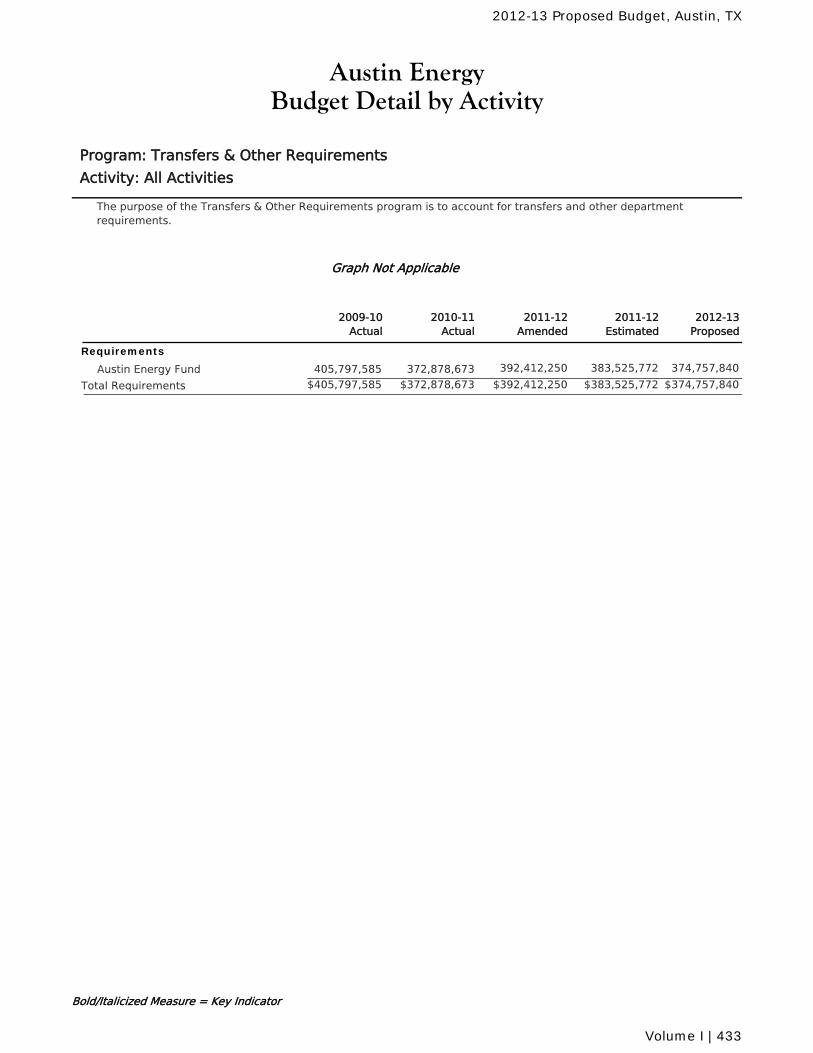
Austin EnergyBudget Detail by Activity
Program: Transfers & Other Requirements
Activity: All Activities
The purpose of the Transfers & Other Requirements program is to account for transfers and other departmentrequirements.
Graph Not Applicable
2011-12Amended
2010-11Actual
2011-12Estimated
2012-13Proposed
2009-10Actual
Requirements
Austin Energy Fund 392,412,250 383,525,772 374,757,840372,878,673405,797,585
$392,412,250 $383,525,772 $374,757,840Total Requirements $372,878,673$405,797,585
Bold/Italicized Measure = Key Indicator
2012-13 Proposed Budget, Austin, TX
Volume I | 433
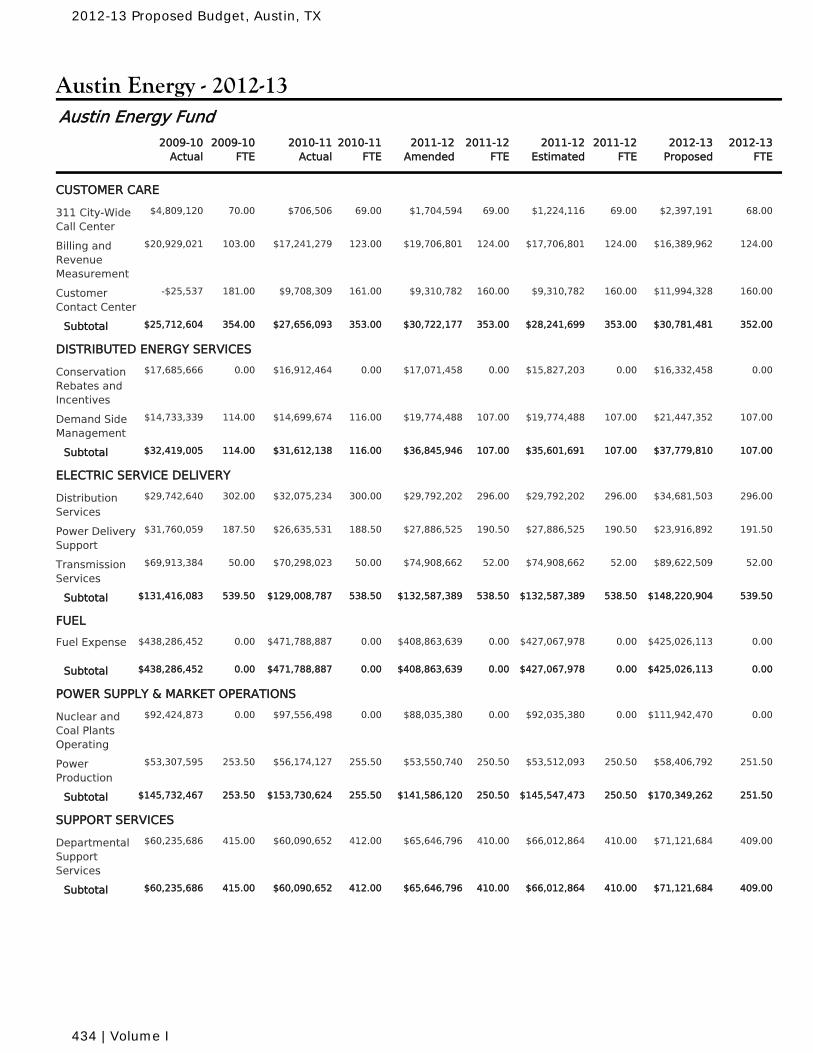
Austin Energy - 2012-13
2010-11Actual
2010-11FTE
2011-12Amended
2011-12FTE
2011-12Estimated
2011-12FTE
2009-10Actual
2009-10FTE
2012-13Proposed
2012-13FTE
Austin Energy Fund
CUSTOMER CARE
$706,506 69.00 $1,704,594 69.00 $1,224,116 69.00311 City-WideCall Center
70.00 $2,397,191 68.00$4,809,120
$17,241,279 123.00 $19,706,801 124.00 $17,706,801 124.00Billing andRevenueMeasurement
103.00 $16,389,962 124.00$20,929,021
$9,708,309 161.00 $9,310,782 160.00 $9,310,782 160.00CustomerContact Center
181.00 $11,994,328 160.00-$25,537
$27,656,093 353.00 $30,722,177 353.00 $28,241,699 353.00Subtotal 354.00 $30,781,481 352.00$25,712,604
DISTRIBUTED ENERGY SERVICES
$16,912,464 0.00 $17,071,458 0.00 $15,827,203 0.00ConservationRebates andIncentives
0.00 $16,332,458 0.00$17,685,666
$14,699,674 116.00 $19,774,488 107.00 $19,774,488 107.00Demand SideManagement
114.00 $21,447,352 107.00$14,733,339
$31,612,138 116.00 $36,845,946 107.00 $35,601,691 107.00Subtotal 114.00 $37,779,810 107.00$32,419,005
ELECTRIC SERVICE DELIVERY
$32,075,234 300.00 $29,792,202 296.00 $29,792,202 296.00DistributionServices
302.00 $34,681,503 296.00$29,742,640
$26,635,531 188.50 $27,886,525 190.50 $27,886,525 190.50Power DeliverySupport
187.50 $23,916,892 191.50$31,760,059
$70,298,023 50.00 $74,908,662 52.00 $74,908,662 52.00TransmissionServices
50.00 $89,622,509 52.00$69,913,384
$129,008,787 538.50 $132,587,389 538.50 $132,587,389 538.50Subtotal 539.50 $148,220,904 539.50$131,416,083
FUEL
$471,788,887 0.00 $408,863,639 0.00 $427,067,978 0.00Fuel Expense 0.00 $425,026,113 0.00$438,286,452
$471,788,887 0.00 $408,863,639 0.00 $427,067,978 0.00Subtotal 0.00 $425,026,113 0.00$438,286,452
POWER SUPPLY & MARKET OPERATIONS
$97,556,498 0.00 $88,035,380 0.00 $92,035,380 0.00Nuclear andCoal PlantsOperating
0.00 $111,942,470 0.00$92,424,873
$56,174,127 255.50 $53,550,740 250.50 $53,512,093 250.50PowerProduction
253.50 $58,406,792 251.50$53,307,595
$153,730,624 255.50 $141,586,120 250.50 $145,547,473 250.50Subtotal 253.50 $170,349,262 251.50$145,732,467
SUPPORT SERVICES
$60,090,652 412.00 $65,646,796 410.00 $66,012,864 410.00DepartmentalSupportServices
415.00 $71,121,684 409.00$60,235,686
$60,090,652 412.00 $65,646,796 410.00 $66,012,864 410.00Subtotal 415.00 $71,121,684 409.00$60,235,686
2012-13 Proposed Budget, Austin, TX
434 | Volume I
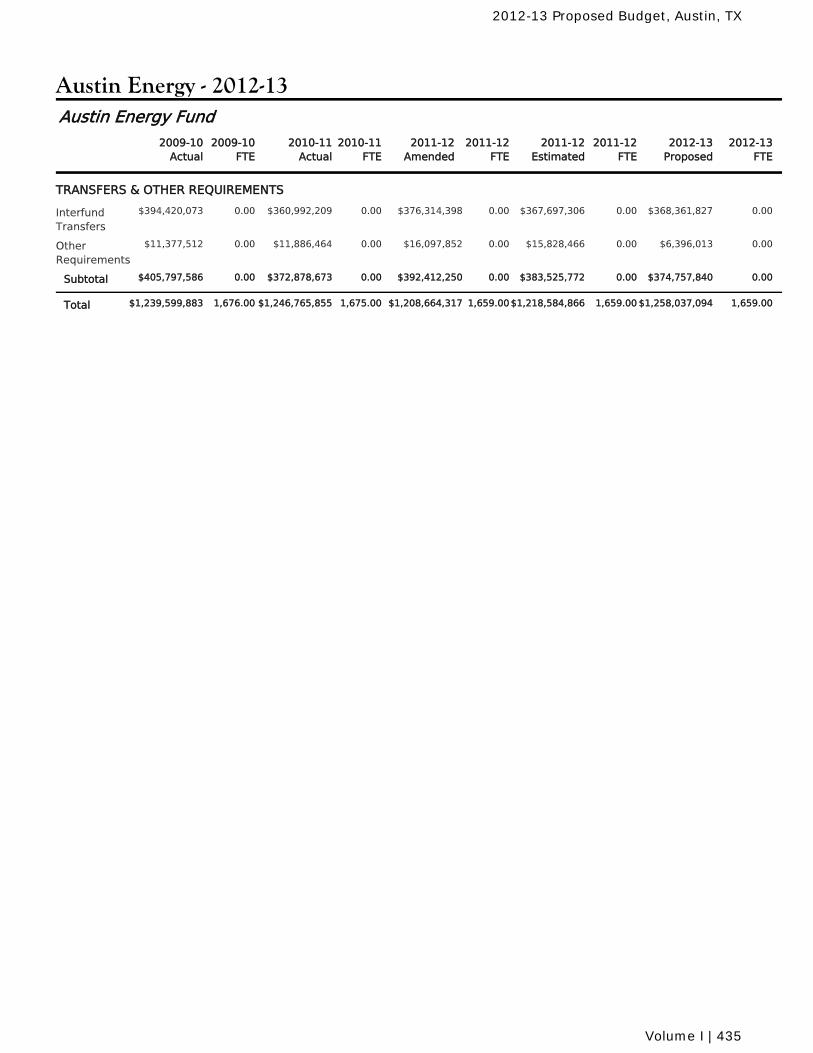
Austin Energy - 2012-13
2010-11Actual
2010-11FTE
2011-12Amended
2011-12FTE
2011-12Estimated
2011-12FTE
2009-10Actual
2009-10FTE
2012-13Proposed
2012-13FTE
Austin Energy Fund
TRANSFERS & OTHER REQUIREMENTS
$360,992,209 0.00 $376,314,398 0.00 $367,697,306 0.00InterfundTransfers
0.00 $368,361,827 0.00$394,420,073
$11,886,464 0.00 $16,097,852 0.00 $15,828,466 0.00OtherRequirements
0.00 $6,396,013 0.00$11,377,512
$372,878,673 0.00 $392,412,250 0.00 $383,525,772 0.00Subtotal 0.00 $374,757,840 0.00$405,797,586
$1,246,765,855 1,675.00 $1,208,664,317 1,659.00$1,218,584,866 1,659.00Total 1,676.00 $1,258,037,094 1,659.00$1,239,599,883
2012-13 Proposed Budget, Austin, TX
Volume I | 435
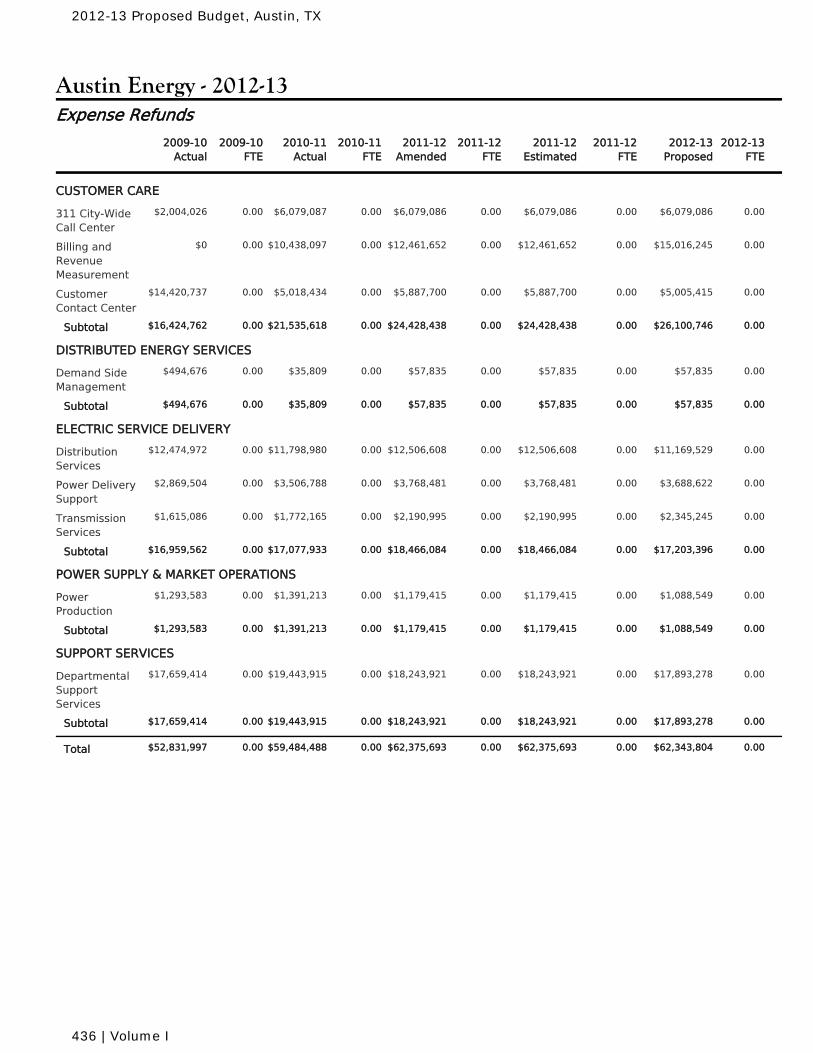
Austin Energy - 2012-13
2010-11Actual
2010-11FTE
2011-12Amended
2011-12FTE
2011-12Estimated
2011-12FTE
2009-10Actual
2009-10FTE
2012-13Proposed
2012-13FTE
Expense Refunds
CUSTOMER CARE
$6,079,087 0.00 $6,079,086 0.00 $6,079,086 0.00311 City-WideCall Center
0.00 $6,079,086 0.00$2,004,026
$10,438,097 0.00 $12,461,652 0.00 $12,461,652 0.00Billing andRevenueMeasurement
0.00 $15,016,245 0.00$0
$5,018,434 0.00 $5,887,700 0.00 $5,887,700 0.00CustomerContact Center
0.00 $5,005,415 0.00$14,420,737
$21,535,618 0.00 $24,428,438 0.00 $24,428,438 0.00Subtotal 0.00 $26,100,746 0.00$16,424,762
DISTRIBUTED ENERGY SERVICES
$35,809 0.00 $57,835 0.00 $57,835 0.00Demand SideManagement
0.00 $57,835 0.00$494,676
$35,809 0.00 $57,835 0.00 $57,835 0.00Subtotal 0.00 $57,835 0.00$494,676
ELECTRIC SERVICE DELIVERY
$11,798,980 0.00 $12,506,608 0.00 $12,506,608 0.00DistributionServices
0.00 $11,169,529 0.00$12,474,972
$3,506,788 0.00 $3,768,481 0.00 $3,768,481 0.00Power DeliverySupport
0.00 $3,688,622 0.00$2,869,504
$1,772,165 0.00 $2,190,995 0.00 $2,190,995 0.00TransmissionServices
0.00 $2,345,245 0.00$1,615,086
$17,077,933 0.00 $18,466,084 0.00 $18,466,084 0.00Subtotal 0.00 $17,203,396 0.00$16,959,562
POWER SUPPLY & MARKET OPERATIONS
$1,391,213 0.00 $1,179,415 0.00 $1,179,415 0.00PowerProduction
0.00 $1,088,549 0.00$1,293,583
$1,391,213 0.00 $1,179,415 0.00 $1,179,415 0.00Subtotal 0.00 $1,088,549 0.00$1,293,583
SUPPORT SERVICES
$19,443,915 0.00 $18,243,921 0.00 $18,243,921 0.00DepartmentalSupportServices
0.00 $17,893,278 0.00$17,659,414
$19,443,915 0.00 $18,243,921 0.00 $18,243,921 0.00Subtotal 0.00 $17,893,278 0.00$17,659,414
$59,484,488 0.00 $62,375,693 0.00 $62,375,693 0.00Total 0.00 $62,343,804 0.00$52,831,997
2012-13 Proposed Budget, Austin, TX
436 | Volume I
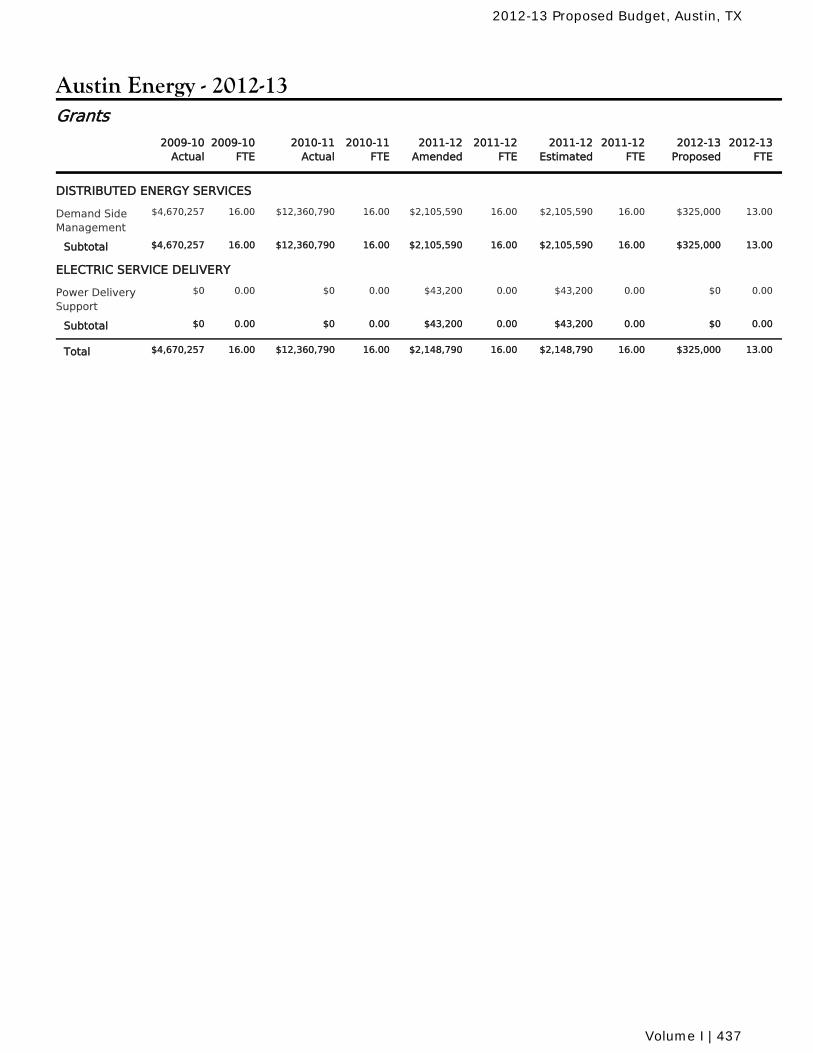
Austin Energy - 2012-13
2010-11Actual
2010-11FTE
2011-12Amended
2011-12FTE
2011-12Estimated
2011-12FTE
2009-10Actual
2009-10FTE
2012-13Proposed
2012-13FTE
Grants
DISTRIBUTED ENERGY SERVICES
$12,360,790 16.00 $2,105,590 16.00 $2,105,590 16.00Demand SideManagement
16.00 $325,000 13.00$4,670,257
$12,360,790 16.00 $2,105,590 16.00 $2,105,590 16.00Subtotal 16.00 $325,000 13.00$4,670,257
ELECTRIC SERVICE DELIVERY
$0 0.00 $43,200 0.00 $43,200 0.00Power DeliverySupport
0.00 $0 0.00$0
$0 0.00 $43,200 0.00 $43,200 0.00Subtotal 0.00 $0 0.00$0
$12,360,790 16.00 $2,148,790 16.00 $2,148,790 16.00Total 16.00 $325,000 13.00$4,670,257
2012-13 Proposed Budget, Austin, TX
Volume I | 437

2012-13 Proposed Budget, Austin, TX
438 | Volume I
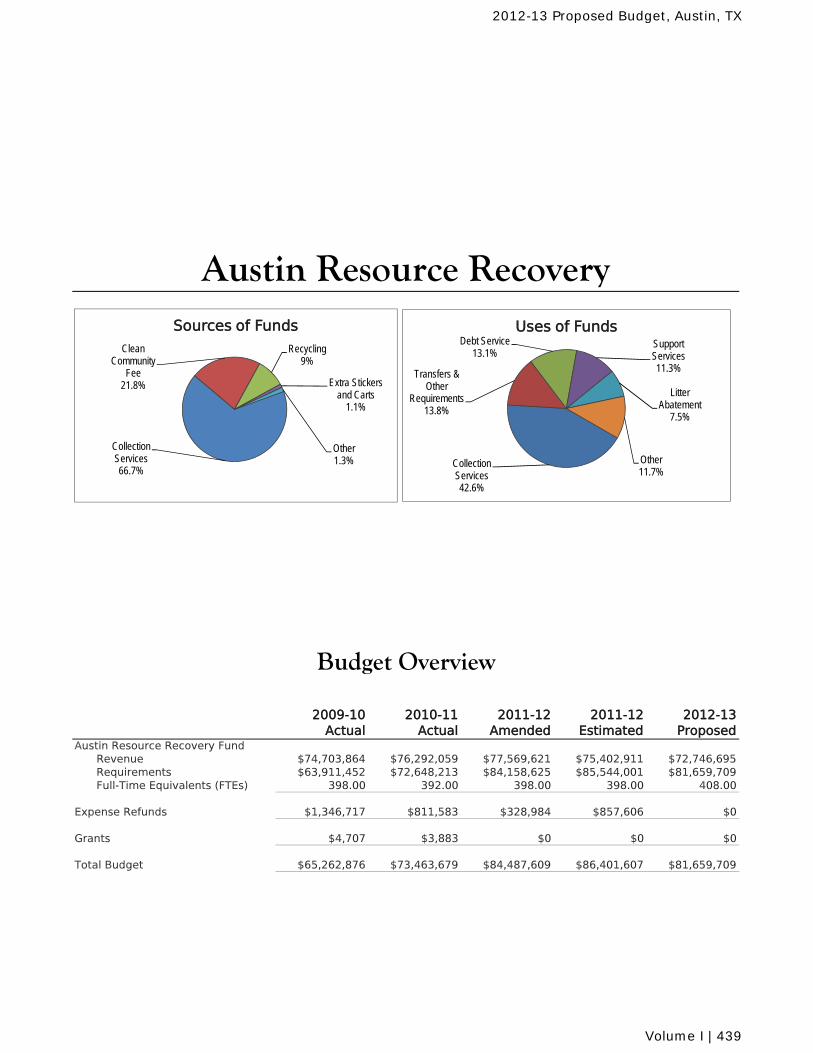
2009-10 Actual
2010-11 Actual
2011-12 Amended
2011-12 Estimated
2012-13 Proposed
Austin Resource Recovery FundRevenue $74,703,864 $76,292,059 $77,569,621 $75,402,911 $72,746,695Requirements $63,911,452 $72,648,213 $84,158,625 $85,544,001 $81,659,709Full-Time Equivalents (FTEs) 398.00 392.00 398.00 398.00 408.00
Expense Refunds $1,346,717 $811,583 $328,984 $857,606 $0
Grants $4,707 $3,883 $0 $0 $0
Total Budget $65,262,876 $73,463,679 $84,487,609 $86,401,607 $81,659,709
Budget Overview
Austin Resource Recovery
Collection Services66.7%
Clean Community
Fee21.8%
Recycling9%
Extra Stickers and Carts
1.1%
Other1.3%
Sources of Funds
Collection Services42.6%
Transfers & Other
Requirements13.8%
Debt Service13.1%
Support Services11.3%
Litter Abatement
7.5%
Other11.7%
Uses of Funds
2012-13 Proposed Budget, Austin, TX
Volume I | 439
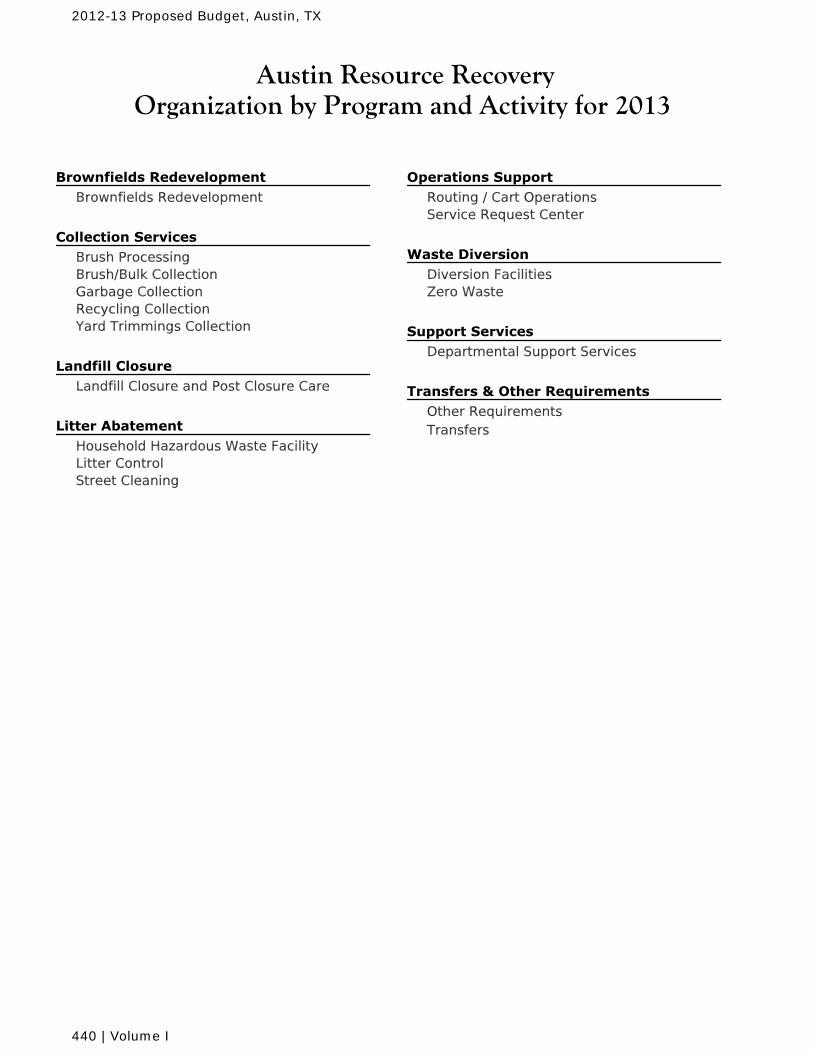
Austin Resource RecoveryOrganization by Program and Activity for 2013
Brownfields Redevelopment Brownfields Redevelopment
Collection Services Brush ProcessingBrush/Bulk CollectionGarbage CollectionRecycling CollectionYard Trimmings Collection
Landfill Closure Landfill Closure and Post Closure Care
Litter Abatement Household Hazardous Waste FacilityLitter ControlStreet Cleaning
Operations Support Routing / Cart OperationsService Request Center
Waste Diversion Diversion FacilitiesZero Waste
Support Services Departmental Support Services
Transfers & Other Requirements Other RequirementsTransfers
2012-13 Proposed Budget, Austin, TX
440 | Volume I
Austin Resource RecoveryMission and Goals for 2013
Mission
The mission of Austin Resource Recovery is to provide excellent customer services that promotewaste reduction, increase resource recovery, and support the City's sustainablilty efforts so thatzero waste goals may be achieved.
Goals
Provide reliable integrated waste management services.
Increase the average pounds of recycled materials collected per customer account per pickupto 26 lbs.Decrease the average pounds of garbage collected per customer account per week to 26 lbs.
Implement Master Plan initiatives in order to achieve Zero Waste goals
Increase the percent of waste stream diverted from the landfill through ARR Curbside andHousehold Hazardous Waste Operations to 42%.
Provide educational programs to the community on responsible waste management.
Promote Zero Waste by increasing the number of contacts through presentations given andevents attended to 12,000.
Increase customer satisfaction in the citizen survey for Residential Garbage Collection Services to90%.
Decrease the lost time injury rate per the equivalent of 100 employees to 0.
2012-13 Proposed Budget, Austin, TX
Volume I | 441
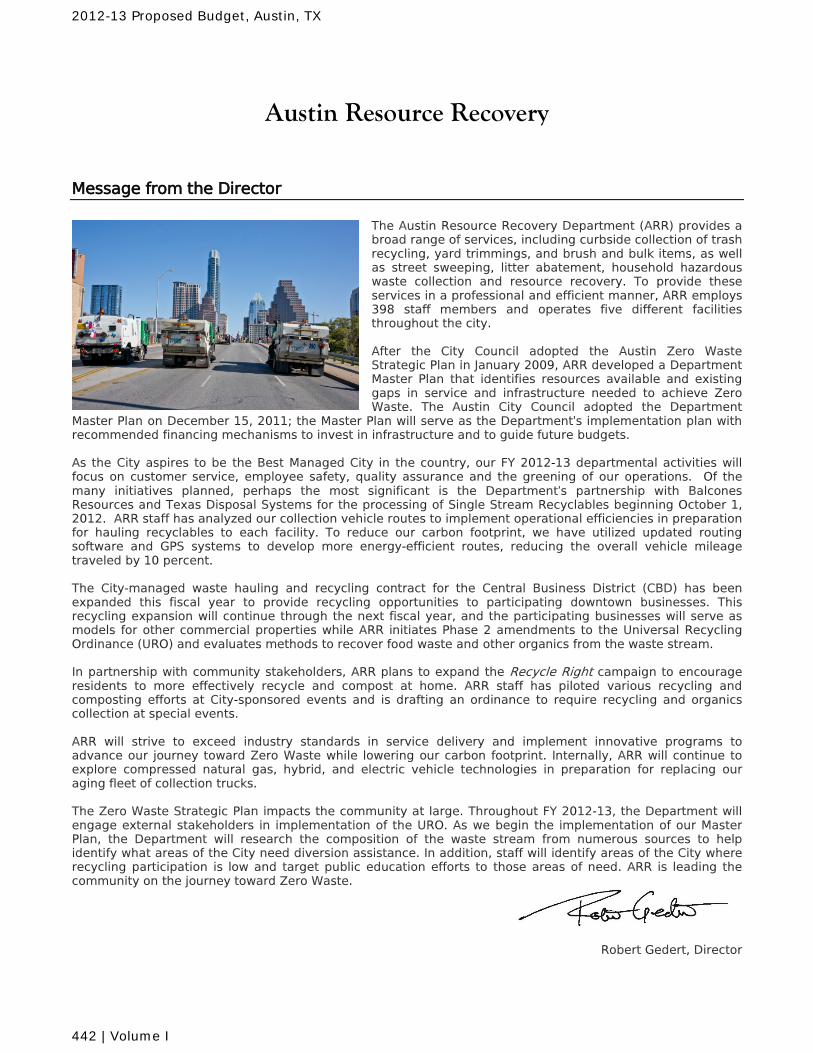
Austin Resource Recovery
Message from the Director
The Austin Resource Recovery Department (ARR) provides a broad range of services, including curbside collection of trash recycling, yard trimmings, and brush and bulk items, as well as street sweeping, litter abatement, household hazardous waste collection and resource recovery. To provide these services in a professional and efficient manner, ARR employs 398 staff members and operates five different facilities throughout the city. After the City Council adopted the Austin Zero Waste Strategic Plan in January 2009, ARR developed a Department Master Plan that identifies resources available and existing gaps in service and infrastructure needed to achieve Zero Waste. The Austin City Council adopted the Department
Master Plan on December 15, 2011; the Master Plan will serve as the Department’s implementation plan with recommended financing mechanisms to invest in infrastructure and to guide future budgets. As the City aspires to be the Best Managed City in the country, our FY 2012-13 departmental activities will focus on customer service, employee safety, quality assurance and the greening of our operations. Of the many initiatives planned, perhaps the most significant is the Department’s partnership with Balcones Resources and Texas Disposal Systems for the processing of Single Stream Recyclables beginning October 1, 2012. ARR staff has analyzed our collection vehicle routes to implement operational efficiencies in preparation for hauling recyclables to each facility. To reduce our carbon footprint, we have utilized updated routing software and GPS systems to develop more energy-efficient routes, reducing the overall vehicle mileage traveled by 10 percent. The City-managed waste hauling and recycling contract for the Central Business District (CBD) has been expanded this fiscal year to provide recycling opportunities to participating downtown businesses. This recycling expansion will continue through the next fiscal year, and the participating businesses will serve as models for other commercial properties while ARR initiates Phase 2 amendments to the Universal Recycling Ordinance (URO) and evaluates methods to recover food waste and other organics from the waste stream. In partnership with community stakeholders, ARR plans to expand the Recycle Right campaign to encourage residents to more effectively recycle and compost at home. ARR staff has piloted various recycling and composting efforts at City-sponsored events and is drafting an ordinance to require recycling and organics collection at special events. ARR will strive to exceed industry standards in service delivery and implement innovative programs to advance our journey toward Zero Waste while lowering our carbon footprint. Internally, ARR will continue to explore compressed natural gas, hybrid, and electric vehicle technologies in preparation for replacing our aging fleet of collection trucks. The Zero Waste Strategic Plan impacts the community at large. Throughout FY 2012-13, the Department will engage external stakeholders in implementation of the URO. As we begin the implementation of our Master Plan, the Department will research the composition of the waste stream from numerous sources to help identify what areas of the City need diversion assistance. In addition, staff will identify areas of the City where recycling participation is low and target public education efforts to those areas of need. ARR is leading the community on the journey toward Zero Waste.
Robert Gedert, Director
2012-13 Proposed Budget, Austin, TX
442 | Volume I
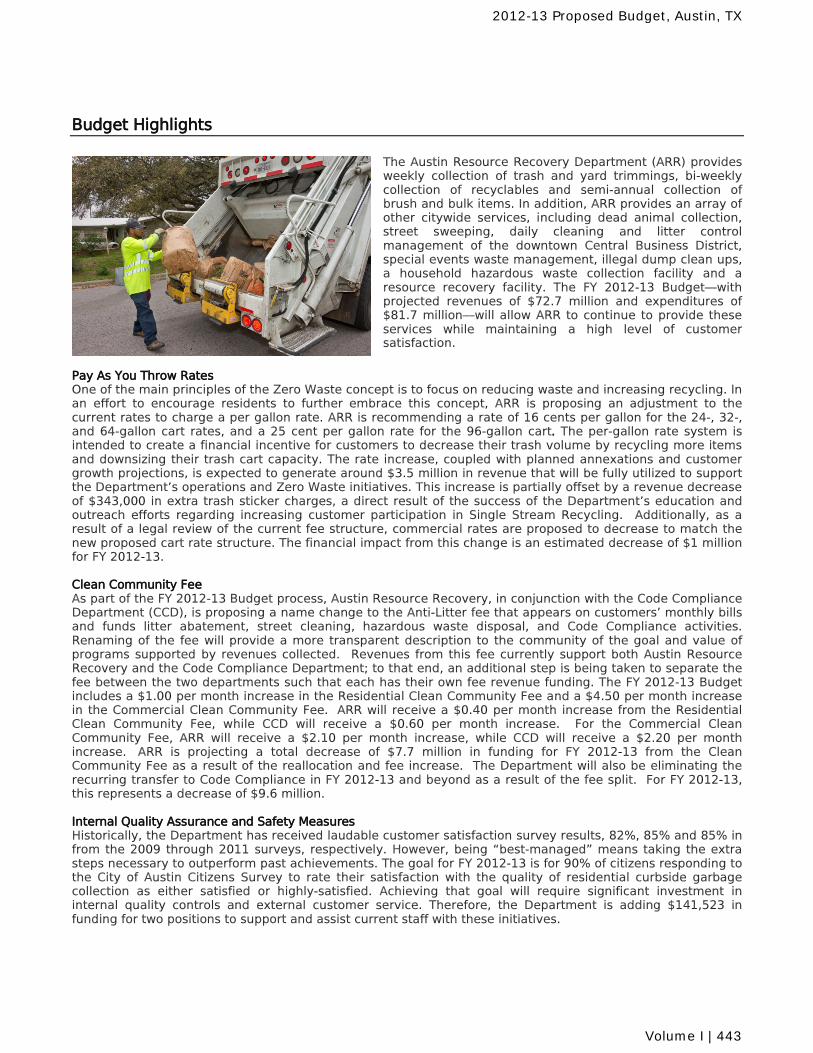
Budget Highlights
The Austin Resource Recovery Department (ARR) provides weekly collection of trash and yard trimmings, bi-weekly collection of recyclables and semi-annual collection of brush and bulk items. In addition, ARR provides an array of other citywide services, including dead animal collection, street sweeping, daily cleaning and litter control management of the downtown Central Business District, special events waste management, illegal dump clean ups, a household hazardous waste collection facility and a resource recovery facility. The FY 2012-13 Budget—with projected revenues of $72.7 million and expenditures of $81.7 million—will allow ARR to continue to provide these services while maintaining a high level of customer satisfaction.
Pay As You Throw Rates One of the main principles of the Zero Waste concept is to focus on reducing waste and increasing recycling. In an effort to encourage residents to further embrace this concept, ARR is proposing an adjustment to the current rates to charge a per gallon rate. ARR is recommending a rate of 16 cents per gallon for the 24-, 32-, and 64-gallon cart rates, and a 25 cent per gallon rate for the 96-gallon cart. The per-gallon rate system is intended to create a financial incentive for customers to decrease their trash volume by recycling more items and downsizing their trash cart capacity. The rate increase, coupled with planned annexations and customer growth projections, is expected to generate around $3.5 million in revenue that will be fully utilized to support the Department’s operations and Zero Waste initiatives. This increase is partially offset by a revenue decrease of $343,000 in extra trash sticker charges, a direct result of the success of the Department’s education and outreach efforts regarding increasing customer participation in Single Stream Recycling. Additionally, as a result of a legal review of the current fee structure, commercial rates are proposed to decrease to match the new proposed cart rate structure. The financial impact from this change is an estimated decrease of $1 million for FY 2012-13. Clean Community Fee As part of the FY 2012-13 Budget process, Austin Resource Recovery, in conjunction with the Code Compliance Department (CCD), is proposing a name change to the Anti-Litter fee that appears on customers’ monthly bills and funds litter abatement, street cleaning, hazardous waste disposal, and Code Compliance activities. Renaming of the fee will provide a more transparent description to the community of the goal and value of programs supported by revenues collected. Revenues from this fee currently support both Austin Resource Recovery and the Code Compliance Department; to that end, an additional step is being taken to separate the fee between the two departments such that each has their own fee revenue funding. The FY 2012-13 Budget includes a $1.00 per month increase in the Residential Clean Community Fee and a $4.50 per month increase in the Commercial Clean Community Fee. ARR will receive a $0.40 per month increase from the Residential Clean Community Fee, while CCD will receive a $0.60 per month increase. For the Commercial Clean Community Fee, ARR will receive a $2.10 per month increase, while CCD will receive a $2.20 per month increase. ARR is projecting a total decrease of $7.7 million in funding for FY 2012-13 from the Clean Community Fee as a result of the reallocation and fee increase. The Department will also be eliminating the recurring transfer to Code Compliance in FY 2012-13 and beyond as a result of the fee split. For FY 2012-13, this represents a decrease of $9.6 million. Internal Quality Assurance and Safety Measures Historically, the Department has received laudable customer satisfaction survey results, 82%, 85% and 85% in from the 2009 through 2011 surveys, respectively. However, being “best-managed” means taking the extra steps necessary to outperform past achievements. The goal for FY 2012-13 is for 90% of citizens responding to the City of Austin Citizens Survey to rate their satisfaction with the quality of residential curbside garbage collection as either satisfied or highly-satisfied. Achieving that goal will require significant investment in internal quality controls and external customer service. Therefore, the Department is adding $141,523 in funding for two positions to support and assist current staff with these initiatives.
2012-13 Proposed Budget, Austin, TX
Volume I | 443
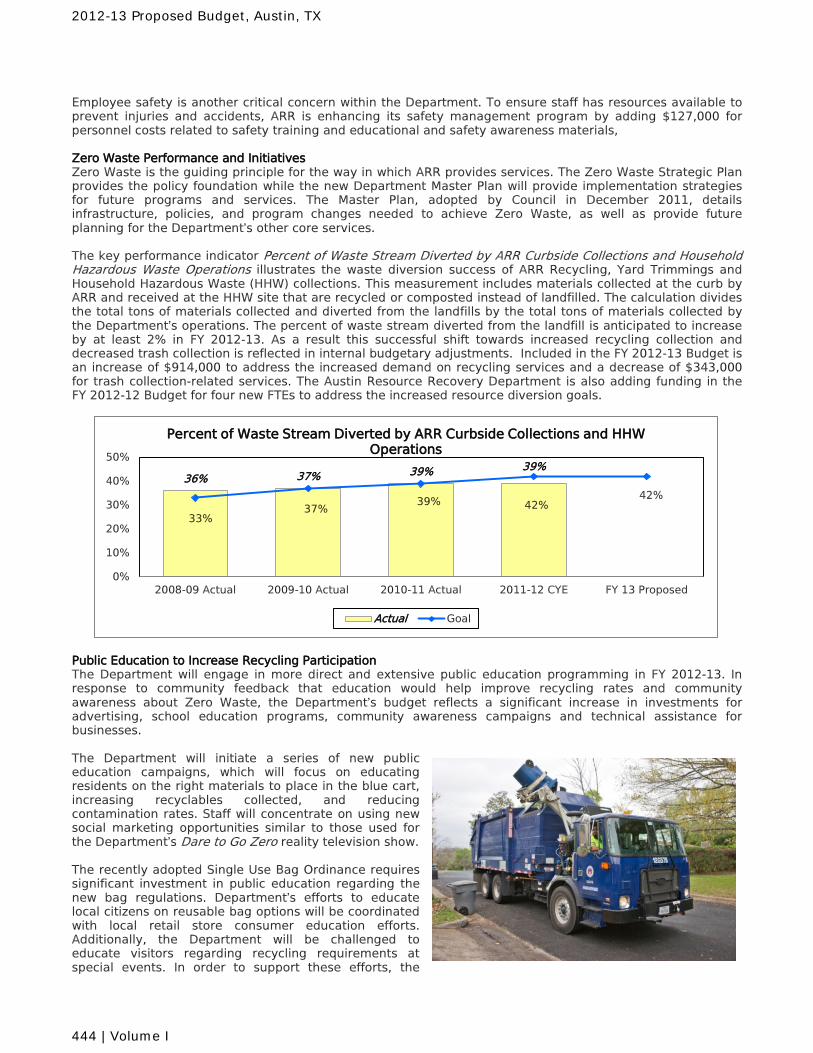
Employee safety is another critical concern within the Department. To ensure staff has resources available to prevent injuries and accidents, ARR is enhancing its safety management program by adding $127,000 for personnel costs related to safety training and educational and safety awareness materials, Zero Waste Performance and Initiatives Zero Waste is the guiding principle for the way in which ARR provides services. The Zero Waste Strategic Plan provides the policy foundation while the new Department Master Plan will provide implementation strategies for future programs and services. The Master Plan, adopted by Council in December 2011, details infrastructure, policies, and program changes needed to achieve Zero Waste, as well as provide future planning for the Department’s other core services. The key performance indicator Percent of Waste Stream Diverted by ARR Curbside Collections and Household Hazardous Waste Operations illustrates the waste diversion success of ARR Recycling, Yard Trimmings and Household Hazardous Waste (HHW) collections. This measurement includes materials collected at the curb by ARR and received at the HHW site that are recycled or composted instead of landfilled. The calculation divides the total tons of materials collected and diverted from the landfills by the total tons of materials collected by the Department’s operations. The percent of waste stream diverted from the landfill is anticipated to increase by at least 2% in FY 2012-13. As a result this successful shift towards increased recycling collection and decreased trash collection is reflected in internal budgetary adjustments. Included in the FY 2012-13 Budget is an increase of $914,000 to address the increased demand on recycling services and a decrease of $343,000 for trash collection-related services. The Austin Resource Recovery Department is also adding funding in the FY 2012-12 Budget for four new FTEs to address the increased resource diversion goals.
Public Education to Increase Recycling Participation The Department will engage in more direct and extensive public education programming in FY 2012-13. In response to community feedback that education would help improve recycling rates and community awareness about Zero Waste, the Department’s budget reflects a significant increase in investments for advertising, school education programs, community awareness campaigns and technical assistance for businesses. The Department will initiate a series of new public education campaigns, which will focus on educating residents on the right materials to place in the blue cart, increasing recyclables collected, and reducing contamination rates. Staff will concentrate on using new social marketing opportunities similar to those used for the Department’s Dare to Go Zero reality television show. The recently adopted Single Use Bag Ordinance requires significant investment in public education regarding the new bag regulations. Department’s efforts to educate local citizens on reusable bag options will be coordinated with local retail store consumer education efforts. Additionally, the Department will be challenged to educate visitors regarding recycling requirements at special events. In order to support these efforts, the
36% 37% 39% 39%
33% 37%
39% 42% 42%
0%
10%
20%
30%
40%
50%
2008-09 Actual 2009-10 Actual 2010-11 Actual 2011-12 CYE FY 13 Proposed
Percent of Waste Stream Diverted by ARR Curbside Collections and HHW Operations
Actual Goal
2012-13 Proposed Budget, Austin, TX
444 | Volume I
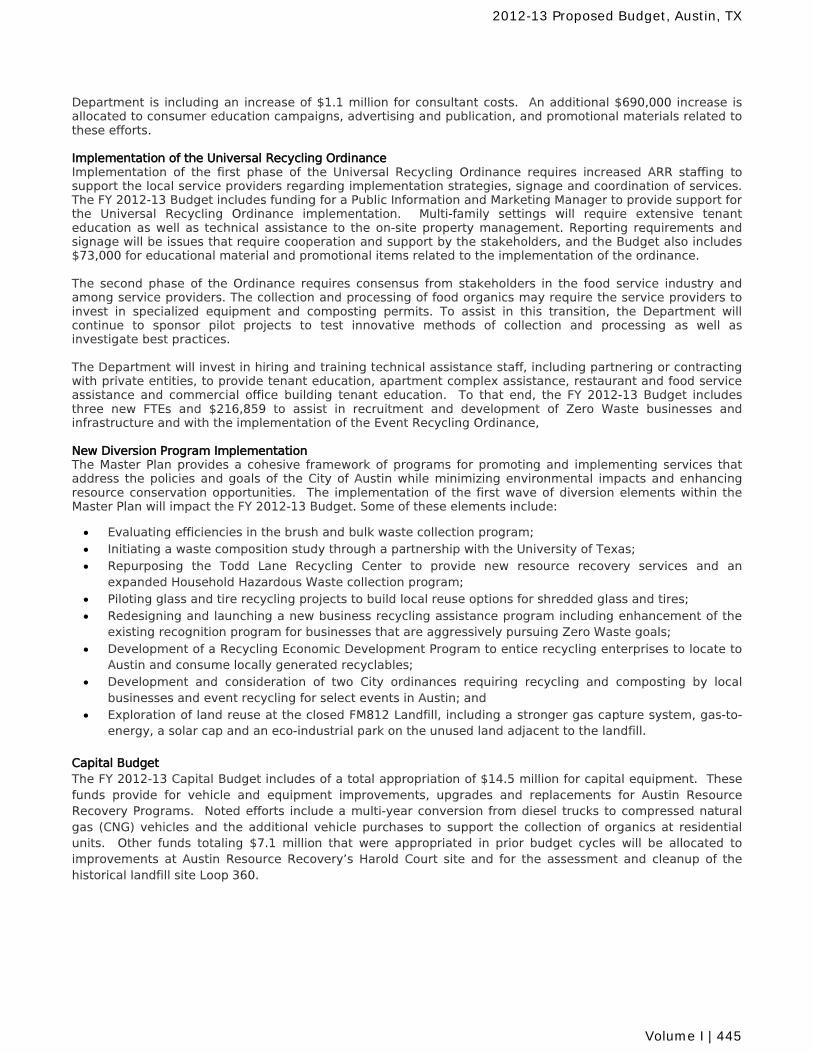
Department is including an increase of $1.1 million for consultant costs. An additional $690,000 increase is allocated to consumer education campaigns, advertising and publication, and promotional materials related to these efforts. Implementation of the Universal Recycling Ordinance Implementation of the first phase of the Universal Recycling Ordinance requires increased ARR staffing to support the local service providers regarding implementation strategies, signage and coordination of services. The FY 2012-13 Budget includes funding for a Public Information and Marketing Manager to provide support for the Universal Recycling Ordinance implementation. Multi-family settings will require extensive tenant education as well as technical assistance to the on-site property management. Reporting requirements and signage will be issues that require cooperation and support by the stakeholders, and the Budget also includes $73,000 for educational material and promotional items related to the implementation of the ordinance. The second phase of the Ordinance requires consensus from stakeholders in the food service industry and among service providers. The collection and processing of food organics may require the service providers to invest in specialized equipment and composting permits. To assist in this transition, the Department will continue to sponsor pilot projects to test innovative methods of collection and processing as well as investigate best practices. The Department will invest in hiring and training technical assistance staff, including partnering or contracting with private entities, to provide tenant education, apartment complex assistance, restaurant and food service assistance and commercial office building tenant education. To that end, the FY 2012-13 Budget includes three new FTEs and $216,859 to assist in recruitment and development of Zero Waste businesses and infrastructure and with the implementation of the Event Recycling Ordinance, New Diversion Program Implementation The Master Plan provides a cohesive framework of programs for promoting and implementing services that address the policies and goals of the City of Austin while minimizing environmental impacts and enhancing resource conservation opportunities. The implementation of the first wave of diversion elements within the Master Plan will impact the FY 2012-13 Budget. Some of these elements include:
• Evaluating efficiencies in the brush and bulk waste collection program; • Initiating a waste composition study through a partnership with the University of Texas; • Repurposing the Todd Lane Recycling Center to provide new resource recovery services and an
expanded Household Hazardous Waste collection program; • Piloting glass and tire recycling projects to build local reuse options for shredded glass and tires; • Redesigning and launching a new business recycling assistance program including enhancement of the
existing recognition program for businesses that are aggressively pursuing Zero Waste goals; • Development of a Recycling Economic Development Program to entice recycling enterprises to locate to
Austin and consume locally generated recyclables; • Development and consideration of two City ordinances requiring recycling and composting by local
businesses and event recycling for select events in Austin; and • Exploration of land reuse at the closed FM812 Landfill, including a stronger gas capture system, gas-to-
energy, a solar cap and an eco-industrial park on the unused land adjacent to the landfill. Capital Budget The FY 2012-13 Capital Budget includes of a total appropriation of $14.5 million for capital equipment. These funds provide for vehicle and equipment improvements, upgrades and replacements for Austin Resource Recovery Programs. Noted efforts include a multi-year conversion from diesel trucks to compressed natural gas (CNG) vehicles and the additional vehicle purchases to support the collection of organics at residential units. Other funds totaling $7.1 million that were appropriated in prior budget cycles will be allocated to improvements at Austin Resource Recovery’s Harold Court site and for the assessment and cleanup of the historical landfill site Loop 360.
2012-13 Proposed Budget, Austin, TX
Volume I | 445
Revenue Changes Dollars
Austin Resource Recovery is decreasing the revenue from the Clean Community Feeby $9,591,680 due to a reallocation of the fee generated through Code Complianceand Austin Resource Recovery. This revenue decrease is offset by a proposedincrease in the Clean Community Fee, which increases the revenue projections forAustin Resource Recovery by $2,384,385. The drop in revenue is further offset by afull reduction in the transfer from Austin Resource Recovery to Code Compliance inFY 2012-13. ($7,207,295)
The Budget includes an increase of $3,474,205 for revenue from residentialcustomer collection fees due to a proposed rate increase related to trash carts,customer growth, and annexations. $3,474,205
Included in the Budget is a decrease of $1,000,972 for revenue from commercialcustomer collection as a result of planned rate reductions. ($1,000,972)
Due to a projected increase in the amount of recyclable materials collected and anincrease in the commodities market prices, the Budget includes an increase of$643,866 for recycling revenue. $643,866
The Budget includes a decrease of $350,000 in revenue from the Waste Haulerprogram, which is being transferred to Code Compliance in FY 2012-13. ($350,000)
The Budget includes a decrease of $342,512 from extra trash stickers and trashcarts revenue because of an estimated increase in customer participation in SingleStream Recycling. ($342,512)
A decrease of $20,571 in revenue for account adjustments and decreases in interestrevenue is included in the Budget. ($20,571)
Expenditure Changes FTEs Dollars
CitywideThe Budget includes $575,139 for salary increases associated with wageadjustments in FY 2012-13. An additional $122,172 is included in the Budget forincreased City contributions for health insurance. $697,311
The Budget includes $427,870 for wage adjustments associated with implementingthe City's recently completed market study. $427,870
Also included in the Budget is an increase of $1,301,355 in Fleet fuel charges andFleet preventative maintenance costs. $1,301,355
The Budget includes additional funding for the Employees' Retirement System that isequivalent to 2% of payroll for non-civil service employees to help improve thefunded status of the pension system. $410,196
Landfill Closure
Included in the Budget is an increase of $917,722 due to the transfer of the LandfillClosure Program from the CIP Fund to the Austin Resource Recovery Operating Fund. $917,722
Austin Resource RecoverySignificant Changes
Austin Resource Recovery Fund
2012-13 Proposed Budget, Austin, TX
446 | Volume I
Expenditure Changes FTEs Dollars
Collection ServicesIncluded in the Budget is a decrease of $363,160 in temporary employees due tochanges in the hiring process. ($363,160)
The Budget includes an increase of $495,410 in Single Stream Recycling materialprocessing expenses due to contractually-obligated increases and a projectedtonnage increase. $495,410
Included in the Budget is a decrease of $193,309 in trash collection service contractsand a decrease of $40,484 for landfill fees due to a decrease in tonnage, a decreaseof $61,802 in radio/telephone costs and maintenance expenses, a decrease of$35,136 in laundry related supplies, and a decrease of $13,011 in small tools, safetyequipment, and software. ($343,742)
The Budget includes a decrease of $45,000 for vehicle parts, a decrease of $44,787in unscheduled vehicle repairs, and a decrease of $17,125 for equipment rentalcharges to align the budget with historical spending levels. ($106,912)
Austin Resource Recovery is budgeting an increase of $50,000 due to a new organiccomposting pilot contract, an increase of $42,049 due to a mattress recycling pilotcontract, and an increase of $14,028 in postage due to expanded use of direct mailand notifications. This increase is partially offset by a decrease of $12,258 ineducational training fees and travel expenditures. $93,819
Waste DiversionThe Budget includes funding for one additional Solid Waste Operator Specialistposition to staff the expanded Resource Recovery Center, one Economic andBusiness Development Liaison who will assist with recruitment and development ofZero Waste businesses and infrastructure, and one Administrative Specialist to assistwith the Event Recycling Ordinance implementation. 3.00 $216,859
Included in the Budget is a decrease of $67,560 in temporary employees due tochanges in the hiring process. ($67,560)
Austin Resource Recovery is budgeting an increase of $1,080,000 in contractedconsultant costs due to the upcoming Plastic Bag Public Education and Zero Wastecampaigns. $1,080,000
Also included in the Budget is an increase of $30,000 in hazardous material disposalcosts due to projected increases in material collected at Reuse Centers, an increaseof $5,000 in trash and recycling services, an increase of $276,855 in contracts for two new Reuse Centers, and an increase of $12,544 in interdepartmental charges tothe Public Works Department. $324,399
The Budget includes an increase of $179,800 in postage due to calendar mail outsand direct mail campaigns, an increase of $295,000 in advertising and publicationdue to seasonal advertising, TV media, guerrilla marketing, and Zero Wasteworkshops, and an increase of $218,400 in printing costs associated with theOrganics Collection Program and direct mailings to promote additional materials nowacceptable for Single Stream Recycling. $693,200
Included in the Budget is a decrease in various services, including a decrease of$32,133 in water, wastewater, and electrical services, a decrease of $17,416 incitywide training and fees, a decrease of $10,111 in travel-related expenses, adecrease of $4,000 for maintenance services for existing software, and a decrease of$16,150 in vehicle parts and rental equipment to align the budget with historicalspending levels. ($79,810)
An increase of $73,400 for education material and signage for the UniversalRecycling Ordinance is included in the Budget. $73,400
2012-13 Proposed Budget, Austin, TX
Volume I | 447
Expenditure Changes FTEs Dollars
Support Services
The Budget includes funding for a new Contract Compliance Specialist to address theincrease in the number of contracts and Interlocal agreements received by theDepartment, a new Financial Specialist to replace a position previously transferred to Quality Assurance, a Human Resource Supervisor and Advisor due to support thecurrent staff with workers' compensation activities, and a Public Information andMarketing Manager to provide support for the department's Zero Waste activities. 5.00 $433,021
As part of revised hiring processes, the Budget includes a decrease of $98,268 fortemporary personnel. ($98,268)
The department is including an increase of $79,900 in the Budget for advertisingand publication contracts related to the Clean Austin Program and free brush dropoff points, and an increase of $153,685 is budgeted for postage charges related todirect mail campaigns, community mailings and calendars. $233,585
Included in the Budget is $554,640 for the purchase and implementation of a newIntegrated Solid Waste Data Management and Electronic Fleet ManagementSoftware System. $544,640
The Budget also includes a decrease of $128,500 for janitorial and security services,a decrease of $22,220 for legal and training fees and travel, a decrease of $74,365for office rental space, and a decrease of $18,493 for small tools to align the budgetwith historical spending levels. ($243,578)
Austin Resource Recovery is including an increase of $29,418 for contracted services for truck wash grit disposal, as well as an increase of $81,908 for otherinterdepartmental services. This increase is partially offset by a decrease of $3,900for vehicle parts and a decrease of $6,962 for vehicle preventative maintenance. $100,464
Included in the Budget is an increase of $100,211 for promotion of department-wideeducation campaigns and pilot projects throughout the City. To support theseactivities, $18,000 is included in the Budget for training at an EmployeeDevelopment Day. $118,211
Operations SupportIncluded in the Budget is funding for one Administrative Specialist and one WasteDiversion Planner Senior to support and assist with key departmental initiatives andefforts. 2.00 $141,523
Austin Resource Recovery is including an increase of $285,760 in temporaryemployees due to an increase in cart delivery activities, route audits for revenuerecovery, and a higher demand for account billing information verification. $285,760
The Budget includes an increase of $9,950 for charges related to container paintingand a quality assurance survey, an increase of $10,000 in equipment formaintenance of downtown containers, and an increase of $59,400 ininterdepartmental charges for cart storage at another City facility. $79,350
Also included in the Budget is a decrease of $1,834,929 in funding for trash cartpurchases. Trash carts will be purchased using the capital budget to better align thedepartment's accounting practices. ($1,834,929)
Transfers and Other RequirementsThe Budget includes an increase of $130,248 for citywide administrative support andan increase of $15,820 in the transfer to the Communications and TechnologyManagement Fund. $146,068
The Budget also includes an increase of $536,136 in the transfer of GeneralObligation (GO) Debt Service payments for the purchase of additional equipment tosupport the initiatives in the Austin Resource Recovery Integrated Master Plan. $536,136
2012-13 Proposed Budget, Austin, TX
448 | Volume I
Expenditure Changes FTEs Dollars
Austin Resource Recovery is including an increase in the transfer to the AustinResource Recovery CIP Fund of $1,400,000 for reimbursement of consulting servicescontracted in prior fiscal years. This increase is partially offset by a scheduleddecrease of $824,734 in the transfer to the CIP Fund to cover Landfill Closure andPost Closure Care. $575,266
The Budget includes an increase of $70,355 for Workers' Compensation and anincrease of $57,195 to UCSO (CIS) Billing Support. $127,550
The Budget includes a decrease of $48,229 in the transfer to the Sustainability Fund,and an increase of $42,200 for Accrued Payroll. ($6,029)
Austin Resource Recovery is decreasing the transfer to the Code Compliance Fund. ($9,591,680)
2012-13 Proposed Budget, Austin, TX
Volume I | 449
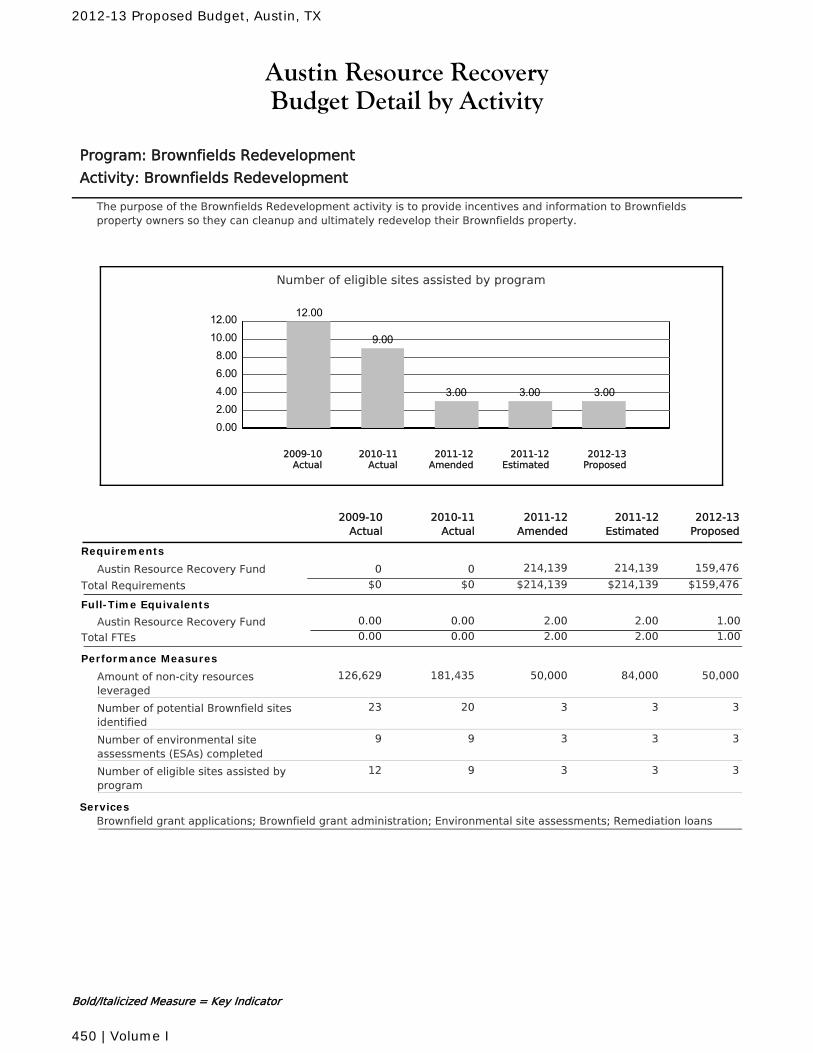
Austin Resource RecoveryBudget Detail by Activity
Program: Brownfields Redevelopment
Activity: Brownfields Redevelopment
The purpose of the Brownfields Redevelopment activity is to provide incentives and information to Brownfieldsproperty owners so they can cleanup and ultimately redevelop their Brownfields property.
Number of eligible sites assisted by program
0.002.004.006.008.00
10.0012.00 12.00
9.00
3.00 3.00 3.00
2010-11Actual
2012-13Proposed
2011-12Amended
2011-12Estimated
2009-10Actual
2011-12Amended
2010-11Actual
2011-12Estimated
2012-13Proposed
2009-10Actual
Requirements
Austin Resource Recovery Fund 214,139 214,139 159,47600
$214,139 $214,139 $159,476Total Requirements $0$0
Full-Time Equivalents
Austin Resource Recovery Fund 0.00 2.00 2.00 1.000.00
Total FTEs 0.00 2.00 2.00 1.000.00
Performance Measures
Amount of non-city resourcesleveraged
50,000181,435 84,000 50,000126,629
Number of potential Brownfield sitesidentified
320 3 323
Number of environmental siteassessments (ESAs) completed
39 3 39
Number of eligible sites assisted byprogram
39 3 312
ServicesBrownfield grant applications; Brownfield grant administration; Environmental site assessments; Remediation loans
Bold/Italicized Measure = Key Indicator
2012-13 Proposed Budget, Austin, TX
450 | Volume I
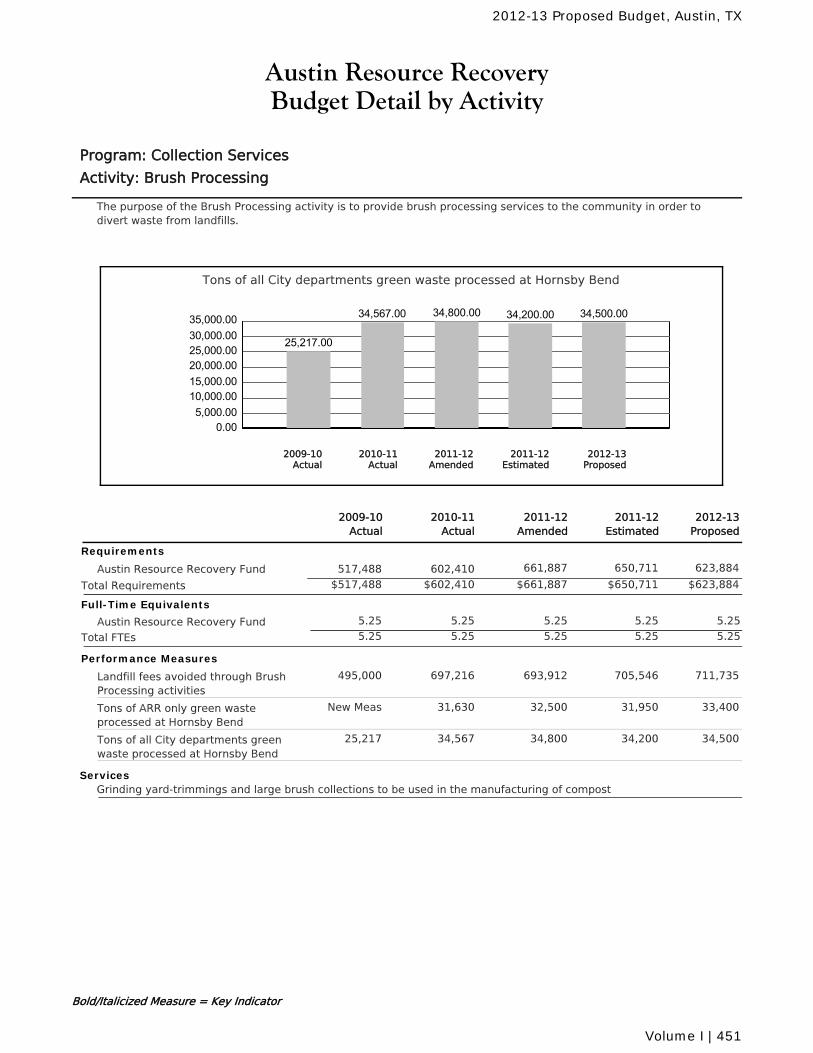
Austin Resource RecoveryBudget Detail by Activity
Program: Collection Services
Activity: Brush Processing
The purpose of the Brush Processing activity is to provide brush processing services to the community in order todivert waste from landfills.
Tons of all City departments green waste processed at Hornsby Bend
0.005,000.00
10,000.0015,000.0020,000.0025,000.0030,000.0035,000.00
25,217.00
34,567.00 34,800.00 34,200.00 34,500.00
2010-11Actual
2012-13Proposed
2011-12Amended
2011-12Estimated
2009-10Actual
2011-12Amended
2010-11Actual
2011-12Estimated
2012-13Proposed
2009-10Actual
Requirements
Austin Resource Recovery Fund 661,887 650,711 623,884602,410517,488
$661,887 $650,711 $623,884Total Requirements $602,410$517,488
Full-Time Equivalents
Austin Resource Recovery Fund 5.25 5.25 5.25 5.255.25
Total FTEs 5.25 5.25 5.25 5.255.25
Performance Measures
Landfill fees avoided through BrushProcessing activities
693,912697,216 705,546 711,735495,000
Tons of ARR only green wasteprocessed at Hornsby Bend
32,50031,630 31,950 33,400New Meas
Tons of all City departments greenwaste processed at Hornsby Bend
34,80034,567 34,200 34,50025,217
ServicesGrinding yard-trimmings and large brush collections to be used in the manufacturing of compost
Bold/Italicized Measure = Key Indicator
2012-13 Proposed Budget, Austin, TX
Volume I | 451
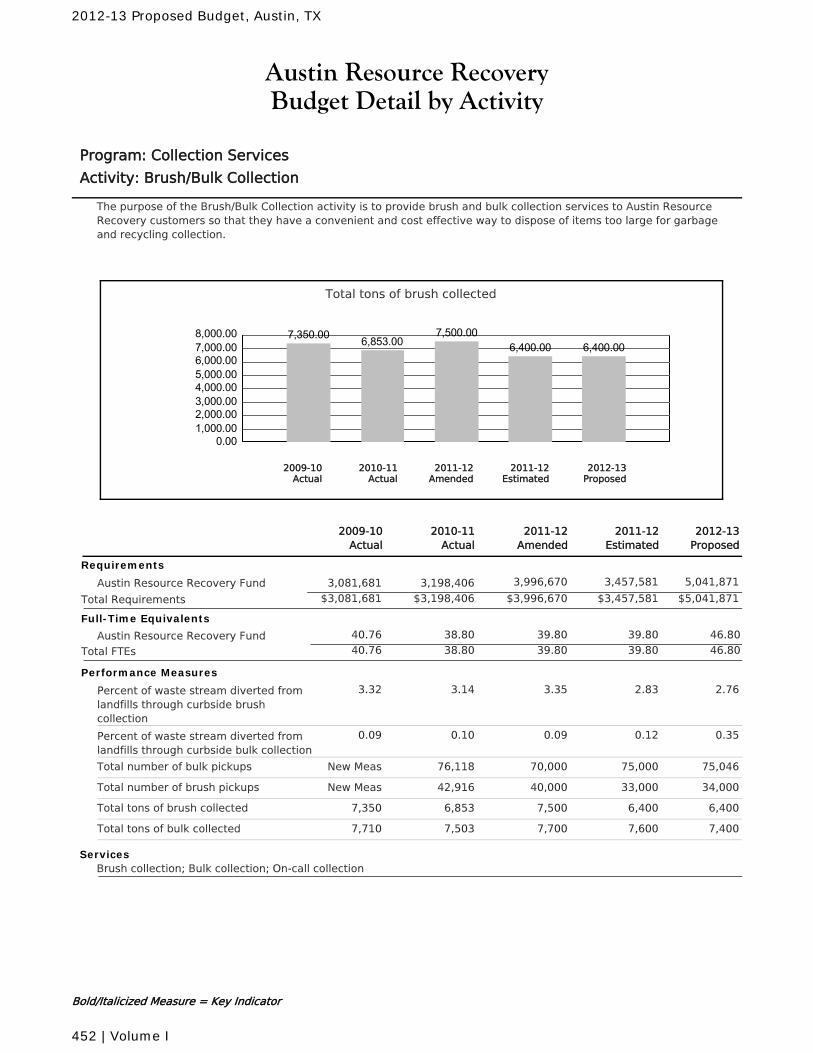
Austin Resource RecoveryBudget Detail by Activity
Program: Collection Services
Activity: Brush/Bulk Collection
The purpose of the Brush/Bulk Collection activity is to provide brush and bulk collection services to Austin ResourceRecovery customers so that they have a convenient and cost effective way to dispose of items too large for garbageand recycling collection.
Total tons of brush collected
0.001,000.002,000.003,000.004,000.005,000.006,000.007,000.008,000.00 7,350.00 6,853.00
7,500.006,400.00 6,400.00
2010-11Actual
2012-13Proposed
2011-12Amended
2011-12Estimated
2009-10Actual
2011-12Amended
2010-11Actual
2011-12Estimated
2012-13Proposed
2009-10Actual
Requirements
Austin Resource Recovery Fund 3,996,670 3,457,581 5,041,8713,198,4063,081,681
$3,996,670 $3,457,581 $5,041,871Total Requirements $3,198,406$3,081,681
Full-Time Equivalents
Austin Resource Recovery Fund 38.80 39.80 39.80 46.8040.76
Total FTEs 38.80 39.80 39.80 46.8040.76
Performance Measures
Percent of waste stream diverted fromlandfills through curbside brushcollection
3.353.14 2.83 2.763.32
Percent of waste stream diverted fromlandfills through curbside bulk collection
0.090.10 0.12 0.350.09
Total number of bulk pickups 70,00076,118 75,000 75,046New Meas
Total number of brush pickups 40,00042,916 33,000 34,000New Meas
Total tons of brush collected 7,5006,853 6,400 6,4007,350
Total tons of bulk collected 7,7007,503 7,600 7,4007,710
ServicesBrush collection; Bulk collection; On-call collection
Bold/Italicized Measure = Key Indicator
2012-13 Proposed Budget, Austin, TX
452 | Volume I
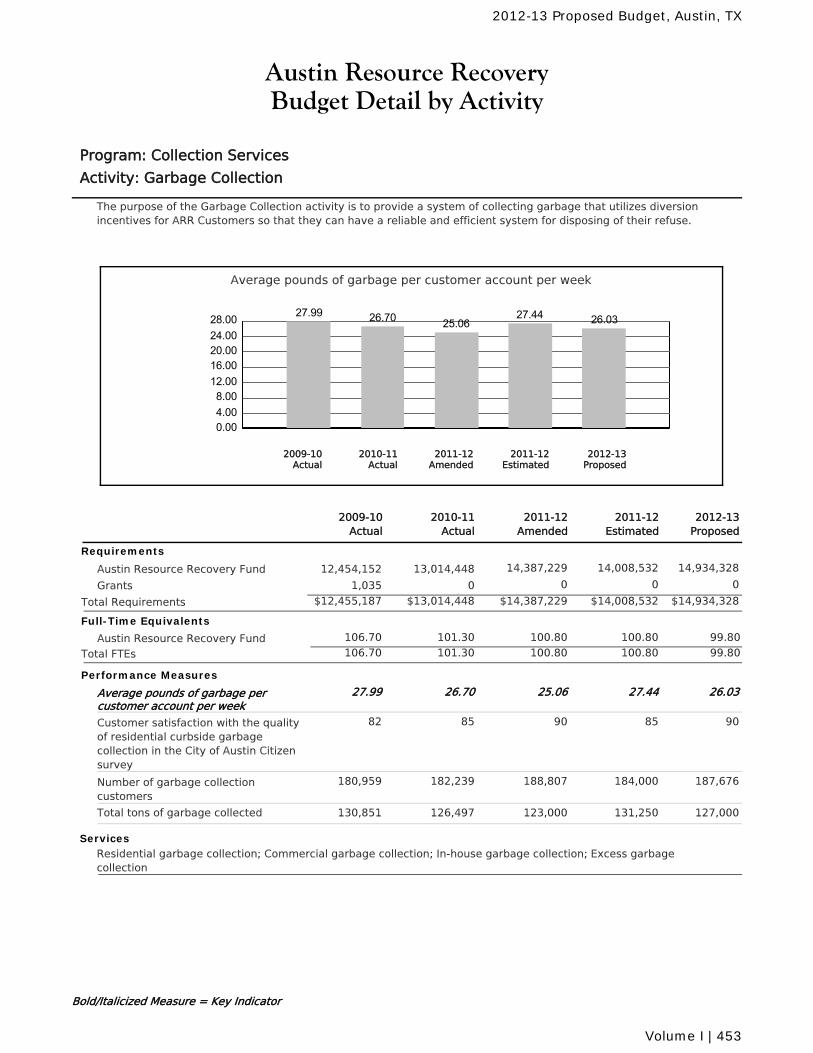
Austin Resource RecoveryBudget Detail by Activity
Program: Collection Services
Activity: Garbage Collection
The purpose of the Garbage Collection activity is to provide a system of collecting garbage that utilizes diversionincentives for ARR Customers so that they can have a reliable and efficient system for disposing of their refuse.
Average pounds of garbage per customer account per week
0.004.008.00
12.0016.0020.0024.0028.00 27.99 26.70 25.06
27.44 26.03
2010-11Actual
2012-13Proposed
2011-12Amended
2011-12Estimated
2009-10Actual
2011-12Amended
2010-11Actual
2011-12Estimated
2012-13Proposed
2009-10Actual
Requirements
Austin Resource Recovery Fund 14,387,229 14,008,532 14,934,32813,014,44812,454,152
Grants 0 0 001,035
$14,387,229 $14,008,532 $14,934,328Total Requirements $13,014,448$12,455,187
Full-Time Equivalents
Austin Resource Recovery Fund 101.30 100.80 100.80 99.80106.70
Total FTEs 101.30 100.80 100.80 99.80106.70
Performance Measures
Average pounds of garbage percustomer account per week
25.0626.70 27.44 26.0327.99
Customer satisfaction with the qualityof residential curbside garbagecollection in the City of Austin Citizensurvey
9085 85 9082
Number of garbage collectioncustomers
188,807182,239 184,000 187,676180,959
Total tons of garbage collected 123,000126,497 131,250 127,000130,851
ServicesResidential garbage collection; Commercial garbage collection; In-house garbage collection; Excess garbagecollection
Bold/Italicized Measure = Key Indicator
2012-13 Proposed Budget, Austin, TX
Volume I | 453
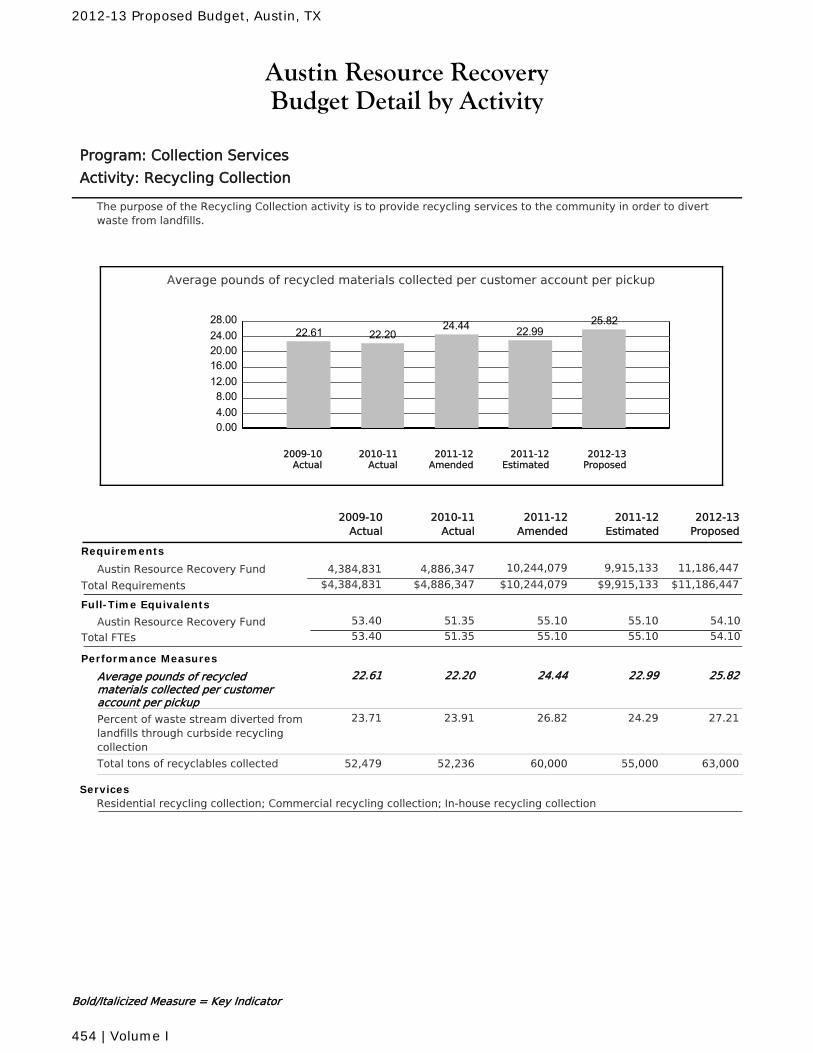
Austin Resource RecoveryBudget Detail by Activity
Program: Collection Services
Activity: Recycling Collection
The purpose of the Recycling Collection activity is to provide recycling services to the community in order to divertwaste from landfills.
Average pounds of recycled materials collected per customer account per pickup
0.004.008.00
12.0016.0020.0024.0028.00
22.61 22.2024.44 22.99
25.82
2010-11Actual
2012-13Proposed
2011-12Amended
2011-12Estimated
2009-10Actual
2011-12Amended
2010-11Actual
2011-12Estimated
2012-13Proposed
2009-10Actual
Requirements
Austin Resource Recovery Fund 10,244,079 9,915,133 11,186,4474,886,3474,384,831
$10,244,079 $9,915,133 $11,186,447Total Requirements $4,886,347$4,384,831
Full-Time Equivalents
Austin Resource Recovery Fund 51.35 55.10 55.10 54.1053.40
Total FTEs 51.35 55.10 55.10 54.1053.40
Performance Measures
Average pounds of recycledmaterials collected per customeraccount per pickup
24.4422.20 22.99 25.8222.61
Percent of waste stream diverted fromlandfills through curbside recyclingcollection
26.8223.91 24.29 27.2123.71
Total tons of recyclables collected 60,00052,236 55,000 63,00052,479
ServicesResidential recycling collection; Commercial recycling collection; In-house recycling collection
Bold/Italicized Measure = Key Indicator
2012-13 Proposed Budget, Austin, TX
454 | Volume I

Austin Resource RecoveryBudget Detail by Activity
Program: Collection Services
Activity: Yard Trimmings Collection
The purpose of the Yard Trimmings Collection activity is to provide SWS residential customers a weekly opportunity todispose of grass clippings, leaves, and small branches from typical residential lawn care, at the curb.
Average pounds of yard trimmings collected per week per household
0.001.002.003.004.005.006.00
4.845.27 5.09 5.34 5.53
2010-11Actual
2012-13Proposed
2011-12Amended
2011-12Estimated
2009-10Actual
2011-12Amended
2010-11Actual
2011-12Estimated
2012-13Proposed
2009-10Actual
Requirements
Austin Resource Recovery Fund 2,832,387 2,916,486 3,008,2702,646,0642,247,521
$2,832,387 $2,916,486 $3,008,270Total Requirements $2,646,064$2,247,521
Full-Time Equivalents
Austin Resource Recovery Fund 32.05 31.80 31.80 31.8032.14
Total FTEs 32.05 31.80 31.80 31.8032.14
Performance Measures
Average pounds of yard trimmingscollected per week per household
5.095.27 5.34 5.534.84
Percent of waste stream diverted fromlandfills through curbside yardtrimmings collection
11.1711.34 11.29 11.6610.14
Total tons of yard trimmings collected 25,00024,777 25,550 27,00022,456
ServicesYard Trimmings collection
Bold/Italicized Measure = Key Indicator
2012-13 Proposed Budget, Austin, TX
Volume I | 455
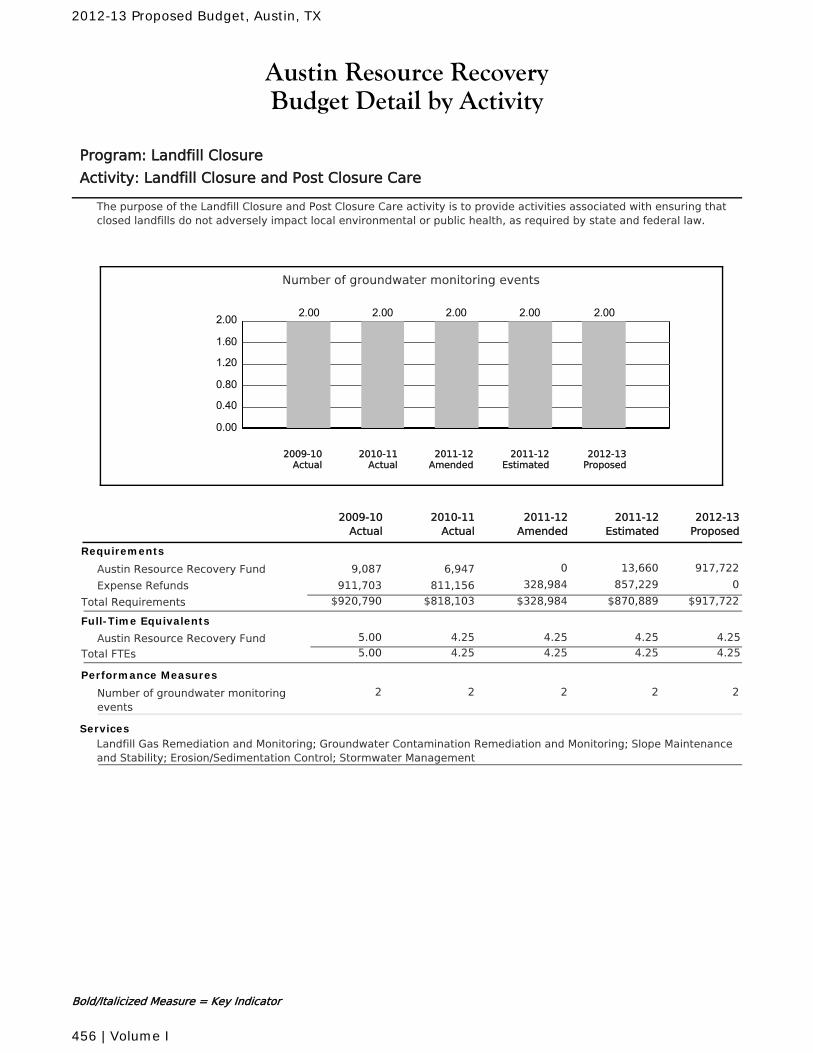
Austin Resource RecoveryBudget Detail by Activity
Program: Landfill Closure
Activity: Landfill Closure and Post Closure Care
The purpose of the Landfill Closure and Post Closure Care activity is to provide activities associated with ensuring thatclosed landfills do not adversely impact local environmental or public health, as required by state and federal law.
Number of groundwater monitoring events
0.00
0.40
0.80
1.20
1.60
2.00 2.00 2.00 2.00 2.00 2.00
2010-11Actual
2012-13Proposed
2011-12Amended
2011-12Estimated
2009-10Actual
2011-12Amended
2010-11Actual
2011-12Estimated
2012-13Proposed
2009-10Actual
Requirements
Austin Resource Recovery Fund 0 13,660 917,7226,9479,087
Expense Refunds 328,984 857,229 0811,156911,703
$328,984 $870,889 $917,722Total Requirements $818,103$920,790
Full-Time Equivalents
Austin Resource Recovery Fund 4.25 4.25 4.25 4.255.00
Total FTEs 4.25 4.25 4.25 4.255.00
Performance Measures
Number of groundwater monitoringevents
22 2 22
ServicesLandfill Gas Remediation and Monitoring; Groundwater Contamination Remediation and Monitoring; Slope Maintenanceand Stability; Erosion/Sedimentation Control; Stormwater Management
Bold/Italicized Measure = Key Indicator
2012-13 Proposed Budget, Austin, TX
456 | Volume I
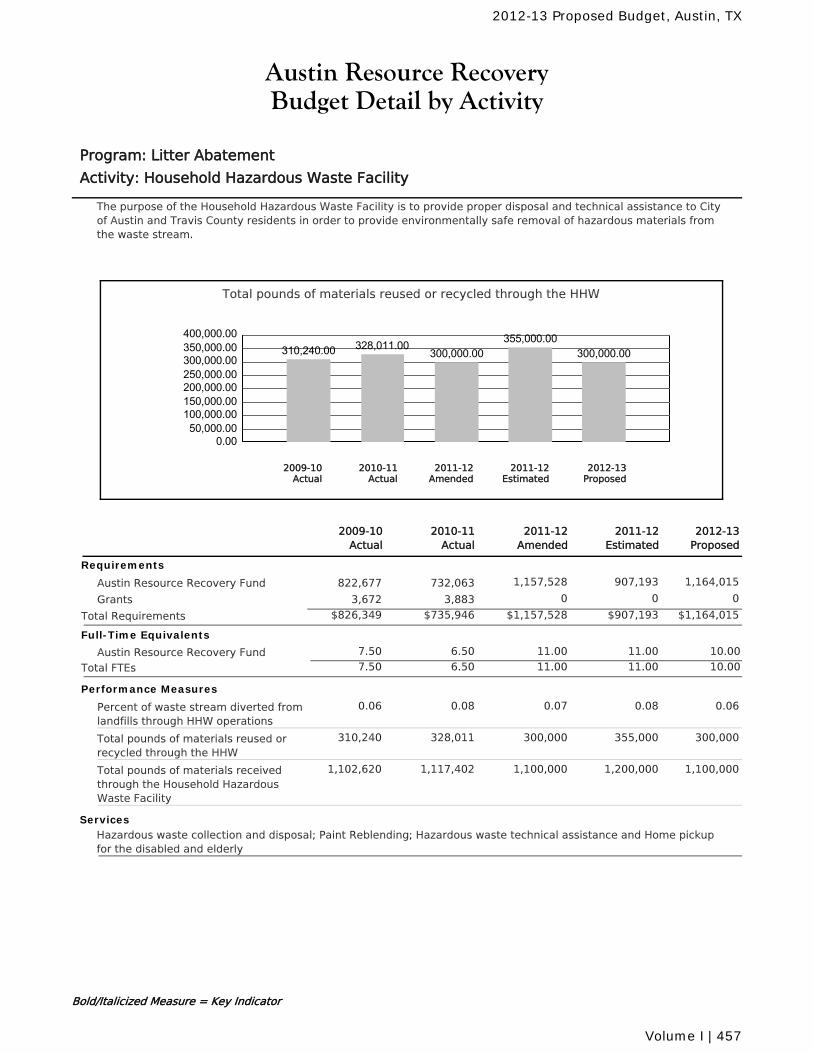
Austin Resource RecoveryBudget Detail by Activity
Program: Litter Abatement
Activity: Household Hazardous Waste Facility
The purpose of the Household Hazardous Waste Facility is to provide proper disposal and technical assistance to Cityof Austin and Travis County residents in order to provide environmentally safe removal of hazardous materials fromthe waste stream.
Total pounds of materials reused or recycled through the HHW
0.0050,000.00
100,000.00150,000.00200,000.00250,000.00300,000.00350,000.00400,000.00
310,240.00 328,011.00300,000.00
355,000.00300,000.00
2010-11Actual
2012-13Proposed
2011-12Amended
2011-12Estimated
2009-10Actual
2011-12Amended
2010-11Actual
2011-12Estimated
2012-13Proposed
2009-10Actual
Requirements
Austin Resource Recovery Fund 1,157,528 907,193 1,164,015732,063822,677
Grants 0 0 03,8833,672
$1,157,528 $907,193 $1,164,015Total Requirements $735,946$826,349
Full-Time Equivalents
Austin Resource Recovery Fund 6.50 11.00 11.00 10.007.50
Total FTEs 6.50 11.00 11.00 10.007.50
Performance Measures
Percent of waste stream diverted fromlandfills through HHW operations
0.070.08 0.08 0.060.06
Total pounds of materials reused orrecycled through the HHW
300,000328,011 355,000 300,000310,240
Total pounds of materials receivedthrough the Household HazardousWaste Facility
1,100,0001,117,402 1,200,000 1,100,0001,102,620
ServicesHazardous waste collection and disposal; Paint Reblending; Hazardous waste technical assistance and Home pickupfor the disabled and elderly
Bold/Italicized Measure = Key Indicator
2012-13 Proposed Budget, Austin, TX
Volume I | 457
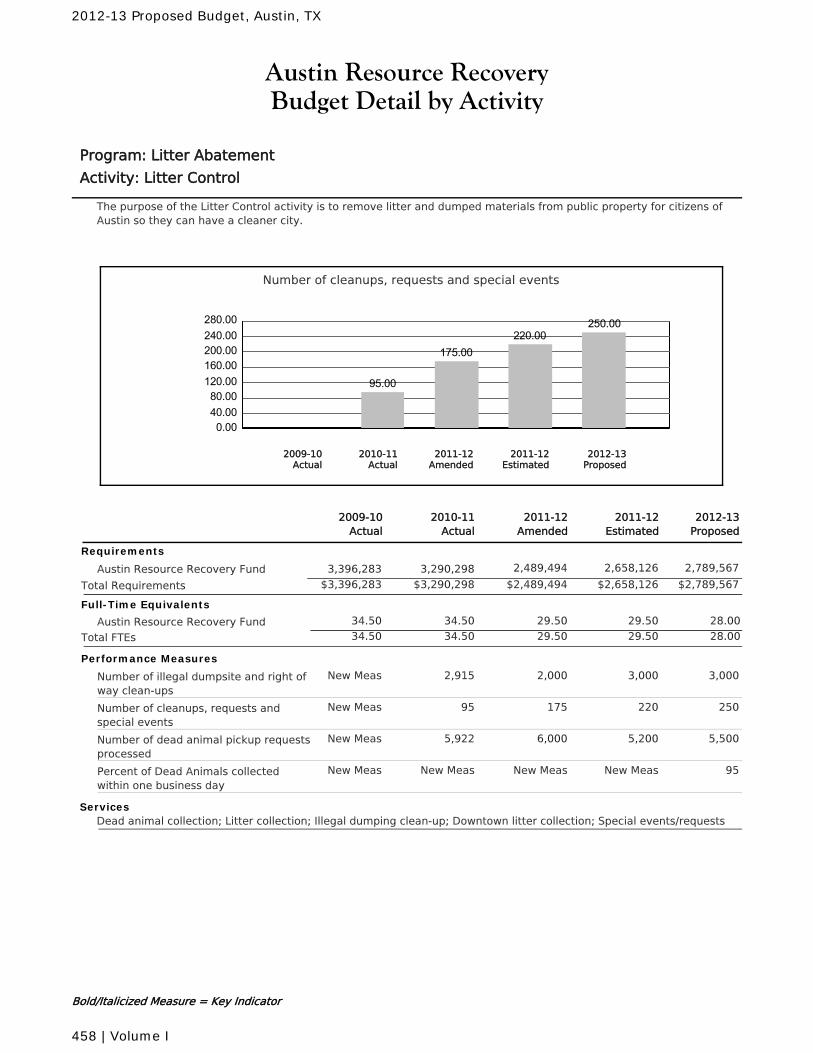
Austin Resource RecoveryBudget Detail by Activity
Program: Litter Abatement
Activity: Litter Control
The purpose of the Litter Control activity is to remove litter and dumped materials from public property for citizens ofAustin so they can have a cleaner city.
Number of cleanups, requests and special events
0.0040.0080.00
120.00160.00200.00240.00280.00
95.00
175.00220.00
250.00
2010-11Actual
2012-13Proposed
2011-12Amended
2011-12Estimated
2009-10Actual
2011-12Amended
2010-11Actual
2011-12Estimated
2012-13Proposed
2009-10Actual
Requirements
Austin Resource Recovery Fund 2,489,494 2,658,126 2,789,5673,290,2983,396,283
$2,489,494 $2,658,126 $2,789,567Total Requirements $3,290,298$3,396,283
Full-Time Equivalents
Austin Resource Recovery Fund 34.50 29.50 29.50 28.0034.50
Total FTEs 34.50 29.50 29.50 28.0034.50
Performance Measures
Number of illegal dumpsite and right ofway clean-ups
2,0002,915 3,000 3,000New Meas
Number of cleanups, requests andspecial events
17595 220 250New Meas
Number of dead animal pickup requestsprocessed
6,0005,922 5,200 5,500New Meas
Percent of Dead Animals collectedwithin one business day
New MeasNew Meas New Meas 95New Meas
ServicesDead animal collection; Litter collection; Illegal dumping clean-up; Downtown litter collection; Special events/requests
Bold/Italicized Measure = Key Indicator
2012-13 Proposed Budget, Austin, TX
458 | Volume I
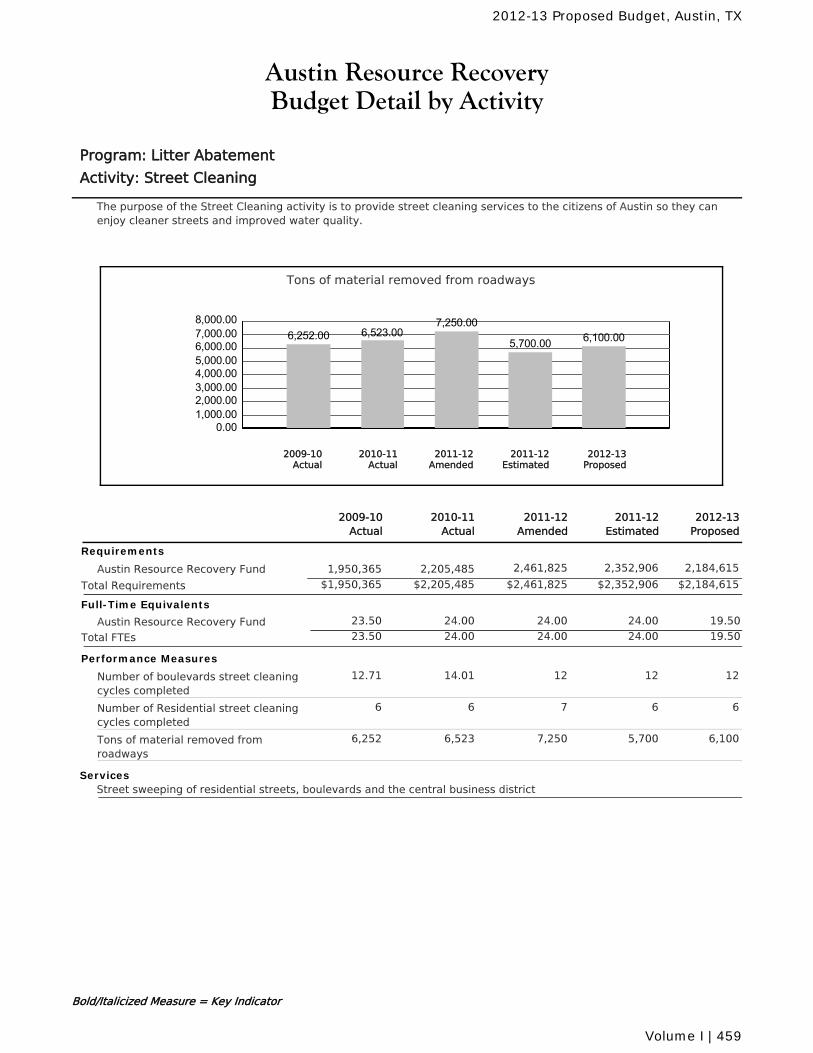
Austin Resource RecoveryBudget Detail by Activity
Program: Litter Abatement
Activity: Street Cleaning
The purpose of the Street Cleaning activity is to provide street cleaning services to the citizens of Austin so they canenjoy cleaner streets and improved water quality.
Tons of material removed from roadways
0.001,000.002,000.003,000.004,000.005,000.006,000.007,000.008,000.00
6,252.00 6,523.007,250.00
5,700.00 6,100.00
2010-11Actual
2012-13Proposed
2011-12Amended
2011-12Estimated
2009-10Actual
2011-12Amended
2010-11Actual
2011-12Estimated
2012-13Proposed
2009-10Actual
Requirements
Austin Resource Recovery Fund 2,461,825 2,352,906 2,184,6152,205,4851,950,365
$2,461,825 $2,352,906 $2,184,615Total Requirements $2,205,485$1,950,365
Full-Time Equivalents
Austin Resource Recovery Fund 24.00 24.00 24.00 19.5023.50
Total FTEs 24.00 24.00 24.00 19.5023.50
Performance Measures
Number of boulevards street cleaningcycles completed
1214.01 12 1212.71
Number of Residential street cleaningcycles completed
76 6 66
Tons of material removed fromroadways
7,2506,523 5,700 6,1006,252
ServicesStreet sweeping of residential streets, boulevards and the central business district
Bold/Italicized Measure = Key Indicator
2012-13 Proposed Budget, Austin, TX
Volume I | 459
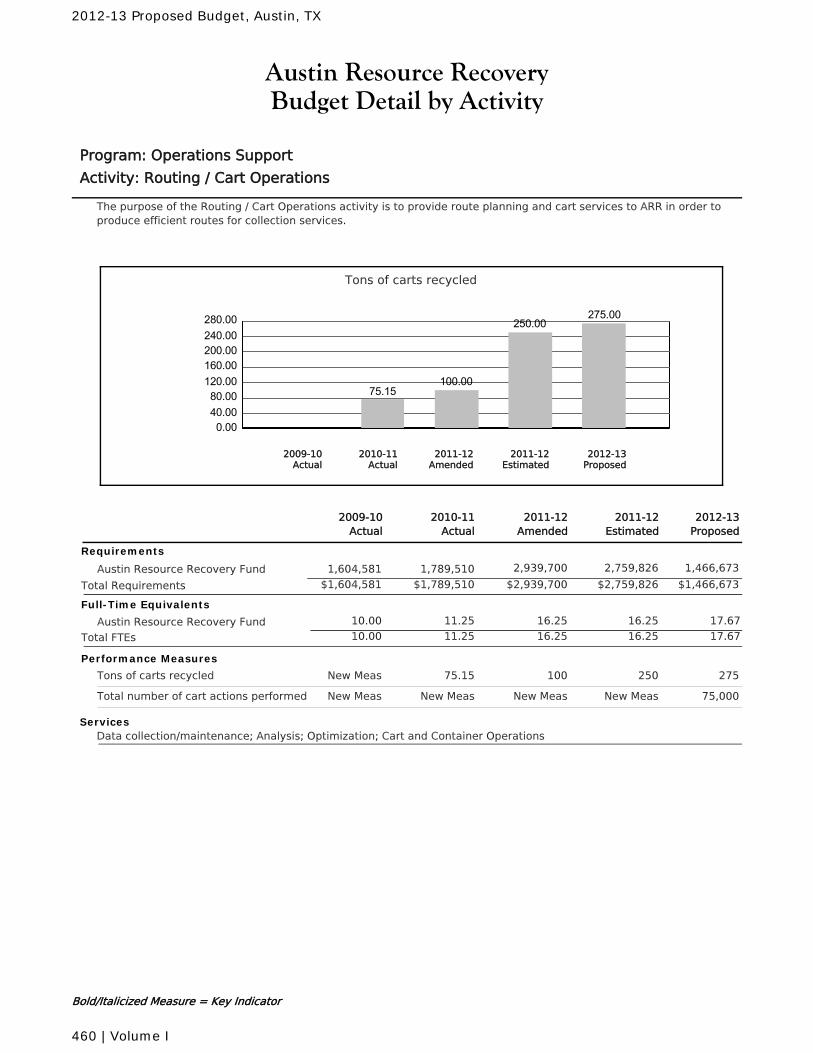
Austin Resource RecoveryBudget Detail by Activity
Program: Operations Support
Activity: Routing / Cart Operations
The purpose of the Routing / Cart Operations activity is to provide route planning and cart services to ARR in order toproduce efficient routes for collection services.
Tons of carts recycled
0.0040.0080.00
120.00160.00200.00240.00280.00
75.15100.00
250.00275.00
2010-11Actual
2012-13Proposed
2011-12Amended
2011-12Estimated
2009-10Actual
2011-12Amended
2010-11Actual
2011-12Estimated
2012-13Proposed
2009-10Actual
Requirements
Austin Resource Recovery Fund 2,939,700 2,759,826 1,466,6731,789,5101,604,581
$2,939,700 $2,759,826 $1,466,673Total Requirements $1,789,510$1,604,581
Full-Time Equivalents
Austin Resource Recovery Fund 11.25 16.25 16.25 17.6710.00
Total FTEs 11.25 16.25 16.25 17.6710.00
Performance Measures
Tons of carts recycled 10075.15 250 275New Meas
Total number of cart actions performed New MeasNew Meas New Meas 75,000New Meas
ServicesData collection/maintenance; Analysis; Optimization; Cart and Container Operations
Bold/Italicized Measure = Key Indicator
2012-13 Proposed Budget, Austin, TX
460 | Volume I
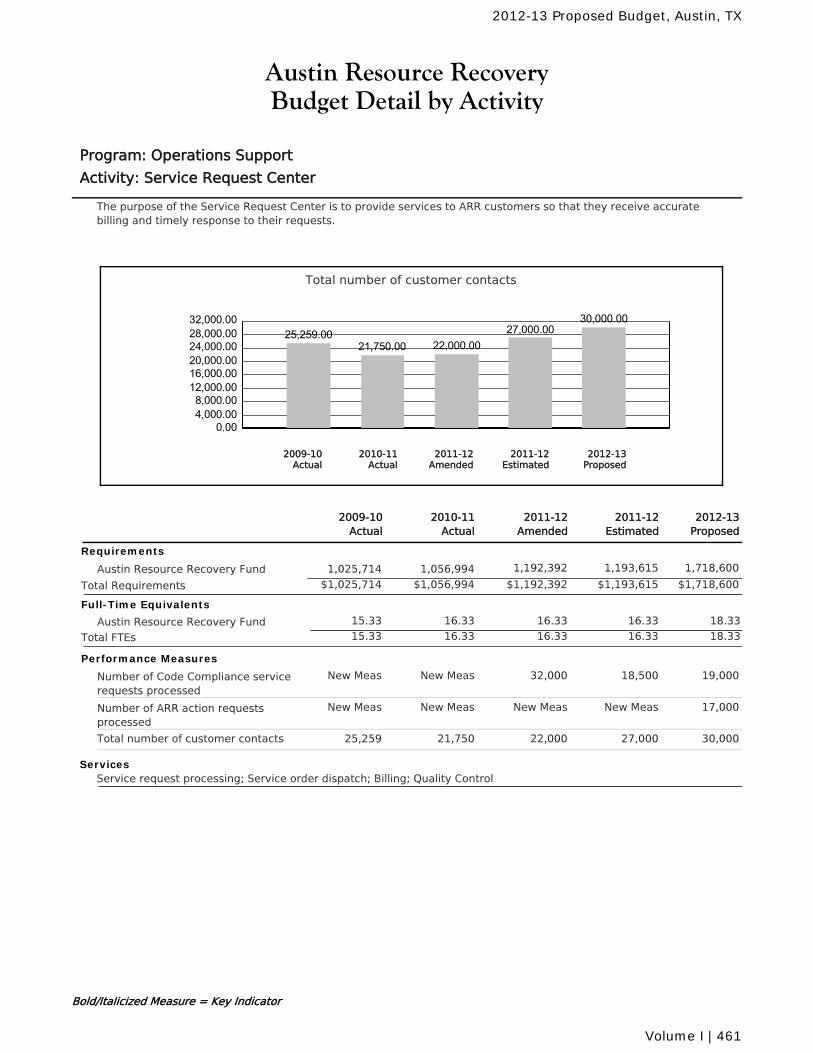
Austin Resource RecoveryBudget Detail by Activity
Program: Operations Support
Activity: Service Request Center
The purpose of the Service Request Center is to provide services to ARR customers so that they receive accuratebilling and timely response to their requests.
Total number of customer contacts
0.004,000.008,000.00
12,000.0016,000.0020,000.0024,000.0028,000.0032,000.00
25,259.0021,750.00 22,000.00
27,000.0030,000.00
2010-11Actual
2012-13Proposed
2011-12Amended
2011-12Estimated
2009-10Actual
2011-12Amended
2010-11Actual
2011-12Estimated
2012-13Proposed
2009-10Actual
Requirements
Austin Resource Recovery Fund 1,192,392 1,193,615 1,718,6001,056,9941,025,714
$1,192,392 $1,193,615 $1,718,600Total Requirements $1,056,994$1,025,714
Full-Time Equivalents
Austin Resource Recovery Fund 16.33 16.33 16.33 18.3315.33
Total FTEs 16.33 16.33 16.33 18.3315.33
Performance Measures
Number of Code Compliance servicerequests processed
32,000New Meas 18,500 19,000New Meas
Number of ARR action requestsprocessed
New MeasNew Meas New Meas 17,000New Meas
Total number of customer contacts 22,00021,750 27,000 30,00025,259
ServicesService request processing; Service order dispatch; Billing; Quality Control
Bold/Italicized Measure = Key Indicator
2012-13 Proposed Budget, Austin, TX
Volume I | 461

Austin Resource RecoveryBudget Detail by Activity
Program: Waste Diversion
Activity: Diversion Facilities
The purpose of the Diversion Facilities activity is to provide City of Austin residents with a place to drop off items to berecycled, reused or repurposed in order to achieve diversion goals.
Tons of recyclable materials recovered at the Resource Recovery Center
0.0050.00
100.00150.00200.00250.00300.00350.00 317.00
280.00 295.00 300.00
2010-11Actual
2012-13Proposed
2011-12Amended
2011-12Estimated
2009-10Actual
2011-12Amended
2010-11Actual
2011-12Estimated
2012-13Proposed
2009-10Actual
Requirements
Austin Resource Recovery Fund 494,178 597,270 910,4565,080,4146,508,012
Expense Refunds 0 377 0357434,993
$494,178 $597,647 $910,456Total Requirements $5,080,771$6,943,005
Full-Time Equivalents
Austin Resource Recovery Fund 4.00 3.00 3.00 3.504.00
Total FTEs 4.00 3.00 3.00 3.504.00
Performance Measures
Tons of recyclable materials recoveredat the Resource Recovery Center
280317 295 300New Meas
Total number of customers utilizing theResource Recovery Center
2,0001,677 1,350 1,700New Meas
ServicesDiversion facilities including the Resource Recovery Center and Austin Reuse Centers
Bold/Italicized Measure = Key Indicator
2012-13 Proposed Budget, Austin, TX
462 | Volume I
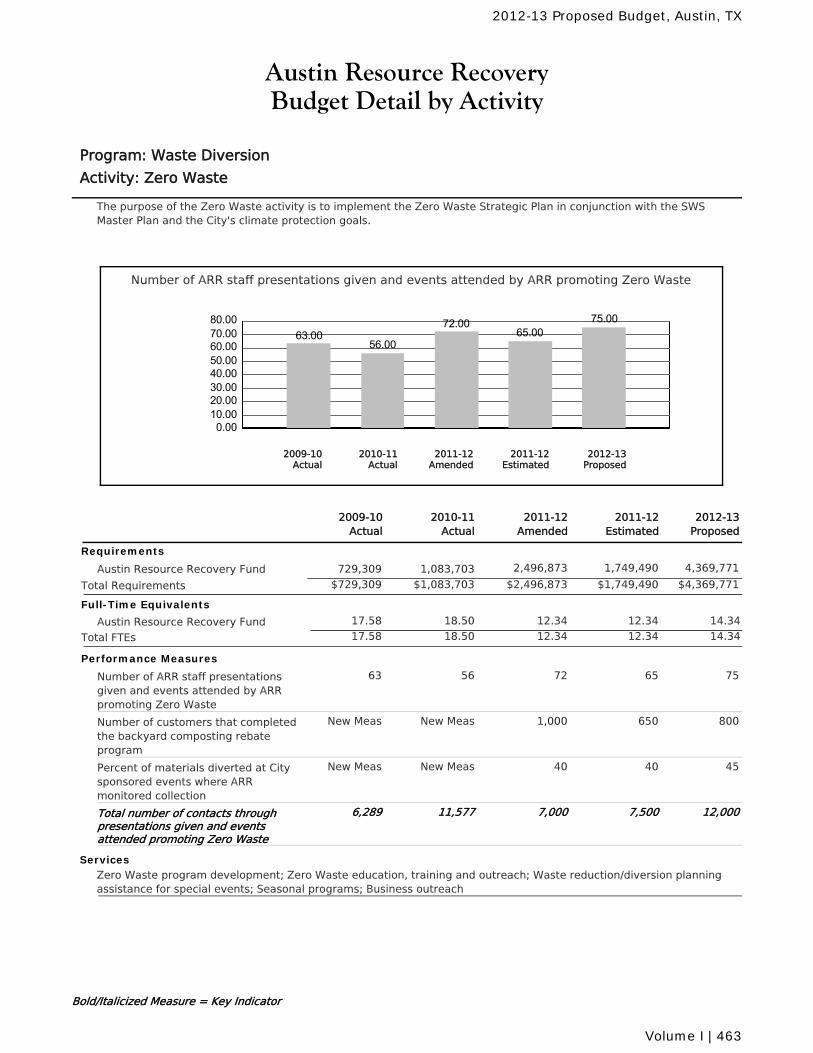
Austin Resource RecoveryBudget Detail by Activity
Program: Waste Diversion
Activity: Zero Waste
The purpose of the Zero Waste activity is to implement the Zero Waste Strategic Plan in conjunction with the SWSMaster Plan and the City's climate protection goals.
Number of ARR staff presentations given and events attended by ARR promoting Zero Waste
0.0010.0020.0030.0040.0050.0060.0070.0080.00
63.0056.00
72.0065.00
75.00
2010-11Actual
2012-13Proposed
2011-12Amended
2011-12Estimated
2009-10Actual
2011-12Amended
2010-11Actual
2011-12Estimated
2012-13Proposed
2009-10Actual
Requirements
Austin Resource Recovery Fund 2,496,873 1,749,490 4,369,7711,083,703729,309
$2,496,873 $1,749,490 $4,369,771Total Requirements $1,083,703$729,309
Full-Time Equivalents
Austin Resource Recovery Fund 18.50 12.34 12.34 14.3417.58
Total FTEs 18.50 12.34 12.34 14.3417.58
Performance Measures
Number of ARR staff presentationsgiven and events attended by ARRpromoting Zero Waste
7256 65 7563
Number of customers that completedthe backyard composting rebateprogram
1,000New Meas 650 800New Meas
Percent of materials diverted at Citysponsored events where ARRmonitored collection
40New Meas 40 45New Meas
Total number of contacts throughpresentations given and eventsattended promoting Zero Waste
7,00011,577 7,500 12,0006,289
ServicesZero Waste program development; Zero Waste education, training and outreach; Waste reduction/diversion planningassistance for special events; Seasonal programs; Business outreach
Bold/Italicized Measure = Key Indicator
2012-13 Proposed Budget, Austin, TX
Volume I | 463
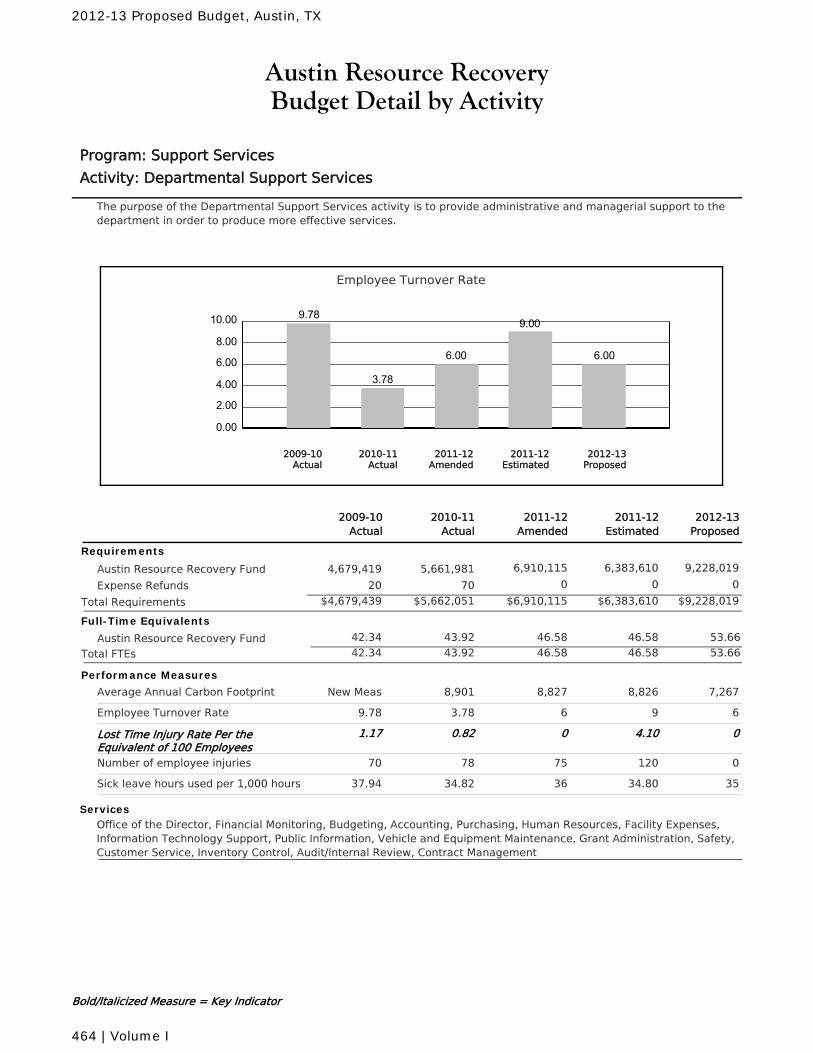
Austin Resource RecoveryBudget Detail by Activity
Program: Support Services
Activity: Departmental Support Services
The purpose of the Departmental Support Services activity is to provide administrative and managerial support to thedepartment in order to produce more effective services.
Employee Turnover Rate
0.00
2.00
4.00
6.00
8.00
10.00 9.78
3.78
6.00
9.00
6.00
2010-11Actual
2012-13Proposed
2011-12Amended
2011-12Estimated
2009-10Actual
2011-12Amended
2010-11Actual
2011-12Estimated
2012-13Proposed
2009-10Actual
Requirements
Austin Resource Recovery Fund 6,910,115 6,383,610 9,228,0195,661,9814,679,419
Expense Refunds 0 0 07020
$6,910,115 $6,383,610 $9,228,019Total Requirements $5,662,051$4,679,439
Full-Time Equivalents
Austin Resource Recovery Fund 43.92 46.58 46.58 53.6642.34
Total FTEs 43.92 46.58 46.58 53.6642.34
Performance Measures
Average Annual Carbon Footprint 8,8278,901 8,826 7,267New Meas
Employee Turnover Rate 63.78 9 69.78
Lost Time Injury Rate Per theEquivalent of 100 Employees
00.82 4.10 01.17
Number of employee injuries 7578 120 070
Sick leave hours used per 1,000 hours 3634.82 34.80 3537.94
ServicesOffice of the Director, Financial Monitoring, Budgeting, Accounting, Purchasing, Human Resources, Facility Expenses,Information Technology Support, Public Information, Vehicle and Equipment Maintenance, Grant Administration, Safety,Customer Service, Inventory Control, Audit/Internal Review, Contract Management
Bold/Italicized Measure = Key Indicator
2012-13 Proposed Budget, Austin, TX
464 | Volume I
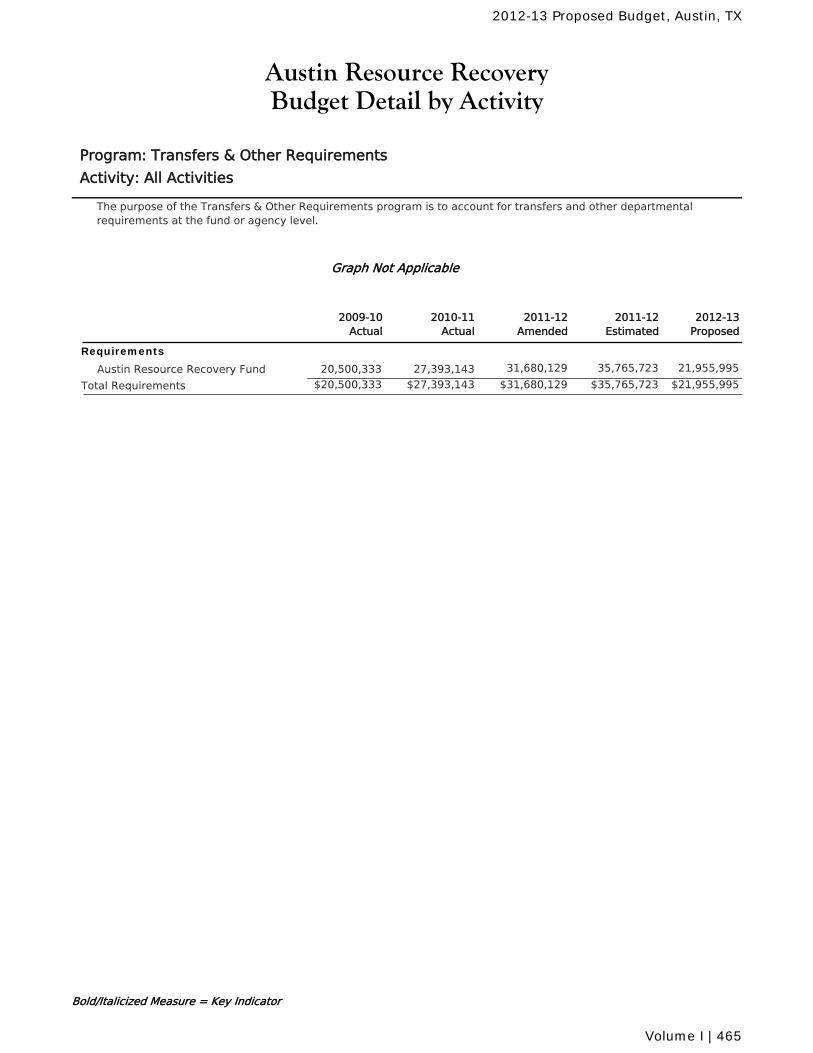
Austin Resource RecoveryBudget Detail by Activity
Program: Transfers & Other Requirements
Activity: All Activities
The purpose of the Transfers & Other Requirements program is to account for transfers and other departmentalrequirements at the fund or agency level.
Graph Not Applicable
2011-12Amended
2010-11Actual
2011-12Estimated
2012-13Proposed
2009-10Actual
Requirements
Austin Resource Recovery Fund 31,680,129 35,765,723 21,955,99527,393,14320,500,333
$31,680,129 $35,765,723 $21,955,995Total Requirements $27,393,143$20,500,333
Bold/Italicized Measure = Key Indicator
2012-13 Proposed Budget, Austin, TX
Volume I | 465
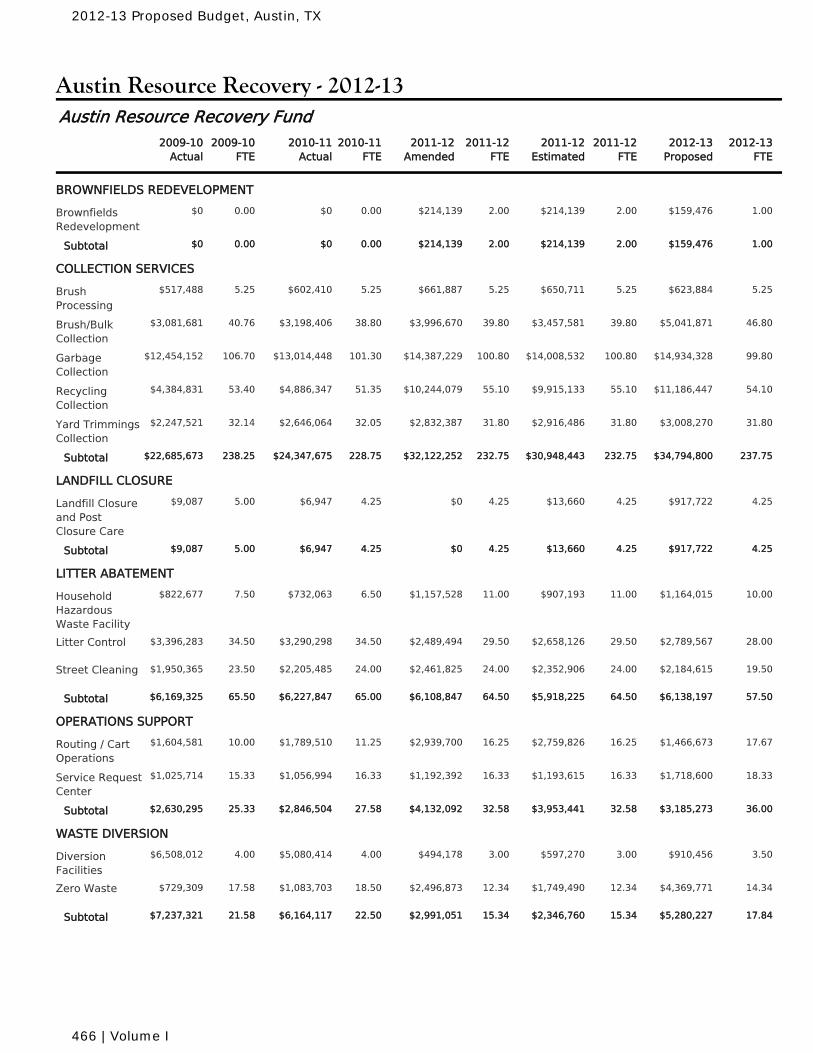
Austin Resource Recovery - 2012-13
2010-11Actual
2010-11FTE
2011-12Amended
2011-12FTE
2011-12Estimated
2011-12FTE
2009-10Actual
2009-10FTE
2012-13Proposed
2012-13FTE
Austin Resource Recovery Fund
BROWNFIELDS REDEVELOPMENT
$0 0.00 $214,139 2.00 $214,139 2.00BrownfieldsRedevelopment
0.00 $159,476 1.00$0
$0 0.00 $214,139 2.00 $214,139 2.00Subtotal 0.00 $159,476 1.00$0
COLLECTION SERVICES
$602,410 5.25 $661,887 5.25 $650,711 5.25BrushProcessing
5.25 $623,884 5.25$517,488
$3,198,406 38.80 $3,996,670 39.80 $3,457,581 39.80Brush/BulkCollection
40.76 $5,041,871 46.80$3,081,681
$13,014,448 101.30 $14,387,229 100.80 $14,008,532 100.80GarbageCollection
106.70 $14,934,328 99.80$12,454,152
$4,886,347 51.35 $10,244,079 55.10 $9,915,133 55.10RecyclingCollection
53.40 $11,186,447 54.10$4,384,831
$2,646,064 32.05 $2,832,387 31.80 $2,916,486 31.80Yard TrimmingsCollection
32.14 $3,008,270 31.80$2,247,521
$24,347,675 228.75 $32,122,252 232.75 $30,948,443 232.75Subtotal 238.25 $34,794,800 237.75$22,685,673
LANDFILL CLOSURE
$6,947 4.25 $0 4.25 $13,660 4.25Landfill Closureand PostClosure Care
5.00 $917,722 4.25$9,087
$6,947 4.25 $0 4.25 $13,660 4.25Subtotal 5.00 $917,722 4.25$9,087
LITTER ABATEMENT
$732,063 6.50 $1,157,528 11.00 $907,193 11.00HouseholdHazardousWaste Facility
7.50 $1,164,015 10.00$822,677
$3,290,298 34.50 $2,489,494 29.50 $2,658,126 29.50Litter Control 34.50 $2,789,567 28.00$3,396,283
$2,205,485 24.00 $2,461,825 24.00 $2,352,906 24.00Street Cleaning 23.50 $2,184,615 19.50$1,950,365
$6,227,847 65.00 $6,108,847 64.50 $5,918,225 64.50Subtotal 65.50 $6,138,197 57.50$6,169,325
OPERATIONS SUPPORT
$1,789,510 11.25 $2,939,700 16.25 $2,759,826 16.25Routing / CartOperations
10.00 $1,466,673 17.67$1,604,581
$1,056,994 16.33 $1,192,392 16.33 $1,193,615 16.33Service RequestCenter
15.33 $1,718,600 18.33$1,025,714
$2,846,504 27.58 $4,132,092 32.58 $3,953,441 32.58Subtotal 25.33 $3,185,273 36.00$2,630,295
WASTE DIVERSION
$5,080,414 4.00 $494,178 3.00 $597,270 3.00DiversionFacilities
4.00 $910,456 3.50$6,508,012
$1,083,703 18.50 $2,496,873 12.34 $1,749,490 12.34Zero Waste 17.58 $4,369,771 14.34$729,309
$6,164,117 22.50 $2,991,051 15.34 $2,346,760 15.34Subtotal 21.58 $5,280,227 17.84$7,237,321
2012-13 Proposed Budget, Austin, TX
466 | Volume I
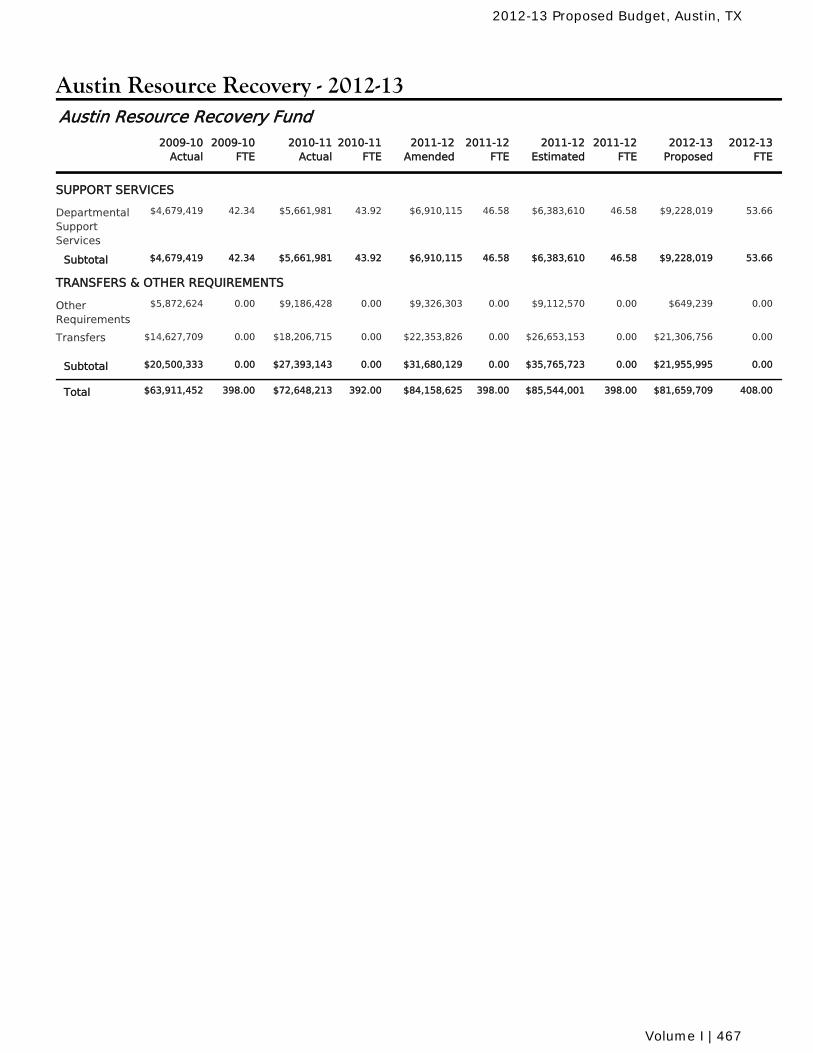
Austin Resource Recovery - 2012-13
2010-11Actual
2010-11FTE
2011-12Amended
2011-12FTE
2011-12Estimated
2011-12FTE
2009-10Actual
2009-10FTE
2012-13Proposed
2012-13FTE
Austin Resource Recovery Fund
SUPPORT SERVICES
$5,661,981 43.92 $6,910,115 46.58 $6,383,610 46.58DepartmentalSupportServices
42.34 $9,228,019 53.66$4,679,419
$5,661,981 43.92 $6,910,115 46.58 $6,383,610 46.58Subtotal 42.34 $9,228,019 53.66$4,679,419
TRANSFERS & OTHER REQUIREMENTS
$9,186,428 0.00 $9,326,303 0.00 $9,112,570 0.00OtherRequirements
0.00 $649,239 0.00$5,872,624
$18,206,715 0.00 $22,353,826 0.00 $26,653,153 0.00Transfers 0.00 $21,306,756 0.00$14,627,709
$27,393,143 0.00 $31,680,129 0.00 $35,765,723 0.00Subtotal 0.00 $21,955,995 0.00$20,500,333
$72,648,213 392.00 $84,158,625 398.00 $85,544,001 398.00Total 398.00 $81,659,709 408.00$63,911,452
2012-13 Proposed Budget, Austin, TX
Volume I | 467
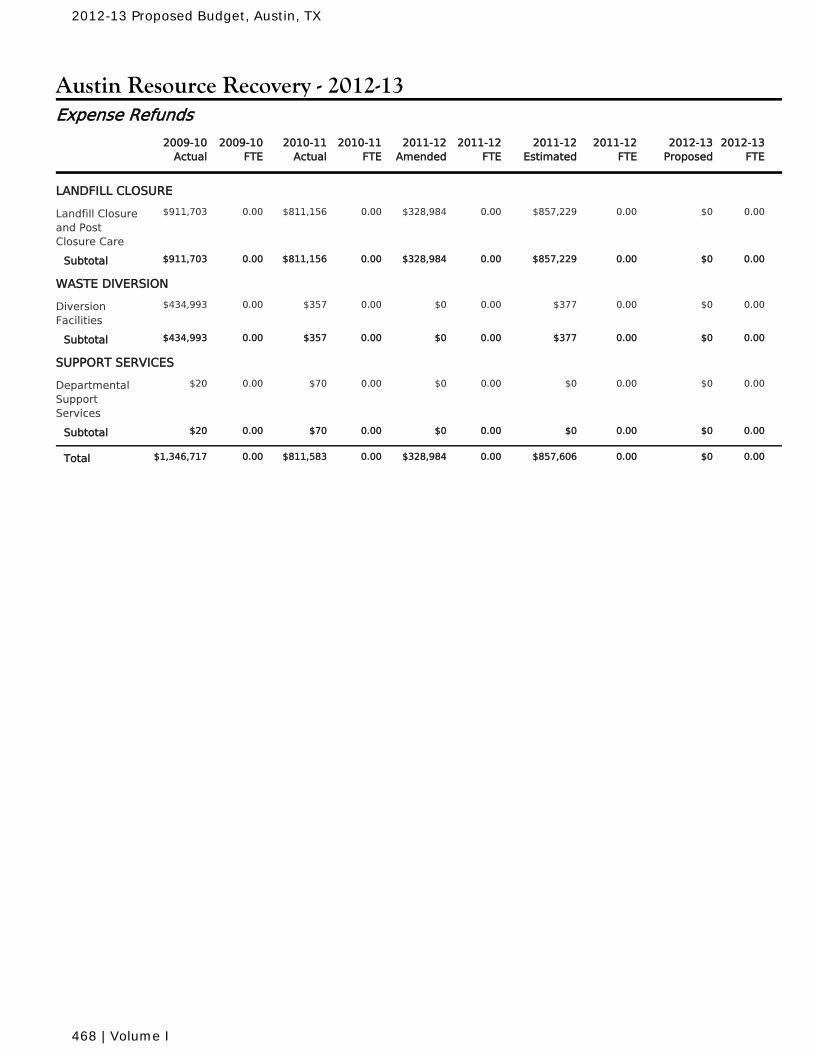
Austin Resource Recovery - 2012-13
2010-11Actual
2010-11FTE
2011-12Amended
2011-12FTE
2011-12Estimated
2011-12FTE
2009-10Actual
2009-10FTE
2012-13Proposed
2012-13FTE
Expense Refunds
LANDFILL CLOSURE
$811,156 0.00 $328,984 0.00 $857,229 0.00Landfill Closureand PostClosure Care
0.00 $0 0.00$911,703
$811,156 0.00 $328,984 0.00 $857,229 0.00Subtotal 0.00 $0 0.00$911,703
WASTE DIVERSION
$357 0.00 $0 0.00 $377 0.00DiversionFacilities
0.00 $0 0.00$434,993
$357 0.00 $0 0.00 $377 0.00Subtotal 0.00 $0 0.00$434,993
SUPPORT SERVICES
$70 0.00 $0 0.00 $0 0.00DepartmentalSupportServices
0.00 $0 0.00$20
$70 0.00 $0 0.00 $0 0.00Subtotal 0.00 $0 0.00$20
$811,583 0.00 $328,984 0.00 $857,606 0.00Total 0.00 $0 0.00$1,346,717
2012-13 Proposed Budget, Austin, TX
468 | Volume I
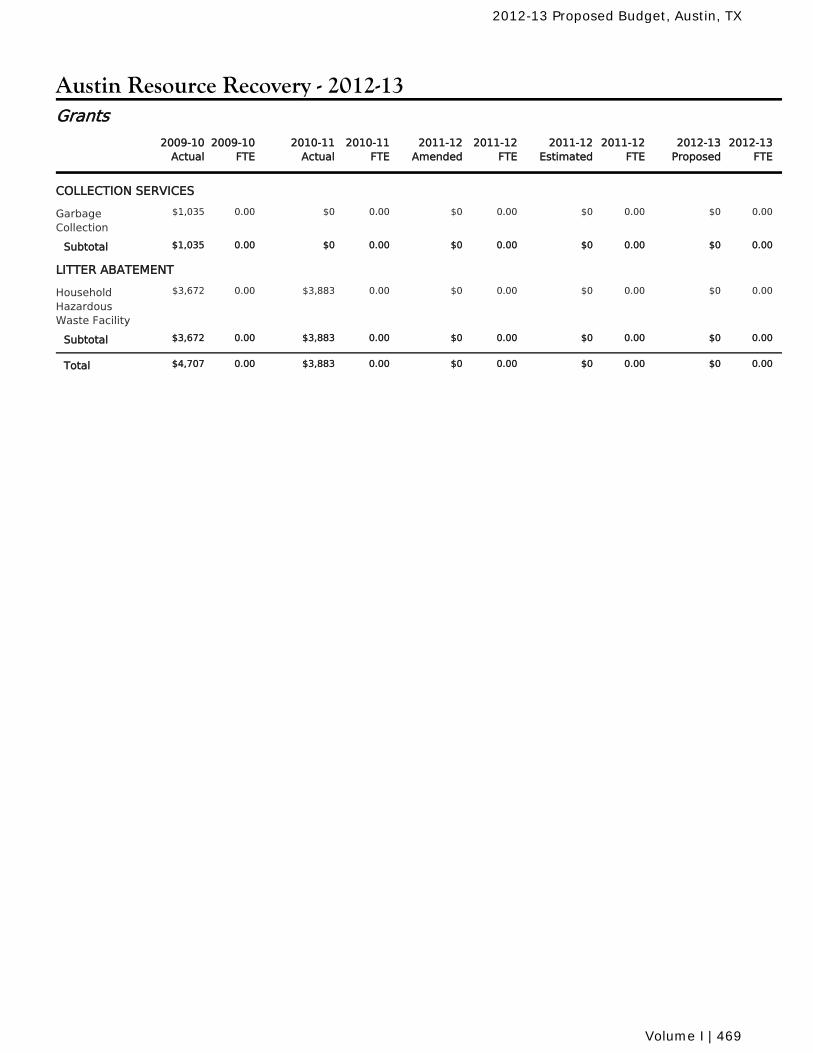
Austin Resource Recovery - 2012-13
2010-11Actual
2010-11FTE
2011-12Amended
2011-12FTE
2011-12Estimated
2011-12FTE
2009-10Actual
2009-10FTE
2012-13Proposed
2012-13FTE
Grants
COLLECTION SERVICES
$0 0.00 $0 0.00 $0 0.00GarbageCollection
0.00 $0 0.00$1,035
$0 0.00 $0 0.00 $0 0.00Subtotal 0.00 $0 0.00$1,035
LITTER ABATEMENT
$3,883 0.00 $0 0.00 $0 0.00HouseholdHazardousWaste Facility
0.00 $0 0.00$3,672
$3,883 0.00 $0 0.00 $0 0.00Subtotal 0.00 $0 0.00$3,672
$3,883 0.00 $0 0.00 $0 0.00Total 0.00 $0 0.00$4,707
2012-13 Proposed Budget, Austin, TX
Volume I | 469

2012-13 Proposed Budget, Austin, TX
470 | Volume I
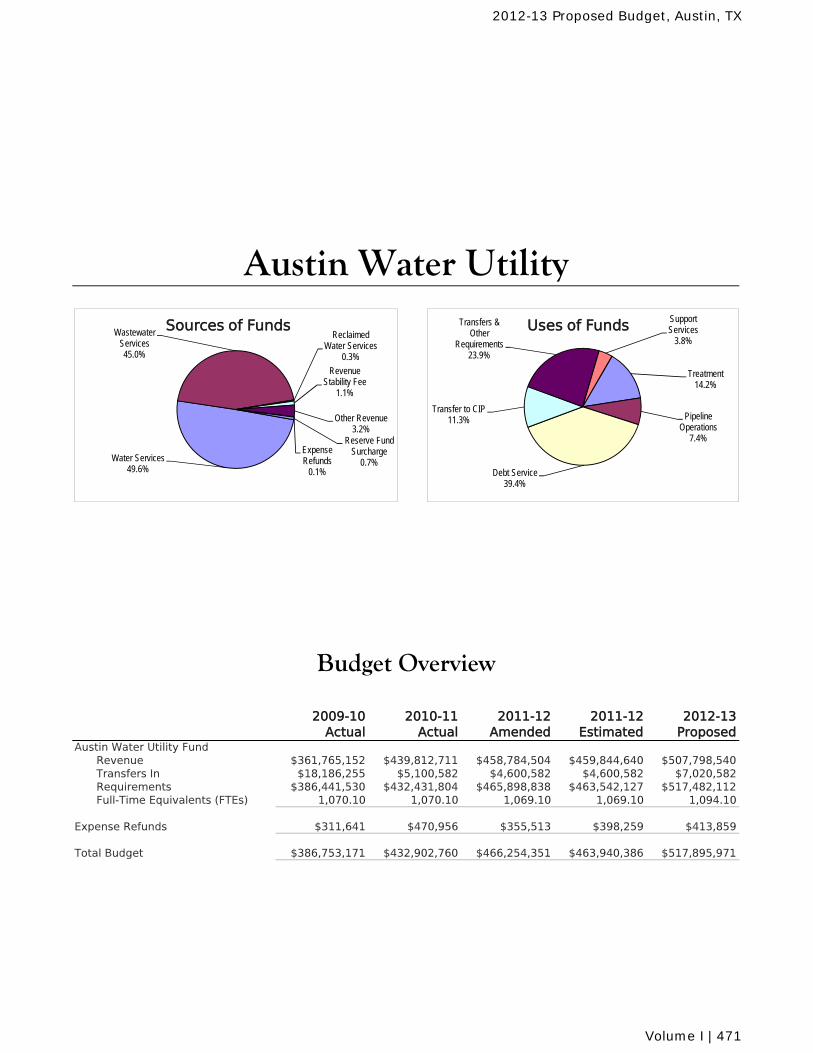
2009-10 Actual
2010-11 Actual
2011-12 Amended
2011-12 Estimated
2012-13 Proposed
Austin Water Utility FundRevenue $361,765,152 $439,812,711 $458,784,504 $459,844,640 $507,798,540Transfers In $18,186,255 $5,100,582 $4,600,582 $4,600,582 $7,020,582Requirements $386,441,530 $432,431,804 $465,898,838 $463,542,127 $517,482,112Full-Time Equivalents (FTEs) 1,070.10 1,070.10 1,069.10 1,069.10 1,094.10
Expense Refunds $311,641 $470,956 $355,513 $398,259 $413,859
Total Budget $386,753,171 $432,902,760 $466,254,351 $463,940,386 $517,895,971
Budget Overview
Austin Water Utility
Water Services49.6%
Wastewater Services45.0%
Reclaimed Water Services
0.3%
Revenue Stability Fee
1.1%
Other Revenue3.2%
Expense Refunds
0.1%
Reserve Fund Surcharge
0.7%
Sources of Funds
Treatment14.2%
Pipeline Operations
7.4%
Debt Service39.4%
Transfer to CIP11.3%
Transfers & Other
Requirements23.9%
Support Services
3.8%
Uses of Funds
2012-13 Proposed Budget, Austin, TX
Volume I | 471
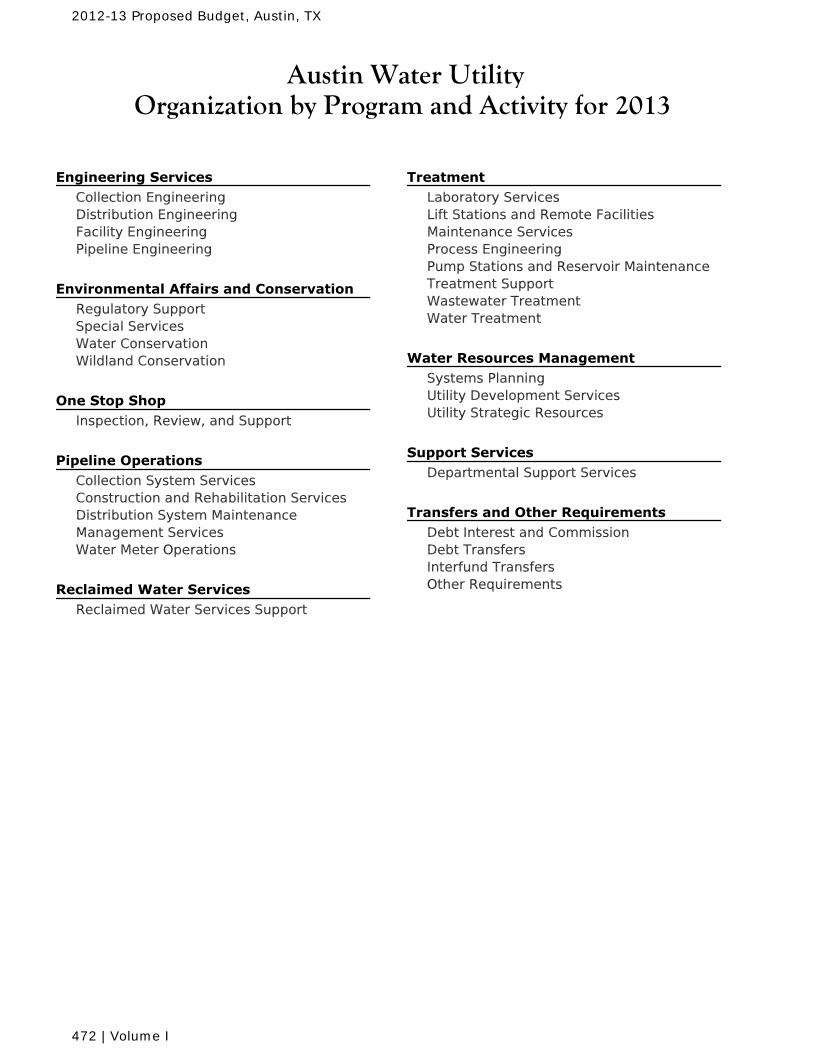
Austin Water UtilityOrganization by Program and Activity for 2013
Engineering Services Collection EngineeringDistribution EngineeringFacility EngineeringPipeline Engineering
Environmental Affairs and Conservation Regulatory SupportSpecial ServicesWater ConservationWildland Conservation
One Stop Shop Inspection, Review, and Support
Pipeline Operations Collection System ServicesConstruction and Rehabilitation ServicesDistribution System MaintenanceManagement ServicesWater Meter Operations
Reclaimed Water Services Reclaimed Water Services Support
Treatment Laboratory ServicesLift Stations and Remote FacilitiesMaintenance ServicesProcess EngineeringPump Stations and Reservoir MaintenanceTreatment SupportWastewater TreatmentWater Treatment
Water Resources Management Systems PlanningUtility Development ServicesUtility Strategic Resources
Support Services Departmental Support Services
Transfers and Other Requirements Debt Interest and CommissionDebt TransfersInterfund TransfersOther Requirements
2012-13 Proposed Budget, Austin, TX
472 | Volume I
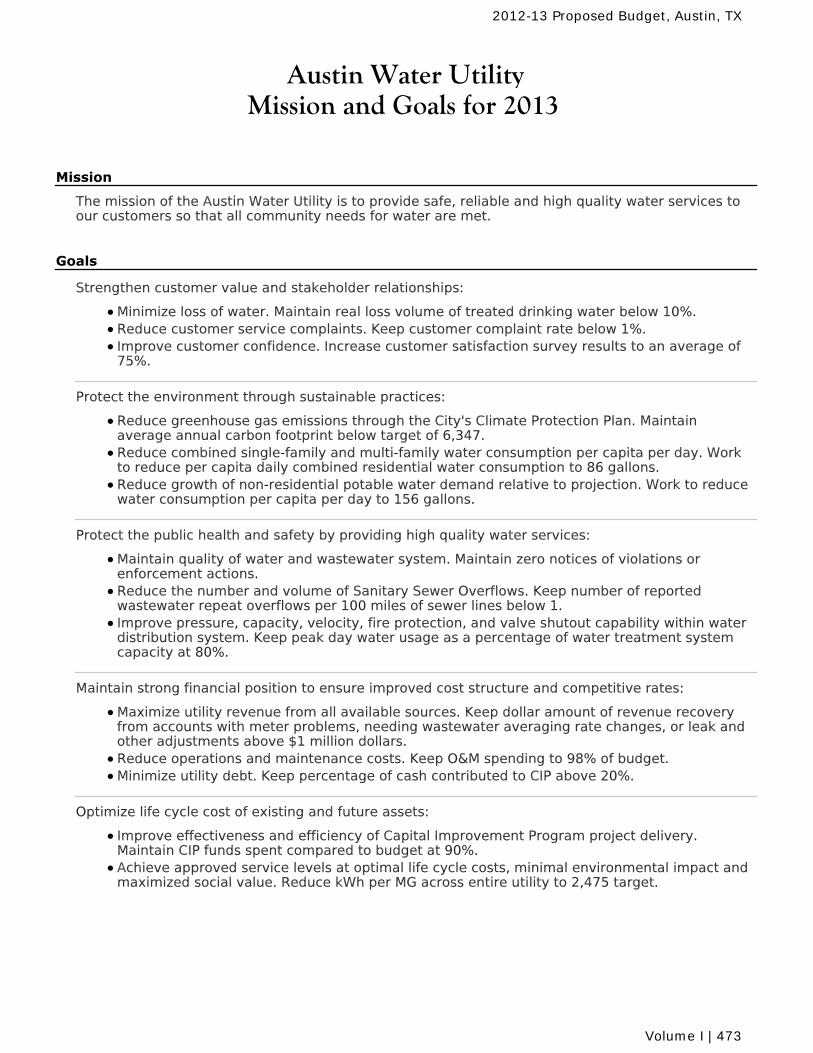
Austin Water UtilityMission and Goals for 2013
The mission of the Austin Water Utility is to provide safe, reliable and high quality water services toour customers so that all community needs for water are met.
Strengthen customer value and stakeholder relationships:
Minimize loss of water. Maintain real loss volume of treated drinking water below 10%.Reduce customer service complaints. Keep customer complaint rate below 1%.Improve customer confidence. Increase customer satisfaction survey results to an average of75%.
Protect the environment through sustainable practices:
Reduce greenhouse gas emissions through the City's Climate Protection Plan. Maintainaverage annual carbon footprint below target of 6,347.Reduce combined single-family and multi-family water consumption per capita per day. Workto reduce per capita daily combined residential water consumption to 86 gallons.Reduce growth of non-residential potable water demand relative to projection. Work to reducewater consumption per capita per day to 156 gallons.
Protect the public health and safety by providing high quality water services:
Maintain quality of water and wastewater system. Maintain zero notices of violations orenforcement actions.Reduce the number and volume of Sanitary Sewer Overflows. Keep number of reportedwastewater repeat overflows per 100 miles of sewer lines below 1.Improve pressure, capacity, velocity, fire protection, and valve shutout capability within waterdistribution system. Keep peak day water usage as a percentage of water treatment systemcapacity at 80%.
Maintain strong financial position to ensure improved cost structure and competitive rates:
Maximize utility revenue from all available sources. Keep dollar amount of revenue recoveryfrom accounts with meter problems, needing wastewater averaging rate changes, or leak andother adjustments above $1 million dollars.Reduce operations and maintenance costs. Keep O&M spending to 98% of budget.Minimize utility debt. Keep percentage of cash contributed to CIP above 20%.
Optimize life cycle cost of existing and future assets:
Improve effectiveness and efficiency of Capital Improvement Program project delivery.Maintain CIP funds spent compared to budget at 90%.Achieve approved service levels at optimal life cycle costs, minimal environmental impact andmaximized social value. Reduce kWh per MG across entire utility to 2,475 target.
2012-13 Proposed Budget, Austin, TX
Volume I | 473
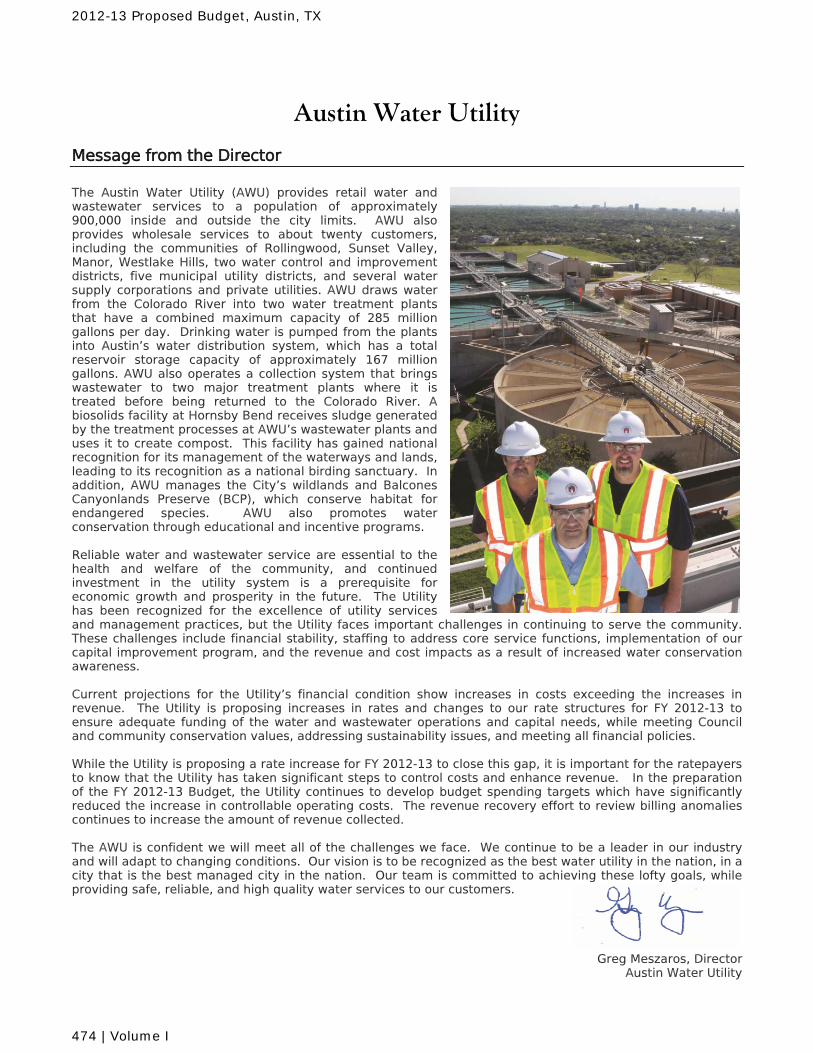
Austin Water Utility
Message from the Director
The Austin Water Utility (AWU) provides retail water and wastewater services to a population of approximately 900,000 inside and outside the city limits. AWU also provides wholesale services to about twenty customers, including the communities of Rollingwood, Sunset Valley, Manor, Westlake Hills, two water control and improvement districts, five municipal utility districts, and several water supply corporations and private utilities. AWU draws water from the Colorado River into two water treatment plants that have a combined maximum capacity of 285 million gallons per day. Drinking water is pumped from the plants into Austin’s water distribution system, which has a total reservoir storage capacity of approximately 167 million gallons. AWU also operates a collection system that brings wastewater to two major treatment plants where it is treated before being returned to the Colorado River. A biosolids facility at Hornsby Bend receives sludge generated by the treatment processes at AWU’s wastewater plants and uses it to create compost. This facility has gained national recognition for its management of the waterways and lands, leading to its recognition as a national birding sanctuary. In addition, AWU manages the City’s wildlands and Balcones Canyonlands Preserve (BCP), which conserve habitat for endangered species. AWU also promotes water conservation through educational and incentive programs. Reliable water and wastewater service are essential to the health and welfare of the community, and continued investment in the utility system is a prerequisite for economic growth and prosperity in the future. The Utility has been recognized for the excellence of utility services and management practices, but the Utility faces important challenges in continuing to serve the community. These challenges include financial stability, staffing to address core service functions, implementation of our capital improvement program, and the revenue and cost impacts as a result of increased water conservation awareness. Current projections for the Utility’s financial condition show increases in costs exceeding the increases in revenue. The Utility is proposing increases in rates and changes to our rate structures for FY 2012-13 to ensure adequate funding of the water and wastewater operations and capital needs, while meeting Council and community conservation values, addressing sustainability issues, and meeting all financial policies. While the Utility is proposing a rate increase for FY 2012-13 to close this gap, it is important for the ratepayers to know that the Utility has taken significant steps to control costs and enhance revenue. In the preparation of the FY 2012-13 Budget, the Utility continues to develop budget spending targets which have significantly reduced the increase in controllable operating costs. The revenue recovery effort to review billing anomalies continues to increase the amount of revenue collected. The AWU is confident we will meet all of the challenges we face. We continue to be a leader in our industry and will adapt to changing conditions. Our vision is to be recognized as the best water utility in the nation, in a city that is the best managed city in the nation. Our team is committed to achieving these lofty goals, while providing safe, reliable, and high quality water services to our customers.
Greg Meszaros, Director Austin Water Utility
2012-13 Proposed Budget, Austin, TX
474 | Volume I
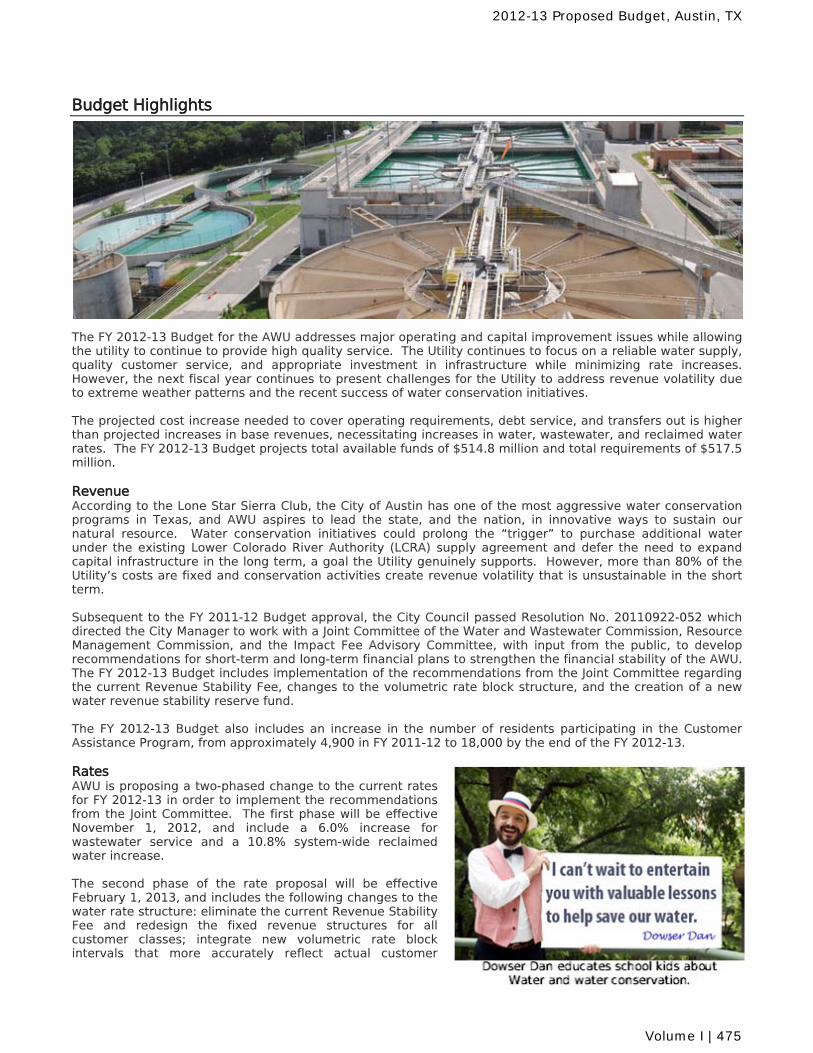
Budget Highlights
The FY 2012-13 Budget for the AWU addresses major operating and capital improvement issues while allowing the utility to continue to provide high quality service. The Utility continues to focus on a reliable water supply, quality customer service, and appropriate investment in infrastructure while minimizing rate increases. However, the next fiscal year continues to present challenges for the Utility to address revenue volatility due to extreme weather patterns and the recent success of water conservation initiatives. The projected cost increase needed to cover operating requirements, debt service, and transfers out is higher than projected increases in base revenues, necessitating increases in water, wastewater, and reclaimed water rates. The FY 2012-13 Budget projects total available funds of $514.8 million and total requirements of $517.5 million. Revenue According to the Lone Star Sierra Club, the City of Austin has one of the most aggressive water conservation programs in Texas, and AWU aspires to lead the state, and the nation, in innovative ways to sustain our natural resource. Water conservation initiatives could prolong the “trigger” to purchase additional water under the existing Lower Colorado River Authority (LCRA) supply agreement and defer the need to expand capital infrastructure in the long term, a goal the Utility genuinely supports. However, more than 80% of the Utility’s costs are fixed and conservation activities create revenue volatility that is unsustainable in the short term. Subsequent to the FY 2011-12 Budget approval, the City Council passed Resolution No. 20110922-052 which directed the City Manager to work with a Joint Committee of the Water and Wastewater Commission, Resource Management Commission, and the Impact Fee Advisory Committee, with input from the public, to develop recommendations for short-term and long-term financial plans to strengthen the financial stability of the AWU. The FY 2012-13 Budget includes implementation of the recommendations from the Joint Committee regarding the current Revenue Stability Fee, changes to the volumetric rate block structure, and the creation of a new water revenue stability reserve fund. The FY 2012-13 Budget also includes an increase in the number of residents participating in the Customer Assistance Program, from approximately 4,900 in FY 2011-12 to 18,000 by the end of the FY 2012-13. Rates AWU is proposing a two-phased change to the current rates for FY 2012-13 in order to implement the recommendations from the Joint Committee. The first phase will be effective November 1, 2012, and include a 6.0% increase for wastewater service and a 10.8% system-wide reclaimed water increase. The second phase of the rate proposal will be effective February 1, 2013, and includes the following changes to the water rate structure: eliminate the current Revenue Stability Fee and redesign the fixed revenue structures for all customer classes; integrate new volumetric rate block intervals that more accurately reflect actual customer
2012-13 Proposed Budget, Austin, TX
Volume I | 475
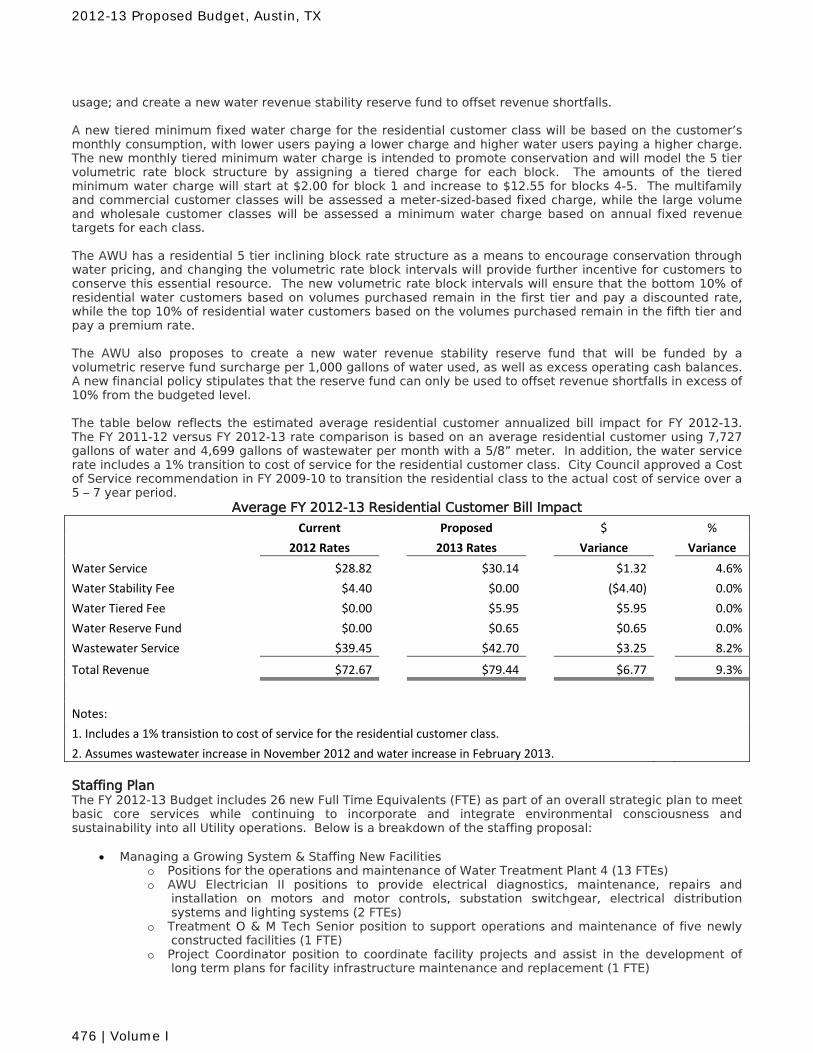
usage; and create a new water revenue stability reserve fund to offset revenue shortfalls. A new tiered minimum fixed water charge for the residential customer class will be based on the customer’s monthly consumption, with lower users paying a lower charge and higher water users paying a higher charge. The new monthly tiered minimum water charge is intended to promote conservation and will model the 5 tier volumetric rate block structure by assigning a tiered charge for each block. The amounts of the tiered minimum water charge will start at $2.00 for block 1 and increase to $12.55 for blocks 4-5. The multifamily and commercial customer classes will be assessed a meter-sized-based fixed charge, while the large volume and wholesale customer classes will be assessed a minimum water charge based on annual fixed revenue targets for each class. The AWU has a residential 5 tier inclining block rate structure as a means to encourage conservation through water pricing, and changing the volumetric rate block intervals will provide further incentive for customers to conserve this essential resource. The new volumetric rate block intervals will ensure that the bottom 10% of residential water customers based on volumes purchased remain in the first tier and pay a discounted rate, while the top 10% of residential water customers based on the volumes purchased remain in the fifth tier and pay a premium rate. The AWU also proposes to create a new water revenue stability reserve fund that will be funded by a volumetric reserve fund surcharge per 1,000 gallons of water used, as well as excess operating cash balances. A new financial policy stipulates that the reserve fund can only be used to offset revenue shortfalls in excess of 10% from the budgeted level. The table below reflects the estimated average residential customer annualized bill impact for FY 2012-13. The FY 2011-12 versus FY 2012-13 rate comparison is based on an average residential customer using 7,727 gallons of water and 4,699 gallons of wastewater per month with a 5/8” meter. In addition, the water service rate includes a 1% transition to cost of service for the residential customer class. City Council approved a Cost of Service recommendation in FY 2009-10 to transition the residential class to the actual cost of service over a 5 – 7 year period.
Average FY 2012-13 Residential Customer Bill Impact
Current Proposed $ %
2012 Rates 2013 Rates Variance Variance
Water Service $28.82 $30.14 $1.32 4.6%
Water Stability Fee $4.40 $0.00 ($4.40) 0.0%
Water Tiered Fee $0.00 $5.95 $5.95 0.0%
Water Reserve Fund $0.00 $0.65 $0.65 0.0%
Wastewater Service $39.45 $42.70 $3.25 8.2%
Total Revenue $72.67 $79.44 $6.77 9.3%
Notes:
1. Includes a 1% transistion to cost of service for the residential customer class.
2. Assumes wastewater increase in November 2012 and water increase in February 2013. Staffing Plan The FY 2012-13 Budget includes 26 new Full Time Equivalents (FTE) as part of an overall strategic plan to meet basic core services while continuing to incorporate and integrate environmental consciousness and sustainability into all Utility operations. Below is a breakdown of the staffing proposal:
Managing a Growing System & Staffing New Facilities o Positions for the operations and maintenance of Water Treatment Plant 4 (13 FTEs) o AWU Electrician II positions to provide electrical diagnostics, maintenance, repairs and
installation on motors and motor controls, substation switchgear, electrical distribution systems and lighting systems (2 FTEs)
o Treatment O & M Tech Senior position to support operations and maintenance of five newly constructed facilities (1 FTE)
o Project Coordinator position to coordinate facility projects and assist in the development of long term plans for facility infrastructure maintenance and replacement (1 FTE)
2012-13 Proposed Budget, Austin, TX
476 | Volume I
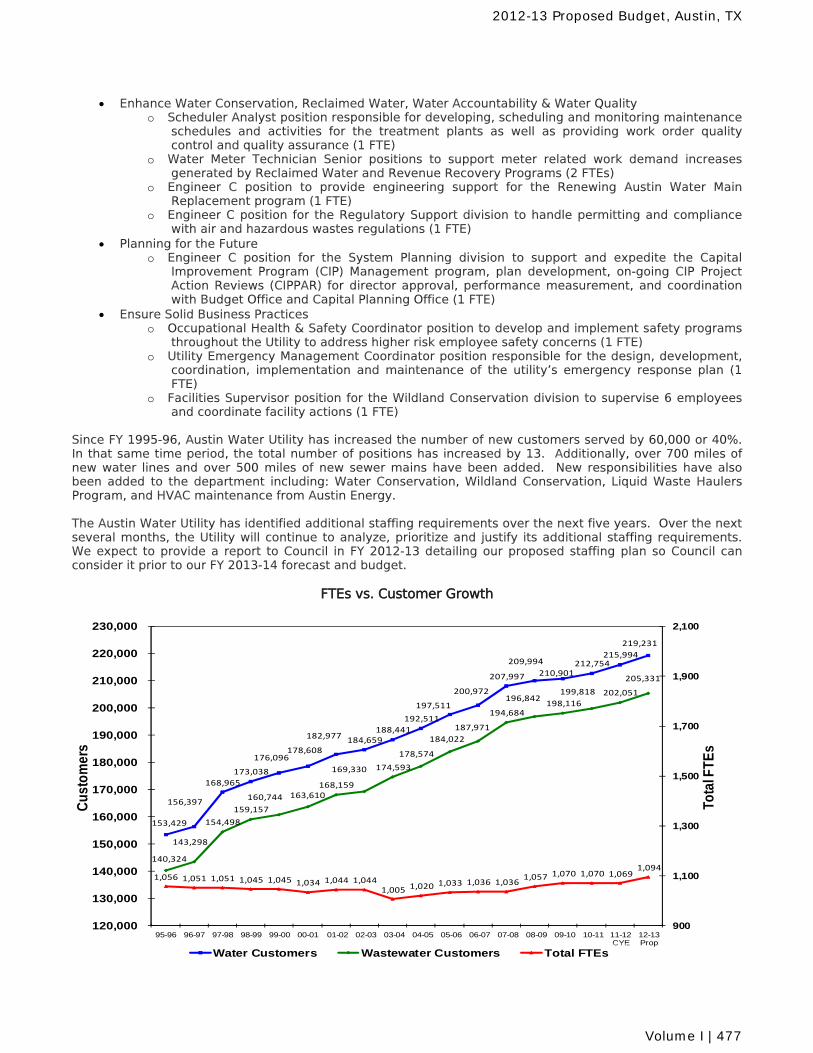
153,429
156,397
168,965
173,038
176,096178,608
182,977 184,659188,441
192,511
197,511
200,972
207,997
209,994
210,901212,754
215,994
219,231
140,324
143,298
154,498
159,157
160,744 163,610168,159
169,330 174,593
178,574
184,022
187,971
194,684
196,842198,116
199,818 202,051
205,331
1,056 1,051 1,051 1,045 1,045 1,034 1,044 1,044 1,005 1,020
1,033 1,036 1,036 1,057 1,070 1,070 1,069
1,094
900
1,100
1,300
1,500
1,700
1,900
2,100
120,000
130,000
140,000
150,000
160,000
170,000
180,000
190,000
200,000
210,000
220,000
230,000
95-96 96-97 97-98 98-99 99-00 00-01 01-02 02-03 03-04 04-05 05-06 06-07 07-08 08-09 09-10 10-11 11-12CYE
12-13Prop
Tota
l FTE
s
Cus
tom
ers
Water Customers Wastewater Customers Total FTEs
Enhance Water Conservation, Reclaimed Water, Water Accountability & Water Quality o Scheduler Analyst position responsible for developing, scheduling and monitoring maintenance
schedules and activities for the treatment plants as well as providing work order quality control and quality assurance (1 FTE)
o Water Meter Technician Senior positions to support meter related work demand increases generated by Reclaimed Water and Revenue Recovery Programs (2 FTEs)
o Engineer C position to provide engineering support for the Renewing Austin Water Main Replacement program (1 FTE)
o Engineer C position for the Regulatory Support division to handle permitting and compliance with air and hazardous wastes regulations (1 FTE)
Planning for the Future o Engineer C position for the System Planning division to support and expedite the Capital
Improvement Program (CIP) Management program, plan development, on-going CIP Project Action Reviews (CIPPAR) for director approval, performance measurement, and coordination with Budget Office and Capital Planning Office (1 FTE)
Ensure Solid Business Practices o Occupational Health & Safety Coordinator position to develop and implement safety programs
throughout the Utility to address higher risk employee safety concerns (1 FTE) o Utility Emergency Management Coordinator position responsible for the design, development,
coordination, implementation and maintenance of the utility’s emergency response plan (1 FTE)
o Facilities Supervisor position for the Wildland Conservation division to supervise 6 employees and coordinate facility actions (1 FTE)
Since FY 1995-96, Austin Water Utility has increased the number of new customers served by 60,000 or 40%. In that same time period, the total number of positions has increased by 13. Additionally, over 700 miles of new water lines and over 500 miles of new sewer mains have been added. New responsibilities have also been added to the department including: Water Conservation, Wildland Conservation, Liquid Waste Haulers Program, and HVAC maintenance from Austin Energy. The Austin Water Utility has identified additional staffing requirements over the next five years. Over the next several months, the Utility will continue to analyze, prioritize and justify its additional staffing requirements. We expect to provide a report to Council in FY 2012-13 detailing our proposed staffing plan so Council can consider it prior to our FY 2013-14 forecast and budget.
FTEs vs. Customer Growth
2012-13 Proposed Budget, Austin, TX
Volume I | 477
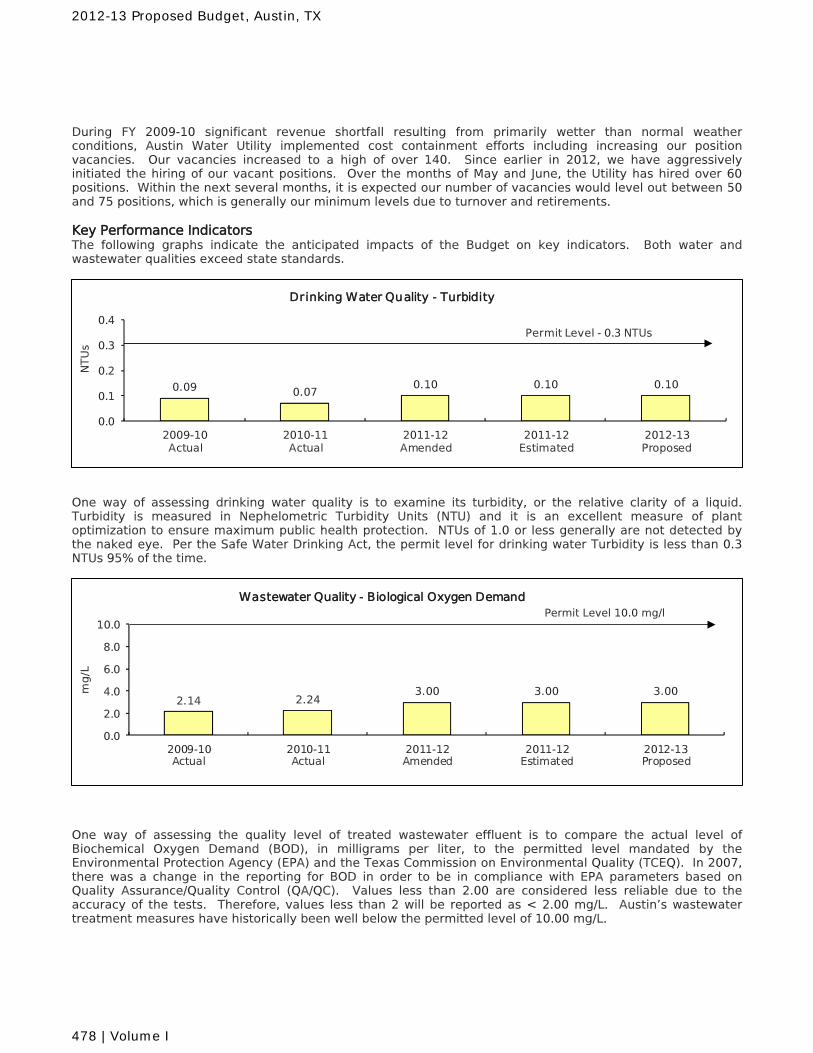
During FY 2009-10 significant revenue shortfall resulting from primarily wetter than normal weather conditions, Austin Water Utility implemented cost containment efforts including increasing our position vacancies. Our vacancies increased to a high of over 140. Since earlier in 2012, we have aggressively initiated the hiring of our vacant positions. Over the months of May and June, the Utility has hired over 60 positions. Within the next several months, it is expected our number of vacancies would level out between 50 and 75 positions, which is generally our minimum levels due to turnover and retirements. Key Performance Indicators The following graphs indicate the anticipated impacts of the Budget on key indicators. Both water and wastewater qualities exceed state standards.
One way of assessing drinking water quality is to examine its turbidity, or the relative clarity of a liquid. Turbidity is measured in Nephelometric Turbidity Units (NTU) and it is an excellent measure of plant optimization to ensure maximum public health protection. NTUs of 1.0 or less generally are not detected by the naked eye. Per the Safe Water Drinking Act, the permit level for drinking water Turbidity is less than 0.3 NTUs 95% of the time.
One way of assessing the quality level of treated wastewater effluent is to compare the actual level of Biochemical Oxygen Demand (BOD), in milligrams per liter, to the permitted level mandated by the Environmental Protection Agency (EPA) and the Texas Commission on Environmental Quality (TCEQ). In 2007, there was a change in the reporting for BOD in order to be in compliance with EPA parameters based on Quality Assurance/Quality Control (QA/QC). Values less than 2.00 are considered less reliable due to the accuracy of the tests. Therefore, values less than 2 will be reported as < 2.00 mg/L. Austin’s wastewater treatment measures have historically been well below the permitted level of 10.00 mg/L.
0.09 0.070.10 0.10 0.10
0.0
0.1
0.2
0.3
0.4
2009-10Actual
2010-11Actual
2011-12Amended
2011-12Estimated
2012-13Proposed
NT
Us
Drinking Water Quality - Turbidity
Permit Level - 0.3 NTUs
2.14 2.243.00 3.00 3.00
0.0
2.0
4.0
6.0
8.0
10.0
2009-10Actual
2010-11Actual
2011-12Amended
2011-12Estimated
2012-13Proposed
mg/L
Wastewater Quality - Biological Oxygen DemandPermit Level 10.0 mg/l
2012-13 Proposed Budget, Austin, TX
478 | Volume I
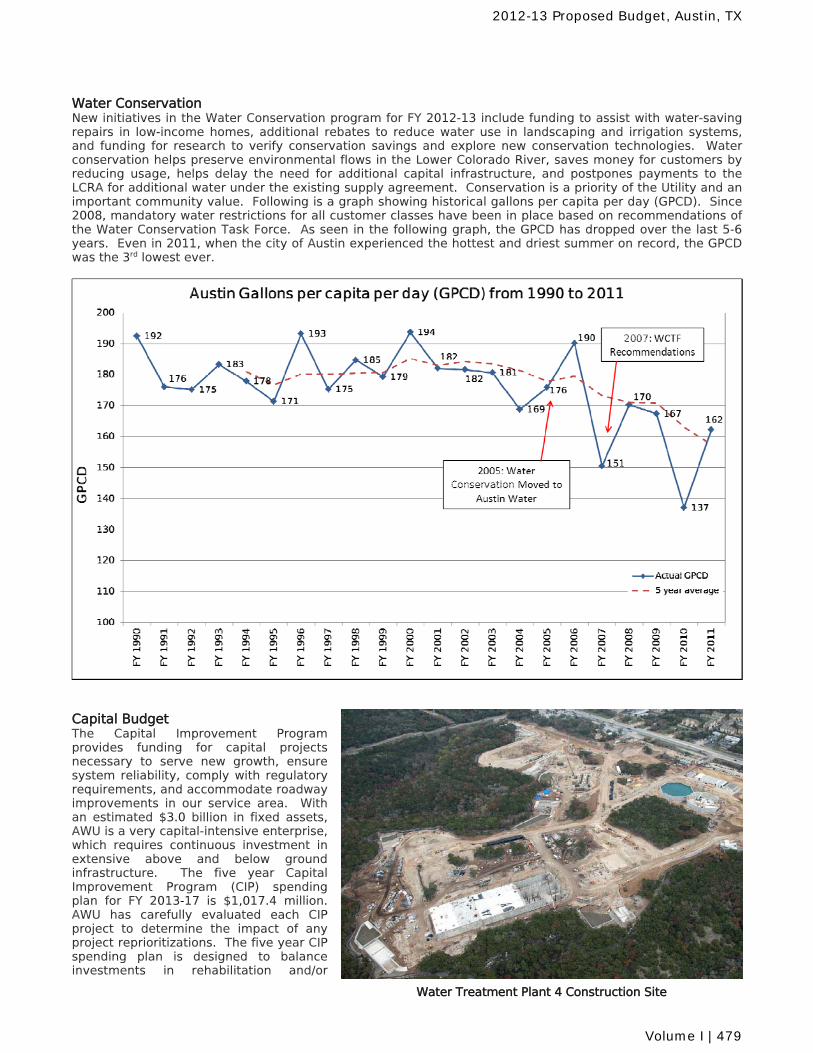
Water Treatment Plant 4 Construction Site
Water Conservation New initiatives in the Water Conservation program for FY 2012-13 include funding to assist with water-saving repairs in low-income homes, additional rebates to reduce water use in landscaping and irrigation systems, and funding for research to verify conservation savings and explore new conservation technologies. Water conservation helps preserve environmental flows in the Lower Colorado River, saves money for customers by reducing usage, helps delay the need for additional capital infrastructure, and postpones payments to the LCRA for additional water under the existing supply agreement. Conservation is a priority of the Utility and an important community value. Following is a graph showing historical gallons per capita per day (GPCD). Since 2008, mandatory water restrictions for all customer classes have been in place based on recommendations of the Water Conservation Task Force. As seen in the following graph, the GPCD has dropped over the last 5-6 years. Even in 2011, when the city of Austin experienced the hottest and driest summer on record, the GPCD was the 3rd lowest ever.
Capital Budget The Capital Improvement Program provides funding for capital projects necessary to serve new growth, ensure system reliability, comply with regulatory requirements, and accommodate roadway improvements in our service area. With an estimated $3.0 billion in fixed assets, AWU is a very capital-intensive enterprise, which requires continuous investment in extensive above and below ground infrastructure. The five year Capital Improvement Program (CIP) spending plan for FY 2013-17 is $1,017.4 million. AWU has carefully evaluated each CIP project to determine the impact of any project reprioritizations. The five year CIP spending plan is designed to balance investments in rehabilitation and/or
2012-13 Proposed Budget, Austin, TX
Volume I | 479
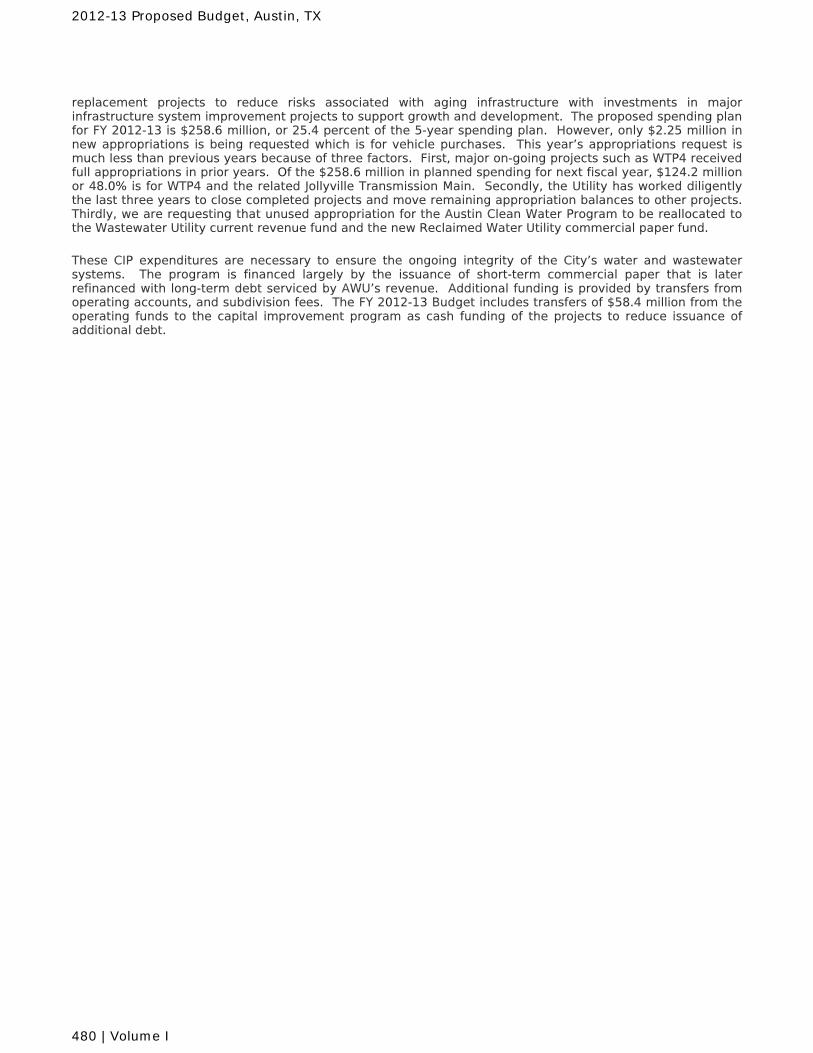
replacement projects to reduce risks associated with aging infrastructure with investments in major infrastructure system improvement projects to support growth and development. The proposed spending plan for FY 2012-13 is $258.6 million, or 25.4 percent of the 5-year spending plan. However, only $2.25 million in new appropriations is being requested which is for vehicle purchases. This year’s appropriations request is much less than previous years because of three factors. First, major on-going projects such as WTP4 received full appropriations in prior years. Of the $258.6 million in planned spending for next fiscal year, $124.2 million or 48.0% is for WTP4 and the related Jollyville Transmission Main. Secondly, the Utility has worked diligently the last three years to close completed projects and move remaining appropriation balances to other projects. Thirdly, we are requesting that unused appropriation for the Austin Clean Water Program to be reallocated to the Wastewater Utility current revenue fund and the new Reclaimed Water Utility commercial paper fund.
These CIP expenditures are necessary to ensure the ongoing integrity of the City’s water and wastewater systems. The program is financed largely by the issuance of short-term commercial paper that is later refinanced with long-term debt serviced by AWU’s revenue. Additional funding is provided by transfers from operating accounts, and subdivision fees. The FY 2012-13 Budget includes transfers of $58.4 million from the operating funds to the capital improvement program as cash funding of the projects to reduce issuance of additional debt.
2012-13 Proposed Budget, Austin, TX
480 | Volume I
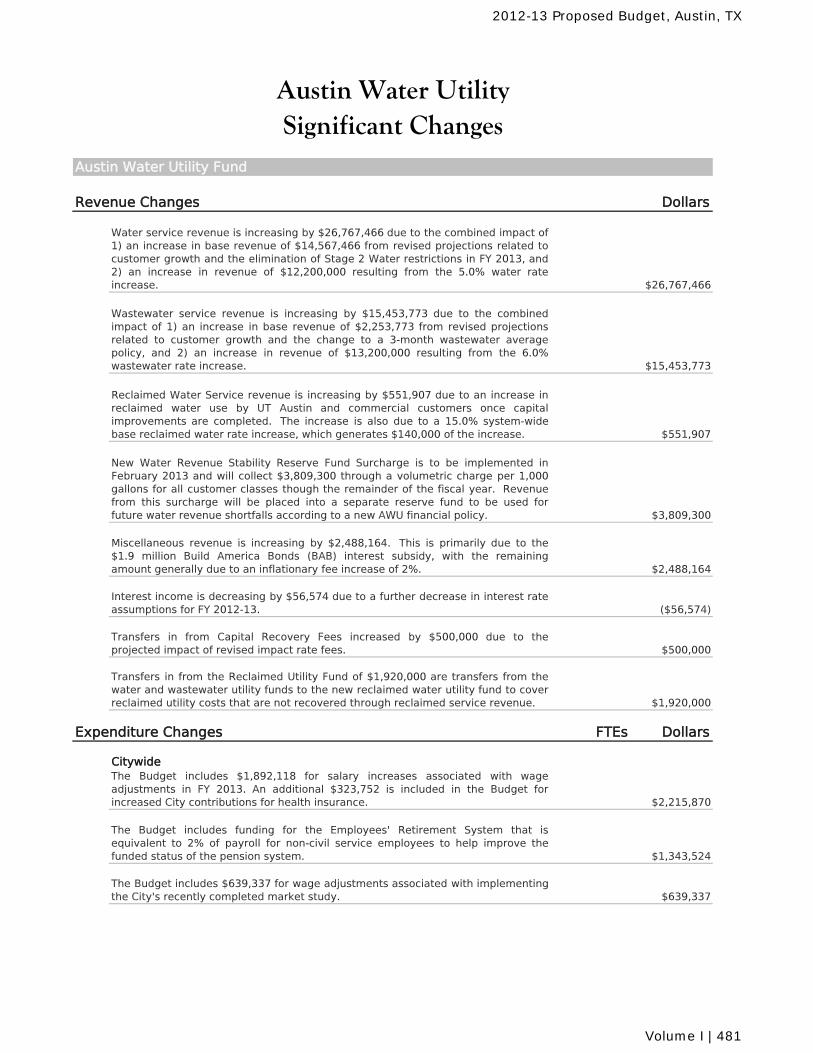
Austin Water Utility Fund
Revenue Changes Dollars
Water service revenue is increasing by $26,767,466 due to the combined impact of1) an increase in base revenue of $14,567,466 from revised projections related tocustomer growth and the elimination of Stage 2 Water restrictions in FY 2013, and2) an increase in revenue of $12,200,000 resulting from the 5.0% water rateincrease. $26,767,466
Wastewater service revenue is increasing by $15,453,773 due to the combinedimpact of 1) an increase in base revenue of $2,253,773 from revised projectionsrelated to customer growth and the change to a 3-month wastewater averagepolicy, and 2) an increase in revenue of $13,200,000 resulting from the 6.0%wastewater rate increase. $15,453,773
Reclaimed Water Service revenue is increasing by $551,907 due to an increase inreclaimed water use by UT Austin and commercial customers once capitalimprovements are completed. The increase is also due to a 15.0% system-widebase reclaimed water rate increase, which generates $140,000 of the increase. $551,907
New Water Revenue Stability Reserve Fund Surcharge is to be implemented inFebruary 2013 and will collect $3,809,300 through a volumetric charge per 1,000gallons for all customer classes though the remainder of the fiscal year. Revenuefrom this surcharge will be placed into a separate reserve fund to be used forfuture water revenue shortfalls according to a new AWU financial policy. $3,809,300
Miscellaneous revenue is increasing by $2,488,164. This is primarily due to the$1.9 million Build America Bonds (BAB) interest subsidy, with the remainingamount generally due to an inflationary fee increase of 2%. $2,488,164
Interest income is decreasing by $56,574 due to a further decrease in interest rateassumptions for FY 2012-13. ($56,574)
Transfers in from Capital Recovery Fees increased by $500,000 due to theprojected impact of revised impact rate fees. $500,000
Transfers in from the Reclaimed Utility Fund of $1,920,000 are transfers from thewater and wastewater utility funds to the new reclaimed water utility fund to coverreclaimed utility costs that are not recovered through reclaimed service revenue. $1,920,000
Expenditure Changes FTEs Dollars
CitywideThe Budget includes $1,892,118 for salary increases associated with wageadjustments in FY 2013. An additional $323,752 is included in the Budget forincreased City contributions for health insurance. $2,215,870
The Budget includes funding for the Employees' Retirement System that isequivalent to 2% of payroll for non-civil service employees to help improve thefunded status of the pension system. $1,343,524
The Budget includes $639,337 for wage adjustments associated with implementingthe City's recently completed market study. $639,337
Significant ChangesAustin Water Utility
2012-13 Proposed Budget, Austin, TX
Volume I | 481
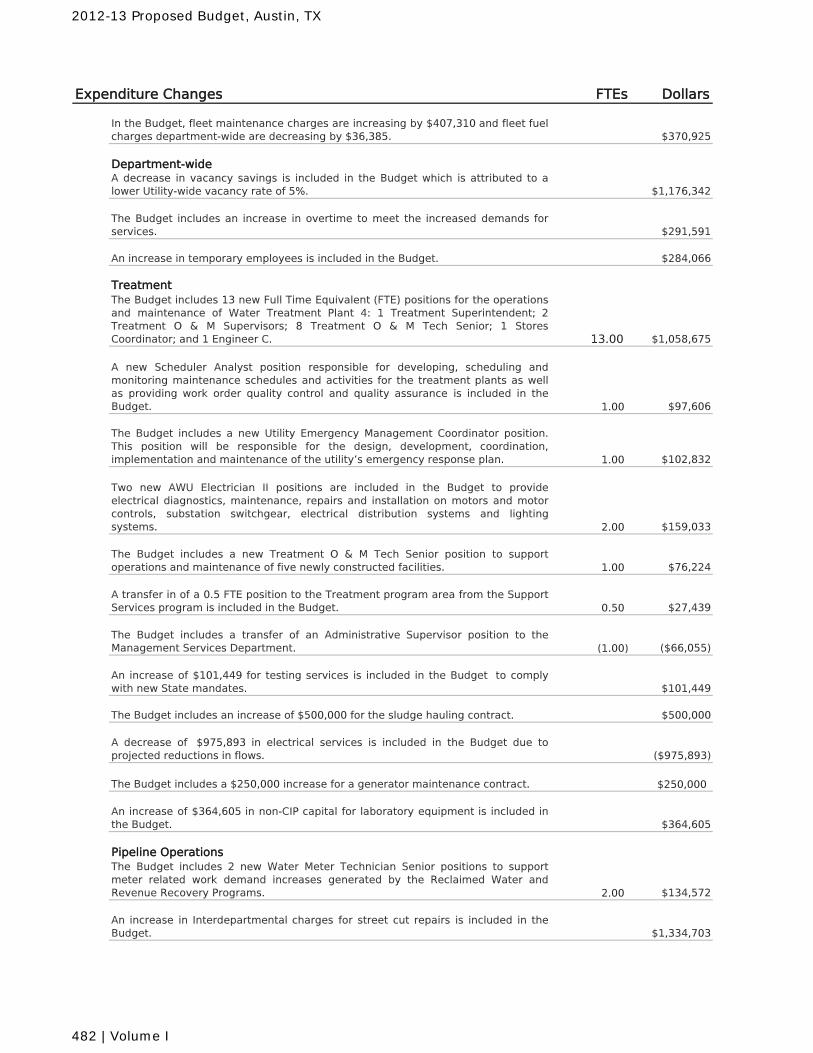
Expenditure Changes FTEs Dollars
In the Budget, fleet maintenance charges are increasing by $407,310 and fleet fuelcharges department-wide are decreasing by $36,385. $370,925
Department-wideA decrease in vacancy savings is included in the Budget which is attributed to alower Utility-wide vacancy rate of 5%. $1,176,342
The Budget includes an increase in overtime to meet the increased demands forservices. $291,591
An increase in temporary employees is included in the Budget. $284,066
TreatmentThe Budget includes 13 new Full Time Equivalent (FTE) positions for the operationsand maintenance of Water Treatment Plant 4: 1 Treatment Superintendent; 2Treatment O & M Supervisors; 8 Treatment O & M Tech Senior; 1 StoresCoordinator; and 1 Engineer C. 13.00 $1,058,675
A new Scheduler Analyst position responsible for developing, scheduling andmonitoring maintenance schedules and activities for the treatment plants as wellas providing work order quality control and quality assurance is included in theBudget. 1.00 $97,606
The Budget includes a new Utility Emergency Management Coordinator position.This position will be responsible for the design, development, coordination,implementation and maintenance of the utility’s emergency response plan. 1.00 $102,832
Two new AWU Electrician II positions are included in the Budget to provideelectrical diagnostics, maintenance, repairs and installation on motors and motorcontrols, substation switchgear, electrical distribution systems and lightingsystems. 2.00 $159,033
The Budget includes a new Treatment O & M Tech Senior position to supportoperations and maintenance of five newly constructed facilities. 1.00 $76,224
A transfer in of a 0.5 FTE position to the Treatment program area from the SupportServices program is included in the Budget. 0.50 $27,439
The Budget includes a transfer of an Administrative Supervisor position to theManagement Services Department. (1.00) ($66,055)
An increase of $101,449 for testing services is included in the Budget to complywith new State mandates. $101,449
The Budget includes an increase of $500,000 for the sludge hauling contract. $500,000
A decrease of $975,893 in electrical services is included in the Budget due toprojected reductions in flows. ($975,893)
The Budget includes a $250,000 increase for a generator maintenance contract. $250,000
An increase of $364,605 in non-CIP capital for laboratory equipment is included inthe Budget. $364,605
Pipeline OperationsThe Budget includes 2 new Water Meter Technician Senior positions to supportmeter related work demand increases generated by the Reclaimed Water andRevenue Recovery Programs. 2.00 $134,572
An increase in Interdepartmental charges for street cut repairs is included in theBudget. $1,334,703
2012-13 Proposed Budget, Austin, TX
482 | Volume I
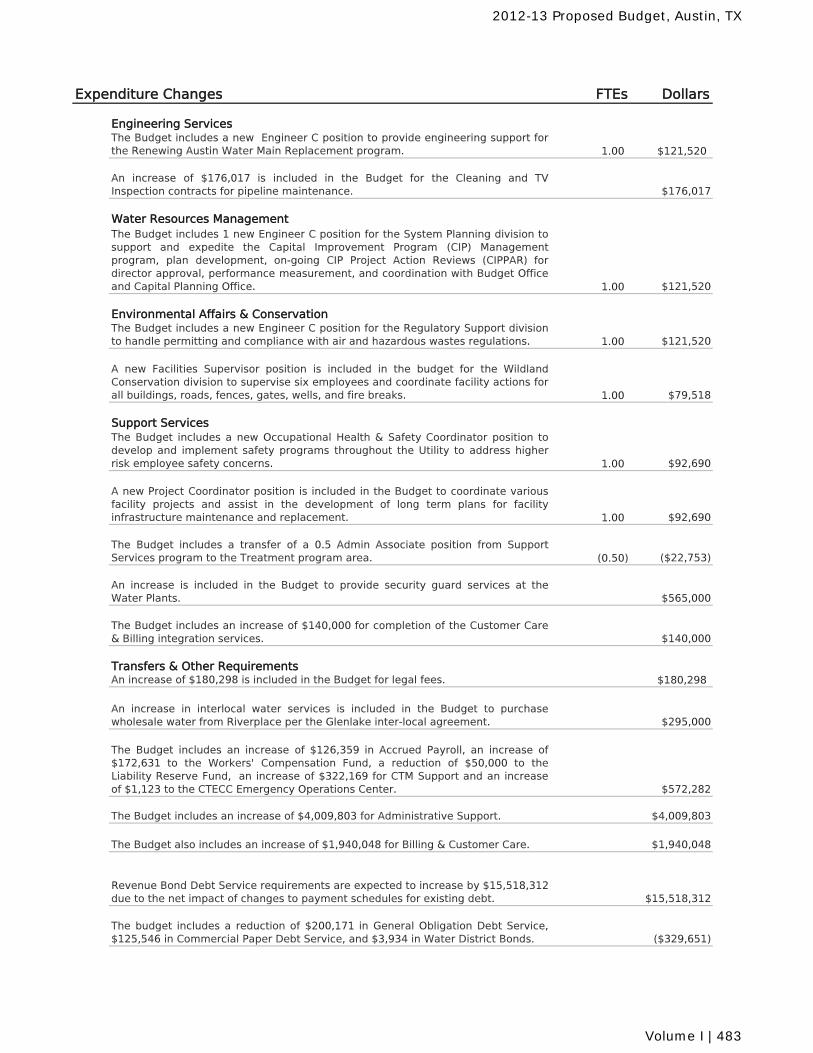
Expenditure Changes FTEs Dollars
Engineering ServicesThe Budget includes a new Engineer C position to provide engineering support forthe Renewing Austin Water Main Replacement program. 1.00 $121,520
An increase of $176,017 is included in the Budget for the Cleaning and TVInspection contracts for pipeline maintenance. $176,017
Water Resources ManagementThe Budget includes 1 new Engineer C position for the System Planning division tosupport and expedite the Capital Improvement Program (CIP) Managementprogram, plan development, on-going CIP Project Action Reviews (CIPPAR) fordirector approval, performance measurement, and coordination with Budget Officeand Capital Planning Office. 1.00 $121,520
Environmental Affairs & ConservationThe Budget includes a new Engineer C position for the Regulatory Support divisionto handle permitting and compliance with air and hazardous wastes regulations. 1.00 $121,520
A new Facilities Supervisor position is included in the budget for the WildlandConservation division to supervise six employees and coordinate facility actions forall buildings, roads, fences, gates, wells, and fire breaks. 1.00 $79,518
Support ServicesThe Budget includes a new Occupational Health & Safety Coordinator position todevelop and implement safety programs throughout the Utility to address higherrisk employee safety concerns. 1.00 $92,690
A new Project Coordinator position is included in the Budget to coordinate variousfacility projects and assist in the development of long term plans for facilityinfrastructure maintenance and replacement. 1.00 $92,690
The Budget includes a transfer of a 0.5 Admin Associate position from SupportServices program to the Treatment program area. (0.50) ($22,753)
An increase is included in the Budget to provide security guard services at theWater Plants. $565,000
The Budget includes an increase of $140,000 for completion of the Customer Care& Billing integration services. $140,000
Transfers & Other RequirementsAn increase of $180,298 is included in the Budget for legal fees. $180,298
An increase in interlocal water services is included in the Budget to purchasewholesale water from Riverplace per the Glenlake inter-local agreement. $295,000
The Budget includes an increase of $126,359 in Accrued Payroll, an increase of$172,631 to the Workers' Compensation Fund, a reduction of $50,000 to theLiability Reserve Fund, an increase of $322,169 for CTM Support and an increaseof $1,123 to the CTECC Emergency Operations Center. $572,282
The Budget includes an increase of $4,009,803 for Administrative Support. $4,009,803
The Budget also includes an increase of $1,940,048 for Billing & Customer Care. $1,940,048
Revenue Bond Debt Service requirements are expected to increase by $15,518,312due to the net impact of changes to payment schedules for existing debt. $15,518,312
The budget includes a reduction of $200,171 in General Obligation Debt Service,$125,546 in Commercial Paper Debt Service, and $3,934 in Water District Bonds. ($329,651)
2012-13 Proposed Budget, Austin, TX
Volume I | 483
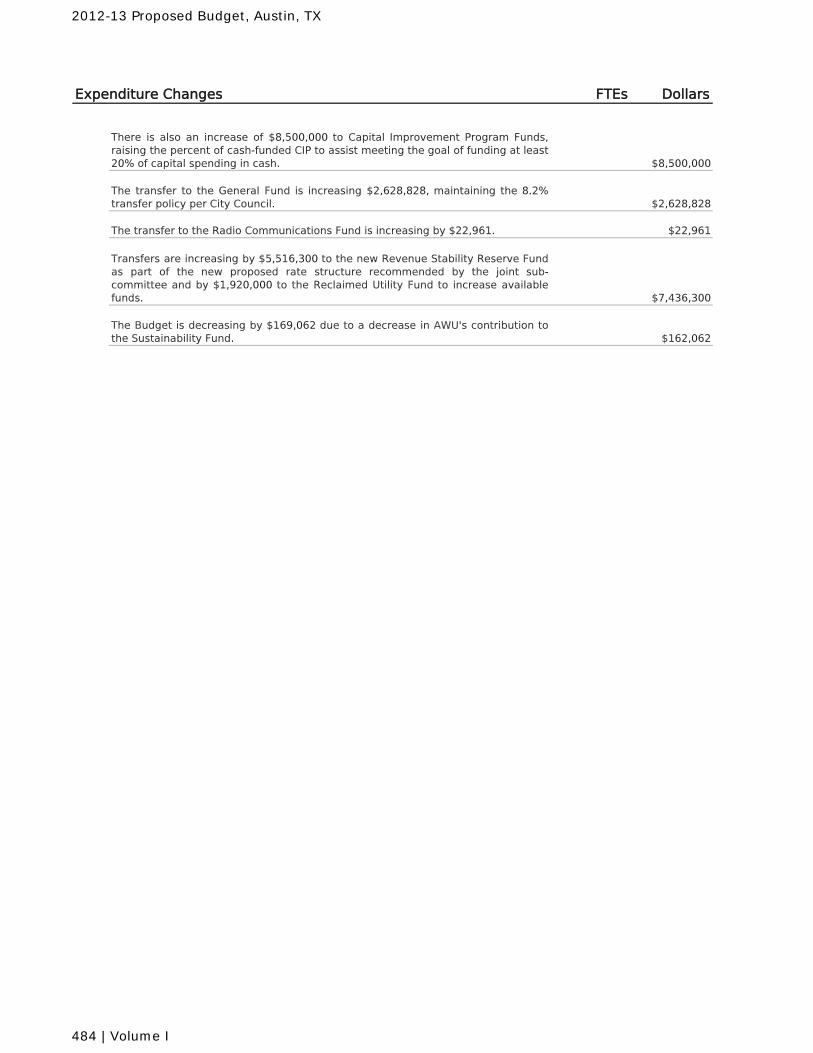
Expenditure Changes FTEs Dollars
There is also an increase of $8,500,000 to Capital Improvement Program Funds,raising the percent of cash-funded CIP to assist meeting the goal of funding at least20% of capital spending in cash. $8,500,000
The transfer to the General Fund is increasing $2,628,828, maintaining the 8.2%transfer policy per City Council. $2,628,828
The transfer to the Radio Communications Fund is increasing by $22,961. $22,961
Transfers are increasing by $5,516,300 to the new Revenue Stability Reserve Fundas part of the new proposed rate structure recommended by the joint sub-committee and by $1,920,000 to the Reclaimed Utility Fund to increase availablefunds. $7,436,300
The Budget is decreasing by $169,062 due to a decrease in AWU's contribution tothe Sustainability Fund. $162,062
2012-13 Proposed Budget, Austin, TX
484 | Volume I
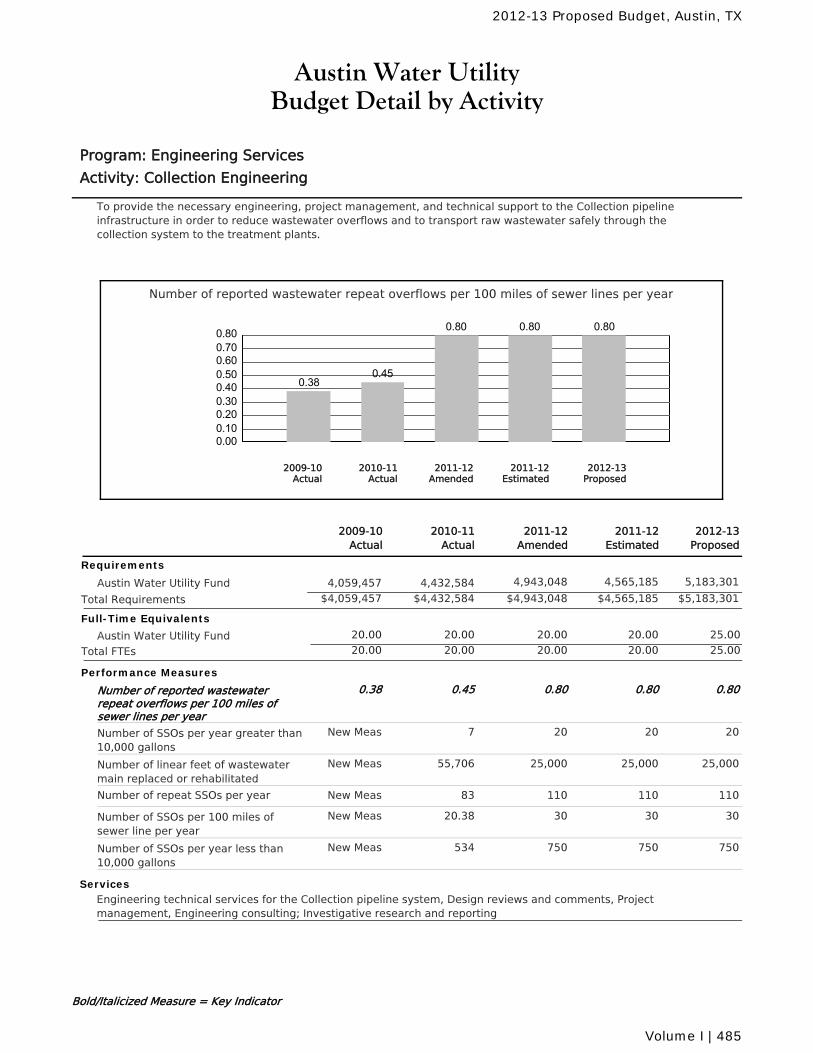
Austin Water UtilityBudget Detail by Activity
Program: Engineering Services
Activity: Collection Engineering
To provide the necessary engineering, project management, and technical support to the Collection pipelineinfrastructure in order to reduce wastewater overflows and to transport raw wastewater safely through thecollection system to the treatment plants.
Number of reported wastewater repeat overflows per 100 miles of sewer lines per year
0.000.100.200.300.400.500.600.700.80
0.380.45
0.80 0.80 0.80
2010-11Actual
2012-13Proposed
2011-12Amended
2011-12Estimated
2009-10Actual
2011-12Amended
2010-11Actual
2011-12Estimated
2012-13Proposed
2009-10Actual
Requirements
Austin Water Utility Fund 4,943,048 4,565,185 5,183,3014,432,5844,059,457
$4,943,048 $4,565,185 $5,183,301Total Requirements $4,432,584$4,059,457
Full-Time Equivalents
Austin Water Utility Fund 20.00 20.00 20.00 25.0020.00
Total FTEs 20.00 20.00 20.00 25.0020.00
Performance Measures
Number of reported wastewaterrepeat overflows per 100 miles ofsewer lines per year
0.800.45 0.80 0.800.38
Number of SSOs per year greater than10,000 gallons
207 20 20New Meas
Number of linear feet of wastewatermain replaced or rehabilitated
25,00055,706 25,000 25,000New Meas
Number of repeat SSOs per year 11083 110 110New Meas
Number of SSOs per 100 miles ofsewer line per year
3020.38 30 30New Meas
Number of SSOs per year less than10,000 gallons
750534 750 750New Meas
ServicesEngineering technical services for the Collection pipeline system, Design reviews and comments, Projectmanagement, Engineering consulting; Investigative research and reporting
Bold/Italicized Measure = Key Indicator
2012-13 Proposed Budget, Austin, TX
Volume I | 485
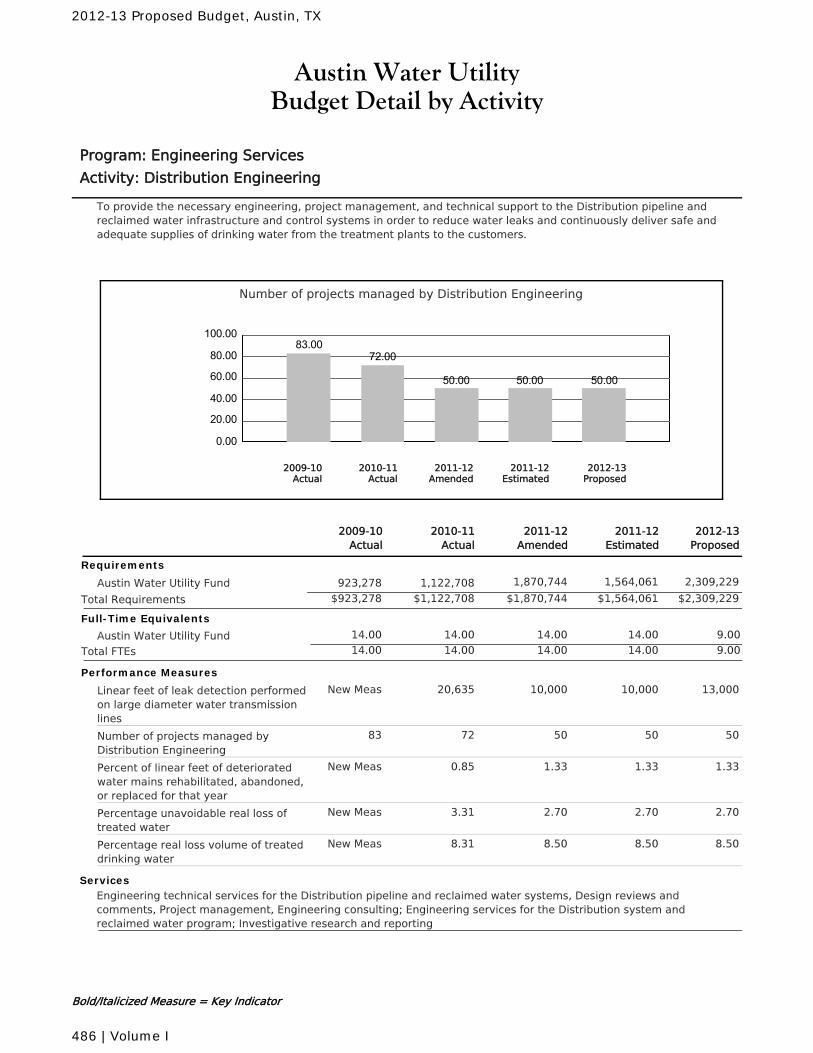
Austin Water UtilityBudget Detail by Activity
Program: Engineering Services
Activity: Distribution Engineering
To provide the necessary engineering, project management, and technical support to the Distribution pipeline andreclaimed water infrastructure and control systems in order to reduce water leaks and continuously deliver safe andadequate supplies of drinking water from the treatment plants to the customers.
Number of projects managed by Distribution Engineering
0.00
20.00
40.00
60.00
80.00
100.0083.00
72.00
50.00 50.00 50.00
2010-11Actual
2012-13Proposed
2011-12Amended
2011-12Estimated
2009-10Actual
2011-12Amended
2010-11Actual
2011-12Estimated
2012-13Proposed
2009-10Actual
Requirements
Austin Water Utility Fund 1,870,744 1,564,061 2,309,2291,122,708923,278
$1,870,744 $1,564,061 $2,309,229Total Requirements $1,122,708$923,278
Full-Time Equivalents
Austin Water Utility Fund 14.00 14.00 14.00 9.0014.00
Total FTEs 14.00 14.00 14.00 9.0014.00
Performance Measures
Linear feet of leak detection performedon large diameter water transmissionlines
10,00020,635 10,000 13,000New Meas
Number of projects managed byDistribution Engineering
5072 50 5083
Percent of linear feet of deterioratedwater mains rehabilitated, abandoned,or replaced for that year
1.330.85 1.33 1.33New Meas
Percentage unavoidable real loss oftreated water
2.703.31 2.70 2.70New Meas
Percentage real loss volume of treateddrinking water
8.508.31 8.50 8.50New Meas
ServicesEngineering technical services for the Distribution pipeline and reclaimed water systems, Design reviews andcomments, Project management, Engineering consulting; Engineering services for the Distribution system andreclaimed water program; Investigative research and reporting
Bold/Italicized Measure = Key Indicator
2012-13 Proposed Budget, Austin, TX
486 | Volume I
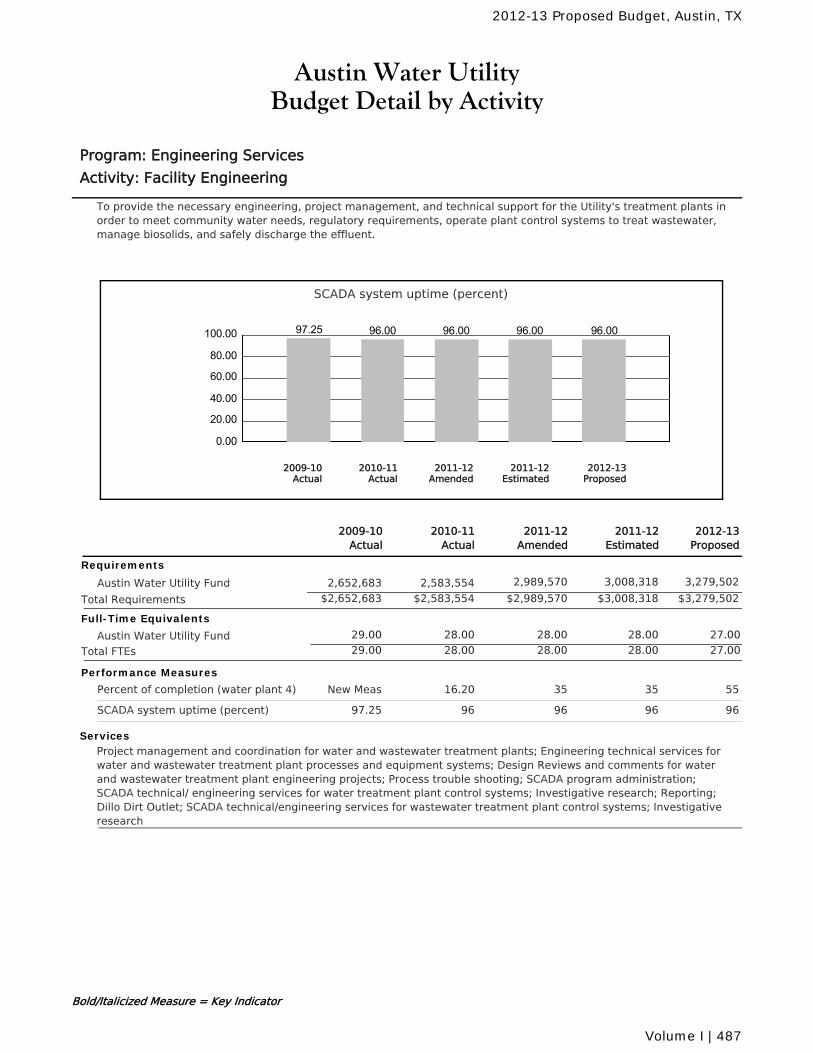
Austin Water UtilityBudget Detail by Activity
Program: Engineering Services
Activity: Facility Engineering
To provide the necessary engineering, project management, and technical support for the Utility's treatment plants inorder to meet community water needs, regulatory requirements, operate plant control systems to treat wastewater,manage biosolids, and safely discharge the effluent.
SCADA system uptime (percent)
0.00
20.00
40.00
60.00
80.00
100.00 97.25 96.00 96.00 96.00 96.00
2010-11Actual
2012-13Proposed
2011-12Amended
2011-12Estimated
2009-10Actual
2011-12Amended
2010-11Actual
2011-12Estimated
2012-13Proposed
2009-10Actual
Requirements
Austin Water Utility Fund 2,989,570 3,008,318 3,279,5022,583,5542,652,683
$2,989,570 $3,008,318 $3,279,502Total Requirements $2,583,554$2,652,683
Full-Time Equivalents
Austin Water Utility Fund 28.00 28.00 28.00 27.0029.00
Total FTEs 28.00 28.00 28.00 27.0029.00
Performance Measures
Percent of completion (water plant 4) 3516.20 35 55New Meas
SCADA system uptime (percent) 9696 96 9697.25
ServicesProject management and coordination for water and wastewater treatment plants; Engineering technical services forwater and wastewater treatment plant processes and equipment systems; Design Reviews and comments for waterand wastewater treatment plant engineering projects; Process trouble shooting; SCADA program administration;SCADA technical/ engineering services for water treatment plant control systems; Investigative research; Reporting;Dillo Dirt Outlet; SCADA technical/engineering services for wastewater treatment plant control systems; Investigativeresearch
Bold/Italicized Measure = Key Indicator
2012-13 Proposed Budget, Austin, TX
Volume I | 487
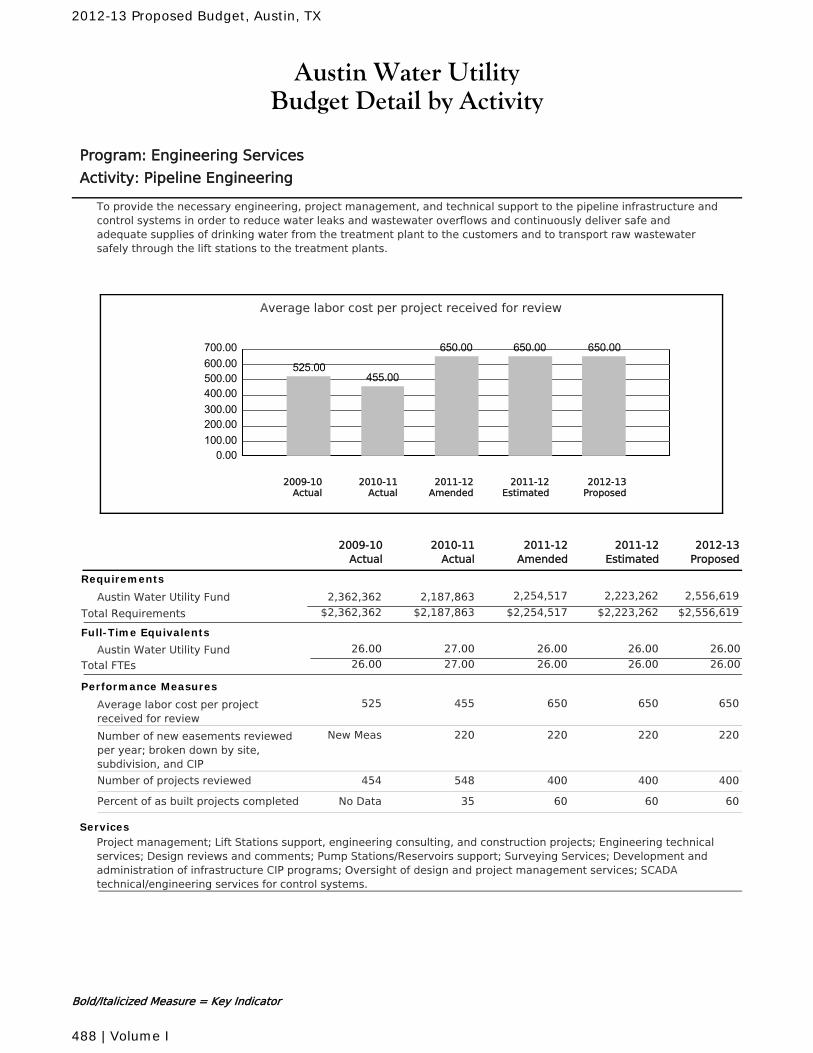
Austin Water UtilityBudget Detail by Activity
Program: Engineering Services
Activity: Pipeline Engineering
To provide the necessary engineering, project management, and technical support to the pipeline infrastructure andcontrol systems in order to reduce water leaks and wastewater overflows and continuously deliver safe andadequate supplies of drinking water from the treatment plant to the customers and to transport raw wastewatersafely through the lift stations to the treatment plants.
Average labor cost per project received for review
0.00100.00200.00300.00400.00500.00600.00700.00
525.00455.00
650.00 650.00 650.00
2010-11Actual
2012-13Proposed
2011-12Amended
2011-12Estimated
2009-10Actual
2011-12Amended
2010-11Actual
2011-12Estimated
2012-13Proposed
2009-10Actual
Requirements
Austin Water Utility Fund 2,254,517 2,223,262 2,556,6192,187,8632,362,362
$2,254,517 $2,223,262 $2,556,619Total Requirements $2,187,863$2,362,362
Full-Time Equivalents
Austin Water Utility Fund 27.00 26.00 26.00 26.0026.00
Total FTEs 27.00 26.00 26.00 26.0026.00
Performance Measures
Average labor cost per projectreceived for review
650455 650 650525
Number of new easements reviewedper year; broken down by site,subdivision, and CIP
220220 220 220New Meas
Number of projects reviewed 400548 400 400454
Percent of as built projects completed 6035 60 60No Data
ServicesProject management; Lift Stations support, engineering consulting, and construction projects; Engineering technicalservices; Design reviews and comments; Pump Stations/Reservoirs support; Surveying Services; Development andadministration of infrastructure CIP programs; Oversight of design and project management services; SCADAtechnical/engineering services for control systems.
Bold/Italicized Measure = Key Indicator
2012-13 Proposed Budget, Austin, TX
488 | Volume I
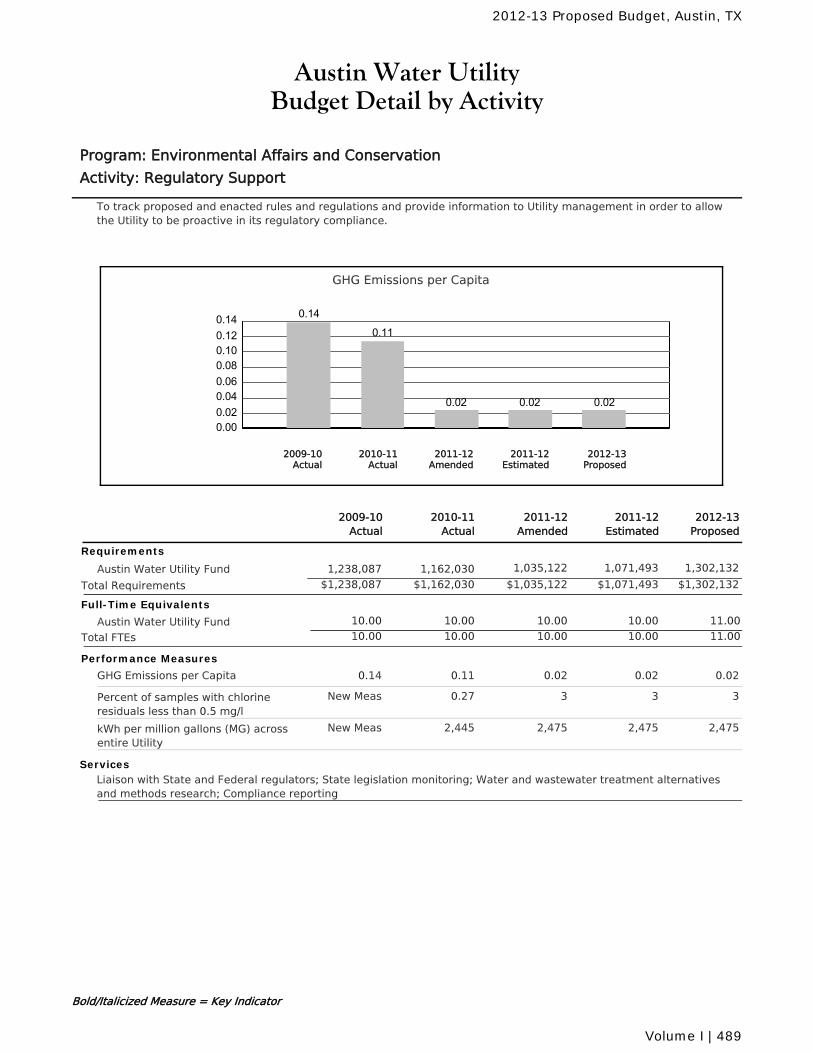
Austin Water UtilityBudget Detail by Activity
Program: Environmental Affairs and Conservation
Activity: Regulatory Support
To track proposed and enacted rules and regulations and provide information to Utility management in order to allowthe Utility to be proactive in its regulatory compliance.
GHG Emissions per Capita
0.000.020.040.060.080.100.120.14 0.14
0.11
0.02 0.02 0.02
2010-11Actual
2012-13Proposed
2011-12Amended
2011-12Estimated
2009-10Actual
2011-12Amended
2010-11Actual
2011-12Estimated
2012-13Proposed
2009-10Actual
Requirements
Austin Water Utility Fund 1,035,122 1,071,493 1,302,1321,162,0301,238,087
$1,035,122 $1,071,493 $1,302,132Total Requirements $1,162,030$1,238,087
Full-Time Equivalents
Austin Water Utility Fund 10.00 10.00 10.00 11.0010.00
Total FTEs 10.00 10.00 10.00 11.0010.00
Performance Measures
GHG Emissions per Capita 0.020.11 0.02 0.020.14
Percent of samples with chlorineresiduals less than 0.5 mg/l
30.27 3 3New Meas
kWh per million gallons (MG) acrossentire Utility
2,4752,445 2,475 2,475New Meas
ServicesLiaison with State and Federal regulators; State legislation monitoring; Water and wastewater treatment alternativesand methods research; Compliance reporting
Bold/Italicized Measure = Key Indicator
2012-13 Proposed Budget, Austin, TX
Volume I | 489
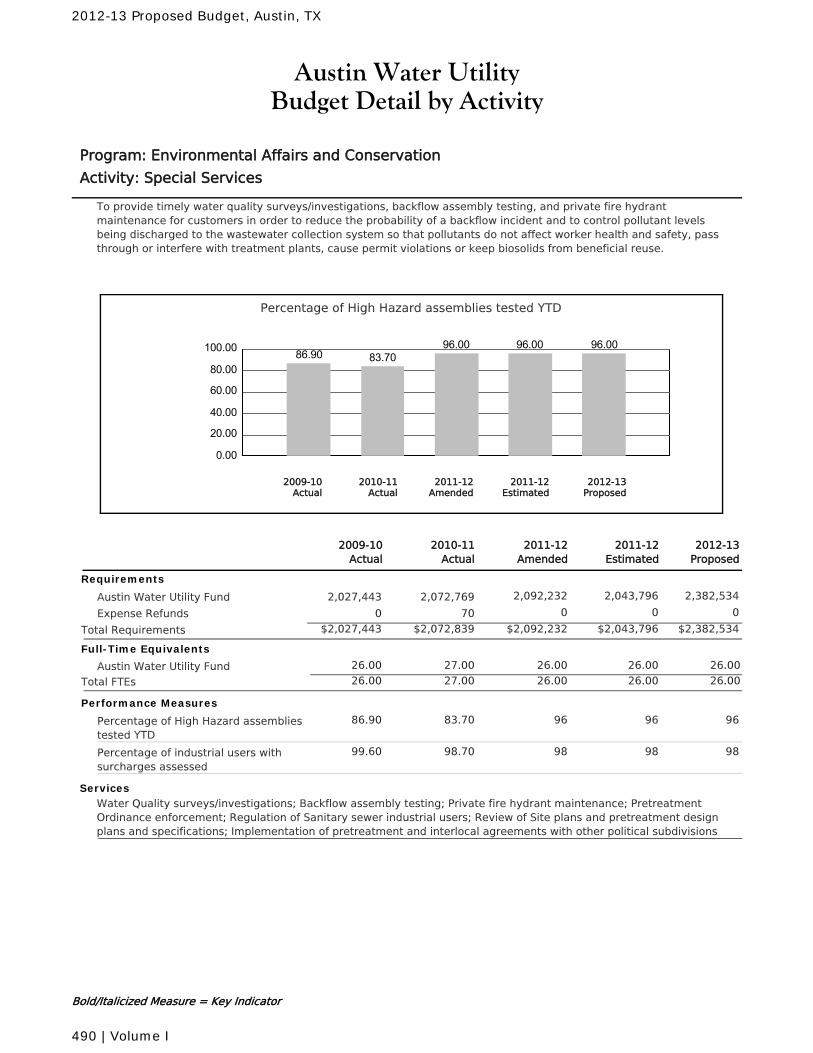
Austin Water UtilityBudget Detail by Activity
Program: Environmental Affairs and Conservation
Activity: Special Services
To provide timely water quality surveys/investigations, backflow assembly testing, and private fire hydrantmaintenance for customers in order to reduce the probability of a backflow incident and to control pollutant levelsbeing discharged to the wastewater collection system so that pollutants do not affect worker health and safety, passthrough or interfere with treatment plants, cause permit violations or keep biosolids from beneficial reuse.
Percentage of High Hazard assemblies tested YTD
0.00
20.00
40.00
60.00
80.00
100.00 86.90 83.7096.00 96.00 96.00
2010-11Actual
2012-13Proposed
2011-12Amended
2011-12Estimated
2009-10Actual
2011-12Amended
2010-11Actual
2011-12Estimated
2012-13Proposed
2009-10Actual
Requirements
Austin Water Utility Fund 2,092,232 2,043,796 2,382,5342,072,7692,027,443
Expense Refunds 0 0 0700
$2,092,232 $2,043,796 $2,382,534Total Requirements $2,072,839$2,027,443
Full-Time Equivalents
Austin Water Utility Fund 27.00 26.00 26.00 26.0026.00
Total FTEs 27.00 26.00 26.00 26.0026.00
Performance Measures
Percentage of High Hazard assembliestested YTD
9683.70 96 9686.90
Percentage of industrial users withsurcharges assessed
9898.70 98 9899.60
ServicesWater Quality surveys/investigations; Backflow assembly testing; Private fire hydrant maintenance; PretreatmentOrdinance enforcement; Regulation of Sanitary sewer industrial users; Review of Site plans and pretreatment designplans and specifications; Implementation of pretreatment and interlocal agreements with other political subdivisions
Bold/Italicized Measure = Key Indicator
2012-13 Proposed Budget, Austin, TX
490 | Volume I
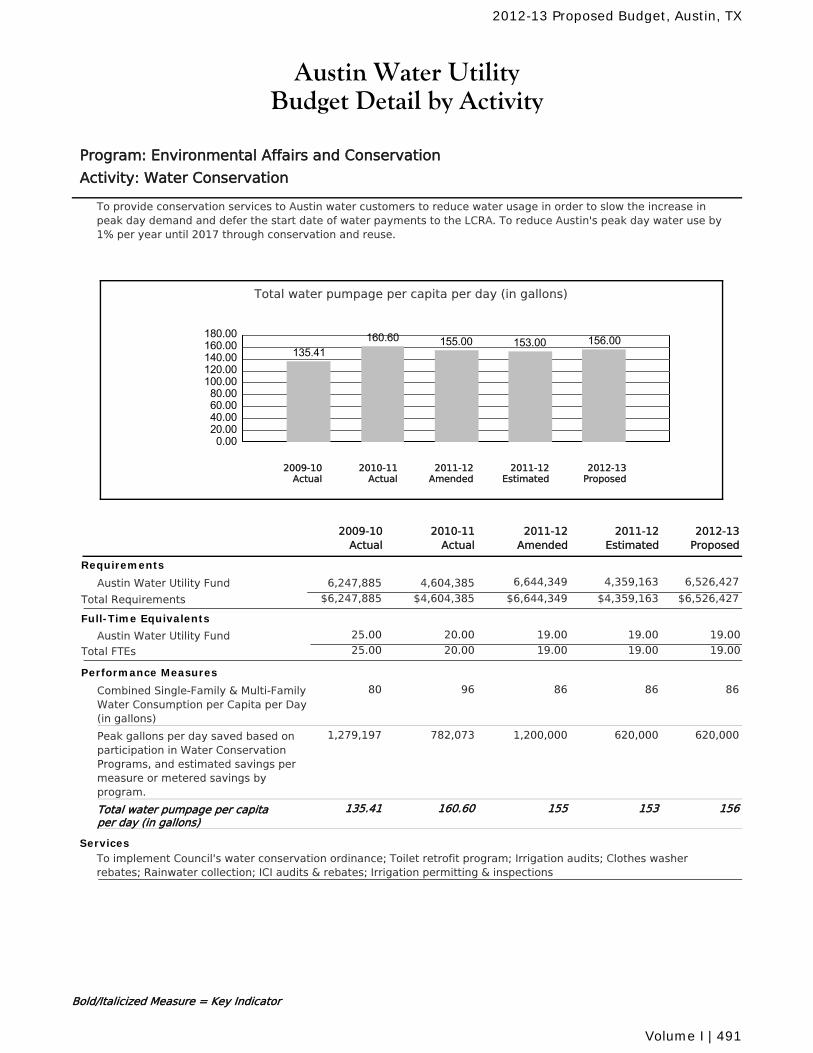
Austin Water UtilityBudget Detail by Activity
Program: Environmental Affairs and Conservation
Activity: Water Conservation
To provide conservation services to Austin water customers to reduce water usage in order to slow the increase inpeak day demand and defer the start date of water payments to the LCRA. To reduce Austin's peak day water use by1% per year until 2017 through conservation and reuse.
Total water pumpage per capita per day (in gallons)
0.0020.0040.0060.0080.00
100.00120.00140.00160.00180.00
135.41160.60 155.00 153.00 156.00
2010-11Actual
2012-13Proposed
2011-12Amended
2011-12Estimated
2009-10Actual
2011-12Amended
2010-11Actual
2011-12Estimated
2012-13Proposed
2009-10Actual
Requirements
Austin Water Utility Fund 6,644,349 4,359,163 6,526,4274,604,3856,247,885
$6,644,349 $4,359,163 $6,526,427Total Requirements $4,604,385$6,247,885
Full-Time Equivalents
Austin Water Utility Fund 20.00 19.00 19.00 19.0025.00
Total FTEs 20.00 19.00 19.00 19.0025.00
Performance Measures
Combined Single-Family & Multi-FamilyWater Consumption per Capita per Day(in gallons)
8696 86 8680
Peak gallons per day saved based onparticipation in Water ConservationPrograms, and estimated savings permeasure or metered savings byprogram.
1,200,000782,073 620,000 620,0001,279,197
Total water pumpage per capitaper day (in gallons)
155160.60 153 156135.41
ServicesTo implement Council's water conservation ordinance; Toilet retrofit program; Irrigation audits; Clothes washerrebates; Rainwater collection; ICI audits & rebates; Irrigation permitting & inspections
Bold/Italicized Measure = Key Indicator
2012-13 Proposed Budget, Austin, TX
Volume I | 491
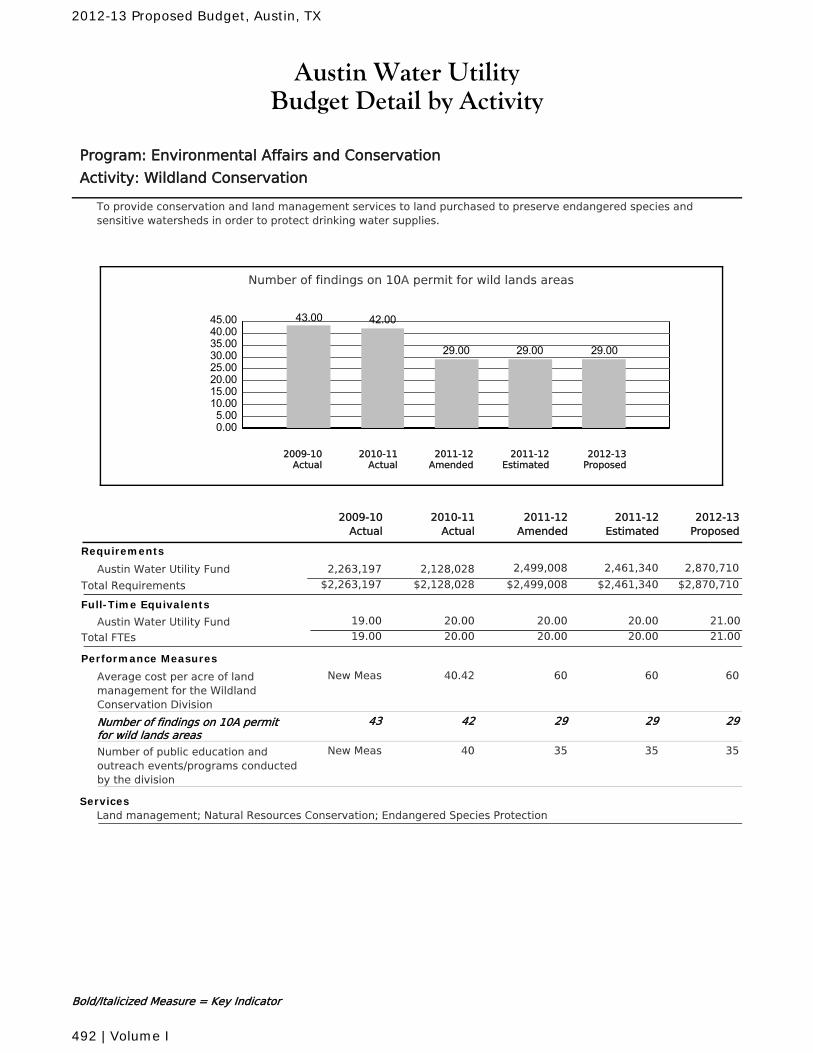
Austin Water UtilityBudget Detail by Activity
Program: Environmental Affairs and Conservation
Activity: Wildland Conservation
To provide conservation and land management services to land purchased to preserve endangered species andsensitive watersheds in order to protect drinking water supplies.
Number of findings on 10A permit for wild lands areas
0.005.00
10.0015.0020.0025.0030.0035.0040.0045.00 43.00 42.00
29.00 29.00 29.00
2010-11Actual
2012-13Proposed
2011-12Amended
2011-12Estimated
2009-10Actual
2011-12Amended
2010-11Actual
2011-12Estimated
2012-13Proposed
2009-10Actual
Requirements
Austin Water Utility Fund 2,499,008 2,461,340 2,870,7102,128,0282,263,197
$2,499,008 $2,461,340 $2,870,710Total Requirements $2,128,028$2,263,197
Full-Time Equivalents
Austin Water Utility Fund 20.00 20.00 20.00 21.0019.00
Total FTEs 20.00 20.00 20.00 21.0019.00
Performance Measures
Average cost per acre of landmanagement for the WildlandConservation Division
6040.42 60 60New Meas
Number of findings on 10A permitfor wild lands areas
2942 29 2943
Number of public education andoutreach events/programs conductedby the division
3540 35 35New Meas
ServicesLand management; Natural Resources Conservation; Endangered Species Protection
Bold/Italicized Measure = Key Indicator
2012-13 Proposed Budget, Austin, TX
492 | Volume I
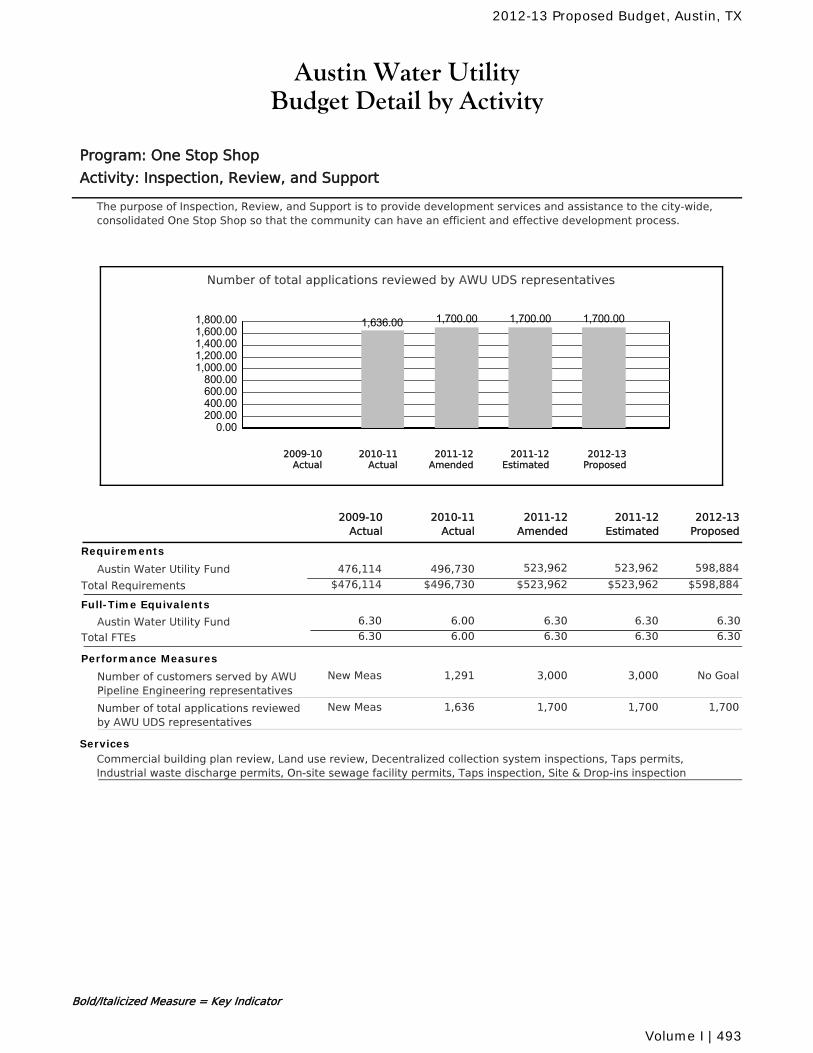
Austin Water UtilityBudget Detail by Activity
Program: One Stop Shop
Activity: Inspection, Review, and Support
The purpose of Inspection, Review, and Support is to provide development services and assistance to the city-wide,consolidated One Stop Shop so that the community can have an efficient and effective development process.
Number of total applications reviewed by AWU UDS representatives
0.00200.00400.00600.00800.00
1,000.001,200.001,400.001,600.001,800.00 1,636.00 1,700.00 1,700.00 1,700.00
2010-11Actual
2012-13Proposed
2011-12Amended
2011-12Estimated
2009-10Actual
2011-12Amended
2010-11Actual
2011-12Estimated
2012-13Proposed
2009-10Actual
Requirements
Austin Water Utility Fund 523,962 523,962 598,884496,730476,114
$523,962 $523,962 $598,884Total Requirements $496,730$476,114
Full-Time Equivalents
Austin Water Utility Fund 6.00 6.30 6.30 6.306.30
Total FTEs 6.00 6.30 6.30 6.306.30
Performance Measures
Number of customers served by AWUPipeline Engineering representatives
3,0001,291 3,000 No GoalNew Meas
Number of total applications reviewedby AWU UDS representatives
1,7001,636 1,700 1,700New Meas
ServicesCommercial building plan review, Land use review, Decentralized collection system inspections, Taps permits,Industrial waste discharge permits, On-site sewage facility permits, Taps inspection, Site & Drop-ins inspection
Bold/Italicized Measure = Key Indicator
2012-13 Proposed Budget, Austin, TX
Volume I | 493
woodp
Cross-Out
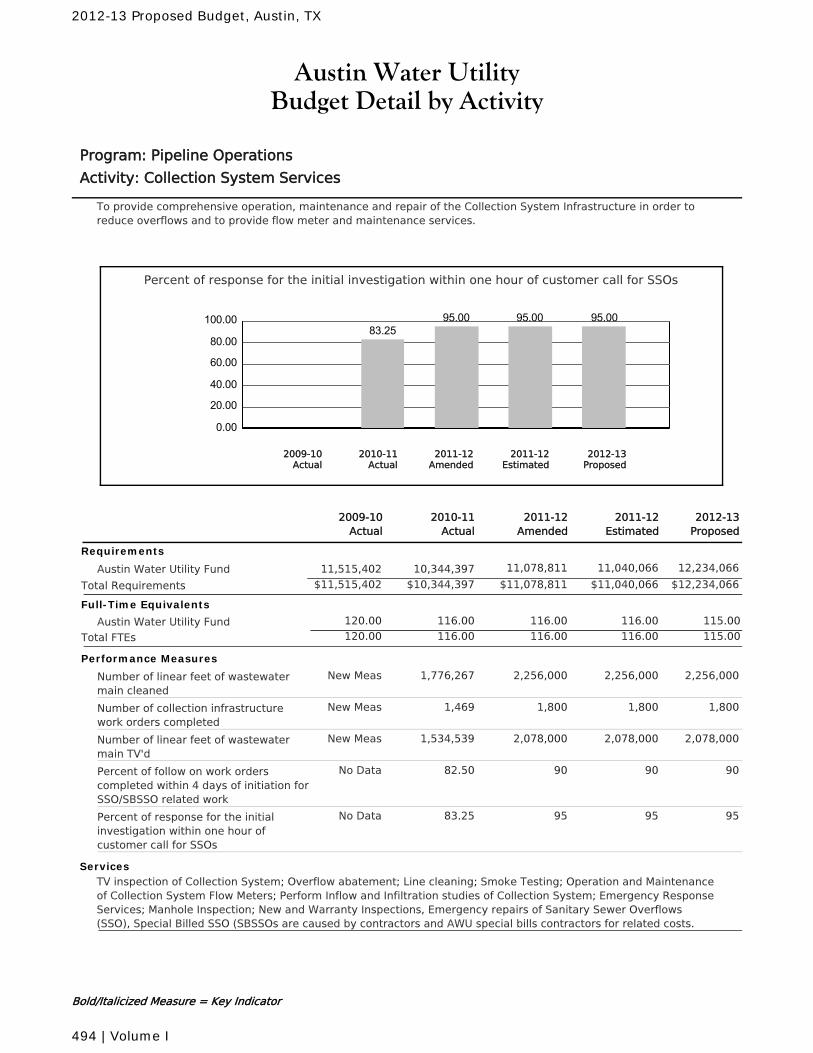
Austin Water UtilityBudget Detail by Activity
Program: Pipeline Operations
Activity: Collection System Services
To provide comprehensive operation, maintenance and repair of the Collection System Infrastructure in order toreduce overflows and to provide flow meter and maintenance services.
Percent of response for the initial investigation within one hour of customer call for SSOs
0.00
20.00
40.00
60.00
80.00
100.0083.25
95.00 95.00 95.00
2010-11Actual
2012-13Proposed
2011-12Amended
2011-12Estimated
2009-10Actual
2011-12Amended
2010-11Actual
2011-12Estimated
2012-13Proposed
2009-10Actual
Requirements
Austin Water Utility Fund 11,078,811 11,040,066 12,234,06610,344,39711,515,402
$11,078,811 $11,040,066 $12,234,066Total Requirements $10,344,397$11,515,402
Full-Time Equivalents
Austin Water Utility Fund 116.00 116.00 116.00 115.00120.00
Total FTEs 116.00 116.00 116.00 115.00120.00
Performance Measures
Number of linear feet of wastewatermain cleaned
2,256,0001,776,267 2,256,000 2,256,000New Meas
Number of collection infrastructurework orders completed
1,8001,469 1,800 1,800New Meas
Number of linear feet of wastewatermain TV'd
2,078,0001,534,539 2,078,000 2,078,000New Meas
Percent of follow on work orderscompleted within 4 days of initiation forSSO/SBSSO related work
9082.50 90 90No Data
Percent of response for the initialinvestigation within one hour ofcustomer call for SSOs
9583.25 95 95No Data
ServicesTV inspection of Collection System; Overflow abatement; Line cleaning; Smoke Testing; Operation and Maintenanceof Collection System Flow Meters; Perform Inflow and Infiltration studies of Collection System; Emergency ResponseServices; Manhole Inspection; New and Warranty Inspections, Emergency repairs of Sanitary Sewer Overflows(SSO), Special Billed SSO (SBSSOs are caused by contractors and AWU special bills contractors for related costs.
Bold/Italicized Measure = Key Indicator
2012-13 Proposed Budget, Austin, TX
494 | Volume I
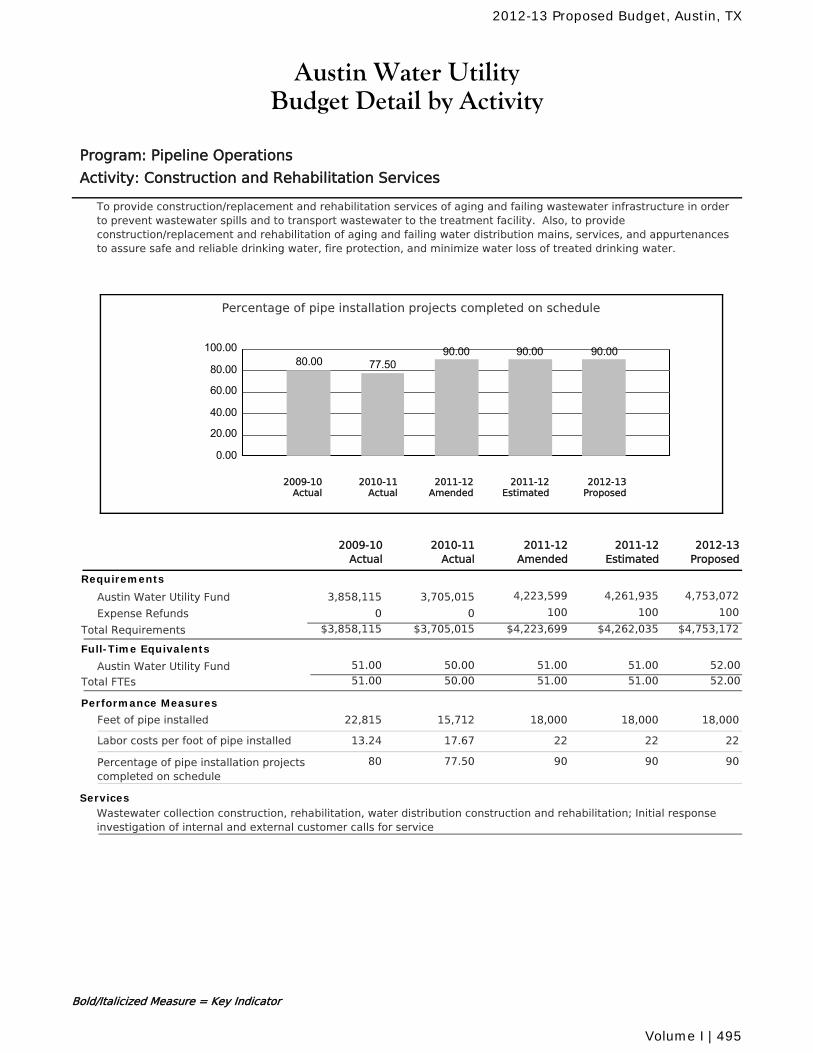
Austin Water UtilityBudget Detail by Activity
Program: Pipeline Operations
Activity: Construction and Rehabilitation Services
To provide construction/replacement and rehabilitation services of aging and failing wastewater infrastructure in orderto prevent wastewater spills and to transport wastewater to the treatment facility. Also, to provideconstruction/replacement and rehabilitation of aging and failing water distribution mains, services, and appurtenancesto assure safe and reliable drinking water, fire protection, and minimize water loss of treated drinking water.
Percentage of pipe installation projects completed on schedule
0.00
20.00
40.00
60.00
80.00
100.0080.00 77.50
90.00 90.00 90.00
2010-11Actual
2012-13Proposed
2011-12Amended
2011-12Estimated
2009-10Actual
2011-12Amended
2010-11Actual
2011-12Estimated
2012-13Proposed
2009-10Actual
Requirements
Austin Water Utility Fund 4,223,599 4,261,935 4,753,0723,705,0153,858,115
Expense Refunds 100 100 10000
$4,223,699 $4,262,035 $4,753,172Total Requirements $3,705,015$3,858,115
Full-Time Equivalents
Austin Water Utility Fund 50.00 51.00 51.00 52.0051.00
Total FTEs 50.00 51.00 51.00 52.0051.00
Performance Measures
Feet of pipe installed 18,00015,712 18,000 18,00022,815
Labor costs per foot of pipe installed 2217.67 22 2213.24
Percentage of pipe installation projectscompleted on schedule
9077.50 90 9080
ServicesWastewater collection construction, rehabilitation, water distribution construction and rehabilitation; Initial responseinvestigation of internal and external customer calls for service
Bold/Italicized Measure = Key Indicator
2012-13 Proposed Budget, Austin, TX
Volume I | 495
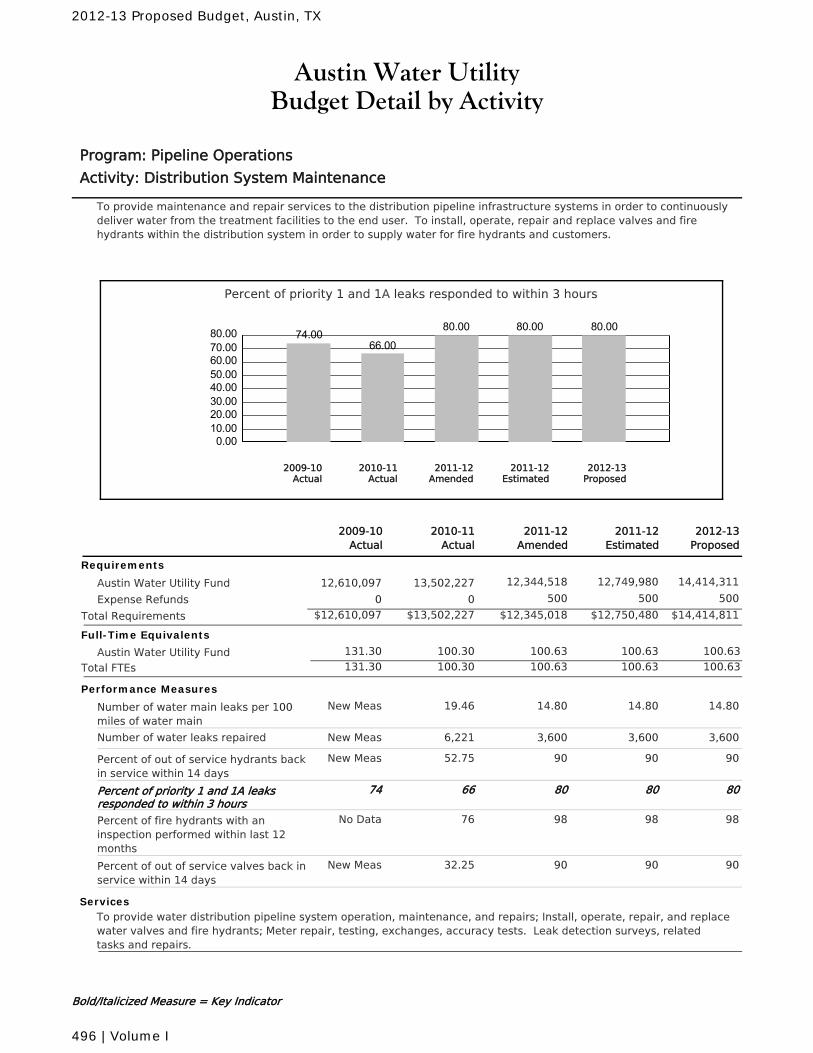
Austin Water UtilityBudget Detail by Activity
Program: Pipeline Operations
Activity: Distribution System Maintenance
To provide maintenance and repair services to the distribution pipeline infrastructure systems in order to continuouslydeliver water from the treatment facilities to the end user. To install, operate, repair and replace valves and firehydrants within the distribution system in order to supply water for fire hydrants and customers.
Percent of priority 1 and 1A leaks responded to within 3 hours
0.0010.0020.0030.0040.0050.0060.0070.0080.00 74.00
66.00
80.00 80.00 80.00
2010-11Actual
2012-13Proposed
2011-12Amended
2011-12Estimated
2009-10Actual
2011-12Amended
2010-11Actual
2011-12Estimated
2012-13Proposed
2009-10Actual
Requirements
Austin Water Utility Fund 12,344,518 12,749,980 14,414,31113,502,22712,610,097
Expense Refunds 500 500 50000
$12,345,018 $12,750,480 $14,414,811Total Requirements $13,502,227$12,610,097
Full-Time Equivalents
Austin Water Utility Fund 100.30 100.63 100.63 100.63131.30
Total FTEs 100.30 100.63 100.63 100.63131.30
Performance Measures
Number of water main leaks per 100miles of water main
14.8019.46 14.80 14.80New Meas
Number of water leaks repaired 3,6006,221 3,600 3,600New Meas
Percent of out of service hydrants backin service within 14 days
9052.75 90 90New Meas
Percent of priority 1 and 1A leaksresponded to within 3 hours
8066 80 8074
Percent of fire hydrants with aninspection performed within last 12months
9876 98 98No Data
Percent of out of service valves back inservice within 14 days
9032.25 90 90New Meas
ServicesTo provide water distribution pipeline system operation, maintenance, and repairs; Install, operate, repair, and replacewater valves and fire hydrants; Meter repair, testing, exchanges, accuracy tests. Leak detection surveys, relatedtasks and repairs.
Bold/Italicized Measure = Key Indicator
2012-13 Proposed Budget, Austin, TX
496 | Volume I
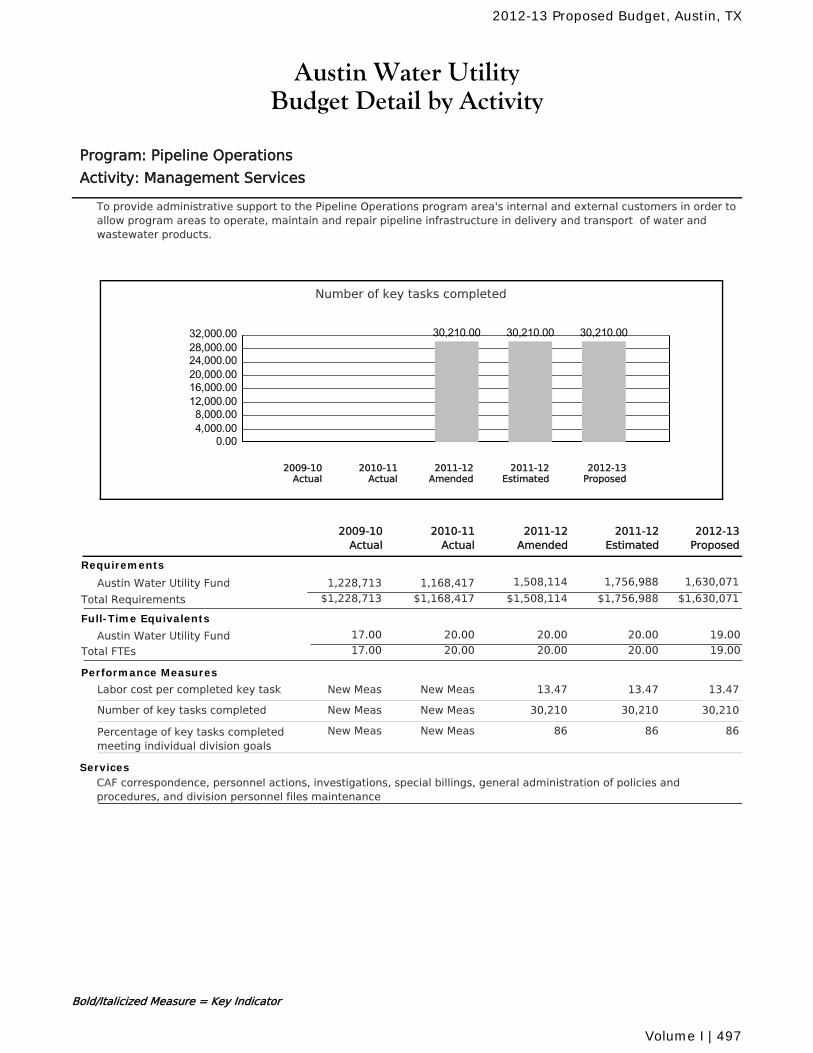
Austin Water UtilityBudget Detail by Activity
Program: Pipeline Operations
Activity: Management Services
To provide administrative support to the Pipeline Operations program area's internal and external customers in order toallow program areas to operate, maintain and repair pipeline infrastructure in delivery and transport of water andwastewater products.
Number of key tasks completed
0.004,000.008,000.00
12,000.0016,000.0020,000.0024,000.0028,000.0032,000.00 30,210.00 30,210.00 30,210.00
2010-11Actual
2012-13Proposed
2011-12Amended
2011-12Estimated
2009-10Actual
2011-12Amended
2010-11Actual
2011-12Estimated
2012-13Proposed
2009-10Actual
Requirements
Austin Water Utility Fund 1,508,114 1,756,988 1,630,0711,168,4171,228,713
$1,508,114 $1,756,988 $1,630,071Total Requirements $1,168,417$1,228,713
Full-Time Equivalents
Austin Water Utility Fund 20.00 20.00 20.00 19.0017.00
Total FTEs 20.00 20.00 20.00 19.0017.00
Performance Measures
Labor cost per completed key task 13.47New Meas 13.47 13.47New Meas
Number of key tasks completed 30,210New Meas 30,210 30,210New Meas
Percentage of key tasks completedmeeting individual division goals
86New Meas 86 86New Meas
ServicesCAF correspondence, personnel actions, investigations, special billings, general administration of policies andprocedures, and division personnel files maintenance
Bold/Italicized Measure = Key Indicator
2012-13 Proposed Budget, Austin, TX
Volume I | 497
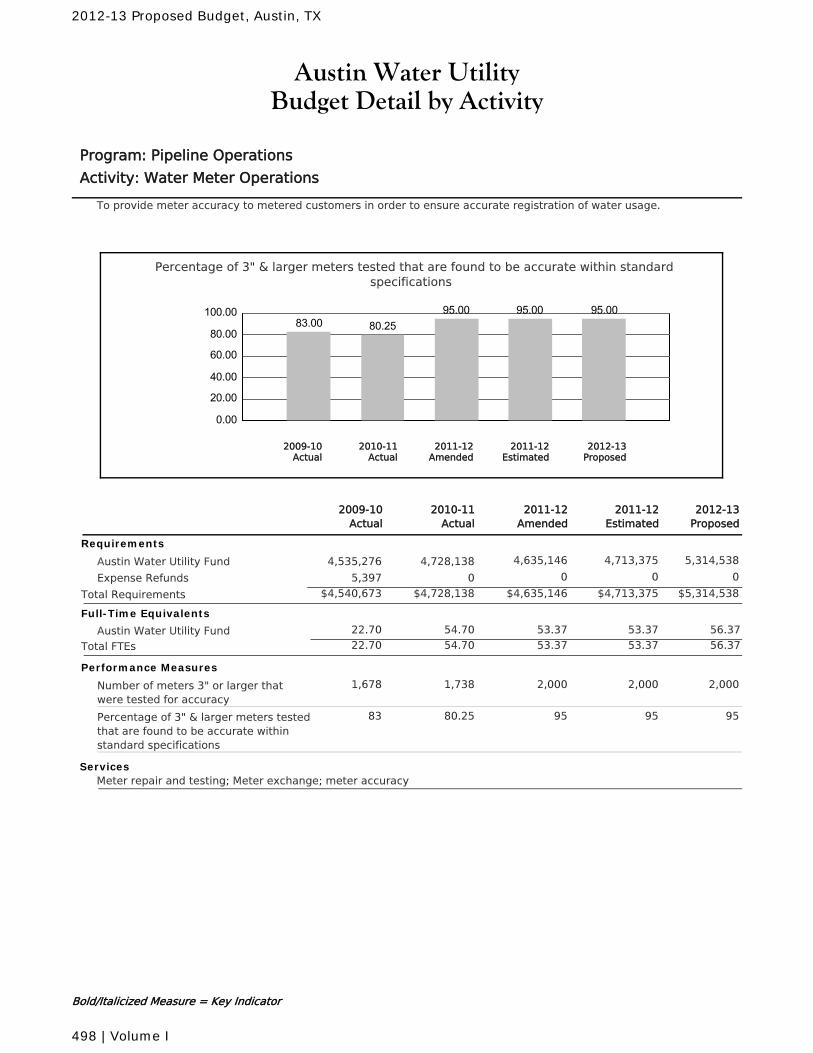
Austin Water UtilityBudget Detail by Activity
Program: Pipeline Operations
Activity: Water Meter Operations
To provide meter accuracy to metered customers in order to ensure accurate registration of water usage.
Percentage of 3" & larger meters tested that are found to be accurate within standardspecifications
0.00
20.00
40.00
60.00
80.00
100.0083.00 80.25
95.00 95.00 95.00
2010-11Actual
2012-13Proposed
2011-12Amended
2011-12Estimated
2009-10Actual
2011-12Amended
2010-11Actual
2011-12Estimated
2012-13Proposed
2009-10Actual
Requirements
Austin Water Utility Fund 4,635,146 4,713,375 5,314,5384,728,1384,535,276
Expense Refunds 0 0 005,397
$4,635,146 $4,713,375 $5,314,538Total Requirements $4,728,138$4,540,673
Full-Time Equivalents
Austin Water Utility Fund 54.70 53.37 53.37 56.3722.70
Total FTEs 54.70 53.37 53.37 56.3722.70
Performance Measures
Number of meters 3" or larger thatwere tested for accuracy
2,0001,738 2,000 2,0001,678
Percentage of 3" & larger meters testedthat are found to be accurate withinstandard specifications
9580.25 95 9583
ServicesMeter repair and testing; Meter exchange; meter accuracy
Bold/Italicized Measure = Key Indicator
2012-13 Proposed Budget, Austin, TX
498 | Volume I
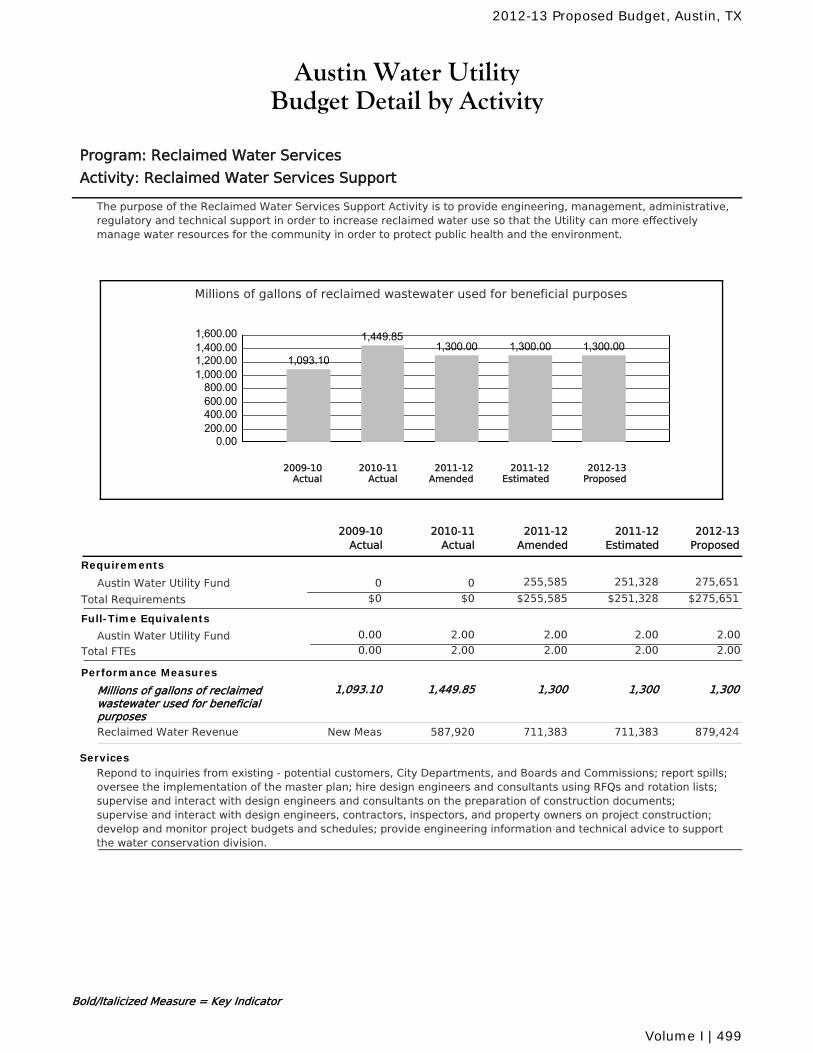
Austin Water UtilityBudget Detail by Activity
Program: Reclaimed Water Services
Activity: Reclaimed Water Services Support
The purpose of the Reclaimed Water Services Support Activity is to provide engineering, management, administrative,regulatory and technical support in order to increase reclaimed water use so that the Utility can more effectivelymanage water resources for the community in order to protect public health and the environment.
Millions of gallons of reclaimed wastewater used for beneficial purposes
0.00200.00400.00600.00800.00
1,000.001,200.001,400.001,600.00
1,093.10
1,449.851,300.00 1,300.00 1,300.00
2010-11Actual
2012-13Proposed
2011-12Amended
2011-12Estimated
2009-10Actual
2011-12Amended
2010-11Actual
2011-12Estimated
2012-13Proposed
2009-10Actual
Requirements
Austin Water Utility Fund 255,585 251,328 275,65100
$255,585 $251,328 $275,651Total Requirements $0$0
Full-Time Equivalents
Austin Water Utility Fund 2.00 2.00 2.00 2.000.00
Total FTEs 2.00 2.00 2.00 2.000.00
Performance Measures
Millions of gallons of reclaimedwastewater used for beneficialpurposes
1,3001,449.85 1,300 1,3001,093.10
Reclaimed Water Revenue 711,383587,920 711,383 879,424New Meas
ServicesRepond to inquiries from existing - potential customers, City Departments, and Boards and Commissions; report spills;oversee the implementation of the master plan; hire design engineers and consultants using RFQs and rotation lists;supervise and interact with design engineers and consultants on the preparation of construction documents;supervise and interact with design engineers, contractors, inspectors, and property owners on project construction;develop and monitor project budgets and schedules; provide engineering information and technical advice to supportthe water conservation division.
Bold/Italicized Measure = Key Indicator
2012-13 Proposed Budget, Austin, TX
Volume I | 499
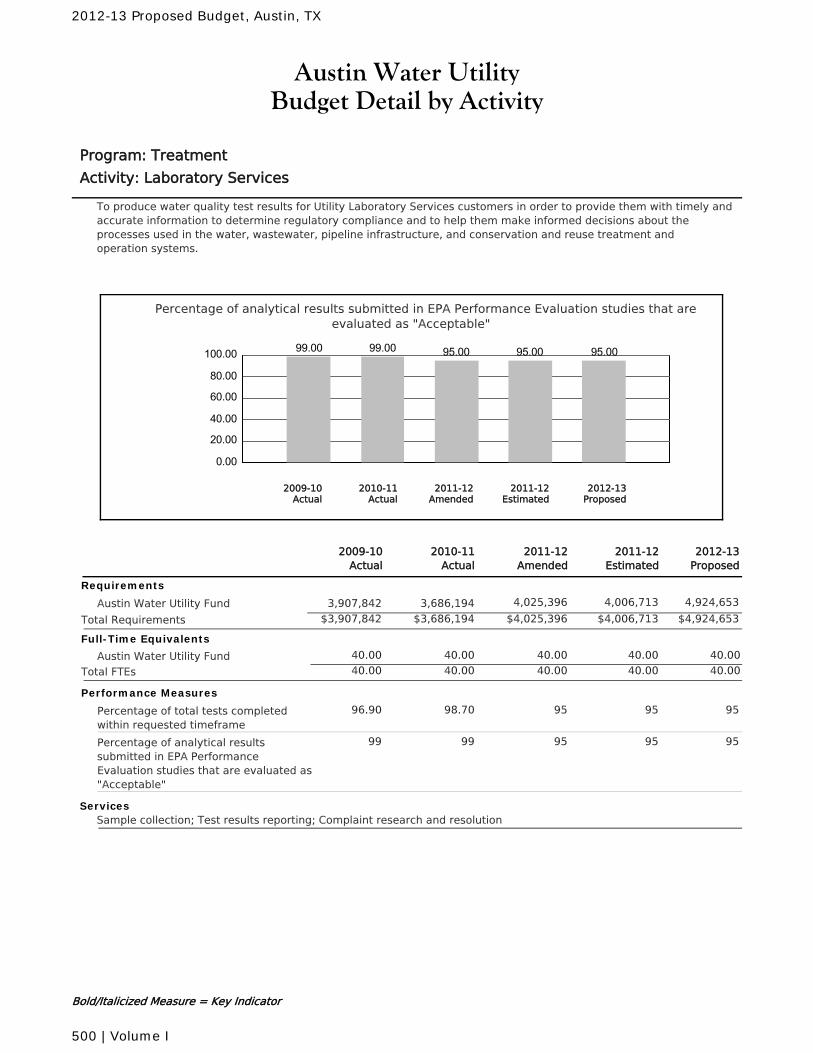
Austin Water UtilityBudget Detail by Activity
Program: Treatment
Activity: Laboratory Services
To produce water quality test results for Utility Laboratory Services customers in order to provide them with timely andaccurate information to determine regulatory compliance and to help them make informed decisions about theprocesses used in the water, wastewater, pipeline infrastructure, and conservation and reuse treatment andoperation systems.
Percentage of analytical results submitted in EPA Performance Evaluation studies that areevaluated as "Acceptable"
0.00
20.00
40.00
60.00
80.00
100.00 99.00 99.00 95.00 95.00 95.00
2010-11Actual
2012-13Proposed
2011-12Amended
2011-12Estimated
2009-10Actual
2011-12Amended
2010-11Actual
2011-12Estimated
2012-13Proposed
2009-10Actual
Requirements
Austin Water Utility Fund 4,025,396 4,006,713 4,924,6533,686,1943,907,842
$4,025,396 $4,006,713 $4,924,653Total Requirements $3,686,194$3,907,842
Full-Time Equivalents
Austin Water Utility Fund 40.00 40.00 40.00 40.0040.00
Total FTEs 40.00 40.00 40.00 40.0040.00
Performance Measures
Percentage of total tests completedwithin requested timeframe
9598.70 95 9596.90
Percentage of analytical resultssubmitted in EPA PerformanceEvaluation studies that are evaluated as"Acceptable"
9599 95 9599
ServicesSample collection; Test results reporting; Complaint research and resolution
Bold/Italicized Measure = Key Indicator
2012-13 Proposed Budget, Austin, TX
500 | Volume I
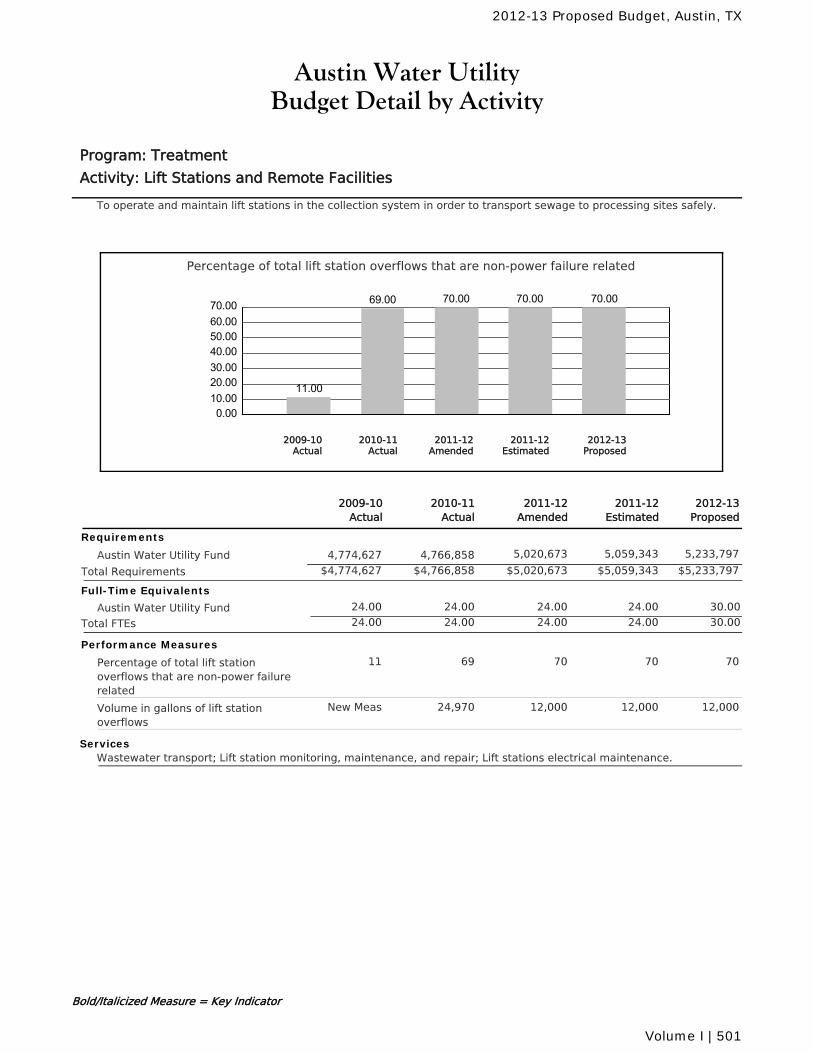
Austin Water UtilityBudget Detail by Activity
Program: Treatment
Activity: Lift Stations and Remote Facilities
To operate and maintain lift stations in the collection system in order to transport sewage to processing sites safely.
Percentage of total lift station overflows that are non-power failure related
0.0010.0020.0030.0040.0050.0060.0070.00
11.00
69.00 70.00 70.00 70.00
2010-11Actual
2012-13Proposed
2011-12Amended
2011-12Estimated
2009-10Actual
2011-12Amended
2010-11Actual
2011-12Estimated
2012-13Proposed
2009-10Actual
Requirements
Austin Water Utility Fund 5,020,673 5,059,343 5,233,7974,766,8584,774,627
$5,020,673 $5,059,343 $5,233,797Total Requirements $4,766,858$4,774,627
Full-Time Equivalents
Austin Water Utility Fund 24.00 24.00 24.00 30.0024.00
Total FTEs 24.00 24.00 24.00 30.0024.00
Performance Measures
Percentage of total lift stationoverflows that are non-power failurerelated
7069 70 7011
Volume in gallons of lift stationoverflows
12,00024,970 12,000 12,000New Meas
ServicesWastewater transport; Lift station monitoring, maintenance, and repair; Lift stations electrical maintenance.
Bold/Italicized Measure = Key Indicator
2012-13 Proposed Budget, Austin, TX
Volume I | 501
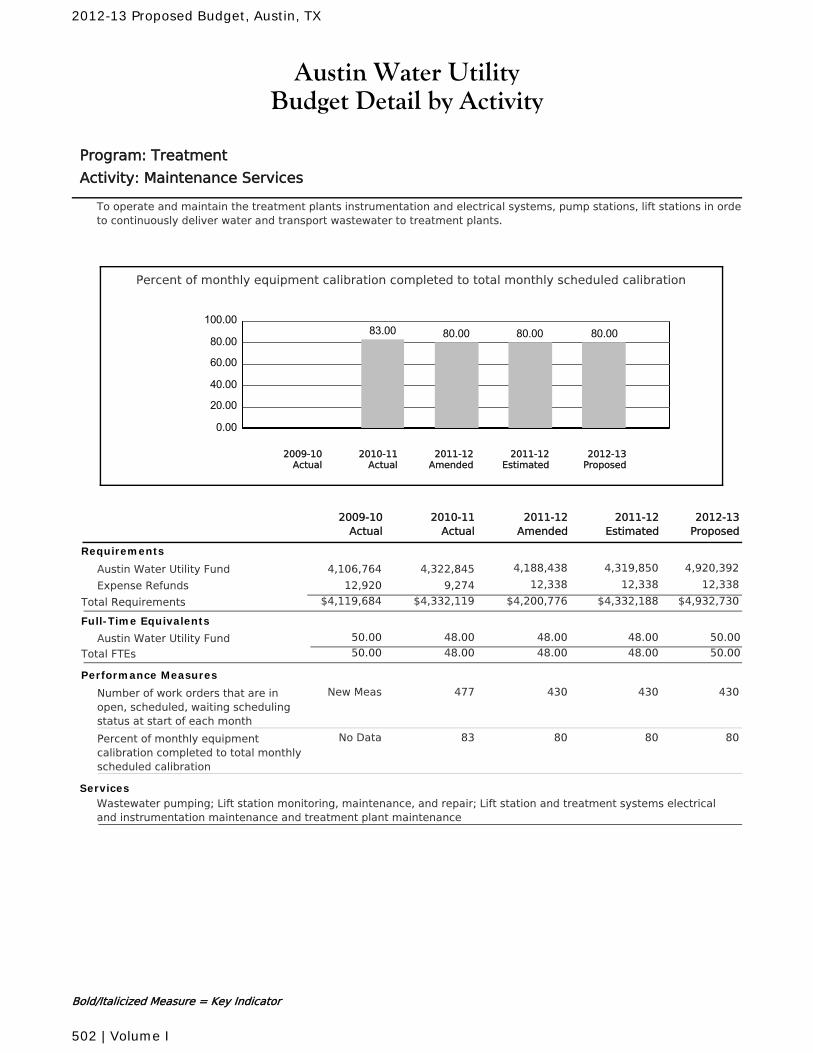
Austin Water UtilityBudget Detail by Activity
Program: Treatment
Activity: Maintenance Services
To operate and maintain the treatment plants instrumentation and electrical systems, pump stations, lift stations in ordeto continuously deliver water and transport wastewater to treatment plants.
Percent of monthly equipment calibration completed to total monthly scheduled calibration
0.00
20.00
40.00
60.00
80.00
100.0083.00 80.00 80.00 80.00
2010-11Actual
2012-13Proposed
2011-12Amended
2011-12Estimated
2009-10Actual
2011-12Amended
2010-11Actual
2011-12Estimated
2012-13Proposed
2009-10Actual
Requirements
Austin Water Utility Fund 4,188,438 4,319,850 4,920,3924,322,8454,106,764
Expense Refunds 12,338 12,338 12,3389,27412,920
$4,200,776 $4,332,188 $4,932,730Total Requirements $4,332,119$4,119,684
Full-Time Equivalents
Austin Water Utility Fund 48.00 48.00 48.00 50.0050.00
Total FTEs 48.00 48.00 48.00 50.0050.00
Performance Measures
Number of work orders that are inopen, scheduled, waiting schedulingstatus at start of each month
430477 430 430New Meas
Percent of monthly equipmentcalibration completed to total monthlyscheduled calibration
8083 80 80No Data
ServicesWastewater pumping; Lift station monitoring, maintenance, and repair; Lift station and treatment systems electricaland instrumentation maintenance and treatment plant maintenance
Bold/Italicized Measure = Key Indicator
2012-13 Proposed Budget, Austin, TX
502 | Volume I
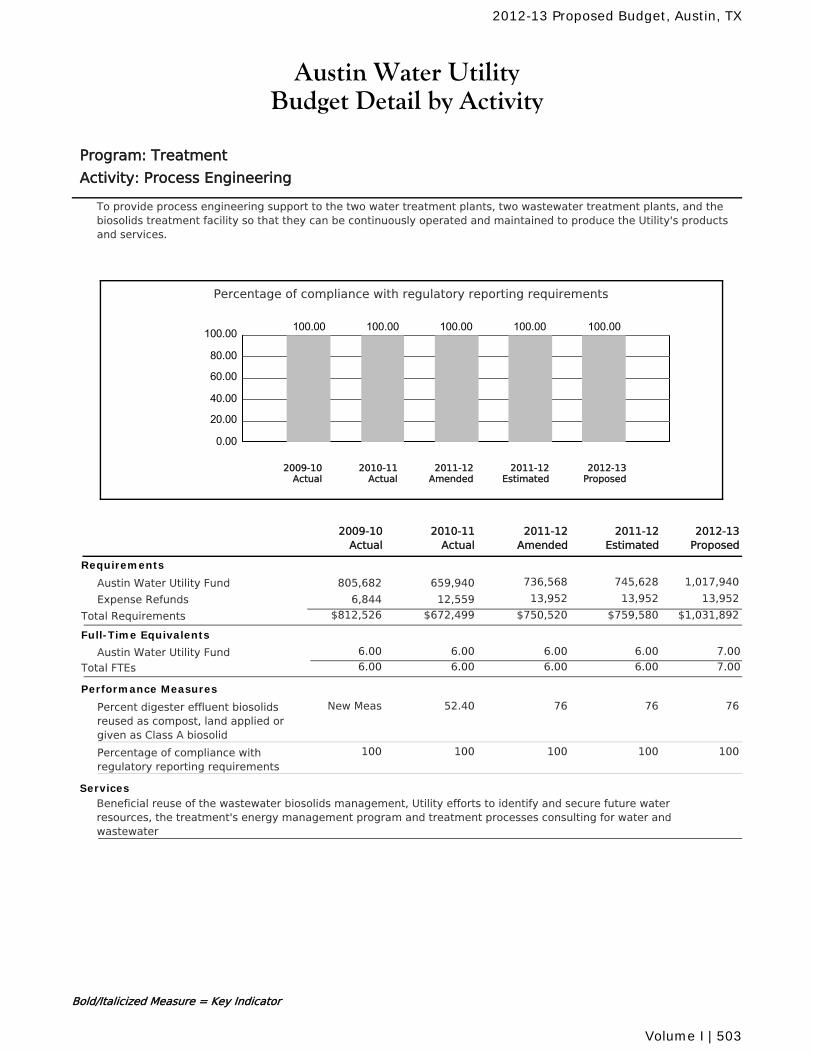
Austin Water UtilityBudget Detail by Activity
Program: Treatment
Activity: Process Engineering
To provide process engineering support to the two water treatment plants, two wastewater treatment plants, and thebiosolids treatment facility so that they can be continuously operated and maintained to produce the Utility's productsand services.
Percentage of compliance with regulatory reporting requirements
0.00
20.00
40.00
60.00
80.00
100.00 100.00 100.00 100.00 100.00 100.00
2010-11Actual
2012-13Proposed
2011-12Amended
2011-12Estimated
2009-10Actual
2011-12Amended
2010-11Actual
2011-12Estimated
2012-13Proposed
2009-10Actual
Requirements
Austin Water Utility Fund 736,568 745,628 1,017,940659,940805,682
Expense Refunds 13,952 13,952 13,95212,5596,844
$750,520 $759,580 $1,031,892Total Requirements $672,499$812,526
Full-Time Equivalents
Austin Water Utility Fund 6.00 6.00 6.00 7.006.00
Total FTEs 6.00 6.00 6.00 7.006.00
Performance Measures
Percent digester effluent biosolidsreused as compost, land applied orgiven as Class A biosolid
7652.40 76 76New Meas
Percentage of compliance withregulatory reporting requirements
100100 100 100100
ServicesBeneficial reuse of the wastewater biosolids management, Utility efforts to identify and secure future waterresources, the treatment's energy management program and treatment processes consulting for water andwastewater
Bold/Italicized Measure = Key Indicator
2012-13 Proposed Budget, Austin, TX
Volume I | 503
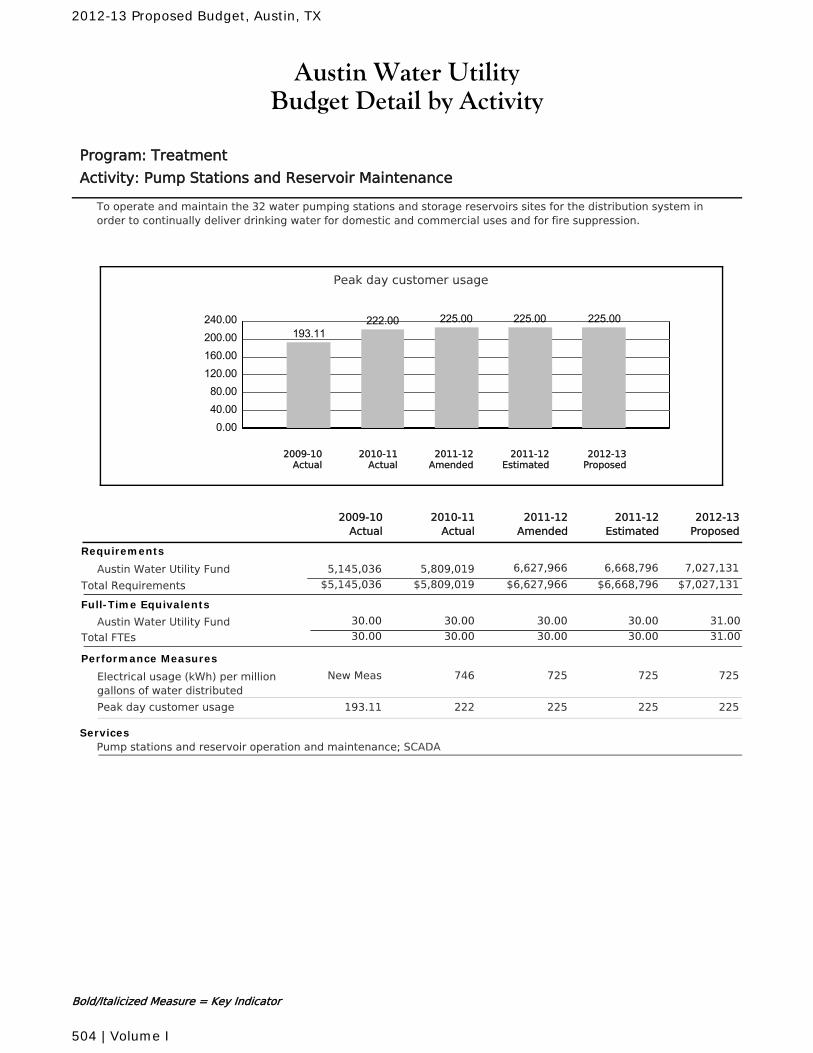
Austin Water UtilityBudget Detail by Activity
Program: Treatment
Activity: Pump Stations and Reservoir Maintenance
To operate and maintain the 32 water pumping stations and storage reservoirs sites for the distribution system inorder to continually deliver drinking water for domestic and commercial uses and for fire suppression.
Peak day customer usage
0.0040.0080.00
120.00160.00200.00240.00
193.11222.00 225.00 225.00 225.00
2010-11Actual
2012-13Proposed
2011-12Amended
2011-12Estimated
2009-10Actual
2011-12Amended
2010-11Actual
2011-12Estimated
2012-13Proposed
2009-10Actual
Requirements
Austin Water Utility Fund 6,627,966 6,668,796 7,027,1315,809,0195,145,036
$6,627,966 $6,668,796 $7,027,131Total Requirements $5,809,019$5,145,036
Full-Time Equivalents
Austin Water Utility Fund 30.00 30.00 30.00 31.0030.00
Total FTEs 30.00 30.00 30.00 31.0030.00
Performance Measures
Electrical usage (kWh) per milliongallons of water distributed
725746 725 725New Meas
Peak day customer usage 225222 225 225193.11
ServicesPump stations and reservoir operation and maintenance; SCADA
Bold/Italicized Measure = Key Indicator
2012-13 Proposed Budget, Austin, TX
504 | Volume I
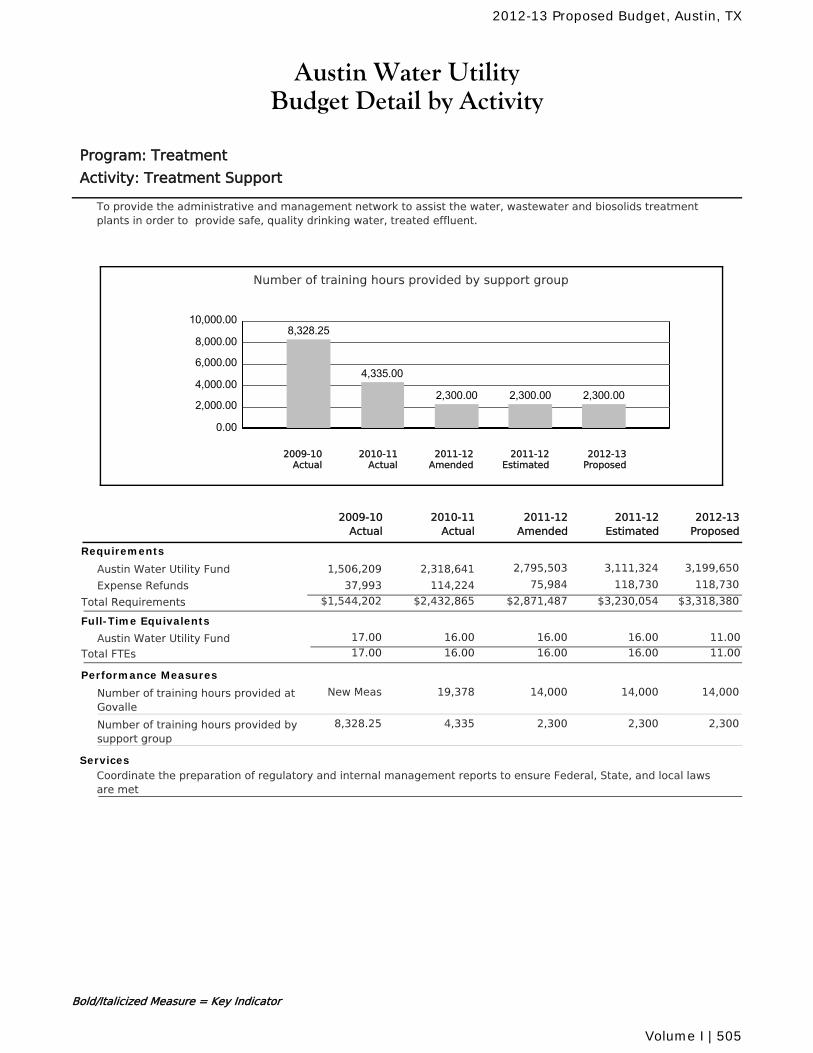
Austin Water UtilityBudget Detail by Activity
Program: Treatment
Activity: Treatment Support
To provide the administrative and management network to assist the water, wastewater and biosolids treatmentplants in order to provide safe, quality drinking water, treated effluent.
Number of training hours provided by support group
0.00
2,000.00
4,000.00
6,000.00
8,000.00
10,000.008,328.25
4,335.00
2,300.00 2,300.00 2,300.00
2010-11Actual
2012-13Proposed
2011-12Amended
2011-12Estimated
2009-10Actual
2011-12Amended
2010-11Actual
2011-12Estimated
2012-13Proposed
2009-10Actual
Requirements
Austin Water Utility Fund 2,795,503 3,111,324 3,199,6502,318,6411,506,209
Expense Refunds 75,984 118,730 118,730114,22437,993
$2,871,487 $3,230,054 $3,318,380Total Requirements $2,432,865$1,544,202
Full-Time Equivalents
Austin Water Utility Fund 16.00 16.00 16.00 11.0017.00
Total FTEs 16.00 16.00 16.00 11.0017.00
Performance Measures
Number of training hours provided atGovalle
14,00019,378 14,000 14,000New Meas
Number of training hours provided bysupport group
2,3004,335 2,300 2,3008,328.25
ServicesCoordinate the preparation of regulatory and internal management reports to ensure Federal, State, and local lawsare met
Bold/Italicized Measure = Key Indicator
2012-13 Proposed Budget, Austin, TX
Volume I | 505
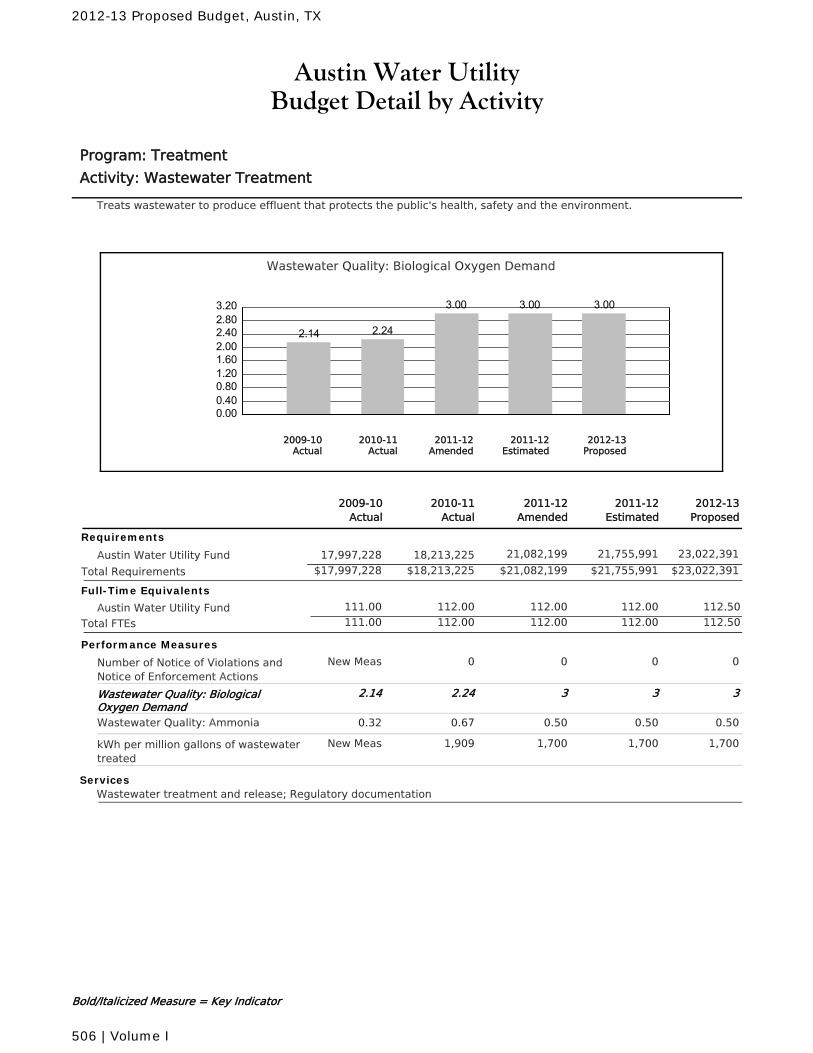
Austin Water UtilityBudget Detail by Activity
Program: Treatment
Activity: Wastewater Treatment
Treats wastewater to produce effluent that protects the public's health, safety and the environment.
Wastewater Quality: Biological Oxygen Demand
0.000.400.801.201.602.002.402.803.20
2.14 2.24
3.00 3.00 3.00
2010-11Actual
2012-13Proposed
2011-12Amended
2011-12Estimated
2009-10Actual
2011-12Amended
2010-11Actual
2011-12Estimated
2012-13Proposed
2009-10Actual
Requirements
Austin Water Utility Fund 21,082,199 21,755,991 23,022,39118,213,22517,997,228
$21,082,199 $21,755,991 $23,022,391Total Requirements $18,213,225$17,997,228
Full-Time Equivalents
Austin Water Utility Fund 112.00 112.00 112.00 112.50111.00
Total FTEs 112.00 112.00 112.00 112.50111.00
Performance Measures
Number of Notice of Violations andNotice of Enforcement Actions
00 0 0New Meas
Wastewater Quality: BiologicalOxygen Demand
32.24 3 32.14
Wastewater Quality: Ammonia 0.500.67 0.50 0.500.32
kWh per million gallons of wastewatertreated
1,7001,909 1,700 1,700New Meas
ServicesWastewater treatment and release; Regulatory documentation
Bold/Italicized Measure = Key Indicator
2012-13 Proposed Budget, Austin, TX
506 | Volume I
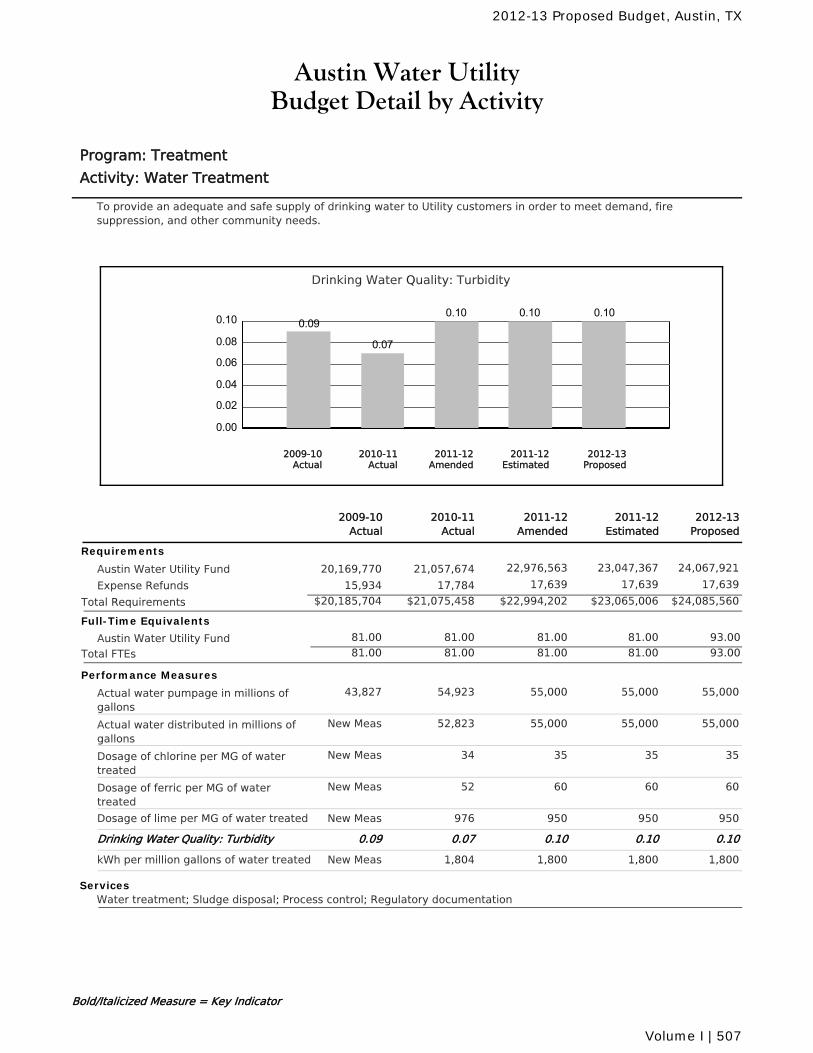
Austin Water UtilityBudget Detail by Activity
Program: Treatment
Activity: Water Treatment
To provide an adequate and safe supply of drinking water to Utility customers in order to meet demand, firesuppression, and other community needs.
Drinking Water Quality: Turbidity
0.00
0.02
0.04
0.06
0.08
0.10 0.09
0.07
0.10 0.10 0.10
2010-11Actual
2012-13Proposed
2011-12Amended
2011-12Estimated
2009-10Actual
2011-12Amended
2010-11Actual
2011-12Estimated
2012-13Proposed
2009-10Actual
Requirements
Austin Water Utility Fund 22,976,563 23,047,367 24,067,92121,057,67420,169,770
Expense Refunds 17,639 17,639 17,63917,78415,934
$22,994,202 $23,065,006 $24,085,560Total Requirements $21,075,458$20,185,704
Full-Time Equivalents
Austin Water Utility Fund 81.00 81.00 81.00 93.0081.00
Total FTEs 81.00 81.00 81.00 93.0081.00
Performance Measures
Actual water pumpage in millions ofgallons
55,00054,923 55,000 55,00043,827
Actual water distributed in millions ofgallons
55,00052,823 55,000 55,000New Meas
Dosage of chlorine per MG of watertreated
3534 35 35New Meas
Dosage of ferric per MG of watertreated
6052 60 60New Meas
Dosage of lime per MG of water treated 950976 950 950New Meas
Drinking Water Quality: Turbidity 0.100.07 0.10 0.100.09
kWh per million gallons of water treated 1,8001,804 1,800 1,800New Meas
ServicesWater treatment; Sludge disposal; Process control; Regulatory documentation
Bold/Italicized Measure = Key Indicator
2012-13 Proposed Budget, Austin, TX
Volume I | 507
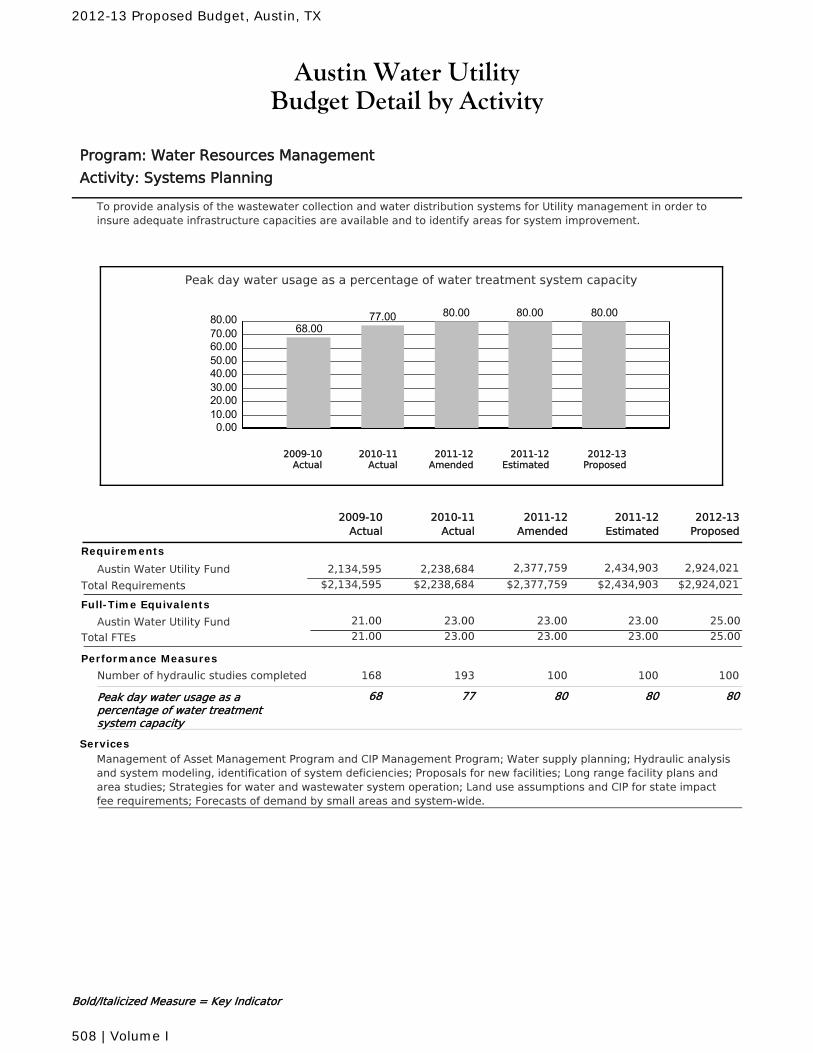
Austin Water UtilityBudget Detail by Activity
Program: Water Resources Management
Activity: Systems Planning
To provide analysis of the wastewater collection and water distribution systems for Utility management in order toinsure adequate infrastructure capacities are available and to identify areas for system improvement.
Peak day water usage as a percentage of water treatment system capacity
0.0010.0020.0030.0040.0050.0060.0070.0080.00
68.0077.00 80.00 80.00 80.00
2010-11Actual
2012-13Proposed
2011-12Amended
2011-12Estimated
2009-10Actual
2011-12Amended
2010-11Actual
2011-12Estimated
2012-13Proposed
2009-10Actual
Requirements
Austin Water Utility Fund 2,377,759 2,434,903 2,924,0212,238,6842,134,595
$2,377,759 $2,434,903 $2,924,021Total Requirements $2,238,684$2,134,595
Full-Time Equivalents
Austin Water Utility Fund 23.00 23.00 23.00 25.0021.00
Total FTEs 23.00 23.00 23.00 25.0021.00
Performance Measures
Number of hydraulic studies completed 100193 100 100168
Peak day water usage as apercentage of water treatmentsystem capacity
8077 80 8068
ServicesManagement of Asset Management Program and CIP Management Program; Water supply planning; Hydraulic analysisand system modeling, identification of system deficiencies; Proposals for new facilities; Long range facility plans andarea studies; Strategies for water and wastewater system operation; Land use assumptions and CIP for state impactfee requirements; Forecasts of demand by small areas and system-wide.
Bold/Italicized Measure = Key Indicator
2012-13 Proposed Budget, Austin, TX
508 | Volume I
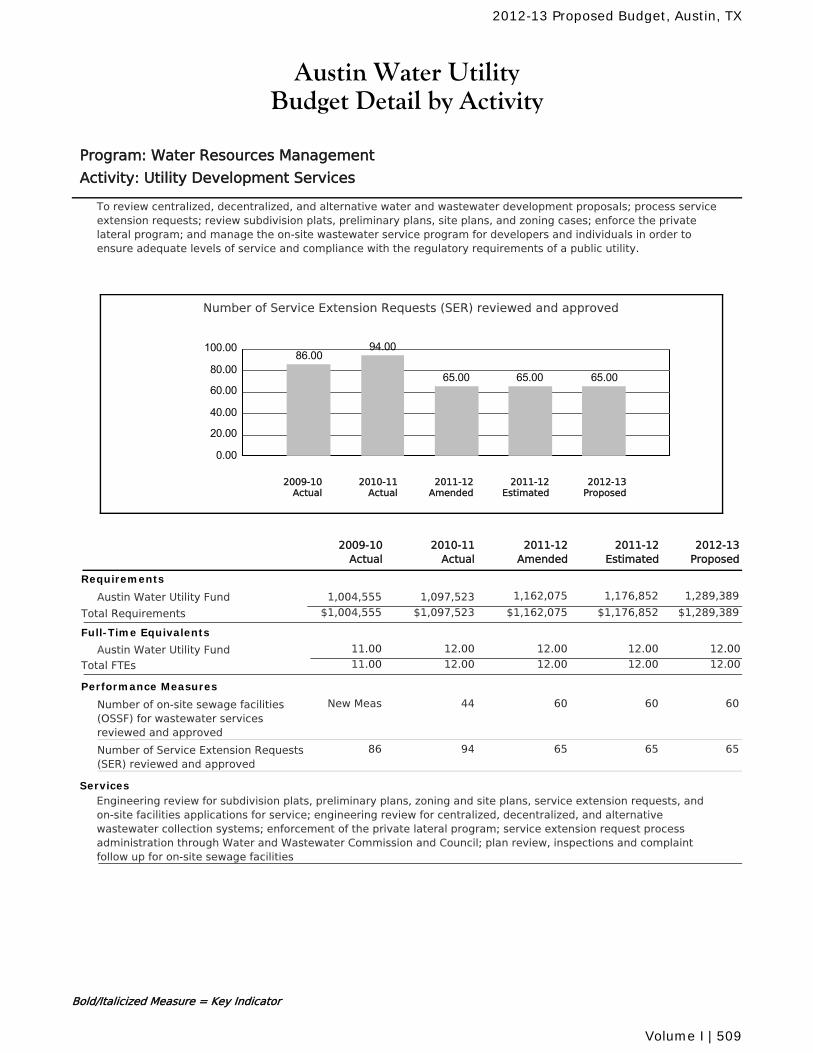
Austin Water UtilityBudget Detail by Activity
Program: Water Resources Management
Activity: Utility Development Services
To review centralized, decentralized, and alternative water and wastewater development proposals; process serviceextension requests; review subdivision plats, preliminary plans, site plans, and zoning cases; enforce the privatelateral program; and manage the on-site wastewater service program for developers and individuals in order toensure adequate levels of service and compliance with the regulatory requirements of a public utility.
Number of Service Extension Requests (SER) reviewed and approved
0.00
20.00
40.00
60.00
80.00
100.0086.00
94.00
65.00 65.00 65.00
2010-11Actual
2012-13Proposed
2011-12Amended
2011-12Estimated
2009-10Actual
2011-12Amended
2010-11Actual
2011-12Estimated
2012-13Proposed
2009-10Actual
Requirements
Austin Water Utility Fund 1,162,075 1,176,852 1,289,3891,097,5231,004,555
$1,162,075 $1,176,852 $1,289,389Total Requirements $1,097,523$1,004,555
Full-Time Equivalents
Austin Water Utility Fund 12.00 12.00 12.00 12.0011.00
Total FTEs 12.00 12.00 12.00 12.0011.00
Performance Measures
Number of on-site sewage facilities(OSSF) for wastewater servicesreviewed and approved
6044 60 60New Meas
Number of Service Extension Requests(SER) reviewed and approved
6594 65 6586
ServicesEngineering review for subdivision plats, preliminary plans, zoning and site plans, service extension requests, andon-site facilities applications for service; engineering review for centralized, decentralized, and alternativewastewater collection systems; enforcement of the private lateral program; service extension request processadministration through Water and Wastewater Commission and Council; plan review, inspections and complaintfollow up for on-site sewage facilities
Bold/Italicized Measure = Key Indicator
2012-13 Proposed Budget, Austin, TX
Volume I | 509
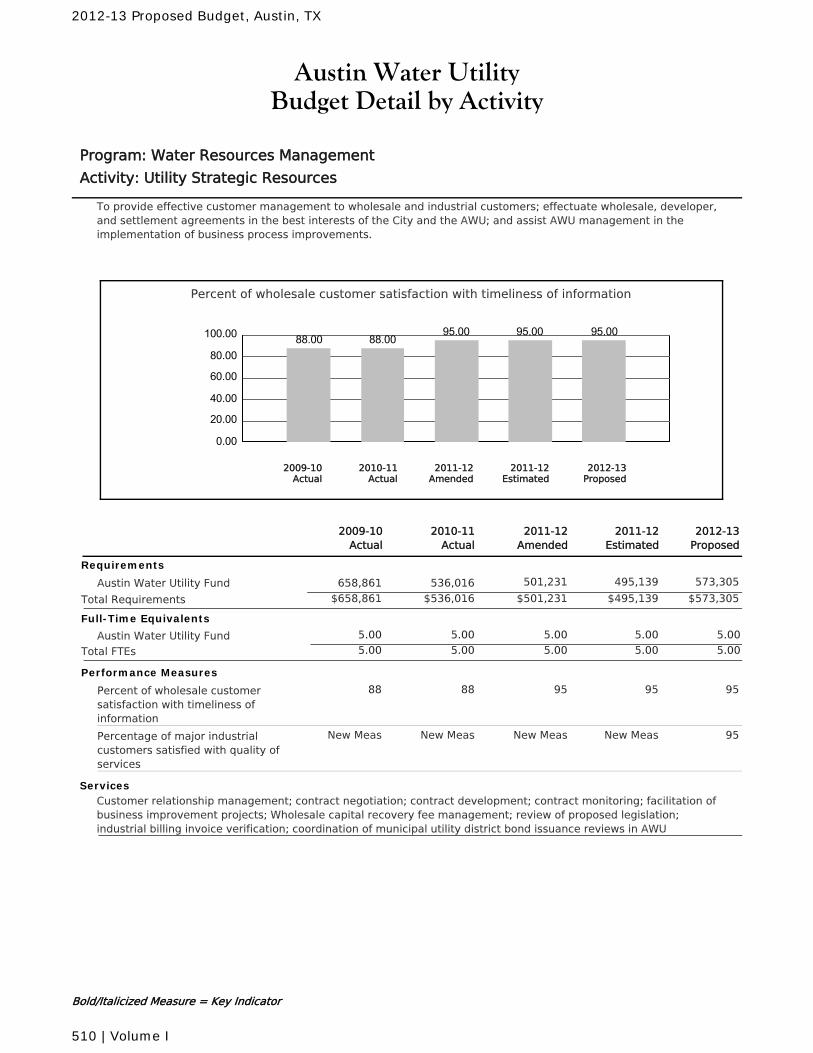
Austin Water UtilityBudget Detail by Activity
Program: Water Resources Management
Activity: Utility Strategic Resources
To provide effective customer management to wholesale and industrial customers; effectuate wholesale, developer,and settlement agreements in the best interests of the City and the AWU; and assist AWU management in theimplementation of business process improvements.
Percent of wholesale customer satisfaction with timeliness of information
0.00
20.00
40.00
60.00
80.00
100.00 88.00 88.0095.00 95.00 95.00
2010-11Actual
2012-13Proposed
2011-12Amended
2011-12Estimated
2009-10Actual
2011-12Amended
2010-11Actual
2011-12Estimated
2012-13Proposed
2009-10Actual
Requirements
Austin Water Utility Fund 501,231 495,139 573,305536,016658,861
$501,231 $495,139 $573,305Total Requirements $536,016$658,861
Full-Time Equivalents
Austin Water Utility Fund 5.00 5.00 5.00 5.005.00
Total FTEs 5.00 5.00 5.00 5.005.00
Performance Measures
Percent of wholesale customersatisfaction with timeliness ofinformation
9588 95 9588
Percentage of major industrialcustomers satisfied with quality ofservices
New MeasNew Meas New Meas 95New Meas
ServicesCustomer relationship management; contract negotiation; contract development; contract monitoring; facilitation ofbusiness improvement projects; Wholesale capital recovery fee management; review of proposed legislation;industrial billing invoice verification; coordination of municipal utility district bond issuance reviews in AWU
Bold/Italicized Measure = Key Indicator
2012-13 Proposed Budget, Austin, TX
510 | Volume I
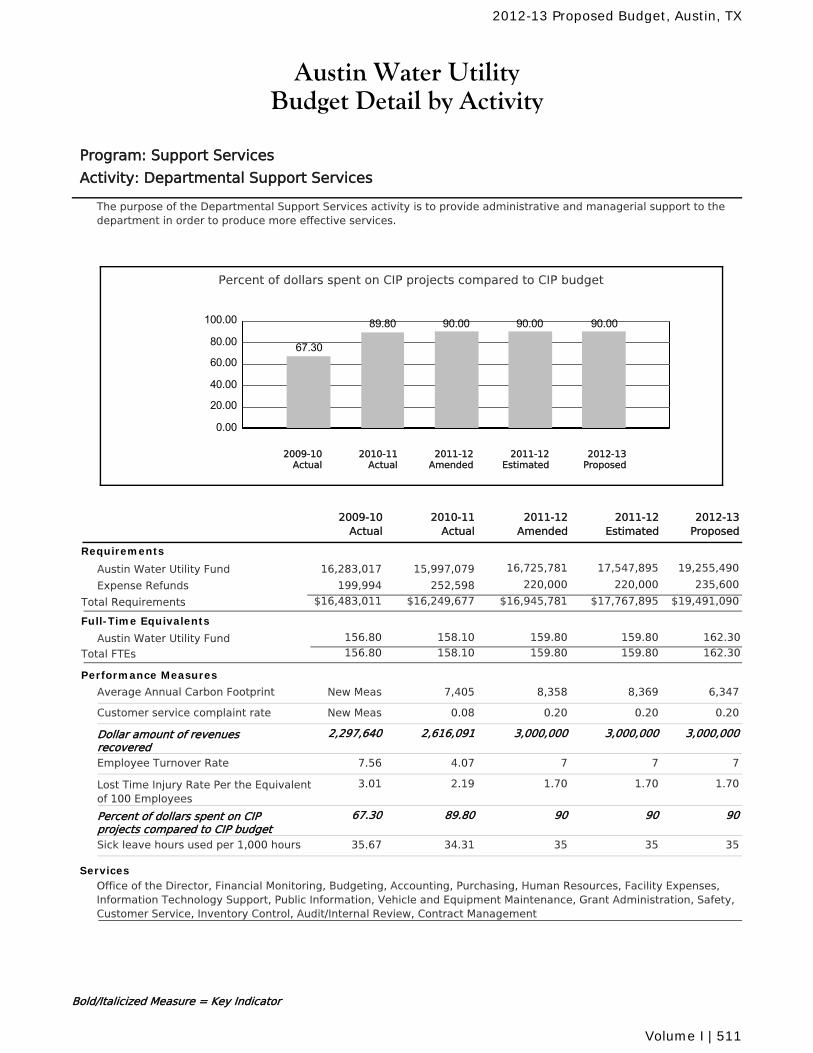
Austin Water UtilityBudget Detail by Activity
Program: Support Services
Activity: Departmental Support Services
The purpose of the Departmental Support Services activity is to provide administrative and managerial support to thedepartment in order to produce more effective services.
Percent of dollars spent on CIP projects compared to CIP budget
0.00
20.00
40.00
60.00
80.00
100.00
67.30
89.80 90.00 90.00 90.00
2010-11Actual
2012-13Proposed
2011-12Amended
2011-12Estimated
2009-10Actual
2011-12Amended
2010-11Actual
2011-12Estimated
2012-13Proposed
2009-10Actual
Requirements
Austin Water Utility Fund 16,725,781 17,547,895 19,255,49015,997,07916,283,017
Expense Refunds 220,000 220,000 235,600252,598199,994
$16,945,781 $17,767,895 $19,491,090Total Requirements $16,249,677$16,483,011
Full-Time Equivalents
Austin Water Utility Fund 158.10 159.80 159.80 162.30156.80
Total FTEs 158.10 159.80 159.80 162.30156.80
Performance Measures
Average Annual Carbon Footprint 8,3587,405 8,369 6,347New Meas
Customer service complaint rate 0.200.08 0.20 0.20New Meas
Dollar amount of revenuesrecovered
3,000,0002,616,091 3,000,000 3,000,0002,297,640
Employee Turnover Rate 74.07 7 77.56
Lost Time Injury Rate Per the Equivalentof 100 Employees
1.702.19 1.70 1.703.01
Percent of dollars spent on CIPprojects compared to CIP budget
9089.80 90 9067.30
Sick leave hours used per 1,000 hours 3534.31 35 3535.67
ServicesOffice of the Director, Financial Monitoring, Budgeting, Accounting, Purchasing, Human Resources, Facility Expenses,Information Technology Support, Public Information, Vehicle and Equipment Maintenance, Grant Administration, Safety,Customer Service, Inventory Control, Audit/Internal Review, Contract Management
Bold/Italicized Measure = Key Indicator
2012-13 Proposed Budget, Austin, TX
Volume I | 511
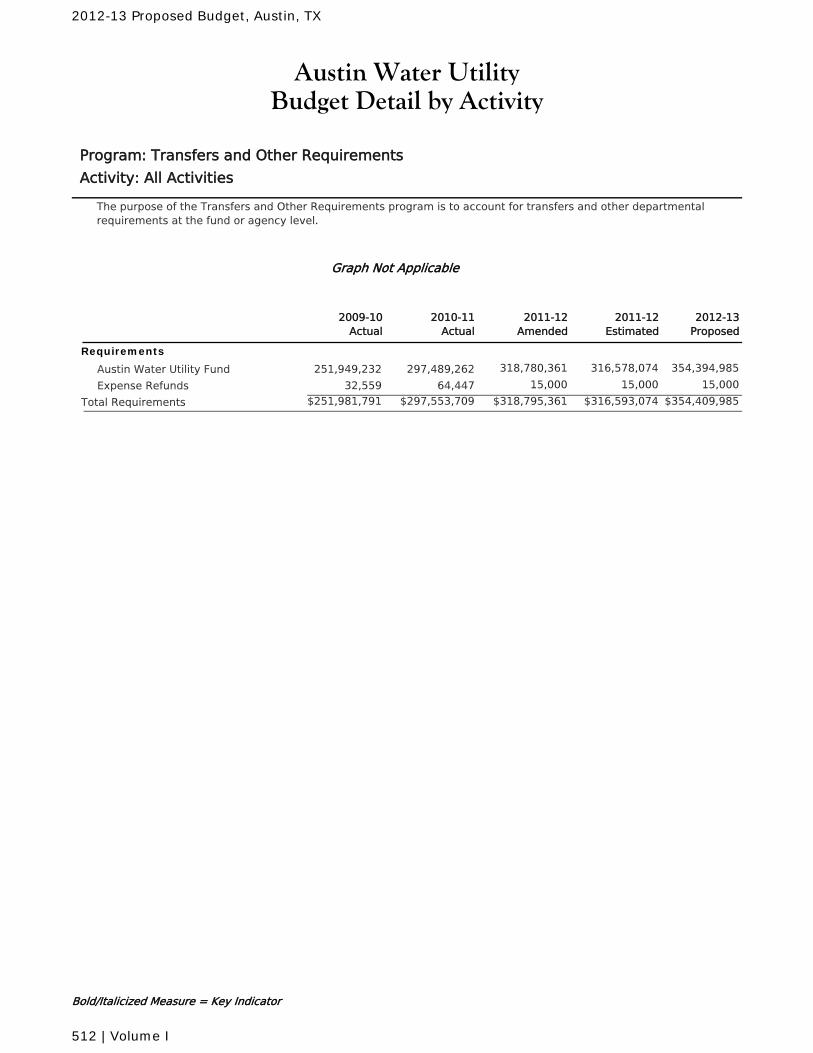
Austin Water UtilityBudget Detail by Activity
Program: Transfers and Other Requirements
Activity: All Activities
The purpose of the Transfers and Other Requirements program is to account for transfers and other departmentalrequirements at the fund or agency level.
Graph Not Applicable
2011-12Amended
2010-11Actual
2011-12Estimated
2012-13Proposed
2009-10Actual
Requirements
Austin Water Utility Fund 318,780,361 316,578,074 354,394,985297,489,262251,949,232
Expense Refunds 15,000 15,000 15,00064,44732,559
$318,795,361 $316,593,074 $354,409,985Total Requirements $297,553,709$251,981,791
Bold/Italicized Measure = Key Indicator
2012-13 Proposed Budget, Austin, TX
512 | Volume I
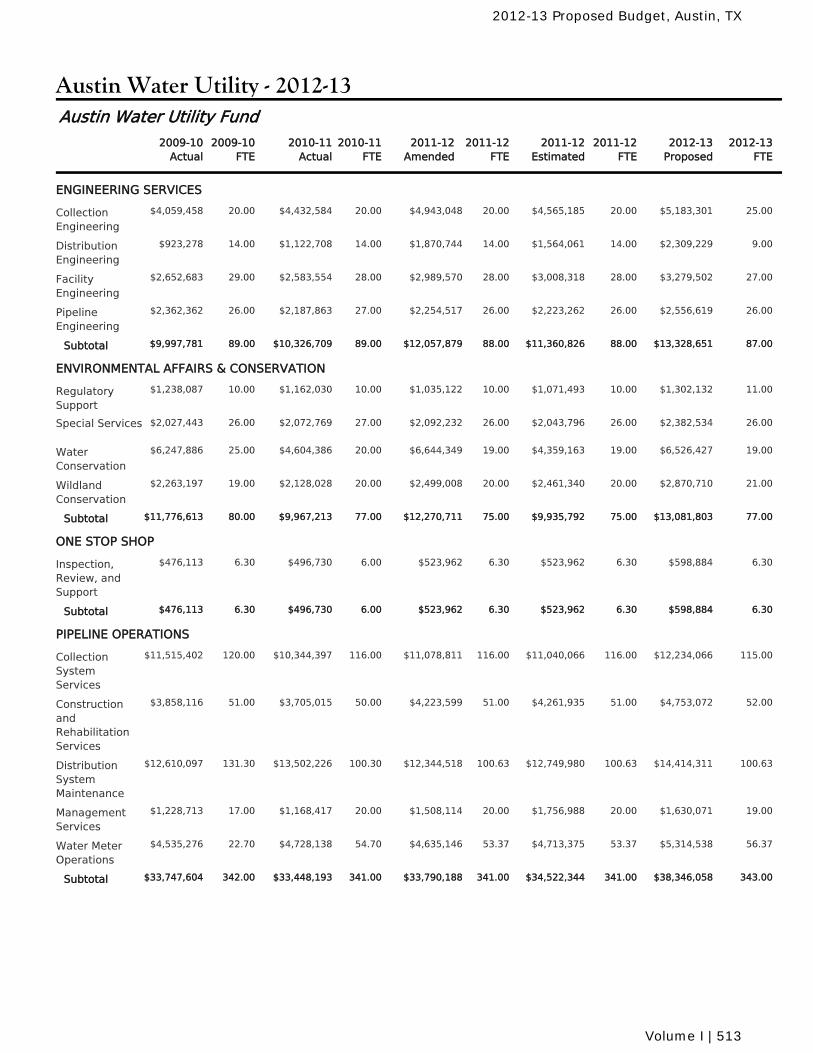
Austin Water Utility - 2012-13
2010-11Actual
2010-11FTE
2011-12Amended
2011-12FTE
2011-12Estimated
2011-12FTE
2009-10Actual
2009-10FTE
2012-13Proposed
2012-13FTE
Austin Water Utility Fund
ENGINEERING SERVICES
$4,432,584 20.00 $4,943,048 20.00 $4,565,185 20.00CollectionEngineering
20.00 $5,183,301 25.00$4,059,458
$1,122,708 14.00 $1,870,744 14.00 $1,564,061 14.00DistributionEngineering
14.00 $2,309,229 9.00$923,278
$2,583,554 28.00 $2,989,570 28.00 $3,008,318 28.00FacilityEngineering
29.00 $3,279,502 27.00$2,652,683
$2,187,863 27.00 $2,254,517 26.00 $2,223,262 26.00PipelineEngineering
26.00 $2,556,619 26.00$2,362,362
$10,326,709 89.00 $12,057,879 88.00 $11,360,826 88.00Subtotal 89.00 $13,328,651 87.00$9,997,781
ENVIRONMENTAL AFFAIRS & CONSERVATION
$1,162,030 10.00 $1,035,122 10.00 $1,071,493 10.00RegulatorySupport
10.00 $1,302,132 11.00$1,238,087
$2,072,769 27.00 $2,092,232 26.00 $2,043,796 26.00Special Services 26.00 $2,382,534 26.00$2,027,443
$4,604,386 20.00 $6,644,349 19.00 $4,359,163 19.00WaterConservation
25.00 $6,526,427 19.00$6,247,886
$2,128,028 20.00 $2,499,008 20.00 $2,461,340 20.00WildlandConservation
19.00 $2,870,710 21.00$2,263,197
$9,967,213 77.00 $12,270,711 75.00 $9,935,792 75.00Subtotal 80.00 $13,081,803 77.00$11,776,613
ONE STOP SHOP
$496,730 6.00 $523,962 6.30 $523,962 6.30Inspection,Review, andSupport
6.30 $598,884 6.30$476,113
$496,730 6.00 $523,962 6.30 $523,962 6.30Subtotal 6.30 $598,884 6.30$476,113
PIPELINE OPERATIONS
$10,344,397 116.00 $11,078,811 116.00 $11,040,066 116.00CollectionSystemServices
120.00 $12,234,066 115.00$11,515,402
$3,705,015 50.00 $4,223,599 51.00 $4,261,935 51.00ConstructionandRehabilitationServices
51.00 $4,753,072 52.00$3,858,116
$13,502,226 100.30 $12,344,518 100.63 $12,749,980 100.63DistributionSystemMaintenance
131.30 $14,414,311 100.63$12,610,097
$1,168,417 20.00 $1,508,114 20.00 $1,756,988 20.00ManagementServices
17.00 $1,630,071 19.00$1,228,713
$4,728,138 54.70 $4,635,146 53.37 $4,713,375 53.37Water MeterOperations
22.70 $5,314,538 56.37$4,535,276
$33,448,193 341.00 $33,790,188 341.00 $34,522,344 341.00Subtotal 342.00 $38,346,058 343.00$33,747,604
2012-13 Proposed Budget, Austin, TX
Volume I | 513
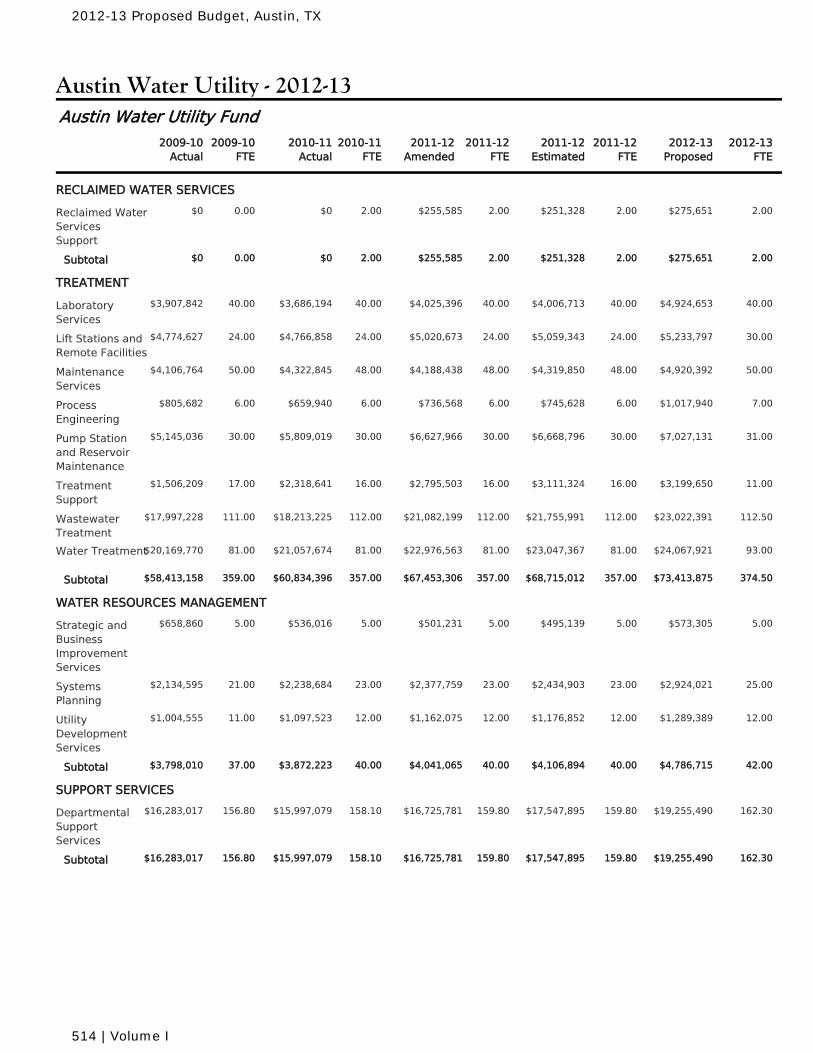
Austin Water Utility - 2012-13
2010-11Actual
2010-11FTE
2011-12Amended
2011-12FTE
2011-12Estimated
2011-12FTE
2009-10Actual
2009-10FTE
2012-13Proposed
2012-13FTE
Austin Water Utility Fund
RECLAIMED WATER SERVICES
$0 2.00 $255,585 2.00 $251,328 2.00Reclaimed WaterServicesSupport
0.00 $275,651 2.00$0
$0 2.00 $255,585 2.00 $251,328 2.00Subtotal 0.00 $275,651 2.00$0
TREATMENT
$3,686,194 40.00 $4,025,396 40.00 $4,006,713 40.00LaboratoryServices
40.00 $4,924,653 40.00$3,907,842
$4,766,858 24.00 $5,020,673 24.00 $5,059,343 24.00Lift Stations andRemote Facilities
24.00 $5,233,797 30.00$4,774,627
$4,322,845 48.00 $4,188,438 48.00 $4,319,850 48.00MaintenanceServices
50.00 $4,920,392 50.00$4,106,764
$659,940 6.00 $736,568 6.00 $745,628 6.00ProcessEngineering
6.00 $1,017,940 7.00$805,682
$5,809,019 30.00 $6,627,966 30.00 $6,668,796 30.00Pump Stationand ReservoirMaintenance
30.00 $7,027,131 31.00$5,145,036
$2,318,641 16.00 $2,795,503 16.00 $3,111,324 16.00TreatmentSupport
17.00 $3,199,650 11.00$1,506,209
$18,213,225 112.00 $21,082,199 112.00 $21,755,991 112.00WastewaterTreatment
111.00 $23,022,391 112.50$17,997,228
$21,057,674 81.00 $22,976,563 81.00 $23,047,367 81.00Water Treatment 81.00 $24,067,921 93.00$20,169,770
$60,834,396 357.00 $67,453,306 357.00 $68,715,012 357.00Subtotal 359.00 $73,413,875 374.50$58,413,158
WATER RESOURCES MANAGEMENT
$536,016 5.00 $501,231 5.00 $495,139 5.00Strategic andBusinessImprovementServices
5.00 $573,305 5.00$658,860
$2,238,684 23.00 $2,377,759 23.00 $2,434,903 23.00SystemsPlanning
21.00 $2,924,021 25.00$2,134,595
$1,097,523 12.00 $1,162,075 12.00 $1,176,852 12.00UtilityDevelopmentServices
11.00 $1,289,389 12.00$1,004,555
$3,872,223 40.00 $4,041,065 40.00 $4,106,894 40.00Subtotal 37.00 $4,786,715 42.00$3,798,010
SUPPORT SERVICES
$15,997,079 158.10 $16,725,781 159.80 $17,547,895 159.80DepartmentalSupportServices
156.80 $19,255,490 162.30$16,283,017
$15,997,079 158.10 $16,725,781 159.80 $17,547,895 159.80Subtotal 156.80 $19,255,490 162.30$16,283,017
2012-13 Proposed Budget, Austin, TX
514 | Volume I
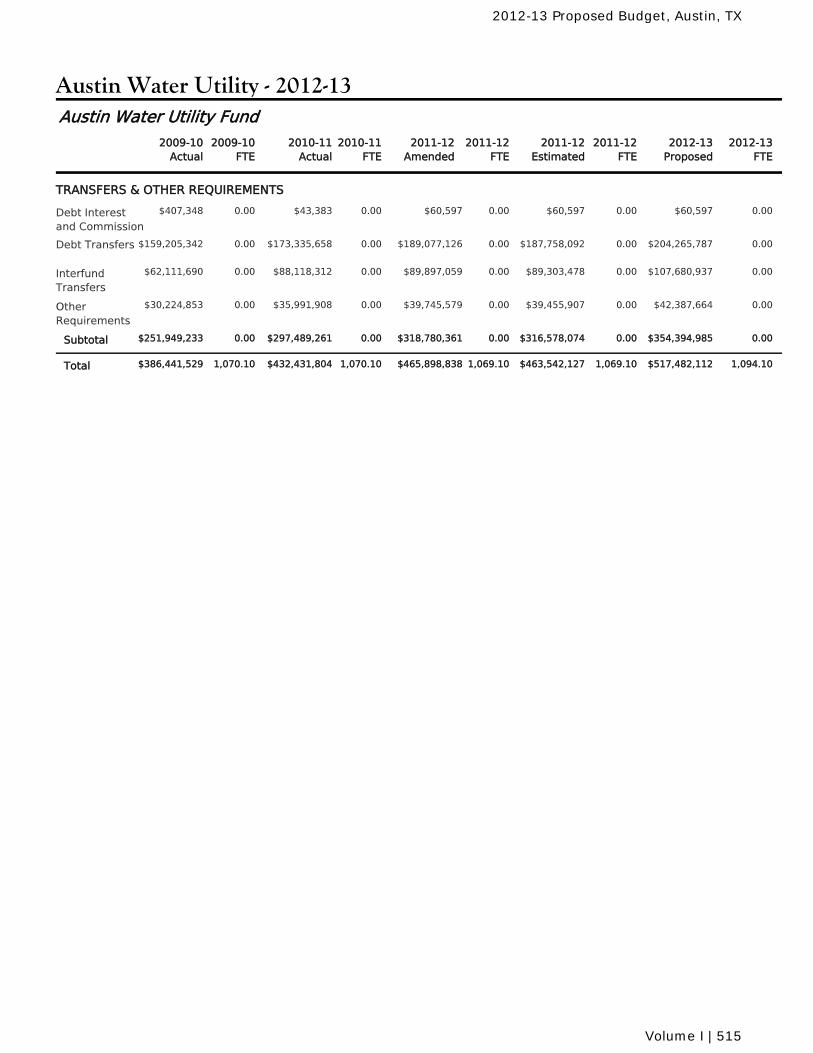
Austin Water Utility - 2012-13
2010-11Actual
2010-11FTE
2011-12Amended
2011-12FTE
2011-12Estimated
2011-12FTE
2009-10Actual
2009-10FTE
2012-13Proposed
2012-13FTE
Austin Water Utility Fund
TRANSFERS & OTHER REQUIREMENTS
$43,383 0.00 $60,597 0.00 $60,597 0.00Debt Interestand Commission
0.00 $60,597 0.00$407,348
$173,335,658 0.00 $189,077,126 0.00 $187,758,092 0.00Debt Transfers 0.00 $204,265,787 0.00$159,205,342
$88,118,312 0.00 $89,897,059 0.00 $89,303,478 0.00InterfundTransfers
0.00 $107,680,937 0.00$62,111,690
$35,991,908 0.00 $39,745,579 0.00 $39,455,907 0.00OtherRequirements
0.00 $42,387,664 0.00$30,224,853
$297,489,261 0.00 $318,780,361 0.00 $316,578,074 0.00Subtotal 0.00 $354,394,985 0.00$251,949,233
$432,431,804 1,070.10 $465,898,838 1,069.10 $463,542,127 1,069.10Total 1,070.10 $517,482,112 1,094.10$386,441,529
2012-13 Proposed Budget, Austin, TX
Volume I | 515
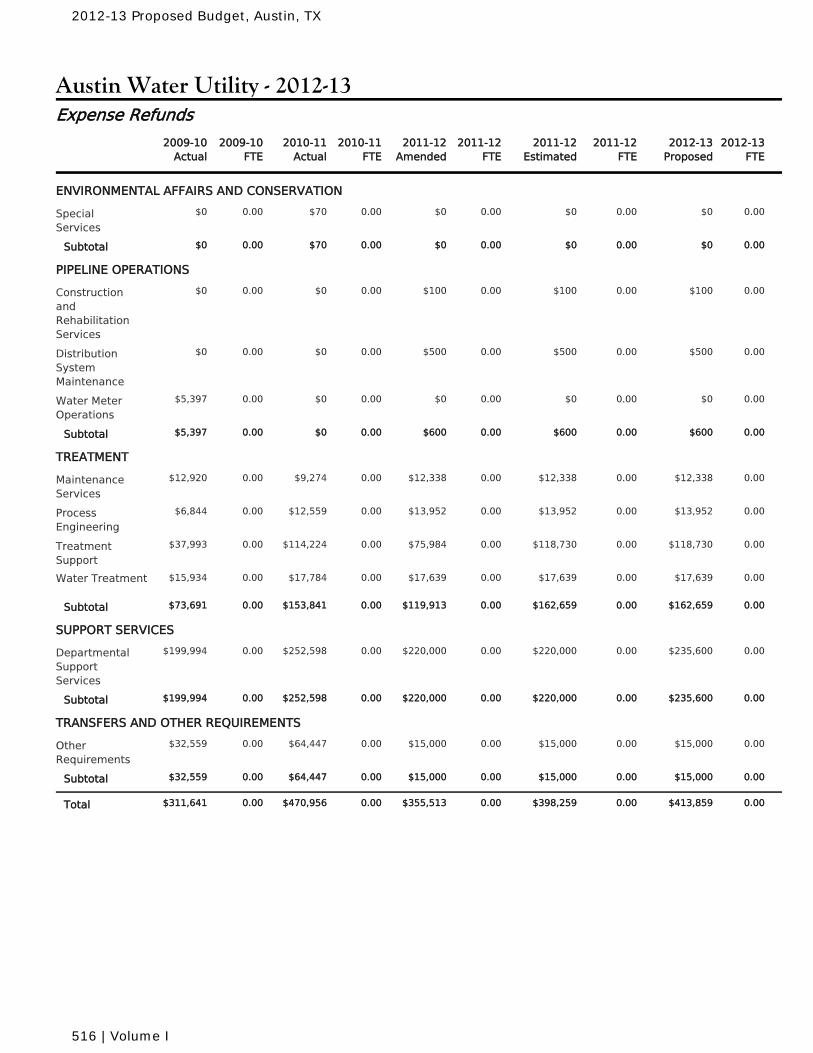
Austin Water Utility - 2012-13
2010-11Actual
2010-11FTE
2011-12Amended
2011-12FTE
2011-12Estimated
2011-12FTE
2009-10Actual
2009-10FTE
2012-13Proposed
2012-13FTE
Expense Refunds
ENVIRONMENTAL AFFAIRS AND CONSERVATION
$70 0.00 $0 0.00 $0 0.00SpecialServices
0.00 $0 0.00$0
$70 0.00 $0 0.00 $0 0.00Subtotal 0.00 $0 0.00$0
PIPELINE OPERATIONS
$0 0.00 $100 0.00 $100 0.00ConstructionandRehabilitationServices
0.00 $100 0.00$0
$0 0.00 $500 0.00 $500 0.00DistributionSystemMaintenance
0.00 $500 0.00$0
$0 0.00 $0 0.00 $0 0.00Water MeterOperations
0.00 $0 0.00$5,397
$0 0.00 $600 0.00 $600 0.00Subtotal 0.00 $600 0.00$5,397
TREATMENT
$9,274 0.00 $12,338 0.00 $12,338 0.00MaintenanceServices
0.00 $12,338 0.00$12,920
$12,559 0.00 $13,952 0.00 $13,952 0.00ProcessEngineering
0.00 $13,952 0.00$6,844
$114,224 0.00 $75,984 0.00 $118,730 0.00TreatmentSupport
0.00 $118,730 0.00$37,993
$17,784 0.00 $17,639 0.00 $17,639 0.00Water Treatment 0.00 $17,639 0.00$15,934
$153,841 0.00 $119,913 0.00 $162,659 0.00Subtotal 0.00 $162,659 0.00$73,691
SUPPORT SERVICES
$252,598 0.00 $220,000 0.00 $220,000 0.00DepartmentalSupportServices
0.00 $235,600 0.00$199,994
$252,598 0.00 $220,000 0.00 $220,000 0.00Subtotal 0.00 $235,600 0.00$199,994
TRANSFERS AND OTHER REQUIREMENTS
$64,447 0.00 $15,000 0.00 $15,000 0.00OtherRequirements
0.00 $15,000 0.00$32,559
$64,447 0.00 $15,000 0.00 $15,000 0.00Subtotal 0.00 $15,000 0.00$32,559
$470,956 0.00 $355,513 0.00 $398,259 0.00Total 0.00 $413,859 0.00$311,641
2012-13 Proposed Budget, Austin, TX
516 | Volume I
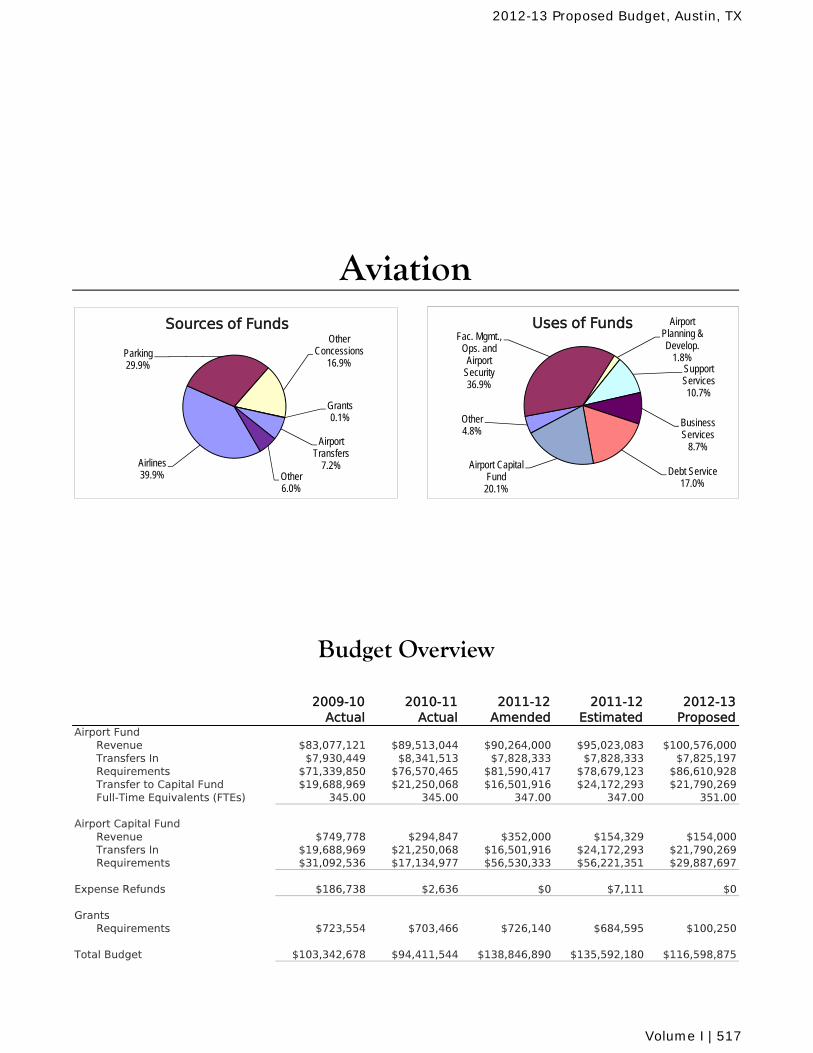
2009-10 Actual
2010-11 Actual
2011-12 Amended
2011-12 Estimated
2012-13 Proposed
Airport FundRevenue $83,077,121 $89,513,044 $90,264,000 $95,023,083 $100,576,000Transfers In $7,930,449 $8,341,513 $7,828,333 $7,828,333 $7,825,197Requirements $71,339,850 $76,570,465 $81,590,417 $78,679,123 $86,610,928Transfer to Capital Fund $19,688,969 $21,250,068 $16,501,916 $24,172,293 $21,790,269Full-Time Equivalents (FTEs) 345.00 345.00 347.00 347.00 351.00
Airport Capital FundRevenue $749,778 $294,847 $352,000 $154,329 $154,000Transfers In $19,688,969 $21,250,068 $16,501,916 $24,172,293 $21,790,269Requirements $31,092,536 $17,134,977 $56,530,333 $56,221,351 $29,887,697
Expense Refunds $186,738 $2,636 $0 $7,111 $0
GrantsRequirements $723,554 $703,466 $726,140 $684,595 $100,250
Total Budget $103,342,678 $94,411,544 $138,846,890 $135,592,180 $116,598,875
Budget Overview
Aviation
Airlines39.9%
Parking29.9%
Other Concessions
16.9%
Grants0.1%
Airport Transfers
7.2%Other6.0%
Sources of Funds
Other4.8%
Fac. Mgmt., Ops. and Airport
Security36.9%
Airport Planning & Develop.
1.8%Support Services10.7%
Business Services
8.7%
Debt Service17.0%
Airport Capital Fund
20.1%
Uses of Funds
2012-13 Proposed Budget, Austin, TX
Volume I | 517
AviationOrganization by Program and Activity for 2013
Airport Planning & Development Planning, Design and Construction
Business Services Airport Property ManagementParking
Facilities Management, Operations andAirport Security
Air/Fire Rescue (ARFF)Airline MaintenanceAirport SecurityAirside MaintenanceBuilding MaintenanceFacility ServicesGrounds MaintenanceMaxAdminMechanic ShopOperations
Support Services Departmental Support Services
Transfers & Other Requirements Other RequirementsTransfers
2012-13 Proposed Budget, Austin, TX
518 | Volume I
AviationMission and Goals for 2013
Mission
We provide safe, secure, and efficient air transportation facilities and services that support andimprove the quality of life and the economic prosperity of Central Texas.
Goals
Provide Customer and Community Value:
At least 47% of customer survey participants rank overall satisfaction "Excellent."
Achieve Operational Excellence:
Lost time injury rate of 1.00 or less.
Be recognized as a leader in airport Environmental Stewardship:
Collect 180 tons of recycling materials in the terminal.
Maintain Economic Sustainability:
Airline Cost per Passenger less than or equal to $8.94.Non-Airline Revenue per Passenger greater than or equal to $11.79.
2012-13 Proposed Budget, Austin, TX
Volume I | 519
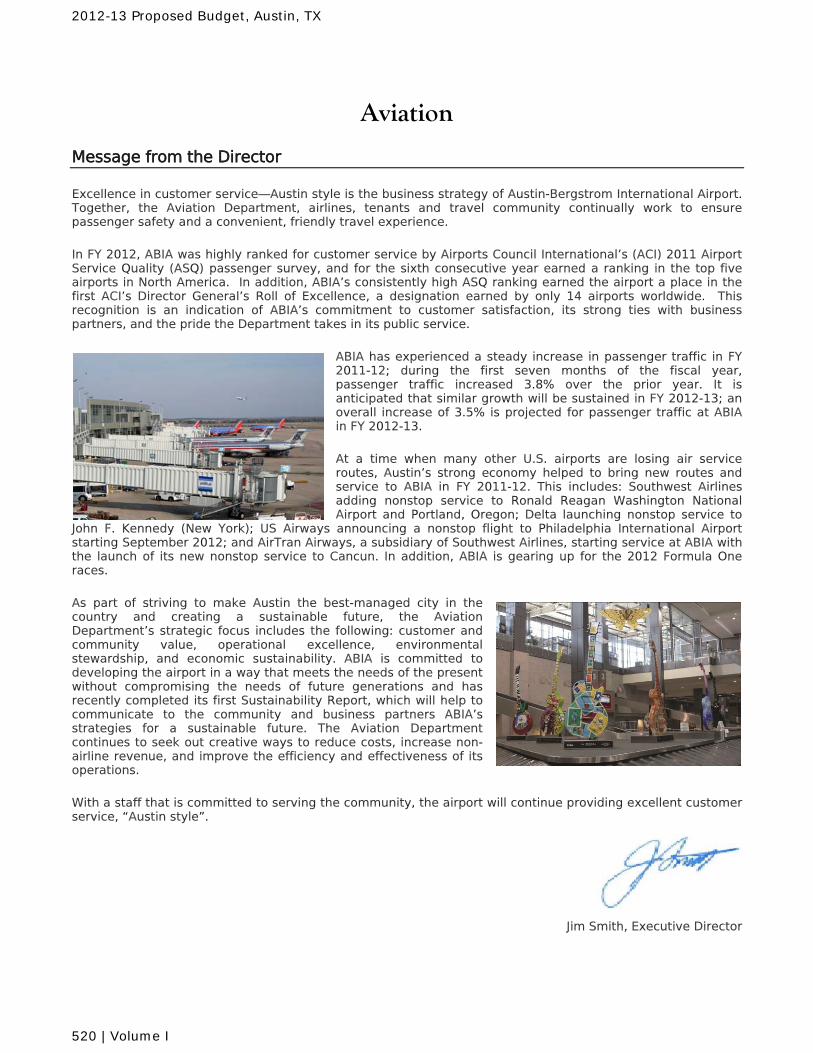
Aviation
Message from the Director
Excellence in customer service—Austin style is the business strategy of Austin-Bergstrom International Airport. Together, the Aviation Department, airlines, tenants and travel community continually work to ensure passenger safety and a convenient, friendly travel experience.
In FY 2012, ABIA was highly ranked for customer service by Airports Council International’s (ACI) 2011 Airport Service Quality (ASQ) passenger survey, and for the sixth consecutive year earned a ranking in the top five airports in North America. In addition, ABIA’s consistently high ASQ ranking earned the airport a place in the first ACI’s Director General’s Roll of Excellence, a designation earned by only 14 airports worldwide. This recognition is an indication of ABIA’s commitment to customer satisfaction, its strong ties with business partners, and the pride the Department takes in its public service.
ABIA has experienced a steady increase in passenger traffic in FY 2011-12; during the first seven months of the fiscal year, passenger traffic increased 3.8% over the prior year. It is anticipated that similar growth will be sustained in FY 2012-13; an overall increase of 3.5% is projected for passenger traffic at ABIA in FY 2012-13.
At a time when many other U.S. airports are losing air service routes, Austin’s strong economy helped to bring new routes and service to ABIA in FY 2011-12. This includes: Southwest Airlines adding nonstop service to Ronald Reagan Washington National Airport and Portland, Oregon; Delta launching nonstop service to
John F. Kennedy (New York); US Airways announcing a nonstop flight to Philadelphia International Airport starting September 2012; and AirTran Airways, a subsidiary of Southwest Airlines, starting service at ABIA with the launch of its new nonstop service to Cancun. In addition, ABIA is gearing up for the 2012 Formula One races.
As part of striving to make Austin the best-managed city in the country and creating a sustainable future, the Aviation Department’s strategic focus includes the following: customer and community value, operational excellence, environmental stewardship, and economic sustainability. ABIA is committed to developing the airport in a way that meets the needs of the present without compromising the needs of future generations and has recently completed its first Sustainability Report, which will help to communicate to the community and business partners ABIA’s strategies for a sustainable future. The Aviation Department continues to seek out creative ways to reduce costs, increase non-airline revenue, and improve the efficiency and effectiveness of its operations.
With a staff that is committed to serving the community, the airport will continue providing excellent customer service, “Austin style”.
Jim Smith, Executive Director
2012-13 Proposed Budget, Austin, TX
520 | Volume I
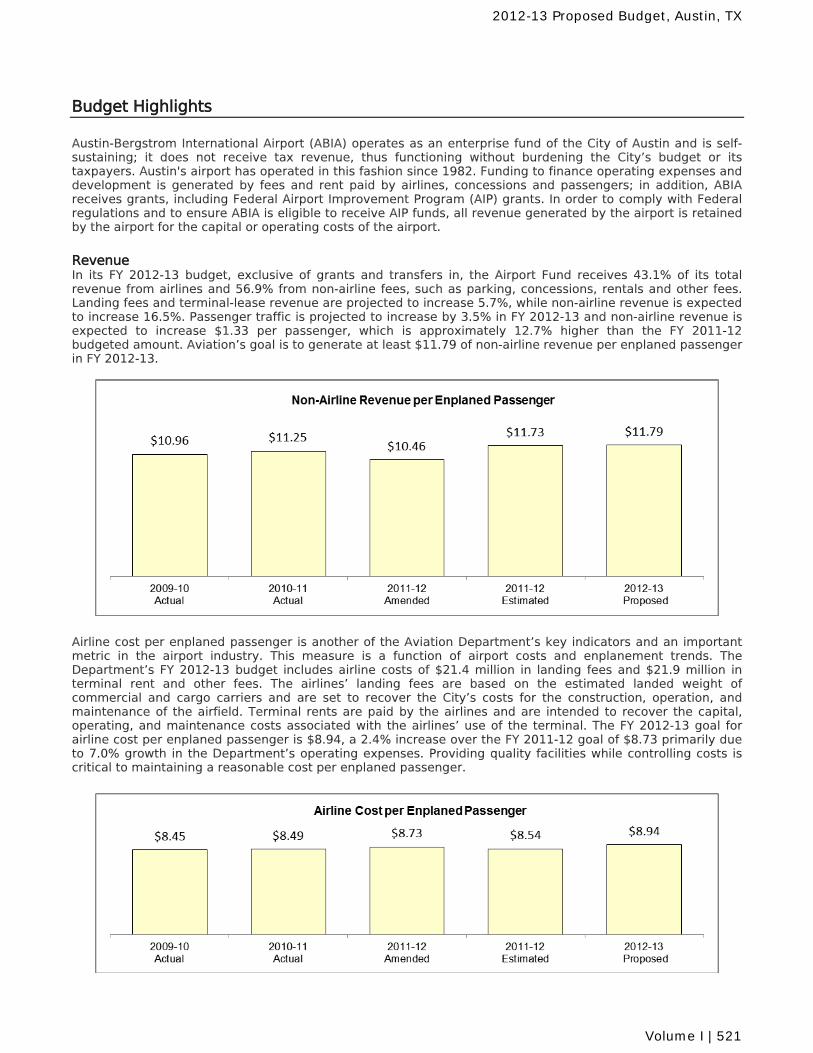
Budget Highlights
Austin-Bergstrom International Airport (ABIA) operates as an enterprise fund of the City of Austin and is self-sustaining; it does not receive tax revenue, thus functioning without burdening the City’s budget or its taxpayers. Austin's airport has operated in this fashion since 1982. Funding to finance operating expenses and development is generated by fees and rent paid by airlines, concessions and passengers; in addition, ABIA receives grants, including Federal Airport Improvement Program (AIP) grants. In order to comply with Federal regulations and to ensure ABIA is eligible to receive AIP funds, all revenue generated by the airport is retained by the airport for the capital or operating costs of the airport.
Revenue In its FY 2012-13 budget, exclusive of grants and transfers in, the Airport Fund receives 43.1% of its total revenue from airlines and 56.9% from non-airline fees, such as parking, concessions, rentals and other fees. Landing fees and terminal-lease revenue are projected to increase 5.7%, while non-airline revenue is expected to increase 16.5%. Passenger traffic is projected to increase by 3.5% in FY 2012-13 and non-airline revenue is expected to increase $1.33 per passenger, which is approximately 12.7% higher than the FY 2011-12 budgeted amount. Aviation’s goal is to generate at least $11.79 of non-airline revenue per enplaned passenger in FY 2012-13.
Airline cost per enplaned passenger is another of the Aviation Department’s key indicators and an important metric in the airport industry. This measure is a function of airport costs and enplanement trends. The Department’s FY 2012-13 budget includes airline costs of $21.4 million in landing fees and $21.9 million in terminal rent and other fees. The airlines’ landing fees are based on the estimated landed weight of commercial and cargo carriers and are set to recover the City’s costs for the construction, operation, and maintenance of the airfield. Terminal rents are paid by the airlines and are intended to recover the capital, operating, and maintenance costs associated with the airlines’ use of the terminal. The FY 2012-13 goal for airline cost per enplaned passenger is $8.94, a 2.4% increase over the FY 2011-12 goal of $8.73 primarily due to 7.0% growth in the Department’s operating expenses. Providing quality facilities while controlling costs is critical to maintaining a reasonable cost per enplaned passenger.
2012-13 Proposed Budget, Austin, TX
Volume I | 521
Requirements There are four new positions included in the Aviation Department’s FY 2012-13 budget: a Safety Management System Manager for the Operations Division, an Airport Maintenance Coordinator for the Building Maintenance Division, a Business Systems Analyst for the MaxAdmin Division, and a Network Systems Administrator for the Information Technology Support Division.
To ensure adequate funding for debt-service coverage, a $7.8 million transfer from the Airport Capital Fund to the Operating Fund is budgeted. Debt Service requirements total $18.5 million, a decrease of $553,000 from the prior fiscal year. Aviation’s projected revenue in excess of requirements, $21.8 million, is to be transferred to the Airport Capital Fund and used for capital improvement projects.
The Budget includes a $455,000 increase in the contribution to the Employees’ Retirement System; it also includes $592,000 for annualized costs associated with wage adjustments to be implemented in FY 2012-13. An increase of 3.0%, or $112,000, for medical insurance is included as well. Capital Budget The FY 2012-13 Capital Budget includes $24.5 million for ABIA Capital Improvements. The focus of Aviation’s Capital Improvements Program is to address terminal and other airport facility improvements. The major construction project for ABIA beginning in FY 2012-13 is the $6-million Consolidated Rental Car Facility. This project will be bond funded and the debt will be serviced by Rental Car Customer Facility Charges. The airport terminal has been open for thirteen years and has gently aged. $1.3 million will be expended on refurbishing the airport’s freight and garage elevators to modernize and replace outdated elements of the elevator systems, upgrading and replacing the terminal dry pipe fire protection system, and ongoing electrical improvements to ensure the continued efficient operation of the terminal building necessary to meet the requirements of its tenants. Landside projects will include internal parking garage ramps—as part of the larger Consolidated Car Rental Project—which will provide connectivity between the third floor of the garage and the first two floors, and $2 million in roadway improvements. Airside projects total $2.7 million and include the design of a new taxiway alpha extension that will improve aircraft taxiing times and reduce aircraft air emissions.
Other Funds
Airport Capital Fund The Airport Capital Fund was established in September 1989 by an ordinance authorizing the issuance of $30 million of Airport System Prior Lien Revenue Bonds for new airport development. As specified in the ordinance, the Airport Operating Fund is required to transfer the excess of available funds over total requirements, less a reserve for future operating expenses, to the Airport Capital Fund on an annual basis. These funds may be used only for lawful purposes related to the Airport System, including expenditures associated with the Airport Capital Improvements Program (CIP). Total available funds of $21.9 million are projected for FY 2012-13. The major source of available funds is a projected transfer of $21.8 million from the Airport Operating Fund. Interest income of $154,000 is also projected. A transfer to the ABIA CIP fund will provide $22.1 million in funding for capital projects associated with improvements at the airport. Additionally, a $7.8 million transfer to the Airport Operating Fund is anticipated to assure adequate funding for debt-service coverage.
2012-13 Proposed Budget, Austin, TX
522 | Volume I
Revenue Changes Dollars
The Budget includes an increase in airline revenue due to higher rental andlanding fees. $2,340,000
Due to projected passenger growth of 3.5% and parking rate increases that tookeffect in May 2012, the Budget includes an increase in parking revenue. $5,972,000
Other concessions revenue, including rental car, food and beverage, news andgifts, and advertising, is budgeted to increase as a result of the 3.5% passengergrowth projection. $2,119,000
The Budget includes a decrease in interest income due to market conditions. ($136,000)
Expenditure Changes FTEs Dollars
CitywideThe Budget includes $591,598 for salary increases associated with wageadjustments in FY 2012-13. An additional $111,645 is included in the Budget forincreased City contributions for health insurance. $703,243
The Budget includes an increase for wage adjustments associated with theimplementation of a market study. $118,280
The Budget includes supplemental funding for the Employees' Retirement Systemthat is equivalent to 2% of payroll for non-civil service employees to help improvethe funded status of the pension system. $455,037
Facilities Management, Operations and Airport SecurityAn Airport Maintenance Coordinator position is included to coordinate, plan andprovide oversight to all ABIA maintenance activities. 1.00 $76,224
A Business Systems Analyst position will have a key role in the progression of theDepartment's Enterprise Asset Management System (Maximo) by assisting withthe software integration, testing, training and implementation phases. 1.00 $88,037
The Budget includes a Safety Management System Manager position to implementthe Airport Safety Management System (SMS) required by the Federal AviationAdministration (FAA). 1.00 $97,603
The Budget includes an increase in Airport Police Department (APD)reimbursement expenses for costs associated with salary increases. $378,996
Due to rising prices and growing customer demand, expenses for householdcleaning supplies are increasing. $144,050
Funding is included for overtime and holidays worked for the security division. $113,000
The Budget includes additional funding for painting supplies and for maintenanceof airport runways. $137,000
Significant ChangesAviation
Airport Fund
2012-13 Proposed Budget, Austin, TX
Volume I | 523
Expenditure Changes FTEs Dollars
Additional funding is included for interdepartmental service costs due to increasingfirefighter wages and benefits. $244,483
The five-year checkpoints and K-9 grant agreements between the HomelandSecurity Transportation Security Administration (TSA) and the Aviation Departmentwill end in FY 2012-13, decreasing grant reimbursements. $625,890
Additional funding is included for temporary employees and overtime and holidaypay in the building maintenance division. $103,206
The Budget includes funding for City increases in drainage and transportationfees. $118,736
Airport Planning and DevelopmentThe Budget includes funding for an internship position in the Planning andEngineering division. $34,000
Additional funding is included for interdepartmental charges for Public Worksservices. $100,000
Support ServicesAdditional funding is included for software maintenance, small tools and minorequipment. $77,710
The Budget includes funding for overtime and on-call pay in the InformationSystems division. $31,500
Air service development funding is increasing in FY 2012-13. $60,000
Additional funding is included for advertising and printing expenses. $55,000
The Budget includes an increase for 2 part-time internship positions in the Financearea. $41,600
Funding is included for costs associated with anticipated special events. $179,016
A Network System Administrator position is being created to provide support to allwireless systems, such as the Ground Transportation Management System (GTMS),Airport Security and Operations Control System (ASOCS) and Asset ManagementSystem (Maximo). 1.00 $88,037
The Budget includes an increase in funding for airline incentives to attract new airservice. $124,500
Transfers/Other requirementsThe City administrative support and the Communications Technology Managementtransfers are increasing by $639,992 and $99,756, respectively. $739,748
Funding is included for an increased Operating Reserve transfer. $673,050
Transfers to the workers' compensation and accrued payroll funds and theallocation for trunked radio services are increasing by $58,252, $31,035 and$43,438, respectively. $132,725
Aviation is budgeting a decrease in debt-service requirements due to lowerinterest rates and early retirement of debt. ($552,558)
An increase is included in the Budget for the contribution to the Airport CapitalFund, which reflects the excess of available funds over total operationalrequirements. $5,288,353
2012-13 Proposed Budget, Austin, TX
524 | Volume I
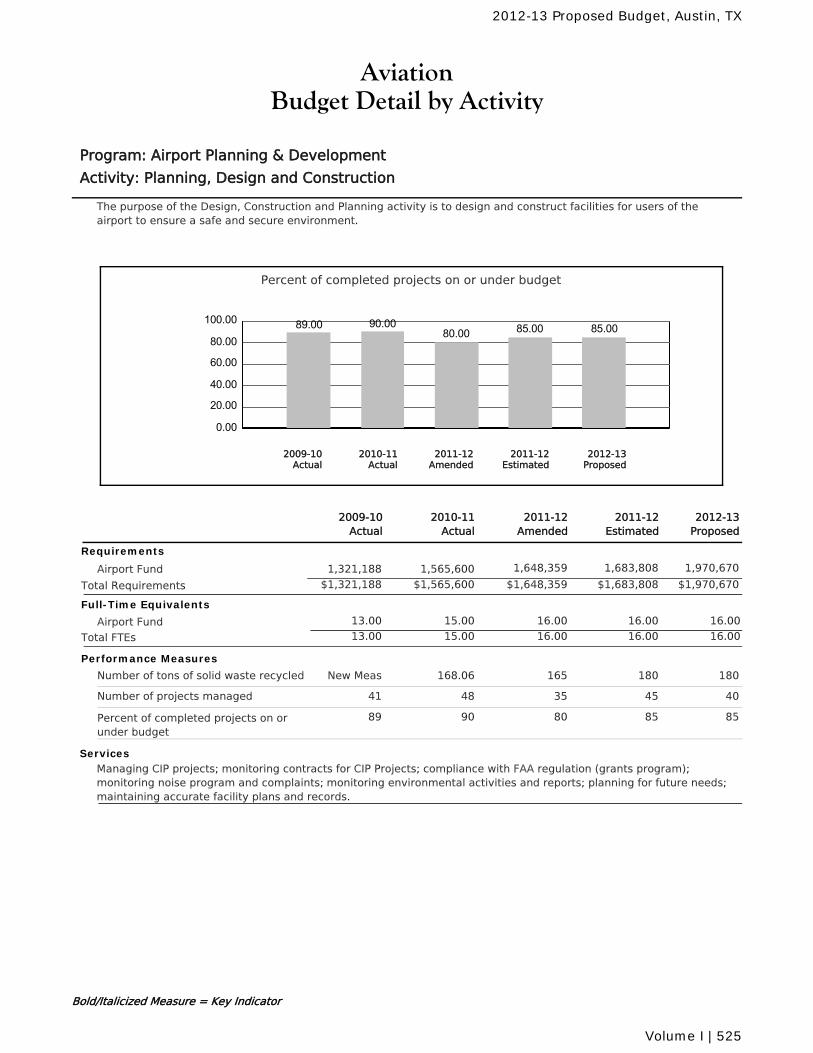
AviationBudget Detail by Activity
Program: Airport Planning & Development
Activity: Planning, Design and Construction
The purpose of the Design, Construction and Planning activity is to design and construct facilities for users of theairport to ensure a safe and secure environment.
Percent of completed projects on or under budget
0.00
20.00
40.00
60.00
80.00
100.00 89.00 90.0080.00 85.00 85.00
2010-11Actual
2012-13Proposed
2011-12Amended
2011-12Estimated
2009-10Actual
2011-12Amended
2010-11Actual
2011-12Estimated
2012-13Proposed
2009-10Actual
Requirements
Airport Fund 1,648,359 1,683,808 1,970,6701,565,6001,321,188
$1,648,359 $1,683,808 $1,970,670Total Requirements $1,565,600$1,321,188
Full-Time Equivalents
Airport Fund 15.00 16.00 16.00 16.0013.00
Total FTEs 15.00 16.00 16.00 16.0013.00
Performance Measures
Number of tons of solid waste recycled 165168.06 180 180New Meas
Number of projects managed 3548 45 4041
Percent of completed projects on orunder budget
8090 85 8589
ServicesManaging CIP projects; monitoring contracts for CIP Projects; compliance with FAA regulation (grants program);monitoring noise program and complaints; monitoring environmental activities and reports; planning for future needs;maintaining accurate facility plans and records.
Bold/Italicized Measure = Key Indicator
2012-13 Proposed Budget, Austin, TX
Volume I | 525
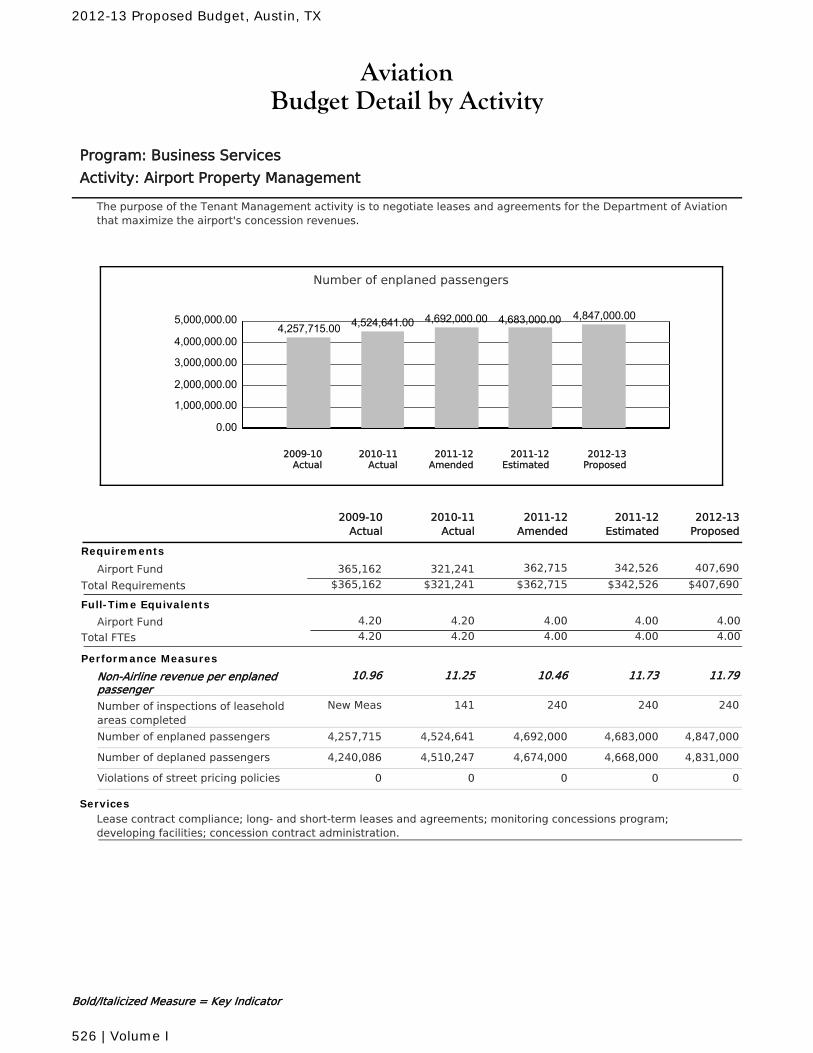
AviationBudget Detail by Activity
Program: Business Services
Activity: Airport Property Management
The purpose of the Tenant Management activity is to negotiate leases and agreements for the Department of Aviationthat maximize the airport's concession revenues.
Number of enplaned passengers
0.00
1,000,000.00
2,000,000.00
3,000,000.00
4,000,000.00
5,000,000.004,257,715.00 4,524,641.00 4,692,000.00 4,683,000.00 4,847,000.00
2010-11Actual
2012-13Proposed
2011-12Amended
2011-12Estimated
2009-10Actual
2011-12Amended
2010-11Actual
2011-12Estimated
2012-13Proposed
2009-10Actual
Requirements
Airport Fund 362,715 342,526 407,690321,241365,162
$362,715 $342,526 $407,690Total Requirements $321,241$365,162
Full-Time Equivalents
Airport Fund 4.20 4.00 4.00 4.004.20
Total FTEs 4.20 4.00 4.00 4.004.20
Performance Measures
Non-Airline revenue per enplanedpassenger
10.4611.25 11.73 11.7910.96
Number of inspections of leaseholdareas completed
240141 240 240New Meas
Number of enplaned passengers 4,692,0004,524,641 4,683,000 4,847,0004,257,715
Number of deplaned passengers 4,674,0004,510,247 4,668,000 4,831,0004,240,086
Violations of street pricing policies 00 0 00
ServicesLease contract compliance; long- and short-term leases and agreements; monitoring concessions program;developing facilities; concession contract administration.
Bold/Italicized Measure = Key Indicator
2012-13 Proposed Budget, Austin, TX
526 | Volume I
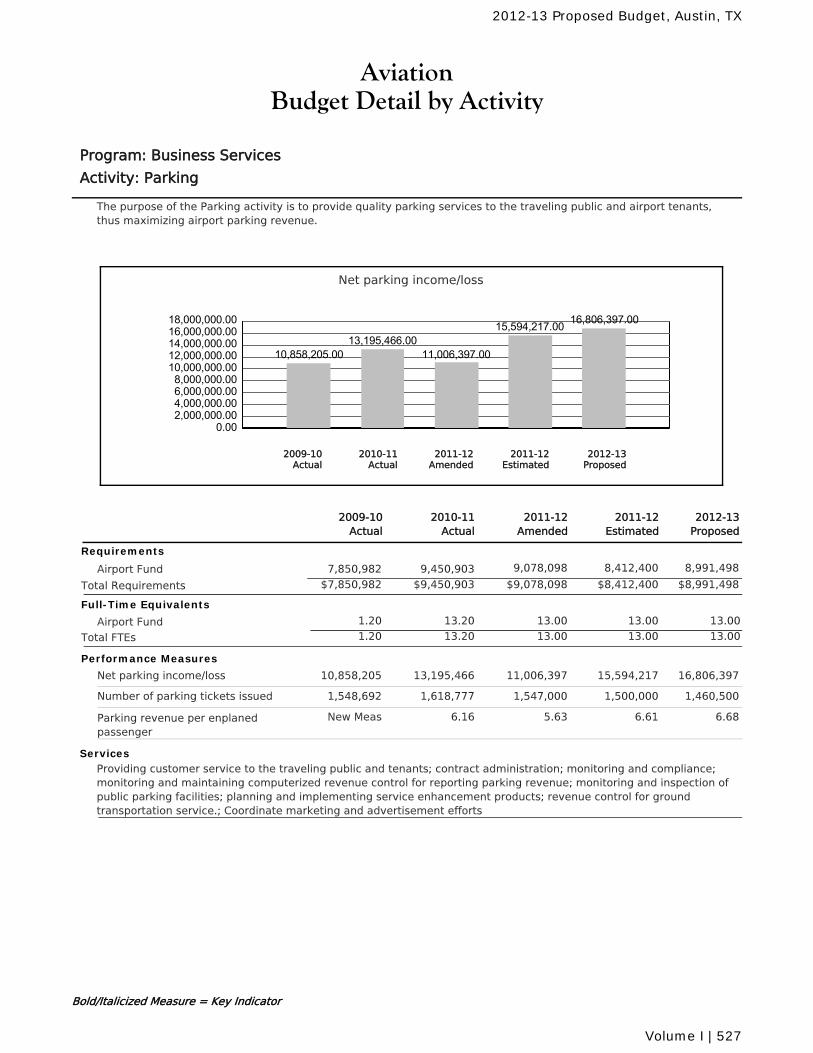
AviationBudget Detail by Activity
Program: Business Services
Activity: Parking
The purpose of the Parking activity is to provide quality parking services to the traveling public and airport tenants,thus maximizing airport parking revenue.
Net parking income/loss
0.002,000,000.004,000,000.006,000,000.008,000,000.0010,000,000.0012,000,000.0014,000,000.0016,000,000.0018,000,000.00
10,858,205.0013,195,466.00
11,006,397.00
15,594,217.00 16,806,397.00
2010-11Actual
2012-13Proposed
2011-12Amended
2011-12Estimated
2009-10Actual
2011-12Amended
2010-11Actual
2011-12Estimated
2012-13Proposed
2009-10Actual
Requirements
Airport Fund 9,078,098 8,412,400 8,991,4989,450,9037,850,982
$9,078,098 $8,412,400 $8,991,498Total Requirements $9,450,903$7,850,982
Full-Time Equivalents
Airport Fund 13.20 13.00 13.00 13.001.20
Total FTEs 13.20 13.00 13.00 13.001.20
Performance Measures
Net parking income/loss 11,006,39713,195,466 15,594,217 16,806,39710,858,205
Number of parking tickets issued 1,547,0001,618,777 1,500,000 1,460,5001,548,692
Parking revenue per enplanedpassenger
5.636.16 6.61 6.68New Meas
ServicesProviding customer service to the traveling public and tenants; contract administration; monitoring and compliance;monitoring and maintaining computerized revenue control for reporting parking revenue; monitoring and inspection ofpublic parking facilities; planning and implementing service enhancement products; revenue control for groundtransportation service.; Coordinate marketing and advertisement efforts
Bold/Italicized Measure = Key Indicator
2012-13 Proposed Budget, Austin, TX
Volume I | 527
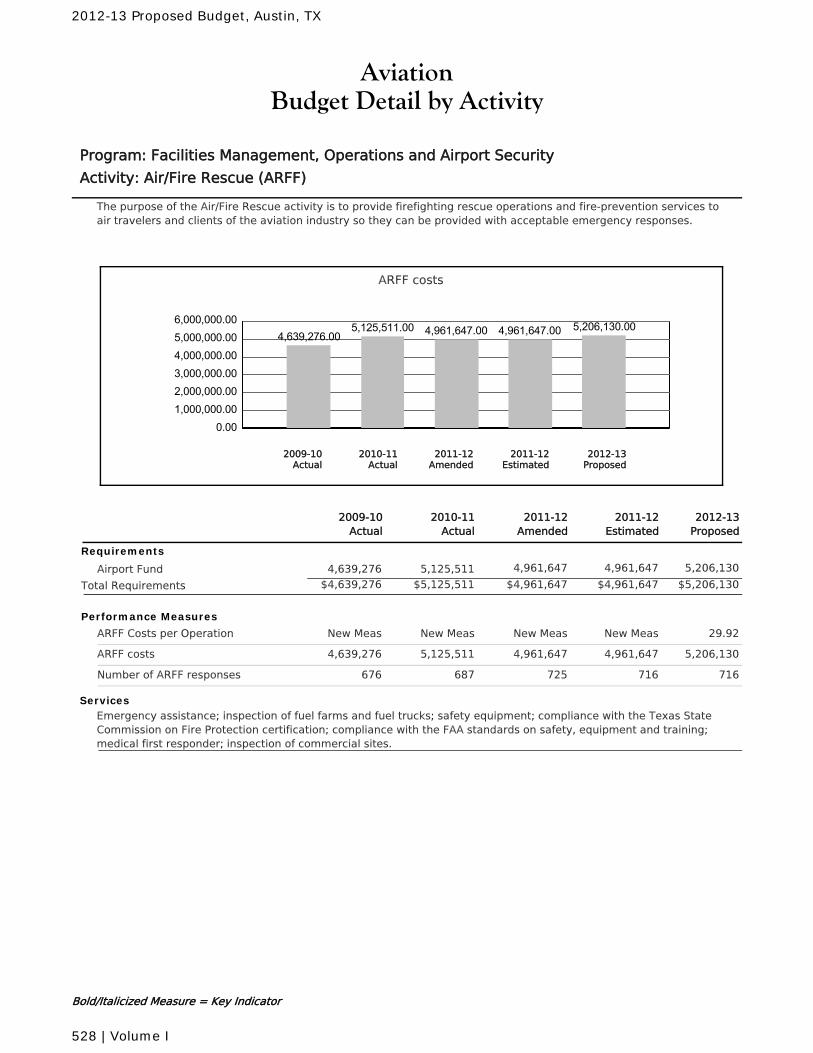
AviationBudget Detail by Activity
Program: Facilities Management, Operations and Airport Security
Activity: Air/Fire Rescue (ARFF)
The purpose of the Air/Fire Rescue activity is to provide firefighting rescue operations and fire-prevention services toair travelers and clients of the aviation industry so they can be provided with acceptable emergency responses.
ARFF costs
0.001,000,000.002,000,000.003,000,000.004,000,000.005,000,000.006,000,000.00
4,639,276.005,125,511.00 4,961,647.00 4,961,647.00 5,206,130.00
2010-11Actual
2012-13Proposed
2011-12Amended
2011-12Estimated
2009-10Actual
2011-12Amended
2010-11Actual
2011-12Estimated
2012-13Proposed
2009-10Actual
Requirements
Airport Fund 4,961,647 4,961,647 5,206,1305,125,5114,639,276
$4,961,647 $4,961,647 $5,206,130Total Requirements $5,125,511$4,639,276
Performance Measures
ARFF Costs per Operation New MeasNew Meas New Meas 29.92New Meas
ARFF costs 4,961,6475,125,511 4,961,647 5,206,1304,639,276
Number of ARFF responses 725687 716 716676
ServicesEmergency assistance; inspection of fuel farms and fuel trucks; safety equipment; compliance with the Texas StateCommission on Fire Protection certification; compliance with the FAA standards on safety, equipment and training;medical first responder; inspection of commercial sites.
Bold/Italicized Measure = Key Indicator
2012-13 Proposed Budget, Austin, TX
528 | Volume I
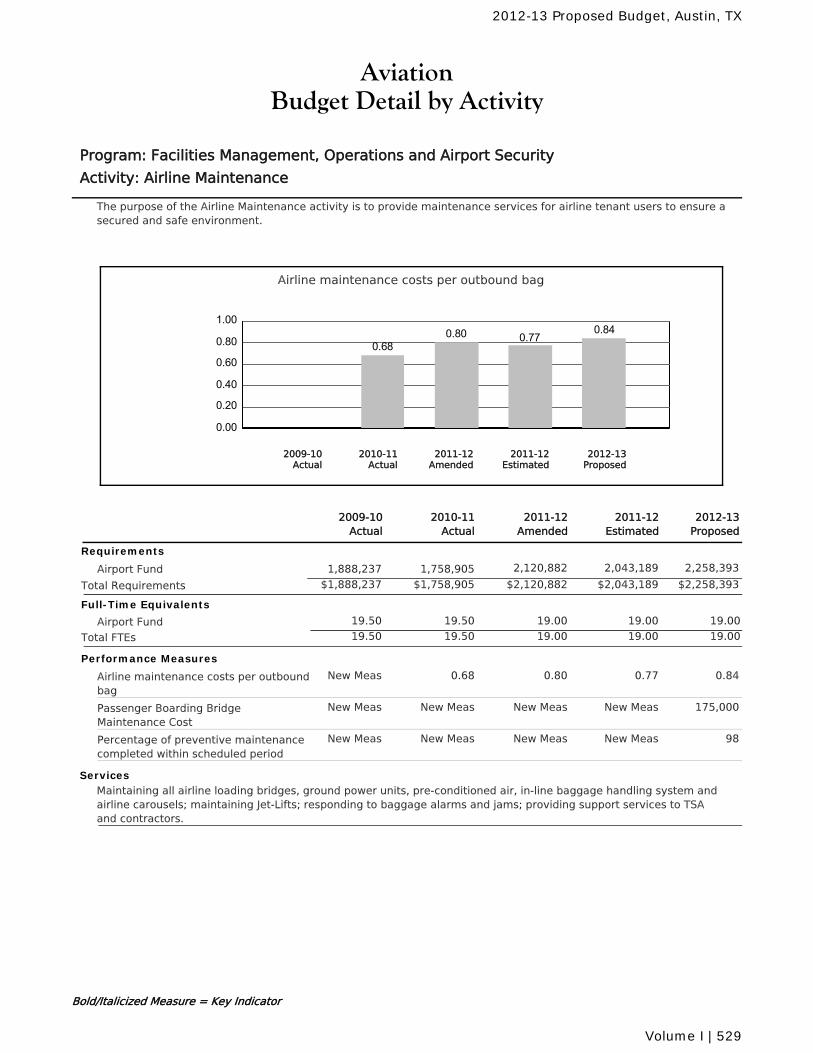
AviationBudget Detail by Activity
Program: Facilities Management, Operations and Airport Security
Activity: Airline Maintenance
The purpose of the Airline Maintenance activity is to provide maintenance services for airline tenant users to ensure asecured and safe environment.
Airline maintenance costs per outbound bag
0.00
0.20
0.40
0.60
0.80
1.00
0.680.80 0.77
0.84
2010-11Actual
2012-13Proposed
2011-12Amended
2011-12Estimated
2009-10Actual
2011-12Amended
2010-11Actual
2011-12Estimated
2012-13Proposed
2009-10Actual
Requirements
Airport Fund 2,120,882 2,043,189 2,258,3931,758,9051,888,237
$2,120,882 $2,043,189 $2,258,393Total Requirements $1,758,905$1,888,237
Full-Time Equivalents
Airport Fund 19.50 19.00 19.00 19.0019.50
Total FTEs 19.50 19.00 19.00 19.0019.50
Performance Measures
Airline maintenance costs per outboundbag
0.800.68 0.77 0.84New Meas
Passenger Boarding BridgeMaintenance Cost
New MeasNew Meas New Meas 175,000New Meas
Percentage of preventive maintenancecompleted within scheduled period
New MeasNew Meas New Meas 98New Meas
ServicesMaintaining all airline loading bridges, ground power units, pre-conditioned air, in-line baggage handling system andairline carousels; maintaining Jet-Lifts; responding to baggage alarms and jams; providing support services to TSAand contractors.
Bold/Italicized Measure = Key Indicator
2012-13 Proposed Budget, Austin, TX
Volume I | 529
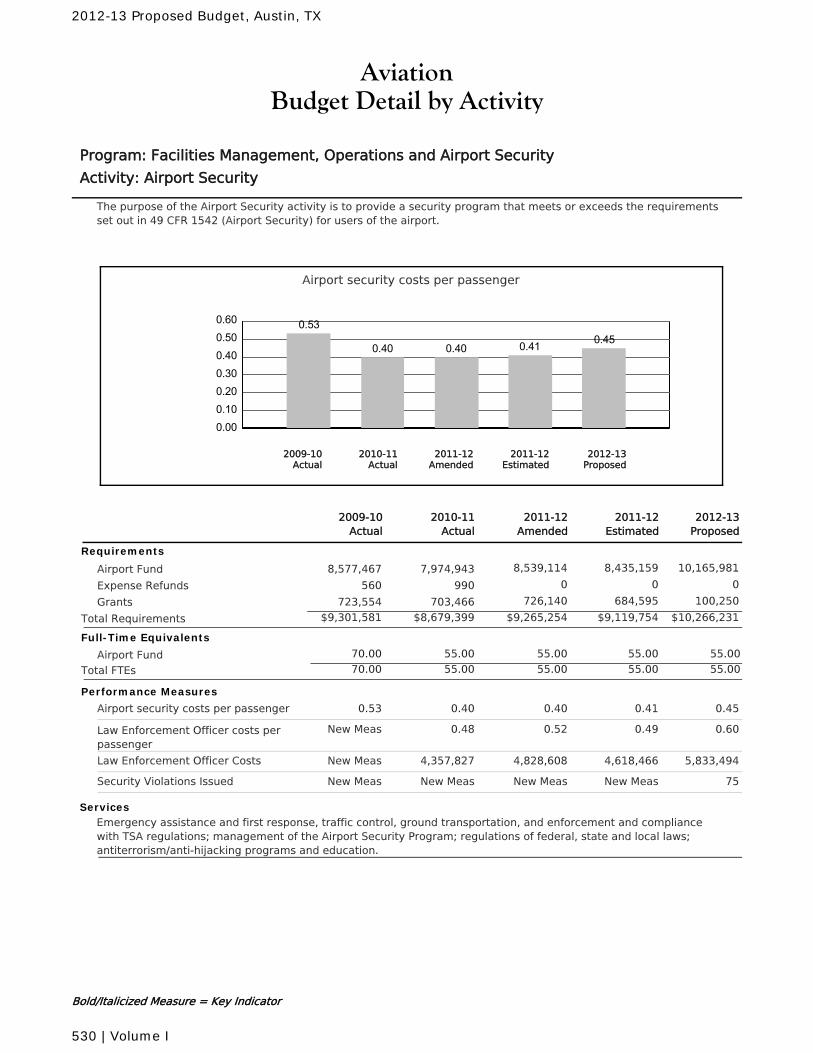
AviationBudget Detail by Activity
Program: Facilities Management, Operations and Airport Security
Activity: Airport Security
The purpose of the Airport Security activity is to provide a security program that meets or exceeds the requirementsset out in 49 CFR 1542 (Airport Security) for users of the airport.
Airport security costs per passenger
0.000.100.200.300.400.500.60 0.53
0.40 0.40 0.41 0.45
2010-11Actual
2012-13Proposed
2011-12Amended
2011-12Estimated
2009-10Actual
2011-12Amended
2010-11Actual
2011-12Estimated
2012-13Proposed
2009-10Actual
Requirements
Airport Fund 8,539,114 8,435,159 10,165,9817,974,9438,577,467
Expense Refunds 0 0 0990560
Grants 726,140 684,595 100,250703,466723,554
$9,265,254 $9,119,754 $10,266,231Total Requirements $8,679,399$9,301,581
Full-Time Equivalents
Airport Fund 55.00 55.00 55.00 55.0070.00
Total FTEs 55.00 55.00 55.00 55.0070.00
Performance Measures
Airport security costs per passenger 0.400.40 0.41 0.450.53
Law Enforcement Officer costs perpassenger
0.520.48 0.49 0.60New Meas
Law Enforcement Officer Costs 4,828,6084,357,827 4,618,466 5,833,494New Meas
Security Violations Issued New MeasNew Meas New Meas 75New Meas
ServicesEmergency assistance and first response, traffic control, ground transportation, and enforcement and compliancewith TSA regulations; management of the Airport Security Program; regulations of federal, state and local laws;antiterrorism/anti-hijacking programs and education.
Bold/Italicized Measure = Key Indicator
2012-13 Proposed Budget, Austin, TX
530 | Volume I
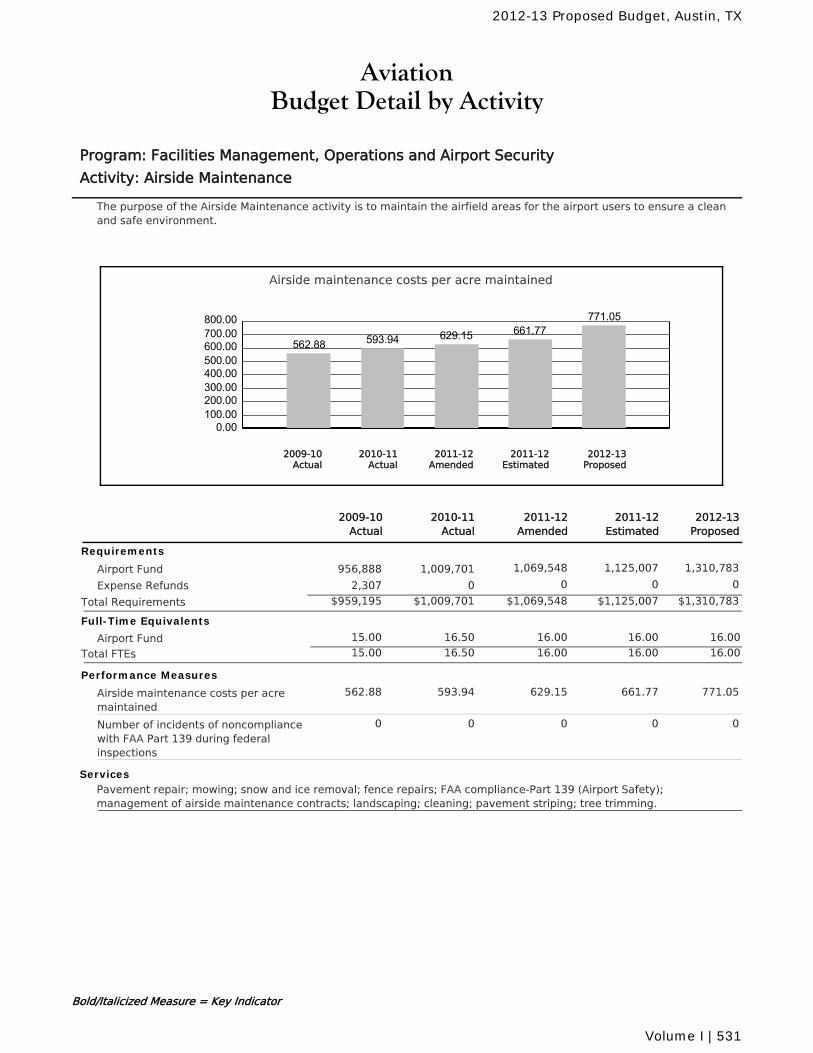
AviationBudget Detail by Activity
Program: Facilities Management, Operations and Airport Security
Activity: Airside Maintenance
The purpose of the Airside Maintenance activity is to maintain the airfield areas for the airport users to ensure a cleanand safe environment.
Airside maintenance costs per acre maintained
0.00100.00200.00300.00400.00500.00600.00700.00800.00
562.88 593.94 629.15 661.77771.05
2010-11Actual
2012-13Proposed
2011-12Amended
2011-12Estimated
2009-10Actual
2011-12Amended
2010-11Actual
2011-12Estimated
2012-13Proposed
2009-10Actual
Requirements
Airport Fund 1,069,548 1,125,007 1,310,7831,009,701956,888
Expense Refunds 0 0 002,307
$1,069,548 $1,125,007 $1,310,783Total Requirements $1,009,701$959,195
Full-Time Equivalents
Airport Fund 16.50 16.00 16.00 16.0015.00
Total FTEs 16.50 16.00 16.00 16.0015.00
Performance Measures
Airside maintenance costs per acremaintained
629.15593.94 661.77 771.05562.88
Number of incidents of noncompliancewith FAA Part 139 during federalinspections
00 0 00
ServicesPavement repair; mowing; snow and ice removal; fence repairs; FAA compliance-Part 139 (Airport Safety);management of airside maintenance contracts; landscaping; cleaning; pavement striping; tree trimming.
Bold/Italicized Measure = Key Indicator
2012-13 Proposed Budget, Austin, TX
Volume I | 531

AviationBudget Detail by Activity
Program: Facilities Management, Operations and Airport Security
Activity: Building Maintenance
The purpose of the Building Maintenance activity is to provide maintenance services for users of the airport so theywill be in a safe environment.
Building maintenance cost per square foot
0.000.501.001.502.002.503.003.504.004.50
3.44 3.734.19 3.96 4.19
2010-11Actual
2012-13Proposed
2011-12Amended
2011-12Estimated
2009-10Actual
2011-12Amended
2010-11Actual
2011-12Estimated
2012-13Proposed
2009-10Actual
Requirements
Airport Fund 9,664,096 9,688,926 10,234,5948,596,6317,943,617
Expense Refunds 0 0 00125,826
$9,664,096 $9,688,926 $10,234,594Total Requirements $8,596,631$8,069,443
Full-Time Equivalents
Airport Fund 34.50 35.00 35.00 36.0034.50
Total FTEs 34.50 35.00 35.00 36.0034.50
Performance Measures
Annual Gallons of Water Used inTerminal
New MeasNew Meas New Meas 72,200New Meas
Annual Kilowatts used in Terminal New MeasNew Meas New Meas 20,500,000New Meas
Building maintenance cost per squarefoot
4.193.73 3.96 4.193.44
ServicesMaintaining airport terminal building systems which include plumbing, electrical, fire protection and suppression;maintaining airport terminal HVAC, elevator/escalator systems and all utilities.
Bold/Italicized Measure = Key Indicator
2012-13 Proposed Budget, Austin, TX
532 | Volume I
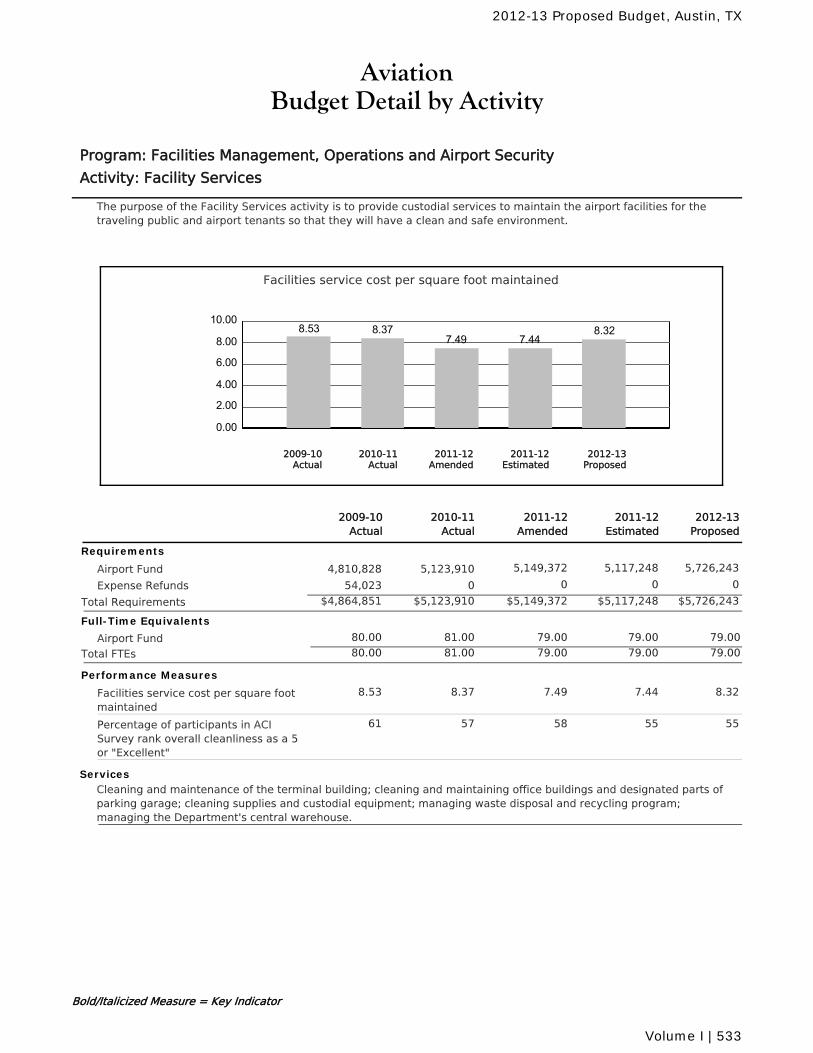
AviationBudget Detail by Activity
Program: Facilities Management, Operations and Airport Security
Activity: Facility Services
The purpose of the Facility Services activity is to provide custodial services to maintain the airport facilities for thetraveling public and airport tenants so that they will have a clean and safe environment.
Facilities service cost per square foot maintained
0.00
2.00
4.00
6.00
8.00
10.008.53 8.37
7.49 7.448.32
2010-11Actual
2012-13Proposed
2011-12Amended
2011-12Estimated
2009-10Actual
2011-12Amended
2010-11Actual
2011-12Estimated
2012-13Proposed
2009-10Actual
Requirements
Airport Fund 5,149,372 5,117,248 5,726,2435,123,9104,810,828
Expense Refunds 0 0 0054,023
$5,149,372 $5,117,248 $5,726,243Total Requirements $5,123,910$4,864,851
Full-Time Equivalents
Airport Fund 81.00 79.00 79.00 79.0080.00
Total FTEs 81.00 79.00 79.00 79.0080.00
Performance Measures
Facilities service cost per square footmaintained
7.498.37 7.44 8.328.53
Percentage of participants in ACISurvey rank overall cleanliness as a 5or "Excellent"
5857 55 5561
ServicesCleaning and maintenance of the terminal building; cleaning and maintaining office buildings and designated parts ofparking garage; cleaning supplies and custodial equipment; managing waste disposal and recycling program;managing the Department's central warehouse.
Bold/Italicized Measure = Key Indicator
2012-13 Proposed Budget, Austin, TX
Volume I | 533
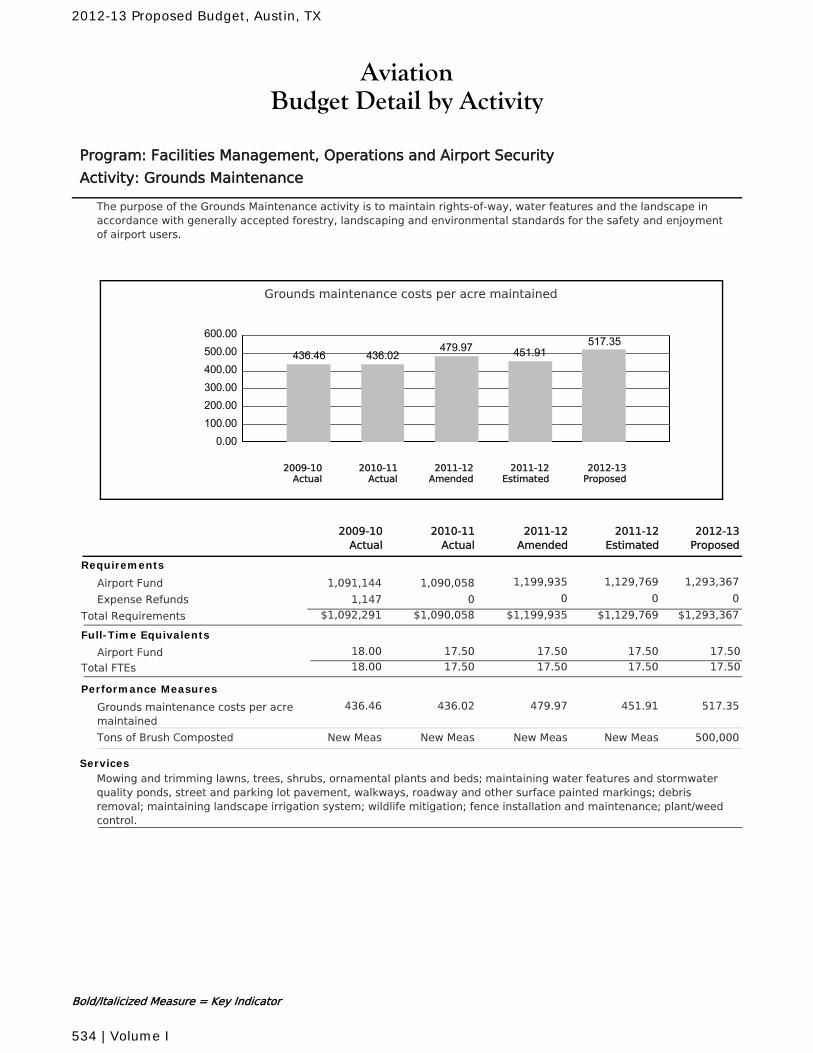
AviationBudget Detail by Activity
Program: Facilities Management, Operations and Airport Security
Activity: Grounds Maintenance
The purpose of the Grounds Maintenance activity is to maintain rights-of-way, water features and the landscape inaccordance with generally accepted forestry, landscaping and environmental standards for the safety and enjoymentof airport users.
Grounds maintenance costs per acre maintained
0.00100.00200.00300.00400.00500.00600.00
436.46 436.02479.97 451.91
517.35
2010-11Actual
2012-13Proposed
2011-12Amended
2011-12Estimated
2009-10Actual
2011-12Amended
2010-11Actual
2011-12Estimated
2012-13Proposed
2009-10Actual
Requirements
Airport Fund 1,199,935 1,129,769 1,293,3671,090,0581,091,144
Expense Refunds 0 0 001,147
$1,199,935 $1,129,769 $1,293,367Total Requirements $1,090,058$1,092,291
Full-Time Equivalents
Airport Fund 17.50 17.50 17.50 17.5018.00
Total FTEs 17.50 17.50 17.50 17.5018.00
Performance Measures
Grounds maintenance costs per acremaintained
479.97436.02 451.91 517.35436.46
Tons of Brush Composted New MeasNew Meas New Meas 500,000New Meas
ServicesMowing and trimming lawns, trees, shrubs, ornamental plants and beds; maintaining water features and stormwaterquality ponds, street and parking lot pavement, walkways, roadway and other surface painted markings; debrisremoval; maintaining landscape irrigation system; wildlife mitigation; fence installation and maintenance; plant/weedcontrol.
Bold/Italicized Measure = Key Indicator
2012-13 Proposed Budget, Austin, TX
534 | Volume I
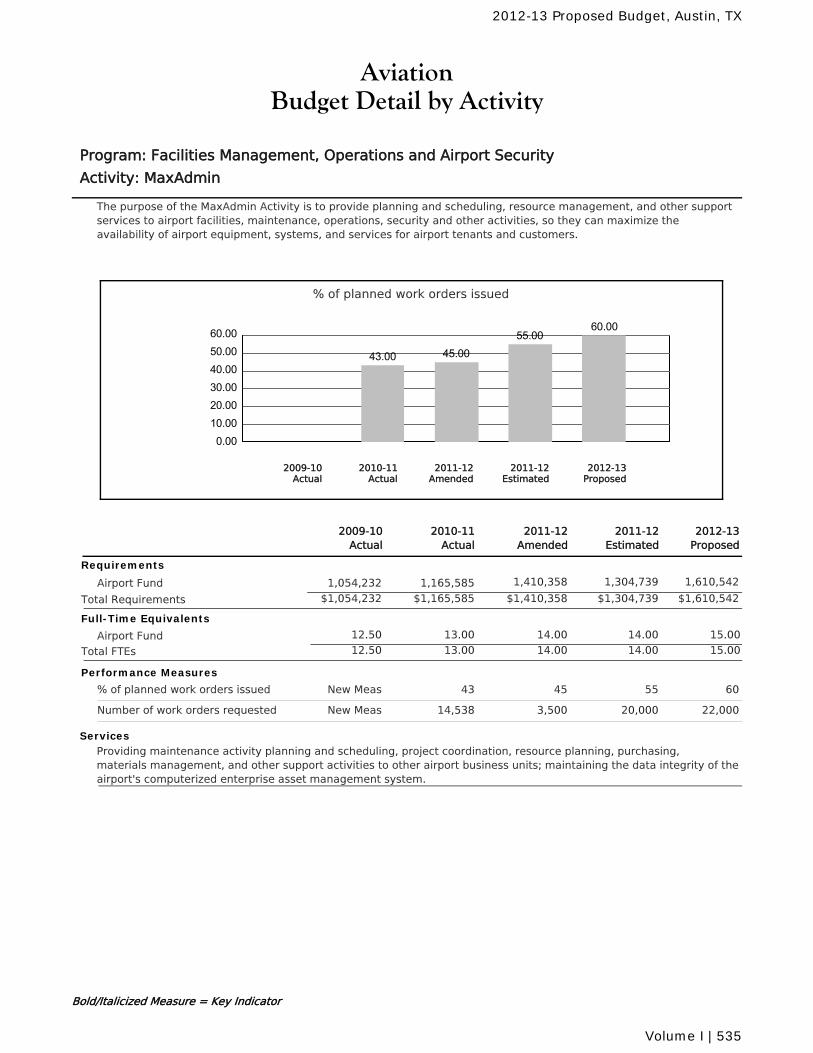
AviationBudget Detail by Activity
Program: Facilities Management, Operations and Airport Security
Activity: MaxAdmin
The purpose of the MaxAdmin Activity is to provide planning and scheduling, resource management, and other supportservices to airport facilities, maintenance, operations, security and other activities, so they can maximize theavailability of airport equipment, systems, and services for airport tenants and customers.
% of planned work orders issued
0.0010.0020.0030.0040.0050.0060.00
43.00 45.0055.00
60.00
2010-11Actual
2012-13Proposed
2011-12Amended
2011-12Estimated
2009-10Actual
2011-12Amended
2010-11Actual
2011-12Estimated
2012-13Proposed
2009-10Actual
Requirements
Airport Fund 1,410,358 1,304,739 1,610,5421,165,5851,054,232
$1,410,358 $1,304,739 $1,610,542Total Requirements $1,165,585$1,054,232
Full-Time Equivalents
Airport Fund 13.00 14.00 14.00 15.0012.50
Total FTEs 13.00 14.00 14.00 15.0012.50
Performance Measures
% of planned work orders issued 4543 55 60New Meas
Number of work orders requested 3,50014,538 20,000 22,000New Meas
ServicesProviding maintenance activity planning and scheduling, project coordination, resource planning, purchasing,materials management, and other support activities to other airport business units; maintaining the data integrity of theairport's computerized enterprise asset management system.
Bold/Italicized Measure = Key Indicator
2012-13 Proposed Budget, Austin, TX
Volume I | 535
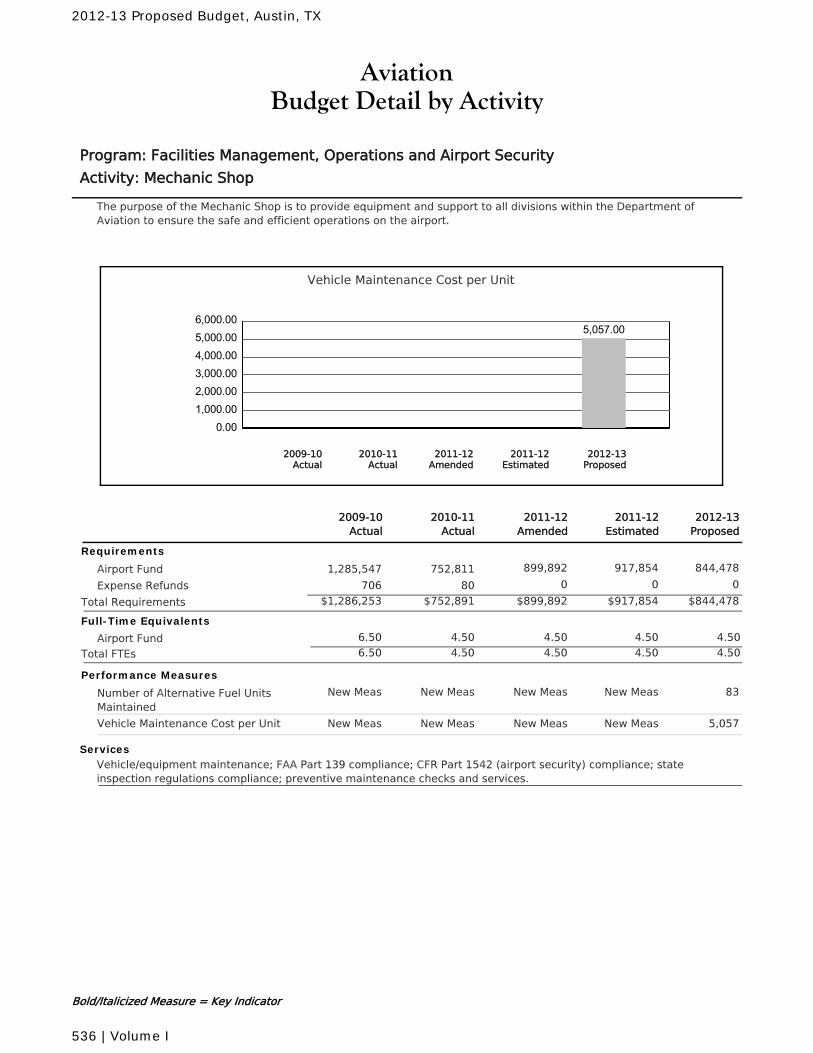
AviationBudget Detail by Activity
Program: Facilities Management, Operations and Airport Security
Activity: Mechanic Shop
The purpose of the Mechanic Shop is to provide equipment and support to all divisions within the Department ofAviation to ensure the safe and efficient operations on the airport.
Vehicle Maintenance Cost per Unit
0.001,000.002,000.003,000.004,000.005,000.006,000.00
5,057.00
2010-11Actual
2012-13Proposed
2011-12Amended
2011-12Estimated
2009-10Actual
2011-12Amended
2010-11Actual
2011-12Estimated
2012-13Proposed
2009-10Actual
Requirements
Airport Fund 899,892 917,854 844,478752,8111,285,547
Expense Refunds 0 0 080706
$899,892 $917,854 $844,478Total Requirements $752,891$1,286,253
Full-Time Equivalents
Airport Fund 4.50 4.50 4.50 4.506.50
Total FTEs 4.50 4.50 4.50 4.506.50
Performance Measures
Number of Alternative Fuel UnitsMaintained
New MeasNew Meas New Meas 83New Meas
Vehicle Maintenance Cost per Unit New MeasNew Meas New Meas 5,057New Meas
ServicesVehicle/equipment maintenance; FAA Part 139 compliance; CFR Part 1542 (airport security) compliance; stateinspection regulations compliance; preventive maintenance checks and services.
Bold/Italicized Measure = Key Indicator
2012-13 Proposed Budget, Austin, TX
536 | Volume I
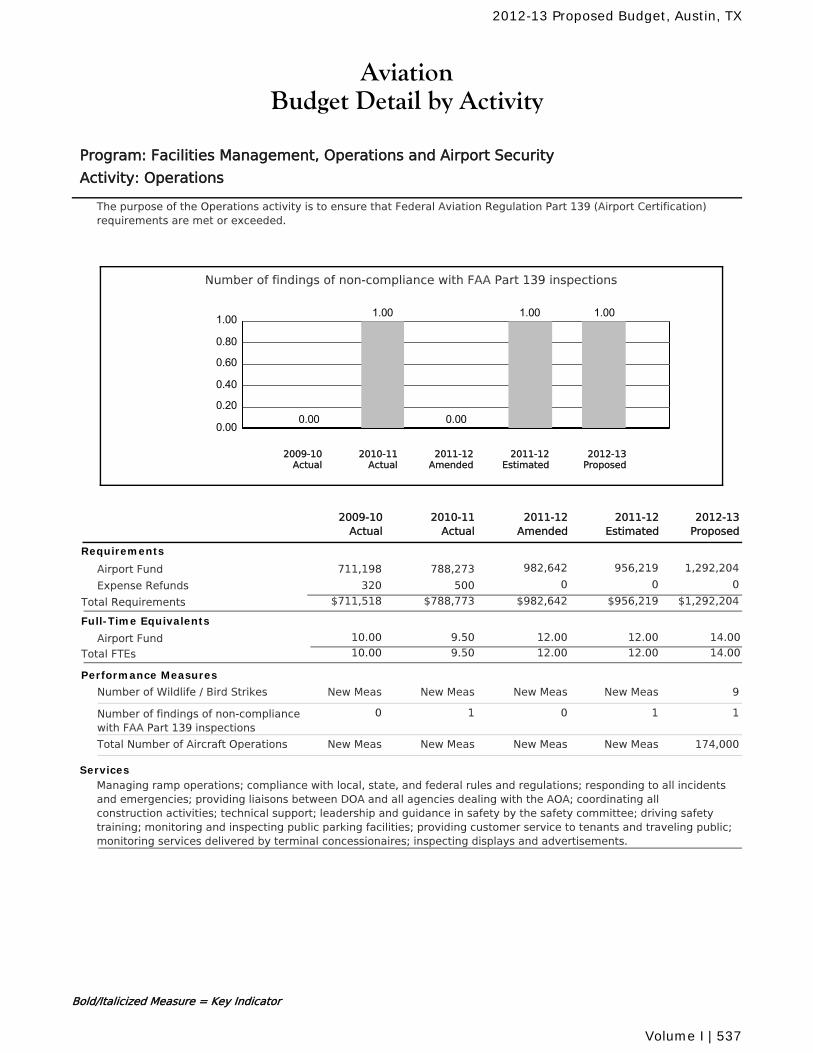
AviationBudget Detail by Activity
Program: Facilities Management, Operations and Airport Security
Activity: Operations
The purpose of the Operations activity is to ensure that Federal Aviation Regulation Part 139 (Airport Certification)requirements are met or exceeded.
Number of findings of non-compliance with FAA Part 139 inspections
0.00
0.20
0.40
0.60
0.80
1.00
0.00
1.00
0.00
1.00 1.00
2010-11Actual
2012-13Proposed
2011-12Amended
2011-12Estimated
2009-10Actual
2011-12Amended
2010-11Actual
2011-12Estimated
2012-13Proposed
2009-10Actual
Requirements
Airport Fund 982,642 956,219 1,292,204788,273711,198
Expense Refunds 0 0 0500320
$982,642 $956,219 $1,292,204Total Requirements $788,773$711,518
Full-Time Equivalents
Airport Fund 9.50 12.00 12.00 14.0010.00
Total FTEs 9.50 12.00 12.00 14.0010.00
Performance Measures
Number of Wildlife / Bird Strikes New MeasNew Meas New Meas 9New Meas
Number of findings of non-compliancewith FAA Part 139 inspections
01 1 10
Total Number of Aircraft Operations New MeasNew Meas New Meas 174,000New Meas
ServicesManaging ramp operations; compliance with local, state, and federal rules and regulations; responding to all incidentsand emergencies; providing liaisons between DOA and all agencies dealing with the AOA; coordinating allconstruction activities; technical support; leadership and guidance in safety by the safety committee; driving safetytraining; monitoring and inspecting public parking facilities; providing customer service to tenants and traveling public;monitoring services delivered by terminal concessionaires; inspecting displays and advertisements.
Bold/Italicized Measure = Key Indicator
2012-13 Proposed Budget, Austin, TX
Volume I | 537
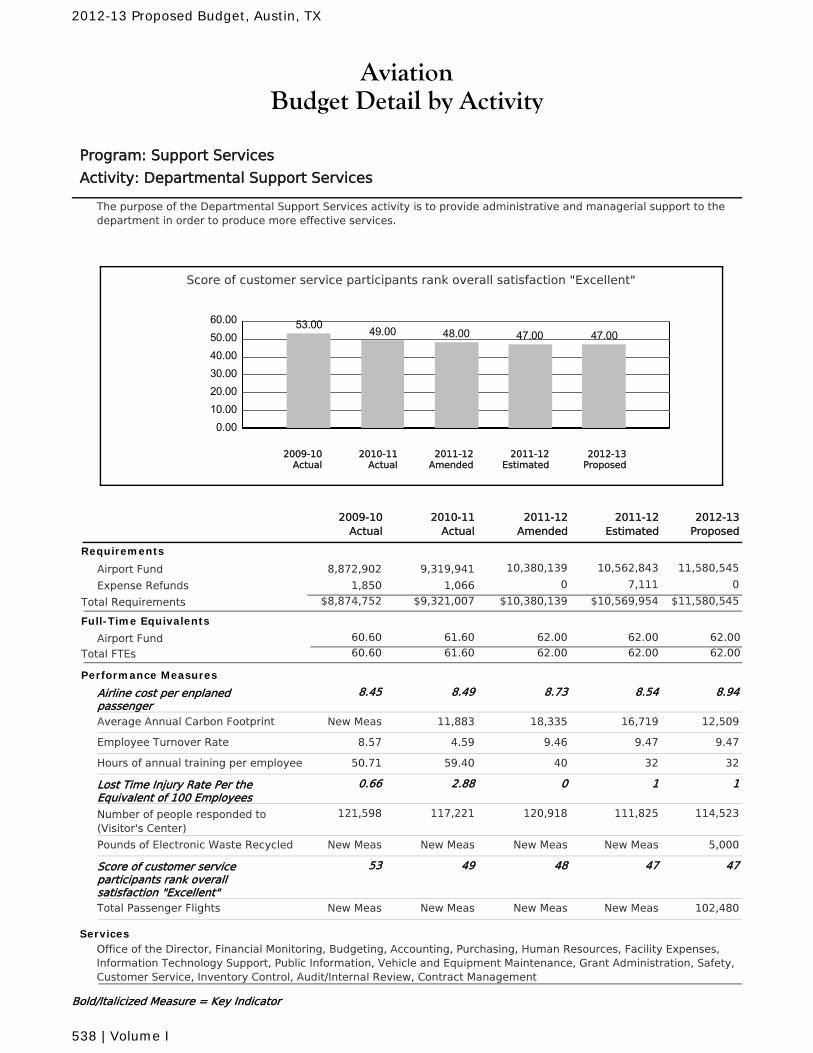
AviationBudget Detail by Activity
Program: Support Services
Activity: Departmental Support Services
The purpose of the Departmental Support Services activity is to provide administrative and managerial support to thedepartment in order to produce more effective services.
Score of customer service participants rank overall satisfaction "Excellent"
0.0010.0020.0030.0040.0050.0060.00 53.00 49.00 48.00 47.00 47.00
2010-11Actual
2012-13Proposed
2011-12Amended
2011-12Estimated
2009-10Actual
2011-12Amended
2010-11Actual
2011-12Estimated
2012-13Proposed
2009-10Actual
Requirements
Airport Fund 10,380,139 10,562,843 11,580,5459,319,9418,872,902
Expense Refunds 0 7,111 01,0661,850
$10,380,139 $10,569,954 $11,580,545Total Requirements $9,321,007$8,874,752
Full-Time Equivalents
Airport Fund 61.60 62.00 62.00 62.0060.60
Total FTEs 61.60 62.00 62.00 62.0060.60
Performance Measures
Airline cost per enplanedpassenger
8.738.49 8.54 8.948.45
Average Annual Carbon Footprint 18,33511,883 16,719 12,509New Meas
Employee Turnover Rate 9.464.59 9.47 9.478.57
Hours of annual training per employee 4059.40 32 3250.71
Lost Time Injury Rate Per theEquivalent of 100 Employees
02.88 1 10.66
Number of people responded to(Visitor's Center)
120,918117,221 111,825 114,523121,598
Pounds of Electronic Waste Recycled New MeasNew Meas New Meas 5,000New Meas
Score of customer serviceparticipants rank overallsatisfaction "Excellent"
4849 47 4753
Total Passenger Flights New MeasNew Meas New Meas 102,480New Meas
ServicesOffice of the Director, Financial Monitoring, Budgeting, Accounting, Purchasing, Human Resources, Facility Expenses,Information Technology Support, Public Information, Vehicle and Equipment Maintenance, Grant Administration, Safety,Customer Service, Inventory Control, Audit/Internal Review, Contract Management
Bold/Italicized Measure = Key Indicator
2012-13 Proposed Budget, Austin, TX
538 | Volume I
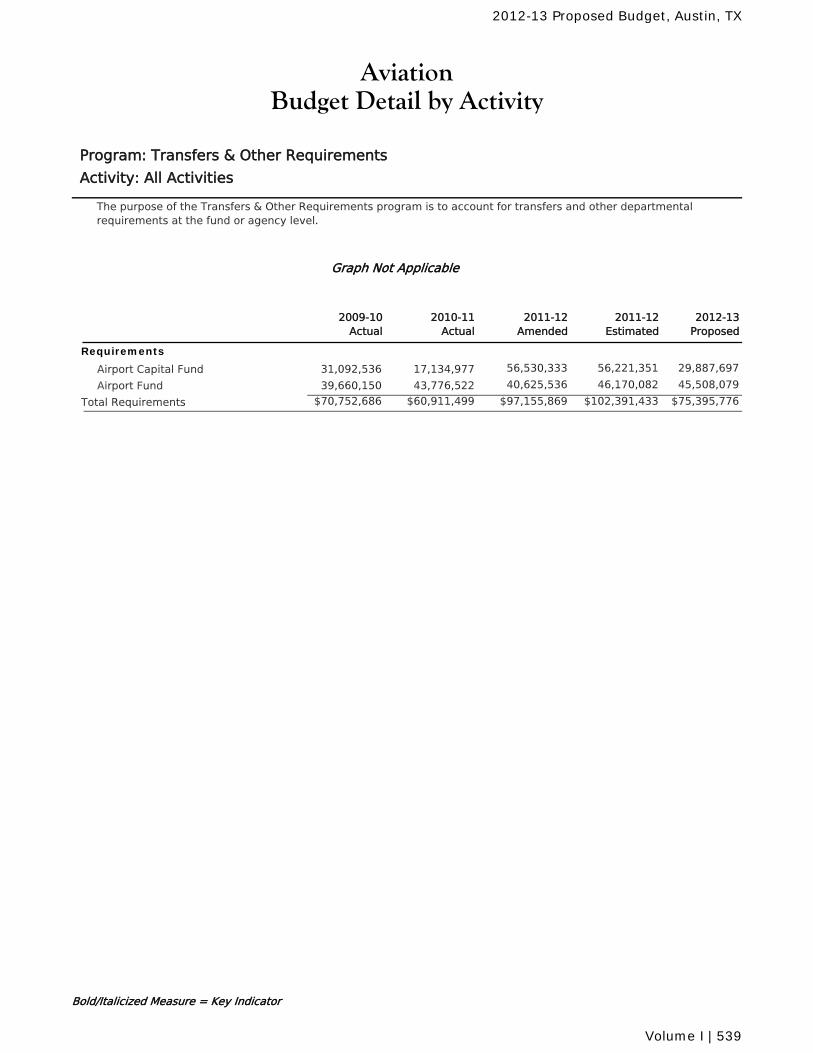
AviationBudget Detail by Activity
Program: Transfers & Other Requirements
Activity: All Activities
The purpose of the Transfers & Other Requirements program is to account for transfers and other departmentalrequirements at the fund or agency level.
Graph Not Applicable
2011-12Amended
2010-11Actual
2011-12Estimated
2012-13Proposed
2009-10Actual
Requirements
Airport Capital Fund 56,530,333 56,221,351 29,887,69717,134,97731,092,536
Airport Fund 40,625,536 46,170,082 45,508,07943,776,52239,660,150
$97,155,869 $102,391,433 $75,395,776Total Requirements $60,911,499$70,752,686
Bold/Italicized Measure = Key Indicator
2012-13 Proposed Budget, Austin, TX
Volume I | 539
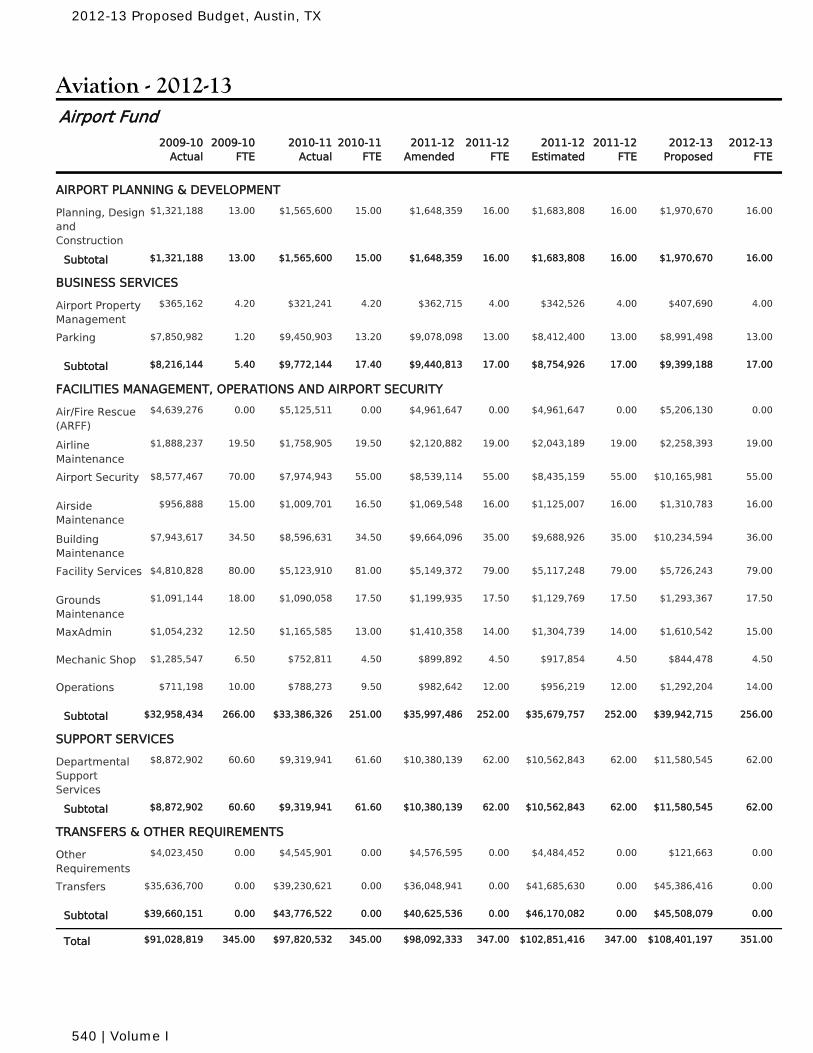
Aviation - 2012-13
2010-11Actual
2010-11FTE
2011-12Amended
2011-12FTE
2011-12Estimated
2011-12FTE
2009-10Actual
2009-10FTE
2012-13Proposed
2012-13FTE
Airport Fund
AIRPORT PLANNING & DEVELOPMENT
$1,565,600 15.00 $1,648,359 16.00 $1,683,808 16.00Planning, DesignandConstruction
13.00 $1,970,670 16.00$1,321,188
$1,565,600 15.00 $1,648,359 16.00 $1,683,808 16.00Subtotal 13.00 $1,970,670 16.00$1,321,188
BUSINESS SERVICES
$321,241 4.20 $362,715 4.00 $342,526 4.00Airport PropertyManagement
4.20 $407,690 4.00$365,162
$9,450,903 13.20 $9,078,098 13.00 $8,412,400 13.00Parking 1.20 $8,991,498 13.00$7,850,982
$9,772,144 17.40 $9,440,813 17.00 $8,754,926 17.00Subtotal 5.40 $9,399,188 17.00$8,216,144
FACILITIES MANAGEMENT, OPERATIONS AND AIRPORT SECURITY
$5,125,511 0.00 $4,961,647 0.00 $4,961,647 0.00Air/Fire Rescue(ARFF)
0.00 $5,206,130 0.00$4,639,276
$1,758,905 19.50 $2,120,882 19.00 $2,043,189 19.00AirlineMaintenance
19.50 $2,258,393 19.00$1,888,237
$7,974,943 55.00 $8,539,114 55.00 $8,435,159 55.00Airport Security 70.00 $10,165,981 55.00$8,577,467
$1,009,701 16.50 $1,069,548 16.00 $1,125,007 16.00AirsideMaintenance
15.00 $1,310,783 16.00$956,888
$8,596,631 34.50 $9,664,096 35.00 $9,688,926 35.00BuildingMaintenance
34.50 $10,234,594 36.00$7,943,617
$5,123,910 81.00 $5,149,372 79.00 $5,117,248 79.00Facility Services 80.00 $5,726,243 79.00$4,810,828
$1,090,058 17.50 $1,199,935 17.50 $1,129,769 17.50GroundsMaintenance
18.00 $1,293,367 17.50$1,091,144
$1,165,585 13.00 $1,410,358 14.00 $1,304,739 14.00MaxAdmin 12.50 $1,610,542 15.00$1,054,232
$752,811 4.50 $899,892 4.50 $917,854 4.50Mechanic Shop 6.50 $844,478 4.50$1,285,547
$788,273 9.50 $982,642 12.00 $956,219 12.00Operations 10.00 $1,292,204 14.00$711,198
$33,386,326 251.00 $35,997,486 252.00 $35,679,757 252.00Subtotal 266.00 $39,942,715 256.00$32,958,434
SUPPORT SERVICES
$9,319,941 61.60 $10,380,139 62.00 $10,562,843 62.00DepartmentalSupportServices
60.60 $11,580,545 62.00$8,872,902
$9,319,941 61.60 $10,380,139 62.00 $10,562,843 62.00Subtotal 60.60 $11,580,545 62.00$8,872,902
TRANSFERS & OTHER REQUIREMENTS
$4,545,901 0.00 $4,576,595 0.00 $4,484,452 0.00OtherRequirements
0.00 $121,663 0.00$4,023,450
$39,230,621 0.00 $36,048,941 0.00 $41,685,630 0.00Transfers 0.00 $45,386,416 0.00$35,636,700
$43,776,522 0.00 $40,625,536 0.00 $46,170,082 0.00Subtotal 0.00 $45,508,079 0.00$39,660,151
$97,820,532 345.00 $98,092,333 347.00 $102,851,416 347.00Total 345.00 $108,401,197 351.00$91,028,819
2012-13 Proposed Budget, Austin, TX
540 | Volume I
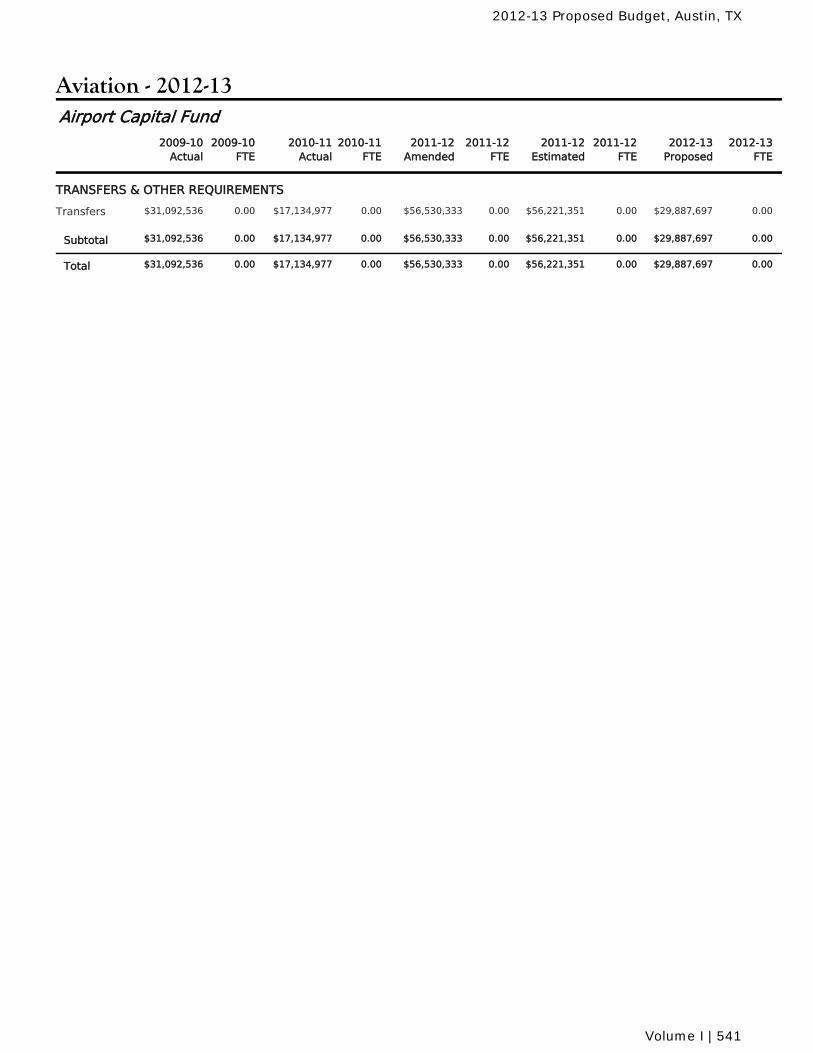
Aviation - 2012-13
2010-11Actual
2010-11FTE
2011-12Amended
2011-12FTE
2011-12Estimated
2011-12FTE
2009-10Actual
2009-10FTE
2012-13Proposed
2012-13FTE
Airport Capital Fund
TRANSFERS & OTHER REQUIREMENTS
$17,134,977 0.00 $56,530,333 0.00 $56,221,351 0.00Transfers 0.00 $29,887,697 0.00$31,092,536
$17,134,977 0.00 $56,530,333 0.00 $56,221,351 0.00Subtotal 0.00 $29,887,697 0.00$31,092,536
$17,134,977 0.00 $56,530,333 0.00 $56,221,351 0.00Total 0.00 $29,887,697 0.00$31,092,536
2012-13 Proposed Budget, Austin, TX
Volume I | 541
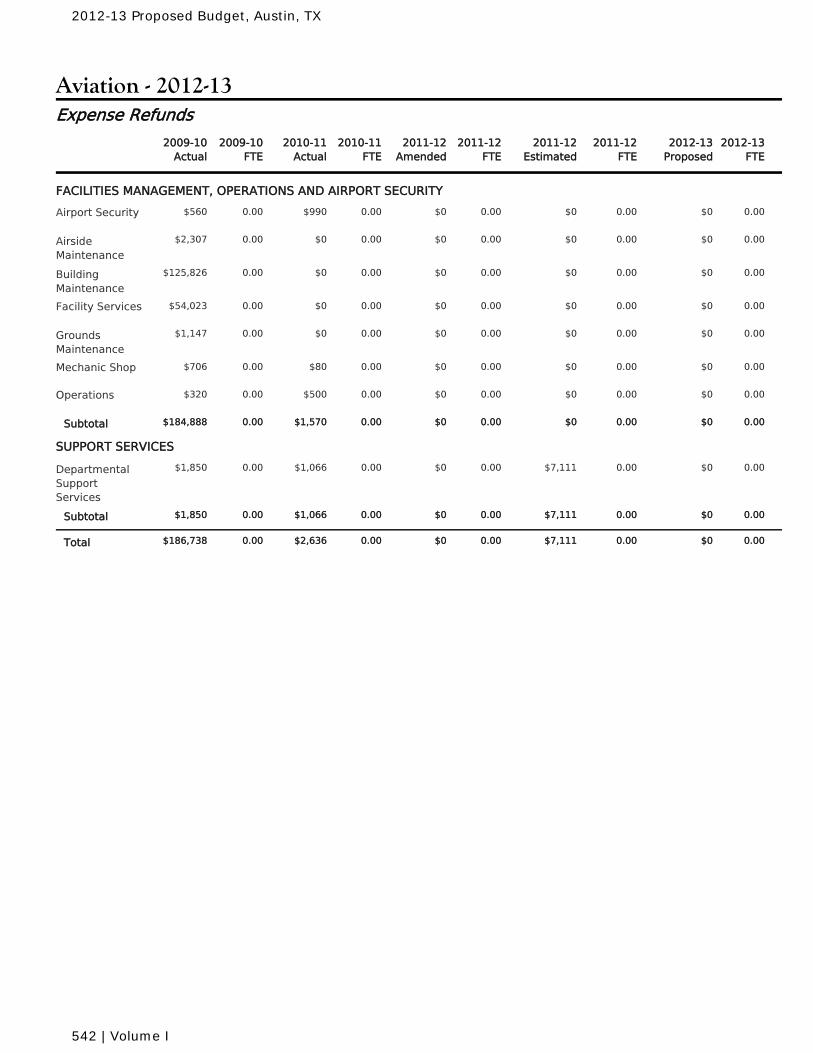
Aviation - 2012-13
2010-11Actual
2010-11FTE
2011-12Amended
2011-12FTE
2011-12Estimated
2011-12FTE
2009-10Actual
2009-10FTE
2012-13Proposed
2012-13FTE
Expense Refunds
FACILITIES MANAGEMENT, OPERATIONS AND AIRPORT SECURITY
$990 0.00 $0 0.00 $0 0.00Airport Security 0.00 $0 0.00$560
$0 0.00 $0 0.00 $0 0.00AirsideMaintenance
0.00 $0 0.00$2,307
$0 0.00 $0 0.00 $0 0.00BuildingMaintenance
0.00 $0 0.00$125,826
$0 0.00 $0 0.00 $0 0.00Facility Services 0.00 $0 0.00$54,023
$0 0.00 $0 0.00 $0 0.00GroundsMaintenance
0.00 $0 0.00$1,147
$80 0.00 $0 0.00 $0 0.00Mechanic Shop 0.00 $0 0.00$706
$500 0.00 $0 0.00 $0 0.00Operations 0.00 $0 0.00$320
$1,570 0.00 $0 0.00 $0 0.00Subtotal 0.00 $0 0.00$184,888
SUPPORT SERVICES
$1,066 0.00 $0 0.00 $7,111 0.00DepartmentalSupportServices
0.00 $0 0.00$1,850
$1,066 0.00 $0 0.00 $7,111 0.00Subtotal 0.00 $0 0.00$1,850
$2,636 0.00 $0 0.00 $7,111 0.00Total 0.00 $0 0.00$186,738
2012-13 Proposed Budget, Austin, TX
542 | Volume I
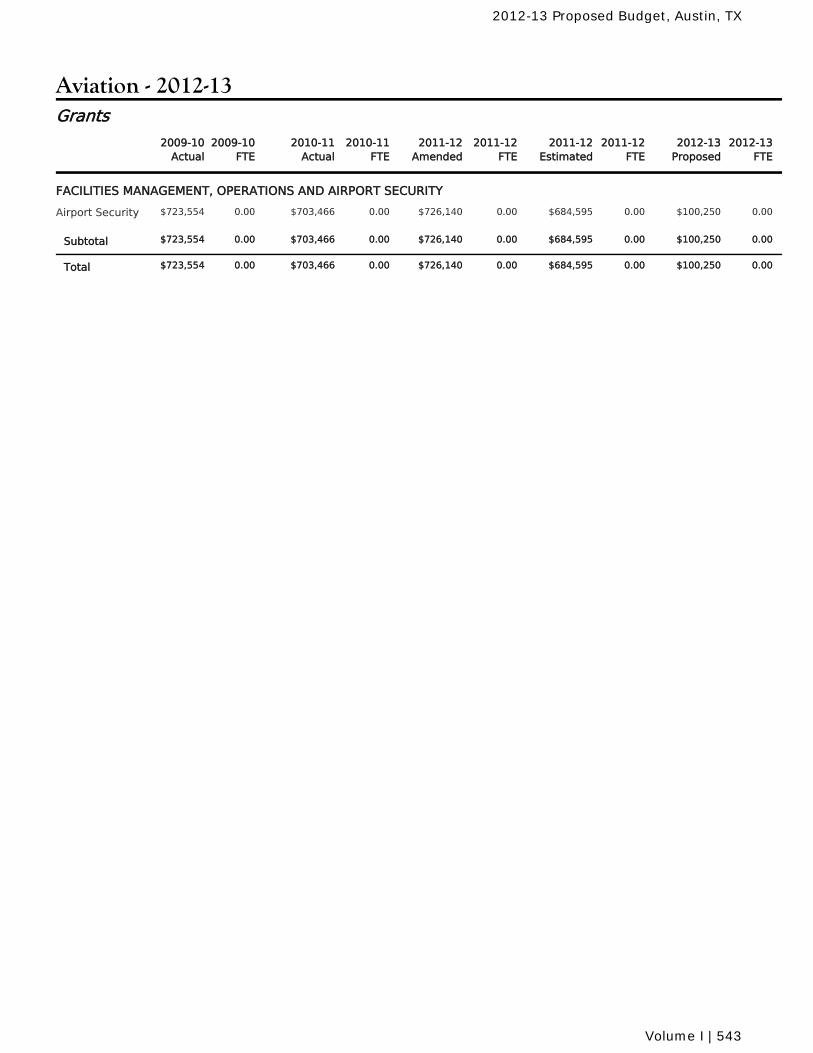
Aviation - 2012-13
2010-11Actual
2010-11FTE
2011-12Amended
2011-12FTE
2011-12Estimated
2011-12FTE
2009-10Actual
2009-10FTE
2012-13Proposed
2012-13FTE
Grants
FACILITIES MANAGEMENT, OPERATIONS AND AIRPORT SECURITY
$703,466 0.00 $726,140 0.00 $684,595 0.00Airport Security 0.00 $100,250 0.00$723,554
$703,466 0.00 $726,140 0.00 $684,595 0.00Subtotal 0.00 $100,250 0.00$723,554
$703,466 0.00 $726,140 0.00 $684,595 0.00Total 0.00 $100,250 0.00$723,554
2012-13 Proposed Budget, Austin, TX
Volume I | 543

2012-13 Proposed Budget, Austin, TX
544 | Volume I
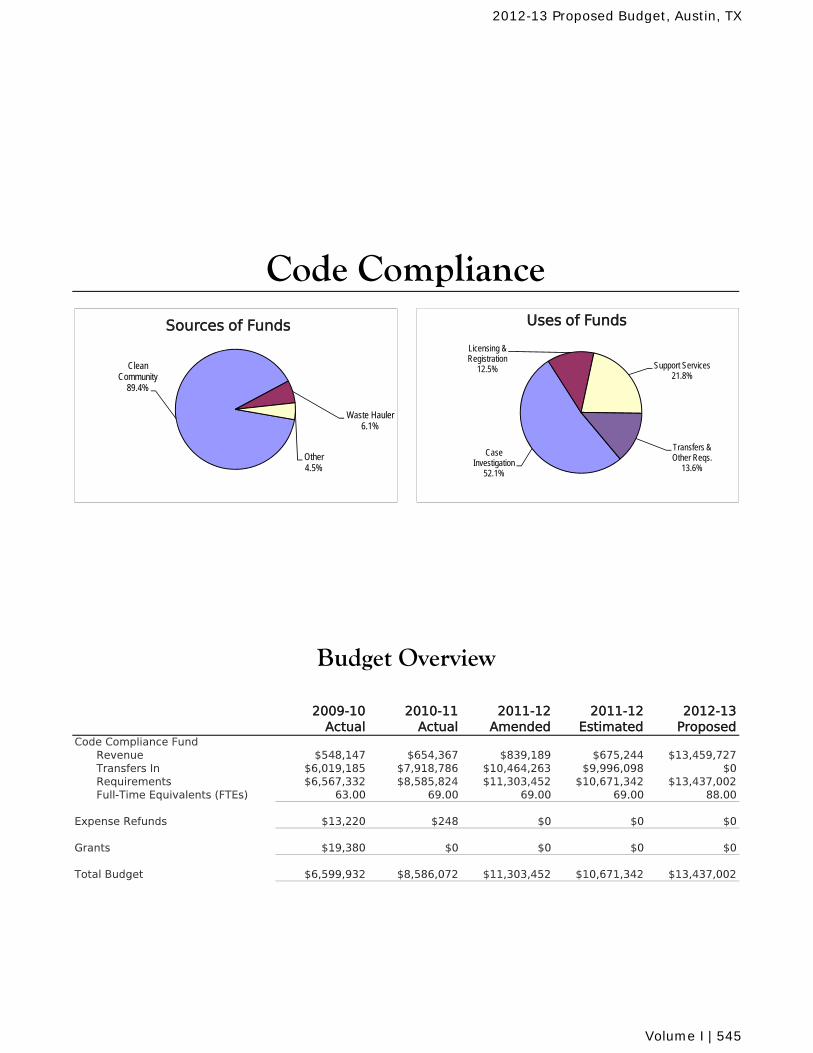
2009-10Actual
2010-11Actual
2011-12 Amended
2011-12 Estimated
2012-13 Proposed
Code Compliance FundRevenue $548,147 $654,367 $839,189 $675,244 $13,459,727Transfers In $6,019,185 $7,918,786 $10,464,263 $9,996,098 $0Requirements $6,567,332 $8,585,824 $11,303,452 $10,671,342 $13,437,002Full-Time Equivalents (FTEs) 63.00 69.00 69.00 69.00 88.00
Expense Refunds $13,220 $248 $0 $0 $0
Grants $19,380 $0 $0 $0 $0
Total Budget $6,599,932 $8,586,072 $11,303,452 $10,671,342 $13,437,002
Budget Overview
Code Compliance
Clean Community
89.4%
Waste Hauler6.1%
Other4.5%
Sources of Funds
Case Investigation
52.1%
Licensing & Registration
12.5% Support Services21.8%
Transfers & Other Reqs.
13.6%
Uses of Funds
2012-13 Proposed Budget, Austin, TX
Volume I | 545
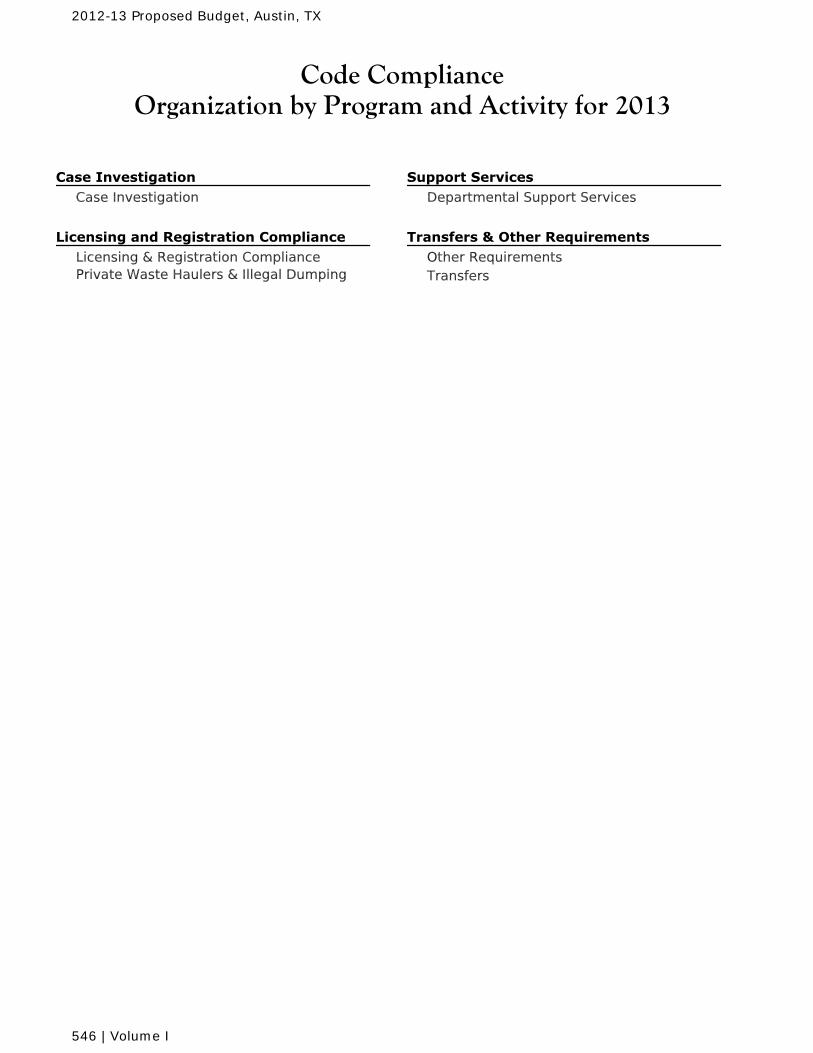
Code Compliance Organization by Program and Activity for 2013
Case Investigation Case Investigation
Licensing and Registration Compliance Licensing & Registration CompliancePrivate Waste Haulers & Illegal Dumping
Support Services Departmental Support Services
Transfers & Other Requirements Other RequirementsTransfers
2012-13 Proposed Budget, Austin, TX
546 | Volume I
Code Compliance Mission and Goals for 2013
Mission
The mission of Code Compliance Department is to provide quality education and enforcement ofcodes and ordinances to our citizens so that Austin will become a more livable city.
Goals
Increase investigative staff responsiveness for Code Compliance complaints.
Obtain an average initial complaint response time of 2 working days for all cases.
Provide information to violators on how to meet compliance requirements.
Attain non-judicial compliance or transfer case to appropriate judicial process on all caseswithin 80 days from when complaints are first reported.
Obtain an average number of cases per inspector of 260 cases.
Maintain an average of 40 hours of training per investigative FTE per fiscal year.
Decrease the percent of employees that reported an injury requiring medical attention from 2.9% to0%.
2012-13 Proposed Budget, Austin, TX
Volume I | 547
Code Compliance
Message from the Director
The mission of the Code Compliance Department (CCD) is to provide quality education and enforcement of codes and ordinances for our citizens so that Austin will be a more livable city. CCD investigates reports from members of the community of property conditions, building activities, zoning and structures thought to be in non-compliance with City codes throughout Austin. City codes establish minimum building, maintenance, and zoning standards.
Challenges that continue to impact CCD are the City’s growth and trend towards urbanization. These issues, coupled with aging housing stock, result in increasing requests from the community for investigations of code violations. For FY 2012-13, CCD will receive 19 additional staff positions and resources that will help the Department better reach published goals and meet the community’s expectations of service and responsiveness. CCD is also planning on organizing additional outreach campaigns in order to educate citizens and developers on the City’s code and compliance process. The campaigns will focus on the importance of voluntary compliance and partnering with members of the community to protect the health, safety, welfare, and quality of life of Austin citizens.
In FY 2012-13, CCD will increase its focus on proactively monitoring multi-family property conditions and continue to investigate all reported concerns. CCD will also proactively investigate ongoing construction and maintenance activities to ensure work is conducted under a permit and in accordance with City codes. CCD is planning to implement an administrative hearing process to expedite the compliance process and provide property owners a non-criminal alternative to the Building and Standards Commission and the court system. Responsibility of administrating and enforcing the Private Waste Hauler Ordinance will be conveyed from the Austin Resource Recovery Department to CCD in FY 2012-13. This transfer will result in an increased focus on the compliance of private haulers with the ordinance and the identification of illegal dumping activities, the abatement of illegal dumpsites, and enforcement throughout the city. Another issue on the horizon that may impact CCD is the Residential Rental Program. City Council continues to study the requirement for a mandatory registration program. Depending on the outcome of the study, CCD may be required to implement the program during FY 2012-13. CCD is committed to improving existing programs and implementing proactive initiatives to help Austin become the Best Managed City.
Carl Smart Code Compliance Director
2012-13 Proposed Budget, Austin, TX
548 | Volume I
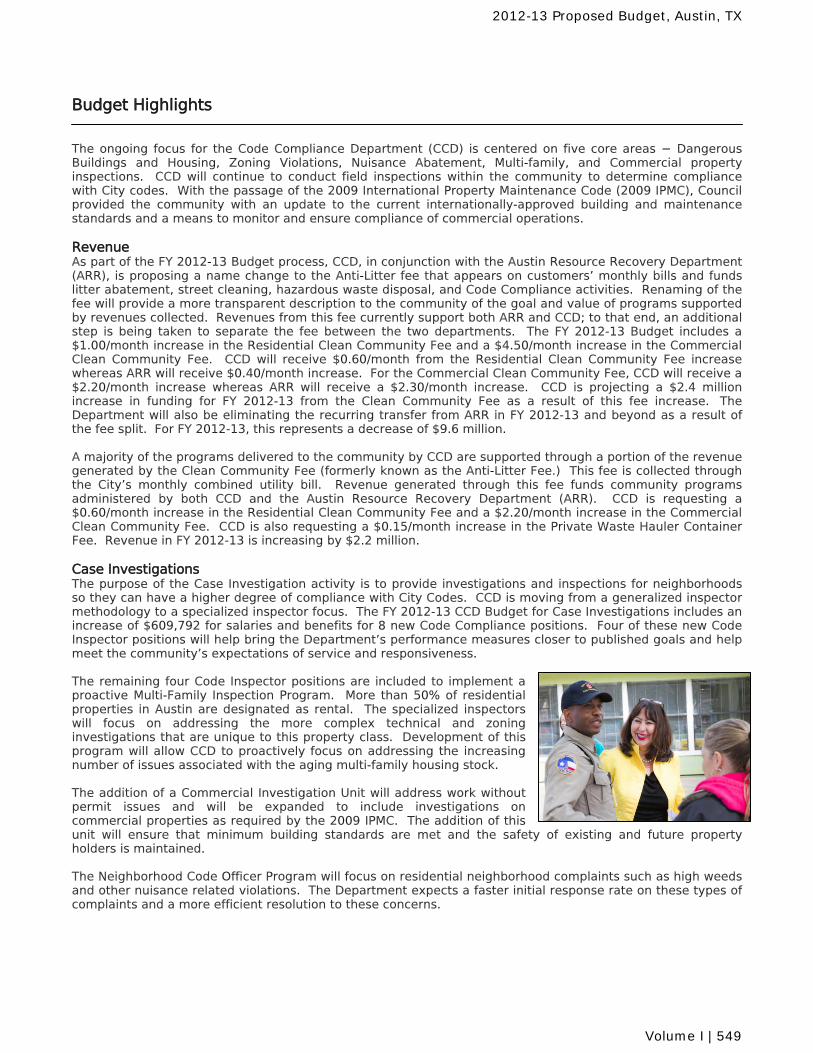
Budget Highlights The ongoing focus for the Code Compliance Department (CCD) is centered on five core areas − Dangerous Buildings and Housing, Zoning Violations, Nuisance Abatement, Multi-family, and Commercial property inspections. CCD will continue to conduct field inspections within the community to determine compliance with City codes. With the passage of the 2009 International Property Maintenance Code (2009 IPMC), Council provided the community with an update to the current internationally-approved building and maintenance standards and a means to monitor and ensure compliance of commercial operations. Revenue As part of the FY 2012-13 Budget process, CCD, in conjunction with the Austin Resource Recovery Department (ARR), is proposing a name change to the Anti-Litter fee that appears on customers’ monthly bills and funds litter abatement, street cleaning, hazardous waste disposal, and Code Compliance activities. Renaming of the fee will provide a more transparent description to the community of the goal and value of programs supported by revenues collected. Revenues from this fee currently support both ARR and CCD; to that end, an additional step is being taken to separate the fee between the two departments. The FY 2012-13 Budget includes a $1.00/month increase in the Residential Clean Community Fee and a $4.50/month increase in the Commercial Clean Community Fee. CCD will receive $0.60/month from the Residential Clean Community Fee increase whereas ARR will receive $0.40/month increase. For the Commercial Clean Community Fee, CCD will receive a $2.20/month increase whereas ARR will receive a $2.30/month increase. CCD is projecting a $2.4 million increase in funding for FY 2012-13 from the Clean Community Fee as a result of this fee increase. The Department will also be eliminating the recurring transfer from ARR in FY 2012-13 and beyond as a result of the fee split. For FY 2012-13, this represents a decrease of $9.6 million. A majority of the programs delivered to the community by CCD are supported through a portion of the revenue generated by the Clean Community Fee (formerly known as the Anti-Litter Fee.) This fee is collected through the City’s monthly combined utility bill. Revenue generated through this fee funds community programs administered by both CCD and the Austin Resource Recovery Department (ARR). CCD is requesting a $0.60/month increase in the Residential Clean Community Fee and a $2.20/month increase in the Commercial Clean Community Fee. CCD is also requesting a $0.15/month increase in the Private Waste Hauler Container Fee. Revenue in FY 2012-13 is increasing by $2.2 million. Case Investigations The purpose of the Case Investigation activity is to provide investigations and inspections for neighborhoods so they can have a higher degree of compliance with City Codes. CCD is moving from a generalized inspector methodology to a specialized inspector focus. The FY 2012-13 CCD Budget for Case Investigations includes an increase of $609,792 for salaries and benefits for 8 new Code Compliance positions. Four of these new Code Inspector positions will help bring the Department’s performance measures closer to published goals and help meet the community’s expectations of service and responsiveness. The remaining four Code Inspector positions are included to implement a proactive Multi-Family Inspection Program. More than 50% of residential properties in Austin are designated as rental. The specialized inspectors will focus on addressing the more complex technical and zoning investigations that are unique to this property class. Development of this program will allow CCD to proactively focus on addressing the increasing number of issues associated with the aging multi-family housing stock. The addition of a Commercial Investigation Unit will address work without permit issues and will be expanded to include investigations on commercial properties as required by the 2009 IPMC. The addition of this unit will ensure that minimum building standards are met and the safety of existing and future property holders is maintained. The Neighborhood Code Officer Program will focus on residential neighborhood complaints such as high weeds and other nuisance related violations. The Department expects a faster initial response rate on these types of complaints and a more efficient resolution to these concerns.
2012-13 Proposed Budget, Austin, TX
Volume I | 549
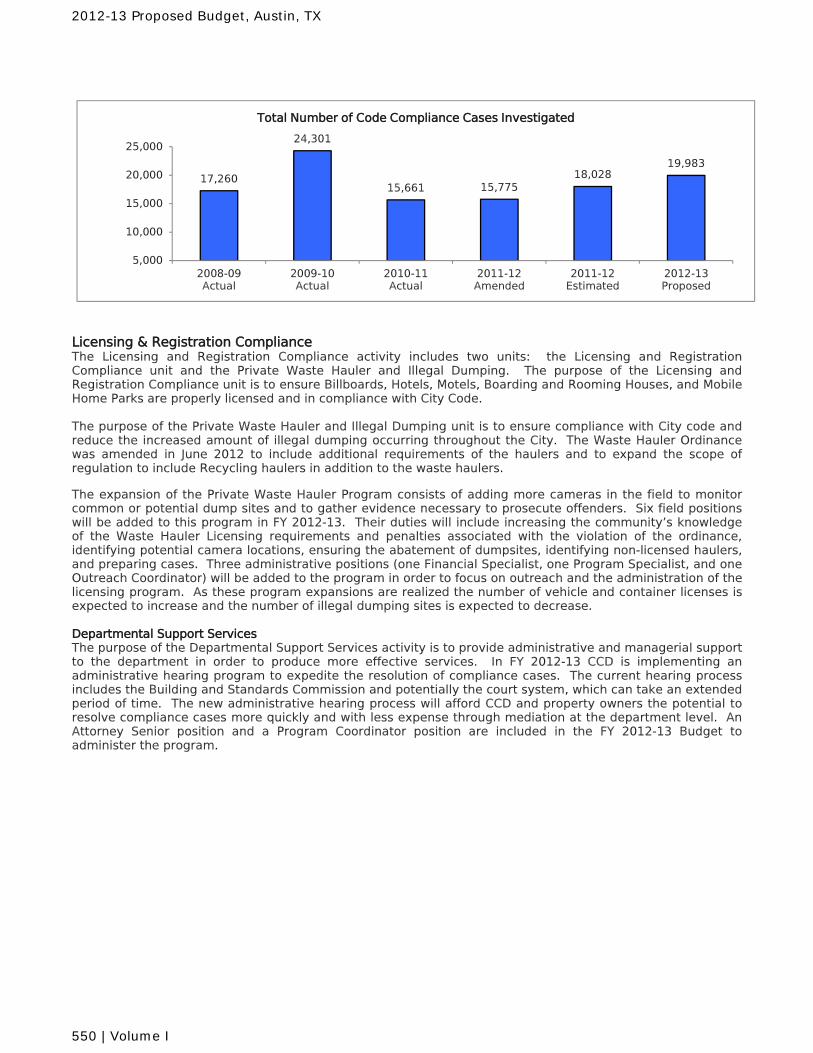
17,260
24,301
15,661 15,77518,028
19,983
5,000
10,000
15,000
20,000
25,000
2008-09Actual
2009-10Actual
2010-11Actual
2011-12Amended
2011-12Estimated
2012-13Proposed
Total Number of Code Compliance Cases Investigated
Licensing & Registration Compliance The Licensing and Registration Compliance activity includes two units: the Licensing and Registration Compliance unit and the Private Waste Hauler and Illegal Dumping. The purpose of the Licensing and Registration Compliance unit is to ensure Billboards, Hotels, Motels, Boarding and Rooming Houses, and Mobile Home Parks are properly licensed and in compliance with City Code. The purpose of the Private Waste Hauler and Illegal Dumping unit is to ensure compliance with City code and reduce the increased amount of illegal dumping occurring throughout the City. The Waste Hauler Ordinance was amended in June 2012 to include additional requirements of the haulers and to expand the scope of regulation to include Recycling haulers in addition to the waste haulers. The expansion of the Private Waste Hauler Program consists of adding more cameras in the field to monitor common or potential dump sites and to gather evidence necessary to prosecute offenders. Six field positions will be added to this program in FY 2012-13. Their duties will include increasing the community’s knowledge of the Waste Hauler Licensing requirements and penalties associated with the violation of the ordinance, identifying potential camera locations, ensuring the abatement of dumpsites, identifying non-licensed haulers, and preparing cases. Three administrative positions (one Financial Specialist, one Program Specialist, and one Outreach Coordinator) will be added to the program in order to focus on outreach and the administration of the licensing program. As these program expansions are realized the number of vehicle and container licenses is expected to increase and the number of illegal dumping sites is expected to decrease. Departmental Support Services The purpose of the Departmental Support Services activity is to provide administrative and managerial support to the department in order to produce more effective services. In FY 2012-13 CCD is implementing an administrative hearing program to expedite the resolution of compliance cases. The current hearing process includes the Building and Standards Commission and potentially the court system, which can take an extended period of time. The new administrative hearing process will afford CCD and property owners the potential to resolve compliance cases more quickly and with less expense through mediation at the department level. An Attorney Senior position and a Program Coordinator position are included in the FY 2012-13 Budget to administer the program.
2012-13 Proposed Budget, Austin, TX
550 | Volume I
Code Compliance Fund
Revenue Changes Dollars
The Budget includes an increase of $12,032,027 for revenue from a portion of theCommercial and Residential Clean Community Fee (formerly known as the Anti-Litter Fee). Out of this amount, $9,591,680 represents a transfer of revenue fromthe Clean Community Fee from Austin Resource Department. The remaining$2,440,347 represents an increase in revenue from CCD's portion of the CleanCommunity Fee increase. $12,032,027
The Budget includes a decrease of $9,591,680 in the transfer from the AustinResource Recovery Fund. CCD will receive a portion of revenue from theCommerical and Residential Clean Community Fee. ($9,591,680)
The Budget includes a decrease of $872,583 in the transfer from the General Fund. ($872,583)
The Budget includes an increase of $817,700 for revenue from the Private WasterHaulers Program. $817,700
The Budget includes a decrease of $50,436 for revenue from Code ComplianceFines based on prior year actual amounts received. ($50,436)
The Budget includes a decrease of $89,651 for revenue from Hotel/Motel andMobile Home License Fees based on prior year actual amounts received. ($89,651)
The Budget includes a decrease of $74,270 for revenue from Weed Lot Clearingand Administrative Fee due to a decrease in the projected number of weed lotcases. ($74,270)
The Budget includes a decrease of $16,201 for revenue from Billboard RegistrationFee due to a decrease in the annual fee in FY 2011-12. ($16,201)
The Budget includes an increase of $976 for revenue from Interest and $393 fromOther Revenue. $1,369
Expenditure Changes FTEs Dollars
CitywideThe Budget includes $142,242 for salary increases associated with wageadjustments in FY 2013. An additional $21,183 is included in the Budget forincreased City contributions for health insurance. $163,425
The Budget includes additional funding for the Employees' Retirement System thatis equivalent to 2% of payroll for non-civil service employees to help improve thefunded status of the pension system. $72,315
The Budget includes $14,611 for wage adjustments associated with implementingthe City's recently completed market study. $14,611
The Budget includes an increase of $18,973 for fleet preventive maintenance anda decrease of $2,895 for fleet fuel. $16,078
Case InvestigationsThe Budget includes an increase of $609,792 and eight new Code ComplianceInspector positions to the Case Investigations Program. 8.00 $609,792
Significant ChangesCode Compliance
2012-13 Proposed Budget, Austin, TX
Volume I | 551
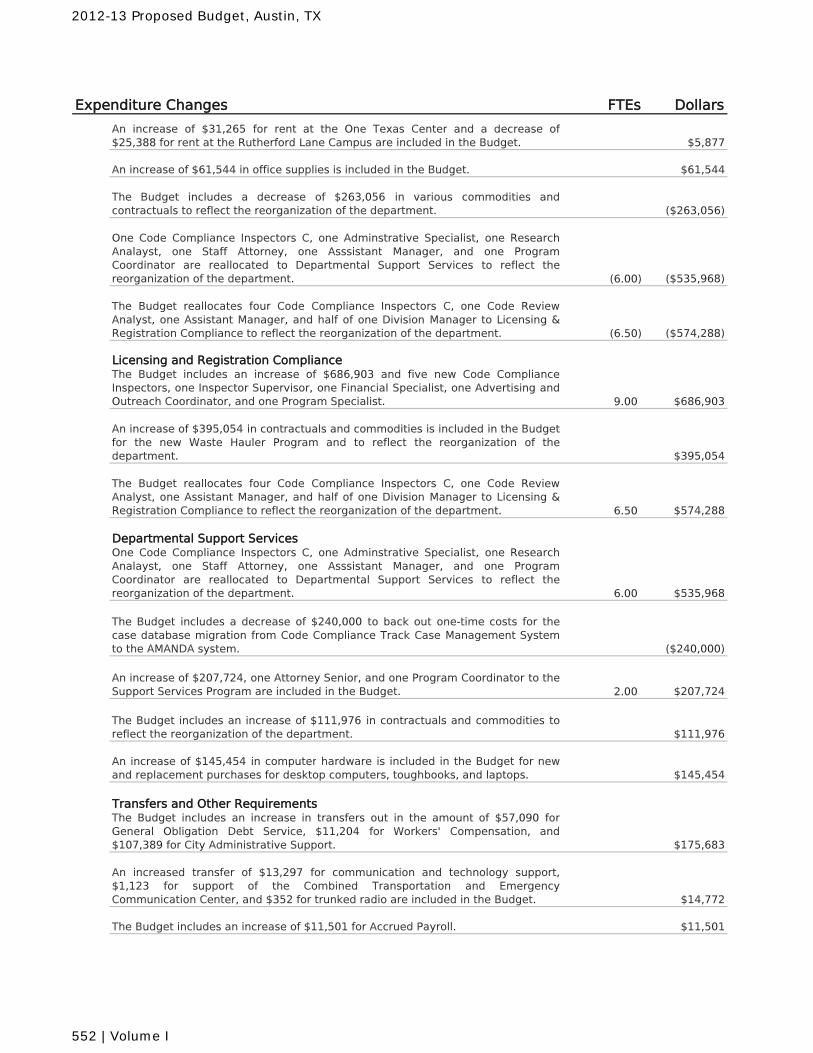
Expenditure Changes FTEs Dollars
An increase of $31,265 for rent at the One Texas Center and a decrease of$25,388 for rent at the Rutherford Lane Campus are included in the Budget. $5,877
An increase of $61,544 in office supplies is included in the Budget. $61,544
The Budget includes a decrease of $263,056 in various commodities andcontractuals to reflect the reorganization of the department. ($263,056)
One Code Compliance Inspectors C, one Adminstrative Specialist, one ResearchAnalayst, one Staff Attorney, one Asssistant Manager, and one ProgramCoordinator are reallocated to Departmental Support Services to reflect thereorganization of the department. (6.00) ($535,968)
The Budget reallocates four Code Compliance Inspectors C, one Code ReviewAnalyst, one Assistant Manager, and half of one Division Manager to Licensing &Registration Compliance to reflect the reorganization of the department. (6.50) ($574,288)
Licensing and Registration ComplianceThe Budget includes an increase of $686,903 and five new Code ComplianceInspectors, one Inspector Supervisor, one Financial Specialist, one Advertising andOutreach Coordinator, and one Program Specialist. 9.00 $686,903
An increase of $395,054 in contractuals and commodities is included in the Budgetfor the new Waste Hauler Program and to reflect the reorganization of thedepartment. $395,054
The Budget reallocates four Code Compliance Inspectors C, one Code ReviewAnalyst, one Assistant Manager, and half of one Division Manager to Licensing &Registration Compliance to reflect the reorganization of the department. 6.50 $574,288
Departmental Support ServicesOne Code Compliance Inspectors C, one Adminstrative Specialist, one ResearchAnalayst, one Staff Attorney, one Asssistant Manager, and one ProgramCoordinator are reallocated to Departmental Support Services to reflect thereorganization of the department. 6.00 $535,968
The Budget includes a decrease of $240,000 to back out one-time costs for thecase database migration from Code Compliance Track Case Management Systemto the AMANDA system. ($240,000)
An increase of $207,724, one Attorney Senior, and one Program Coordinator to theSupport Services Program are included in the Budget. 2.00 $207,724
The Budget includes an increase of $111,976 in contractuals and commodities toreflect the reorganization of the department. $111,976
An increase of $145,454 in computer hardware is included in the Budget for newand replacement purchases for desktop computers, toughbooks, and laptops. $145,454
Transfers and Other RequirementsThe Budget includes an increase in transfers out in the amount of $57,090 forGeneral Obligation Debt Service, $11,204 for Workers' Compensation, and$107,389 for City Administrative Support. $175,683
An increased transfer of $13,297 for communication and technology support,$1,123 for support of the Combined Transportation and EmergencyCommunication Center, and $352 for trunked radio are included in the Budget. $14,772
The Budget includes an increase of $11,501 for Accrued Payroll. $11,501
2012-13 Proposed Budget, Austin, TX
552 | Volume I
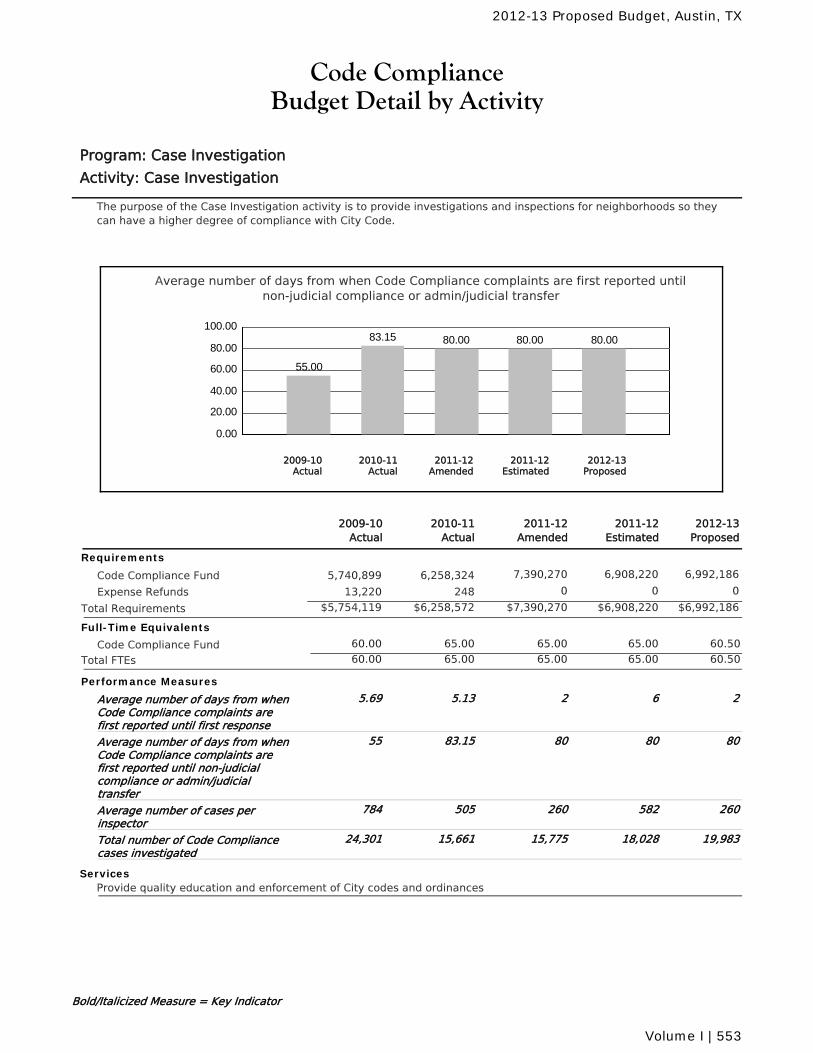
Code ComplianceBudget Detail by Activity
Program: Case Investigation
Activity: Case Investigation
The purpose of the Case Investigation activity is to provide investigations and inspections for neighborhoods so theycan have a higher degree of compliance with City Code.
Average number of days from when Code Compliance complaints are first reported untilnon-judicial compliance or admin/judicial transfer
0.00
20.00
40.00
60.00
80.00
100.00
55.00
83.15 80.00 80.00 80.00
2010-11Actual
2012-13Proposed
2011-12Amended
2011-12Estimated
2009-10Actual
2011-12Amended
2010-11Actual
2011-12Estimated
2012-13Proposed
2009-10Actual
Requirements
Code Compliance Fund 7,390,270 6,908,220 6,992,1866,258,3245,740,899
Expense Refunds 0 0 024813,220
$7,390,270 $6,908,220 $6,992,186Total Requirements $6,258,572$5,754,119
Full-Time Equivalents
Code Compliance Fund 65.00 65.00 65.00 60.5060.00
Total FTEs 65.00 65.00 65.00 60.5060.00
Performance Measures
Average number of days from whenCode Compliance complaints arefirst reported until first response
25.13 6 25.69
Average number of days from whenCode Compliance complaints arefirst reported until non-judicialcompliance or admin/judicialtransfer
8083.15 80 8055
Average number of cases perinspector
260505 582 260784
Total number of Code Compliancecases investigated
15,77515,661 18,028 19,98324,301
ServicesProvide quality education and enforcement of City codes and ordinances
Bold/Italicized Measure = Key Indicator
2012-13 Proposed Budget, Austin, TX
Volume I | 553
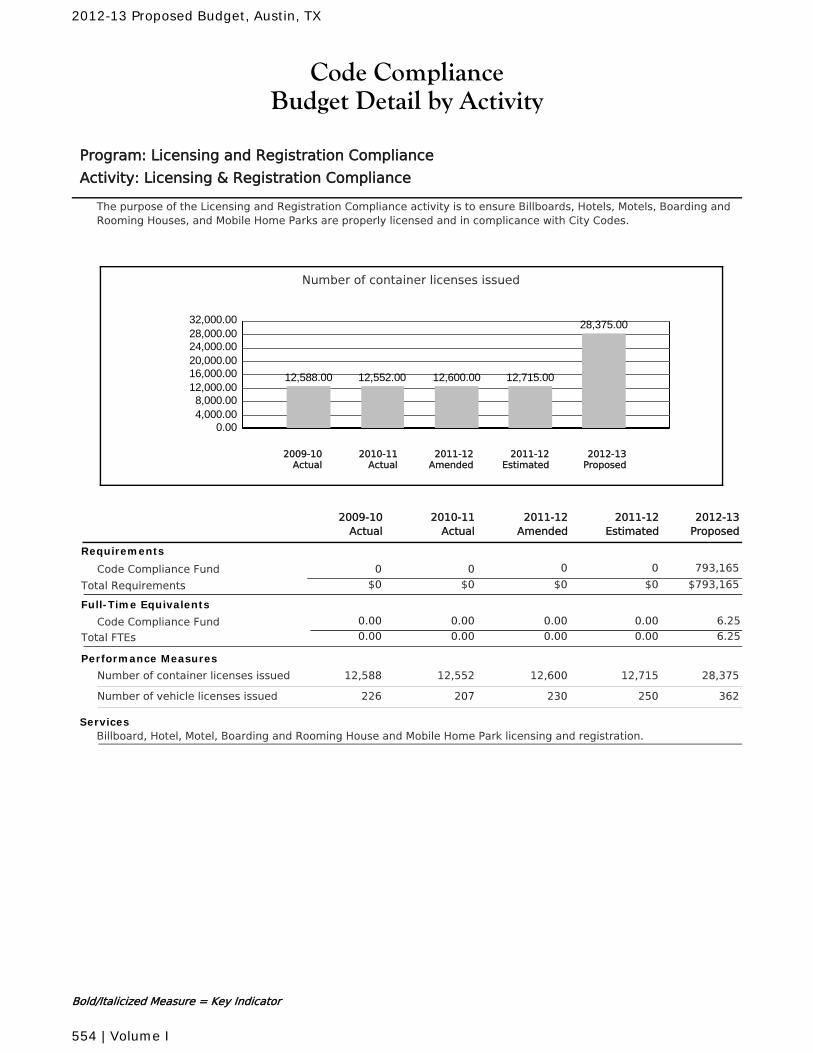
Code ComplianceBudget Detail by Activity
Program: Licensing and Registration Compliance
Activity: Licensing & Registration Compliance
The purpose of the Licensing and Registration Compliance activity is to ensure Billboards, Hotels, Motels, Boarding andRooming Houses, and Mobile Home Parks are properly licensed and in complicance with City Codes.
Number of container licenses issued
0.004,000.008,000.00
12,000.0016,000.0020,000.0024,000.0028,000.0032,000.00
12,588.00 12,552.00 12,600.00 12,715.00
28,375.00
2010-11Actual
2012-13Proposed
2011-12Amended
2011-12Estimated
2009-10Actual
2011-12Amended
2010-11Actual
2011-12Estimated
2012-13Proposed
2009-10Actual
Requirements
Code Compliance Fund 0 0 793,16500
$0 $0 $793,165Total Requirements $0$0
Full-Time Equivalents
Code Compliance Fund 0.00 0.00 0.00 6.250.00
Total FTEs 0.00 0.00 0.00 6.250.00
Performance Measures
Number of container licenses issued 12,60012,552 12,715 28,37512,588
Number of vehicle licenses issued 230207 250 362226
ServicesBillboard, Hotel, Motel, Boarding and Rooming House and Mobile Home Park licensing and registration.
Bold/Italicized Measure = Key Indicator
2012-13 Proposed Budget, Austin, TX
554 | Volume I
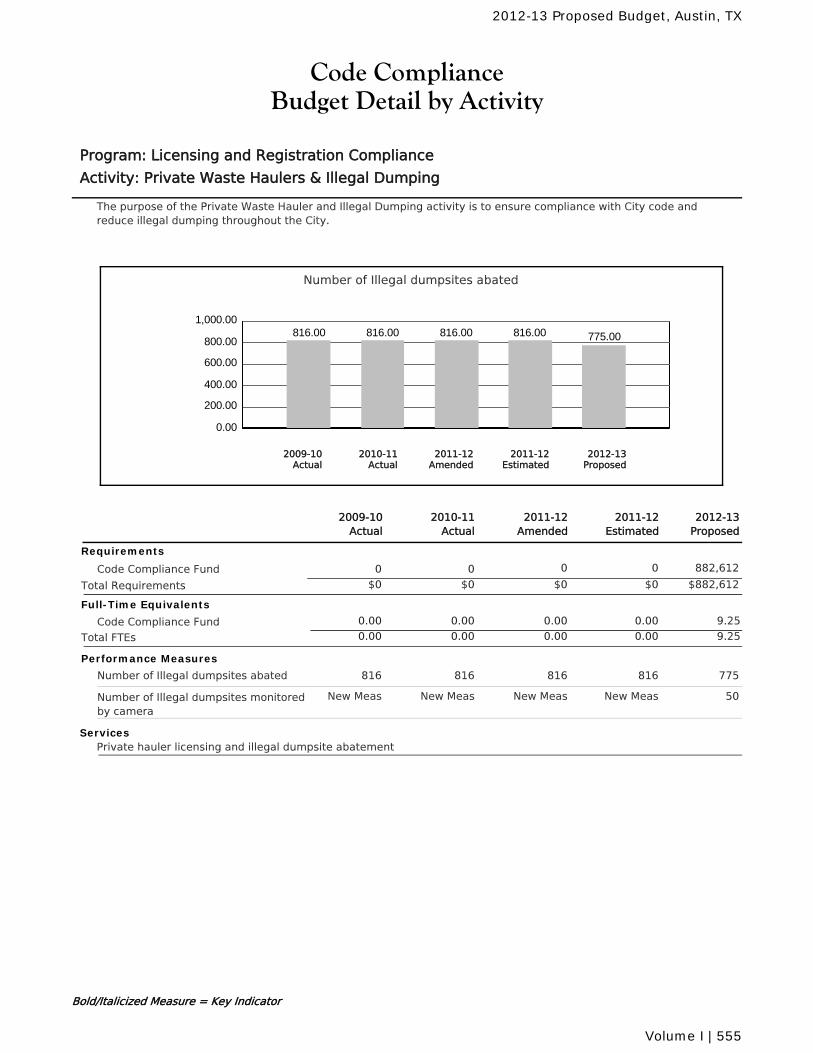
Code ComplianceBudget Detail by Activity
Program: Licensing and Registration Compliance
Activity: Private Waste Haulers & Illegal Dumping
The purpose of the Private Waste Hauler and Illegal Dumping activity is to ensure compliance with City code andreduce illegal dumping throughout the City.
Number of Illegal dumpsites abated
0.00
200.00
400.00
600.00
800.00
1,000.00816.00 816.00 816.00 816.00 775.00
2010-11Actual
2012-13Proposed
2011-12Amended
2011-12Estimated
2009-10Actual
2011-12Amended
2010-11Actual
2011-12Estimated
2012-13Proposed
2009-10Actual
Requirements
Code Compliance Fund 0 0 882,61200
$0 $0 $882,612Total Requirements $0$0
Full-Time Equivalents
Code Compliance Fund 0.00 0.00 0.00 9.250.00
Total FTEs 0.00 0.00 0.00 9.250.00
Performance Measures
Number of Illegal dumpsites abated 816816 816 775816
Number of Illegal dumpsites monitoredby camera
New MeasNew Meas New Meas 50New Meas
ServicesPrivate hauler licensing and illegal dumpsite abatement
Bold/Italicized Measure = Key Indicator
2012-13 Proposed Budget, Austin, TX
Volume I | 555
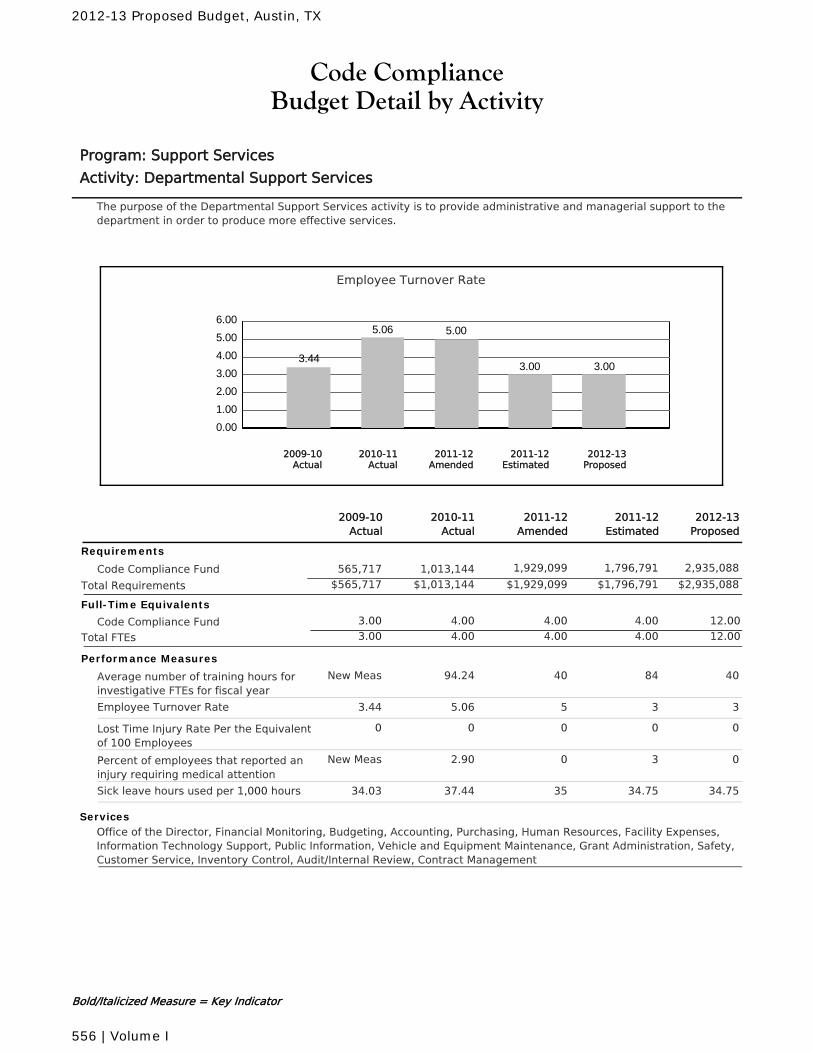
Code ComplianceBudget Detail by Activity
Program: Support Services
Activity: Departmental Support Services
The purpose of the Departmental Support Services activity is to provide administrative and managerial support to thedepartment in order to produce more effective services.
Employee Turnover Rate
0.00
1.00
2.00
3.00
4.00
5.00
6.00
3.44
5.06 5.00
3.00 3.00
2010-11Actual
2012-13Proposed
2011-12Amended
2011-12Estimated
2009-10Actual
2011-12Amended
2010-11Actual
2011-12Estimated
2012-13Proposed
2009-10Actual
Requirements
Code Compliance Fund 1,929,099 1,796,791 2,935,0881,013,144565,717
$1,929,099 $1,796,791 $2,935,088Total Requirements $1,013,144$565,717
Full-Time Equivalents
Code Compliance Fund 4.00 4.00 4.00 12.003.00
Total FTEs 4.00 4.00 4.00 12.003.00
Performance Measures
Average number of training hours forinvestigative FTEs for fiscal year
4094.24 84 40New Meas
Employee Turnover Rate 55.06 3 33.44
Lost Time Injury Rate Per the Equivalentof 100 Employees
00 0 00
Percent of employees that reported aninjury requiring medical attention
02.90 3 0New Meas
Sick leave hours used per 1,000 hours 3537.44 34.75 34.7534.03
ServicesOffice of the Director, Financial Monitoring, Budgeting, Accounting, Purchasing, Human Resources, Facility Expenses,Information Technology Support, Public Information, Vehicle and Equipment Maintenance, Grant Administration, Safety,Customer Service, Inventory Control, Audit/Internal Review, Contract Management
Bold/Italicized Measure = Key Indicator
2012-13 Proposed Budget, Austin, TX
556 | Volume I
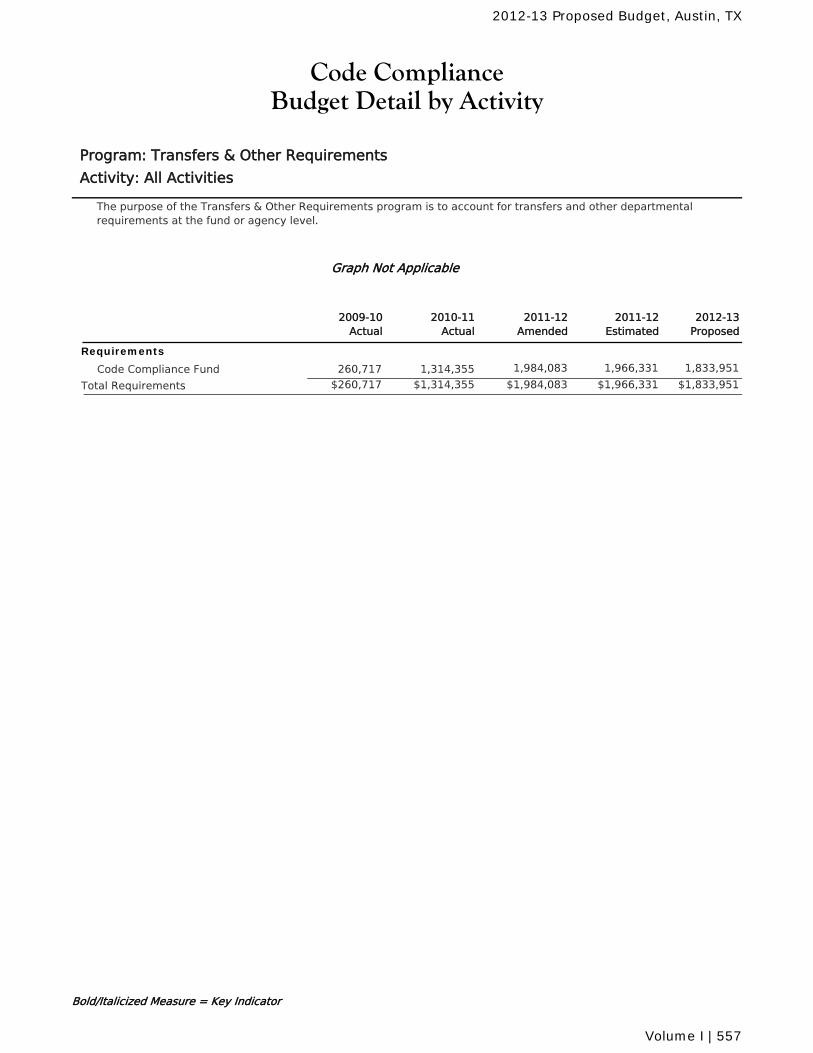
Code ComplianceBudget Detail by Activity
Program: Transfers & Other Requirements
Activity: All Activities
The purpose of the Transfers & Other Requirements program is to account for transfers and other departmentalrequirements at the fund or agency level.
Graph Not Applicable
2011-12Amended
2010-11Actual
2011-12Estimated
2012-13Proposed
2009-10Actual
Requirements
Code Compliance Fund 1,984,083 1,966,331 1,833,9511,314,355260,717
$1,984,083 $1,966,331 $1,833,951Total Requirements $1,314,355$260,717
Bold/Italicized Measure = Key Indicator
2012-13 Proposed Budget, Austin, TX
Volume I | 557
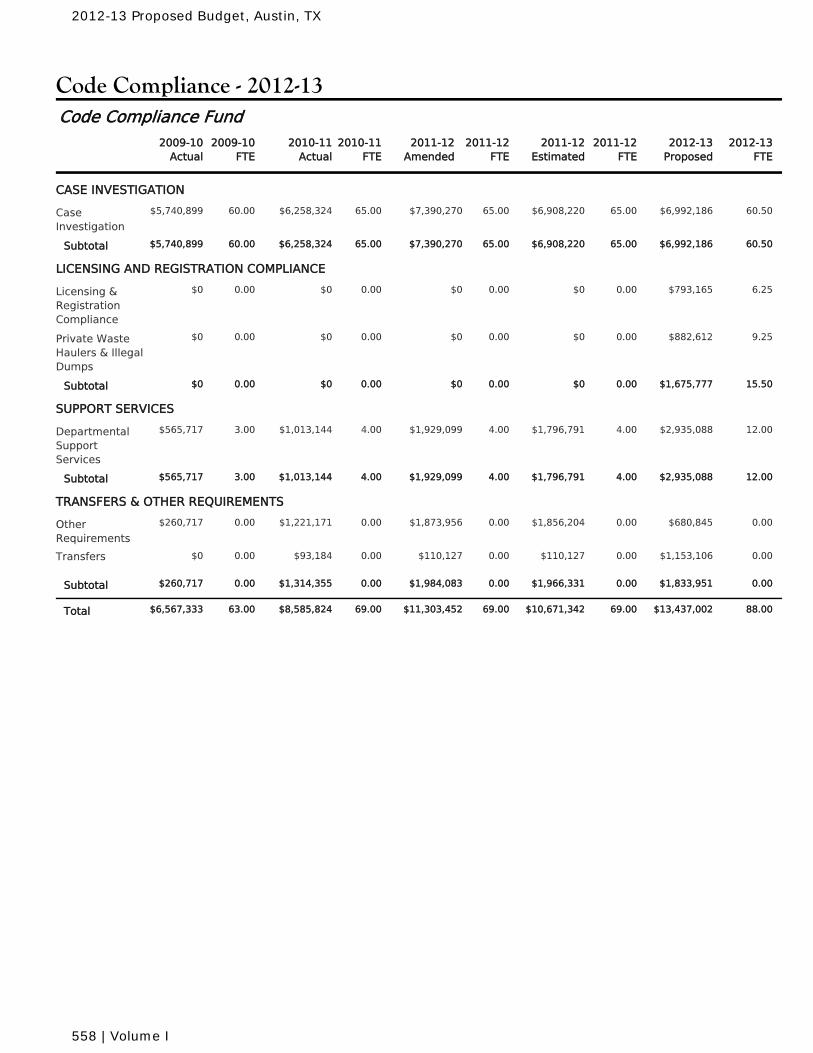
Code Compliance - 2012-13
2010-11Actual
2010-11FTE
2011-12Amended
2011-12FTE
2011-12Estimated
2011-12FTE
2009-10Actual
2009-10FTE
2012-13Proposed
2012-13FTE
Code Compliance Fund
CASE INVESTIGATION
$6,258,324 65.00 $7,390,270 65.00 $6,908,220 65.00CaseInvestigation
60.00 $6,992,186 60.50$5,740,899
$6,258,324 65.00 $7,390,270 65.00 $6,908,220 65.00Subtotal 60.00 $6,992,186 60.50$5,740,899
LICENSING AND REGISTRATION COMPLIANCE
$0 0.00 $0 0.00 $0 0.00Licensing &RegistrationCompliance
0.00 $793,165 6.25$0
$0 0.00 $0 0.00 $0 0.00Private WasteHaulers & IllegalDumps
0.00 $882,612 9.25$0
$0 0.00 $0 0.00 $0 0.00Subtotal 0.00 $1,675,777 15.50$0
SUPPORT SERVICES
$1,013,144 4.00 $1,929,099 4.00 $1,796,791 4.00DepartmentalSupportServices
3.00 $2,935,088 12.00$565,717
$1,013,144 4.00 $1,929,099 4.00 $1,796,791 4.00Subtotal 3.00 $2,935,088 12.00$565,717
TRANSFERS & OTHER REQUIREMENTS
$1,221,171 0.00 $1,873,956 0.00 $1,856,204 0.00OtherRequirements
0.00 $680,845 0.00$260,717
$93,184 0.00 $110,127 0.00 $110,127 0.00Transfers 0.00 $1,153,106 0.00$0
$1,314,355 0.00 $1,984,083 0.00 $1,966,331 0.00Subtotal 0.00 $1,833,951 0.00$260,717
$8,585,824 69.00 $11,303,452 69.00 $10,671,342 69.00Total 63.00 $13,437,002 88.00$6,567,333
2012-13 Proposed Budget, Austin, TX
558 | Volume I
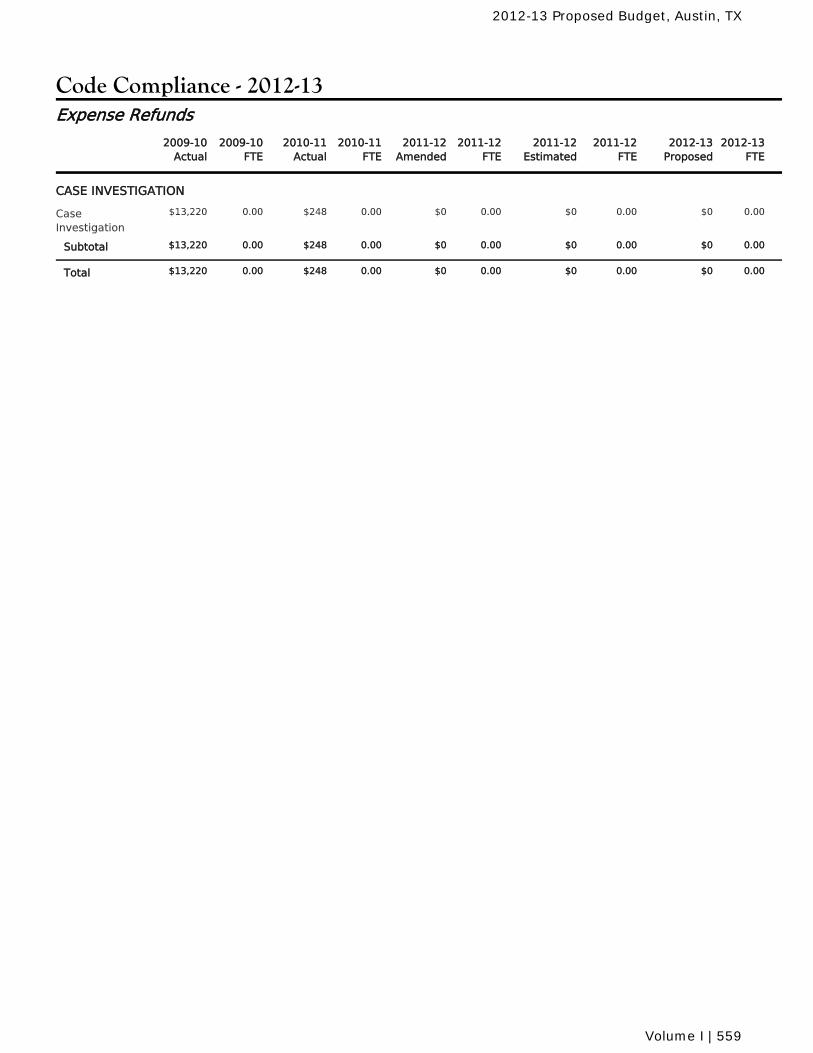
Code Compliance - 2012-13
2010-11Actual
2010-11FTE
2011-12Amended
2011-12FTE
2011-12Estimated
2011-12FTE
2009-10Actual
2009-10FTE
2012-13Proposed
2012-13FTE
Expense Refunds
CASE INVESTIGATION
$248 0.00 $0 0.00 $0 0.00CaseInvestigation
0.00 $0 0.00$13,220
$248 0.00 $0 0.00 $0 0.00Subtotal 0.00 $0 0.00$13,220
$248 0.00 $0 0.00 $0 0.00Total 0.00 $0 0.00$13,220
2012-13 Proposed Budget, Austin, TX
Volume I | 559

2012-13 Proposed Budget, Austin, TX
560 | Volume I
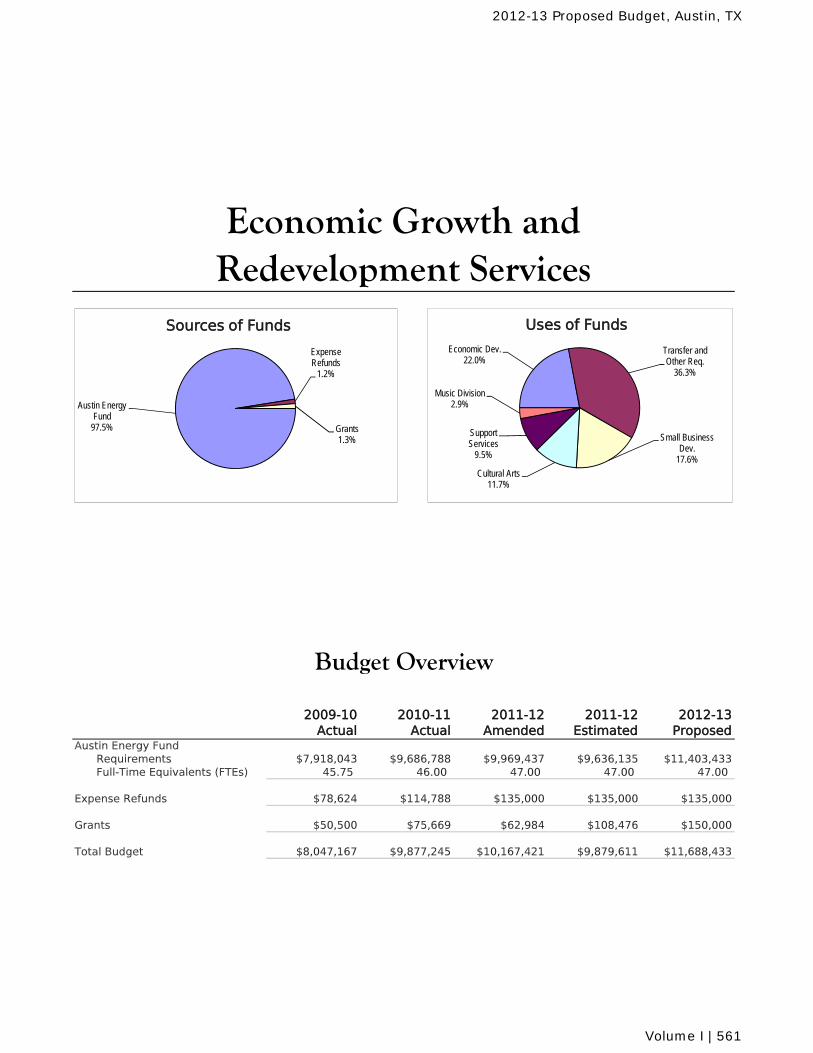
2009-10 Actual
2010-11 Actual
2011-12 Amended
2011-12 Estimated
2012-13 Proposed
Austin Energy FundRequirements $7,918,043 $9,686,788 $9,969,437 $9,636,135 $11,403,433Full-Time Equivalents (FTEs) 45.75 46.00 47.00 47.00 47.00
Expense Refunds $78,624 $114,788 $135,000 $135,000 $135,000
Grants $50,500 $75,669 $62,984 $108,476 $150,000
Total Budget $8,047,167 $9,877,245 $10,167,421 $9,879,611 $11,688,433
Budget Overview
Economic Growth and Redevelopment Services
Austin Energy Fund
97.5%
Expense Refunds
1.2%
Grants1.3%
Sources of Funds
Economic Dev.22.0%
Transfer and Other Req.
36.3%
Small Business Dev.
17.6%
Cultural Arts 11.7%
Support Services
9.5%
Music Division2.9%
Uses of Funds
2012-13 Proposed Budget, Austin, TX
Volume I | 561
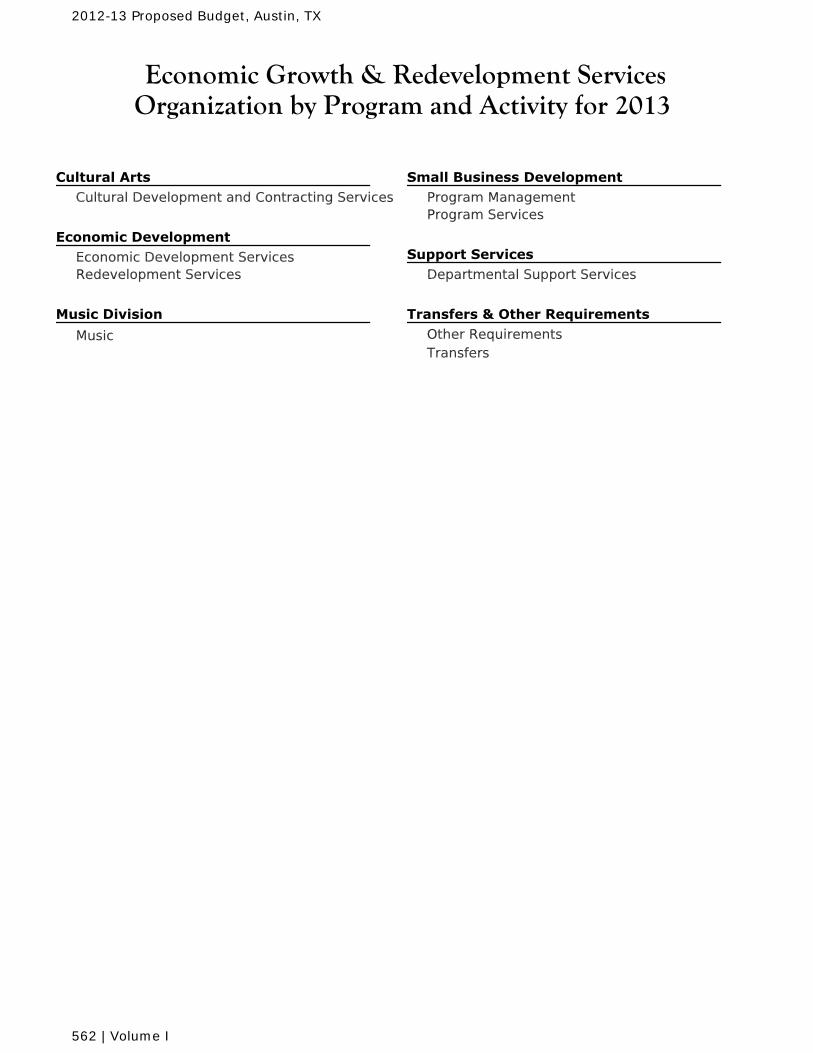
Economic Growth & Redevelopment ServicesOrganization by Program and Activity for 2013
Cultural Development and Contracting Services
Economic Development ServicesRedevelopment Services
Music
Program ManagementProgram Services
Departmental Support Services
Other RequirementsTransfers
2012-13 Proposed Budget, Austin, TX
562 | Volume I
Economic Growth & Redevelopment ServicesMission and Goals for 2013
The mission of the Economic Growth and Redevelopment Services Office (EGRSO) is to create acultural and economic environment that enhances the vitality of the community in a manner thatpreserves Austin's character and environment.
Create 500 new jobs through economic development efforts with a renewed emphasis on low incomeand blue collar jobs.
Offer classes through International Programs that will assist 35 businesses to export or enter intonew markets.
Perform 550 venue sound evaluations to decrease noise impact to neighboring communities.
Create 20 new jobs through the Family Business Loan program.
Repair or restore three pieces of the public art collection per year.
2012-13 Proposed Budget, Austin, TX
Volume I | 563
Economic Growth and Redevelopment Services
Message from the Director
Austin was named as one of the seven cities worldwide competing for the Top Intelligent Community Award by the Intelligent Community Forum; Austin was ranked No. 2 by MovieMaker Magazine; Austin was recently ranked the 3rd most prosperous metro in the nation making it one of the biggest labor markets to have regained jobs during the recession; known as the “Live Music Capital of the World,” Austin also boasts the world famous SXSW, ACL and numerous other music festivals and events. Texas was ranked as the top exporting state in 2011 for the 10th year in a row, according to data released by the U.S. Department of Commerce, a clear sign of Texas’ (and Austin’s) continued role as a leader in the global market. Maintaining this impressive list of accolades and accomplishments will require the City of Austin’s Economic Growth and Redevelopment Services Office (EGRSO) to continue to be a leader by pursuing programs and initiatives that leverage our cultural economic and business assets. EGRSO will continue to grow small business and new technology companies, strategically redevelop underutilized downtown assets, and utilize the strengths of the music, cultural, technology and international division to grow digital and alternative media investments in Austin. The International Division will have an enhanced role in seeking new platforms to promote Austin and further transform business cultures within a global marketplace through key international relationships initiated during FY 2011-12. In 2013, EGRSO seeks to deploy new economic vitality techniques to improve the city’s economic sustainability and create jobs for the nearly 25,000 City of Austin residents who remain unemployed despite great strides in our economic recovery. New Technology Part of the answer is technology. EGRSO is planning to manage the nations’ first supercomputing tool for sustainable places and to assist with implementing portions of Imagine Austin. EGRSO is creating a return-on-investment business platform that improves the performance of implementation scenarios. In this context EGRSO is going to use a new analytic and supercomputing technology to implement citywide redevelopment activities. EGRSO is seeking new federal resources to fund this redevelopment and will deploy those resources to facilitate small business expansions. In adapting to the changing 21st century economic conditions, EGRSO is continuing to make incremental improvements to existing economic systems that support technology, trade, entrepreneurship and city rebuilding. We strive to make Austin a model for job and tax creation, city management, environmental quality, innovation and creativity in the global marketplace. New Public Resources EGRSO is also focusing on attracting federal resources for redevelopment and small business expansion. Federal resources include grants, low interest loans, and federal tax credits to accelerate city rebuilding efforts. New Trade Activity EGRSO is working to attract foreign direct investment and trade to Austin. We are expanding our efforts to reduce the barriers inhibiting small- and medium-sized business export growth and to promote Austin in international markets as a top destination for investment. We are placing particular emphasis on attracting industrial development to the 3,700 industrial-zoned acres near Austin-Bergstrom International Airport (ABIA). EGRSO will continue its traditional award-winning programs through Cultural Arts, Redevelopment/Downtown Initiatives, International Programs, Economic Development and Small Business Development Programs, all of which provide a variety of economic opportunities. Challenges in the future include increasing blue and green collar employment for the unemployed and under employed; greater work load due to new initiatives and increasing customer demand; keeping pace with the increasingly global economy; and updating the Art in Public Places Ordinance to address donation/loan policy and decision policy. EGRSO plans to press forward with new initiatives with a total budget of $11.7 million in FY 2012-13. On behalf of all EGSRO staff, I thank you for allowing us to help keep the city of Austin’s economy moving forward. Lucien Kevin Johns, Director
2012-13 Proposed Budget, Austin, TX
564 | Volume I
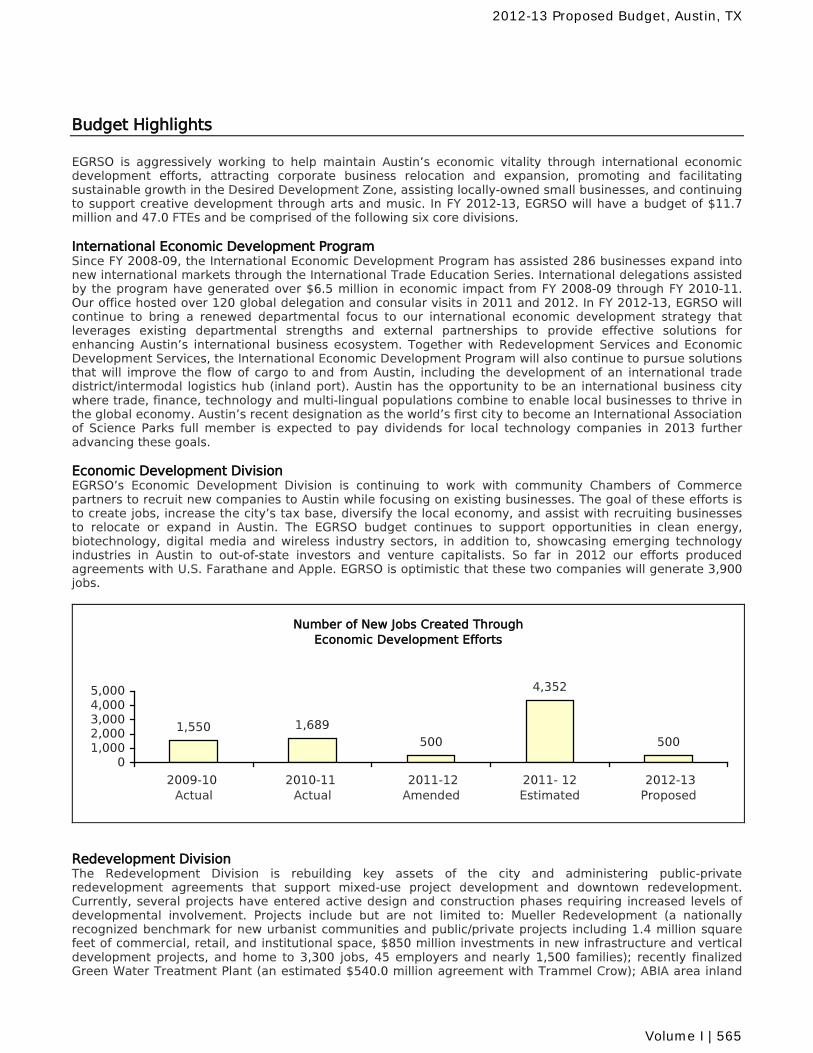
Budget Highlights
EGRSO is aggressively working to help maintain Austin’s economic vitality through international economic development efforts, attracting corporate business relocation and expansion, promoting and facilitating sustainable growth in the Desired Development Zone, assisting locally-owned small businesses, and continuing to support creative development through arts and music. In FY 2012-13, EGRSO will have a budget of $11.7 million and 47.0 FTEs and be comprised of the following six core divisions. International Economic Development Program Since FY 2008-09, the International Economic Development Program has assisted 286 businesses expand into new international markets through the International Trade Education Series. International delegations assisted by the program have generated over $6.5 million in economic impact from FY 2008-09 through FY 2010-11. Our office hosted over 120 global delegation and consular visits in 2011 and 2012. In FY 2012-13, EGRSO will continue to bring a renewed departmental focus to our international economic development strategy that leverages existing departmental strengths and external partnerships to provide effective solutions for enhancing Austin’s international business ecosystem. Together with Redevelopment Services and Economic Development Services, the International Economic Development Program will also continue to pursue solutions that will improve the flow of cargo to and from Austin, including the development of an international trade district/intermodal logistics hub (inland port). Austin has the opportunity to be an international business city where trade, finance, technology and multi-lingual populations combine to enable local businesses to thrive in the global economy. Austin’s recent designation as the world’s first city to become an International Association of Science Parks full member is expected to pay dividends for local technology companies in 2013 further advancing these goals. Economic Development Division EGRSO’s Economic Development Division is continuing to work with community Chambers of Commerce partners to recruit new companies to Austin while focusing on existing businesses. The goal of these efforts is to create jobs, increase the city’s tax base, diversify the local economy, and assist with recruiting businesses to relocate or expand in Austin. The EGRSO budget continues to support opportunities in clean energy, biotechnology, digital media and wireless industry sectors, in addition to, showcasing emerging technology industries in Austin to out-of-state investors and venture capitalists. So far in 2012 our efforts produced agreements with U.S. Farathane and Apple. EGRSO is optimistic that these two companies will generate 3,900 jobs.
Number of New Jobs Created Through Economic Development Efforts
1,550 1,689500
4,352
500
01,0002,0003,0004,0005,000
2009-10 Actual
2010-11 Actual
2011-12 Amended
2011- 12Estimated
2012-13 Proposed
Redevelopment Division The Redevelopment Division is rebuilding key assets of the city and administering public-private redevelopment agreements that support mixed-use project development and downtown redevelopment. Currently, several projects have entered active design and construction phases requiring increased levels of developmental involvement. Projects include but are not limited to: Mueller Redevelopment (a nationally recognized benchmark for new urbanist communities and public/private projects including 1.4 million square feet of commercial, retail, and institutional space, $850 million investments in new infrastructure and vertical development projects, and home to 3,300 jobs, 45 employers and nearly 1,500 families); recently finalized Green Water Treatment Plant (an estimated $540.0 million agreement with Trammel Crow); ABIA area inland
2012-13 Proposed Budget, Austin, TX
Volume I | 565
port; Gables Park Plaza Phase II; the Federal Courthouse; 501 Congress Avenue; Seaholm; and RBJ Senior Residential Center (a project without an agreement). EGRSO is well versed in developing various partnerships using a variety of financing mechanisms that result in the implementation of large catalyst projects that translate vision into reality. Small Business Development Program Small Business Development Program (SBDP) fosters job creation and economic growth by providing information, education, one-on-one technical assistance, annual highly visible special-topic informational events, and innovative technology resources that help Austin’s small businesses grow and prosper. SBDP’s budget for FY 2012-13 meets the evolving needs of small businesses with current funding levels, and includes three valuable new resources implemented in FY 2011-12: The Family Business Loan Program, a public-private partnership that provides low-cost loans for small business expansion and job creation; The Entrepreneur Center, a dedicated state-of-the-art small business training facility with access to meeting rooms for small business owners where SBDP expects to train approximately 2,000 small business owners annually; Explorelocalaustin.org, SBDP’s online small business map, which will provide a variety of beneficial new features for users and participating businesses. SBDP is also supporting EGRSO’s Global Commerce Strategy by adapting existing services to educate Austin’s small businesses on doing business internationally. New initiatives will be implemented in FY 2012-13 with existing staff though the demand for SBDP’s services is expected to rise further as the economy continues to recover and new business startups increase. Cultural Arts Division Arts, culture, and creativity are critical to the identity, economy, and quality of life in Austin and key to Austin’s reputation as a creative center in the global marketplace. The Cultural Arts Division continues to partner with the community to implement the CreateAustin Community Cultural Master Plan, provide Take it to the Next Level creative industry workshops, manage more than 80 active multi-year Art in Public Places projects, and administer the Cultural Arts Fund with a total Budget of $6.7M projected in FY 2012-13 for cultural contracts— funded from a dedicated 1.05 cents of every nine cents of the Hotel/Motel Occupancy Tax—all in an effort to strengthen Austin’s arts, culture and creative industries. A recently completed economic impact analysis shows that Austin’s creative sector generates over $4.3 billion in annual economic activity, with tourism contributing to over half of the city’s tax base. The Cultural Arts Division will develop a cultural tourism plan to ensure that the creative sector continues to be a vibrant contributor to Austin’s economy. Music Division The Music Division aims to enhance the economic vitality and cultural excellence of Austin’s music industry. In 2012, the economic impact of music on Austin’s economy grossed over $1.6 billion dollars, employing an estimated 18,148 people, with music city tax revenue totaling more than $38 million. The Music Division contributes to Austin’s music industry by partnering with various music-based community businesses and organizations, coordinating over 24 music-focused programs and 166 live music performances, while strengthening the network between music professionals, musicians, and community members. In addition, the Music Division performs an integral role in the event permitting process collaborating with event organizers in the review process which resulted in over 5,000 amplified sound investigations and 500 outdoor music permit evaluations this year. Providing assistance to live music venues and sound mitigation measures plus streamlining the event permitting process are key to maintaining a balance between Austin’s live music districts and residential development which is crucial to providing higher level of service to enhance music tourism, which contributed over $806 million dollars to Austin’s economy in 2010.
2012-13 Proposed Budget, Austin, TX
566 | Volume I
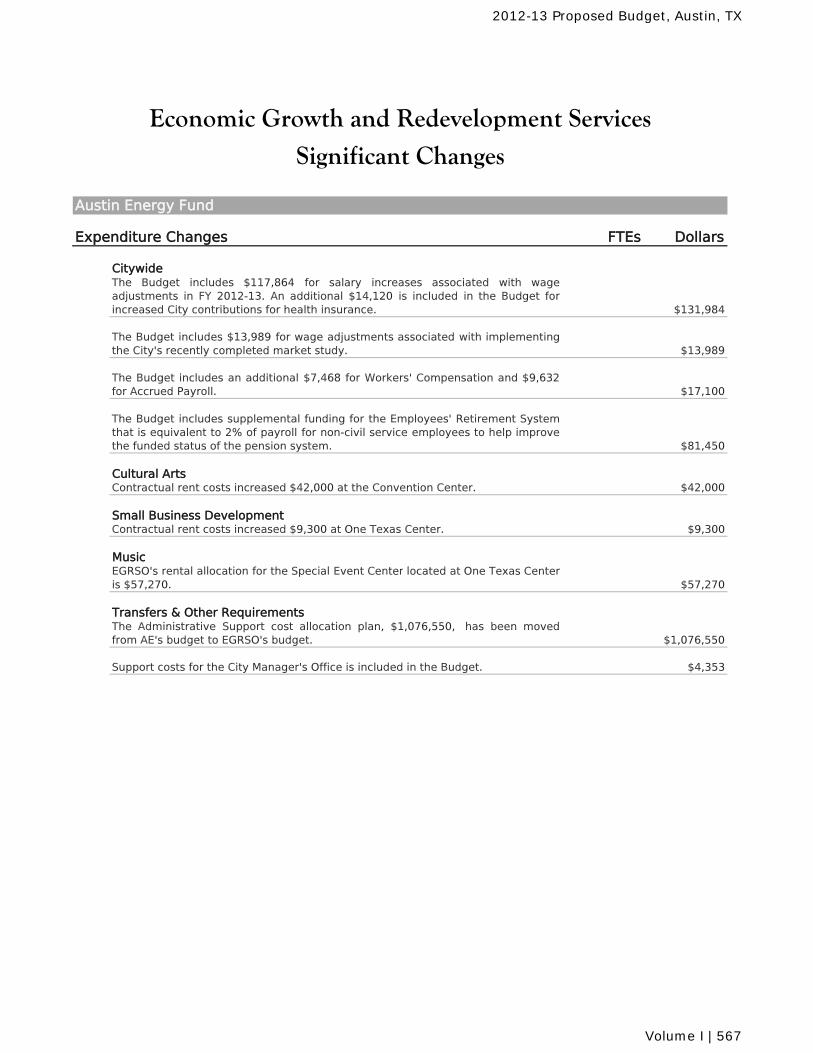
Expenditure Changes FTEs Dollars
CitywideThe Budget includes $117,864 for salary increases associated with wageadjustments in FY 2012-13. An additional $14,120 is included in the Budget forincreased City contributions for health insurance. $131,984
The Budget includes $13,989 for wage adjustments associated with implementingthe City's recently completed market study. $13,989
The Budget includes an additional $7,468 for Workers' Compensation and $9,632for Accrued Payroll. $17,100
The Budget includes supplemental funding for the Employees' Retirement Systemthat is equivalent to 2% of payroll for non-civil service employees to help improvethe funded status of the pension system. $81,450
Cultural ArtsContractual rent costs increased $42,000 at the Convention Center. $42,000
Small Business DevelopmentContractual rent costs increased $9,300 at One Texas Center. $9,300
MusicEGRSO's rental allocation for the Special Event Center located at One Texas Centeris $57,270. $57,270
Transfers & Other RequirementsThe Administrative Support cost allocation plan, $1,076,550, has been movedfrom AE's budget to EGRSO's budget. $1,076,550
Support costs for the City Manager's Office is included in the Budget. $4,353
Significant Changes
Economic Growth and Redevelopment Services
Austin Energy Fund
2012-13 Proposed Budget, Austin, TX
Volume I | 567
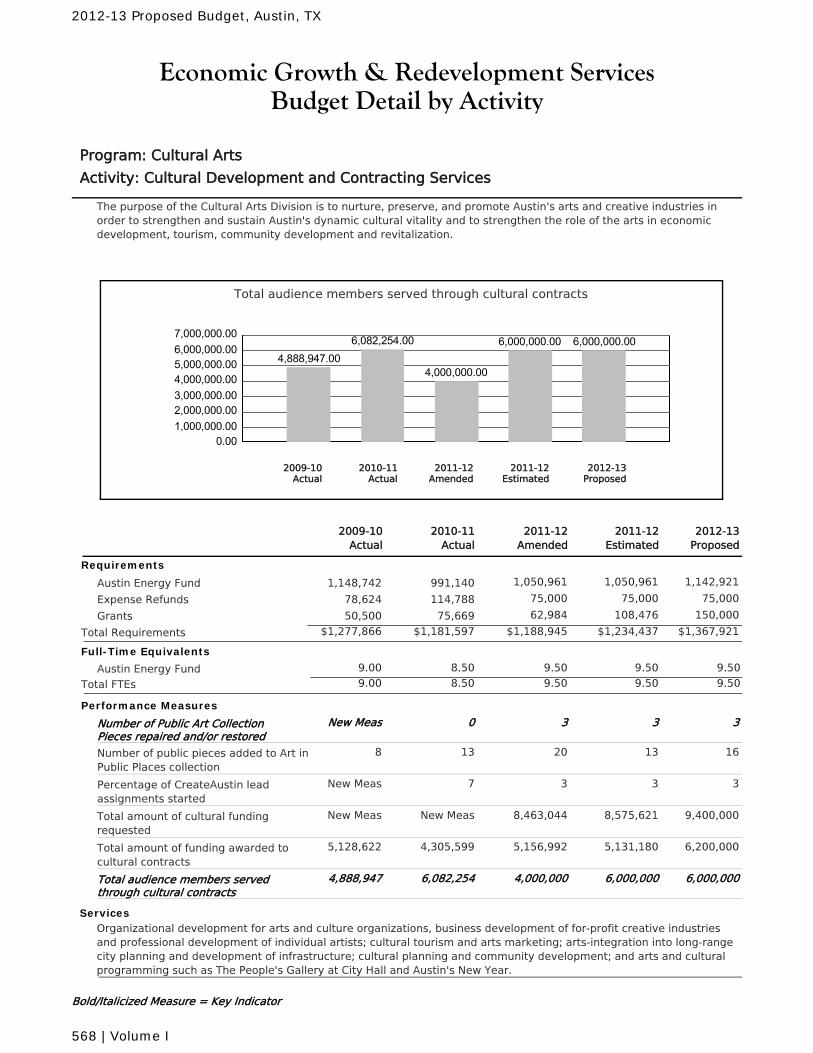
Economic Growth & Redevelopment ServicesBudget Detail by Activity
Program: Cultural Arts
Activity: Cultural Development and Contracting Services
The purpose of the Cultural Arts Division is to nurture, preserve, and promote Austin's arts and creative industries inorder to strengthen and sustain Austin's dynamic cultural vitality and to strengthen the role of the arts in economicdevelopment, tourism, community development and revitalization.
Total audience members served through cultural contracts
0.001,000,000.002,000,000.003,000,000.004,000,000.005,000,000.006,000,000.007,000,000.00
4,888,947.006,082,254.00
4,000,000.00
6,000,000.00 6,000,000.00
2010-11Actual
2012-13Proposed
2011-12Amended
2011-12Estimated
2009-10Actual
2011-12Amended
2010-11Actual
2011-12Estimated
2012-13Proposed
2009-10Actual
Requirements
Austin Energy Fund 1,050,961 1,050,961 1,142,921991,1401,148,742
Expense Refunds 75,000 75,000 75,000114,78878,624
Grants 62,984 108,476 150,00075,66950,500
$1,188,945 $1,234,437 $1,367,921Total Requirements $1,181,597$1,277,866
Full-Time Equivalents
Austin Energy Fund 8.50 9.50 9.50 9.509.00
Total FTEs 8.50 9.50 9.50 9.509.00
Performance Measures
Number of Public Art CollectionPieces repaired and/or restored
30 3 3New Meas
Number of public pieces added to Art inPublic Places collection
2013 13 168
Percentage of CreateAustin leadassignments started
37 3 3New Meas
Total amount of cultural fundingrequested
8,463,044New Meas 8,575,621 9,400,000New Meas
Total amount of funding awarded tocultural contracts
5,156,9924,305,599 5,131,180 6,200,0005,128,622
Total audience members servedthrough cultural contracts
4,000,0006,082,254 6,000,000 6,000,0004,888,947
ServicesOrganizational development for arts and culture organizations, business development of for-profit creative industriesand professional development of individual artists; cultural tourism and arts marketing; arts-integration into long-rangecity planning and development of infrastructure; cultural planning and community development; and arts and culturalprogramming such as The People's Gallery at City Hall and Austin's New Year.
Bold/Italicized Measure = Key Indicator
2012-13 Proposed Budget, Austin, TX
568 | Volume I
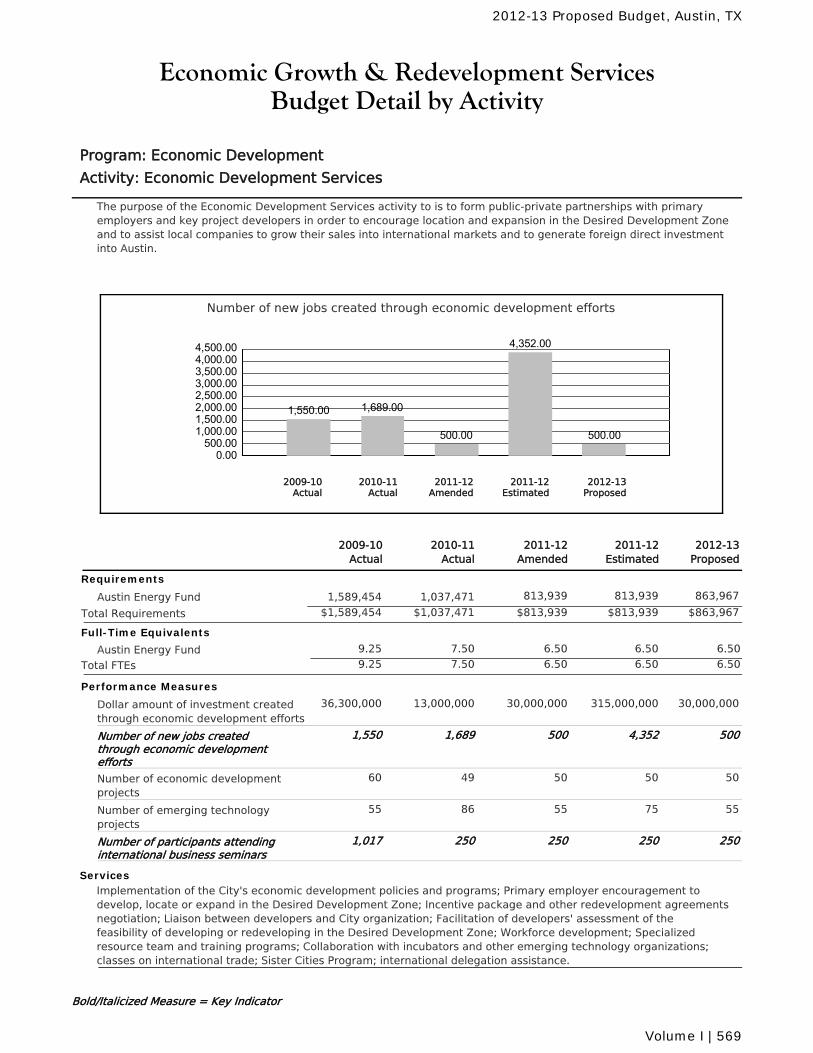
Economic Growth & Redevelopment ServicesBudget Detail by Activity
Program: Economic Development
Activity: Economic Development Services
The purpose of the Economic Development Services activity to is to form public-private partnerships with primaryemployers and key project developers in order to encourage location and expansion in the Desired Development Zoneand to assist local companies to grow their sales into international markets and to generate foreign direct investmentinto Austin.
Number of new jobs created through economic development efforts
0.00500.00
1,000.001,500.002,000.002,500.003,000.003,500.004,000.004,500.00
1,550.00 1,689.00
500.00
4,352.00
500.00
2010-11Actual
2012-13Proposed
2011-12Amended
2011-12Estimated
2009-10Actual
2011-12Amended
2010-11Actual
2011-12Estimated
2012-13Proposed
2009-10Actual
Requirements
Austin Energy Fund 813,939 813,939 863,9671,037,4711,589,454
$813,939 $813,939 $863,967Total Requirements $1,037,471$1,589,454
Full-Time Equivalents
Austin Energy Fund 7.50 6.50 6.50 6.509.25
Total FTEs 7.50 6.50 6.50 6.509.25
Performance Measures
Dollar amount of investment createdthrough economic development efforts
30,000,00013,000,000 315,000,000 30,000,00036,300,000
Number of new jobs createdthrough economic developmentefforts
5001,689 4,352 5001,550
Number of economic developmentprojects
5049 50 5060
Number of emerging technologyprojects
5586 75 5555
Number of participants attendinginternational business seminars
250250 250 2501,017
ServicesImplementation of the City's economic development policies and programs; Primary employer encouragement todevelop, locate or expand in the Desired Development Zone; Incentive package and other redevelopment agreementsnegotiation; Liaison between developers and City organization; Facilitation of developers' assessment of thefeasibility of developing or redeveloping in the Desired Development Zone; Workforce development; Specializedresource team and training programs; Collaboration with incubators and other emerging technology organizations;classes on international trade; Sister Cities Program; international delegation assistance.
Bold/Italicized Measure = Key Indicator
2012-13 Proposed Budget, Austin, TX
Volume I | 569
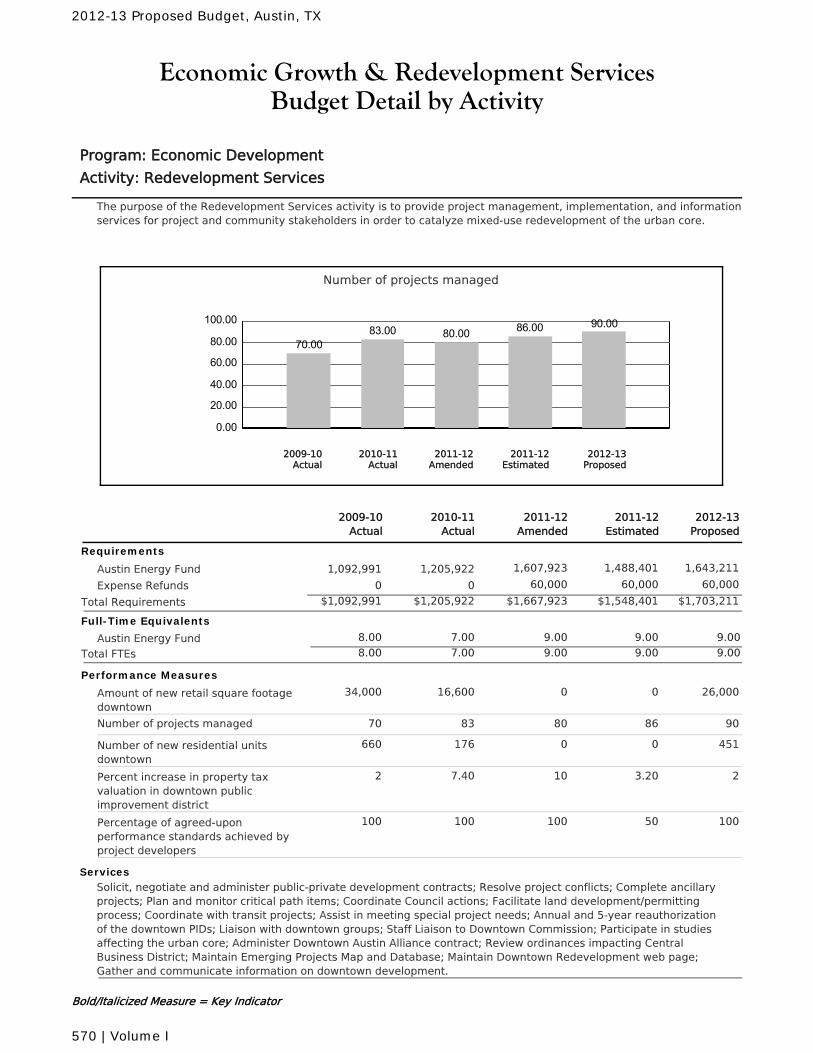
Economic Growth & Redevelopment ServicesBudget Detail by Activity
Program: Economic Development
Activity: Redevelopment Services
The purpose of the Redevelopment Services activity is to provide project management, implementation, and informationservices for project and community stakeholders in order to catalyze mixed-use redevelopment of the urban core.
Number of projects managed
0.00
20.00
40.00
60.00
80.00
100.00
70.0083.00 80.00 86.00 90.00
2010-11Actual
2012-13Proposed
2011-12Amended
2011-12Estimated
2009-10Actual
2011-12Amended
2010-11Actual
2011-12Estimated
2012-13Proposed
2009-10Actual
Requirements
Austin Energy Fund 1,607,923 1,488,401 1,643,2111,205,9221,092,991
Expense Refunds 60,000 60,000 60,00000
$1,667,923 $1,548,401 $1,703,211Total Requirements $1,205,922$1,092,991
Full-Time Equivalents
Austin Energy Fund 7.00 9.00 9.00 9.008.00
Total FTEs 7.00 9.00 9.00 9.008.00
Performance Measures
Amount of new retail square footagedowntown
016,600 0 26,00034,000
Number of projects managed 8083 86 9070
Number of new residential unitsdowntown
0176 0 451660
Percent increase in property taxvaluation in downtown publicimprovement district
107.40 3.20 22
Percentage of agreed-uponperformance standards achieved byproject developers
100100 50 100100
ServicesSolicit, negotiate and administer public-private development contracts; Resolve project conflicts; Complete ancillaryprojects; Plan and monitor critical path items; Coordinate Council actions; Facilitate land development/permittingprocess; Coordinate with transit projects; Assist in meeting special project needs; Annual and 5-year reauthorizationof the downtown PIDs; Liaison with downtown groups; Staff Liaison to Downtown Commission; Participate in studiesaffecting the urban core; Administer Downtown Austin Alliance contract; Review ordinances impacting CentralBusiness District; Maintain Emerging Projects Map and Database; Maintain Downtown Redevelopment web page;Gather and communicate information on downtown development.
Bold/Italicized Measure = Key Indicator
2012-13 Proposed Budget, Austin, TX
570 | Volume I
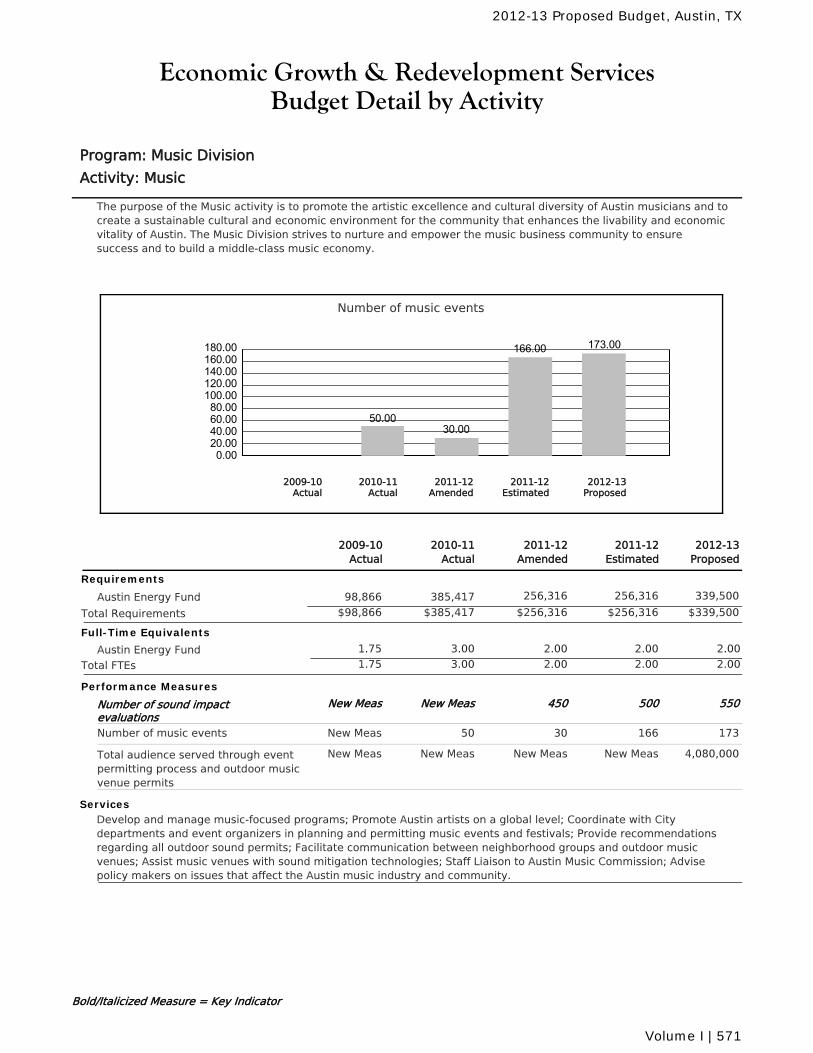
Economic Growth & Redevelopment ServicesBudget Detail by Activity
Program: Music Division
Activity: Music
The purpose of the Music activity is to promote the artistic excellence and cultural diversity of Austin musicians and tocreate a sustainable cultural and economic environment for the community that enhances the livability and economicvitality of Austin. The Music Division strives to nurture and empower the music business community to ensuresuccess and to build a middle-class music economy.
Number of music events
0.0020.0040.0060.0080.00100.00120.00140.00160.00180.00
50.0030.00
166.00 173.00
2010-11Actual
2012-13Proposed
2011-12Amended
2011-12Estimated
2009-10Actual
2011-12Amended
2010-11Actual
2011-12Estimated
2012-13Proposed
2009-10Actual
Requirements
Austin Energy Fund 256,316 256,316 339,500385,41798,866
$256,316 $256,316 $339,500Total Requirements $385,417$98,866
Full-Time Equivalents
Austin Energy Fund 3.00 2.00 2.00 2.001.75
Total FTEs 3.00 2.00 2.00 2.001.75
Performance Measures
Number of sound impactevaluations
450New Meas 500 550New Meas
Number of music events 3050 166 173New Meas
Total audience served through eventpermitting process and outdoor musicvenue permits
New MeasNew Meas New Meas 4,080,000New Meas
ServicesDevelop and manage music-focused programs; Promote Austin artists on a global level; Coordinate with Citydepartments and event organizers in planning and permitting music events and festivals; Provide recommendationsregarding all outdoor sound permits; Facilitate communication between neighborhood groups and outdoor musicvenues; Assist music venues with sound mitigation technologies; Staff Liaison to Austin Music Commission; Advisepolicy makers on issues that affect the Austin music industry and community.
Bold/Italicized Measure = Key Indicator
2012-13 Proposed Budget, Austin, TX
Volume I | 571
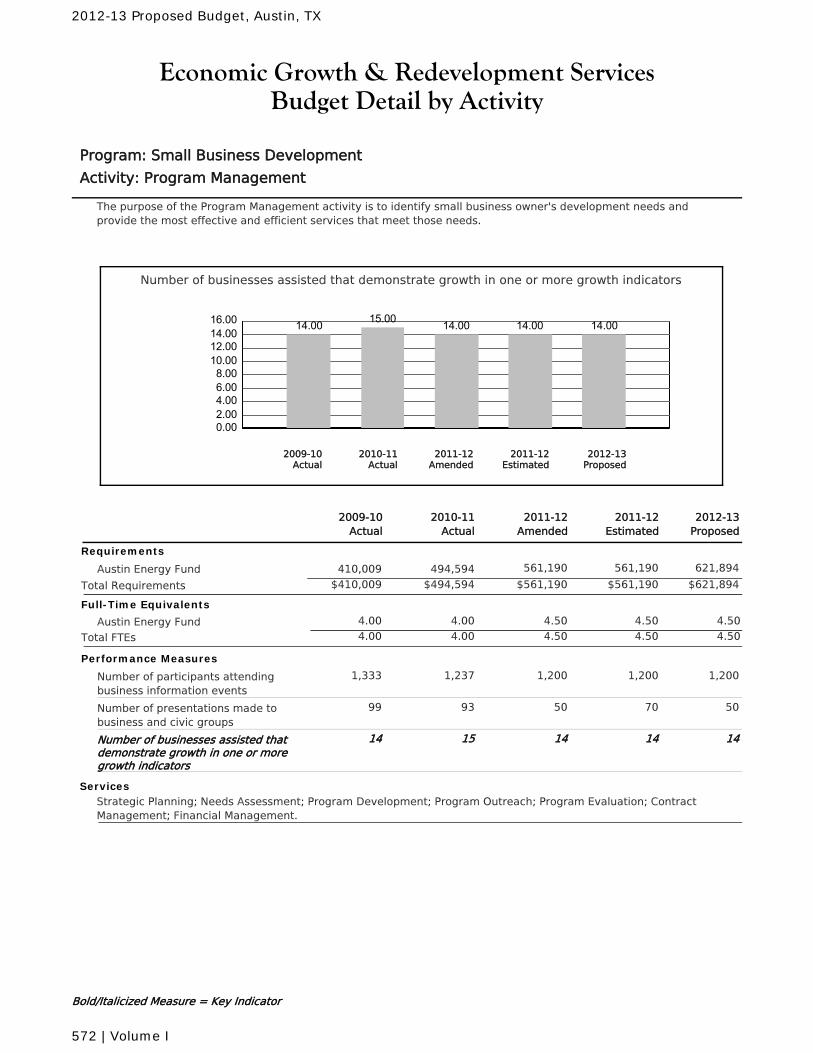
Economic Growth & Redevelopment ServicesBudget Detail by Activity
Program: Small Business Development
Activity: Program Management
The purpose of the Program Management activity is to identify small business owner's development needs andprovide the most effective and efficient services that meet those needs.
Number of businesses assisted that demonstrate growth in one or more growth indicators
0.002.004.006.008.0010.0012.0014.0016.00 14.00 15.00 14.00 14.00 14.00
2010-11Actual
2012-13Proposed
2011-12Amended
2011-12Estimated
2009-10Actual
2011-12Amended
2010-11Actual
2011-12Estimated
2012-13Proposed
2009-10Actual
Requirements
Austin Energy Fund 561,190 561,190 621,894494,594410,009
$561,190 $561,190 $621,894Total Requirements $494,594$410,009
Full-Time Equivalents
Austin Energy Fund 4.00 4.50 4.50 4.504.00
Total FTEs 4.00 4.50 4.50 4.504.00
Performance Measures
Number of participants attendingbusiness information events
1,2001,237 1,200 1,2001,333
Number of presentations made tobusiness and civic groups
5093 70 5099
Number of businesses assisted thatdemonstrate growth in one or moregrowth indicators
1415 14 1414
ServicesStrategic Planning; Needs Assessment; Program Development; Program Outreach; Program Evaluation; ContractManagement; Financial Management.
Bold/Italicized Measure = Key Indicator
2012-13 Proposed Budget, Austin, TX
572 | Volume I
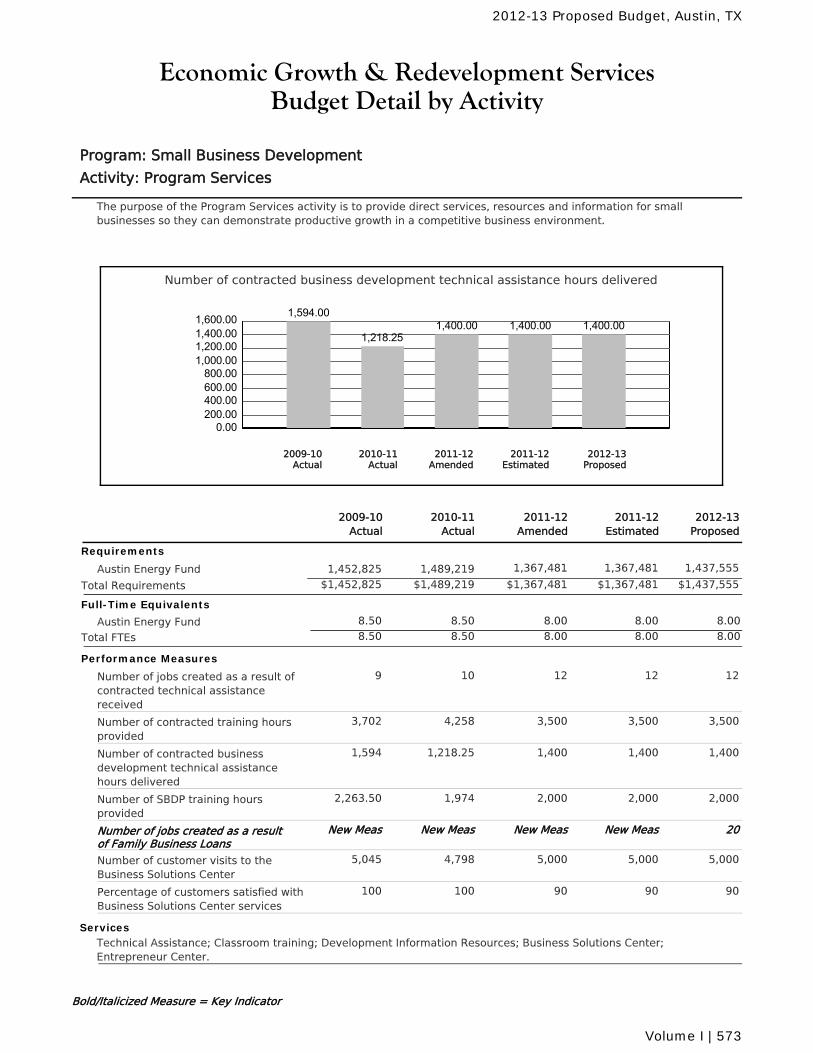
Economic Growth & Redevelopment ServicesBudget Detail by Activity
Program: Small Business Development
Activity: Program Services
The purpose of the Program Services activity is to provide direct services, resources and information for smallbusinesses so they can demonstrate productive growth in a competitive business environment.
Number of contracted business development technical assistance hours delivered
0.00200.00400.00600.00800.00
1,000.001,200.001,400.001,600.00 1,594.00
1,218.251,400.00 1,400.00 1,400.00
2010-11Actual
2012-13Proposed
2011-12Amended
2011-12Estimated
2009-10Actual
2011-12Amended
2010-11Actual
2011-12Estimated
2012-13Proposed
2009-10Actual
Requirements
Austin Energy Fund 1,367,481 1,367,481 1,437,5551,489,2191,452,825
$1,367,481 $1,367,481 $1,437,555Total Requirements $1,489,219$1,452,825
Full-Time Equivalents
Austin Energy Fund 8.50 8.00 8.00 8.008.50
Total FTEs 8.50 8.00 8.00 8.008.50
Performance Measures
Number of jobs created as a result ofcontracted technical assistancereceived
1210 12 129
Number of contracted training hoursprovided
3,5004,258 3,500 3,5003,702
Number of contracted businessdevelopment technical assistancehours delivered
1,4001,218.25 1,400 1,4001,594
Number of SBDP training hoursprovided
2,0001,974 2,000 2,0002,263.50
Number of jobs created as a resultof Family Business Loans
New MeasNew Meas New Meas 20New Meas
Number of customer visits to theBusiness Solutions Center
5,0004,798 5,000 5,0005,045
Percentage of customers satisfied withBusiness Solutions Center services
90100 90 90100
ServicesTechnical Assistance; Classroom training; Development Information Resources; Business Solutions Center;Entrepreneur Center.
Bold/Italicized Measure = Key Indicator
2012-13 Proposed Budget, Austin, TX
Volume I | 573
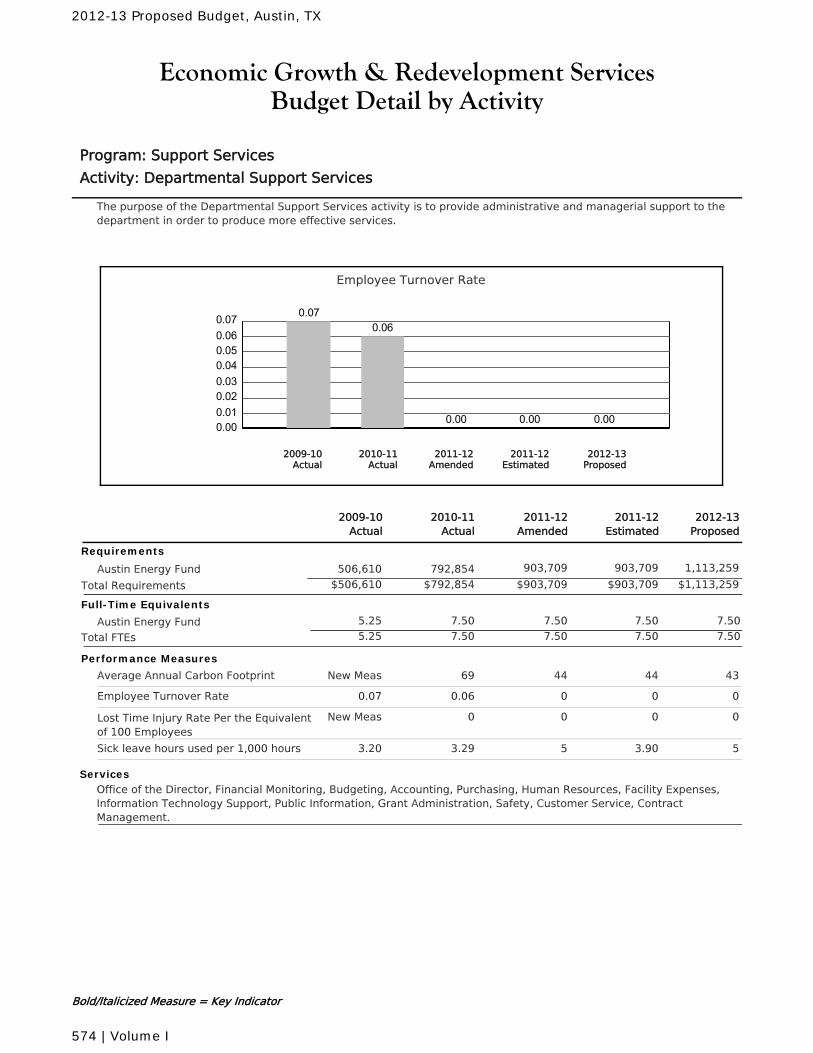
Economic Growth & Redevelopment ServicesBudget Detail by Activity
Program: Support Services
Activity: Departmental Support Services
The purpose of the Departmental Support Services activity is to provide administrative and managerial support to thedepartment in order to produce more effective services.
Employee Turnover Rate
0.000.010.020.030.040.050.060.07 0.07
0.06
0.00 0.00 0.00
2010-11Actual
2012-13Proposed
2011-12Amended
2011-12Estimated
2009-10Actual
2011-12Amended
2010-11Actual
2011-12Estimated
2012-13Proposed
2009-10Actual
Requirements
Austin Energy Fund 903,709 903,709 1,113,259792,854506,610
$903,709 $903,709 $1,113,259Total Requirements $792,854$506,610
Full-Time Equivalents
Austin Energy Fund 7.50 7.50 7.50 7.505.25
Total FTEs 7.50 7.50 7.50 7.505.25
Performance Measures
Average Annual Carbon Footprint 4469 44 43New Meas
Employee Turnover Rate 00.06 0 00.07
Lost Time Injury Rate Per the Equivalentof 100 Employees
00 0 0New Meas
Sick leave hours used per 1,000 hours 53.29 3.90 53.20
ServicesOffice of the Director, Financial Monitoring, Budgeting, Accounting, Purchasing, Human Resources, Facility Expenses,Information Technology Support, Public Information, Grant Administration, Safety, Customer Service, ContractManagement.
Bold/Italicized Measure = Key Indicator
2012-13 Proposed Budget, Austin, TX
574 | Volume I
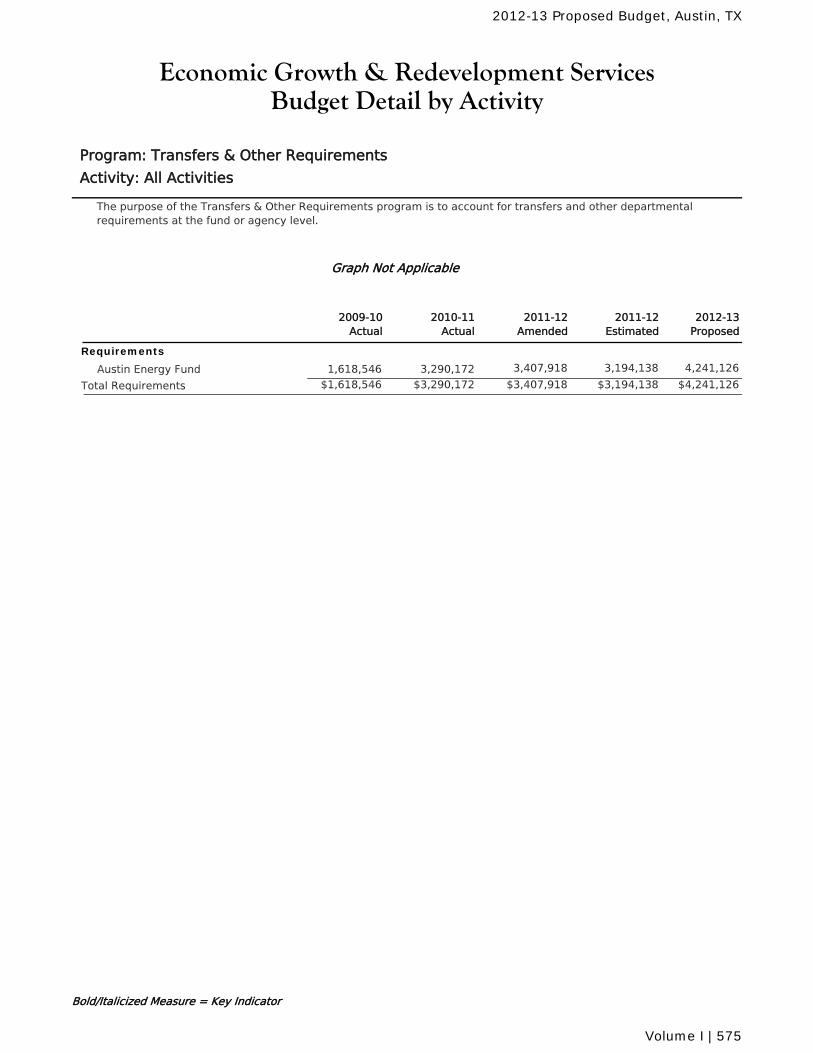
Economic Growth & Redevelopment ServicesBudget Detail by Activity
Program: Transfers & Other Requirements
Activity: All Activities
The purpose of the Transfers & Other Requirements program is to account for transfers and other departmentalrequirements at the fund or agency level.
Graph Not Applicable
2011-12Amended
2010-11Actual
2011-12Estimated
2012-13Proposed
2009-10Actual
Requirements
Austin Energy Fund 3,407,918 3,194,138 4,241,1263,290,1721,618,546
$3,407,918 $3,194,138 $4,241,126Total Requirements $3,290,172$1,618,546
Bold/Italicized Measure = Key Indicator
2012-13 Proposed Budget, Austin, TX
Volume I | 575
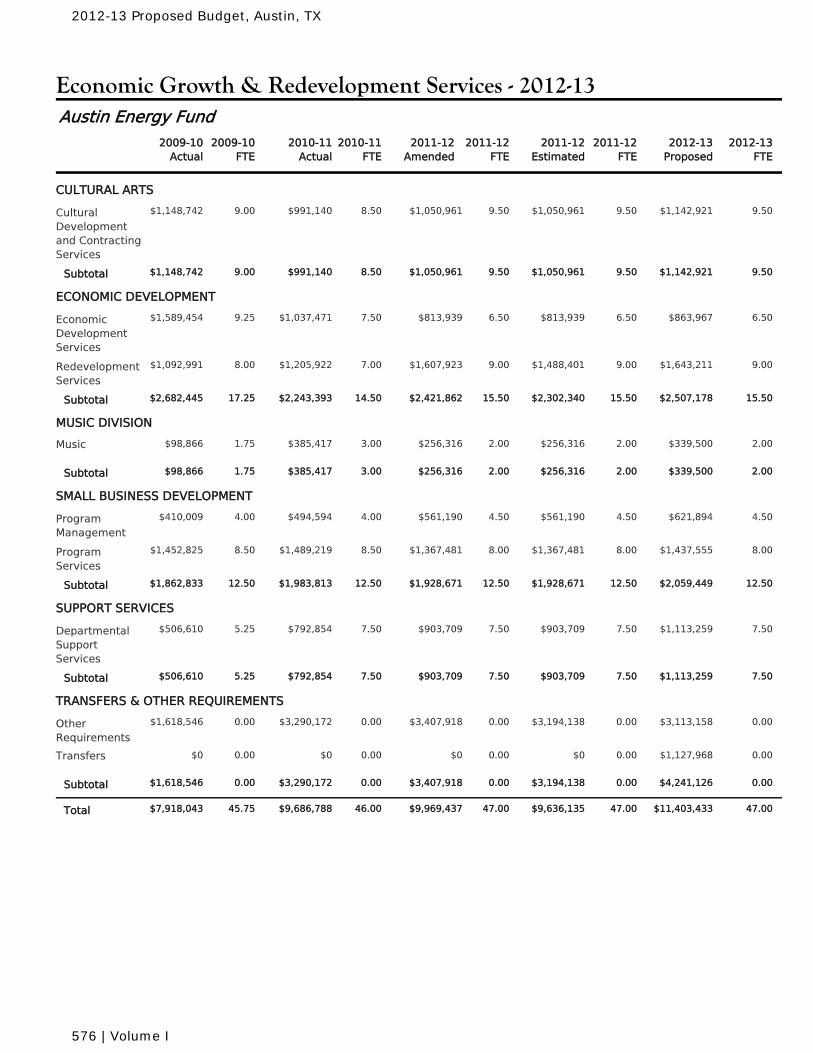
Economic Growth & Redevelopment Services - 2012-13
2010-11Actual
2010-11FTE
2011-12Amended
2011-12FTE
2011-12Estimated
2011-12FTE
2009-10Actual
2009-10FTE
2012-13Proposed
2012-13FTE
Austin Energy Fund
CULTURAL ARTS
$991,140 8.50 $1,050,961 9.50 $1,050,961 9.50CulturalDevelopmentand ContractingServices
9.00 $1,142,921 9.50$1,148,742
$991,140 8.50 $1,050,961 9.50 $1,050,961 9.50Subtotal 9.00 $1,142,921 9.50$1,148,742
ECONOMIC DEVELOPMENT
$1,037,471 7.50 $813,939 6.50 $813,939 6.50EconomicDevelopmentServices
9.25 $863,967 6.50$1,589,454
$1,205,922 7.00 $1,607,923 9.00 $1,488,401 9.00RedevelopmentServices
8.00 $1,643,211 9.00$1,092,991
$2,243,393 14.50 $2,421,862 15.50 $2,302,340 15.50Subtotal 17.25 $2,507,178 15.50$2,682,445
MUSIC DIVISION
$385,417 3.00 $256,316 2.00 $256,316 2.00Music 1.75 $339,500 2.00$98,866
$385,417 3.00 $256,316 2.00 $256,316 2.00Subtotal 1.75 $339,500 2.00$98,866
SMALL BUSINESS DEVELOPMENT
$494,594 4.00 $561,190 4.50 $561,190 4.50ProgramManagement
4.00 $621,894 4.50$410,009
$1,489,219 8.50 $1,367,481 8.00 $1,367,481 8.00ProgramServices
8.50 $1,437,555 8.00$1,452,825
$1,983,813 12.50 $1,928,671 12.50 $1,928,671 12.50Subtotal 12.50 $2,059,449 12.50$1,862,833
SUPPORT SERVICES
$792,854 7.50 $903,709 7.50 $903,709 7.50DepartmentalSupportServices
5.25 $1,113,259 7.50$506,610
$792,854 7.50 $903,709 7.50 $903,709 7.50Subtotal 5.25 $1,113,259 7.50$506,610
TRANSFERS & OTHER REQUIREMENTS
$3,290,172 0.00 $3,407,918 0.00 $3,194,138 0.00OtherRequirements
0.00 $3,113,158 0.00$1,618,546
$0 0.00 $0 0.00 $0 0.00Transfers 0.00 $1,127,968 0.00$0
$3,290,172 0.00 $3,407,918 0.00 $3,194,138 0.00Subtotal 0.00 $4,241,126 0.00$1,618,546
$9,686,788 46.00 $9,969,437 47.00 $9,636,135 47.00Total 45.75 $11,403,433 47.00$7,918,043
2012-13 Proposed Budget, Austin, TX
576 | Volume I
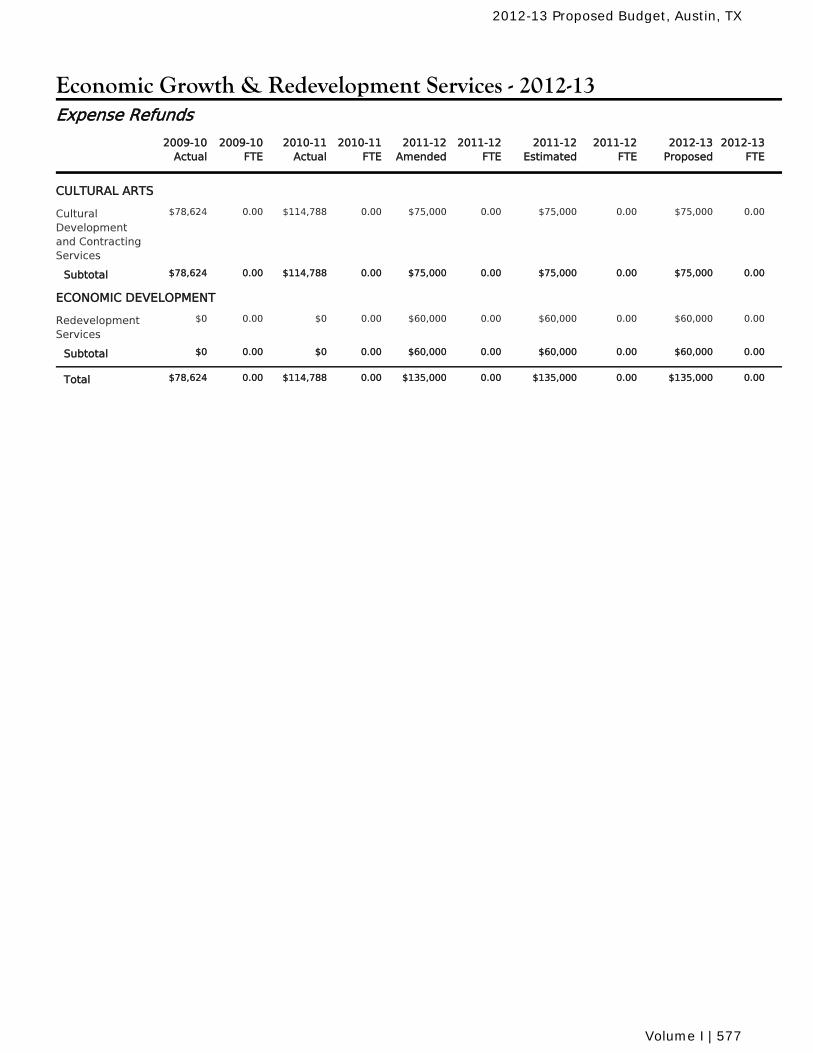
Economic Growth & Redevelopment Services - 2012-13
2010-11Actual
2010-11FTE
2011-12Amended
2011-12FTE
2011-12Estimated
2011-12FTE
2009-10Actual
2009-10FTE
2012-13Proposed
2012-13FTE
Expense Refunds
CULTURAL ARTS
$114,788 0.00 $75,000 0.00 $75,000 0.00CulturalDevelopmentand ContractingServices
0.00 $75,000 0.00$78,624
$114,788 0.00 $75,000 0.00 $75,000 0.00Subtotal 0.00 $75,000 0.00$78,624
ECONOMIC DEVELOPMENT
$0 0.00 $60,000 0.00 $60,000 0.00RedevelopmentServices
0.00 $60,000 0.00$0
$0 0.00 $60,000 0.00 $60,000 0.00Subtotal 0.00 $60,000 0.00$0
$114,788 0.00 $135,000 0.00 $135,000 0.00Total 0.00 $135,000 0.00$78,624
2012-13 Proposed Budget, Austin, TX
Volume I | 577
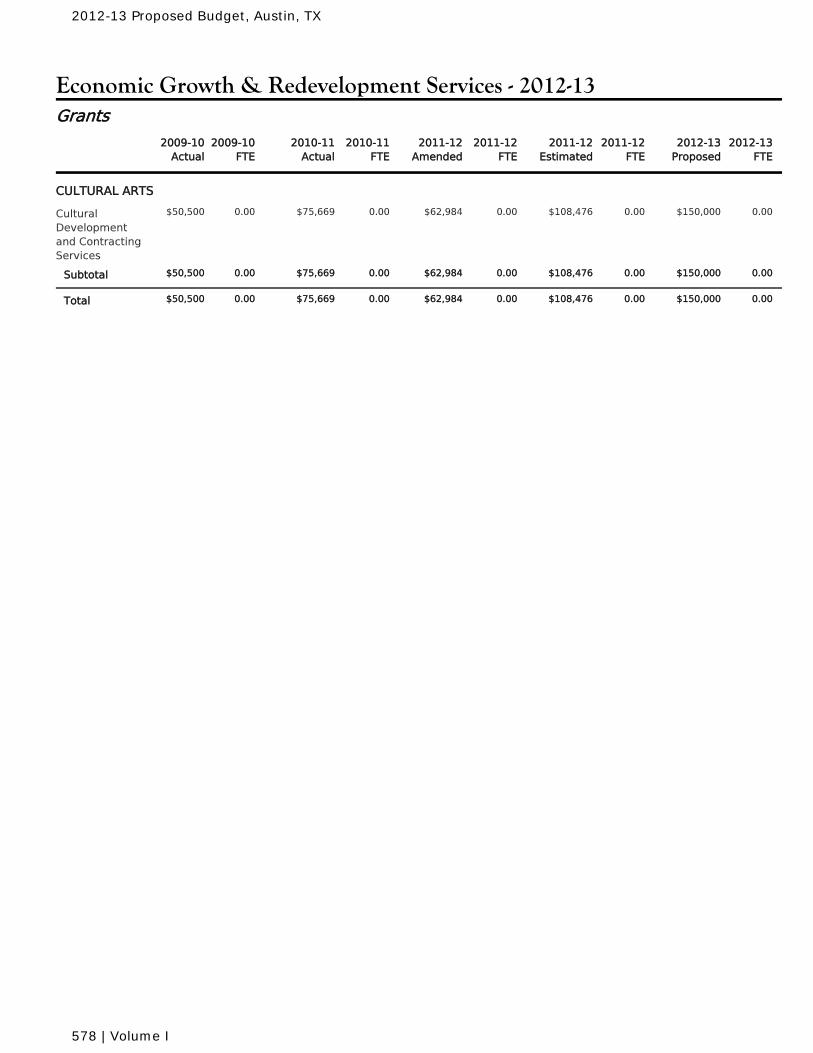
Economic Growth & Redevelopment Services - 2012-13
2010-11Actual
2010-11FTE
2011-12Amended
2011-12FTE
2011-12Estimated
2011-12FTE
2009-10Actual
2009-10FTE
2012-13Proposed
2012-13FTE
Grants
CULTURAL ARTS
$75,669 0.00 $62,984 0.00 $108,476 0.00CulturalDevelopmentand ContractingServices
0.00 $150,000 0.00$50,500
$75,669 0.00 $62,984 0.00 $108,476 0.00Subtotal 0.00 $150,000 0.00$50,500
$75,669 0.00 $62,984 0.00 $108,476 0.00Total 0.00 $150,000 0.00$50,500
2012-13 Proposed Budget, Austin, TX
578 | Volume I

City of Austin
2012-2013 Proposed
Budget
Volume I Financial Summaries

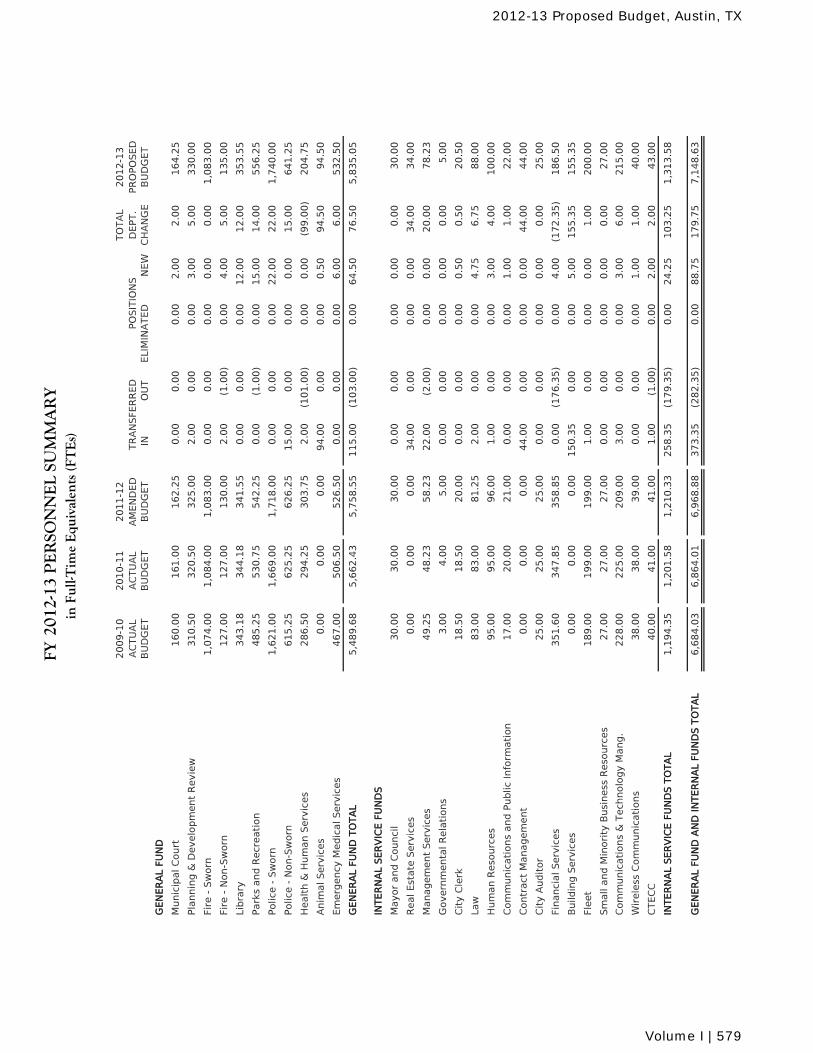
FY
2
012-
13 P
ER
SON
NE
L SU
MM
AR
Yin
Ful
l-Tim
e E
quiv
alen
ts (F
TE
s)
2009-1
02010-1
12011-1
2TO
TA
L2012-1
3A
CTU
AL
AC
TU
AL
AM
EN
DED
DEPT.
PR
OPO
SED
BU
DG
ET
BU
DG
ET
BU
DG
ET
INO
UT
NEW
CH
AN
GE
BU
DG
ET
GEN
ER
AL
FU
ND
Munic
ipal C
ourt
160.0
0161.0
0162.2
50.0
00.0
00.0
02.0
02.0
0164.2
5
Pla
nnin
g &
Develo
pm
ent
Revie
w
310.5
0320.5
0325.0
02.0
00.0
00.0
03.0
05.0
0330.0
0
Fir
e -
Sw
orn
1,0
74.0
01,0
84.0
01,0
83.0
00.0
00.0
00.0
00.0
00.0
01,0
83.0
0
Fir
e -
Non-S
worn
127.0
0127.0
0130.0
02.0
0(1
.00)
0.0
04.0
05.0
0135.0
0
Libra
ry343.1
8344.1
8341.5
50.0
00.0
00.0
012.0
012.0
0353.5
5
Park
s and R
ecr
eati
on
485.2
5530.7
5542.2
50.0
0(1
.00)
0.0
015.0
014.0
0556.2
5
Polic
e -
Sw
orn
1,6
21.0
01,6
69.0
01,7
18.0
00.0
00.0
00.0
022.0
022.0
01,7
40.0
0
Polic
e -
Non-S
worn
615.2
5625.2
5626.2
515.0
00.0
00.0
00.0
015.0
0641.2
5
Healt
h &
Hum
an S
erv
ices
286.5
0294.2
5303.7
52.0
0(1
01.0
0)
0.0
00.0
0(9
9.0
0)
204.7
5
Anim
al Serv
ices
0.0
00.0
00.0
094.0
00.0
00.0
00.5
094.5
094.5
0
Em
erg
ency
Medic
al Serv
ices
467.0
0506.5
0526.5
00.0
00.0
00.0
06.0
06.0
0532.5
0
GEN
ER
AL
FU
ND
TO
TA
L5,4
89.6
85,6
62.4
35,7
58.5
5115.0
0(1
03.0
0)
0.0
064.5
076.5
05,8
35.0
5
INTER
NA
L SER
VIC
E F
UN
DS
Mayor
and C
ounci
l30.0
030.0
030.0
00.0
00.0
00.0
00.0
00.0
030.0
0
Real Est
ate
Serv
ices
0.0
00.0
00.0
034.0
00.0
00.0
00.0
034.0
034.0
0
Managem
ent
Serv
ices
49.2
548.2
358.2
322.0
0(2
.00)
0.0
00.0
020.0
078.2
3
Govern
menta
l R
ela
tions
3.0
04.0
05.0
00.0
00.0
00.0
00.0
00.0
05.0
0
Cit
y C
lerk
18.5
018.5
020.0
00.0
00.0
00.0
00.5
00.5
020.5
0
Law
83.0
083.0
081.2
52.0
00.0
00.0
04.7
56.7
588.0
0
Hum
an R
eso
urc
es
95.0
095.0
096.0
01.0
00.0
00.0
03.0
04.0
0100.0
0
Com
munic
ati
ons
and P
ublic
Info
rmati
on
17.0
020.0
021.0
00.0
00.0
00.0
01.0
01.0
022.0
0
Contr
act
Managem
ent
0.0
00.0
00.0
044.0
00.0
00.0
00.0
044.0
044.0
0
Cit
y A
udit
or
25.0
025.0
025.0
00.0
00.0
00.0
00.0
00.0
025.0
0
Fin
anci
al Serv
ices
351.6
0347.8
5358.8
50.0
0(1
76.3
5)
0.0
04.0
0(1
72.3
5)
186.5
0
Build
ing S
erv
ices
0.0
00.0
00.0
0150.3
50.0
00.0
05.0
0155.3
5155.3
5
Fle
et
189.0
0199.0
0199.0
01.0
00.0
00.0
00.0
01.0
0200.0
0
Sm
all
and M
inori
ty B
usi
ness
Reso
urc
es
27.0
027.0
027.0
00.0
00.0
00.0
00.0
00.0
027.0
0
Com
munic
ati
ons
& T
ech
nolo
gy M
ang.
228.0
0225.0
0209.0
03.0
00.0
00.0
03.0
06.0
0215.0
0
Wir
ele
ss C
om
munic
ati
ons
38.0
038.0
039.0
00.0
00.0
00.0
01.0
01.0
040.0
0
CTEC
C40.0
041.0
041.0
01.0
0(1
.00)
0.0
02.0
02.0
043.0
0
INTER
NA
L SER
VIC
E F
UN
DS T
OTA
L1,1
94.3
51,2
01.5
81,2
10.3
3258.3
5(1
79.3
5)
0.0
024.2
5103.2
51,3
13.5
8
GEN
ER
AL
FU
ND
AN
D IN
TER
NA
L FU
ND
S T
OTA
L6,6
84.0
36,8
64.0
16,9
68.8
8373.3
5(2
82.3
5)
0.0
088.7
5179.7
57,1
48.6
3
ELI
MIN
ATED
TR
AN
SFER
RED
P
OSIT
ION
S
2012-13 Proposed Budget, Austin, TX
Volume I | 579
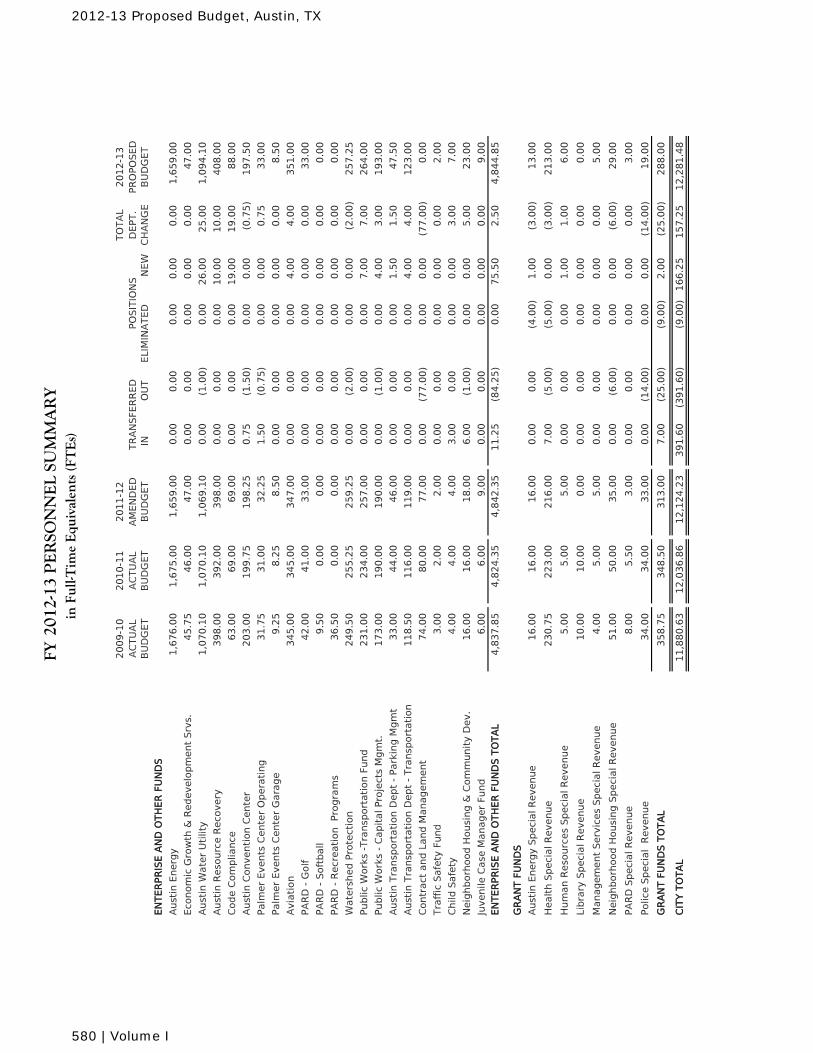
FY
2
012-
13 P
ER
SON
NE
L SU
MM
AR
Yin
Ful
l-Tim
e E
quiv
alen
ts (F
TE
s)
2009-1
02010-1
12011-1
2TO
TA
L2012-1
3A
CTU
AL
AC
TU
AL
AM
EN
DED
DEPT.
PR
OPO
SED
BU
DG
ET
BU
DG
ET
BU
DG
ET
INO
UT
NEW
CH
AN
GE
BU
DG
ET
ELI
MIN
ATED
TR
AN
SFER
RED
P
OSIT
ION
S
EN
TER
PR
ISE A
ND
OTH
ER
FU
ND
S
Aust
in E
nerg
y1,6
76.0
01,6
75.0
01,6
59.0
00.0
00.0
00.0
00.0
00.0
01,6
59.0
0
Eco
nom
ic G
row
th &
Redevelo
pm
ent
Srv
s.45.7
546.0
047.0
00.0
00.0
00.0
00.0
00.0
047.0
0
Aust
in W
ate
r U
tilit
y1,0
70.1
01,0
70.1
01,0
69.1
00.0
0(1
.00)
0.0
026.0
025.0
01,0
94.1
0
Aust
in R
eso
urc
e R
eco
very
398.0
0392.0
0398.0
00.0
00.0
00.0
010.0
010.0
0408.0
0
Code C
om
plia
nce
63.0
069.0
069.0
00.0
00.0
00.0
019.0
019.0
088.0
0
Aust
in C
onventi
on C
ente
r203.0
0199.7
5198.2
50.7
5(1
.50)
0.0
00.0
0(0
.75)
197.5
0
Palm
er
Events
Cente
r O
pera
ting
31.7
531.0
032.2
51.5
0(0
.75)
0.0
00.0
00.7
533.0
0
Palm
er
Events
Cente
r G
ara
ge
9.2
58.2
58.5
00.0
00.0
00.0
00.0
00.0
08.5
0
Avia
tion
345.0
0345.0
0347.0
00.0
00.0
00.0
04.0
04.0
0351.0
0
PA
RD
- G
olf
42.0
041.0
033.0
00.0
00.0
00.0
00.0
00.0
033.0
0
PA
RD
- S
oft
ball
9.5
00.0
00.0
00.0
00.0
00.0
00.0
00.0
00.0
0
PA
RD
- R
ecr
eati
on Pro
gra
ms
36.5
00.0
00.0
00.0
00.0
00.0
00.0
00.0
00.0
0
Wate
rshed P
rote
ctio
n249.5
0255.2
5259.2
50.0
0(2
.00)
0.0
00.0
0(2
.00)
257.2
5
Public
Work
s -T
ransp
ort
ati
on F
und
231.0
0234.0
0257.0
00.0
00.0
00.0
07.0
07.0
0264.0
0
Public
Work
s -
Capit
al Pro
ject
s M
gm
t.173.0
0190.0
0190.0
00.0
0(1
.00)
0.0
04.0
03.0
0193.0
0
Aust
in T
ransp
ort
ati
on D
ept
- Park
ing M
gm
t33.0
044.0
046.0
00.0
00.0
00.0
01.5
01.5
047.5
0
Aust
in T
ransp
ort
ati
on D
ept
- Tra
nsp
ort
ati
on
118.5
0116.0
0119.0
00.0
00.0
00.0
04.0
04.0
0123.0
0
Contr
act
and L
and M
anagem
ent
74.0
080.0
077.0
00.0
0(7
7.0
0)
0.0
00.0
0(7
7.0
0)
0.0
0
Tra
ffic
Safe
ty F
und
3.0
02.0
02.0
00.0
00.0
00.0
00.0
00.0
02.0
0
Child
Safe
ty4.0
04.0
04.0
03.0
00.0
00.0
00.0
03.0
07.0
0
Neig
hborh
ood H
ousi
ng &
Com
munit
y D
ev.
16.0
016.0
018.0
06.0
0(1
.00)
0.0
00.0
05.0
023.0
0
Juvenile
Case
Manager
Fund
6.0
06.0
09.0
00.0
00.0
00.0
00.0
00.0
09.0
0EN
TER
PR
ISE A
ND
OTH
ER
FU
ND
S T
OTA
L4,8
37.8
54,8
24.3
54,8
42.3
511.2
5(8
4.2
5)
0.0
075.5
02.5
04,8
44.8
5
GR
AN
T F
UN
DS
Aust
in E
nerg
y S
peci
al R
evenue
16.0
016.0
016.0
00.0
00.0
0(4
.00)
1.0
0(3
.00)
13.0
0
Healt
h S
peci
al R
evenue
230.7
5223.0
0216.0
07.0
0(5
.00)
(5.0
0)
0.0
0(3
.00)
213.0
0
Hum
an R
eso
urc
es
Speci
al R
evenue
5.0
05.0
05.0
00.0
00.0
00.0
01.0
01.0
06.0
0
Libra
ry S
peci
al R
evenue
10.0
010.0
00.0
00.0
00.0
00.0
00.0
00.0
00.0
0
Managem
ent
Serv
ices
Speci
al R
evenue
4.0
05.0
05.0
00.0
00.0
00.0
00.0
00.0
05.0
0
Neig
hborh
ood H
ousi
ng S
peci
al R
evenue
51.0
050.0
035.0
00.0
0(6
.00)
0.0
00.0
0(6
.00)
29.0
0
PA
RD
Speci
al R
evenue
8.0
05.5
03.0
00.0
00.0
00.0
00.0
00.0
03.0
0
Polic
e S
peci
al R
evenue
34.0
034.0
033.0
00.0
0(1
4.0
0)
0.0
00.0
0(1
4.0
0)
19.0
0
GR
AN
T F
UN
DS T
OTA
L358.7
5348.5
0313.0
07.0
0(2
5.0
0)
(9.0
0)
2.0
0(2
5.0
0)
288.0
0
CIT
Y T
OTA
L11,8
80.6
312,0
36.8
612,1
24.2
3391.6
0(3
91.6
0)
(9.0
0)
166.2
5157.2
512,2
81.4
8
2012-13 Proposed Budget, Austin, TX
580 | Volume I
Funds Subject to Appropriation
The City of Austin has set up a series of funds to keep track of what it spends for separate activities. A fund is a fiscal and accounting entity that records cash, revenue, expenditures and balances relating to specific activities. The City of Austin uses funds that can be divided into the following categories: General, Enterprise, Internal Service, Special Revenue, Debt Retirement and Capital Projects. Below is a list of the funds that are budgeted for the upcoming fiscal year.
General Fund and General Fund Reserves The General Fund is the general operating fund for the City of Austin. This fund accounts for revenue and expenditures for general government services. The General Fund is supported by taxes, fees, fines, permits, licenses, charges for services and interest income. The General Fund also includes transfers from other funds including Austin Water Utility and Austin Energy. Reserve funds are maintained according to the City’s financial policies to keep a healthy fiscal climate.
Enterprise Funds and Enterprise Reserves Enterprise funds account for the acquisition, operations and maintenance of the City's facilities and services that are entirely or predominantly supported by user charges. They may also be funds for which the City has decided that the revenue earned, expenses incurred, and/or net income is appropriate for capital maintenance, public policy, management control, accountability or other purposes. All activities necessary to provide services are accounted for in these funds including, but not limited to, administration, operations and maintenance. The two largest enterprise funds are the Austin Energy and Austin Water Utility Funds. Austin Energy Fund The Austin Energy Fund is the operating fund for the electric utility. The primary source of revenue is the sale of electricity to customers. Revenue supports operations and maintenance of the electrical distribution system. Austin Water Utility Fund The Austin Water Utility Fund is the operating fund for the water and wastewater utility. The primary revenue source is from water and wastewater sales. The revenue supports treatment, collection and distribution of water, wastewater, and reclaimed water. Other enterprise funds are as follows: Airport Fund – The operating and maintenance fund for the Austin-Bergstrom International Airport. Revenue
sources include airline fees and non-airline revenue such as parking and concession fees. Austin Resource Recovery Fund – Accounts for activities of the Austin Resource Recovery department,
including garbage, recycling and hazardous waste collection and zero waste initiatives; Code Compliance Fund – Used to account for expenditures of the City’s code compliance efforts, including
property abatement, zoning, and dangerous housing and buildings code compliance; Convention Center Funds – Account for convention center and public events activities; Drainage Utility Fund – Accounts for drainage and watershed protection activities; Golf and Golf Surcharge Funds – Account for golf activities; Parking Management Fund – Accounts for parking and transportation permitting activities; and, Transportation Fund – Accounts for transportation, streets, and traffic management activities. The enterprise reserve funds are as follows: Airport Capital Fund – Accounts for funds used for the Airport Capital Improvements Program (CIP); Austin Energy Repair and Replacement Fund – Accounts for extensions, additions and improvements to the
electric system; Austin Energy Strategic Reserve Fund – Provides emergency funding for unforeseen events in Austin Energy; Austin Water Revenue Stability Reserve Fund – Provides emergency funding in case of revenue shortfalls; Convention Center Marketing and Promotion Fund – Accounts for promotion of concession and catering
products and services at the Convention Center; and, Convention Center Repair and Replacement Fund – Funds the acquisition, replacement, maintenance and
repair of catering and concession equipment and furnishings within the Convention Center.
Internal Service Funds Internal service funds are used to account for the financing of goods or services provided by one department to other City departments and other agencies on a cost-reimbursement basis. The internal service funds are:
2012-13 Proposed Budget, Austin, TX
Volume I | 581
Funds Subject to Appropriation
Capital Projects Management Fund – Includes project management of the City’s capital projects; Combined Transportation, Emergency, and Communication Center – Accounts for the operation of shared
emergency communications and transportation management for the region; Communications and Technology Management Fund – Includes information technology efforts of the City; Employee Benefits Fund – Includes the health, dental and life insurance costs of City employees and retirees; Fleet Services Fund – Includes vehicle and equipment services; Liability Reserve Fund – Provides coverage of the City’s major claims liabilities; Support Services Fund – Includes the activities of the various support service departments; Vehicle Acquisition Fund – Used to purchase replacement vehicles for general government departments; Wireless Communication Services Fund – Includes communication support activities; and, Workers’ Compensation Fund – Accounts for workers’ compensation costs.
Special Revenue Funds Special revenue funds are used to account for the proceeds of specific revenue sources (other than major capital projects) that are legally restricted to expenditures for specific purposes. Included in the special revenue funds are Federal, State, and other grant funds. Also included are the following funds. General Government Municipal Court Building Security Fund – Provides funding to enhance courthouse security; Municipal Court Juvenile Case Manager Fund – Accounts for the collection of fees associated with fine-only
misdemeanor charges and provides funding for the administration of juvenile dockets; and Municipal Court Technology Fund – Provides funding for technological enhancements to Court operations. Public Safety Police Asset Forfeiture Funds – Account for the collection of contraband awarded to the agency by the courts.
Funds may only be used to increase law enforcement resources; and, Municipal Court Traffic Safety Fund – Collects fees associated with red light camera program penalties. Transportation, Planning, and Sustainability Child Safety Fund – Accounts for certain fines and fees used to provide school crossing guards at city
schools; and, Environmental Remediation Fund – Accounts for the remediation of sites, which affect ground and surface
water quality or public health and safety. Recreation and Culture Cultural Arts Fund – Records activities for cultural project purposes; funded by a portion of the hotel
occupancy tax. Urban Growth Management Austin Energy Performance Contracting Fund – Accounts for conservation measures that reduce energy
consumption; Economic Incentives Reserve Fund – Provides incentive grants and other economic incentive agreements
established on the grounds that they provide higher levels of employment, economic activity and stability; Neighborhood Housing and Community Development Fund – Accounts for economic development, affordable
housing and neighborhood revitalization efforts; Neighborhood Housing - Housing Trust Fund – Accounts for preserving and creating reasonably priced
housing in the city of Austin; and, Neighborhood Housing - University Neighborhood Overlay (UNO) Fund – Created to provide rental housing
development assistance within the University Neighborhood Overlay. Other Austin Cable Access Fund – Collects payments by cable companies and disburses funds to Access Television; Business Retention & Enhancement Fund – Accounts for funds to retain and enhance downtown businesses; City Hall Fund – Used for funding and expenditures associated with the City Hall Parking Garage; Hotel/Motel Occupancy Tax Fund – Accounts for hotel/motel occupancy tax revenue and transfers the
revenue to participating funds;
2012-13 Proposed Budget, Austin, TX
582 | Volume I
Funds Subject to Appropriation
IH-35 Parking Program Fund – Accounts for revenue, operations, and maintenance requirements for two parking lots located under the IH-35 overpass between East 6th and 8th Streets;
Mueller Tax Incrementing Financing Fund – Accounts for property tax revenue collected in the Mueller Tax Increment Financing reinvestment Zone No. 16;
Music Venue Assistance Program – Provides low-interest loans to qualifying music venues to assist with implementing sound mitigation technologies and reduce the number of sound-related complaints;
One Texas Center Fund – Accounts for revenue and debt service of the One Texas Center Building; Palmer Events Center Town Lake Park Venue Project Fund – Accounts for the levy of a short-term motor
vehicle rental tax; Rutherford Lane Facility Fund – Accounts for revenue, expenditures and debt service requirements of the
Rutherford Lane facilities; Section 108 Family Business Loan Program – In partnership with the U.S. Department of Housing and Urban
Development, supports and stimulates business development by providing low-interest loans to qualified Austin small business owners;
Sustainability Fund – Provides resources that help the City of Austin build a more sustainable economy, environment, and equitable infrastructure;
Tourism and Promotion Fund – Accounts for the promotion of tourism in Austin as both a leisure and business destination. Funded by a portion of bed tax receipts;
Waller Creek Tunnel Reserve Fund – Provides reserve funding for the Waller Creek tunnel project; Waller Creek Tunnel Tax Increment Financing Fund – Accounts for property tax revenue that is collected in
the Waller Creek Tax Increment Financing Reinvestment Zone No. 17; and, Wildland Conservation Fund – Accounts for the City and County’s management of preserve systems.
Debt Retirement Debt retirement funds are used to account for the accumulation of resources for, and the payment of, general long-term debt. General Obligation Debt Service Fund – Used for payments of principal, interest and related costs of general
obligation or tax-supported debt; Airport Revenue Bond Redemption Fund – Used to pay debt for airport construction; Airport Variable Rate Bond Debt Service Fund – Used to pay debt for the airport rental car area; Combined Utility Revenue Bond Redemption Fund – Used to pay debt for utility bonds; Hotel Occupancy Tax Revenue Bond Redemption Fund – Used to pay debt for the Convention Center and
Waller Creek expansion with funds from Venue Project Fund; HUD Section 108 Debt Service Fund – Used to account for HUD loans for construction costs; and, Town Lake Park Venue Project Bond Redemption Fund – Used to pay for debt associated with the Palmer
Events Center Town Lake Park Venue Project.
Capital Projects Funds Capital projects funds are used to account for financial resources to be used for the acquisition or construction of major capital facilities other than those financed by proprietary funds and trust funds. Below are the groups of funds that account for the activities related to the capital improvement projects:
1984: Funds authorized September 8, 1984, for various purposes; 1985: Funds authorized January 19, 1985, for cultural arts; Authorized July 26 for parks and recreation;
Authorized September 26 for art in public places; and Authorized December 14 for various purposes; 1992: Funds authorized August 10, 1992, for various purposes; 1997: Funds authorized on May 3, 1997, for radio trunking; 1998: Funds authorized November 3, 1998, for various purposes; 2000: Funds authorized November 7, 2000, for street improvements and land acquisition; 2006: Funds authorized November 7, 2006, for various purposes; 2010: Funds authorized November 2, 2010, for mobility projects, including roadway, signals, intersections
and pedestrian/ADA improvements; and, Other: Funds established for various purposes that use funding sources other than authorized bonds.
2012-13 Proposed Budget, Austin, TX
Volume I | 583
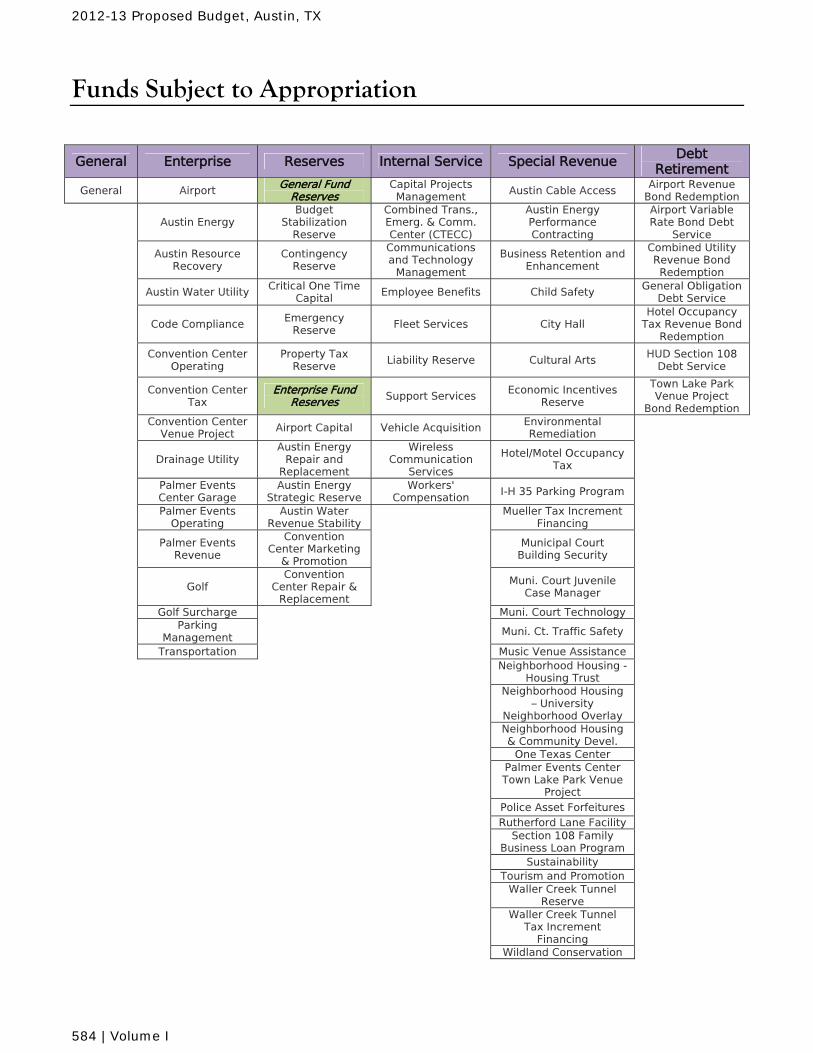
Funds Subject to Appropriation
General Enterprise Reserves Internal Service Special Revenue Debt Retirement
General Airport General Fund
Reserves Capital Projects Management
Austin Cable Access Airport Revenue
Bond Redemption
Austin Energy Budget
Stabilization Reserve
Combined Trans., Emerg. & Comm. Center (CTECC)
Austin Energy Performance Contracting
Airport Variable Rate Bond Debt
Service
Austin Resource Recovery
Contingency Reserve
Communications and Technology
Management
Business Retention and Enhancement
Combined Utility Revenue Bond Redemption
Austin Water Utility Critical One Time Capital
Employee Benefits Child Safety General Obligation Debt Service
Code Compliance Emergency Reserve
Fleet Services City Hall Hotel Occupancy
Tax Revenue Bond Redemption
Convention Center
Operating Property Tax
Reserve Liability Reserve Cultural Arts
HUD Section 108 Debt Service
Convention Center
Tax Enterprise Fund
Reserves Support Services Economic Incentives
Reserve
Town Lake Park Venue Project
Bond Redemption
Convention Center Venue Project
Airport Capital Vehicle Acquisition Environmental Remediation
Drainage Utility Austin Energy
Repair and Replacement
Wireless Communication
Services
Hotel/Motel Occupancy Tax
Palmer Events Center Garage
Austin Energy Strategic Reserve
Workers' Compensation I-H 35 Parking Program
Palmer Events
Operating Austin Water
Revenue Stability Mueller Tax Increment
Financing
Palmer Events
Revenue
Convention Center Marketing
& Promotion Municipal Court
Building Security
Golf
Convention Center Repair &
Replacement Muni. Court Juvenile
Case Manager
Golf Surcharge Muni. Court Technology
Parking
Management
Muni. Ct. Traffic Safety
Transportation Music Venue Assistance
Neighborhood Housing -
Housing Trust
Neighborhood Housing – University
Neighborhood Overlay
Neighborhood Housing & Community Devel.
One Texas Center
Palmer Events Center Town Lake Park Venue
Project
Police Asset Forfeitures Rutherford Lane Facility
Section 108 Family
Business Loan Program Sustainability Tourism and Promotion
Waller Creek Tunnel
Reserve
Waller Creek Tunnel Tax Increment
Financing
Wildland Conservation
2012-13 Proposed Budget, Austin, TX
584 | Volume I
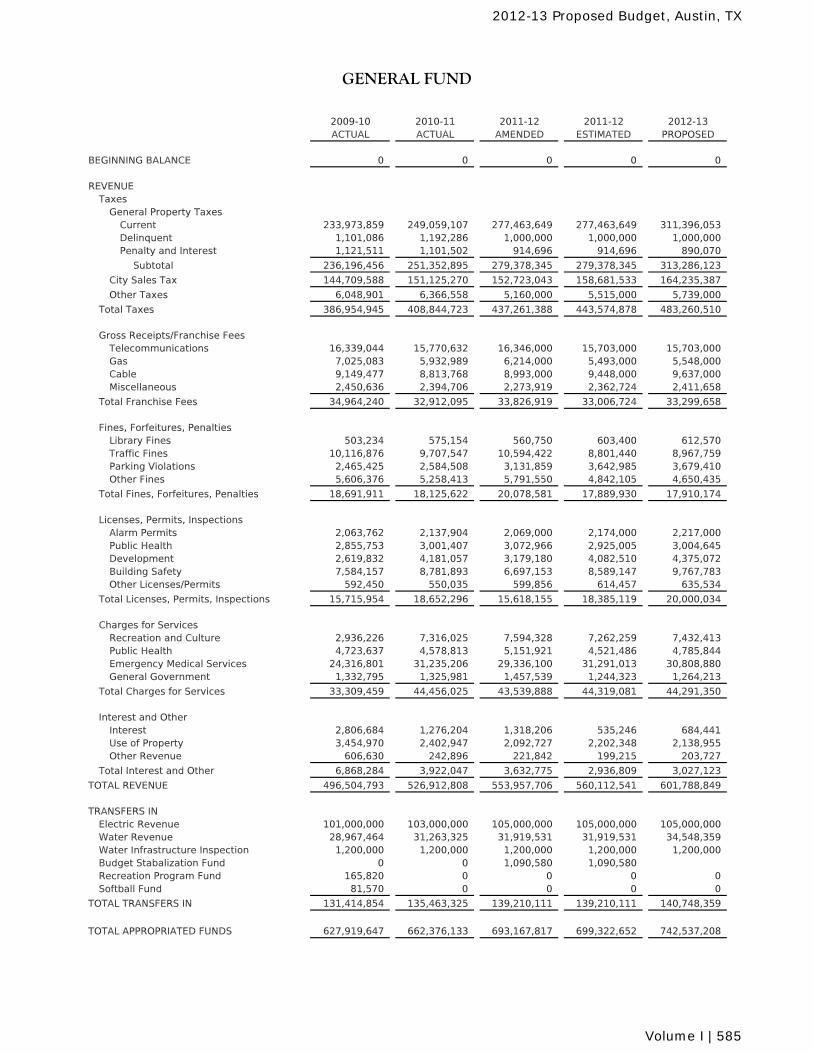
2009-10 2010-11 2011-12 2011-12 2012-13ACTUAL ACTUAL AMENDED ESTIMATED PROPOSED
BEGINNING BALANCE 0 0 0 0 0
REVENUETaxes
General Property TaxesCurrent 233,973,859 249,059,107 277,463,649 277,463,649 311,396,053Delinquent 1,101,086 1,192,286 1,000,000 1,000,000 1,000,000Penalty and Interest 1,121,511 1,101,502 914,696 914,696 890,070
Subtotal 236,196,456 251,352,895 279,378,345 279,378,345 313,286,123
City Sales Tax 144,709,588 151,125,270 152,723,043 158,681,533 164,235,387
Other Taxes 6,048,901 6,366,558 5,160,000 5,515,000 5,739,000
Total Taxes 386,954,945 408,844,723 437,261,388 443,574,878 483,260,510
Gross Receipts/Franchise FeesTelecommunications 16,339,044 15,770,632 16,346,000 15,703,000 15,703,000Gas 7,025,083 5,932,989 6,214,000 5,493,000 5,548,000Cable 9,149,477 8,813,768 8,993,000 9,448,000 9,637,000Miscellaneous 2,450,636 2,394,706 2,273,919 2,362,724 2,411,658
Total Franchise Fees 34,964,240 32,912,095 33,826,919 33,006,724 33,299,658
Fines, Forfeitures, PenaltiesLibrary Fines 503,234 575,154 560,750 603,400 612,570Traffic Fines 10,116,876 9,707,547 10,594,422 8,801,440 8,967,759Parking Violations 2,465,425 2,584,508 3,131,859 3,642,985 3,679,410Other Fines 5,606,376 5,258,413 5,791,550 4,842,105 4,650,435
Total Fines, Forfeitures, Penalties 18,691,911 18,125,622 20,078,581 17,889,930 17,910,174
Licenses, Permits, InspectionsAlarm Permits 2,063,762 2,137,904 2,069,000 2,174,000 2,217,000Public Health 2,855,753 3,001,407 3,072,966 2,925,005 3,004,645Development 2,619,832 4,181,057 3,179,180 4,082,510 4,375,072Building Safety 7,584,157 8,781,893 6,697,153 8,589,147 9,767,783Other Licenses/Permits 592,450 550,035 599,856 614,457 635,534
Total Licenses, Permits, Inspections 15,715,954 18,652,296 15,618,155 18,385,119 20,000,034
Charges for ServicesRecreation and Culture 2,936,226 7,316,025 7,594,328 7,262,259 7,432,413Public Health 4,723,637 4,578,813 5,151,921 4,521,486 4,785,844Emergency Medical Services 24,316,801 31,235,206 29,336,100 31,291,013 30,808,880General Government 1,332,795 1,325,981 1,457,539 1,244,323 1,264,213
Total Charges for Services 33,309,459 44,456,025 43,539,888 44,319,081 44,291,350
Interest and OtherInterest 2,806,684 1,276,204 1,318,206 535,246 684,441Use of Property 3,454,970 2,402,947 2,092,727 2,202,348 2,138,955Other Revenue 606,630 242,896 221,842 199,215 203,727
Total Interest and Other 6,868,284 3,922,047 3,632,775 2,936,809 3,027,123
TOTAL REVENUE 496,504,793 526,912,808 553,957,706 560,112,541 601,788,849
TRANSFERS INElectric Revenue 101,000,000 103,000,000 105,000,000 105,000,000 105,000,000Water Revenue 28,967,464 31,263,325 31,919,531 31,919,531 34,548,359Water Infrastructure Inspection 1,200,000 1,200,000 1,200,000 1,200,000 1,200,000Budget Stabalization Fund 0 0 1,090,580 1,090,580Recreation Program Fund 165,820 0 0 0 0Softball Fund 81,570 0 0 0 0
TOTAL TRANSFERS IN 131,414,854 135,463,325 139,210,111 139,210,111 140,748,359
TOTAL APPROPRIATED FUNDS 627,919,647 662,376,133 693,167,817 699,322,652 742,537,208
GENERAL FUND
2012-13 Proposed Budget, Austin, TX
Volume I | 585
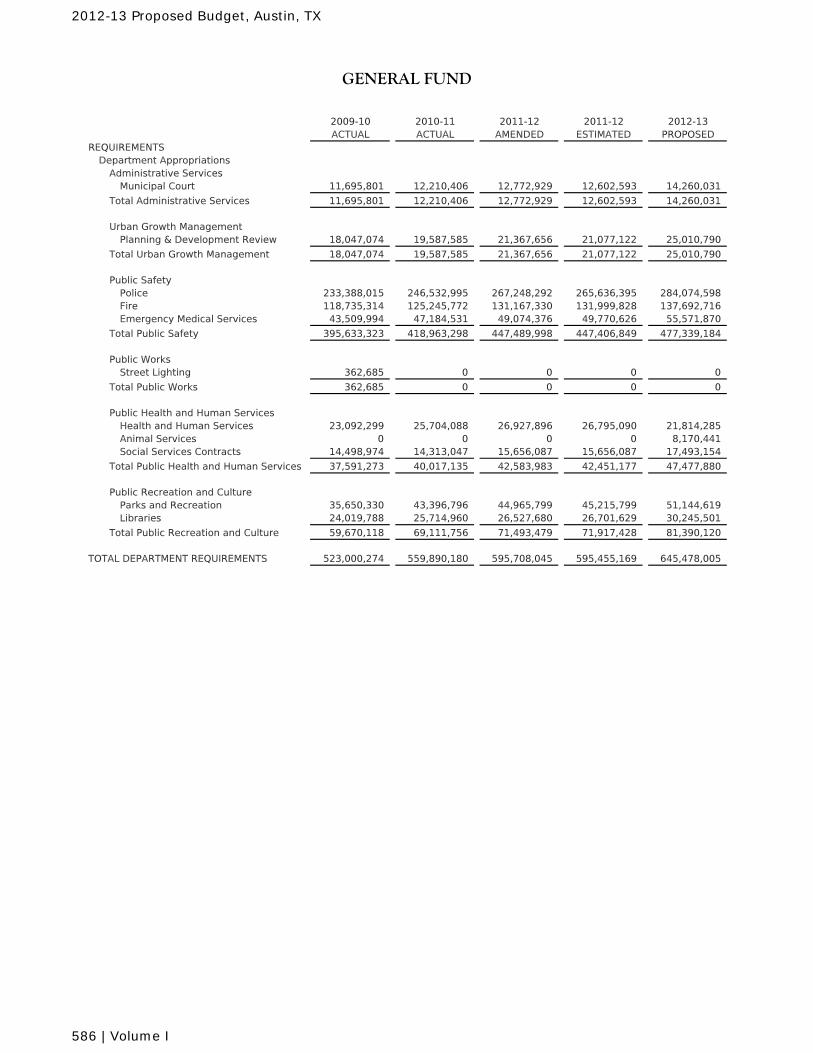
2009-10 2010-11 2011-12 2011-12 2012-13ACTUAL ACTUAL AMENDED ESTIMATED PROPOSED
GENERAL FUND
REQUIREMENTSDepartment Appropriations
Administrative ServicesMunicipal Court 11,695,801 12,210,406 12,772,929 12,602,593 14,260,031
Total Administrative Services 11,695,801 12,210,406 12,772,929 12,602,593 14,260,031
Urban Growth ManagementPlanning & Development Review 18,047,074 19,587,585 21,367,656 21,077,122 25,010,790
Total Urban Growth Management 18,047,074 19,587,585 21,367,656 21,077,122 25,010,790
Public SafetyPolice 233,388,015 246,532,995 267,248,292 265,636,395 284,074,598Fire 118,735,314 125,245,772 131,167,330 131,999,828 137,692,716Emergency Medical Services 43,509,994 47,184,531 49,074,376 49,770,626 55,571,870
Total Public Safety 395,633,323 418,963,298 447,489,998 447,406,849 477,339,184
Public WorksStreet Lighting 362,685 0 0 0 0
Total Public Works 362,685 0 0 0 0
Public Health and Human ServicesHealth and Human Services 23,092,299 25,704,088 26,927,896 26,795,090 21,814,285Animal Services 0 0 0 0 8,170,441Social Services Contracts 14,498,974 14,313,047 15,656,087 15,656,087 17,493,154
Total Public Health and Human Services 37,591,273 40,017,135 42,583,983 42,451,177 47,477,880
Public Recreation and CultureParks and Recreation 35,650,330 43,396,796 44,965,799 45,215,799 51,144,619Libraries 24,019,788 25,714,960 26,527,680 26,701,629 30,245,501
Total Public Recreation and Culture 59,670,118 69,111,756 71,493,479 71,917,428 81,390,120
TOTAL DEPARTMENT REQUIREMENTS 523,000,274 559,890,180 595,708,045 595,455,169 645,478,005
2012-13 Proposed Budget, Austin, TX
586 | Volume I
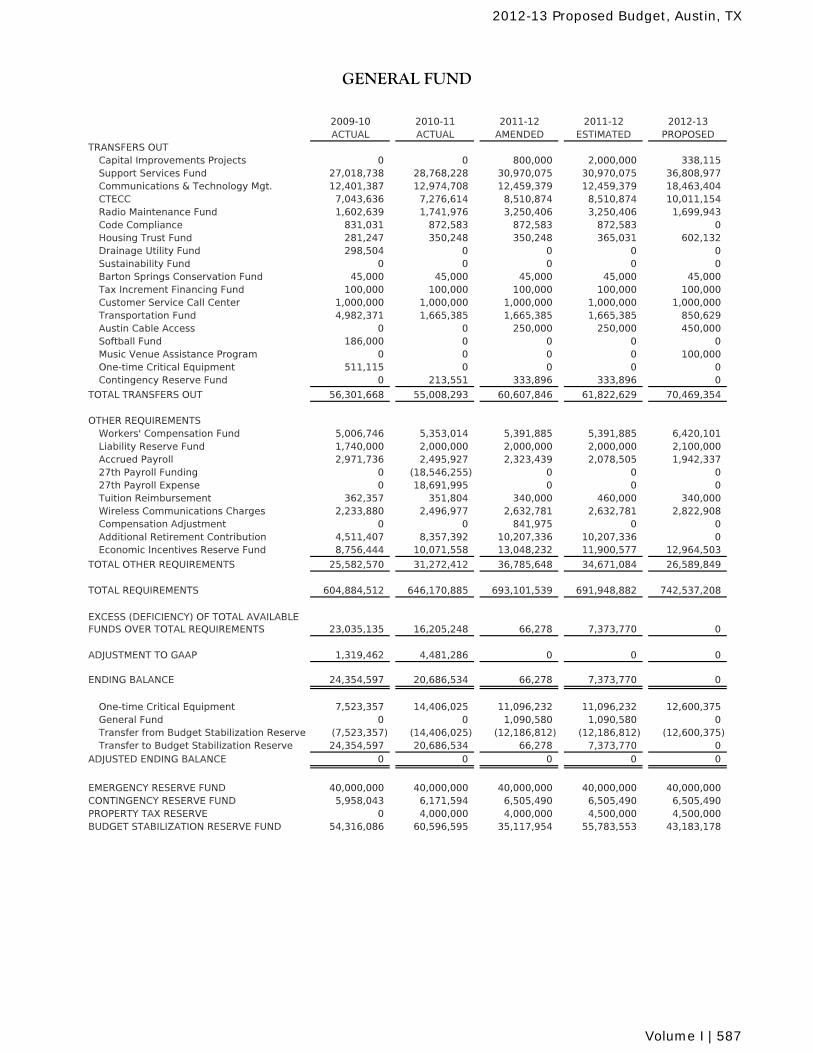
2009-10 2010-11 2011-12 2011-12 2012-13ACTUAL ACTUAL AMENDED ESTIMATED PROPOSED
GENERAL FUND
TRANSFERS OUTCapital Improvements Projects 0 0 800,000 2,000,000 338,115Support Services Fund 27,018,738 28,768,228 30,970,075 30,970,075 36,808,977Communications & Technology Mgt. 12,401,387 12,974,708 12,459,379 12,459,379 18,463,404CTECC 7,043,636 7,276,614 8,510,874 8,510,874 10,011,154Radio Maintenance Fund 1,602,639 1,741,976 3,250,406 3,250,406 1,699,943Code Compliance 831,031 872,583 872,583 872,583 0Housing Trust Fund 281,247 350,248 350,248 365,031 602,132Drainage Utility Fund 298,504 0 0 0 0Sustainability Fund 0 0 0 0 0Barton Springs Conservation Fund 45,000 45,000 45,000 45,000 45,000Tax Increment Financing Fund 100,000 100,000 100,000 100,000 100,000Customer Service Call Center 1,000,000 1,000,000 1,000,000 1,000,000 1,000,000Transportation Fund 4,982,371 1,665,385 1,665,385 1,665,385 850,629Austin Cable Access 0 0 250,000 250,000 450,000Softball Fund 186,000 0 0 0 0Music Venue Assistance Program 0 0 0 0 100,000One-time Critical Equipment 511,115 0 0 0 0Contingency Reserve Fund 0 213,551 333,896 333,896 0
TOTAL TRANSFERS OUT 56,301,668 55,008,293 60,607,846 61,822,629 70,469,354
OTHER REQUIREMENTSWorkers' Compensation Fund 5,006,746 5,353,014 5,391,885 5,391,885 6,420,101Liability Reserve Fund 1,740,000 2,000,000 2,000,000 2,000,000 2,100,000Accrued Payroll 2,971,736 2,495,927 2,323,439 2,078,505 1,942,33727th Payroll Funding 0 (18,546,255) 0 0 027th Payroll Expense 0 18,691,995 0 0 0Tuition Reimbursement 362,357 351,804 340,000 460,000 340,000Wireless Communications Charges 2,233,880 2,496,977 2,632,781 2,632,781 2,822,908Compensation Adjustment 0 0 841,975 0 0Additional Retirement Contribution 4,511,407 8,357,392 10,207,336 10,207,336 0Economic Incentives Reserve Fund 8,756,444 10,071,558 13,048,232 11,900,577 12,964,503
TOTAL OTHER REQUIREMENTS 25,582,570 31,272,412 36,785,648 34,671,084 26,589,849
TOTAL REQUIREMENTS 604,884,512 646,170,885 693,101,539 691,948,882 742,537,208
23,035,135 16,205,248 66,278 7,373,770 0
ADJUSTMENT TO GAAP 1,319,462 4,481,286 0 0 0
ENDING BALANCE 24,354,597 20,686,534 66,278 7,373,770 0
One-time Critical Equipment 7,523,357 14,406,025 11,096,232 11,096,232 12,600,375General Fund 0 0 1,090,580 1,090,580 0Transfer from Budget Stabilization Reserve (7,523,357) (14,406,025) (12,186,812) (12,186,812) (12,600,375)Transfer to Budget Stabilization Reserve 24,354,597 20,686,534 66,278 7,373,770 0
ADJUSTED ENDING BALANCE 0 0 0 0 0
EMERGENCY RESERVE FUND 40,000,000 40,000,000 40,000,000 40,000,000 40,000,000CONTINGENCY RESERVE FUND 5,958,043 6,171,594 6,505,490 6,505,490 6,505,490PROPERTY TAX RESERVE 0 4,000,000 4,000,000 4,500,000 4,500,000BUDGET STABILIZATION RESERVE FUND 54,316,086 60,596,595 35,117,954 55,783,553 43,183,178
EXCESS (DEFICIENCY) OF TOTAL AVAILABLE FUNDS OVER TOTAL REQUIREMENTS
2012-13 Proposed Budget, Austin, TX
Volume I | 587
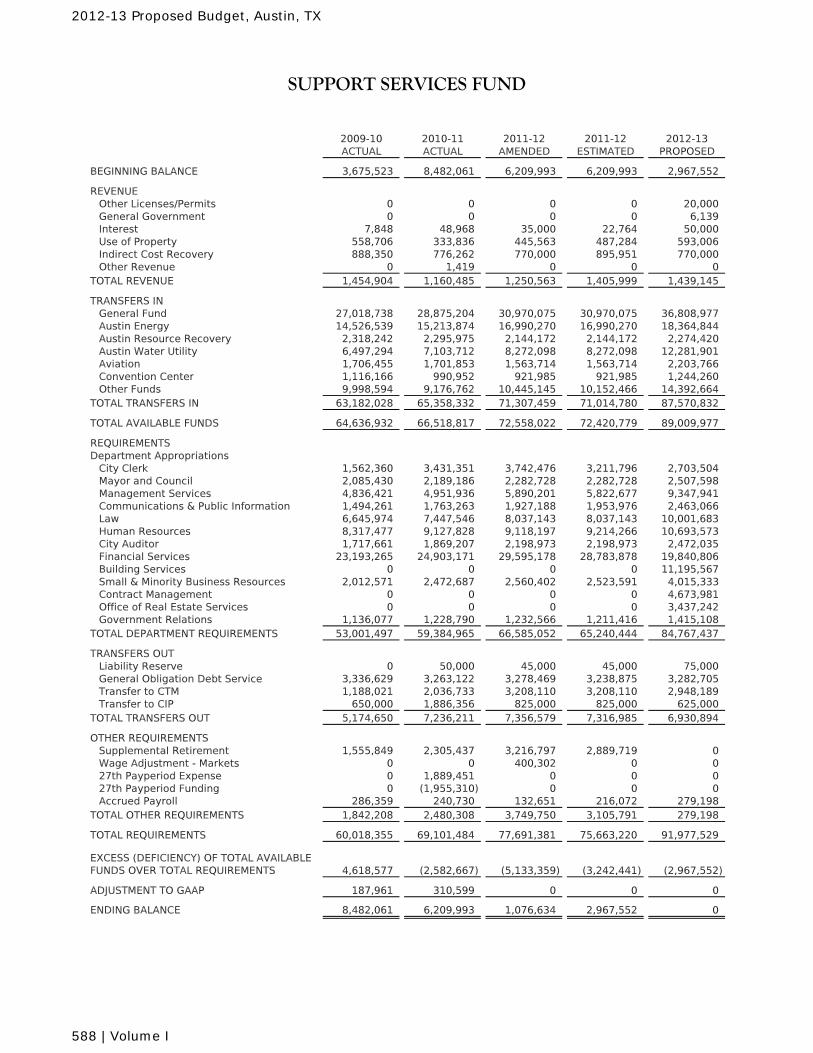
2009-10 2010-11 2011-12 2011-12 2012-13ACTUAL ACTUAL AMENDED ESTIMATED PROPOSED
BEGINNING BALANCE 3,675,523 8,482,061 6,209,993 6,209,993 2,967,552
REVENUEOther Licenses/Permits 0 0 0 0 20,000General Government 0 0 0 0 6,139Interest 7,848 48,968 35,000 22,764 50,000Use of Property 558,706 333,836 445,563 487,284 593,006Indirect Cost Recovery 888,350 776,262 770,000 895,951 770,000Other Revenue 0 1,419 0 0 0
TOTAL REVENUE 1,454,904 1,160,485 1,250,563 1,405,999 1,439,145
TRANSFERS INGeneral Fund 27,018,738 28,875,204 30,970,075 30,970,075 36,808,977Austin Energy 14,526,539 15,213,874 16,990,270 16,990,270 18,364,844Austin Resource Recovery 2,318,242 2,295,975 2,144,172 2,144,172 2,274,420Austin Water Utility 6,497,294 7,103,712 8,272,098 8,272,098 12,281,901Aviation 1,706,455 1,701,853 1,563,714 1,563,714 2,203,766Convention Center 1,116,166 990,952 921,985 921,985 1,244,260Other Funds 9,998,594 9,176,762 10,445,145 10,152,466 14,392,664
TOTAL TRANSFERS IN 63,182,028 65,358,332 71,307,459 71,014,780 87,570,832
TOTAL AVAILABLE FUNDS 64,636,932 66,518,817 72,558,022 72,420,779 89,009,977
REQUIREMENTSDepartment Appropriations
City Clerk 1,562,360 3,431,351 3,742,476 3,211,796 2,703,504Mayor and Council 2,085,430 2,189,186 2,282,728 2,282,728 2,507,598Management Services 4,836,421 4,951,936 5,890,201 5,822,677 9,347,941Communications & Public Information 1,494,261 1,763,263 1,927,188 1,953,976 2,463,066Law 6,645,974 7,447,546 8,037,143 8,037,143 10,001,683Human Resources 8,317,477 9,127,828 9,118,197 9,214,266 10,693,573City Auditor 1,717,661 1,869,207 2,198,973 2,198,973 2,472,035Financial Services 23,193,265 24,903,171 29,595,178 28,783,878 19,840,806Building Services 0 0 0 0 11,195,567Small & Minority Business Resources 2,012,571 2,472,687 2,560,402 2,523,591 4,015,333Contract Management 0 0 0 0 4,673,981Office of Real Estate Services 0 0 0 0 3,437,242Government Relations 1,136,077 1,228,790 1,232,566 1,211,416 1,415,108
TOTAL DEPARTMENT REQUIREMENTS 53,001,497 59,384,965 66,585,052 65,240,444 84,767,437
TRANSFERS OUTLiability Reserve 0 50,000 45,000 45,000 75,000General Obligation Debt Service 3,336,629 3,263,122 3,278,469 3,238,875 3,282,705Transfer to CTM 1,188,021 2,036,733 3,208,110 3,208,110 2,948,189Transfer to CIP 650,000 1,886,356 825,000 825,000 625,000
TOTAL TRANSFERS OUT 5,174,650 7,236,211 7,356,579 7,316,985 6,930,894
OTHER REQUIREMENTSSupplemental Retirement 1,555,849 2,305,437 3,216,797 2,889,719 0Wage Adjustment - Markets 0 0 400,302 0 027th Payperiod Expense 0 1,889,451 0 0 027th Payperiod Funding 0 (1,955,310) 0 0 0Accrued Payroll 286,359 240,730 132,651 216,072 279,198
TOTAL OTHER REQUIREMENTS 1,842,208 2,480,308 3,749,750 3,105,791 279,198
TOTAL REQUIREMENTS 60,018,355 69,101,484 77,691,381 75,663,220 91,977,529
4,618,577 (2,582,667) (5,133,359) (3,242,441) (2,967,552)
ADJUSTMENT TO GAAP 187,961 310,599 0 0 0
ENDING BALANCE 8,482,061 6,209,993 1,076,634 2,967,552 0
SUPPORT SERVICES FUND
EXCESS (DEFICIENCY) OF TOTAL AVAILABLE FUNDS OVER TOTAL REQUIREMENTS
2012-13 Proposed Budget, Austin, TX
588 | Volume I
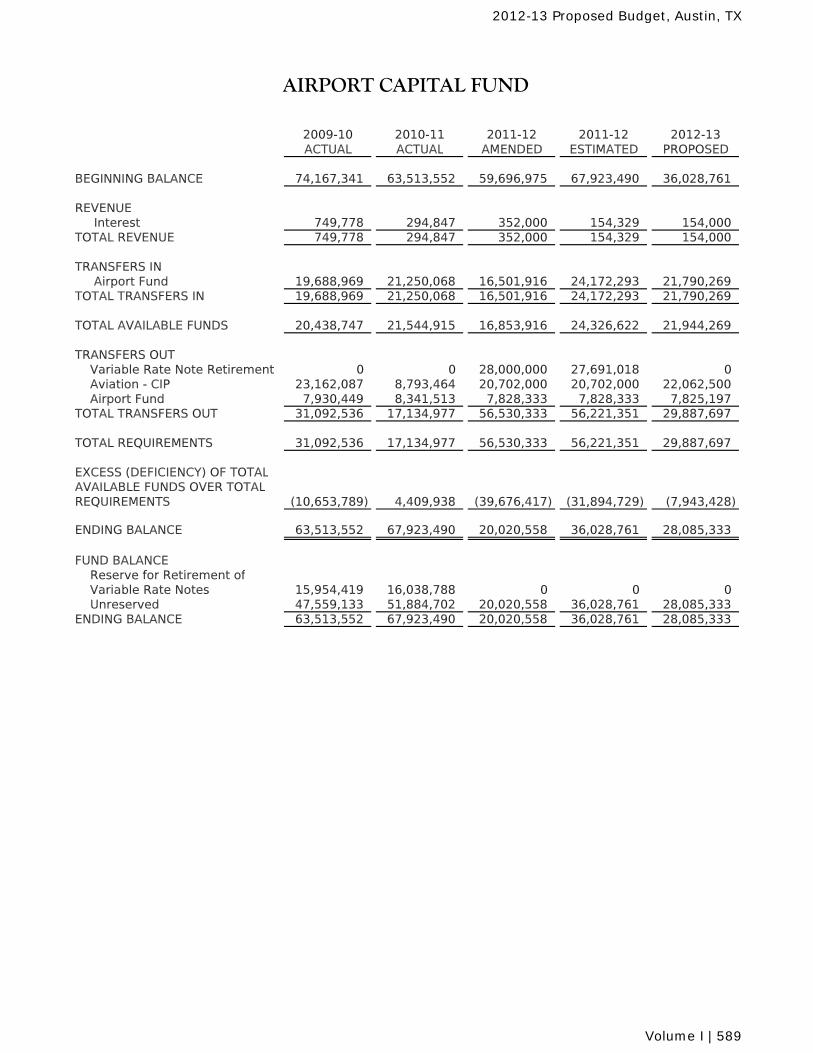
2009-10 2010-11 2011-12 2011-12 2012-13ACTUAL ACTUAL AMENDED ESTIMATED PROPOSED
BEGINNING BALANCE 74,167,341 63,513,552 59,696,975 67,923,490 36,028,761
REVENUE Interest 749,778 294,847 352,000 154,329 154,000TOTAL REVENUE 749,778 294,847 352,000 154,329 154,000
TRANSFERS IN Airport Fund 19,688,969 21,250,068 16,501,916 24,172,293 21,790,269TOTAL TRANSFERS IN 19,688,969 21,250,068 16,501,916 24,172,293 21,790,269
TOTAL AVAILABLE FUNDS 20,438,747 21,544,915 16,853,916 24,326,622 21,944,269
TRANSFERS OUT Variable Rate Note Retirement 0 0 28,000,000 27,691,018 0 Aviation - CIP 23,162,087 8,793,464 20,702,000 20,702,000 22,062,500 Airport Fund 7,930,449 8,341,513 7,828,333 7,828,333 7,825,197TOTAL TRANSFERS OUT 31,092,536 17,134,977 56,530,333 56,221,351 29,887,697
TOTAL REQUIREMENTS 31,092,536 17,134,977 56,530,333 56,221,351 29,887,697
EXCESS (DEFICIENCY) OF TOTALAVAILABLE FUNDS OVER TOTALREQUIREMENTS (10,653,789) 4,409,938 (39,676,417) (31,894,729) (7,943,428)
ENDING BALANCE 63,513,552 67,923,490 20,020,558 36,028,761 28,085,333
FUND BALANCE Reserve for Retirement of Variable Rate Notes 15,954,419 16,038,788 0 0 0 Unreserved 47,559,133 51,884,702 20,020,558 36,028,761 28,085,333ENDING BALANCE 63,513,552 67,923,490 20,020,558 36,028,761 28,085,333
AIRPORT CAPITAL FUND
2012-13 Proposed Budget, Austin, TX
Volume I | 589
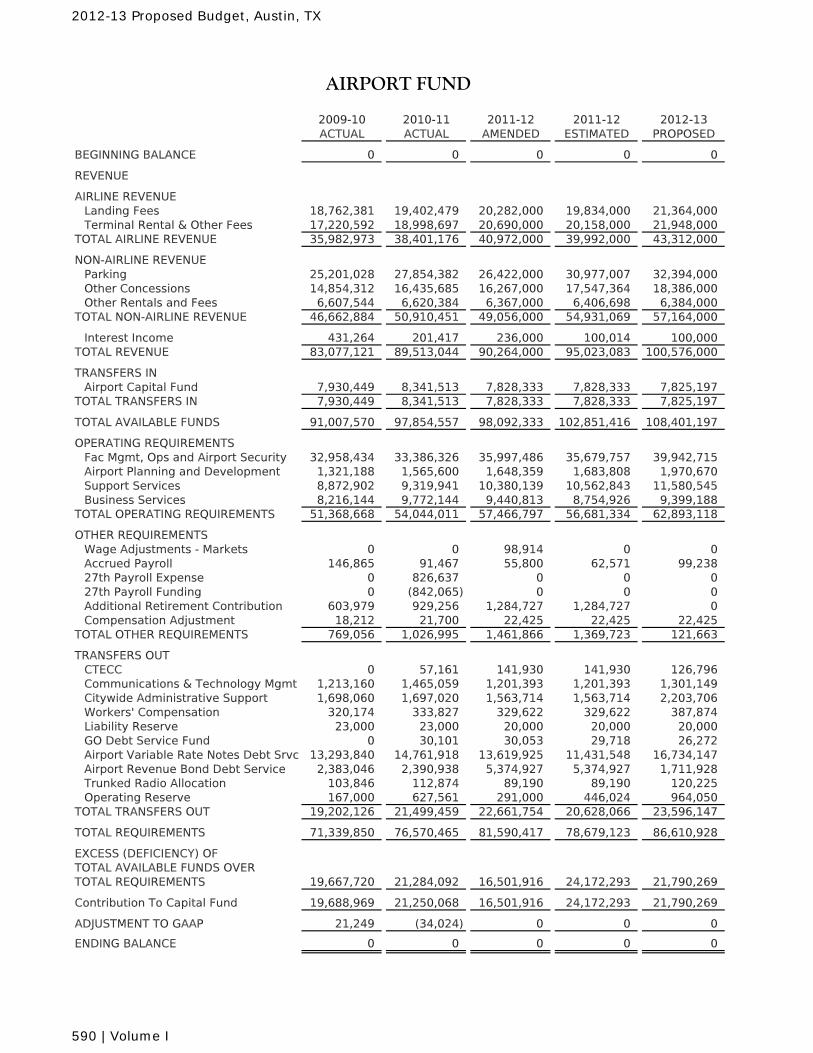
2009-10 2010-11 2011-12 2011-12 2012-13ACTUAL ACTUAL AMENDED ESTIMATED PROPOSED
BEGINNING BALANCE 0 0 0 0 0
REVENUE
AIRLINE REVENUELanding Fees 18,762,381 19,402,479 20,282,000 19,834,000 21,364,000Terminal Rental & Other Fees 17,220,592 18,998,697 20,690,000 20,158,000 21,948,000
TOTAL AIRLINE REVENUE 35,982,973 38,401,176 40,972,000 39,992,000 43,312,000
NON-AIRLINE REVENUEParking 25,201,028 27,854,382 26,422,000 30,977,007 32,394,000Other Concessions 14,854,312 16,435,685 16,267,000 17,547,364 18,386,000Other Rentals and Fees 6,607,544 6,620,384 6,367,000 6,406,698 6,384,000
TOTAL NON-AIRLINE REVENUE 46,662,884 50,910,451 49,056,000 54,931,069 57,164,000
Interest Income 431,264 201,417 236,000 100,014 100,000TOTAL REVENUE 83,077,121 89,513,044 90,264,000 95,023,083 100,576,000
TRANSFERS INAirport Capital Fund 7,930,449 8,341,513 7,828,333 7,828,333 7,825,197
TOTAL TRANSFERS IN 7,930,449 8,341,513 7,828,333 7,828,333 7,825,197
TOTAL AVAILABLE FUNDS 91,007,570 97,854,557 98,092,333 102,851,416 108,401,197
OPERATING REQUIREMENTSFac Mgmt, Ops and Airport Security 32,958,434 33,386,326 35,997,486 35,679,757 39,942,715Airport Planning and Development 1,321,188 1,565,600 1,648,359 1,683,808 1,970,670Support Services 8,872,902 9,319,941 10,380,139 10,562,843 11,580,545Business Services 8,216,144 9,772,144 9,440,813 8,754,926 9,399,188
TOTAL OPERATING REQUIREMENTS 51,368,668 54,044,011 57,466,797 56,681,334 62,893,118
OTHER REQUIREMENTSWage Adjustments - Markets 0 0 98,914 0 0Accrued Payroll 146,865 91,467 55,800 62,571 99,23827th Payroll Expense 0 826,637 0 0 027th Payroll Funding 0 (842,065) 0 0 0Additional Retirement Contribution 603,979 929,256 1,284,727 1,284,727 0Compensation Adjustment 18,212 21,700 22,425 22,425 22,425
TOTAL OTHER REQUIREMENTS 769,056 1,026,995 1,461,866 1,369,723 121,663
TRANSFERS OUTCTECC 0 57,161 141,930 141,930 126,796Communications & Technology Mgmt 1,213,160 1,465,059 1,201,393 1,201,393 1,301,149Citywide Administrative Support 1,698,060 1,697,020 1,563,714 1,563,714 2,203,706Workers' Compensation 320,174 333,827 329,622 329,622 387,874Liability Reserve 23,000 23,000 20,000 20,000 20,000GO Debt Service Fund 0 30,101 30,053 29,718 26,272Airport Variable Rate Notes Debt Srvc 13,293,840 14,761,918 13,619,925 11,431,548 16,734,147Airport Revenue Bond Debt Service 2,383,046 2,390,938 5,374,927 5,374,927 1,711,928Trunked Radio Allocation 103,846 112,874 89,190 89,190 120,225Operating Reserve 167,000 627,561 291,000 446,024 964,050
TOTAL TRANSFERS OUT 19,202,126 21,499,459 22,661,754 20,628,066 23,596,147
TOTAL REQUIREMENTS 71,339,850 76,570,465 81,590,417 78,679,123 86,610,928
EXCESS (DEFICIENCY) OF TOTAL AVAILABLE FUNDS OVERTOTAL REQUIREMENTS 19,667,720 21,284,092 16,501,916 24,172,293 21,790,269
Contribution To Capital Fund 19,688,969 21,250,068 16,501,916 24,172,293 21,790,269
ADJUSTMENT TO GAAP 21,249 (34,024) 0 0 0
ENDING BALANCE 0 0 0 0 0
AIRPORT FUND
2012-13 Proposed Budget, Austin, TX
590 | Volume I
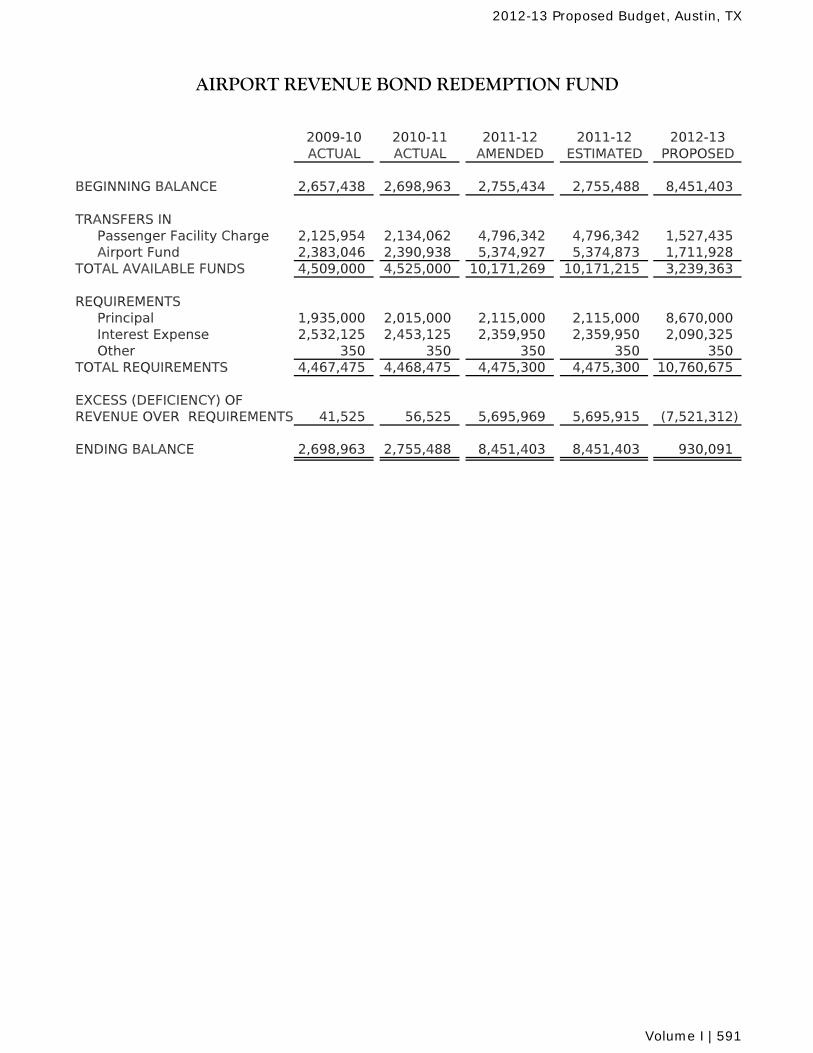
2009-10 2010-11 2011-12 2011-12 2012-13ACTUAL ACTUAL AMENDED ESTIMATED PROPOSED
BEGINNING BALANCE 2,657,438 2,698,963 2,755,434 2,755,488 8,451,403
TRANSFERS INPassenger Facility Charge 2,125,954 2,134,062 4,796,342 4,796,342 1,527,435Airport Fund 2,383,046 2,390,938 5,374,927 5,374,873 1,711,928
TOTAL AVAILABLE FUNDS 4,509,000 4,525,000 10,171,269 10,171,215 3,239,363
REQUIREMENTSPrincipal 1,935,000 2,015,000 2,115,000 2,115,000 8,670,000Interest Expense 2,532,125 2,453,125 2,359,950 2,359,950 2,090,325Other 350 350 350 350 350
TOTAL REQUIREMENTS 4,467,475 4,468,475 4,475,300 4,475,300 10,760,675
EXCESS (DEFICIENCY) OF REVENUE OVER REQUIREMENTS 41,525 56,525 5,695,969 5,695,915 (7,521,312)
ENDING BALANCE 2,698,963 2,755,488 8,451,403 8,451,403 930,091
AIRPORT REVENUE BOND REDEMPTION FUND
2012-13 Proposed Budget, Austin, TX
Volume I | 591
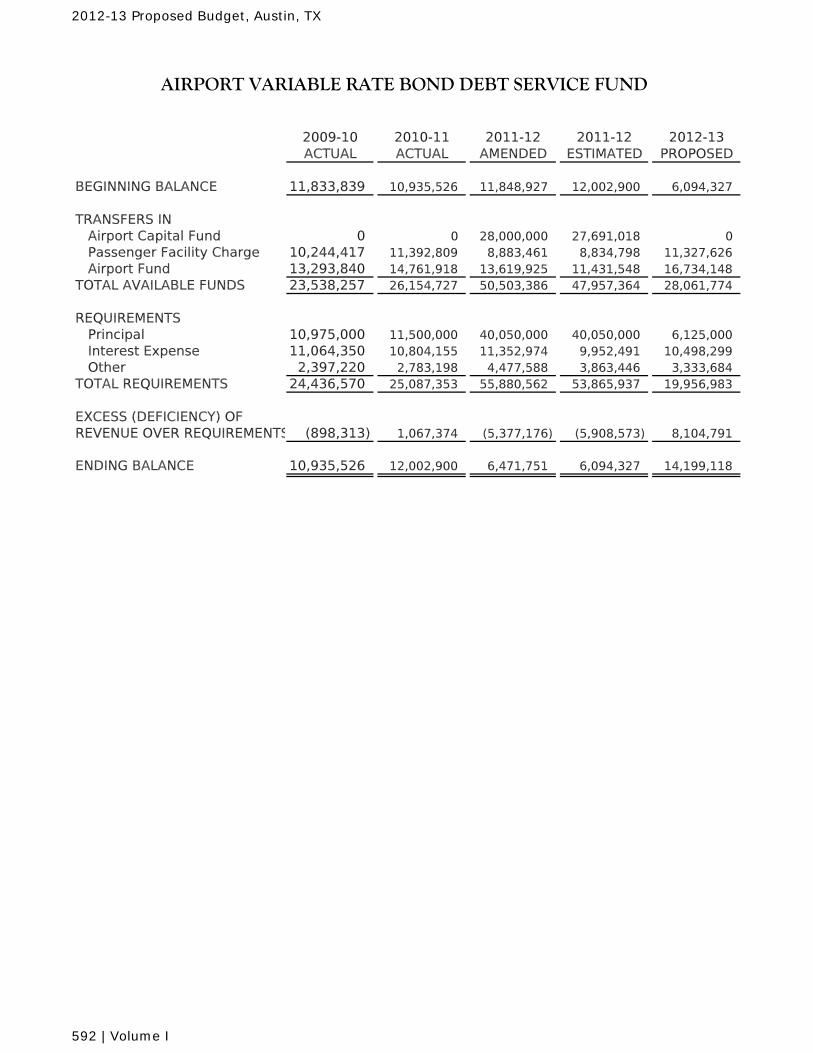
2009-10 2010-11 2011-12 2011-12 2012-13ACTUAL ACTUAL AMENDED ESTIMATED PROPOSED
BEGINNING BALANCE 11,833,839 10,935,526 11,848,927 12,002,900 6,094,327
TRANSFERS INAirport Capital Fund 0 0 28,000,000 27,691,018 0Passenger Facility Charge 10,244,417 11,392,809 8,883,461 8,834,798 11,327,626Airport Fund 13,293,840 14,761,918 13,619,925 11,431,548 16,734,148
TOTAL AVAILABLE FUNDS 23,538,257 26,154,727 50,503,386 47,957,364 28,061,774
REQUIREMENTSPrincipal 10,975,000 11,500,000 40,050,000 40,050,000 6,125,000Interest Expense 11,064,350 10,804,155 11,352,974 9,952,491 10,498,299Other 2,397,220 2,783,198 4,477,588 3,863,446 3,333,684
TOTAL REQUIREMENTS 24,436,570 25,087,353 55,880,562 53,865,937 19,956,983
EXCESS (DEFICIENCY) OF REVENUE OVER REQUIREMENTS (898,313) 1,067,374 (5,377,176) (5,908,573) 8,104,791
ENDING BALANCE 10,935,526 12,002,900 6,471,751 6,094,327 14,199,118
AIRPORT VARIABLE RATE BOND DEBT SERVICE FUND
2012-13 Proposed Budget, Austin, TX
592 | Volume I
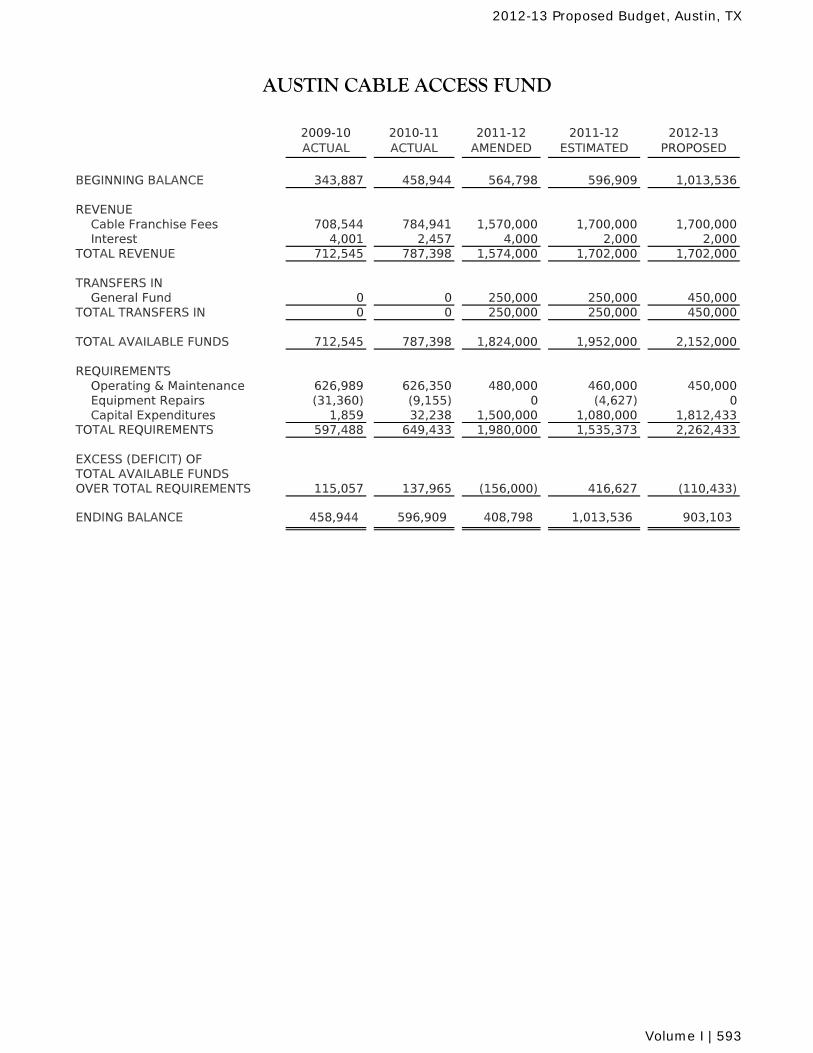
2009-10 ACTUAL
2010-11 ACTUAL
2011-12 AMENDED
2011-12 ESTIMATED
2012-13 PROPOSED
BEGINNING BALANCE 343,887 458,944 564,798 596,909 1,013,536
REVENUE Cable Franchise Fees 708,544 784,941 1,570,000 1,700,000 1,700,000 Interest 4,001 2,457 4,000 2,000 2,000 TOTAL REVENUE 712,545 787,398 1,574,000 1,702,000 1,702,000
TRANSFERS IN General Fund 0 0 250,000 250,000 450,000 TOTAL TRANSFERS IN 0 0 250,000 250,000 450,000
TOTAL AVAILABLE FUNDS 712,545 787,398 1,824,000 1,952,000 2,152,000
REQUIREMENTS Operating & Maintenance 626,989 626,350 480,000 460,000 450,000 Equipment Repairs (31,360) (9,155) 0 (4,627) 0 Capital Expenditures 1,859 32,238 1,500,000 1,080,000 1,812,433 TOTAL REQUIREMENTS 597,488 649,433 1,980,000 1,535,373 2,262,433
EXCESS (DEFICIT) OFTOTAL AVAILABLE FUNDSOVER TOTAL REQUIREMENTS 115,057 137,965 (156,000) 416,627 (110,433)
ENDING BALANCE 458,944 596,909 408,798 1,013,536 903,103
AUSTIN CABLE ACCESS FUND
2012-13 Proposed Budget, Austin, TX
Volume I | 593
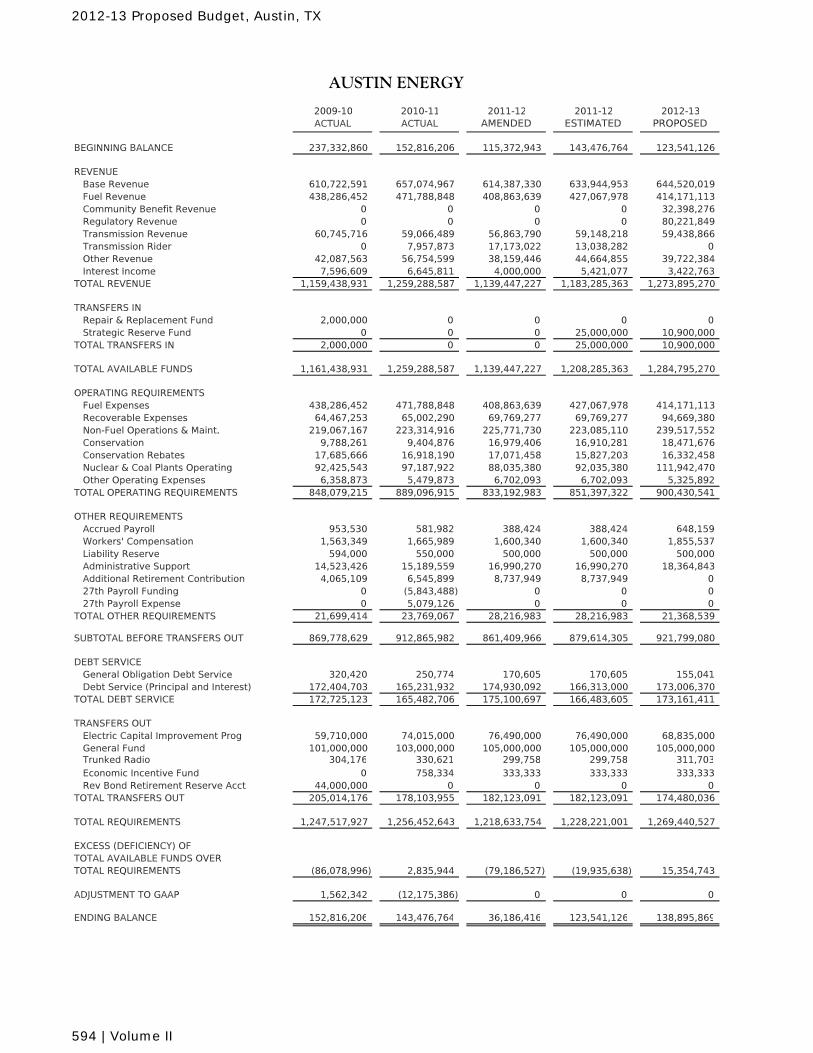
2009-10 2010-11 2011-12 2011-12 2012-13ACTUAL ACTUAL AMENDED ESTIMATED PROPOSED
BEGINNING BALANCE 237,332,860 152,816,206 115,372,943 143,476,764 123,541,126
REVENUE Base Revenue 610,722,591 657,074,967 614,387,330 633,944,953 644,520,019 Fuel Revenue 438,286,452 471,788,848 408,863,639 427,067,978 414,171,113 Community Benefit Revenue 0 0 0 0 32,398,276 Regulatory Revenue 0 0 0 0 80,221,849 Transmission Revenue 60,745,716 59,066,489 56,863,790 59,148,218 59,438,866 Transmission Rider 0 7,957,873 17,173,022 13,038,282 0 Other Revenue 42,087,563 56,754,599 38,159,446 44,664,855 39,722,384 Interest Income 7,596,609 6,645,811 4,000,000 5,421,077 3,422,763TOTAL REVENUE 1,159,438,931 1,259,288,587 1,139,447,227 1,183,285,363 1,273,895,270
TRANSFERS IN Repair & Replacement Fund 2,000,000 0 0 0 0 Strategic Reserve Fund 0 0 0 25,000,000 10,900,000TOTAL TRANSFERS IN 2,000,000 0 0 25,000,000 10,900,000
TOTAL AVAILABLE FUNDS 1,161,438,931 1,259,288,587 1,139,447,227 1,208,285,363 1,284,795,270
OPERATING REQUIREMENTS Fuel Expenses 438,286,452 471,788,848 408,863,639 427,067,978 414,171,113 Recoverable Expenses 64,467,253 65,002,290 69,769,277 69,769,277 94,669,380 Non-Fuel Operations & Maint. 219,067,167 223,314,916 225,771,730 223,085,110 239,517,552 Conservation 9,788,261 9,404,876 16,979,406 16,910,281 18,471,676 Conservation Rebates 17,685,666 16,918,190 17,071,458 15,827,203 16,332,458 Nuclear & Coal Plants Operating 92,425,543 97,187,922 88,035,380 92,035,380 111,942,470 Other Operating Expenses 6,358,873 5,479,873 6,702,093 6,702,093 5,325,892TOTAL OPERATING REQUIREMENTS 848,079,215 889,096,915 833,192,983 851,397,322 900,430,541
OTHER REQUIREMENTS Accrued Payroll 953,530 581,982 388,424 388,424 648,159 Workers' Compensation 1,563,349 1,665,989 1,600,340 1,600,340 1,855,537 Liability Reserve 594,000 550,000 500,000 500,000 500,000 Administrative Support 14,523,426 15,189,559 16,990,270 16,990,270 18,364,843 Additional Retirement Contribution 4,065,109 6,545,899 8,737,949 8,737,949 0 27th Payroll Funding 0 (5,843,488) 0 0 0 27th Payroll Expense 0 5,079,126 0 0 0TOTAL OTHER REQUIREMENTS 21,699,414 23,769,067 28,216,983 28,216,983 21,368,539
SUBTOTAL BEFORE TRANSFERS OUT 869,778,629 912,865,982 861,409,966 879,614,305 921,799,080
DEBT SERVICE General Obligation Debt Service 320,420 250,774 170,605 170,605 155,041 Debt Service (Principal and Interest) 172,404,703 165,231,932 174,930,092 166,313,000 173,006,370TOTAL DEBT SERVICE 172,725,123 165,482,706 175,100,697 166,483,605 173,161,411
TRANSFERS OUT Electric Capital Improvement Prog 59,710,000 74,015,000 76,490,000 76,490,000 68,835,000 General Fund 101,000,000 103,000,000 105,000,000 105,000,000 105,000,000 Trunked Radio 304,176 330,621 299,758 299,758 311,703 Economic Incentive Fund 0 758,334 333,333 333,333 333,333 Rev Bond Retirement Reserve Acct 44,000,000 0 0 0 0TOTAL TRANSFERS OUT 205,014,176 178,103,955 182,123,091 182,123,091 174,480,036
TOTAL REQUIREMENTS 1,247,517,927 1,256,452,643 1,218,633,754 1,228,221,001 1,269,440,527
EXCESS (DEFICIENCY) OF TOTAL AVAILABLE FUNDS OVERTOTAL REQUIREMENTS (86,078,996) 2,835,944 (79,186,527) (19,935,638) 15,354,743
ADJUSTMENT TO GAAP 1,562,342 (12,175,386) 0 0 0
ENDING BALANCE 152,816,206 143,476,764 36,186,416 123,541,126 138,895,869
AUSTIN ENERGY
2012-13 Proposed Budget, Austin, TX
594 | Volume II
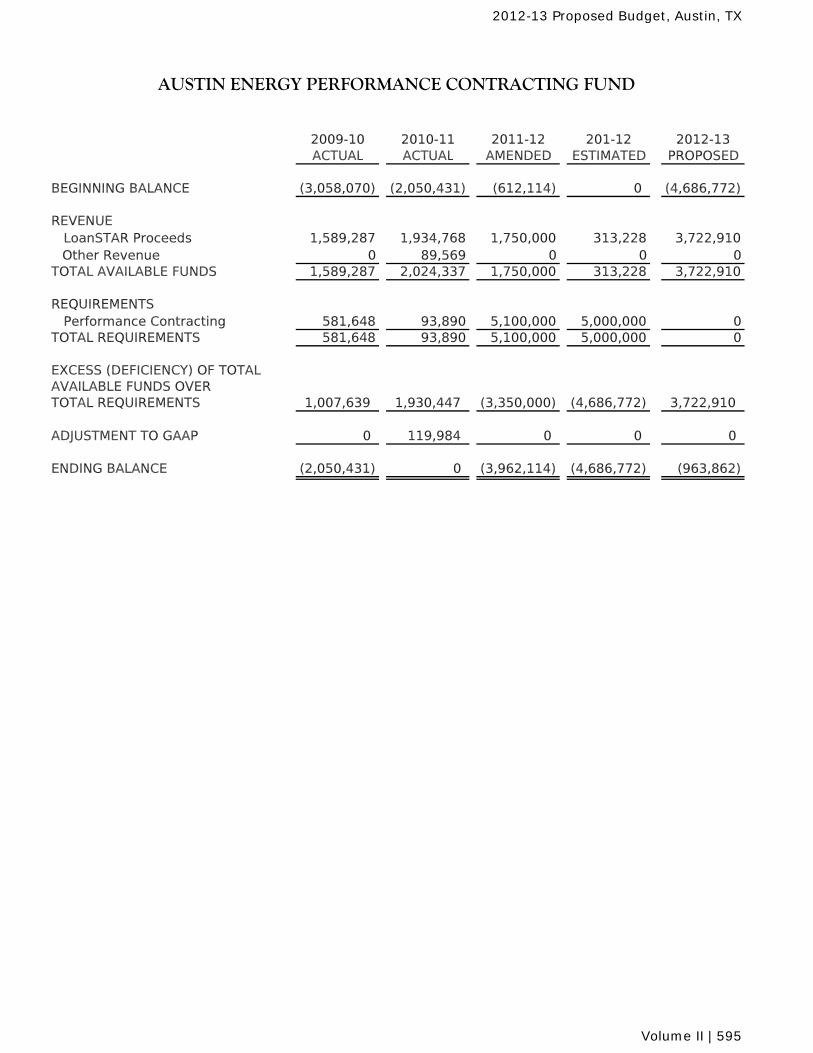
2009-10 2010-11 2011-12 201-12 2012-13ACTUAL ACTUAL AMENDED ESTIMATED PROPOSED
BEGINNING BALANCE (3,058,070) (2,050,431) (612,114) 0 (4,686,772)
REVENUE LoanSTAR Proceeds 1,589,287 1,934,768 1,750,000 313,228 3,722,910
Other Revenue 0 89,569 0 0 0TOTAL AVAILABLE FUNDS 1,589,287 2,024,337 1,750,000 313,228 3,722,910
REQUIREMENTS Performance Contracting 581,648 93,890 5,100,000 5,000,000 0TOTAL REQUIREMENTS 581,648 93,890 5,100,000 5,000,000 0
EXCESS (DEFICIENCY) OF TOTALAVAILABLE FUNDS OVER TOTAL REQUIREMENTS 1,007,639 1,930,447 (3,350,000) (4,686,772) 3,722,910
ADJUSTMENT TO GAAP 0 119,984 0 0 0
ENDING BALANCE (2,050,431) 0 (3,962,114) (4,686,772) (963,862)
AUSTIN ENERGY PERFORMANCE CONTRACTING FUND
2012-13 Proposed Budget, Austin, TX
Volume II | 595
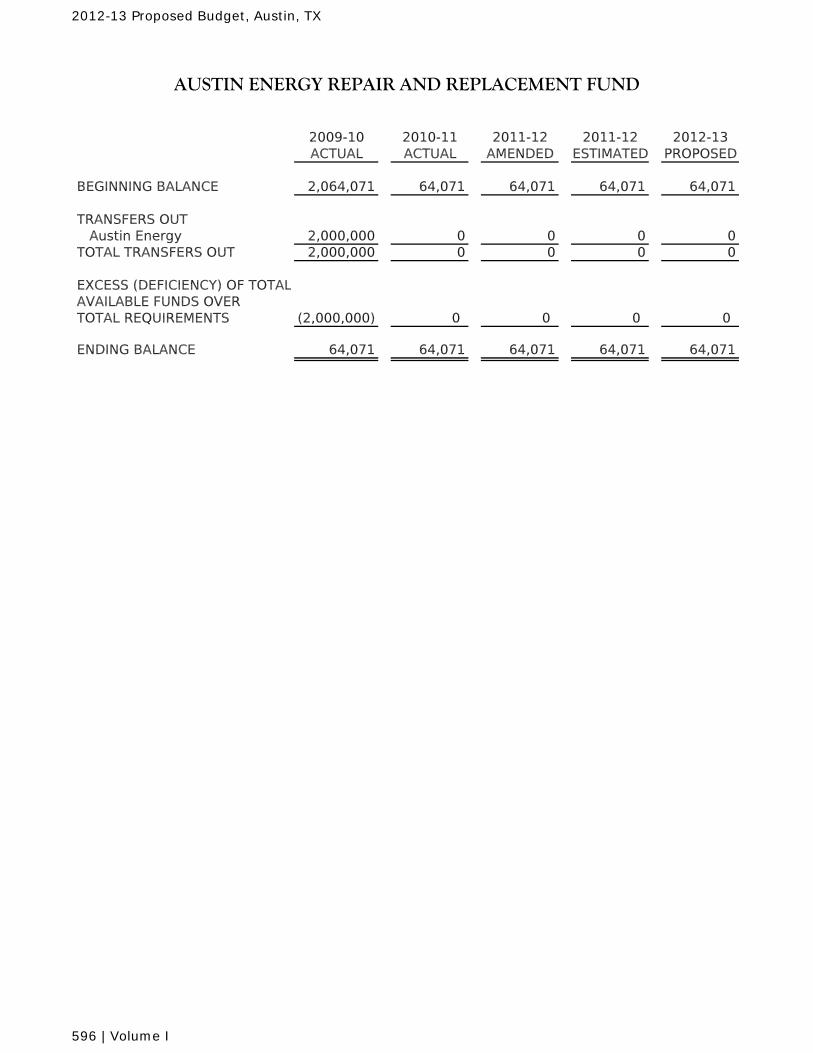
2009-10 2010-11 2011-12 2011-12 2012-13ACTUAL ACTUAL AMENDED ESTIMATED PROPOSED
BEGINNING BALANCE 2,064,071 64,071 64,071 64,071 64,071
TRANSFERS OUTAustin Energy 2,000,000 0 0 0 0
TOTAL TRANSFERS OUT 2,000,000 0 0 0 0
EXCESS (DEFICIENCY) OF TOTALAVAILABLE FUNDS OVERTOTAL REQUIREMENTS (2,000,000) 0 0 0 0
ENDING BALANCE 64,071 64,071 64,071 64,071 64,071
AUSTIN ENERGY REPAIR AND REPLACEMENT FUND
2012-13 Proposed Budget, Austin, TX
596 | Volume I
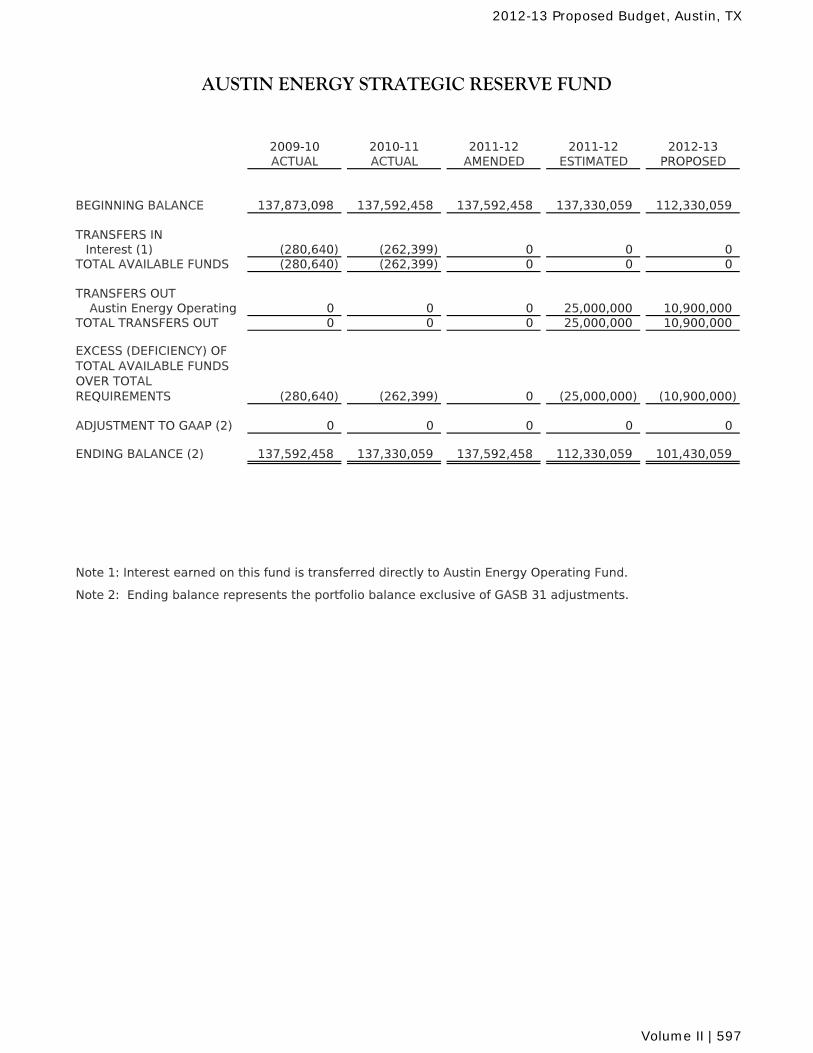
2009-10 2010-11 2011-12 2011-12 2012-13ACTUAL ACTUAL AMENDED ESTIMATED PROPOSED
BEGINNING BALANCE 137,873,098 137,592,458 137,592,458 137,330,059 112,330,059
TRANSFERS INInterest (1) (280,640) (262,399) 0 0 0
TOTAL AVAILABLE FUNDS (280,640) (262,399) 0 0 0
TRANSFERS OUT Austin Energy Operating 0 0 0 25,000,000 10,900,000
TOTAL TRANSFERS OUT 0 0 0 25,000,000 10,900,000
EXCESS (DEFICIENCY) OF TOTAL AVAILABLE FUNDSOVER TOTAL REQUIREMENTS (280,640) (262,399) 0 (25,000,000) (10,900,000)
ADJUSTMENT TO GAAP (2) 0 0 0 0 0
ENDING BALANCE (2) 137,592,458 137,330,059 137,592,458 112,330,059 101,430,059
Note 1: Interest earned on this fund is transferred directly to Austin Energy Operating Fund.
Note 2: Ending balance represents the portfolio balance exclusive of GASB 31 adjustments.
AUSTIN ENERGY STRATEGIC RESERVE FUND
2012-13 Proposed Budget, Austin, TX
Volume II | 597
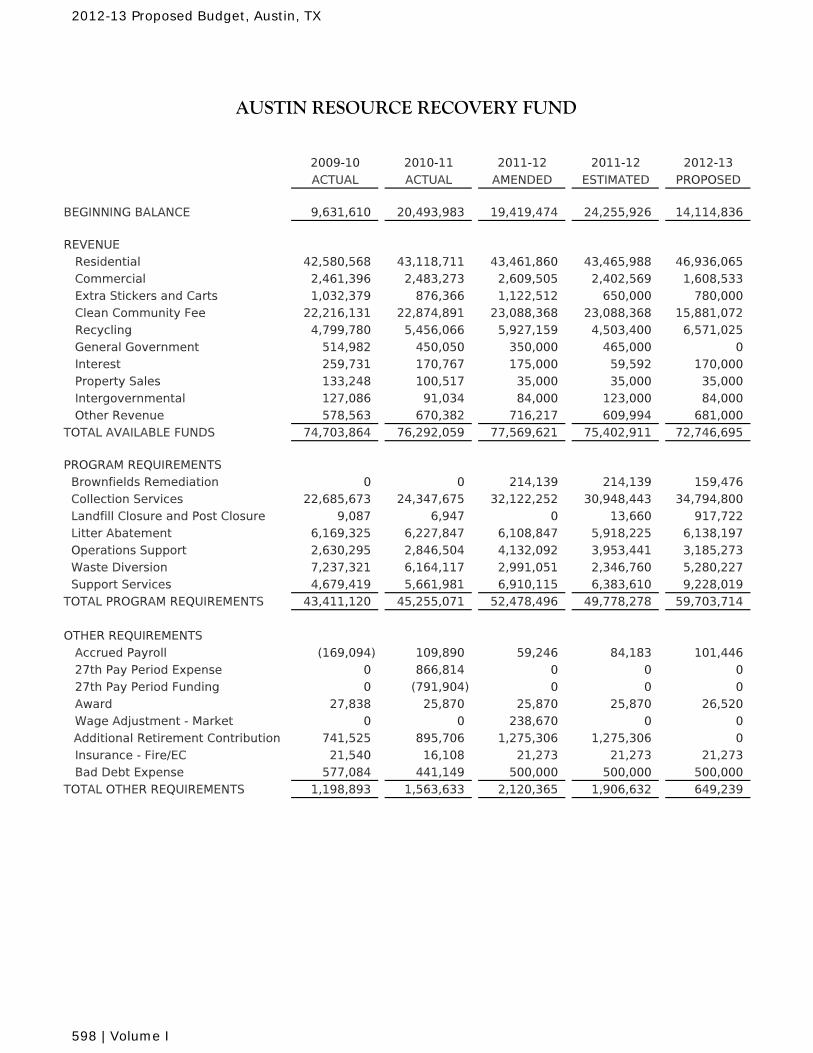
2009-10 2010-11 2011-12 2011-12 2012-13 ACTUAL ACTUAL AMENDED ESTIMATED PROPOSED
BEGINNING BALANCE 9,631,610 20,493,983 19,419,474 24,255,926 14,114,836
REVENUE Residential 42,580,568 43,118,711 43,461,860 43,465,988 46,936,065 Commercial 2,461,396 2,483,273 2,609,505 2,402,569 1,608,533 Extra Stickers and Carts 1,032,379 876,366 1,122,512 650,000 780,000 Clean Community Fee 22,216,131 22,874,891 23,088,368 23,088,368 15,881,072 Recycling 4,799,780 5,456,066 5,927,159 4,503,400 6,571,025 General Government 514,982 450,050 350,000 465,000 0 Interest 259,731 170,767 175,000 59,592 170,000 Property Sales 133,248 100,517 35,000 35,000 35,000 Intergovernmental 127,086 91,034 84,000 123,000 84,000 Other Revenue 578,563 670,382 716,217 609,994 681,000TOTAL AVAILABLE FUNDS 74,703,864 76,292,059 77,569,621 75,402,911 72,746,695
PROGRAM REQUIREMENTS Brownfields Remediation 0 0 214,139 214,139 159,476 Collection Services 22,685,673 24,347,675 32,122,252 30,948,443 34,794,800 Landfill Closure and Post Closure 9,087 6,947 0 13,660 917,722 Litter Abatement 6,169,325 6,227,847 6,108,847 5,918,225 6,138,197 Operations Support 2,630,295 2,846,504 4,132,092 3,953,441 3,185,273 Waste Diversion 7,237,321 6,164,117 2,991,051 2,346,760 5,280,227 Support Services 4,679,419 5,661,981 6,910,115 6,383,610 9,228,019 TOTAL PROGRAM REQUIREMENTS 43,411,120 45,255,071 52,478,496 49,778,278 59,703,714
OTHER REQUIREMENTS Accrued Payroll (169,094) 109,890 59,246 84,183 101,446 27th Pay Period Expense 0 866,814 0 0 0 27th Pay Period Funding 0 (791,904) 0 0 0 Award 27,838 25,870 25,870 25,870 26,520 Wage Adjustment - Market 0 0 238,670 0 0
Additional Retirement Contribution 741,525 895,706 1,275,306 1,275,306 0 Insurance - Fire/EC 21,540 16,108 21,273 21,273 21,273 Bad Debt Expense 577,084 441,149 500,000 500,000 500,000TOTAL OTHER REQUIREMENTS 1,198,893 1,563,633 2,120,365 1,906,632 649,239
AUSTIN RESOURCE RECOVERY FUND
2012-13 Proposed Budget, Austin, TX
598 | Volume I
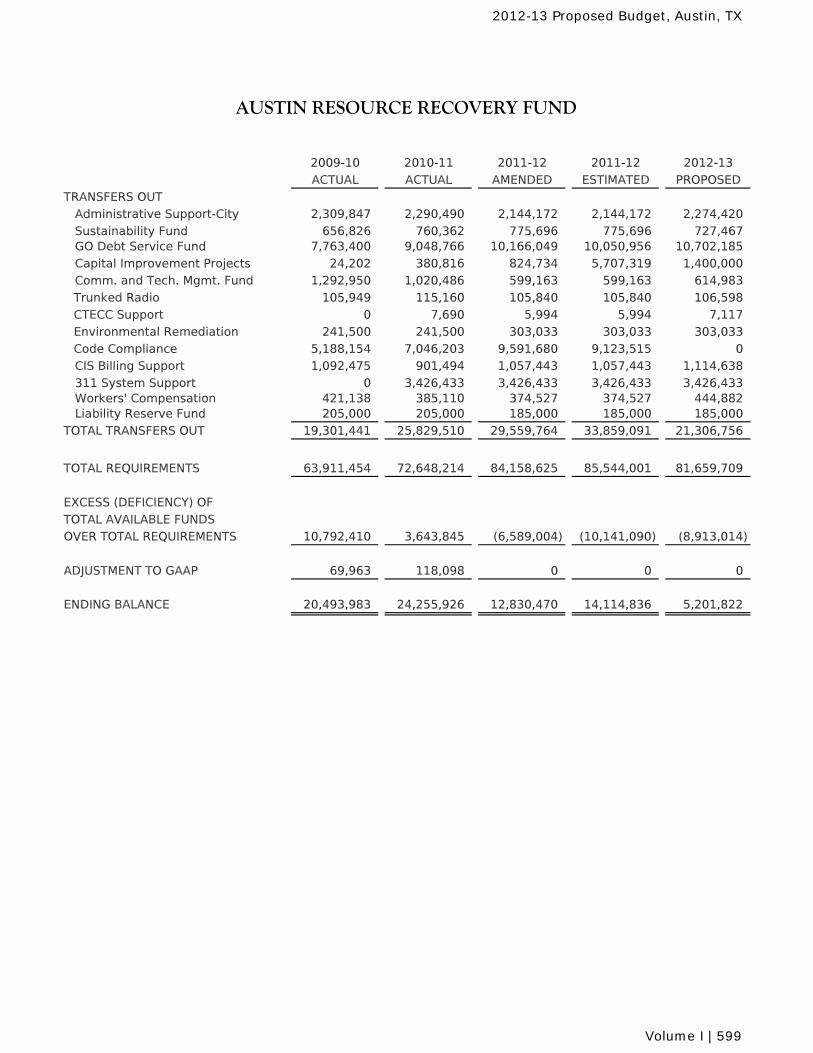
2009-10 2010-11 2011-12 2011-12 2012-13 ACTUAL ACTUAL AMENDED ESTIMATED PROPOSED
AUSTIN RESOURCE RECOVERY FUND
TRANSFERS OUT Administrative Support-City 2,309,847 2,290,490 2,144,172 2,144,172 2,274,420 Sustainability Fund 656,826 760,362 775,696 775,696 727,467 GO Debt Service Fund 7,763,400 9,048,766 10,166,049 10,050,956 10,702,185 Capital Improvement Projects 24,202 380,816 824,734 5,707,319 1,400,000 Comm. and Tech. Mgmt. Fund 1,292,950 1,020,486 599,163 599,163 614,983
Trunked Radio 105,949 115,160 105,840 105,840 106,598CTECC Support 0 7,690 5,994 5,994 7,117Environmental Remediation 241,500 241,500 303,033 303,033 303,033Code Compliance 5,188,154 7,046,203 9,591,680 9,123,515 0
CIS Billing Support 1,092,475 901,494 1,057,443 1,057,443 1,114,638 311 System Support 0 3,426,433 3,426,433 3,426,433 3,426,433 Workers' Compensation 421,138 385,110 374,527 374,527 444,882 Liability Reserve Fund 205,000 205,000 185,000 185,000 185,000TOTAL TRANSFERS OUT 19,301,441 25,829,510 29,559,764 33,859,091 21,306,756
TOTAL REQUIREMENTS 63,911,454 72,648,214 84,158,625 85,544,001 81,659,709 EXCESS (DEFICIENCY) OF TOTAL AVAILABLE FUNDS OVER TOTAL REQUIREMENTS 10,792,410 3,643,845 (6,589,004) (10,141,090) (8,913,014)
ADJUSTMENT TO GAAP 69,963 118,098 0 0 0
ENDING BALANCE 20,493,983 24,255,926 12,830,470 14,114,836 5,201,822
2012-13 Proposed Budget, Austin, TX
Volume I | 599
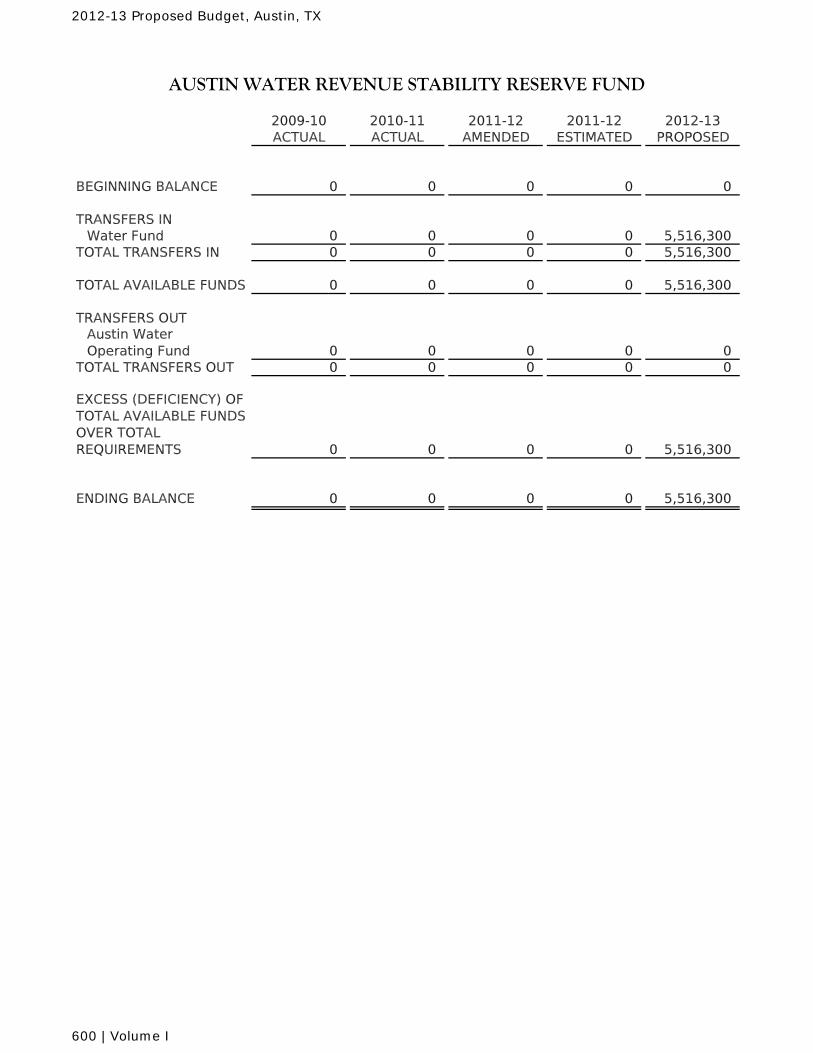
2009-10 2010-11 2011-12 2011-12 2012-13ACTUAL ACTUAL AMENDED ESTIMATED PROPOSED
BEGINNING BALANCE 0 0 0 0 0
TRANSFERS INWater Fund 0 0 0 0 5,516,300
TOTAL TRANSFERS IN 0 0 0 0 5,516,300
TOTAL AVAILABLE FUNDS 0 0 0 0 5,516,300
TRANSFERS OUTAustin Water Operating Fund 0 0 0 0 0
TOTAL TRANSFERS OUT 0 0 0 0 0
EXCESS (DEFICIENCY) OF TOTAL AVAILABLE FUNDS OVER TOTAL REQUIREMENTS 0 0 0 0 5,516,300
ENDING BALANCE 0 0 0 0 5,516,300
AUSTIN WATER REVENUE STABILITY RESERVE FUND
2012-13 Proposed Budget, Austin, TX
600 | Volume I
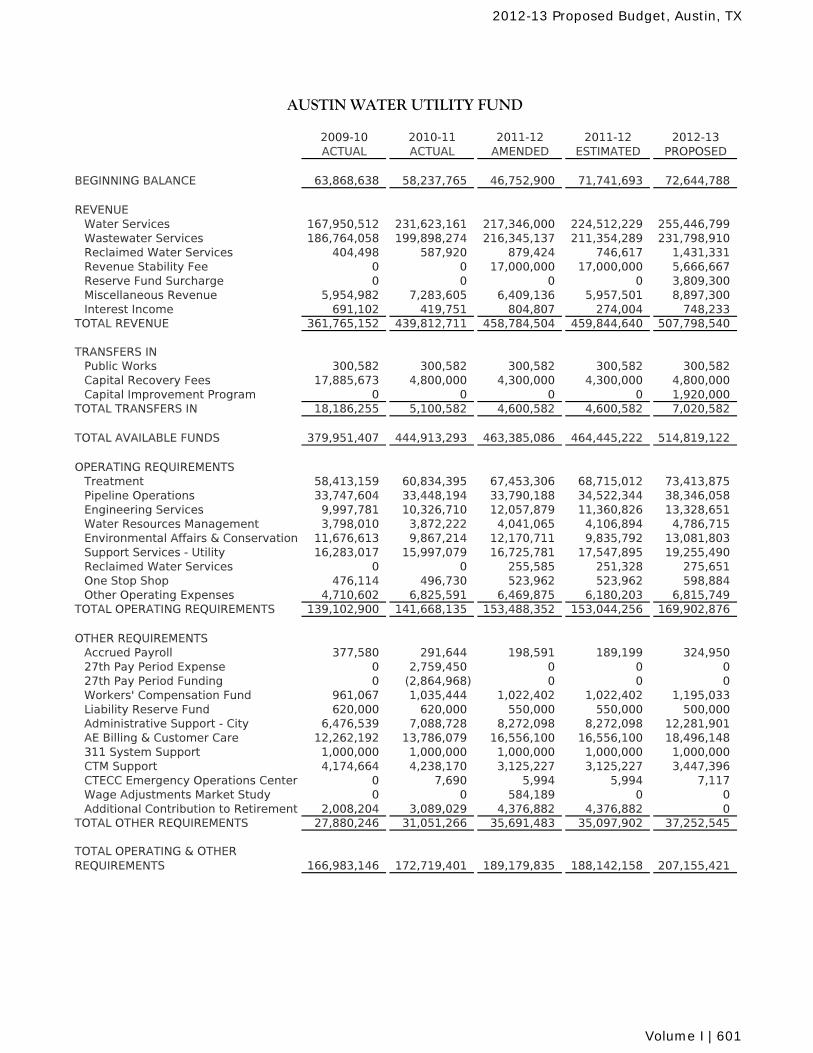
2009-10 2010-11 2011-12 2011-12 2012-13ACTUAL ACTUAL AMENDED ESTIMATED PROPOSED
BEGINNING BALANCE 63,868,638 58,237,765 46,752,900 71,741,693 72,644,788
REVENUEWater Services 167,950,512 231,623,161 217,346,000 224,512,229 255,446,799Wastewater Services 186,764,058 199,898,274 216,345,137 211,354,289 231,798,910Reclaimed Water Services 404,498 587,920 879,424 746,617 1,431,331Revenue Stability Fee 0 0 17,000,000 17,000,000 5,666,667Reserve Fund Surcharge 0 0 0 0 3,809,300Miscellaneous Revenue 5,954,982 7,283,605 6,409,136 5,957,501 8,897,300Interest Income 691,102 419,751 804,807 274,004 748,233
TOTAL REVENUE 361,765,152 439,812,711 458,784,504 459,844,640 507,798,540
TRANSFERS INPublic Works 300,582 300,582 300,582 300,582 300,582Capital Recovery Fees 17,885,673 4,800,000 4,300,000 4,300,000 4,800,000Capital Improvement Program 0 0 0 0 1,920,000
TOTAL TRANSFERS IN 18,186,255 5,100,582 4,600,582 4,600,582 7,020,582
TOTAL AVAILABLE FUNDS 379,951,407 444,913,293 463,385,086 464,445,222 514,819,122
OPERATING REQUIREMENTSTreatment 58,413,159 60,834,395 67,453,306 68,715,012 73,413,875Pipeline Operations 33,747,604 33,448,194 33,790,188 34,522,344 38,346,058Engineering Services 9,997,781 10,326,710 12,057,879 11,360,826 13,328,651Water Resources Management 3,798,010 3,872,222 4,041,065 4,106,894 4,786,715Environmental Affairs & Conservation 11,676,613 9,867,214 12,170,711 9,835,792 13,081,803Support Services - Utility 16,283,017 15,997,079 16,725,781 17,547,895 19,255,490Reclaimed Water Services 0 0 255,585 251,328 275,651One Stop Shop 476,114 496,730 523,962 523,962 598,884Other Operating Expenses 4,710,602 6,825,591 6,469,875 6,180,203 6,815,749
TOTAL OPERATING REQUIREMENTS 139,102,900 141,668,135 153,488,352 153,044,256 169,902,876
OTHER REQUIREMENTSAccrued Payroll 377,580 291,644 198,591 189,199 324,95027th Pay Period Expense 0 2,759,450 0 0 027th Pay Period Funding 0 (2,864,968) 0 0 0Workers' Compensation Fund 961,067 1,035,444 1,022,402 1,022,402 1,195,033Liability Reserve Fund 620,000 620,000 550,000 550,000 500,000Administrative Support - City 6,476,539 7,088,728 8,272,098 8,272,098 12,281,901AE Billing & Customer Care 12,262,192 13,786,079 16,556,100 16,556,100 18,496,148311 System Support 1,000,000 1,000,000 1,000,000 1,000,000 1,000,000CTM Support 4,174,664 4,238,170 3,125,227 3,125,227 3,447,396CTECC Emergency Operations Center 0 7,690 5,994 5,994 7,117Wage Adjustments Market Study 0 0 584,189 0 0Additional Contribution to Retirement 2,008,204 3,089,029 4,376,882 4,376,882 0
TOTAL OTHER REQUIREMENTS 27,880,246 31,051,266 35,691,483 35,097,902 37,252,545
TOTAL OPERATING & OTHER REQUIREMENTS 166,983,146 172,719,401 189,179,835 188,142,158 207,155,421
AUSTIN WATER UTILITY FUND
2012-13 Proposed Budget, Austin, TX
Volume I | 601
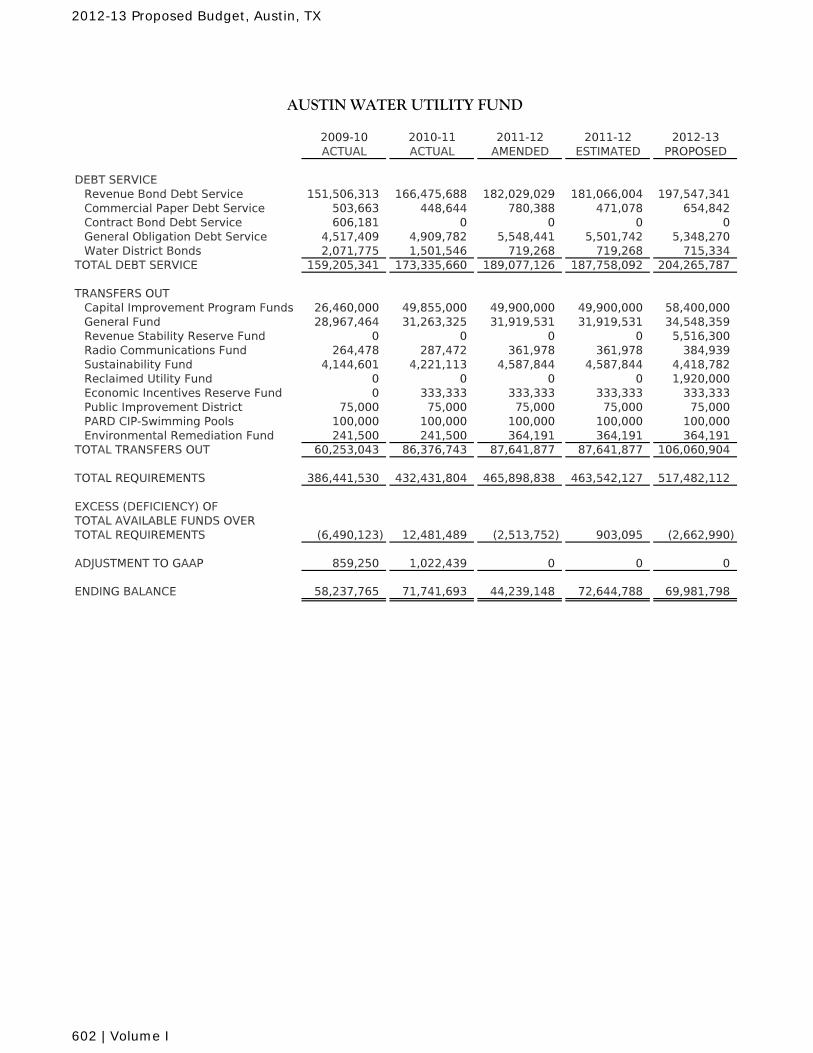
2009-10 2010-11 2011-12 2011-12 2012-13ACTUAL ACTUAL AMENDED ESTIMATED PROPOSED
AUSTIN WATER UTILITY FUND
DEBT SERVICERevenue Bond Debt Service 151,506,313 166,475,688 182,029,029 181,066,004 197,547,341Commercial Paper Debt Service 503,663 448,644 780,388 471,078 654,842Contract Bond Debt Service 606,181 0 0 0 0General Obligation Debt Service 4,517,409 4,909,782 5,548,441 5,501,742 5,348,270Water District Bonds 2,071,775 1,501,546 719,268 719,268 715,334
TOTAL DEBT SERVICE 159,205,341 173,335,660 189,077,126 187,758,092 204,265,787
TRANSFERS OUTCapital Improvement Program Funds 26,460,000 49,855,000 49,900,000 49,900,000 58,400,000General Fund 28,967,464 31,263,325 31,919,531 31,919,531 34,548,359Revenue Stability Reserve Fund 0 0 0 0 5,516,300Radio Communications Fund 264,478 287,472 361,978 361,978 384,939Sustainability Fund 4,144,601 4,221,113 4,587,844 4,587,844 4,418,782Reclaimed Utility Fund 0 0 0 0 1,920,000Economic Incentives Reserve Fund 0 333,333 333,333 333,333 333,333Public Improvement District 75,000 75,000 75,000 75,000 75,000PARD CIP-Swimming Pools 100,000 100,000 100,000 100,000 100,000Environmental Remediation Fund 241,500 241,500 364,191 364,191 364,191
TOTAL TRANSFERS OUT 60,253,043 86,376,743 87,641,877 87,641,877 106,060,904
TOTAL REQUIREMENTS 386,441,530 432,431,804 465,898,838 463,542,127 517,482,112
EXCESS (DEFICIENCY) OF TOTAL AVAILABLE FUNDS OVERTOTAL REQUIREMENTS (6,490,123) 12,481,489 (2,513,752) 903,095 (2,662,990)
ADJUSTMENT TO GAAP 859,250 1,022,439 0 0 0
ENDING BALANCE 58,237,765 71,741,693 44,239,148 72,644,788 69,981,798
2012-13 Proposed Budget, Austin, TX
602 | Volume I
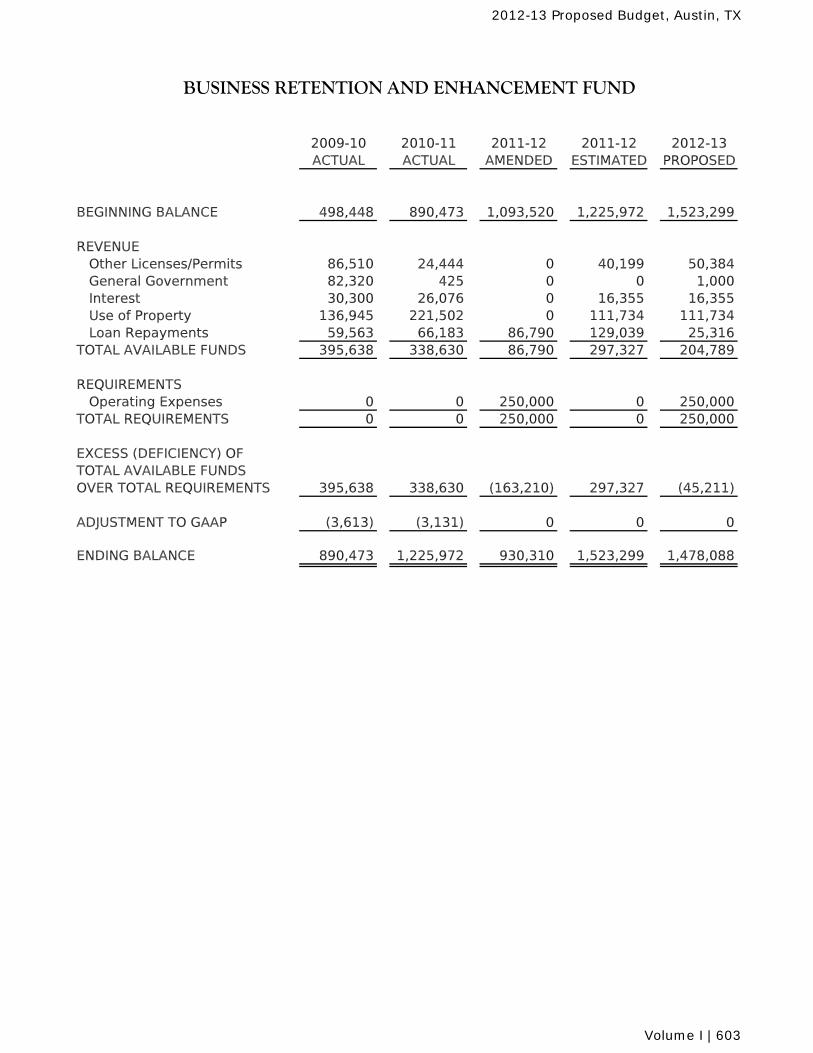
2009-10 2010-11 2011-12 2011-12 2012-13ACTUAL ACTUAL AMENDED ESTIMATED PROPOSED
BEGINNING BALANCE 498,448 890,473 1,093,520 1,225,972 1,523,299
REVENUE Other Licenses/Permits 86,510 24,444 0 40,199 50,384 General Government 82,320 425 0 0 1,000 Interest 30,300 26,076 0 16,355 16,355 Use of Property 136,945 221,502 0 111,734 111,734 Loan Repayments 59,563 66,183 86,790 129,039 25,316TOTAL AVAILABLE FUNDS 395,638 338,630 86,790 297,327 204,789
REQUIREMENTS Operating Expenses 0 0 250,000 0 250,000TOTAL REQUIREMENTS 0 0 250,000 0 250,000
EXCESS (DEFICIENCY) OF TOTAL AVAILABLE FUNDS OVER TOTAL REQUIREMENTS 395,638 338,630 (163,210) 297,327 (45,211)
ADJUSTMENT TO GAAP (3,613) (3,131) 0 0 0
ENDING BALANCE 890,473 1,225,972 930,310 1,523,299 1,478,088
BUSINESS RETENTION AND ENHANCEMENT FUND
2012-13 Proposed Budget, Austin, TX
Volume I | 603
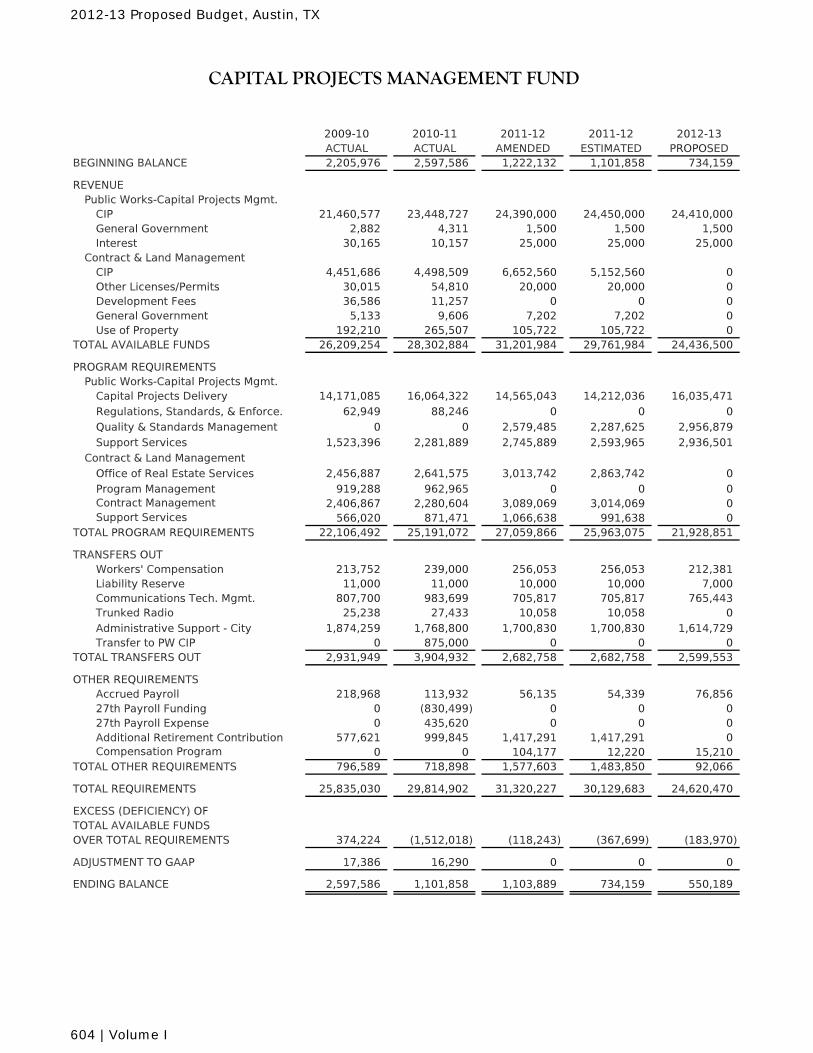
2009-10 2010-11 2011-12 2011-12 2012-13ACTUAL ACTUAL AMENDED ESTIMATED PROPOSED
BEGINNING BALANCE 2,205,976 2,597,586 1,222,132 1,101,858 734,159
REVENUEPublic Works-Capital Projects Mgmt.
CIP 21,460,577 23,448,727 24,390,000 24,450,000 24,410,000 General Government 2,882 4,311 1,500 1,500 1,500
Interest 30,165 10,157 25,000 25,000 25,000Contract & Land Management
CIP 4,451,686 4,498,509 6,652,560 5,152,560 0 Other Licenses/Permits 30,015 54,810 20,000 20,000 0
Development Fees 36,586 11,257 0 0 0General Government 5,133 9,606 7,202 7,202 0Use of Property 192,210 265,507 105,722 105,722 0
TOTAL AVAILABLE FUNDS 26,209,254 28,302,884 31,201,984 29,761,984 24,436,500
PROGRAM REQUIREMENTSPublic Works-Capital Projects Mgmt.
Capital Projects Delivery 14,171,085 16,064,322 14,565,043 14,212,036 16,035,471Regulations, Standards, & Enforce. 62,949 88,246 0 0 0Quality & Standards Management 0 0 2,579,485 2,287,625 2,956,879Support Services 1,523,396 2,281,889 2,745,889 2,593,965 2,936,501
Contract & Land ManagementOffice of Real Estate Services 2,456,887 2,641,575 3,013,742 2,863,742 0Program Management 919,288 962,965 0 0 0Contract Management 2,406,867 2,280,604 3,089,069 3,014,069 0Support Services 566,020 871,471 1,066,638 991,638 0
TOTAL PROGRAM REQUIREMENTS 22,106,492 25,191,072 27,059,866 25,963,075 21,928,851
TRANSFERS OUTWorkers' Compensation 213,752 239,000 256,053 256,053 212,381Liability Reserve 11,000 11,000 10,000 10,000 7,000Communications Tech. Mgmt. 807,700 983,699 705,817 705,817 765,443Trunked Radio 25,238 27,433 10,058 10,058 0Administrative Support - City 1,874,259 1,768,800 1,700,830 1,700,830 1,614,729Transfer to PW CIP 0 875,000 0 0 0
TOTAL TRANSFERS OUT 2,931,949 3,904,932 2,682,758 2,682,758 2,599,553
OTHER REQUIREMENTS Accrued Payroll 218,968 113,932 56,135 54,339 76,85627th Payroll Funding 0 (830,499) 0 0 027th Payroll Expense 0 435,620 0 0 0Additional Retirement Contribution 577,621 999,845 1,417,291 1,417,291 0Compensation Program 0 0 104,177 12,220 15,210
TOTAL OTHER REQUIREMENTS 796,589 718,898 1,577,603 1,483,850 92,066
TOTAL REQUIREMENTS 25,835,030 29,814,902 31,320,227 30,129,683 24,620,470
EXCESS (DEFICIENCY) OFTOTAL AVAILABLE FUNDS OVER TOTAL REQUIREMENTS 374,224 (1,512,018) (118,243) (367,699) (183,970)
ADJUSTMENT TO GAAP 17,386 16,290 0 0 0
ENDING BALANCE 2,597,586 1,101,858 1,103,889 734,159 550,189
CAPITAL PROJECTS MANAGEMENT FUND
2012-13 Proposed Budget, Austin, TX
604 | Volume I
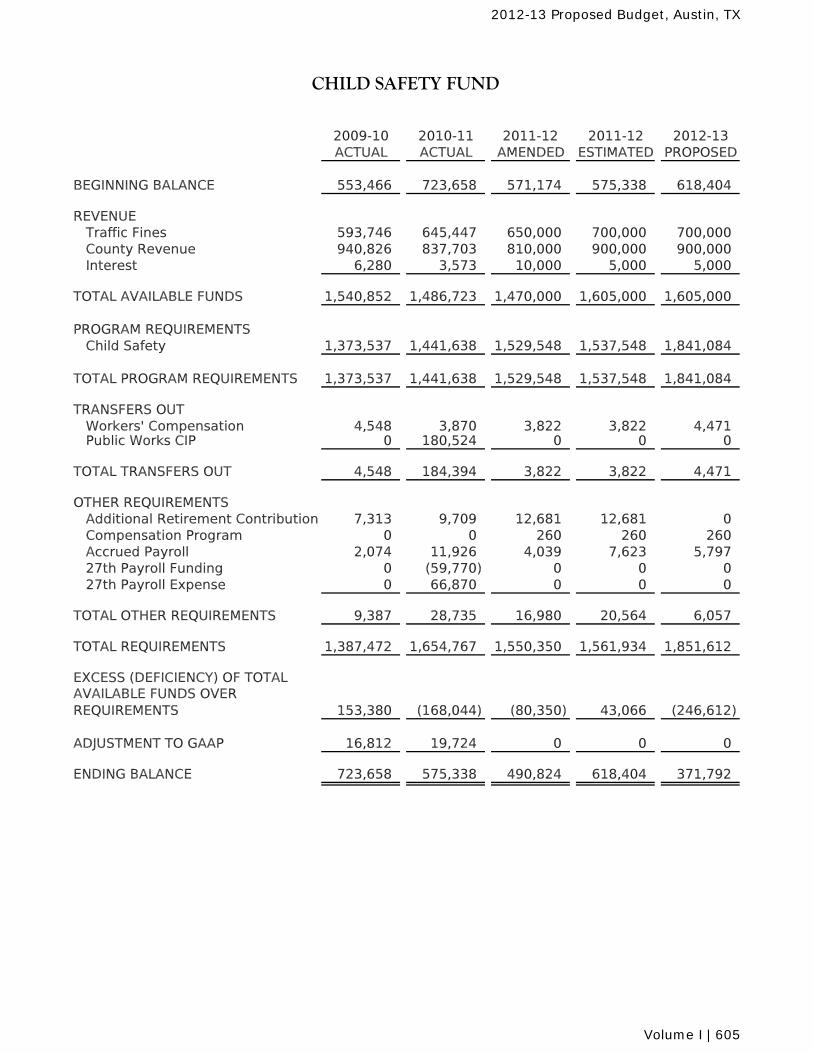
2009-10 2010-11 2011-12 2011-12 2012-13ACTUAL ACTUAL AMENDED ESTIMATED PROPOSED
BEGINNING BALANCE 553,466 723,658 571,174 575,338 618,404
REVENUE Traffic Fines 593,746 645,447 650,000 700,000 700,000 County Revenue 940,826 837,703 810,000 900,000 900,000 Interest 6,280 3,573 10,000 5,000 5,000
TOTAL AVAILABLE FUNDS 1,540,852 1,486,723 1,470,000 1,605,000 1,605,000
PROGRAM REQUIREMENTS Child Safety 1,373,537 1,441,638 1,529,548 1,537,548 1,841,084
TOTAL PROGRAM REQUIREMENTS 1,373,537 1,441,638 1,529,548 1,537,548 1,841,084
TRANSFERS OUT Workers' Compensation 4,548 3,870 3,822 3,822 4,471 Public Works CIP 0 180,524 0 0 0
TOTAL TRANSFERS OUT 4,548 184,394 3,822 3,822 4,471
OTHER REQUIREMENTS Additional Retirement Contribution 7,313 9,709 12,681 12,681 0 Compensation Program 0 0 260 260 260 Accrued Payroll 2,074 11,926 4,039 7,623 5,797 27th Payroll Funding 0 (59,770) 0 0 0 27th Payroll Expense 0 66,870 0 0 0
TOTAL OTHER REQUIREMENTS 9,387 28,735 16,980 20,564 6,057
TOTAL REQUIREMENTS 1,387,472 1,654,767 1,550,350 1,561,934 1,851,612
EXCESS (DEFICIENCY) OF TOTALAVAILABLE FUNDS OVER REQUIREMENTS 153,380 (168,044) (80,350) 43,066 (246,612)
ADJUSTMENT TO GAAP 16,812 19,724 0 0 0
ENDING BALANCE 723,658 575,338 490,824 618,404 371,792
CHILD SAFETY FUND
2012-13 Proposed Budget, Austin, TX
Volume I | 605
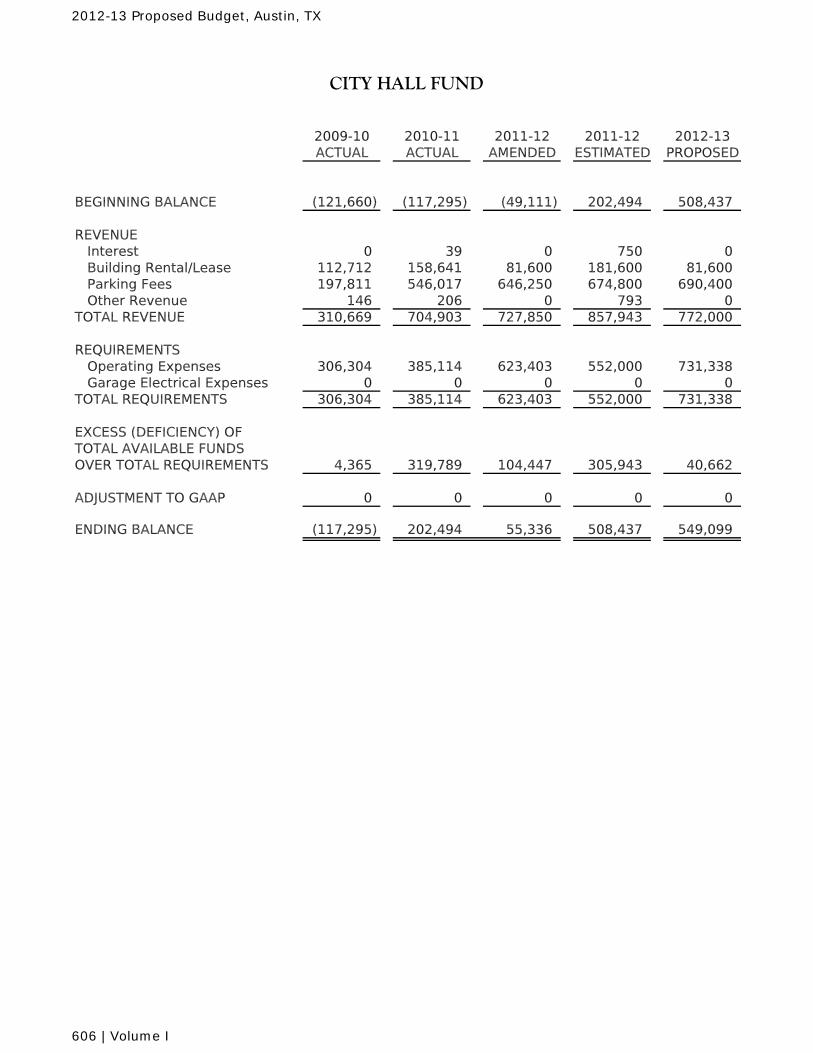
2009-10 2010-11 2011-12 2011-12 2012-13ACTUAL ACTUAL AMENDED ESTIMATED PROPOSED
BEGINNING BALANCE (121,660) (117,295) (49,111) 202,494 508,437
REVENUEInterest 0 39 0 750 0Building Rental/Lease 112,712 158,641 81,600 181,600 81,600Parking Fees 197,811 546,017 646,250 674,800 690,400Other Revenue 146 206 0 793 0
TOTAL REVENUE 310,669 704,903 727,850 857,943 772,000
REQUIREMENTSOperating Expenses 306,304 385,114 623,403 552,000 731,338Garage Electrical Expenses 0 0 0 0 0
TOTAL REQUIREMENTS 306,304 385,114 623,403 552,000 731,338
EXCESS (DEFICIENCY) OF TOTAL AVAILABLE FUNDS OVER TOTAL REQUIREMENTS 4,365 319,789 104,447 305,943 40,662
ADJUSTMENT TO GAAP 0 0 0 0 0
ENDING BALANCE (117,295) 202,494 55,336 508,437 549,099
CITY HALL FUND
2012-13 Proposed Budget, Austin, TX
606 | Volume I
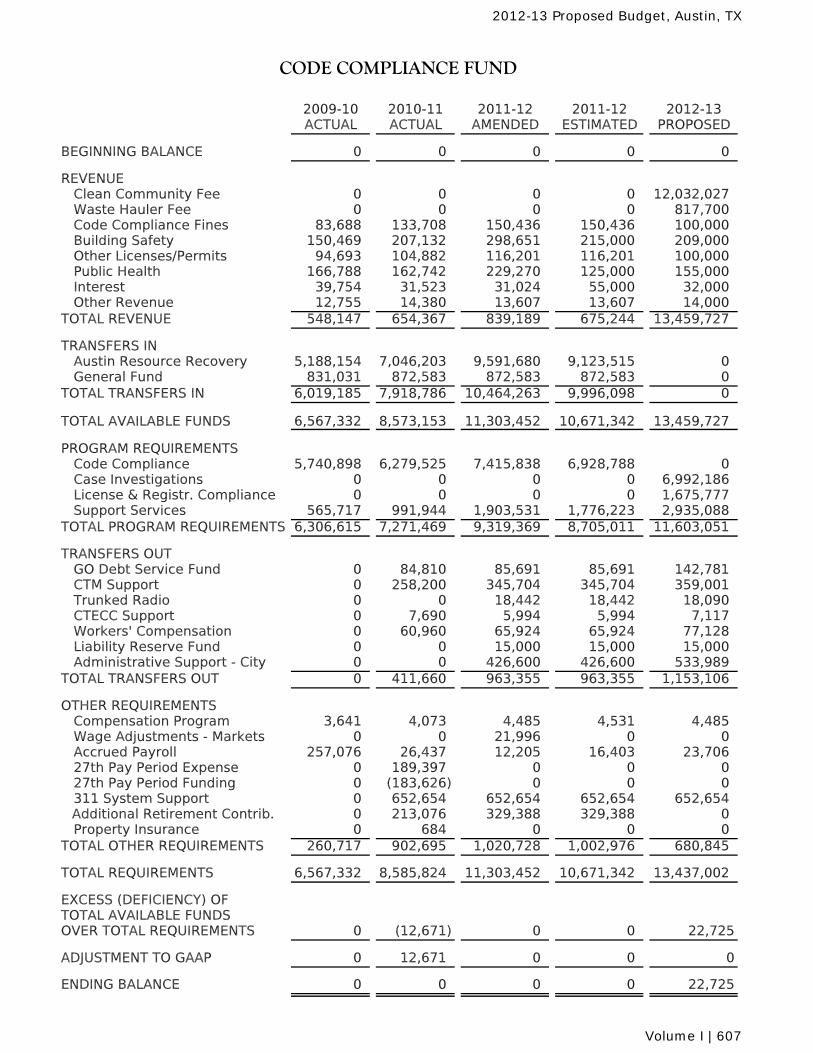
2009-10 2010-11 2011-12 2011-12 2012-13ACTUAL ACTUAL AMENDED ESTIMATED PROPOSED
BEGINNING BALANCE 0 0 0 0 0
REVENUE Clean Community Fee 0 0 0 0 12,032,027 Waste Hauler Fee 0 0 0 0 817,700 Code Compliance Fines 83,688 133,708 150,436 150,436 100,000 Building Safety 150,469 207,132 298,651 215,000 209,000 Other Licenses/Permits 94,693 104,882 116,201 116,201 100,000 Public Health 166,788 162,742 229,270 125,000 155,000 Interest 39,754 31,523 31,024 55,000 32,000 Other Revenue 12,755 14,380 13,607 13,607 14,000TOTAL REVENUE 548,147 654,367 839,189 675,244 13,459,727
TRANSFERS IN Austin Resource Recovery 5,188,154 7,046,203 9,591,680 9,123,515 0 General Fund 831,031 872,583 872,583 872,583 0TOTAL TRANSFERS IN 6,019,185 7,918,786 10,464,263 9,996,098 0
TOTAL AVAILABLE FUNDS 6,567,332 8,573,153 11,303,452 10,671,342 13,459,727
PROGRAM REQUIREMENTS Code Compliance 5,740,898 6,279,525 7,415,838 6,928,788 0 Case Investigations 0 0 0 0 6,992,186 License & Registr. Compliance 0 0 0 0 1,675,777 Support Services 565,717 991,944 1,903,531 1,776,223 2,935,088TOTAL PROGRAM REQUIREMENTS 6,306,615 7,271,469 9,319,369 8,705,011 11,603,051
TRANSFERS OUT GO Debt Service Fund 0 84,810 85,691 85,691 142,781 CTM Support 0 258,200 345,704 345,704 359,001 Trunked Radio 0 0 18,442 18,442 18,090 CTECC Support 0 7,690 5,994 5,994 7,117 Workers' Compensation 0 60,960 65,924 65,924 77,128 Liability Reserve Fund 0 0 15,000 15,000 15,000 Administrative Support - City 0 0 426,600 426,600 533,989TOTAL TRANSFERS OUT 0 411,660 963,355 963,355 1,153,106
OTHER REQUIREMENTS Compensation Program 3,641 4,073 4,485 4,531 4,485 Wage Adjustments - Markets 0 0 21,996 0 0 Accrued Payroll 257,076 26,437 12,205 16,403 23,706 27th Pay Period Expense 0 189,397 0 0 0 27th Pay Period Funding 0 (183,626) 0 0 0 311 System Support 0 652,654 652,654 652,654 652,654
Additional Retirement Contrib. 0 213,076 329,388 329,388 0 Property Insurance 0 684 0 0 0TOTAL OTHER REQUIREMENTS 260,717 902,695 1,020,728 1,002,976 680,845
TOTAL REQUIREMENTS 6,567,332 8,585,824 11,303,452 10,671,342 13,437,002 EXCESS (DEFICIENCY) OF TOTAL AVAILABLE FUNDS OVER TOTAL REQUIREMENTS 0 (12,671) 0 0 22,725
ADJUSTMENT TO GAAP 0 12,671 0 0 0
ENDING BALANCE 0 0 0 0 22,725
CODE COMPLIANCE FUND
2012-13 Proposed Budget, Austin, TX
Volume I | 607
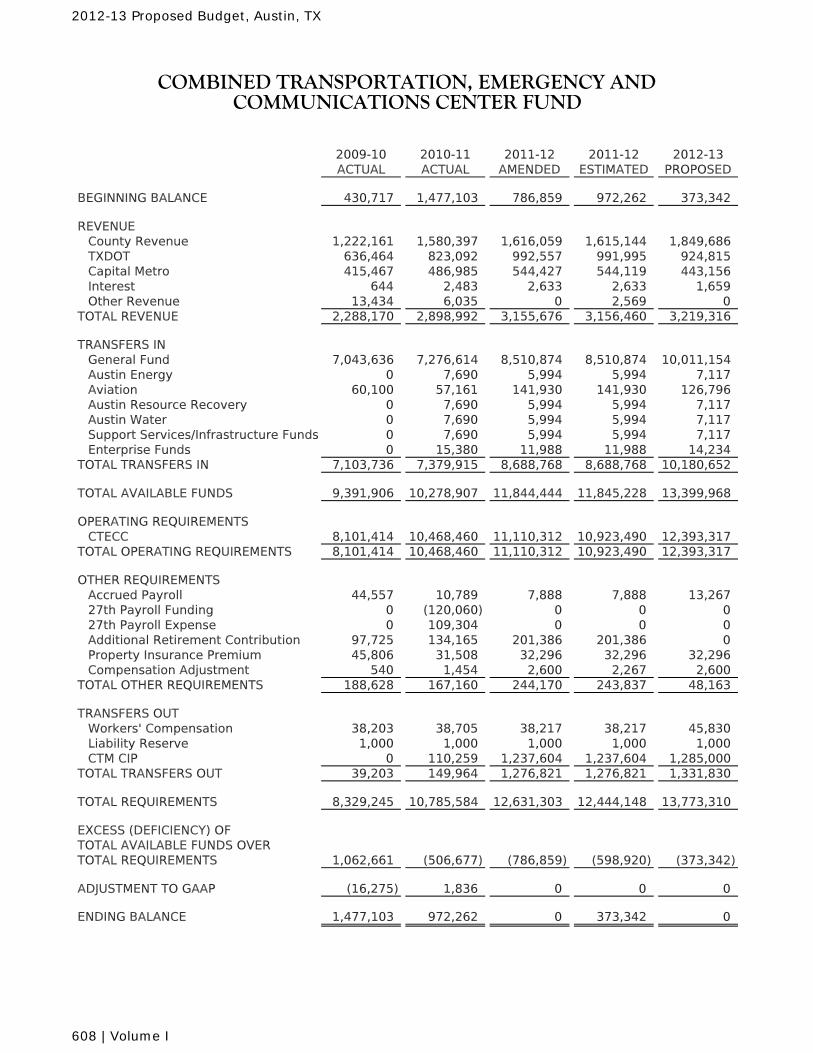
2009-10 ACTUAL
2010-11 ACTUAL
2011-12 AMENDED
2011-12 ESTIMATED
2012-13 PROPOSED
BEGINNING BALANCE 430,717 1,477,103 786,859 972,262 373,342
REVENUECounty Revenue 1,222,161 1,580,397 1,616,059 1,615,144 1,849,686TXDOT 636,464 823,092 992,557 991,995 924,815Capital Metro 415,467 486,985 544,427 544,119 443,156Interest 644 2,483 2,633 2,633 1,659Other Revenue 13,434 6,035 0 2,569 0
TOTAL REVENUE 2,288,170 2,898,992 3,155,676 3,156,460 3,219,316
TRANSFERS INGeneral Fund 7,043,636 7,276,614 8,510,874 8,510,874 10,011,154Austin Energy 0 7,690 5,994 5,994 7,117Aviation 60,100 57,161 141,930 141,930 126,796Austin Resource Recovery 0 7,690 5,994 5,994 7,117Austin Water 0 7,690 5,994 5,994 7,117Support Services/Infrastructure Funds 0 7,690 5,994 5,994 7,117Enterprise Funds 0 15,380 11,988 11,988 14,234
TOTAL TRANSFERS IN 7,103,736 7,379,915 8,688,768 8,688,768 10,180,652
TOTAL AVAILABLE FUNDS 9,391,906 10,278,907 11,844,444 11,845,228 13,399,968
OPERATING REQUIREMENTSCTECC 8,101,414 10,468,460 11,110,312 10,923,490 12,393,317
TOTAL OPERATING REQUIREMENTS 8,101,414 10,468,460 11,110,312 10,923,490 12,393,317
OTHER REQUIREMENTSAccrued Payroll 44,557 10,789 7,888 7,888 13,26727th Payroll Funding 0 (120,060) 0 0 027th Payroll Expense 0 109,304 0 0 0Additional Retirement Contribution 97,725 134,165 201,386 201,386 0Property Insurance Premium 45,806 31,508 32,296 32,296 32,296Compensation Adjustment 540 1,454 2,600 2,267 2,600
TOTAL OTHER REQUIREMENTS 188,628 167,160 244,170 243,837 48,163
TRANSFERS OUTWorkers' Compensation 38,203 38,705 38,217 38,217 45,830Liability Reserve 1,000 1,000 1,000 1,000 1,000CTM CIP 0 110,259 1,237,604 1,237,604 1,285,000
TOTAL TRANSFERS OUT 39,203 149,964 1,276,821 1,276,821 1,331,830
TOTAL REQUIREMENTS 8,329,245 10,785,584 12,631,303 12,444,148 13,773,310
EXCESS (DEFICIENCY) OFTOTAL AVAILABLE FUNDS OVERTOTAL REQUIREMENTS 1,062,661 (506,677) (786,859) (598,920) (373,342)
ADJUSTMENT TO GAAP (16,275) 1,836 0 0 0
ENDING BALANCE 1,477,103 972,262 0 373,342 0
COMBINED TRANSPORTATION, EMERGENCY AND COMMUNICATIONS CENTER FUND
2012-13 Proposed Budget, Austin, TX
608 | Volume I
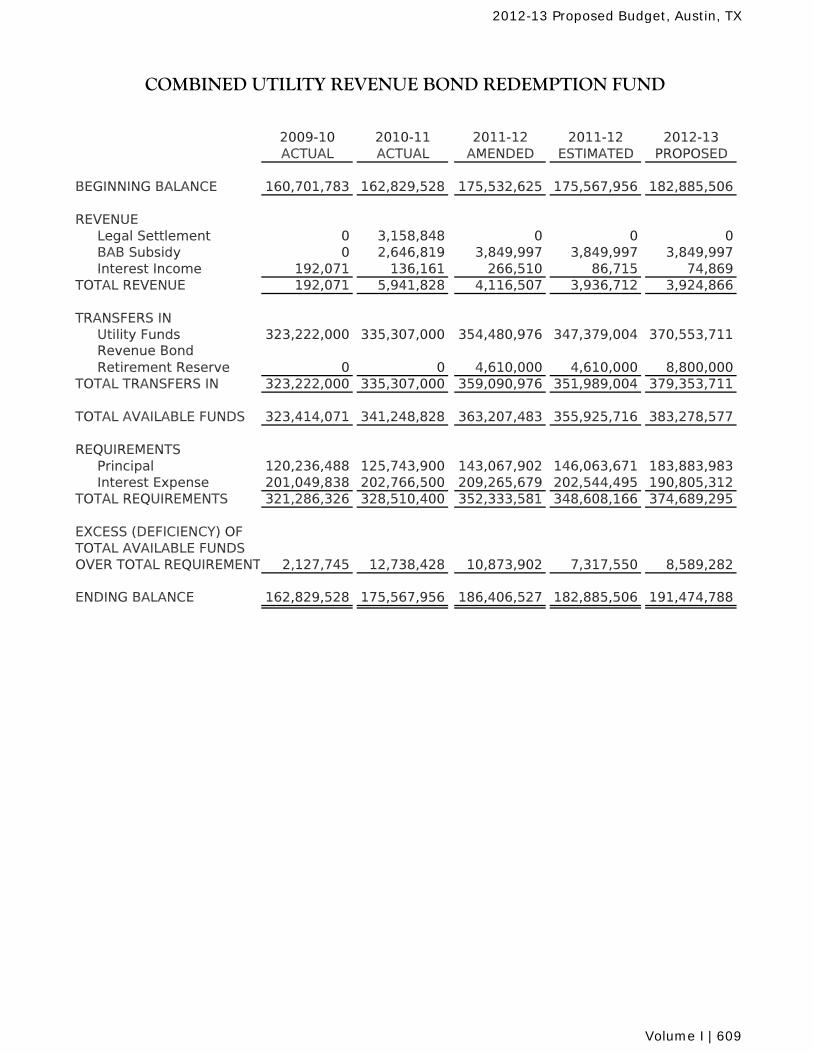
2009-10 2010-11 2011-12 2011-12 2012-13ACTUAL ACTUAL AMENDED ESTIMATED PROPOSED
BEGINNING BALANCE 160,701,783 162,829,528 175,532,625 175,567,956 182,885,506
REVENUELegal Settlement 0 3,158,848 0 0 0BAB Subsidy 0 2,646,819 3,849,997 3,849,997 3,849,997Interest Income 192,071 136,161 266,510 86,715 74,869
TOTAL REVENUE 192,071 5,941,828 4,116,507 3,936,712 3,924,866
TRANSFERS INUtility Funds 323,222,000 335,307,000 354,480,976 347,379,004 370,553,711Revenue Bond Retirement Reserve 0 0 4,610,000 4,610,000 8,800,000
TOTAL TRANSFERS IN 323,222,000 335,307,000 359,090,976 351,989,004 379,353,711
TOTAL AVAILABLE FUNDS 323,414,071 341,248,828 363,207,483 355,925,716 383,278,577
REQUIREMENTSPrincipal 120,236,488 125,743,900 143,067,902 146,063,671 183,883,983Interest Expense 201,049,838 202,766,500 209,265,679 202,544,495 190,805,312
TOTAL REQUIREMENTS 321,286,326 328,510,400 352,333,581 348,608,166 374,689,295
EXCESS (DEFICIENCY) OF TOTAL AVAILABLE FUNDSOVER TOTAL REQUIREMENT 2,127,745 12,738,428 10,873,902 7,317,550 8,589,282
ENDING BALANCE 162,829,528 175,567,956 186,406,527 182,885,506 191,474,788
COMBINED UTILITY REVENUE BOND REDEMPTION FUND
2012-13 Proposed Budget, Austin, TX
Volume I | 609
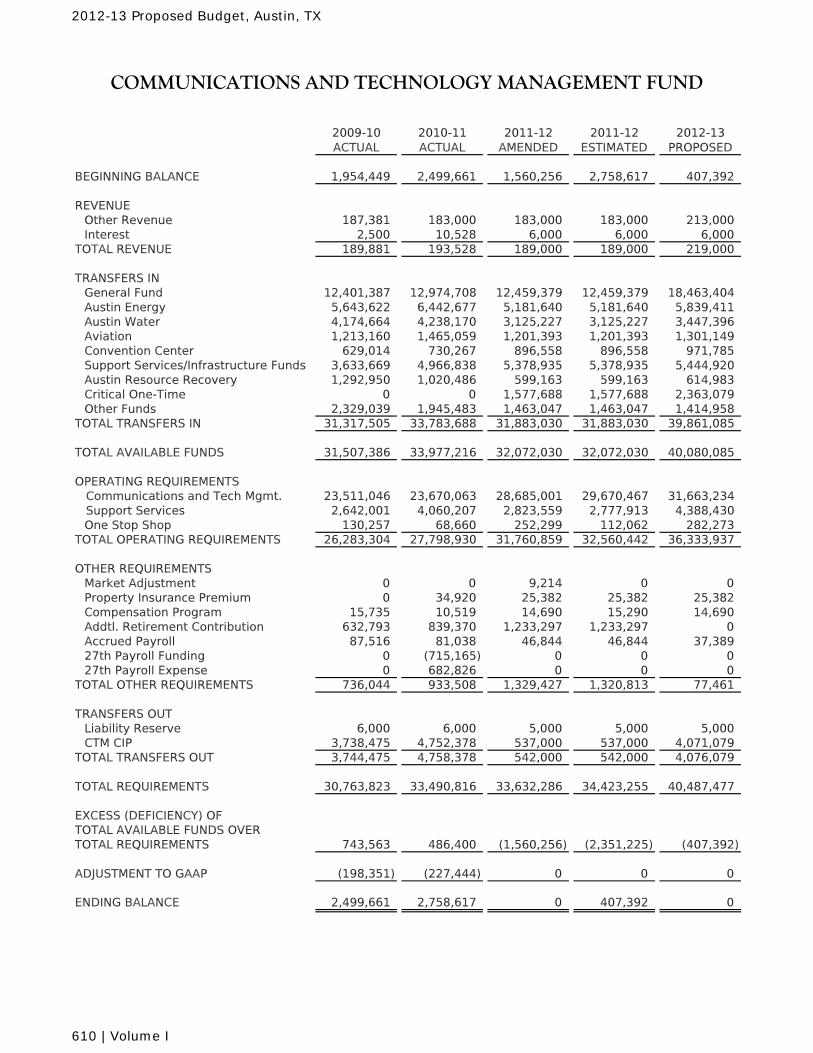
2009-10 ACTUAL
2010-11 ACTUAL
2011-12 AMENDED
2011-12 ESTIMATED
2012-13 PROPOSED
BEGINNING BALANCE 1,954,449 2,499,661 1,560,256 2,758,617 407,392
REVENUEOther Revenue 187,381 183,000 183,000 183,000 213,000Interest 2,500 10,528 6,000 6,000 6,000
TOTAL REVENUE 189,881 193,528 189,000 189,000 219,000
TRANSFERS INGeneral Fund 12,401,387 12,974,708 12,459,379 12,459,379 18,463,404Austin Energy 5,643,622 6,442,677 5,181,640 5,181,640 5,839,411Austin Water 4,174,664 4,238,170 3,125,227 3,125,227 3,447,396Aviation 1,213,160 1,465,059 1,201,393 1,201,393 1,301,149Convention Center 629,014 730,267 896,558 896,558 971,785Support Services/Infrastructure Funds 3,633,669 4,966,838 5,378,935 5,378,935 5,444,920Austin Resource Recovery 1,292,950 1,020,486 599,163 599,163 614,983Critical One-Time 0 0 1,577,688 1,577,688 2,363,079Other Funds 2,329,039 1,945,483 1,463,047 1,463,047 1,414,958
TOTAL TRANSFERS IN 31,317,505 33,783,688 31,883,030 31,883,030 39,861,085
TOTAL AVAILABLE FUNDS 31,507,386 33,977,216 32,072,030 32,072,030 40,080,085
OPERATING REQUIREMENTS Communications and Tech Mgmt. 23,511,046 23,670,063 28,685,001 29,670,467 31,663,234 Support Services 2,642,001 4,060,207 2,823,559 2,777,913 4,388,430
One Stop Shop 130,257 68,660 252,299 112,062 282,273TOTAL OPERATING REQUIREMENTS 26,283,304 27,798,930 31,760,859 32,560,442 36,333,937
OTHER REQUIREMENTSMarket Adjustment 0 0 9,214 0 0Property Insurance Premium 0 34,920 25,382 25,382 25,382Compensation Program 15,735 10,519 14,690 15,290 14,690Addtl. Retirement Contribution 632,793 839,370 1,233,297 1,233,297 0Accrued Payroll 87,516 81,038 46,844 46,844 37,38927th Payroll Funding 0 (715,165) 0 0 027th Payroll Expense 0 682,826 0 0 0
TOTAL OTHER REQUIREMENTS 736,044 933,508 1,329,427 1,320,813 77,461
TRANSFERS OUTLiability Reserve 6,000 6,000 5,000 5,000 5,000CTM CIP 3,738,475 4,752,378 537,000 537,000 4,071,079
TOTAL TRANSFERS OUT 3,744,475 4,758,378 542,000 542,000 4,076,079
TOTAL REQUIREMENTS 30,763,823 33,490,816 33,632,286 34,423,255 40,487,477
EXCESS (DEFICIENCY) OFTOTAL AVAILABLE FUNDS OVERTOTAL REQUIREMENTS 743,563 486,400 (1,560,256) (2,351,225) (407,392)
ADJUSTMENT TO GAAP (198,351) (227,444) 0 0 0
ENDING BALANCE 2,499,661 2,758,617 0 407,392 0
COMMUNICATIONS AND TECHNOLOGY MANAGEMENT FUND
2012-13 Proposed Budget, Austin, TX
610 | Volume I
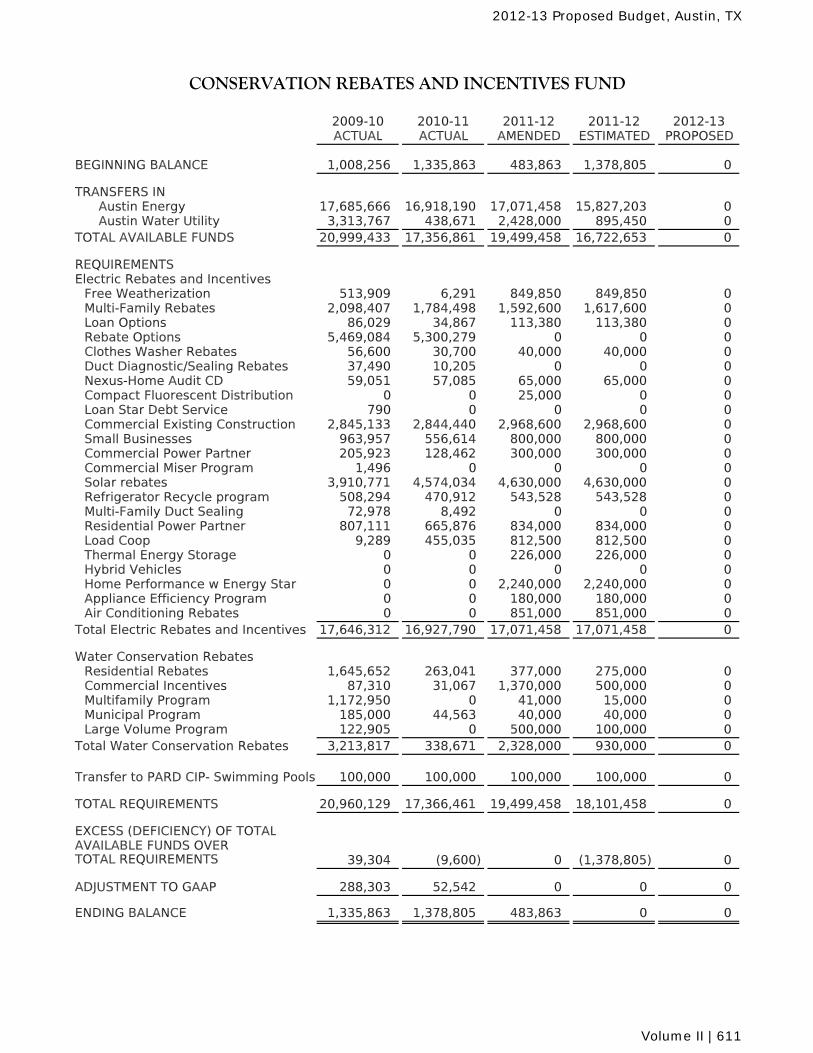
2009-10 2010-11 2011-12 2011-12 2012-13ACTUAL ACTUAL AMENDED ESTIMATED PROPOSED
BEGINNING BALANCE 1,008,256 1,335,863 483,863 1,378,805 0
TRANSFERS IN Austin Energy 17,685,666 16,918,190 17,071,458 15,827,203 0 Austin Water Utility 3,313,767 438,671 2,428,000 895,450 0TOTAL AVAILABLE FUNDS 20,999,433 17,356,861 19,499,458 16,722,653 0
REQUIREMENTSElectric Rebates and Incentives
Free Weatherization 513,909 6,291 849,850 849,850 0Multi-Family Rebates 2,098,407 1,784,498 1,592,600 1,617,600 0Loan Options 86,029 34,867 113,380 113,380 0Rebate Options 5,469,084 5,300,279 0 0 0Clothes Washer Rebates 56,600 30,700 40,000 40,000 0Duct Diagnostic/Sealing Rebates 37,490 10,205 0 0 0Nexus-Home Audit CD 59,051 57,085 65,000 65,000 0Compact Fluorescent Distribution 0 0 25,000 0 0Loan Star Debt Service 790 0 0 0 0Commercial Existing Construction 2,845,133 2,844,440 2,968,600 2,968,600 0Small Businesses 963,957 556,614 800,000 800,000 0Commercial Power Partner 205,923 128,462 300,000 300,000 0Commercial Miser Program 1,496 0 0 0 0Solar rebates 3,910,771 4,574,034 4,630,000 4,630,000 0Refrigerator Recycle program 508,294 470,912 543,528 543,528 0Multi-Family Duct Sealing 72,978 8,492 0 0 0Residential Power Partner 807,111 665,876 834,000 834,000 0Load Coop 9,289 455,035 812,500 812,500 0Thermal Energy Storage 0 0 226,000 226,000 0Hybrid Vehicles 0 0 0 0 0Home Performance w Energy Star 0 0 2,240,000 2,240,000 0Appliance Efficiency Program 0 0 180,000 180,000 0Air Conditioning Rebates 0 0 851,000 851,000 0
Total Electric Rebates and Incentives 17,646,312 16,927,790 17,071,458 17,071,458 0
Water Conservation RebatesResidential Rebates 1,645,652 263,041 377,000 275,000 0Commercial Incentives 87,310 31,067 1,370,000 500,000 0Multifamily Program 1,172,950 0 41,000 15,000 0Municipal Program 185,000 44,563 40,000 40,000 0Large Volume Program 122,905 0 500,000 100,000 0
Total Water Conservation Rebates 3,213,817 338,671 2,328,000 930,000 0
Transfer to PARD CIP- Swimming Pools 100,000 100,000 100,000 100,000 0
TOTAL REQUIREMENTS 20,960,129 17,366,461 19,499,458 18,101,458 0
EXCESS (DEFICIENCY) OF TOTALAVAILABLE FUNDS OVER TOTAL REQUIREMENTS 39,304 (9,600) 0 (1,378,805) 0
ADJUSTMENT TO GAAP 288,303 52,542 0 0 0
ENDING BALANCE 1,335,863 1,378,805 483,863 0 0
CONSERVATION REBATES AND INCENTIVES FUND
2012-13 Proposed Budget, Austin, TX
Volume II | 611
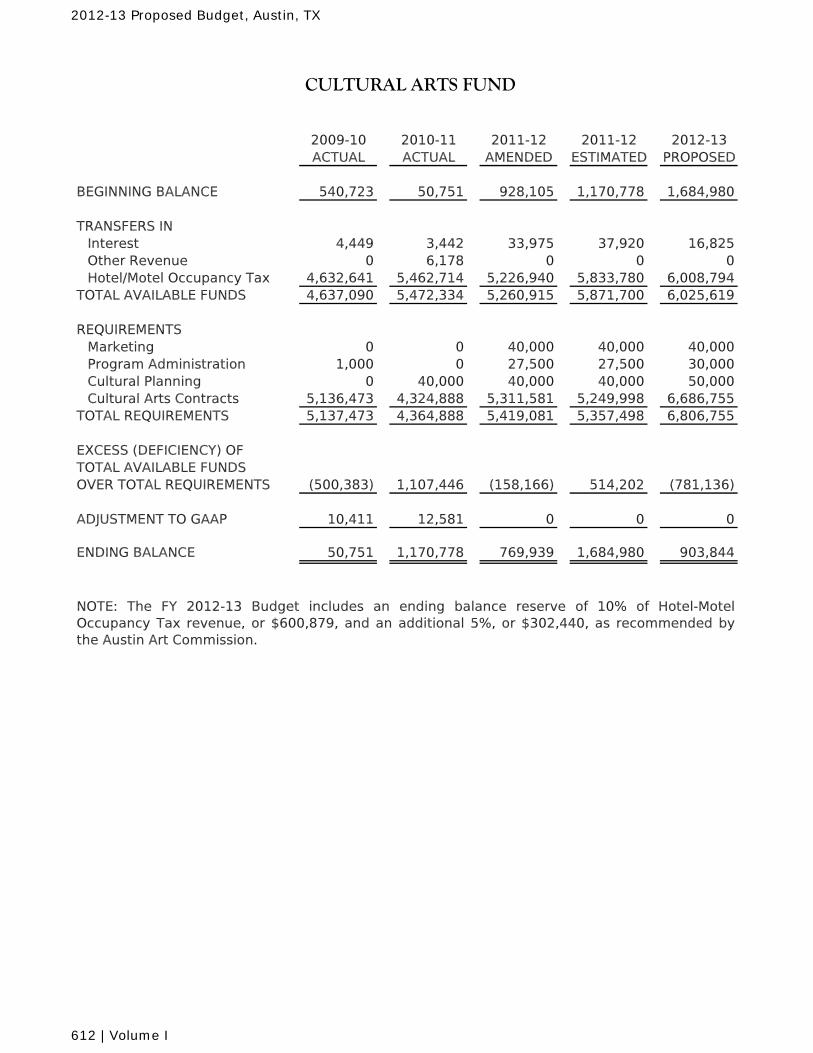
2009-10 2010-11 2011-12 2011-12 2012-13ACTUAL ACTUAL AMENDED ESTIMATED PROPOSED
BEGINNING BALANCE 540,723 50,751 928,105 1,170,778 1,684,980
TRANSFERS INInterest 4,449 3,442 33,975 37,920 16,825Other Revenue 0 6,178 0 0 0Hotel/Motel Occupancy Tax 4,632,641 5,462,714 5,226,940 5,833,780 6,008,794
TOTAL AVAILABLE FUNDS 4,637,090 5,472,334 5,260,915 5,871,700 6,025,619
REQUIREMENTS Marketing 0 0 40,000 40,000 40,000Program Administration 1,000 0 27,500 27,500 30,000Cultural Planning 0 40,000 40,000 40,000 50,000Cultural Arts Contracts 5,136,473 4,324,888 5,311,581 5,249,998 6,686,755
TOTAL REQUIREMENTS 5,137,473 4,364,888 5,419,081 5,357,498 6,806,755
EXCESS (DEFICIENCY) OF TOTAL AVAILABLE FUNDS OVER TOTAL REQUIREMENTS (500,383) 1,107,446 (158,166) 514,202 (781,136)
ADJUSTMENT TO GAAP 10,411 12,581 0 0 0
ENDING BALANCE 50,751 1,170,778 769,939 1,684,980 903,844
CULTURAL ARTS FUND
NOTE: The FY 2012-13 Budget includes an ending balance reserve of 10% of Hotel-MotelOccupancy Tax revenue, or $600,879, and an additional 5%, or $302,440, as recommended bythe Austin Art Commission.
2012-13 Proposed Budget, Austin, TX
612 | Volume I
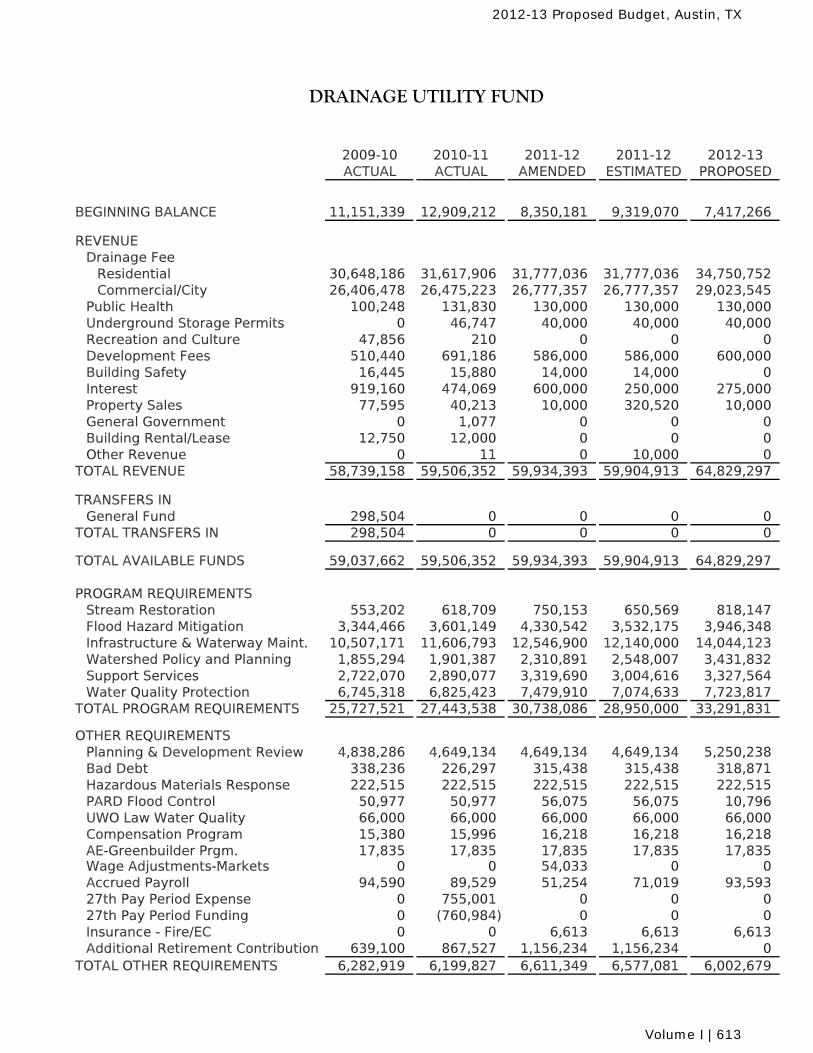
DRAINAGE UTILITY FUND
2009-10 2010-11 2011-12 2011-12 2012-13ACTUAL ACTUAL AMENDED ESTIMATED PROPOSED
BEGINNING BALANCE 11,151,339 12,909,212 8,350,181 9,319,070 7,417,266
REVENUEDrainage Fee
Residential 30,648,186 31,617,906 31,777,036 31,777,036 34,750,752Commercial/City 26,406,478 26,475,223 26,777,357 26,777,357 29,023,545
Public Health 100,248 131,830 130,000 130,000 130,000Underground Storage Permits 0 46,747 40,000 40,000 40,000Recreation and Culture 47,856 210 0 0 0Development Fees 510,440 691,186 586,000 586,000 600,000Building Safety 16,445 15,880 14,000 14,000 0Interest 919,160 474,069 600,000 250,000 275,000Property Sales 77,595 40,213 10,000 320,520 10,000General Government 0 1,077 0 0 0Building Rental/Lease 12,750 12,000 0 0 0Other Revenue 0 11 0 10,000 0
TOTAL REVENUE 58,739,158 59,506,352 59,934,393 59,904,913 64,829,297
TRANSFERS INGeneral Fund 298,504 0 0 0 0
TOTAL TRANSFERS IN 298,504 0 0 0 0
TOTAL AVAILABLE FUNDS 59,037,662 59,506,352 59,934,393 59,904,913 64,829,297
PROGRAM REQUIREMENTSStream Restoration 553,202 618,709 750,153 650,569 818,147Flood Hazard Mitigation 3,344,466 3,601,149 4,330,542 3,532,175 3,946,348Infrastructure & Waterway Maint. 10,507,171 11,606,793 12,546,900 12,140,000 14,044,123Watershed Policy and Planning 1,855,294 1,901,387 2,310,891 2,548,007 3,431,832Support Services 2,722,070 2,890,077 3,319,690 3,004,616 3,327,564Water Quality Protection 6,745,318 6,825,423 7,479,910 7,074,633 7,723,817
TOTAL PROGRAM REQUIREMENTS 25,727,521 27,443,538 30,738,086 28,950,000 33,291,831
OTHER REQUIREMENTSPlanning & Development Review 4,838,286 4,649,134 4,649,134 4,649,134 5,250,238Bad Debt 338,236 226,297 315,438 315,438 318,871Hazardous Materials Response 222,515 222,515 222,515 222,515 222,515PARD Flood Control 50,977 50,977 56,075 56,075 10,796UWO Law Water Quality 66,000 66,000 66,000 66,000 66,000Compensation Program 15,380 15,996 16,218 16,218 16,218AE-Greenbuilder Prgm. 17,835 17,835 17,835 17,835 17,835Wage Adjustments-Markets 0 0 54,033 0 0Accrued Payroll 94,590 89,529 51,254 71,019 93,59327th Pay Period Expense 0 755,001 0 0 027th Pay Period Funding 0 (760,984) 0 0 0Insurance - Fire/EC 0 0 6,613 6,613 6,613Additional Retirement Contribution 639,100 867,527 1,156,234 1,156,234 0
TOTAL OTHER REQUIREMENTS 6,282,919 6,199,827 6,611,349 6,577,081 6,002,679
2012-13 Proposed Budget, Austin, TX
Volume I | 613
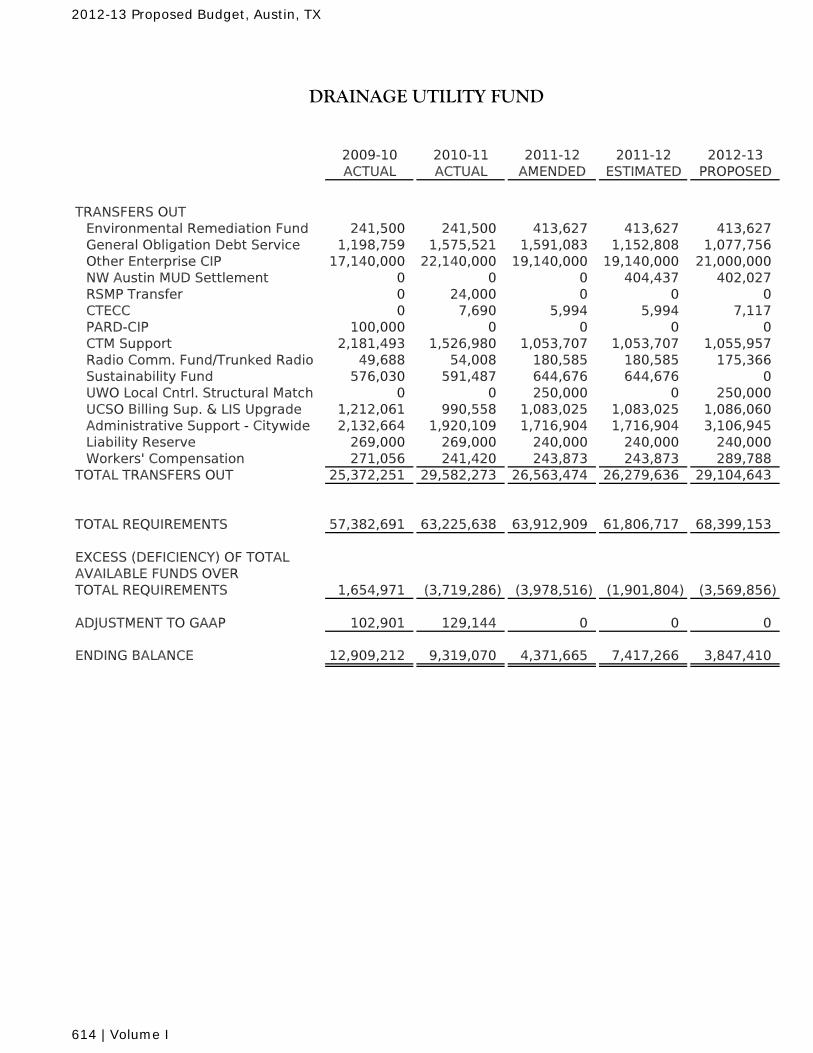
DRAINAGE UTILITY FUND
2009-10 2010-11 2011-12 2011-12 2012-13ACTUAL ACTUAL AMENDED ESTIMATED PROPOSED
TRANSFERS OUTEnvironmental Remediation Fund 241,500 241,500 413,627 413,627 413,627General Obligation Debt Service 1,198,759 1,575,521 1,591,083 1,152,808 1,077,756Other Enterprise CIP 17,140,000 22,140,000 19,140,000 19,140,000 21,000,000NW Austin MUD Settlement 0 0 0 404,437 402,027RSMP Transfer 0 24,000 0 0 0CTECC 0 7,690 5,994 5,994 7,117PARD-CIP 100,000 0 0 0 0CTM Support 2,181,493 1,526,980 1,053,707 1,053,707 1,055,957Radio Comm. Fund/Trunked Radio 49,688 54,008 180,585 180,585 175,366Sustainability Fund 576,030 591,487 644,676 644,676 0UWO Local Cntrl. Structural Match 0 0 250,000 0 250,000UCSO Billing Sup. & LIS Upgrade 1,212,061 990,558 1,083,025 1,083,025 1,086,060Administrative Support - Citywide 2,132,664 1,920,109 1,716,904 1,716,904 3,106,945Liability Reserve 269,000 269,000 240,000 240,000 240,000Workers' Compensation 271,056 241,420 243,873 243,873 289,788
TOTAL TRANSFERS OUT 25,372,251 29,582,273 26,563,474 26,279,636 29,104,643
TOTAL REQUIREMENTS 57,382,691 63,225,638 63,912,909 61,806,717 68,399,153
EXCESS (DEFICIENCY) OF TOTALAVAILABLE FUNDS OVER TOTAL REQUIREMENTS 1,654,971 (3,719,286) (3,978,516) (1,901,804) (3,569,856)
ADJUSTMENT TO GAAP 102,901 129,144 0 0 0
ENDING BALANCE 12,909,212 9,319,070 4,371,665 7,417,266 3,847,410
2012-13 Proposed Budget, Austin, TX
614 | Volume I
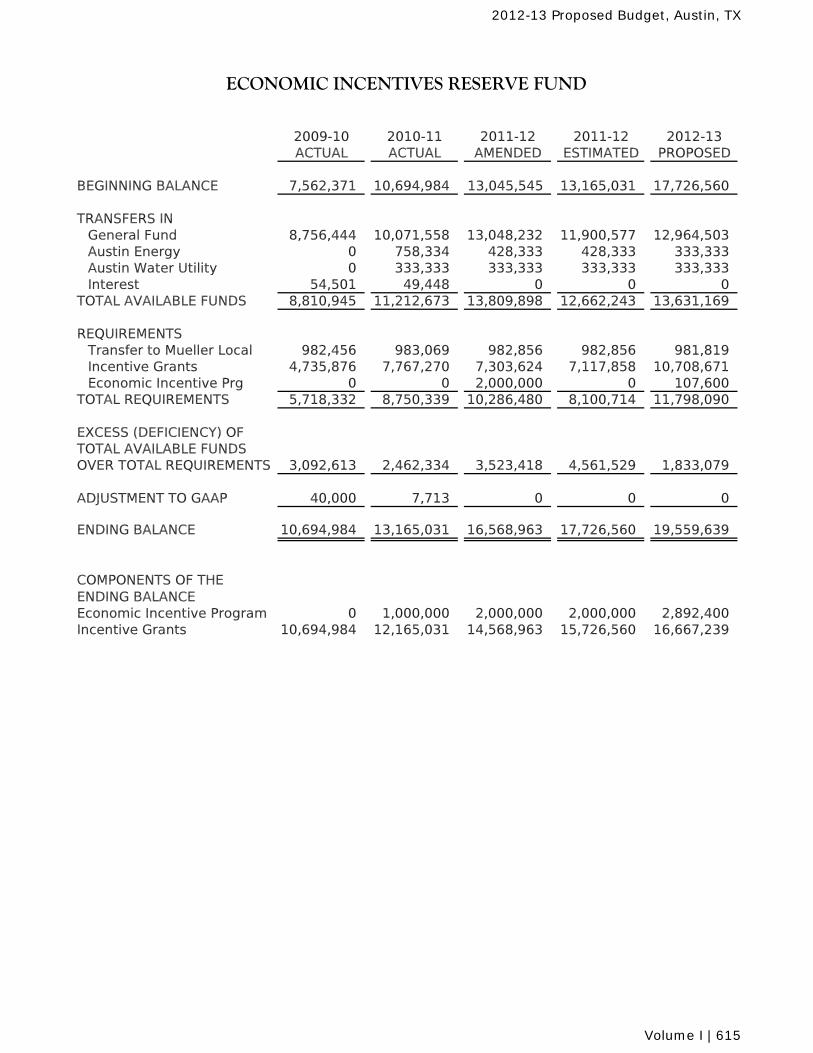
2009-10 2010-11 2011-12 2011-12 2012-13ACTUAL ACTUAL AMENDED ESTIMATED PROPOSED
BEGINNING BALANCE 7,562,371 10,694,984 13,045,545 13,165,031 17,726,560
TRANSFERS INGeneral Fund 8,756,444 10,071,558 13,048,232 11,900,577 12,964,503Austin Energy 0 758,334 428,333 428,333 333,333Austin Water Utility 0 333,333 333,333 333,333 333,333Interest 54,501 49,448 0 0 0
TOTAL AVAILABLE FUNDS 8,810,945 11,212,673 13,809,898 12,662,243 13,631,169
REQUIREMENTSTransfer to Mueller Local 982,456 983,069 982,856 982,856 981,819Incentive Grants 4,735,876 7,767,270 7,303,624 7,117,858 10,708,671Economic Incentive Prg 0 0 2,000,000 0 107,600
TOTAL REQUIREMENTS 5,718,332 8,750,339 10,286,480 8,100,714 11,798,090
EXCESS (DEFICIENCY) OF TOTAL AVAILABLE FUNDSOVER TOTAL REQUIREMENTS 3,092,613 2,462,334 3,523,418 4,561,529 1,833,079
ADJUSTMENT TO GAAP 40,000 7,713 0 0 0
ENDING BALANCE 10,694,984 13,165,031 16,568,963 17,726,560 19,559,639
COMPONENTS OF THE ENDING BALANCEEconomic Incentive Program 0 1,000,000 2,000,000 2,000,000 2,892,400Incentive Grants 10,694,984 12,165,031 14,568,963 15,726,560 16,667,239
ECONOMIC INCENTIVES RESERVE FUND
2012-13 Proposed Budget, Austin, TX
Volume I | 615
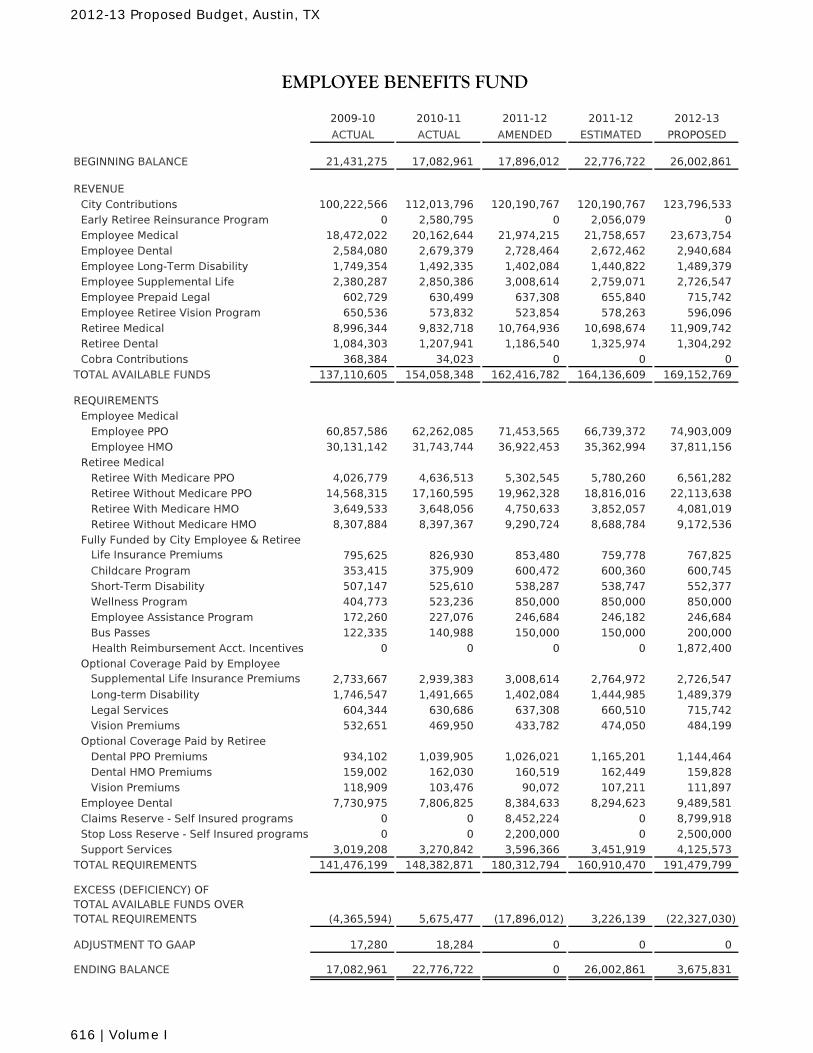
2009-10 2010-11 2011-12 2011-12 2012-13
ACTUAL ACTUAL AMENDED ESTIMATED PROPOSED
BEGINNING BALANCE 21,431,275 17,082,961 17,896,012 22,776,722 26,002,861
REVENUECity Contributions 100,222,566 112,013,796 120,190,767 120,190,767 123,796,533Early Retiree Reinsurance Program 0 2,580,795 0 2,056,079 0Employee Medical 18,472,022 20,162,644 21,974,215 21,758,657 23,673,754Employee Dental 2,584,080 2,679,379 2,728,464 2,672,462 2,940,684Employee Long-Term Disability 1,749,354 1,492,335 1,402,084 1,440,822 1,489,379Employee Supplemental Life 2,380,287 2,850,386 3,008,614 2,759,071 2,726,547Employee Prepaid Legal 602,729 630,499 637,308 655,840 715,742Employee Retiree Vision Program 650,536 573,832 523,854 578,263 596,096Retiree Medical 8,996,344 9,832,718 10,764,936 10,698,674 11,909,742Retiree Dental 1,084,303 1,207,941 1,186,540 1,325,974 1,304,292Cobra Contributions 368,384 34,023 0 0 0
TOTAL AVAILABLE FUNDS 137,110,605 154,058,348 162,416,782 164,136,609 169,152,769
REQUIREMENTSEmployee Medical Employee PPO 60,857,586 62,262,085 71,453,565 66,739,372 74,903,009 Employee HMO 30,131,142 31,743,744 36,922,453 35,362,994 37,811,156Retiree Medical Retiree With Medicare PPO 4,026,779 4,636,513 5,302,545 5,780,260 6,561,282 Retiree Without Medicare PPO 14,568,315 17,160,595 19,962,328 18,816,016 22,113,638 Retiree With Medicare HMO 3,649,533 3,648,056 4,750,633 3,852,057 4,081,019 Retiree Without Medicare HMO 8,307,884 8,397,367 9,290,724 8,688,784 9,172,536Fully Funded by City Employee & Retiree Life Insurance Premiums 795,625 826,930 853,480 759,778 767,825 Childcare Program 353,415 375,909 600,472 600,360 600,745 Short-Term Disability 507,147 525,610 538,287 538,747 552,377 Wellness Program 404,773 523,236 850,000 850,000 850,000 Employee Assistance Program 172,260 227,076 246,684 246,182 246,684 Bus Passes 122,335 140,988 150,000 150,000 200,000
Health Reimbursement Acct. Incentives 0 0 0 0 1,872,400Optional Coverage Paid by Employee Supplemental Life Insurance Premiums 2,733,667 2,939,383 3,008,614 2,764,972 2,726,547 Long-term Disability 1,746,547 1,491,665 1,402,084 1,444,985 1,489,379 Legal Services 604,344 630,686 637,308 660,510 715,742 Vision Premiums 532,651 469,950 433,782 474,050 484,199Optional Coverage Paid by Retiree Dental PPO Premiums 934,102 1,039,905 1,026,021 1,165,201 1,144,464 Dental HMO Premiums 159,002 162,030 160,519 162,449 159,828 Vision Premiums 118,909 103,476 90,072 107,211 111,897Employee Dental 7,730,975 7,806,825 8,384,633 8,294,623 9,489,581Claims Reserve - Self Insured programs 0 0 8,452,224 0 8,799,918Stop Loss Reserve - Self Insured programs 0 0 2,200,000 0 2,500,000Support Services 3,019,208 3,270,842 3,596,366 3,451,919 4,125,573
TOTAL REQUIREMENTS 141,476,199 148,382,871 180,312,794 160,910,470 191,479,799
EXCESS (DEFICIENCY) OF TOTAL AVAILABLE FUNDS OVER TOTAL REQUIREMENTS (4,365,594) 5,675,477 (17,896,012) 3,226,139 (22,327,030)
ADJUSTMENT TO GAAP 17,280 18,284 0 0 0
ENDING BALANCE 17,082,961 22,776,722 0 26,002,861 3,675,831
EMPLOYEE BENEFITS FUND
2012-13 Proposed Budget, Austin, TX
616 | Volume I
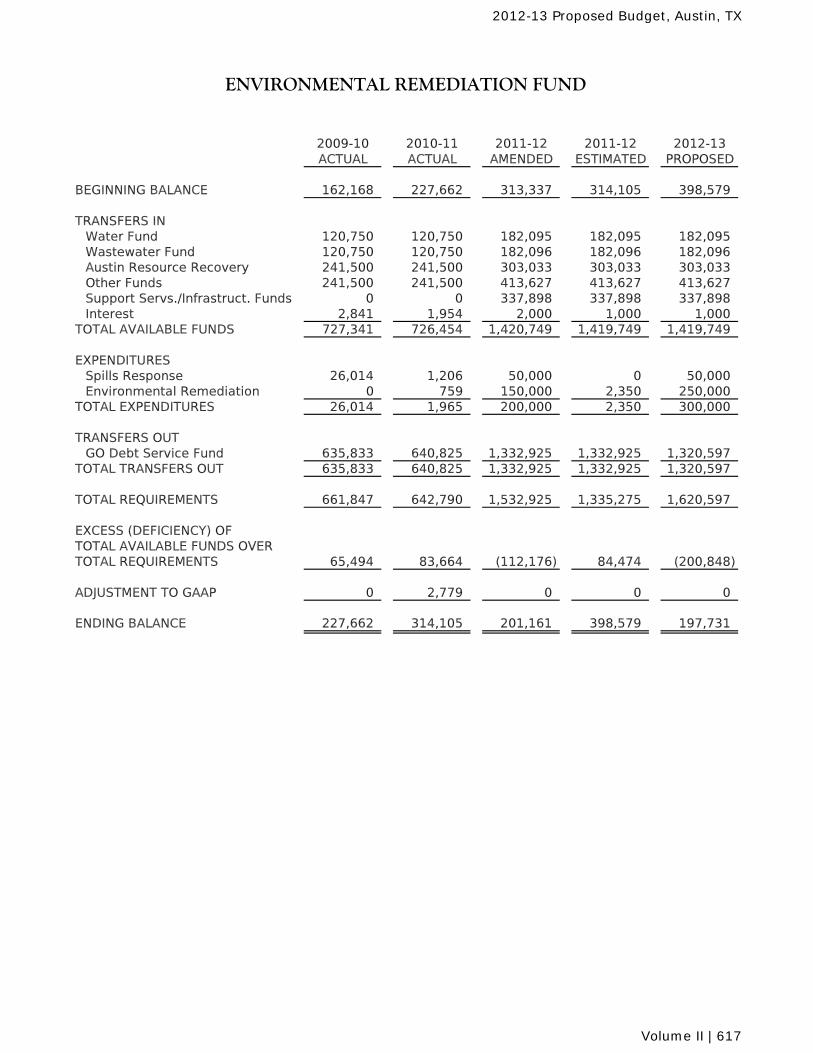
ENVIRONMENTAL REMEDIATION FUND
2009-10 2010-11 2011-12 2011-12 2012-13ACTUAL ACTUAL AMENDED ESTIMATED PROPOSED
BEGINNING BALANCE 162,168 227,662 313,337 314,105 398,579
TRANSFERS INWater Fund 120,750 120,750 182,095 182,095 182,095Wastewater Fund 120,750 120,750 182,096 182,096 182,096Austin Resource Recovery 241,500 241,500 303,033 303,033 303,033Other Funds 241,500 241,500 413,627 413,627 413,627Support Servs./Infrastruct. Funds 0 0 337,898 337,898 337,898Interest 2,841 1,954 2,000 1,000 1,000
TOTAL AVAILABLE FUNDS 727,341 726,454 1,420,749 1,419,749 1,419,749
EXPENDITURESSpills Response 26,014 1,206 50,000 0 50,000Environmental Remediation 0 759 150,000 2,350 250,000
TOTAL EXPENDITURES 26,014 1,965 200,000 2,350 300,000
TRANSFERS OUTGO Debt Service Fund 635,833 640,825 1,332,925 1,332,925 1,320,597
TOTAL TRANSFERS OUT 635,833 640,825 1,332,925 1,332,925 1,320,597
TOTAL REQUIREMENTS 661,847 642,790 1,532,925 1,335,275 1,620,597 EXCESS (DEFICIENCY) OF TOTAL AVAILABLE FUNDS OVER TOTAL REQUIREMENTS 65,494 83,664 (112,176) 84,474 (200,848)
ADJUSTMENT TO GAAP 0 2,779 0 0 0
ENDING BALANCE 227,662 314,105 201,161 398,579 197,731
2012-13 Proposed Budget, Austin, TX
Volume II | 617
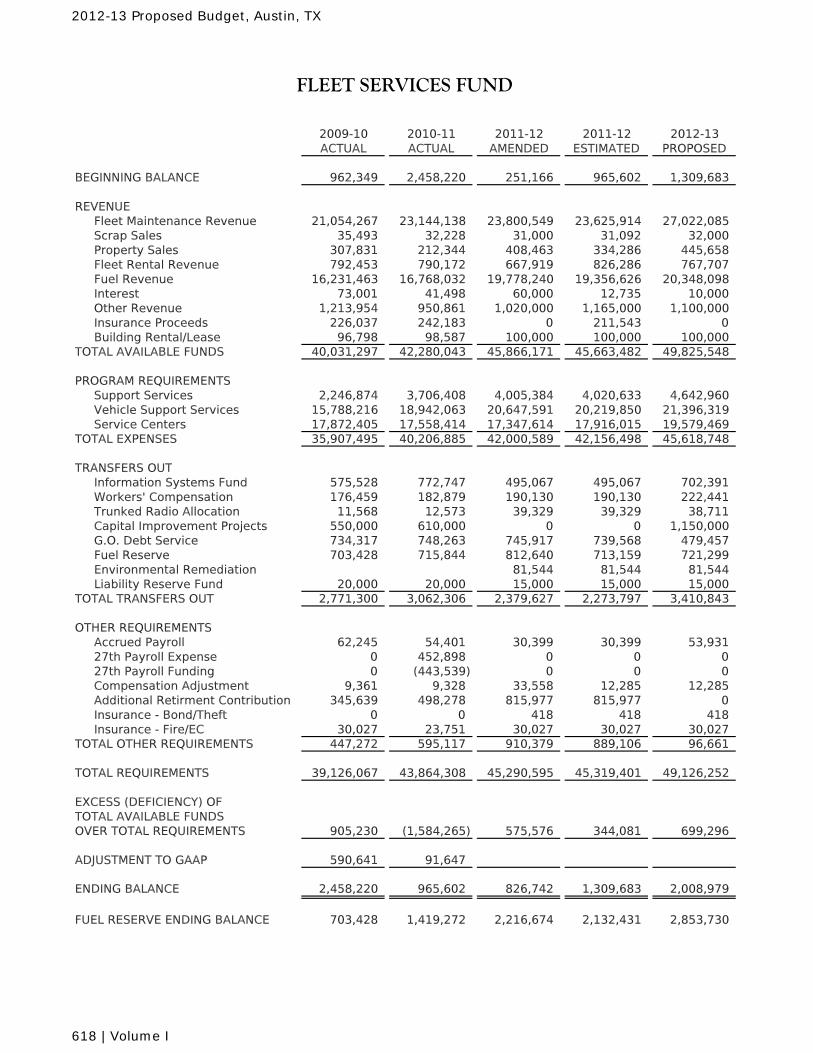
2009-10 2010-11 2011-12 2011-12 2012-13ACTUAL ACTUAL AMENDED ESTIMATED PROPOSED
BEGINNING BALANCE 962,349 2,458,220 251,166 965,602 1,309,683
REVENUEFleet Maintenance Revenue 21,054,267 23,144,138 23,800,549 23,625,914 27,022,085Scrap Sales 35,493 32,228 31,000 31,092 32,000Property Sales 307,831 212,344 408,463 334,286 445,658Fleet Rental Revenue 792,453 790,172 667,919 826,286 767,707Fuel Revenue 16,231,463 16,768,032 19,778,240 19,356,626 20,348,098Interest 73,001 41,498 60,000 12,735 10,000Other Revenue 1,213,954 950,861 1,020,000 1,165,000 1,100,000Insurance Proceeds 226,037 242,183 0 211,543 0Building Rental/Lease 96,798 98,587 100,000 100,000 100,000
TOTAL AVAILABLE FUNDS 40,031,297 42,280,043 45,866,171 45,663,482 49,825,548
PROGRAM REQUIREMENTSSupport Services 2,246,874 3,706,408 4,005,384 4,020,633 4,642,960Vehicle Support Services 15,788,216 18,942,063 20,647,591 20,219,850 21,396,319Service Centers 17,872,405 17,558,414 17,347,614 17,916,015 19,579,469
TOTAL EXPENSES 35,907,495 40,206,885 42,000,589 42,156,498 45,618,748
TRANSFERS OUTInformation Systems Fund 575,528 772,747 495,067 495,067 702,391Workers' Compensation 176,459 182,879 190,130 190,130 222,441Trunked Radio Allocation 11,568 12,573 39,329 39,329 38,711Capital Improvement Projects 550,000 610,000 0 0 1,150,000G.O. Debt Service 734,317 748,263 745,917 739,568 479,457Fuel Reserve 703,428 715,844 812,640 713,159 721,299Environmental Remediation 81,544 81,544 81,544Liability Reserve Fund 20,000 20,000 15,000 15,000 15,000
TOTAL TRANSFERS OUT 2,771,300 3,062,306 2,379,627 2,273,797 3,410,843
OTHER REQUIREMENTSAccrued Payroll 62,245 54,401 30,399 30,399 53,93127th Payroll Expense 0 452,898 0 0 027th Payroll Funding 0 (443,539) 0 0 0Compensation Adjustment 9,361 9,328 33,558 12,285 12,285Additional Retirment Contribution 345,639 498,278 815,977 815,977 0Insurance - Bond/Theft 0 0 418 418 418Insurance - Fire/EC 30,027 23,751 30,027 30,027 30,027
TOTAL OTHER REQUIREMENTS 447,272 595,117 910,379 889,106 96,661
TOTAL REQUIREMENTS 39,126,067 43,864,308 45,290,595 45,319,401 49,126,252
EXCESS (DEFICIENCY) OFTOTAL AVAILABLE FUNDSOVER TOTAL REQUIREMENTS 905,230 (1,584,265) 575,576 344,081 699,296
ADJUSTMENT TO GAAP 590,641 91,647
ENDING BALANCE 2,458,220 965,602 826,742 1,309,683 2,008,979
FUEL RESERVE ENDING BALANCE 703,428 1,419,272 2,216,674 2,132,431 2,853,730
FLEET SERVICES FUND
2012-13 Proposed Budget, Austin, TX
618 | Volume I
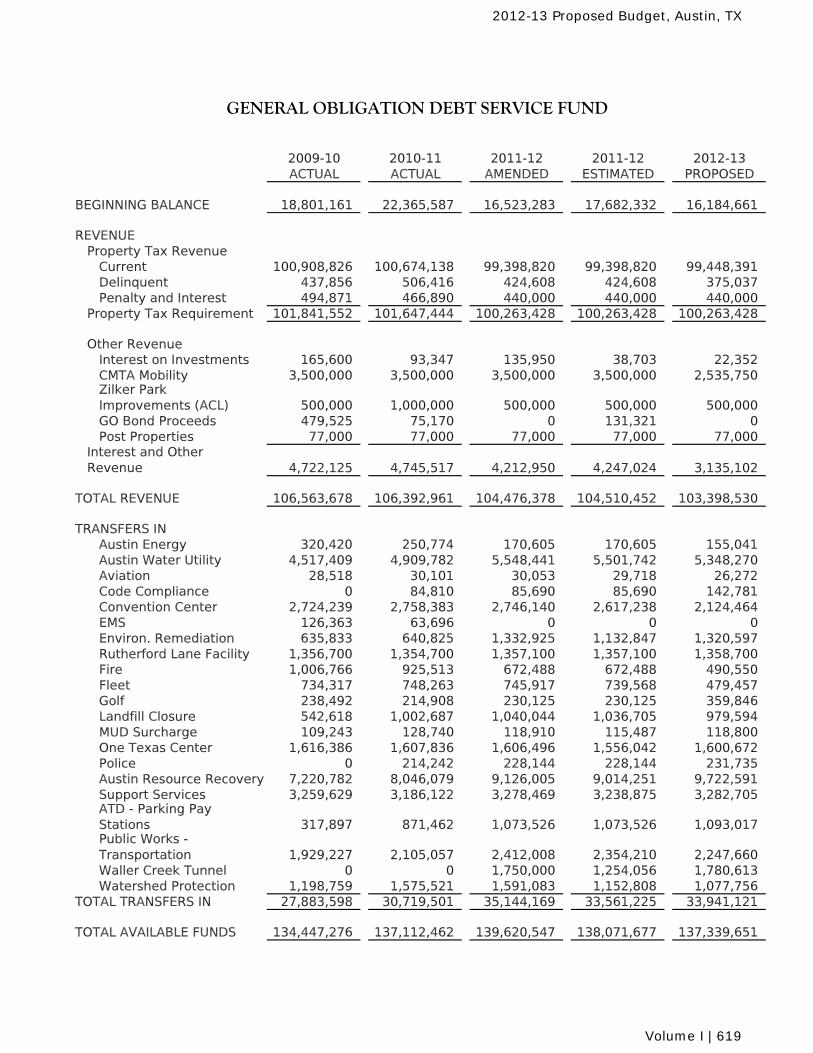
2009-10 2010-11 2011-12 2011-12 2012-13ACTUAL ACTUAL AMENDED ESTIMATED PROPOSED
BEGINNING BALANCE 18,801,161 22,365,587 16,523,283 17,682,332 16,184,661
REVENUEProperty Tax Revenue
Current 100,908,826 100,674,138 99,398,820 99,398,820 99,448,391Delinquent 437,856 506,416 424,608 424,608 375,037Penalty and Interest 494,871 466,890 440,000 440,000 440,000
Property Tax Requirement 101,841,552 101,647,444 100,263,428 100,263,428 100,263,428
Other RevenueInterest on Investments 165,600 93,347 135,950 38,703 22,352CMTA Mobility 3,500,000 3,500,000 3,500,000 3,500,000 2,535,750Zilker Park Improvements (ACL) 500,000 1,000,000 500,000 500,000 500,000GO Bond Proceeds 479,525 75,170 0 131,321 0Post Properties 77,000 77,000 77,000 77,000 77,000
4,722,125 4,745,517 4,212,950 4,247,024 3,135,102
TOTAL REVENUE 106,563,678 106,392,961 104,476,378 104,510,452 103,398,530
TRANSFERS INAustin Energy 320,420 250,774 170,605 170,605 155,041Austin Water Utility 4,517,409 4,909,782 5,548,441 5,501,742 5,348,270Aviation 28,518 30,101 30,053 29,718 26,272Code Compliance 0 84,810 85,690 85,690 142,781Convention Center 2,724,239 2,758,383 2,746,140 2,617,238 2,124,464EMS 126,363 63,696 0 0 0Environ. Remediation 635,833 640,825 1,332,925 1,132,847 1,320,597Rutherford Lane Facility 1,356,700 1,354,700 1,357,100 1,357,100 1,358,700Fire 1,006,766 925,513 672,488 672,488 490,550Fleet 734,317 748,263 745,917 739,568 479,457Golf 238,492 214,908 230,125 230,125 359,846Landfill Closure 542,618 1,002,687 1,040,044 1,036,705 979,594MUD Surcharge 109,243 128,740 118,910 115,487 118,800One Texas Center 1,616,386 1,607,836 1,606,496 1,556,042 1,600,672Police 0 214,242 228,144 228,144 231,735Austin Resource Recovery 7,220,782 8,046,079 9,126,005 9,014,251 9,722,591Support Services 3,259,629 3,186,122 3,278,469 3,238,875 3,282,705ATD - Parking Pay Stations 317,897 871,462 1,073,526 1,073,526 1,093,017Public Works - Transportation 1,929,227 2,105,057 2,412,008 2,354,210 2,247,660Waller Creek Tunnel 0 0 1,750,000 1,254,056 1,780,613Watershed Protection 1,198,759 1,575,521 1,591,083 1,152,808 1,077,756
TOTAL TRANSFERS IN 27,883,598 30,719,501 35,144,169 33,561,225 33,941,121
TOTAL AVAILABLE FUNDS 134,447,276 137,112,462 139,620,547 138,071,677 137,339,651
GENERAL OBLIGATION DEBT SERVICE FUND
Interest and Other Revenue
2012-13 Proposed Budget, Austin, TX
Volume I | 619
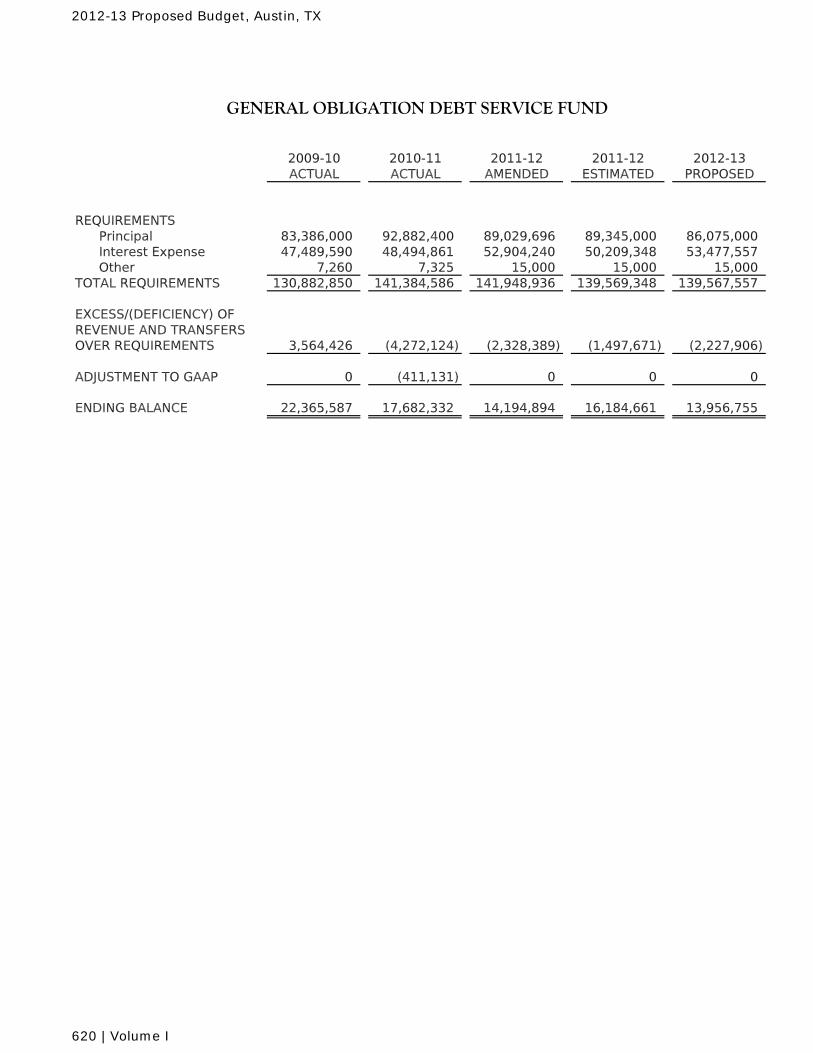
2009-10 2010-11 2011-12 2011-12 2012-13ACTUAL ACTUAL AMENDED ESTIMATED PROPOSED
GENERAL OBLIGATION DEBT SERVICE FUND
REQUIREMENTSPrincipal 83,386,000 92,882,400 89,029,696 89,345,000 86,075,000Interest Expense 47,489,590 48,494,861 52,904,240 50,209,348 53,477,557Other 7,260 7,325 15,000 15,000 15,000
TOTAL REQUIREMENTS 130,882,850 141,384,586 141,948,936 139,569,348 139,567,557
REVENUE AND TRANSFERSOVER REQUIREMENTS 3,564,426 (4,272,124) (2,328,389) (1,497,671) (2,227,906)
ADJUSTMENT TO GAAP 0 (411,131) 0 0 0
ENDING BALANCE 22,365,587 17,682,332 14,194,894 16,184,661 13,956,755
EXCESS/(DEFICIENCY) OF
2012-13 Proposed Budget, Austin, TX
620 | Volume I
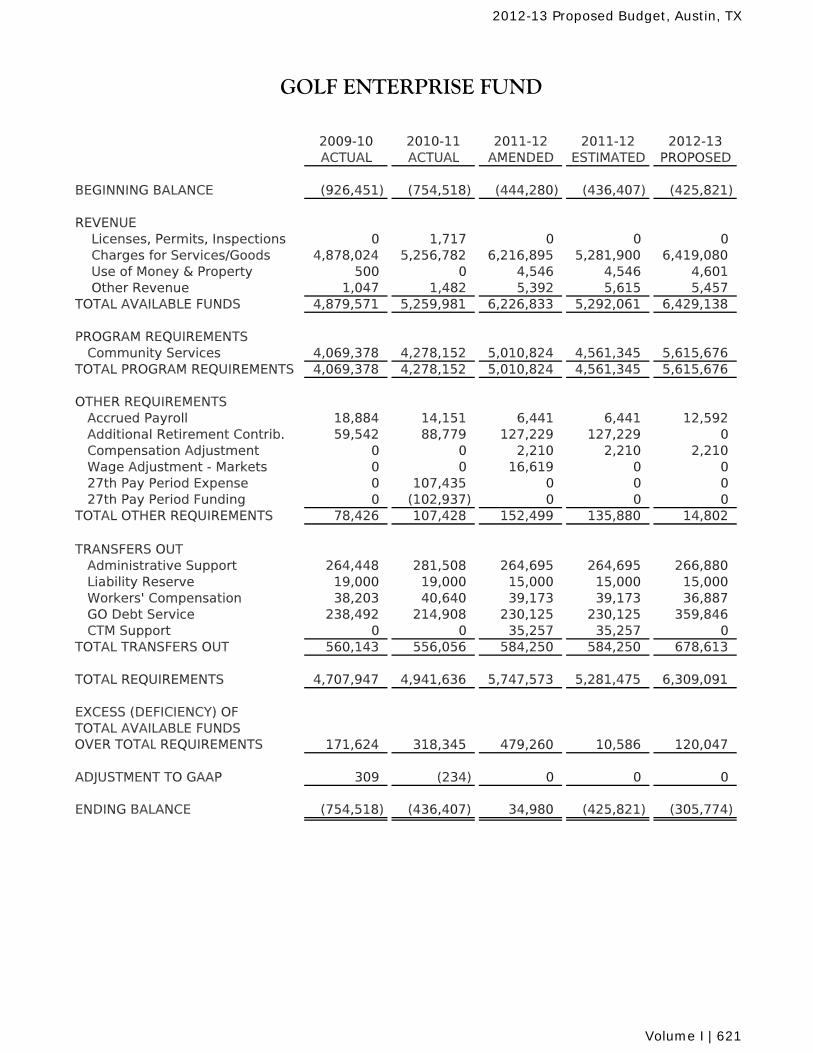
2009-10 2010-11 2011-12 2011-12 2012-13ACTUAL ACTUAL AMENDED ESTIMATED PROPOSED
BEGINNING BALANCE (926,451) (754,518) (444,280) (436,407) (425,821)
REVENUE Licenses, Permits, Inspections 0 1,717 0 0 0 Charges for Services/Goods 4,878,024 5,256,782 6,216,895 5,281,900 6,419,080 Use of Money & Property 500 0 4,546 4,546 4,601 Other Revenue 1,047 1,482 5,392 5,615 5,457TOTAL AVAILABLE FUNDS 4,879,571 5,259,981 6,226,833 5,292,061 6,429,138
PROGRAM REQUIREMENTS Community Services 4,069,378 4,278,152 5,010,824 4,561,345 5,615,676TOTAL PROGRAM REQUIREMENTS 4,069,378 4,278,152 5,010,824 4,561,345 5,615,676
OTHER REQUIREMENTS Accrued Payroll 18,884 14,151 6,441 6,441 12,592 Additional Retirement Contrib. 59,542 88,779 127,229 127,229 0 Compensation Adjustment 0 0 2,210 2,210 2,210 Wage Adjustment - Markets 0 0 16,619 0 0 27th Pay Period Expense 0 107,435 0 0 0 27th Pay Period Funding 0 (102,937) 0 0 0TOTAL OTHER REQUIREMENTS 78,426 107,428 152,499 135,880 14,802
TRANSFERS OUT Administrative Support 264,448 281,508 264,695 264,695 266,880 Liability Reserve 19,000 19,000 15,000 15,000 15,000 Workers' Compensation 38,203 40,640 39,173 39,173 36,887 GO Debt Service 238,492 214,908 230,125 230,125 359,846 CTM Support 0 0 35,257 35,257 0TOTAL TRANSFERS OUT 560,143 556,056 584,250 584,250 678,613
TOTAL REQUIREMENTS 4,707,947 4,941,636 5,747,573 5,281,475 6,309,091
EXCESS (DEFICIENCY) OFTOTAL AVAILABLE FUNDSOVER TOTAL REQUIREMENTS 171,624 318,345 479,260 10,586 120,047
ADJUSTMENT TO GAAP 309 (234) 0 0 0
ENDING BALANCE (754,518) (436,407) 34,980 (425,821) (305,774)
GOLF ENTERPRISE FUND
2012-13 Proposed Budget, Austin, TX
Volume I | 621
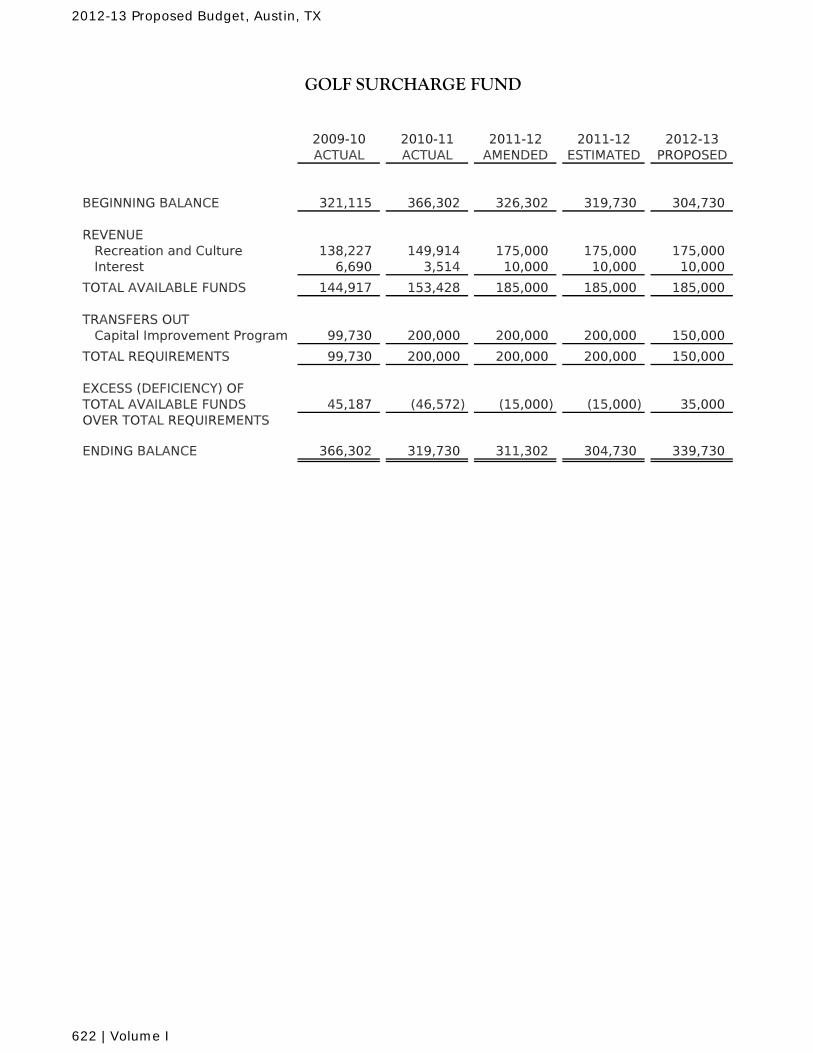
2009-10 2010-11 2011-12 2011-12 2012-13ACTUAL ACTUAL AMENDED ESTIMATED PROPOSED
BEGINNING BALANCE 321,115 366,302 326,302 319,730 304,730
REVENUERecreation and Culture 138,227 149,914 175,000 175,000 175,000Interest 6,690 3,514 10,000 10,000 10,000
TOTAL AVAILABLE FUNDS 144,917 153,428 185,000 185,000 185,000
TRANSFERS OUTCapital Improvement Program 99,730 200,000 200,000 200,000 150,000
TOTAL REQUIREMENTS 99,730 200,000 200,000 200,000 150,000
EXCESS (DEFICIENCY) OFTOTAL AVAILABLE FUNDS 45,187 (46,572) (15,000) (15,000) 35,000OVER TOTAL REQUIREMENTS
ENDING BALANCE 366,302 319,730 311,302 304,730 339,730
GOLF SURCHARGE FUND
2012-13 Proposed Budget, Austin, TX
622 | Volume I
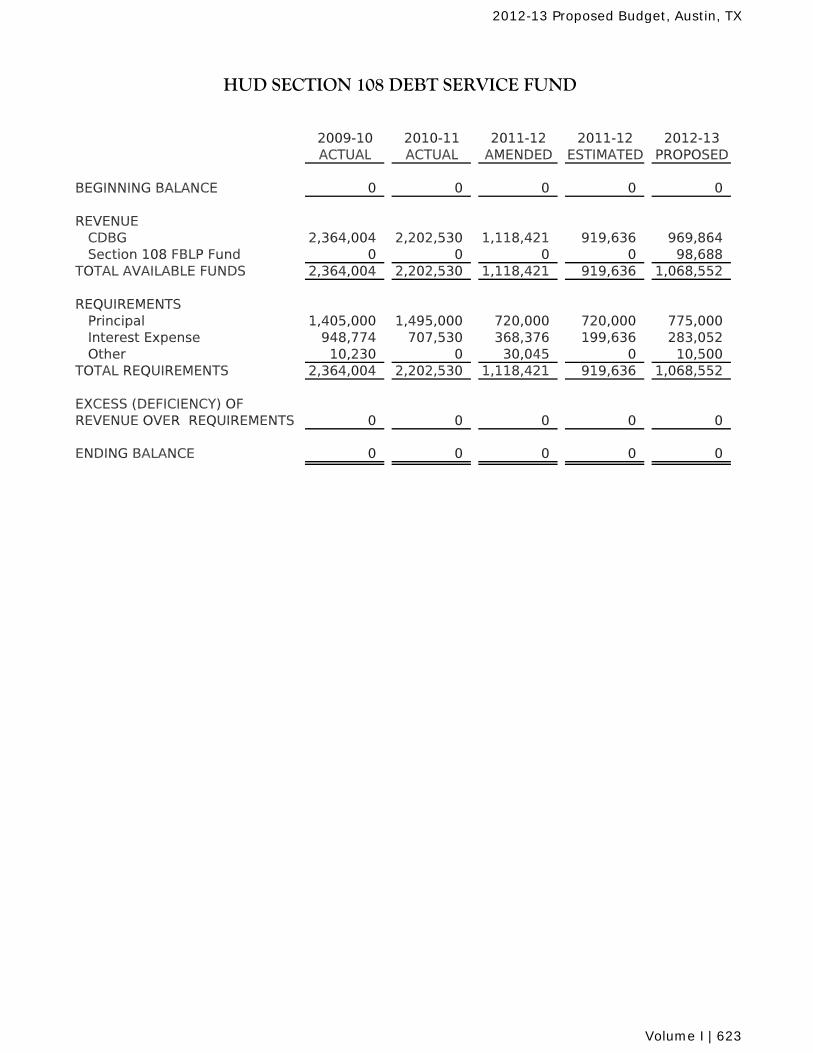
2009-10 2010-11 2011-12 2011-12 2012-13ACTUAL ACTUAL AMENDED ESTIMATED PROPOSED
BEGINNING BALANCE 0 0 0 0 0
REVENUECDBG 2,364,004 2,202,530 1,118,421 919,636 969,864Section 108 FBLP Fund 0 0 0 0 98,688
TOTAL AVAILABLE FUNDS 2,364,004 2,202,530 1,118,421 919,636 1,068,552
REQUIREMENTSPrincipal 1,405,000 1,495,000 720,000 720,000 775,000Interest Expense 948,774 707,530 368,376 199,636 283,052Other 10,230 0 30,045 0 10,500
TOTAL REQUIREMENTS 2,364,004 2,202,530 1,118,421 919,636 1,068,552
EXCESS (DEFICIENCY) OF REVENUE OVER REQUIREMENTS 0 0 0 0 0
ENDING BALANCE 0 0 0 0 0
HUD SECTION 108 DEBT SERVICE FUND
2012-13 Proposed Budget, Austin, TX
Volume I | 623
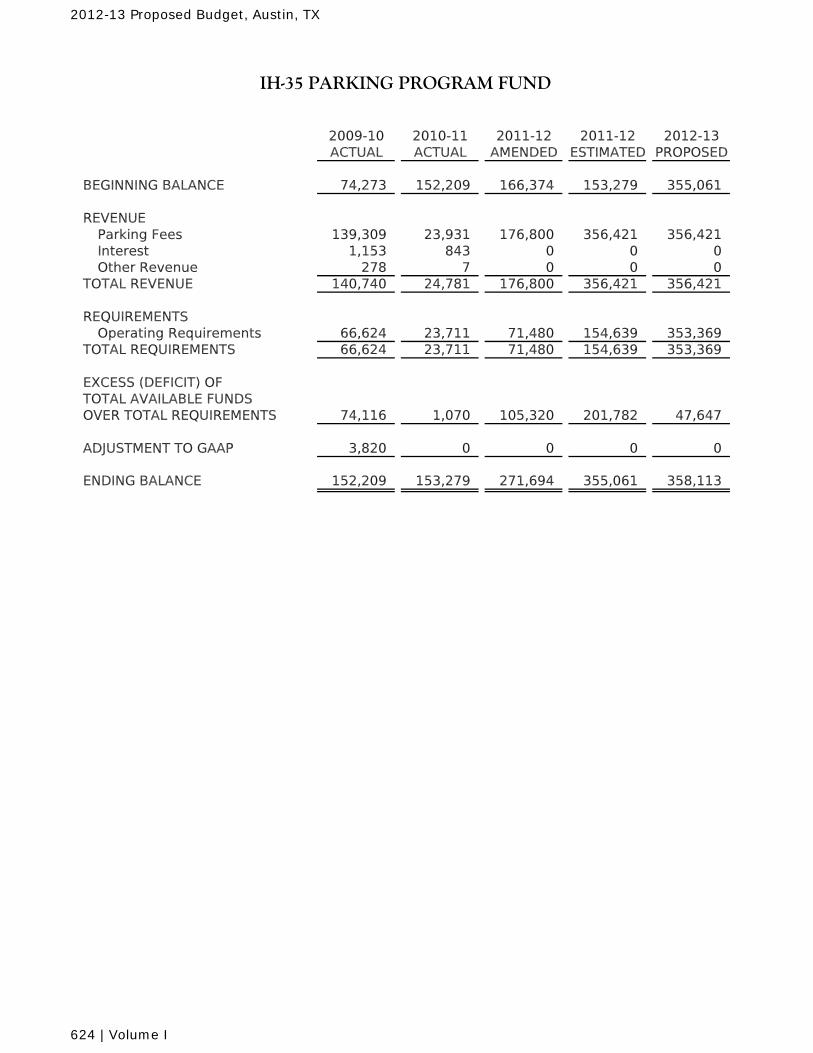
2009-10 2010-11 2011-12 2011-12 2012-13ACTUAL ACTUAL AMENDED ESTIMATED PROPOSED
BEGINNING BALANCE 74,273 152,209 166,374 153,279 355,061
REVENUEParking Fees 139,309 23,931 176,800 356,421 356,421Interest 1,153 843 0 0 0Other Revenue 278 7 0 0 0
TOTAL REVENUE 140,740 24,781 176,800 356,421 356,421
REQUIREMENTSOperating Requirements 66,624 23,711 71,480 154,639 353,369
TOTAL REQUIREMENTS 66,624 23,711 71,480 154,639 353,369
EXCESS (DEFICIT) OFTOTAL AVAILABLE FUNDSOVER TOTAL REQUIREMENTS 74,116 1,070 105,320 201,782 47,647
ADJUSTMENT TO GAAP 3,820 0 0 0 0
ENDING BALANCE 152,209 153,279 271,694 355,061 358,113
IH-35 PARKING PROGRAM FUND
2012-13 Proposed Budget, Austin, TX
624 | Volume I
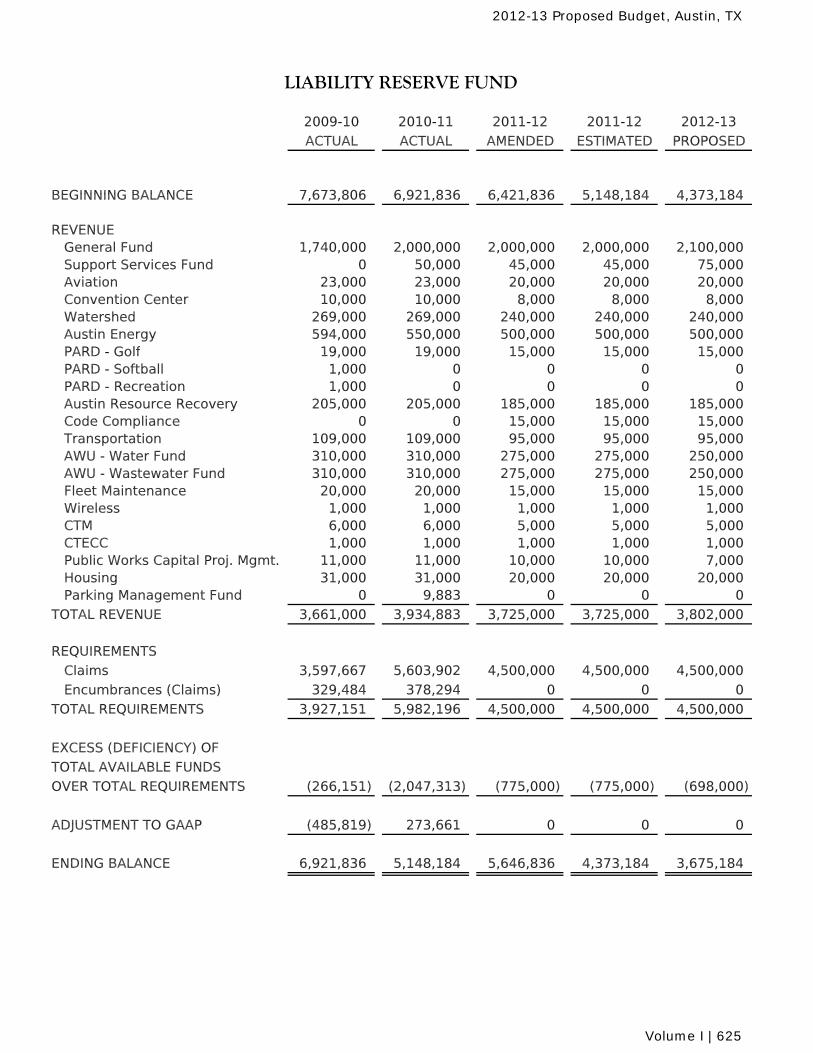
2009-10 2010-11 2011-12 2011-12 2012-13
ACTUAL ACTUAL AMENDED ESTIMATED PROPOSED
BEGINNING BALANCE 7,673,806 6,921,836 6,421,836 5,148,184 4,373,184
REVENUE General Fund 1,740,000 2,000,000 2,000,000 2,000,000 2,100,000 Support Services Fund 0 50,000 45,000 45,000 75,000 Aviation 23,000 23,000 20,000 20,000 20,000 Convention Center 10,000 10,000 8,000 8,000 8,000 Watershed 269,000 269,000 240,000 240,000 240,000 Austin Energy 594,000 550,000 500,000 500,000 500,000 PARD - Golf 19,000 19,000 15,000 15,000 15,000 PARD - Softball 1,000 0 0 0 0 PARD - Recreation 1,000 0 0 0 0 Austin Resource Recovery 205,000 205,000 185,000 185,000 185,000 Code Compliance 0 0 15,000 15,000 15,000 Transportation 109,000 109,000 95,000 95,000 95,000 AWU - Water Fund 310,000 310,000 275,000 275,000 250,000 AWU - Wastewater Fund 310,000 310,000 275,000 275,000 250,000 Fleet Maintenance 20,000 20,000 15,000 15,000 15,000 Wireless 1,000 1,000 1,000 1,000 1,000 CTM 6,000 6,000 5,000 5,000 5,000 CTECC 1,000 1,000 1,000 1,000 1,000 Public Works Capital Proj. Mgmt. 11,000 11,000 10,000 10,000 7,000 Housing 31,000 31,000 20,000 20,000 20,000 Parking Management Fund 0 9,883 0 0 0
TOTAL REVENUE 3,661,000 3,934,883 3,725,000 3,725,000 3,802,000
REQUIREMENTS
Claims 3,597,667 5,603,902 4,500,000 4,500,000 4,500,000
Encumbrances (Claims) 329,484 378,294 0 0 0
TOTAL REQUIREMENTS 3,927,151 5,982,196 4,500,000 4,500,000 4,500,000
EXCESS (DEFICIENCY) OF
TOTAL AVAILABLE FUNDS
OVER TOTAL REQUIREMENTS (266,151) (2,047,313) (775,000) (775,000) (698,000)
ADJUSTMENT TO GAAP (485,819) 273,661 0 0 0
ENDING BALANCE 6,921,836 5,148,184 5,646,836 4,373,184 3,675,184
LIABILITY RESERVE FUND
2012-13 Proposed Budget, Austin, TX
Volume I | 625
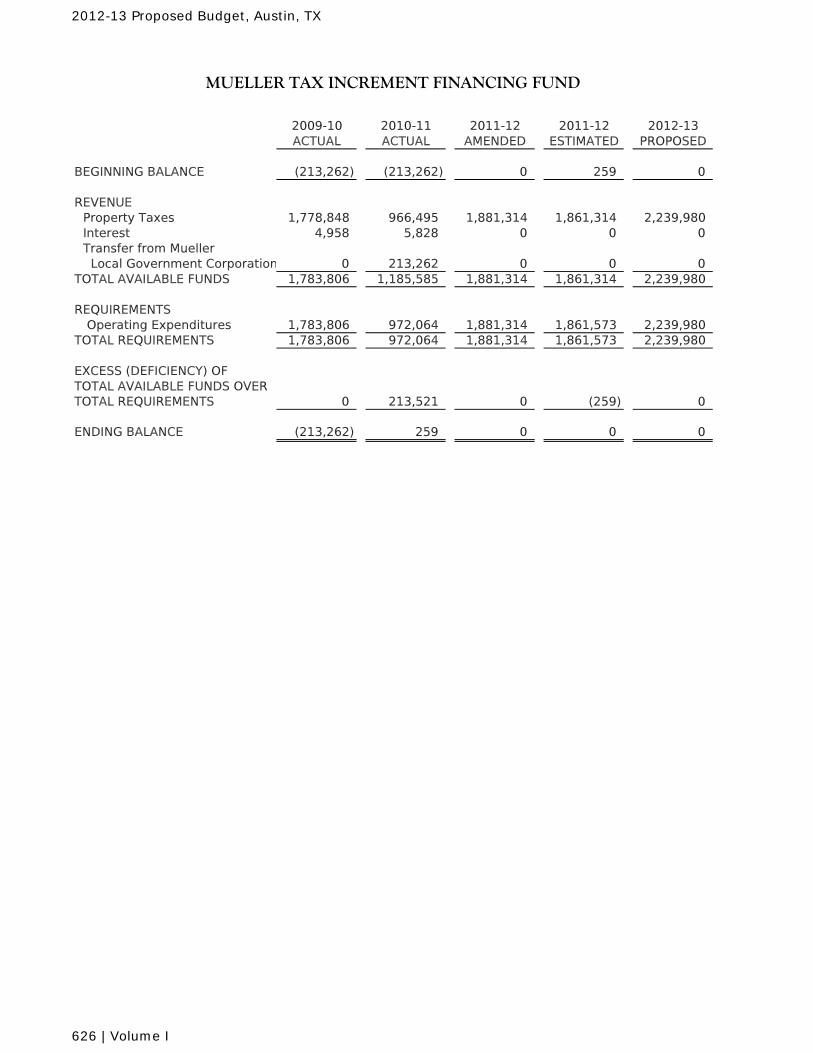
2009-10 2010-11 2011-12 2011-12 2012-13ACTUAL ACTUAL AMENDED ESTIMATED PROPOSED
BEGINNING BALANCE (213,262) (213,262) 0 259 0
REVENUEProperty Taxes 1,778,848 966,495 1,881,314 1,861,314 2,239,980Interest 4,958 5,828 0 0 0Transfer from Mueller Local Government Corporation 0 213,262 0 0 0
TOTAL AVAILABLE FUNDS 1,783,806 1,185,585 1,881,314 1,861,314 2,239,980
REQUIREMENTS Operating Expenditures 1,783,806 972,064 1,881,314 1,861,573 2,239,980
TOTAL REQUIREMENTS 1,783,806 972,064 1,881,314 1,861,573 2,239,980
EXCESS (DEFICIENCY) OFTOTAL AVAILABLE FUNDS OVERTOTAL REQUIREMENTS 0 213,521 0 (259) 0
ENDING BALANCE (213,262) 259 0 0 0
MUELLER TAX INCREMENT FINANCING FUND
2012-13 Proposed Budget, Austin, TX
626 | Volume I
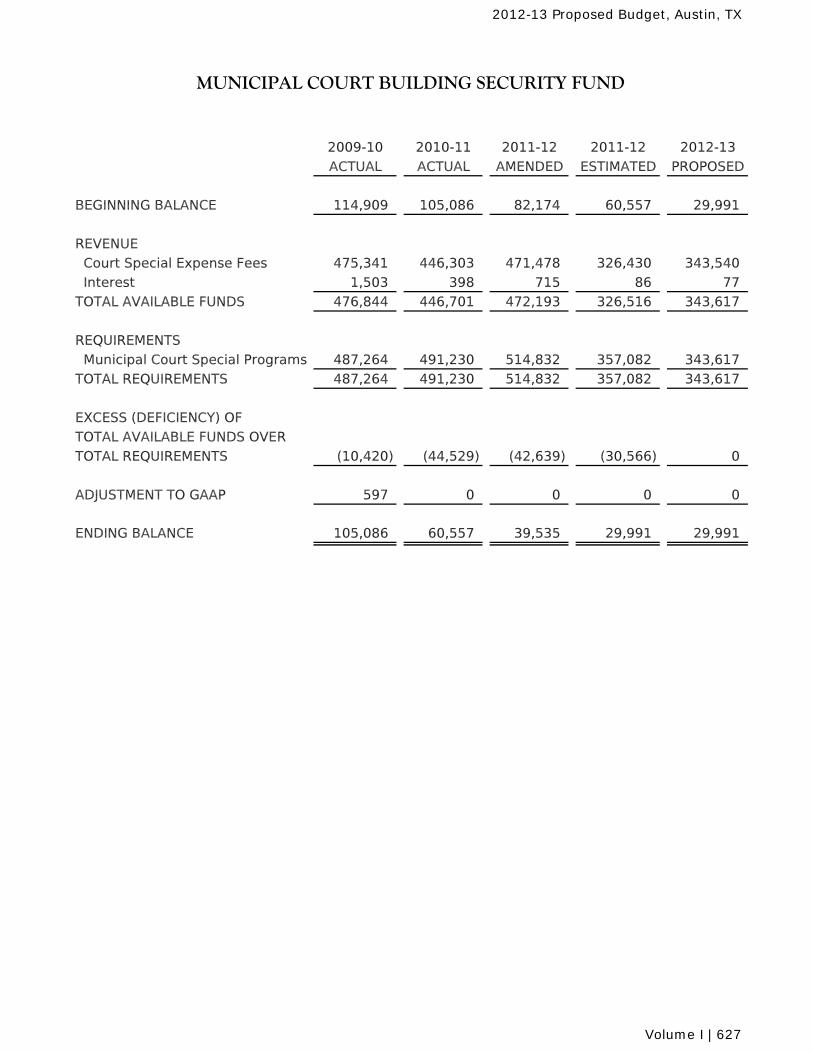
MUNICIPAL COURT BUILDING SECURITY FUND
2009-10 2010-11 2011-12 2011-12 2012-13ACTUAL ACTUAL AMENDED ESTIMATED PROPOSED
BEGINNING BALANCE 114,909 105,086 82,174 60,557 29,991
REVENUE Court Special Expense Fees 475,341 446,303 471,478 326,430 343,540 Interest 1,503 398 715 86 77TOTAL AVAILABLE FUNDS 476,844 446,701 472,193 326,516 343,617
REQUIREMENTS Municipal Court Special Programs 487,264 491,230 514,832 357,082 343,617TOTAL REQUIREMENTS 487,264 491,230 514,832 357,082 343,617
EXCESS (DEFICIENCY) OF TOTAL AVAILABLE FUNDS OVER TOTAL REQUIREMENTS (10,420) (44,529) (42,639) (30,566) 0
ADJUSTMENT TO GAAP 597 0 0 0 0
ENDING BALANCE 105,086 60,557 39,535 29,991 29,991
2012-13 Proposed Budget, Austin, TX
Volume I | 627
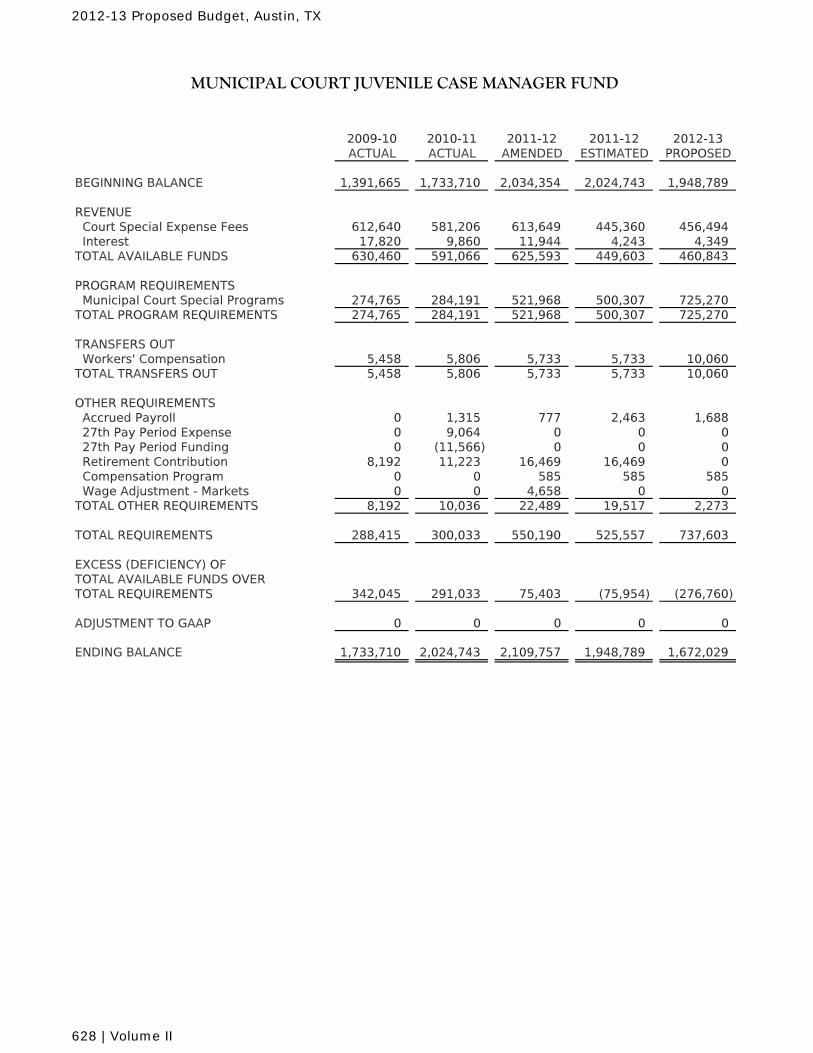
MUNICIPAL COURT JUVENILE CASE MANAGER FUND
2009-10 2010-11 2011-12 2011-12 2012-13ACTUAL ACTUAL AMENDED ESTIMATED PROPOSED
BEGINNING BALANCE 1,391,665 1,733,710 2,034,354 2,024,743 1,948,789
REVENUE Court Special Expense Fees 612,640 581,206 613,649 445,360 456,494 Interest 17,820 9,860 11,944 4,243 4,349TOTAL AVAILABLE FUNDS 630,460 591,066 625,593 449,603 460,843
PROGRAM REQUIREMENTS Municipal Court Special Programs 274,765 284,191 521,968 500,307 725,270TOTAL PROGRAM REQUIREMENTS 274,765 284,191 521,968 500,307 725,270
TRANSFERS OUT Workers' Compensation 5,458 5,806 5,733 5,733 10,060TOTAL TRANSFERS OUT 5,458 5,806 5,733 5,733 10,060
OTHER REQUIREMENTS Accrued Payroll 0 1,315 777 2,463 1,688 27th Pay Period Expense 0 9,064 0 0 0 27th Pay Period Funding 0 (11,566) 0 0 0 Retirement Contribution 8,192 11,223 16,469 16,469 0 Compensation Program 0 0 585 585 585 Wage Adjustment - Markets 0 0 4,658 0 0TOTAL OTHER REQUIREMENTS 8,192 10,036 22,489 19,517 2,273
TOTAL REQUIREMENTS 288,415 300,033 550,190 525,557 737,603 EXCESS (DEFICIENCY) OF TOTAL AVAILABLE FUNDS OVERTOTAL REQUIREMENTS 342,045 291,033 75,403 (75,954) (276,760)
ADJUSTMENT TO GAAP 0 0 0 0 0
ENDING BALANCE 1,733,710 2,024,743 2,109,757 1,948,789 1,672,029
2012-13 Proposed Budget, Austin, TX
628 | Volume II
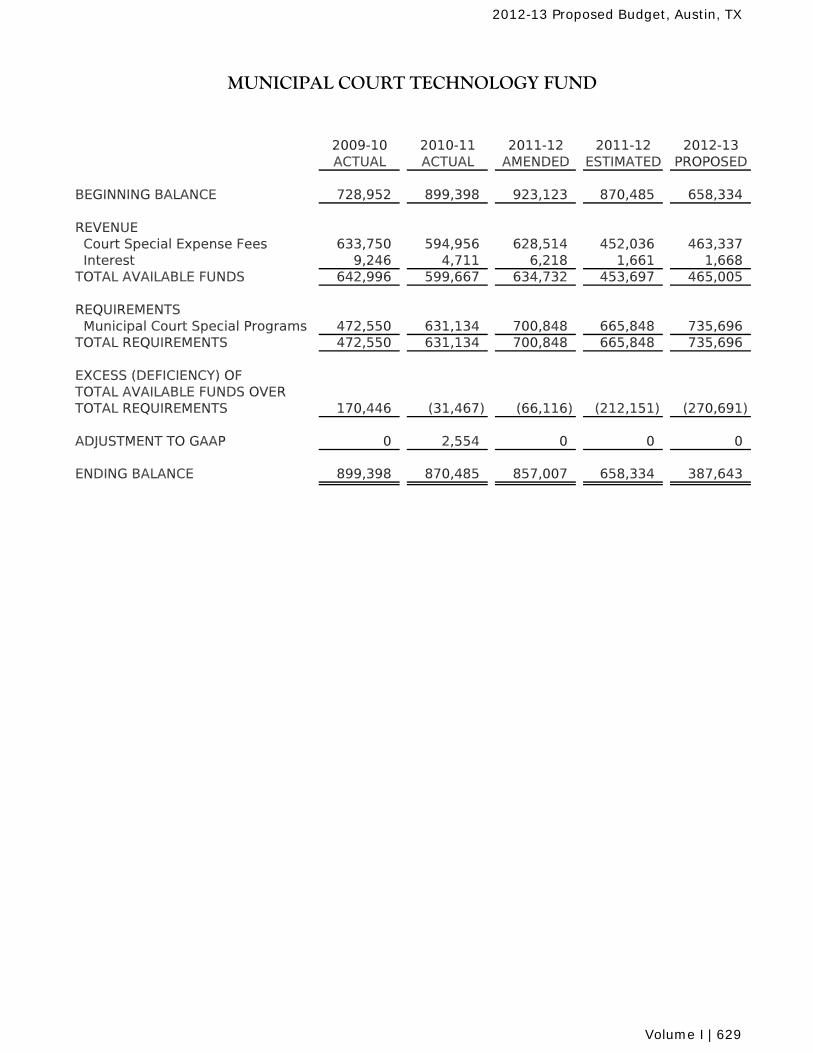
MUNICIPAL COURT TECHNOLOGY FUND
2009-10 2010-11 2011-12 2011-12 2012-13ACTUAL ACTUAL AMENDED ESTIMATED PROPOSED
BEGINNING BALANCE 728,952 899,398 923,123 870,485 658,334
REVENUE Court Special Expense Fees 633,750 594,956 628,514 452,036 463,337 Interest 9,246 4,711 6,218 1,661 1,668TOTAL AVAILABLE FUNDS 642,996 599,667 634,732 453,697 465,005
REQUIREMENTS Municipal Court Special Programs 472,550 631,134 700,848 665,848 735,696TOTAL REQUIREMENTS 472,550 631,134 700,848 665,848 735,696
EXCESS (DEFICIENCY) OF TOTAL AVAILABLE FUNDS OVER TOTAL REQUIREMENTS 170,446 (31,467) (66,116) (212,151) (270,691)
ADJUSTMENT TO GAAP 0 2,554 0 0 0
ENDING BALANCE 899,398 870,485 857,007 658,334 387,643
2012-13 Proposed Budget, Austin, TX
Volume I | 629
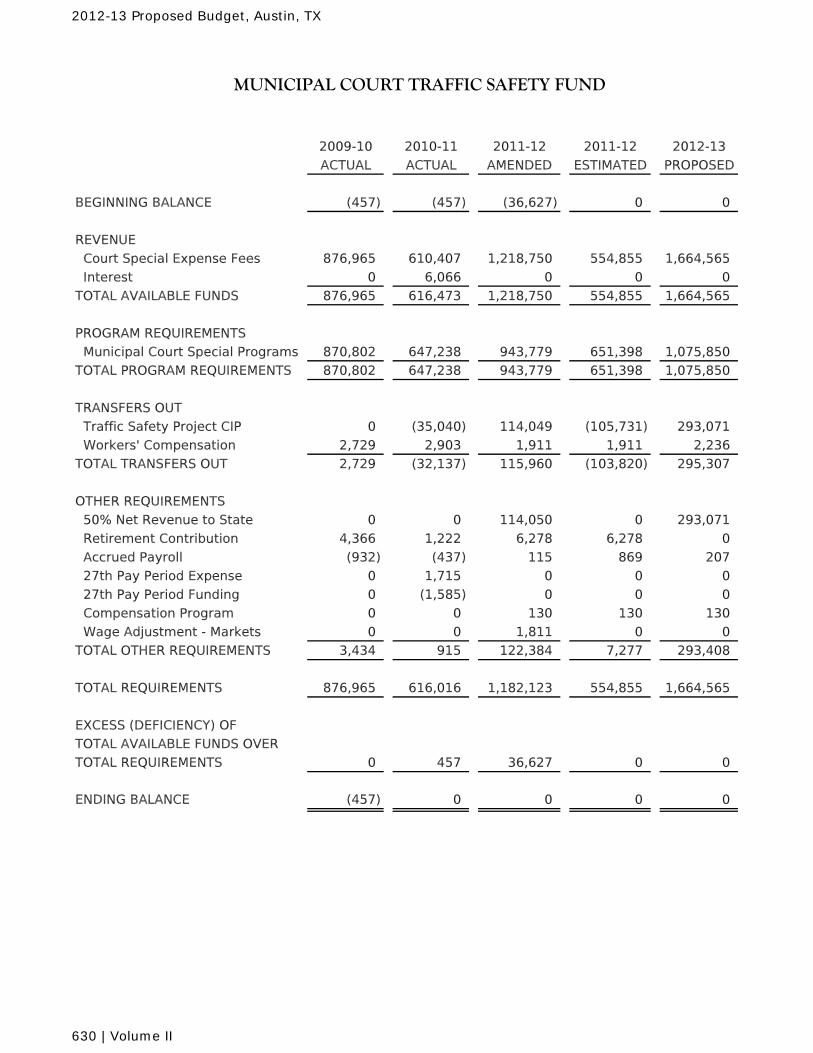
MUNICIPAL COURT TRAFFIC SAFETY FUND
2009-10 2010-11 2011-12 2011-12 2012-13
ACTUAL ACTUAL AMENDED ESTIMATED PROPOSED
BEGINNING BALANCE (457) (457) (36,627) 0 0
REVENUE
Court Special Expense Fees 876,965 610,407 1,218,750 554,855 1,664,565
Interest 0 6,066 0 0 0
TOTAL AVAILABLE FUNDS 876,965 616,473 1,218,750 554,855 1,664,565
PROGRAM REQUIREMENTS
Municipal Court Special Programs 870,802 647,238 943,779 651,398 1,075,850
TOTAL PROGRAM REQUIREMENTS 870,802 647,238 943,779 651,398 1,075,850
TRANSFERS OUT
Traffic Safety Project CIP 0 (35,040) 114,049 (105,731) 293,071
Workers' Compensation 2,729 2,903 1,911 1,911 2,236
TOTAL TRANSFERS OUT 2,729 (32,137) 115,960 (103,820) 295,307
OTHER REQUIREMENTS
50% Net Revenue to State 0 0 114,050 0 293,071
Retirement Contribution 4,366 1,222 6,278 6,278 0
Accrued Payroll (932) (437) 115 869 207
27th Pay Period Expense 0 1,715 0 0 0
27th Pay Period Funding 0 (1,585) 0 0 0
Compensation Program 0 0 130 130 130
Wage Adjustment - Markets 0 0 1,811 0 0
TOTAL OTHER REQUIREMENTS 3,434 915 122,384 7,277 293,408
TOTAL REQUIREMENTS 876,965 616,016 1,182,123 554,855 1,664,565
EXCESS (DEFICIENCY) OF
TOTAL AVAILABLE FUNDS OVER
TOTAL REQUIREMENTS 0 457 36,627 0 0
ENDING BALANCE (457) 0 0 0 0
2012-13 Proposed Budget, Austin, TX
630 | Volume II
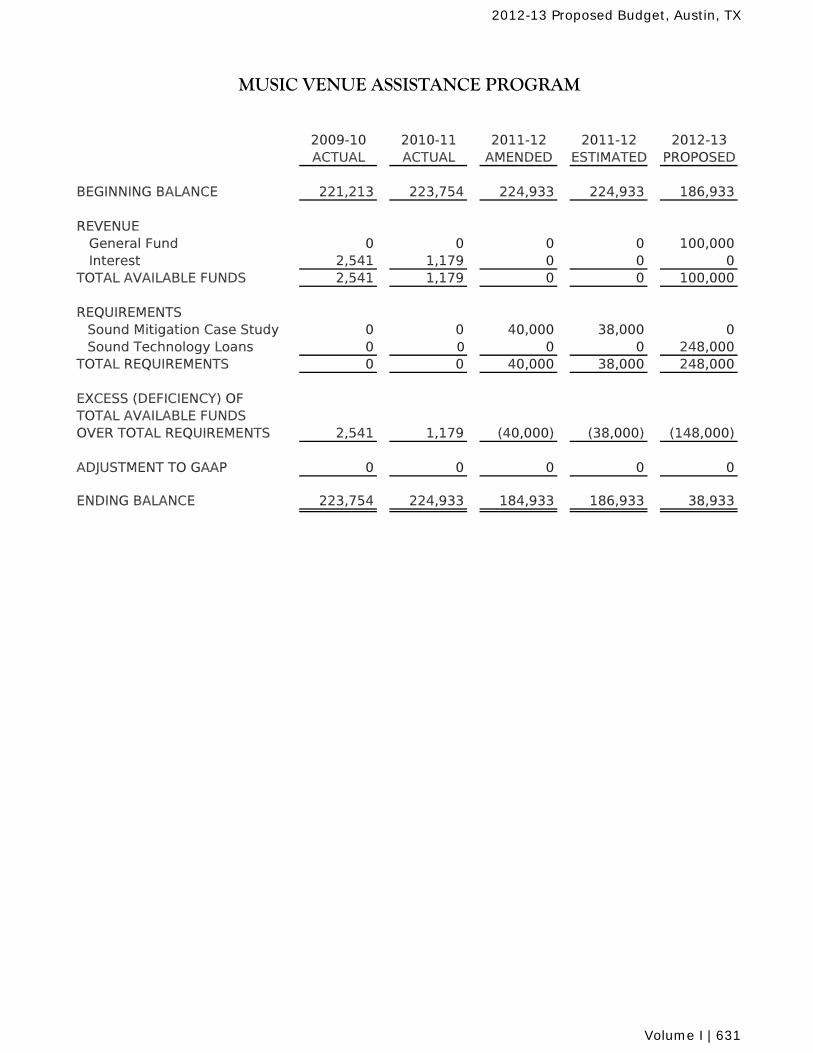
2009-10 2010-11 2011-12 2011-12 2012-13ACTUAL ACTUAL AMENDED ESTIMATED PROPOSED
BEGINNING BALANCE 221,213 223,754 224,933 224,933 186,933
REVENUE General Fund 0 0 0 0 100,000 Interest 2,541 1,179 0 0 0TOTAL AVAILABLE FUNDS 2,541 1,179 0 0 100,000
REQUIREMENTSSound Mitigation Case Study 0 0 40,000 38,000 0Sound Technology Loans 0 0 0 0 248,000
TOTAL REQUIREMENTS 0 0 40,000 38,000 248,000
EXCESS (DEFICIENCY) OF TOTAL AVAILABLE FUNDS OVER TOTAL REQUIREMENTS 2,541 1,179 (40,000) (38,000) (148,000)
ADJUSTMENT TO GAAP 0 0 0 0 0
ENDING BALANCE 223,754 224,933 184,933 186,933 38,933
MUSIC VENUE ASSISTANCE PROGRAM
2012-13 Proposed Budget, Austin, TX
Volume I | 631
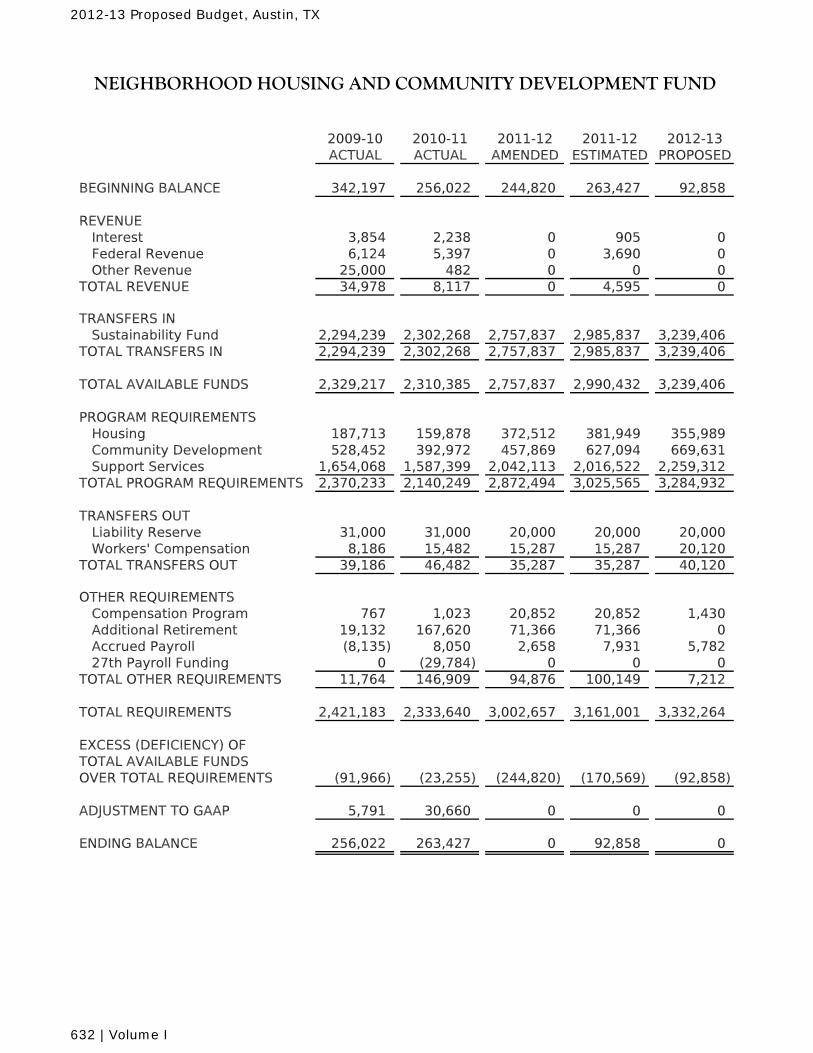
2009-10 2010-11 2011-12 2011-12 2012-13ACTUAL ACTUAL AMENDED ESTIMATED PROPOSED
BEGINNING BALANCE 342,197 256,022 244,820 263,427 92,858
REVENUEInterest 3,854 2,238 0 905 0Federal Revenue 6,124 5,397 0 3,690 0Other Revenue 25,000 482 0 0 0
TOTAL REVENUE 34,978 8,117 0 4,595 0
TRANSFERS INSustainability Fund 2,294,239 2,302,268 2,757,837 2,985,837 3,239,406
TOTAL TRANSFERS IN 2,294,239 2,302,268 2,757,837 2,985,837 3,239,406
TOTAL AVAILABLE FUNDS 2,329,217 2,310,385 2,757,837 2,990,432 3,239,406
PROGRAM REQUIREMENTSHousing 187,713 159,878 372,512 381,949 355,989Community Development 528,452 392,972 457,869 627,094 669,631Support Services 1,654,068 1,587,399 2,042,113 2,016,522 2,259,312
TOTAL PROGRAM REQUIREMENTS 2,370,233 2,140,249 2,872,494 3,025,565 3,284,932
TRANSFERS OUTLiability Reserve 31,000 31,000 20,000 20,000 20,000Workers' Compensation 8,186 15,482 15,287 15,287 20,120
TOTAL TRANSFERS OUT 39,186 46,482 35,287 35,287 40,120
OTHER REQUIREMENTSCompensation Program 767 1,023 20,852 20,852 1,430Additional Retirement 19,132 167,620 71,366 71,366 0Accrued Payroll (8,135) 8,050 2,658 7,931 5,78227th Payroll Funding 0 (29,784) 0 0 0
TOTAL OTHER REQUIREMENTS 11,764 146,909 94,876 100,149 7,212
TOTAL REQUIREMENTS 2,421,183 2,333,640 3,002,657 3,161,001 3,332,264
EXCESS (DEFICIENCY) OFTOTAL AVAILABLE FUNDSOVER TOTAL REQUIREMENTS (91,966) (23,255) (244,820) (170,569) (92,858)
ADJUSTMENT TO GAAP 5,791 30,660 0 0 0
ENDING BALANCE 256,022 263,427 0 92,858 0
NEIGHBORHOOD HOUSING AND COMMUNITY DEVELOPMENT FUND
2012-13 Proposed Budget, Austin, TX
632 | Volume I
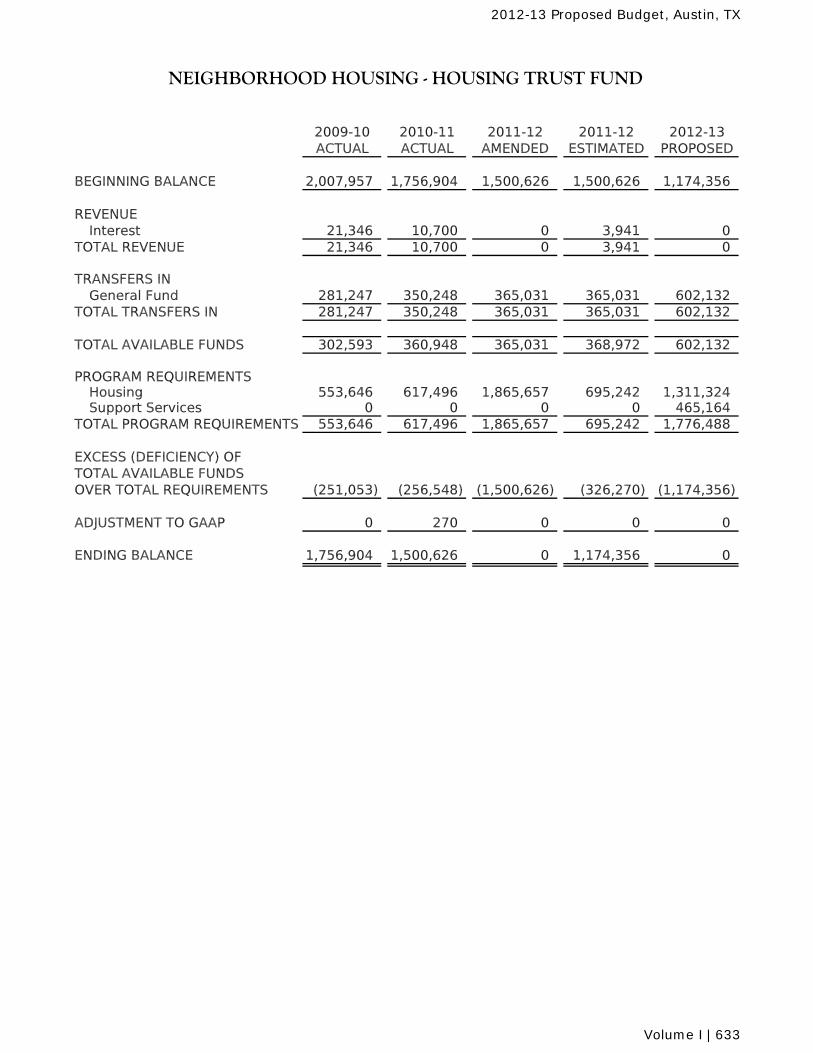
2009-10 2010-11 2011-12 2011-12 2012-13ACTUAL ACTUAL AMENDED ESTIMATED PROPOSED
BEGINNING BALANCE 2,007,957 1,756,904 1,500,626 1,500,626 1,174,356
REVENUEInterest 21,346 10,700 0 3,941 0
TOTAL REVENUE 21,346 10,700 0 3,941 0
TRANSFERS INGeneral Fund 281,247 350,248 365,031 365,031 602,132
TOTAL TRANSFERS IN 281,247 350,248 365,031 365,031 602,132
TOTAL AVAILABLE FUNDS 302,593 360,948 365,031 368,972 602,132
PROGRAM REQUIREMENTSHousing 553,646 617,496 1,865,657 695,242 1,311,324Support Services 0 0 0 0 465,164
TOTAL PROGRAM REQUIREMENTS 553,646 617,496 1,865,657 695,242 1,776,488
EXCESS (DEFICIENCY) OFTOTAL AVAILABLE FUNDSOVER TOTAL REQUIREMENTS (251,053) (256,548) (1,500,626) (326,270) (1,174,356)
ADJUSTMENT TO GAAP 0 270 0 0 0
ENDING BALANCE 1,756,904 1,500,626 0 1,174,356 0
NEIGHBORHOOD HOUSING - HOUSING TRUST FUND
2012-13 Proposed Budget, Austin, TX
Volume I | 633
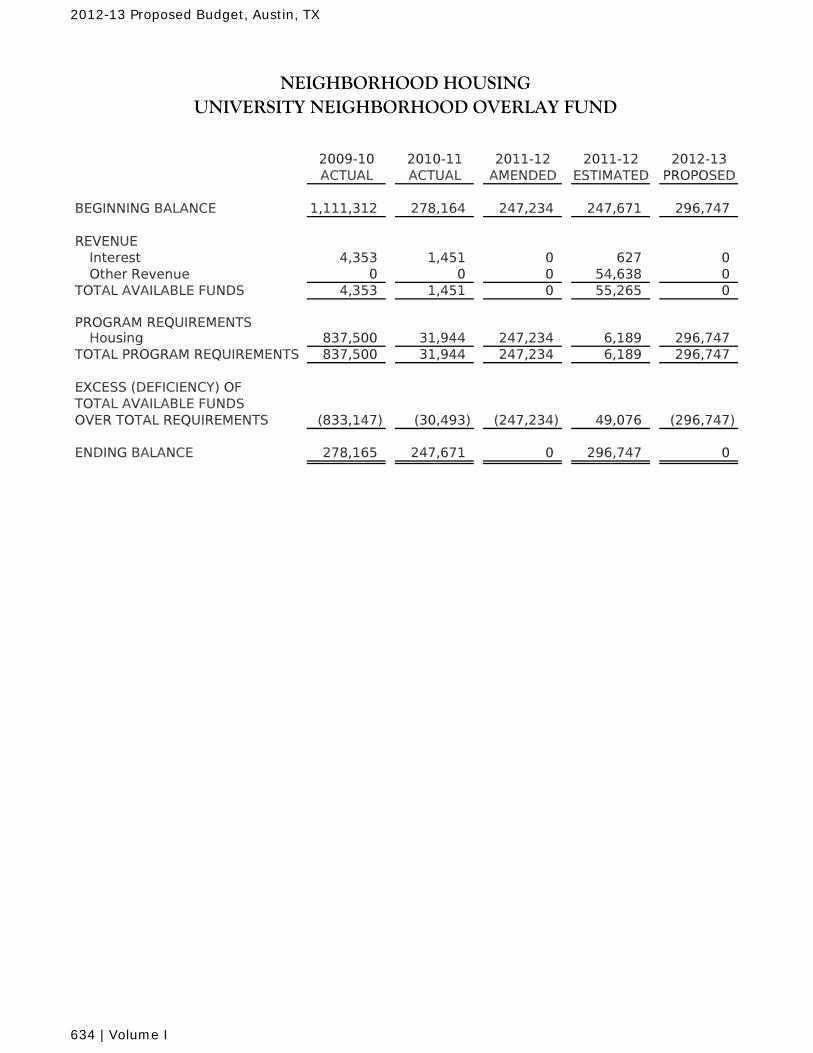
2009-10 2010-11 2011-12 2011-12 2012-13ACTUAL ACTUAL AMENDED ESTIMATED PROPOSED
BEGINNING BALANCE 1,111,312 278,164 247,234 247,671 296,747
REVENUEInterest 4,353 1,451 0 627 0Other Revenue 0 0 0 54,638 0
4,353 1,451 0 55,265 0
PROGRAM REQUIREMENTSHousing 837,500 31,944 247,234 6,189 296,747
TOTAL PROGRAM REQUIREMENTS 837,500 31,944 247,234 6,189 296,747
EXCESS (DEFICIENCY) OFTOTAL AVAILABLE FUNDSOVER TOTAL REQUIREMENTS (833,147) (30,493) (247,234) 49,076 (296,747)
ENDING BALANCE 278,165 247,671 0 296,747 0
TOTAL AVAILABLE FUNDS
NEIGHBORHOOD HOUSINGUNIVERSITY NEIGHBORHOOD OVERLAY FUND
2012-13 Proposed Budget, Austin, TX
634 | Volume I
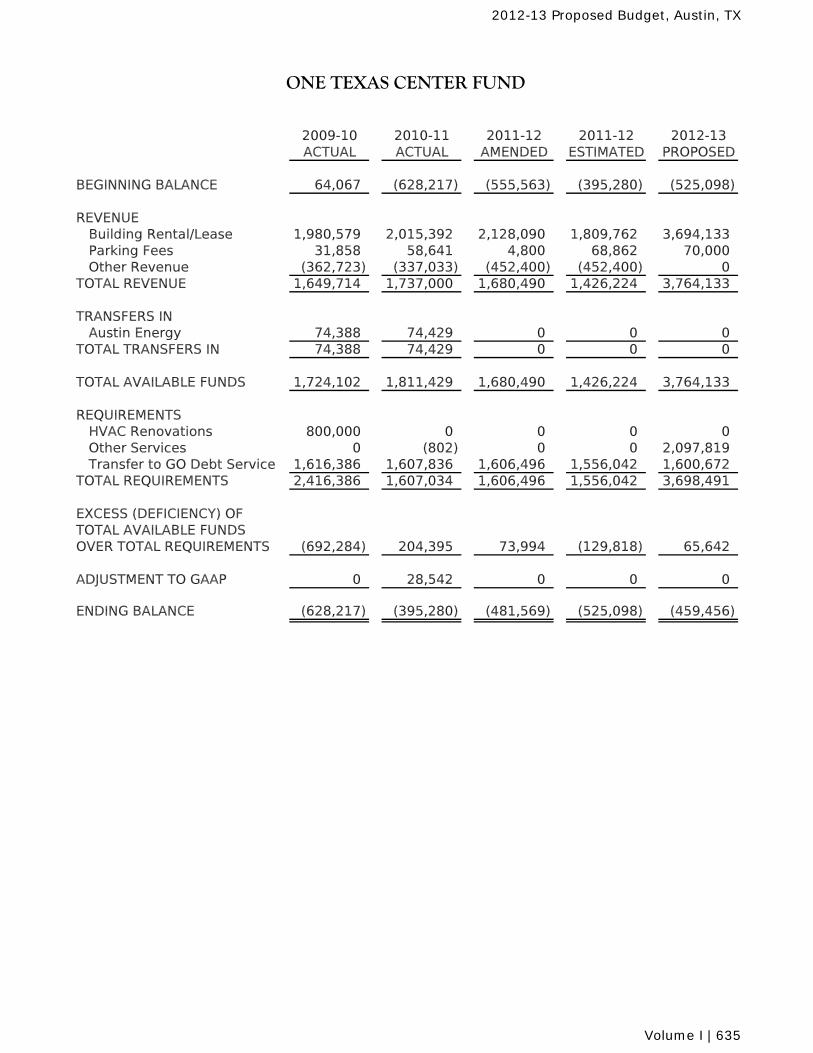
2009-10 2010-11 2011-12 2011-12 2012-13ACTUAL ACTUAL AMENDED ESTIMATED PROPOSED
BEGINNING BALANCE 64,067 (628,217) (555,563) (395,280) (525,098)
REVENUEBuilding Rental/Lease 1,980,579 2,015,392 2,128,090 1,809,762 3,694,133Parking Fees 31,858 58,641 4,800 68,862 70,000Other Revenue (362,723) (337,033) (452,400) (452,400) 0
TOTAL REVENUE 1,649,714 1,737,000 1,680,490 1,426,224 3,764,133
TRANSFERS INAustin Energy 74,388 74,429 0 0 0
TOTAL TRANSFERS IN 74,388 74,429 0 0 0
TOTAL AVAILABLE FUNDS 1,724,102 1,811,429 1,680,490 1,426,224 3,764,133
REQUIREMENTSHVAC Renovations 800,000 0 0 0 0Other Services 0 (802) 0 0 2,097,819Transfer to GO Debt Service 1,616,386 1,607,836 1,606,496 1,556,042 1,600,672
TOTAL REQUIREMENTS 2,416,386 1,607,034 1,606,496 1,556,042 3,698,491
EXCESS (DEFICIENCY) OF TOTAL AVAILABLE FUNDS OVER TOTAL REQUIREMENTS (692,284) 204,395 73,994 (129,818) 65,642
ADJUSTMENT TO GAAP 0 28,542 0 0 0
ENDING BALANCE (628,217) (395,280) (481,569) (525,098) (459,456)
ONE TEXAS CENTER FUND
2012-13 Proposed Budget, Austin, TX
Volume I | 635
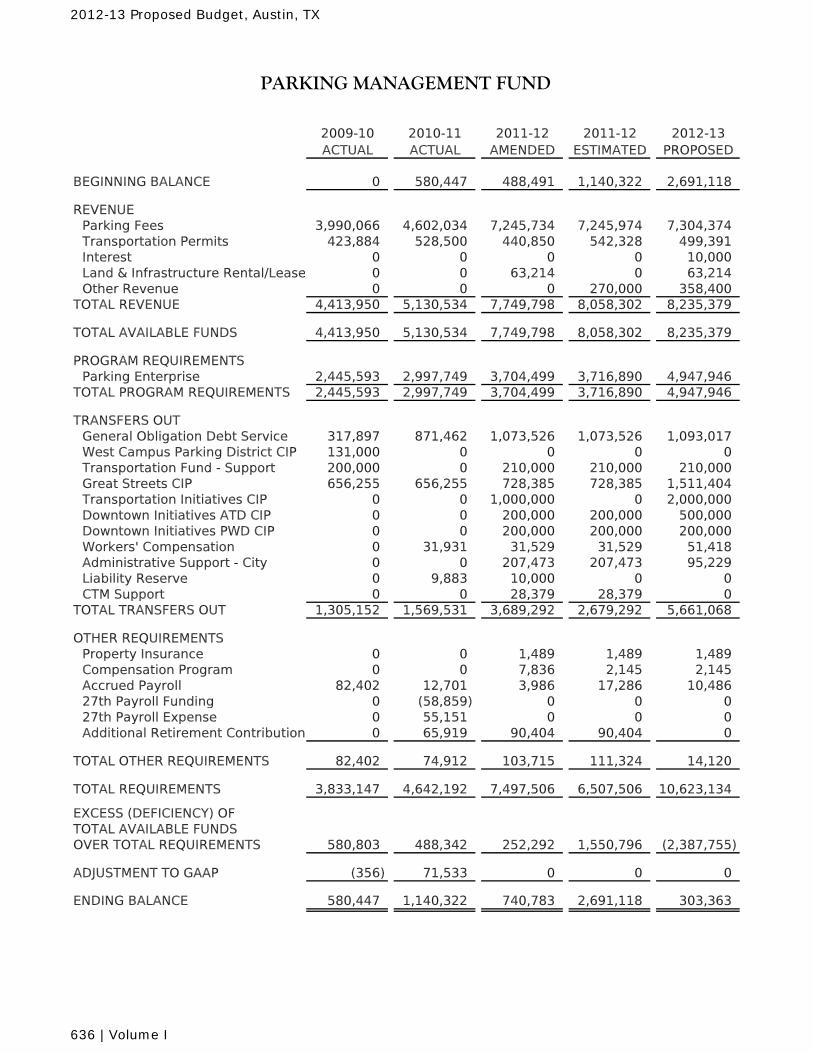
2009-10 2010-11 2011-12 2011-12 2012-13ACTUAL ACTUAL AMENDED ESTIMATED PROPOSED
BEGINNING BALANCE 0 580,447 488,491 1,140,322 2,691,118
REVENUEParking Fees 3,990,066 4,602,034 7,245,734 7,245,974 7,304,374Transportation Permits 423,884 528,500 440,850 542,328 499,391Interest 0 0 0 0 10,000Land & Infrastructure Rental/Lease 0 0 63,214 0 63,214Other Revenue 0 0 0 270,000 358,400
TOTAL REVENUE 4,413,950 5,130,534 7,749,798 8,058,302 8,235,379
TOTAL AVAILABLE FUNDS 4,413,950 5,130,534 7,749,798 8,058,302 8,235,379
PROGRAM REQUIREMENTSParking Enterprise 2,445,593 2,997,749 3,704,499 3,716,890 4,947,946
TOTAL PROGRAM REQUIREMENTS 2,445,593 2,997,749 3,704,499 3,716,890 4,947,946
TRANSFERS OUTGeneral Obligation Debt Service 317,897 871,462 1,073,526 1,073,526 1,093,017West Campus Parking District CIP 131,000 0 0 0 0Transportation Fund - Support 200,000 0 210,000 210,000 210,000Great Streets CIP 656,255 656,255 728,385 728,385 1,511,404Transportation Initiatives CIP 0 0 1,000,000 0 2,000,000Downtown Initiatives ATD CIP 0 0 200,000 200,000 500,000Downtown Initiatives PWD CIP 0 0 200,000 200,000 200,000Workers' Compensation 0 31,931 31,529 31,529 51,418Administrative Support - City 0 0 207,473 207,473 95,229Liability Reserve 0 9,883 10,000 0 0CTM Support 0 0 28,379 28,379 0
TOTAL TRANSFERS OUT 1,305,152 1,569,531 3,689,292 2,679,292 5,661,068
OTHER REQUIREMENTSProperty Insurance 0 0 1,489 1,489 1,489Compensation Program 0 0 7,836 2,145 2,145Accrued Payroll 82,402 12,701 3,986 17,286 10,48627th Payroll Funding 0 (58,859) 0 0 027th Payroll Expense 0 55,151 0 0 0Additional Retirement Contribution 0 65,919 90,404 90,404 0
TOTAL OTHER REQUIREMENTS 82,402 74,912 103,715 111,324 14,120
TOTAL REQUIREMENTS 3,833,147 4,642,192 7,497,506 6,507,506 10,623,134
EXCESS (DEFICIENCY) OFTOTAL AVAILABLE FUNDSOVER TOTAL REQUIREMENTS 580,803 488,342 252,292 1,550,796 (2,387,755)
ADJUSTMENT TO GAAP (356) 71,533 0 0 0
ENDING BALANCE 580,447 1,140,322 740,783 2,691,118 303,363
PARKING MANAGEMENT FUND
2012-13 Proposed Budget, Austin, TX
636 | Volume I
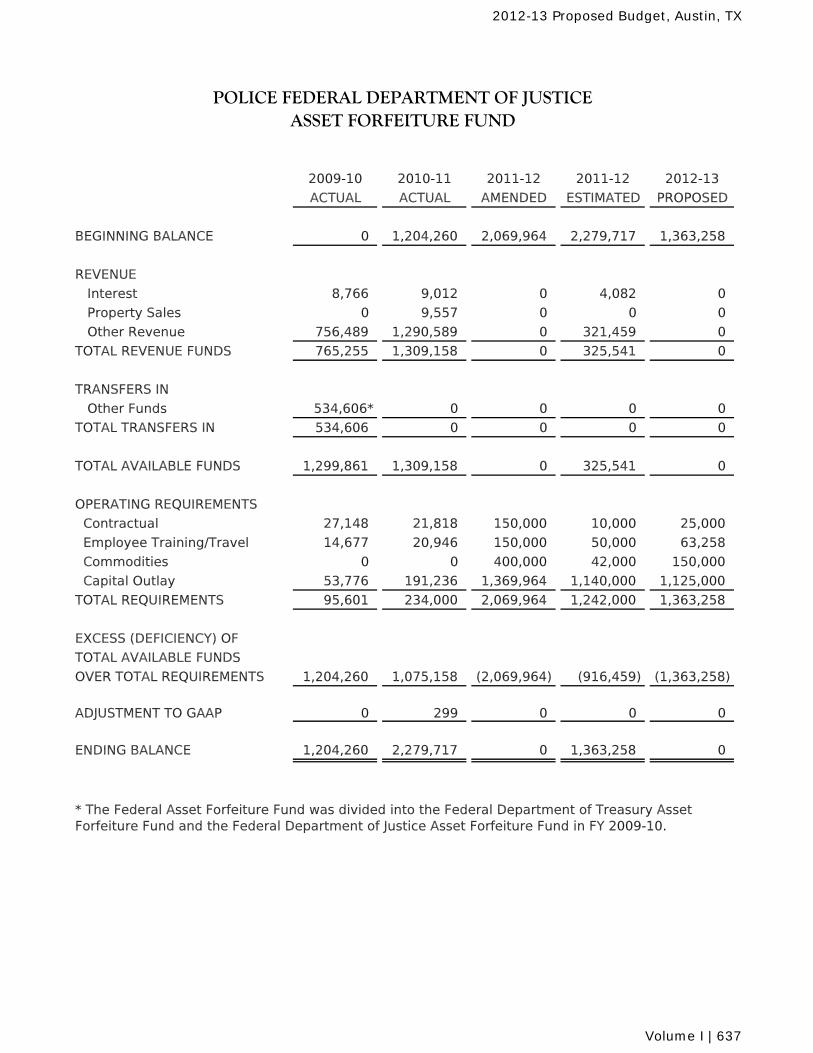
2009-10 2010-11 2011-12 2011-12 2012-13
ACTUAL ACTUAL AMENDED ESTIMATED PROPOSED
BEGINNING BALANCE 0 1,204,260 2,069,964 2,279,717 1,363,258
REVENUE
Interest 8,766 9,012 0 4,082 0
Property Sales 0 9,557 0 0 0
Other Revenue 756,489 1,290,589 0 321,459 0
TOTAL REVENUE FUNDS 765,255 1,309,158 0 325,541 0
TRANSFERS IN
Other Funds 534,606* 0 0 0 0
TOTAL TRANSFERS IN 534,606 0 0 0 0
TOTAL AVAILABLE FUNDS 1,299,861 1,309,158 0 325,541 0
OPERATING REQUIREMENTS
Contractual 27,148 21,818 150,000 10,000 25,000
Employee Training/Travel 14,677 20,946 150,000 50,000 63,258
Commodities 0 0 400,000 42,000 150,000
Capital Outlay 53,776 191,236 1,369,964 1,140,000 1,125,000
TOTAL REQUIREMENTS 95,601 234,000 2,069,964 1,242,000 1,363,258
EXCESS (DEFICIENCY) OF
TOTAL AVAILABLE FUNDS
OVER TOTAL REQUIREMENTS 1,204,260 1,075,158 (2,069,964) (916,459) (1,363,258)
ADJUSTMENT TO GAAP 0 299 0 0 0
ENDING BALANCE 1,204,260 2,279,717 0 1,363,258 0
POLICE FEDERAL DEPARTMENT OF JUSTICEASSET FORFEITURE FUND
* The Federal Asset Forfeiture Fund was divided into the Federal Department of Treasury Asset Forfeiture Fund and the Federal Department of Justice Asset Forfeiture Fund in FY 2009-10.
2012-13 Proposed Budget, Austin, TX
Volume I | 637
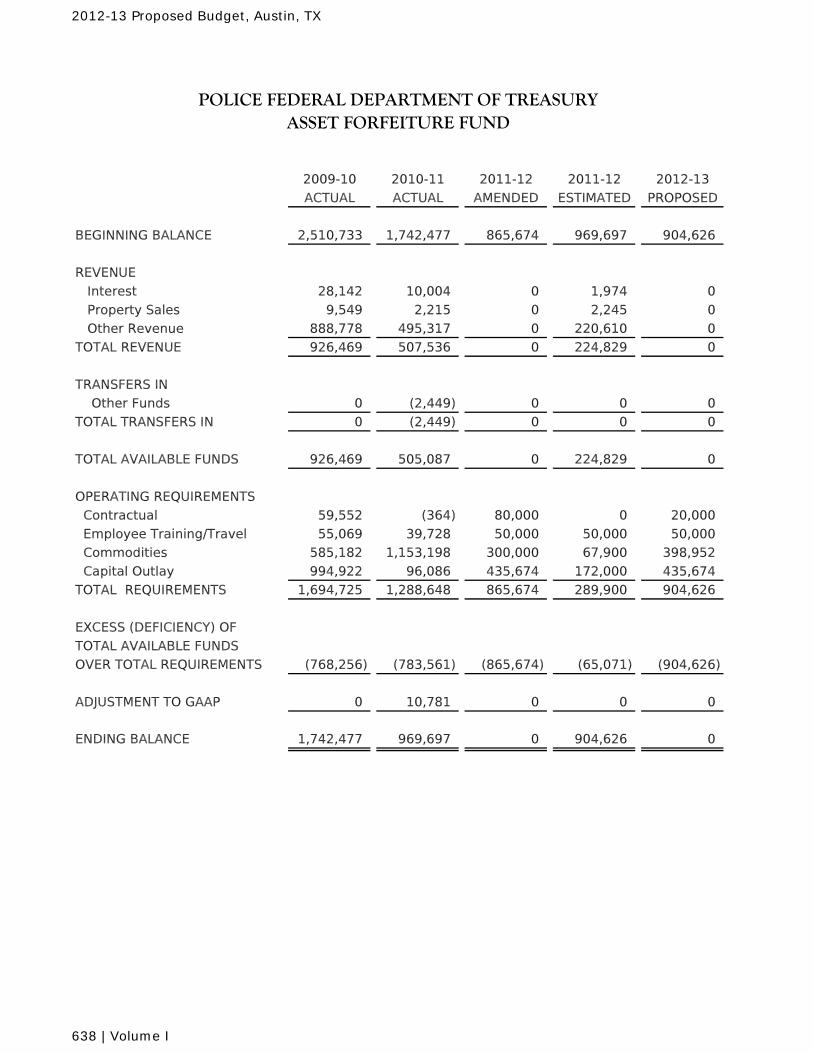
2009-10 2010-11 2011-12 2011-12 2012-13
ACTUAL ACTUAL AMENDED ESTIMATED PROPOSED
BEGINNING BALANCE 2,510,733 1,742,477 865,674 969,697 904,626
REVENUE
Interest 28,142 10,004 0 1,974 0
Property Sales 9,549 2,215 0 2,245 0
Other Revenue 888,778 495,317 0 220,610 0
TOTAL REVENUE 926,469 507,536 0 224,829 0
TRANSFERS IN
Other Funds 0 (2,449) 0 0 0
TOTAL TRANSFERS IN 0 (2,449) 0 0 0
TOTAL AVAILABLE FUNDS 926,469 505,087 0 224,829 0
OPERATING REQUIREMENTS
Contractual 59,552 (364) 80,000 0 20,000
Employee Training/Travel 55,069 39,728 50,000 50,000 50,000
Commodities 585,182 1,153,198 300,000 67,900 398,952
Capital Outlay 994,922 96,086 435,674 172,000 435,674
TOTAL REQUIREMENTS 1,694,725 1,288,648 865,674 289,900 904,626
EXCESS (DEFICIENCY) OF
TOTAL AVAILABLE FUNDS
OVER TOTAL REQUIREMENTS (768,256) (783,561) (865,674) (65,071) (904,626)
ADJUSTMENT TO GAAP 0 10,781 0 0 0
ENDING BALANCE 1,742,477 969,697 0 904,626 0
POLICE FEDERAL DEPARTMENT OF TREASURY ASSET FORFEITURE FUND
2012-13 Proposed Budget, Austin, TX
638 | Volume I
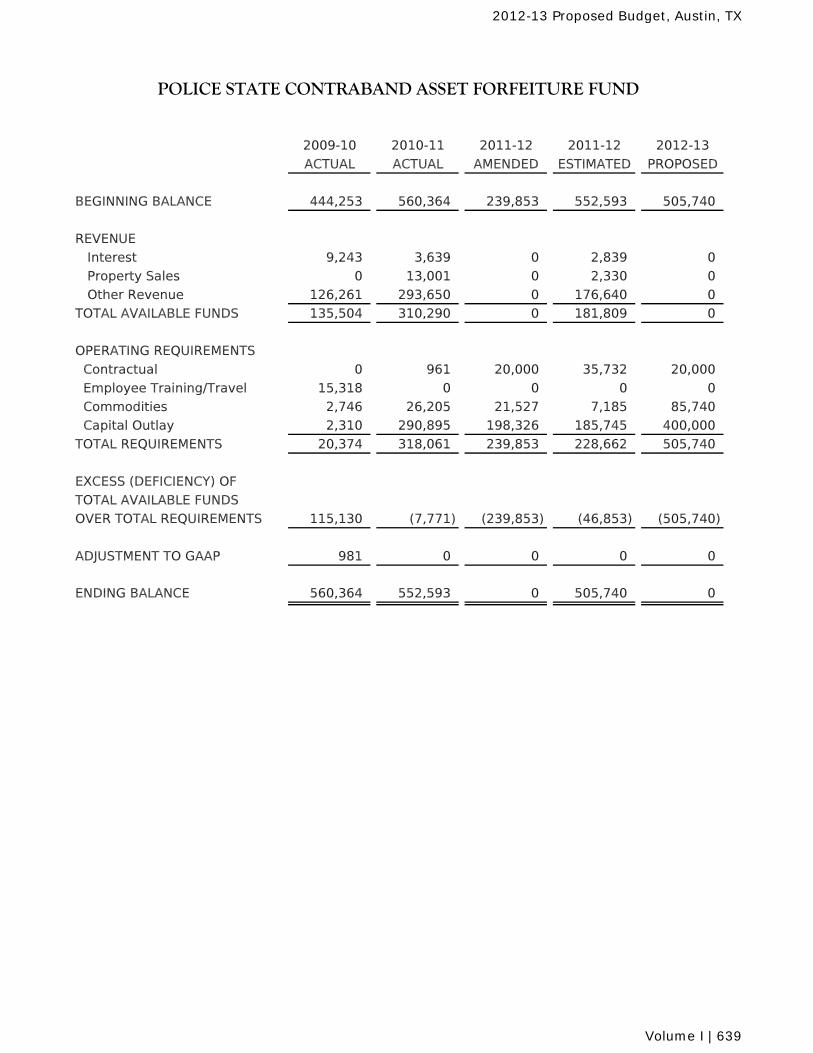
2009-10 2010-11 2011-12 2011-12 2012-13
ACTUAL ACTUAL AMENDED ESTIMATED PROPOSED
BEGINNING BALANCE 444,253 560,364 239,853 552,593 505,740
REVENUE
Interest 9,243 3,639 0 2,839 0
Property Sales 0 13,001 0 2,330 0
Other Revenue 126,261 293,650 0 176,640 0
TOTAL AVAILABLE FUNDS 135,504 310,290 0 181,809 0
OPERATING REQUIREMENTS
Contractual 0 961 20,000 35,732 20,000
Employee Training/Travel 15,318 0 0 0 0
Commodities 2,746 26,205 21,527 7,185 85,740
Capital Outlay 2,310 290,895 198,326 185,745 400,000
TOTAL REQUIREMENTS 20,374 318,061 239,853 228,662 505,740
EXCESS (DEFICIENCY) OF
TOTAL AVAILABLE FUNDS
OVER TOTAL REQUIREMENTS 115,130 (7,771) (239,853) (46,853) (505,740)
ADJUSTMENT TO GAAP 981 0 0 0 0
ENDING BALANCE 560,364 552,593 0 505,740 0
POLICE STATE CONTRABAND ASSET FORFEITURE FUND
2012-13 Proposed Budget, Austin, TX
Volume I | 639
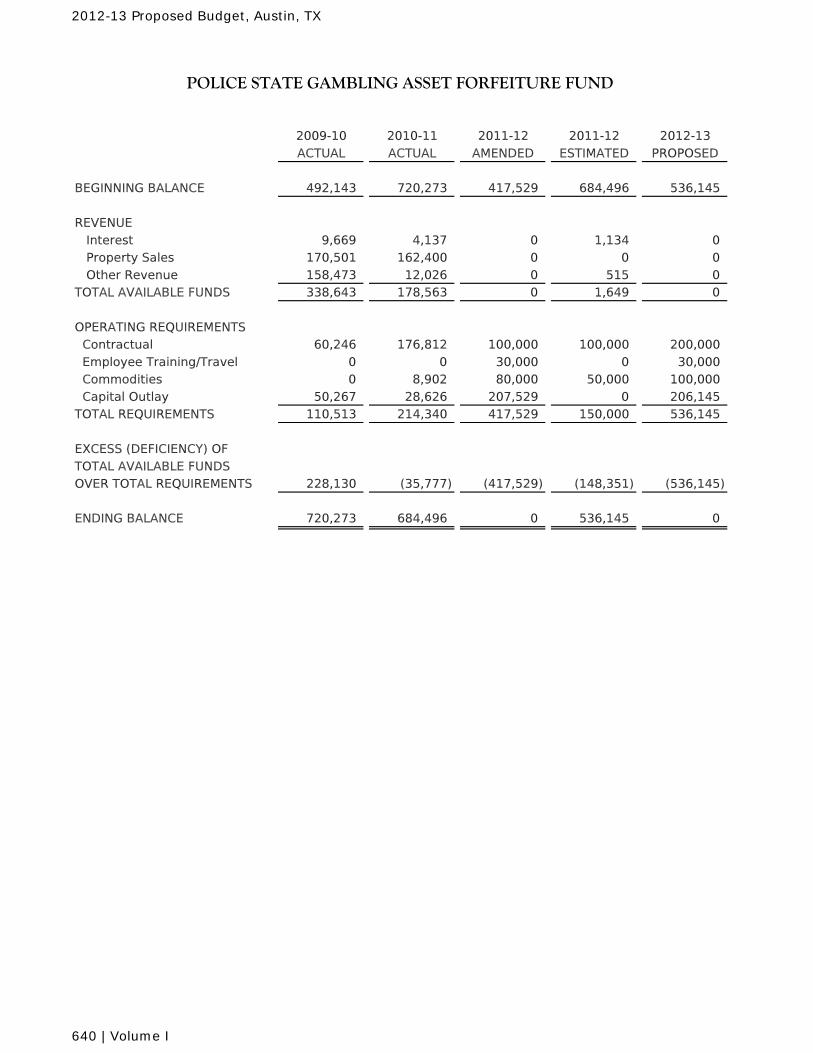
2009-10 2010-11 2011-12 2011-12 2012-13ACTUAL ACTUAL AMENDED ESTIMATED PROPOSED
BEGINNING BALANCE 492,143 720,273 417,529 684,496 536,145
REVENUE Interest 9,669 4,137 0 1,134 0 Property Sales 170,501 162,400 0 0 0 Other Revenue 158,473 12,026 0 515 0TOTAL AVAILABLE FUNDS 338,643 178,563 0 1,649 0
OPERATING REQUIREMENTS Contractual 60,246 176,812 100,000 100,000 200,000 Employee Training/Travel 0 0 30,000 0 30,000 Commodities 0 8,902 80,000 50,000 100,000 Capital Outlay 50,267 28,626 207,529 0 206,145TOTAL REQUIREMENTS 110,513 214,340 417,529 150,000 536,145
EXCESS (DEFICIENCY) OF TOTAL AVAILABLE FUNDSOVER TOTAL REQUIREMENTS 228,130 (35,777) (417,529) (148,351) (536,145)
ENDING BALANCE 720,273 684,496 0 536,145 0
POLICE STATE GAMBLING ASSET FORFEITURE FUND
2012-13 Proposed Budget, Austin, TX
640 | Volume I
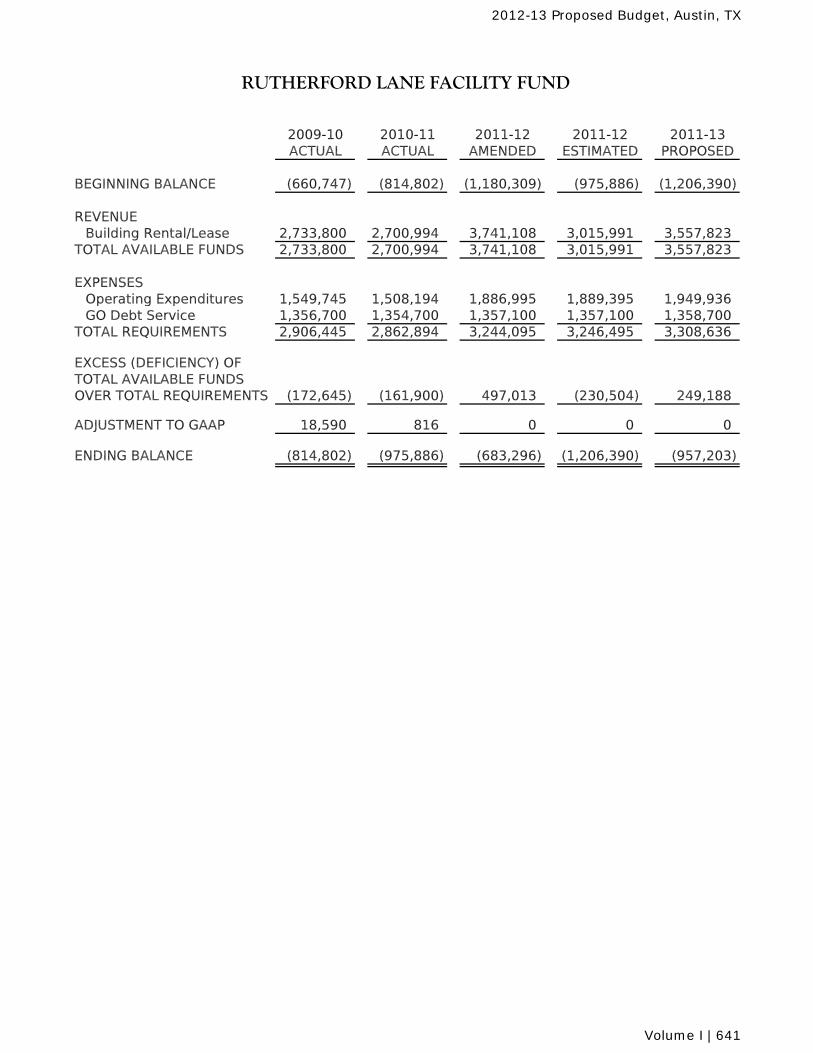
2009-10 2010-11 2011-12 2011-12 2011-13ACTUAL ACTUAL AMENDED ESTIMATED PROPOSED
BEGINNING BALANCE (660,747) (814,802) (1,180,309) (975,886) (1,206,390)
REVENUEBuilding Rental/Lease 2,733,800 2,700,994 3,741,108 3,015,991 3,557,823
TOTAL AVAILABLE FUNDS 2,733,800 2,700,994 3,741,108 3,015,991 3,557,823
EXPENSESOperating Expenditures 1,549,745 1,508,194 1,886,995 1,889,395 1,949,936GO Debt Service 1,356,700 1,354,700 1,357,100 1,357,100 1,358,700
TOTAL REQUIREMENTS 2,906,445 2,862,894 3,244,095 3,246,495 3,308,636
EXCESS (DEFICIENCY) OFTOTAL AVAILABLE FUNDS OVER TOTAL REQUIREMENTS (172,645) (161,900) 497,013 (230,504) 249,188
ADJUSTMENT TO GAAP 18,590 816 0 0 0
ENDING BALANCE (814,802) (975,886) (683,296) (1,206,390) (957,203)
RUTHERFORD LANE FACILITY FUND
2012-13 Proposed Budget, Austin, TX
Volume I | 641
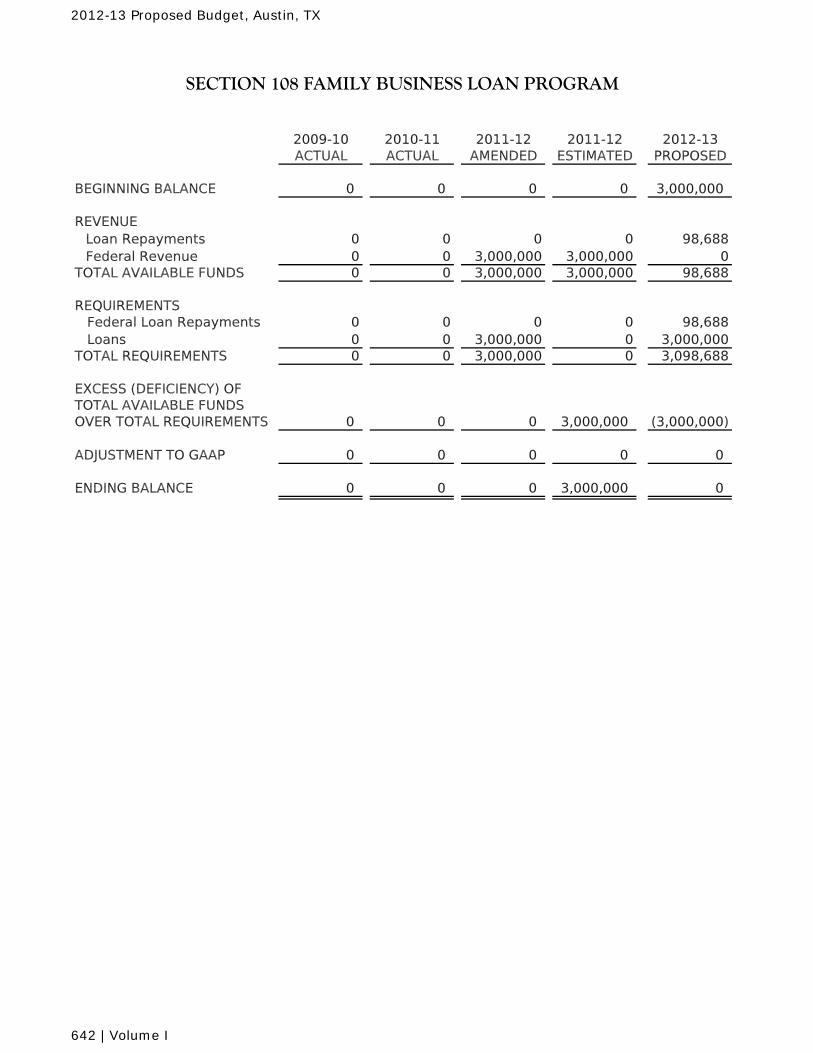
2009-10 2010-11 2011-12 2011-12 2012-13ACTUAL ACTUAL AMENDED ESTIMATED PROPOSED
BEGINNING BALANCE 0 0 0 0 3,000,000
REVENUELoan Repayments 0 0 0 0 98,688Federal Revenue 0 0 3,000,000 3,000,000 0
TOTAL AVAILABLE FUNDS 0 0 3,000,000 3,000,000 98,688
REQUIREMENTS Federal Loan Repayments 0 0 0 0 98,688 Loans 0 0 3,000,000 0 3,000,000TOTAL REQUIREMENTS 0 0 3,000,000 0 3,098,688
EXCESS (DEFICIENCY) OF TOTAL AVAILABLE FUNDS OVER TOTAL REQUIREMENTS 0 0 0 3,000,000 (3,000,000)
ADJUSTMENT TO GAAP 0 0 0 0 0
ENDING BALANCE 0 0 0 3,000,000 0
SECTION 108 FAMILY BUSINESS LOAN PROGRAM
2012-13 Proposed Budget, Austin, TX
642 | Volume I
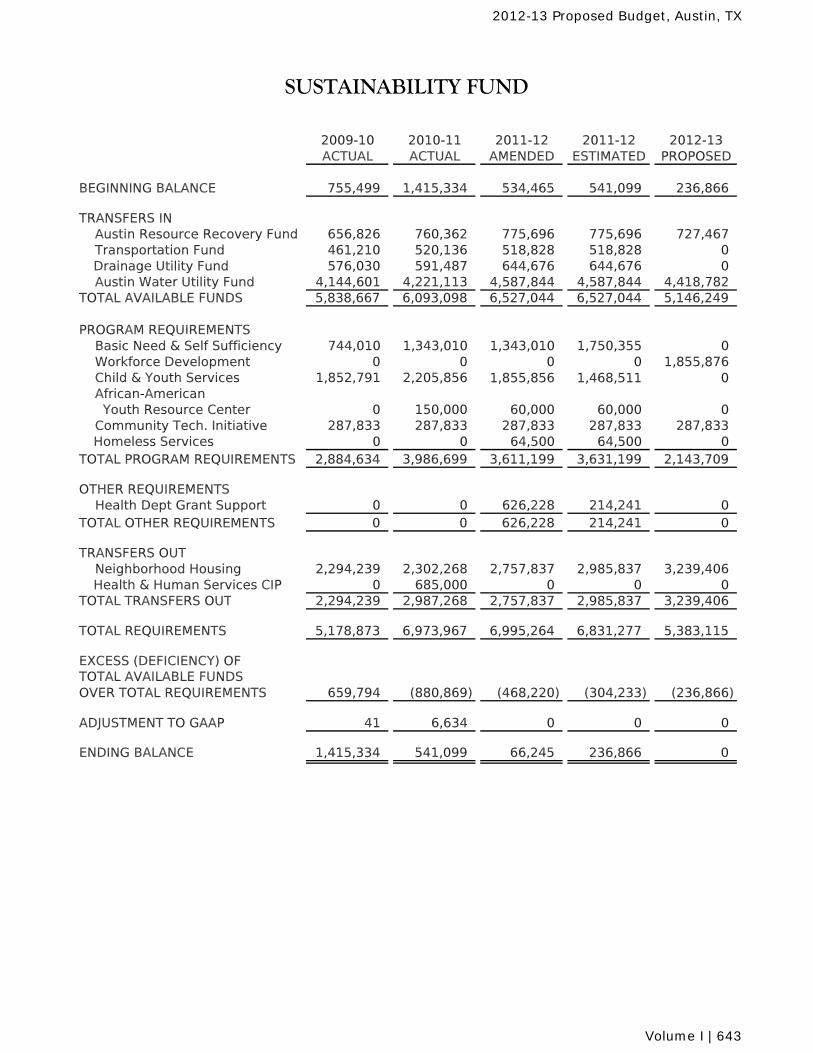
2009-10 2010-11 2011-12 2011-12 2012-13ACTUAL ACTUAL AMENDED ESTIMATED PROPOSED
BEGINNING BALANCE 755,499 1,415,334 534,465 541,099 236,866
TRANSFERS IN Austin Resource Recovery Fund 656,826 760,362 775,696 775,696 727,467 Transportation Fund 461,210 520,136 518,828 518,828 0
Drainage Utility Fund 576,030 591,487 644,676 644,676 0 Austin Water Utility Fund 4,144,601 4,221,113 4,587,844 4,587,844 4,418,782TOTAL AVAILABLE FUNDS 5,838,667 6,093,098 6,527,044 6,527,044 5,146,249
PROGRAM REQUIREMENTS Basic Need & Self Sufficiency 744,010 1,343,010 1,343,010 1,750,355 0 Workforce Development 0 0 0 0 1,855,876 Child & Youth Services 1,852,791 2,205,856 1,855,856 1,468,511 0 African-American Youth Resource Center 0 150,000 60,000 60,000 0 Community Tech. Initiative 287,833 287,833 287,833 287,833 287,833
Homeless Services 0 0 64,500 64,500 0TOTAL PROGRAM REQUIREMENTS 2,884,634 3,986,699 3,611,199 3,631,199 2,143,709
OTHER REQUIREMENTS Health Dept Grant Support 0 0 626,228 214,241 0TOTAL OTHER REQUIREMENTS 0 0 626,228 214,241 0
TRANSFERS OUT Neighborhood Housing 2,294,239 2,302,268 2,757,837 2,985,837 3,239,406
Health & Human Services CIP 0 685,000 0 0 0TOTAL TRANSFERS OUT 2,294,239 2,987,268 2,757,837 2,985,837 3,239,406
TOTAL REQUIREMENTS 5,178,873 6,973,967 6,995,264 6,831,277 5,383,115
EXCESS (DEFICIENCY) OFTOTAL AVAILABLE FUNDSOVER TOTAL REQUIREMENTS 659,794 (880,869) (468,220) (304,233) (236,866)
ADJUSTMENT TO GAAP 41 6,634 0 0 0
ENDING BALANCE 1,415,334 541,099 66,245 236,866 0
SUSTAINABILITY FUND
2012-13 Proposed Budget, Austin, TX
Volume I | 643
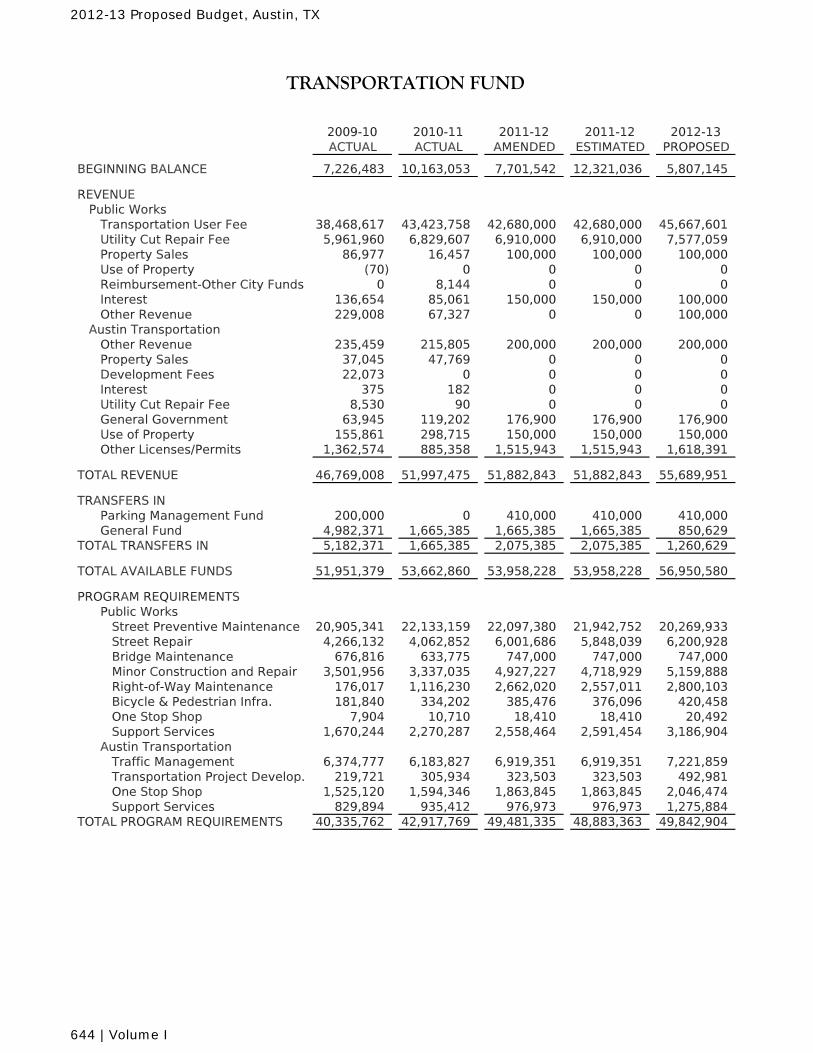
2009-10 2010-11 2011-12 2011-12 2012-13ACTUAL ACTUAL AMENDED ESTIMATED PROPOSED
BEGINNING BALANCE 7,226,483 10,163,053 7,701,542 12,321,036 5,807,145
REVENUEPublic Works
Transportation User Fee 38,468,617 43,423,758 42,680,000 42,680,000 45,667,601Utility Cut Repair Fee 5,961,960 6,829,607 6,910,000 6,910,000 7,577,059Property Sales 86,977 16,457 100,000 100,000 100,000Use of Property (70) 0 0 0 0Reimbursement-Other City Funds 0 8,144 0 0 0Interest 136,654 85,061 150,000 150,000 100,000Other Revenue 229,008 67,327 0 0 100,000
Austin TransportationOther Revenue 235,459 215,805 200,000 200,000 200,000Property Sales 37,045 47,769 0 0 0Development Fees 22,073 0 0 0 0Interest 375 182 0 0 0Utility Cut Repair Fee 8,530 90 0 0 0General Government 63,945 119,202 176,900 176,900 176,900Use of Property 155,861 298,715 150,000 150,000 150,000Other Licenses/Permits 1,362,574 885,358 1,515,943 1,515,943 1,618,391
TOTAL REVENUE 46,769,008 51,997,475 51,882,843 51,882,843 55,689,951
TRANSFERS INParking Management Fund 200,000 0 410,000 410,000 410,000General Fund 4,982,371 1,665,385 1,665,385 1,665,385 850,629
TOTAL TRANSFERS IN 5,182,371 1,665,385 2,075,385 2,075,385 1,260,629
TOTAL AVAILABLE FUNDS 51,951,379 53,662,860 53,958,228 53,958,228 56,950,580
PROGRAM REQUIREMENTSPublic Works Street Preventive Maintenance 20,905,341 22,133,159 22,097,380 21,942,752 20,269,933 Street Repair 4,266,132 4,062,852 6,001,686 5,848,039 6,200,928 Bridge Maintenance 676,816 633,775 747,000 747,000 747,000 Minor Construction and Repair 3,501,956 3,337,035 4,927,227 4,718,929 5,159,888 Right-of-Way Maintenance 176,017 1,116,230 2,662,020 2,557,011 2,800,103 Bicycle & Pedestrian Infra. 181,840 334,202 385,476 376,096 420,458 One Stop Shop 7,904 10,710 18,410 18,410 20,492 Support Services 1,670,244 2,270,287 2,558,464 2,591,454 3,186,904Austin Transportation Traffic Management 6,374,777 6,183,827 6,919,351 6,919,351 7,221,859 Transportation Project Develop. 219,721 305,934 323,503 323,503 492,981 One Stop Shop 1,525,120 1,594,346 1,863,845 1,863,845 2,046,474 Support Services 829,894 935,412 976,973 976,973 1,275,884
TOTAL PROGRAM REQUIREMENTS 40,335,762 42,917,769 49,481,335 48,883,363 49,842,904
TRANSPORTATION FUND
2012-13 Proposed Budget, Austin, TX
644 | Volume I
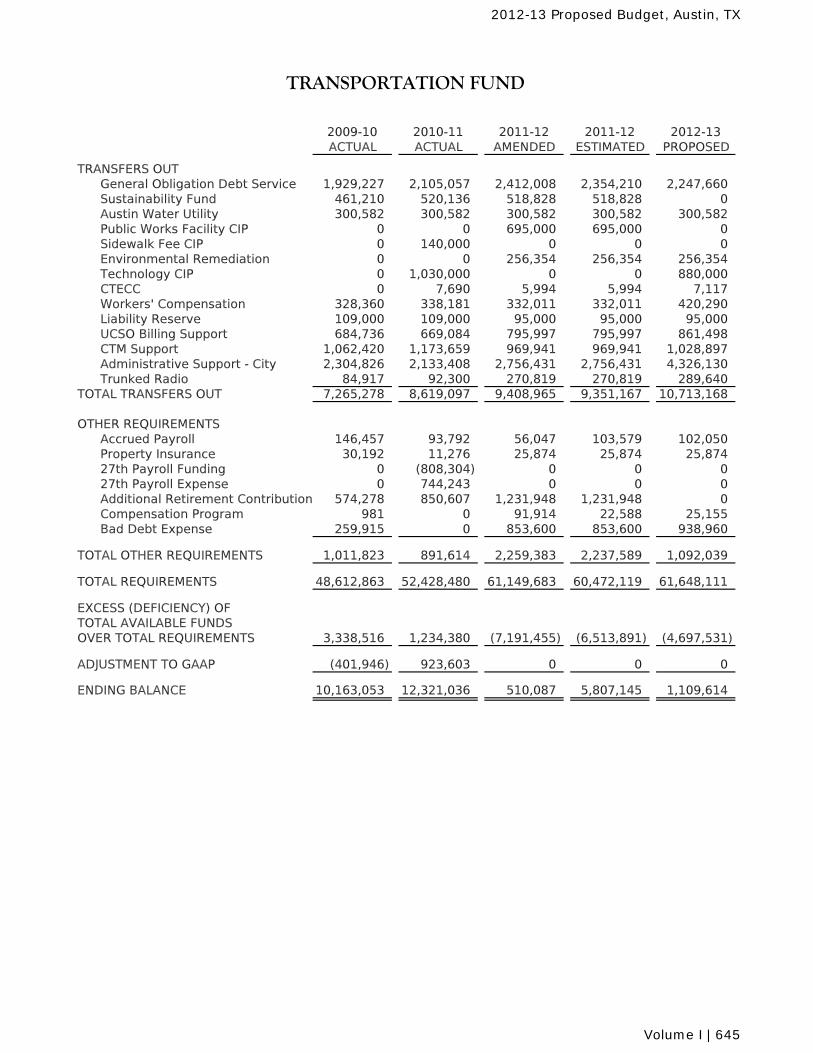
2009-10 2010-11 2011-12 2011-12 2012-13ACTUAL ACTUAL AMENDED ESTIMATED PROPOSED
TRANSPORTATION FUND
TRANSFERS OUTGeneral Obligation Debt Service 1,929,227 2,105,057 2,412,008 2,354,210 2,247,660Sustainability Fund 461,210 520,136 518,828 518,828 0Austin Water Utility 300,582 300,582 300,582 300,582 300,582Public Works Facility CIP 0 0 695,000 695,000 0Sidewalk Fee CIP 0 140,000 0 0 0Environmental Remediation 0 0 256,354 256,354 256,354Technology CIP 0 1,030,000 0 0 880,000CTECC 0 7,690 5,994 5,994 7,117Workers' Compensation 328,360 338,181 332,011 332,011 420,290Liability Reserve 109,000 109,000 95,000 95,000 95,000UCSO Billing Support 684,736 669,084 795,997 795,997 861,498CTM Support 1,062,420 1,173,659 969,941 969,941 1,028,897Administrative Support - City 2,304,826 2,133,408 2,756,431 2,756,431 4,326,130Trunked Radio 84,917 92,300 270,819 270,819 289,640
TOTAL TRANSFERS OUT 7,265,278 8,619,097 9,408,965 9,351,167 10,713,168
OTHER REQUIREMENTS Accrued Payroll 146,457 93,792 56,047 103,579 102,050Property Insurance 30,192 11,276 25,874 25,874 25,87427th Payroll Funding 0 (808,304) 0 0 027th Payroll Expense 0 744,243 0 0 0Additional Retirement Contribution 574,278 850,607 1,231,948 1,231,948 0Compensation Program 981 0 91,914 22,588 25,155Bad Debt Expense 259,915 0 853,600 853,600 938,960
TOTAL OTHER REQUIREMENTS 1,011,823 891,614 2,259,383 2,237,589 1,092,039
TOTAL REQUIREMENTS 48,612,863 52,428,480 61,149,683 60,472,119 61,648,111
EXCESS (DEFICIENCY) OFTOTAL AVAILABLE FUNDSOVER TOTAL REQUIREMENTS 3,338,516 1,234,380 (7,191,455) (6,513,891) (4,697,531)
ADJUSTMENT TO GAAP (401,946) 923,603 0 0 0
ENDING BALANCE 10,163,053 12,321,036 510,087 5,807,145 1,109,614
2012-13 Proposed Budget, Austin, TX
Volume I | 645
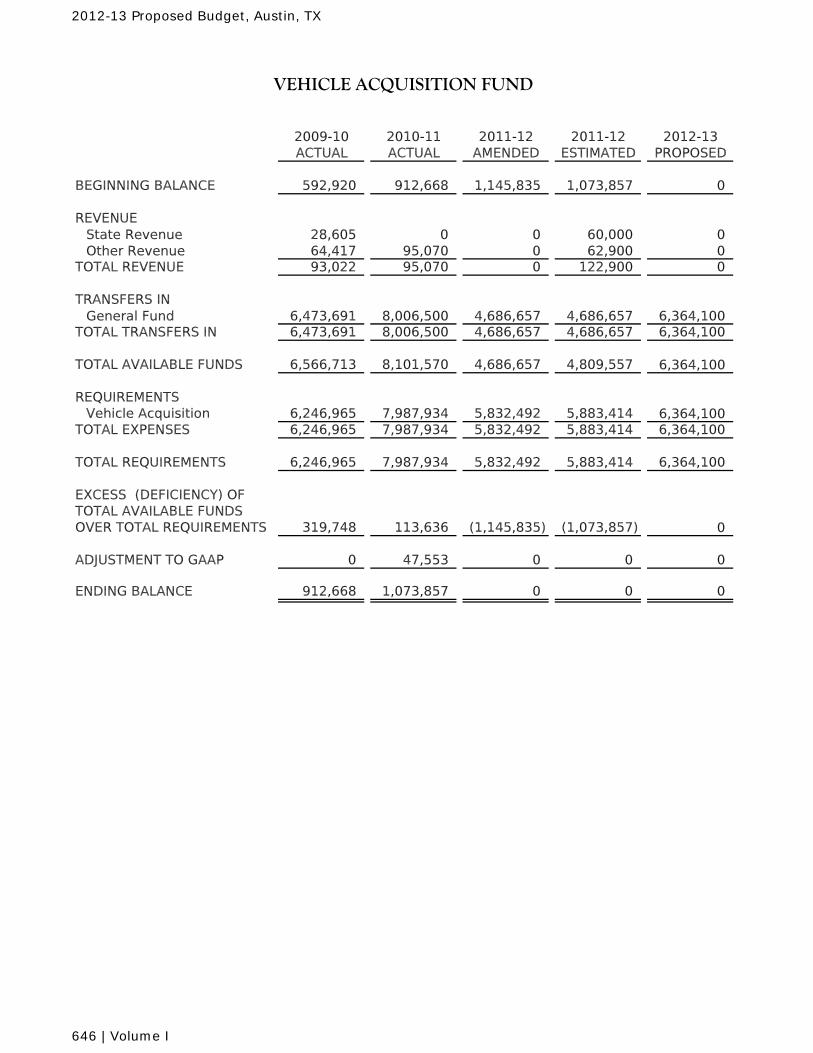
2009-10 2010-11 2011-12 2011-12 2012-13ACTUAL ACTUAL AMENDED ESTIMATED PROPOSED
BEGINNING BALANCE 592,920 912,668 1,145,835 1,073,857 0
REVENUEState Revenue 28,605 0 0 60,000 0Other Revenue 64,417 95,070 0 62,900 0
TOTAL REVENUE 93,022 95,070 0 122,900 0
TRANSFERS INGeneral Fund 6,473,691 8,006,500 4,686,657 4,686,657 6,364,100
TOTAL TRANSFERS IN 6,473,691 8,006,500 4,686,657 4,686,657 6,364,100
TOTAL AVAILABLE FUNDS 6,566,713 8,101,570 4,686,657 4,809,557 6,364,100
REQUIREMENTSVehicle Acquisition 6,246,965 7,987,934 5,832,492 5,883,414 6,364,100
TOTAL EXPENSES 6,246,965 7,987,934 5,832,492 5,883,414 6,364,100
TOTAL REQUIREMENTS 6,246,965 7,987,934 5,832,492 5,883,414 6,364,100
EXCESS (DEFICIENCY) OFTOTAL AVAILABLE FUNDSOVER TOTAL REQUIREMENTS 319,748 113,636 (1,145,835) (1,073,857) 0
ADJUSTMENT TO GAAP 0 47,553 0 0 0
ENDING BALANCE 912,668 1,073,857 0 0 0
VEHICLE ACQUISITION FUND
2012-13 Proposed Budget, Austin, TX
646 | Volume I
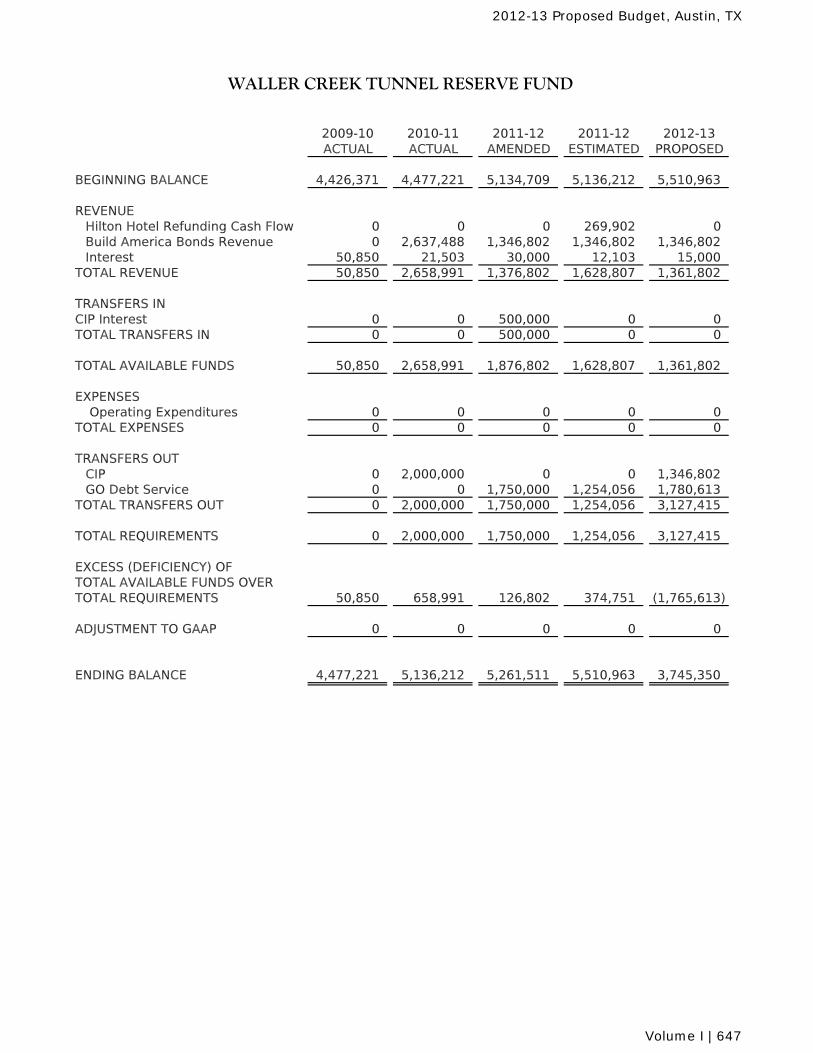
2009-10 2010-11 2011-12 2011-12 2012-13ACTUAL ACTUAL AMENDED ESTIMATED PROPOSED
BEGINNING BALANCE 4,426,371 4,477,221 5,134,709 5,136,212 5,510,963
REVENUEHilton Hotel Refunding Cash Flow 0 0 0 269,902 0Build America Bonds Revenue 0 2,637,488 1,346,802 1,346,802 1,346,802Interest 50,850 21,503 30,000 12,103 15,000
TOTAL REVENUE 50,850 2,658,991 1,376,802 1,628,807 1,361,802
TRANSFERS INCIP Interest 0 0 500,000 0 0TOTAL TRANSFERS IN 0 0 500,000 0 0
TOTAL AVAILABLE FUNDS 50,850 2,658,991 1,876,802 1,628,807 1,361,802
EXPENSES Operating Expenditures 0 0 0 0 0
TOTAL EXPENSES 0 0 0 0 0
TRANSFERS OUTCIP 0 2,000,000 0 0 1,346,802GO Debt Service 0 0 1,750,000 1,254,056 1,780,613
TOTAL TRANSFERS OUT 0 2,000,000 1,750,000 1,254,056 3,127,415
TOTAL REQUIREMENTS 0 2,000,000 1,750,000 1,254,056 3,127,415
EXCESS (DEFICIENCY) OFTOTAL AVAILABLE FUNDS OVERTOTAL REQUIREMENTS 50,850 658,991 126,802 374,751 (1,765,613)
ADJUSTMENT TO GAAP 0 0 0 0 0
ENDING BALANCE 4,477,221 5,136,212 5,261,511 5,510,963 3,745,350
WALLER CREEK TUNNEL RESERVE FUND
2012-13 Proposed Budget, Austin, TX
Volume I | 647
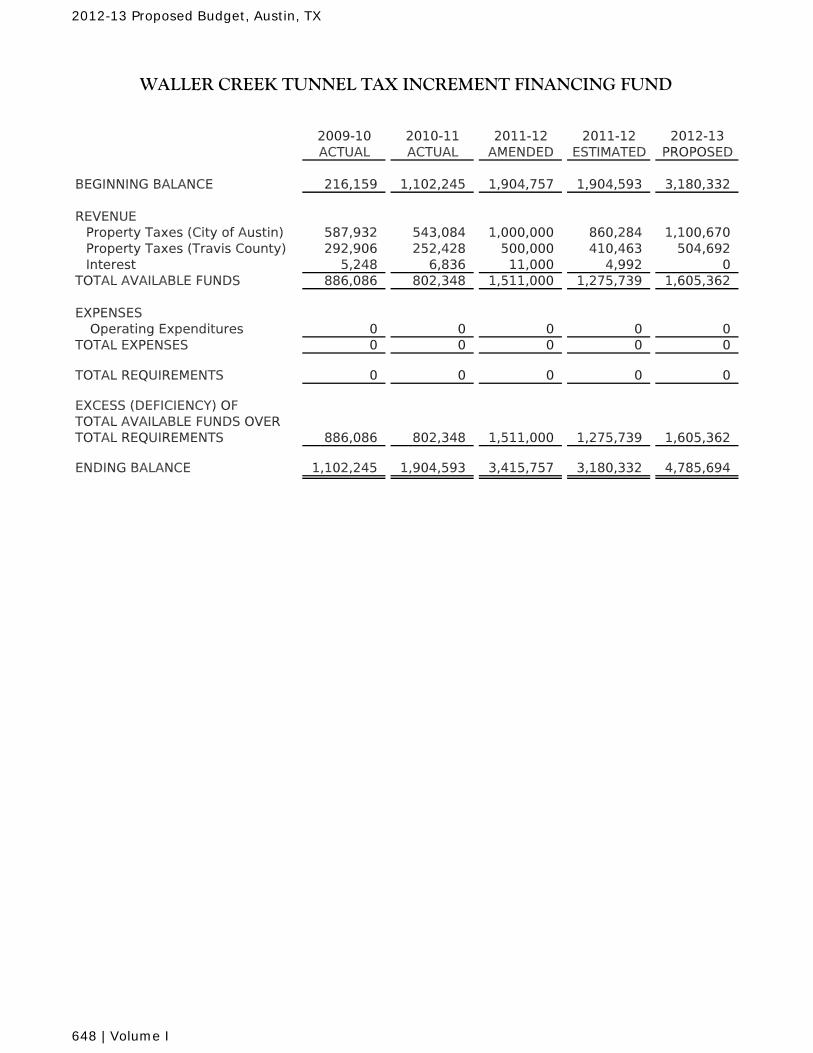
2009-10 2010-11 2011-12 2011-12 2012-13ACTUAL ACTUAL AMENDED ESTIMATED PROPOSED
BEGINNING BALANCE 216,159 1,102,245 1,904,757 1,904,593 3,180,332
REVENUEProperty Taxes (City of Austin) 587,932 543,084 1,000,000 860,284 1,100,670Property Taxes (Travis County) 292,906 252,428 500,000 410,463 504,692Interest 5,248 6,836 11,000 4,992 0
TOTAL AVAILABLE FUNDS 886,086 802,348 1,511,000 1,275,739 1,605,362
EXPENSES Operating Expenditures 0 0 0 0 0
TOTAL EXPENSES 0 0 0 0 0
TOTAL REQUIREMENTS 0 0 0 0 0
EXCESS (DEFICIENCY) OFTOTAL AVAILABLE FUNDS OVERTOTAL REQUIREMENTS 886,086 802,348 1,511,000 1,275,739 1,605,362
ENDING BALANCE 1,102,245 1,904,593 3,415,757 3,180,332 4,785,694
WALLER CREEK TUNNEL TAX INCREMENT FINANCING FUND
2012-13 Proposed Budget, Austin, TX
648 | Volume I
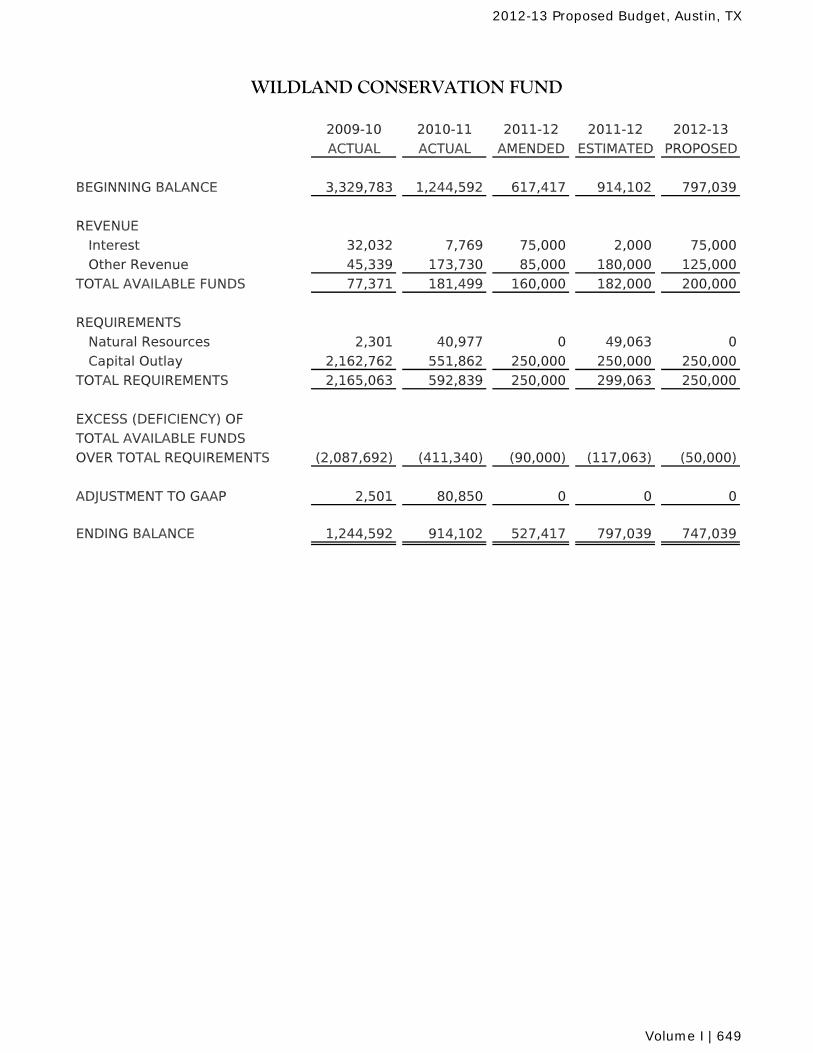
2009-10 2010-11 2011-12 2011-12 2012-13
ACTUAL ACTUAL AMENDED ESTIMATED PROPOSED
BEGINNING BALANCE 3,329,783 1,244,592 617,417 914,102 797,039
REVENUE
Interest 32,032 7,769 75,000 2,000 75,000
Other Revenue 45,339 173,730 85,000 180,000 125,000
TOTAL AVAILABLE FUNDS 77,371 181,499 160,000 182,000 200,000
REQUIREMENTS
Natural Resources 2,301 40,977 0 49,063 0
Capital Outlay 2,162,762 551,862 250,000 250,000 250,000
TOTAL REQUIREMENTS 2,165,063 592,839 250,000 299,063 250,000
EXCESS (DEFICIENCY) OF
TOTAL AVAILABLE FUNDS
OVER TOTAL REQUIREMENTS (2,087,692) (411,340) (90,000) (117,063) (50,000)
ADJUSTMENT TO GAAP 2,501 80,850 0 0 0
ENDING BALANCE 1,244,592 914,102 527,417 797,039 747,039
WILDLAND CONSERVATION FUND
2012-13 Proposed Budget, Austin, TX
Volume I | 649
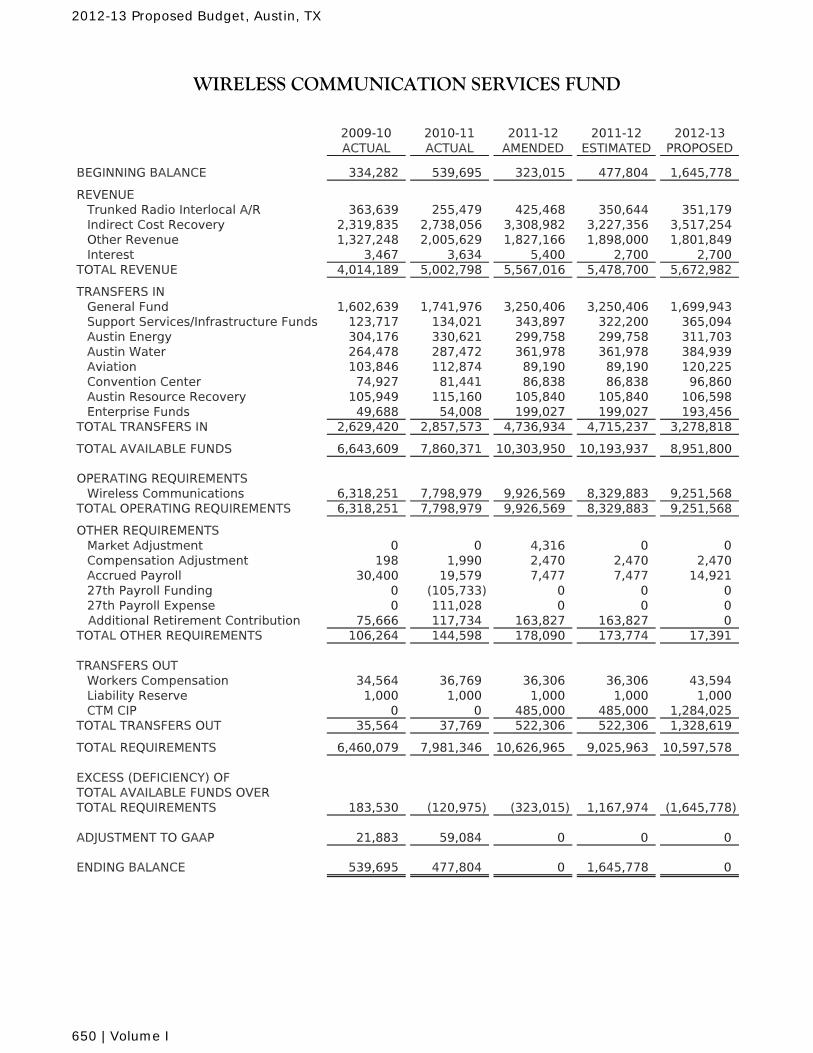
2009-10 ACTUAL
2010-11 ACTUAL
2011-12 AMENDED
2011-12 ESTIMATED
2012-13 PROPOSED
BEGINNING BALANCE 334,282 539,695 323,015 477,804 1,645,778
REVENUETrunked Radio Interlocal A/R 363,639 255,479 425,468 350,644 351,179Indirect Cost Recovery 2,319,835 2,738,056 3,308,982 3,227,356 3,517,254Other Revenue 1,327,248 2,005,629 1,827,166 1,898,000 1,801,849Interest 3,467 3,634 5,400 2,700 2,700
TOTAL REVENUE 4,014,189 5,002,798 5,567,016 5,478,700 5,672,982
TRANSFERS INGeneral Fund 1,602,639 1,741,976 3,250,406 3,250,406 1,699,943Support Services/Infrastructure Funds 123,717 134,021 343,897 322,200 365,094Austin Energy 304,176 330,621 299,758 299,758 311,703Austin Water 264,478 287,472 361,978 361,978 384,939Aviation 103,846 112,874 89,190 89,190 120,225Convention Center 74,927 81,441 86,838 86,838 96,860Austin Resource Recovery 105,949 115,160 105,840 105,840 106,598Enterprise Funds 49,688 54,008 199,027 199,027 193,456
TOTAL TRANSFERS IN 2,629,420 2,857,573 4,736,934 4,715,237 3,278,818
TOTAL AVAILABLE FUNDS 6,643,609 7,860,371 10,303,950 10,193,937 8,951,800
OPERATING REQUIREMENTSWireless Communications 6,318,251 7,798,979 9,926,569 8,329,883 9,251,568
TOTAL OPERATING REQUIREMENTS 6,318,251 7,798,979 9,926,569 8,329,883 9,251,568
OTHER REQUIREMENTSMarket Adjustment 0 0 4,316 0 0Compensation Adjustment 198 1,990 2,470 2,470 2,470Accrued Payroll 30,400 19,579 7,477 7,477 14,92127th Payroll Funding 0 (105,733) 0 0 027th Payroll Expense 0 111,028 0 0 0
Additional Retirement Contribution 75,666 117,734 163,827 163,827 0TOTAL OTHER REQUIREMENTS 106,264 144,598 178,090 173,774 17,391
TRANSFERS OUTWorkers Compensation 34,564 36,769 36,306 36,306 43,594Liability Reserve 1,000 1,000 1,000 1,000 1,000CTM CIP 0 0 485,000 485,000 1,284,025
TOTAL TRANSFERS OUT 35,564 37,769 522,306 522,306 1,328,619
TOTAL REQUIREMENTS 6,460,079 7,981,346 10,626,965 9,025,963 10,597,578
EXCESS (DEFICIENCY) OFTOTAL AVAILABLE FUNDS OVERTOTAL REQUIREMENTS 183,530 (120,975) (323,015) 1,167,974 (1,645,778)
ADJUSTMENT TO GAAP 21,883 59,084 0 0 0
ENDING BALANCE 539,695 477,804 0 1,645,778 0
WIRELESS COMMUNICATION SERVICES FUND
2012-13 Proposed Budget, Austin, TX
650 | Volume I
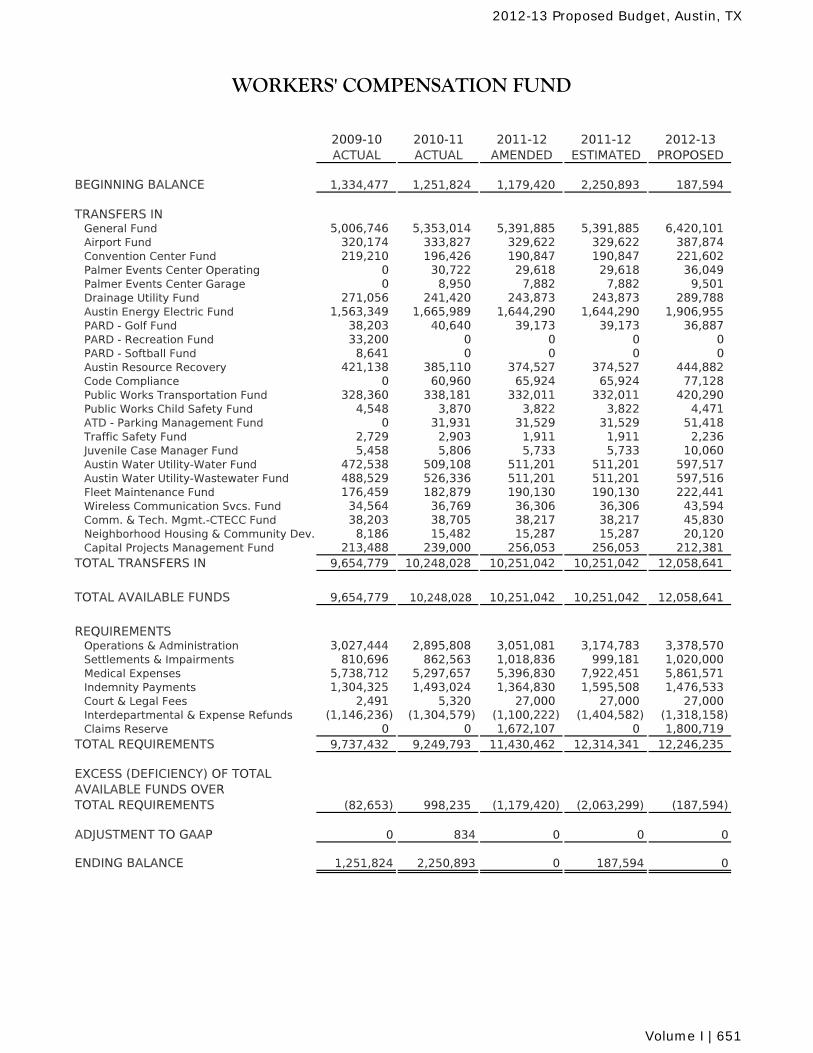
2009-10 2010-11 2011-12 2011-12 2012-13ACTUAL ACTUAL AMENDED ESTIMATED PROPOSED
BEGINNING BALANCE 1,334,477 1,251,824 1,179,420 2,250,893 187,594
TRANSFERS INGeneral Fund 5,006,746 5,353,014 5,391,885 5,391,885 6,420,101Airport Fund 320,174 333,827 329,622 329,622 387,874Convention Center Fund 219,210 196,426 190,847 190,847 221,602Palmer Events Center Operating 0 30,722 29,618 29,618 36,049Palmer Events Center Garage 0 8,950 7,882 7,882 9,501Drainage Utility Fund 271,056 241,420 243,873 243,873 289,788Austin Energy Electric Fund 1,563,349 1,665,989 1,644,290 1,644,290 1,906,955PARD - Golf Fund 38,203 40,640 39,173 39,173 36,887PARD - Recreation Fund 33,200 0 0 0 0PARD - Softball Fund 8,641 0 0 0 0Austin Resource Recovery 421,138 385,110 374,527 374,527 444,882Code Compliance 0 60,960 65,924 65,924 77,128Public Works Transportation Fund 328,360 338,181 332,011 332,011 420,290Public Works Child Safety Fund 4,548 3,870 3,822 3,822 4,471ATD - Parking Management Fund 0 31,931 31,529 31,529 51,418Traffic Safety Fund 2,729 2,903 1,911 1,911 2,236Juvenile Case Manager Fund 5,458 5,806 5,733 5,733 10,060Austin Water Utility-Water Fund 472,538 509,108 511,201 511,201 597,517Austin Water Utility-Wastewater Fund 488,529 526,336 511,201 511,201 597,516Fleet Maintenance Fund 176,459 182,879 190,130 190,130 222,441Wireless Communication Svcs. Fund 34,564 36,769 36,306 36,306 43,594Comm. & Tech. Mgmt.-CTECC Fund 38,203 38,705 38,217 38,217 45,830Neighborhood Housing & Community Dev. 8,186 15,482 15,287 15,287 20,120Capital Projects Management Fund 213,488 239,000 256,053 256,053 212,381
TOTAL TRANSFERS IN 9,654,779 10,248,028 10,251,042 10,251,042 12,058,641
TOTAL AVAILABLE FUNDS 9,654,779 10,248,028 10,251,042 10,251,042 12,058,641
REQUIREMENTSOperations & Administration 3,027,444 2,895,808 3,051,081 3,174,783 3,378,570Settlements & Impairments 810,696 862,563 1,018,836 999,181 1,020,000Medical Expenses 5,738,712 5,297,657 5,396,830 7,922,451 5,861,571Indemnity Payments 1,304,325 1,493,024 1,364,830 1,595,508 1,476,533Court & Legal Fees 2,491 5,320 27,000 27,000 27,000Interdepartmental & Expense Refunds (1,146,236) (1,304,579) (1,100,222) (1,404,582) (1,318,158)Claims Reserve 0 0 1,672,107 0 1,800,719
TOTAL REQUIREMENTS 9,737,432 9,249,793 11,430,462 12,314,341 12,246,235
EXCESS (DEFICIENCY) OF TOTALAVAILABLE FUNDS OVERTOTAL REQUIREMENTS (82,653) 998,235 (1,179,420) (2,063,299) (187,594)
ADJUSTMENT TO GAAP 0 834 0 0 0
ENDING BALANCE 1,251,824 2,250,893 0 187,594 0
WORKERS' COMPENSATION FUND
2012-13 Proposed Budget, Austin, TX
Volume I | 651
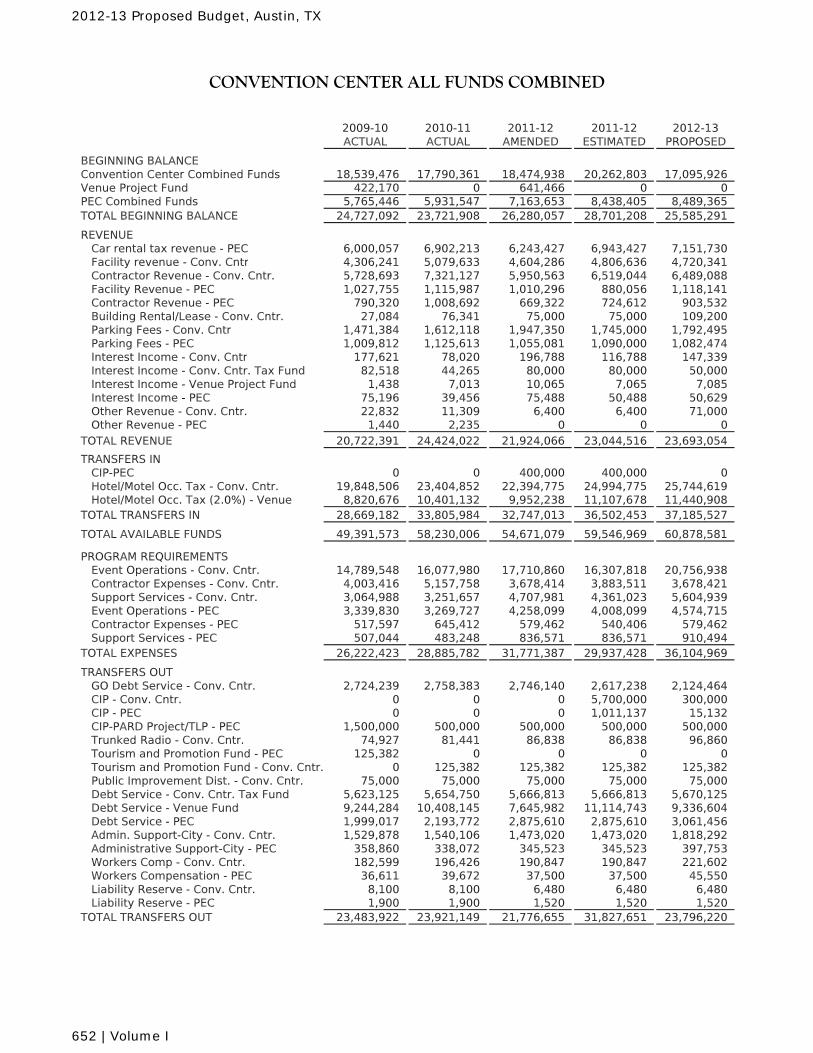
2009-10 2010-11 2011-12 2011-12 2012-13ACTUAL ACTUAL AMENDED ESTIMATED PROPOSED
BEGINNING BALANCEConvention Center Combined Funds 18,539,476 17,790,361 18,474,938 20,262,803 17,095,926Venue Project Fund 422,170 0 641,466 0 0PEC Combined Funds 5,765,446 5,931,547 7,163,653 8,438,405 8,489,365TOTAL BEGINNING BALANCE 24,727,092 23,721,908 26,280,057 28,701,208 25,585,291
REVENUE Car rental tax revenue - PEC 6,000,057 6,902,213 6,243,427 6,943,427 7,151,730 Facility revenue - Conv. Cntr 4,306,241 5,079,633 4,604,286 4,806,636 4,720,341 Contractor Revenue - Conv. Cntr. 5,728,693 7,321,127 5,950,563 6,519,044 6,489,088 Facility Revenue - PEC 1,027,755 1,115,987 1,010,296 880,056 1,118,141 Contractor Revenue - PEC 790,320 1,008,692 669,322 724,612 903,532 Building Rental/Lease - Conv. Cntr. 27,084 76,341 75,000 75,000 109,200 Parking Fees - Conv. Cntr 1,471,384 1,612,118 1,947,350 1,745,000 1,792,495 Parking Fees - PEC 1,009,812 1,125,613 1,055,081 1,090,000 1,082,474 Interest Income - Conv. Cntr 177,621 78,020 196,788 116,788 147,339 Interest Income - Conv. Cntr. Tax Fund 82,518 44,265 80,000 80,000 50,000 Interest Income - Venue Project Fund 1,438 7,013 10,065 7,065 7,085 Interest Income - PEC 75,196 39,456 75,488 50,488 50,629 Other Revenue - Conv. Cntr. 22,832 11,309 6,400 6,400 71,000 Other Revenue - PEC 1,440 2,235 0 0 0TOTAL REVENUE 20,722,391 24,424,022 21,924,066 23,044,516 23,693,054
TRANSFERS IN CIP-PEC 0 0 400,000 400,000 0 Hotel/Motel Occ. Tax - Conv. Cntr. 19,848,506 23,404,852 22,394,775 24,994,775 25,744,619 Hotel/Motel Occ. Tax (2.0%) - Venue 8,820,676 10,401,132 9,952,238 11,107,678 11,440,908TOTAL TRANSFERS IN 28,669,182 33,805,984 32,747,013 36,502,453 37,185,527
TOTAL AVAILABLE FUNDS 49,391,573 58,230,006 54,671,079 59,546,969 60,878,581
PROGRAM REQUIREMENTS Event Operations - Conv. Cntr. 14,789,548 16,077,980 17,710,860 16,307,818 20,756,938 Contractor Expenses - Conv. Cntr. 4,003,416 5,157,758 3,678,414 3,883,511 3,678,421 Support Services - Conv. Cntr. 3,064,988 3,251,657 4,707,981 4,361,023 5,604,939 Event Operations - PEC 3,339,830 3,269,727 4,258,099 4,008,099 4,574,715 Contractor Expenses - PEC 517,597 645,412 579,462 540,406 579,462 Support Services - PEC 507,044 483,248 836,571 836,571 910,494TOTAL EXPENSES 26,222,423 28,885,782 31,771,387 29,937,428 36,104,969
TRANSFERS OUT GO Debt Service - Conv. Cntr. 2,724,239 2,758,383 2,746,140 2,617,238 2,124,464 CIP - Conv. Cntr. 0 0 0 5,700,000 300,000 CIP - PEC 0 0 0 1,011,137 15,132 CIP-PARD Project/TLP - PEC 1,500,000 500,000 500,000 500,000 500,000 Trunked Radio - Conv. Cntr. 74,927 81,441 86,838 86,838 96,860 Tourism and Promotion Fund - PEC 125,382 0 0 0 0 Tourism and Promotion Fund - Conv. Cntr. 0 125,382 125,382 125,382 125,382 Public Improvement Dist. - Conv. Cntr. 75,000 75,000 75,000 75,000 75,000 Debt Service - Conv. Cntr. Tax Fund 5,623,125 5,654,750 5,666,813 5,666,813 5,670,125 Debt Service - Venue Fund 9,244,284 10,408,145 7,645,982 11,114,743 9,336,604 Debt Service - PEC 1,999,017 2,193,772 2,875,610 2,875,610 3,061,456 Admin. Support-City - Conv. Cntr. 1,529,878 1,540,106 1,473,020 1,473,020 1,818,292 Administrative Support-City - PEC 358,860 338,072 345,523 345,523 397,753 Workers Comp - Conv. Cntr. 182,599 196,426 190,847 190,847 221,602 Workers Compensation - PEC 36,611 39,672 37,500 37,500 45,550 Liability Reserve - Conv. Cntr. 8,100 8,100 6,480 6,480 6,480 Liability Reserve - PEC 1,900 1,900 1,520 1,520 1,520TOTAL TRANSFERS OUT 23,483,922 23,921,149 21,776,655 31,827,651 23,796,220
CONVENTION CENTER ALL FUNDS COMBINED
2012-13 Proposed Budget, Austin, TX
652 | Volume I
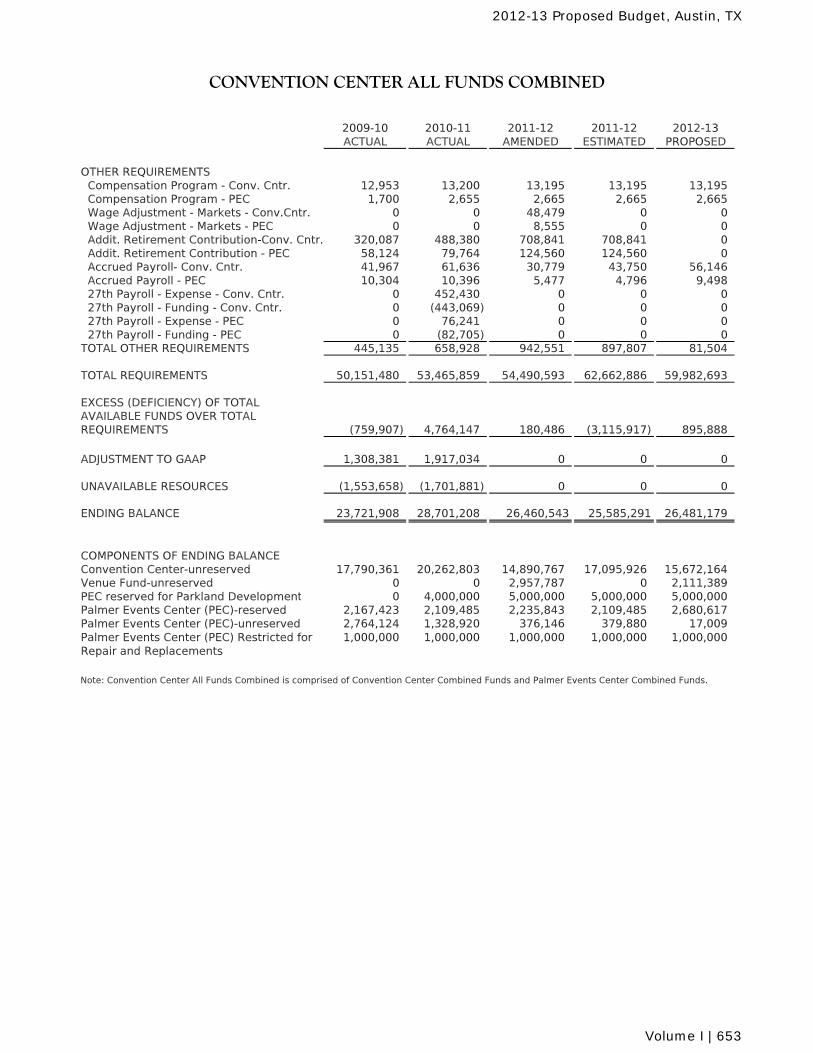
2009-10 2010-11 2011-12 2011-12 2012-13ACTUAL ACTUAL AMENDED ESTIMATED PROPOSED
CONVENTION CENTER ALL FUNDS COMBINED
OTHER REQUIREMENTS Compensation Program - Conv. Cntr. 12,953 13,200 13,195 13,195 13,195 Compensation Program - PEC 1,700 2,655 2,665 2,665 2,665 Wage Adjustment - Markets - Conv.Cntr. 0 0 48,479 0 0 Wage Adjustment - Markets - PEC 0 0 8,555 0 0 Addit. Retirement Contribution-Conv. Cntr. 320,087 488,380 708,841 708,841 0 Addit. Retirement Contribution - PEC 58,124 79,764 124,560 124,560 0 Accrued Payroll- Conv. Cntr. 41,967 61,636 30,779 43,750 56,146 Accrued Payroll - PEC 10,304 10,396 5,477 4,796 9,498 27th Payroll - Expense - Conv. Cntr. 0 452,430 0 0 0 27th Payroll - Funding - Conv. Cntr. 0 (443,069) 0 0 0 27th Payroll - Expense - PEC 0 76,241 0 0 0 27th Payroll - Funding - PEC 0 (82,705) 0 0 0TOTAL OTHER REQUIREMENTS 445,135 658,928 942,551 897,807 81,504
TOTAL REQUIREMENTS 50,151,480 53,465,859 54,490,593 62,662,886 59,982,693
EXCESS (DEFICIENCY) OF TOTALAVAILABLE FUNDS OVER TOTAL REQUIREMENTS (759,907) 4,764,147 180,486 (3,115,917) 895,888
ADJUSTMENT TO GAAP 1,308,381 1,917,034 0 0 0
UNAVAILABLE RESOURCES (1,553,658) (1,701,881) 0 0 0
ENDING BALANCE 23,721,908 28,701,208 26,460,543 25,585,291 26,481,179
COMPONENTS OF ENDING BALANCEConvention Center-unreserved 17,790,361 20,262,803 14,890,767 17,095,926 15,672,164Venue Fund-unreserved 0 0 2,957,787 0 2,111,389PEC reserved for Parkland Development 0 4,000,000 5,000,000 5,000,000 5,000,000Palmer Events Center (PEC)-reserved 2,167,423 2,109,485 2,235,843 2,109,485 2,680,617Palmer Events Center (PEC)-unreserved 2,764,124 1,328,920 376,146 379,880 17,009Palmer Events Center (PEC) Restricted for Repair and Replacements
1,000,000 1,000,000 1,000,000 1,000,000 1,000,000
Note: Convention Center All Funds Combined is comprised of Convention Center Combined Funds and Palmer Events Center Combined Funds.
2012-13 Proposed Budget, Austin, TX
Volume I | 653
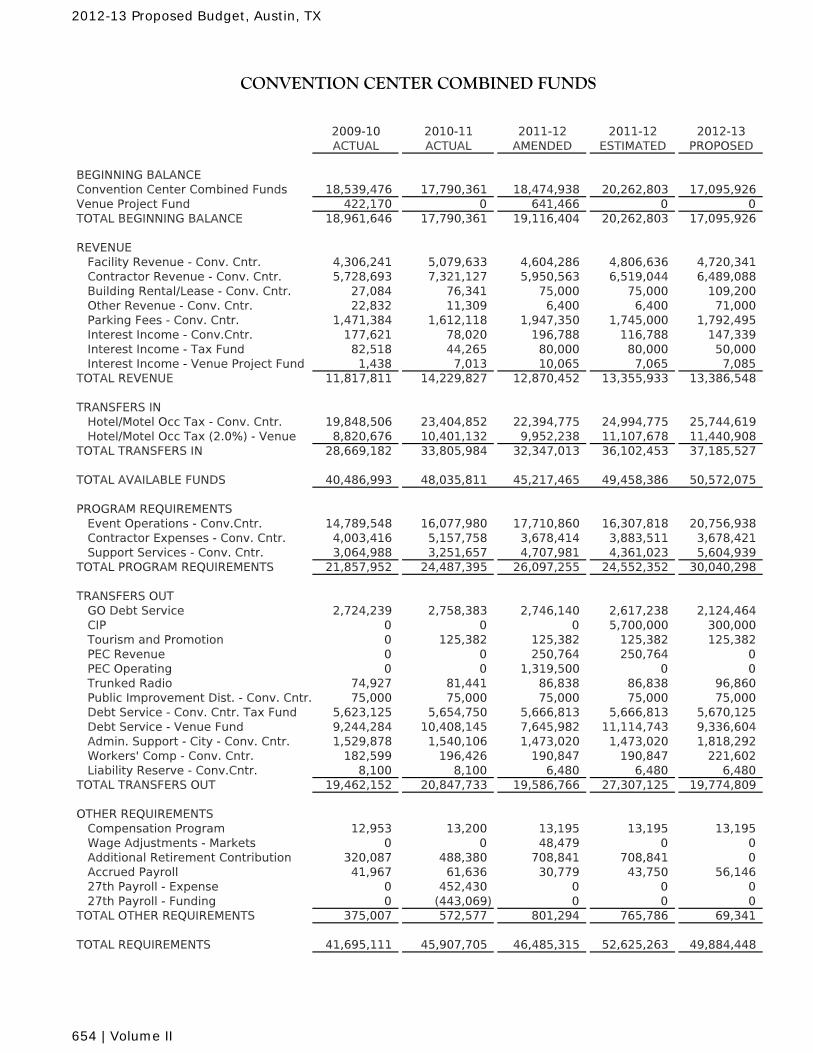
2009-10 2010-11 2011-12 2011-12 2012-13ACTUAL ACTUAL AMENDED ESTIMATED PROPOSED
BEGINNING BALANCEConvention Center Combined Funds 18,539,476 17,790,361 18,474,938 20,262,803 17,095,926Venue Project Fund 422,170 0 641,466 0 0TOTAL BEGINNING BALANCE 18,961,646 17,790,361 19,116,404 20,262,803 17,095,926
REVENUE Facility Revenue - Conv. Cntr. 4,306,241 5,079,633 4,604,286 4,806,636 4,720,341 Contractor Revenue - Conv. Cntr. 5,728,693 7,321,127 5,950,563 6,519,044 6,489,088 Building Rental/Lease - Conv. Cntr. 27,084 76,341 75,000 75,000 109,200 Other Revenue - Conv. Cntr. 22,832 11,309 6,400 6,400 71,000 Parking Fees - Conv. Cntr. 1,471,384 1,612,118 1,947,350 1,745,000 1,792,495 Interest Income - Conv.Cntr. 177,621 78,020 196,788 116,788 147,339 Interest Income - Tax Fund 82,518 44,265 80,000 80,000 50,000 Interest Income - Venue Project Fund 1,438 7,013 10,065 7,065 7,085TOTAL REVENUE 11,817,811 14,229,827 12,870,452 13,355,933 13,386,548
TRANSFERS IN Hotel/Motel Occ Tax - Conv. Cntr. 19,848,506 23,404,852 22,394,775 24,994,775 25,744,619 Hotel/Motel Occ Tax (2.0%) - Venue 8,820,676 10,401,132 9,952,238 11,107,678 11,440,908TOTAL TRANSFERS IN 28,669,182 33,805,984 32,347,013 36,102,453 37,185,527
TOTAL AVAILABLE FUNDS 40,486,993 48,035,811 45,217,465 49,458,386 50,572,075
PROGRAM REQUIREMENTS Event Operations - Conv.Cntr. 14,789,548 16,077,980 17,710,860 16,307,818 20,756,938 Contractor Expenses - Conv. Cntr. 4,003,416 5,157,758 3,678,414 3,883,511 3,678,421 Support Services - Conv. Cntr. 3,064,988 3,251,657 4,707,981 4,361,023 5,604,939TOTAL PROGRAM REQUIREMENTS 21,857,952 24,487,395 26,097,255 24,552,352 30,040,298
TRANSFERS OUT GO Debt Service 2,724,239 2,758,383 2,746,140 2,617,238 2,124,464 CIP 0 0 0 5,700,000 300,000 Tourism and Promotion 0 125,382 125,382 125,382 125,382 PEC Revenue 0 0 250,764 250,764 0 PEC Operating 0 0 1,319,500 0 0 Trunked Radio 74,927 81,441 86,838 86,838 96,860 Public Improvement Dist. - Conv. Cntr. 75,000 75,000 75,000 75,000 75,000 Debt Service - Conv. Cntr. Tax Fund 5,623,125 5,654,750 5,666,813 5,666,813 5,670,125 Debt Service - Venue Fund 9,244,284 10,408,145 7,645,982 11,114,743 9,336,604 Admin. Support - City - Conv. Cntr. 1,529,878 1,540,106 1,473,020 1,473,020 1,818,292 Workers' Comp - Conv. Cntr. 182,599 196,426 190,847 190,847 221,602 Liability Reserve - Conv.Cntr. 8,100 8,100 6,480 6,480 6,480TOTAL TRANSFERS OUT 19,462,152 20,847,733 19,586,766 27,307,125 19,774,809
OTHER REQUIREMENTS Compensation Program 12,953 13,200 13,195 13,195 13,195 Wage Adjustments - Markets 0 0 48,479 0 0 Additional Retirement Contribution 320,087 488,380 708,841 708,841 0 Accrued Payroll 41,967 61,636 30,779 43,750 56,146 27th Payroll - Expense 0 452,430 0 0 0 27th Payroll - Funding 0 (443,069) 0 0 0TOTAL OTHER REQUIREMENTS 375,007 572,577 801,294 765,786 69,341
TOTAL REQUIREMENTS 41,695,111 45,907,705 46,485,315 52,625,263 49,884,448
CONVENTION CENTER COMBINED FUNDS
2012-13 Proposed Budget, Austin, TX
654 | Volume II
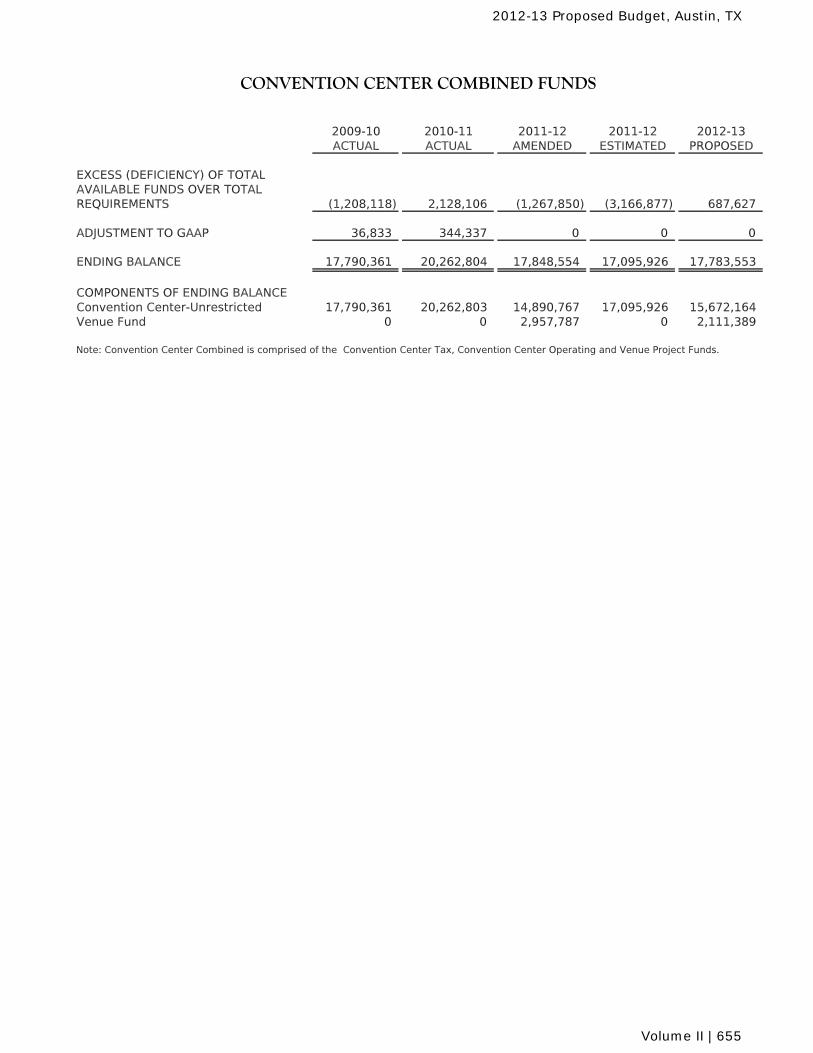
2009-10 2010-11 2011-12 2011-12 2012-13ACTUAL ACTUAL AMENDED ESTIMATED PROPOSED
CONVENTION CENTER COMBINED FUNDS
EXCESS (DEFICIENCY) OF TOTALAVAILABLE FUNDS OVER TOTAL REQUIREMENTS (1,208,118) 2,128,106 (1,267,850) (3,166,877) 687,627
ADJUSTMENT TO GAAP 36,833 344,337 0 0 0
ENDING BALANCE 17,790,361 20,262,804 17,848,554 17,095,926 17,783,553
COMPONENTS OF ENDING BALANCEConvention Center-Unrestricted 17,790,361 20,262,803 14,890,767 17,095,926 15,672,164Venue Fund 0 0 2,957,787 0 2,111,389
Note: Convention Center Combined is comprised of the Convention Center Tax, Convention Center Operating and Venue Project Funds.
2012-13 Proposed Budget, Austin, TX
Volume II | 655
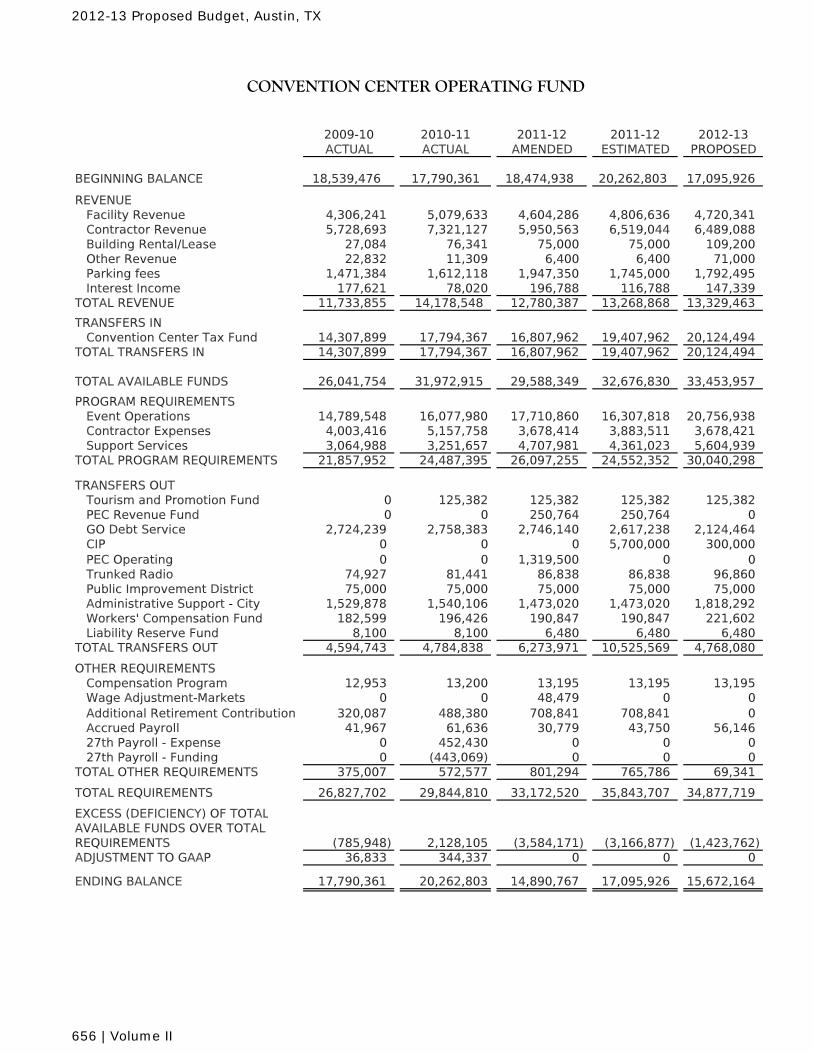
2009-10 2010-11 2011-12 2011-12 2012-13ACTUAL ACTUAL AMENDED ESTIMATED PROPOSED
BEGINNING BALANCE 18,539,476 17,790,361 18,474,938 20,262,803 17,095,926
REVENUE Facility Revenue 4,306,241 5,079,633 4,604,286 4,806,636 4,720,341 Contractor Revenue 5,728,693 7,321,127 5,950,563 6,519,044 6,489,088 Building Rental/Lease 27,084 76,341 75,000 75,000 109,200 Other Revenue 22,832 11,309 6,400 6,400 71,000 Parking fees 1,471,384 1,612,118 1,947,350 1,745,000 1,792,495 Interest Income 177,621 78,020 196,788 116,788 147,339TOTAL REVENUE 11,733,855 14,178,548 12,780,387 13,268,868 13,329,463
TRANSFERS IN Convention Center Tax Fund 14,307,899 17,794,367 16,807,962 19,407,962 20,124,494TOTAL TRANSFERS IN 14,307,899 17,794,367 16,807,962 19,407,962 20,124,494
TOTAL AVAILABLE FUNDS 26,041,754 31,972,915 29,588,349 32,676,830 33,453,957
PROGRAM REQUIREMENTS Event Operations 14,789,548 16,077,980 17,710,860 16,307,818 20,756,938 Contractor Expenses 4,003,416 5,157,758 3,678,414 3,883,511 3,678,421 Support Services 3,064,988 3,251,657 4,707,981 4,361,023 5,604,939TOTAL PROGRAM REQUIREMENTS 21,857,952 24,487,395 26,097,255 24,552,352 30,040,298
TRANSFERS OUT Tourism and Promotion Fund 0 125,382 125,382 125,382 125,382 PEC Revenue Fund 0 0 250,764 250,764 0 GO Debt Service 2,724,239 2,758,383 2,746,140 2,617,238 2,124,464 CIP 0 0 0 5,700,000 300,000 PEC Operating 0 0 1,319,500 0 0 Trunked Radio 74,927 81,441 86,838 86,838 96,860 Public Improvement District 75,000 75,000 75,000 75,000 75,000 Administrative Support - City 1,529,878 1,540,106 1,473,020 1,473,020 1,818,292 Workers' Compensation Fund 182,599 196,426 190,847 190,847 221,602 Liability Reserve Fund 8,100 8,100 6,480 6,480 6,480TOTAL TRANSFERS OUT 4,594,743 4,784,838 6,273,971 10,525,569 4,768,080
OTHER REQUIREMENTS Compensation Program 12,953 13,200 13,195 13,195 13,195 Wage Adjustment-Markets 0 0 48,479 0 0 Additional Retirement Contribution 320,087 488,380 708,841 708,841 0 Accrued Payroll 41,967 61,636 30,779 43,750 56,146 27th Payroll - Expense 0 452,430 0 0 0 27th Payroll - Funding 0 (443,069) 0 0 0TOTAL OTHER REQUIREMENTS 375,007 572,577 801,294 765,786 69,341
TOTAL REQUIREMENTS 26,827,702 29,844,810 33,172,520 35,843,707 34,877,719
EXCESS (DEFICIENCY) OF TOTALAVAILABLE FUNDS OVER TOTAL REQUIREMENTS (785,948) 2,128,105 (3,584,171) (3,166,877) (1,423,762)ADJUSTMENT TO GAAP 36,833 344,337 0 0 0
ENDING BALANCE 17,790,361 20,262,803 14,890,767 17,095,926 15,672,164
CONVENTION CENTER OPERATING FUND
2012-13 Proposed Budget, Austin, TX
656 | Volume II
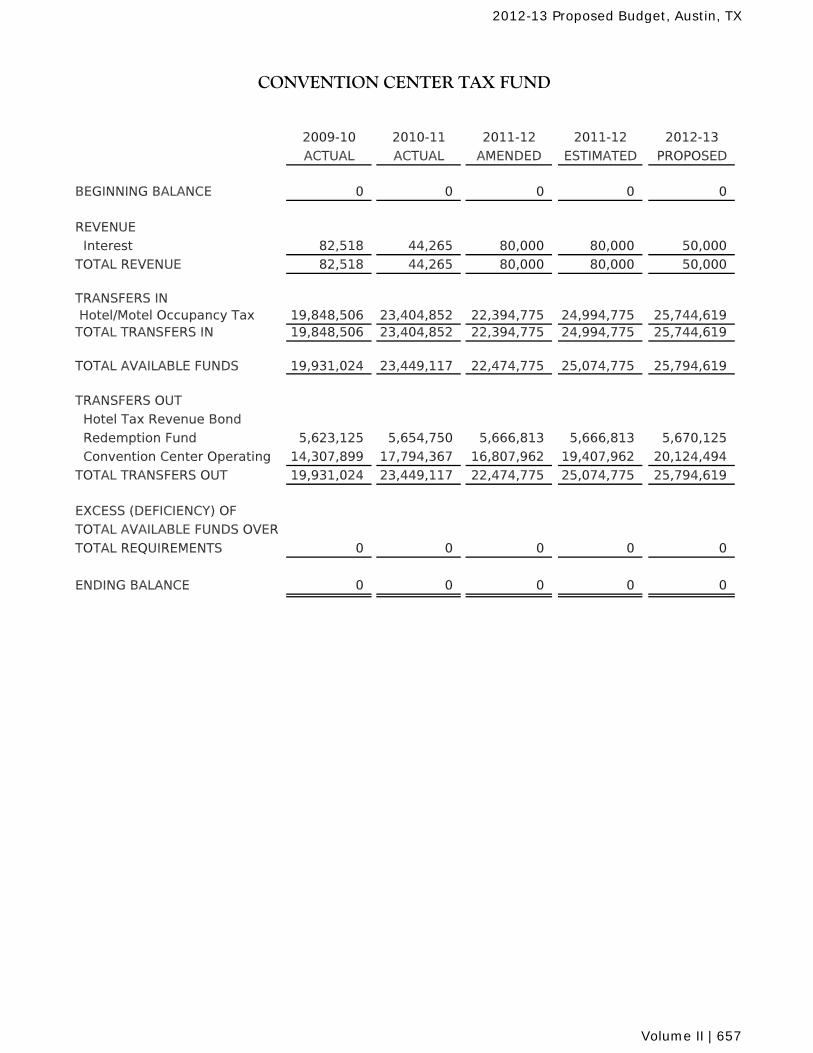
CONVENTION CENTER TAX FUND
2009-10 2010-11 2011-12 2011-12 2012-13
ACTUAL ACTUAL AMENDED ESTIMATED PROPOSED
BEGINNING BALANCE 0 0 0 0 0
REVENUE
Interest 82,518 44,265 80,000 80,000 50,000
TOTAL REVENUE 82,518 44,265 80,000 80,000 50,000
TRANSFERS IN Hotel/Motel Occupancy Tax 19,848,506 23,404,852 22,394,775 24,994,775 25,744,619TOTAL TRANSFERS IN 19,848,506 23,404,852 22,394,775 24,994,775 25,744,619
TOTAL AVAILABLE FUNDS 19,931,024 23,449,117 22,474,775 25,074,775 25,794,619
TRANSFERS OUT
Hotel Tax Revenue Bond
Redemption Fund 5,623,125 5,654,750 5,666,813 5,666,813 5,670,125
Convention Center Operating 14,307,899 17,794,367 16,807,962 19,407,962 20,124,494
TOTAL TRANSFERS OUT 19,931,024 23,449,117 22,474,775 25,074,775 25,794,619
EXCESS (DEFICIENCY) OF
TOTAL AVAILABLE FUNDS OVER
TOTAL REQUIREMENTS 0 0 0 0 0
ENDING BALANCE 0 0 0 0 0
2012-13 Proposed Budget, Austin, TX
Volume II | 657
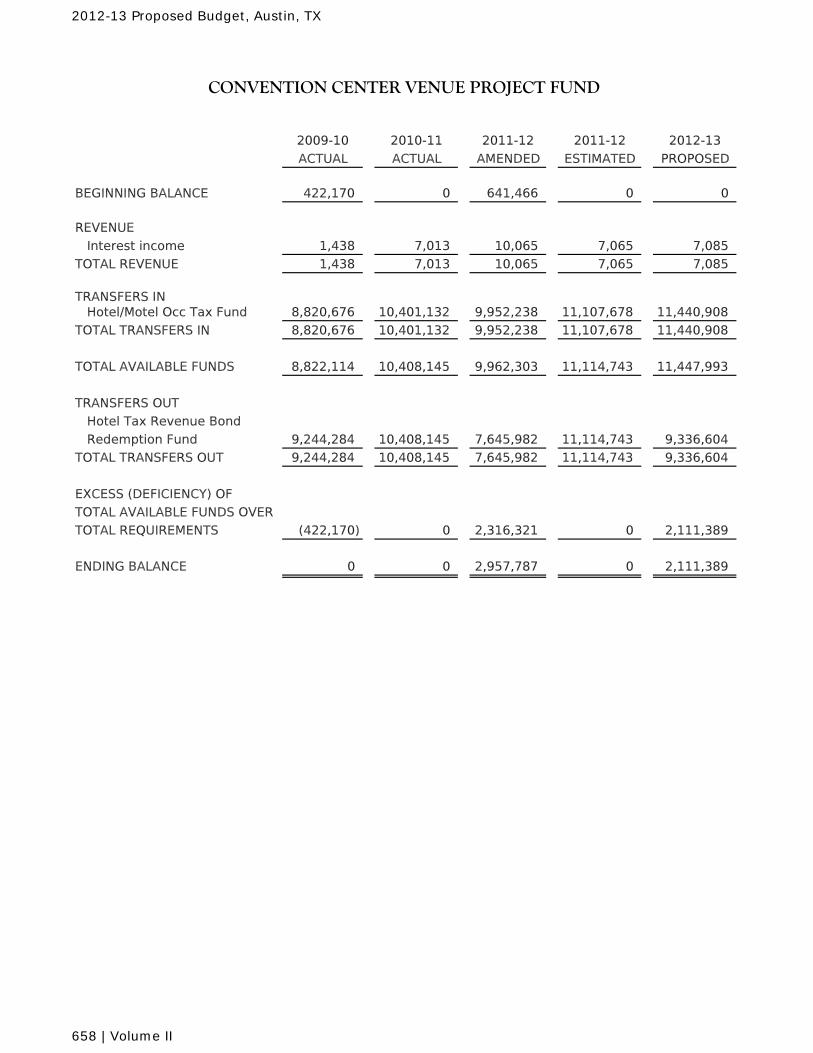
CONVENTION CENTER VENUE PROJECT FUND
2009-10 2010-11 2011-12 2011-12 2012-13
ACTUAL ACTUAL AMENDED ESTIMATED PROPOSED
BEGINNING BALANCE 422,170 0 641,466 0 0
REVENUE
Interest income 1,438 7,013 10,065 7,065 7,085
TOTAL REVENUE 1,438 7,013 10,065 7,065 7,085
TRANSFERS IN Hotel/Motel Occ Tax Fund 8,820,676 10,401,132 9,952,238 11,107,678 11,440,908
TOTAL TRANSFERS IN 8,820,676 10,401,132 9,952,238 11,107,678 11,440,908
TOTAL AVAILABLE FUNDS 8,822,114 10,408,145 9,962,303 11,114,743 11,447,993
TRANSFERS OUT
Hotel Tax Revenue Bond
Redemption Fund 9,244,284 10,408,145 7,645,982 11,114,743 9,336,604
TOTAL TRANSFERS OUT 9,244,284 10,408,145 7,645,982 11,114,743 9,336,604
EXCESS (DEFICIENCY) OF
TOTAL AVAILABLE FUNDS OVER
TOTAL REQUIREMENTS (422,170) 0 2,316,321 0 2,111,389
ENDING BALANCE 0 0 2,957,787 0 2,111,389
2012-13 Proposed Budget, Austin, TX
658 | Volume II
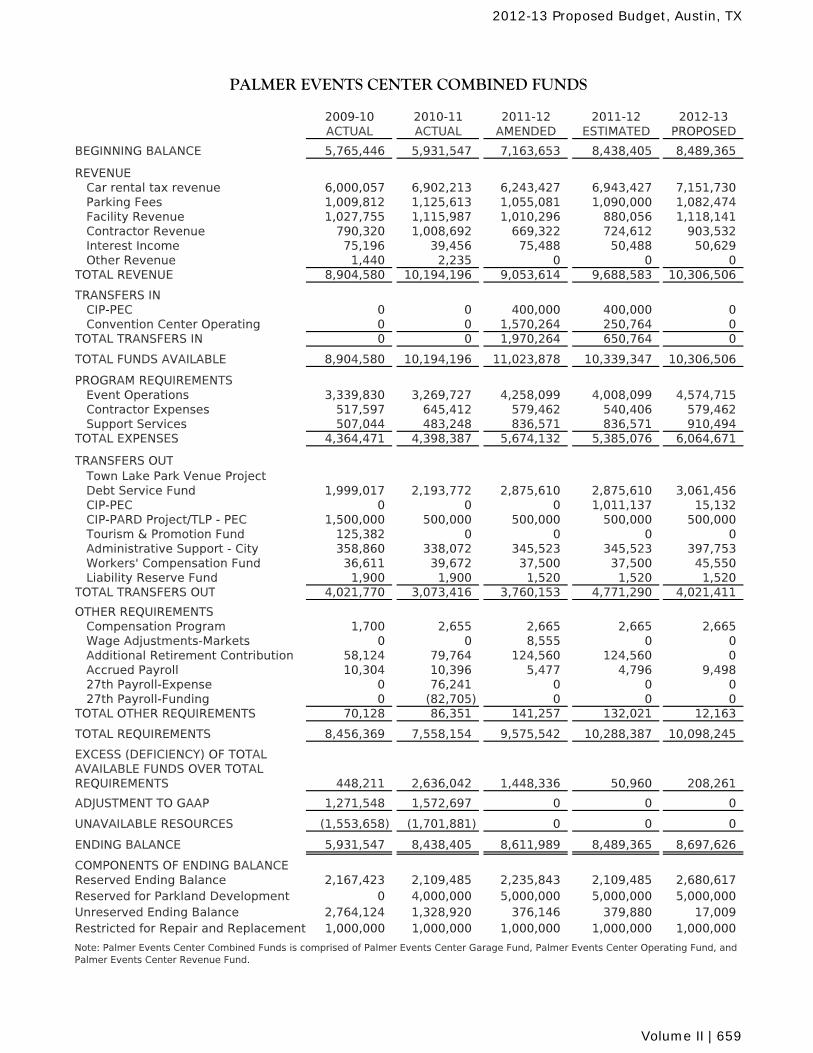
2009-10 2010-11 2011-12 2011-12 2012-13ACTUAL ACTUAL AMENDED ESTIMATED PROPOSED
BEGINNING BALANCE 5,765,446 5,931,547 7,163,653 8,438,405 8,489,365
REVENUE Car rental tax revenue 6,000,057 6,902,213 6,243,427 6,943,427 7,151,730 Parking Fees 1,009,812 1,125,613 1,055,081 1,090,000 1,082,474 Facility Revenue 1,027,755 1,115,987 1,010,296 880,056 1,118,141 Contractor Revenue 790,320 1,008,692 669,322 724,612 903,532 Interest Income 75,196 39,456 75,488 50,488 50,629 Other Revenue 1,440 2,235 0 0 0TOTAL REVENUE 8,904,580 10,194,196 9,053,614 9,688,583 10,306,506
TRANSFERS IN CIP-PEC 0 0 400,000 400,000 0 Convention Center Operating 0 0 1,570,264 250,764 0TOTAL TRANSFERS IN 0 0 1,970,264 650,764 0
TOTAL FUNDS AVAILABLE 8,904,580 10,194,196 11,023,878 10,339,347 10,306,506
PROGRAM REQUIREMENTS Event Operations 3,339,830 3,269,727 4,258,099 4,008,099 4,574,715 Contractor Expenses 517,597 645,412 579,462 540,406 579,462 Support Services 507,044 483,248 836,571 836,571 910,494TOTAL EXPENSES 4,364,471 4,398,387 5,674,132 5,385,076 6,064,671
TRANSFERS OUT Town Lake Park Venue Project Debt Service Fund 1,999,017 2,193,772 2,875,610 2,875,610 3,061,456 CIP-PEC 0 0 0 1,011,137 15,132 CIP-PARD Project/TLP - PEC 1,500,000 500,000 500,000 500,000 500,000 Tourism & Promotion Fund 125,382 0 0 0 0 Administrative Support - City 358,860 338,072 345,523 345,523 397,753 Workers' Compensation Fund 36,611 39,672 37,500 37,500 45,550 Liability Reserve Fund 1,900 1,900 1,520 1,520 1,520TOTAL TRANSFERS OUT 4,021,770 3,073,416 3,760,153 4,771,290 4,021,411
OTHER REQUIREMENTS Compensation Program 1,700 2,655 2,665 2,665 2,665 Wage Adjustments-Markets 0 0 8,555 0 0 Additional Retirement Contribution 58,124 79,764 124,560 124,560 0 Accrued Payroll 10,304 10,396 5,477 4,796 9,498 27th Payroll-Expense 0 76,241 0 0 0 27th Payroll-Funding 0 (82,705) 0 0 0TOTAL OTHER REQUIREMENTS 70,128 86,351 141,257 132,021 12,163
TOTAL REQUIREMENTS 8,456,369 7,558,154 9,575,542 10,288,387 10,098,245
EXCESS (DEFICIENCY) OF TOTALAVAILABLE FUNDS OVER TOTAL REQUIREMENTS 448,211 2,636,042 1,448,336 50,960 208,261
ADJUSTMENT TO GAAP 1,271,548 1,572,697 0 0 0
UNAVAILABLE RESOURCES (1,553,658) (1,701,881) 0 0 0
ENDING BALANCE 5,931,547 8,438,405 8,611,989 8,489,365 8,697,626
COMPONENTS OF ENDING BALANCEReserved Ending Balance 2,167,423 2,109,485 2,235,843 2,109,485 2,680,617Reserved for Parkland Development 0 4,000,000 5,000,000 5,000,000 5,000,000Unreserved Ending Balance 2,764,124 1,328,920 376,146 379,880 17,009Restricted for Repair and Replacement 1,000,000 1,000,000 1,000,000 1,000,000 1,000,000
PALMER EVENTS CENTER COMBINED FUNDS
Note: Palmer Events Center Combined Funds is comprised of Palmer Events Center Garage Fund, Palmer Events Center Operating Fund, and Palmer Events Center Revenue Fund.
2012-13 Proposed Budget, Austin, TX
Volume II | 659
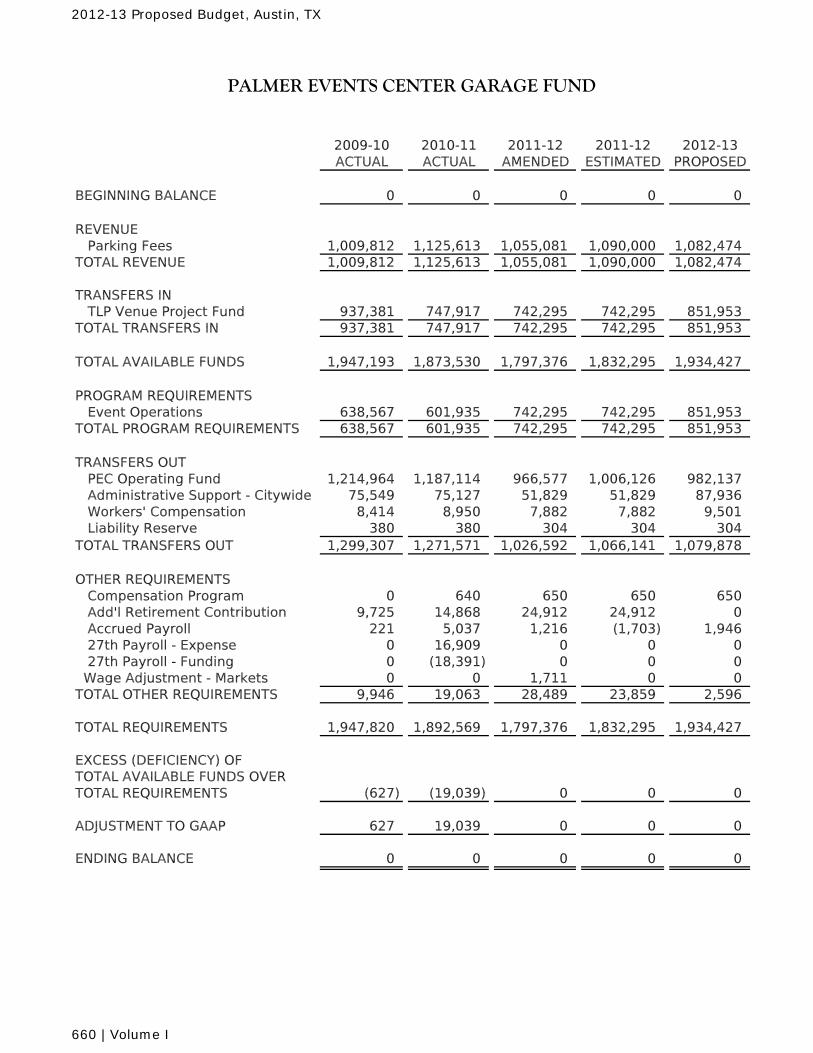
2009-10 2010-11 2011-12 2011-12 2012-13ACTUAL ACTUAL AMENDED ESTIMATED PROPOSED
BEGINNING BALANCE 0 0 0 0 0
REVENUE Parking Fees 1,009,812 1,125,613 1,055,081 1,090,000 1,082,474TOTAL REVENUE 1,009,812 1,125,613 1,055,081 1,090,000 1,082,474
TRANSFERS IN TLP Venue Project Fund 937,381 747,917 742,295 742,295 851,953TOTAL TRANSFERS IN 937,381 747,917 742,295 742,295 851,953
TOTAL AVAILABLE FUNDS 1,947,193 1,873,530 1,797,376 1,832,295 1,934,427
PROGRAM REQUIREMENTS Event Operations 638,567 601,935 742,295 742,295 851,953TOTAL PROGRAM REQUIREMENTS 638,567 601,935 742,295 742,295 851,953
TRANSFERS OUT PEC Operating Fund 1,214,964 1,187,114 966,577 1,006,126 982,137 Administrative Support - Citywide 75,549 75,127 51,829 51,829 87,936 Workers' Compensation 8,414 8,950 7,882 7,882 9,501 Liability Reserve 380 380 304 304 304TOTAL TRANSFERS OUT 1,299,307 1,271,571 1,026,592 1,066,141 1,079,878
OTHER REQUIREMENTS Compensation Program 0 640 650 650 650 Add'l Retirement Contribution 9,725 14,868 24,912 24,912 0 Accrued Payroll 221 5,037 1,216 (1,703) 1,946 27th Payroll - Expense 0 16,909 0 0 0 27th Payroll - Funding 0 (18,391) 0 0 0 Wage Adjustment - Markets 0 0 1,711 0 0TOTAL OTHER REQUIREMENTS 9,946 19,063 28,489 23,859 2,596
TOTAL REQUIREMENTS 1,947,820 1,892,569 1,797,376 1,832,295 1,934,427 EXCESS (DEFICIENCY) OF TOTAL AVAILABLE FUNDS OVERTOTAL REQUIREMENTS (627) (19,039) 0 0 0
ADJUSTMENT TO GAAP 627 19,039 0 0 0
ENDING BALANCE 0 0 0 0 0
PALMER EVENTS CENTER GARAGE FUND
2012-13 Proposed Budget, Austin, TX
660 | Volume I
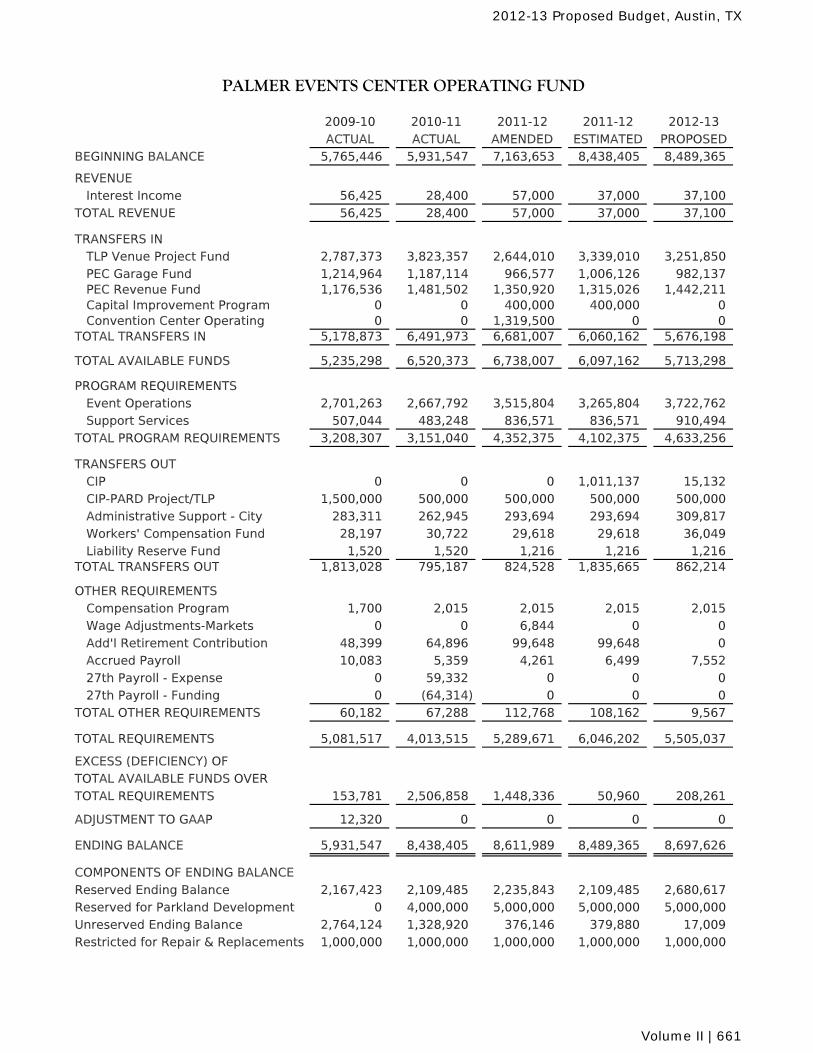
2009-10 2010-11 2011-12 2011-12 2012-13ACTUAL ACTUAL AMENDED ESTIMATED PROPOSED
BEGINNING BALANCE 5,765,446 5,931,547 7,163,653 8,438,405 8,489,365
REVENUE Interest Income 56,425 28,400 57,000 37,000 37,100TOTAL REVENUE 56,425 28,400 57,000 37,000 37,100
TRANSFERS IN TLP Venue Project Fund 2,787,373 3,823,357 2,644,010 3,339,010 3,251,850 PEC Garage Fund 1,214,964 1,187,114 966,577 1,006,126 982,137 PEC Revenue Fund 1,176,536 1,481,502 1,350,920 1,315,026 1,442,211 Capital Improvement Program 0 0 400,000 400,000 0 Convention Center Operating 0 0 1,319,500 0 0TOTAL TRANSFERS IN 5,178,873 6,491,973 6,681,007 6,060,162 5,676,198
TOTAL AVAILABLE FUNDS 5,235,298 6,520,373 6,738,007 6,097,162 5,713,298
PROGRAM REQUIREMENTS Event Operations 2,701,263 2,667,792 3,515,804 3,265,804 3,722,762 Support Services 507,044 483,248 836,571 836,571 910,494TOTAL PROGRAM REQUIREMENTS 3,208,307 3,151,040 4,352,375 4,102,375 4,633,256
TRANSFERS OUT CIP 0 0 0 1,011,137 15,132 CIP-PARD Project/TLP 1,500,000 500,000 500,000 500,000 500,000 Administrative Support - City 283,311 262,945 293,694 293,694 309,817 Workers' Compensation Fund 28,197 30,722 29,618 29,618 36,049 Liability Reserve Fund 1,520 1,520 1,216 1,216 1,216TOTAL TRANSFERS OUT 1,813,028 795,187 824,528 1,835,665 862,214
OTHER REQUIREMENTS Compensation Program 1,700 2,015 2,015 2,015 2,015 Wage Adjustments-Markets 0 0 6,844 0 0 Add'l Retirement Contribution 48,399 64,896 99,648 99,648 0 Accrued Payroll 10,083 5,359 4,261 6,499 7,552 27th Payroll - Expense 0 59,332 0 0 0 27th Payroll - Funding 0 (64,314) 0 0 0TOTAL OTHER REQUIREMENTS 60,182 67,288 112,768 108,162 9,567
TOTAL REQUIREMENTS 5,081,517 4,013,515 5,289,671 6,046,202 5,505,037 EXCESS (DEFICIENCY) OF TOTAL AVAILABLE FUNDS OVERTOTAL REQUIREMENTS 153,781 2,506,858 1,448,336 50,960 208,261
ADJUSTMENT TO GAAP 12,320 0 0 0 0
ENDING BALANCE 5,931,547 8,438,405 8,611,989 8,489,365 8,697,626
COMPONENTS OF ENDING BALANCEReserved Ending Balance 2,167,423 2,109,485 2,235,843 2,109,485 2,680,617Reserved for Parkland Development 0 4,000,000 5,000,000 5,000,000 5,000,000Unreserved Ending Balance 2,764,124 1,328,920 376,146 379,880 17,009Restricted for Repair & Replacements 1,000,000 1,000,000 1,000,000 1,000,000 1,000,000
PALMER EVENTS CENTER OPERATING FUND
2012-13 Proposed Budget, Austin, TX
Volume II | 661
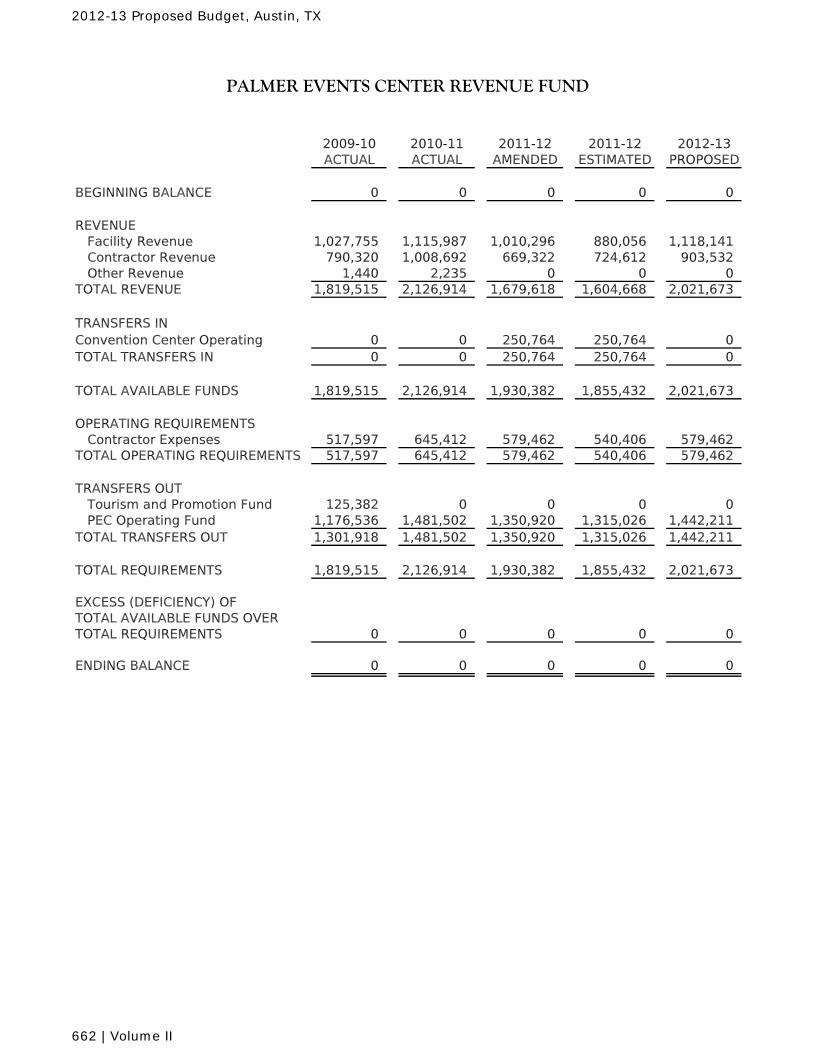
PALMER EVENTS CENTER REVENUE FUND
2009-10 2010-11 2011-12 2011-12 2012-13ACTUAL ACTUAL AMENDED ESTIMATED PROPOSED
BEGINNING BALANCE 0 0 0 0 0
REVENUE Facility Revenue 1,027,755 1,115,987 1,010,296 880,056 1,118,141 Contractor Revenue 790,320 1,008,692 669,322 724,612 903,532 Other Revenue 1,440 2,235 0 0 0TOTAL REVENUE 1,819,515 2,126,914 1,679,618 1,604,668 2,021,673
TRANSFERS INConvention Center Operating 0 0 250,764 250,764 0TOTAL TRANSFERS IN 0 0 250,764 250,764 0
TOTAL AVAILABLE FUNDS 1,819,515 2,126,914 1,930,382 1,855,432 2,021,673
OPERATING REQUIREMENTS Contractor Expenses 517,597 645,412 579,462 540,406 579,462TOTAL OPERATING REQUIREMENTS 517,597 645,412 579,462 540,406 579,462
TRANSFERS OUT Tourism and Promotion Fund 125,382 0 0 0 0 PEC Operating Fund 1,176,536 1,481,502 1,350,920 1,315,026 1,442,211TOTAL TRANSFERS OUT 1,301,918 1,481,502 1,350,920 1,315,026 1,442,211
TOTAL REQUIREMENTS 1,819,515 2,126,914 1,930,382 1,855,432 2,021,673 EXCESS (DEFICIENCY) OF TOTAL AVAILABLE FUNDS OVERTOTAL REQUIREMENTS 0 0 0 0 0
ENDING BALANCE 0 0 0 0 0
2012-13 Proposed Budget, Austin, TX
662 | Volume II
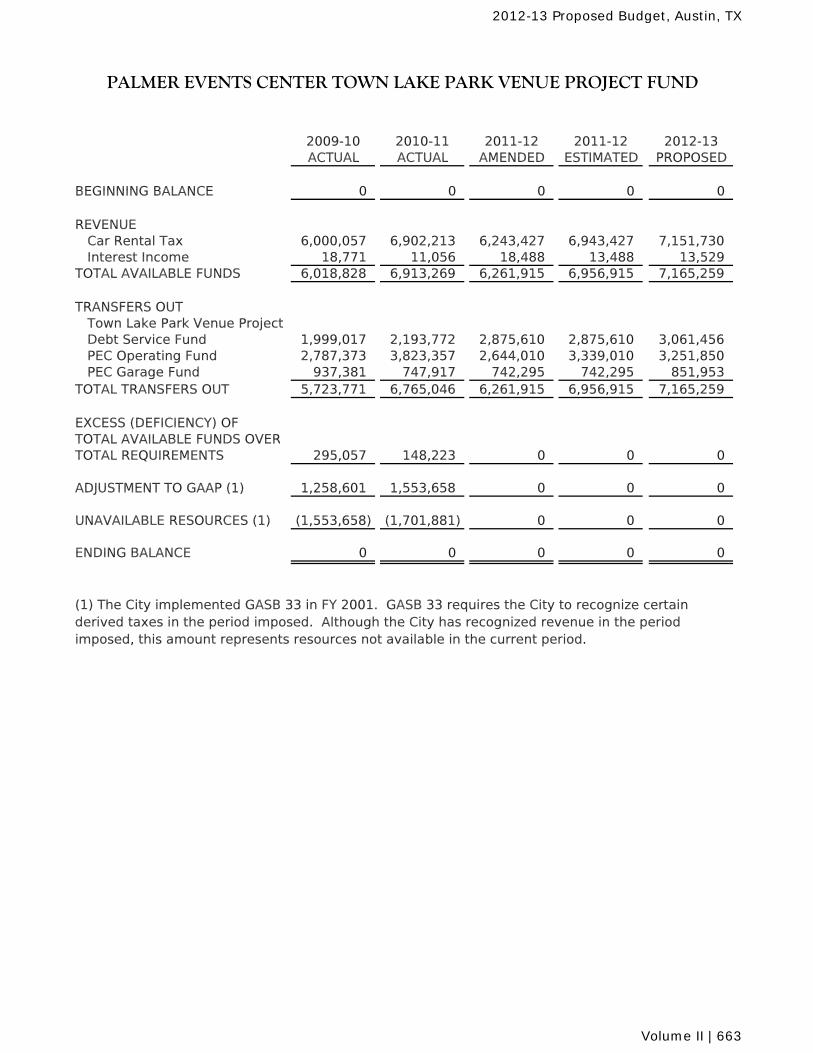
PALMER EVENTS CENTER TOWN LAKE PARK VENUE PROJECT FUND
2009-10 2010-11 2011-12 2011-12 2012-13ACTUAL ACTUAL AMENDED ESTIMATED PROPOSED
BEGINNING BALANCE 0 0 0 0 0
REVENUE Car Rental Tax 6,000,057 6,902,213 6,243,427 6,943,427 7,151,730 Interest Income 18,771 11,056 18,488 13,488 13,529TOTAL AVAILABLE FUNDS 6,018,828 6,913,269 6,261,915 6,956,915 7,165,259
TRANSFERS OUT Town Lake Park Venue Project Debt Service Fund 1,999,017 2,193,772 2,875,610 2,875,610 3,061,456 PEC Operating Fund 2,787,373 3,823,357 2,644,010 3,339,010 3,251,850 PEC Garage Fund 937,381 747,917 742,295 742,295 851,953TOTAL TRANSFERS OUT 5,723,771 6,765,046 6,261,915 6,956,915 7,165,259
EXCESS (DEFICIENCY) OF TOTAL AVAILABLE FUNDS OVERTOTAL REQUIREMENTS 295,057 148,223 0 0 0
ADJUSTMENT TO GAAP (1) 1,258,601 1,553,658 0 0 0
UNAVAILABLE RESOURCES (1) (1,553,658) (1,701,881) 0 0 0
ENDING BALANCE 0 0 0 0 0
(1) The City implemented GASB 33 in FY 2001. GASB 33 requires the City to recognize certainderived taxes in the period imposed. Although the City has recognized revenue in the periodimposed, this amount represents resources not available in the current period.
2012-13 Proposed Budget, Austin, TX
Volume II | 663
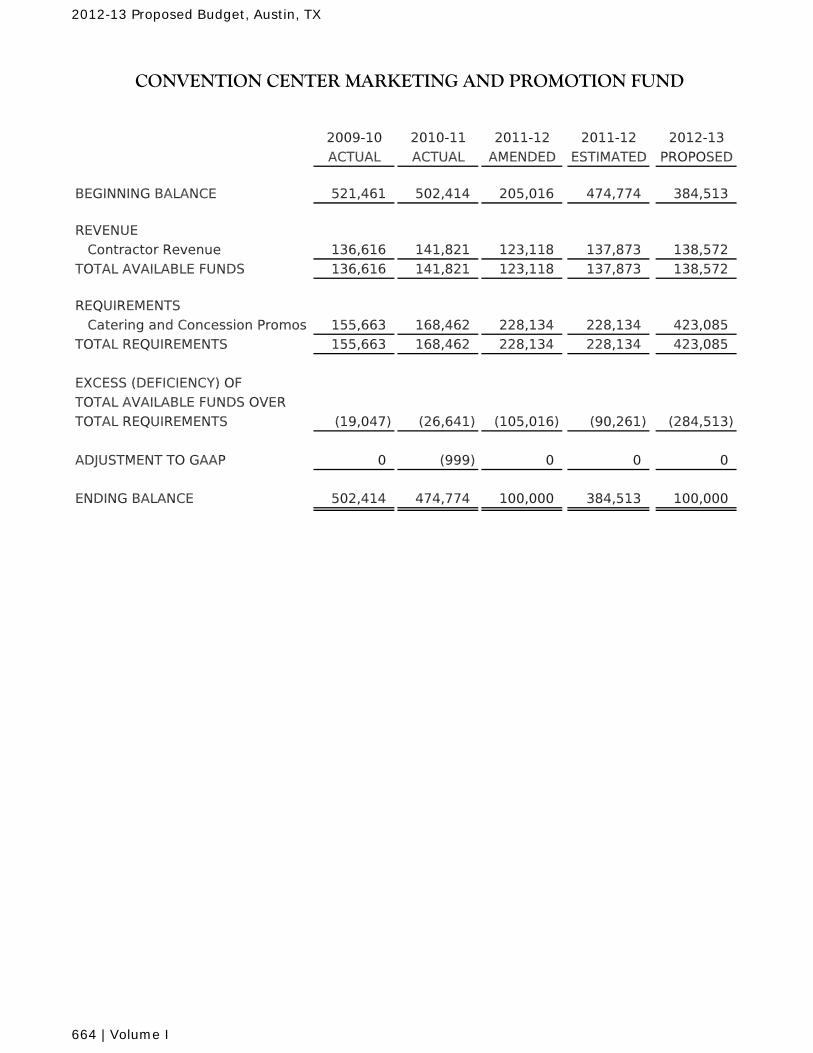
CONVENTION CENTER MARKETING AND PROMOTION FUND
2009-10 2010-11 2011-12 2011-12 2012-13ACTUAL ACTUAL AMENDED ESTIMATED PROPOSED
BEGINNING BALANCE 521,461 502,414 205,016 474,774 384,513
REVENUE Contractor Revenue 136,616 141,821 123,118 137,873 138,572TOTAL AVAILABLE FUNDS 136,616 141,821 123,118 137,873 138,572
REQUIREMENTS Catering and Concession Promos 155,663 168,462 228,134 228,134 423,085TOTAL REQUIREMENTS 155,663 168,462 228,134 228,134 423,085 EXCESS (DEFICIENCY) OF TOTAL AVAILABLE FUNDS OVERTOTAL REQUIREMENTS (19,047) (26,641) (105,016) (90,261) (284,513)
ADJUSTMENT TO GAAP 0 (999) 0 0 0
ENDING BALANCE 502,414 474,774 100,000 384,513 100,000
2012-13 Proposed Budget, Austin, TX
664 | Volume I
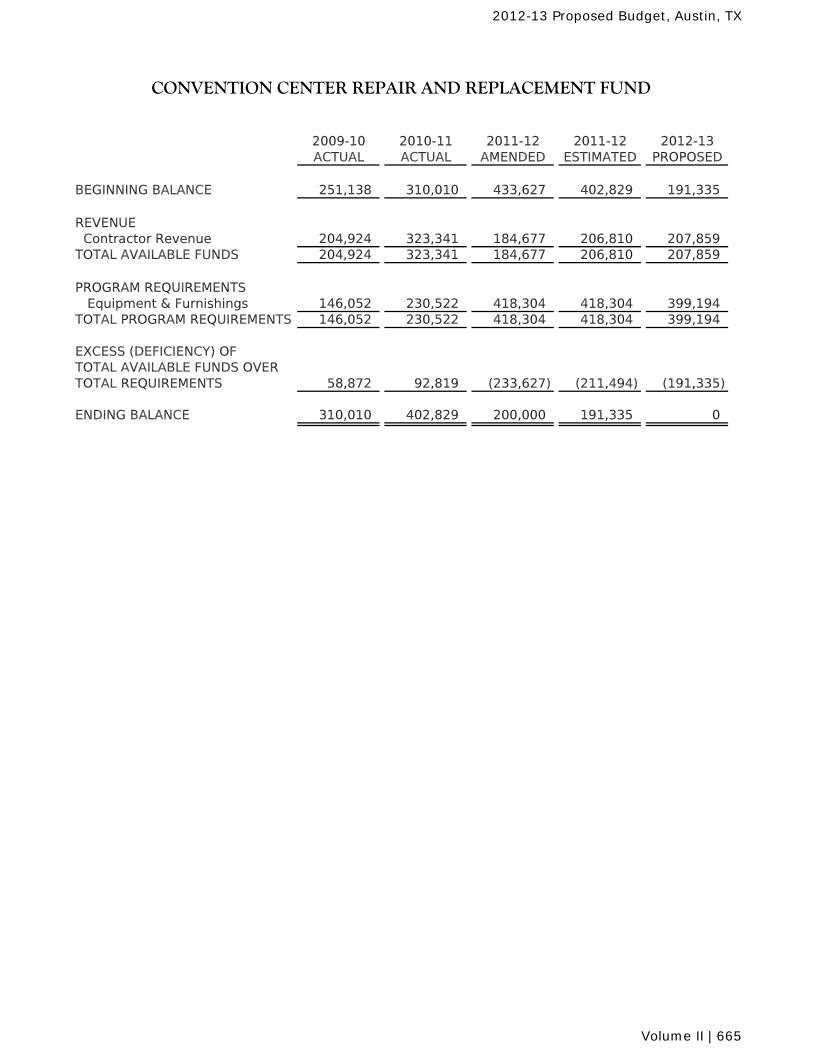
CONVENTION CENTER REPAIR AND REPLACEMENT FUND
2009-10 2010-11 2011-12 2011-12 2012-13ACTUAL ACTUAL AMENDED ESTIMATED PROPOSED
BEGINNING BALANCE 251,138 310,010 433,627 402,829 191,335
REVENUE Contractor Revenue 204,924 323,341 184,677 206,810 207,859TOTAL AVAILABLE FUNDS 204,924 323,341 184,677 206,810 207,859
PROGRAM REQUIREMENTS Equipment & Furnishings 146,052 230,522 418,304 418,304 399,194TOTAL PROGRAM REQUIREMENTS 146,052 230,522 418,304 418,304 399,194 EXCESS (DEFICIENCY) OF TOTAL AVAILABLE FUNDS OVERTOTAL REQUIREMENTS 58,872 92,819 (233,627) (211,494) (191,335)
ENDING BALANCE 310,010 402,829 200,000 191,335 0
2012-13 Proposed Budget, Austin, TX
Volume II | 665
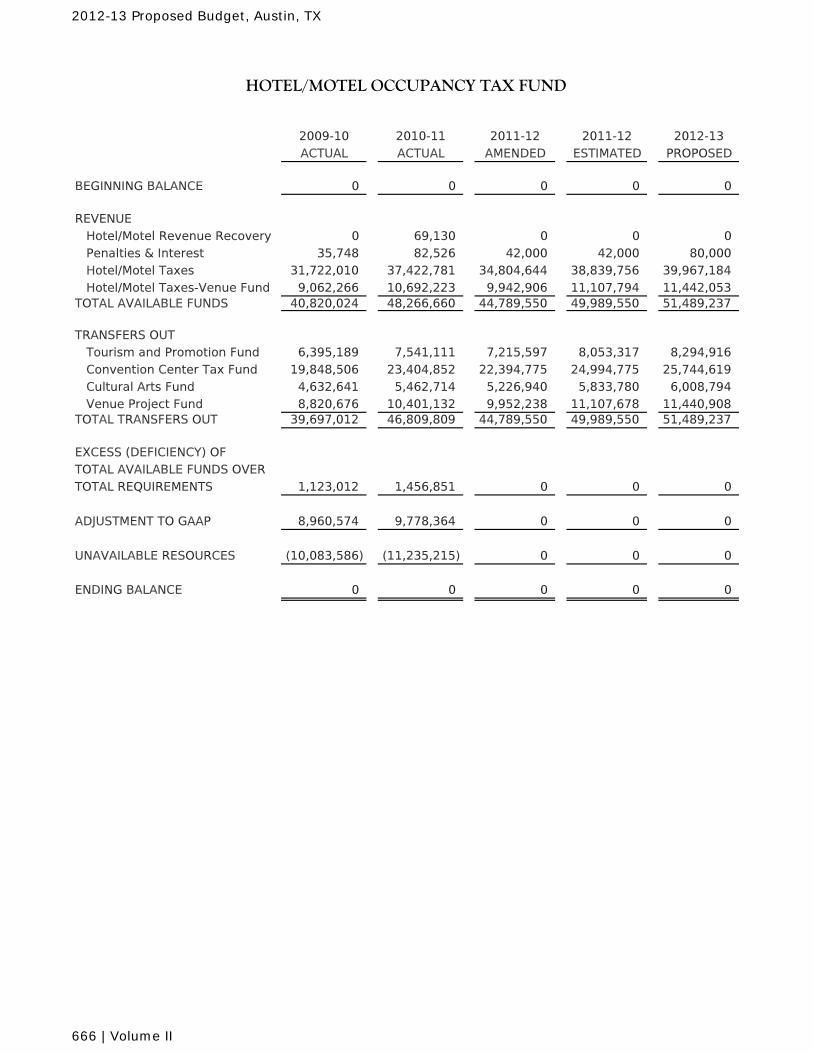
HOTEL/MOTEL OCCUPANCY TAX FUND
2009-10 2010-11 2011-12 2011-12 2012-13ACTUAL ACTUAL AMENDED ESTIMATED PROPOSED
BEGINNING BALANCE 0 0 0 0 0
REVENUE Hotel/Motel Revenue Recovery 0 69,130 0 0 0 Penalties & Interest 35,748 82,526 42,000 42,000 80,000 Hotel/Motel Taxes 31,722,010 37,422,781 34,804,644 38,839,756 39,967,184 Hotel/Motel Taxes-Venue Fund 9,062,266 10,692,223 9,942,906 11,107,794 11,442,053TOTAL AVAILABLE FUNDS 40,820,024 48,266,660 44,789,550 49,989,550 51,489,237
TRANSFERS OUT Tourism and Promotion Fund 6,395,189 7,541,111 7,215,597 8,053,317 8,294,916 Convention Center Tax Fund 19,848,506 23,404,852 22,394,775 24,994,775 25,744,619 Cultural Arts Fund 4,632,641 5,462,714 5,226,940 5,833,780 6,008,794 Venue Project Fund 8,820,676 10,401,132 9,952,238 11,107,678 11,440,908TOTAL TRANSFERS OUT 39,697,012 46,809,809 44,789,550 49,989,550 51,489,237
EXCESS (DEFICIENCY) OF TOTAL AVAILABLE FUNDS OVERTOTAL REQUIREMENTS 1,123,012 1,456,851 0 0 0
ADJUSTMENT TO GAAP 8,960,574 9,778,364 0 0 0
UNAVAILABLE RESOURCES (10,083,586) (11,235,215) 0 0 0
ENDING BALANCE 0 0 0 0 0
2012-13 Proposed Budget, Austin, TX
666 | Volume II
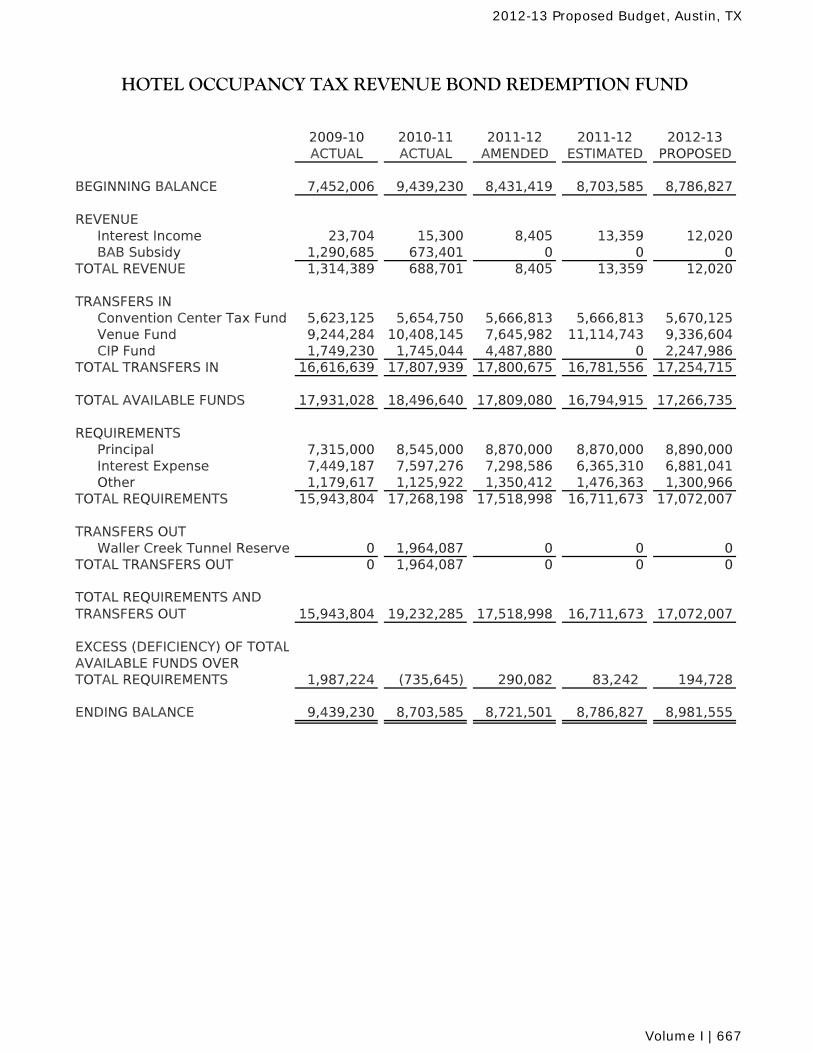
2009-10 2010-11 2011-12 2011-12 2012-13ACTUAL ACTUAL AMENDED ESTIMATED PROPOSED
BEGINNING BALANCE 7,452,006 9,439,230 8,431,419 8,703,585 8,786,827
REVENUEInterest Income 23,704 15,300 8,405 13,359 12,020BAB Subsidy 1,290,685 673,401 0 0 0
TOTAL REVENUE 1,314,389 688,701 8,405 13,359 12,020
TRANSFERS INConvention Center Tax Fund 5,623,125 5,654,750 5,666,813 5,666,813 5,670,125Venue Fund 9,244,284 10,408,145 7,645,982 11,114,743 9,336,604CIP Fund 1,749,230 1,745,044 4,487,880 0 2,247,986
TOTAL TRANSFERS IN 16,616,639 17,807,939 17,800,675 16,781,556 17,254,715
TOTAL AVAILABLE FUNDS 17,931,028 18,496,640 17,809,080 16,794,915 17,266,735
REQUIREMENTSPrincipal 7,315,000 8,545,000 8,870,000 8,870,000 8,890,000Interest Expense 7,449,187 7,597,276 7,298,586 6,365,310 6,881,041Other 1,179,617 1,125,922 1,350,412 1,476,363 1,300,966
TOTAL REQUIREMENTS 15,943,804 17,268,198 17,518,998 16,711,673 17,072,007
TRANSFERS OUTWaller Creek Tunnel Reserve 0 1,964,087 0 0 0
TOTAL TRANSFERS OUT 0 1,964,087 0 0 0
TOTAL REQUIREMENTS AND TRANSFERS OUT 15,943,804 19,232,285 17,518,998 16,711,673 17,072,007
EXCESS (DEFICIENCY) OF TOTALAVAILABLE FUNDS OVERTOTAL REQUIREMENTS 1,987,224 (735,645) 290,082 83,242 194,728
ENDING BALANCE 9,439,230 8,703,585 8,721,501 8,786,827 8,981,555
HOTEL OCCUPANCY TAX REVENUE BOND REDEMPTION FUND
2012-13 Proposed Budget, Austin, TX
Volume I | 667
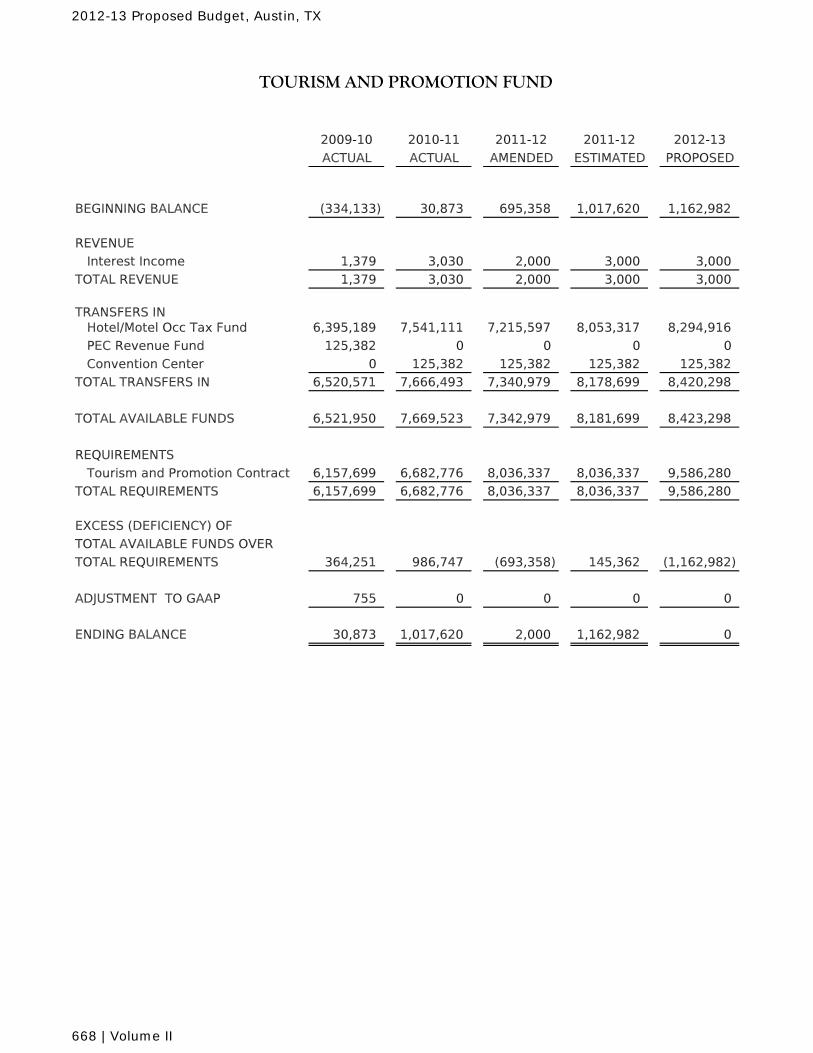
TOURISM AND PROMOTION FUND
2009-10 2010-11 2011-12 2011-12 2012-13
ACTUAL ACTUAL AMENDED ESTIMATED PROPOSED
BEGINNING BALANCE (334,133) 30,873 695,358 1,017,620 1,162,982
REVENUE
Interest Income 1,379 3,030 2,000 3,000 3,000
TOTAL REVENUE 1,379 3,030 2,000 3,000 3,000
TRANSFERS IN Hotel/Motel Occ Tax Fund 6,395,189 7,541,111 7,215,597 8,053,317 8,294,916
PEC Revenue Fund 125,382 0 0 0 0
Convention Center 0 125,382 125,382 125,382 125,382
TOTAL TRANSFERS IN 6,520,571 7,666,493 7,340,979 8,178,699 8,420,298
TOTAL AVAILABLE FUNDS 6,521,950 7,669,523 7,342,979 8,181,699 8,423,298
REQUIREMENTS
Tourism and Promotion Contract 6,157,699 6,682,776 8,036,337 8,036,337 9,586,280
TOTAL REQUIREMENTS 6,157,699 6,682,776 8,036,337 8,036,337 9,586,280
EXCESS (DEFICIENCY) OF
TOTAL AVAILABLE FUNDS OVER
TOTAL REQUIREMENTS 364,251 986,747 (693,358) 145,362 (1,162,982)
ADJUSTMENT TO GAAP 755 0 0 0 0
ENDING BALANCE 30,873 1,017,620 2,000 1,162,982 0
2012-13 Proposed Budget, Austin, TX
668 | Volume II
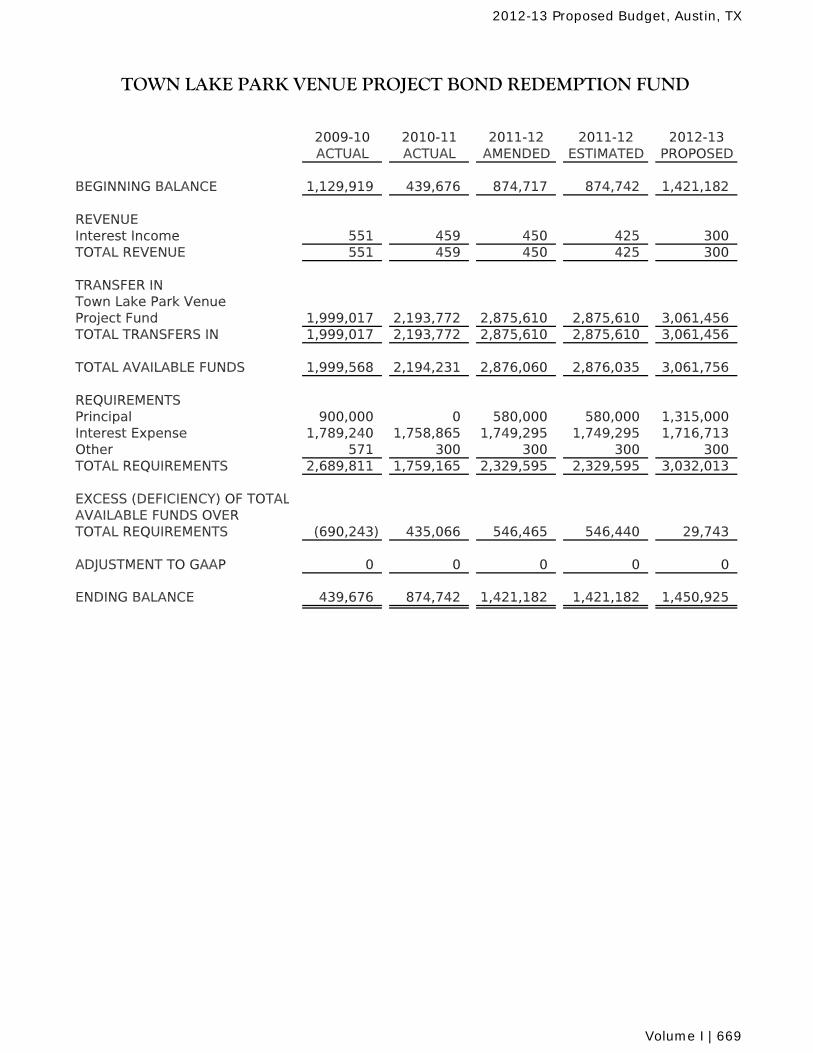
2009-10 2010-11 2011-12 2011-12 2012-13ACTUAL ACTUAL AMENDED ESTIMATED PROPOSED
BEGINNING BALANCE 1,129,919 439,676 874,717 874,742 1,421,182
REVENUEInterest Income 551 459 450 425 300TOTAL REVENUE 551 459 450 425 300
TRANSFER INTown Lake Park Venue Project Fund 1,999,017 2,193,772 2,875,610 2,875,610 3,061,456TOTAL TRANSFERS IN 1,999,017 2,193,772 2,875,610 2,875,610 3,061,456
TOTAL AVAILABLE FUNDS 1,999,568 2,194,231 2,876,060 2,876,035 3,061,756
REQUIREMENTSPrincipal 900,000 0 580,000 580,000 1,315,000Interest Expense 1,789,240 1,758,865 1,749,295 1,749,295 1,716,713Other 571 300 300 300 300TOTAL REQUIREMENTS 2,689,811 1,759,165 2,329,595 2,329,595 3,032,013
EXCESS (DEFICIENCY) OF TOTALAVAILABLE FUNDS OVERTOTAL REQUIREMENTS (690,243) 435,066 546,465 546,440 29,743
ADJUSTMENT TO GAAP 0 0 0 0 0
ENDING BALANCE 439,676 874,742 1,421,182 1,421,182 1,450,925
TOWN LAKE PARK VENUE PROJECT BOND REDEMPTION FUND
2012-13 Proposed Budget, Austin, TX
Volume I | 669

2012-13 Proposed Budget, Austin, TX
670 | Volume I


Printed by the Budget Office - August 2012
Related Documents