WORKFORCE MANAGEMENT TREND SURVEY sponsored by 2014 –2015

Welcome message from author
This document is posted to help you gain knowledge. Please leave a comment to let me know what you think about it! Share it to your friends and learn new things together.
Transcript

WORKFORCE MANAGEMENTTREND SURVEY
sponsored by
2014 –2015

Workforce Management Trend Survey 2014-2015 2
CONTENTS
Executive Summary ......................................................................................... 3
Section I: Risk Management ............................................................................ 4
Section II: Organizational Performance and Efficiency ..................................... 9
Section III: Combating Worker Fatigue .......................................................... 14
Conclusion .................................................................................................... 17
About ............................................................................................................ 18
Appendix: Demographic Information ............................................................ 19

Workforce Management Trend Survey 2014-2015 3
Employers have long relied on workforce management processes to deploy, measure, and improve the effectiveness of their labor pool. Those same functions are now playing a bigger role in recruitment and retention. As the goals for these processes evolve, so do the enabling technologies. For instance, while time and attendance practices remain the cornerstone of workforce management, leave administration and time-off policy design are emerging as focal points.
For the past five years WorkForce Software LLC, in conjunction with Workforce magazine, has endeavored to identify, document and analyze these advances in workforce management practices through an annual market survey. This year’s study examines the results of the most recent survey, while also drawing upon findings from previous surveys, when applicable, to illustrate the evolution underway.
This year’s survey explored three specific areas of workforce management:
» Risk management, with an emphasis on labor compliance.
» Organizational performance and efficiency, with a focus on labor analytics capabilities
» Employee fatigue, both assessing the business costs and exploring the potential remedies
PARTICIPANTS
For more detailed information, see Appendix.
Our current survey data represents responses from 930 HR professionals at organizations spanning a broad range of industries, geographic distribution and company size. Management level and more senior professionals comprised 78 percent of respondents.
In general, survey results show the entire set of respondents; where noted we have also examined how an organization’s size or industry impacts workforce management programs and strategies.
Size categories include:
» Small: fewer than 1,000 employees
» Midsize: 1,000-2,499 employees
» Large: more than 2,500 employees
SUMMARY OF KEY FINDINGS
» Organizations — especially midsize and large employers — view a decline in morale as the greatest risk of noncompliance with labor laws.
» Operations departments are taking more direct ownership over workforce management systems and practices, signaling a shift in how these tools are used.
» Nearly 8 in 10 organizations (77 percent) use specific scheduling practices to help new hires become more effective more quickly.
» Roughly two-thirds (63 percent) of organizations offer more generous leave programs than are required by law, signaling raised expectations about work-life balance from employees.
» Employee fatigue is widely seen as an obstacle to performance — fully three-quarters of respondents say it has a moderate-to-major impact — yet there is no single formula for addressing it.
EXECUTIVE SUMMARY

Workforce Management Trend Survey 2014-2015 4
EMPLOYEE MORALE TOPS THE LIST OF NONCOMPLIANCE CONCERNS
The role that workforce management processes play in maintaining compliance with labor regulations — such as wage and hour laws — remains essential, especially as fines and lawsuits alleging noncompliance are increasing from year to year. For example, U.S. federal lawsuits filed under the Fair Labor Standards Act (FLSA) have increased for seven consecutive years, according to research by the law firm Seyfarth Shaw LLP.1 In 2014, more than 8,000 such cases were filed, representing a 5 percent jump over the prior year and part of a long and steady climb. The Department of Labor (DOL) has also been increasingly vigilant, and has pursued a number of high profile businesses. In 2014, the DOL found LinkedIn in violation of record-keeping provisions related to the FLSA, a finding which cost LinkedIn nearly $6 million in unpaid wages and damages.2 Yet despite operating in a more aggressive enforcement environment than in years past, employers ranked several risks as greater concerns than fines and penalties (Figure 1). Notably, the largest area of compliance concern (69 percent) is damage to employee morale — a striking result and further evidence that workforce management functions are steadily being viewed through an employee-first lens.
1 Seyfarth Shaw LLP (2014). http://www.wagehourlitigation.com/files/2014/05/FLSA-Cases-20141.pdf.2 U.S. Department of Labor (2014). LinkedIn to pay nearly $6M in unpaid overtime wages and damages to 359 employees following U.S. Labor Department investigation.
SECTION I:
RISK MANAGEMENT
QUESTION: If you were to evaluate a new workforce management solution today, which function would be your primary focus?
“Balancing mandated compliance with value-added service.”
— From respondent comments on the Workforce Management Trends Survey (2014–15)
FIGURE 1HOW CONCERNED IS YOUR ORGANIZATION WITH THE NEGATIVE IMPACTS OF NONCOMPLIANCE WITH LABOR POLICY REGULATIONS IN THE FOLLOWING AREAS?
0 10 20 30 40 50 60 70 80
69%
67%
66%
65%
64%
62%
Decline inemployee morale
Brand equity/damaged reputation
Fines andpenalties
Litigation
Process audits andcorrective steps
Increased attrition

Workforce Management Trend Survey 2014-2015 5
This concern about employee perceptions and morale is even more acute when isolating the results of midsize (80 percent) and large companies (75 percent) (Figure 2). Employers have reason to be concerned about morale: Independent research has shown that nearly 70 percent of workers report dissatisfaction with their jobs3, continuing the drop in employee morale from highs last seen in 2008.4
Against that backdrop, every opportunity to improve employee engagement is an important one, and demonstrating fair, transparent and compliant practices is one way to strengthen the employer-employee relationship.
3 Stebner, B. (2013), Workplace morale heads down: 70% of Americans negative about their jobs, Gallup study shows. New York Daily News.4 Baker, B (2013). Employee morale still on the decline, but benefits education can help. Reuters.5 Engardio, P. and Arndt, M. (2007). What price reputation? Bloomberg Businessweek Magazine.6 Cable, D. and Turban, D. (2003). The value of organizational reputation in the recruitment context: a brand-equity perspective. University of Missouri.
Employee morale is a top concern for labor law compliance among both midsize (80 percent) and large (75 percent) organizations.
Brand equity came in as the second biggest concern, and that makes sense when considering new research on the linkages between brand strength and profitability. Positive brand reputation has been shown to have a direct impact on stock prices, leading to higher profits for companies that have a positive brand image.5 Additionally, research suggests that job seekers are more likely to take an offer from a company with a positive brand reputation, leading to better recruitment for companies that are viewed favorably by the public.6 Organizations are still as concerned as ever about being an employer of choice, and maintaining a positive brand reputation creates a virtuous cycle that helps attract and retain top talent.
Small Midsize Large
FIGURE 2WHAT ARE THE TOP THREE NONCOMPLIANCE CONCERNS AT YOUR ORGANIZATION?
0 10 20 30 40 50 60 70 80
79%
76%
60%
66%
63%
80%
75%
61%
68%
Decline inemployee morale
Brand equity/damaged reputation
Fines andpenalties
RESP
ONSE
S BY
COM
PAN
Y SI
ZE

Workforce Management Trend Survey 2014-2015 6
FOR MANY, LABOR COMPLIANCE REMAINS A TOUGH TASK
This is the second survey where we have asked respondents to compare the level of effort required to support labor compliance this year versus the prior one, and the numbers largely bear out what we saw last year. Approximately one-third (32 percent) of organizations report that managing labor compliance has gotten somewhat or much harder over the past year, whereas only 8 percent have noticed an improvement (Figure 3). This is a slightly improved picture over last year, when only 3 percent reported improvements, but the data still portrays the function as growing more arduous rather than less.
When questioned further as to why their job has become more difficult, respondents discussed several broad themes: keeping up with health care reform, responding to tighter regulations, dealing with company size changes and working with fewer resources. Although U.S. state and federal legislatures passed 30 percent fewer compliance bills in 2013 than they did in 20127, new domestic legislation is merely one facet of the compliance picture. New employer obligations are cropping up at the local level, for instance, and court rulings can augment existing laws. One commenter noted both of these dynamics, citing that a “local sick leave regulation took effect, [as well as] changes in state and federal protected leave,” when describing the sources of increased work. Similarly, current laws and new legislation do not always easily coexist. As one respondent said, “Different state regulations often conflict with different federal regulations,” while according to another, “It has become very labor intensive to sift through the various executive orders and other regulations to determine what needs to be changed or implemented, and then actually implementing [those changes].”
7 Ruggles, M. and Brown, C. (2013). New compliance obligations for 2014: fewer new laws, but important changes for employers. Littler Mendelson P.C.8 English, S. and Hammond, S. (2014). Cost of compliance. Thomson Reuters Accelus.
“[The method of manager alert] depends on the issue — [we use] mostly email but if [the] issue is critical, face-to-face meetings may occur.”
— From respondent comments on the Workforce Management Trends Survey (2014–15)
Additionally, nearly 1 in 5 respondents (19 percent) represents a multinational employer, many of which have operations in a number of countries. This footprint can substantially complicate labor compliance, because each region will have its own pace of labor law reform. One respondent observed that, “In Peru, the government has issued many laws about labor: pensions (AFP), payments (CTS) [and] inclusion.” Given all of these dimensions, it is not surprising that compliance teams spend on average 10 hours of every working week tracking and analyzing new regulatory developments, according to a 2014 Thomson Reuters survey.8
Much/Somewhat Harder
About the Same
Much/Somewhat Easier
FIGURE 3HOW HAS YOUR JOB OF MANAGING LABOR COMPLIANCE CHANGED SINCE LAST YEAR?
8%
60%
32%

Workforce Management Trend Survey 2014-2015 7
With so many respondents stating that compliance work has gotten harder during the past year, the question becomes: What specific activities are causing this workload increase? One area that stands out is the time required to handle leave of absence cases. Figure 4 shows that for nearly one-third of companies (31 percent), furnishing evidence for leave-of-absence compliance can take hours, and for almost 1 in 6 organizations (16 percent) the same request can take days.
The stakes for providing accurate compliance records are also quite high. In addition to providing employees with timely documentation, HR professionals may be required to furnish case records for onsite Department of Labor investigators — for example, in situations where the company’s pay practices are being examined. The ability to quickly and efficiently access such records can affect business perceptions and risk in very concrete ways, yet another factor that contributes to the intensity of compliance work and the need for precision.
Compliance work may also be difficult because workforce management functions cross many departments, as we saw again when asking about system ownership and use.
“[An] increased frequency in changing regulations [is] making it hard to keep abreast.”
— From respondent comments on the Workforce Management Trends Survey (2014–15)
For 16 percent of companies, furnishing evidence of leave of absence compliance can take days.
Minutes
Hours
Not Sure
Days
FIGURE 4HOW LONG DOES IT TAKE ON AVERAGE TO FURNISH EVIDENCE OF WAGE/HOUR OR LEAVE OF ABSENCE COMPLIANCE AT YOUR ORGANIZATION?
16%
31%21%
32%

Workforce Management Trend Survey 2014-2015 8
WORKFORCE MANAGEMENT OWNERSHIP
Workforce management practices affect every employee in the organization — along with other members of the labor pool, such as contingent and casual staff — and despite this broad reach (or perhaps because of it) do not always squarely fit within one department’s control. The most common approach is to seat workforce management processes and systems within HR, and for the third consecutive year more than half of respondents (55 percent) stated that the human resources department was the primary owner (Figure 5). However, a new path is emerging. HR ownership has receded to pre-2013 levels, and more employers are asking operations departments to take the lead with time, attendance, absence and scheduling practices. Operations departments typically play a wide role in the day-to-day handling of the business, and are often accountable for finding ways to achieve specific performance or profitability targets — goals which can be directly supported via the right staffing and absence strategies.9 As such, the increased role of operations professionals may signal growing recognition that effective workforce management improves business outcomes.
9 Goldberg, B. Explaining the role of operations. People, Processes, and Profit.
The majority of organizations house workforce management within HR (55 percent), but a growing number ask operations (29 percent) to take the lead.
“HR works cross-functionally with several other teams (legal, finance and management) to plan and implement HR programs.”
— From respondent comments on the Workforce Management Trends Survey (2014–15)
2013 2014
FIGURE 5WHICH FUNCTION PRIMARILY OWNS WORKFORCE MANAGEMENT AT YOUR ORGANIZATION?
0 10 20 30 40 50 60 70 80
55%
68%
18%
29%
5%
5%
3%
5%
Operations
HR
Payroll
Finance

Workforce Management Trend Survey 2014-2015 9
SECTION II:
ORGANIZATIONAL PERFORMANCE AND EFFICIENCY
ENABLING MANAGER COMMUNICATION
We asked several questions related to technology, including how management was alerted to workforce issues, to what degree workforce management functions were automated and whether organizations were moving their systems into the cloud. Consistent with previous years, we found that while many organizations are still heavily reliant on manual systems, a steady shift toward automation is taking place.
As organizations improve their technology foundation, they can provide more tools and support to their line managers. One prime example is configuring a system to send automated alerts when there is a task or issue (e.g. a time-entry error) that requires a manager’s attention. We asked what methods were employed today and found that a solid majority take advantage of proactive methods such as email, social media, text or online messaging, often within the application itself (Figure 6). Interestingly, despite the buzz around embedded social functionality within enterprise applications, the survey results showed that email remains king. Fully half of all respondents use email alerts to keep managers abreast of potential issues, and no other automated communication reached even the 10 percent mark. Given that checking email is a standard routine for managers in a wide range of industries, alerts sent via that route leverage existing communication channels rather than trying to forge new ones, such as using social media or texting in a business setting.
QUESTION: If you were to evaluate a new workforce management solution today, which function would be your primary focus?
“How to identify my best people to best reward them.”
— From respondent comments on the Workforce Management Trends Survey (2014–15)
No Automated Alerts
Phone
Online Message
Other
Social
Text
FIGURE 6AT YOUR ORGANIZATION, HOW ARE MANAGERS PRIMARILY ALTERTED ABOUT WORKFORCE ISSUES?
4%
1%
17%
10%
9%
9%
50%

Workforce Management Trend Survey 2014-2015 10
In the open comments, many respondents noted that minor workforce issues are handled differently than significant concerns. When there are larger doubts stemming from workforce management data, the common practice is sharing that information with the direct manager via a face-to-face meeting. This type of distinction is laudable and shows that most organizations use software where it’s appropriate, but retain the human touch for sensitive workforce issues.
ATTRACTING AND ENABLING NEW TALENT
Workforce management applications are one of the first systems an employee interacts with upon joining a company, so we asked how employers are using those systems to maximize the results of an employee’s critical first 90 days. The first question that we asked in this vein was whether specific scheduling techniques were employed to help new employees get acquainted with their role and hone the skills needed to execute at a high level (Figure 7). The results found widespread use of one or more techniques, though on-the-job training with a senior mentor is the most popular by a significant margin. Structuring time to take learning courses was the second most popular scheduling technique, used by nearly half (49 percent) of all respondents. In comparison, only 11 percent of those surveyed had neither a scheduling strategy in place nor a desire to establish one to benefit new hires.
FIGURE 7HOW DOES YOUR ORGANIZATION USE SCHEDULING TO TRAIN AND EQUIP NEW HIRES?
0 10 20 30 40 50 60
59%
49%
27%
13%
11%
6%
Pairing seniorworkers with them
Structuringlearning coursesin their schedule
Rotating throughdifferent shiftsand positions
We don’t, but wewould like to
We don’t andwe have no
current interest
Other

Workforce Management Trend Survey 2014-2015 11
Time-off policies are also frequently designed to both attract and retain quality workers, though the nature of time off is also affected by other factors, which we will describe later. Nearly two-thirds of all employers offer more generous leave policies than the law requires (Figure 8), suggesting that employers need to go above and beyond to attract the best candidates. However, while roughly a third of respondents said that time-off policy design was affected by retention or recruitment goals (Figure 9), those ranked as the second and fourth most influential objectives, respectively. Interestingly, 53 percent of respondents indicated that their time-off policies would be most likely to change if it improved productivity. These findings illustrate that organizations are using every workforce management tool at their disposal to improve top- and bottom-line results.
FIGURE 9WHAT WOULD PROMPT YOUR ORGANIZATIONTO CHANGE THE TIME-OFF PACKAGE?
0 10 20 30 40 50 60
53%
40%
36%
32%
25%
8%
Could prove itwould improve
productivity
Could prove itwould improve
retention
Could prove itwould reduceabsenteeism
Could prove itwould attract
better candidates
None ofthe above
Other
Yes, more generousthan the law requires
No, not at this time
FIGURE 8DOES YOUR ORGANIZATION OFFER LEAVE POLICIESMORE GENEROUS THAN THOSE REQUIRED BY LAW?
37%
63%

Workforce Management Trend Survey 2014-2015 12
Workforce management professionals may appreciate that their field is now being viewed in performance and productivity terms. However, these objectives must be carefully balanced with employee engagement and morale. When we asked further about leave policies and examined the specific types of additional leave (beyond the standard sick and vacation days, for example), the results revealed some potentially troubling contrasts (Figure 10). First, bereavement leave is very common, available to employees in 85 percent of responding organizations, yet leave for other life events is only available in a slim majority (55 percent) of workplaces represented. The implications of granting time off for mourning, yet not for celebrating other situations — the birth or adoption of a child, for example — could affect both employee morale and the bottom line, as unscheduled time off (if the employee takes leave anyway) is an issue at many organizations.10 Another contrast, perhaps more surprising, is that leave for mental health issues lags behind leave for physical health issues by a significant margin, 47 percent to 71 percent, respectively. Again, this type of imbalance could be negatively viewed by employees, especially if it stands in direct contrast to a published list of company values.
USE OF NEW TECHNOLOGIES
The survey also asked how employers plan to enhance their workforce management technologies in the future. When asked about the most important component of a future solution, respondents overwhelmingly listed labor analytics, by a nearly two-to-one margin over the runner-up: time and attendance (Figure 11). These results are largely consistent with responses from last year, and reveal a strong desire to make better use of labor data for business planning. When we asked about current practices, less than half (47 percent) of respondents said that they currently used labor analytics to drive business value. That figure closely corresponded with the number of organizations that have an automated
10 SHRM (2008). Examining paid leave in the workplace: helping your organization attract and retain talented employees.
approach to labor analytics, thus reinforcing the connection between using technology to make labor data readily accessible to supervisors and managers and the opportunity to make cost-efficient, precise labor decisions.
FIGURE 10WHAT TYPES OF TIME-OFF BENEFITS DOES YOUR ORGANIZATION OFFER?
0 20 40 60 80 100
85%
71%
57%
56%
55%
47%
29%
15%
Bereavement
PhysicalHealth
ReligiousHolidays
ParentalObligations
LifeEvent
MentalHealth
Other
Volunteering/Charitable Work
Labor Analytics
Time and Attendance
Absence and Leave Management
Staff Scheduling
Other
FIGURE 11IF YOU WERE TO EVALUATE A NEW WORKFORCE MANAGEMENT SOLUTION TODAY, WHICH FUNCTION WOULD BE YOUR PRIMARY FOCUS?
8%
23%
13%
13%
43%

Workforce Management Trend Survey 2014-2015 13
We also asked our participants about cloud adoption at their organization, recognizing that cloud technology allows some distinct benefits over other means of software delivery.11 Almost half of respondents (48 percent) reported that cloud delivery for new HR software and systems is a high-to-medium priority (Figure 12). Industries where cloud delivery trended as a high priority include retail/hospitality (61 percent) and finance/insurance (59 percent) (Figure 13).
11 RightScale (2014). State of the cloud report.
QUESTION: If you were to evaluate a new workforce management solution today, which function would be your primary focus?
“Getting staff from willing compliance to creative excitement, i.e. motivation and meaningful work.”
— From respondent comments on the Workforce Management Trends Survey (2014–15)
Our research suggests that many organizations are still in the early stages of cloud adoption, as the majority (51 percent) said they had moved less than a quarter of their HR systems to the cloud (Figure 14). Yet the migration is underway, and nearly 1 in 4 organizations (22 percent) have moved substantial portions of their systems into the cloud. Some organizations continue to have concerns about the cloud; however, independent research has shown that those perceived challenges diminish as an organization gains cloud maturity. Security is an often-cited concern among beginner cloud adopters, but it decreases as a concern with continued cloud usage.12 Manufacturing and professional services firms show the fastest pace of cloud adoption, with 1 in 5 organizations in both sectors reporting that more than half of their systems are in the cloud today.
High/Medium Priority
Low Priority
Not a Priority
FIGURE 12HOW CRITICAL IS CLOUD DELIVERY FOR NEW HR SOFTWARE/SYSTEMS PURCHASES AT YOUR ORGANIZATION?
32%
21%
47%
FIGURE 13CLOUD DELIVERY FOR NEW HR SOFTWARE/SYSTEMSPURCHASES IS A PRIORITY AT MY ORGANIZATION
0 10 20 30 40 50 60 70 80
62%
48%
61%
Finance/insurance
Retail/hospitality
Health care
Less than 25%
26-100%
Not Sure
FIGURE 14WHAT PERCENTAGE OF YOUR HR SYSTEMS HAVE YOU MOVED TO THE CLOUD?
27%
22%
51%
Workforce Management Trend Survey 2014-2015 14
SECTION III:
COMBATING WORKER FATIGUE
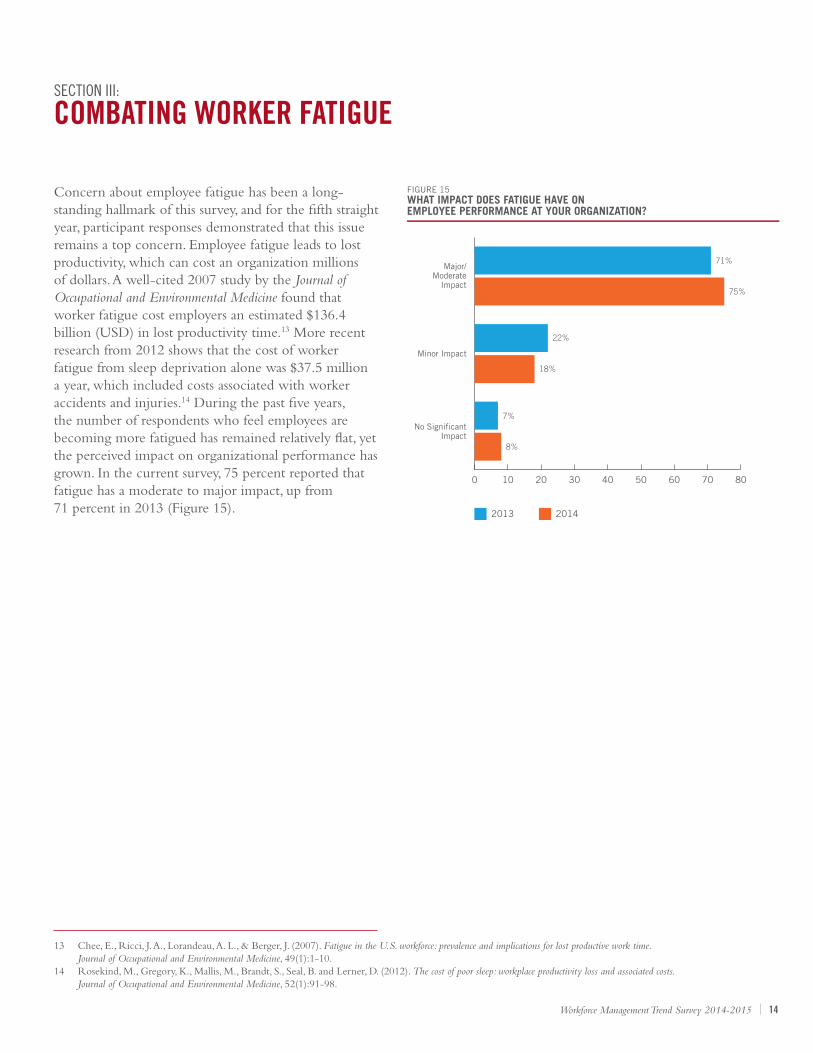
Concern about employee fatigue has been a long-standing hallmark of this survey, and for the fifth straight year, participant responses demonstrated that this issue remains a top concern. Employee fatigue leads to lost productivity, which can cost an organization millions of dollars. A well-cited 2007 study by the Journal of Occupational and Environmental Medicine found that worker fatigue cost employers an estimated $136.4 billion (USD) in lost productivity time.13 More recent research from 2012 shows that the cost of worker fatigue from sleep deprivation alone was $37.5 million a year, which included costs associated with worker accidents and injuries.14 During the past five years, the number of respondents who feel employees are becoming more fatigued has remained relatively flat, yet the perceived impact on organizational performance has grown. In the current survey, 75 percent reported that fatigue has a moderate to major impact, up from 71 percent in 2013 (Figure 15).
13 Chee, E., Ricci, J. A., Lorandeau, A. L., & Berger, J. (2007). Fatigue in the U.S. workforce: prevalence and implications for lost productive work time. Journal of Occupational and Environmental Medicine, 49(1):1-10.14 Rosekind, M., Gregory, K., Mallis, M., Brandt, S., Seal, B. and Lerner, D. (2012). The cost of poor sleep: workplace productivity loss and associated costs. Journal of Occupational and Environmental Medicine, 52(1):91-98.
2013 2014
FIGURE 15WHAT IMPACT DOES FATIGUE HAVE ONEMPLOYEE PERFORMANCE AT YOUR ORGANIZATION?
0 10 20 30 40 50 60 70 80
75%
71%
22%
18%
7%
8%
Minor Impact
Major/Moderate
Impact
No SignificantImpact

Workforce Management Trend Survey 2014-2015 15
Data from this year’s survey shows how companies are using a number of different strategies to keep their employees alert. Figure 16 shows companies most often use flextime (38 percent), adjusting scheduling practices (32 percent) or telecommuting (38 percent) to counteract fatigue. These practices were consistent across industries, although the energy/utility sector was more likely (38 percent) to use contingent labor to combat worker fatigue. Several respondents also offered unique ideas for addressing the fatigue issue, such as providing an office sleep room, in-house yoga or reviewing specific tasks to make them less labor-intensive. However, there is more to be done in the realm of mitigating fatigue, given that a third of surveyed organizations (33 percent) do not have any programs in place at all. Limited budgets may tell the story. When asked, “What are the barriers to improving the conditions of employee fatigue at your organization?” 49 percent cited budgetary constraints as a top concern, followed by understaffing (45 percent) (Figure 17).
2013 2014
FIGURE 17WHAT ARE THE BARRIERS TO IMPROVING THE CONDITIONSOF EMPLOYEE FATIGUE AT YOUR ORGANIZATION?
0 10 20 30 40 50
49%
42%
39%
45%
30%
36%
32%
35%
Understaffingrelative toworkload
Budgetconstraints
Not amanagement
priority
Poor understandingof the impact of
employee fatigueon the business
FIGURE 16WHAT STRATEGIES DOES YOUR ORGANIZATION USE TO MITIGATE EMPLOYEE FATIGUE?
0 5 10 15 20 25 30 35 40
33%
38%
32%
28%
None; myorganization does
not have programsto address
employee fatigue
Flextime
Adjustscheduling
practices
Telecommuting/work from home

Workforce Management Trend Survey 2014-2015 16
There are clear financial benefits — beyond accident avoidance — to mitigating employee fatigue. The cost of fatigue-related absenteeism continues to affect bottom-line profits. Organizations estimate an average annual loss of productivity of 11 percent due to unplanned absences. In addition, the average cost to businesses for unplanned absences is equivalent to 74 percent of replaced worker salary.15 Our survey results add credence to this connection between fatigue and unplanned absence. In fact, absence patterns were the most common (70 percent) sign of fatigue risk among factors being monitored by respondents (Figure 18) — yet another example of how employers continually use workforce management data to operate more effectively.
15 Mollie Lombardi (2013). Total Workforce Management 2013: Absence Management. Aberdeen Group.
FIGURE 18WHICH OF THE FOLLOWING DO YOU CURRENTLY MONITOR TO WATCH FOR SIGNS OF EMPLOYEE FATIGUE AND/OR UNPLANNED ATTRITION?
0 10 20 30 40 50 60 70 80
69%
67%
66%
65%
64%
Absence Patterns
Hours Worked
Extended Leave
Other
Shift Changes

Workforce Management Trend Survey 2014-2015 17
Workforce management systems and practices are continuing to play a bigger role in securing top talent and improving business performance. On the HR side, the majority of organizations are already designing scheduling and time-off programs to cater to new hires and retain their best employees. Most organizations offer leave policies more generous than those required by law, which suggests that employees expect them to go above and beyond what is simply required by law to stand out as an employer of choice. On the operations side, those same policies are being scrutinized to understand their effect on company profitability, and businesses have a big appetite for better labor analytics tools to help inform company strategy. Critically, these two drivers are closely interrelated, rather than being separate goals. Organizations are starting to recognize the relationships between intricate functions like labor compliance and employee morale, and many are testing out new ways of strengthening the employer-employee bond — particularly at sensitive times, such as a leave of absence. When organizations get it right, they are rewarded not only with improved morale, but also with a resulting boost in productivity as a result of keeping employees informed, engaged, and incented to remain part of the team.
CONCLUSION

Workforce Management Trend Survey 2014-2015 18
WORKFORCE MAGAZINE
Workforce is a multimedia publication that covers the intersection of people management and business strategy. Our community of senior-level human resources executives and C-level officers are the key decision-makers on talent management matters in the 2,500 largest corporations in America. They read us for our editorial focus and relevance to help them improve their business — and their bottom line — through effective management of the workforce. While employees and executives often bemoan the bureaucratic nature of HR processes, companies increasingly realize they need to be smarter about the ways they attract, retain and train their workforce. Our content helps HR professionals approach their jobs from a more strategic, big-picture, business-results perspective.
WORKFORCE SOFTWARE
WorkForce Software is the leader in workforce management software for organizations with complex policies and compliance concerns. Through its cloud-based EmpCenter® and RosterLive® workforce management suites, WorkForce Software enables organizations to fully automate time and attendance processes, effectively manage employee absence and leave, optimize staff scheduling, gain real-time visibility into labor costs, and mitigate the risks associated with employee fatigue.
HUMAN CAPITAL MEDIA
The Human Capital Media (HCM) Research and Advisory Group is the research division of Human Capital Media, publisher of Chief Learning Officer, Talent Management and Workforce magazines. The Research and Advisory Group specializes in partnered research solutions — customizable and proprietary deliverables that integrate seamlessly with existing sales and marketing programs. Leveraging our access to senior-level decision-makers and proven HR industry expertise, we undertake market and thought leadership research in the human resources industry. Creating custom content and presenting thought leadership research are all part of the Research and Advisory Group’s focus.
If you have any questions, contact Sarah Kimmel, research director: [email protected].
ABOUT
Workforce Management Trend Survey 2014-2015 19
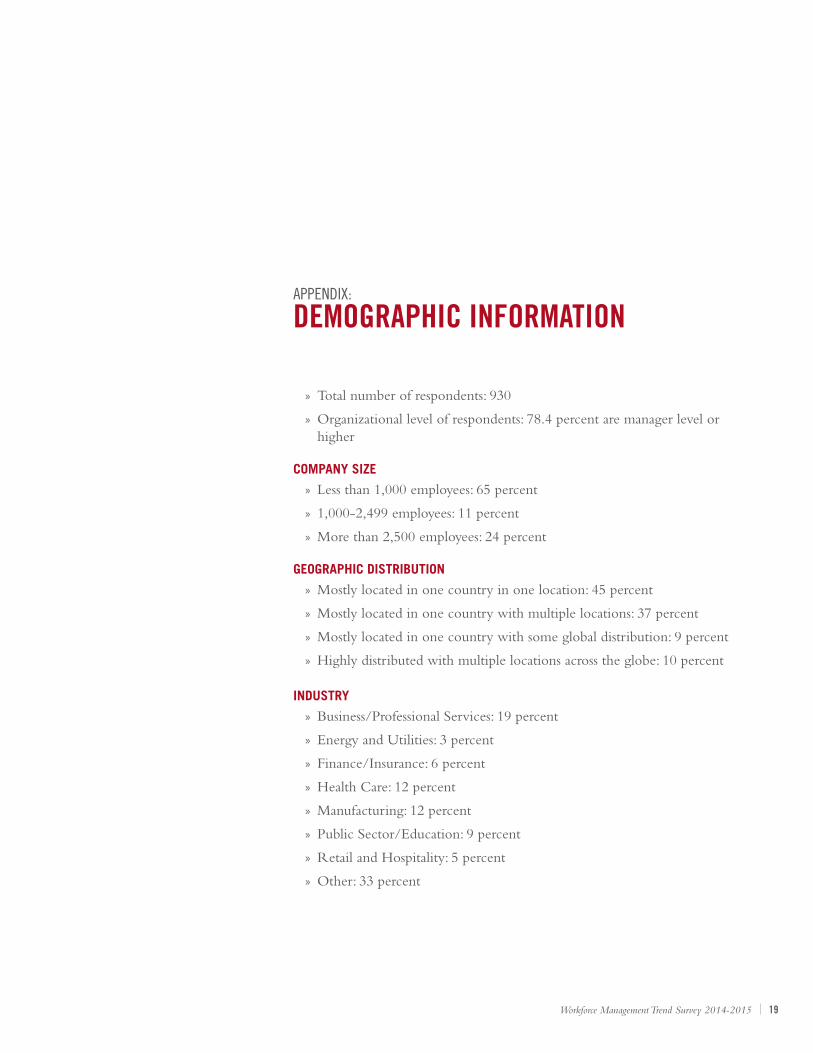
APPENDIX:
DEMOGRAPHIC INFORMATION
» Total number of respondents: 930
» Organizational level of respondents: 78.4 percent are manager level or higher
COMPANY SIZE
» Less than 1,000 employees: 65 percent
» 1,000-2,499 employees: 11 percent
» More than 2,500 employees: 24 percent
GEOGRAPHIC DISTRIBUTION
» Mostly located in one country in one location: 45 percent
» Mostly located in one country with multiple locations: 37 percent
» Mostly located in one country with some global distribution: 9 percent
» Highly distributed with multiple locations across the globe: 10 percent
INDUSTRY
» Business/Professional Services: 19 percent
» Energy and Utilities: 3 percent
» Finance/Insurance: 6 percent
» Health Care: 12 percent
» Manufacturing: 12 percent
» Public Sector/Education: 9 percent
» Retail and Hospitality: 5 percent
» Other: 33 percent
Related Documents

![(UNTITLED) [ ] · PDF fileTitle (UNTITLED) Subject (UNTITLED) Keywords](https://static.cupdf.com/doc/110x72/5a7ca10e7f8b9ae9398d019f/untitled-untitled-subject-untitled-keywords.jpg)
![Untitled Document []€¦ · Title: Untitled Document Created Date: 191000309095417](https://static.cupdf.com/doc/110x72/600101983d1deb13132b1db7/untitled-document-title-untitled-document-created-date-191000309095417.jpg)
![(UNTITLED) []...Title (UNTITLED) Subject (UNTITLED)](https://static.cupdf.com/doc/110x72/5e75d9c1b01cbe739756294f/-untitled-title-untitled-subject-untitled.jpg)
![Untitled Document [] · Title: Untitled Document Created Date: 191050201155549](https://static.cupdf.com/doc/110x72/5fb77709eb118919875133dc/untitled-document-title-untitled-document-created-date-191050201155549.jpg)
![Untitled-2 [about.gitlab.com] · Title: Untitled-2 Created Date: 20161031172420Z](https://static.cupdf.com/doc/110x72/5aecde047f8b9a66258f266b/untitled-2-about-untitled-2-created-date-20161031172420z.jpg)
![Untitled Document []...Title Untitled Document Created Date 20050211140857Z](https://static.cupdf.com/doc/110x72/5f05dd4f7e708231d41518d4/-untitled-document-title-untitled-document-created-date-20050211140857z.jpg)
![Untitled-5 [] · Title: Untitled-5 Created Date: 20010118111809Z](https://static.cupdf.com/doc/110x72/5f88abbf1b028837b776432c/untitled-5-title-untitled-5-created-date-20010118111809z.jpg)
![Untitled-6 []...Untitled-6 Author: turtle Subject: Untitled-6 Created Date: 3/5/2003 8:41:27 PM ...](https://static.cupdf.com/doc/110x72/602bf9e5400fe51bf2284894/untitled-6-untitled-6-author-turtle-subject-untitled-6-created-date-352003.jpg)
![Untitled-5 []Title Untitled-5 Created Date 20140415073242Z](https://static.cupdf.com/doc/110x72/5ffd33023c19df0499476daa/-untitled-5-title-untitled-5-created-date-20140415073242z.jpg)

![(UNTITLED) []...Title (UNTITLED) Subject (UNTITLED) Keywords](https://static.cupdf.com/doc/110x72/5e9b61cb57896228d3155fa7/-untitled-title-untitled-subject-untitled-keywords.jpg)