Abstract⎯Capsule endoscopy is a non-invasive imaging technique commonly used for screening of the entire small intestine. It is performed by a wireless swallowable endoscopic capsule capable of transmitting thousands of video frames per examination. The visual inspection of the vast amount of images acquired during such an examination is a subjective and highly time consuming task even for experienced gastroenterologists. In this paper we propose a novel approach to the reduction of the number of the video frames to be inspected so as to enable faster inspection of the endoscopic video. It is based on symmetric non-negative matrix factorisation initialised by the fuzzy c-means algorithm and it is supported by non-negative Lagrangian relaxation to extract a subset of video frames containing the most representative scenes from a whole endoscopic examination. The experimental evaluation of the proposed approach was tested on annotated endoscopic videos with frames displaying ulcers, bleedings and normal tissues from various sites in the small intestine. The results demonstrate that the video summary produced consists of representative frames from all the abnormal findings and the normal tissues of the input video. Index Terms⎯non-negative matrix factorisation, summarisation, video, wireless capsule endoscopy I. INTRODUCTION Wireless Capsule Endoscopy (WCE) was introduced in the early beginnings of this century for the examination of the gastrointestinal tract and especially of the small intestine [1]. It represents a major departure from conventional endoscopy which is usually uncomfortable for the patient. It is performed by a swallowable capsule with the size of a large vitamin that includes a miniature colour video camera, a light, a battery and a video stream transmitter. With this capsule, the physician can efficiently diagnose a range of gastrointestinal disorders, including ulcer, unexplained bleeding, and polyps. The visual inspection of the WCE video is a challenging task even for the most experienced endoscopists. A typical size for such a video is approx. 55,000 frames, and it usually takes more than an whole hour of intense labour in front of a monitor device to examine all these frames [2]. However, this manual examination process does not guarantee that some abnormal regions are missed. For example, it is quite common that an abnormal lesion is D. K. Iakovidis, S. Tsevas and D. Maroulis are with the University of Athens, department of Informatics and Telecommunications, Panepistimiopolis, GR-15784, Athens, Greece (e-mail: [email protected], [email protected], [email protected]). A. Polydorou, M.D. is with Aretaieion Hospital, Department of Surgery, V. Sofias 76 av, GR 11527, Athens, Greece. visible in only a few frames, or it can be so small or flat that it may escape from the examiners notice. Computational approaches coping with the analysis of the WCE video include the development of special annotation tools to auto-bookmark abnormalities [3]; classification approaches that perform tissue discrimination either between normal and abnormal regions [4] or between different organs [5-7]; synergistic methodologies such as image registration techniques and L-G graphs for the detection of abnormal patterns in WCE images [8]; clustering techniques for blood detection [9]; neural network techniques for classification or detection of abnormal patterns [10,11,16]; intestinal motility assessment methodologies [13,15]; and other approaches that aim either to image enhancement [12] or to the rejection of invalid parts of the WCE video by performing intestinal juice detection [14]. However, to the best of our knowledge, no major contribution has been made to the reduction of the time required for visual inspection of the WCE video. To cope with this issue, we propose an effective computational approach that drastically reduces the video frames to be inspected enabling this way faster inspection of the video sequence. The proposed approach applies a methodology based on non-negative matrix factorisation (NMF) [17] to summarize the WCE video by keeping the most representative scenes from the whole examination. NMF was proposed in [19] in an effort to preserve much of the structure of the input data and, at the same time, to guarantee that both the resulting basis and its accompanying weights are non-negative. NMF’s notion, lies in the process of using a low-dimensional subspace to approximate a much larger one. Lee and Seung [17-19] demonstrated that NMF is able to offer parts-based representations in contrast to other methods such as principal component analysis and vector quantization, leading to a more intuitive approach towards real world data. The rest of this paper consists of three sections. Section II provides a description of the proposed methodology. Section III, presents the results of its experimental application on WCE video data, and Section IV summarises the conclusions that can be derived from this study. II. METHODOLOGY The proposed WCE video summarisation approach is based on the methodology described in [17]. It involves three steps. In the first step FCM is applied on the input video Unsupervised Summarisation of Capsule Endoscopy Video D. K. Iakovidis, Member, IEEE, S. Tsevas, Student Member, IEEE, D. Maroulis, Member, IEEE, and A. Polydorou 2008 4th International IEEE Conference "Intelligent Systems" 978-1-4244-1739-1/08/$25.00 © 2008 IEEE 3-15

Welcome message from author
This document is posted to help you gain knowledge. Please leave a comment to let me know what you think about it! Share it to your friends and learn new things together.
Transcript
Abstract⎯Capsule endoscopy is a non-invasive imaging
technique commonly used for screening of the entire small intestine. It is performed by a wireless swallowable endoscopic capsule capable of transmitting thousands of video frames per examination. The visual inspection of the vast amount of images acquired during such an examination is a subjective and highly time consuming task even for experienced gastroenterologists. In this paper we propose a novel approach to the reduction of the number of the video frames to be inspected so as to enable faster inspection of the endoscopic video. It is based on symmetric non-negative matrix factorisation initialised by the fuzzy c-means algorithm and it is supported by non-negative Lagrangian relaxation to extract a subset of video frames containing the most representative scenes from a whole endoscopic examination. The experimental evaluation of the proposed approach was tested on annotated endoscopic videos with frames displaying ulcers, bleedings and normal tissues from various sites in the small intestine. The results demonstrate that the video summary produced consists of representative frames from all the abnormal findings and the normal tissues of the input video.
Index Terms⎯non-negative matrix factorisation, summarisation, video, wireless capsule endoscopy
I. INTRODUCTION
Wireless Capsule Endoscopy (WCE) was introduced in the early beginnings of this century for the examination of the gastrointestinal tract and especially of the small intestine [1]. It represents a major departure from conventional endoscopy which is usually uncomfortable for the patient. It is performed by a swallowable capsule with the size of a large vitamin that includes a miniature colour video camera, a light, a battery and a video stream transmitter. With this capsule, the physician can efficiently diagnose a range of gastrointestinal disorders, including ulcer, unexplained bleeding, and polyps.
The visual inspection of the WCE video is a challenging task even for the most experienced endoscopists. A typical size for such a video is approx. 55,000 frames, and it usually takes more than an whole hour of intense labour in front of a monitor device to examine all these frames [2]. However, this manual examination process does not guarantee that some abnormal regions are missed. For example, it is quite common that an abnormal lesion is
D. K. Iakovidis, S. Tsevas and D. Maroulis are with the University of
Athens, department of Informatics and Telecommunications, Panepistimiopolis, GR-15784, Athens, Greece (e-mail: [email protected], [email protected], [email protected]).
A. Polydorou, M.D. is with Aretaieion Hospital, Department of Surgery, V. Sofias 76 av, GR 11527, Athens, Greece.
visible in only a few frames, or it can be so small or flat that it may escape from the examiners notice.
Computational approaches coping with the analysis of the WCE video include the development of special annotation tools to auto-bookmark abnormalities [3]; classification approaches that perform tissue discrimination either between normal and abnormal regions [4] or between different organs [5-7]; synergistic methodologies such as image registration techniques and L-G graphs for the detection of abnormal patterns in WCE images [8]; clustering techniques for blood detection [9]; neural network techniques for classification or detection of abnormal patterns [10,11,16]; intestinal motility assessment methodologies [13,15]; and other approaches that aim either to image enhancement [12] or to the rejection of invalid parts of the WCE video by performing intestinal juice detection [14].
However, to the best of our knowledge, no major contribution has been made to the reduction of the time required for visual inspection of the WCE video. To cope with this issue, we propose an effective computational approach that drastically reduces the video frames to be inspected enabling this way faster inspection of the video sequence. The proposed approach applies a methodology based on non-negative matrix factorisation (NMF) [17] to summarize the WCE video by keeping the most representative scenes from the whole examination.
NMF was proposed in [19] in an effort to preserve much of the structure of the input data and, at the same time, to guarantee that both the resulting basis and its accompanying weights are non-negative. NMF’s notion, lies in the process of using a low-dimensional subspace to approximate a much larger one. Lee and Seung [17-19] demonstrated that NMF is able to offer parts-based representations in contrast to other methods such as principal component analysis and vector quantization, leading to a more intuitive approach towards real world data.
The rest of this paper consists of three sections. Section II provides a description of the proposed methodology. Section III, presents the results of its experimental application on WCE video data, and Section IV summarises the conclusions that can be derived from this study.
II. METHODOLOGY The proposed WCE video summarisation approach is based on the methodology described in [17]. It involves three steps. In the first step FCM is applied on the input video
Unsupervised Summarisation of Capsule Endoscopy Video
D. K. Iakovidis, Member, IEEE, S. Tsevas, Student Member, IEEE, D. Maroulis, Member, IEEE, and A. Polydorou
2008 4th International IEEE Conference "Intelligent Systems"
978-1-4244-1739-1/08/$25.00 © 2008 IEEE 3-15
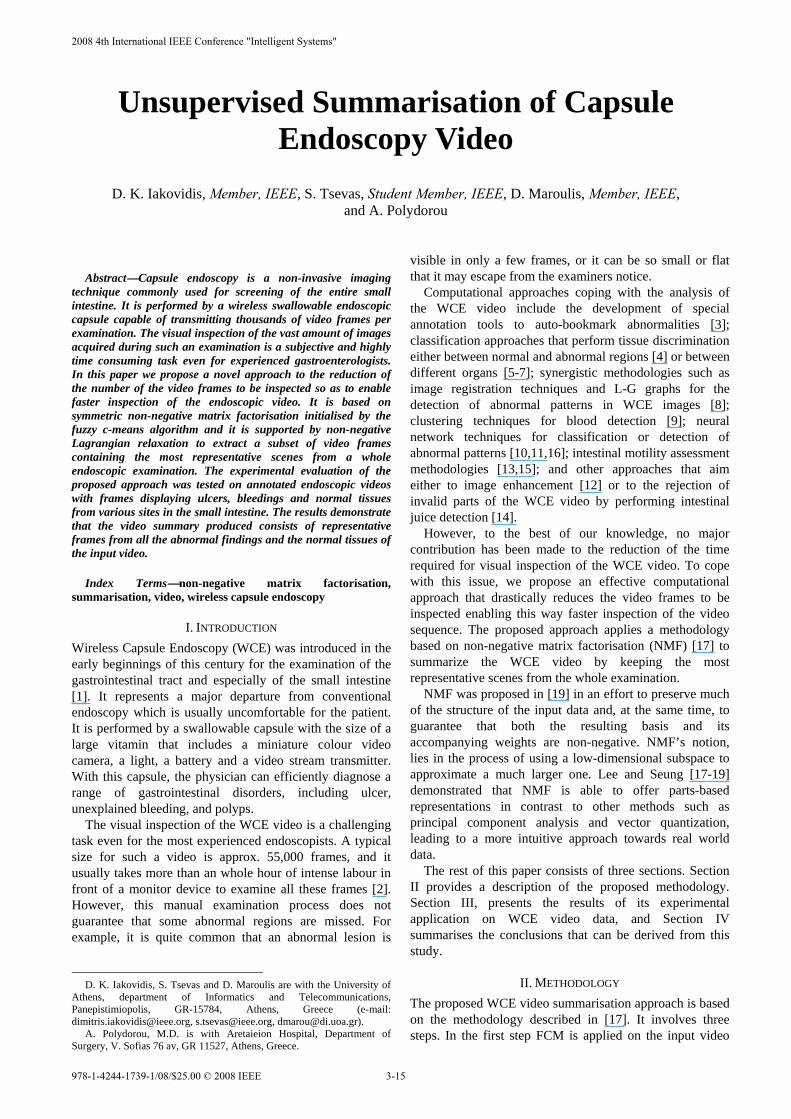
stream to group its frames into a predefined number of clusters, whereas in the second and in the third step two NMF algorithms are subsequently applied on the clustered frames so that they extract only some representative video frames from the whole video. An overview of this methodology is illustrated in Fig.1.
Given a non-negative m×n matrix V, the NMF algorithms seeks to find non-negative factors W and H of V such that:
HWVV ×=≈ (1)
where km×ℜ∈W and nk×ℜ∈H .
Intuitively, we may think of W as the matrix containing the NMF basis and H as the matrix containing the non-negative coefficients. Consequently, NMF solves the following optimisation problem:
0HWWHVHW,
≥− , , min 2F (2)
where H actually is a reduced representation of V with lower dimensionality and F stands for the Frobenius norm of a matrix.
The dimensionality and the initial values of W and H (or just H in certain algorithms) are determined by means of the FCM algorithm. FCM performs soft clustering of the video frames so that they belong to more than a single cluster. The memberships of each frame to the different clusters are stored in a m×n matrix UFCM. To prepare the input of the FCM, a n×n similarity matrix V is constructed according to the process described in [17].
The dimension k of V is set equal to the predefined number of clusters c, whereas W and H are initialized with the m-dimensional cluster centroids and the values of the membership matrix of the converged FCM, respectively. The neighbouring frames in the original m-dimensional vector space, are determined by calculating the n×n matrix DE of the Euclidean distances. Using the DE, the calculation
of the geodesic distance matrix takes place resulting in a matrix DG that contains the geodesic distances (shortest paths) between the vectorial representations of the frames. Next, DG is transformed into a pairwise similarity matrix according to Eq.(3),
rDG
eV−
= (3) The symmetric NMF (SymNMF) which for a square
matrix is:
THHV ×≈ (4) is applied on V so that it “unfolds” the clusters and make them more transparent. According to [22] the calculation of H is iterative according the following update rule:
( )( ) ⎟
⎟
⎠
⎞
⎜⎜
⎝
⎛+−=+
jik
T
jikj
ikj
ikHHH
VHHH ββ11 (5)
where j stands for the iteration index, Hik is the (i,k) entry of H and 10 ≤< β , with 0.5 advised as a good choice for beta value [32]. For j=0, H is set to UFCM. SymNMF iterates until
11 εLL jj <−+ (6)
where ε1 is a small positive constant close to zero and Lj is the objective function of the SymNMF at the j-th iteration and is defined as:
2
FTjjjjL HHV −= (7)
Fig. 1. Methodology for unsupervised summarisation of WCE video.
3-16
The final step of the methodology imposes orthogonality constraints on the output of the SymNMF so as to extract the most representative members of a given cluster. It is implemented by means of an NMF multiplicative update algorithm known as Non-negative Lagrangian Relaxation (NLR) [17, 23]. This algorithm iterates according to the following update rule:
( )( ) j
ik
jikj
ikj
ik XVX
XXα
=+1 , VXXT=α (8)
until:
21 εLL jj <−+ (9)
where ε2 is a very small positive constant close to zero and Lj is the objective function of the NLR at the j-th iteration and is defined as:
( ) ( )( )IXXVTX −−= TTjL αTr Tr (10)
Tr(·) stands for the trace of the matrix (the summary of the diagonal elements) and I is the identity matrix. For j=0, X is set to the result obtained by the SymNMF.
In NLR the entries of X are viewed as cluster indicators and as a result the interpretation of the results at convergence is straightforward allowing this way a relatively easy interpretation of the cluster structure.
III. RESULTS
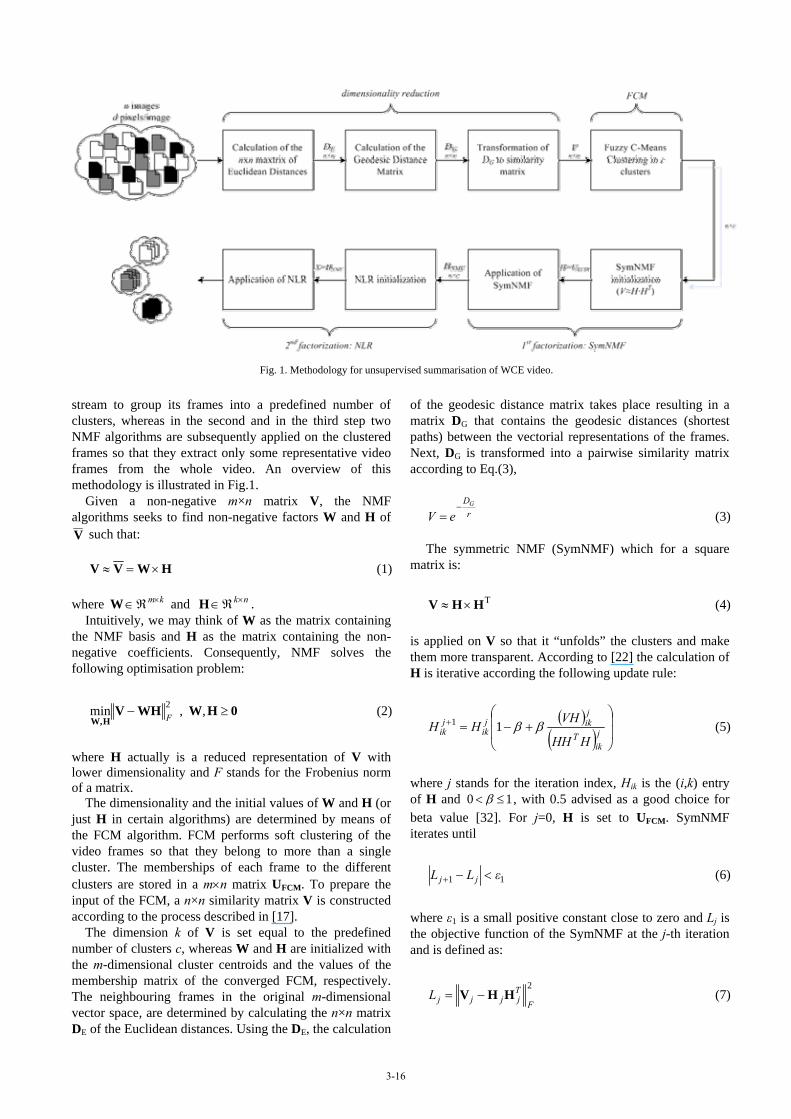
A number of experiments were conducted to illustrate the performance of the proposed summarization approach on a controlled dataset comprising of annotated video frames with ground truth information provided by expert endoscopists. A total of 281,000 WCE frames were obtained with identical imaging settings from different patients. Each frame was visually inspected by the experts, and two kinds of abnormal findings were identified; ulcers and bleeding. As each finding was visible in more than a single frame, neighbourhoods of frames were extracted for each finding. This process led to the extraction of a total of eight neighbourhoods of frames with abnormal findings, summing up to 40 and 58 frames of ulcers and bleedings respectively. These two sets of frames were further balanced at 40 frames per category by random sampling of the larger set to avoid bias. Aiming to investigate the discrimination between abnormal and normal tissues, a total of 40 frames of normal tissues, was appended. The normal frames were extracted from randomly sampled neighbourhoods of normal tissues over the whole dataset. The composition of the resulting 120-frame dataset (n=120) is presented in Table 1. Indicative images from this dataset are illustrated in Fig. 2.
In order to reduce the computational cost and the detail of each frame the video frames were rescaled from 260×260 pixels to 91×91 pixels (m=8281).
Experimentation showed that the use of smaller frames was not beneficial for the overall results.
The images were converted to greyscale and used to form the initial dataset matrix of m×n dimensions. By following the process described in the previous section we calculated the similarity matrix V according Eq. 3, with r=100 [17], so as to proceed with the FCM calculations. FCM was executed for 3 clusters. The algorithm was implemented in MATLABTM using the fuzzy-logic toolbox.
(a)
(b)
(c)
Fig.2. Indicative frames (a) for ulcer (b) normal regions and (c) bleedings.
TABLE I NEIGHBOURHOODS PER CATEGORY AND NUMBER OF FRAMES PER
NEIGHBOURHOOD
U N B 11 10 12 8 7 19 12 4 5 9 6 4 3 4 6
U stands for Ulcer, N for Normal, and B stands for Bleeding. Each cell in the U, N and B columns of the table represents a neighbourhood of frames.
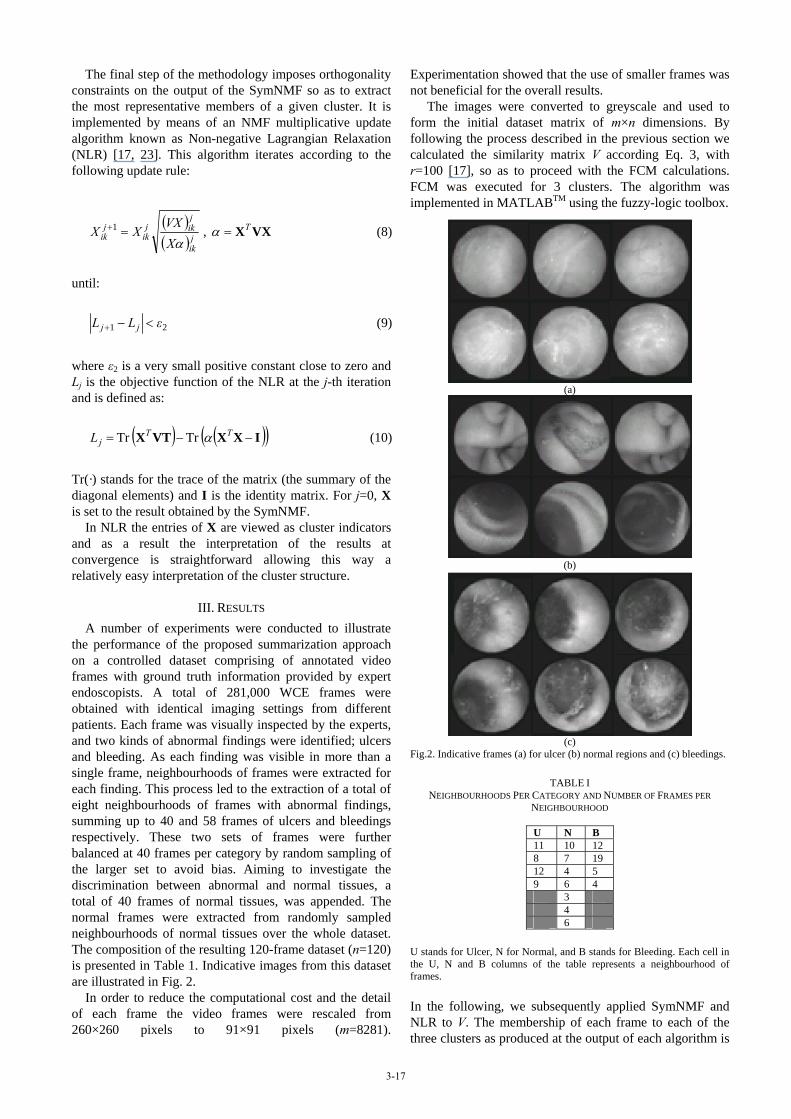
In the following, we subsequently applied SymNMF and NLR to V. The membership of each frame to each of the three clusters as produced at the output of each algorithm is
3-17
illustrated in Figs. 3 and 4, respectively. It can be observed that still after SymNMF the cluster structure is not clear. After the application of NLR the clusters are not really separated, though NLR enforces orthogonality. Actually, only a part of the examples are strictly ‘orthogonal’ to the members of other clusters. These members form the Most Representative Examples (MREs) of the cluster.
20 40 60 80 100 120
0.0
0.4
0.8
Cluster 1
Cluster 2
Cluster 3
SymNMF
Frame Number
Mem
bers
hip
Valu
e
Fig. 3. Result of the SymNMF.
20 40 60 80 100 120
0.000.020.040.060.080.100.120.140.160.180.20
Cluster 1
Cluster 2
Cluster 3
NLR
Frame Number
Mem
bers
hip
Val
ue
Fig. 4. Result of the NLR.
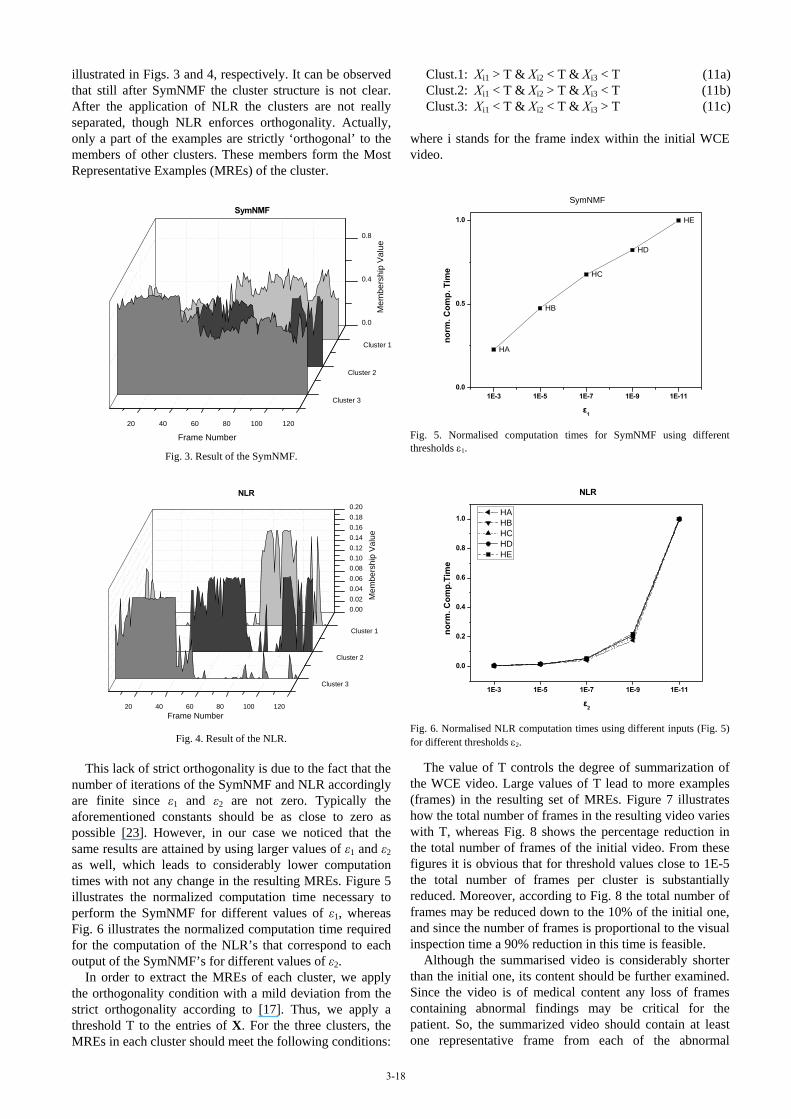
This lack of strict orthogonality is due to the fact that the number of iterations of the SymNMF and NLR accordingly are finite since ε1 and ε2 are not zero. Typically the aforementioned constants should be as close to zero as possible [23]. However, in our case we noticed that the same results are attained by using larger values of ε1 and ε2 as well, which leads to considerably lower computation times with not any change in the resulting MREs. Figure 5 illustrates the normalized computation time necessary to perform the SymNMF for different values of ε1, whereas Fig. 6 illustrates the normalized computation time required for the computation of the NLR’s that correspond to each output of the SymNMF’s for different values of ε2.
In order to extract the MREs of each cluster, we apply the orthogonality condition with a mild deviation from the strict orthogonality according to [17]. Thus, we apply a threshold T to the entries of X. For the three clusters, the MREs in each cluster should meet the following conditions:
Clust.1: Xi1 > T & Xi2 < T & Xi3 < T (11a) Clust.2: Xi1 < T & Xi2 > T & Xi3 < T (11b) Clust.3: Xi1 < T & Xi2 < T & Xi3 > T (11c)
where i stands for the frame index within the initial WCE video.
1E-3 1E-5 1E-7 1E-9 1E-110.0
0.5
1.0
HA
HB
HC
HD
HE
SymNMF
norm
. Com
p. T
ime
ε1
Fig. 5. Normalised computation times for SymNMF using different thresholds ε1.
1E-3 1E-5 1E-7 1E-9 1E-11
0.0
0.2
0.4
0.6
0.8
1.0
NLR
norm
. Com
p.Ti
me
ε2
HA HB HC HD HE
Fig. 6. Normalised NLR computation times using different inputs (Fig. 5) for different thresholds ε2.
The value of T controls the degree of summarization of the WCE video. Large values of T lead to more examples (frames) in the resulting set of MREs. Figure 7 illustrates how the total number of frames in the resulting video varies with T, whereas Fig. 8 shows the percentage reduction in the total number of frames of the initial video. From these figures it is obvious that for threshold values close to 1E-5 the total number of frames per cluster is substantially reduced. Moreover, according to Fig. 8 the total number of frames may be reduced down to the 10% of the initial one, and since the number of frames is proportional to the visual inspection time a 90% reduction in this time is feasible.
Although the summarised video is considerably shorter than the initial one, its content should be further examined. Since the video is of medical content any loss of frames containing abnormal findings may be critical for the patient. So, the summarized video should contain at least one representative frame from each of the abnormal
3-18
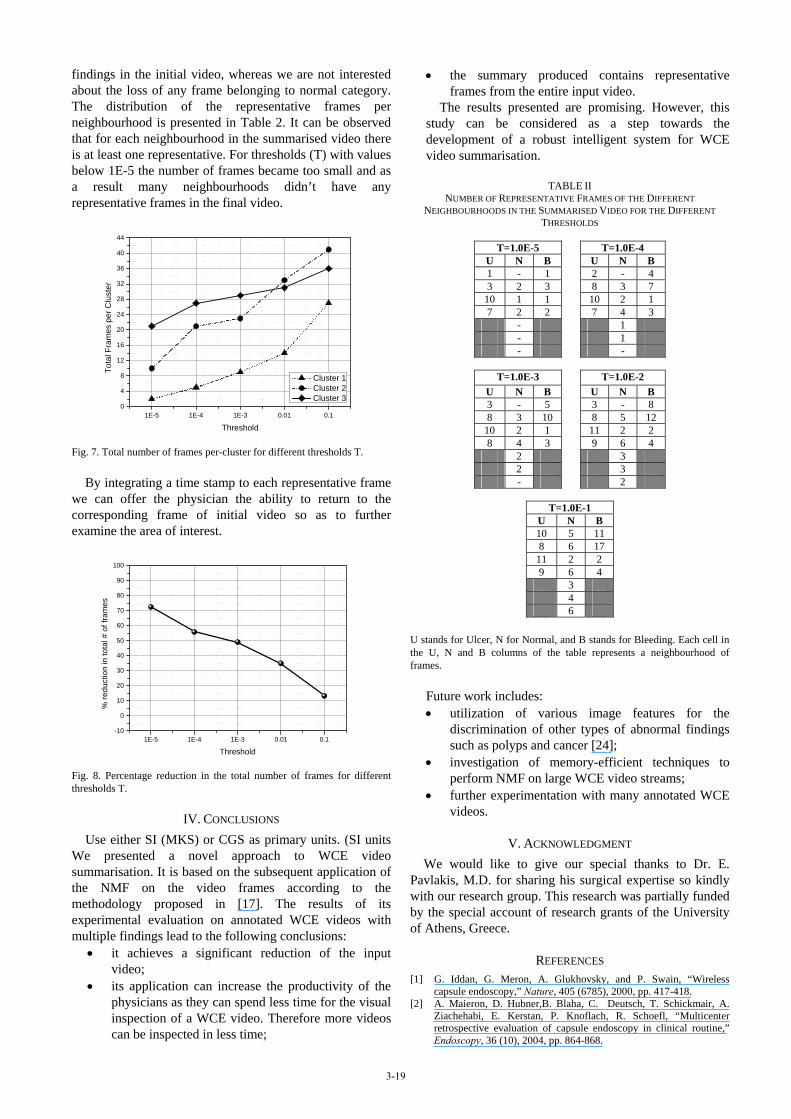
findings in the initial video, whereas we are not interested about the loss of any frame belonging to normal category. The distribution of the representative frames per neighbourhood is presented in Table 2. It can be observed that for each neighbourhood in the summarised video there is at least one representative. For thresholds (T) with values below 1E-5 the number of frames became too small and as a result many neighbourhoods didn’t have any representative frames in the final video.
1E-5 1E-4 1E-3 0.01 0.10
4
8
12
16
20
24
28
32
36
40
44
Tota
l Fra
mes
per
Clu
ster
Threshold
Cluster 1 Cluster 2 Cluster 3
Fig. 7. Total number of frames per-cluster for different thresholds T.
By integrating a time stamp to each representative frame
we can offer the physician the ability to return to the corresponding frame of initial video so as to further examine the area of interest.
1E-5 1E-4 1E-3 0.01 0.1-10
0
10
20
30
40
50
60
70
80
90
100
% re
duct
ion
in to
tal #
of f
ram
es
Threshold
Fig. 8. Percentage reduction in the total number of frames for different thresholds T.
IV. CONCLUSIONS Use either SI (MKS) or CGS as primary units. (SI units
We presented a novel approach to WCE video summarisation. It is based on the subsequent application of the NMF on the video frames according to the methodology proposed in [17]. The results of its experimental evaluation on annotated WCE videos with multiple findings lead to the following conclusions:
• it achieves a significant reduction of the input video;
• its application can increase the productivity of the physicians as they can spend less time for the visual inspection of a WCE video. Therefore more videos can be inspected in less time;
• the summary produced contains representative frames from the entire input video.
The results presented are promising. However, this study can be considered as a step towards the development of a robust intelligent system for WCE video summarisation.
TABLE II NUMBER OF REPRESENTATIVE FRAMES OF THE DIFFERENT
NEIGHBOURHOODS IN THE SUMMARISED VIDEO FOR THE DIFFERENT THRESHOLDS
T=1.0E-5 T=1.0E-4
U N B U N B 1 - 1 2 - 4 3 2 3 8 3 7
10 1 1 10 2 1 7 2 2 7 4 3 - 1 - 1 -
-
T=1.0E-3 T=1.0E-2 U N B U N B 3 - 5 3 - 8 8 3 10 8 5 12
10 2 1 11 2 2 8 4 3 9 6 4 2 3 2 3 -
2
T=1.0E-1 U N B 10 5 11 8 6 17
11 2 2 9 6 4 3 4 6
U stands for Ulcer, N for Normal, and B stands for Bleeding. Each cell in the U, N and B columns of the table represents a neighbourhood of frames.
Future work includes: • utilization of various image features for the
discrimination of other types of abnormal findings such as polyps and cancer [24];
• investigation of memory-efficient techniques to perform NMF on large WCE video streams;
• further experimentation with many annotated WCE videos.
V. ACKNOWLEDGMENT We would like to give our special thanks to Dr. E.
Pavlakis, M.D. for sharing his surgical expertise so kindly with our research group. This research was partially funded by the special account of research grants of the University of Athens, Greece.
REFERENCES [1] G. Iddan, G. Meron, A. Glukhovsky, and P. Swain, “Wireless
capsule endoscopy,” Nature, 405 (6785), 2000, pp. 417-418. [2] A. Maieron, D. Hubner,B. Blaha, C. Deutsch, T. Schickmair, A.
Ziachehabi, E. Kerstan, P. Knoflach, R. Schoefl, “Multicenter retrospective evaluation of capsule endoscopy in clinical routine,” Endoscopy, 36 (10), 2004, pp. 864-868.
3-19
[3] M. T. Coimbra, and J. P. S. Cunha, “MPEG-7 visual descriptors - contributions for automated feature extraction in capsule endoscopy,” IEEE Transactions on Circuits and Systems for Video Technology, 16 (5), 2006, pp. 628-636.
[4] B. Li, M.Q.-H. Meng, “Analysis of the gastrointestinal status from wireless capsule endoscopy images using local color feature,” Information Acquisition,. ICIA '07. International Conference, 8-11 July 2007, pp.553-557.
[5] M. Mackiewicz, J. Berens, M. Fisher, and D. Bell. “Colour and texture based gastrointestinal tissue discrimination,” ICASSP, IEEE International Conference on Acoustics, Speech and Signal Processing - Proceedings 2, 2006, pp. II597-II600.
[6] J. Berens, M. Mackiewicz, and D. Bell. “ Stomach, intestine and colon tissue discriminators for wireless capsule endoscopy images” Progress in Biomedical Optics and Imaging, Proceedings of SPIE 5747, 2005, pp. (I): 283-290.
[7] J. Lee, J. Oh, S. K. Shah, X. Yuan, and S. J. Tang, “Automatic classification of digestive organs in wireless capsule endoscopy videos,” Proceedings of the ACM, Symposium on Applied Computing, 2007, pp. 1041-1045.
[8] N. Bourbakis, “Detecting abnormal patterns in WCE images,” Proceedings - BIBE 2005, 5th IEEE Symposium on Bioinformatics and Bioengineering, 2005, pp. 232-238.
[9] S. Hwang, J. Oh, J. Cox, S. J. Tang, and H. F. Tibbals, “Blood detection in wireless capsule endoscopy using expectation maximization clustering,” Progress in Biomedical Optics and Imaging, Proceedings of SPIE 6144 I, 2006.
[10] V.S. Kodogiannis, and M. Boulougoura, “Neural network-based approach for the classification of wireless-capsule endoscopic images,” Proceedings of the International Joint Conference on Neural Networks 4, 2005, pp. 2423-2428.
[11] V.S. Kodogiannis, M. Boulougoura, J. N. Lygouras, and I. Petrounias, “A neuro-fuzzy-based system for detecting abnormal patterns in wireless-capsule endoscopic images,” Neurocomputing, 70, (4-6), 2007, pp. 704-717.
[12] B. Li, and M. Q. -H Meng, “Wireless capsule endoscopy images enhancement by tensor based diffusion,” Annual International Conference of the IEEE Engineering in Medicine and Biology Proceedings, 2006, pp. 4861-4864
[13] F. Vilariño, L. I. Kuncheva, and P. Radeva., “ROC curves and video analysis optimization in intestinal capsule endoscopy,” Pattern Recognition Letters, 27 (8), 2006, pp. 875-881.
[14] F. Vilariño, P. Spyridonos, O. Pujol, J. Vitrià, P. Radeva, and F. De Iorio, “Automatic detection of intestinal juices in wireless capsule video endoscopy,” Proceedings - International Conference on Pattern Recognition, 4, 2006, pp. 719-722.
[15] F. Vilariño, P. Spyridonos, J. Vitrià, C. Malagelada, and P. Radeva, “A machine learning framework using SOMs: Applications in the intestinal motility assessment,” Lecture Notes in Computer Science (including subseries Lecture Notes in Artificial Intelligence and Lecture Notes in Bioinformatics), 4225 LNCS, 2006, pp. 188-197.
[16] E. Wadge, M. Boulougoura, and V. Kodogiannis, “Computer-assisted diagnosis of wireless-capsule endoscopic images using neural network based techniques,” Proceedings of the 2005 IEEE International Conference on Computational Intelligence for Measurement Systems and Applications, CIMSA 2005, pp. 328-333.
[17] O. Okun, and H. Priisalu, “Unsupervised data reduction,” Signal Processing 87 (9), 2007, pp. 2260-2267.
[18] D.D. Lee and H.S. Seung, “Unsupervised learning by convex and conic coding,” Adv. Neural Inf. Process. Systems, 9, 1997, pp. 515–521.
[19] D.D. Lee and H.S. Seung, “Learning the parts of objects by non-negative matrix factorization,” Nature, 401, 1999, pp. 788–791.
[20] D.D. Lee and H.S. Seung, “Algorithms for non-negative matrix factorization,” Adv. Neural Inf. Process. Systems, 13, 2000, pp. 556–562.
[21] L.K. Saul and D.D. Lee, “Multiplicative updates for classification by mixture models,” Adv. Neural Inf. Process. Systems, 14, 2002, pp. 897–904.
[22] C. Ding, X. He, H.D. Simon, “On the equivalence of nonnegative matrix factorization and spectral clustering,” Proceedings of the SIAM International Conference on Data Mining, Newport Beach, CA, 21–23 April 2005, pp. 606–610.
[23] C. Ding, X. He, H.D. Simon, “Nonnegative Lagrangian relaxation of K-means and spectral clustering,” Proceedings of the Sixteenth European Conference on Machine Learning, Porto, Portugal, 3–7 October 2005, pp. 530–538.
[24] D.K. Iakovidis, D.E. Maroulis, and S.A. Karkanis, "An Intelligent System for Automatic Detection of Gastrointestinal Adenomas in Video Endoscopy," Computers in Biology and Medicine, vol. 36, no. 10, pp. 1084-1103, 2006.
3-20
Related Documents