NASA/TM-1999-209526 Unstructured Grid Euler Method Assessment for Longitudinal and Lateral/ Directional Stability Analysis of the HSR Reference H Configuration at Transonic Speeds Farhad Ghaffari Langley Research Center, Hampton, Virginia December 1999 https://ntrs.nasa.gov/search.jsp?R=20000011602 2018-08-09T05:10:15+00:00Z

Welcome message from author
This document is posted to help you gain knowledge. Please leave a comment to let me know what you think about it! Share it to your friends and learn new things together.
Transcript

NASA/TM-1999-209526
Unstructured Grid Euler Method
Assessment for Longitudinal and Lateral/
Directional Stability Analysis of the HSR
Reference H Configuration at Transonic
Speeds
Farhad Ghaffari
Langley Research Center, Hampton, Virginia
December 1999
https://ntrs.nasa.gov/search.jsp?R=20000011602 2018-08-09T05:10:15+00:00Z

The NASA STI Program Office... in Profile
Since its founding, NASA has been dedicated
to the advancement of aeronautics and spacescience. The NASA Scientific and Technical
Information (STI) Program Office plays a keypart in helping NASA maintain thisimportant role.
The NASA STI Program Office is operated byLangley Research Center, the lead center forNASA's scientific and technical information.
The NASA STI Program Office providesaccess to the NASA STI Database, the
largest collection of aeronautical and space
science STI in the world. The Program Officeis also NASA's institutional mechanism for
disseminating the results of its research anddevelopment activities. These results are
published by NASA in the NASA STI Report
Series, which includes the following reporttypes:
TECHNICAL PUBLICATION. Reports of
completed research or a major significantphase of research that present the resultsof NASA programs and include extensive
data or theoretical analysis. Includescompilations of significant scientific andtechnical data and information deemed
to be of continuing reference value. NASA
counterpart of peer-reviewed formalprofessional papers, but having less
stringent limitations on manuscript
length and extent of graphicpresentations.
TECHNICAL MEMORANDUM.
Scientific and technical findings that arepreliminary or of specialized interest,
e.g., quick release reports, workingpapers, and bibliographies that containminimal annotation. Does not contain
extensive analysis.
CONTRACTOR REPORT. Scientific and
technical findings by NASA-sponsoredcontractors and grantees.
CONFERENCE PUBLICATION.
Collected papers from scientific and
technical conferences, symposia,
seminars, or other meetings sponsored orco-sponsored by NASA.
SPECIAL PUBLICATION. Scientific,technical, or historical information from
NASA programs, projects, and missions,
often concerned with subjects havingsubstantial public interest.
TECHNICAL TRANSLATION. English-language translations of foreign scientificand technical material pertinent toNASA's mission.
Specialized services that complement the
STI Program Office's diverse offerings includecreating custom thesauri, building customized
databases, organizing and publishingresearch results.., even providing videos.
For more information about the NASA STI
Program Office, see the following:
• Access the NASA STI Program Home
Page at http:I/www.sti.nasa.gov
• Email your question via the Intemet [email protected]
• Fax your question to the NASA STIHelp Desk at (301) 621-0134
• Telephone the NASA STI Help Desk at(301) 621-0390
Write to:
NASA STI Help Desk
NASA Center for AeroSpace Information7121 Standard Drive
Hanover, MD 21076-1320

NASA / TM-1999-209526
Unstructured Grid Euler Method
Assessment for Longitudinal and Lateral/
Directional Stability Analysis of the HSR
Reference H Configuration at Transonic
Speeds
Farhad Ghaffari
Langley Research Center, Hampton, Virginia
National Aeronautics and
Space Administration
Langley Research CenterHampton, Virginia 23681-2199
December 1999

Available from:
NASA Center for AeroSpace Information (CASI)712! Standard Drive
Hanover, MD 21076-1320(301) 621-0390
National Technical Information Service (NTIS)5285 Port Royal Road :_Springfield, VA 22161-2171(703) 6O5-6OO0

Unstructured Grid Euler Method Assessment for Longitudinal and Lateral/Directional
Stability Analysis of the HSR Reference H Configuration at Transonic Speeds
Farhad Ghaffari
NASA Langley Research Center, Hampton, VA
ABSTRACT
Transonic Euler computations, based on unstructured grid methodology, are performed for a proposed
High Speed Civil Transport (HSCT) configuration, designated as the Reference H configuration within the
High Speed Research (HSR) Program. The predicted results are correlated with appropriate experimental
wind-tunnel data for the baseline configuration with and without control surface deflections for a range of
angle of attack at Moo = 0.95. Good correlations between the predictions and measured data have been
obtained for the longitudinal aerodynamic characteristics on the baseline configuration. The incremental
effects in the longitudinal aerodynamic characteristics due to horizontal tail deflections as well as wing
leading-edge and trailing-edge flap deflections have also been predicted reasonably well. Computational
results and correlations with data are also presented for the lateral and directional stability characteristics
for a range of angle of attack at a constant sideslip angle as well as a range of sideslip angles at a constant
angle of attack. In addition, the results axe presented to assess the computational method performance andconvergence characteristics.
bref
CDCOoCLQCm
CpMoo
P
Po_
qoo
S_eSc_
(Sht
_Ze/
8te f
SYMBOLS
reference span, inches
reference chord, inches
drag coefficient, Drag/(qoo S_e/)skin friction drag at CL = 0
lift coefficient, Lift/(qoo S_/)
rolling moment coefficient, Rolling moment/(qoo S_¢] b_/)
pitching moment coefficient, Pitching moment/(qoo S_/_)
Yawing moment coefficient, Yawing moment/(qoo S_el b_e/)pressure coefficient, (p - Poo)/qoofreestream Mach number
static pressure
freestream static pressure
freestream dynamic pressure
Reynolds number per foot
reference area, sq. inches
angle of attack, degrees
sideslip angle, degrees
horizontal tail flap deflection angle, degrees
inboard/outboard wing leading-edge flap deflection angle, degrees
inboard/outboard wing trailing-edge flap deflection angle, degrees
Abbreviations
HSCT
HSR
IGES
LaRC
High Speed Civil Transport
High Speed Research
Initial Graphics Exchange SpecificationLangley Research Center

COMPUTATIONAL OBJECTIVE AND APPROACH
The primary objective of the computations is to provide an accuracy assessment of an unstructured grid
Euler method known as USM3D (Ref. 1) for predicting the longitudinal and lateral/directional aerodynamiccharacteristics for the baseline configuration and the corresponding effects due to control surface deflections
at transonic speeds. " ...........
A computational matrix is developed to complement the configurations and the conditions tested in
the NASA LaRC 16-Foot Transonic Tunnel. The wind tunnel test was conducted on a 1.675% model (also
referred to as controls model) at an average Reynolds number of about 4 million per foot. Three config-
urations are selected for the computational method assessment study. Consistent with the experimental
test, each configuration incorporated an extended circular aftbody to represent the wind-tunnel model sting
apparatus and appropriate boundary conditions at the nacelle's inlet and exhaust planes to simulate the
flow through propulsion effects. The selected configurations are:
1) transonic cruise (i.e., 5tel = 0/10; _tef = 0/3; 5hi ---- 0). This geometry is considered as the baselinetransonic cruise configuration.
2) transonic cruise with deflected horizontal tail (i.e., 5zef = 0/10; 5tel = 0/3; 6ht = 6).
3) supersonic cruise configuration where all the control surface deflection angles are set to zero (i.e.,
5_ s = 0/0; _te_ = 0/0; _t = 0).
The above nomenclatures are defined as: the Greek letter (f represents control surface deflection angle; the
subscripts leS, tel, and ht denote the leading-edge flap, trailing-edge flap, and horizontal tail, respectively.if applicable, the control surface deflection angles, separated by a slash, correspond to those of the inboard
and outboard wing, respectively. For example, 51el = 0/10 denotes that the inboard- and outboard-wing
segmented leading-edge flap deflection angles are set to 0 ° and 10°, respectively. The positive control surface
deflection angles ((_lef, 5te$, and (_ht) are downward ....
The corresponding flow conditions for the selected configurations are then identified from the exper-
imental data analyses at M_ = 0.95. Zero sideslip analyses are performed for all three configurations at
a = 0°, 4 ° , and 8° while the finite sideslip matrix composed of an a-sweep (0 °, 4 °, 8 °, 11 °) at f_ = 3 ° and a
fLsweep (0 °, 3°, 6 °) at c_ = 4 °. The Selected computational matrix is depicted graphically in a chart form
(figure 1) to illustrate the links between Various configurations and the corresponding flow conditions. It
should be noted that the transonic experimental data with finite sideslip angles were only available for the
supersonic cruise configuration when the present computational analysis was initiated. In addition, the
experiment was conducted to only measure the overall forces and moments.
COMPUTATIONAL GRID
The HSR Reference H initial surface geometry was defined in a format known as Initial Graphics
Exchange Specification (IGES), (Ref. 2), which served as the database for all the subsequent grid generation
processes. The GRIDTOOL (Ref. 3) program was used to read in the initial IGES geometry definition and
the corresponding discretization into surface patches. The resulting surface patc-hes-were then read in the
VGRID (Ref. 4) program to generate the initial surface triangulation by the advancing front method. The
initial surface triangles were then read back into GRIDTOOL for the projection onto the initial database
to preserve the proper surface curvature within the interior of a given patch. As a final step, the resulting
front on the surface and the farfield boundary patches were used by VGRID to generate the volume grid
within the computational domain along with the corresponding grid and face connectivity files. A nearfield
and a closeup view of a typical grid, used to compute the flow for the transonic cruise configuration with
deflected horizontal tail (i.e., (ilei = 0/10; (ft_f = 0/3; (fht = 6), are shown in figures 2 and 3 from two
different perspectives. The figures illustrate the triangular meshes on the surface, plane of symmetry, and
the wind-tunnel sting representation. The farfield boundaries, clipped in the figures for clarity, are extended
to about 6-longitudinal and 3-radial body lengths away from the surface.-The computational grid size for
each of the three configurations are as follows: the transonic cruise configuration had about 1.023 million
cells and 36,000 surface triangles; the transonic cruise with deflected horizontal tail configuration had 0.822
2

million cellsand44,000surfacetriangles;andthesupersoniccruiseco_guration had0.997million cellsand47,000surfacetriangles.Thegrid for thesupersoniccruiseconfigurationwasmirroredaboutthesymmetryplaneto generatethe computationalgrid for all the finite sideslipruns. The resultinggrid approximatelydoubledthe grid sizeusedfor the zerosideslip(only one-halfmodeled)computations.
ALGORITHM PERFORMANCE AND CONVERGENCE
USM3D computations were performed on both the Numerical Aerodynamic Simulation (NAS) Cray-C90 located at NASA Ames, and the NASA Langley Cray-YMP. All the zero sideslip computations were
conducted on the Cray-C90 using the implicit time integration scheme and the corresponding finite sideslip
cases were executed on the Cray-YMP by using the explicit algorithm. Also, no flux limiters were used to
obtain the solutions presented here. As a general strategy, solutions based on the second-order accurate flux
difference splitting (FDS2) method were first sought; however, for certain cases only the first-order accurate
flux difference splitting (FDS1) could be achieved. In general, the aerodynamic effects due to the difference
in the order of solution accuracy were found to be small, particularly in terms of total forces and momentsand will be discussed later.
The selected computational matrix, along with the corresponding numerical method employed to con-
verge a given solution for each configuration, are summarized in Table 1. In this table, symbols '_/' and
'X' indicate that a solution convergence 'was' and 'was not' achieved, respectively. For zero sideslip cases,
converged solutions with FDS2 were obtained for all configurations at a = 0 ° and 4 °, except for the super-
sonic cruise configuration at a = 4° where only the FDS1 solution could be achieved. At higher angles of
attack (i.e., a > 4°), no solution convergence based on FDS2 could be achieved for any of the configurations
investigated. It is speculated that the lack of solution convergence could be due to the flow separation
occurring within the boundary layer over the round leading-edges of the inboard wing which is known torequire Navier-Stokes simulation to resolve. As a result, the numerical solutions for a -- 8 ° are obtained
based on FDS1 for all the configurations except for the supersonic cruise configuration for which no solu-
tion could be achieved. The supersonic cruise configuration was the most challenging geometry to obtain
solution convergence at the present transonic flow conditions. The solution convergence difficulties were
identified to have been caused primarily by geometrical features particularly with respect to the transition
region between the inboard and the outboard wing. This transition region represents a step discontinuity
from a round to a sharp leading edge of the undeflected flap on the outboard wing. Progress has been made
recently to implement various flux limiters in USM3D as numerical dumping mechanisms to alleviate such
convergence difficulties. As mentioned earlier, the supersonic cruise configuration was the only geometry for
which experimental data were available at transonic speeds with finite sideslip angle. As a result, with the
lessons learned from the zero sideslip computations, only FDS1 solutions were sought for the finite sideslip
analysis. A typical zero sideslip case required about 500 cycles to converge and, for finite sideslip cases,
required about 1000 cycles. The implicit time integration scheme required ,_ 180 words of memory per cell
and _ 30 p-second�cell�cycle on the Cray-Cg0. Similarly, the explicit scheme required _ 46 words of
memory per cell and _ 6 p-second/cell/cycle on the Cray-C90. Very little overhead CPU time, generallyless than 5%, is found to be associated with the second-order accurate solution, compared to the first-orderformulation.
Typical convergence characteristics (i.e., Residuals and Lift) for solutions based on FDS2 and FDS1
at a = 0 °,/3 = 0°, for the supersonic cruise configuration are shown in Figures 4(a) and 4(b), respectively.
A typical second-order solution is initiated automatically within USM3D after a certain level of residual
convergence has been achieved by the first-order accurate flux formulation. For example, as shown in figure
4(a), the FDS2 solution is initiated from the FDS1 solution (after 205 iterations) where the residuals have
already dropped 2.5 orders of magnitude. Similarly, figure 4(b) shows the residual and lift characteristics for
the fully converged solution based on the FDS1 formulation. These two particular solutions were obtained
as part of the solution accuracy assessment between first- and second- order flux differencing schemes. Asimilar set of convergence history plots are shown in figure 5 for typical solutions obtained for the supersonic
cruise configuration for two different sideslip angles at a = 4 °.
3

RESULTS AND DISCUSSIONS
Surface Pressure Coefficients:
Typical surface pressure coefficient contours computed at a = 4 °, Moo = 0.95, and /3 = 0° for the
transonic cruise, transonic cruise with deflected horizontal tail, and the supersonic cruise configurations,
are shown in figures 6, 7 and 8, respectively. All surface pressure coefficients are contoured over a constant
range from 0.6 to -1.4 with 0.067 increments (i.e., Cp,_,_x = 0:6, Cprn_,_ = -1.4, ACp = 0:067) and shown
from the same vantage point. The surface pressure contours computed for the transonic cruise configuration,shown in figure 6, serve _as the baseline solution to be correlated with the results obtained for the transonic
cruise configuration with deflected horizontal tail and the supersonic cruise configuration. The latter two
correlations show the effects of horizontal tail deflection and the wing leading-edge and trailing-edge flap
deflections on the computed surface pressure coefficients, respectively. Furthermore, since no experimentalsurface pressure data is available, these correlations are only: intended for relative comparisons between
computational results to show, qualitatively, the effects due to a particular control surface deflection.
The surface pressure coefficients Computed for the baseline transonic cruise configuration (figure 6)
can be characterized by two dominant flow features, one that can be attributed to typical flow expansions
caused by the physical geometry and the other to shock waves due to the transonic flow effects. The typical
fl0w expansions on the upper Surface (figure 6(a)) occur at the leading edges, particularly on the inboard
wing, and the hinge lines associated with the deflected leading-edge and trailing-edge flaps on the outboard
wing. The transonic flow shock waves (i.e., highlighted by a concentration of several pressure contour lines)
on the upper surface appear in two locations. The first location is very close, nearly spanning in parallel, !to the entire wing trailing edge, and the other location is Situated approximately along the mid-chord,spanning the horizontal tail and extending to the fuselage and onto the vertical tail. The lower surface
pressure contours (figure 6(b)) indicate fairly benign flow characteristics with the exception of a shock wave
that appears in between the two nacelles and the compression rings on the wing just ahead of each nacellecaused by the pylons. :........ _ __
The comparative assessments of the results shown in figures 6 and 7 indicate only very small effectsdue to_t-he'horizontal _tail clei]ectlon'0n the computed Surface pressure coeffi_nt: cont6_S for the transonic
cruiseconfigUration. The most not-iceab]e change appears to be the flip of the shock wave from the tipper
surface of the undeflected horizontal tail to the lower surface of the deflected horizontal tail. Similarly, a iComparison of the"resultsshoWn in figures 6 and 8 indicate the effects of wing leading-edge and trailing'edge i
flap deflections on the computed surface pressure coefficient contours for the transonic cruise configuration.
As expected, the comparison indicates that the hinge line flow expansions disappear on the upper surface of
the undeflected wing leading-edge and trailing-edge flaps. In addition, the shock waves on the wing upper
surface near the wing trailing edge and the horizontal tail, for the supersonic cruise configuration, are not
as crisply predicted as those of the transonic cruise configuration. This smearing of the shock waves isspeculated to have been caused primarily by the excess dissipation generally associated with the first-order :
accurate solutions. The comparison shows very little difference on the computed lower surface pressurecoefficient contours due to wing leading-edge and trailing-edge flap deflections.
Forces and Moments and Correlations with Data: .:
:: All predicted inviscid drag Coefficients have been corrected with an appropriate CDo to account for
the skin friction using the experimental data obtained in the NASA LaRC i6-Foot Transonic Tunnel. This
Coo was determined by a linear extrapolation from the plotted C_ vs. CD curve for the supersonic cruise
configuration as shown in figure 9. This Coo provides a minimum skin friction drag Which, by definition, is
independent of the configuration camber and twist. Through this analysis, a CDo of 0.0126 was obtained,which was subsequently added to all the inviscid drag predictions.
Solution method assess .mcnt - As discussed earlier, the supersonic cruise configuration was the most
challenging geometry for ol_tai_ning solution convergence at thepresent transonic Mach number. As a result,

the FDS2solutioncouldonly beachievedfor a = 0 °, and the FDSi Solution could only be achieved for= 4°. This prompted a solution method assessment study to be performed at a = 0 ° for which both first-
and second- order solutions could be obtained. The results from this study are presented in figure 10 forthe longitudinal aerodynamic characteristics. The correlations at a = 0° indicate that the solution order of
accuracy has only a small effect on the predicted lift and drag, with relatively more pronounced effect onthe pitching moment estimate.
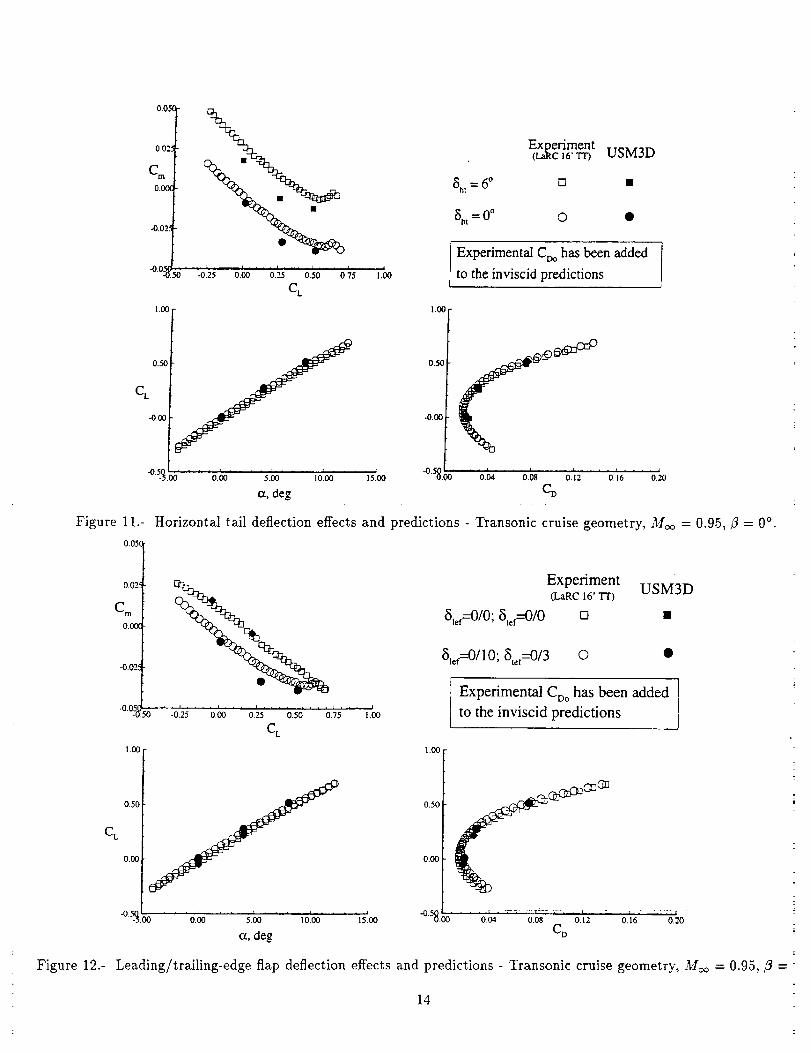
Horizontal tail deflection effects - The predicted and measured longitudinal aerodynamic effects due to
the horizontal tail deflection at Moo = 0.95 and/3 = 0° are shown in figure 11. The measured aerodynamic
effects due to the horizontal tail deflection on both the lift and drag coefficients appear to be small. The
pitching moment characteristics remain nearly the same over the measured range of flow conditions, and
as expected, the horizontal tail deflection causes roughly a constant positive shift in the pitching momentcoefficients. The overall lift and drag coefficients have been predicted reasonably well with the Euler method
both in terms of incremental effects due to the horizontal tail deflection and magnitudes. Although the
overall magnitudes of the pitching moment coefficients are not predicted as well, the incremental effects dueto the horizontal tail deflection are predicted reasonably well.
Wing leading-edge and trailing-edge flap deflection effects - The predicted and measured longitudinal
aerodynamic effects due to the leading-edge and trailing-edge flap deflection at Moo = 0.95 and/3 = 0°
are shown in figure 12. The measured aerodynamic effects due to the leading-edge and trailing-edge flap
deflections appear to be small for both the lift and drag coefficients and more pronounced for the pitching
moment characteristics particularly at a < 10°. These aerodynamic effects due to the leading-edge andtrailing-edge flap are reasonably predicted both in terms of overall magnitudes and trends.
Finite sideslip stability analysis - The longitudinal aerodynamic characteristics computed for an a-sweep (i.e., 0 °, 4°, 8°, and 11°) at/3 = 3 ° and Mc_ = 0.95, along with the experimental measurements for
the supersonic cruise configuration, are shown in figure 13. The correlations indicate excellent agreement
between the computed and measured data throughout the examined range of flow conditions for both•magnitudes and trends.
The lateral/directional stability characteristics computed for a/_-sweep (i.e., 0 °, 3°, and 6°) at a = 4 °
and Moo = 0.95, along with the experimental measurements for the supersonic cruise configuration, are
shown in figure I4. The correlations indicate a good agreement for the pitching and rolling moments but
not as good for the yawing moment, particularly with respect to the slope (i.e., C,_Z).
CONCLUDING REMARKS
The application viability of an unstructured grid Euler method (USM3D) for predicting the longitudinaland lateral/directional stability characteristics of the HSR Reference H configuration at a transonic Mach
number of 0.95 have been addressed. Particular emphasis was placed on assessing the ability of the method
to provide consistent and accurate solutions of forces and moments for the baseline configuration with
different control surface deflection settings for the horizontal tail as well as for the leading-edge and trailing-
edge flaps. The analysis revealed that a consistent set of solutions based on the first-order accuracy was
achievable for a wider range of applicability (in terms of configurations and flow conditions) where the
second-order accurate solutions could not be obtained. The solution method assessment analysis indicated
that the first-order accurate solutions provide comparable results to those of the second-order, particularlyfor the aggregate forces and moment characteristics. The computed longitudinal aerodynamic effects due tocontrol surface deflections and sideslip angles agree reasonably well with the measured data both in terms
of magnitude and trends. Finally, the lateral/directional stability analysis revealed fairly good agreementbetween the predictions and measured data for the pitching and rolling moment characteristics but not as
good for the yawing moment. It is believed that the present unstructured grid Euler method is certainly a
viable engineering tool that can be utilized with confidence in the early aerodynamic design and analysis ofthe proposed high speed civil transport configuration.

REFERENCES
1 Frink, N. T., "Upwind Schemefor Solvingthe Euler Equationson UnstructuredTetrahedralMeshes,"AIAA Journal,Vol. 30,No. 1, 1992,pp. 70-77.2 Smith, B. M.; Brauner, K. M.; Kennicott, P. R.; Liewald,M.; and W'ellington,J.: Initial GraphicsExchangeSpecification(IGES),Version2.0. NBSIR-82-2631-AF, Feb. 1983. (Available from NTIS as PB
83-137448.)
3 Abolhassani, J. "GRIDTOOL: A Surface Modeling and Grid Generation Tool," NASA-CP-3291, May
1995, pp. 821-832.
4 Parikh, P., Pirzadeh, S., and Lohner, R., "A Package for 3-D Unstructured Grid Generation, Finite-
Element Flow Solution and Flow Field Visualization," NASA CR-182090, Sept. 1990.
O
FDS2
4 ° 8 °
FDS 1
0 ° 4 ° o
Transonic cruise
Transonic cruise with 5ht = 6
Supersonic cruise
Table 1.-
4
-4
,4
",1 X
4 x
X X 4
-- 4
4 x
Computational matrix - method of convergence.
Sweep,:oo I Io _ ,xeePe 21iSoi&,o: t' 4o30[ "
Figure 1.-....Selected computational matrix - geometries and conditions.

(a) Nearfietd.
(b) Closeup.
Figure2.- Typical computationalgrid - Uppersurfaceview. _lef _-- 0/10, _tef = 0/3, Sht = 6.
7

\
(b) Closeup.
Figure 3.- Typical computational grid - Lower surface view. _lef = 0/10, *t,f = 0/3, *ht = 6.

FDSI <-"-_ 0
-2v
_-I --30
-> FDS2i ' i
I i I , I i
200 400 600 800
0
-1
-2
-3
-4
I ' I ' I '
, I , l i I i
0 I00 200 300 400
C L
0.00
-0.02
-0.04
-0.06
-0.08
' I ' I ' I ' 1
0.00
-0.02
-0.04
-0.06
-0.08
' I '
, I , I , I ,, I , I ,,, I
0 200 400 600 800 0 I00 200 300
Iterations ]t.erations
(a)FDS2. (b)FDSI.
400
Figure 4.- Typical convergence characteristics - _lef = 0/0, _fef = 0/0, _hf = 0; Moo = 0.95, a = 0°,/9 = 0°.
0
2O_o
--30.0
' I ' I ' I ' I '
f , I , I , I , I ,
' I ' I ' I ' I '1
0
-1
-2
-30.0
xl03 , , , , , , , , , xl03
0.2 0.4 0.6 0.8 1.0 0.2 0.4 0.6 0.8 1.0
C L
1.0
0.8
0.6
0.4
0.20.0
I I I ' i ' I I ' I ' I1.0
0.8
0.6
0.4
0.20.0
, i , I , i , , , xl03 , I , i , i , i , xl03
0.2 0.4 0.6 0.8 1.0 0.2 0.4 0.6 0.8 1.0
Iterations Iterations
(a) _ = 3° . (b) _ = 6°.
Figure 5.- Typical FDS1 convergence characteristics - 6_f = 0/0, 6tel = 0/0, _ht = 0; Moo = 0.95, a = 0°.

(a) Upper surface.
=
Figure 6.-
(b) Lower surface.
Computed surface Cp contours - Transonic cruise geometry. Moo 0.95, (_ = 4 °, _ = 0°.
10 !

(a) Upper surface.
(b) Lower surface.
Figure 7.- Computed surface Cp contours - Transonic cruise geometry with 5ht = 6. M_ = 0.95, a = 4 °, _ = 0%
11

(a) Uppersurface.
Figure8.-
(b) Lower surface.
Computed surface Cp contours - Supersonic cruise geometry. M_¢ = 0.95, _ = 4 °, _ = 0 °.
12

0.020
0.018
0.016
Co
0.014
0.011
0.01C0.00
unnel
Cf / _lation to exclude configuration
-""" camber and twist contribution to zero-lift drag
."< Coo value of 0.0126 is used to correct the Euler
drag predictions to account for the skin friction
2 0.02 0.03 0.040.01 CL
Figure 9.- CDo determination strategy- Supersonic cruise geometry, Moo = 0.95
0.051
0.02:
Cm0.0_
-0,025
-0.o_
%
5o :o::5 b._o' 0._5 o._o 0._5 t._o
CL
1.00 I20
Experiment USM3D(LaRC16'T'r) VDS2 R)S]
[] • •
t Experimental CDo has been addedto the inviscid predictions
0,50
CL
-0.00 0.50-0.00
DOO DE]
-°_.?_oo o.h.... o.og.... o.h " o.'_6" o._o(z, deg CD
Figure 10.- Solution method accuracy assessment - Supersonic cruise geometry, M_ = 0.95, 3 = 0 °-
13
0.05_
O.O'_d
Cm0.000
-0.02
-o_o_ _o.25 o.oo o.2s 0.50 o.V5
CL
'l._O
1.00 1.00
Experiment(t_c _6.Tn USM3D
8_ = 60 [] •
8.t = 0 ° O •
Experimental C_ has been added
to the inviscid predictions
0.50
CL
-0.00
.o.5.%o 0.20
0.50-0.00
o._ " _5._o" ,oloo....,51oo -°'_._o
a,deg
• - "0.{M 0.08 ' _ '0.12 '0.16'
CD
Figure 11.- Horizontal tail deflection effects and predictions - Transonic cruise geometry, Moo = 0.95,/3 = 0°.
0.05_
0.02:
CmO.(XX
-0.02.:
-0.05_ _o :o.'25 b_ " 0).5 0.k'" b.7i " ',._oCL
I.(30
Experiment USM3D(LaRC 16' "IT)
51el=0/0 , _tef=0]0 O •
5]¢f---'0/10; _Stef--O/3 O •
Experimental Coo has been added l
to the inviscid predictions J1.00
E L
0.500.00
-0"5t_:00 .... 0.(30 ..... 5,00 .... 10100 .... 15100
oc,deg
0.50 ( (_/3:32(_ (I130.00
-058._o" o.o_ o.o_ 'o.;_ o._ 0.20CD
Figure 12.- Leading/trailing-edge flap deflection effects and predictions - Transonic cruise geometry, M_ = 0.95, fl =
14

E L
0.05C
0.025 (__(_
Cm0.017
-0.02
°°-_5o -0.'25 o._ " 0.'.,5 0.;o 0.7i '_._o
CL
1.00
-0.00
-0"-_:oo....o._o'''5._o...._oloo'' );ooa,deg
Experiment USM3D(L_RC16'rr_ (mS1)
O •
!
Experimental Ct_ has been added [to the inviscid predictions J
1.00
o.2o
Figure 13.- Longitudinal aerodynamic characteristics and predictions - Supersonic cruise geometry, Moo = 0.95,/3 = 3 °.
igure 14.-
°°21 Pitching Momento.ol Experiment USM3D
(LaRC 16' Tr) (FDSI)
Cm°°°[ 0 0 qbO 0 C?O 0 _0 0 % 0 •
"0"0126!0
,o.o "":4'.0....S.o_"o'.o....21o....;.o....6:0
C I
0.03
0.02
0.0_
020
-0.01
-0.02
-0,036. 0
Rolling Moment ]
00 _00 _
"0 00IDo O OD
'''-4'.o....-_.o....olo' f.o....,/.o"L_6:0
13,deg
Cn
0.03
0,02
0.01
0,00
-0.01
-0.07
-0.0_¥ 0
Yawing Moment 1
O O
OO
OO
oOqD
0
" " -/.o.... -_.o " o'.o.... i.o.... ,io.... 6'.013,deg
Lateral/directional stability characteristics and predictions - Supersonic cruise geometry, Moo = 0.95, a = 4 °.
15

Form ApprovedREPORT DOCUMENTATION PAGE OMBNo 0Z04-0188
Public reporting burden for this ¢o_tection of information is estimated to average I hour per respot',se, including the time for reviewing instructions, searching e_sting data sources,
3atheringand maintainingthe dataneeded,and completingand reviewingthe collectionof information Send commentsregardingthisburdenestima.taof anyotheraspect of this:.o41ecti_of information,inclu_ngsuggestionsf_" reducing thisburden, to WashingtonHeadquartersSencices,Directoratefo_InformationOpera_ionsand Reports.1215Jeflerso_DavisHighway,Suite 1204, Arlington,VA222C_-4302,andto the Officeof ManagementandBudget,PaperworkReductionProject(0704-0188), Washington,IX; 20503.
1. AGENCY USE ONLY (Leave blank) 2. REPORT DATE 3. REPORTTYPE AND DATES COVERED
December 1999 Technical Memorandum
4. TITLE AND SUBTITLE 5. FUNDING NUMBERS
Unstructured Grid Euler Method Assessment for Longitudinal and Lateral/Directional Stability Analysis of the HSR Reference H Configuration at WU 537-07-20-21Transonic Speeds WBS 4.3.1
6. AUTHOR(S)
Farhad Ghaffari
7. PERFORMING ORGANIZATION NAME(S) AND ADDRESS(ES)
NASA Langley Research CenterHampton, VA 23681-2199
9. SPONSORING/MONITORINGAGENCYNAME(S)ANDADDRESS(ES)
National Aeronautics and Space AdministrationWashington, DC 20546-0001
8. PERFORMING ORGANIZATIONREPORT NUMBER
L-17927
10. SPONSORING/MON_ORINGAGENCY REPORT NUMBER
NASA/TM-1999-209526
11. SUPPLEMENTARY NOTES
12a. DISTRIBUTION/AVAILABILITY STATEMENT
Unclassified-Unlimited
Subject Category 02 Distribution: NonstandardAvailability: NASA CASI (301) 621-0390
12b. DISTRIBUTION CODE
13. ABSTRACT (Maximum 200 words)
Transonic Euler computations, based on unstructured grid methodology, are performed for a proposed High SpeedCivil Transport (HSCT) configuration, designated as the Reference H configuration within the High SpeedResearch (HSR) Program. The predicted results are correlated with appropriate experimental wind-tunnel data forthe baseline configuration with and without control surface deflections for a range of angle of attack at Mo_ = 0.95.Good correlations between the predictions and measured data have been obtained for the longitudinal aerodynamiccharacteristics of the baseline configuration. The incremental effects in the longitudinal aerodynamic characteris-tics due to horizontal rail deflections as well as wing leading-edge and trailing-edge flap deflections have also beenpredicted reasonably well. Compuational results and correlations with data are also presented for the lateral anddirectional stability characteristics for a range of angle of attack at a constant sideslip angle as well as a range ofsideslip angles at a constant angle of attack. In addition, the results are presented to assess the computationalmethod performance and convergence characteristics.
14. SUBJECT TERMS
Computational fluid dynamics; Euledinviscid method; High speed research/HighSpeed Civil Transport Reference H; Unstructured grid; Transonic speeds; Longitudinaland lateral/directional
I
117. SECURITY CLASSIFICATION 18. SECURITY CLASSIFICATION 19. SECURITY CLASSIFICATIONOF REPORT OF THIS PAGE OF ABSTRACT
Unclassified Unclassified Unclassified
NSN 7540-01-280-5500
15. NUMBER OF PAGES
2O16. PRICE CODE
A03
20. LIMITATIONOF ABSTRACT
LTL
Standard Form 298 (Rev. 2-89)Prescn'i:_dbyANSI Std.Z_J_-i8 :298-102
#
-|
Related Documents