Unsteady Aero-Loads from Vortices Shed on A320 Landing Gear Door: CFD compared to flight tests M. Tomac * , A. Rizzi † Royal Institute of Technology (KTH), 10044 Stockholm, Sweden, D. Charbonnier, J.B. Vos ‡ CFS Engineering (CFSE), 1015 Lausanne, Switzerland, A.Jir´asek, S-H. Peng § Swedish Defence Research Agency (FOI), 16490 Stockholm, Sweden, A. Winkler, A. Allen ¶ Airbus Defence & Space GmbH (A-DS), 85077 Manching, Germany, G. Wissocq k , G. Puigt ** Centre Europ´ een de Recherche et de Formation Avanc´ ee en Calcul Scientifique (CERFACS), 31057 Toulouse France, J. Dandois †† ONERA The French Aerospace Lab., 92190 Meudon, France , R. Abarca-Lopez ‡‡ Airbus Operations S.L., 28906 Getafe, Spain AFLoNext is a project of four years duration, funded by the European Commission within the Seventh Framework Programme. The project’s main objectives are proving and ma- turing highly promising flow control and noise reduction technologies for novel aircraft configurations, to achieve a big step forward towards improved aircraft performance and thus reducing the environmental footprint. The project consortium is composed by 40 European partners from 15 countries. One of the six technology streams, which are form- ing the scientific concept of AFLoNext, is concerned with the mitigation and control of vibrations in the undercarriage area during take-off and landing. Structural components in the vicinity of the landing gears, e.g. undercarriage housing walls, struts or landing gear doors, are often subject to significant dynamic loading. These loads originate from fluctuating aerodynamic pressures and resulting structural vibrations. Unsteady pressures on structural parts are caused by highly fluctuating and complex aerodynamic flow behav- ior under the fuselage. The paper describes the CFD approach employed to predict such dynamic loads and presents some preliminary results that have been computed with hybrid RANS-LES models and the Lattice Bolzmann method. Comparison with flight-test data have verified the realism of these CFD simulations. * Engineer, now at FS Dynamics, 16970 Solna, Sweden, AIAA Senior Member † Professor, Department of Aeronautical and Vehicle Engineering, AIAA Associate Fellow ‡ Senior Scientists, AIAA Members § Research Director, Information and Aeronautical Systems, AIAA Associate Fellow ¶ Engineer, Flight Physics, AIAA Senior Members k PhD student, CFD Team, AIAA Member ** Senior Scientist, CFD Team, AIAA Member †† Senior Scientist, Applied Aerodynamics Dept. ‡‡ Engineer, Component Loads & Dynamics 1 of 18 American Institute of Aeronautics and Astronautics 54th AIAA Aerospace Sciences Meeting 4-8 January 2016, San Diego, California, USA 10.2514/6.2016-0803 Copyright © 2016 by Arthur Rizzi. Published by the American Institute of Aeronautics and Astronautics, Inc., with permission. AIAA SciTech Forum

Welcome message from author
This document is posted to help you gain knowledge. Please leave a comment to let me know what you think about it! Share it to your friends and learn new things together.
Transcript
Unsteady Aero-Loads from Vortices Shed on A320
Landing Gear Door: CFD compared to flight tests
M. Tomac∗, A. Rizzi†
Royal Institute of Technology (KTH), 10044 Stockholm, Sweden,
D. Charbonnier, J.B. Vos‡
CFS Engineering (CFSE), 1015 Lausanne, Switzerland,
A. Jirasek, S-H. Peng§
Swedish Defence Research Agency (FOI), 16490 Stockholm, Sweden,
A. Winkler, A. Allen¶
Airbus Defence & Space GmbH (A-DS), 85077 Manching, Germany,
G. Wissocq‖, G. Puigt∗∗
Centre Europeen de Recherche et de Formation Avancee en Calcul Scientifique (CERFACS), 31057 Toulouse France,
J. Dandois ††
ONERA The French Aerospace Lab., 92190 Meudon, France ,
R. Abarca-Lopez ‡‡
Airbus Operations S.L., 28906 Getafe, Spain
AFLoNext is a project of four years duration, funded by the European Commission withinthe Seventh Framework Programme. The project’s main objectives are proving and ma-turing highly promising flow control and noise reduction technologies for novel aircraftconfigurations, to achieve a big step forward towards improved aircraft performance andthus reducing the environmental footprint. The project consortium is composed by 40European partners from 15 countries. One of the six technology streams, which are form-ing the scientific concept of AFLoNext, is concerned with the mitigation and control ofvibrations in the undercarriage area during take-off and landing. Structural componentsin the vicinity of the landing gears, e.g. undercarriage housing walls, struts or landinggear doors, are often subject to significant dynamic loading. These loads originate fromfluctuating aerodynamic pressures and resulting structural vibrations. Unsteady pressureson structural parts are caused by highly fluctuating and complex aerodynamic flow behav-ior under the fuselage. The paper describes the CFD approach employed to predict suchdynamic loads and presents some preliminary results that have been computed with hybridRANS-LES models and the Lattice Bolzmann method. Comparison with flight-test datahave verified the realism of these CFD simulations.
∗Engineer, now at FS Dynamics, 16970 Solna, Sweden, AIAA Senior Member†Professor, Department of Aeronautical and Vehicle Engineering, AIAA Associate Fellow‡Senior Scientists, AIAA Members§Research Director, Information and Aeronautical Systems, AIAA Associate Fellow¶Engineer, Flight Physics, AIAA Senior Members‖PhD student, CFD Team, AIAA Member∗∗Senior Scientist, CFD Team, AIAA Member††Senior Scientist, Applied Aerodynamics Dept.‡‡Engineer, Component Loads & Dynamics
1 of 18
American Institute of Aeronautics and Astronautics
54th AIAA Aerospace Sciences Meeting
4-8 January 2016, San Diego, California, USA
10.2514/6.2016-0803
Copyright © 2016 by Arthur Rizzi. Published by the American Institute of Aeronautics and Astronautics, Inc., with permission.
AIAA SciTech Forum
Nomenclature
α angle of attackν kinematic viscosity, µ
ρνr freestream kinematic viscosityρ densityCp static pressure coefficient
Cprms RMS value of Cpprms RMS value of the pressure pTu Turbulence levelM Mach numberx,y,z Cartesian coordinate system
I. Introduction: Objectives & Problem Statement
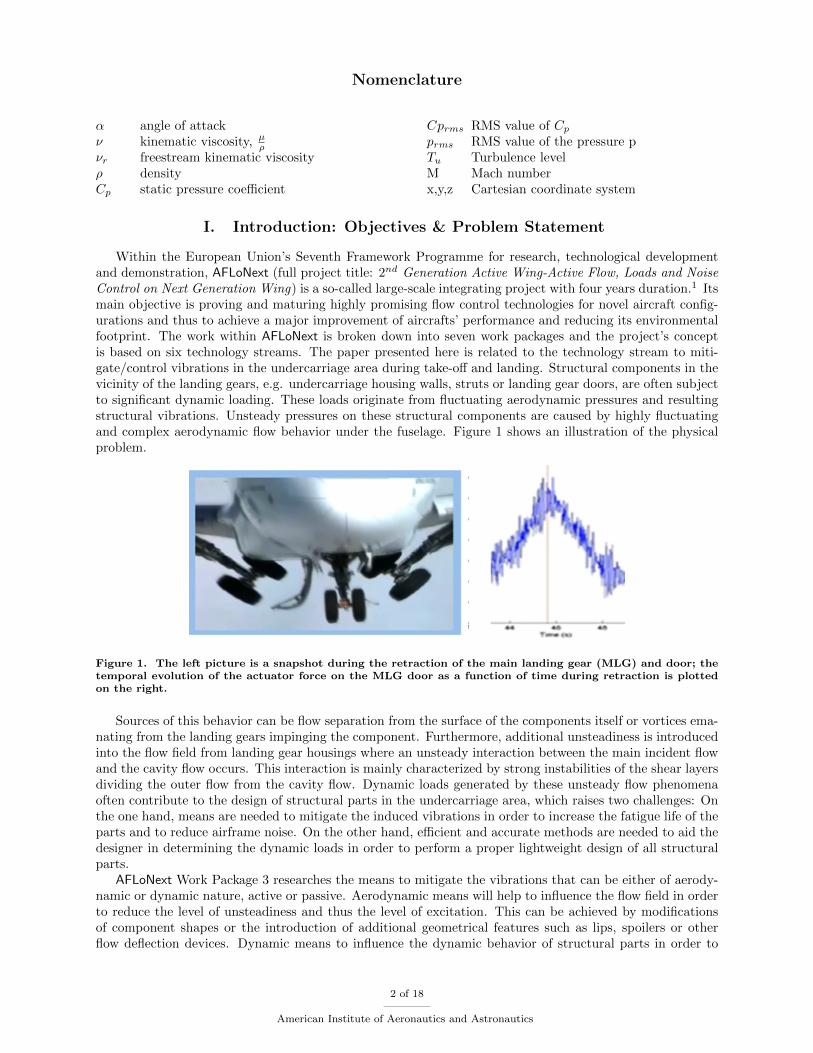
Within the European Union’s Seventh Framework Programme for research, technological developmentand demonstration, AFLoNext (full project title: 2nd Generation Active Wing-Active Flow, Loads and NoiseControl on Next Generation Wing) is a so-called large-scale integrating project with four years duration.1 Itsmain objective is proving and maturing highly promising flow control technologies for novel aircraft config-urations and thus to achieve a major improvement of aircrafts’ performance and reducing its environmentalfootprint. The work within AFLoNext is broken down into seven work packages and the project’s conceptis based on six technology streams. The paper presented here is related to the technology stream to miti-gate/control vibrations in the undercarriage area during take-off and landing. Structural components in thevicinity of the landing gears, e.g. undercarriage housing walls, struts or landing gear doors, are often subjectto significant dynamic loading. These loads originate from fluctuating aerodynamic pressures and resultingstructural vibrations. Unsteady pressures on these structural components are caused by highly fluctuatingand complex aerodynamic flow behavior under the fuselage. Figure 1 shows an illustration of the physicalproblem.
Figure 1. The left picture is a snapshot during the retraction of the main landing gear (MLG) and door; thetemporal evolution of the actuator force on the MLG door as a function of time during retraction is plottedon the right.
Sources of this behavior can be flow separation from the surface of the components itself or vortices ema-nating from the landing gears impinging the component. Furthermore, additional unsteadiness is introducedinto the flow field from landing gear housings where an unsteady interaction between the main incident flowand the cavity flow occurs. This interaction is mainly characterized by strong instabilities of the shear layersdividing the outer flow from the cavity flow. Dynamic loads generated by these unsteady flow phenomenaoften contribute to the design of structural parts in the undercarriage area, which raises two challenges: Onthe one hand, means are needed to mitigate the induced vibrations in order to increase the fatigue life of theparts and to reduce airframe noise. On the other hand, efficient and accurate methods are needed to aid thedesigner in determining the dynamic loads in order to perform a proper lightweight design of all structuralparts.
AFLoNext Work Package 3 researches the means to mitigate the vibrations that can be either of aerody-namic or dynamic nature, active or passive. Aerodynamic means will help to influence the flow field in orderto reduce the level of unsteadiness and thus the level of excitation. This can be achieved by modificationsof component shapes or the introduction of additional geometrical features such as lips, spoilers or otherflow deflection devices. Dynamic means to influence the dynamic behavior of structural parts in order to
2 of 18
American Institute of Aeronautics and Astronautics
avoid resonance with the aerodynamic excitation. Changes of a component’s design or its stiffness fall inthis category.
A prerequisite for the definition of effective means for vibration reduction is a thorough understandingof the underlying physical phenomena, including the complex flow field and its interaction with the elasticstructure. Due to the complexity of this problem, theoretical approaches to accurately predict dynamic loadson structural parts in the undercarriage area and to define devices for vibration reduction prior to flight testswere not available in the past.
The objectives of the activities carried out in AFLoNext Work Package 3 are to:
i provide a validation basis for advanced numerical prediction of the associated unsteady flow fields
ii show efficient means to mitigate vibrations on undercarriage components
iii demonstrate their engineering feasibility
The objective of the activities presented in this paper is to use 3D unsteady Computational Fluid Dynamics(CFD) models to identify aerodynamic sources of vibration and to suggest effective aerodynamic means tocontrol and reduce the vibrations. One of the selected concepts will then be fitted to the DLR Airbus 320ATRA to perform flight tests in a later stage of the project.
AFLoNext partners KTH, CFSE, FOI, A-DS, CERFACS and ONERA are involved in these activitiesthat are in particular focused on studying by CFD two main effects considered as major contributors to theunsteady loads on the main landing gear (MLG) door, namely the:
- unsteady wake trailing from the nose landing gear (NLG)
- unsteady vortices shedding from the MLG door as the NLG wake
- acoustic resonance of the MLG cavity
This is a demanding problem in terms of grid generation and local grid refinement to maintain the resolutionof the NLG wake over the 13m until it hits the door and other components of the MLG. Those are challengesto the numerical modeling, but there are also challenges to the physical modeling. The NLG is anythingbut a streamlined body, rather a very bluff body, and the physical modeling must capture the essentialfeatures in a bluff-body wake. Full Large Eddy Simulation (LES) is out of the question due to the largecomputational resources it requires. CFD simulations were therefore made using hybrid RANS-LES modelsor using the Lattice Boltzmann method (LBM). The paper describes the CFD approach taken, and presentspreliminary results. Sections II-IV summarize the CFD solvers that are used, their numerical and physicalmodeling techniques, the geometry they are applied to and the grids employed in the simulations. SectionV presents preliminary results of the different CFD simulations carried out along with their comparison toflight-test data. Finally overall conclusions are presented in Section VI.
II. Physics Modeling - Two CFD Approaches
The overall goal of the work here is to identify main sources of flow unsteadiness that incite vibrations inthe MLG door structure. Possible sources could be the unsteady airflow: 1) over features in the door itself,2) over the MLG in proximity to the door, 3) in the door cavity, 4) in the wake behind the NLG and 5)all ofthe above. In order to sort out the contributions from all these sources, a systematic computational studyis set in place that involves a number of steps to reach the final goal.
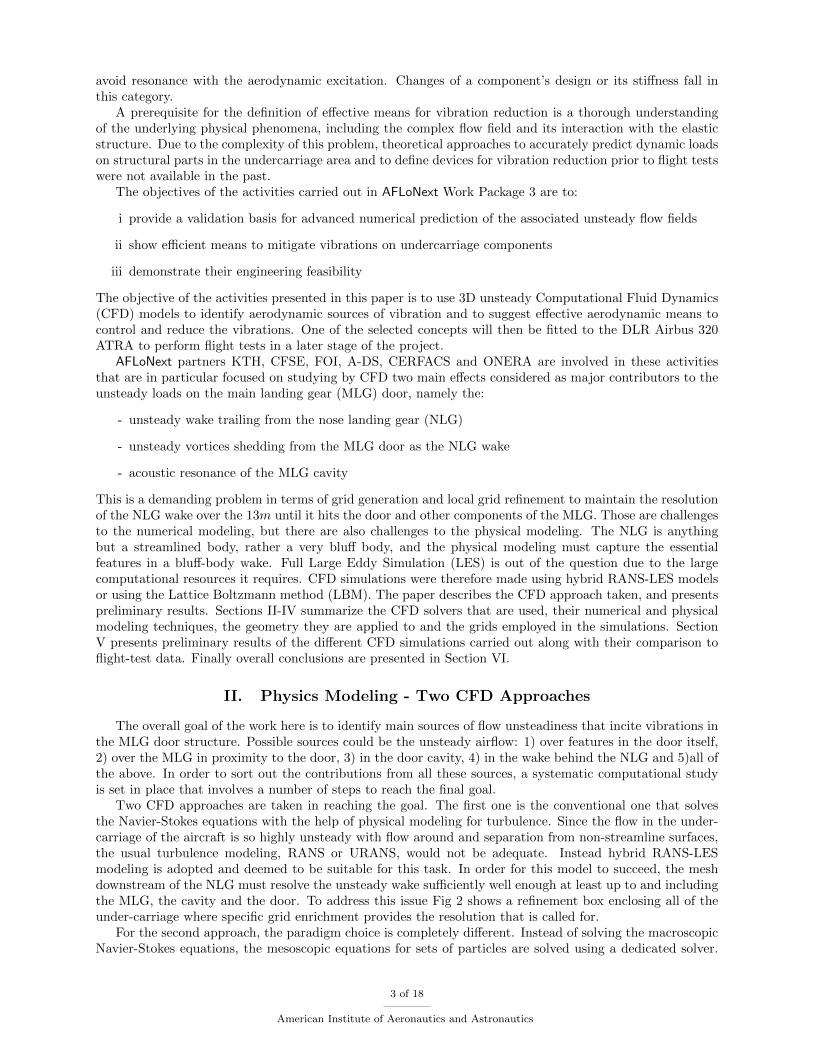
Two CFD approaches are taken in reaching the goal. The first one is the conventional one that solvesthe Navier-Stokes equations with the help of physical modeling for turbulence. Since the flow in the under-carriage of the aircraft is so highly unsteady with flow around and separation from non-streamline surfaces,the usual turbulence modeling, RANS or URANS, would not be adequate. Instead hybrid RANS-LESmodeling is adopted and deemed to be suitable for this task. In order for this model to succeed, the meshdownstream of the NLG must resolve the unsteady wake sufficiently well enough at least up to and includingthe MLG, the cavity and the door. To address this issue Fig 2 shows a refinement box enclosing all of theunder-carriage where specific grid enrichment provides the resolution that is called for.
For the second approach, the paradigm choice is completely different. Instead of solving the macroscopicNavier-Stokes equations, the mesoscopic equations for sets of particles are solved using a dedicated solver.
3 of 18
American Institute of Aeronautics and Astronautics
Figure 2. Mesh refinement box defined for enriching mesh within it.
As a consequence, the Navier-Stokes equations are replaced by the discrete Lattice-Boltzmann equation.To do so, a collision step is modeled using the standard Bhatnagar-Gross-Krook (BGK) model, while theadvection process is solved using a streaming approach. In this paper, the Lattice-Boltzmann equation aresolved using the LaBS software.14 One advantage of the LBM approach lies on the fact that highly complexgeometries can be easily handled.
A. CFD Solvers with Hybrid RANS-LES Modeling
Three different CFD codes are used in the first approach: Edge,2 Tau3 and NSMB,4 the first two solve theNavier-Stokes equations on unstructured grids, and the third solves them on structured grids.
1. Computational Methodology - Edge solver
The Edge solver is an edge- and node-based Navier-Stokes flow solver for unstructured grids, based on a finite-volume formulation where a median dual grid forms the control volumes with the unknowns allocated in thedual-grid centers, i.e. the vertices of the primary grid. The governing equations are accelerated to steadystate, with a line-implicit approach in regions with highly stretched elements (e.g. the boundary layer) andexplicitly elsewhere with a multistage Runge-Kutta time integration scheme. The steady state convergenceis accelerated by FAS agglomeration multigrid. For unsteady computations, a dual time-stepping methodis invoked, in which the physical time is advanced using an implicit second-order backward Euler scheme.At each time step, the solution is driven to convergence with the line-implicit approach and the explicitRunge-Kutta scheme.
The Edge solver includes a number of different turbulence models ranging from one-equation Spalart-Almaras (SA) to two-equation SST k-ω and EARSM to DRSM and to HYB0 (Hybrid RANS-LES) turbulencemodels. It has been parallelized using domain decomposition and message passing with MPI. The Edge codeincludes an integrated hybrid mesh generator and mesh adaptation system using complete or local re-meshingor, alternatively, local grid adaption by so called h-refinement. Interfaces are available to commercial meshgeneration and mesh adaption software.
The hybrid RANS-LES model HYB0 by Peng11 is used in the KTH work here. In the time accurateHYB0 simulation (for Case 1b below) a total of 10000 physical time steps of 1e-4s was used, which translatesto about 1s of physical time in total for statistical analysis. Within each physical time step, up to 100sub-iterations are conducted and resulting in about three-order reduction of the magnitude of residuals.
2. Computational Methodology - TAU solver
TAU is a three-dimensional, parallel, unstructured flow solver. It works on a finite volume scheme for solvingthe Reynolds-averaged Navier-Stokes (RANS) equations. It is node-centered, meaning that the flow variablesare stored on the vertices of the primary grid. A dual metric is computed during the preprocessing step
4 of 18
American Institute of Aeronautics and Astronautics
yielding the finite volume discretization with the primary grid vertices as volume centers. In the course ofthis project implicit time stepping with a LU-time scheme has been applied. The DES simulations havebeen started from a steady state RANS solution for which the convergence accelerating concepts of localtime-stepping, residual smoothing and a geometrical multigrid method have been applied. The time accurateDES simulations applied a dual time stepping scheme and various physical time steps and simulation times.From a turbulence resolving point of view, small time steps are preferred while from a structural dynamicanalysis point of view long simulation times are preferable. The different time steps and simulation timesreflect the effort to balance those two requirements. The mapping of physical simulation times to flow casesis shown in Figure 6. Physical simulation times of 1s are done with a time step of 1e-4s and simulation timesof about 4s are done with a time step of 5e-4s. DES simulations were performed using the Spalart-Almarasturbulence model.
3. Computational Methodology - NSMB solver
NSMB is a parallelized compressible Navier-Stokes Multiblock solver that includes several numerical schemes.Space discretization schemes include 2nd and 4th order central schemes with artificial dissipation and variousupwind schemes (Roe, AUSM, Van Leer ...) upto 5th order. Time integration methods are explicit (Runge-Kutta schemes) or implicit (LU-SGS) schemes that can be used for simulations on fixed or moving grids(ALE, Remeshing). Convergence acceleration as multi grid, local time stepping, preconditioning, full multigrid can be used to accelerate the convergence.Turbulence models range from 0 to 5 equations models, as well as Hybrid RANS-LES and LES approaches.To relax the difficulty of grid generation for complex geometries the chimera approach can be used, andwas employed in this project. The unsteady calculations reported in this paper were all started from thecorresponding steady calculation, with a time-step of 10−3 secs for URANS simulation (case 2a) and of10−4 secs for the DDES simulation (case 1a).
B. CFD Solver using LBM Formulation
- LaBS - Code A relatively new simulation technique for complex flows, LBM, unlike the traditional CFDmethods, does not solve the conservation equations of macroscopic properties (i.e., mass, momentum, andenergy). In contrary, fictive set of particles are modeled through their distribution function and macroscopicquantities are recovered by post-treatment. Due to its particulate nature and local dynamics, LBM hasseveral advantages over other conventional CFD methods, especially in dealing with complex boundariesand treating microscopic interactions since the method originates from a molecular description of a fluid andcan directly incorporate physical terms stemming from a knowledge of the interaction between molecules.In contrary, LBM approach is by nature currently limited to low-Mach number flows (weakly compressibleisothermal flows).
The Lattice Boltzmann solver named LaBS has been developed within a consortium of industrial compa-nies (Renault, Airbus, CS), academic laboratories (UPMC, Ecole Centrale de Lyon) and strong partnershipswith others entities (Onera, Alstom, Universite Paris-Sud, Gantha, Matelys) in 2010-2014. LaBS is builtupon the classical Lattice-Boltzmann principles15 and uses a D3Q19 lattice, with a BGK collision modelimproved with regularization16 for a better robustness / accuracy trade-off. Turbulence is handled accordingto LES approach17 either with high-order explicit filltering (Approximate Deconvolution Model, ADM18) orwith a dedicated subgrid scale model (Shear Improved Smagorinsky Model, SISM19). Near wall turbulence ismodeled using wall laws accounting for adverse pressure gradient20 and curvature effects.21 The dissipationand dispersion errors22 are kept as low as possible to enable proper generation and propagation of waves.In particular, the LBM approach is weakly dispersive and almost not dissipative since it consists in bothstreaming and collide processes.
The main difference with standard approaches concerns the easy mesh generation. The LaBS solver usesa Cartesian octree-based mesh generated automatically. It includes mesh refinement strategy based on thelocalized octree decomposition. The LBM approach was applied to the configuration defined as Take-OffCase 2b.
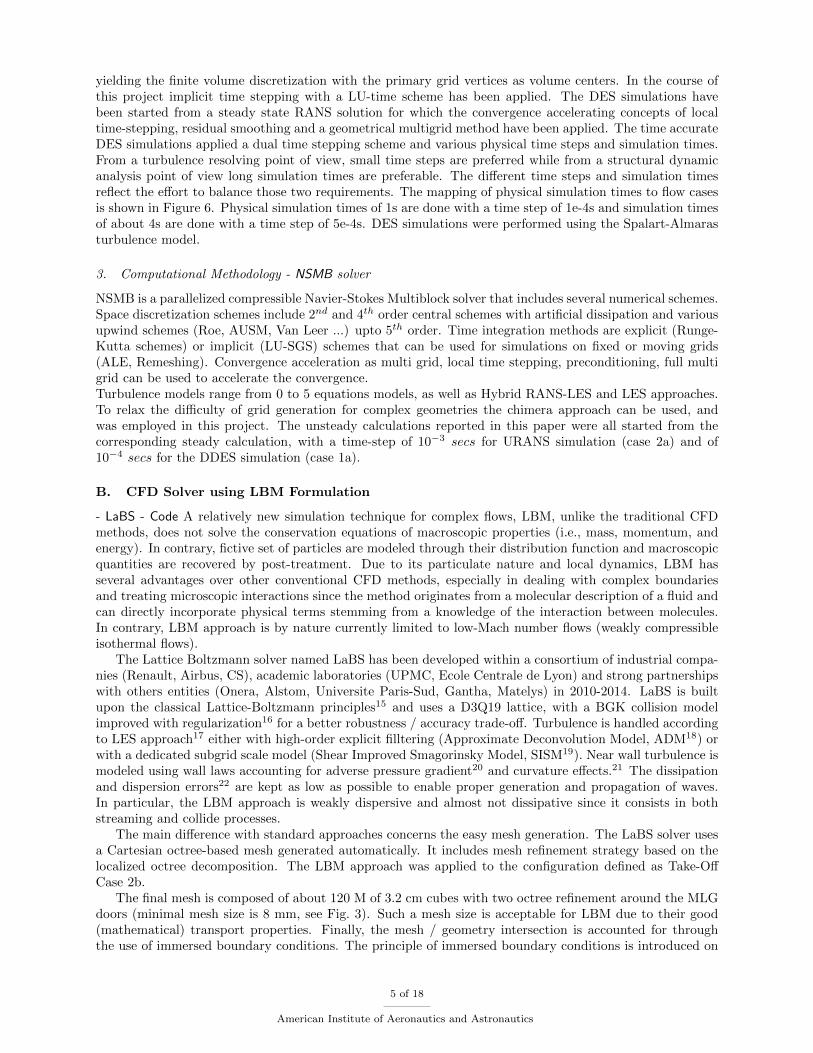
The final mesh is composed of about 120 M of 3.2 cm cubes with two octree refinement around the MLGdoors (minimal mesh size is 8 mm, see Fig. 3). Such a mesh size is acceptable for LBM due to their good(mathematical) transport properties. Finally, the mesh / geometry intersection is accounted for throughthe use of immersed boundary conditions. The principle of immersed boundary conditions is introduced on
5 of 18
American Institute of Aeronautics and Astronautics
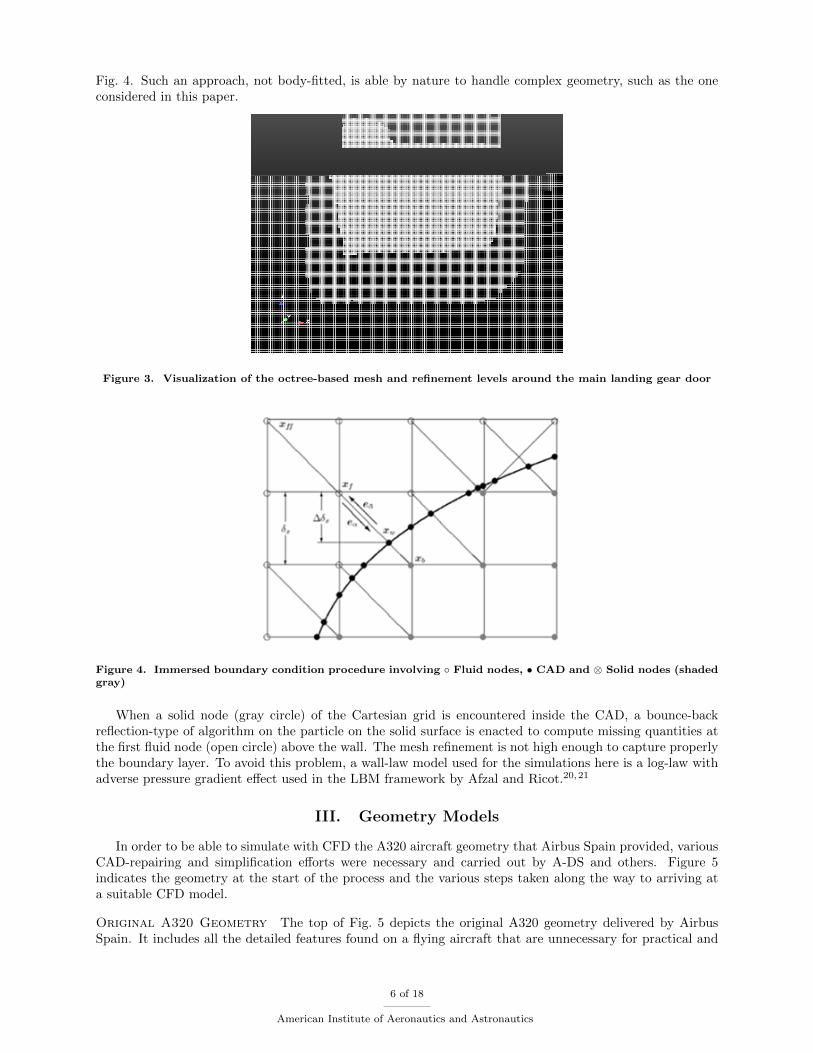
Fig. 4. Such an approach, not body-fitted, is able by nature to handle complex geometry, such as the oneconsidered in this paper.
Figure 3. Visualization of the octree-based mesh and refinement levels around the main landing gear door
Figure 4. Immersed boundary condition procedure involving ◦ Fluid nodes, • CAD and ⊗ Solid nodes (shadedgray)
When a solid node (gray circle) of the Cartesian grid is encountered inside the CAD, a bounce-backreflection-type of algorithm on the particle on the solid surface is enacted to compute missing quantities atthe first fluid node (open circle) above the wall. The mesh refinement is not high enough to capture properlythe boundary layer. To avoid this problem, a wall-law model used for the simulations here is a log-law withadverse pressure gradient effect used in the LBM framework by Afzal and Ricot.20,21
III. Geometry Models
In order to be able to simulate with CFD the A320 aircraft geometry that Airbus Spain provided, variousCAD-repairing and simplification efforts were necessary and carried out by A-DS and others. Figure 5indicates the geometry at the start of the process and the various steps taken along the way to arriving ata suitable CFD model.
Original A320 Geometry The top of Fig. 5 depicts the original A320 geometry delivered by AirbusSpain. It includes all the detailed features found on a flying aircraft that are unnecessary for practical and
6 of 18
American Institute of Aeronautics and Astronautics
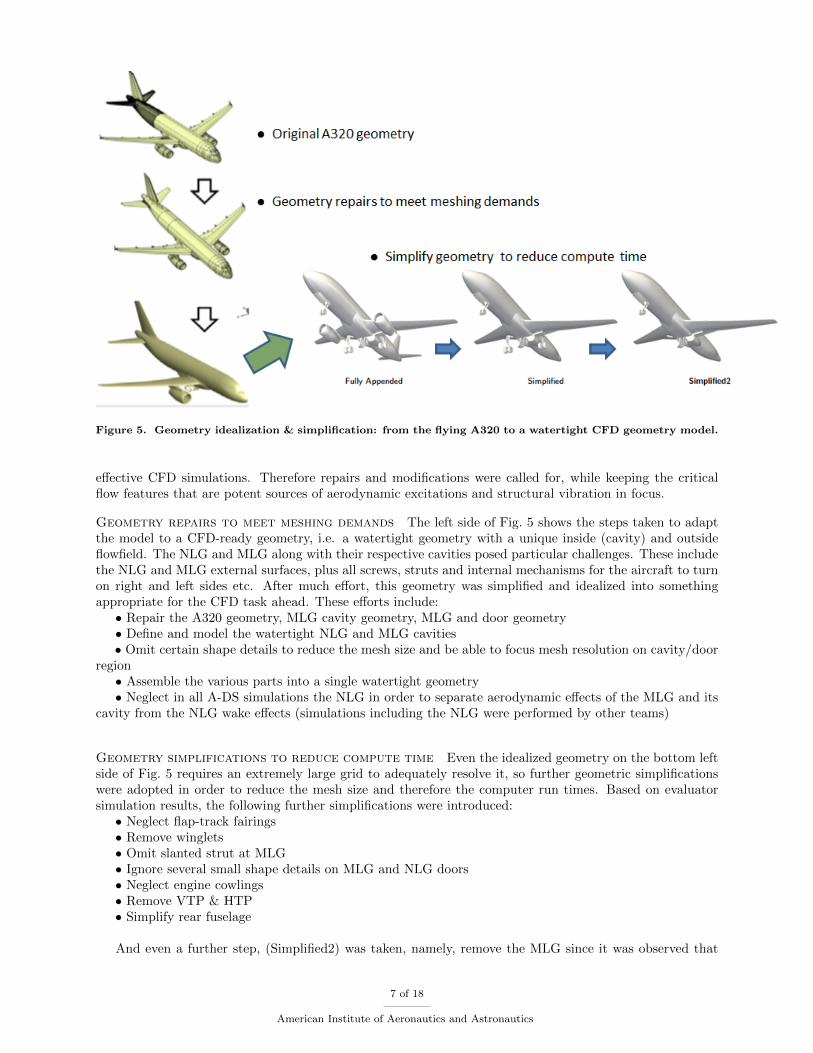
Figure 5. Geometry idealization & simplification: from the flying A320 to a watertight CFD geometry model.
effective CFD simulations. Therefore repairs and modifications were called for, while keeping the criticalflow features that are potent sources of aerodynamic excitations and structural vibration in focus.
Geometry repairs to meet meshing demands The left side of Fig. 5 shows the steps taken to adaptthe model to a CFD-ready geometry, i.e. a watertight geometry with a unique inside (cavity) and outsideflowfield. The NLG and MLG along with their respective cavities posed particular challenges. These includethe NLG and MLG external surfaces, plus all screws, struts and internal mechanisms for the aircraft to turnon right and left sides etc. After much effort, this geometry was simplified and idealized into somethingappropriate for the CFD task ahead. These efforts include:
• Repair the A320 geometry, MLG cavity geometry, MLG and door geometry• Define and model the watertight NLG and MLG cavities• Omit certain shape details to reduce the mesh size and be able to focus mesh resolution on cavity/door
region• Assemble the various parts into a single watertight geometry• Neglect in all A-DS simulations the NLG in order to separate aerodynamic effects of the MLG and its
cavity from the NLG wake effects (simulations including the NLG were performed by other teams)
Geometry simplifications to reduce compute time Even the idealized geometry on the bottom leftside of Fig. 5 requires an extremely large grid to adequately resolve it, so further geometric simplificationswere adopted in order to reduce the mesh size and therefore the computer run times. Based on evaluatorsimulation results, the following further simplifications were introduced:
• Neglect flap-track fairings• Remove winglets• Omit slanted strut at MLG• Ignore several small shape details on MLG and NLG doors• Neglect engine cowlings• Remove VTP & HTP• Simplify rear fuselage
And even a further step, (Simplified2) was taken, namely, remove the MLG since it was observed that
7 of 18
American Institute of Aeronautics and Astronautics
there was little effect felt on the MLG door when fully deployed. The various simplifications are shown alongthe bottom of Fig. 5.
IV. Two Take-Off & Landing Cases Studied
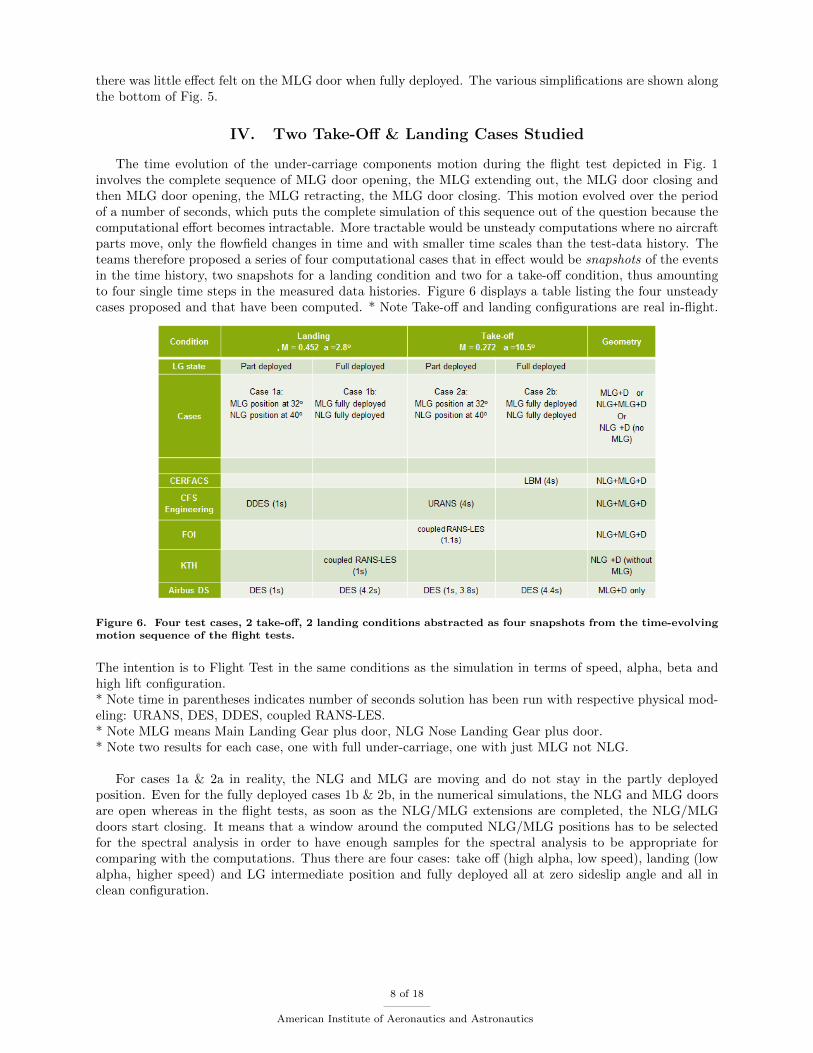
The time evolution of the under-carriage components motion during the flight test depicted in Fig. 1involves the complete sequence of MLG door opening, the MLG extending out, the MLG door closing andthen MLG door opening, the MLG retracting, the MLG door closing. This motion evolved over the periodof a number of seconds, which puts the complete simulation of this sequence out of the question because thecomputational effort becomes intractable. More tractable would be unsteady computations where no aircraftparts move, only the flowfield changes in time and with smaller time scales than the test-data history. Theteams therefore proposed a series of four computational cases that in effect would be snapshots of the eventsin the time history, two snapshots for a landing condition and two for a take-off condition, thus amountingto four single time steps in the measured data histories. Figure 6 displays a table listing the four unsteadycases proposed and that have been computed. * Note Take-off and landing configurations are real in-flight.
Figure 6. Four test cases, 2 take-off, 2 landing conditions abstracted as four snapshots from the time-evolvingmotion sequence of the flight tests.
The intention is to Flight Test in the same conditions as the simulation in terms of speed, alpha, beta andhigh lift configuration.* Note time in parentheses indicates number of seconds solution has been run with respective physical mod-eling: URANS, DES, DDES, coupled RANS-LES.* Note MLG means Main Landing Gear plus door, NLG Nose Landing Gear plus door.* Note two results for each case, one with full under-carriage, one with just MLG not NLG.
For cases 1a & 2a in reality, the NLG and MLG are moving and do not stay in the partly deployedposition. Even for the fully deployed cases 1b & 2b, in the numerical simulations, the NLG and MLG doorsare open whereas in the flight tests, as soon as the NLG/MLG extensions are completed, the NLG/MLGdoors start closing. It means that a window around the computed NLG/MLG positions has to be selectedfor the spectral analysis in order to have enough samples for the spectral analysis to be appropriate forcomparing with the computations. Thus there are four cases: take off (high alpha, low speed), landing (lowalpha, higher speed) and LG intermediate position and fully deployed all at zero sideslip angle and all inclean configuration.
8 of 18
American Institute of Aeronautics and Astronautics
A. Landing Case 1b: high speed, low α, NLG & MLG fully deployed
The landing Case 1b, M∞ = 0.452, α = 2.8◦, with NLG & MLG fully deployed has been computed by theKTH team with the Edge code. The hybrid RANS-LES computations used a zero-equation model of mixing-length type in the RANS zone bounded by the solid surface and a LES model (Smagorinsky type) in theouter zone (see Peng11 for details). The reasoning here is that zero-equation RANS modeling restricted toonly the near-wall attached turbulent boundary layer is sufficient, and that no additional turbulent transportequation needs to be solved for efficient computational analysis. Moreover, the use of LES modeling in off-wall regions will ensure much better resolution of the development of turbulent structures in the vortexmotion detached from wall surfaces.
1. Computational Grids & Setup
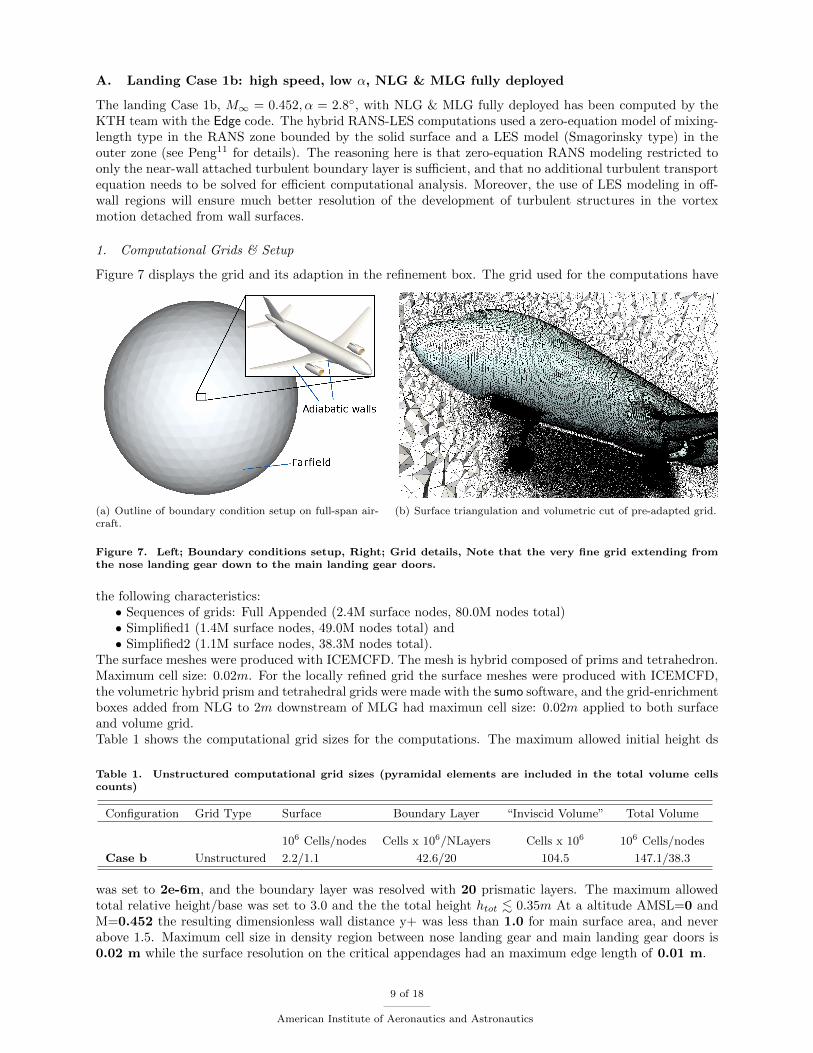
Figure 7 displays the grid and its adaption in the refinement box. The grid used for the computations have
(a) Outline of boundary condition setup on full-span air-craft.
(b) Surface triangulation and volumetric cut of pre-adapted grid.
Figure 7. Left; Boundary conditions setup, Right; Grid details, Note that the very fine grid extending fromthe nose landing gear down to the main landing gear doors.
the following characteristics:• Sequences of grids: Full Appended (2.4M surface nodes, 80.0M nodes total)• Simplified1 (1.4M surface nodes, 49.0M nodes total) and• Simplified2 (1.1M surface nodes, 38.3M nodes total).
The surface meshes were produced with ICEMCFD. The mesh is hybrid composed of prims and tetrahedron.Maximum cell size: 0.02m. For the locally refined grid the surface meshes were produced with ICEMCFD,the volumetric hybrid prism and tetrahedral grids were made with the sumo software, and the grid-enrichmentboxes added from NLG to 2m downstream of MLG had maximun cell size: 0.02m applied to both surfaceand volume grid.Table 1 shows the computational grid sizes for the computations. The maximum allowed initial height ds
Table 1. Unstructured computational grid sizes (pyramidal elements are included in the total volume cellscounts)
Configuration Grid Type Surface Boundary Layer “Inviscid Volume” Total Volume
106 Cells/nodes Cells x 106/NLayers Cells x 106 106 Cells/nodes
Case b Unstructured 2.2/1.1 42.6/20 104.5 147.1/38.3
was set to 2e-6m, and the boundary layer was resolved with 20 prismatic layers. The maximum allowedtotal relative height/base was set to 3.0 and the the total height htot . 0.35m At a altitude AMSL=0 andM=0.452 the resulting dimensionless wall distance y+ was less than 1.0 for main surface area, and neverabove 1.5. Maximum cell size in density region between nose landing gear and main landing gear doors is0.02 m while the surface resolution on the critical appendages had an maximum edge length of 0.01 m.
9 of 18
American Institute of Aeronautics and Astronautics
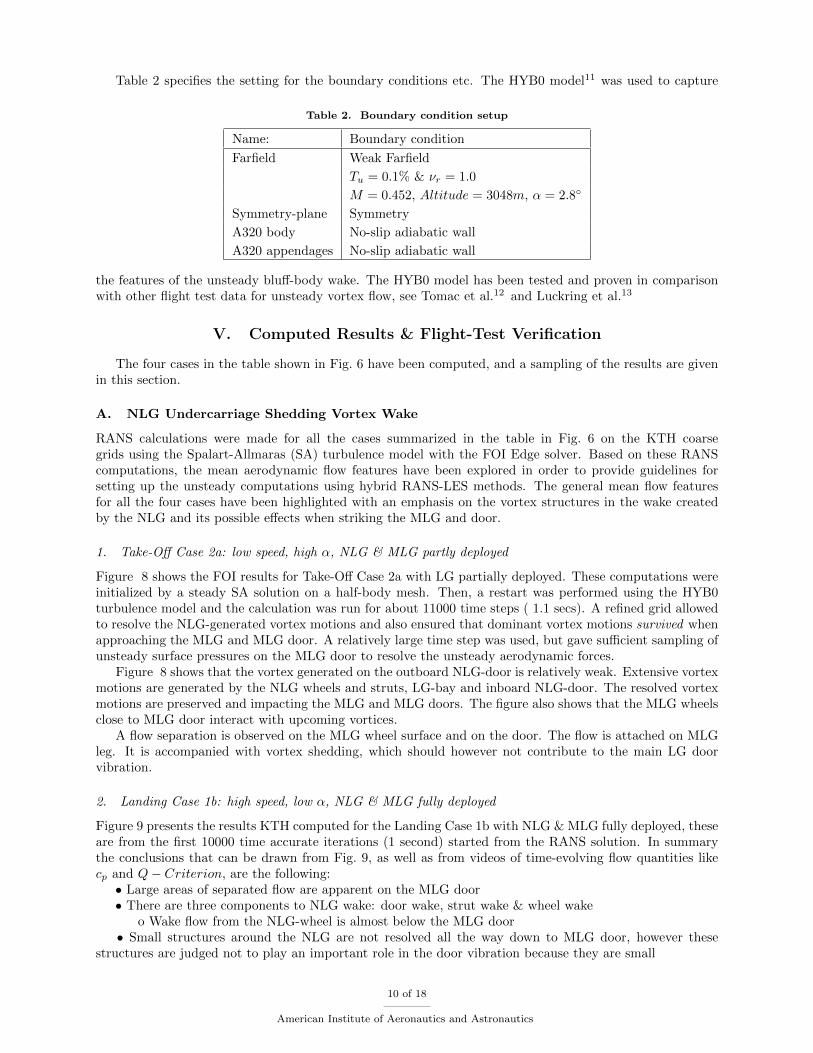
Table 2 specifies the setting for the boundary conditions etc. The HYB0 model11 was used to capture
Table 2. Boundary condition setup
Name: Boundary condition
Farfield Weak Farfield
Tu = 0.1% & νr = 1.0
M = 0.452, Altitude = 3048m, α = 2.8◦
Symmetry-plane Symmetry
A320 body No-slip adiabatic wall
A320 appendages No-slip adiabatic wall
the features of the unsteady bluff-body wake. The HYB0 model has been tested and proven in comparisonwith other flight test data for unsteady vortex flow, see Tomac et al.12 and Luckring et al.13
V. Computed Results & Flight-Test Verification
The four cases in the table shown in Fig. 6 have been computed, and a sampling of the results are givenin this section.
A. NLG Undercarriage Shedding Vortex Wake
RANS calculations were made for all the cases summarized in the table in Fig. 6 on the KTH coarsegrids using the Spalart-Allmaras (SA) turbulence model with the FOI Edge solver. Based on these RANScomputations, the mean aerodynamic flow features have been explored in order to provide guidelines forsetting up the unsteady computations using hybrid RANS-LES methods. The general mean flow featuresfor all the four cases have been highlighted with an emphasis on the vortex structures in the wake createdby the NLG and its possible effects when striking the MLG and door.
1. Take-Off Case 2a: low speed, high α, NLG & MLG partly deployed
Figure 8 shows the FOI results for Take-Off Case 2a with LG partially deployed. These computations wereinitialized by a steady SA solution on a half-body mesh. Then, a restart was performed using the HYB0turbulence model and the calculation was run for about 11000 time steps ( 1.1 secs). A refined grid allowedto resolve the NLG-generated vortex motions and also ensured that dominant vortex motions survived whenapproaching the MLG and MLG door. A relatively large time step was used, but gave sufficient sampling ofunsteady surface pressures on the MLG door to resolve the unsteady aerodynamic forces.
Figure 8 shows that the vortex generated on the outboard NLG-door is relatively weak. Extensive vortexmotions are generated by the NLG wheels and struts, LG-bay and inboard NLG-door. The resolved vortexmotions are preserved and impacting the MLG and MLG doors. The figure also shows that the MLG wheelsclose to MLG door interact with upcoming vortices.
A flow separation is observed on the MLG wheel surface and on the door. The flow is attached on MLGleg. It is accompanied with vortex shedding, which should however not contribute to the main LG doorvibration.
2. Landing Case 1b: high speed, low α, NLG & MLG fully deployed
Figure 9 presents the results KTH computed for the Landing Case 1b with NLG & MLG fully deployed, theseare from the first 10000 time accurate iterations (1 second) started from the RANS solution. In summarythe conclusions that can be drawn from Fig. 9, as well as from videos of time-evolving flow quantities likecp and Q− Criterion, are the following:
• Large areas of separated flow are apparent on the MLG door• There are three components to NLG wake: door wake, strut wake & wheel wake
o Wake flow from the NLG-wheel is almost below the MLG door• Small structures around the NLG are not resolved all the way down to MLG door, however these
structures are judged not to play an important role in the door vibration because they are small
10 of 18
American Institute of Aeronautics and Astronautics
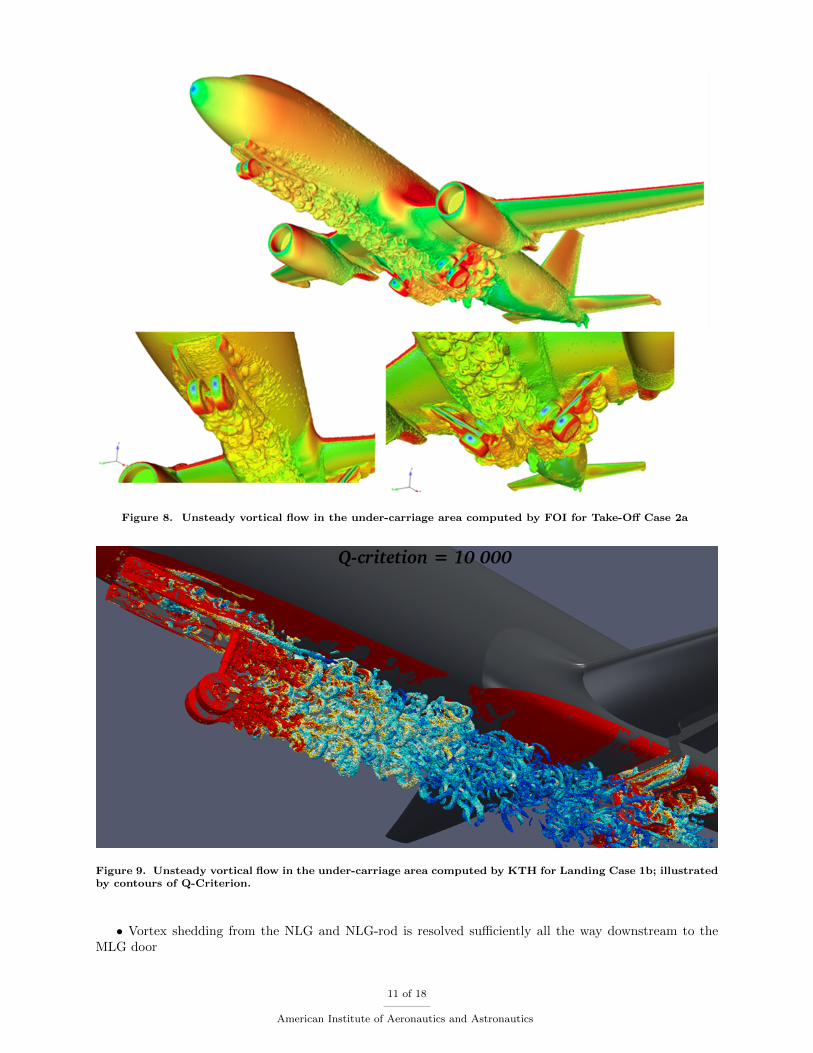
Figure 8. Unsteady vortical flow in the under-carriage area computed by FOI for Take-Off Case 2a
Figure 9. Unsteady vortical flow in the under-carriage area computed by KTH for Landing Case 1b; illustratedby contours of Q-Criterion.
• Vortex shedding from the NLG and NLG-rod is resolved sufficiently all the way downstream to theMLG door
11 of 18
American Institute of Aeronautics and Astronautics

• Vortex tubes rolling off of,and on to, the edges of the cavity are well resolvedo Small structures are captured in the close proximity of MLG door
• Cp and Q− Criterion time evolution movies indicate the following:o Pressure fluctuations on the MLG door are indeed affected by BOTH cavity and wake flowso On the inner side of the MLG door the pressure pulses are slower, with frequency similar to cavity
flow fluctuations
In consideration of the above findings, one can speculate:• Intuitively it seems that the low frequency pressure pulses originate, or are coupled with, the cavity
flow, while the medium and large spectra comes from the NLG wake.• Could the main high frequency pulses originate from small details on the door itself, probably initiated
or affected by strongly turbulent-fluctuating flow from upstream ?
B. MLG Undercarriage with or without NLG Wake - Landing Case 1a
For the Landing Case 1a: M∞ = 0.452, α = 2.8◦, with only the MLG partly deployed, this section con-centrates on computed results in the under-carriage area of the MLG which includes effects from cavityresonance and MLG interference effects on the door. Two different sets of results, from the A-DS team andthe CFSE team, have been examined, important to keep in mind that the A-DS results are without modelingthe NLG, hence they contain no NLG-wake effects. Thus the comparison between the two allows drawingconclusions about the NLG-wake effects. Mainly the A-DS results without the NLG-wake effects are shownhere.
CFD simulations from A-DS and CFSE shown that the large MLG-cavity is subject to considerablepressure fluctuations in the time period when the MLG is deployed and the MLG door is still open. Thisstate leads to a situation that is widely known as cavity flow and that is known to bear the risk of considerablecavity tones. These tones are known as Rossiter modes in the case of the most simple geometry, namely therectangular empty cavity in a flat plate. While the geometry of the MLG cavity is certainly more complex,CFD simulations at various flow conditions have shown that pressure fluctuations are emanating from thiscavity into the outer flowfield, also affecting the MLG door. Figure 10 shows the A-DS computations forthis case.
Wheel-door interaction studied It is possible to see from the A-DS simulations, which are withoutNLG, that the effect of the MLG alone (see Fig. 10) partly deployed, compared to the fully deployed one(Case 1b) is a pressure increase close to the door leading edge. This leads to the conclusion that both NLGwake and MLG interference have the same effect on sensors at the door leading edge, i.e. a pressure increase,but it is difficult to say if one is more dominant than the other.
The A-DS and CFSE simulations for Case 1a and the FOI simulations for Case 2a, both for a partiallydeployed MLG, indicate that a vortex is shed from the outer surface of the door leading edge and inducesa suction. But this vortex is not present in the fully deployed cases 1b and 2b. Furthermore on the outersurface (Fig. 10) the prms level is around two times lower than on the inner surface with a maximum peakat the door leading edge.
1. Cavity investigation
Figure 11 shows the standard deviation of the oscillating pressure field, prms in two different x-planes, cuttingthrough the MLG cavity. It is obvious, that the pressure oscillations for the case of fully deployed MLG arelarger and that inside of the cavity the fluctuations increase when approaching the rear wall of the cavity.From literature it is known that the impingement of the separated boundary layer on the rear wall of thecavity is the cause of a feedback loop between the boundary layer separation on the cavity leading edge andthe pressure waves traveling upstream from the impingement on the rear wall. Figure 12 illustrates thismechanism, and it is known to be the cause for the above mentioned cavity tones.
2. Unsteady Loads on MLG door: vortex shedding
As mentioned both A-DS and CFSE have computed results for the Landing Case 1a. The CFSE computationshave been performed with the structured finite volume multi block solver called NSMB. Chimera techniques
12 of 18
American Institute of Aeronautics and Astronautics
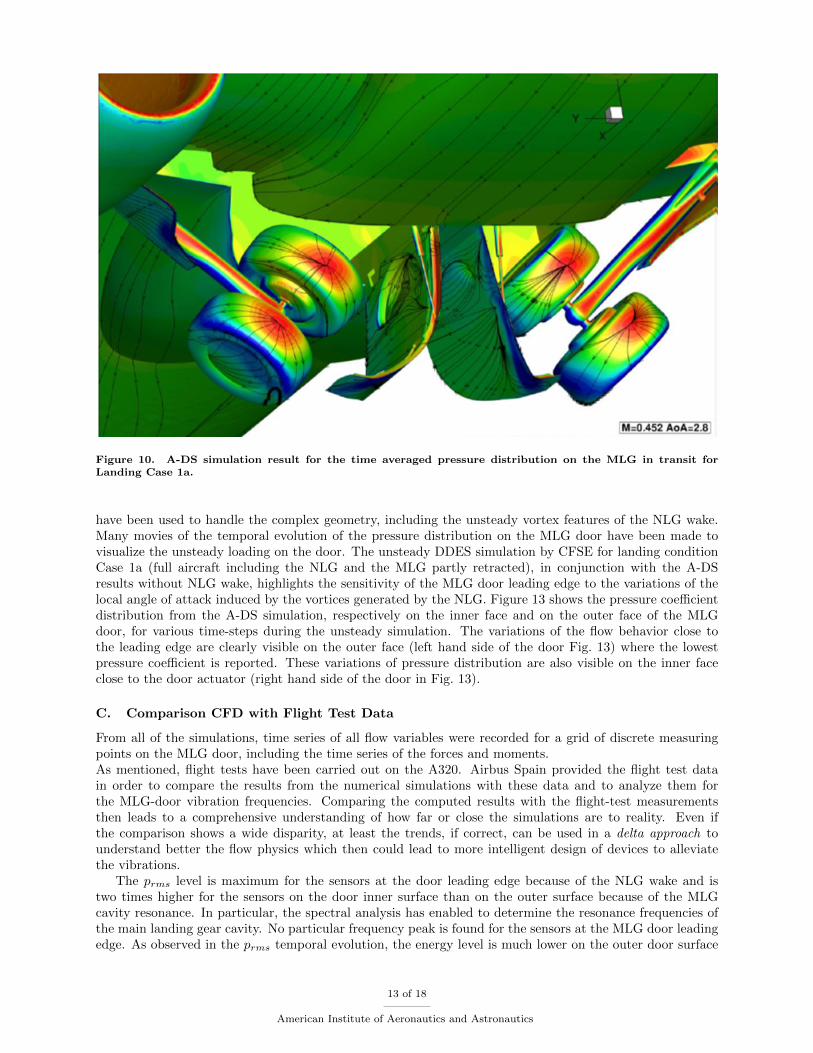
Figure 10. A-DS simulation result for the time averaged pressure distribution on the MLG in transit forLanding Case 1a.
have been used to handle the complex geometry, including the unsteady vortex features of the NLG wake.Many movies of the temporal evolution of the pressure distribution on the MLG door have been made tovisualize the unsteady loading on the door. The unsteady DDES simulation by CFSE for landing conditionCase 1a (full aircraft including the NLG and the MLG partly retracted), in conjunction with the A-DSresults without NLG wake, highlights the sensitivity of the MLG door leading edge to the variations of thelocal angle of attack induced by the vortices generated by the NLG. Figure 13 shows the pressure coefficientdistribution from the A-DS simulation, respectively on the inner face and on the outer face of the MLGdoor, for various time-steps during the unsteady simulation. The variations of the flow behavior close tothe leading edge are clearly visible on the outer face (left hand side of the door Fig. 13) where the lowestpressure coefficient is reported. These variations of pressure distribution are also visible on the inner faceclose to the door actuator (right hand side of the door in Fig. 13).
C. Comparison CFD with Flight Test Data
From all of the simulations, time series of all flow variables were recorded for a grid of discrete measuringpoints on the MLG door, including the time series of the forces and moments.As mentioned, flight tests have been carried out on the A320. Airbus Spain provided the flight test datain order to compare the results from the numerical simulations with these data and to analyze them forthe MLG-door vibration frequencies. Comparing the computed results with the flight-test measurementsthen leads to a comprehensive understanding of how far or close the simulations are to reality. Even ifthe comparison shows a wide disparity, at least the trends, if correct, can be used in a delta approach tounderstand better the flow physics which then could lead to more intelligent design of devices to alleviatethe vibrations.
The prms level is maximum for the sensors at the door leading edge because of the NLG wake and istwo times higher for the sensors on the door inner surface than on the outer surface because of the MLGcavity resonance. In particular, the spectral analysis has enabled to determine the resonance frequencies ofthe main landing gear cavity. No particular frequency peak is found for the sensors at the MLG door leadingedge. As observed in the prms temporal evolution, the energy level is much lower on the outer door surface
13 of 18
American Institute of Aeronautics and Astronautics
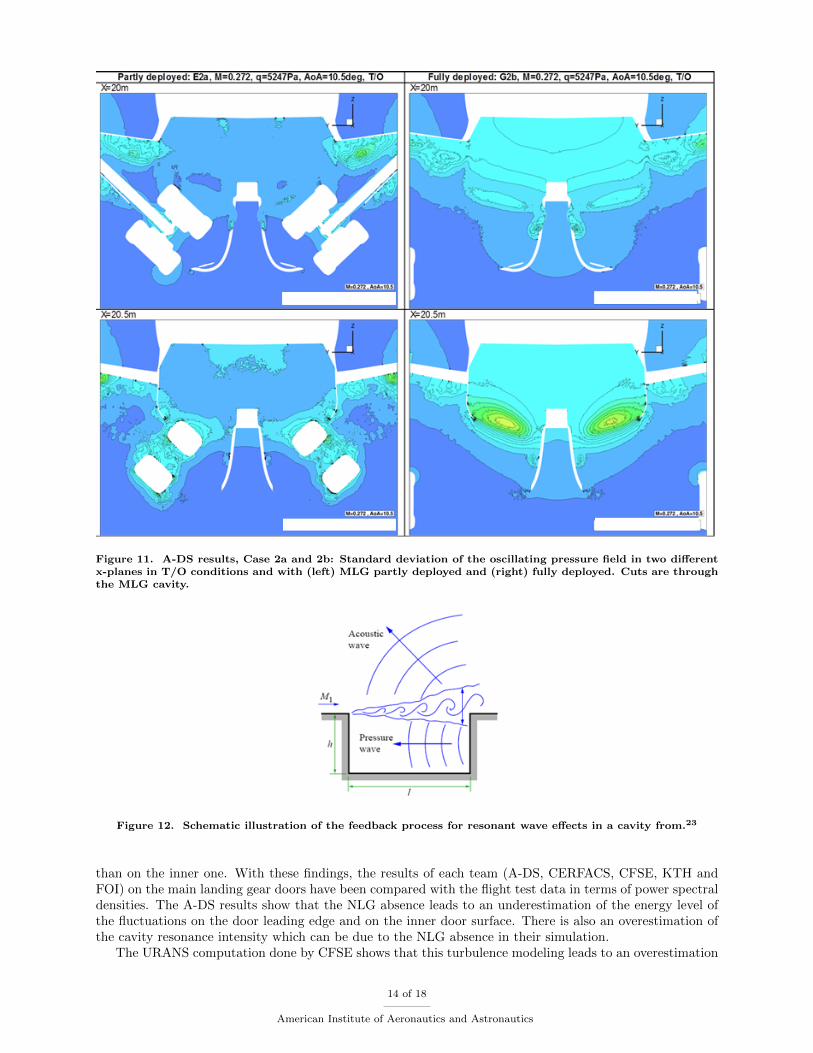
Figure 11. A-DS results, Case 2a and 2b: Standard deviation of the oscillating pressure field in two differentx-planes in T/O conditions and with (left) MLG partly deployed and (right) fully deployed. Cuts are throughthe MLG cavity.
Figure 12. Schematic illustration of the feedback process for resonant wave effects in a cavity from.23
than on the inner one. With these findings, the results of each team (A-DS, CERFACS, CFSE, KTH andFOI) on the main landing gear doors have been compared with the flight test data in terms of power spectraldensities. The A-DS results show that the NLG absence leads to an underestimation of the energy level ofthe fluctuations on the door leading edge and on the inner door surface. There is also an overestimation ofthe cavity resonance intensity which can be due to the NLG absence in their simulation.
The URANS computation done by CFSE shows that this turbulence modeling leads to an overestimation
14 of 18
American Institute of Aeronautics and Astronautics
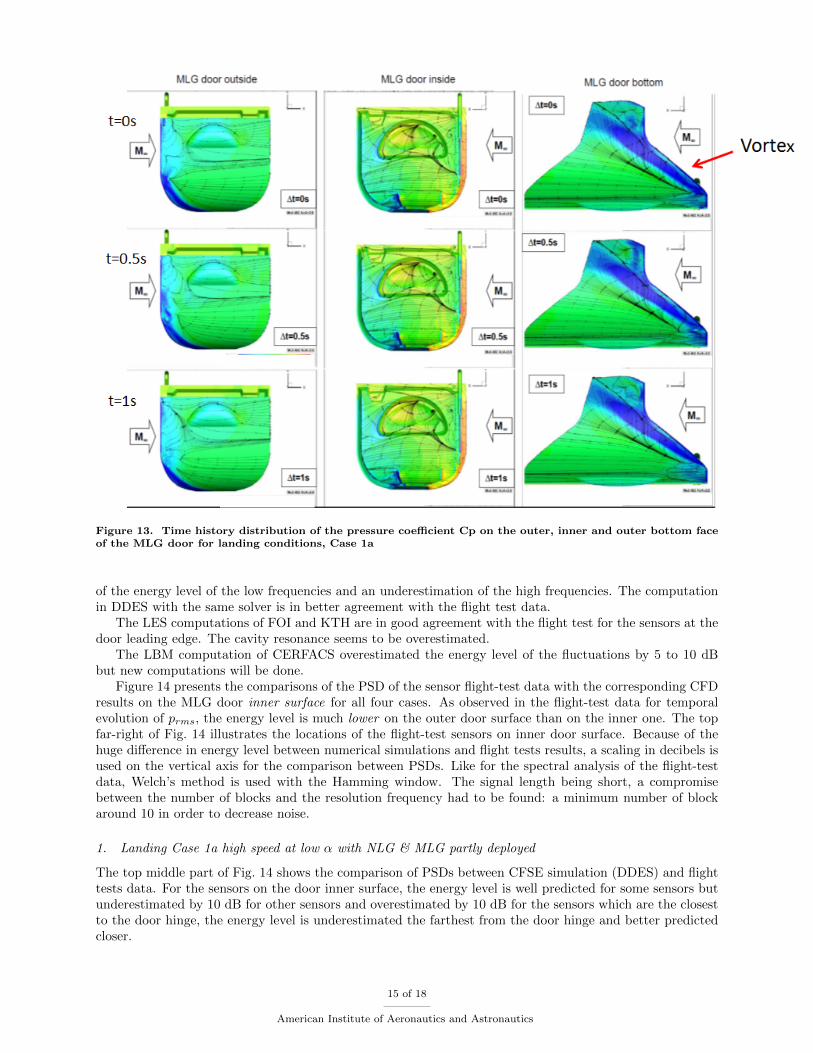
Figure 13. Time history distribution of the pressure coefficient Cp on the outer, inner and outer bottom faceof the MLG door for landing conditions, Case 1a
of the energy level of the low frequencies and an underestimation of the high frequencies. The computationin DDES with the same solver is in better agreement with the flight test data.
The LES computations of FOI and KTH are in good agreement with the flight test for the sensors at thedoor leading edge. The cavity resonance seems to be overestimated.
The LBM computation of CERFACS overestimated the energy level of the fluctuations by 5 to 10 dBbut new computations will be done.
Figure 14 presents the comparisons of the PSD of the sensor flight-test data with the corresponding CFDresults on the MLG door inner surface for all four cases. As observed in the flight-test data for temporalevolution of prms, the energy level is much lower on the outer door surface than on the inner one. The topfar-right of Fig. 14 illustrates the locations of the flight-test sensors on inner door surface. Because of thehuge difference in energy level between numerical simulations and flight tests results, a scaling in decibels isused on the vertical axis for the comparison between PSDs. Like for the spectral analysis of the flight-testdata, Welch’s method is used with the Hamming window. The signal length being short, a compromisebetween the number of blocks and the resolution frequency had to be found: a minimum number of blockaround 10 in order to decrease noise.
1. Landing Case 1a high speed at low α with NLG & MLG partly deployed
The top middle part of Fig. 14 shows the comparison of PSDs between CFSE simulation (DDES) and flighttests data. For the sensors on the door inner surface, the energy level is well predicted for some sensors butunderestimated by 10 dB for other sensors and overestimated by 10 dB for the sensors which are the closestto the door hinge, the energy level is underestimated the farthest from the door hinge and better predictedcloser.
15 of 18
American Institute of Aeronautics and Astronautics

Figure 14. Comparison of PSD of sensor signals from all the CFD simulations (solid lines) and flight test 195(solid line with symbols) on MLG door inner surface in respective subplots.
2. Landing Case 1b high speed at low α with NLG & MLG fully deployed
The plot in the upper left of Fig. 14 presents the comparison of PSDs between the A-DS simulation (DES)and flight tests data where the agreement is reasonable on the door inner surface but the cavity resonance istoo intense compared to the flight tests data. The question which arises: is this overestimation of the cavityresonance intensity due to the NLG wake absence or due to a numerical effect like mesh density? It wouldhave been more conclusive to compute with the same solver both cases, with and without NLG, to separateboth effects. If the absence of the NLG wake increases the cavity resonance intensity, it is an importantconclusion with respect to the objective of decreasing the vibration level of the MLG doors. Because, if onetries to deviate or decrease the turbulence in the NLG wake, it could have the opposite effect of increasingthe cavity resonance intensity. Two peaks at f = 35 and 70 Hz are visible whereas there were three peaksat f = 34, 63 and 83 Hz in Case 1a. The first peak corresponding to the first MLG cavity mode and it is atthe same frequency as in Case 1a. The second peak could be the first harmonic of the peak at 35 Hz.
The plot in the upper right of Fig. 14 shows the comparison of PSDs between the KTH simulation (LES)and flight-test data. The simulation done by KTH is without MLG but since it is supposed to be in afully deployed position, it would have been farther from the MLG door than in the partially deployed caseand hence of small effect presumably. The energy levels on the inner door surface are quite well predicted,suggesting that the energy is on a larger band than the 60 Hz one limited by the sensors bandwidth. Butthe cavity resonance seems too intense compared to the flight-test data because the peak at f = 32 Hz hasa too high amplitude, but the frequency is well predicted.
3. Take-Off Case 2a low speed at high α with NLG & MLG partly deployed
The plot in the lower left of Fig. 14 presents the comparison of PSDs between the FOI simulation (LES)and flight-test data. Like for the KTH simulation which uses the same code and nearly the same mesh, theenergy levels on the inner surface are also quite well predicted except for sensor 148 close the door hinge.The cavity modes are more visible on the outer surface than on the inner surface. There are peaks at f = 14and 34 Hz at lower frequencies than expected from Rossiter equation for the first two cavity modes (19 and45 Hz).
16 of 18
American Institute of Aeronautics and Astronautics
4. Take-Off Case 2b low speed at high α with NLG & MLG fully deployed
The plot in the lower right of Fig. 14 shows the comparison of PSDs between the CERFACS simulation(LBM) and flight-test data. For the sensors on the door inner surface, the cavity resonance intensity isoverestimated compared to flight-test data. There is a peak at f = 26 Hz like in the A-DS simulation. Thesecond and third peaks from the A-DS simulation are not present in the CERFACS results. Not shown here,other comparisons indicate that the CERFACS results overestimate the energy levels of the fluctuations onthe door leading edge and outer surface by 5 to 10 dB. This can be explained by wave reflections in refinementtransition. One of the current task concerns the improvement of the LaBS solver for such mesh transition.Another conclusion drawn is that the NLG cavity doesn’t seem to contribute to NLG wake generation.
5. Comparison of Door-Vibration Modes
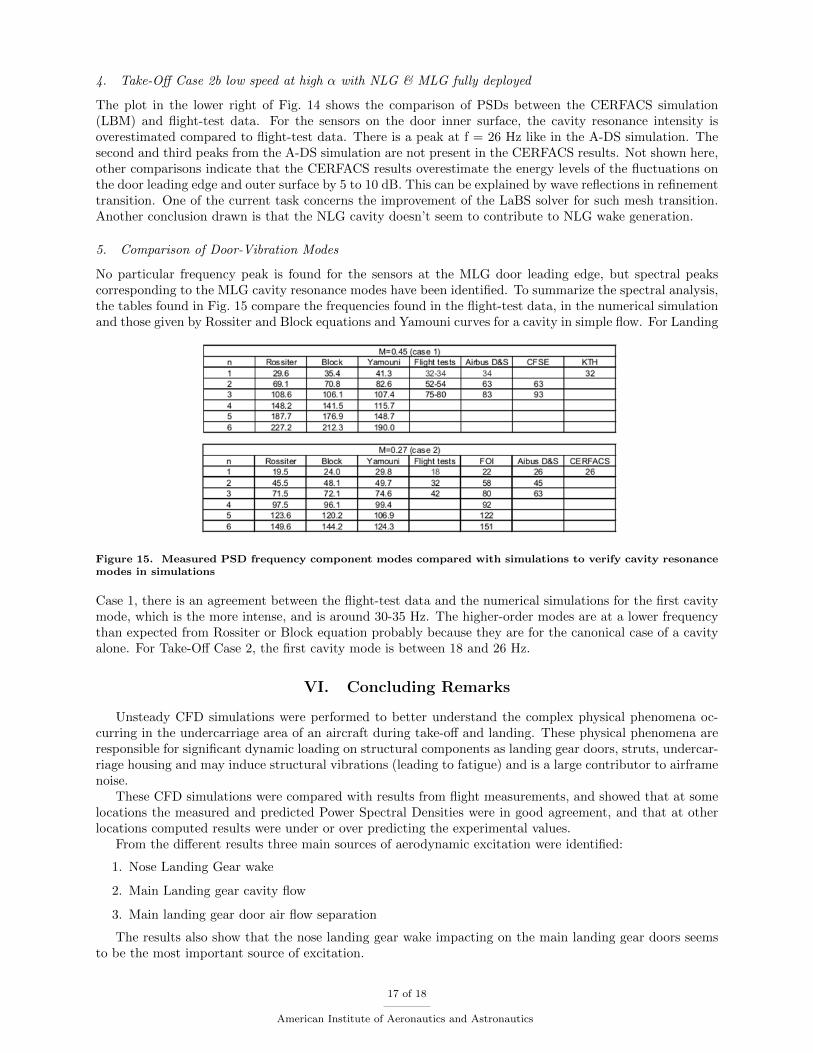
No particular frequency peak is found for the sensors at the MLG door leading edge, but spectral peakscorresponding to the MLG cavity resonance modes have been identified. To summarize the spectral analysis,the tables found in Fig. 15 compare the frequencies found in the flight-test data, in the numerical simulationand those given by Rossiter and Block equations and Yamouni curves for a cavity in simple flow. For Landing
Figure 15. Measured PSD frequency component modes compared with simulations to verify cavity resonancemodes in simulations
Case 1, there is an agreement between the flight-test data and the numerical simulations for the first cavitymode, which is the more intense, and is around 30-35 Hz. The higher-order modes are at a lower frequencythan expected from Rossiter or Block equation probably because they are for the canonical case of a cavityalone. For Take-Off Case 2, the first cavity mode is between 18 and 26 Hz.
VI. Concluding Remarks
Unsteady CFD simulations were performed to better understand the complex physical phenomena oc-curring in the undercarriage area of an aircraft during take-off and landing. These physical phenomena areresponsible for significant dynamic loading on structural components as landing gear doors, struts, undercar-riage housing and may induce structural vibrations (leading to fatigue) and is a large contributor to airframenoise.
These CFD simulations were compared with results from flight measurements, and showed that at somelocations the measured and predicted Power Spectral Densities were in good agreement, and that at otherlocations computed results were under or over predicting the experimental values.
From the different results three main sources of aerodynamic excitation were identified:
1. Nose Landing Gear wake
2. Main Landing gear cavity flow
3. Main landing gear door air flow separation
The results also show that the nose landing gear wake impacting on the main landing gear doors seemsto be the most important source of excitation.
17 of 18
American Institute of Aeronautics and Astronautics
Acknowledgement
The work described in this paper and the research leading to these results has received funding from theEuropean Community’s Seventh Framework Programme FP7/2007-2013, under grant agreement n◦ 604013,AFLoNext project.
Regarding the LBM computations, the support of LaBS Groupement is greatly acknowledged and theLaBS simulations have been conducted on Airbus’ HPC resources.
References
1AFLoNext-Aircraft Flow Control Techniques, EU Research Project of the 7thFramework Programme, Project reference:604013, URL: http://www.aflonext.eu(cited 21 June 2014).
2P., Eliasson; Edge, a Navier-Stokes solver for unstructured grids. In Finite Volumes for Complex Applications III, pages527-534, June 2002.
3Deutsches Zentrum fuer Luft- und Raumfahrt e.V.Technical Documentation of the DLR TAU-Code Release 2013.2.0.Institute of Aerodynamics and Flow Technology Braunschweig. 2013.
4Vos J.B., Rizzi A.W., Corjon A., Chaput E., Soinne E. Recent Advances in Aerodynamics inside the NSMB (Navier-StokesMultiblock) Consortium. AIAA paper 98-0225, 1998.
5Spalart, P.R., Allmaras, S.R., 1994. A one-equation turbulence model for aerodynamic Flows. La Recherche Aerospatiale1, 5.
6Kok, J. C.: Resolving the Dependence on Freestream Values for k - ω Turbulence Model, AIAA Journal, Vol. 38, No. 7,2000
7Menter, F.R., (1994), Two-equation eddy-viscosity turbulence models for engineering applications. AIAA-Journal, 32(8),pp. 269-289, 1994.
8Tomac, M., Petersson, K. Rizzi, A., Calibration and Verification of a γ − Reθ Transition prediction Method for AirfoilComputations, Presented at 51st AIAA Aerospace Sciences Meeting.
9Wallin, S. and Johansson, A. V., An explicit algebraic Reynolds stress model for incompressible and compressible turbulentflows, Journal of Fluid Mechanics, Vol. 403, 2000, pp. 89-132.
10Wallin, S. and Johansson, A. V., The full differential Reynolds stress model corresponding to the W&J EARSM +Hellsten k-omega, that is the same pressure-strain model and the same modeled omega equation, Journal of Fluid Mechanics,Vol. 403, 2000, pp. 89-132.
11Shia-Hui Peng, Hybrid RANS-LES Modeling Based on Zero- and One-Equation Models for Turbulent Flow Simulation,In Proceedings of 4th International Symposium on Turbulence and Shear Flow Phenomena, Vol. 3, pp1159-1164. Williamsburg,VA USA, 27-29 June, 2005.
12M. Tomac, A. Rizzi, A. Jirasek, Hybrid RANS-LES Simulations of F-16XL Aircraft in Low-speed High-alpha Flight,AIAA-Paper-2015-2874, 2015.
13J. Luckring, M. Park, S.Hitzel, A. Jirasek, A Synthesis of Hybrid RANS/LES CFD Results for F-16XL Aircraft Aerody-namics, AIAA-Paper-2015-2876, 2015.
14”Lattice-Boltzmann Solver LaBS”, http://www.labs-project.org, 2014.15Chen, S. and Doolen, G., ”Lattice Boltzmann Method for fluid flows,” Ann. Rev. Fluid Mech. , Vol. 30, 1998, pp. 329-364.16Latt, J. and Chopard, B., ”Lattice Boltzmann method with regularized pre-collision distribution functions”, Mathematics
and Computers in Simulation, Vol. 72, No. 2, 2006, pp. 165-168.17Sagaut, P., Large Eddy Simulation for incompressible flows, Scientific computation series, Springer-Verlag, 2000.18Malaspinas, O. and Sagaut, P., ”Advanced large-eddy simulation for lattice Boltzmann methods: The approximate
deconvolution model”, Phys. Fluids , Vol. 23 - 105103, 2011.19Leveque, E., Toschi, F., Shao, L., and Bertoglio, J.-P., ”Shear-improved Smagorinsky model for large-eddy simulation of
wall-bounded turbulent flows”, J. Fluid Mech. , Vol. 570, 2007, pp. 491-502.20Afzal, N., ”Wake layer in a turbulent boundary layer with pressure gradient- A new approach,” IUTAM Symposium on
Asymptotic Methods for Turbulent Shear Flows at High Reynolds Numbers, Bochum, Germany, 1996, pp. 95-118.21Touil, H., Ricot, D., and Leveque, E., ”Direct and large-eddy simulation of turbulent flows on composite multi-resolution
grids by the lattice Boltzmann method”, J. Comput. Phys. , 2014, pp. 220-233.22Ricot, D., Marie, S., Sagaut, P., and Bailly, C., ”Lattice Boltzmann method with selective viscosity filter,” J. Comput.
Phys. , Vol. 228, 2009, pp. 4478-4490.23Chappell, P.D., ”Aerodynamics and aero-acoustics of rectangular planform cavities Part II: Unsteady flow and aero-
acoustics”, London ESDU International plc, 2005, 111.
18 of 18
American Institute of Aeronautics and Astronautics
Related Documents


![Parallel Vectors Criteria for Unsteady Flow Vortices · the principle of the parallel vectors operator [16] for extracting the vortex core lines in conjunction with modied extraction](https://static.cupdf.com/doc/110x72/5f07cacc7e708231d41ec4b5/parallel-vectors-criteria-for-unsteady-flow-vortices-the-principle-of-the-parallel.jpg)

