- d United Nations Scientific Committee on the Effects of Atomic Radiation 1977 report to the General Assembly, with annexes

Welcome message from author
This document is posted to help you gain knowledge. Please leave a comment to let me know what you think about it! Share it to your friends and learn new things together.
Transcript

-d
United Nations Scientific Committee on the Effects of Atomic Radiation
1977 report to the General Assembly, with annexes
NOTE
The report of the Committee without its annexes appears as Official Records of the General Assembly, Thirty-second Session, Supplement No. 40 (A/32/40).
In the text of each annex, Arabic numbers in parentheses are references listed at the end.
The designations employed and the presentation of material in this publication do not imply the expression of any opinion whatsoever on the part of the Secretariat of the United Nations concerning the legal status of any country, territory, city or area, or of its authorities, or concerning the delimitation of its frontiers or boundaries.
UNITED NATIONS PUBLICATION Sales No. E.77.IX.1 Price: $U.S. 28.00
(or equivalent in other currencies)
Produced by UNIDO, Vienna

--
ANNEXF
Medical irradiation
CONTENTS
INTRODUCTION •..........•.......
I. BASIC INFORMATION ••..•.......
A. Method of data presentation ..... . B. Individual dose per unit procedure .. . C. Collective dose per type of procedure
1. Purpose of assessment ...•.•. 2. Limitations in the use of the
collective dose as a measure of detriment from medical exposures
3. Weighting for relevance ...•.. 4. Assessment of collective dose .. . 5. Accuracy of assessments ..... .
D. Groups of potential epidemiological interest .•.................
II. DIAGNOSTIC USES OF RADIATION
A. X-ray diagnostic radiology .......• 1. Trends in frequency and technique 2. Individual dose per unit procedure
(a) Accuracy of dose estimates and reasons for variation .. .
(b) Doses to various organs .. . (c) Embryo and foetal exposures (d) Comparison of procedures
3. Collective dose to various organs from different types of procedures (a) Accuracy of assessment .•. (b) Collective dose to various
organs •.•.......... {c) Annual genetically significant
dose ...•..•...•... 4. Groups of epidemiological interest 5. Potential means of dose reduction
Introduction
Paragraphs
1-9
10-31 10
11-14 15-30 15-17
18 19-20 21-26 27-30
31
32-126 32-116 32-46 47-80
47-51 52-75 76-77 78-80
81-108 82
83-92
93-108 109-110 111-116
I. The Committee has previously presented data on the medical irradiation of patients in its reports of 1958 (242), 1962 (243) and 1972 (244). Medical exposures
B. Diagnostic uses of radiopharmaceuticals 1. Trends in frequencies and
techniques •.••..••••.••• 2. Individual dose per unit procedure
{a) Administered activity .•... {b) Dose per examination ....
III. THERAPEUTIC USES OF RADIATION A. Treatment with e.xternal beams and
sealed sources •.....•.•••..•. 1. General ....•.•••....•. 2. Trends in radiotherapy practice 3. Dose data in radiotherapy ..•.. 4. Information of epidemiological
interest .............. . 5. Genetically significant dose ... .
B. Therapeutic uses of radiopharma· ceuticals ........•••••...... 1. lodine-131 therapy for hyper
thyroidism and heart disease 2. Jodine-131 therapy for cancer of
the thyroid ........••... 3. Polycythemia vera patients treated
with l2p •••••••••••••••
IV. WASTE DISPOSAL OF MEDICALLY USED RADIOPHARMACEUTICALS •..•...•
V. CONCLUSIONS
References ....................•..
Paragraphs
117-130
117-122 123-130 123-125 126-130
131-153
131-145 131-132 133-135 136-137
138-142 143-145
146-153
147-148
149-150
151-153
154-156
157-161
Page
349
are of particular interest since they contribute the highest man-made per caput doses in the population, are given with high instantaneous dose rates and cause the highest individual organ doses short of accidental exposures. From the radiation protection point of view,
301

they also offer the largest scope for implementing methods of dose reduction without loss of the information required. They differ from many other types of exposure in that they usually involve irradiation of limited regions of the body. They also differ in that the individuals who are irradiated are those who may expect to benefit directly from the particular treatment or examination.
2. A particularly difficult problem, however, arises when risk of medical irradiation is compared with the risk from other sources of man-made exposure or from natural background radiation. The organ doses received in diagnostic radiology may range over four orders of magnitude (from a few millirads to a few tens of rads) and will usually be given at high dose rates, compared with other man-made and natural sources. The various effects of radiation depend in a complex manner on the dose, the part of the body exposed, the dose rate and the length of time during which the total dose was received (described in Annexes H, I and J). Therefore, the detailed estimation of the risk from medical exposure is very complex; however, it is possible, by making simple assumptions about the relationship between dose and effect (as has been described in Annex A), to use the product of the number of persons in a subgroup and the dose received by a particular organ as a measure of the relative radiation detriment. The Committee has used this concept of collective dose for the estimation of the relative risk in diagnostic radiology.
3. However. since in radiotherapeutic practice, as compared with diagnostic practice, considerably higher doses are given to smaller groups of patients, and since the dose-effect relationship is likely to be different, the Committee has followed the practice of quoting, for radiotherapy the average organ dose together with the number of patients in the treated group. In this way it is hoped that there will be a clear indication that there may well be differences between the relative risk estimates from a given collective dose from diagnostic radiology and those from an equivalent numerical product for a radiotherapeutic practice. For this reason, it is important that the risks from the two practices should not be compounded or summed.
4. A vast amount of information on medical exposures was summarized in the 1958, 1962 and 1972 reports. Nevertheless, since the variation in practice and performance is large, not only from one country to another, but also between different hospitals and different radiologists, it is difficult to give a comprehen· sive presentation of the situation. Some of these variations arise from the differing needs of the individual patients. e.g., in the extent or duration of a particular examination; other variations occur because of the type of equipment available and the standard of the performance. The Committee has found no reason to compile data merely for recording purposes. but has tried to present information which might be useful for risk assessment, trend consideration and radiationprotection evaluation.
5. In the previous reports special emphasis was put on assessments of the annual genetically significant dose (GSD). The presentation of such data has encouraged
302
further studies, so that it is now relatively clear to what extent medical exposures contribute to the total genetic dose in both developing and developed countries. In the developing countries the level of the GSD will usually reflect the availability of x-ray facilities. In order to meet the medical need, such services may need to be expanded. This is likely to increase the genetic dose in these countries in spite of any recommendations for good practice that are aimed at decreasing GSD.
6. The emphasis on the GSD may have detracted attention from exposure of organs other than the gonads and may therefore have led to an under-estimation of the overall risk from certain types of examination that usually cause very low gonad doses. One-example is the chest examination, which involves irradiation of such radiosensitive tissues as lung, breast, marrow and sometimes also thyroid. The 1972 report, accordingly, gave more information on the dose in the active marrow. A number of groups of patients were also reported who had been identified as receiving high doses, and some had been shown to have a higher incidence of certain diseases than comparable but non-irradiated groups. In this report, further attention is given to identifying examinations in which particular organs may receive high doses. An attempt is also made to give a fuller picture of the patient's dose distribution, including data on doses in radiosensitive tissues such as bone marrow. thyroid, lung and breast.
7. In presenting data on dose levels in medical procedures, the Committee has three different purposes in mind. Firstly, it is of interest to know, for individuals, the doses to. particular organs from the various types of medical irradiation and, particularly, the extent of the variation of such doses for any one type of investigation, as a basis for any attempt to weigh the radiation risks against the expectation of benefit to the individual patient and for differential cost-benefit analyses of protective measures (100). Secondly, it may be of interest to know both the individual and the collective organ doses from various medical practices as part of the presentation of man's total radiation exposure. Thirdly, the identification of some highly exposed groups may be of interest in epidemiological studies; for this purpose, the collective dose would be of interest.
8. As has been stated in paragraph 1, medical exposure is unique in the sense that the benefit is usually limited to the individuals who are irradiated. Assessments of individual doses in relation to the expected benefit are therefore usually sufficient for justification and optimization purposes. Only in special cases, e.g., public health examinations (267). or medico-legal examinations, is there an expected benefit to society in addition to that measured by the benefit to the individual. In such cases there may also be a need to assess the collective dose from a given practice as a whole.
9. The information sought for any individual is the dose to those particular organs which are considered to be at risk (see Annex G). Only then would it be possible to make a complete assessment of the radiation risk from that irradiation. Such complete information has only rarely been presented, principally for a few

therapeutic procedures, e.g. a survey of the radiation treatment of ankylosing spondylitis (see Annex G). However, the general awareness of the problem has resulted in further studies.
I. BASIC INFORMATION
A. METHOD OF DATA PRESENTATION
10. Medical irradiation comprises irradiation for both diagnostic and therapeutic purposes, and these will be treated separately in chapters II and III of this Annex. In each chapter, individual dose per unit procedure and the collective dose to various organs from different diagnostic procedures will be reported and discussed in separate sections. The individual dose will be influenced by the differences in techniques. In addition, the contributions to the collective dose will be proportional to the number of individual irradiations at a given dose level.
B. INDNIDUAL DOSE PER UNIT PROCEDURE
11. The determination of the dose to a particular organ for a given examination, investigation or treatment may be direct: a dosimeter can be placed at representative sites in the organ of interest. More frequently, however, the method of dose determination has to be indirect: the organ may be inaccessible and measurements must be made elsewhere; calculations or further measurements are needed to determine the organ dose.
12. Measurements are normally made on the skin surface, although for the estimation of ovary dose measurements have been made in the vagina and rectum. The skin measurements combined with measurements on man-like phantoms have been used to estimate the dose to the bone marrow. The detenrtination of the radiation doses to other organs has principally been undertaken by Monte Carlo methods (171) or by using skin measurements in conjunction with phantom measurements, percentage-depth dose data or isodose curves (239). For organs outside the main beam, scatter function curves are used (47, 86, Ill, 137, 222). Alternatively, in the case of the administration of radiopharmaceuticals. calculations based on the distribution of the radiopharmaceuticals and on the physical properties of the nuclides need to be undertaken (140). Monte Carlo type calculations have also been made to facilitate such estimates (212). Considerable errors may arise in the determination of dose, but in general the direct method of measurement is expected to be subject to the least error.
13. Studies involving measurements on man-like phantoms require that such phantoms be sufficiently like Reference Man or normal patients in relevant characteristics to keep errors within reasonable limits (147). Reports such as that of the ICRP on Reference Man (101) enable anthropometric considerations as well as physiological variations to be taken into account in the choice of models or design of phantoms.
14. The difficulties in assessing the true organ doses will introduce systematic errors but will also to some extent increase the apparent spread of doses in each type of irradiation. For example, the gonad dose will vary dependent on the position of the stomach during radiological investigations of the gastro-intestinal tract (127). The doses actually received by individual patients, however, will also differ. depending upon the clinical requirements, the standards of the equipment and the skill of the operators. It has been claimed that spread of individual organ doses in each type of examination with x rays may fit a log-normal distribution (120). However, it has also been shown that. with some limitations measured doses in x-ray examinations will fit a normal distribution (17). This will be discussed in more detail in chapter II. It seems reasonable to assume, however, that there is no a priori reason to expect a log-normal distribution of patient doses. Since each type of medical irradiation has a special objective (e.g., to destroy a tumour or produce an x-ray image) and is subject to optimization, it could rather be expected that the resulting doses would follow a normal distribution around the optimum value. Even this assumption, however, is usually an over-simplification.
C. COLLECTNE DOSE PER TYPE OF PROCEDURE
1. Purpose of assessment
15. Ideally. the detriment from a unit procedure (e.g., a treatment course or a particular type of diagnostic examination) should be assessed by the weighted sum of all significant organ and tissue doses, but in practice the necessary weighting factors are not known. Lacking this information, it is still of interest to know the various organ doses, e.g., for relative risk assessments and optimization evaluations on the basis of various assumed risk factors.
16. As indicated in paragraphs 7 and 8, there is usually no need to assess· collective doses from various medical practices for the purpose of justification and optimization considerations; instead, the individual doses may be used for the same purpose, because the risks and benefits relate to the same individuals. However, certain protection measures are of an administrative nature and may involve considerations of a practice as a whole. For example, in planning education and information, it may be of value to know where efforts might yield the best results. The doses to patients in dental examinations requiring two or three pictures are in general low and would not justify much attention in the individual case, but because of the very large number of examinations improved education might result in a larger reduction in the collective dose with higher individual doses but fewer individuals exposed. For this reason, national authorities may wish to have information not only on high individual doses but also on practices causing high collective doses. Also, the total collective dose from all medical practices would be of interest in the assessment of man's overall radiation exposure.
17. There is also an obvious interest in knowing the collective dose to various organs in those irradiated population groups which could be subject to epidemiological studies. The requirements are discussed in paragraph 31.
303
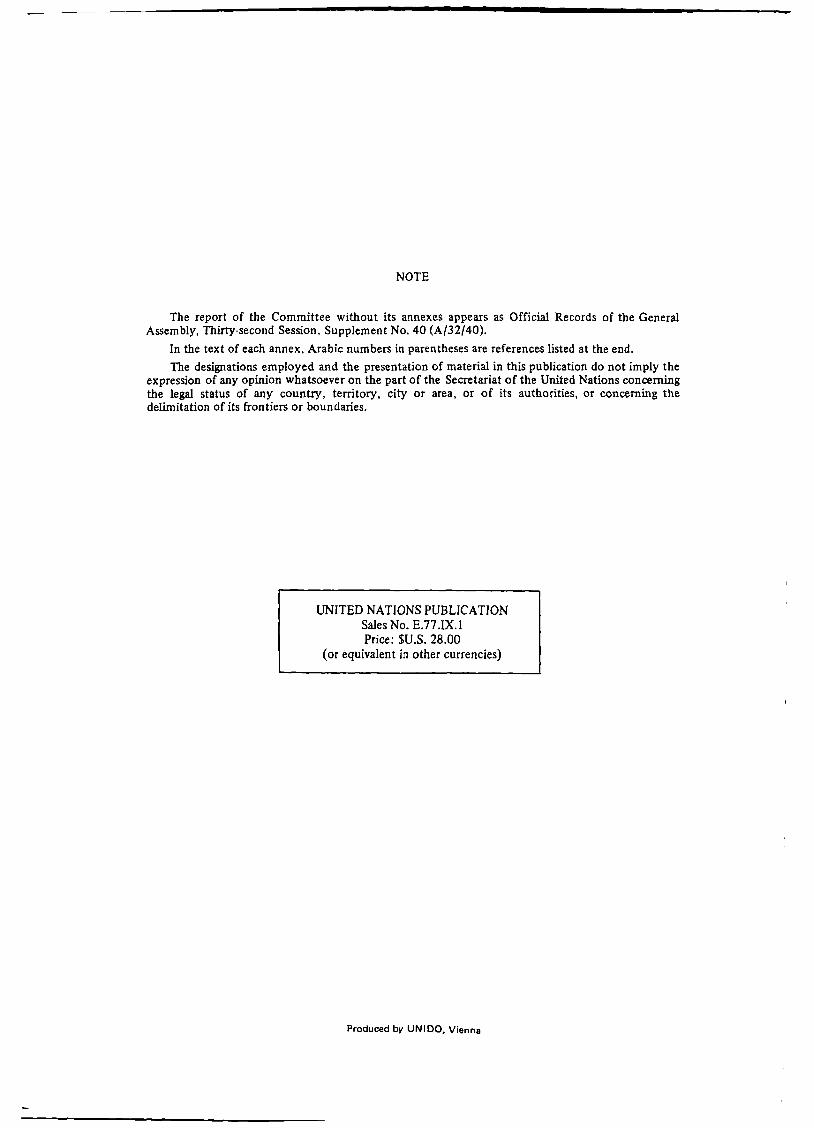
2. Limitations in the use of the collective dose as a measure of detriment from medical exposures
18. It has been shown in Annex A that for a given radiation the collective dose may be used as a relative measure of detriment if doses are so low that effects are proportional to dose and independent of dose rate. Doses are considered in this report to be sufficiently small in most diagnostic examinations so that the collective dose concept is applicable, and the relatively high dose rates utilized in these examinations are of little significance as far as the validity of the collective dose concept is concerned. However, this concept should not be extended to the case of therapeutic exposures where there is a risk of acute effects and where cell killing may reduce the risk of late- deleterious effects. A further limitation arises from the fact that for some late effects of radiation it is not yet known which particular cell or tissue is at risk and therefore what tissue dose should be calculated.
3. Weighting for relevance
19. Neither collective doses nor per caput doses will reflect the detriment in a population if a substantial fraction of the per caput dose is contributed by the exposure of individuals who, for biological reasons, are not at risk. This would be the case with regard to genetic risks and carcinogenic effects when doses are received by individuals who would not be expected to be able to make the possible biological effect manifest because they are not expected to have children or to live long enough.
20. In such cases weighting procedures are called for. Weighting for the individual's child expectancy is part of the calculation of the GSD. A weighting for life expectancy could properly be an element in the derivation of a weighted per caput dose for the production of a particular somatic effect if sufficient data were available (see paragraph 86).
4. Assessment of collective dose
21. As was shown in Annex A, the radiation detriment from a given source k can be assessed, at least on a relative basis, by means of collective dose Sk (measured in man rad), which can be derived from the weighted product of the individual dose and the number of individuals:
sk = ioDNv(D)dD (I) where Nv(D)dD is the number of individuals receiving a dose in a specified organ or tissue in the range D to D + dD. The collective dose can apply to the world population, to a subpopulation or to one person. The defined group may comprise individuals who live at different times or individuals living in a given year, depending upon the purpose of the assessment.
22. In the context of medical irradiation, the collective dose to a certain organ, p, in the patients receiving a given type of examination or treatment, x, can be formulated as
Sp,x = K "f,;Dp,x,i (2) where K = I man since each group i is composed of one person.
304
23. In practice it is not often possible to ascertain the dose Dp,x,i for each individual in the total number of patients involved Nx. As data can usually be obtained only for a sample nx of individuals within the relevant patient population, some simplifying approximations to the summation over all individuals have to be made. If sampling is unbiased and can be considered representative, then the collective dose to the organ p from procedure x can be estimated by
Sp,x = (Nx/nx/ Sp,x,nx (3) where SP x n is the collective dose in the sample.
• • X
24. A further approximation is required when information about doses delivered by a given procedure is only available for a different group of patients who have undergone a similar procedure but do not form part of the patient population under study. The collective dose can be estimated by
(4)
where Dl,x is the average individual dose in the outside group for which information is available.
25. The approximation given by equation 4 is obviously not as reliable as that of equation 3, because there may be unspecified factors in the outside group that may be different in the patient population under study. This approximation would be used, for example, when the relevant average dose is available in one country and an estimate of the collective dose is required for a patient population in another country where no direct information on the individual doses is available.
26. An alternative way of presenting info_!lllation on population exposures is the per caput dose Dp.x, which is simply the collective dose divided by the total population size N:
(5)
5. Accuracy of assessments
27. The accuracy of any estimate of collective dose obviously depends on the accuracy of the determination of the two main factors, i.e., the individual dose and the number of irradiated individuals. The accuracy would depend on which of the above equations is used for the calculations.
28. In the case of studies which use equation 3, i.e., when measurement data are obtained from only a sample of the patient population, it is important that such a sample group should be large enough (37). In practice it has been found that, to obtain a reliable distribution of the doses received in a particular medical practice, it is necessary to have at least 200-300 measurements (23). Obviously, it is also essential that the individuals in the sample should be selected so as to be representative of the patient population being studied.
29. In some collective dose surveys, the number of exposed individuals will be obvious, e.g., when investigating a group of individuals who have all had a particular investigation or treatment during a defined time at a limited number of centres, such as the
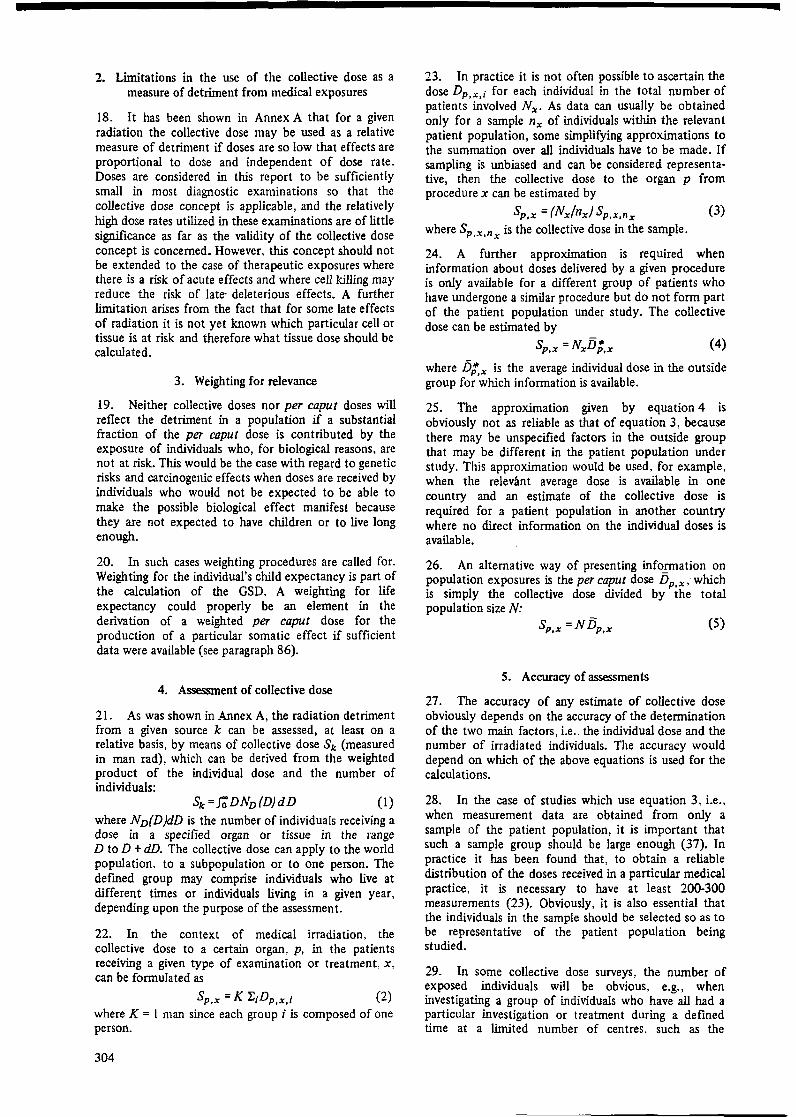
radium-224 patients surveyed in reference 215. However, more generally, for an estimate of the collective dose to individuals who undergo x-ray examinations in current practice, e.g., in the .examination of the stomach in Japan, it is necessary to obtain data on the frequency of these examinations in the country concerned. This requires a sample to be taken over a period of time from a selected sample of the hospitals in the country. Such frequency surveys have fanned part of most of the studies undertaken for the estimation of the GSD, and samples of frequency data have usually covered about 1-4 per cent of the year's radiological examinations. Some surveys have shown that fluctuations in the frequency of particular examinations throughout the year also need to be taken into account (36).
30. In the determination of the collective dose, the least error is involved if the organ doses for all the irradiated individuals are known. In this case the overall error is in the determination of the doses to the particular organ concerned. When direct measurements of the skin dose or the male gonad dose are being made during x-ray examinations, modern techniques should enable the measurement errors to be of the order of 5 per cent. In other cases the' errors hi the measurement or estimation of the organ dose may be considerably greater. The bigger the contribution from a particular practice to the total collective dose. the more effort should be applied to improve the pr~cision of the dose determination. In those surveys in which only a sample of the individuals are measured, there will be, in addition to the measurement error, sampling errors for both the measurement sample selection and the frequency sample used.
D. GROUPS OF POTENTIAL EPIDEMIOLOGICAL INTEREST
31. When a group is being studied to determine the incidence of a deleterious effect caused by radiation, it is essential that an estimate be made of the incidence in a control group. The appropriate size of an exposed population for this.purpose has been studied recently by Goss (65). Table 1 gives the size of collective dose needed to have a 95% chance of detecting an increased risk at the 5% level of significance. It is obvious that at low doses very large groups of patients are required, but at therapeutic dose levels it is possible to observe the required number of patients with relative ease.
TABLE 1. SIZE OF COLLECTIVE DOSE NEEDED TO GIV'E A 95% PROBABILITY OF DETECTING AN IN· CREASED RISK
Collective Observation Age group and dose period investigated risk (10 3 man rad) (y)
Children Leukaemia 310 10 Thyroid cancer (incidence) 700 10 Other cancers 310 10
Adults Leukaemia 100 20 Breast cancer (females) 420a 20 Lung cancer 4 OOO 20 Other cancers 12 OOO 20
Source: Reference 65. a Corrected by the Committee.
II. DIAGNOSTIC USES OF RADIATION
A. X-RAY DIAGNOSTIC RADIOLOGY
1. Trends in frequency and technique
32. In most countries the distribution of x-ray apparatus is non-uniform and the number of installed machines increases with population density. A study of this in Japan (115) showed a good correlation between population and number of units. The study also showed that in some areas non-trained or unlicensed staff were used to take up to 60 per cent of the radiographs made in practitioners' offices.
33. In the 1972 report of the Committee, the overall rate of increase in the number of radiological examinations reported for the 1960s by a number of countries with technically advanced medical services was reported to be between 2 and 6 per cent per year. When corrected for the increased population the growth was estimated to be about 3 per cent per year. However a more recent report from the Netherlands (175) for the sam~ period has shown an annual growth rate of 8 .5 per cent. Reports quoted by Puijlaert (176) indicate that for a number of countries the annual growth rate per caput for the late 1960s and early 1970s was between 5 and 15 per cent.
34. Further analysis of surveys made in the United States of America in 1964 and 1970 (27, 250, 251) indicates a number of interesting trends in frequency, technique and dose (table 2). As can be seen from the table, the trend pattern is rather complex.
TABLE 2. CHANGES IN DATA PERTAINING TO DIAGNOSTIC X-RAY PROCEDURES IN A SIX-YEAR PERIOD
United States of America, 1964 and 1970
1964 1970
Number of persons having x-ray examinations 108 106 130 1Q6
Number of x-ray procedures 173 106 212 10•
Number of films exposed 506 10• 661 10• Average number of films
per examination 2.2 2.4 Fraction of thoracic
examinations with two or more films 31 % 47%
Mean ratio of beam area to film area (in hospitals) 1.9 1.2
Estimated mean skin exposures for posterior-anterior and anterior-posterior views of the abdomen 480mR 620 mR
Mean skin exposure per dental film 1140 mR 910 mR
Sources: References 27, 250, 251.
Increasea (percent)
+ 20
+ 22 + 30
+ 9
+ 52
-37
+ 29b
-2oc
0 The population of the United States increased by 7 per cent over the six.year period.
bThis' mcrease may be due to the increased frequency of high-exposure examinations, the increase in the use of grids, and the use of higher tube potentials and currents without a corresponding increase in filtration.
cThis decrease is due to the increased use of faster film.
305

TABLE 3. ESTIMATED ANNUAL NUMBER AND DISTRIBUTION OF MEDICAL X-RAY PROCEDURES BY TYPE OF FACILITY AND SUPERVISION
United States, 1964 and 1970
Number of Number of medical procedures supervised x-ray procedures Per cent of medical by radiologists
Per cent of procedures supervised by radiologists (thousands) x-ray procedures (thousa11ds)
Type of facility 1964 1970 1964
All types 118 919 144 355 100,0
Hospital 68 490 92 489 57.6
Private office 24 195 27 136 20.3 Radiologist 5 335 4 223 4.5 Other 18 860 22 913 15.8
Private group 7 861 9 903 6.6
Health agencies and others 18 374 14 826 15.5
Note: Table reproduced from reference 2 S 1.
35. The estimated number and distribution of diagnostic x-ray procedures in the United States in 1964 and in 1970 (251 ), by type of facility and supervision, are shown in table 3. There was a 6.5 per cent increase in the use of hospital radiological facilities. and an increase from 92.l per cent to 98.8 per cent in the proportion of films taken in hospitals under the supervision of radiologists.
36. An analysis of the trend in the number of medical x-ray visits by age group for the years 1960, 1964 and 1970 is shown in table 4 (250). The major increases occurred in the age groups <IS, ~5 and, particularly, >65 years. According to this information, the fractional number of patients under 30 decreased from 223 per cent in 1960 to 20.5 per cent in 1970.
37. The United States surveys (255) showed no significant change in the annual GSD between 1964 and 1970, in spite of the increased number of examinations and the indication of higher abdominal doses. (See paragraph 107 .) An analysis of the increase in frequency of abdomen and thoracic examinations shows, however,
Sex
Male Female
Total
Male Female
Total
0-5
Male and female 1 261
1970
100.0
64.l
18.8 2.9
15.9
6.9
10.3
TABLE 4.
1964 1970
72 346 100 530
63 080 91 356
5 335 4 223
3 931 4 951
1964
60.8
92.1
100.0
50.0
1970
69.6
98.8
100.0
50.0
ANAL YSlS OF THE INCREASING FREQUENCY OF MEDICAL X·RA Y VISITS BY AGE AND SEX
United States, 1960-1970 (Visits per 100 persons per year)
April-July 1960- Apn1.June September
Category June 1961 1964 1970
Age (y)
< 15 16.4 20.9 24.4 15-29 57.1 55.2 55.4 30-44 63.0 61.1 65.9
;>45 66.5 69.8 81.5 45-64 71.2 73.6 82.3
;;,, 65 55.4 61.5 79.9
Sex Male 49.7 50.6 56.6 Female 46.2 49.0 55.3
Overall 47.9 49.8 55.9
Source: Reference 2 SO.
that these examinations increased principally in the age groups above 30, which might be one explanation for the lack of significant change in GSD. Additional patient protection was used in 10 per cent and 8.5 per cent of
TABLE 6. NUMBER OF X-RAY EXAMINATIONS IN MASS
Breakdown ,10• J
Age ('Y)
(a) Mass chest
.;;.10 11-15 16-18 19-24 25-29 30-34 35.39
655 634 2 278 3 340 2 426 2 053 1 830 622 606 2 296 2 201 1 849 1565 1432
1 277 1 240 4 574 5 541 4 275 3 618 3 262
(b) Mass stomach
<; 19 20-24 25,29 30-34 35.39
4.7 22.2 70.9 136.1 310.1 2.3 11.1 30.1 94.9 216.5
7.0 33.3 101.0 231.0 526.6
(c) Dental
6-10 11-14 15-19 2()..24 25-29 30-34 35.39
2 495 2 595 5 061 9 731 11 360 11 510 12 762
Sources: Chest screening, reference 84; stomach screening, 83; dental radiography, 138.
306
--TABLE 5. ANALYSIS OF THE INCREASING FREQUENCY
OF DIAGNOSTIC X·RAY EXAMINATIONS BY TYPE
Japan, 1958-1975
Number of examinations Type of examination per 1 OOO persons Ratio
Head, cervical spine Shoulder Chest Barium meal Abdomen Barium enema Dorsal spine Lumbar or sacral spine Urography, cystography Hip and joint Lower leg Tomography Pelvimetry, obstetrical
(abdomen) Other
Total
a. Radiography
1959 1969 (A) (B)
8.8 58 22 33
144 277 19.4 86
1.5 14 5.9 6.2 3.3 7.0 7.1 37 5.1 7.7 8.5 14
15.8 44 5.0
1.6 2.8 13.9 54
259 641
1974 (C)
60 48
289 108
23 6.5 5.0
41 9.6
19 56
7.3
1.9 63
729
b. Dental radiography
Dental x-ray examinations
1958 1974 (AJ (CJ
13 833
c. Photofluorography
1963 1968 1973 1975 (AJ (BJ (CJ (DJ B/A
B/A
6.6 1.5 1.92 4.4 9.3 1.05 2.1 5.2 1.51 1.65 2.8
1.75 3.9
2.5
C/A
64
C/B
C/B
1.03 1.45 1.02 1.25 1.64 1.04 0.71 1.11 1.24 1.35 1.27 1.46
0.68 1.16
1.14
D/B
Chest 434 641 486 313 1.47 0.76 0.49 Barium meal 18 31 40 1.72 2.22
Sources: References 74, 79,146,181.
the diagnostic x-ray examinations in 1964 and 1970, respectively, whereas in dental radiography the use of additional patient protection increased from 18.8 per cent to 27 .2 per cent (251 ).
SCREENING AND DENTAL RADIOGRAPHY IN JAPAN, 1974 AND 1975
by age ana sex
screening, 1975
40-44 45-49 50-54 55.59 ;;. 60
1 762 1 559 1109 469 537 1407 1 273 1 094 345 438
3 169 2 832 2 203 814 975
screening, 1975
40-44 45-49 50-54 55.59 60-69 ;;. 70
492.6 496.8 369.2 224.0 205.6 51.8 331.3 331.3 279.1 193.2 207.5 39.7
823.9 828.1 648.3 417.2 413.1 91.5
radiography, 1974
40-49 50-59 .. ;;. 60
16 668 10 055 6 423
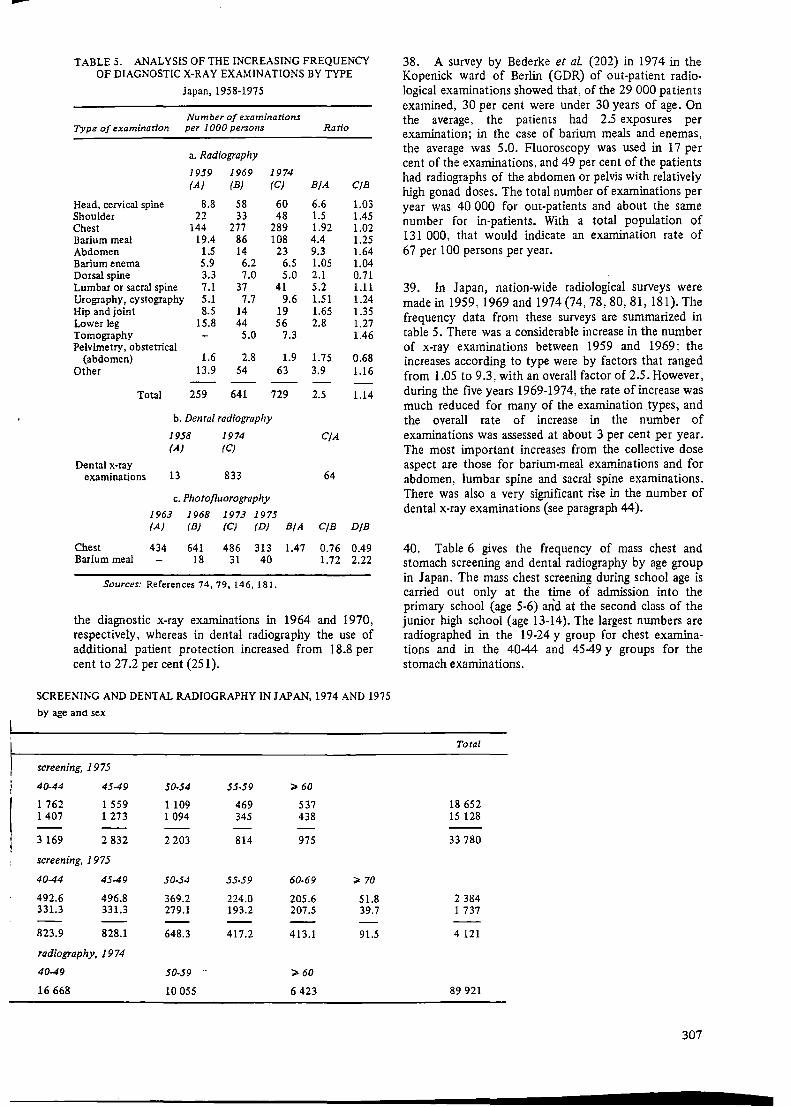
38. A survey by Bederke et al (202) in 1974 in the Kopenick ward of Berlin (GDR) of out-patient radio· logical examinations showed that. of the 29 OOO patients examined, 30 per cent were under 30 years of age. On the average, the patients had 2.5 exposures per examination; in the case of barium meals and enemas, the average was 5.0. Fluoroscopy was used in 17 per cent of the examinations, and 49 per cent of the patients had radiographs of the abdomen or pelvis with relatively high gonad doses. The total number of examinations per year was 40 OOO for out-patients and about the same number for in-patients. With a total population of 131 OOO, that would indicate an examination rate of 67 per 100 persons per year.
39. In Ja pan, nation-wide radiological surveys were made in 1959, 1969 and 1974 (74, 78, 80, 81, 181). The frequency data from these surveys are summarized in table 5. There was a considerable increase in the number of x-ray examinations between 1959 and 1969; the increases according to type were by factors that ranged from 1.05 to 9 .3. with an overall factor of 2.5. However, during the five years 1969-1974, the rate of increase was much reduced for many of the examination types, and the overall rate of increase in the number of examinations was assessed at about 3 per cent per year. The most important increases from the collective dose aspect are those for barium-meal examinations and for abdomen, lumbar spine and sacral spine examinations. There was also a very significant rise in the number of dental x-ray examinations (see paragraph 44).
40. Table 6 gives the frequency of mass chest and stomach screening and dental radiography by age group in Japan. The mass chest screening during school age is carried out only at the time of admission into the primary school (age 5-6) and at the second class of the junior high school (age 13-14). The largest numbers are radiographed in the 19-24 y group for chest examinations and in the 40-44 and 4549 y groups for the stomach examinations.
Total
18 652 15 128
33 780
2 384 1 737
4 121
89 921
307

41. A comparison between the 1974 Swedish survey by Bengtsson et al (17) and·the 1955 survey by Larsson (128) shows that x-ray examinations (excluding dental) increased by 51 per cent between ·1955 and 1974. During this period the Swedish population increased by 11 per cent, which means that the net increase was 36 per cent, or less than 2 per cent per year. The disappearance of tuberculosis as a significant problem is reflected in decreased frequencies of mass photofluoroscopy, but this trend may not be representative of other countries. There is a remarkable increase in the number of dental exposures, almost by a factor of five. The frequency data are summarized in table 7.
TABLE 7. ANALYSIS OF THE INCREASING FREQUENCY OF DIAGNOSTIC X-RAY EXAMINATIONS BY TYPE
Sweden, 1955 and 1974
Type of examination
Hip and femur Pelvis Pelvimetry Lumbosacral region Urography, retrograde
pyelography Urethrocystography Stomach, small intestine Colon Abdomen Obstetrical abdomen Hysterosalpingography Cholecystography,
cholangiography Dorsal spine Lung, ribs, heart
Number of examinations per 1000 persona
Ratio 1955 1974 1974/1955 (Population (Population (Population 7.3 106
) 8.1 106) ratio 1.11)
9.6 18.9 2.0 8.2 15.4 1.9 0.5 1.3 2.6
16.1 25.0 1.6
9.1 23.9 2.6 1.2 2.7 2.3
30.0 33.0 1.1 9.0 16.0 1.8 5.0 12.9 2.6 0.6 1.4 2.3 1.2 0.8 0.7
12.0 18.4 1.5 5.8 13.3 2.3
79.4 161.6 2.0 Lung (photofluorography) 139 110 0.8 DenW (single exposures) 307 1500 4.9 Other 103 195 1.9
Total (excluding denW) 430 650 1.51
Sources: References I 7, 12 8.
42. An interesting study reported by Berry and Oliver (20) shows that in the United Kingdom of Great Britain and Northern Ireland, 18 per cent of the x-rayed patients had spoilt films, principally because of exposure or positioning faults.
43. The annual number of dental exposures per 1000 of population in Sweden increased from about 300 in 1955 to 570 in 1969 (151), i.e., by about 6 per cent per year. The subsequent increase to 1500 in 1974 (table 7) corresponds to about 20 per cent per year over that last five-year period. Of the 13 million dental films exposed in Sweden in 1974, about 3 million were exposed in bite-wing examinations of school children. Of the remaining 10 million films, about 50 per cent have been estimated to have been used in bite-wing examinations. The increasing number of bite-wing examinations is partly explained by deliberate efforts to make full-mouth examinations irrespective of whether the dentist knows beforehand that the film will be needed.
308
This practice is defended on the basis of claimed earlier detection of small cavities. Such dental examinations are therefore health investigations rather than diagnostic examinations. The yield has been estimated to be about 10 per cent in those examinations for which there were no clinical indications, but this number is uncertain. No estimate has been made on how many of the bite-wing exposures were made without clinical indication.
44. Similar observations have been made in other countries. For example, in the 1970 United States survey (251) it was reported that there were an estimated 68 million dental x-ray visits, corresponding to an average of 340 x-ray examinations per 1 OOO of population. As each examination consisted of, on the average, 4.1 films, the to.ta! numbef was approximately 1400 films per 1000 of population, in line with the practice in Sweden. The annual number of dental exposures per 1000 of the population in Japan increased from 13 in 1958 to 855 in 1974 (146). The age distribution of the population in Japan having dental examinations during 1974 is given in table 6. The study (138) also includes information on the numbers in each age group for the different types of intra-oral examination.
45. In contrast, it has been estimated that 4 million x-ray films were used in the United Kingdom in 1973 (52), an average of only 73 per 1000 of population. This compares with an estimated 2 million films used in 1957.
46. Interesting sociological variations in the United States in the frequency of x-ray visits for dental examinations are shown by the fact that the rate of x-ray visits per 100 of population were 11.2, 29.2 and 50.3 for those people having under 9, 9-12 and 13 or more years of education, respectively (250). This finding agrees with the findings of the 1964 survey for dental examinations, but not with those shown by the analysis of x-ray visits for medical examinations.
2. Individual dose per unit procedure
(a) Accuracy of dose estimates and reasons for variation
47. Previous reports of the Committee have shown that individual organ doses in each type of examination vary considerably from one clinic or individual radiologist to another. Some of this variation arises from differences in the actual extent and needs of the examination itself and some from differences in the selection of field sizes and localization of the beam. However, there is also a large variation in the skin exposures, both because of differences in the technical operation of the equipment (89), including the use of grids, and in the dimensions of the patients. Additionally, the sensitivity of the recording medium influences the results.
48. The use of equipment that measures the product of the exposure and area at the beam collimator is sometimes used as an indication of the total energy emerging from the x-ray tube towards the patient. These
-per cent
99.9
99
z 0
90 ;:: :,
"' ii: .. "' 0
> 50 ;:: <( .J :, JO ::;; :,
20 <J
10
5
0.1
10 100 1 OOO
GONADAL DOSE
10000 100000 mr•d
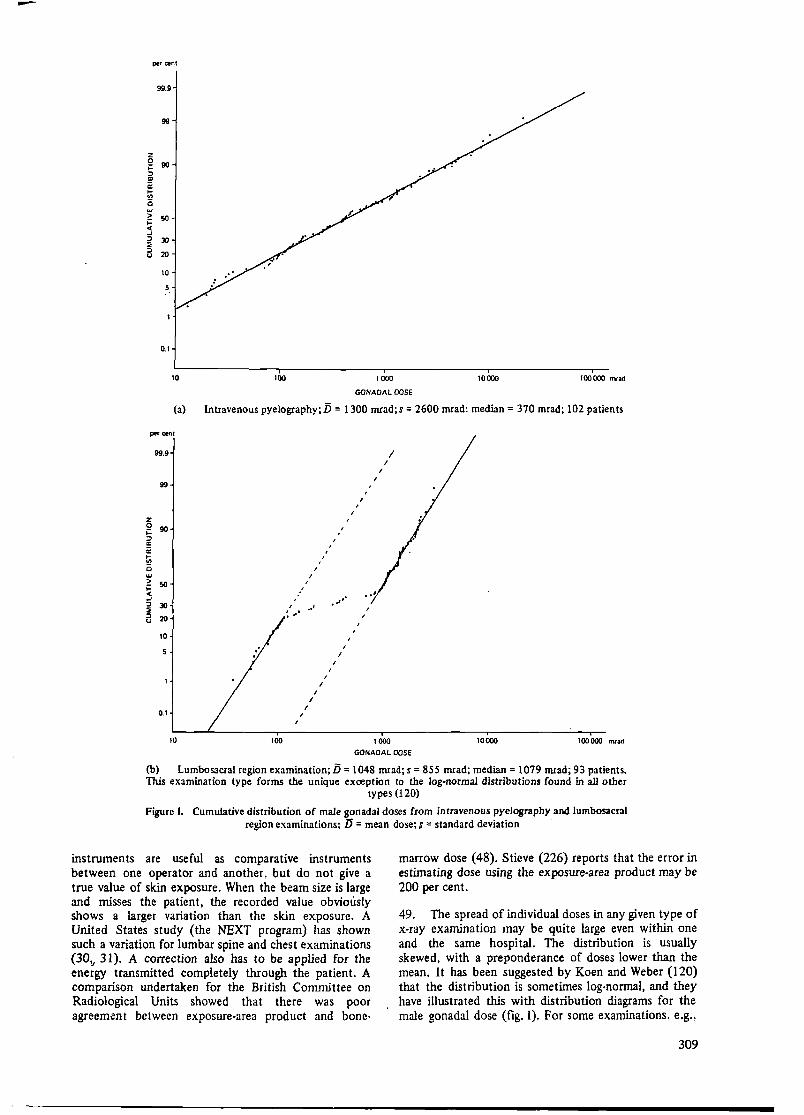
(a) Intravenous pyelography;D = 1300 mrad; s = 2600 mrad; median= 370 mrad; 102 patients
99.9
99
z 0 90 ;:: :,
"' ii: .. "' 0 w > 50 ;:: <( .J :, JO ~ :,
20 <J
10
0.1
I I
I I
I
I ' ,
.. ...
I
I
I
' I
10 100 1 OOO
GONADAL DOSE
10000 100000 mrad
(b) Lumbosacral region examination; 15 = 1048 mrad; s = 855 mrad; median= 1079 mrad; 93 patients. This examination type forms the unique exception to the log-normal distnoutions found in all other
types (120)
Figure I. Cumulative distribution of male gonadal doses from intravenous pyelography and lumbosacral region examinations; D = mean dose; s = standard deviation
instruments are useful as comparative instruments between one operator and another, but do not give a true value of skin exposure. When the beam size is large and misses the patient, the recorded value obviously shows a larger variation than the skin exposure. A United States study (the NEXT program) has shown such a variation for lumbar spine and chest examinations (30,., 31 ). A correction also has to be applied for the energy transmitted completely through the patient. A comparison undertaken for the British Committee on Radiological Units showed that there was poor agreement between exposure-area product and bone-
marrow dose ( 48). Stieve (226) reports that the error in estimating dose using the exposure-area product may be 200 per cent.
49. The spread of individual doses in any given type of x-ray examination may be quite large even within one and the same hospital. The distribution is usually skewed, with a preponderance of doses lower than the mean. It has been suggested by Koen and Weber (120) that the distribution is sometimes log-normal, and they have illustrated this with distribution diagrams for the male gonadal dose (fig. I). For some examinations, e.g.,
309
of the lumbosacral region in male patients, the gonadal dose will increase by an order of magnitude when the direct beam falls on the gonads. This will be equivalent to two distinct groups of patients and hence will, when the data are plotted on probability paper, provide two distinctive but overlapping populations. Subsequently, more detailed information from the same survey ( 121)
per cent
99
90
>-u 70 z w :::> 0 w a: u. w 50 > i= ~ :::> ~ 30 :::> u
10
0 10 20 30 40 50
showed that various distributions were obtained when all the doses for a particular examination from all the hospitals surveyed were included.
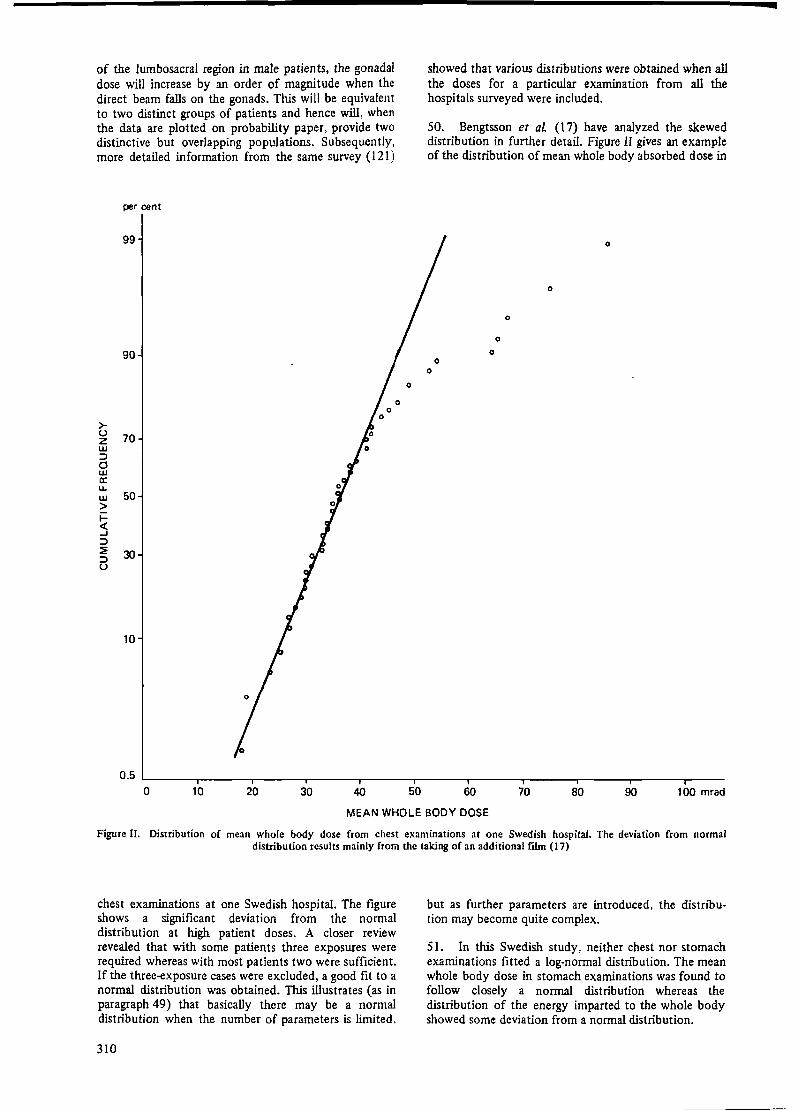
50. Bengtsson et al (17) have analyzed the skewed distribution in further detail. Figure II gives an example of the distribution of mean whole body absorbed dose in
0
. 0
0
0
0
60 70 80 90 100 mrad
MEAN WHOLE BODY DOSE
Figure II. Distribution of mean whole body dose from chest examinations at one Swedish hospital. The deviation from normal distribution results mainly from the taking of an additional film (17)
chest examinations at one Swedish hospital. The figure shows a significant deviation from the normal distribution at high patient doses. A closer review revealed that with some patients three exposures were required whereas with most patients two were sufficient. If the three-exposure cases were excluded, a good fit to a normal distribution was obtained. This illustrates (as in paragraph 49) that basically there may be a normal distribution when the number of parameters is limited,
310
but· as further parameters are introduced, the distribution may become quite complex.
51. In this Swedish study, neither chest nor stomach examinations fitted a log-normal distribution. The mean whole body dose in stomach examinations was found to follow closely a normal distribution whereas the distribution of the energy imparted to the whole body showed some deviation from a normal distribution.
--(b) Doses to various organs
52. There is an increasing number of publications on measurements carried out during radiological pro· cedures. Even though they may reflect particular conditions in the clinics and hospitals concerned, they are nevertheless useful in illustrating the levels of radiation dose to patients. Typical publications on patient dose are referred to in each of the following sections and in references 7, 58, 71, 116, 207 and 234. A number of reports referring to technical advances are referred to, such as those on the improved sensitivity of image recording (10, 11, 12, 55, 196). It is particularly useful if patient studies are directed at measuring the total absorbed dose ·to each of the organs of interest that is accumulated from all radiological studies during a particular patient's period of ill health. Examples of this are given by Trott et al (238).
(i) Incident skin dose
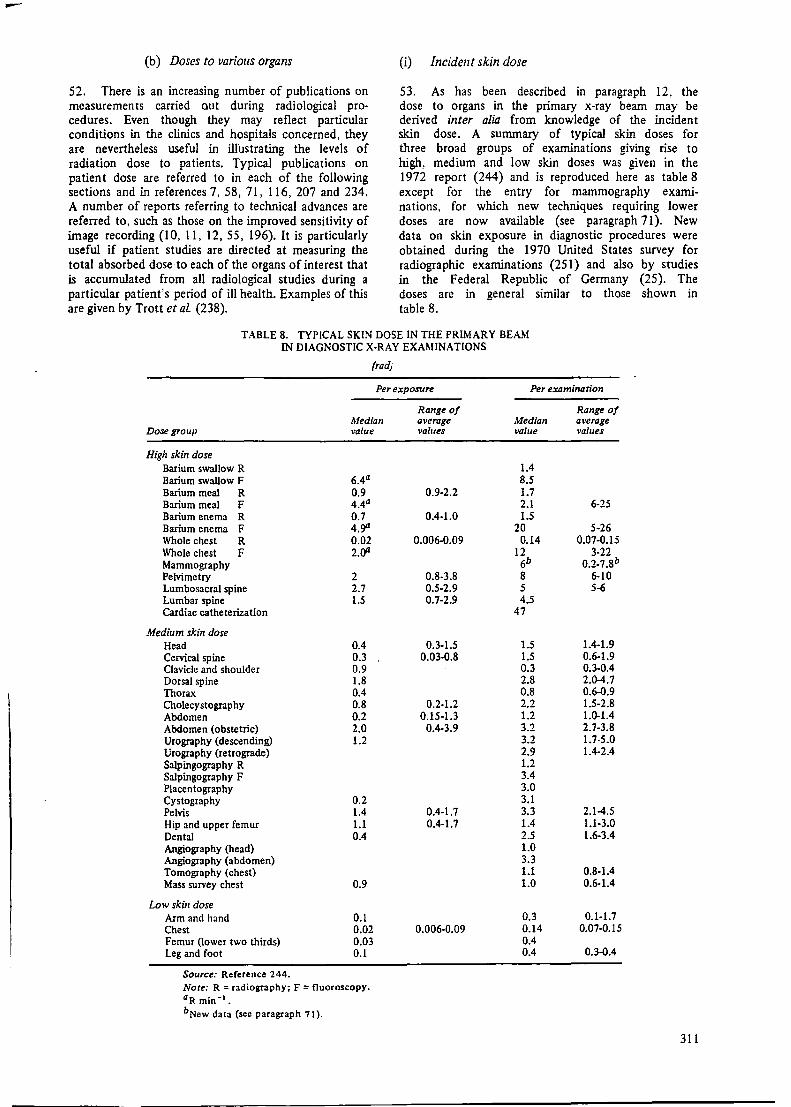
53. As has been described in paragraph 12, the dose to organs in the primary x-ray beam may be derived inter alia from knowledge of the incident skin dose. A summary of typical skin doses for three broad groups of examinations giving rise to high, medium and low skin doses was given in the 1972 report (244) and is reproduced here as table 8 except for the entry for mammography examinations, for which new techniques requiring lower doses are now available (see paragraph 71). New data on skin exposure in diagnostic procedures were obtained during the 1970 United States survey for radiographic examinations (251) and also by studies in the Federal Republic of Germany (25). The doses are in general similar to those shown in table 8.
TABLE 8. TYPICAL SKIN DOSE IN THE PRIMARY BEAM IN DIAGNOSTIC X-RAY EXAMINATIONS
(rad)
Per exposure Per examination
Range of Range of Median average Median average
Dose group value val1Jes val1Je values
High skin dose Barium swallow R 1.4 Barium swallow F 6.4a 8.5 Barium meal R 0.9 0.9-2.2 1.7 Barium meal F 4.4a 2.1 6-25 Barium enema R 0.7 0.4-1.0 1.5 Barium enema F 4,ga 20 5-26 Whole chest R 0.02 0.006-0.09 0.14 0.07.Q.15 Whole chest F 2.oa 12 3-22 Mammography 6b o.2.1.8b Pelvimetry 2 0.8-3.8 8 6-10 Lumbosacral spine 2.7 0.5-2.9 5 5-6 Lumbar spine 1.5 0.7-2.9 4.5 Cardiac catheterization 47
Medium skin dose Head 0.4 0.3-1.5 1.5 1.4-1.9 Cervical spine 0.3 0.03.Q.8 1.5 0.6-1.9 Clavicle and shoulder 0.9 0.3 0.3-0.4 Dorsal spine 1.8 2.8 2.0-4.7 Thorax 0.4 0.8 0.6.Q.9 Cholecystography 0.8 0.2-1.2 2.2 1.5-2.8 Abdomen 0.2 0.15·1.3 1.2 1.0-1.4 Abdomen (obstetric) 2.0 0.4-3.9 3.2 2.7-3.8 Urography (descending) 1.2 3.2 1.7-5.0 Urography (retrograde) 2.9 1.4-2.4 Salpingography R 1.2 Salpingography F 3.4 Placentography 3.0 Cystography 0.2 3.1 Pelvis 1.4 0.4-1.7 3.3 2.1-4.S Hip and upper femur 1.1 0.4-1.7 1.4 1.1-3.0 Dental 0.4 2.5 1.6-3.4 Angiography (head) 1.0 Angiography (abdomen) 3.3 Tomography (chest) 1.1 0.8-1.4 Mass survey chest 0.9 1.0 0.6-1.4
Low skin dose Arm and hand 0.1 0.3 0.1-1.7 Chest 0.02 0.006-0.09 0.14 O.Q7·0.15 Femur (lower two thirds) 0.03 0.4 Leg and foot 0.1 0.4 0.3.Q.4
Source: Reference 244. Note: R = radiography; F = fluoroscopy. aR min·•. bNew data (see paragraph 71).
311

Final line of scan of x•rav bum I
Figure III. lsodose curves in a water phantom for single complete scan (165)
54. The new technique of computerized tomography (CT) scanning utilizes a narrow beam of x rays either in a pencil or a fan shape. The skin dose to the patient per complete scan is increased as the matrix element size of the display is decreased. Typical skin doses have been measured by Perry and Bridges (165) and are shown in figure III for a single complete scan of the head. The increase in dose for subsequent consecutive scans will depend on the amount of overlap. The width of the beam is about 1 cm and the overlap may be between one third and one half of the width of the beam. The radiation dose will therefore be of the same order as in comparable x-ray examinations of the head or the trunk.
55. High skin doses have been reported for such types of examinations as cardiac catheterization, pace-maker insertions and cine investigations in voiding urethrocystography. Gough, Davis and Stacey (66) indicate mean skin doses of 47 rad in a group of 85 patients undergoing cardiac catheterization, with a maximum value of 140 rad. The frequency of undertaking this examination is not accurately known. Other surveys also indicate high doses (8, 10, 46, 153, 192). A comparison of the skin doses received in different techniques of investigations of the heart and large vessels are given in table 9 (235).
56. Recent detailed measurements (52) during 24 cardiac catheterization studies have shown a reasonable correlation between dose and exposure expressed as the current-time product. Typically, for ·a study involving an x-ray tube operating for 104 mAs a posterior skin dose of 8-20 rad was received, the anterior skin dose being 1-2 rad. The mean marrow dose, deduced from the skin dose, was 0.5-1.2 rad and the gonad dose 5-100 mrad.
57. Pace-maker insertions are controlled by x-ray fluoroscopy. Gough et al (66) have reported an average skin dose of 132 rad per insertion for a group of six patients. This dose is likely to be repeated a number of times for each patient. The high skin-dose rates in cine investigations have been mentioned by several authors and may be of the order of 50 rad_min-1 (192. 258).
(ii) Dose to the head and thyroid, particularly from dental x-ray examinations
58. The considerable increase in the frequency of dental x-ray examinations reported in paragraphs 41-44 merits the inclusion of recent measurements of the dose
TABLE 9. MEAN ENERGY IMPARTED TO PATIENTS DURING RADIOLOGICAL INVESTIGATIONS OF THE HEART AND LARGER VESSELS
Dose Typical conditions
Per Skin-focus Per procedure examination distance Vo/rage Area 1Tme Filrer
Merhod of investigation (cm) (kV) (cm') (min) (mm Al) (R) (kg rad) (kg rQd)
Fluoroscopy 60 60 200 1.5 0.5 7.5-10 8.5-11.35 Radiography
Direct 80 70 1 200 0.5 0.25-0.5 1.64-3.3 Lateral 60 80 BOO 0.5 0.5-1 2.3-4.7 Tele 150 90 1200 0.5 0.3 2.0
Photofluorography 80 70 800 0.5 0.5-1 2.3-4.6 4.6-9.2 Tomography 70 70 1 200 0.5 1-2 6.8-12.6 20.4-37.8 Kymography
Direct 80 90 720 1 8 32.9 Lateral 70 90 720 1 12 51
Electrokymography 60 60 so 10 1 25 7 Angiocardiography 70 llO 1200 0.5 3.6 55 Heart catheterization 40 70 100 22 1 3().232 145 Heart catheterization with image
intensifier 40 60 400 22 3 21 58.4 Cine with image intensifier 60 70 400 22 3 12.5 32
Source: Reference 235.
312
r I
1000
800
-•-
I
• •
-•-
•
• 90 kVp, 9 mAs • •
I 70 kVp, 15 mAs
-•-~ ! 600 w
~ u.
~ w a: :J (I)
~ 400 w
200
0
-•-
90 kVp, 1.5 mAs -·-2 4 6 8 10 12 14 16 18 20
CURRENT-TIME PRODUCT (mAs)
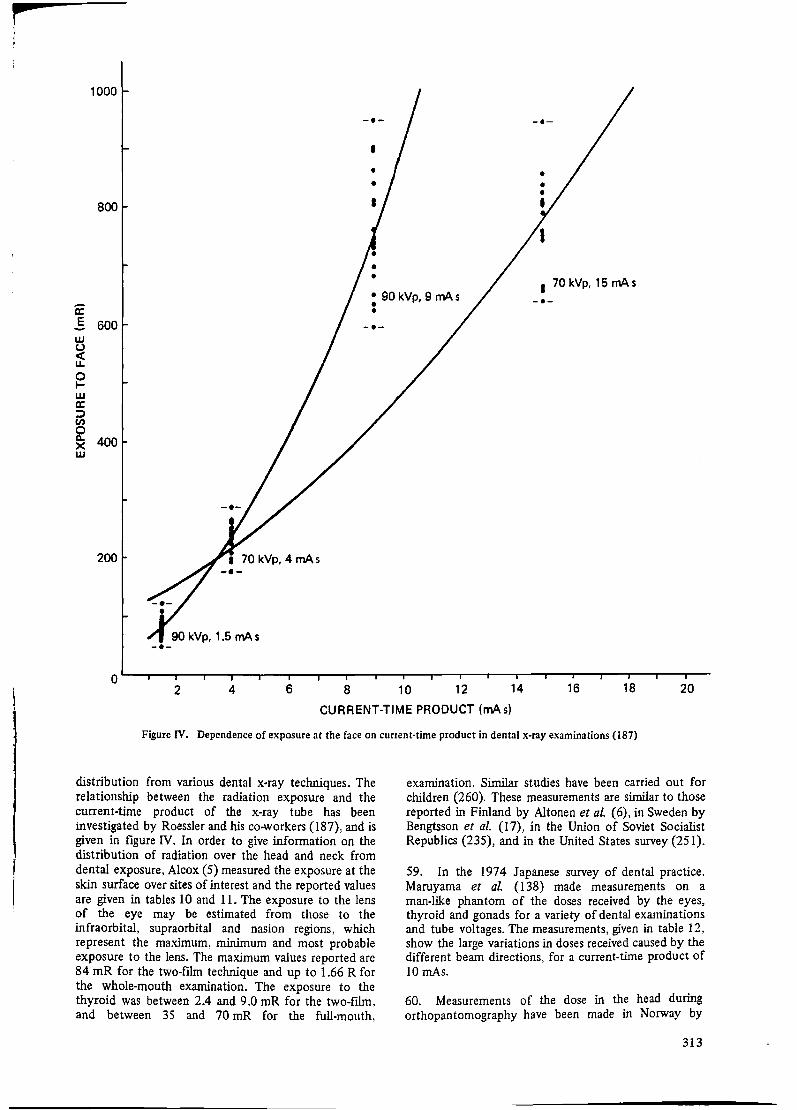
Figure IV. Dependence of exposure at the face on cunent·tirne product in dental x-ray examinations (187)
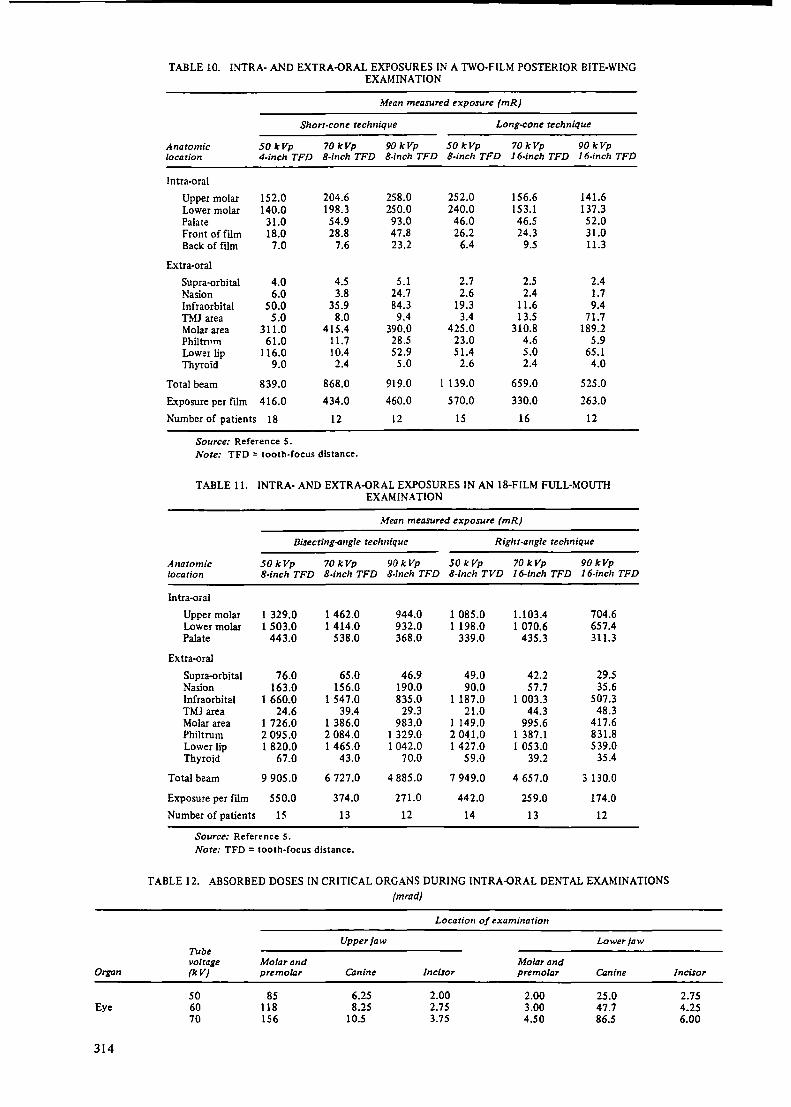
distribution from various dental x-ray techniques. The relationship between the radiation exposure and the current-time product of the x-ray tube has been investigated by Roessler and his co-workers (187), and is given in figure IV. In order to give information on the distribution of radiation over the head and neck from dental exposure, Alcox (5) measured the exposure at the skin surface over sites of interest and the reported values are given in tables 10 and 11. The exposure to the lens of the eye may be estimated from those to the infraorbital, supraorbital and nasion regions, which represent the maximum, minimum and most probable exposure to the lens. The maximum values reported are 84 mR for the two-film technique and up to 1.66 R for the whole-mouth examination. The exposure to the thyroid was between 2.4 and 9.0 mR for the two-film, and between 35 and 70 mR for the full-mouth,
examination. Similar studies have been carried out for children (260). These measurements are similar to those reported in Finland by Altonen et al. (6), in Sweden by Bengtsson et al. (17), in the Union of Soviet Socialist Republics (235), and in the United States survey (251 ).
59. In the 1974 Japanese survey of dental practice, Maruyama et al. (I 38) made measurements on a man-like phantom of the doses received by the eyes, thyroid and gonads for a variety of dental examinations and tube voltages. The measurements, given in table 12, show the large variations in doses received caused by the different beam directions, for a current-time product of 10 mAs.
60. Measurements of the dose in the head during orthopantomography have been made in Norway by
313
Organ
Eye
314
TABLE 10. INTRA· AND EXTRA-ORAL EXPOSURES IN A lWO-FILM POSTERIOR BITE-WING EXAMINATION
Mean measured exposure (mR)
Shorr-cone technique Long-cone technique
Anatomic 50 kVp 70kVp 90kVp 50 kVp 70kVp 90kVp location 4-inch TFD 8-inch TFD 8-inch TFD 8-inch TFD 16-inch TFD 16-inch TFD
Intra-oral
Upper molar 152.0 204.6 258.0 252.0 156.6 141.6 Lower molar 140.0 198.3 250.0 240.0 153.1 137.3 Palate 31.0 54.9 93.0 46.0 46.5 52.0 Front of film 18.0 28.8 47.8 26.2 24.3 31.0 Back of ftlm 7.0 7.6 23.2 6.4 9.5 11.3
Extra-oral
Supra-orbital 4.0 4.5 5.1 2.7 2.5 2.4 Nasion 6.0 3.8 24.7 2.6 2.4 1.7 lnfraorbital 50.0 35.9 84.3 19.3 11.6 9.4 TMJ area 5.0 8.0 9.4 3.4 13.5 71.7 Molar area 311.0 415.4 390.0 425.0 310.8 189.2 Philtnn11 61.0 11.7 28.5 23.0 4.6 5.9 Lower lip 116.0 10.4 52.9 51.4 5.0 65.1 Thyroid 9.0 2.4 5.0 2.6 2.4 4.0
Total beam 839.0 868.0 919.0 I 139.0 659.0 525.0
Exposure per film 416.0 434.0 460.0 570.0 330.0 263.0
Number of patients 18 12 12 15 16 12
Source: Reference S. Note: TFD = tooth-focus distance.
TABLE 11. INTRA· AND EXTRA-ORAL EXPOSURES IN AN 18-FILM FULL·MOUTii EXAMINATION
Mean measured exposure (mR)
Bisecting-angle technique Right-angle technique
Anatomic 50kVp 70kVp 90kVp 50 kVp 70kVp 90kVp location 8-inch TFD 8-inch TFD 8-inch TFD 8-inch TVD 16-inch TFD 16-inch TFD
Intra-oral
Upper molar 1 329.0 I 462.0 944.0 1 085.0 l.103.4 704.6 Lower molar 1 503.0 1 414.0 932.0 1 198.0 1 070.6 657.4 Palate 443.0 538.0 368.0 339.0 435.3 311.3
Extra-oral
Supra-orbital 76.0 65.0 46.9 49.0 42.2 29.5 Nasion 163.0 156.0 190.0 90.0 57.7 35.6 Infraorbital 1 660.0 1 547.0 835.0 1 187 .0 1 003.3 507.3 TMJ area 24.6 39.4 29.3 21.0 44.3 48.3 Molar area 1 726.0 1 386.0 983.0 1 149.0 995.6 417.6 Philtrum 2 095.0 2 084.0 1 329.0 2 04,1.0 I 387 .1 831.8 Lower lip 1 820.0 1 465.0 1 042.0 1 427.0 1 053.0 539.0 Thyroid 67.0 43.0 70.0 59.0 39.2 35.4
Total beam 9 905.0 6 727.0 4 885.0 7 949.0 4 657.0 3 130.0
Exposure per ftlm 550.0 374.0 271.0 442.0 259.0 174.0
Number of patients 15 13 12 14 13 12
Source: Reference s. Note: TFD = tooth-focus distance.
TABLE 12. ABSORBED DOSES IN CRITICAL ORGANS DURING INTRA-ORAL DENTAL EXAMINATIONS (mrad)
Location of examination
Upper jaw Lower jaw Tube voltage Molar and Molar and (kV) premolar Canine Incisor premolar Canine
50 85 6.25 2.00 2.00 25.0 60 118 8.25 2.75 3.00 47.7 70 156 10.S 3.75 4.50 86.S
Incisor
2.75 4.25 6.00
Upper jaw Tube voltage Molar and
Organ (kV) premolar Canine
50 2.75 20.2 Thyroid 60 3.50 26.7
70 4.25 33.7
50 0.12 0.08 Testis 60 0.21 0.17
70 0.34 0.29
50 0.0000 0.0000 Ovary 60 0.0007 0.0000
70 0.0015 0.0000
Source: Reference I 38.
(a) Dose distribution in cross-section of the head through the lower jaw. The figures are absorbed doses (mrad) in soft tissue. The rotational axes are shown as black spots
(b} Skin exposure (mR)
Figure V. Distribution of head dose and skin exposure from orthopantomography (221)
Location of examination
Lower jaw
Molar and Incisor premolar Canine Incisor
6.25 23.0 3.0 5.25 8.00 33.2 5.5 9.50 9.75 45.5 9.5 15.2
0.18 0.10 0.12 0.10 0.28 0.18 0.20 0.22 0.35 0.30 0.31 0.45
0.0026 0.0000 0.0000 0.0000 0.0055 0.0000 0.0000 0.0000 0.0105 0.0000 0.0000 0.0000
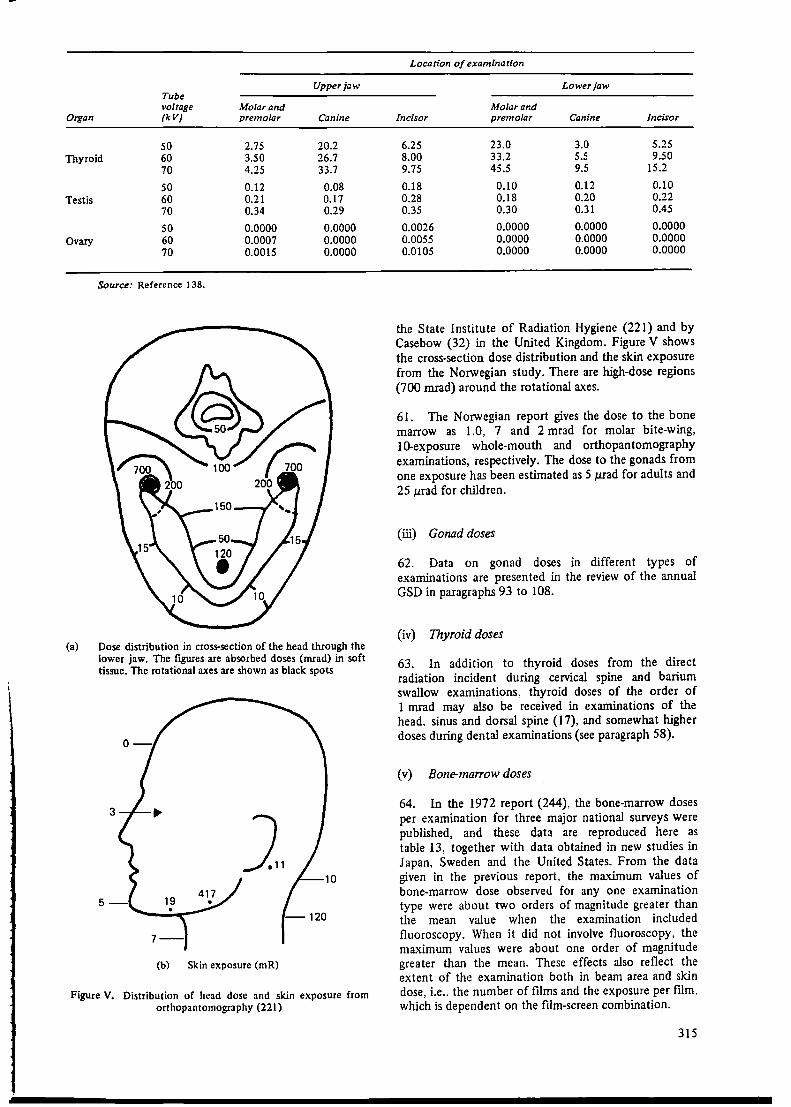
the State Institute of Radiation Hygiene (221) and by Casebow {32) in the United Kingdom. Figure V shows the cross-section dose distribution and the skin exposure from the Norwegian study. There are high-dose regions (700 mrad) around the rotational axes.
61. The Norwegian report gives the dose to the bone marrow as 1.0, 7 and 2 mrad for molar bite-wing, 10-exposure whole-mouth and orthopantomography examinations, respectively. The dose to the gonads from one exposure has been estimated as 5 µrad for adults and 25 µrad for children.
(iii) Gonad doses
62. Data on gonad doses in different types of examinations are presented in the review of the annual GSD in paragraphs 93 to 108.
(iv) Thyroid doses
63. In addition to thyroid doses from the direct radiation incident during cervical spine and barium swallow examinations, thyroid doses of the order of 1 mrad may also be received in examinations of the head, sinus and dorsal spine ( 17), and somewhat higher doses during dental examinations (see paragraph 58).
(v) Bone-marrow doses
64. In the 1972 report (244). the bone-marrow doses per examination for three major national surveys were published, and these data are reproduced here as table 13, together with data obtained in new studies in Japan, Sweden and the United States. From the data given in the previous report, the maximum values of bone-marrow dose observed for any one examination type were about two orders of magnitude greater than the mean value when the examination included fluoroscopy. When it did not involve fluoroscopy, the maximum values were about one order of magnitude greater than the mean. These effects also reflect the extent of the examination both in beam area and skin dose, i.e., the number of films and the exposure per film, which is dependent on the film-screen combination.
315
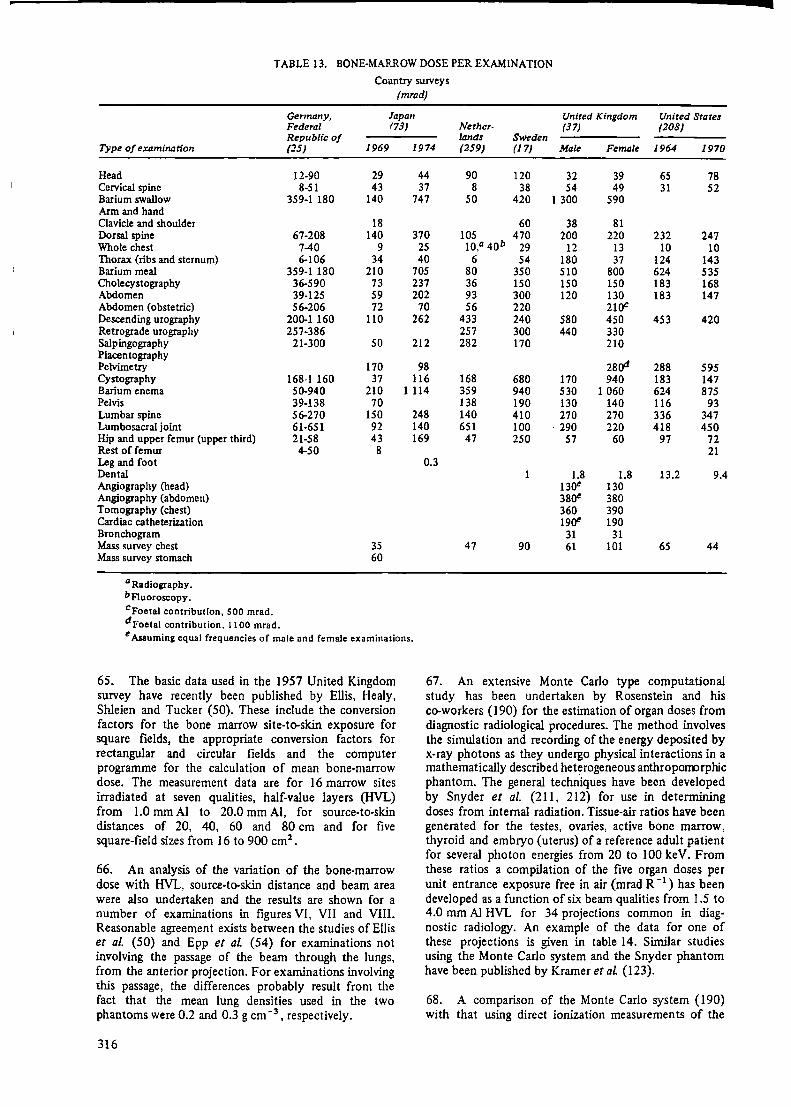
TABLE 13. BONE-MARROW DOSE PER EXAMINATION
Country surveys (mrad)
Gennany, Japan United Kingdom United States Federal (73) Nether- (37) (208) Republic of lands Sweden
Type of examination (25) 1969 1974 (259) (17) Male Female 1964 1970
Head 12-90 29 44 90 120 32 39 65 78 Cervical spine 8-51 43 37 8 38 54 49 31 52 Barium swallow 359-1 180 140 747 so 420 1 300 590 Arm and hand Clavicle and shoulder 18 60 38 81 Dorsal spine 67-208 140 370 105 470 200 220 232 247 Whole chest 7-40 9 25 10,0 40b 29 12 13 10 10 Thorax (ribs and sternum) 6-106 34 40 6 54 180 37 124 143 Barium meal 359-1 180 210 705 80 350 510 800 624 535 Cholecystography 36-590 73 237 36 150 150 150 183 168 Abdomen 39-125 59 202 93 300 120 130 183 147 Abdomen (obstetric) 56-206 72 70 56 220 210C Descending urography 200-1160 110 262 433 240 580 450 453 420 Retrograde urography 257-386 257 300 440 330 Salpingography 21-300 50 212 282 170 210 Placentography
280'1 Pelvimetry 170 98 288 595 Cystography 168-1 160 37 116 168 680 170 940 183 147 Barium enema 50-940 210 1114 359 940 530 1 060 624 875 Pelvis Lumbar spine Lumbosacral joint Hip and upper femur (upper third) Rest of femur Leg and foot Dental Angiography (head) Angiography (abdomen) Tomography (chest) Cardiac catheterization Bronchogram Mass survey chest Mass survey stomach
a Radiography. bf1uoroscopy. cFoetal contribution, SOO mrad. dFoetal contribution, 1100 mrad.
39-138 56-270 61-651 21-58 4-50
70 138 150 248 140 92 140 651 43 169 47 8
0.3
35 47 60
190 130 140 116 93 410 270 270 336 347 100 · 290 220 418 450 250 57 60 97 72
21
1 1.8 1.8 13.2 9.4 130C 130 380C 380 360 390 190C 190
31 31 90 61 101 65 44
e Assuming equal frequencies of male and female examinations.
65. The basic data used in the 1957 United Kingdom survey have recently been published by Ellis, Healy, Shleien and Tucker (50). These include the conversion factors for the bone marrow site-to-skin exposure for square fields, the appropriate conversion factors for rectangular and circular fields and the computer programme for the calculation of mean bone-marrow dose. The measurement data are for 16 marrow sites irradiated at seven qualities, half-value layers {HVL) from 1.0 mm Al to 20.0 mm Al, for source-to-skin distances of 20, 40, 60 and 80 cm and for five square-field sizes from 16 to 900 cm2 •
66. An analysis of the variation of the bone-marrow dose with HVL, source-to-skin distance and beam area were also undertaken and the results are shown for a number of examinations in figures VI, VII and VIII. Reasonable agreement exists between the studies of Ellis et al (50) and Epp et al (54) for examinations not involving the passage of the beam through the lungs, from the anterior projection. For examinations involving this passage, the differences probably result from the fact that the mean lung densities used in the two phantoms were 0.2 and 0.3 g cm-3 , respectively.
316
67. An extensive Monte Carlo type computational study has been undertaken by Rosenstein and his co-workers (190) for the estimation of organ doses from diagnostic radiological procedures. The method involves the simulation and recording of the energy deposited by x-ray photons as they undergo physical interactions in a mathematically described heterogeneous anthropom:>rphic phantom. The general techniques have been developed by Snyder et al. (211, 212) for use in determining doses from internal radiation. Tissue-air ratios have been generated for the testes, ovaries, active bone marrow, thyroid and embryo (uterus) of a reference adult patient for several photon energies from 20 to 100 keV. From these ratios a compilation of the five organ doses per unit entrance exposure free in air (mrad R -I) has been developed as a function of six beam qualities from 1.5 to 4.0 mm Al HVL for 34 projections common in diagnostic radiology. An example of the data for one of these projections is given in table 14. Similar studies using the Monte Carlo system and the Snyder phantom have been published by Kramer et al {123).
68. A comparison of the Monte Carlo system {190) with that using direct ionization measurements of the

dose to the bone marrow (50) shows that there is general agreement between the two methods. The tissue•air ratios for six AP projections, when compared for the two methods, lie between ·0.4 and 0.7 of each other; for three PA projections the ratios between I and 2.4; and for two lateral projections they are both about 0.7 of the direct measurement values (50). These differences occur because of the differences between the measure·
w "' g ~ IC IC < :l w z 0 m w > ,::: ~
mr1d
,sol ,eoi 170i 1601 150
140
130
120
110
100
90
80
70
Ill)
50
40
30
Thoracic spine (lateral protfction) CSE: 980 mR; bum 388 an2
SSO: 73cm
:i~~~. 0.S 1.0 1.5 2.0 2.5 10 3.5 4.0 4.5 5.0
HVLlmmAII
Figure VI. Dependence of active bone-marrow dose on the half-value layer (HVL) in various x-ray examinations (208)
CSE = central skin exposure SSD = source-to-skin distance
nvld
120 r·-., 480 cm1
: ' 110
0
100
!lO
80
10
60
50
40
JI)
20
10
0 20 40 mi
80 ''" SOURCE TO SKIN DtSTANCE
Figwe VII. Dependence of active bone-marrow dose on beam area and source-to-skin distance (SSD) in thoracic spine and lumbosacral joint x-ray examinations (208). HVL constant at
-70
II)
~ 0
50 C 3: C
"' "' 40 .. ! z JI) g "' > ;: 20
~ 10
0
2mmAI
CSE = central skin exposure
961Cffl1 ,..- -- -, I • I I
I O :
-·~ SJ8 • . r _ AbdotNn lport1r1« proiec:tion1 I CSE: l70mA ' ' I j,I' _: Hip and femt1 (an1aricw projllcUon)
2Jlcml /L-- r•• J.....--- CSE:560rril I O'""
r--. I ~ 'o~--J..,..., -""~· ~ • '---'270cm' _., 120c:m1
~ ~ m m ~ SOURCE TO SK1" 01ST ANCE
Figure VIII. Dependence of active bone-marrow dose on beam area and source-'to-skin distance (SSD) in abdominal and hip and
femur x-ray examinations (208). HVL constant at 2 mm Al
CSE = central skin exposure
TABLE 14. DOSES TO ORGANS DURING LUMBAR SPINE EXAMINATIONS
(Dose in millirads per 1000 mR entrance skin exposure free in air)
Beam quality (HYL i11 mm Al)
Organ Projection 1.5 2.0 2.5 3.0 3.5 4.0
Testis AP LI 2.2 3.7 5.6 7.8 10 Lateral 0.2 0.4 0.7 1.1 1.6 2.3
Ovary AP 91 139 188 238 288 336 Lateral 15 27 41 58 76 96
Thyroid AP 0.05 0.2 0.3 0.5 0.8 LI Lateral
Active bone marrow AP 13 21 32 46 62 81 Lateral 8.2 13 19 27 37 48
Embryo (uterus) AP 128 189 250 309 366 419 Lateral 9.4 17 27 39 53 68
Notes: (a) Conditions: Source to image-detector distance, 102 cm; film size (= field size), 35.6 cm X 43.2 cm.
(b) A dash (-) signifies a value of less than 0.01 mrad.
317
ment phantom and the mathematical phantom, the effect of the amount of compact bone overlying any specific dosimeter and the thickness of the homogeneous mixture of bone and marrow assumed in the skeleton of the mathematical phantom. The comparisons reported made corrections for the differences in the x-ray spectra and the assumed volume and density of the lung that were used in the two studies.
(vi) Breast doses
69. The breasts are exposed to radiation in a number of common x-ray examinations. The highest doses to the breast are caused during urography examinations. photofluorography of the lung, examinations of the dorsal spine and stomach examinations, in the order mentioned, with doses between 100 and 540 rnrad (17). Photofluorography of the lung is of special interest because of the high frequency of examinations.
70. In addition to these common examinations, special examinations may cause higher doses. Direct radiography of the female breast, i.e., mammography, is of particular interest because the technique is also being used in health investigations. The organization of a number of large population mass-screening surveys caused concern when high-dose techniques were in use and when regular re-examinations were carried out on young women. The justification for such examinations was questioned because of the increase of breast cancer that might be induced by radiation (13, 49, 182).
71. In the 1972 report the radiation dose in the breast per mammography examination was reported to be in the range 10-35 rad. However, since then considerable progress has occurred in techniques for reduction of the radiation dose. The use of the low-dose technique (very sensitive films with high-efficiency intensifying screens in vacuum packing) has enabled radiographs to be taken with a maximum skin dose to the breast of 0.1 rad ( 13, 173, 229, 268). With two-film techniques being accepted for screening examinations, surveys can be undertaken with a breast dose of less than 200-300 mrad. The use of xeroradiography leads to doses which are an order of magnitude higher, i.e., 1-5 rad per examination (22, 56, 191 ), while the use of industrial film leads to doses between 1.8 and 18 rad (13, 60, 229).
( vii) Lung doses
72. The density of the lungs at full inspiration is about 0.1-0.15 g cm-3 , while an average value of 0.25 g cm-3
is more appropriate when the main vessels are included. These changes make accurate assessment of the lung dose difficult. In typical x-ray examinations the transmission through the chest is about 10 per cent. Lung doses may therefore be estimated as a function of the direction of the beam from the incident skin dose. For full-size radiographs, the skin dose per exposure is about 20 mrad: for photofluorography using 70- or 100-mm cameras, the skin dose is usually about 200-300 mrad; for photofluorography using 35-mm cameras, the skin dose is usually in the range 600-1000 rnrad. In the Swedish study by Bengtsson et al. (17), the highest dose to the lung, 800 mrad, was found in examinations of the dorsal spine. Special examinations such as cardiac catheterization cause much higher lung doses (see paragraph 56).
318
(viii) Doses in other organs
73. Eye. Surveys (102, 103) have shown that the radiation dose to the cornea during extensive neurological x-ray examinations may be in the range 20-80 rad. Patients who have repeated examinations may have a considerably increased risk of a radiation-induced cataract. The introduction of new x-ray units using computerized axial tomography will tend to change the mode of examination of patients with head lesions. Dose distributions in the head have been reported by Perry and Bridges (165). Doses to various parts of the head in dental examinations have been calculated or measured by several authors (5, 187, 251, 260). Casebow (32) has reported the dose to the head during orthopantomographic dental examinations.
74. Bone. The frequent radiography of young children with orthopaedic handicaps may cause damage to the development of bone and, in particular, produce stunted growth when the epiphysis has received a high dose (67). It is not uncommon to observe that particular patients have had over 100 radiographs of one particular joint during childhood. Estimates of dose distributions are not yet available.
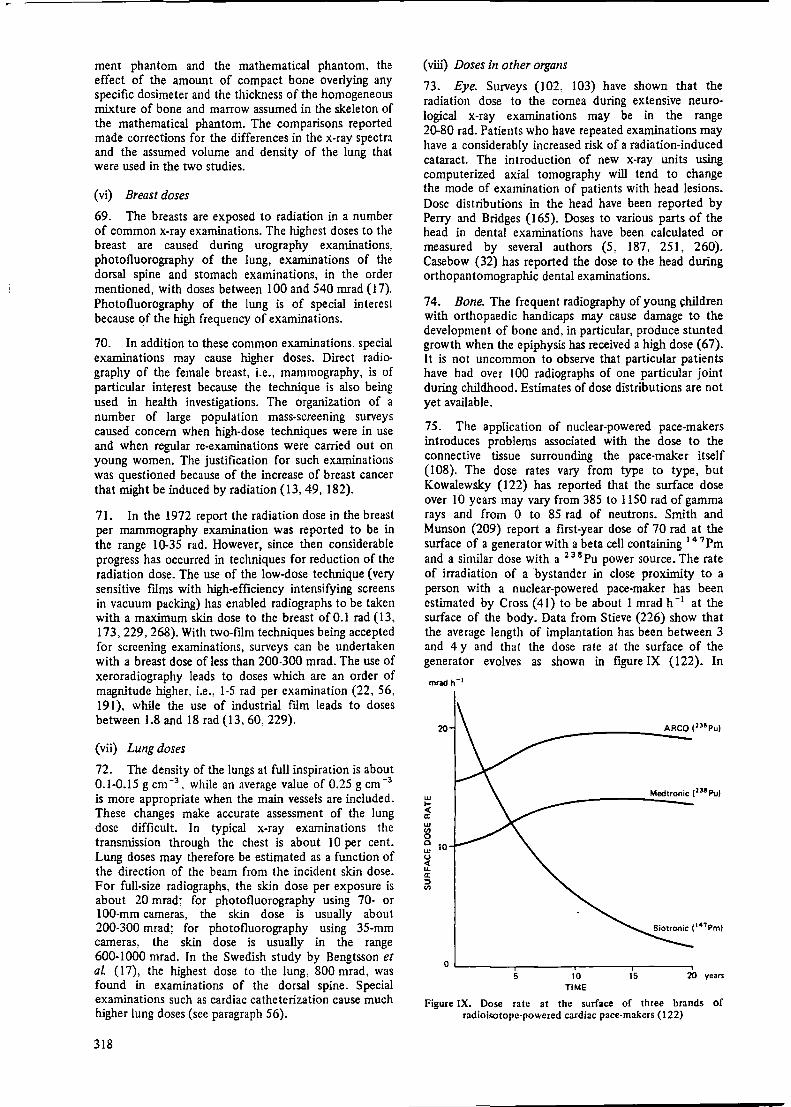
75. The application of nuclear-powered pace-makers introduces problems associated with the dose to the connective tissue surrounding the pace-maker itself (108). The dose rates vary from type to type, but Kowalewsky (122) has reported that the surface dose over 10 years may vary from 385 to 1150 rad of gamma rays and from O to 85 rad of neutrons. Smith and Munson (209) report a first-year dose of 70 rad at the surface of a generator with a beta cell containing 14 7 Pm and a similar dose with a 2 3 8 Pu power source. The rate of irradiation of a bystander in close proximity to a person with a nuclear-powered pace-maker has been estimated by Cross ( 41) to be about 1 mrad h -i at the surface of the body. Data from Stieve (226) show that the average length of implantation has been between 3 and 4 y and that the dose rate at the surface of the generator evolves as shown in figure IX (122). In
w I-< a: w "' 0 0 w u < u. a: ::> "'
20
Medtronic (138 Pu)
10
o.__ ___ ..------,----..------, 5 10
TIME 15 20 years
Figure IX. Dose rate at the surface of three brands of radioisotope-powered cardiac pace-makers (122)
r interpreting the effect of the absorbed dose rate in figure IX, account should be taken of the relevant biological effectiveness of the neutron contribution.
( c) Embryo and foetal exposures
76. The surveys of pre-natally exposed children ( 134, 228) were summarized in the 1972 report. The practice of x-ray pelvimetry and obstetric abdomen examination has declined in frequency in a number of countries, even though recent statistical information on this is not readily available (see table 7, however). The introduction of ultrasonic scanning is probably reducing the need for x-ray and radionuclide investigations to localize the placenta {172). From the data given in the 1972 report, it can be deduced that the foetal whole-body dose is usually about 300 mrad in obstetric abdomen examinations and 620 mrad in pelvimetry examinations. The frequencies reported for the two examinations were about 2 and 1 per 1000 of population, respectively. These data give an annual collective dose to the foetus of about 1.2 man rad per 1000 of population from these two types of examination. A recent survey in Japan {1974) from Kitabatake et al. (119) reports, however, frequencies of 69 and 92 per I OOO pregnancies, respectively, for the two examinations.
77. Several reviews have been published (42, 150, 155, 223, 225) dealing with the levels of dose to women having child-bearing capacity at which subsequent action might be considered desirable, including termination of
pregnancy. In the state of available human information on the risks of radiation during various stages of pregnancy (see Annex J. paragraphs 169-173). as well as on the normal incidence of congenital defects, it does not seem appropriate to make any absolute recommendation regarding the line of action following such medical radiation exposures. In any case. such recommendations could serve only as a guide that would have to be modified in specific instances according to the judgement of the patient's physician and consulting radiation experts and, of course according to the desires of the patient herself. The radiation dose itself, particularly from diagnostic radiologic procedures, is unlikely to be the sole determining factor in advising abortion. Decisions based on the generally small risks involved must require very careful consideration of the conditions applyin~ in each indi'tidual case.
( d) Comparison of procedures
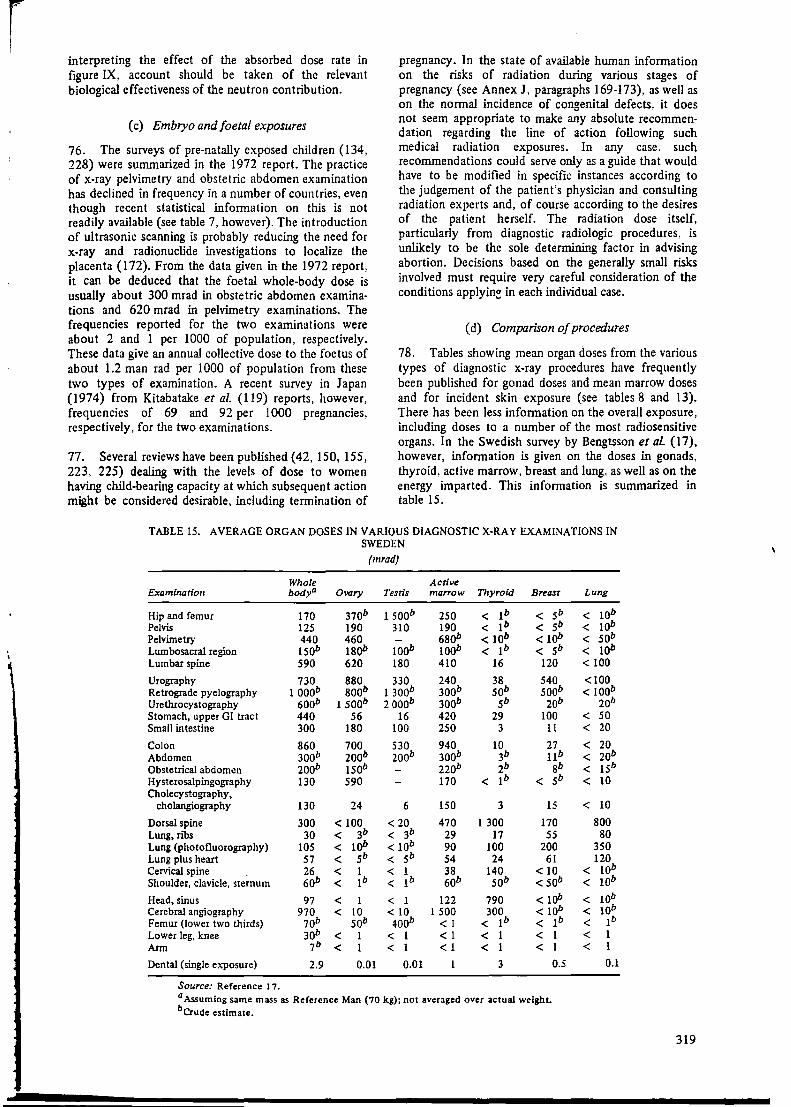
78. Tables showing mean organ doses from the various types of diagnostic x-ray procedures have frequently been published for gonad doses and mean marrow doses and for incident skin exposure (see tables 8 and 13). There has been less information on the overall exposure, including doses to a number of the most radiosensitive organs. In the Swedish survey by Bengtsson et al {17), however, information is given on the doses in gonads, thyroid, active marrow, breast and lung, as well as on the energy imparted. This information is summarized in table 15.
TABLE 15. AVERAGE ORGAN DOSES IN VARIOUS DIAGNOSTIC X-RAY EXAMINATIONS IN SWEDEN
{mrad)
Whole Active Examination bodya Ovary Testis ma"ow Thyroid Breast
Hip and femur 170 310b 1 soob 250 < 1b < 5b Pelvis 125 190 310 190 < 1b < 5b Pelvimetry 440 460 - 680b < 10b < lob Lumbosacral region 1sob 18ob 100b 100b < 1b < 5b Lumbar spine 590 620 180 410 16 120
Urography 730 880 330 240 38 540 Retrograde pyelography 1 ooob 8oob 1 300b 300b sob soob Urethrocystography 600b 1 soob 2 ooob 300b 5b 20b Stomach, upper GI tract 440 56 16 420 29 100 Small intestine 300 180 100 250 3 11
Colon 860 700 530 940 10 27 Abdomen 300b 200b 200b 300b 3b 11b Obstetrical abdomen zoob 1sob 220b 2b 8b Hysterosalpingography 130 590 170 < 1b < 5b Cholecystography,
cholangiography 130 24 6 150 3 15
Dorsal spine 300 < 100 < 20 470 1 300 170 Lung, n'bs 30 < 3b < 3b 29 17 55 Lung (photofluorography) 105 < lob < 10b 90 100 200 Lung plus heart 57 < 5b < 5b 54 24 61 Cervical spine 26 < 1 < l 38 140 < 10 Shoulder, clavicle, sternum 60b < lb < 1b 60b sob < sob
Head, sinus 97 < 1 < 1 122 790 < lob Cerebral angiography 970 < 10 < 10 1 500 300 < 10b Femur Oower two thirds) 10b sob 400b < 1 < 1b < 1b Lower leg, knee 30b < 1 < 1 < 1 < 1 < l Arm 7b < 1 < 1 < 1 < 1 < 1
Dental (single exposure) 2.9 0.01 0.01 1 3 0.5
Source: Reference I 7. a Assuming same mass as Reference Man {70 kg); not averaged over actual weight. berude estimate.
Lung
< lob < lob < sob < 10b < 100
<100 < 100b
20b < 50 < 20
< 20 < 20b < 15b < 10
< 10
800 80
350 120
< 10b < 10b
< 10b < 10b < 1b < 1 < 1
0.1
319
79. The Swedish study involved measurements on about 1000 patients in 13 Swedish hospitals. The techniques employed at these hospitals were believed to be representative for the whole of Sweden since diagnostic techniques are quite uniform throughout the country. Image-intensifier television was generally used, the older fluoroscopic screen, rarely. Chest examinations were normally made without fluoroscopy. Automatic exposure control was generally used. The dominant screen-film combination would under optimum condi· tions require an exposure of 0.4-1 mR to give an adequate density. Examinations of gall bladder, stomach and colon, and special examinations were performed by doctors. Most other examinations were performed by specially trained nurses or x-ray technicians. The exposures were measured at various points on the patients using thermoluminescent lithium fluoride dosimeters. These were placed at the laryngeal prominence (to estimate the thyroid dose), the breast, the male gonad and the rectum (to estimate the ovary dose). For the other organs an estimate of the dose was made from the recorded exposure area product (see paragraph 48). The overall accuracy of the mean absorbed dose for a particular organ was± 50 per cent.
80. It is seen from table 15 that the imparted energy (expressed in the table as mean whole body dose in Reference Man in mrad, but in the Swedish study reported in mJ is usually a good indicator of the significance of an exposure as regards high doses in radiosensitive organs. None of the examinations having an imparted energy of less than 200 mJ (280 mrad whole-body dose) caused an absorbed dose of more than 800 mrad in any of the organs listed, with the exception of a testis dose of 1500 rnrad in examinations of hip and femur. However, some examinations simultaneously exposed several of the listed organs to the extent that the exposures might be considered more significant than indicated by the imparted energy alone. These examinations were the examinations of the lung and the
dorsal spine. As can be expected, examinations of the pelvic region. e.g. pelvimetry, urethrocystography and examination of the hip and femur gave high gonad exposures in relation to the energy imparted.
3. Collective dose to various organs from different types of procedures
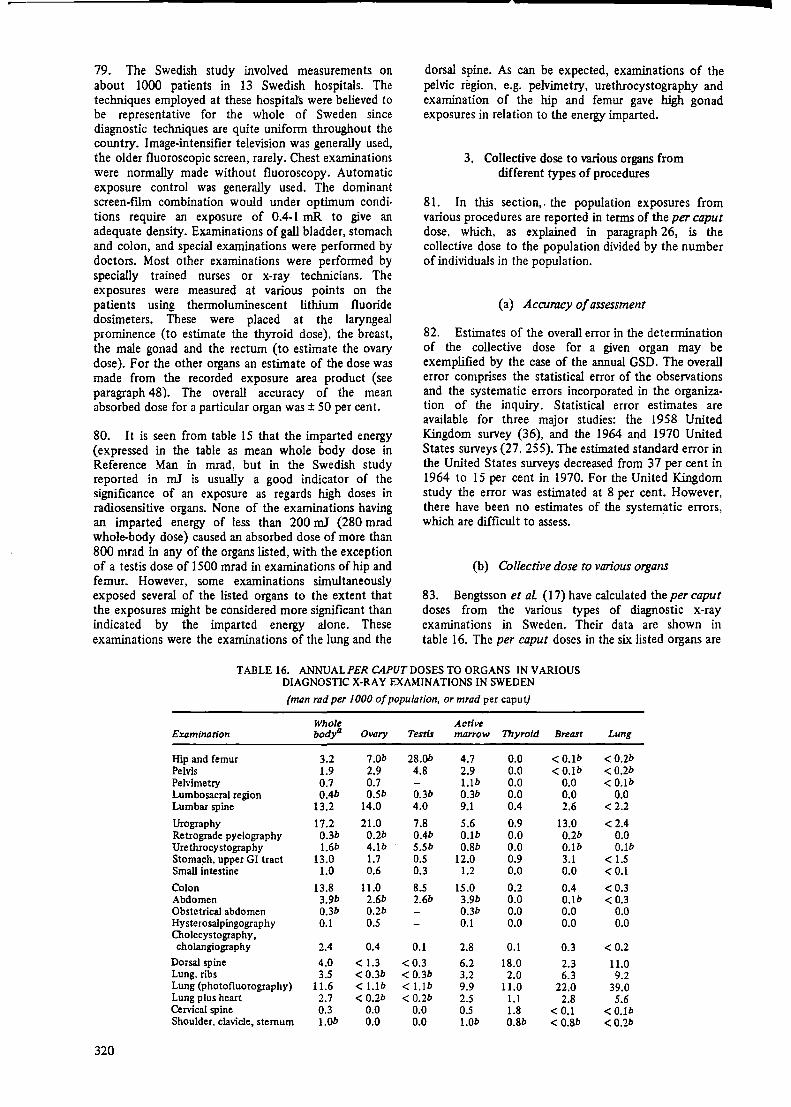
81. In this section,. the population exposures from various procedures are reported in terms of the per caput dose, which, as explained in paragraph 26, is the collective dose to the population divided by the number of individuals in the population.
(a) Accuracy of assessment
82. Estimates of the overall error in the determination of the collective dose for a given organ may be exemplified by the case of the annual GSD. The overall error comprises the statistical error of the observations and the systematic errors incorporated in the organization of the inquiry. Statistical error estimates are available for three major studies: the 1958 United Kingdom survey (36), and the 1964 and 1970 United States surveys (27. 255). The estimated standard error in the United States surveys decreased from 37 per cent in 1964 to 15 per cent in 1970. For the United Kingdom study the error was estimated at 8 per cent. However, there have been no estimates of the systematic errors, which are difficult to assess.
(b) Collective dose to various organs
83. Bengtsson et al (17) have calculated the per caput doses from the various types of diagnostic x-ray examinations in Sweden. Their data are shown in table 16. The per caput doses in the six listed organs are
TABLE 16. ANNUAL PER CAPUT DOSES TO ORGANS IN V ARlOUS DIAGNOSTIC X-RAY EXAMINATIONS IN SWEDEN
(man rad per 1000 of population, or mrad per caput)
Whole Active Examination body' Ovary Tents marrow Thyroid Breast Lung
Hip and femur 3.2 1.0b 28.0b 4.7 0.0 < O.lb <0.2b Pelvis 1.9 2.9 4.8 2.9 0.0 < O.lb < 0.2b Pelvimetry 0.7 0.7 l.lb 0.0 0.0 < O.lb Lumbosacral region 0.4b 0.5b 0.3b 0.3b 0.0 0.0 0.0 Lumbar spine 13.2 14.0 4.0 9.1 0.4 2.6 <2.2
Urography 17.2 21.0 7.8 5.6 0.9 13.0 < 2.4 Retrograde pyelography 0.3b 0.2b 0.4b O.lb 0.0 0.2b 0.0 Urethrocystography 1.6b 4.lb 5.5b 0.8b 0,0 O.lb O.lb Stoma~h, upper GI tract 13.0 1.7 0.5 12.0 0.9 3.1 < 1.5 Small intestine 1.0 0.6 0.3 1.2 0.0 0.0 <0.1
Colon 13.8 11.0 8.5 15.0 0.2 0.4 <0.3 Abdomen 3.9b 2.6b 2.6b 3.9b 0.0 O.lb < 0.3 Obstetrical abdomen 0.3b 0.2b 0.3b 0.0 0.0 o.o Hysterosalpingography 0.1 0.5 0.1 0.0 0.0 0.0 Ololecystography, cholangiography 2.4 0.4 0.1 2.8 0.1 0.3 <0.2
Dorsal spine 4.0 < 1.3 <0.3 6.2 18.0 2.3 11.0 Lung, ribs 3.5 <0.3b <0.3b 3.2 2.0 6.3 9.2 Lung (photofluorography) 11.6 < I.lb < I.lb 9.9 11.0 22.0 39.0 Lung plus heart 2.7 < 0.2b < 0.2b 2.5 1.1 2.8 5.6 Cervical spine 0.3 0.0 0.0 0.5 1.8 < 0.1 <0.lb Shoulder, clavicle, sternum I.Ob 0.0 0.0 1.0b 0.8b <0.8b <0.2b
320
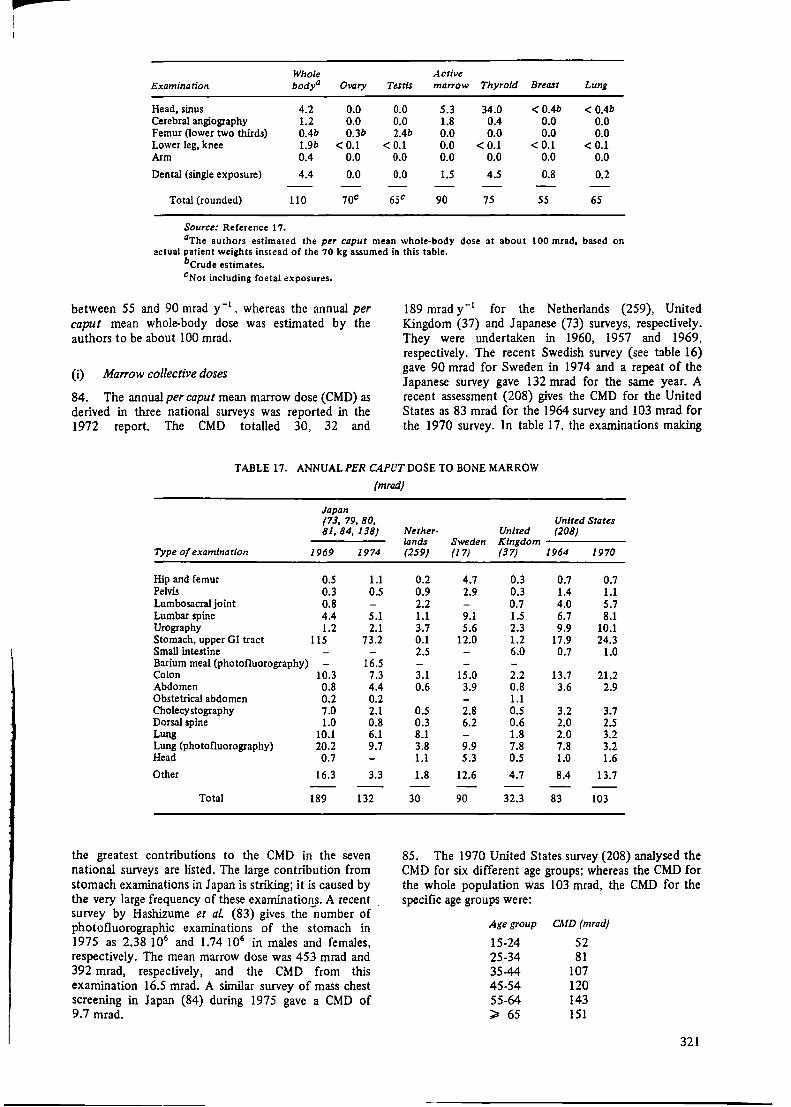
pa
Whole Active Examination bodya Ovary Testis ma"ow Thyroid Breast Lung
Head, sinus 4.2 0.0 0.0 5.3 34.0 <0.4b < 0.4b Cerebral angiography 1.2 0.0 0.0 1.8 0.4 0.0 0.0 Femur Oower two thirds) 0.4b 0.3b 2.4b 0.0 0.0 0.0 0.0 Lower leg, knee 1.9b < 0.1 < 0.1 0.0 < 0.1 < 0.1 <0.1 Arm 0.4 0.0 0.0 0.0 0.0 0.0 0.0
Dental (single exposure) 4.4 0.0 0.0 1.5 4.5 0.8 0.2
Total (rounded) 110 70c 65c 90 75 55 65
Source: Reference 1 7. aThe authors estimated the per caput mean whole-body dose at about 100 mrad, based on
actual patient weights instead of the 70 kg assumed in this table. bcrude estimates. cNot including foetal exposures.
between 55 and 90 mrad y-1, whereas the annual per
caput mean whole-body dose was estimated by the authors to be about 100 mrad.
(i) Marrow collective doses
84. The annual per caput mean marrow dose (CMD) as derived in three national surveys was reported in the 1972 report. The CMD totalled 30, 32 and
189 mrad y- 1 for the Netherlands (259), United Kingdom (37) and Japanese (73) surveys, respectively. They were undertaken in 1960, 1957 and 1969, respectively. The recent Swedish survey (see table 16) gave 90 mrad for Sweden in 1974 and a repeat of the Japanese survey gave 132 mrad for the same year. A recent assessment (208) gives the CMD for the United States as 83 mrad for the 1964 survey and 103 mrad for the 1970 survey. In table 17, the examinations making
TABLE 17. ANNUAL PER C4PUTD0SE TO BONE MARROW
(mrad)
Japan (73, 79, 80, 81, 84,138)
Type of examination 1969 1974
Hip and femur o.s 1.1 Pelvis 0.3 0.5 Lumbosacral joint 0.8 Lumbar spine 4.4 5.1 Urography 1.2 2.1 Stomach, upper GI tract 115 73.2 Small intestine Barium meal (photofluorography) - 16.5 Colon 10.3 7.3 Abdomen 0.8 4.4 Obstetrical abdomen 0.2 0.2 Cholecystography 7.0 2.1 Dorsal spine 1.0 0.8 Lung 10.1 6.1 Lung (photofluorography) 20.2 9.7 Head 0.7
Other 16.3 3.3
Total 189 132
the greatest contributions to the CMD in the seven national surveys are listed. The large contribution from stomach examinations in Japan is striking; it is caused by the very large frequency of these examinations. A recent survey by Hashizume et al (83) gives the -number of photofluorographic examinations of the stomach in 1975 as 2.38 106 and 1.74 106 in males and females, respectively. The mean marrow dose was 453 mrad and 392 mrad, respectively, and the CMD from this examination 16.5 mrad. A similar survey of mass chest screening in Japan (84) during 1975 gave a CMD of 9.7 mrad.
United States Nether- United (208) lands Sweden Kingdom (259) (17) (37) 1964 1970
0.2 4.7 0.3 0.7 0.7 0.9 2.9 0.3 1.4 1.1 2.2 0.7 4.0 5.7 1.1 9.1 1.5 6.7 8.1 3.7 5.6 2.3 9.9 10.1 0.1 12.0 1.2 17.9 24.3 2.5 6.0 0.7 1.0
3.1 15.0 2.2 13.7 21.2 0.6 3.9 0.8 3.6 2.9
1.1 0.5 2.8 0.5 3.2 3.7 0.3 6.2 0.6 2.0 2.5 8.1 1.8 2.0 3.2 3.8 9.9 7.8 7.8 3.2 1.1 5.3 0.5 1.0 1.6
1.8 12.6 4.7 8.4 13.7
30 90 32.3 83 103
85. The 1970 United States survey (208) analysed the C.MD for six different age groups; whereas the CMD for the whole population was 103 mrad, the CMD for the specific age groups were:
Age group
15-24 25-34 35-44 45.54 55-64 ~ 65
CMD (mrad)
52 81
107 120 143 151
321
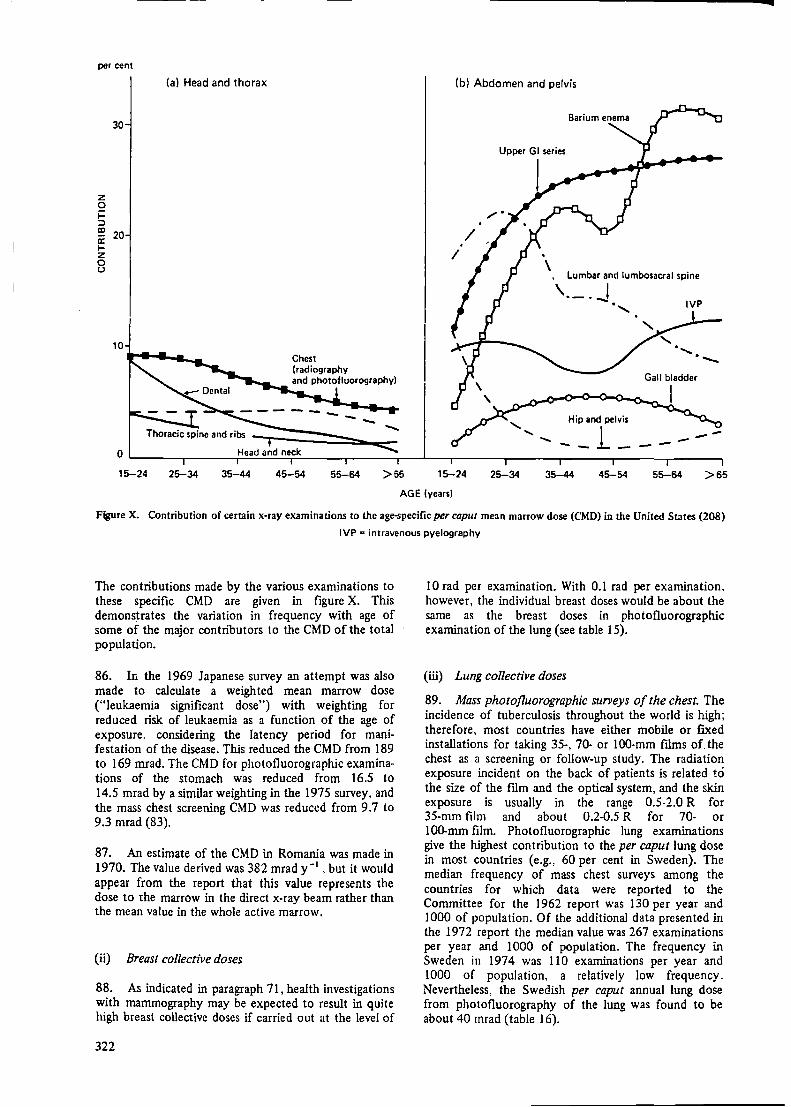
per cent
z 0 j:: :::::>
30
ID 20 a: 1-z 0 u
10
(al Head and thorax (b) Abdomen and pelvis
/ I
, Lumbar and lumbosacral spine
IVP
Hip and pelvis
-- --, __ 1_ O '------,-----,H,....e.;..;;a..;.d..;;.a_nd_n_eck..-------.-----.---'---r------..-----,,----r------..-----,
15-24 25-34 35-44 45-54 55-64 >SS 15-24 25-34 35-44 45-54 55-64 >65
AGE (years)
Figure X. Contribution of certain x-ray examinations to the age-specific per caput mean marrow dose (CMD) in the United States (208)
IVP a intravenous pyelography
The contributions made by the various examinations to these specific CMD are given in figure X. This demonstrates the variation in frequency with age of some of the major contributors to the CMD of the total population.
86. In the 1969 Japanese survey an attempt was also made to calculate a weighted mean marrow dose ("leukaemia significant dose") with weighting for reduced risk of leukaemia as a function of the age of exposure. considering the latency period for manifestation of the disease. This reduced the CMD from 189 to 169 mrad. The CMD for photofluorographic examinations of the stomach was reduced from 16.5 to 14.5 mrad by a similar weighting in the 1975 survey, and the mass chest screening CMD was reduced from 9.7 to 9.3 mrad (83).
87. An estimate of the CMD in Romania was made in 1970. The value derived was 382 mrad y-1 , but it would appear from the report that this value represents the dose to the marrow in the direct x-ray beam rather than the mean value in the whole active marrow.
(ii) Breast collective doses
88. As indicated in paragraph 71, health investigations with mammography may be expected to result in quite high breast collective doses if carried out at the level of
322
10 rad per examination. With 0.1 rad per examination, however, the individual breast doses would be about the same as the breast doses in photofluorographic examination of the lung (see table 15).
(iii) Lung collective doses
89. Mass photofluorographic surveys of the chest. The incidence of tuberculosis throughout the world is high; therefore, most countries have either mobile or fixed installations for taking 35-, 70- or 100-mm films of. the chest as a screening or follow-up study. The radiation exposure incident on the back of patients is related to the size of the film and the optical system, and the skin exposure is usually in the range 0.5-2.0 R for 35-mm film and about 0.2-0.5 R for 70- or 100-mm film. Photofluorographic lung examinations give the highest contribution to the per caput lung dose in most countries (e.g., 60 per cent in Sweden). The median frequency of mass chest surveys among the countries for which data were reported to the Committee for the 1962 report was 130 per year and 1000 of population. Of the additional data presented in the 1972 report the median value was 267 examinations per year and 1 OOO of population. The frequency in Sweden in 1974 was 110 examinations per year and 1000 of population, a relatively low frequency. Nevertheless, the Swedish per caput annual lung dose from photofluorography of the lung was found to be about 40 mrad ( table 16).
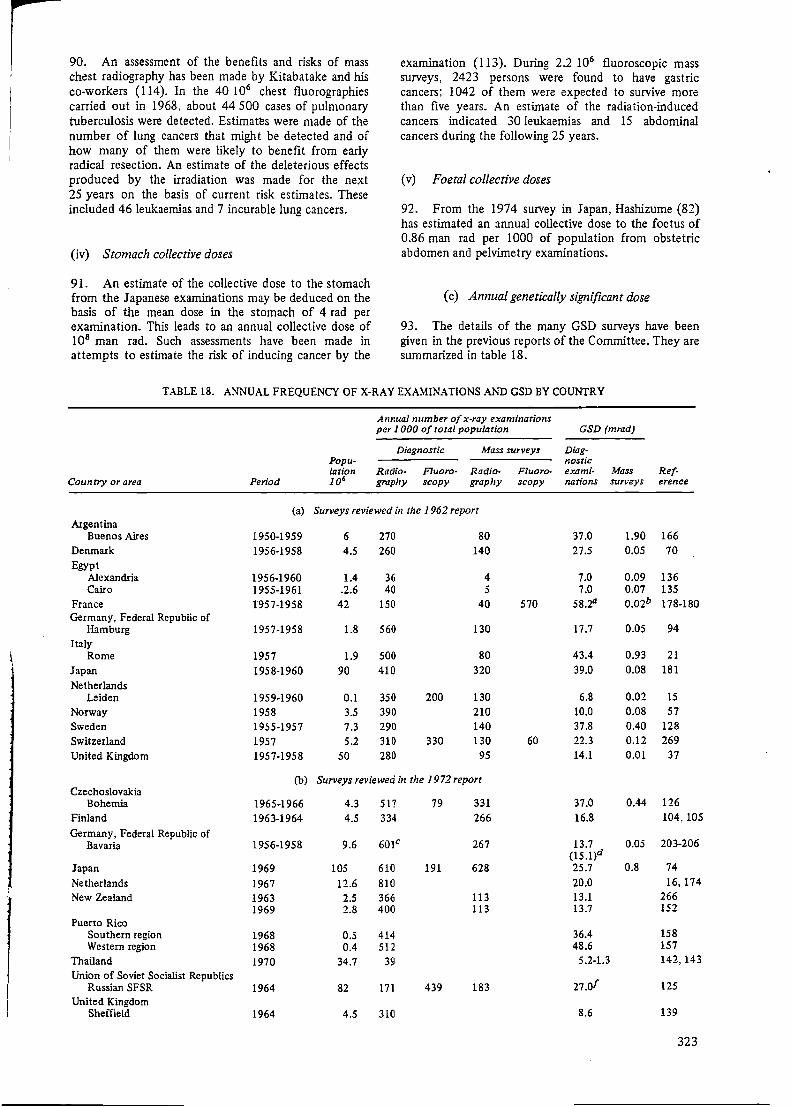
90. An assessment of the benefits and risks of mass chest radiography has been made by Kitabatake and his co-workers (I 14). In the 40 l 06 chest fluorographies carried out in 1968, about 44 500 cases of pulmonary tuberculosis were detected. Estimatc:s were made of the number of lung cancers that might be detected and of how many of them were likely to benefit from early radical resection. An estimate of the deleterious effects produced by the irradiation was made for the next 25 years on the basis of current risk estimates. These included 46 leukaemias and 7 incurable lung cancers.
(iv) Stomach collective doses
91. An estimate of the collective dose to the stomach from the Japanese examinations may be deduced on the basis of the mean dose in the stomach of 4 rad per examination. This leads to an annual collective dose of 108 man rad. Such assessments have been made in attempts to estimate the risk of inducing cancer by the
examination (113). During 2.2 106 fluoroscopic mass surveys, 2423 persons were found to have gastric cancers; 1042 of them were expected to survive more than five years. An estimate of the radiation-induced cancers indicated 30 Jeukaemias and 15 abdominal cancers during the following 25 years.
(v) Foetal collective doses
92. From the 1974 survey in Japan, Hashizume (82) has estimated an annual collective dose to the foetus of 0.86 man rad per 1000 of population from obstetric abdomen and pelvimetry examinations.
(c) Annual genetically significant dose
93. The details of the many GSD surveys have been given in the previous reports of the Committee. They are summarized in table 18.
TABLE 18. ANNUAL FREQUENCY OF X-RAY EXAMINATIONS AND GSD BY COUNTRY
Annual number of x-ray examinations per 1 OOO of total population GSD (mrad)
Diagnostic Mass surveys Diag-Popu- nostic lation Radio- Fluoro- Radio- Fluoro- exami· Mass Ref·
Country or area Period 106 graphy scopy graph}' scopy nations surveys erence
(a) Surveys reviewed in the 1962 report Argentina
Buenos Aires 1950-1959 6 270 80 37.0 1.90 166 Denmark 1956-1958 4.5 260 140 27.5 0.05 70 Egypt
Alexandria 1956-1960 1.4 36 4 7.0 0.09 136 Cairo 1955-1961 .2.6 40 5 7.0 0.07 135
France 1957-1958 42 150 40 570 58.2° 0.02b 178-180 Germany, Federal Republic of
Hamburg 1957-1958 1.8 560 130 17.7 0.05 94 Italy
Rome 1957 1.9 500 80 43.4 0.93 21
Japan 1958-1960 90 410 320 39.0 0.08 181
Netherlands Leiden 1959-1960 0.1 350 200 130 6.8 0.02 15
Norway 1958 3.5 390 210 10.0 0.08 57 Sweden 1955-1957 7.3 290 140 37.8 0.40 128 Switzerland 1957 5.2 310 330 130 60 22.3 0.12 269
United Kingdom 1957-1958 50 280 95 14.1 0.01 37
(b) Surveys reviewed in the 1972 report Czechoslovakia
Bohemia 1965-1966 4.3 517 79 331 37.0 0.44 126
Finland 1963-1964 4.5 334 266 16.8 104,105
Germany, Federal Republic of 601c 203-206 Bavaria 1956-1958 9.6 267 13.7 0.05
(15.l)d Japan 1969 105 610 191 628 25.7 0.8 74
Netherlands 1967 12.6 810 20.0 16,174
New Zealand 1963 2.5 366 113 13.1 266 1969 2.8 400 113 13.7 152
Puerto Rico Southern region 1968 0.5 414 36.4 158 Western region 1968 0.4 512 48.6 157
Thailand 1970 34.7 39 5.2-1.3 142,143
Union of Soviet Socialist Republics 27.of Russian SFSR 1964 82 171 439 183 125
United Kingdom Sheffield 1964 4.5 310 8.6 139
323
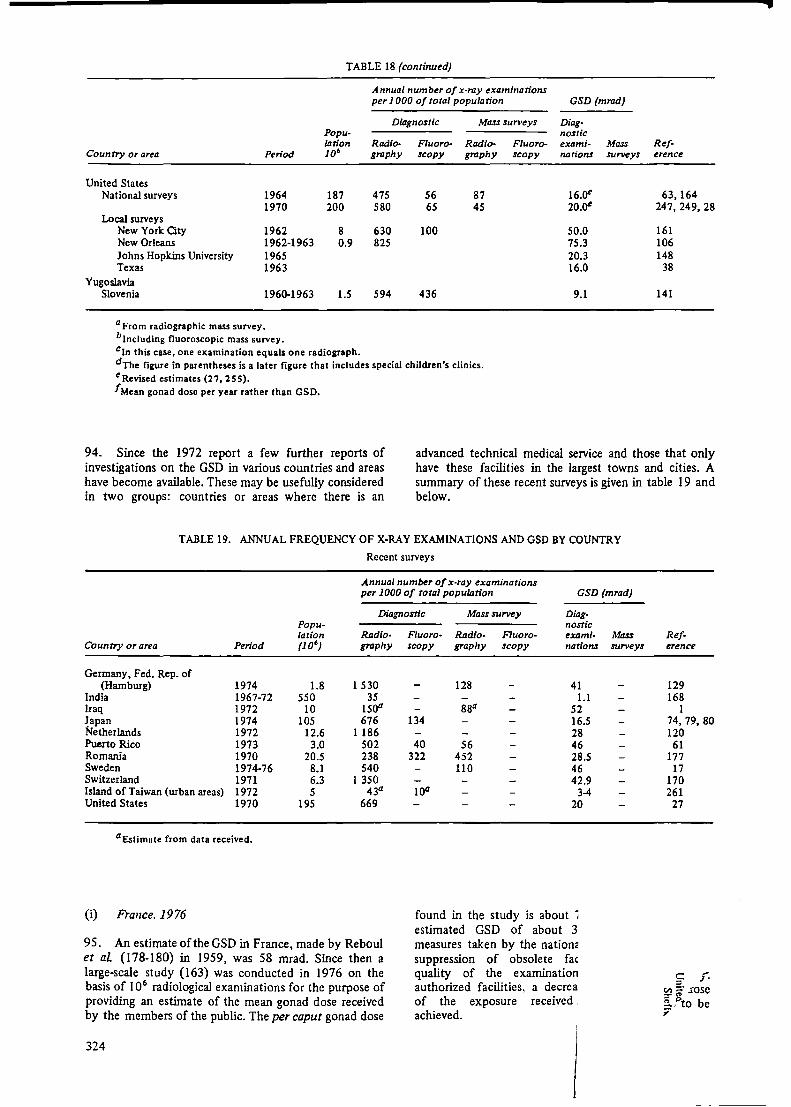
TABLE 18 (continued)
Annual number of x-ray examinations per 1 OOO of total population GSD (mrad)
Diagnostic Mass surveys Diag-nostic Popu
lation 106
Radio- Fluoro- Radio- Fluoro- exami- Mass Ref-Country or area Period graphy :scopy graphy :scopy nation.s surveys erence
United States National surveys
Local surveys New York City New Orleans Johns Hopkins University Texas
Yugoslavia Slovenia
1964 1970
1962 1962-1963 1965 1963
1960-1963
a From radiographic mass survey. blncluding fluoroscopic mass survey.
187 200
8 0.9
1.5
475 580
630 825
594
56 65
100
436
87 45
cln this case, one examination equals one radiograph. dThe figure in parentheses is a later figure that includes special children's clinics. e Revised estimates (27, 2 5 5). /Mean gonad dose per year rather than GSO.
16.Qt 63,164 20.oe 247,249, 28
50.0 161 75.3 106 20.3 148 16.0 38
9.1 141
94. Since the 1972 report a few further reports of investigations on the GSD in various countries and areas have become available. These may be usefully considered in two groups: countries or areas where there is an
advanced technical medical service and those that only have these facilities in the largest towns and cities. A summary of these recent surveys is given in table 19 and below.
TABLE 19. ANNUAL FREQUENCY OF X-RAY EXAMINATIONS AND GSD BY COUNTRY
Recent surveys
Annual number of x-ray examinations per 1000 of total population GSD (mrad)
DiaifllOStiC Mass survey Diag-Popu-lation Radio-
Country or area Period (JO') graphy
Germany, Fed. Rep. of (Hamburg) 1974 1.8 1 530
India 1967-72 550 35 Iraq 1972 10 1500 Japan 1974 105 676 Netherlands 1972 12.6 1 186 Puerto Rico 1973 3.0 502 Romania 1970 20.5 238 Sweden 1974-76 8.1 540 Switzerland 1971 6.3 1 350 Island of Taiwan (urban areas) 1972 5 43a United States 1970 195 669
aEstimate from data received.
(i) France. 1976
95. An estimate of the GSD in France, made by Reboul et aL (178-180) in 1959, was 58 mrad. Since then a large-scale study (163) was conducted in 1976 on the basis of I 06 radiological examinations for the purpose of providing an estimate of the mean gonad dose received by the members of the public. The per caput gonad dose
324
nostic Fluoro- Radio- Fluoro- exami-scopy graphy scopy nation.s
128 41 1.1
88a 52 134 16.5
28 40 56 46
322 452 28.5 110 46
42.9 100 3-4
20
found in the study is about i estimated GSD of about 3 measures taken by the nation:: suppression of obsolete fac quality of the examination authorized facilities, a decrea of the exposure received . achieved.
Mass surveys
Ref-erence
129 168
1 74, 79, 80 120 61
177 17
170 261 27
C f'. I!:! .rose iPto be ;'

--
I
(ii) Federal Republic of Gennany, 1972-1973
96. An assessment of the GSD in the Federal Republic of Germany has been made by Stieve for 1972-1973 on the basis of reported average values of the doses from various procedures. The GSD has been estimated as 50 mrad from medical sources (25. 224). Surveys were conducted in the Hamburg region in 1958, 1972 and 1974 (94, 129). The GSD increased from 17.7 to 37 to 41 mrad, respectively while the average annual number of examinations per person increased from 0.61 to 1.16 to 1.33.
(iii) India, 1967-1972
97. Surveys in four representative areas of India were used to obtain data on the frequency of examination, dose per examination and child expectancy factors (228). From these data the GSD was calculated for each district in each area. The four GSDs derived were 1.89, 0.77, 0.88 and 0.93 mrad for the state of Maharashtra (1967-1968). the state of Tamil Nadu (1969-1970), the northern region ( 1970-1971) and the eastern region {1971-1972). respectively. In those districts where the larger x-ray facilities existed, considerably higher GSDs were obtained (table 20). The GSD was weighted
TABLE 20. CONTRIBUTION TO TIIE ANNUAL GSD DUE TO DIAGNOSTIC RADIOLOGY
India, 1967-1972 (mrad)
District contrib· ution to
Male Female state or State or region region and Radio- Fluoro• Radio- Fluoro- Foetal Annual annual district graphy scopy graphy scopy dose GSD GSD
Maharashtra (1967-1968)
Bombay 6.059 0.447 1.308 2.592 0.240 10.646 1.118 Poona 0.725 0.043 0.158 0.743 0.201 1.870 0.117 Nagpur 1.875 0.001 1.259 0.482 0.435 4.052 0.155 Nasik 0.822 0.006 0.083 0.009 0.037 0.957 0.152 Sangli 0.281 0.004 0.157 0.041 0.007 0.490 0.015 Nanded 0.212 0.014 0.032 0.081 0.023 0.362 0.043 Ratnagiri 0.023 0.013 0.018 0.081 0.006 0.141 0.016 Buldhana 0.014 0.003 0.001 0.001 0.002 0.021 0.003 Sholapur 0.110 0.147 0.036 2.619 0.014 2.9]6 0.138
Overall 1.894
Tami1 Nadu (1969-1970)
Madras 4.1469 0.0048 1.4391 0.1646 0.2605 6.0159 0.3098 Madurai 0.3064 0.0003 0.4502 0.0418 0.0865 0.8852 0.0845 Coirnbatore 0.6209 0.0005 0.2171 0.0714 0.0475 0.9574 0.1010 Thanjavur 0.1403 0.0004 0.0534 0.0022 0.0074 0.2037 0.0196 Kanya-
kumari 0.1137 0.0023 0.1215 0.2185 0.0780 0.5340 0.0158
Overall 0.7664
Northern region (1970.1971)
Delhi 1.9751 0.0153 1.0166 0.1785 0.2590 3.4445 0.3257 Arnritsar 0.7500 0.0031 0.2000 0.0037 0.0417 0.9985 0.0426 Patiala 1.0474 0.0156 0.5999 1.0706 0.3271 3.0606 0.0868 Chandigarh 7.1332 0.7060 3.0894 8.5605 3.5231 23.0122 0.1377 Himachal 0.6457 0.0017 0.2240 0.0114 0.0359 0.9187 0.0739
Pradesh Hissar 0.0533 0.0008 0.0426 0.0004 0.0077 0.1048 0.0052 Hoshiarpur 0.0064 0.0009 0.0003 0.0018 0.0003 0.0097 0.0002 Jullundar 0.4307 0.0224 0.1337 0.0017 0.0273 0.6158 0.0203
Overall 0.8772
Eastern region (19 71-19 72)
Calcutta 5.4412 0.0089 3.4016 0.6293 0.1908 9.6718 0.2478 Cuttack 1.2770 0.0080 0.5430 0.1184 0.0098 1.9562 0.0611 Patna 0.7365 0.0161 0.4203 0.0298 0.0257 1.2284 0.0356 Ranchi 0.2963 0.0038 0.0785 0.0018 0.0065 0.3869 0.0082 Shahabad 0.0254 0.0078 0.0101 0.0454 neg 0.0887 0.0028 Ganjam 0.7832 0.0008 0.1531 neg neg 0.9371 0.0175 Sambalpur 1.2204 0.0004 0.4168 0.0012 neg 1.6388 0.0246 Saharsha 0.0006 neg 0.0103 neg neg 0.0109 0.0002
Overall 0.9337
Source: Reference 168.
325
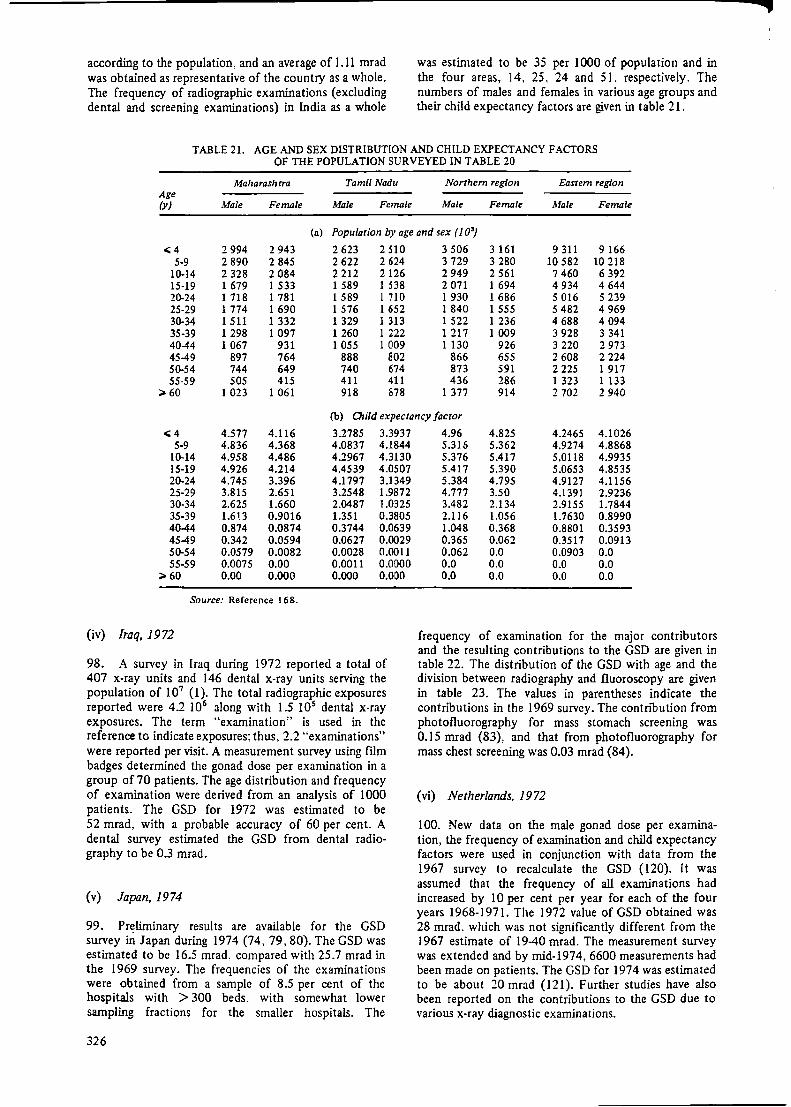
according to the population. and an average of 1.11 mrad was obtained as representative of the country as a whole. The frequency of radiographic examinations (excluding dental and screening examinations) in India as a whole
was estimated to be 35 per 1 OOO of population and in the four areas, 14, 25, 24 and 51. respectively. The numbers of males and females in various age groups and their child expectancy factors are given in table 21.
TABLE 21. AGE AND SEX DISTRIBUTION AND CHILD EXPECTANCY FACTORS OF THE POPULATION SURVEYED IN TABLE 20
Maharashrra Tamil Nadu Northern region Eastern region Age (y) Male Female Male Female Male Female Male Female
(a) Population by age and sex ( 1 O')
,;;4 2 994 2 943 2 623 2 510 3 506 3 161 9 311 9 166 5-9 2 890 2 845 2 622 2 624 3 729 3 280 10 582 10 218
10-14 2 328 2 084 2 212 2 126 2 949 2 561 7 460 6 392 15-19 1 679 1 533 1 589 I 538 2 071 I 694 4 934 4 644 20-24 1 718 1 781 1 589 1 710 1 930 1 686 5 016 5 239 25-29 1 774 1 690 1 576 1 652 1 840 1 555 5 482 4 969 30-34 1511 1 332 1 329 1 313 1 522 1 236 4 688 4 094 35-39 1 298 1 097 1 260 1 222 1 217 1 009 3 928 3 341 40-44 1 067 931 1 055 1 009 1130 926 3 220 2 973 45-49 897 764 888 802 866 655 2 608 2 224 50-54 744 649 740 674 873 591 2 225 1 917 55-59 505 415 411 411 436 286 1 323 1 133
;;, 60 1 023 1 061 918 878 1 377 914 2 702 2 940
(b) 0,i/d expectancy factor
..;4 4.577 4.116 3.2785 3.3937 5-9 4.836 4.368 4.0837 4.1844
10-14 4.958 4.486 4.2967 4.3130 15-19 4.926 4.214 4.4539 4.0507 20-24 4.745 3.396 4.1797 3.1349 25-29 3.815 2.651 3.2548 1.9872 30-34 2.625 1.660 2.0487 1.0325 35-39 1.613 0.9016 1.351 0.3805 40-44 0.874 0.0874 0.3744 0.0639 4549 0.342 0.0594 0.0627 0.0029 50-54 0.0579 0.0082 0.0028 0.0011 55-59 0.0075 0.00 0.0011 0.0000
;;, 60 0.00 0.000 0.000 0.000
Source: Reference 168.
(iv) Iraq, 1972
98. A survey in Iraq during 1972 reported a total of 407 x-ray units and 146 dental x-ray units serving the population of 107 (1). The total radiographic exposures reported were 4.2 106 along with 15 105 dental x-ray exposures. The term "examination" is used in the reference to indicate exposures; thus, 2.2 "examinations" were reported per visit. A measurement survey using film badges determined the gonad dose per examination in a group of 70 patients. The age distribution and frequency of examination were derived from an analysis of 1000 patients. The GSD for 1972 was estimated to be 52 mrad, with a probable accuracy of 60 per cent. A dental survey estimated the GSD from dental radiography to be 0.3 mrad.
(v) Japan, 1974
99. Pr~lirninary results are available for the GSD survey in Japan during 1974 (74, 79, 80). The GSD was estimated to be 16.5 mrad. compared with 25.7 mrad in the 1969 survey. The frequencies of the examinations were obtained from a sample of 8.5 per cent of the hospitals with > 300 beds. with somewhat lower sampling fractions for the smaller hospitals. The
326
4.96 4.825 4.2465 4.1026 5.316 5.362 4.9274 4.8868 5.376 5.417 5.0118 4.9935 5.417 5.390 5.0653 4.8535 5.384 4.795 4.9127 4.1156 4.777 3.50 4.1391 2.9236 3.482 2.134 2.9155 1.7844 2.116 1.056 1.7630 0.8990 1.048 0.368 0.8801 0.3593 0.365 0.062 0.3517 0.0913 0.062 0.0 0.0903 0.0 0.0 0.0 0.0 0.0 0.0 0.0 0.0 0.0
frequency of examination for the major contributors and the resulting contributions to the GSD are given in table 22. The distribution of the GSD with age and the division between radiography and fluoroscopy are given in table 23. The values in parentheses indicate the contributions in the 1969 survey. The contribution from photofluorography for mass stomach screening was 0.15 mrad (83), and that from photofluorography for mass chest screening was 0.03 mrad (84).
(vi) Netherlands, 1972
l 00. New data on the male gonad dose per examination, the frequency of examination and child expectancy factors were used in conjunction with data from the 1967 survey to recalculate the GSD ( 120). It was assumed that the frequency of all examinations had increased by 10 per cent per year for each of the four years 1968-1971. The 1972 value of GSD obtained was 28 mrad. which was not significantly different from the 1967 estimate of 19-40 mrad. The measurement survey was extended and by mid-1974, 6600 measurements had been made on patients. The GSD for 1974 was estimated to be about 20 mrad (121). Further studies have also been reported on the contributions to the GSD due to various x-ray diagnostic examinations.

f TABLE 22. FREQUENCY OF X-RAY EXAMINATIONS AND GSD BY SEX AND TYPE OF EXAMINATION
Japan, 1974 (Units: frequency, number of examinations per 1 OOO of population group; GSD, mrad)
Radiography Fluoroscopy Total
Male Female Male Female Fraction of total
Fre- Fre- Fre- Fre- Fre- GSD Type of examination quency GSD quency GSD quency GSD quency GSD quency GSD {%)
Chest 145 136 7 6 294 0.1 0.6 Stomach 59 0.2 46 1.1 56 0.3 43 2.0 204 3.6 22 Abdomen 12 0.3 10 0.3 2 0.2 2 0.5 26 1.3 7.9 Intestine 3 1.5 3 0.3 2 0.5 2 0.5 10 2.8 17 Lumbar, lumbosacral 23 0.7 17 0.8 0.5 0.3 0.2 41 1.7 10 Pelvis 2 0.4 3 0.2 0.1 0.1 5.2 0.7 4.3 Urography 3 0.1 3 0.4 0.7 0.1 0.5 0.2 7.2 0.8 4.9 Bladder 2 0.4 0.9 0.3 0.1 0.2 0.1 3.4 0.6 3.7 Hystero 0.7 0.1 0.1 0.1 0.8 0.2 1.2 Obstetric 1.9 0.5 1.9 0.5 3.0 Hip joint 9 2.2 10 0.9 0.1 0.1 0.1 0.2 18 3.4 21 Lower leg 34 0.5 20 0.5 0.3 55 0.6 3.7
Other 75.1 57.9 5.6 4.4 143 0.1 0.6
Total 367.l 6.4 309.4 4.7 74.8 1.5 59 3.9 809.5 16.4 100
Sources: References 74, 79, 80. Note: A dash(-) signifies that the GSD was less than 0.05 mrad.
TABLE 23. GSD FROM X-RAY EXAMINATIONS BY AGE AND SEX
Japan,1974 (mrad)
0-14y 15-29 y Type of examination Male Female Male Female
Radiography 1.51 1.16 4.22 3.24 (1.32) (0.61) (7 .23) (4.31)
Auoroscopy 0.20 0.53 1.04 3.00 (0.41) (0.64) (2.64) (5.62)
Total 1.71 1.69 5.26 6.24 (1.73) (1.25) (9.87) (9.93)
Sources: References 74, 80 Note: Values in parentheses are the 1969 dose values (74).
( vii) Puerto Rico
l O 1. In Puerto Rico a repeat in 1973 on the same basis as the 1968 survey included new frequency data derived from questionnaires about one week's work in all the hospitals (61). The new gonad doses per examination that are reported show apparent decreases compared with those in the 1968 survey. but these recent values would appear to be based on very few measurements. The frequency of lumbar spine and abdominal examinations, particularly in females, has increased the contribution to the GSD from these examinations by factors of three and two respectively. There was however no significant change in the overall GSD, which was estimated to be 46 mrad, compared with 43 mrad in the 1968 survey.
(viii) Romania, 1970
102. The frequency of the use of x rays in Romania during the period 1953 to 1970 increased from 429 to
30-44 y >4Sy
Male Female Male Female Total
0.63 0.32 0.02 0.0 11.1 (1.45) (0.30) (0.02) (15.2)
0.22 0.39 0.01 0.002 5.4 (0.54) (0.61) (0.01) (10.5)
0.85 0.71 0.03 0.002 16.5 {1.99) (0.91) (0.03) (25.7)
I O 12 examinations per I OOO of population. This increase has predominantly been in radiography (37 to 238) and photofluorography (54 to 452). with a slight decrease in fluoroscopic examinations (338 to 322). A measurement survey has been conducted in which direct patient measurements using thermoluminescent detectors have been made during 5370 radiological, 8750 fluoroscopic and 9370 photofluorography examinations: The GSD. has been estimated for the first time and a value of28.5 mrad obtained {177).
(ix) Sweden, 1974
103. From preliminary data reported by Bengtsson et al. {17), it is possible to analyze the changes that hav.e
. f hi h th GSD in Sweden occurred m the factors rom w c e ·. h was derived in the 1962 report by the Committee: ! ~ results of this analysis are shown in table 24. · ·
327

TABLE 24. ANALYSIS OF THE INCREASE IN THE GSD
Sweden, 1955-1974
Ratio of Ratio of GSD (mrad) examination gonad doses frequency 1974/1955 1955 1974
Type of 1974/ examination 1955 Male Female Male Female Foetus Male Female Foetus
Lumbosacral region 1.55 0.18 1.16 6.30 1.36 0.14 1.75 2.44 0.25 Pelvimetry 2.59 0.46a 0.28 6.40 0.33 1.35 Urography 2.59 0.27 0.95 3.48 1.17 .0.16 2.43 4.36 0.39 Pelvis 1.86 0.36 0.95 2.70 0.40 0.03 1.80 0.71 0.05 Abdomen 2.63 0.15 0.17 1.78 0.93 0.11 0.70 0.42 0.05 Colon 1.76 1.71 0.46 0.56 2.03 0.21 1.68 1.64 0.17 Hip and femur 2.70 1.38 1.42 2.19 0.25 0.01 8.16 0.96 0.04 Urethrocystography 2.25 0.54 0.77 1.57 0.14 0.02 1.90 0.24 0.03 Femurb 1.40 0.02 0.01 Obstetrical abdomen 2.33 0.57 0.06 1.20 0.08 1.59
Subtotal 20.0 7.2 8.3 18.4 11.2 3.9
Other 1.42 (No change assumed) 0.3 1.8 0.2 0.4 2.6 0.3
Total 20.3 9.0 8.5 18.8 13.8 4.2
Total of male, female and foetus totals for the year 37.8 36.8
Enhanced 1974 totals due to an assumed shift in age distribution 24.4 16.5 5.0
Total of enhanced totals
Source: Reference 131.
a For the mother; the ratio for the foetus is 0.03.
bNot included in comparison; no data for 1974.
104. It can be seen from table 7 that the total frequency of examinations (excluding dental exposures) increased by 50 per cent from 1955 to 1974. Table 24 shows that the increase in the types of examination which give the highest contributions to the GSD has been higher, nearly 100 per cent. The mean gonad doses in the various types of examinations have sometimes, but not always, been substantially reduced. The result is that the male contribution to the GSD has not changed despite the increased number of examinations. The female contribution, however, has increased approximately in proportion to the higher number of examinations, since there has been no apparent dose reduction in the types of examinations which give the highest contributions (e.g., urography and examinations of the lumbar spine). Due to improved techniques, the foetal contribution has decreased despite an increase in the number of pelvimetries. In total, the annual genetically significant dose from x-ray diagnostic procedures in Sweden has not changed significantly from the value of 38 mrad assessed for 1956, assuming no shift in the age distribution within the types of examinations giving the highest contributions. Bengtsson et al (17), however, take into account an enhancement due to shift towards younger patients, corresponding to a factor of 1.2 for females and 1.3 for males. If this correction is made on the results in table 24, the annual GSD will be assessed at about 46 mrad.
(x) Switzerland, 1971
105. A radiological survey of the frequency of 60 types of x-ray examinations was carried out during two weeks of September 1971 and information recorded on 60 OOO patients in 1567 hospitals (170). The total number of
328
46
films used in 1971 was estimated to be 15 106,
compared with 5 106 in 1957. The total number of examinations in 1971 was estimated to be 8.55 106
•
increasing annually at the rate of 34 per cent. The number of examinations per caput of the population increased from 0.96 in 1957 to 1.35 in 1971. The GSD for 197 I was estimated to be 42.9 mrad; the breakdown by type of examination is given in table 25. A calculation shows that by using suitable gonad shielding the GSD could be reduced by 20 per cent to 34.9 mrad.
TABLE 25. BREAKDOWN OF GSD BY TYPE OF EXAMINATION
Switzerland, 1971
Contribution to GSD
Type of examination (mrad) (%)
Pelvis without pregnancies 9.24 21.5 Descending urography 8.74 20.4 Hip and femur 6.24 14.5 Lumbar vertebrae 3.81 8.9 Barium meal 2.19 5.1 Barium enema 1.91 4.5 Urography 1.29 3.0 Obstetric abdomen 1.06 2.5 Abdomen without pregnancies 1.01 2.3 Pclvimetry 0.52 1.2 Other 6.89 16.1
Total 42.90 100
Source: Reference I 70.
(xi) Island of Taiwan, 1972
I 06. A survey was conducted over eight months of I 972 in five hospitals in the city of Hsineku, considered

F
to be representative of the five major cities on the i'sland of Taiwan, where the urban population is 5 106 (261). about one half of the total population. The method of estimating the frequency of: examination and the gonad dose per examination was simplified. It would appear from the reference that the radiation dose incident to the gonad region was integrated, using a thermoJuminescent detector, for all patients examined radiographically over a period of one month on five x-ray units at the five chosen hospitals. A separate detector was used for those patients having fluoroscopic examinations. A mean gonad dose was used for all examination types, and the age distribution of those examined was used in the calculation of the GSD for 1972, which was found to be 3-4 mrad.
(xii) United States surveys in 1964 and 1970
107. The dosimetry of the United States surveys in 1964 and I 970 has been revised, and the new national estimates of the GSD in those years from radiographic examinations only are 16 and 20 mrad, respectively (25 I, 255). The contribution from screening examinations was not included. The main examinations and their contributions (per cent) to the 1970 total were as follows: lumbar spine, 18; urography, 16; pelvis, 12: abdomen KUB and flat plate, 10; other abdominal examinations, 20; barium enema, 10; hip, 5. The frequency of x-ray examinations is given in table 26.
TABLE 26. FREQUENCY OF X-RAY EXAMINATIONS BY TYPE OF EXAMINATION
United States, 1970
Type of examination
Head and neck Oiest
Radiography Photofluorography Not categorized
Oiolecystography, and cholangiography
Lumbar and dorso-lumbar spine Upper GI tract Upper abdomen not categorized Abdomen KUB and flat plate Urography Barium enema Pelvis, lumbo-pelvis Lower abdomen not categorized Upper extremities Lower extremities Two-area examinations
Total
Source: Reference 2 51.
Frequency (number of examinations per 1 OOO of population)
49.8
251.7 53.7 32.5
20.7 18.7 29.1
8.0 17.5 20.7 17.8 10.6 22.7 50.9 62.6
1.8
668.8
(xiii) Projections of GSD for other countries
108. Three new estimates of GSD {India, Iraq and Taiwan) have been reported for populations that have limited radiological facilities. Low frequencies of radiological examinations correlate in principle with small GSD. unless very high individual doses are involved. A
WHO staff report (64) describes the present status of radiological services in several countries of the eastern Mediterranean area. The report compared the average of one diagnostic x-ray unit per 72 OOO people with the United States situation of one unit per 1000 people, and the film consumption of 0.063 film per person-year with the United States value of 2.46 films per person-year.
4. Groups of epidemiological interest
109. Collective doses to special patient groups are of particular interest when they can be used for epidemiological studies. Annex G describes in detail the use of such information, from past medical practices, for the assessment of carcinogenesis risks.
110. The organs of special interest in these investigations, for which dose information are required, are:
Public health investigations:
Dental
Mass surveys of the chest
Mammography
Ginical investigations:
Barium meal
Barium enema
Orography
Children with orthopaedic handicaps
Skin, thyroid, hypothalamus, lens of the eye: particularly for patients having regular wholemouth x-ray examinations
Lung, heart, thyroid, bone marrow; particularly for patients with a history of chronic chest disease
Breast; particularly for groups of high breast-cancer risk
Stomach, bone marrow, small intestine, pancreas; particularly for patients having multiple fluoroscopic examinations
Large intestine, particularly for patients with chronic diseases such as ulcerative colitis
Kidney, particularly in patients with chronic disease or kidney failure
Epiphyses of bones, gonads, bone marrow
Foetal irradiation Whole body of foetus
Cardiac Heart, lung, bone marrow; catheterization particularly in children
Pace-maker insertions
Dynamic investigations
Neurological examinations
Heart. lung. bone marrow and connective tissues in vicinity of nuclear-powered pace-makers; particularly in patients under 40 years of age
Organs in the chest for cardiac investigations and the kidneys, large intestine, bladder and gonads for pelvic examinations
Eye, thyroid, hypothalamus
329
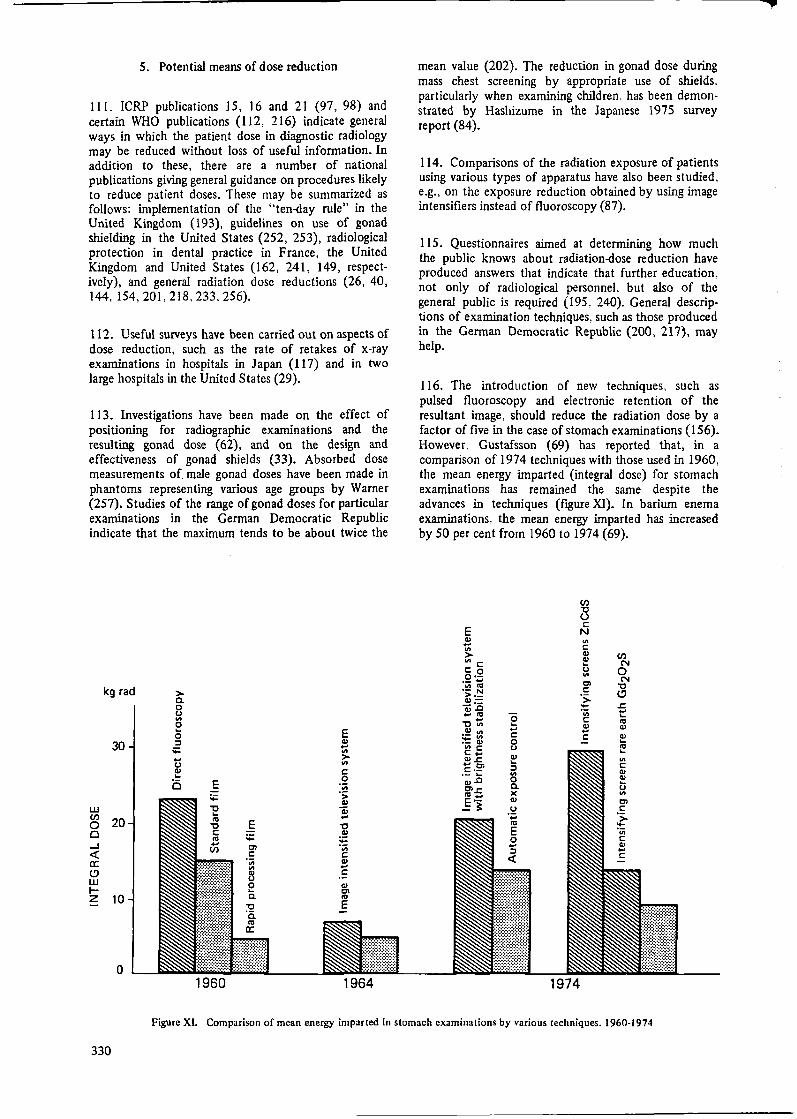
5. Potential means of dose reduction
Ill. ICRP publications 15, 16 and 21 (97, 98) and certain WHO publications (I 12, 216) indicate general ways in which the patient dose in diagnostic radiology may be reduced without loss of useful information. In addition to these, there are a number of national publications giving general guidance on procedures likely to reduce patient doses. These may be summarized as follows: implementation of the "ten-day rule'' in the United Kingdom (193), guidelines on use of gonad shielding in the United States (252, 253), radiological protection in dental practice in France, the United Kingdom and United States (162, 241, 149, respectively), and general radiation dose reductions (26, 40, 144,154,201,218,233,256).
112. Useful surveys have been carried out on aspects of dose reduction, such as the rate of retakes of x-ray examinations in hospitals in Ja pan ( 117) and in two large hospitals in the United States (29).
113. Investigations have been made on the effect of positioning for radiographic examinations and the resulting gonad dose (62), and on the design and effectiveness of gonad shields (33). Absorbed dose measurements of male gonad doses have been made in phantoms representing various age groups by Warner (257). Studies of the range of gonad doses for particular examinations in the German Democratic Republic indicate that the maximum tends to be about twice the
kg rad
30-
w en 20-0 Cl ...J <C a: (!) w I-z 10-
0
> c. 0 tJ "' 0
0 ::,
;;:
ti Cl) ... c E
:,::
'E "' 'C C:
"' ... en
1960
E :,:: Cl C:
'iii
fl 0 c.
'C 'c. "' a:
E Cl) ... "' > "' C: 0
"iii ·;;:
Cl)
ai ... 'C Cl)
;;: 'iii C: Cl) ... C:
Ill Cl
"' E
1964
mean value (202). The reduction in gonad dose during mass chest screening by appropriate use of shields, particularly when examining children. has been demonstrated by Hashizume in the Japanese 1975 survey report (84).
114. Comparisons of the radiation exposure of patients using various types of apparatus have also been studied, e.g., on the exposure reduction obtained by using image intensifiers instead of fluoroscopy (87).
115. Questionnaires aimed at determining how much the public knows about radiation-dose reduction have produced answers that indicate that further education, not only of radiological personnel, but also of the general public is required (195. 240). General descrip· tions of examination techniques, such as those produced in the German Democratic Republic (200, 217}, may help.
116. The introduction of new techniques, such as pulsed fluoroscopy and electronic retention of the resultant image, should reduce the radiation dose by a factor of five in the case of stomach examinations ( 156). However, Gustafsson (69) has reported that, in a comparison of 1974 techniques with those used in 1960, the mean energy imparted (integral dose) for stomach examinations has remained the same despite the advances in techniques (figure XI). In barium enema examinations, the mean energy imparted has increased by 50 per cent from 1960 to 1974 (69).
E Cl) ... "' > "' C: C: 0 O•-·- ... "'"' •- N >--~~ ... "' "'O t: ~~ ·- Cl) "'C C: ... 111..C: ... Cl C:,·- ... 111..0 Cl..c: "' ... E·-;:
0 ... ... C: 0 tJ Cl) ... ::, "' 0 c. X Cl)
tJ ·;:. "' E 0 ... ::,
<C
en "O u C:
N
"' C: Cl) (/) Cl) ... N tJ 0 "' N Cl "O C: (!) > - ..c:
"iii ... ... C: "' Cl) Cl) ... C: Cl) ...
"' ~~ ... "' C: Cl) Cl) ... tJ
"' Cl C:
'> -'iii C Cl) ... C:
1974
Figure XL Comparison of mean energy imparted in stomach examinations by various techniques, 1960-1974
330

F
B. DL\.GNOSTIC USES OF RADIOPHARMACEUTICALS
1. Trends in frequencies and techniques
117. In the 1972 report attention was drawn to the fact that in certain countries the number of diagnostic examinations using radiopharrnaceuticals was doubling approximately every three years. This trend is continuing, and therefore it is important that more data should be presented so that estimates of organ dose and GSD may be calculated. Most examinations using radiopharmaceuticals give organ doses of about the same order as or less than complementary x-ray examinations (99, 238). Examination of the thyroid using 1 31 I is the main exception, but with the introduction of alternative in vitro techniques, the number of in vivo tests using 131 I is likely to decline (172). The growth of radioisotope uses in developing countries is being monitored by lAEA (96); from their data it may be possible to assess the effect of the introduction and general availability of short-lived radiopharrnaceuticals and the changes in demand resulting from new x-ray facilities, such as computerized axial tomography.
118. The annual frequency of radionuclide examinations was given in the 1972 report for a number of countries for the late 1960s as 2-10 per 1000 of population. With a doubling time of three years, it is now, in several places, approaching and even exceeding 10 per 1000 of population as can be seen in figure XII arid in table 27 (93). which show the increase in the
30000
"' ~ 20000
~ ::; t < ~ ~ ; 10000 :::, z
I 99fflr, /
/ ll1111ododol
/ i
/ .," 13tl(Hipp$anl I ~
}~.,,,, ,"j ......• 198Au
o k::::;::::::::=......,. ...... ql!.:l:<~,~.:.,~;;:;·;~;~~~;,··~.:;:.:,.:~·;~;;::;~:..f::'.·~:.:··.·=:.:.::_:..:·;.-_5..:;7eo.::_51co::_
~ ~ 1~ = 11155
Figure XII. Trend in the annual number of applications of certain radionuclides in West Berlin, 1953-1975 (93)
TABLE 27. SURVEY OF THE DEVELOPMENT OF NUCLEAR MEDICINE IN WEST BERLIN, 1955-1975
(1975 population approximately 2.2 106)
Number Fre- Distribution by purpose of all quency of application (%) radionuclide (per I (}Q() of
Year applications population) Diagnostic Therapeutic
1955 1960 1965 1970 1975
729 4 220
15 228 30 236 64 720
0.32 1.92 6.92
13.87 32.29
Source: Reference 93.
90.5 91.0 97,1 98.1 99.2
9.5 9.0 2.9 1.9 0.8
TABLE 28. SURVEY OF THE DEVELOPMENT OF NUCLEAR MEDICINE IN THE GERMAN DEMOCRATIC REPUBLIC, 1965-1974
(1974 population approximately 17 106)
Number Distribution by purpose of all Frequency of application (%) radionuclide (per 1000 of
Year applications population) Diagnostic Therapeutic
1965 25 913 1.5 96.96 3.04 1966 31 895 1.9 97.06 2.94 1967 42 461 2.5 97.67 2.33 1970 71 378 4.2 98.79 1.21 1971 77 172 4.5 98.75 1.25 1972 131 021 7.7 99.20 0.80 1973 137 128 8.0 98.94 1.06 1974 167 483 9.9 99.16 0.84
Source: Reference 202.
TABLE 29. TRENDS IN THE 1 3' I-UPTAKE TESTS IN THE
GERMAN DEMOCRATIC REPUBLIC, 1958-1974
(Administered activity 25-30 µCi)
Fraction of all radio-nuclide Frequency diagnostic of test Number of
Number examin- (per l(J()()of performing Year of tests ations (%) population) facilities
1958 729 2 1960 2 818 6 1965 10 192 40.6 11 1970 20 092 28.5 14 1971 21 902 27.8 15 1972 26 326 21.6 16 1973 25 170 18.5 16 1974 24 969 15.0 1.47 17
Source: Reference 202.
annual number and frequency of application of radiopharmaceuticals in West Berlin (91, 92, 93 186), and in table 28, which show similar data for the German Democratic Republic (202). Table 29 shows the reduction in the frequency of 131 I-uptake tests in the German Democratic Republic in the last few years due to the introduction of in vitro techniques.
119. The introduction of new nuclides in radiophannaceuticals giving lower doses for some types of examinations has to some extent minimized the increase in dose that would be expected from the rapid increase in the number of radiopharmaceutical examinations. This is illustrated in figure XIII, which shows how the change froin 198 Au to 9 9 m Tc in liver scans has reduced the gonad dose per examination by a factor of three so that the collective dose has increased but little, even though the total number of examinations has increased substantially (151 ). Roedler et al (186) have calculated the achievable dose reduction for examined or critical organs and gonads by selection of suitable radiopharmaceuticals (see table 30). The most promising dose reductions have been made possible by the introduction in the mid 1960s of 9 9 m Tc, which is now in increasing use all over the world.
331
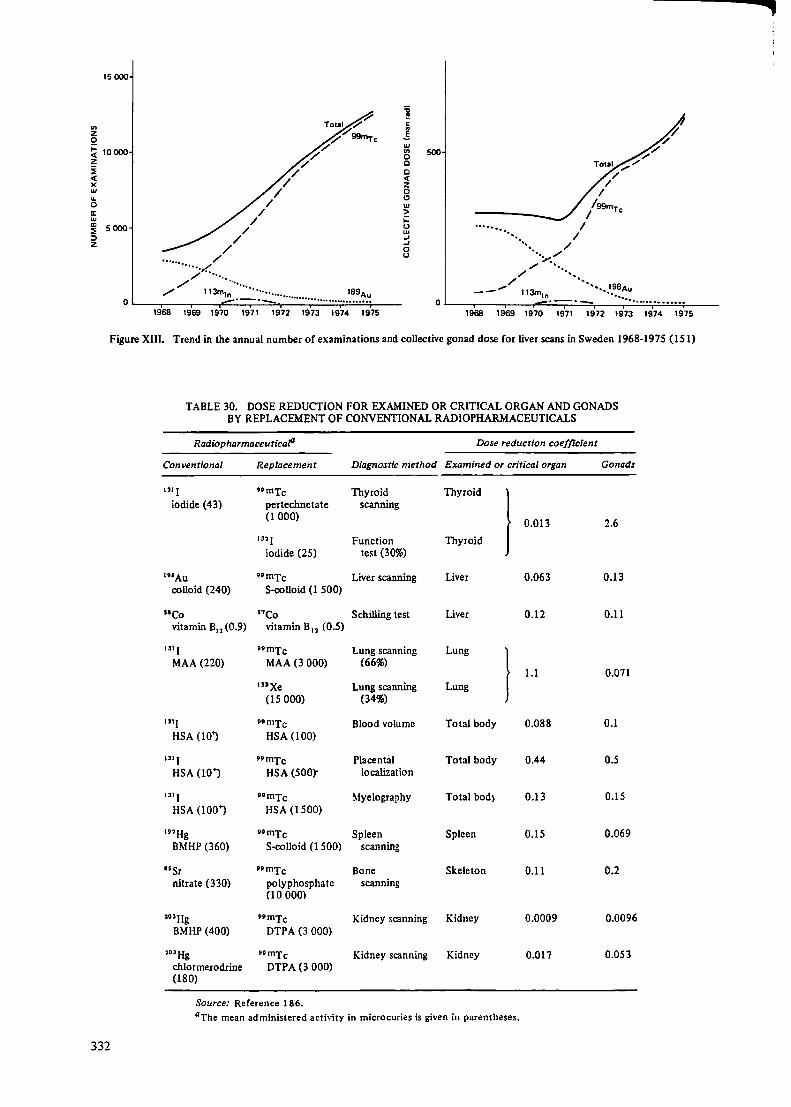
en z 0
15000
~ 10000 z i <( X w ... 0 a: w ; 5000 :, z /
'"······)~: ..
/ /
/
/
/ /
/ /
~ Total 7
'/ '/ 99tnr C
/'/'/
j C:
1 w "' 500 0 0 0 <( z 0 C)
w > ~ (.) w .J .J 0 (.)
Total .,,."' /
/ /
/99mT / C
·········•.. // ....... /
-~/
.,,....... ··· ... / ...
/'/
~ ;,
/ ········· O ...__.,..,,, __ ~1_1_3m.,.,1,::n:..·::~_··:..:·:_==· .. ,,. ........ _···_··_· .. ~··-":..:··:..:·"::;":;:··:.:.·~8:.:.•~:.:.•'::.;·~--
__ ..- 113mln '•,,,198Au
0 L....-,--~---,o..::.:·:=-=:-;::.:·-=-~-·-·~··-=··.:.:"=-=··;:.··c.e·.?.,"'!.''!.;'--1968 1969 1970 1971 1972 1973 1974 1975 1968 1969 1970 1971 1972 1973 1974 1975
Figure XIII. Trend in the annual number of examinations and collective gonad dose for liver scans in Sweden 1968-1975 (15 I)
TABLE 30. DOSE REDUCTION FOR EXAMINED OR CRITICAL ORGAN AND GONADS BY REPLACEMENT OF CONVENTIONAL RADIOPHARMACEUTICALS
Radiopharmaceuticafl Dose reduction coefficient
Conventional Replacement Diagnostic method Examined or critical organ Gonads
"'I "mTc Thyroid Thyroid
} iodide (43) pertechnetate scanning
(1000) 0.013 2.6
'" I Function Thyroid iodide (25) test (30%)
19'Au 99 mTc Liver scanning Liver 0.063 0.13 colloid (240) S-colloid (1 500)
58Co "Co Schilling test Liver 0.12 0.11 vitamin B12 (0.9) vitamin B12 (0.5)
1311 nmTc Lung scanning Lung
} MAA (220) MAA(3 000) (66%)
1.1 0.071 '"Xe Lung scanning Lung
(15 OOO) (34%)
"'I 99mTc Blood volume Total body 0.088 0.1 HSA (10') HSA (100)
"' I nmTc Placental Total body 0.44 0.5 HSA (10"') HSA (500)"" localization
1311 ••mTc Myelography Total bod} 0.13 0.15 HSA (100"') HSA (1500)
'"Hg t9mTc Spleen Spleen 0.15 0.069 BMHP (360) S-colloid (1 SOO) scanning
15Sr nmTc Bone Skeleton 0.11 0.2 nitrate (330) polyphosphate scanning
(10 OOO)
1o•Hg 9tmTc Kidney scanning Kidney 0.0009 0.0096 BMHP (400) DTPA (3 OOO)
l03Hg t9mTc Kidney scanning Kidney 0.017 0.053 chlormerodrine DTPA (3 OOO) (180)
Source: Reference 186. 0 The mean administered activity in microcuries is given in parentheses.
332
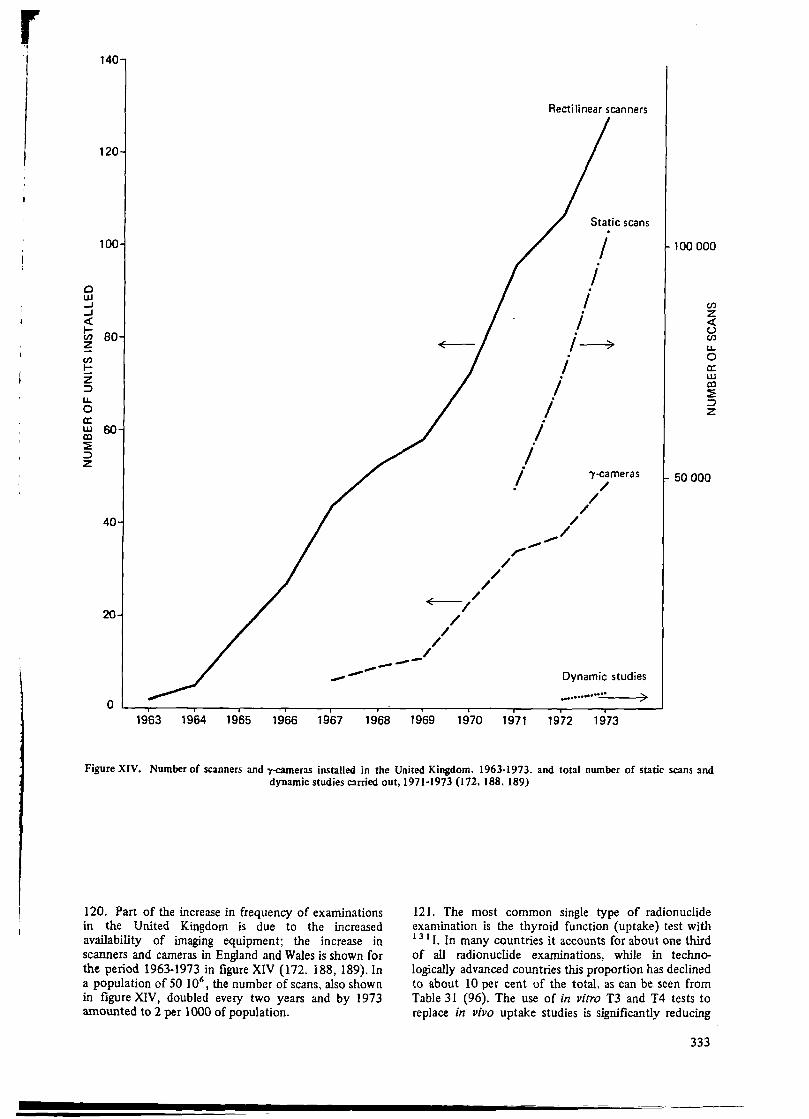
0 w ..J ..J <
140
120
100
!;; 80 z en t:: z :, u. 0 a: ~ 60 ~ :, z
40
20
0 ---
/ /
~/ /
/ /
/ / ----
/
Rectilinear scanners
Static scans
I I .
I i ,~
I i
i i
I i
,,,.. ..... /
.,.../
')'-cameras /
/ /
Dynamic studies
············-"--7>
100 OOO
en z < u en u. 0 a: w CX)
:E :::, z
50 OOO
1963 1964 1965 1966 1967 1968 1969 1970 1971 1972 1973
Figure XIV. Number of scanners and r-cameras installed in the United Kingdom. 1963-1973. and total number of static scans and dynamic studies carried out, 1971-1973 (I 72, 188, 189)
120. Part of the increase in frequency of examinations in the United Kingdom is due to the increased availability of imaging equipment; the increase in scanners and cameras in England and Wales is shown for the period 1963-1973 in figure XIV (172, 188, 189). In a population of 50 106
, the number of scans, also shown in figure XIV, doubled every two years and by 1973 amounted to 2 per 1000 of population.
121. The most common single type of radionuclide examination is the thyroid function (uptake) test with 13 1 I. In many countries it accounts for about one third of all radionuclide examinations, while in technologically advanced countries this proportion has declined to about 10 per cent of the total, as can be seen from Table 31 (96). The use of in vitro T3 and T4 tests to replace in vivo uptake studies is significantly reducing
333

TABLE 31. RELATIVE PROPORTION OF IODINE-131 THYROID UPTAKE STUDIES IN VARIOUS COUNTRIES
Country Fraction of all radionuclide investigations (%)
Argentina Brazil Denmark (1973/74) Hungary India Israel Mexico Poland Sweden (1968) Sweden (1974) United State~ Yugoslavia
Source: Reference 96.
40 47
9 27 38 18 23 30 19 12
8 22
aData from 65 academic divisions of nuclear medicine (231).
TABLE 32. FREQUENCY OF 1 3 1 1-UPT AKE STUDIES AND THE ACTIVITY ADMINISTERED IN VARIOUS COUNTRIES
Frequency Population (per lOOOof
Country (10 6) population)
Argentina 24.0 0.66 Brazil 91.3 0.18 Denmark
(1973) 5.06 0.89 Hungary 10.3 1.40 India 537.0 0.013 Israel 2.82 2.29 Sweden 7.9 1.14 Mexico 48.9 0.12 Poland 32.5 0.46 United
States (1966) 195.0 1.54 Yugoslavia 20.4 0.66
Source: Reference 96.
Administered activity (,sCi)
Mean (popu-lation
Range weighted)
5-100 44 20-70 41
20 0.5-50 16
740 16 6-35 21
2.5-35 9 5-50 14 5-60 13
2.5-100 37 5-100 31
TABLE 33. FREQU.,ENCY OF 1 31 I THYROID SCANS AND THE ACTIVITY ADMINISTERED IN VARIOUS COUNTRIES
Frequency Population (perlOOOof
Country (106) population)
Argentina 24.0 0.23 Brazil 91.3 0.093 Denmark 5.06 0.23 Hungary 10.3 0.36 India 537.0 0.003 Israel 2.82 1.38 Sweden 7.9 1.53 Mexico 48.9 0.077 Poland 32.5 0.14 United
States (1966) 195.0 0.78 Yugoslavia 20.4 0.63
Source: Reference 96.
334
Administered activity (,sCi)
Mean (popu-lation
Range weighted)
50-100 80 15-300 71
78 15-50 32 20-100 41 10-50 31 4-100 41
50-180 116 10-100 50
10-150 57 20-100 45
the radiation dose to this group of patients in the United Kingdom (I 72). The introduction of the use of 123 I for thyroid imaging would reduce the dose by a factor of <1bout 10 compared with 131 I (254).
122. It is possible to complete the picture of the use of 131 I by presenting some data compiled by IAEA (96) on the us!l of r:idionuclides in 11 countries for periods around 1970. Tables 32 and 33 give the frequencies, the average administered activities and the range of activities in these countries for thyroid uptake studies and thyroid scans with 1 3 1 I. It has already been shown ( table 31) that thyroid uptake studies dominate the number of radionuclide examinations in many countries. It can be seen from table 32 that, with the exception of India, there is relatively little variation in the frequency of uptake studies, the range being 0.12-2.29 per 1000 of population. Table 33 shows that there is. on the average one 1 3 1 I thyroid scan for every two uptake tests. The administered activities range between 9 and 44 µCi for the uptake studies and between 31 and 116 µCi for the scans. It is important to obtain more recent information on these aspects, as the situation is likely to have changed significantly in the last eight years.
2. Individual dose per unit procedure
(a) Administered activity
123. As with x-ray examinations, the doses received during radiopharmaceutical examinations vary from hospital to hospital. In this case, however. comparisons are somewhat easier because the choice of nuclide, chemical substance. mode of administration and administered activity define the dose for any particular investigation of disease. Interesting comparisons may therefore be made on the basis of the administered activity, once the other factors are kept constant, which is usually the case within each type of examination and for each nuclide.
124. Data are available from Sweden on the average activity used in each type of examination and on the lowest and highest average activities used in particular clinics. On the basis of the reported average activity, the highest organ dose (in the average procedure) has been calculated, together with the gonad dose. The results are shown in tables 34 and 35 for 1968 and 1974 (151). The doses have been calculated using data from Swedish compilations (59).
125. Tables 34 and 35 may be compared with tables 36 and 37. where similar information is presented for Denmark (1973-1974) and the United States (1966) (219, 248). There is a great degree of similarity in the practices for the corresponding years. These recent data give a relatively clear picture of the magnitude of radionuclide examinations in technologically developed countries for the year I 974. The variation in administered activities in three of the most common types of examinations is shown in table 38.
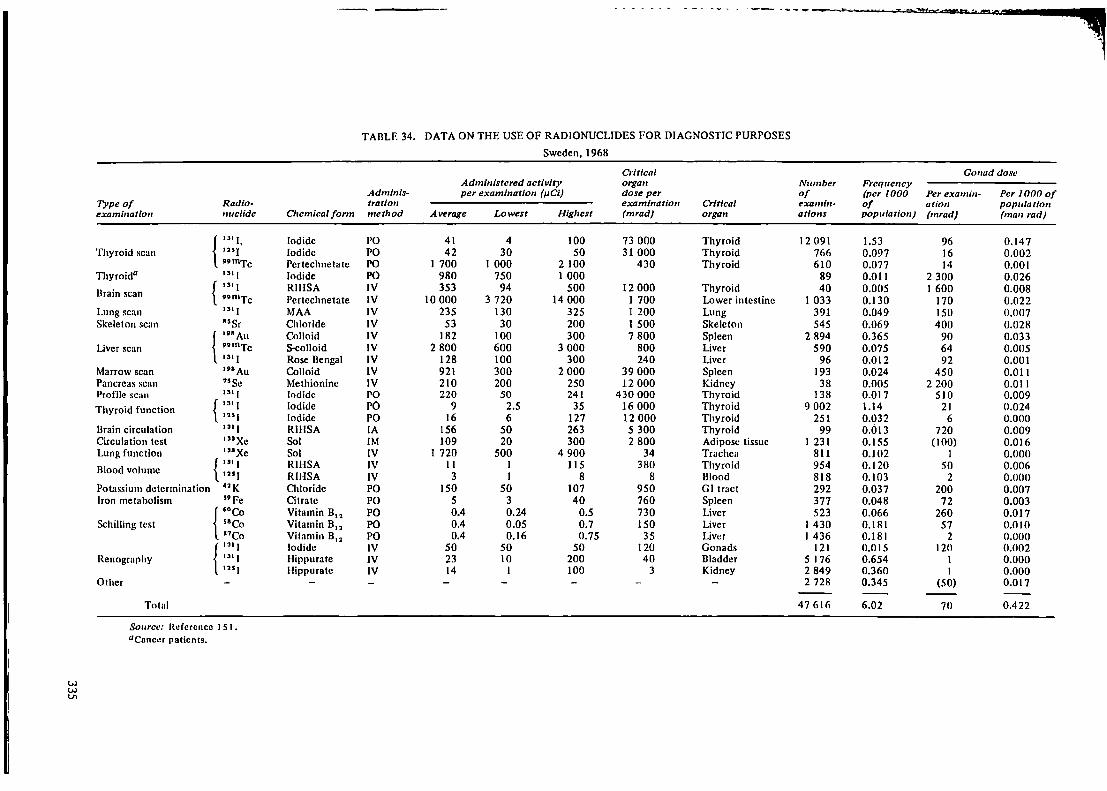
TABLE 34. DATA ON THE USE OF RADIONUCLIDES FOR DIAGNOSTIC PURPOSES
Sweden, 1968
C,-it/cal Gonad dose Administered activity organ Number Frequency
Admlnis- per examination (µ.Cl) dose per of (per 1000 Perexamln- Per 1000 of Type of Radio- tration examination Critical examin- of ation population exami11atio11 nuclide Cltemical fonn metltod Average Lowest Higllest (mrad) organ ations population) (mrad) (man rad)
{ rn 1, Iodide l'O 41 4 100 73 OOO Thyroid 12 091 1.53 96 0.147 Thyroid scan '"I Iodide PO 42 30 50 31 OOO Thyroid 766 0.097 16 0.002
vvmTc Pertechnetatc PO I 700 1 OOO 2 100 430 Thyroid 610 0.077 14 0.001 Thyroida "' I Iodide PO 980 750 1 OOO 89 0.011 2 300 0.026
Brain scan { ,,. I RIIISA IV 353 94 500 12 OOO Thyroid 40 0.005 I 600 0.008 tvmTc Pertechnetate IV 10 OOO 3 720 14 OOO I 700 Lower intestine I 033 0.130 170 0.022
Lung scan "'I MAA IV 235 130 325 I 200 Lung 391 0.049 ISO 0.007 Skeleton scan 85 Sr Chloride IV 53 30 200 1 500 Skeleton 545 0.069 400 0.028
{ ,v"Au Colloid IV 182 100 300 7 800 Spleen 2 894 0.365 90 0.033 Liver scan 9911\Tc S-Colloid IV 2 800 600 3 OOO 800 Liver 590 0.075 64 0.005
131 I Rose Bengal IV 128 100 300 240 Liver 96 0.012 92 0.001 Marrow scan ,nAu Colloid IV 921 300 2 OOO 39 OOO Spleen 193 0.024 450 0.011 Pancreas scan 75 Se Methionine IV 210 200 250 12 OOO Kidney 38 0.005 2 200 0.011 Profile sc:1n "'I Iodide PO 220 50 241 430 OOO Thyroid 138 0.017 510 0.009 Thyroid function { "' I Iodide PO 9 2.5 35 16 OOO Thyroid 9 002 1.14 21 0.024
'"I Iodide PO 16 6 127 12 OOO Thyroid 251 0.032 6 0.000 Brain circulation 1311 RII-ISA IA 156 50 263 5 300 Thyroid 99 0.013 720 0.009 Circulation test '"Xe Sol IM 109 20 300 2 800 Adipose tissue I 231 0.155 (100) 0.016 Lung function 111Xe Sol IV I 720 500 4 900 34 Trachea 811 0.102 I 0.000
Blood volume { "'I RIHSA IV II I 115 380 Thyroid 954 0.120 50 0.006 12SJ RIHSA IV 3 I 8 8 Blood 818 0.103 2 0.000
Potassium determination •2K Chloride PO ISO so 107 950 GI tract 292 0.037 200 0.007 Iron metabolism s9Fe Citrate PO 5 3 40 760 Spleen 377 0.048 72 0.003
r·eo Vitamin B11 PO 0.4 0.24 0.5 730 Liver 523 0.066 260 0.017 Schilling test 58Co Vitamin B12 PO 0.4 0.05 0.7 ISO Liver I 430 0.181 57 0.010
57Co Vitamin B12 PO 0.4 0.16 0.75 35 Liver I 436 0.181 2 0.000 { 1ai I Iodide IV so 50 50 120 Gonads 121 0.015 120 0.002
Renography "' I Hippurate IV 23 10 200 40 Bladder 5 176 0.654 I 0.000 '"I Hippurate IV 14 I 100 3 Kidney 2 849 0.360 I 0.000
Other 2 728 0.345 (50) 0.017
Total 47 616 6.02 70 0.422
Source: Reference I SI • aconcer patients.
w w Vo

TABLE 35. DATA ON TIIE USE OF RADIONUCLIDES FOR DIAGNOSTIC PURPOSES
Sweden, 1974
Critical Gonad dose Administered activity orga,1 Number Frequen,•y
Adminis- per examination (µCi) dose per of (per 1000 Per exa- Per 1000 of Type of Radio- Chemical tration examination Critical examin- of minatio,1 population examination nuclide form method Average Lowest Highest (mrad) organ ations population) (mrad) (man rad)
u1 1 Iodide PO 86 4 1 OOO 153 OOO Thyroid 10 101 1.22 202 0.246 Thyroid scan '"I Iodide PO 25 I I 40 18 500 Thyroid 265 0.032 10 0.000
,,mTc Pcrtechnctatc IV 1 810 600 5 OOO 920 Thyroid 3 647 0.439 30 0.013
Brain scan ,,mTc Pertechnctate IV 10 950 5 OOO 15 OOO 1 860 Lower intestine 10 894 1.31 185 0.242 umTc DTPA IV 14 360 14 OOO 14 700 5 600 Bladder I 382 0.166 280 0.047
Lung scan "'I MAA IV 767 300 1 500 3 900 Lung 200 0.024 490 0.012 "mTc MAA IV I 780 I OOO 3 OOO 90 Blood 2 084 0.251 20 0.005
Skeleton scan "Sr 01loridc IV 66 40 100 1 900 Skeleton 831 0.100 500 0.050 umTc Phosphate IV 8 670 4 OOO 15 OOO 1 765 Bladder 3 926 0.473 135 0.064
Liver scan '98Au Colloid IV 138 120 175 5 900 Spleen 162 0.020 68 0.001
,,mTc S-colloid IV 2 050 500 5 OOO 585 Liver 10 600 1.28 47 0.060 Marrow scan 19"Au Culluid IV 833 500 1 aoo 35 OOO Spleen 97 0.012 410 0.005
Pancreas scan {'5Se Metionine IV 240 200 250 13 500 Kidney 328 0.039 2 500 0.098 99111Tc 8-colloid IV 2 OOO 2 OOO 2 OOO 570 Liver 236 0.028 46 0.001
Profile scan "'J Iodide PO 479 100 950 936 OOO Thyroid 155 0.019 I 100 0.021 Thyroid function "' I Iodide PO 12 2 30 21 OOO Thyroid 11 796 1.42 28 0.040 Thyroid0 1>1 I Iodide PO 279 200 357 346 0.042 640 0.027 Circulation test '"Xe Sol IM 319 8 1400 8 200 Adipose tissues 259 0.031 (300) 0.009 Lung function "'Xe Sol IV 2 517 263 10 500 50 Trachea 2 652 0.319 I 0.000 Blood volume { "'I RIHSA IV 4.4 1.5 6 150 Thyroid I 546 0.186 20 0.004
125 ( RIHSA IV 4.6 0.7 10 12 Blood 695 0.084 3 0.000 Iron metabolism "Fe Chloride PO 6.9 0.6 20 I 050 Spleen 484 0.058 JOO 0.006
Schilling test { "Co Vitamin B12 PO 0.57 0.05 0.8 210 Liver 727 0.088 80 0.007 51Co Vitamin B12 PO 0.44 0.05 0.5 38 Liver I 682 0.203 2 0.000
{'" I Hippurate IV 32 6 200 56 Bladder 11 475 1.38 I 0.001
Renography '"J Hippuratc IV 17 6 40 4 Kidney 8 311 1.00 I 0.001 I SI I RIHSA IV 10 10 10 340 Thyroid 110 0.013 45 0.001
Other 10 774 1.30 (50) 0.065
Total 95 765 11.5 80 0.922
Source: Reference IS I.
acancer patients.

.. ,
TABLE 36. DATA ON 'fHE USE OF RADIONUCLIDES FOR DIAGNOSTIC PURPOSES
Denmark, 1973/74
Go11addo:se Frequency Administered
Number of (per 1000 activity per Perexamin- Per 1000 of Radio· Cllemlcal aamin- of popu- examination at/011 poplllation
Type of examination ,wclfde fonn at/ons latfon) (µCl) (mrad) (ma11 rad)
Thyroid scan { Ill I Iodide 1 187 0.235 78 183 0.043
umTc Pertechnetate 2 605 0.515 1 493 25 0.013 Brain scan nmTc Pertechnetate 8 624 1.70 11 890 200 0.340
{ "'l MAA 334 0.066 293 187 0.012 Lung scan umTc Microspheres 714 0.141 I 467 19 0.003 Skeleton scan nmTc Phosphate 1 409 0.278 10 250 154 0.043 Liver scan "mTc S.Colloid 2463 0.487 1 689 56 0.027 Pnncroos scan 75 Sc Methionine 46 0.009 263 2 740 0.025
Thyroid function { ,,, I Iodide 4 525 0.894 20 47 0.042
••mTc Pertechnetate 447 0.088 1 OOO 17 0.001 Circulation test •nxe Sol 2 112 0.417 90 (100) 0.042 Lung function "'Xe Sol 123 0.024 2 852 I 0.000 Iron metabolism "Fe Citrate 140 0.028 10 145 0.004
{ 51Co Vitamin B12 1 101 0.218 0.54 80 0.017
Schilling test "Co Vitamin B12 932 0.184 0.44 2 0.000
Rcnography { ISI I Hippuran 7 539 1.49 36 I 0.001
"'I Hippuran 2 638 0.521 26 1 0.000 Kidney clearance 51 Cr EDTA 1 019 0.201 82 1 0.000 Other 10 741 2.12 (50) 0.106
Total 48 699 9.62 75 0.719
Source: Reference 219.
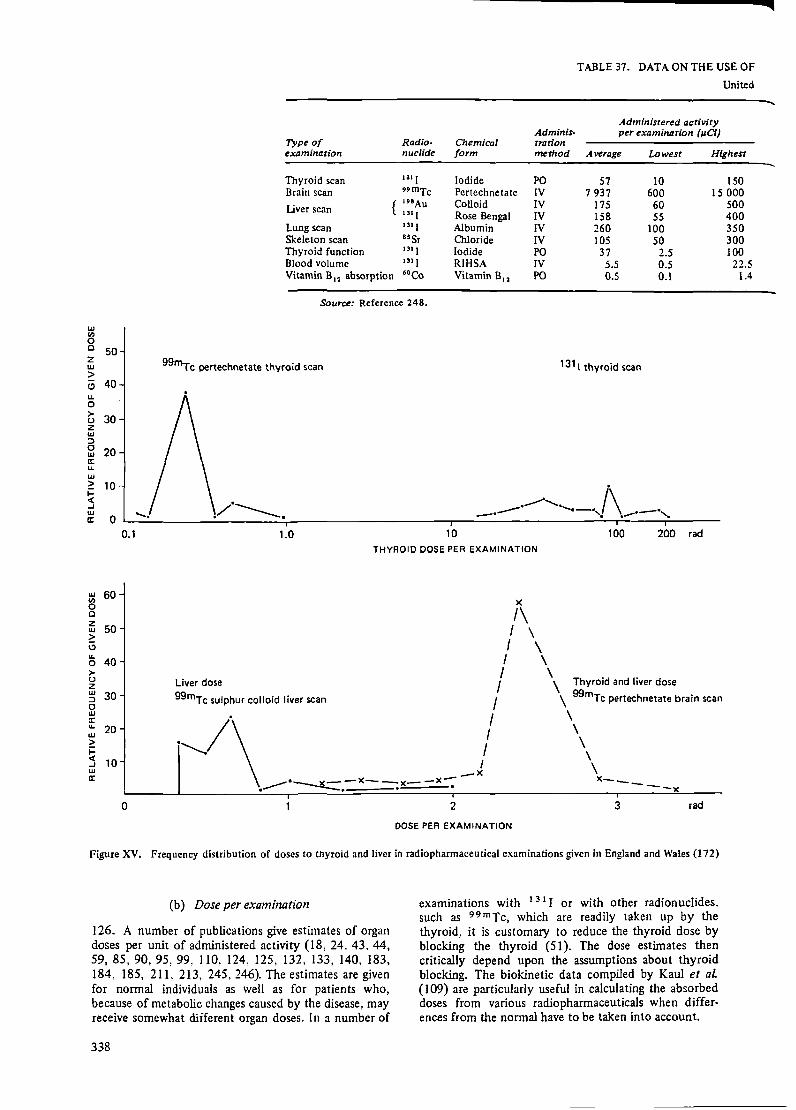
TABLE37_ DATAONTHEUSEOF
United
Type of Radio- Chemical Adminis-trotion
Adminisrered activity per examination (µCi)
examination nuclide form method Average Lowest Highest
Thyroid scan u1 I Iodide PO 57 10 150 Brain scan 99mTc Pertechnetate IV 7 937 600 15 OOO Liver scan {
1"Au Colloid IV 131 I Rose Bengal IV
175 60 158 SS
Lung scan 1,1 I Albumin IV 260 100 Skeleton scan assr Chloride IV 105 so Thyroid function 131 I Iodide PO 37 2.5 Blood volume u1 I RIHSA IV 5.5 0.5 Vitamin Bu absorption 6•co Vitamin B11 PO 0.5 0.1
Source: Reference 248.
w U)
0 C 50 2 w >
99"'Tc pertechnetate thyroid scan 1311 thyroid scan
<.? 40 u. 0 >- 30 (.)
z w ::::, 0 20 w a: u. w > 10 -j:: c( ...J w
0 ..... a:
_ __.,. i\ ----- ......... _.,, \ ·--·, .- . .-- "'
0.1 1.0 10 100 200 rad
THYROID DOSE PER EXAMINATION
w 60 U)
0 C z 50 w > i, u.
40 0 >-(.) z Liver dose w 30 ::::, 0
99mTc sulphur colloid liver scan
)(
I\ I \ I \ I \ I \
/ \ Thyroid and liver dose
/ \ 99mTc pertechnetate brain scan w a: u. 20 w ~ I-c( 10 ...J w a:
.";·\ I \ I \ -x \
.~·----.lt::::.-><---;)(- -x-; x------x 0 2 3 rad
DOSE PER EXAMINATION
Figure XV. Frequency distribution of doses to thyroid and liver in radiopharmaceutical examinations given in England and Wales (172)
(b) Dose per examination
126. A number of publications give estimates of organ doses per unit of administered activity {18, 24. 43. 44, 59, 85, 90, 95, 99. J 10, 124. 125, 132, 133, 140, 183, 184, 185, 211. 213, 245,246). The estimates are given for normal individuals as well as for patients who, because of metabolic changes caused by the disease, may receive somewhat different organ doses. In a number of
338
examinations with 131 I or with other radionuclides. such as 99 mTc, which are readily taken up by the thyroid, it is customary to reduce the thyroid dose by blocking the thyroid (51). The dose estimates then critically depend upon the assumptions about thyroid blocking. The biokinetic data compiled by Kaul et al {I 09) are particularly useful in calculating the absorbed doses from various radiopharmaceuticals when differences from the normal have to be taken into account.
500 400 350 300 100 22.5
1.4

...
i
RADIONUCLIDES FOR DIAGNOSTIC PURPOSES
States, 1966
Gonad dose Number Frequency
0-itical of (per 1000 Perexamin- Per 1000 of organ dose Critical examin- of ation population (mrad) organ ations population) (mrad) (man rad)
101 500 Thyroid 153 089 0.78 133 0.104 l 350 lower intestine 63 078 0.32 135 0.043 7 500 Spleen 41 855 0.21 87 0.018
296 Liver 19 721 0.10 114 0.012 1 330 Lung 22 840 0.120 166 0.020 2 970 Bone 6 232 0.032 792 0.025
65 OOO Thyroid 301 052 1.54 86 0.132 190 Thyroid 101 994 0.52 25 0.013 913 Liver 16 486 0.085 325 0.028
TABLE 38. ADMINISTERED ACTIVITY IN THREE COM- 127. Typical radiation doses received from radio-pharmaceutical examinations are given in the eighth column of table 34 for the organs listed in the ninth column. The distribution of typical doses in all the centres in England and Wales have been reported by Potter (172), and are given in figure XV. It is important to note that the dose to the thyroid is two orders of magnitude lower when 9 9mrc pertechnetate is used instead of 1 3 1 L
MON RADIOPHARMACEUTICAL EXAMINATIONS
(µCi per examination}
Examination
Thyroid scan Thyroid Brain ur.rake scan
Country 1311 9•mrc I II ••mrc
Denmark (1973/74) 78 1490 20 11 890
West Berlin (1975) 1 035 9 380
Sweden (1968) 41 1 700 9 10 OOO Sweden (1975) 57 1 840 9 10 990 United Kingdom
(1973) 41 900 9 500 United States
(1966) 57 37 7 940
Sources: References 93, 151, l 72, 219, 248.
128. Roedler et al (186) have made a critical review of the dose factors reported in the literature. Because of the high frequency of thyroid examinations with 131 I, the dose factors for this nuclide are of particular interest. A number of authors have assessed the gonadal dose per unit administered activity of 1 3 1 I at more than 2 mrad µCi- 1 • Roedler et al. suggest that the dose factor is only 0.2 mrad µCi- 1
. A comparison of some current estimates of the dose factor to organs for a number of examinations is made in table 39 and the corresponding dose per examination given in table 40.
TABLE 39. RANGE AND NOMINAL VALUE OF ABSORBED DOSE PER UNIT ADMINISTERED ACTIVITY IN THE MOST FREQUENTLY PERFORMED RADIOPHARMACEUTICAL EXMUNATIONS
{mrad µCi"')
Range
Type of Radio- Chemical From Nominal examination nuclide form Organ literature Recalculated value
Thyroid scan 131 I Iodide Thyroid 68-3 400 840-3 700 2 OOO or function Gonads 0.024-8.5 0.10-0.33 0.2
Skeleton 0.3-1.4 0.20-0.59 0.4
Thyroid scan ••mTc Pertech- Thyroid 0.1-0.6 0.56 0.6 Brain scan netate Gonads 0.01-0.04 0.019 0.02
Skeleton 0.018 0.02
Thyroid 132 I Iodide Thyroic 0.37-50 4-90 30 function Gonads 0.18-0.20 0.061-0.14 0.1
Skeleton 0.068-0.11 0.1
Kidney 131 I o-Iodo- Kidney 0.07-1 0.22-0.65 0.5 function hippurate Gonads 0.016-0.25 0.0053-0.0087 0.01
Skeleton 0.0057-0.0076 0.007
Bone scan 85 Sr Nitrate/ Gonads 2.9-40 2.8-3.3 3 chloride Skeleton 2.9-52 11 10
!7·msr Nitrate/ Gonads 0.02 0.02
chloride Skeleton 0.071-0.6 0.05 0.05
••mTc Poly- Gonads 0.02 0.02
phosphate Skeleton 0.04 0.04
:,,339·
.,
•J
- : ' .. -;¥1i, .. .
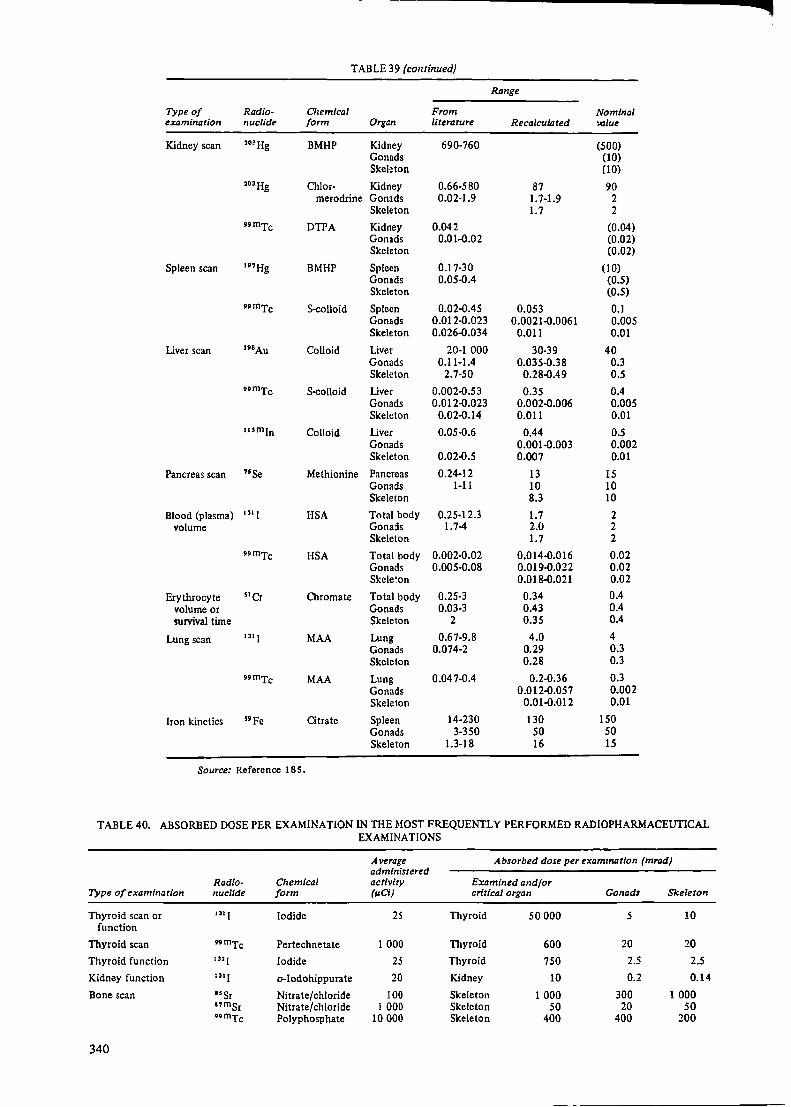
TABLE 39 (continued)
Range
Type of Radio- Chemical From Nominal examination nuclide form Organ literature Recalculated value
Kidney scan 203Hg BMHP Kidney 690-760 (500) Gonads (10) Skeleton (10)
203Hg Chlor- Kidney 0.66-580 87 90 merodrine Gonads 0.02-1.9 1. 7-1.9 2
Skeleton 1.7 2
••mTc DTPA Kidney 0.042 (0.04) Gonads 0.01-0.02 (0.02) Skeleton (0.02)
Spleen scan 1nHg BMHP Spleen 0.17-30 (10) Gonads 0.05-0.4 (0.5} Skeleton (0.5}
••mTc S-colloid Spleen 0.02-0.45 0.053 0.1 Gonads 0.012-0.023 0.0021-0.0061 0.005 Skeleton 0.026-0.034 0.011 0.01
Liver scan •'"Au Colloid Liver 20-1 OOO 30-39 40 Gonads 0.11-1.4 0.035-0.38 0.3 Skeleton 2.7-50 0.28-0.49 0.5
••mTc S-colloid Liver 0.002-0.53 0.35 0.4 Gonads 0.012-0.023 0.002-0.006 0.005 Skeleton 0.02-0.14 0.011 0.01
1um1n Colloid Liver 0.05-0.6 0.44 0.5 Gonads 0.001-0.003 0.002 Skeleton 0.02-0.5 0.007 0.01
Pancreas scan "Se Methionine Pancreas 0.24-12 13 15 Gonads 1-11 10 10 Skeleton 8.3 10
Blood (plasma) u, I HSA Total body 0.25-12.3 1.7 2 volume Gonads 1.7-4 2.0 2
Skeleton 1.7 2
••mTc HSA Total body 0.002-0.02 0.014-0.016 0.02 Gonads 0.005-0.08 0.019-0.022 0.02 Skele~on 0.018-0.021 0.02
Erythrocyte 51 Cr Chromate Total body 0.25-3 0.34 0.4 volume or Gonads 0.03-3 0.43 0.4 survival time Skeleton 2 0.35 0.4
Lung scan 131 I MAA Lung 0.67-9.8 4.0 4 Gonads 0.074-2 0.29 0.3 Skeleton 0.28 0.3
••mTc MAA Lung 0.047-0.4 0.2-0.36 0.3 Gonads 0.012-0.057 0.002 Skeleton 0.01-0.012 0.01
Iron kinetics s•pe atrate Spleen 14-230 130 150 Gonads 3-350 50 50 Skeleton 1.3-18 16 15
Source: Reference 185.
TABLE 40. ABSORBED DOSE PER EXAMINATION IN THE MOST FREQUENTLY PERFORMED RADIOPHARMACEUTICAL EXAM INA TI ONS
Average Absorbed dose per examination (mrad) administered
Radio- Chemical activity Examined and/or Type of examination nuclide form (µ.Ci) critical organ Gonads Skeleton
Thyroid scan or u, 1 Iodide 25 Thyroid SO OOO s 10 function
Thyroid scan .. mTc Pertechnetate 1 OOO Thyroid 600 20 20
Thyroid function '"l Iodide 25 Thyroid 750 2.5 2.5
Kidney function u, I o-Iodohippurate 20 Kidney 10 0.2 0.14
Bone scan "Sr Nitrate/chloride 100 Skeleton 1 OOO 300 1 OOO nmsr Nitrate/chloride 1 OOO Skeleton so 20 50 ••mTc Polyphosphate 10 OOO Skeleton 400 400 200
340

Type of examination Radio· nuclide
Chemical fonn
Average administered activity (µCi)
Absorbed dose per examination (mrad)
Examined and/or critical organ Gonads Skeleton
Kidney scan
Brain scan
Spleen scan
Liver scan
Pancreas scan
Blood (plasma) volume
Erythrocyte volume or sunival time
Lung scan
Iron kinetics
,nHg 203Hg "mTc
••mTc
1•1Hg ••mTc
191Au "mTc 1um1n
75Se
1,1 I ••mTc
51 Cr
Source: Reference 185.
BMHP Chlormerodrine DTPA
Pertechnetate
BMHP S-colloid
Colloid $-colloid Colloid
Methionine
HSA HSA
Chromate
MAA MAA
Citrate
100 150
3 OOO
10 OOO
300 1 500
150 1 500 1 OOO
200
10 100
100
200 3 OOO
15
129. To calculate an approximate value for the annual collective dose, the data from England and Wales (population 50 106
) for 1973 may be averaged and
Kidney Kidney Kidney
Thyroid
Spleen Spleen
Liver Liver Liver
Pancreas
Total body Total body
Total body
Lung Lung
Spleen
50 OOO 13 SOO
120
6 OOO
3 OOO lSO
6 OOO 600 SOO
3 OOO
20 2
40
800 900
2 250
l OOO 300 60
200
!SO 7.5
4S 7.5 2
2 OOO
20 2
40
60 6
750
l OOO 300
60
200
150 15
75 15 10
2 OOO
20 2
40
60 30
225
combined with the number of examinations carried out. The collective doses for five examinations are given in table 41.
TABLE 41. COLLECTIVE DOSE FROM RADIOPHARMACEUTICAL EXAMINATIONS IN ENGLAND AND WALES
Average administered Collectfl.e Annual
Type of Radio- Chemical activity examination nuclide form (µCi)
Brain scan nmTc Pertechnetate 9 500
Liver scan "mTc 5-colloid 2 OOO
Thyroid scan ••mTc Pertechnetate 900
1 3 1 J 41
Lung scan ••mTc MAA 1 800
Placental 11,mln Chloride localization
Source: Reference 172.
130. Only very little new information is available since the 1972 report on the GSD from radionuclide examinations. The survey in West Berlin has been updated (186) and the GSD in 1970 was estimated to be 0.2 mrad, compared with 0.1 mrad in 1968. The change is primarily due to the increased number of examinations. This is in line with the GSDs reported in 1972 by the Committee, which were in the range 0.01-0.4 mrad.
III. THERAPEUTIC USES OF RADIATION
A. TREATMENT WITH EXTERNAL BEAMS AND SEALED SOURCES
1. General
131. High radiation doses have been used in radiotherapy for the treatment of two major classes of
700
dose (I 03 number of Organ man rad) examinations
Stomach 101 44 OOO Thyroid 101 44 OOO
Liver 14 20000
{ Thyroid 2 10 OOO Stomach 2 10 OOO
Thyroid 467 4600
Lung 4 8 600
Foetus .040 2 900
disease, the first being skin and other non-neoplastic diseases, for which radiation doses of up to l000-2000 rad have been given. The majority of these treatments are for skin diseases, for which a low-energy, fairly non-penetrating radiation has been used.
132. The second class of disease treated by irradiation has been neoplastic disease, which includes all the various forms of cancer and other invasive and malignant diseases. For the treatment of these diseases. radiation doses of up to 6000-7000 rad are given to localized tumours: in the ease of more generalized neoplastic diseases, such as leukaemia, extra corporeal irradiation may be given. These high doses are necessary to cause a destructive effect on the tumour cells. It is inevitable in these treatments thatlarge radiation doses will also be received by some of the healthy tissues lying within the treatment volume or in the path of any of the treatment beams. The seriousness of the primary disease, however, necessitates that little consideration be given to any
341

deleterious late effects of radiation that might occur many years after a successful treatment. Nevertheless, it is important to obtain estimates of the radiation dose within healthy organs and tissues irradiated in the treatment regime, so that estimates of the frequency of such late effects may be made.
2. Trends in radiotherapy practice
133. In the 1972 report of the Committee it was estimated that in many industrialized countries about one half of the new cancer cases arising each year are treated with radiotherapy and that this proportion does not seem to change appreciably even with the increased use of chemotherapy. Elsewhere, the treatment of cancer will rise in importance as other causes of death such as malnutrition, malaria and tuberculosis are gradually eliminated by the improvement of living conditions and the availability of medical care. These estimates seem to remain valid.
134. For the treatment of non-neoplastic disease, alternative treatment forms not involving radiation have been recommended, and a drastic decrease in the number of such treatments took place in the 1960s (118, 232), which is illustrated by table 42. X rays were regularly used for the treatment of skin lesions, particularly dermatological conditions, in the years 1930 to 1960. Since that time a great reduction in the number of patients treated has occurred and lower tube voltages have been used, meaning less penetration of the beam.
TABLE 42. PERCENTAGE OF THERAPEUTIC IRRADIA· TIONS PERFORMED IN CONNECTION WITH NONNEOPLASTIC DISEASE IN JAPAN AND SWEDEN, 1956-1972
Country 1956
Japan (118) 72 Sweden (171) 88
1965
22 49
aRepresenting 1722 patients.
1970
12° 14
1972
10 10
135. The technological development in radiotherapy equipment over the last 25 years has been aimed at providing radiation beams capable of penetrating
Condition rreated
Skin conditions Growths
adequately to deep-seated tumours and of producing higher dose rates. Thus, orthovoltage x-ray units operating at 250 kV and 2 2 6 Ra sources used in brachytherapy have been replaced by electron accelerators (4-20 MeV) and telecurie units containing gammaray emitting sources such as 6 ° Co with activities of up to 10 kCi. This trend is illustrated by the installation in Sweden of cancer therapy machines (table 43).
TABLE 43. CHANGE IN USE OF RADIOTHERAPHY EQUIPMENT AT ONE LARGE SWEDISH CANCER CLINIC, 1956-1970
Year
1956 1965 1970
Annual number of trearments
Using 250-kV and shorr-disrance 226 Ra and 60 Co unirs
49 582 30 145 11 281
Source: Reference 15 I,
Using accelerators and telecurie units
0 21 633 46 941
3. Dose data in radiotherapy
136. Radiotherapy of non-neoplastic diseases has been reasonably well controlled and recorded. The radiation doses received by the skin of such patients are therefore reliably known. Information about the filters and tube voltages employed is less likely to be available. This is exactly the information required for deducing the penetration of the beam and hence the dose fo organs below the irradiated skin surface. These doses will usually be Jess well known than the dose to the irradiated skin surface. Calculations of doses to an organ outside the direct beam will be Jess accurate, particularly if there is a possibility that the organ might on occasions be just outside or just inside the main beam. These variations may occur due to slightly different positions of the patient when the treatment is undertaken; for example, irradiation of children for thymic enlargement may have been carried out with the thyroid just in or just out of the beam (88) (see Annex G).
137. The complexity of the treatments and the generally somewhat higher doses delivered for neoplastic disease make careful dosimetric control a necessity, and,
TABLE 44. RADIOTHERAPY OF NON-NEOPLASTIC DISEASE:
Head and trunk only
Children Adults
Males Females Males Females
Mean Mean Mean Mean Num- dose Num• dose Num- dose Num- dose ber (rad) ber (rad) ber (rad) ber (rad)
27 14.6 21 10.0 52 4.8 80 7.6 Allergic and inflammatory 10 10.8 13 23.3 201 10.4 230 7.9
342
Ringworm 5 92.0 1 62.5 2 36.0 Other I 49.0 1 5.6 38 6.9 38 4.3
Glandular enlargements 2 6.2 7 5.5 1 5.9 Ankylosing spondylitis 70 83.6 14 59.5 Arthritic and rheumatic 23 27.1 29 22.0 Artificial menopause 74 51.5 Deafness 5 9.4 2 8.6 7 3.5 10 3.7 Other non-neoplastic I 2.6 2 282.0 15 20.9 35 27.6
Source: Reference 37. Note:The data in this table were produced by a computer programme that was adapted to make an
approximate estimate of the bone-marrow dose from small treatment areas which receive high doses.

because of the need to provide a follow-up service, the records of such patients are generally well kept. It is, therefore, reasonably easy to determine the radiation doses to particular organs retrospectively. The potential groups of interest would be composed of patients with long survival after treatment.
4. Information of epidemiological interest
138. The following determinations of dose to given organs have been carried out for epidemiological surveys:
Bone-marrow dose and whole-body integral dose in the treatment of ankylosing spondylitis (39, 107,269)
Dose to the stomach and pancreas in the treatment of ankylosing spondylitis ( 14)
Dose to the kidney in patients treated for stomach ulcers (35, 236)
Dose distribution through the head and neck for children treated for tinea capitis (2, 3, 4, 72, 159, 160,199,263,264)
Thyroid dose for children treated for thymic enlargement (88)
Skin dose in patients treated for skin disease and neoplastic disease with rodent ulcers and basal cell carcinoma occurring in the treatment area (9, 237)
Bone-marrow dose in the treatment of metropathia haemorrhagica (45, 210).
139. As leukaemia has been associated with the irradiation of the bone marrow and a number of surveys of patients treated for non-neoplastic disease have reported an increase in the incidence of leukaemia, considerable effort has been made to derive bonemarrow doses. In its 1972 report, the Committee reproduced data from the British survey (37) on bone-marrow doses from treatment of non-neoplastic disease in the years 1957-1958, assessed by measurements and a computer programme (50). Since further information is lacking, these data are again presented in table 44 to illustrate the fact that the mean marrow
MEA.lll BONE-MARROW DOSE PER TREATMENT COURSE
All cases
Children
Males Females Males
Mean Mean Mean Num- dose Num- dose Num- dose ber (rad) ber (rad) ber (rad)
91 4.3 125 1.7 110 2.3 26 4.2 18 16.8 600 3.5
6 76.0 2 31.3 4 18.0 1 49.0 1 5.6 65 4.0
2 6.2 7 5.5 70 83.6 33 18.9
5 9.4 2 8.6 7 3.5 I 2.6 2 282.0 23 13.6
a Assumed male value in absence of data
I 2 3 4 5 6 7/8 9 IC II 12 13 14 15 16 I I i\. I I / - 'I ...i L
2 "I =- r \ i' ~ .J ~ ... I
3 .,....l--:' -- >--. ..... ( ,,..i...,..., I, ..... (
' ' I ' \ ( - i 4 ' . . . , .... _ I.,
J 5 • I ' ' \-- ···1 ,.
" --j - .~ 6 I ' I/ \
A I ~ I
7 ·- --
8 I ) I
9 ' I 1/ I"-.... '/ I )
Figure XVI. Grid reference system for defining irradiation position (see tables 45 and 48) (76)
doses may range from less than I to nearly 300 rad per treatment course, with values of about 10 rad not being infrequent. Recent measurements and calculations based on depth-dose studies published by Hashizume (76) provide tabular information from which the bonemarrow dose may be calculated for any particular radiotherapeutic treatment. Figure XVI shows the grid reference system used to indicate the particular part of the body that is irradiated. By selecting a particular pair of grid reference numbers in the first two columns of table 45 one can find, for the particular types of radiation given in the other column headings the values of direct plus scatter radiation M + S and of the marrow dose T from the generalized leakage radiation from the source per unit of dose at the skin. These data are useful in that they give the values for 250-kV x rays, 6 ° Co gamma rays, 6-MV x rays and 15-MeV electrons. As predicted in earlier United Kingdom work, the marrow dose per treatment course calculated for 250-kV x rays tends to exceed the bone-marrow dose from any other energy source.
Adults
Females
Mean Num- dose ber (rad)
185 3.3 578 3.2
3 18.oa 115 1.4
1 5.9 14 59.5 42 15.1 74 51.5 10 3.7 37 26.2
343

TABLE 45. ACTIVE BONE-MARROW DOSE IN ADULTS IN DIFFERENT IRRADIATION CONDITIONS (mrad per rad at the skin)
Xrays J"adiation posltiona ,oco
gamma rays Coni•entional 6-MV I 5-Me V electrons Vertical number Lateral number M+S T M+S T M+S T M+S T
1 2,4 290 250 280 30 295 150 200 175 13, 15 300 370 350 35 305 250 200 180 14 320 360 370 35 330 250 230 180 3, 7, 10 295 240 360 30 320 170 230 135
2 2,4 70 265 95 30 75 180 25 130 13, 15 70 380 95 40 75 260 25 195 3 140 305 180 45 150 300 0 105 7,10,14 180 360 220 45 175 340 30 220
3 3, 7, 10, 14 120 385 170 40 125 260 0 195 1, 5, 12, 16, 25 340 35 30 30 235 0 175 13, 15 45 450 70 45 50 300 25 220 2,4 40 380 55 35 45 265 25 190
4 2, 4 230 505 315 40 235 340 100 260 13,15 250 560 320 so iss 380 100 300 3 500 475 710 so 510 315 200 250 14 750 530 1 200 55 760 350 650 285 12, 15, 16 120 380 170 40 120 255 20 200 6, 7, 10, 11 200 300 240 30 205 210 220 170
s 6, 7, 10, ll 260 285 380 30 270 195 0 145 14 830 345 l 350 55 840 380 105 290 3 480 425 700 40 485 285 0 220 13, 15 60 340 85 so 60 365 0 265 2,4 65 415 90 40 70 285 0 210 l, 5, 12, 16 so 385 70 40 SS 260 0 190
6 6,7,10,11 330 345 430 30 335 235 230 175 14 7..;0 595 1 150 60 730 400 95 300 3 370 475 520 45 375 320 0 230 13, 15 340 680 490 60 345 320 300 340 2,4 160 440 220 40 165 160 30 220 l, s, 12, 16 50 385 70 35 so 300 0 170
7 3, 14 70 395 95 40 70 195 0 210 2, 4, 7, 10, 13, 15 70 290 95 30 70 160 30 150
8 2, 4, 7, 10, 13, 15 1 235 s 25 1 26 0 115 9 2, 4, 7, 10, 13, 15 0 40 0 10 0 0 0 26
Source: Reference 76. Note: See paragraph 139 for an explanation of the use of this table. a As defined by the grid reference system in figure XVI.
140. The per caput marrow dose (CMD) and dose weighted for the incidence of leukaemia (LSD) in the remainder of the patient's life were 206 and 37 mrad, respectively, for the practice in Japan during 1971. Table 46 shows that the contributions to the CMD were about 60 per cent from 6 °Co units, 30 per cent from accelerators and 10 per cent from conventional x-ray machines. The skin treatment of non-neoplastic disease gives only 1.3 per cent of the total CMD (table 46). The use of the product of the average dose and the number of patients treated is a better measure of the possible detriment to the irradiated group than the per caput dose to the whole population. The average bone-marrow dose was 120 rad to the 177 OOO patients treated for neoplastic disease and 0.15 rad to the I 965 OOO patients treated for non-neoplastic disease. This latter dose may be compared with the average dose from the treatment of non-neoplastic disease in the United Kingdom in 1957-1958 of 103 rad to the 6000 persons treated (37).
141. The number of patients treated by brachytherapy in Japan (78) in 1974 was 21 650 (table 47a). The population doses are given in table 47b, the CMD and LSD being 43 and 7. 7 mrad, respectively.
344
142. The average doses and the sizes of the patient populations studied in some epidemiological surveys are to be found in Annex G.
5. Genetically significant dose
143. The gonad dose and GSD received from radiotherapeutic practice was given in the 1962 and 1972 reports for a few countries. The GSD from the treatment of non-neoplastic disease ranged from 0.9 to 12.1 mrad; of neoplastic disease, from 0.5 to 2.5 rnrad. Recent data by Hashizume (75, 77) are in the form of a tabulation of the gonad dose for different kinds of radiotherapeutic irradiation (table 48). The doses are given in terms of the leakage radiation L and the scattered radiation S per field area of 100 cm2
, and in some cases in terms of the primary beam.
144. The GSD in Japan for 1971 from the treatment of non-neoplastic disease was 0.7 rnrad; of neoplastic disease. suitably corrected for the expected number of children in these ill patients, 0.26 rnrad. The GSD
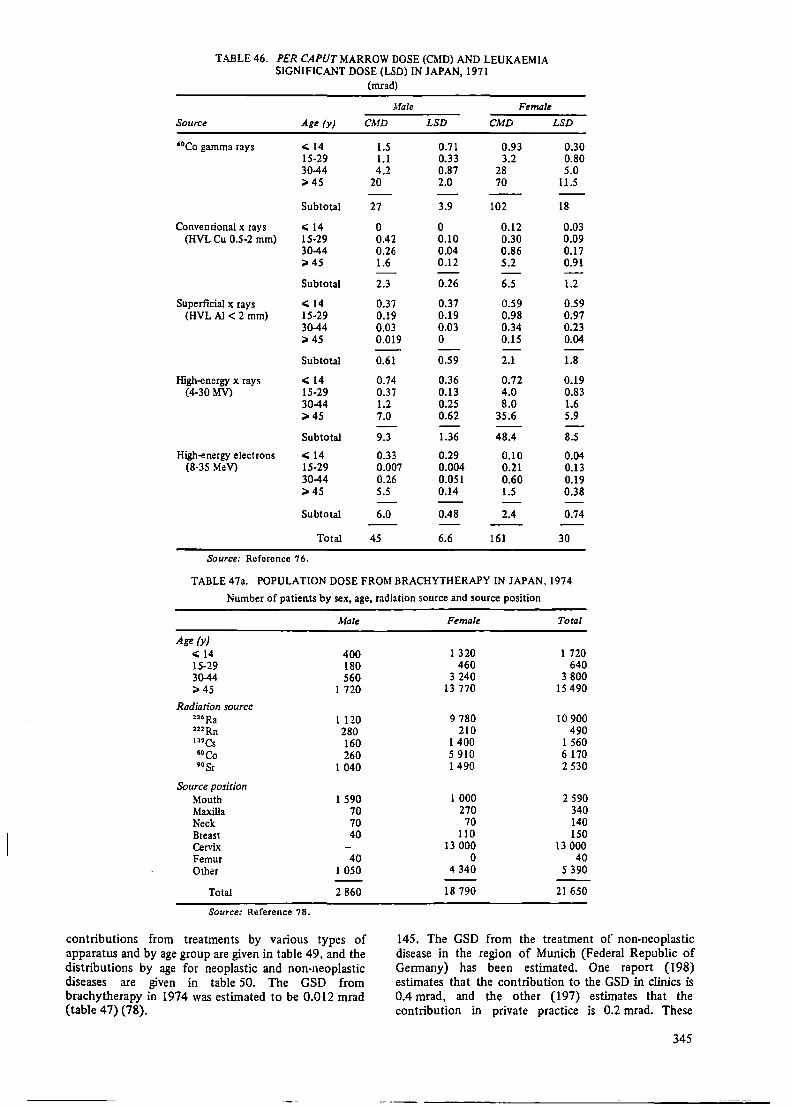
TABLE 46. PER CAPUT MARROW DOSE (CMD) AND LEUKAEMIA SIGNIFICANT DOSE (LSD) IN JAPAN, 1971
(mrad)
Male Female
Source Age (y) CMD LSD CMD LSD
'°Co gamma rays < 14 1.5 0.71 0.93 0.30 15-29 1.1 0.33 3.2 0.80 30-44 4.2 0.87 28 5.0 ;;,. 45 20 2.0 70 11.5
Subtotal 27 3.9 102 18
Conventional x rays < 14 0 0 0.12 0.03 (HVL Cu 0.5-2 mm) 15-29 0.42 0.10 0.30 0.09
30-44 0.26 0.04 0.86 0.17 :>45 1.6 0.12 5.2 0.91
Subtotal 2.3 0.26 6.5 1.2
Superficial x rays < 14 0.37 0.37 0.59 0.59 (HVL Al < 2 mm) 15-29 0.19 0.19 0.98 0.97
30-44 0.03 0.03 0.34 0.23 ;;,. 45 0.019 0 0.15 0.04
Subtotal 0.61 0.59 2.1 1.8
High-energy x rays < 14 0.74 0.36 0.72 0.19 (4-30 MV) 15-29 0.37 0.13 4.0 0.83
30-44 1.2 0.25 8.0 1.6 :>45 7.0 0.62 35.6 5.9
Subtotal 9.3 1.36 48.4 8.5
High-energy electrons < 14 0.33 0.29 0.10 0.04 (8-35 MeV) 15-29 0.007 0.004 0.21 0.13
30-44 0.26 0.051 0.60 0.19 :> 45 5.5 0.14 1.5 0.38
Subtotal 6.0 0.48 2.4 0.74
Total 45 6.6 161 30
Source: Reference 76.
TABLE 47a. POPULATION DOSE FROM BRACHYTHERAPY IN JAPAN, 1974
Number of patients by sex, age, radiation source and source position
Male
Age (y) < 14 400 15-29 180 3~ 560 :>45 1 720
Radiation source 11•Ra 1 120 222Rn 280 137Cs 160 •oco 260 9osr 1 040
Source position Mouth 1 590 Maxilla 70 Neck 70 Breast 40 Cervix Femur 40 Other 1 050
Total 2 860
Source: Reference 78.
contributions from treatments by various types of apparatus and by age group are given in table 49, and the distributions by age for neoplastic and non-neoplastic diseases are given in table 50. The GSD from brachytherapy in 1974 was estimated to be 0.012 mrad (table 47) (78).
Female Total
1 320 1 720 460 640
3 240 3800 13 770 15 490
9 780 10 900 210 490
1 400 1 560 5 910 6 170 1 490 2 530
1 OOO 2 590 270 340 70 140
110 150 13 OOO 13 OOO
0 40 4 340 5 390
18 790 21 650
145. The GSD from the treatment of non-neoplastic disease in the region of Munich (Federal Republic of Germany) has been estimated. One report (198) estimates that the contribution to the GSD in clinics is 0.4 rnrad, and the other (197) estimates that the contribution in private practice is 0.2 mrad. These
345

TABLE 47b. POPULATION DOSE FROM BRACHYTHERAPY IN JAPAN, 1974
GSD, CMD and LSD by sex and age
GSD CMD LSD (10- 3 mrad) (mrad) (mrad)
Age (Y) Female Male Female Male Female Male
< 14 10.7 l.033 0.077 0.120 0.075 0.119 15-29 0.003 0.155 0.415 0.144 0.088 0.081 30-44 0.465 0.001 6.390 0.100 1.327 0.031 ;;. 45 0 0.001 33.280 2.724 5.469 0.493
Subtotal 11.178 l.l 90 40.149 3.088 6.959 0.724
Total 12.4 43.2 7.7
Source: Reference 78.
TABLE 48. GONAD DOSE IN ADULTS IN
Irradiation positiona (V-L)
4-2
6-2
7-3
60Co HVL gamma rays 1.5 mm Cu
Sex L s L
M 0.75 0 0.08 F 0.55 0.01 0.04
M 1.2 0.06 O.Q7 Fb 420 1.3 125 Mb 960 0.03 820 F 1.0 0.11 0.03
Source: Reference 75.
Note: L = leakage radiation; S = scattered radiation. asee figure XVI.
s
0 0
0.13 2.4
0.25 0.25
(mrad per rad
Xrays
HVL 1.0 mm Al
L s
0.04 0 0.01 0
0.05 O.Q7 12 0.25
800 0.2 0.05 0.14
bThe values in this line are the gonad doses due to the primary beam (of zero area).
TABLE 49. GENETICALLY SIGNIFICANT DOSE IN JAPAN, 1971 Source Age (y) Male Female Total
Breakdown by source, age and sex High-energy electron < 14 0.000 0.000 (mrad)
accelerators 15-29 0.000 0.000 (8-35 MeV) 30-44 0.000 0.000
Source Age (y) Male Female Total ;;. 45 0.000 0.000
Subtotal 0.000 0.000 60Co gamma-ray <: 14 0.047 0.046
units 15-29 0.088 0.018 Total 0.23 0.75 0.98 30-44 0.030 0.011 ;;,.45 0.000 0.000
Source: Reference 75. Subtotal 0.17 0.075 0.245
Conventional x-ray <: 14 0.000 0.010 units 15-29 0.013 0.000 TABLE 50. GENETICALLY SIGNIFICANT DOSE (HVL 1.5 mm Cu) 30-44 0.002 0.000 IN JAPAN, 1971
;;., 45 0.000 0.000 Breakdown by type of disease, age and sex
Subtotal 0.015 0.010 0.025 (mrad)
Superficial x-ray < 14 0.030 0.31 Male Female
units 15-29 0.002 0.34 Non- Non· (HVL 1.5 mm Cu) 30-44 0.001 0.002 Age (y) neoplastic Neoplastic neoplastic Neoplastic
;;,,45 0.000 0.000
Subtotal 0.033 0.65 0.683 < 14 0.041 0.039 0.31 0.061 15-29 0.006 0.097 0.34 0.022
High-energy x-ray 30-44 0.001 0.029 0.002 0.011
<: 14 0.003 0.007 ;;. 45 0.000 0.000 0.000 0.000 units 15-29 0.011 0.004 (4-30MV) 30-44 0.000 0.000 Total 0.048 0.17 0.65 0.094
;;., 45 0.000 0.000
Subtotal 0.014 0.011 0.025 Source: Reference 75.
346
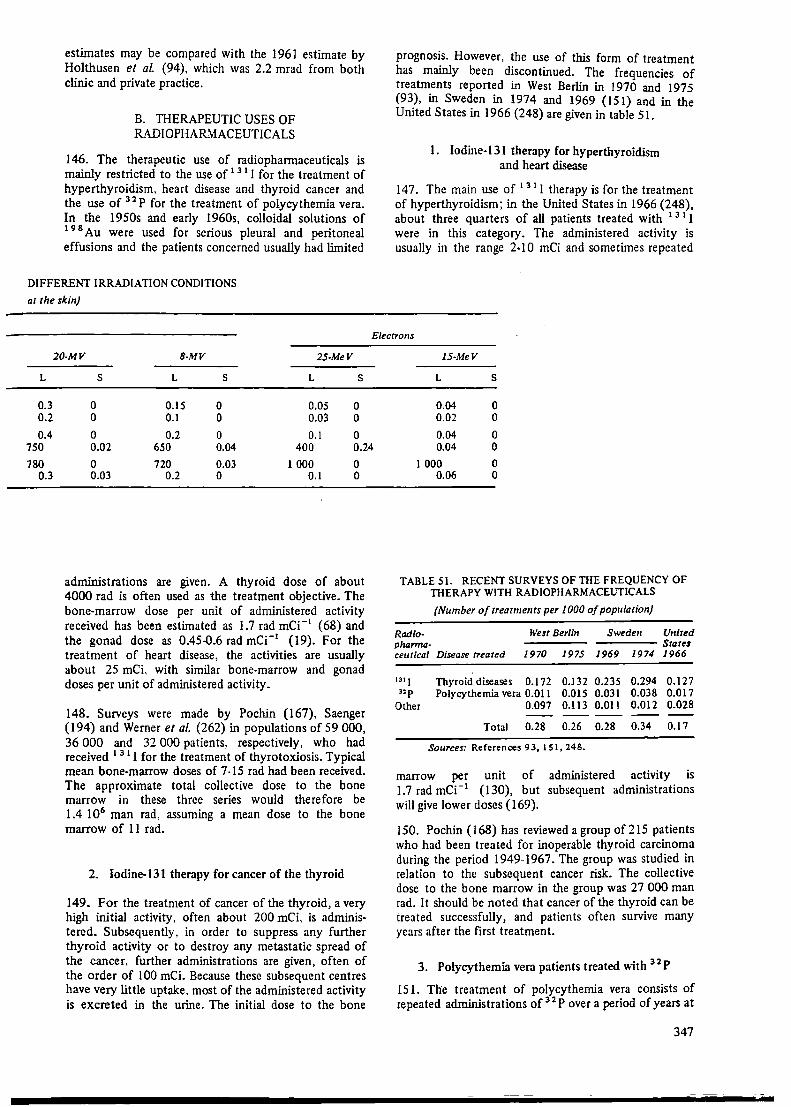
estimates may be compared with the 1961 estimate by Holthusen et al (94), which was 2.2 mrad from both clinic and private practice.
B. THERAPEUTIC USES OF RADIOPHARMACEUTICALS
146. The therapeutic use of radiopharmaceuticals is mainly restricted to the use of 1 31 I for the treatment of hyperthyroidism, heart disease and thyroid cancer and the use of 32 P for the treatment of polycythemia vera. In the 1950s and early 1960s, colloidal solutions of 1 9 8 Au were used for serious pleural and peritoneal effusions and the patients concerned usually had limited
DIFFERENT IRRADIATION CONDITIONS
at the skin)
20-MV 8-MV 25-MeV
L s L s L s
0.3 0 0.15 0 0.05 0 0.2 0 0.1 0 0.03 0
0.4 0 0.2 0 0.1 0
prognosis. However, the use of this form of treatment has mainly been discontinued. The frequencies of treatments reported in West Berlin in I 970 and 1975 (93), in Sweden in 1974 and 1969 (151) and in the United States in 1966 (248) are given in table 51.
I. Iodine-131 therapy for hyperthyroidism and heart disease
14 7. The main use of 131 l therapy is for the treatment of hyperthyroidism; in the United States in 1966 (248), about three quarters of all patients treated with 1 3 1 1 were in this category. The administered activity is usually in the range 2-10 mCi and sometimes repeated
Electrons
15-MeV
L s
0.04 0 0.02 0
0.04 0 750 0.02 650 0.04 400 0.24 0.04 0
780 0.3
0 720 0.03 l OOO 0 0.03 0.2 0 0.1 0
administrations are given. A thyroid dose of about 4000 rad is often used as the treatment objective. The bone-marrow dose per unit of administered activity received has been estimated as I.7 rad mCi- 1 (68) and the gonad dose as 0.45-0.6 rad mCi-1 (19). For the treatment of heart disease, the activities are usually about 25 mCL with similar bone-marrow and gonad doses per unit of administered activity.
148. Surveys were made by Pochin (167), Saenger (194) and Werner et al. (262) in populations of 59 OOO, 36 OOO and 32 OOO patients, respectively, who had received 1 3 1 I for the treatment of thyrotoxiosis. Typical mean bone-marrow doses of 7 -15 rad had been received. The approximate total collective dose to the bone marrow in these three series would therefore be 1.4 106 man rad, assuming a mean dose to the bone marrow of 11 rad.
2. Iodine-131 therapy for cancer of the thyroid
149. For the treatment of cancer of the thyroid, a very high initial activity. often about 200 mCi, is administered. Subsequently. in order to suppress any further thyroid activity or to destroy any metastatic spread of the cancer, further administrations are given, often of the order of 100 mCi. Because these subsequent centres have very little uptake, most of the administered activity is excreted in the urine. The initial dose to the bone
1 OOO 0 0.06 0
TABLE 51. RECENT SURVEYS OF TIIE FREQUENCY OF TIIERAPY WITH RAD10PHARMACEUTICALS
Radio· pharma-
(Number of treatments per 1000 of population)
West Berlin Sweden United
ceutical Disease treated ----Stares
1970 1975 1969 1974 1966
131 I Thyroid diseases 0.172 0.132 0.235 0.294 0.127 32 P Polycythemia vera 0.011 0.015 0.031 0.038 0.017
Other 0.097 0.113 0.011 0.012 0.028
Total 0.28 0.26 0.28 0.34 0.17
Sources: References 93, 151, 248.
marrow per unit of administered activity is 1.7 rad mCi-1
( 130), but subsequent administrations will give lower doses {169).
150. Pochin {168) has reviewed a group of 215 patients who had been treated for inoperable thyroid carcinoma during the period 1949-1967. The group was studied in relation to the subsequent cancer risk. The collective dose to the bone marrow in the group was 27 OOO man rad. It should be noted that cancer of the thyroid can be treated successfully, and patients often survive many years after the first treatment.
3. Polycythemia vera patients treated with 32 P
151. The treatment of polycythernia vera consists of repeated administrations of 32 P over a period of years at
347
activities of 4-8 mCi. The bone-marrow dose is 30 rad mCi-1 for intravenous administration. The gonad dose is in the range 2.6-7.0 rad mCi- 1 {133). High mean bone-marrow doses of the order of 600 rad per treatment may be received (34,214).
152. Modan and Lilienfeld (145) show that the collective dose for such patients treated by 3 2 P is sufficiently high to make epidemiological studies interesting. Of an original series of 1222 cases, 228 were treated by 3 2 P. The collective dose to the bone marrow for the group of 228 cases was 132 750 man rad.
153. Details of further studies are contained in Annex G.
IV. WASTE DISPOSAL OF MEDICALLY USED RADIOPHARMACEUTICALS
154. Much of the short-lived activity incorporated in radiopharmaceuticals l!Sed in a diagnostic investigation decays either before or during the investigation, and only a small fraction of the total activity is eventually disposed of as waste. The principal route of disposal is as liquid waste. However, therapeutically used radiopharmaceuticals do provide a substantial source of waste activity, particularly in the treatments using 1 3 1 I. In the case of treatments for hyperthyroidism, some 30 per cent of the activity may be released in the ·urine. Following the first treatment of a cancer of the thyroid, some 50-60 per cent of the administered activity (about 100 mCi) will be excreted in the urine. Further treatments, particularly of metastases, lead to the excretion of about 90 per cent or more of the administered radioactive iodine. In some countries the urine from such patients is not stored but is released as liquid waste into the sewers.
155. Few countries have complete records of the activity released to the sewers from medical establishments. The total activity administered to the patients may be used as an upper estimate. In Denmark, the total use of radionuclides has risen from 181 Ci in 1970 to 298 Ci, in 1974 (220), the total activity remaining after one year being 48 Ci and 15 Ci, respectively. The total use of 13 1 I has remained steady at about 20 Ci per year. By using the frequency data in the Danish report (53) and assuming that on the average 5 mCi of 3 1 I was used in each hyperthyroid treatment and 200 mCi in each cancer patient, one can account for about 13 Ci of 1 31 I, of which about 8 Ci would probably be excreted as urine into the sewers.
156. It is difficult to estimate the radiation doses received by the public from such releases. However, the families of the patients would be those who would be at
348
greatest risk, and they would also receive a radiation dose directly from the activity remaining in the patient. Estimates of this dose have been made by Stieve and Kaul (227).
V. CONCLUSIONS
157. Diagnostic radiology in many technically developed countries has been growing at a rate between 5 and 15 per cent per year. Because of increasing medical requirements. the growth rate in developing countries is likely to be greater. The use of radiopharmaceuticals for diagnostic purposes has been expanding rapidly over the last decade, and many countries are reporting a doubling of the number of tests every three to five years. Radiotherapeutic practice indicates that less treatment is being carried out for non-malignant conditions using radiation, while treatment for malignant conditions is now primarily carried out using high-energy radiation from accelerators or teletherapy units.
158. Considerable information is now available on radiation doses to the skin and the gonads received in individual x-ray examinations. while the knowledge about doses to bone marrow and some other organs is currently expanding. Further information is still required, however, particularly in the case of specialized examinations. With this further knowledge it will be possible to assess the detriment that may be associated with such examinations. Consideration would then have to be given to the basis for the comparison of the benefits that are received by a patient with the estimated detriment.
159. A satisfactory amount of information is now available regarding the radiation doses to organs received during investigations involving the use of radiopharmaceuticals. In general, these doses to particular organs are of the same order or smaller than those incurred during x-ray examinations of the same region or function.
160. Published recommendations of a number of national and international bodies have made available useful information about methods of reducing radiation doses to patients, but the implementation of these recommendations is not yet universal. There is a need to encourage the estimation of the radiation doses received by organs during medical radiological procedures as a means of identifying those practices likely to give rise to high patient doses.
161. Studies of the frequency of examinations should be combined with studies of organ doses to provide collective dose estimates for each technique and investigation. Collective doses may then be used to assess relative detriments, with some limitations due to the range of individual doses, the age group and the effects under consideration. Suggestions as to possible groups of patients that may be at greater risk have been made on the basis of the known radiation doses, and further studies of this type would be of particular interest for epidemiological research.

REFERENCES
1. Abbas, M. S. Use of medical x-ray diagnostic units in Iraq, p. 1150-1155 in Proceedings of the Third International Congress of the International Radiation · Protection Association, Washington, 1973. U.S. Atomic Energy Commission report CONF-730907-P2 (1974).
2. Albert, R. E., A. R. Omran, E.W. Brauer et al Follow-up study of patients treated by x-ray for tinea capitis. Am. J. Public Health 56: 2114-2120 (1966).
3. Albert, R. E. and A. R. Omran. Follow-up study of patients treated by x-ray epilation for tinea capitis. 1. Population characteristics, post treatment illnesses and mortality experience. Arch. Environ. Health i7: 899-918 (1968).
4. Albert, R. E., A. R. Omran, E.W. Brauer et aL Follow-up study of patients treated by x-ray epilation for tinea capitis. 2. Results of clinical and laboratory examinations. Arch. Environ. Health 17: 919-934 (1968).
5. Alcox, R. W. A dosimetry study of dental exposures from intraoral radiography, p. 107-114 in Health Physics in the Healing Arts. Health Physics Society, December 1972. U.S. Department of Health, Education and Welfare report DHEW (FDA) 73-8029.
6. Altonen, M., M. Heikkila and K. Mattila. A comparative study of radiation doses received during examination with the Pantomograph, Orthopantomograph, Panorex, Status X. and Conventional Roentgen Apparatus. Proc. Finn. Dent. Soc. 70: 67-74 (1974).
7. Alves, R. N., A. M. Araujo, P.H. Nette et al Assessment of population dose in x-ray diagnosis in Brazil, in Biomedical Dosimetry. IAEA publication STI/PUB/401. Vienna, 1975.
8. Amie!, M., A. Clermont, D. Jocteur-Monrozier et al Etude dosimetrique au cours de l'angiographie cardiaque chez le jeune enfant. Ann. Radiol. 19 (6): 623-628 (1976).
9. Andrews, P. S. Follow-up study of patients treated for cancer of the breast, p. 9-10 in British Empire Cancer Campaign Annual Report. Part II (1957).
10. Ardran, G. M .. J. Hamill, E. Emrys Roberts et al Radiation dose to the patient in cardiac radiology. Br. J. Radio). 43: 391-394 (1970).
11. Ardran, G. M., W. A. Langmead and H. E. Crooks. Exposure reduction using new screen/film combination. Br. J. Radiol. 48: 233-234 (1975).
12. Ardran, G. M., H. E. Crooks and P. S. Fursdon. Rare-earth intensifying screens. British Institute of Radiology Bulletin Vol. II(2): 5-6 (1976).
13. Asbury, D. L. and P. G. Barker. Radiation dosage to the breast in well-woman screening surveys. Br. J. Radiol. 48: 963-967 (1975).
14. Baker, R. and R. E. Ellis. Measurements in phantom of doses to stomach and pancreas in radiotherapy of ankylosing spondylitis. Unpublished.
15. Beekman, Z. M. Genetically significant dose from diagnostic roentgenology. A study concerning a defined population in the Netherlands. Leiden, Neder. Inst. v. Praevent. Geneesk. 53 (1962).
15. Beentjes, L.B. An estimate of G.S.D. in the Netherlands (1967). Thesis, Utrecht, 1969.
17. Bengtsson, G. et al Patient exposures in Swedish diagnostic radiology. Swedish National Institute of Radiation Protection report SSI: 1976-013 (1976).
18. Berger, M. J. Energy deposition in water by photons from point isotopic sources. MIRD Committee Pamphlet No. 2, J. Nucl. Med. (1968).
19. Berman, M., D. V. Becker and R. S. Benna. The use of 1 3 3 I in the treatment of Graves' disease. J. Clin. Endocrinol. 17: 1222-1228 (1957).
20. Berry, R. J. and R. Oliver. Spoilt films in x-ray departments and radiation exposure to the public from medical radiology. Br. J. Radiol. 49: 475476 (1976).
21. Biagnini, C.. M. Barilla and A. Montanara. Zur genetischen Strahlenbelastung der Bevolkerung Roms durch die Rontgendiagnostik. Strahlentherapie 113: 100-109 (1969).
22. Boag, J. W., A. J. Stacey and R. Davis. Radiation exposure to the patient in xeroradiography. Br. J. Radiol. 49: 253-261 (1976).
23. Bradford Hill, J. Communication to the Adrian Committee Internal Report (1958).
349

24. Brownell, G. L., W. H. Ellet and A. R. Reddy. Absorbed fractions for photon .dosimetry. MIRD Committee Pamphlet No. 3. J. Nucl. Med. {1968).
25. Bundesminister des Innem, Federal Republic of Germany. Umweltradioaktivitat und Strahlenbelastung, Jahresbericht 1974. Bonn, 1976.
26. Bunge, R. National analysis of the organ dose index system, p. 89-93 in 6th Annual National Conference on Radiation Control. San Antonio, Texas.
27. Bureau of Radiological Health, United States. X-Ray Exposure Study (XES). Revised estimates of 1964 and 1970 genetically significant dose. Bulletin IX(3). Washington, 1975.
28. Bureau of Radiological Health, United States. Information provided by J.C. Villforth.
29. Burnett, B. M., R. J. Mazzaferro and W. C. Church. A study of retakes in radiology departments of two large hospitals. U.S. Department of Health, Educ~tion and Welfare report DHEW(FDA) 76-8016 (1975).
30. Cameron, J. R. A proposed unit for patient radiation exposure from diagnostic x-rays. Health Phys. 21: 879-880 (1971).
31. Cameron, J. R., J. Wochos and C.R. Wilson. Patient exposure from spine, chest and dental x-rays: A partial analysis of the "NEXT' data, p. 111-120 in Symposium on Population Exposures. Proceedings of the Eighth Midyear Topical Symposium of the Health Society. Report CONF-741018 (1974).
32. Case bow, M. P. Patient doses from orthopantomograph dental x-ray exposures. Br. J. Radio!. 46: 230-232 (1973).
33. Church, W.W. and B. M. Burnett. Lead equivalents of male gonad shields. Health Phys. 30: 229-231 (1976).
34. Cloutier, R. J. and E. E. Watson. Radiation dose from radioisotopes in the blood, p. 325-346 in Medical Radionuclides: Radiation Dose and Effects. U.S. Atomic Energy Commission Symposium Series 20 (1970).
35. Cocco, A. E. John's Hopkins reporting in World Tribune, 2 January 1969.
36. Committee on the Radiological Hazards to Patients. Second Report of the Committee, Her Majesty's Stationery Office, London, 1960.
37. Committee on the Radiological Hazards to Patients. Final Report of the Committee, Her Majesty's Stationery Office, London, 1960.
38. Cooley, R. N. and L.B. Beentjes. Weighted gonadal diagnostic roentgen ray doses in a teaching
350
hospital with comments on x-ray dosages to the general population of the United States. Am. J. Roentgenol. 92: 404-417 (1964).
39. Court Brown, W. M. and R. Doll. Leukaemia and aplastic anaemia in patients irradiated for ankylosing spondylitis. Medical Research Council Special Report Series No. 295, Her Majesty's Stationery Office, London, 1960.
40. Crabtree, C. L., 0. N. Johnson and S. J. Gibbs. Nashville Dental Report: an educational approach for voluntary improvement of radiographic practice. U.S. Department of Health, Education and Welfare report DHEW(FDA) 76-8011 (1975).
41. Cross, F. T. Dose rate to a bystander from an artificial heart power source. Health Phys. 29: 350-352 (1975).
42. Devik, F. Intrauterin bestraling ved rontgenundersokelse av gravide kvinner. og abortus provocatus. Tidskrift for Norske Laegeforer.Jtg 4 (1970).
43. Dillman, L. T. Radionuclide decay schemes and nuclear parameters for use in radiation dose estimation. MIRD Committee Pamphlet No. 4, J. Nucl. Med. (1969).
44. Dillman, L. T. Radionuclide decay schemes and nuclear parameters for use in radiation dose estimation. MIRO Committee Pamphlet No. 6, J. Nucl. Med. (1970).
45. Doll, R. and P. G. Smith. The long-term effects of x-irradiation in patients treated for metropathia haemorrhagica. Br.J. Radio!. 41: 362-368 (1968).
46. Dunlap, J. H. Radiation protection considerations in cardiac catheterization laboratory. Health Phys. 29: 415-417 (1975).
47. Ellis, R. E. The estimation of ovary dose received during diagnostic x-ray examinations from measurements of the ideal chest dose and skin dose. Adrian Committee Internal report 9/5/60/3 (1960).
48. Ellis, R. E. The correlation between the 'Incident Area-Exposure' and mean bone marrow dose. British Committee on Radiological Units report BCRU/68/27 (1968).
49. Ellis, R. E. Breast cancer following irradiation. Br. J. Radio!. 45: 795-796 (1972).
50. Ellis, R. E .. M. J. R. Healy, B. Shleien et al. A system for estimation of mean active bone marrow dose. U.S. Department of Health, Education and Welfare, Bureau of Radiological Health report DHEW(FDA) 76-8015 (1976).
51. Ellis, R. E., C. Nordin. P. Tothill et al The use of thyroid blocking agents. Br. J. Radio!. 50: 203-204 (1977).
52. Ellis, R. E .. Personal communication.
53. Ennow, K. State Institute of Radiation Hygiene. Use of radioactive materials in Denmark 1974/1975.
54. Epp, J.M .. H. Heslin, J. S. Weiss et al. Measurement of bone marrow and gonadal dose from x-ray examinations of the pelvis, hip and spine as a function of field size, tube kilovoltage and added filtration. Br. J. Radio!. 36: 247-265 (1963).
55. Evans, A. L., M. Davison, J. Mclellan et al Evaluation of a new screen/film combination. Br. J. Radio!. 48: 858-859 (1975).
56. Evans, A. L., W. B. James, J. Mclellan et al Film and xeroradiographic images in mammography. A comparison of tungsten and molybdenum anode materials. Br. J. Radio!. 48: 968-972 {1975).
57. Flat by, J. Genetically significant dose in x-ray diagnosis in Norway. Personal communication.
58. Gaeta, A. N. and B. M. Burnett. Standard technique for estimating patient exposure from photofluorographic x·-ray machines. U.S. Department of Health, Education and Welfare report DHEW(FDA) 75-8007 (1975).
59. Garby, L., B. Nosslin and S. Lofveberg. Data on dose to organs per microcurie administered and statistical data. Swedish National Institute of Radiation Protection, 1969.
60. Gilbertson, J. S., M. G. Randall and A. G. Fingerhut. Evaluation of roentgen exposure in mammography. Radiology 97: 641-647 (1970).
61. Gileadi, M. Joint radiation survey results 1973. Commonwealth of Puerto Rico. Department of Health and Puerto Rico Nuclear Center, 1975.
62. Gileadi, M. Uniform positiorung in routine abdominal x-ray diagnosis. Health Phys. 29: 883-885 (1975).
63. Gitlin, J. N. and P. S. Lawrence. Population exposure to x-rays, United States 1964. A report of the Public Health Service X-ray Exposure Study. U.S. Department of Health, Education and Welfare, PHS publication No. 1519 {1966).
64. Gomez.Crespo, G. and D. R. E. Ernborg. Medical radiation protection in the Eastern Mediterranean region, p. 1133-1138 in Proceedings of the Third International Congress of the International Radiation Protection Association, Washington, 1973. U.S. Atomic Energy Commission report CONF-730907-P2 (1974).
65. Goss, S. Size of population needed to detect an increase in disease risk when the levels of risk in the exposed and the controls are specified: examples from cancer induced by ionizing radiation. Health Phys. 29: 715-721 (1975).
66. Gough, J. H., R. Davis and A. J. Stacey. Radiation doses delivered to the skin, bone marrow and gonads of patients during cardiac· catheterisation and audiocardiography. Br. J. Radio!. 41: 508-518 (1968).
67. Goys, Y. S. and T. H. Khor. Failure of hand growth after x-ray therapy. Singapore Med. J. 14(1): 19-22 (1973).
68. Green, M., M. Fisher, H. Miller et al Blood radiation dose after 1 3 1 I therapy of thyrotoxicosis, calculations with reference to leukaemia. Br. Med. J. 11: 210.
69. Gustafsson, M. Integral absorbed doses in x-ray examinations of the gastrointestinal tract 1960 and 1974. Criteria for radiation protection. Third European Congress of the International Radiation Protection Association. Amsterdam, 1975.
70. Hammer Jacobsen, E. Genetically significant radiation doses in diagnostic radiology. Acta Radio!., Suppl. 222 (1963).
71. Hans, A. G., K. Rossman, K. Doi et al Image quality and patient exposure. International Symposium on Advances in Biomedical Dosimetry. U.S. Atomic Energy Commission report CONF-750331 (1975).
72. Harley, N. H., R. E. Albert, R. E. Shore et al Treatment of tinea capitis by x-ray epilation. Phys. Med. Biol. 21 (4): 631-642 (1976).
73. Hashizume, T., Y. Kato, T. Maruyama et al Population mean marrow dose and leukaemia significant dose from diagnostic medical x-ray examinations in Japan 1969. Health Phys. 23: 845-853 (1972).
74. Hashizume, T., Y. Kato, T. Maruyama et al Genetically significant dose from diagnostic medical x-ray examination in Japan, 1969. Health Phys. 23: 827-843 (1972).
75. Hashizurne, T., Y. Kato, Y. Kumomoto et al Genetically significant dose from beam therapy in Japan, 1971. Health Phys. 26: 449-459 (1974).
76. Hashizume, T., Y. Kato, Y. Kurnomoto et al Population mean marrow dose and leukaemia significant dose from beam therapy in Japan, 1971. Health Phys. 26: 461-467 (1974).
77. Hashizume, T., T. Maruyama, K. Nishizawa et al Comparison of genetically significant doses from medical uses of ionizing radiations and radionuclides in Japan. Proceedings of the First World Congress of Nuclear Medicine, World Federation of Nuclear Medicine and Biology. Kyoto, 1974.
78. Hashizume T., T. Maruyama, K. Nishizawa et al Estimation of population dose from brachytherapy in Japan. Nippon Acta Radio!. 35: 1022-1031 (1975).

79. Hashizume, T., T. Maruyama and Y. Kumamoto. Estimation of population dose from diagnostic medical examinations in Japan, 1974. I. The number of radiographs, radiographlc and fluoroscopic examinations. Nippon Acta Radiol. 36: 47-55 {1976).
80. Hashizume, T., T. Maruyama and Y. Kumamoto. Estimation of population dose from diagnostic medical examinations in Japan, 1974. 2. Estima· tion of genetically significant dose. Nippon Acta Radiol. 36: 208-214 {1976).
81. Hashizume, T., T. Maruyama and Y. Kumamoto. Estimation of population dose from diagnostic medical examinations in Japan, 1974. 3. Per caput mean marrow dose and leukemia significant do~e. Nippon Acta Radio!. 36: 215-224 (1976).
82. Hashlzume, T., T. Maruyama and Y. Kumamoto. Estimation of population dose from diagnostic medical examinations in Japan, 1974. 4. Dose estimation of foetus exposed in utero to diagnostic
• x rays. Nippon Acta Radiol. 36: 645-651 (1976).
83. Hashlzume, T., Y. Kato, T. Maruyama et al. Estimation of population doses from stomach mass screening, 1975. Nippon Acta Radiol. 37: 6 (1977).
84. Hashizurne, T. and T. Maruyama. Estimation of population doses from chest mass screening, 1975. Nippon Acta Radio!. 37: 6 (1977).
85. Hauser, W., H. L. Atkins, K. G. Nelson et aL Technetium-99m DTPA-A new radiopharmaceutical for brain and kidney scanning. Radiology 94: 679 {1970).
86. Haybittle, J. L. The effect of field size on the dose to the patient in diagnostic radiology. Br. J. Radio!. 30: 663-665 ( 1957).
87. Heegemann, C. Radiation exposure of patients in x-ray diagnostics with and without image intensifier television equipment and of the medical team work during work in the operating theatre. Thesis, University of Freiburg.
88. Hempelmann, L. H., J. W. Pifer, G. J. Burke et al Neoplasms in persons treated with x-rays in infancy for thymic enlargement. A repnrt of the third follow-up survey. J. Natl. Cancer Hist. 38: 317-341 (1967).
89. Henshaw, E.T. and J. Kennedy. Measurements of automatically controlled exposure rate in radiodiagnostic screening units. Br. J. Radial. 680-682 (1975).
90. Hine, G. J. and R. E. Johnston. Absorbed dose from radionuclides. J. Nucl. Med. 11: 468-469 (1970).
91. Hinz, G. and H. Weil. Entwicklung der Anwendung offener Radionuklide in Berlin (West). Deutscher
352
Rontgenkongress, 1972. Suppl. Fortschr. Geb. Roentgenstr. Nuklearmed. (1973).
92. Hinz, G. and R. Kramer. Aktuelle Fragen des Strahlenschutzes bei Untersuchungen im Beckenbereich, Bayerischer Rontgenkongress, Bamberg, 1976.
93. Hinz, G .. and W. Pietzsch. Entwicklung der Nuklearmedizin in Berlin (West) 1953-1975. Institut fur StrahlenhyP,:ene, Bundesgesundheitsamt, Federal Republic of Germany, STH-Bericht 10/76 (1976).
94. Holthusen, H., H. H.-K. Leetz and W. Leppin. Die genetische Belastung der Bevolkerung einer Grossstadt (Hamburg) durch medizinische Strahlenanwendung, Schriftenreihe des Bundesministers fur Atomkemenergie und Wasserwirtschaft. Strahlenschutz, Heft 21 (1961).
95. Hosain, P. and F. Hosain. A comprehensive approach for the evaluation of comparative dosimetry of internally administered radiopharma· ceuticals, p. 1175-1179 in Proceedings of the Third International Congress of the International Radiation Protection Association. Washington, 1973. U.S. Atomic Energy Commission report CONF-730907 (1974).
96. International Atomic Energy Agency. Register of Medical Radioisotope units. International Atomic Energy Agency report IAEA-167, Vienna 1974.
97. International Commission on Radiological Protection. Protection against ionizing radiation from external sources. A report of Committee 3. ICRP publications 15 and 21, Pergamon Press. Oxford, 1970.
98. International Commission on Radiological Protection. Protection of the patient in x-ray diagnosis. A report of a task group of Committee 3. ICRP publication 16, Pergamon Press. Oxford, 1970.
99. International Commission on Radiological Protection. Protection of patient in radionuclide investigations. ICRP publication 17. Pergarnon Press, Oxford, 1971 .
100. International Commission on Radiological Protection. Implications of Commission recommendations that doses be kept as low as readily achlevable. ICRP publication 22, Pergarnon Press, Oxford, 1973.
101. International Commission on Radiological Protection. Report of the Task Group on Reference Man. ICRP publication 23, Pergarnon Press, Oxford, 1975.
102. Isherwood. I., I. M. Young, K. W. Bowker et al. Radiation dose to the eyes of the patient during neuroradiological investigations (Abstract). Congressus Tertium Societatis Radiologicae Europaeae. Edinburgh, 1975.
103. Isherwood, L I. M. Young, K. W. Bowker et al. Radiation dose to the eyes of the patient during neuroradiological investigations. Neuroradioloizy 10: 137-141 (1975).
104. Isola, A. On the extent of x-ray examinations in Finland, p. 1321-1324 in Proceedings of the First International Congress of Radiation Protection, 1966. Pergamon Press (1968).
105. Isola. A. and 0. Ojala. The genetically significant dose from roentgen examination in Finland in 1963. Acta Radio!. 254: 120-130.
106. Izenstark, J. L. and W. Lafferty. Medical radiological practice in New Orleans: estimates and characteristics of visits, examinations and genetically significant dose. Radiology 90: 229-242 (1968).
107. Jones, D. E. A. and R. E. Ellis. The measurement of the dose contributions from the main treatment fields, p. 100-111 in Leukaemia and Aplastic Anaemia in Patients Irradiated for Ankylosing Spondylitis (W. M. Court Brown and R. Doll, eds.). Medical Research Council Special Report Series 295, Her Majesty's Stationery Office. London, 1957.
108. Kallfelz. F. A., C. L. Comar and A. P. Casarett. Biological effects of nuclear power pacemakers. Annual progress report, June 1, 1973-May 31, 1974. Report C00-3167-106 (1974).
109. Kaul. A., K. Oeff, H. D. Roedler et al Radiopharmaceuticals-biokinetic data and results of radiation dose calculations. Informationsdienst ftir Nuklearmedizin, Klinikum Steglitz der Freien Universitat Berlin (1973).
llO. Kaul, A., K. Oeff, H. D. Roedler et al Die Strahlenbelastung von Patienten bei der nuklearmedizinischen Anwendung offener radioaktiver Stoffe. Inforrnationsdienst fur Nuklearmedizin, Klinikum Steglitz der Freien Universitat Berlin (1973).
111. Keane, B. E. and G. Spiegler. Assessment of dose to the gonads outside diagnostic x-ray beams. Br. J. Radiol. 34: 362-367 (1961).
112. Keane, B. E. and K. B. Tikhonov. Manual on Radiation Protection in Hospitals and General Practice. Volume 3: X-ray Diagnosis. World Health Organization, Geneva, 1975.
113. Kitabatake, T., .M. Yokoyama, M. Sakka et al Estimation of benefits and radiation risks from stomach mass x-ray survey in Japan. Strahlentherapie 146(3): 352-358 (1973).
114. Kitabatake. T., M. Yokoyama, M. Sakka et al. Estimations of benefit and risk from mass chest radiography. Radiology 109: 3740 (1973).
115. Kitabatake T. and T. Watanabe. X-ray operation in practitioner offices in Niigata prefecture, Japan. Acta Med. Biol. 21 (2): 63-70 (1973).
116. Kitabatake, T. and M. Yokoyama. Tendency for patients with peptic ulcer to receive excess medical ionizing radiation. Tohoku J. Exp . .Med. 112: 205-208 (1974).
117. Kitabatake, T., T. Watanake and K. Shimonmura. Retake rate of x-ray films in Niigata area Japan. Acta Med. Biol. 22(2): 99-102 (1974).
118. Kitabatake, T. Epidemiological study on patient exposure to medical radiation. Nippon Acta Radiol. 35( 4): 228-242 (1975).
119. Kitabatake, T., T. Sato and S. Takeuchi. Frequency of prenatal x-ray examination and radiation risks in Japan. J. Radiat. Res. 1 7: 204-210 (1976).
120. Koen, J. A. and J. Weber. The genetically significant dose due to medical x-ray examinations in the Netherlands, p. 1085-1089 in Proceedings of the Third Irtternational Congress of the International Radiation Protection Association, Washington. 1973. U.S. Atomic Energy Commission report CONF-730907 (1974).
121. Koen, J. A. and C. J. Huyskens. Keimdriisendosen in der Rontgendiagnostik beim Mann. Internationales Reaktorinstitut, Bericht Nr. 190-75-05. Delft, Netherlands, 1975.
122. Kowalewsky, H. Radiation exposure of people by radioisotopic powered cardiac pacemaker licensed in the Federal Republic of Germany. Third European Congress of the International Radiation Protection Association. Amsterdam, 1975.
123. Kramer, R. and G. Drexler. Zurn Verhaltnis von Oberflachen- und Korperdosis in der Rontgendiagnostik. Medizinische Physik, Vol. 2 (Dr. A. Huthig, ed.). Heidelberg, 1976.
124. Kriss, J.P., R. Barrall, R. Greenberg et al. Guidelines and criteria for a Committee authorizing the use of radioactive isotopes in humans. J. Nucl. Med. 8: 70-73 (1967).
125. Krongaus, A. N., L. N. Gorelova and V. Ya. Gotlib. Radiation doses to patients and criterion for maximum permissible dose. Med. Radio!. 11.8: 77-84 (1966).
126. Kunz, E. and V. Michal. Exposure of the population of the CSSR to ionizing radiation in x-ray diagnostics. Institute of Radiation Hygiene, Czechoslovakia.
127. Kuznetsov. A. I., V. D. Krimtsyn and T. I. Zubkova. Gonad doses in roentgendiagnostical investigation of the stomach depending upon its location in the abdominal cavity. Med. Radio!. No. 8: 27-31 (1975).
353

128. Larsson, L. E. Radiation doses to the gonads of patients in Swedish roentgen diagnostics: Studies on magnitude and variation of the gonad doses together with dose reducing measures. Acta Radial. Suppl. 157: 7-127 (1958).
129. Leppin, W. Strahlenexposition der Bevolkerung durch rontgendiagnostische Massnahmen, insbesondere <lurch die genetischsignifikante Gonadendosis. Deutscher Rontgenkongress, Berlin. 1975.
130. Lewallen. C. G. Some observations on radiation dose to · bone marrow during 13 1 I therapy of thyroid cancer. Am. J. Roentgenol. 89: 618-623 (1963).
131. Lindell, B. Personal communication.
132. Loevinger. R. and M. Berman. Schema for ab· sorbed dose calculations for biologically distributed radionuclides. MIRD Committee Pamphlet No. I. J. Nucl. Med. (1968).
133. McEwan, A. C. Unsealed radioisotopes in medical practice in New Zealand. National Radiation Laboratory report NRL/PDS/ 1967.
134. MacMahon, B. and G. B. Hutchinson. Prenatal x-ray and childhood cancer: A review. Acta Unio. Int, Contra Cancrum 20; 1172-1174 ( 1964).
135. Mahmoud, K. A., M. M. Mahfouz, M. E. Mahmoud et al Gonadal and bone marrow dose in medical diagnostic radiology. United Arab Republic Scientific Committee on the Effects of Atomic Radiation on Man, Vol. 3-1 (1961).
136. Mahmoud, K. A .. M. M. Mahfouz, I. R. Atiyah et al Report on genetically significant dose from diagnostic radiology in Cairo and Alexandria. United Arab Republic Scientific Committee on the Effects of Atomic Radiation on Man. Vol. 4-2 (1962).
137. MaJ1e, T. and Z. Rozycki. Exposure of human gonads to x-ray dose and conditions influencing the value of the dose during radiological diagnosis. Pol. Przeg. Rad. I. Med. Nukl. XXXVIII, 2: 211-222 (1974).
138. Maruyama, T., T. Hashizume, K. Nishizawa et al. Estimation of population doses from dental radiography in Japan, 1974. J. Dent. Radio!. 17(1): 52-53 (1977).
139. Matthews, J.C. and H. Miller. Radiation hazards from diagnostic radiology. A repeat survey over a small area. Br. J. Radio!. 42: 814-817 (1969).
140. Medical Internal Radiation Dose Committee (MIRD). Pamphlets 1-9, J. Nucl. Med. ( I 968-1972).
141. Milhailovic, M .. M.Pavlic, M. V. Milhailovic et al.
354
Radiation doses to the gonads of patients from diagnostic radiology in Yugoslavia. Proceedings of
the Ninth International Congress of Radiology. Excerpta Med. ICS No. 105: 1537-1561 (1967).
142. Ministry of Public Health, Thailand. Annual Report for the Year 1969. R.P.S. AR.3. Bangkok. Thailand, 1969.
143. Ministry of Public Health. Thailand. Report on some aspects of radiation protection and population exposure in Thailand (1970).
144. Misono, K. (ed.). Dose reduction in radiological procedure. Japan Isotope Association (1973).
145. Modan, B. and A. M. Lilienfeld. Polycythernia vera and leukaemia-the role of radiation treatment. Medicine 44: 305-344 (1965).
146. Murai, T. The genetically significant dose from dental x-ray diagnosis in Japan. Bulletin Tokyo Medical Dental University 8: 219 (1961).
147. Morgan. K. Z. Standard man-standard patient, p. 87-102 in Medical Radionuclides: Radiation Dose and Effects. U.S. Atomic Energy Commission Symposium Series 20 (1970).
148. Morgan, R.H. and J.C. Gehret. The radiant energy received by patients in diagnostic x-ray practice. Am. J. Roentgenol. 97; 793-810 ( 1966).
149. National Council on Radiation Protection and Measurements. Dental x-ray protection. NCRP report No. 35 (1970).
150. National Council on Radiation Protection and Measurements. Medical radiation exposure of pregnant and potentially pregnant women. NCRP report No. 54 (1977).
151. National Institute of Radiation Protection, Sweden. Annual Reports of the Swedish National Institute of Radiation Protection. Stockholm, 1968-1975.
152. National Radiation Laboratory, New Zealand. Report on Radiation Control and Population Dose in New Zealand. National Radiation Laboratory report NRL-UN/2 (1970).
153. National Radiological Protection Board. The data submitted by the United Kingdom to the United Nations Scientific Committee on the Effects of Atomic Radiation for the 1977 Report to the General Assembly (F. E. Taylor, G. A. M. Webb and J. R. Simmonds, eds.), NRPB-47. Harwell, 1976.
154. Nave, M. Radiat{on dose reduction for patients in diagnostic radiology. Technion-Israel Institute of Technology report APR 38 (1973) (in Hebrew).
155. Neumeister. K. Radiogenetic and radiobiological indications for interruption of pregnancy. Arnt fiir Atomsicherheit und Strahlenschutz der DDR, report SAAS-203 (1976).
156. Noothoven van Goor, J.·M., A. A. Franken and J.C. Hellekamp. Radiation dose reduction by pulsed fluoroscopy. Congressus Tertium Societatis Radiologicae Europaeae Edinburgh, 1975.
157. Nuclear Center Department of Health, Puerto Rico. Evaluation of health hazards due to unintentional irradiation of the gonads during routine abdominal x-ray examinations of male ·and female patients in Puerto Rico. Report No. 1, Western Region, Puerto Rico, 1969.
158. Nuclear Center Department of Health, Puerto Rico. Evaluation of health hazards due to unintentional irradiation of the gonads during routine abdominal x-ray examinations of male and female patients in Puerto Rico. Report No. 2, Southern Region. Puerto Rico, 1970.
159. Osborne, S. B., D.R. Tavener and F. T. Farmer. Dosage distribution in the treatment of ringworm by x-rays. Br. J. Radial. 18: 145-147 (1945).
160. Osborne, S. B. and F. T. Farmer. Dose variation in x-ray epilation for tinea capitis. Phys. Med. Biol. 21: 992-994 (1976).
161. Pasternack, B. S. and M. B. Heller. Genetically significant dose to the population of New York City from diagnostic medical radiology. Radiology 90: 217-228 (1968J.
162. Pellerin, Y. P.A. La radioprotection en chirurgie dentaire (radiodiagnostic). Rene Descartes Academie de Paris. 1974.
163. Pellerin. Y. P.A. Personal communication.
164. Penfil, R. L. and M. L. Brown. Genetically s1gruficant dose to the United States population from diagnostic medical roentgenology, 1964. Radiology 90: 209-216 (1968).
165. Perry, B. J. and C. Bridges. Computerized transverse axial scanning (tomography): Part 3. Radiation dose considerations. Br. J. Radio!. 46: 1048-1051 (1973).
166. Placer. A. E. Dosis geneticamente significativa debida al radiodiagn6stico medico. Republica Argentina, Comisi6n Nacional de Energia At6· mica, Inforrne No. 49. Buenos Aires, 1961.
167. Pochin, E. E. Leukaemia following radioiodine treatment of thyrotoxicosis. Br. Med. J. 11: 1545-1550 (1960).
168. Pochin, E. E. Long term hazards of radioiodine treatment of thyroid carcinoma, p. 293-304 in Thyroid Cancer (C. Hedinger, ed.). UICC Mono· graph Series, Vol. 12. Springer Verlag, Berlin. 1969.
169. Pochin, E. E. and J.C. Kermode. Protection prob· lems in radionuclide therapy: the patient as a gamma radiation source. Br. J. Radio!. 48: 299-305 ( 197 5 ).
170. Paretti. G. G., F. Ionesco-Farca and w. L Erhebung iiber die Strahlenbelastuna a;:2· S h · B ··lk · f O er c we1zer evo erung m olge rontgendiagnos-tischer Untersuchungen (1971 ).
171. Poston, J. W. and G. C. Warner. Absorbed dose to selected internal organs from typical diagnostic exposures, p. 1115-1120 in Proceedings of the Third International Congress of the International Radiation Protection Association, Washington, 1973. U.S. Atomic Energy Commission report CONF-730907 (1974).
172. Potter, D. C. Hospital radioisotope imaging equipment and techniques-1974 version. Department of Health and Social Security, London, Supply Division report STB2/74/1.
173. Price, J. L. and P. D. Butler. A new screen/film combination applicable to mammography. Br. J. Radiol. 48: 872 (1975).
174. Puijlaert, C. B. De Expansie van de Rontgendiagnostick, Medisch Contract, 1969/24/685. l\Iedicamundi 14(3): 137-149 (1969).
175. Puijlaert, C. B. Expansion in radiodiagnostic work in the Netherlands. Planning of Radiological Departments. G. Thieme-Verlag, Stuttgart. 1974.
176. Puijlaert, C. B. Planning and calculation of surveys of x-ray department, based on workload to be expected. Planning of Radiological Departments. G. Thieme-Verlag, Stuttgart, 1974.
177. Racoveano. N. T., C. Diaconesco, G. Modoran et al Medical irradiation to the population of Romania. p. 1144-1149 in Proceedings of the Third International Congress of the International Radiation Protection Association, Washington, 1973. U.S. Atomic Energy Commission report CONF-730907 (1974).
178. Reboul,J., J.Tavemier, Y.Istin et al Doses gonades resultant de !'utilisation des radiations ionisantes en France, I. Radiodiagnostic.Ann. Radio!. 2: 179-196 (1959).
179. Reboul, J., 1: Tavernier, G. Delorme et al Doses gonades resultant de !'utilisation des radiations ionisantes en France, I. Radiodiagnostic. Ann. Radio!. 2: 571-584 (1959).
180. Reboul, J., G. Delorme, J. Tavernier et al Doses gonades resultant de !'utilisation des radiations ionisantes en France, II. Radioscopie. Ann. Radio!. 3: 89-99 (1960).
181. Research Group on the Genetically Significant Dose by the Medical Use of X-ray in Japan. The genetically significant dose by the x-ray diagnostic examination in Japan (March 1961 ).
182. Richter, B. and L. Rausch. Gegenilberstellung von Risiko, Kosten und Nutzen der Mammographie, p. 158-168 in Betrieblicher Strahlenschutz aus
355

arztlicher Sicht. Grundlagen und Praxis des Strahlenschutzes in der Medizin, Strahlenschutz in Forschung und Praxis, Bd. XVII. G.ThiemeVerlag, Stuttgart. 1977.
183. Roedler, H. D., A. Kaul, W. Berner et al Development of an extended formalism for internal dose calculation and practical application to several biologically distributed radioelements, p. 515-541 in Assessment of Radioactive Contamination in Man. Proceedings of a Symposium on the Assessment of Radioactive Organ and Body Burdens. IAEA publication STI/PUB/290 (1972).
184. Roedler, H. D. and A. Kaul. Neuere Berechnungen der Strahlendosis <lurch inkorpierte radioaktive Stoffe nach dem erweiterten Konzept der absorbierten Bruchteile: Formal exakte und Niiherungslosung. A tornkernenergie 21 ( 4 ): 249-253 (1973).
185. Roedler, H. D. and A. Kaul. Radiation absorbed dose from medically administered radiopharmaceuticals, p. 655-665 in Biomedical Dosimetry. IAEA publication STI/PUB/ 401. Vienna. 1975.
186. Roedler, H. D., A. Kaul, G. Hinz et al. Genetically significant dose from the use of radiopharmaceuticals, p. 377-393 in Population Dose Evaluation and Standards for Man and His Environment, LAEA publication STI/PUB/375, Vienna., 1974.
187. Roessler, C. E .. R. J. Forsythe, W. K. Collett et al Development of a dental x-ray protection survey technique employing thermoluminescent dosimeters, p. 91-100 in Health Physics in the Healing Arts. U.S. Department of Health, Education and Welfare report DHEW(FDA) 73-8029 (1973).
188. Rogers, R. T. Hospital radioisotope imaging equip· ment and techniques. U.K. Department of Health and Social Security. Supply Division report (1972).
189. Rogers, R. T. Hospital radioisotope imaging equipment and techniques, 1973 version. U.K. Department of Health and Social Security, Supply Division report SIB 2/73/1.
190. Rosenstein, M. Organ doses in diagnostic radiology. U.S. Department of Health, Education and Welfare report DHEW(FDA) 76-8030 (1976).
191. Rothenburg. L. N., R. A. Kirch and R. E. Snyder. Patient exposure from film and xeroradiographic mammography techniques. Radiology 117: 701-703 (1975).
192. Rowley, K. A. Patient exposure in cardiac catheterisation and cinefluorography using the Eclair 16 mm camera at speeds up to 200 frames per second. Br. J. Radio!. 47: 169-178 (1974).
193. Royal College of Radiologists, London. Recommendations on the implementation of the ·' I 0-Day Rule". Br. J. Radiol. 49: 201 (1976).
356
194. Saenger, E. L., G. E. Thoma and E. A. Tomkins. Incidence of leukaemia following treatment of hyperthyroidism. J. Am. Med. Assoc. 205: 855-862 (1968).
195. Saxton, H. M. Radiology now. Which? on radiation. Br. J. Radiol. 48: 877 (1975).
196. Schlenker, R. A. X-ray exposures given with various combinations of films and screen, p. 90-92 in Argonne National Laboratory Radiological report ANL-75-3, Pt. 2.
197. Schmelz, H.P. 8trahlentherapie in freier Praxis. Statistische Untersuchung iiber die Strahlenexposition der Bevolkerung <lurch die Therapie nicht maligner Erkrankungen im Raum Miinchen. Inauguraldissertation. Miinchen. 1974.
198. Schmelz, H.P. Strahlentherapie in der Klinik. Statistische Untersuchung auf Grund der strahlentherapeutischen Tatigkeit im Raum Miinchen. Inauguraldissertation. Miinchen, 1974.
199. Schulz, R. J. and R. E. Albert. Dose to organs of the head from the x-ray treatment of tinea capitis. Arch. Environ. Health 17: 935-950 (1968).
200. Schiittman. W. and W. Konig. The importance of training radiologists in radiation protection with regard to the reduction of radiation exposure of patients. Third European Congress of the International Radiation Protection Association, Amsterdam, 1975.
201. Schuttmann, W. Staatliches Arnt fiir Atomsicherheit und Strahlenschutz der DDR. report SAAS-201 (1976).
202. Schuttmann, W. Personal communication.
203. Seelentag, W., D. V. Arnim, E. Klotz et al Frage der genetischen Belastung der Bevolkerung durch die Anwendung ionisierender Strahlen in der Medizin. II. Teil: Messungen iiber die bei rontgendiagnostischen Untersuchungen an die Gonaden gelangenden Dosen. Strahlentherapie 105: 169-195 (1958).
204. Seelentag, W., T. Nurnberger, D. Knorr et al Zur Frage der genetischen Belastung der Bevolkerung durch die Anwendung ionisierender Strahlen in der Medizin. N. Teil: Die Strahlenbelastung <lurch die Rontgendiagnostik in Kinderkliniken. Strahlentherapie 107: 537-555 (1958).
205. Seelentag, W., E. Seelentag-Lupp and E. Klotz. Zur Frage der genetischen Belastung der Bevolkerung <lurch die Anwendung ionisierender Strahlen in der Medizin. V. Teil: Werte und Schwankungsbreiten von Untersuchungsfrequenzen und gemessenen Dosen in 10 grossen und kleinen Krankenhausern und in der freien rontgenologischen Praxis. Strahlentherapie 111: 435-467 ( 1960).
206. Seelentag, W. Die gegenwiirtige Exposition der Bevolkerung durch die medizinische Strahlenanwendung und ihre Bedeutung. Strahlentherapie 52: 326-333 ( 1963).
207. Seidlitz. L. and A. R. Margulis. Doses to the vertebral marrow during common x-ray examinations in clinical situations. Invest. Radio!. 9( 6): 419-424 (1974).
208. Shleien, B., T. T. Tucker and D. W. Johnson. The mean active bone marrow dose to the adult population of the United States from diagnosticradiology. U.S. Department of Health Education and Welfare report DHEW(FDA) 77-8013 (1977).
209. Smith, M. L. and L. H. Munson. Dose measurement criteria for prosthetic devices powered by nuclear batteries, p. 445-449 in Health Physics in the Healing Arts. U. S. Department of Health, Education and Welfare report DHEW (FDA) 73-8029 (1973).
210. Smith, P. G. and R. Doll. Late effects of x-irradiation in patients treated for metropathia haemorrhagica. Br. J. Radio!. 49: 224-232 (1976).
211. Snyder, W. S., H. I. Fisher, M. R. Ford et al Estimates of absorbed fractions for monoenergetic photon sources uniformly distributed in various organs of a heterogeneous phantom. MIRO Committee Pamphlet No. 5, J. Nucl. Med. (1969).
212. Snyder, W. S., M. R. Ford, G. G. Warner et al A tabulation of dose equivalent per microcurie-day for source and target organs of an adult for various radionuclides. Oak Ridge National Laboratory report ORNL-TM-5000 {1975).
213. Snyder, W. S., M. R. Ford, G. G. Warner et al. Absorbed dose per unit cumulated activity for selected radionuclides and organs. MIRD Committee Pamphlet No. 11, J. Nucl. Med. (1976).
214. Spiers, F. W., A. H. Beddoe, S. D. King et aL The absorbed dose to bone marrow in the treatment of polycythaemia by 32 P. Br. J. Radio!. 49: 133-140 (1976).
215. Spiess, H. 22 4 Ra-induced tumours in children and adults, p. 227-247 in Delayed Effects of BoneSeeking Radionuclides (C. W. Mays, W. S.S. Jee, R. D. Lloyd et al., eds.). University of Utah Press, 1969.
216. Sowby, F. D. Exposure to x rays in diagnostic radiology. World Health Organization Chronicle 28(7): 333-335 (1974).
217. Staatliches Arnt fiir Atomsicherheit und Strahlenschutz der DDR. Standardisierungsempfehlungen der Roentgendiagnostik in der DDR. Report SAAS-182 (1975).
218. Staatliches Arnt fur Atomsicherheit und Strahlenschutz der DDR. Recommendations for standardization in x-ray diagnosis in the German Democratic Republic. Second enlarged edition. Report SAAS-200 (1976).
219. State Institute of Radiation Hygiene, Denmark. Annual report on the use of radiopharmaceuticals at Danish hospitals. Copenhagen, 1974.
220. State Institute of Radiation Hygiene, Denmark. Report on the Institute's work from I April 1974 to 31 March 1975. Copenhagen. 1975.
221. State Institute of Radiation Hygiene, Norway. Patient doses in Norwegian dental radiography. Osteras, 1976.
222. Stavitzki, R. V. Gonadal doses of patients who were investigated roentgenologically. Med. Radio!. 8: 32-37 (1975).
223. Stieve, F. E. Indikationen zum Schwangerschaftsabbruch nach Einwirkung ionisierender Strahlen, in lndikationen zum Schwangerschaftsabbruch (H. Lau, ed.). 148. Tagung der Mittelrheinischen Geburtshilfe und Gyniikologie. Darmstadt, 1976.
224. Stieve, F. E. Neue technologische Entwicklung in Konkurrenz mit der Rontgendiagnostik um die zivilisatorische Strahlenbelastung des Menschen. Fortschr. Geb. Roentgenstr. Nuklearmed. 152: 2 (1976).
225. Stieve, F. E. Strahlenbedingte teratogene Wirkungen und Schwangerschaftsabbruch. Rontgenbliitter 29 (1976).
226. Stieve, F. E. Personal communication (1976).
227. Stieve, F. E. and A. Kaul. Ambulante Behandlung und Schutz von Personen ausserhalb des Krankenhauses. Institut fur Strahlenhygiene, Bundesgesundheitsamt Berlin, STH-Bericht 12/76 (1976).
228. Stewart, A. and R. Barber. Epidemiological importance of childhood cancers. Br. Med. Bull. 27(1): 64-70 (1971).
229. Stillman, J. and K. Palmer. Variation of skin dose in mammography-a comparison of blue x-ray film (Medichrome) with conventional black and white (Kodak PE 4006). Br. J. Radiol. 48: 228-229 (1975).
230. Supe, S. J .. S. M. Rao, S. G. Savant et al Genetically significant dose to the population in India from x-ray diagnostic procedures, p. 395-411 in Population Dose Evaluation and Standards for Man and His Environment. IAEA publication STI/PUB/375. Vienna, 1974.
231. Survey of academic divisions of nuclear medicine in the United States Medical Schools, April 1972. J. Nucl. Med. 15: l (1974).
232. Swedish Medical Board. Suggestion on the organization of oncology in Sweden-a report of a study group. Stockholm, Sweden, 1972.
233. Takahashi, S., T. Kitabatake and S. Koga. Study on technique of patient dose reduction. Hamamatsu University School of Medicine, March 1975.
234. Takaku, Y. A method for estimation of active bone marrow dose from x-ray radiography. Nippon Acta Radio!. 35: 685-687 (1975).
357

235. Telichko, F. F. Doses of irradiation from roentgenological investigations. Medizina, Moscow, 1976.
236. Thompson, P. L., I. R. Mackay, G. S. M. Robson et al Late radiation nephritis after gastric x-irradiation for peptic ulcer. Q. J. Med. 40(157): 145-157 (1971).
237. Traenkle, H. L. X-ray induced skin cancer in man. U.S. National Cancer Institute Monograph, Biology of Cutaneous Cancer 10: 423432 (1963).
238. Trott, N. G., A. J. Stacey, R. E. Ellis et al The dosimetry of selected procedures using x rays and radioactive substances, p. 157 -184 in Medical Radionuclides-:- Radiation Dose and Effects. U.S. Atomic Energy Commission Symposium Series 20 (1970).
239. Trout, E. D., J.P. Kelley and A. C. Lucas. The effect of kilovoltage and filtration on depth dose, p. 143-157 in Technological Needs for Reduction of Patient Dosage from Diagnostic Radiology. Charles C. Thomas, Springfield, Illinois. 1963.
240. United Kingdom Consumers Association. Public safety: radiation, Which? 4: 100-103 (1975).
241. United Kingdom Department of Health and Social Security. Radiological protection in dental practice. March 1975.
242. United Nations. Report of the United Nations Scientific Committee on the Effects of Atomic Radiation. Official Records of the General Assembly, Thirteenth Session. Supplement No. 17. (A/3838). New York, 1958.
243. United Nations. Report of the United Nations Scientific Committee on the Effects of Atomic Radiation. Official Records of the General Assembly, Seventeenth Session. Supplement No. 16. (A/5216). New York, 1962.
244. United Nations. Ionizing Radiation: Levels and Effects. A report of the United Nations Scientific Committee on the Effects of Atomic Radiation to the General Assembly, with annexes. United Nations publications, Sales No. E.72.IX.17 and 18. New York, 1972.
245. United States Atomic Energy Commission. Medical Radionuclides: Radiation Dose and Effects. U.S. Atomic Energy Commission Symposium Series 20 (1970).
246. United States Department of Health, Education and Welfare. Reduction of radiation exposure in nuclear medicine. U.S. Department of Health, Education and Welfare Public Health Service, Environmental Health Series publication 99-RH-30 (1967).
247. United States Department of Health, Education and Welfare. Population dose from x-rays. U.S.
358
1964. Estimates of gonad dose and genetically significant dose from the Public Health Service X-ray Exposure Study. U.S. Department of Health, Education and Welfare Public Health Service publication No. 2001 (1969).
248. United States Department of Health, Education and Welfare. Survey of the use of radionuclides in medicine. Stanford Research Institute report BRH/DMRE 70-1 (1970).
249. United States Department of Health, Education and Welfare. Radiation bio-effects. Summary report Jan.-Dec. 1969. U.S. Department of Health, Education and Welfare Public Health Service publication BRH/DBE 70-1 (1970).
250. United States Department of Health, Education and Welfare. Volume of x-ray visits, U.S. Apr.-Sept. 1970. Vital and Health Statistics, Series 10, No. 81. National Center for Health Statistics publication DHEW-HSM 73-1507.
251. United States Department of Health, Education and Welfare. Population Exposure to X-rays, U.S. 1970. U.S. Department of Health, Education and Welfare publication DHEW(FDA) 73-8047 (1973).
252. United States Department of Health, Education and Welfare. Gonad shielding in diagnostic radiology. U.S. Department of Health, Education and Welfare publication DHEW(FDA) 75-8024 (1975).
253. United States Department of Health, Education and Welfare. Specific Area Gonad Shielding, p. 4274942751 in Federal Register 40: 180 (1975).
254. United States Department of Health, Education and Welfare. Application of iodine-123 in nuclear medicine. Proceedings of Conference in Rockville, Maryland, 1975. U.S. Department of Health, Education and Welfare publication DHEW(FDA) 76-8033 (1976).
255. United States Department of Health, Education and Welfare. Gonad doses and genetically significant dose from diagnostic radiology. U.S. Department of Health, Education and Welfare publication DHEW(FDA) 76-8034 {1976).
256. Villforth, J. C. Population exposure for diagnostic x-rays and their control, p. 79-88 in Symposium on Population Exposures. Proceedings of the Eighth Midyear Topical Symposium of the Health Society. Report CONF-741018 (1974).
257. Warner, G. G., J. W. Poston and W. S. Snyder. Absorbed dose in phantoms which represent various aged male humans from external sources of photons as a function of age. Health Phys. 28: 599-603 (1975).
258. Watts, F. C. and J.E. Whitley. Determination of radiation exposure dose to patients and personnel
during elaborate cinefluorographic procedures. Third Health Physics Society Symposium, U.S. Atomic Energy Commission report CONF-690102-Pl (1969).
259. Weber, J. Beenmergdosis tengevolge van de rontgendiagnostiek, Thesis. Leiden, 1964.
260. Weismann, D. D. Comparative absorbed doses in dental radiography: IV. Pedodontic radiography, p. 101-105 in Health Physics and the Healing Arts. Health Physics Society, December 1972. U.S. Department of Health , Education and Welfare report DHEW(FDA) 73-8029 ( 1973).
261. Weng, P. S. and C. Y. Huang. Evaluation of diagnostic x-ray contribution to the annual genetically significant dose equivalent of Taiwan urban population, p. 1091-1905 in Proceedings of the Third International Congress of the International Radiation Protection Association, Washington , 1973. U.S. Atomic Energy Commission report CONF-730907-P2 (1974).
262. Werner, S. C., A. Gittelsohn and A. B. Brill. Leukaemia following radioiodine therapy of hyperthyroidism. J. Am. Med. Assoc. 177: 646-648 (1961 ).
263. Werner, A., B. Modan and D. Davidoff. Doses to brain, skull and thyroid following x-ray therapy for tinea capitis. Phys. Med. Biol. 13: 247-258 (1968).
264. Werner, A. , B. Madan and E. Ron. Thyroid dosimetry re-evaluation after treatment for scalp tinea. Communication given at the Fourth International Conference on Medical Physics. Ottawa, July 1976.
265. Wheatley, B. M. and J. Gellinger. The methods used to estimate the whole body integral dose of radiation. p. 113-123 in Leukaemia and Aplastic Anaemia in Patients Irradiated for Ankylosing Spondylitis (W. M. Court Brown and R. Doll , eds.). Medical Research Council Special Report Series 295 , Her Majesty's Stationery Office, London, 1957.
266. Williamson, B. D. P. and A. C. McEwan. The genetically significant radiation dose to the population of New Zealand from diagnostic radiology. National Radiation Laboratory report NRL/PDS/ 1965.
267. World Health Organization. Mass Health Examinations. Public Health Papers No. 45. Geneva, 1971.
268. Young, G. B. Techniques and radiation in mammography. Br. J. Radio!. 47: 811-815 (1974).
269. Zuppinger, A., W. Minder, R. Sarasin et al. Die Strahlenbelastung der schweizerischen Bevolkerung durch rontgendiagnostische Massnahmen. Radial. Clin. 30: 1-27 (1961).
359
Related Documents