Unrealized Promises Unequal Access, Affordability, and Excellence at Community Colleges in Southern California Mary Martinez-Wenzl and Rigoberto Marquez January 2012

Welcome message from author
This document is posted to help you gain knowledge. Please leave a comment to let me know what you think about it! Share it to your friends and learn new things together.
Transcript

UnrealizedPromisesUnequalAccess,Affordability,andExcellenceatCommunityCollegesinSouthernCalifornia
MaryMartinezWenzlandRigobertoMarquez
January2012

2 UnrealizedPromises
CivilRightsProject/ProyectoDerechosCivilesJanuary,2012
TABLEOFCONTENTSAcknowledgements………………………………………………………………………………………………….3
ForewordbyGaryOrfield…………………………………………………………………………………………4
ExecutiveSummary ....................................................................................................6
Introduction ...............................................................................................................8
CaliforniaCommunityCollegeContext......................................................................10
TheMasterPlan’sUnrealizedPromises ............................................................................................. 10
ServingtheUnderpreparedatComparablyLowExpense .................................................................. 11
TheResourceFailure:RestrictedRevenueStreams,RisingCosts,andVolatileSpending .................. 12
AnIncreasinglyDiverseStateShiftandChangesinEnrollmentPatterns ........................................... 13
UnevenRacialandEthnicDiversityinPublicPostsecondarySystems ................................................ 14
FreshmenPathwaystoCommunityColleges:LocationMatters ................................17
FlowsofFirst‐TimeFreshmen ............................................................................................................. 17
PathwaysfromSchoolswithStrongandWeakPromotingPower ..................................................... 18
SegregatedPathwaysfromHigh‐andLow–PerformingSchools ....................................................... 20
TransferRatesandVolumebyRaceandEthnicity.....................................................25
TransferRatesbyCounty.................................................................................................................... 26
HighestandLowestTransferRatesintheRegion .............................................................................. 27
BlackandLatinoTransferTrends ....................................................................................................... 29
Findings ....................................................................................................................34
Conclusion................................................................................................................36
Appendix ..................................................................................................................40

3 UnrealizedPromises
CivilRightsProject/ProyectoDerechosCivilesJanuary,2012
Acknowledgements
Ourownexperiencesascommunitycollegestudentsdriveourinterestandpassionincommunitycollegeresearch.Webothbeganourcollegeeducationatcommunitycolleges,wherewebenefitedtremendouslyfromdedicatedinstructorsandstudentsupportsystems.Withthisinmind,wewouldliketothanktheOfficeofMulticulturalAffairsatLaneCommunityCollegeandTRIO:StudentSupportServicesprogramatSantaMonicaCollegeforhelpingusbecomesuccessfulcommunitycollegestudents,whotransferredandlaterwentontoearnMastersdegreesandnowaredoctoralstudents.WealsowouldliketoextendourgratitudetoProfessorGaryOrfieldforaffordinguswiththeopportunitytodelveintothisresearchproject.LittledidweknowuponenrollinginProfessorOrfield’scourse,“Immigration,RacialChange,andEducationina21stCenturyMetropolis,”thatwewouldbedivingdeeplyintoresearchthatwouldchallengeustoexaminetheinterplayofrace,segregation,andopportunityinthecommunitycollegesystem.ProfessorOrfield’smentorshipandsupportallowedustocontinuetodevelopourresearchbeyondtheboundsofthecourse.WealsoextendourthankstoDr.GenevieveSiegel‐Hawleyforherinvaluableassistanceandeditingeverystepoftheway.Finally,wewishtoacknowledgetheCouncilfortheStudyofCommunityCollegesforprovidingaforumtoshareourearlyfindingsandreceiveinsightfulfeedbackonourwork.MaryMartinez‐WenzlandRigobertoMarquez

4 UnrealizedPromises
CivilRightsProject/ProyectoDerechosCivilesJanuary,2012
ForewordbyGaryOrfield Earlierthismonth,PresidentBarackObamavisitedacommunitycollegecampusinNorthernVirginia,justoutsidethenation’scapital.“Lightingaspark—that’swhatcommunitycollegescando,”proclaimedthepresident,toutingtheindividualadvantagesofcommunitycollegeprograms—atickettothemiddleclasstraditionallyprovidedatsteeplydiscountedprices—aswellastheirimportanceinshoringupAmerica’seconomicfuture.Yet,despitethecriticalsparkthatcommunitycollegesarewell‐poisedtoprovide,Californiaisthreateningtoslashsupportforthestatesystembyupto10percent,amountingtoan$800‐millionreductioninnextyear’sfunding. InCalifornia,communitycollegeshavelongplayedacentralroleinthestate’shighereducationsystem.Datingbacktothe1960MasterPlan,allCaliforniastudentshavesupposedlybeenassuredofaccesstohighereducation.Communitycollegeswereslatedtocarrythelargestportionoftheload,responsibleforeducatingandtheneithergraduatingortransferringtwo‐thirdsofthestate’saspirantstoapost‐secondarydegree.Extraordinarilyseverefundingcuts(andtheaccompanyingriseinfees)will,ofcourse,dolittletomakegoodonthatlong‐standingpromise. Duringatimeofseriousdemographictransition,thestatecanillaffordtobackpedalonitspledgestoarisinggenerationofblackandLatinoyouth,whoareverydisproportionatelyconcentratedinthecommunitycollegesystem.ThesestudentswillmakeupamajorityofCalifornia’sworkforceinshortorder.Withoutaccesstohighereducation,theeducationaltrajectoryofmultitudesofstudentswillbetragicallystunted,andthestate’seconomicenginewillcontinuetosputter.
Beyondprovidingthebasicfundingandinfrastructuretosustainenrollmentincommunitycolleges,Californiamustworktoensurethattheprogramsareworkingtotransferand/orgraduatedegree‐seekingstudents.Areportlastfall,fromtheInstituteforHigherEducationLeadershipandPolicy,gavenoticethatthecommunitycollegesystemisfallingfarshortofthesecommitments:fully70%ofCalifornia’scommunitycollegestudentsarenotsuccessfullytransferringto4‐yearinstitutionswithinsixyears.Bothexternalandinternalchallenges,then,threatentoextinguishthepossibilitiesofanabsolutelyessentialelementofCalifornia’shighereducationalsystem.
Theanalysisthatfollowsbuildsonwhatweknowabouttransferratesinastatethatishome
tothecountry’slargestsystemofcommunitycolleges,inaregionthatisabellwetherfordemographicshiftsplayingacrosstheUnitedStates.Thisresearchaddsanimportantnewdimensiontothisconversation,byexaminingtherelationshipbetweenracialisolationandSouthernCaliforniacommunitycollegetransfers—inadditiontodocumentingthepathwaysbetweenhigh‐andlow‐performinghighschoolsandcommunitycollegesintheregion.Theauthorsfindthatstudentsfromweak‐performinghighschoolsaregoingontoattendraciallysegregatedcommunitycolleges,whichinturnarelesslikelytotransferstudentsto4‐yearinstitutionsthanmajoritywhiteorAsiancommunitycolleges.Inmorediversecommunitycolleges,aracialtransferrategappersists.Thereportalsohighlightsthespatialdimensionsoftheseunequalcircumstances,indicatingthatalloftheintenselysegregatedcommunitycollegesintheregionarelocatedintheLosAngelesCommunityCollegeDistrict.
5 UnrealizedPromises
CivilRightsProject/ProyectoDerechosCivilesJanuary,2012
ThisinvestigationofthewayracialisolationinfluencescommunitycollegepathwaysandtransferratesisthesecondinaseriesofreportsrelatedtoequityandopportunityintheSouthernCalifornia‐BajaMexicomegalopolis(http://civilrightsproject.ucla.edu/research/metro‐and‐regional‐inequalities/lasanti‐project‐los‐angeles‐san‐diego‐tijuana/the‐lasanti‐project‐description/?searchterm=lasanti).Fivemonthsago,wereleasedastudydetailingseverepatternsoftriplesegregation—byrace,classandlanguage—inSouthernCalifornia’sK‐12settings,alongwithavarietyofseriouseducationalopportunityandoutcomegapslinkedtothatsegregation.Takentogether,thesetworeportshelpillustratethedynamicsofastrongcycleoflimitingeducationalcircumstances,beginningintheK‐12systemandcontinuingintotheregion’scommunitycolleges. Theconsequencesofnotdealingwiththeseissuesarerising.Thisreportshowsthatitistimetodesignpolicyandallocatefundingthatdevelopsandextendseducationalopportunitytofuturegenerations,ratherthansignificantlycurtailingit.

6 UnrealizedPromises
CivilRightsProject/ProyectoDerechosCivilesJanuary,2012
ExecutiveSummary
Californiacommunitycollegesare,bydesign,theonlyentrypointtofour‐yearinstitutionsforthemajorityofstudentsinthestate.Yet,manyoftheseinstitutionsperpetuateracialandclasssegregation,thusdisruptingtheCaliforniaMasterPlanforHigherEducation’spromiseofaccess,equity,andexcellenceinhighereducation.ThisreportisanexploratoryanddescriptiveexaminationofthepipelinestoandfromSouthernCalifornia’s51communitycolleges.Twocentralquestionsguideouranalysisanddiscussioninthisreport.First,howdoeshighschoolperformancerelatetothelevelsofracialandethnicsegregationinreceivingcommunitycolleges?Second,howdotransferoutcomesrelatetotheethnicandracialcompositionofthecommunitycollege?Wefindevidenceofaharmfulcycleofsegregation,wherebystudentsfromlow‐performinghighschoolsarefunneledintoraciallyisolatedcommunitycolleges,whichinturnfailtotransferstudentsathighrates.Andatmoreintegratedcommunitycolleges,aracialtransfergappersists.
Weexaminetheflowsofstudentsintheregionfromthestrongest‐andweakest‐performinghighschoolstocommunitycollegesbytheirlevelsofsegregation.Thehighschools’performancesaremeasuredbythree‐yearpromotingpoweraverages,orsuccessfultransitionsfromonegradetothenext.Specifically,welookatthenumberoflargepathways(flowsofmorethan50studentsperyear)tocommunitycolleges.Thesepathwayscanbethoughtofaslargeroadsfunnelingstudentstospecificcommunitycollegesyearafteryear,andillustratehowcertaincommunitycollegesintheregionservelargenumbersofstudentsfromweak‐performinghighschools,whileotherslargelyserveonlythosefromhigh‐performinghighschools.
Thisreportalsoassesseshowtransferratesvarybetweencommunitycollegesthatarethemost‐andleast‐segregatedintheregion.Collegesaredividedintothefollowingcategoriesbytheirlevelsofsegregation:intenselysegregated(n=5),majorityunderrepresentedminority(n=17),highlydiverse(n=4),majoritywhite/Asian(n=14),andmajoritywhite(n=11).
Fivethemesemergedfromthisanalysis,summarizedasfollows:
1. StudentsfromweakhighschoolsareconcentratedincommunitycollegeswhereBlackandLatinostudentsareoverrepresented.At114highschoolsintheregion,only23to65%offreshmenpersisttothesenioryear,referredtointhisreportasdropoutfactories.Themajority(57%)ofthe78largepathwaysfromthesedrop‐outschoolsflowstomajorityBlack/Latinoorintenselysegregatedcommunitycolleges.AllofthefiveintenselysegregatedcollegesintheregionareintheLosAngelesCommunityCollegeDistrict.
2. StudentsfromstronghighschoolsareconcentratedincommunitycollegeswherewhiteandAsianstudentsareoverrepresented.Thereare115highschoolsintheregioninwhich85to100%offreshmenpersisttothesenioryear.Themajority(64%)ofthe98largepathwaysfromtheseschoolsaretomajoritywhiteormajoritywhite/Asiancommunitycolleges.Majoritywhiteschoolsdrawespeciallyheavilyfromhigh‐performinghighschools.
3. Mostofthelowesttransferratecommunitycollegesaremajorityunderrepresentedminorityorintenselysegregated.The13communitycollegeswiththelowestsix‐yeartransferrateshaveratesrangingfrom15to33%,withanaverageof28%.Themajority(85%)oftheseinstitutionsareintenselysegregatedormajorityunderrepresentedminority.Theselow‐
7 UnrealizedPromises
CivilRightsProject/ProyectoDerechosCivilesJanuary,2012
transferringcommunitycollegesarefoundthroughouttheregion,butareconcentratedinLosAngeles.
4. Communitycollegeswiththehighesttransferratesaremajoritywhiteormajoritywhite/Asian.Allofthecommunitycollegesintheupperquartileoftransferratesaremajoritywhiteormajoritywhite/Asian.Atthese13schools,theoverallsix‐yeartransferratesrangefrom45to58%,averaging49%.AsianandWhitestudentshavehighertransferrates,60%and51%,respectively.
5. Manyofthesehighesttransferratecommunitycollegeshaveracialdisparities.Severalofthecommunitycollegesintheregionthatareintheupperquartilefortheoveralltransferratehavelargediscrepanciesbetweenthetransferratesbyrace.Specifically,thereareeightschoolsintheregioninwhichBlackandLatinotransferratesare12to20percentagepointslowerthantheoveralltransferrate,andthisgroupincludessomeoftheinstitutionsthoughtofasflagshipcommunitycolleges.
Tosummarize,itisattheextremesthatoneseesthestarkestdifferencesinlevelsofsegregationandeducationalopportunity.Studentswholivenearandattendcommunitycollegesthatareintenselysegregated,ormajorityBlackandLatino,typicallyareincollegeswhereagreatnumberoffellowstudentscomefromweakpromotinghighschools.Studentsfromweakerhighschoolstendtohaveweakeracademicpreparationandrequiremoreremediation,andtheircollegesandfacultytendtofocusmoreonthoseneeds.Incontrast,studentsfrommajoritywhiteand/ormajoritywhite/Asiancollegeslargelyencounterstudentscomingfromschoolswithhighpromotingpower.Inconsiderationofthesechallenges,weofferthefollowingrecommendations:
1. Recognizeandrewardsuccess:Rewardingsuccessfulcommunitycollegeswillprovideanincentiveforcommunitycollegestoimprovetheirtransferrateamongthestudentswhoaremostinneedofattention.Recognitionfortransferequitybyraceshouldnotonlybedefinedbytheaggregatetransferrate,butalsobyhavingmoreequaltransferratesacrossracialgroups.
2. Streamlinethetransferprocess:Auniformarticulationagreementbetweenthe112communitycollegesinthestatewouldbeonestepclosertowardsequalaccess.
3. Alignmentacrossinstitutionalsectors:Increasedalignmentsbetweensendinghighschoolsandreceivingcommunitycollegescanreducetheneedforremediation.Dualenrollmentprogramsforhighschoolstudentscanalsobegintobridgethegapbetweenthetwosectors,butwillonlydosoinameaningfulwayifaccessisextendedtoawiderangeofstudents,andnotsolelyhigh‐performingstudents.
4. Informationandintegration:Studentsandparentsshouldreceivemuchbetterinformationandthereshouldbeanexpansionofmagnetschools,aswellashonorsprogramswithseriouspre‐collegiatecourses,inallhighschools.Communitycollegestudentsshouldreceivemoreinformationabouttherelativetransfersuccessofvariouscampuses,inadditiontounderliningtheirrighttoenrollinmoresuccessfulcampusesthatmaybefurtherfromhome.
5. Increasefunding:CurrentfundingisnotsufficienttomeettheobjectivessetforthintheCaliforniaMasterPlanforHigherEducation,andtheseverereductionsduringtheeconomiccrisishaveintensifiedtheseproblems.
8 UnrealizedPromises
CivilRightsProject/ProyectoDerechosCivilesJanuary,2012
Introduction
CaliforniahasthelargestcommunitycollegesystemintheUnitedStates.Thestate’s112communitycollegesserveover2.9millionstudentsannually,onequarterofallcommunitycollegestudentsinthenation.1Nearly80%ofBlackandLatinostudentsinthepostsecondarysystemattendacommunitycollege.Theoretically,allCalifornianscanmatriculateintoanycommunitycollege,but,inpractice,studentstypicallyattendthecommunitycollegethatisclosesttowheretheylive.InCalifornia,whereLatinosaremoresegregatedthananyotherethnicgroupinschools,2apatternofsegregationcontinuesinthecommunitycollegesystem,andmanyoftheinequitiesoftheK‐12systemareperpetuated.
BlackandLatinostudentsareleastlikelytotransfer;bythemostoptimisticofestimates,only
threeoutof10transferwithinsixyears.3Thistroublingpatternoccurswithinabroadercontextofahighschooldropoutcrisis,with27%ofLatinoand37%ofBlackstudentsdroppingoutofhighschool.4OftheBlackandLatinoswhodograduate,abouthalfgoontoattendoneofthestate’spostsecondaryinstitutions,byandlargefindingthemselvesatacommunitycollege.5
Communitycollegesegregationappearstocorrespondtotheoveralltransferrates.In
SouthernCalifornia,theregionoffocusforthisreport,thecommunitycollegeswiththelowesttransferratesareintenselysegregated(morethan90%minority)ormajorityBlackandLatino.Incontrast,studentswhoattendcommunitycollegeswiththegreatestlikelihoodoftransferringfindthemselvesatinstitutionswhosestudentpopulationispredominantlywhiteandAsian.
Reducingcommunitycollegedropoutratesandracialdisparitiesmustbeginwithaclear
understandingatthelocallevel.ThisreportprovidessuchapictureforSouthernCalifornia.Twocentralquestionsguideouranalysisanddiscussioninthisreport.First,howdoeshighschoolperformancerelatetothelevelsofracialandethnicsegregationinreceivingcommunitycolleges?Toanswerthisquestion,weexaminetheflowsofstudentsintheregionfromthestrongestandweakestperforminghighschoolstocommunitycollegesbythecolleges’levelsofsegregation.SouthernCalifornia’shighschoolsarehighlysegregatedbyraceandpovertyandveryunequalintermsofthecourseofferingsandteacherexperience,providingverydifferentlevelsofgraduationandeventualsuccessincollege.Thesepathwaysrevealtheextenttowhichthemost‐andleast‐preparedstudents
1CommunityCollegeLeagueofCalifornia,FastFacts(2010)http://www.ccleague.org/files/public/FF2010_revNov10.pdf(accessedMarch2010).2L.ChavezandE.Frankenberg,IntegrationDefended:BerkeleyUnified’sStrategytoMaintainSchoolDiversity.UCLACivilRightsProject/ProyectoDerechosCiviles(2009).3CaliforniaCommunityCollege'sChancellor'sOffice,TransferVelocityReport,200304Cohort.http://webprod.cccco.edu/datamarttrans/dmtrnsstucsel.aspx(AccessedMarch2010).Thethree‐yeartransferratesinthissamecohortweremuchlower:9%amongLatinos,12%amongBlacks,24%amongAsians,and16%amongwhites. 4CaliforniaDepartmentofEducation.DropoutsbyEthnicDesignationbyGrade,200708FouryearDropoutRate(2010).5CaliforniaPostsecondaryEducationCommission.HigherEducationEnrollmentamongCaliforniaPublicandPrivateHighSchoolGraduatesbyRace(2008).

9 UnrealizedPromises
CivilRightsProject/ProyectoDerechosCivilesJanuary,2012
areintegratedandsegregatedincommunitycollegesintheregion,whichhasimportantimplicationsforbothstudentopportunityandinstitutionalburdens.
Oursecondresearchquestionis:Howdotransferoutcomesrelatetotheethnicandracial
compositionofthecommunitycollege?Hereweareinterestedinthehighestandlowesttransferratesbyrace/ethnicityacrossinstitutionsinourregion,and,inparticular,whichinstitutionsintheregionhavethehighestandlowesttransferratesforBlackandLatinostudents.Inadditiontopayingattentiontothedisparitiesacrosstheregion,weconsidertransferrategapswithinthesesameinstitutionsbyrace/ethnicity.Answeringthesequestionsisessentialtounderstandinghowlikelytransferisforstudents,dependingonone’sgeographiclocationinaresidentiallysegregatedregion.Thishasprofoundimplicationsforhowaccesstoeconomicandsocialmobilityviahighereducationvariesthroughouttheregion.Giventhecontinueddisparitiesinbotheducationalachievementbyraceandethnicityandthedemographicsofourregionofstudy,theracialdimensionsofcommunitycollegeaccessandopportunityareessentialtounderstandingthedistributionofeducationalopportunityandaccess.Ifnonwhitestudents,whoarethelargemajorityinSouthernCalifornia,aregoingfromunequalhighschoolsintolesssuccessfulcommunitycolleges,thatraisesfundamentalissuesofequityandthreatensthefutureforasignificantandgrowingsegmentofCalifornia’spopulation,aswellastheregionasawhole.
Theconsequencesforcommunitycollegedropoutsaredire.Whileitwasoncepossiblefor
highschoolgraduatestosecurealivingwageandgoodunionjobs,theseopportunitieshavedisappearedwiththelossofthemanufacturingbaseinSouthernCalifornia.6Postsecondaryeducationisincreasinglyaprerequisiteforeconomicandsocialmobility.Howeverthereissomeevidencetosuggestcommunitycollegestudentswithoutacredentialfindtheireducationhaslittlecurrencyinthelabormarketandearnaboutthesameashighschoolgraduates.7Earningdifferentialsbylevelofeducationhaveincreasedsteadilyoverthepast35years.8In2005,salariesofindividualswithfour‐yearcollegedegreeswereonaverage62%morethanthosewithonlyahighschooldiploma.9Inaddition,Californiaisprojectedtohaveashortageofonemillioncollege‐educatedworkersby2020,makingtheneedtoincreaselevelofpostsecondaryeducationalattainmenturgentforthestateaswell.10
SouthernCalifornia,withnearlyhalfthecommunitycollegesinthestateandawiderangein
termsofsize,demographics,andtransferpatterns,isanideallensthroughwhichtoexaminecommunitycollegesinthestate.Theareaishometothenation’slargestconcentrationofLatinostudents,aboutafifthofthetotalintheenormousSouthernCaliforniamegalopolis.Assuch,the
6Grant, D. M. 2000. “A demographic portrait of Los Angeles County, 1970 to 1990.” Prismatic Metropolis: Inequality in Los Angeles: 51–80. 7W.N.Grubb,WorkingintheMiddle:StrengtheningEducationandTrainingfortheMidSkilledLaborForce(SanFrancisco:Jossey‐BassPublishers,1996).8S.BaumandJ.Ma,EducationPays:TheBenefitsofHigherEducationforIndividualsandSociety(CollegeBoardTrendsinHigherEducationSeries,2007).9Ibid.10C.Moore,N.Shulock,andC.Jensen,CraftingaStudentCenteredTransferProcessinCalifornia:LessonsfromOtherStates(CaliforniaStateUniversity,Sacramento:InstituteforHigherEducationLeadership&Policy,2009).
10 UnrealizedPromises
CivilRightsProject/ProyectoDerechosCivilesJanuary,2012
lessonslearnedthroughthisregionhaveimportantimplicationsforthenation,asCalifornialargelyportendsthechangesonthehorizonfortherestoftheUnitedStates.
Thisstudy’sregionalapproach,lookingatall51communitycollegesinSouthernCalifornia,
affordscomparisonsbetweeninstitutionsintheregionandrevealstheimpactshousingandschoolsegregationhaveoneducationalopportunity.Todate,nostudyhasexaminedtheinterplayofsegregation,communitycolleges,andeducationalequityandaccess.Ourhopeinthisreportistofurtherdiscussionsaboutcreatingchangeinasystemthatcontinuestomarginalizelowincomeandstudentsofcolorfromaccesstoanequitableeducationandapromisingfuture.
ThispaperexaminesCaliforniacommunitycollegesintheSouthernCaliforniaregion(Ventura,LosAngeles,Riverside,SanBernardino,OrangeandSanDiegocounties).WebeginbyreviewingthemajorpoliciesimpactingCaliforniacommunitycolleges,beginningwiththeCaliforniaMasterPlanforHigherEducation,andconsiderthecurrentpolicyandeconomiccontext.Wethenexaminefreshmenpathwaysintheregion,specificallythelargestpathwaysfromstrongandweakpromotinghighschoolstocommunitycolleges.Next,weanalyzetransferratesandpatternsintheregion,focusingonthevariationsbetweenrace/ethnicgroupswithinandacrossinstitutions.Thepaperconcludeswithadiscussionofthefindingsandtheimplicationsforfutureresearch.
CaliforniaCommunityCollegeContextForCalifornia’slow‐incomestudentsandstudentsofcolor,communitycollegesoftenserveas
theinitialaccesspointtoafour‐yearuniversity.Assuch,theyplayacriticalroleinpreparingCalifornia’sfuture.Communitycollegeshavetheenormoustaskofprovidingandensuringaccesstofour‐yearuniversitiesforthemajorityofstudentsinthestateaswellassomeofitsmostmarginalizedandunderservedstudents.WithLatinosbecomingarapidlygrowinganddominantsegmentofthestate’scollege‐agepopulationandthemajorityoftheyoungadultpopulationby2014,11therehastobealargeinvestmentbythestatetoprovideaccesstoafour‐yearuniversityforLatinos.With80%ofBlackandLatinocollegestudentsincommunitycollege,thesecommunitiesaredisproportionatelyaffectedbythelackofopportunitiesandresourcesthatexistforstudentsinourcommunitycolleges.
TheMasterPlan’sUnrealizedPromises
California’sconcentrationofcollegestudentsincommunitycollegecanbetracedbacktothe1960MasterPlanforHigherEducation,whichcreatedathree‐tieredsystemofhighereducation:theUniversityofCalifornia,CaliforniaStateUniversityandCaliforniaCommunityColleges.Whencreated,themissionoftheMasterPlanwastoprovideallstudentsequalaccessthroughmultiplepathwaystoaqualitypostsecondaryeducationinthestate.Underthissystem,themostpreparedandqualifiedhighschoolstudentsdirectlyentertheUniversityofCalifornia(top12.5%)orCaliforniaStateUniversity(top33.3%),whiletheremainingtwo‐thirdsbegintheireducationatacommunitycollege.TheMasterPlanalsoassuresallcommunitycollegestudents,whomeetandfulfillasetnumberof
11TheCampaignforCollegeOpportunity,ReturnonInvestment:ALatinoSnapshot(2010)http://www.collegecampaign.org/assets/docs/res‐lib/ROI‐Latino‐Snapshot.pdf(accessedMarch16,2010)

11 UnrealizedPromises
CivilRightsProject/ProyectoDerechosCivilesJanuary,2012
minimumrequirements,guaranteedadmissiontooneofthe33publicfour‐yearuniversitiesinthestate.
WhentheMasterPlanwascreated,itwaspraisedbythenationasagreatstepforwardinequalizinghighereducationinthecountry;theMasterPlanprinciplesof“access,affordabilityandexcellence”resonatedwithmanypeopleinthecountry.Inthefirstyearsofimplementation,theMasterPlanopenedopportunitiesforlow‐incomeandminoritystudentstoearnacollegedegree.Atthetimeofitsinceptionstudentfeeswerelow,andforthosewhoneededfinancialassistancethestateprovidedgrantstohelpoffsetthecostofbooksandhousing.However,overtheyearsdifferentpropositionsandpolicyinitiatives,budgetconstraints,skyrocketingstudentfeeincreases,dismalinvestmentforenrollmentgrowth,andincreasingselectivitybyuniversitieshaveseverelycompromisedCalifornia’sabilitytoabidebytheprinciplesoftheMasterPlan.
TheMasterPlanhelpedproducearemarkablearrayofworldclassUniversityof
Californiacampusesclosetoalmostallstudentsinthestate.Butitrestedonsomeassumptionsthatwerenotcloselyexaminedforalongtime.First,theplanassumedthatstateandlocalpropertytaxeswouldprovidethefundingforuniversalaccesstocommunitycolleges.Itssecondpremisesuggestedthatallthecommunitycollegeswouldbegoodenoughtopermitqualifiedstudentstotransferandtofunctionsuccessfullyonfour‐yearcampuses.Third,thePlanpresumedthatopportunitywouldbeequalacrossthestate.Fourth,itsupposedthatstudentswhostartedoutinthecommunitycollegeswouldhaveanequalopportunitytofinishcollegeiftheysucceededintheirstudies.Andalthoughthestatehasproducedsomeremarkablygoodcommunitycolleges,noneoftheseassumptionshasbeenfulfilled.
ServingtheUnderpreparedatComparablyLowExpense
Communitycollegesfunctionasacriticalaccesspointtoapostsecondaryeducation,andbyextension,accesstoeconomicandsocialmobilityforpoor,workingclass,Black,Latino,andfirst‐generationcollegestudents.Communitycollegestudentsarealsomorelikelytobeunder‐preparedforhighereducation.InCalifornia,halfofenteringcommunitycollegestudentsaredirectedtobasicskillscourses.12Uponenteringthecommunitycollege,manyofthesestudentsfindthattheyneedextensiveremediationinordertosucceedincollegecredit‐bearingcourses.
Inadditiontoservingasanaccesspointforstudentsinneedofextrasupport,California
communitycollegefeesaretheoneofthelowestinthecountryat$36perunit.CaliforniaStateUniversityfeesarefourtimesthatcostperunit,theUniversityofCaliforniaisninetimesthecost,andprivateinstitutionsaremuchmoreexpensivestill.Manystudentsare,however,unawareofthedirectandindirectcostsaccruedinthetypicalfiveyearsCaliforniacommunitycollegetransferstudentsspendpriortotransferring.Muchofthisisduetothetimestudentsspendinremediation,whichofteninvolvesseriouslossofincome,drivesuptherealcostoftransferforstudents,andrepresentsaregressiveexpensedisproportionatelyaffectingthemostunder‐preparedstudents.13Moreover,non‐
12AcademicSenateforCaliforniaCommunityColleges,“IssuesinBasicSkillsAssessmentandPlacementinCaliforniaCommunityColleges(2004).13T.Melguizo,L.SHagedorn,andS.Cypers,“Remedial/DevelopmentalEducationandtheCostofCommunityCollegeTransfer:ALosAngelesCountySample,”TheReviewofHigherEducation31,no.4(2008):401–431.

12 UnrealizedPromises
CivilRightsProject/ProyectoDerechosCivilesJanuary,2012
tuitioncostssuchasbooksandhousingaresimilarforstudentsatcommunitycollegesandfour‐yearinstitutions.
Californiadataconsistentlyshowlowratesofsuccessfultransferfrommostcommunity
colleges,andpolicydiscussionsoftentreatthisasaproblemofcreatingbetteron‐campussupportsandagreementsbetweenthetwo‐yearandfour‐yearcampuses,butrecentresearchfindslittlesupportforthetheorythatbetterarticulationagreementsmakeadifference.14Obviously,ifitisamoredeeplyrootedsystemofinequalitythatisbuiltonsegregatedandunequalopportunitiesandpreparationbeforecollege,thenmorefarreachingremediesmustbeconsidered.
TheResourceFailure:RestrictedRevenueStreams,RisingCosts,andVolatileSpending
Overtheyears,taxpolicyandensuingbudgetcutshavecompromisedCalifornia’sabilitytoadheretotheprinciplesoftheMasterPlan.In1978,CaliforniavoterspassedProposition13,“ThePeoplesInitiativetoLimitPropertyTaxation,”whichradicallycappedpropertytaxratesforfamiliesandcompaniesandrequiredatwo‐thirdsmajorityforanyfuturetaxincreases.Asaresult,localfundingforcommunitycollegedistrictsbasicallydisappeared.15Futuretaxcutsonlyservedtocompoundtheproblems.Voter‐passedpublicsafetyinitiativesforjuvenileincarcerationandmandatorysentencinghaveinadvertentlyplacedadditionalcostburdensontheeducationsystem.Californiapresentlyspendsmoreonfundingprisonsthanonpublichighereducation.16
Californiahighereducationspendinghasalsobeenvolatile,varyingfromyeartoyearandused
asabalancewheelinthestatebudget.Tofurthercompoundmatters,communitycollegerevenuefromthestatehasbeenthemostunpredictable,beinglargelydependentonlocalrevenuestreams.17AlloftheselimitstorevenueforcommunitycollegeshavemadeCaliforniaincreasinglyunabletomeetthebasicneedsanddemandsofitsgrowinganddiversestate.
Thereisnosubstantialcommitmenttoincreasefundingtosupportgrowingenrollment,
especiallyforcommunitycolleges.Forinstance,thestate’sper‐pupilspendingforcommunitycollegestudentsin2007was$5,591(farlessthanisspentonhighschoolstudents),andforCSUandUCstudentsitwas$11,829and$21,778respectively.18Incomparisontoper‐pupilspendingforcommunitycollegesinotherstates,Californiaspendsapproximately$2,000lessperstudent,andthisisprojectedtodecreaseinthecomingyears.19Forthe2010‐2011year,thestatehasincreased
14JosipaRoksaandBruceKeith,“Credits,Time,andAttainment:ArticulationPoliciesandSuccessAfterTransfer,”EducationalEvaluationandPolicyAnalysis30,no.3(2008):236‐254.15Prop13states,“Districtsreceiveaportionofthe1%countywidepropertytaxbasedontheirproportionalshareofpropertytaxrevenuereceivedfromtheircommunitypriortotaxcontrol,”citedinCenterforCommunityCollegePolicy,EducationCommissionoftheStates,StateFundingforCommunityColleges:AFiftyStateSurvey(Denver,CO:2000).16PhillipReese,“HigherEducationvs.Prisons:SeeWhereCalifornia’sMoneyGoes,”TheSacramentoBeehttp://www.sacbee.com/2010/01/06/2442430/higher‐education‐vs‐prisons‐see.html17J.Santos.LatinoEducationSummit.UniversityofCalifornia,LosAngeles.2010.18CaliforniaLegislativeAnalyst’sOffice.“The2010‐11Budget:HigherEducation.”http://www.lao.ca.gov/laoapp/main.aspx(accessedMarch8,2010)19P.Burdman,“DoesCalifornia'sMasterPlanStillWork?”Change:TheMagazineofHigherLearning41,no.4(2009):28–35.

13 UnrealizedPromises
CivilRightsProject/ProyectoDerechosCivilesJanuary,2012
communitycollegefunding,20butitstillleavesabout60,000studentsunfundedacrossthecommunitycolleges.21Inadditiontothelackofsupportfromthestate,theUC,CSUandcommunitycollegeshavepassedontostudentssomeoftheburdenofbudgetshortfallsbysignificantlyincreasingstudentfees,nearlydoublingthecostintheUCsandCSUsinthelasttenyears,andalmosttriplingitinthelasttwodecadesforcommunitycolleges.22
Openingupthreesmalluniversitycampuses,theUniversityofCaliforniaandtheCalifornia
StateUniversityhaveincreasedenrollmentbyonlyafewthousandoverthelast10years,butcontinuetoreceivethemajorityofthestate’sfundingsupport.23Meanwhile,communitycollegescontinuetocontendwithsteadyincreasesinenrollmentandsimultaneouscutstofunding.Thisplacesanenormousamountofstressoncommunitycolleges.Inordertodealwithenrollmentgrowthanddecreasedfunding,communitycollegeshavealsotriedtobalanceshortfallsbyincreasingfees,cuttingclasses,anddecreasingservicestostudents.Asaresult,currentstudentsaretakingfewerclasses,havelittletonoguidancefromcounselors,andfinditdifficulttoenrollinrequiredcourses,oranycoursesatall.24
AnIncreasinglyDiverseStateShiftandChangesinEnrollmentPatterns
TheMasterPlanwascreatedtomeettheneedsanddemandsofwhatwasthenafarmorehomogenous,white,BabyBoomergeneration.Fiftyyearslater,Californiaisexperiencinganothersurgeofstudentsseekingapostsecondaryeducation‐‐themajorityofwhomarenonwhite.Bythemostrecentestimates,theCaliforniapopulationunder18yearsofageisnow50%Latino.In2008,Latinoscomposed44%ofthetraditionalcollegeagepopulation(thoseages18‐24),butonly38%ofhighschoolgraduates.
AsshowninTable1,whilewhitestudentscomposearelativelylargesegmentofhighschoolgraduateseligiblefortheUC/CSU,Asianstudentsleadallracial/ethnicgroups,graduatingwiththeUC/CSUrequirementsattwicetherateofBlackandLatinostudents.Asianstudentsmakeup14%ofallhighschoolgraduates,butcompose23%ofhighschoolgraduateswithUC/CSUrequirements.
20ForcommunitycollegesproposefundingI$219.4million,whilefundingforCSU/UCwillincreaseby$373millionforCSUand$423millionforUC.21CaliforniaCommunityCollegeChancellor’sOffice,CaliforniaCommunityCollegesChancellorJackScottCommentsontheStateBudgetPassedbytheLegislatureOctober8,2010222000students’feesforUCundergraduatestudentswere$5,300andforCSUstudents$2,460;todayUCstudentsarepaying$10,302infeeswhileCSUstudentsarepaying$4,429.CaliforniaPostsecondaryEducationCommission.“FeesatCalifornia’sPublicCollegesandUniversities.”Draftreport,March2009.http://www.cpec.ca.gov/SecondPages/CommissionReports.asp(accessedMarch14,2010)23CaliforniaStateUniversity,accessedonMay29,2009http://www.calstate.edu/pa/info/milestones.shtml24CaliforniaCommunityCollegesChancellor’sOffice.CaliforniaCommunityCollegeChancellorJackScottAnnounces200910EnrollmentDecline:ConcernsMountingasBudgetCutsImpactStudentAccess.http://www.cccco.edu/ChancellorsOffice/IntheNews/PressReleases/tabid/183/Default.aspx(accessedMay7,2010)

14 UnrealizedPromises
CivilRightsProject/ProyectoDerechosCivilesJanuary,2012
Table1.RacialCompositionofCalifornia’sYouth,2008
Lessthan18YearsofAge
(%) 18‐24Years(%)HighSchool
Graduates(%)
ProportionofAllGraduateswith
UC/CSURequirements(%)
Asian 10 12 14 23Black 6 7 7 5Latino 50 44 38 25White 29 34 38 44Multiracial 5 3 2 2Sources:StateofCalifornia,DepartmentofFinance,E‐3Race/EthnicPopulationEstimateswithAgeandSexDetail,2000–2008.Sacramento,CA,June2010,CaliforniaDepartmentofEducation.
Acrossallracial/ethnicgroups,malesarelesslikelytograduatefromhighschooleligibletoattendtheUC/CSU;statewide,30%ofmaleswereeligibleascomparedto38%offemales.OnlyoneinfiveofBlackandLatinomalehighschooldiplomaholdershasmettherequirementsforUC/CSUadmission.Table2illustratesthesegenderdiscrepanciesareprevalentacrossallracial/ethnicgroups.
Table2.HighSchoolGraduateswithUC/CSURequirementsbyRaceandGender Male
(%)Female(%)
Total(%)
Asian 49 59 54Black 20 27 23Latino 19 26 23White 36 44 40Multiracial/Other 29 35 32Average 30 38 34Source:CaliforniaDepartmentofEducation,2008
UnevenRacialandEthnicDiversityinPublicPostsecondarySystems
ThedemographicsacrossCalifornia’spublicpostsecondarysystemsvaryconsiderably(summarizedinFigure1bypostsecondarysystemsector).TheUniversityofCaliforniaenrolls226,040undergraduatestudentsacrossits10campuses.AsianstudentsarestronglyoverrepresentedintheUCsystem,whereBlacksandLatinosarestrikinglyunderrepresented.Asianstudentsare12%ofhighschoolstudentsyetcompose40%oftheUCstudentbody.BlackandLatinostudentscompose3%and13%,respectively,oftheUCstudentbody.25TheCaliforniaStateUniversitysystemenrolls437,008studentsat23campuses.ThedemographicsoftheCSUmorecloselyparallelthoseoftheK‐12system.TheCaliforniaStateUniversitysystemispredominantlywhite(36%)andLatino(24%),with
25CaliforniaPostsecondaryEducationCommission,HigherEducationEnrollmenthttp://www.cpec.ca.gov/OnLineData/OnLineData.asp(2008)

15 UnrealizedPromises
CivilRightsProject/ProyectoDerechosCivilesJanuary,2012
AsianandBlackstudentscomposingasmallerportionofthestudentpopulation(17%and6%,respectively).26
Figure1.EnrollmentinSouthernCaliforniaPostsecondaryInstitutions,2008
California’scommunitycollegesserveabout2.9millionstudentsat112campuses.TheirdemographicsaresimilartothoseoftheCSU,butwithgreaterproportionsofLatinostudents.Whitestudentsareat35%ofthepopulationandLatinosare30%,representingthelargestgroups;Asian(15%)andBlack(8%)representthesmallest.27Figure2(below)summarizesenrollmentinSouthernCalifornia’scommunitycollegesbyracial/ethnicgroupbetween1998and2007.
Thepopulationofcollegestudentsinthestatehasincreasedbothinsizeanddiversityoverthe
last50years.EnrollmentcapacityattheUniversityofCaliforniahasgrownfarmoreslowlythanthepopulation.Inthepast10years,Californiaexperiencedsteadyincreasesinthenumberofcollegeboundstudents,withlittlecapacityforenrollmentgrowth,anddecreasedfundingfromthestate.Itisprojectedthatby2014,Californiawillhave640,000morestudentsseekingacollegeeducationthanitiscapableofserving.28Atthesametime,Californiahasbeguntofollowtheexampleofotherpublicinstitutions,suchastheUniversityofVirginiaandtheUniversityofMichigan,inpursuingmoreout‐of‐statestudentsasameansofincreasingrevenue—whichsomeresearcherssayisamovetowardprivatizationofpubliceducation.29
TheSouthernCaliforniaregionincludesfourUCcampuses(LosAngeles,Irvine,RiversideandSanDiego),nineCSUs(DominguezHills,Fullerton,LongBeach,LosAngeles,Northridge,SanBernardino,SanDiego,SanMarcosandPomona)andseveralprominentprivateuniversities(TheClaremontColleges,UniversityofSouthernCalifornia,LoyolaMarymount,OccidentalCollegeandtheUniversityofSanDiego)aswellasmanyfor‐profitpostsecondarycampuses.Thecommunitycollegesarebroadlydistributedtooffereducationwithincommutingdistancetoalmostallstudentsinthe
26Ibid.27Ibid.28TheCampaignforCollegeOpportunity,“2006FastFacts”www.collegecampaign.org29J.Santos,LatinoEducationalSummit(UniversityofCalifornia,LosAngeles,2010).

16 UnrealizedPromises
CivilRightsProject/ProyectoDerechosCivilesJanuary,2012
region.Giventheconcentratedpopulation,thereare21communitycollegesinLosAngelesCounty.SanDiegoCountyandOrangeCounty,whicheachhavepopulationscloseto3million,haveeightandninecommunitycolleges,respectively.Takentogether,itisanincrediblydiversesetofpostsecondaryinstitutionsthatenrollstudentsfromawiderangeofsocialclasses,racialandethnicgroups,andprioracademicexperiences.However,itisalsoahighlystratifiedarea,withthemajorityofBlackandLatinostudentsenrolledatcommunitycolleges.
Figure2.EnrollmentinSouthernCaliforniaCommunityCollegesbyRace,1998‐2007
Source:CaliforniaPostsecondaryEducationCommission
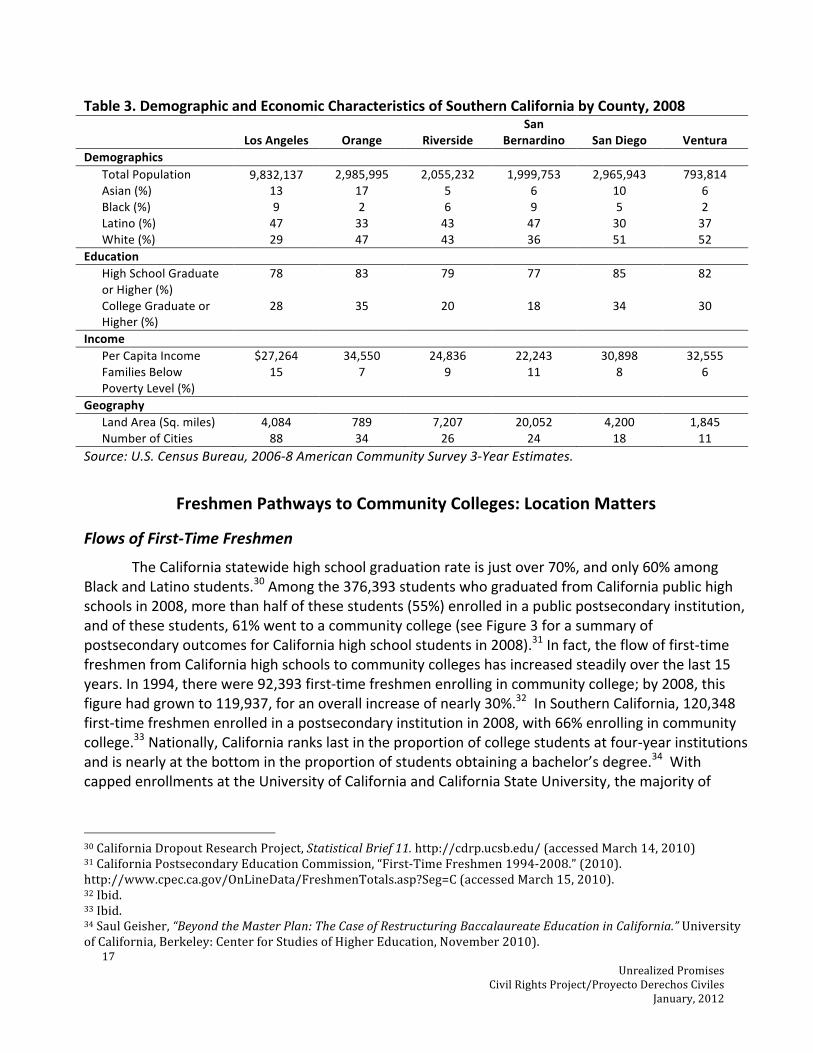
Thecountiesintheregionrangewidelyinracialandethnicdistributionsandbythewealthandaverageeducationallevelsofthecommunitiestheyserve,summarizedbelowinTable3.LosAngeles,whichhasapopulationthreetimesthesizeofOrangeCountyand12timesthesizeofVenturaCounty,hasthesmallestproportionofwhiteinhabitants.Orange,SanDiego,andVenturaCountieshavehigherpercapitaincomesandlevelsofeducationthanLosAngeles,Riverside,andSanBernardinoCounties.LosAngeles,Riverside,andSanBernardinohavegreaterproportionsoffamilieslivingbelowthepovertylevelandarelargelyLatinoandBlack(combinedBlackandLatinopopulationsrangefrom49to56%).Incontrast,thepopulationsofOrange,SanDiego,andVenturaCountiesarepredominantlywhiteandAsian(combinedrangesfrom58to64%).
0
50000
100000
150000
200000
250000
300000
350000
1998199920002001200220032004200520062007
Asian/PacIslander
Black
Filipino
Latino
NativeAmerican
White
17 UnrealizedPromises
CivilRightsProject/ProyectoDerechosCivilesJanuary,2012
Table3.DemographicandEconomicCharacteristicsofSouthernCaliforniabyCounty,2008
LosAngeles Orange RiversideSan
Bernardino SanDiego VenturaDemographics
TotalPopulation 9,832,137 2,985,995 2,055,232 1,999,753 2,965,943 793,814Asian(%) 13 17 5 6 10 6Black(%) 9 2 6 9 5 2Latino(%) 47 33 43 47 30 37White(%) 29 47 43 36 51 52
Education HighSchoolGraduateorHigher(%)
78 83 79 77 85 82
CollegeGraduateorHigher(%)
28 35 20 18 34 30
Income PerCapitaIncome $27,264 34,550 24,836 22,243 30,898 32,555FamiliesBelowPovertyLevel(%)
15 7 9 11 8 6
Geography LandArea(Sq.miles) 4,084 789 7,207 20,052 4,200 1,845NumberofCities 88 34 26 24 18 11
Source:U.S.CensusBureau,2006‐8AmericanCommunitySurvey3‐YearEstimates.
FreshmenPathwaystoCommunityColleges:LocationMatters
FlowsofFirst‐TimeFreshmen
TheCaliforniastatewidehighschoolgraduationrateisjustover70%,andonly60%amongBlackandLatinostudents.30Amongthe376,393studentswhograduatedfromCaliforniapublichighschoolsin2008,morethanhalfofthesestudents(55%)enrolledinapublicpostsecondaryinstitution,andofthesestudents,61%wenttoacommunitycollege(seeFigure3forasummaryofpostsecondaryoutcomesforCaliforniahighschoolstudentsin2008).31Infact,theflowoffirst‐timefreshmenfromCaliforniahighschoolstocommunitycollegeshasincreasedsteadilyoverthelast15years.In1994,therewere92,393first‐timefreshmenenrollingincommunitycollege;by2008,thisfigurehadgrownto119,937,foranoverallincreaseofnearly30%.32InSouthernCalifornia,120,348first‐timefreshmenenrolledinapostsecondaryinstitutionin2008,with66%enrollingincommunitycollege.33Nationally,Californiarankslastintheproportionofcollegestudentsatfour‐yearinstitutionsandisnearlyatthebottomintheproportionofstudentsobtainingabachelor’sdegree.34WithcappedenrollmentsattheUniversityofCaliforniaandCaliforniaStateUniversity,themajorityof
30CaliforniaDropoutResearchProject,StatisticalBrief11.http://cdrp.ucsb.edu/(accessedMarch14,2010)31CaliforniaPostsecondaryEducationCommission,“First‐TimeFreshmen1994‐2008.”(2010).http://www.cpec.ca.gov/OnLineData/FreshmenTotals.asp?Seg=C(accessedMarch15,2010).32Ibid.33Ibid.34SaulGeisher,“BeyondtheMasterPlan:TheCaseofRestructuringBaccalaureateEducationinCalifornia.”UniversityofCalifornia,Berkeley:CenterforStudiesofHigherEducation,November2010).

18 UnrealizedPromises
CivilRightsProject/ProyectoDerechosCivilesJanuary,2012
studentsarerelegatedtocommunitycolleges,wherethelikelihoodofcompletionand/ortransferisbleak.
Figure3.OutcomesforCaliforniaHighSchoolStudents,2008
Sources:CaliforniaPostsecondaryEducationCommission&CaliforniaDepartmentofEducation
PathwaysfromSchoolswithStrongandWeakPromotingPower
Wenowexaminetheflowstocommunitycollegefromtheregion’sschoolswiththestrongestandweakesthighschoolcompletionrates,measuredbysuccessfultransitionsfromonegradetothenext(promotingpower),whichisstronglyrelatedtograduationrates.Manyofthepatternsofeconomicandracialsegregationfoundinhighschoolspersistinthecommunitycollegesystem.Thecrisisofhighschoolcompletioninthenationisstronglyconcentratedinasmallfractionof“dropoutfactory”highschools,whichareoverwhelminglyconcentratedinlargelysegregatedurbanschoolswithveryhighconcentrationsofimpoverishedstudents.35Largenumbersofstudentswhograduatedfromsomeofthelowest‐performinghighschoolsarenowattendingsomeofthecommunitycollegeswiththelowesttransferratesinthestate.Likewise,studentsfromsomeofthehighest‐performinghighschoolswhodidnotgodirectlytoafour‐yearuniversityarenowattendingsomeofthehighest‐performingcommunitycollegesinthestate.Whiletherearemanycommunitycollegesintheregionthatservelargenumbersofstudentsfrombothhigh‐andlow‐performinghighschools,therearetoomanyschoolsthattendtoserveprimarilyonegroupoveranother.
35R.BalfanzandN.Legters,“LocatingtheDropoutCrisis:WhichHighSchoolsProducetheNation’sDropouts?”inDropoutsinAmerica:ConfrontingtheGraduationRateCrisis,ed.GaryOrfield(Cambridge,MA:HarvardEducationPress,2004)85‐106.
DoNotGraduateHighSchool;40%
EnrolledinCommunityCollege;20%
EnrolledinPublic4‐yr
PostsecondaryInstitution;13%
HighSchoolGraduatesNotEnrolledin
PostsecondaryInstitution;27%
19 UnrealizedPromises
CivilRightsProject/ProyectoDerechosCivilesJanuary,2012
Weusedmeasuresofpromotingpowertoidentifythehighest‐andlowest‐performinghighschoolsintheregion.Measuresofpromotingpowerarewell‐establishedproxiesforhighschoolgraduationrates.Schoolsintheregionwithweakandstronglevelsofpromotingpowerwereidentifiedviathree‐yearaveragesofpromotinglevelsbetween2005and2007.36TheschoolsinthebottomquartileofpromotingpowerinSouthernCaliforniaincludetheregion’s“dropoutfactories,”definedasthosewithpromotingpowerof60%orless,aswellasschoolsthatarefaringslightlybetter,withpromotingpowerbetween60and65%.
InSouthernCalifornia,thebottomquartileincluded114schoolswithpromotingpowerlevels
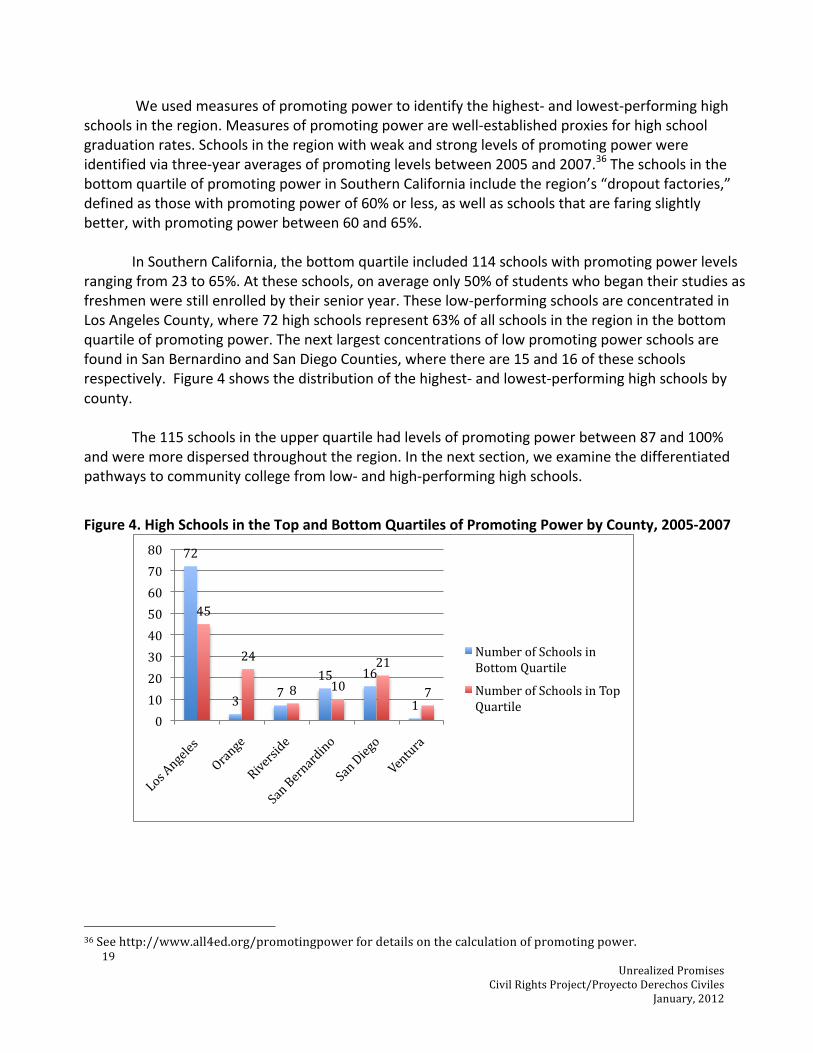
rangingfrom23to65%.Attheseschools,onaverageonly50%ofstudentswhobegantheirstudiesasfreshmenwerestillenrolledbytheirsenioryear.Theselow‐performingschoolsareconcentratedinLosAngelesCounty,where72highschoolsrepresent63%ofallschoolsintheregioninthebottomquartileofpromotingpower.ThenextlargestconcentrationsoflowpromotingpowerschoolsarefoundinSanBernardinoandSanDiegoCounties,wherethereare15and16oftheseschoolsrespectively.Figure4showsthedistributionofthehighest‐andlowest‐performinghighschoolsbycounty.
The115schoolsintheupperquartilehadlevelsofpromotingpowerbetween87and100%andweremoredispersedthroughouttheregion.Inthenextsection,weexaminethedifferentiatedpathwaystocommunitycollegefromlow‐andhigh‐performinghighschools.
Figure4.HighSchoolsintheTopandBottomQuartilesofPromotingPowerbyCounty,2005‐2007
36Seehttp://www.all4ed.org/promotingpowerfordetailsonthecalculationofpromotingpower.
72
3 715 16
1
45
24
8 10
21
7
01020304050607080
NumberofSchoolsinBottomQuartile
NumberofSchoolsinTopQuartile

20 UnrealizedPromises
CivilRightsProject/ProyectoDerechosCivilesJanuary,2012
SegregatedPathwaysfromHigh‐andLow–PerformingSchools
CaliforniaPostsecondaryEducationCommissiondatawerecollectedonfreshmenpathwaystocommunitycollegesintheregion.Werestrictouranalysistolargeflows,definedas50ormorestudentsannually,andusetheaverageflowsfrom1994‐2008toidentifyconsistentpatternsforthehighschoolsintheupperandbottomquartilesofpromotingpower.Amongthehighschoolsinthebottomquartileofpromotingpower,thereare78largepathwaystocommunitycollegesintheregion.However,manyofthesehighschoolswithweakpromotingpowerdonothaveanylargepathwaystoinstitutionsofhighereducationwhatsoever.Incontrast,amongthestrong‐promotinghighschools,therearenotonlymanymorelargepathwaystocommunitycolleges(98inall),butalsomanyhighschoolsthatsolelyhavelargepathwaystofour‐yearinstitutions.Thesehighschoolsessentiallyactassuperhighwaystocollege.
Schoolsinthebottomquartileofpromotingpoweraremorelikelytosendlargenumbersof
studentstocommunitycollegeswithgreaterproportionsofBlackandLatinostudents.Conversely,studentsfromhighschoolswiththestrongestlevelsofpromotingpowertendtoenrollincommunitycollegesthatarelargelywhiteandAsian.Todemonstratethesepatterns,weexaminecommunitycollegesbytheirlevelsofsegregation,andcomparethenumberofpathwaysfromstrongandweakhighschoolsforcommunitycollegesinthefollowingcategories:37
• Intenselysegregated:90to100%minority• Majorityunderrepresentedminority(URM):morethan50%BlackandLatino• Highlydiverse:lessthan50%URMandlessthan50%whiteandAsian• MajoritywhiteandAsian:morethan50%whiteandAsian• Majoritywhite:morethan50%white
Figure5.PathwaysfromHighandLowPerformingHighSchools
37CategoriesmodifiedfromG.OrfieldandC.LeeRacialTransformationandtheChangingNatureofSegregation.(Cambridge,MA:TheCivilRightsProjectatHarvardUniversity2006)

21 UnrealizedPromises
CivilRightsProject/ProyectoDerechosCivilesJanuary,2012
Figure5summarizestheproportionoflargepathwaysfromdropoutfactoryhighschoolsandhigh‐performinghighschoolstocommunitycollegesaccordingtothecommunitycolleges’levelsofsegregation.FiveofthecommunitycollegesinSouthernCaliforniaareintenselysegregatedinstitutions,90to100%minority.AllareinLosAngelesCountyanddrawdisproportionatelyfromhighschoolsinthebottomquartileofpromotingpower,witheightlargepathwaysfromthesehighschoolsandonlytwopathwaysfromthoseintheupperquartileofpromotingpower(seeTable4).Thus,studentsatintenselysegregatedcommunitycollegesaremostlikelytofindthemselvesamongstudentsfromdropoutfactoryhighschools.
Table4.PathwaystoIntenselySegregatedCommunityColleges(90to100%Minority)
Two‐YearInstitution County
StrongPromotingPower
Pathways
WeakPromotingPower
PathwaysWhite(%)
Black(%)
Latino(%)
ComptonCommunityCollege LosAngeles 0 0 10 54 36EastLosAngelesCollege LosAngeles 2 5 9 4 70LosAngelesMissionCollege LosAngeles 0 2 6 5 78LosAngelesSouthwestCollege LosAngeles 0 0 3 61 36LosAngelesTrade‐TechnicalCollege
LosAngeles 0 1 1 27 59
Source:CaliforniaPostsecondaryEducationCommission
Thepathwaysfromtheweakestandstrongesthighschoolsintheregiontothe17communitycollegesthataremajorityunderrepresentedminorities(morethan50%BlackandLatino)arecomparativelymorebalanced(seeTable5).Therewere31largepathwaysfromhighschoolswithstrongpromotingpower,and37fromthosewithweakpromotingpower.However,whileasagroupthesemajorityURMcommunitycollegesseemtobedrawingamorebalancedmixofstudents,closer
10%
47%
5%
32%
5%
ShareofLargePathwaysfromDropoutFactories
2%
33%
26%
38%
1%
ShareofLargePathwaysfromHighPerformingHighSchools
IntenselySegregated
URM
MajorityWhite
White/Asian
HighlyDiverse

22 UnrealizedPromises
CivilRightsProject/ProyectoDerechosCivilesJanuary,2012
examinationrevealsthat,infact,fiveoftheinstitutionsinthisgroupdrawlargepathwaysexclusivelyfromthehighschoolswithstrongpromotingpower.ThetrendismostpronouncedatSouthwesternCollege,whichistwo‐thirdsLatinoandhasfourlargepathwaysfromstrongpromotingpowerhighschools.Similarly,fiveofthecommunitycollegesthataremajorityunderrepresentedminoritieshavelargepathwaysonlyfromhighschoolswithweakpromotingpower.TheseschoolsarealmostallinLosAngeles,and,insomeinstances,thepatternisespeciallypronounced:LosAngelesValleyCollegehassixlargepathwaysfromtheweakesthighschoolsintheregionandnonefromthestrongest.
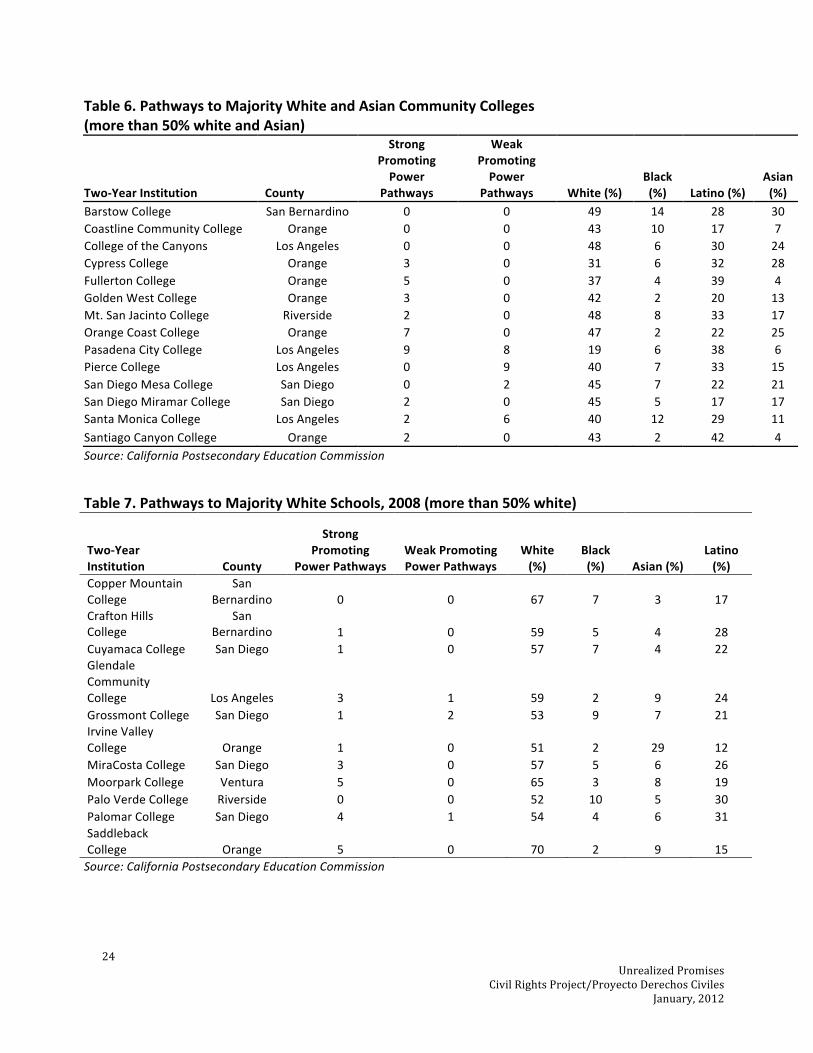
AquarterofthecommunitycollegesinSouthernCaliforniahaveamajorityofwhiteandAsianstudents(14institutions).PathwaystotheseinstitutionsaresummarizedinTable6.SixoftheseinstitutionsareinOrangeCounty.InLosAngeles,SantaMonicaCollegeandPasadenaCityCollege,someofthemostsuccessfulschoolsintheregion,areincludedinthisgroup.Largepathwaysfromthestrongest‐performinghighschoolsintheregionoutnumberthosefromlow‐performinghighschools(35versus25).Inaddition,halfoftheseschoolssolelyhavelargepathwaysfromthestrongest‐performinghighschoolsintheregion(andnonefromtheweakest).However,therearealsotwocollegesinthisgroupthathaveonlylargepathwaysfromtheweakest‐performinghighschools,and,infact,PierceCollegeinLosAngeleshasalargenumberofpathwaysfromthelow‐performinghighschools(9).

23 UnrealizedPromises
CivilRightsProject/ProyectoDerechosCivilesJanuary,2012
Table5.PathwaystoMajorityUnderrepresentedMinorityCommunityColleges(morethan50%underrepresentedminority)
Two‐YearInstitution County
StrongPromotingPower
Pathways
WeakPromotingPower
PathwaysWhite(%)
Black(%)
Latino(%)
AntelopeValleyCollege LosAngeles 1 0 37 22 33CerritosCollege LosAngeles 1 4 16 9 60ChaffeyCommunityCollege
SanBernardino 2 2 28 12 48
CitrusCollege LosAngeles 1 0 34 6 47CollegeOfTheDesert Riverside 1 1 30 3 59ElCaminoCollege LosAngeles 6 4 22 20 36LongBeachCityCollege LosAngeles 1 0 28 15 37LosAngelesCityCollege LosAngeles 0 3 20 12 45LosAngelesHarborCollege LosAngeles 0 4 17 15 47LosAngelesValleyCollege LosAngeles 0 6 32 6 45Mt.SanAntonioCollege LosAngeles 10 4 19 5 46OxnardCollege Ventura 2 0 18 4 68RioHondoCollege LosAngeles 0 3 13 3 72RiversideCityCollege Riverside 2 4 35 12 41SanBernardinoValleyCollege
SanBernardino 0 2 24 20 47
SouthwesternCollege SanDiego 4 0 13 5 66WestLosAngelesCollege LosAngeles 0 0 15 43 31Source:CaliforniaPostsecondaryEducationCommission
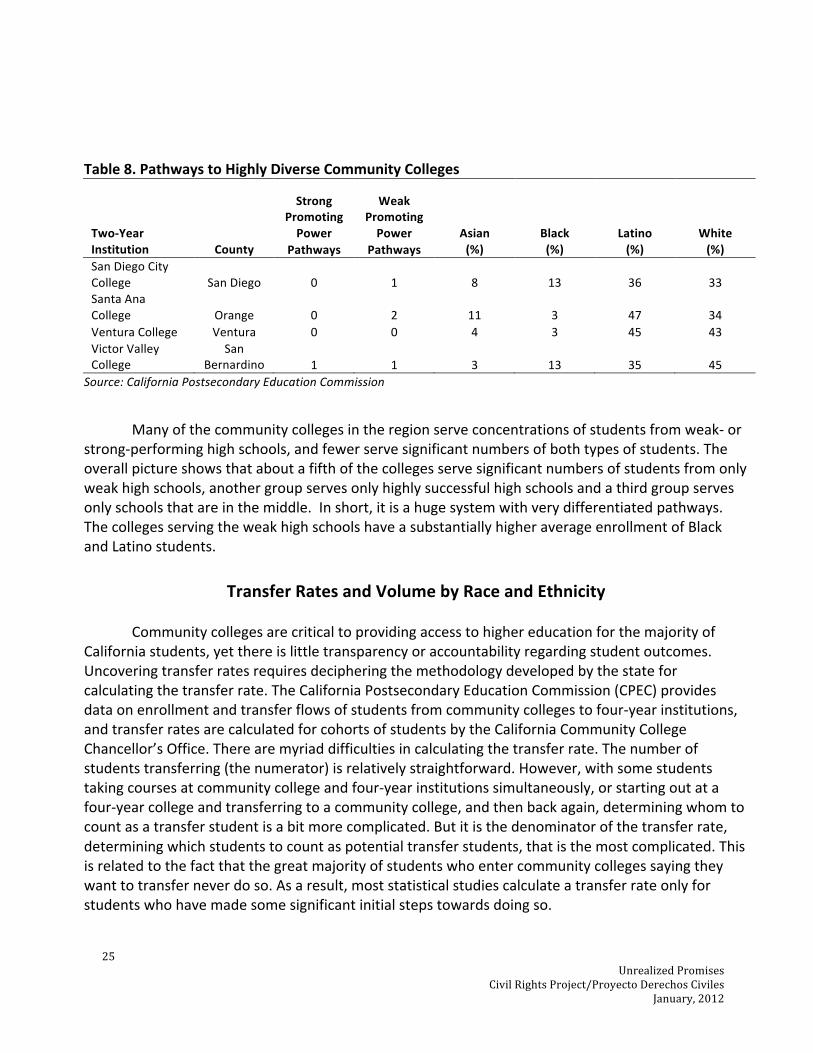
Aboutafifthoftheregion’scommunitycollegesaremajoritywhite,listedinTable7.Theseschoolsaremuchmorelikelytohavelargepathwaysfromthestrongest‐performinghighschoolsintheregion.Thereare24pathwaysfromhighperforminghighschoolsintomajoritywhitecommunitycolleges,comparedtoamerefourfromthelower‐performingschoolsintheregion.Eachofthecountiesintheregionhasatleastonemajoritywhitecommunitycollege,andinSanDiegotherearefour. Onlyahandfulofcommunitycollegesintheregionarenotintenselysegregated,majorityunderrepresentedminority,ormajoritywhiteand/orAsian.TheseschoolsarehighlydiverseandhavefewlargepathwaysfromanyoftheweakestorstrongesthighschoolsandarelistedinTable8.Althoughtheseschoolsareregardedashighlydiverse,allare48to50%underrepresentedminority,andveryclosetomeetingthethresholdforclassificationasmajorityunderrepresentedminority.
24 UnrealizedPromises
CivilRightsProject/ProyectoDerechosCivilesJanuary,2012
Table6.PathwaystoMajorityWhiteandAsianCommunityColleges(morethan50%whiteandAsian)
Two‐YearInstitution County
StrongPromotingPower
Pathways
WeakPromotingPower
Pathways White(%)Black(%) Latino(%)
Asian(%)
BarstowCollege SanBernardino 0 0 49 14 28 30CoastlineCommunityCollege Orange 0 0 43 10 17 7CollegeoftheCanyons LosAngeles 0 0 48 6 30 24CypressCollege Orange 3 0 31 6 32 28FullertonCollege Orange 5 0 37 4 39 4GoldenWestCollege Orange 3 0 42 2 20 13Mt.SanJacintoCollege Riverside 2 0 48 8 33 17OrangeCoastCollege Orange 7 0 47 2 22 25PasadenaCityCollege LosAngeles 9 8 19 6 38 6PierceCollege LosAngeles 0 9 40 7 33 15SanDiegoMesaCollege SanDiego 0 2 45 7 22 21SanDiegoMiramarCollege SanDiego 2 0 45 5 17 17SantaMonicaCollege LosAngeles 2 6 40 12 29 11SantiagoCanyonCollege Orange 2 0 43 2 42 4Source:CaliforniaPostsecondaryEducationCommission
Table7.PathwaystoMajorityWhiteSchools,2008(morethan50%white)
Two‐YearInstitution County
StrongPromoting
PowerPathwaysWeakPromotingPowerPathways
White(%)
Black(%) Asian(%)
Latino(%)
CopperMountainCollege
SanBernardino 0 0 67 7 3 17
CraftonHillsCollege
SanBernardino 1 0 59 5 4 28
CuyamacaCollege SanDiego 1 0 57 7 4 22GlendaleCommunityCollege LosAngeles 3 1 59 2 9 24GrossmontCollege SanDiego 1 2 53 9 7 21IrvineValleyCollege Orange 1 0 51 2 29 12MiraCostaCollege SanDiego 3 0 57 5 6 26MoorparkCollege Ventura 5 0 65 3 8 19PaloVerdeCollege Riverside 0 0 52 10 5 30PalomarCollege SanDiego 4 1 54 4 6 31SaddlebackCollege Orange 5 0 70 2 9 15Source:CaliforniaPostsecondaryEducationCommission
25 UnrealizedPromises
CivilRightsProject/ProyectoDerechosCivilesJanuary,2012
Table8.PathwaystoHighlyDiverseCommunityColleges
Two‐YearInstitution County
StrongPromotingPower
Pathways
WeakPromotingPower
PathwaysAsian(%)
Black(%)
Latino(%)
White(%)
SanDiegoCityCollege SanDiego 0 1 8 13 36 33SantaAnaCollege Orange 0 2 11 3 47 34VenturaCollege Ventura 0 0 4 3 45 43VictorValleyCollege
SanBernardino 1 1 3 13 35 45
Source:CaliforniaPostsecondaryEducationCommission
Manyofthecommunitycollegesintheregionserveconcentrationsofstudentsfromweak‐orstrong‐performinghighschools,andfewerservesignificantnumbersofbothtypesofstudents.Theoverallpictureshowsthataboutafifthofthecollegesservesignificantnumbersofstudentsfromonlyweakhighschools,anothergroupservesonlyhighlysuccessfulhighschoolsandathirdgroupservesonlyschoolsthatareinthemiddle.Inshort,itisahugesystemwithverydifferentiatedpathways.ThecollegesservingtheweakhighschoolshaveasubstantiallyhigheraverageenrollmentofBlackandLatinostudents.
TransferRatesandVolumebyRaceandEthnicity
CommunitycollegesarecriticaltoprovidingaccesstohighereducationforthemajorityofCaliforniastudents,yetthereislittletransparencyoraccountabilityregardingstudentoutcomes.Uncoveringtransferratesrequiresdecipheringthemethodologydevelopedbythestateforcalculatingthetransferrate.TheCaliforniaPostsecondaryEducationCommission(CPEC)providesdataonenrollmentandtransferflowsofstudentsfromcommunitycollegestofour‐yearinstitutions,andtransferratesarecalculatedforcohortsofstudentsbytheCaliforniaCommunityCollegeChancellor’sOffice.Therearemyriaddifficultiesincalculatingthetransferrate.Thenumberofstudentstransferring(thenumerator)isrelativelystraightforward.However,withsomestudentstakingcoursesatcommunitycollegeandfour‐yearinstitutionssimultaneously,orstartingoutatafour‐yearcollegeandtransferringtoacommunitycollege,andthenbackagain,determiningwhomtocountasatransferstudentisabitmorecomplicated.Butitisthedenominatorofthetransferrate,determiningwhichstudentstocountaspotentialtransferstudents,thatisthemostcomplicated.Thisisrelatedtothefactthatthegreatmajorityofstudentswhoentercommunitycollegessayingtheywanttotransferneverdoso.Asaresult,moststatisticalstudiescalculateatransferrateonlyforstudentswhohavemadesomesignificantinitialstepstowardsdoingso.

26 UnrealizedPromises
CivilRightsProject/ProyectoDerechosCivilesJanuary,2012
CliffordAdelman,long‐timefederaldataanalyst,hasdevelopedawidelyusedapproach.Hesuggeststhatonlystudentswhoearned10collegecreditsormoreatthecommunitycollegeandthentransferredandearnedatleast10creditsatthefour‐yearinstitutioncanbecountedaspartofthetransferpopulation.38Importantly,thistechniqueomitsverylargenumbersofstudentswhobelievetheyareonthepathtoearnaB.A.whentheyenrollincommunitycollege,butwhoendupmakingnorealsignificantprogress.
California’sreportedtransferratesarecalculatedinarelatedway.Thestatetrackscohortsof
first‐timecollegefreshmenwhoenrolledinatransferlevelmathorEnglishcourse,enrolledinaminimumof12attemptedunits,andtransferredwithinsixyearsofinitialenrollment.Thestateadjuststheratesforvariablesorfactorsconsideredoutsidethecontrolofthecolleges:thepercentageofstudents25yearsorolder,thebachelordegreeattainmentofthepopulation,andthepercentage25yearsorolderinacollege’sservicearea.39CaliforniaalsoprovidesastatewideStudentRight‐to‐KnowRate,40whichreportscompletionandtransferratesoverathree‐yearperiodforcohortsoftransfer‐seekingfirst‐time,full‐timestudents.TheaveragetransferrateinSouthernCaliforniacommunitycollegesusingthefirstmethodis39%,whileunderthesecondmethoditis17%.
TheCaliforniaCommunityCollegeChancellor’sOfficeTransferVelocityProjectprovides
transferdataforcohortsofstudentswhobegantheirstudiesataCaliforniacommunitycollegebetween1997and2003.WerelyontheTransferVelocityreportdatahere,usingthesix‐yeartransferrates,asitistheonlytransferratedatareadilyavailablethatcanbedisaggregatedbyrace/ethnicity.
SomeofthestrongesttransferschoolsinthestatearefoundinSouthernCalifornia.Santa
MonicaCityCollege,PasadenaCityCollegeandOrangeCoastCollegeconsistentlytransferthehighestnumberofstudentstoUCandCSU.Takentogether,one‐quarterofallcommunitycollegestudentsintheregiontransferringtoaUCcamefromoneofthesethreecampuses,andalmostone‐eighthcamefromSantaMonicaCollegealone.
TransferRatesbyCounty
Forthecohortoffreshmenenteringcommunitycollegein2003‐04,anaverageof38%transferredwithinsixyears.Table9liststhesix‐yeartransferratesbyrace/ethnicityforeachofthe
38C.Adelman,“MovingintoTown–andMovingOn:TheCommunityCollegeintheLivesofTraditionalAgeStudents”(Washington,DC:USDepartmentofEducation,2005)202.http://eric.ed.gov/ERICWebPortal/custom/portlets/recordDetails/detailmini.jsp?_nfpb=true&_&ERICExtSearch_SearchValue_0=ED496111&ERICExtSearch_SearchType_0=no&accno=ED496111(accessedMarch6,2010) 39CaliforniaCommunityCollegeChancellor’sOffice,TransferRateStudyofCaliforniaCommunityColleges(2005‐06Report).http://www.cccco.edu/ChancellorsOffice/Divisions/TechResearchInfo/ResearchandPlanning/ResearchReports/tabid/299/Default.aspx40AccordingtotheCaliforniaPostsecondaryEducationCommission,“IncompliancewithDepartmentofEducation'sStudentRight‐to‐KnowAct,allcollegesanduniversitiesreceivingTitleIVfundsarerequiredtoreportvariouspointsofinformationtostudents,employeesandprospectivestudents.TheStudentRight‐to‐KnowActrequiresaninstitutionthatparticipatesinanyfederalstudentfinancialassistanceprogramtodiscloseinformationaboutgraduationorcompletionratestocurrentandprospectivestudents.”http://www.cpec.ca.gov/CollegeGuide/InfoForStudents.asp(accessedMarch6,2010).

27 UnrealizedPromises
CivilRightsProject/ProyectoDerechosCivilesJanuary,2012
countiesinSouthernCalifornia.Bycounty,thetransferrateaverageswerehighestinOrangeCountyat46%,andlowestinRiversideat30%.TransferratesforBlackstudentsbycountyrangedfromalowof27%inSanBernardinotoahighof39%inSanDiego.Similarly,Latinotransferratesbycountyrangedfromaverage(38%)inVenturatowellbelowaverage(2%)inSanBernardino.WhiteandAsianstudentsweremorelikelytotransfer,exceptinRiversideandSanBernardino.Thehighesttransferrateforanysinglegroupswas61%forVenturaCountyAsianstudents.SanBernardinoCountyhadthelowestaveragetransferratesforbothLatinoandBlackstudents.
Table9.Six‐YearTransferRatesbyCountyandRace/Ethnicity,2003‐04Cohort
CountyBlack(%)
Asian(%)
Filipino(%)
Latino(%)
PacificIslander(%)
White(%)
Total(%)
LosAngeles 33 54 31 29 35 41 37Orange 34 57 32 37 33 45 46Riverside 36 35 22 27 16 32 30SanBernardino 27 36 28 26 30 34 32SanDiego 39 51 40 34 27 42 40Ventura 37 61 37 38 47 42 41Source:CaliforniaCommunityCollegeChancellor’sOfficeTransferVelocityReport
HighestandLowestTransferRatesintheRegion
Withoutexception,thecommunitycollegeswiththehighestoveralltransferratesaremajoritywhiteandAsian(seeTable10).However,evenintheseinstitutionswithrelativelyhightransferrates,BlackandLatinostudentstransfermuchlessfrequently.LosAngelesCounty’s21communitycollegesareamongthehighest‐andlowest‐performinginthestate.LosAngelesSouthwestandLosAngelesTrade‐TechnicalCollegetransferredfewerthan10studentseachtoaUCin2008‐09,whileSantaMonicaCollegeoccupiedtheotherextreme.OrangeCountyhasninecollegeswithsomeofthehighesttransferstoCSUandUC.ThestrongestschoolsinOrangeCountyincludeOrangeCoastCollegeandSaddlebackCollege,whichtransferlargenumbersofstudentstoCSU.RiversideCountyhasjustfourcommunitycolleges,withRiversideCityCollegeasitsstrongesttransferschool.SanBernardinohassixcommunitycollegesandallhaverelativelylowtransferratestobothUCandCSU.InSanDiego,SanDiegoMesaCollegeandPalomarCollegesendlargenumbersofstudentstoCSUandUC.
Thecommunitycollegesintheregionwiththelargestnumberoftransferstudents
eachyeararelistedinTable11.SantaMonicaCollegeleadstheregioninthenumberofstudenttransfers,withcloseto2,000studentstransferringeachyear.ThemajorityofSantaMonicaCollegetransferstudentswenttoUCLAin2008,averyhighlyselectivecampus,followedcloselybyCalStateNorthridge.Thefollowingtableshowsthetransferdestinationsandvolumeforthetopfivetransferringinstitutionsintheregion.

28 UnrealizedPromises
CivilRightsProject/ProyectoDerechosCivilesJanuary,2012
Table10.Six‐YearTransferRatesfor2003‐04Cohort,UpperQuartileofSchoolsintheRegion
Two‐YearInstitution County
Asian(%)
Black(%)
Filipino(%)
Latino(%)
White(%)
Total(%)
RacialMajority
SantaMonicaCollege LosAngeles 68 46 47 41 64 58 White/AsianIrvineValleyCollege Orange 62 48 35 44 55 55 WhiteMoorparkCollege Ventura 62 39 33 47 54 53 WhiteGlendaleCommunityCollege LosAngeles 62 31 25 32 57 50 WhiteCoastlineCommunityCollege Orange 64 29 0 39 37 49 White/AsianSaddlebackCollege Orange 58 51 35 38 51 49 WhiteSantiagoCanyonCollege Orange 54 0 48 44 50 49 White/AsianOrangeCoastCollege Orange 57 30 40 37 49 48 White/AsianSanDiegoMesaCollege SanDiego 56 46 44 41 50 48 White/AsianFullertonCollege Orange 64 43 44 38 48 47 White/AsianPasadenaCityCollege LosAngeles 61 36 38 31 50 47 White/AsianPierceCollege LosAngeles 51 31 40 32 50 45 White/AsianSanDiegoMiramarCollege SanDiego 55 41 43 42 42 45 White/Asian
Average 60 36 36 39 51 49 Source:CaliforniaCommunityCollegeChancellor’sOfficeTransferVelocityReport
Table11.SouthernCaliforniaCommunityCollegeswithLargestNumberofTransferStudents,2008
CommunityCollege County
TotalEnrollment
TransferstoUC&CSU
LargestReceivingInstitutions
6‐YearTransferRate
(%)
Racial
Majority
SantaMonicaCollege
LosAngeles54,878
UC(919)CSU(1,011)
UCLA(516)CSU‐Northridge
(510)
58 White/Asian
OrangeCoastCollege Orange 34,790
UC(555)CSU(1,303)
UCLA(235)CSU‐Fullerton
(602)
48 White/Asian
PasadenaCityCollege LosAngeles 45,324
UC(565)CSU(1,222)
UCLA(206)CSULA(500)
47 White/Asian
Mt.SanAntonioCollege LosAngeles 69,627
UC(332)CSU(1,258)
UCLA(90)CalPolyPomona
(471)
40 URM
ElCaminoCollege LosAngeles 41,700
UC(296)CSU(1,031)
UCLA(113)CSU‐Dominguez
Hills(385)
35 URM
Source:2008CaliforniaPostsecondaryEducationCommission,HigherEducationData
29 UnrealizedPromises
CivilRightsProject/ProyectoDerechosCivilesJanuary,2012
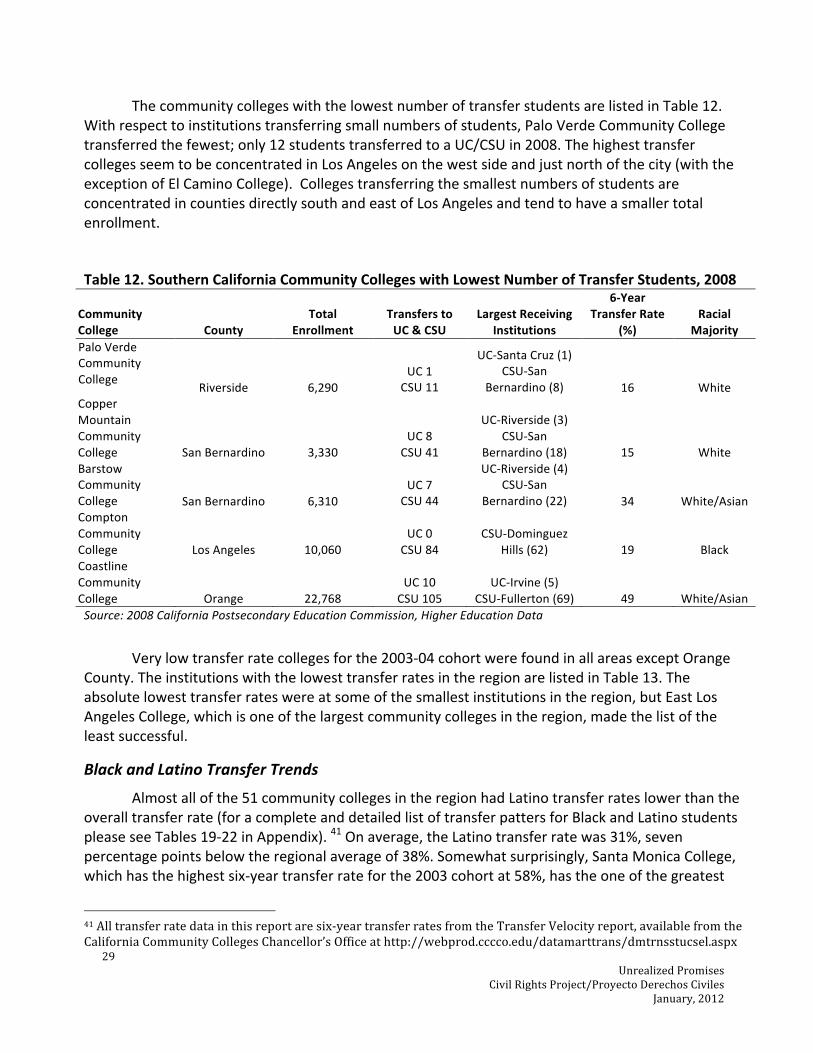
ThecommunitycollegeswiththelowestnumberoftransferstudentsarelistedinTable12.Withrespecttoinstitutionstransferringsmallnumbersofstudents,PaloVerdeCommunityCollegetransferredthefewest;only12studentstransferredtoaUC/CSUin2008.ThehighesttransfercollegesseemtobeconcentratedinLosAngelesonthewestsideandjustnorthofthecity(withtheexceptionofElCaminoCollege).CollegestransferringthesmallestnumbersofstudentsareconcentratedincountiesdirectlysouthandeastofLosAngelesandtendtohaveasmallertotalenrollment.
Table12.SouthernCaliforniaCommunityCollegeswithLowestNumberofTransferStudents,2008
CommunityCollege County
TotalEnrollment
TransferstoUC&CSU
LargestReceivingInstitutions
6‐YearTransferRate
(%)
Racial
MajorityPaloVerdeCommunityCollege
Riverside 6,290UC1CSU11
UC‐SantaCruz(1)CSU‐San
Bernardino(8) 16 WhiteCopperMountainCommunityCollege SanBernardino 3,330
UC8CSU41
UC‐Riverside(3)CSU‐San
Bernardino(18) 15 WhiteBarstowCommunityCollege SanBernardino 6,310
UC7CSU44
UC‐Riverside(4)CSU‐San
Bernardino(22) 34 White/AsianComptonCommunityCollege LosAngeles 10,060
UC0CSU84
CSU‐DominguezHills(62) 19 Black
CoastlineCommunityCollege Orange 22,768
UC10CSU105
UC‐Irvine(5)CSU‐Fullerton(69) 49 White/Asian
Source:2008CaliforniaPostsecondaryEducationCommission,HigherEducationData
Verylowtransferratecollegesforthe2003‐04cohortwerefoundinallareasexceptOrangeCounty.TheinstitutionswiththelowesttransferratesintheregionarelistedinTable13.Theabsolutelowesttransferrateswereatsomeofthesmallestinstitutionsintheregion,butEastLosAngelesCollege,whichisoneofthelargestcommunitycollegesintheregion,madethelistoftheleastsuccessful.
BlackandLatinoTransferTrends
Almostallofthe51communitycollegesintheregionhadLatinotransferrateslowerthantheoveralltransferrate(foracompleteanddetailedlistoftransferpattersforBlackandLatinostudentspleaseseeTables19‐22inAppendix).41Onaverage,theLatinotransferratewas31%,sevenpercentagepointsbelowtheregionalaverageof38%.Somewhatsurprisingly,SantaMonicaCollege,whichhasthehighestsix‐yeartransferrateforthe2003cohortat58%,hastheoneofthegreatest
41Alltransferratedatainthisreportaresix‐yeartransferratesfromtheTransferVelocityreport,availablefromtheCaliforniaCommunityCollegesChancellor’sOfficeathttp://webprod.cccco.edu/datamarttrans/dmtrnsstucsel.aspx
30 UnrealizedPromises
CivilRightsProject/ProyectoDerechosCivilesJanuary,2012
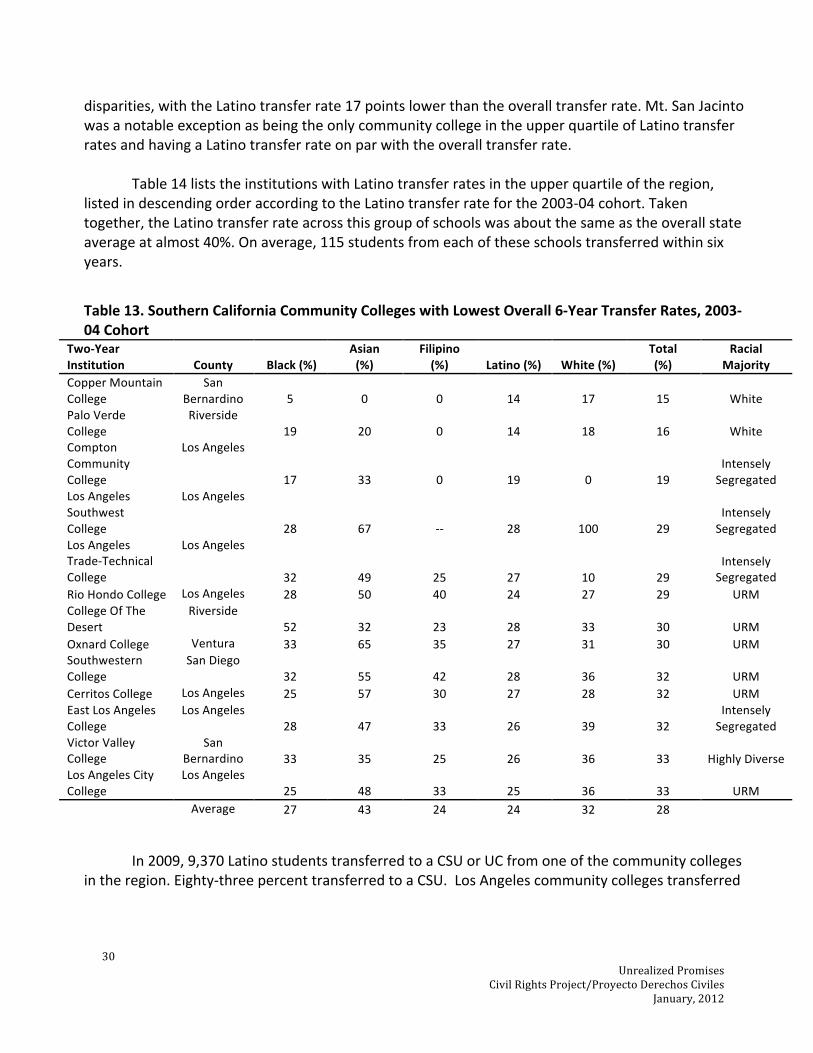
disparities,withtheLatinotransferrate17pointslowerthantheoveralltransferrate.Mt.SanJacintowasanotableexceptionasbeingtheonlycommunitycollegeintheupperquartileofLatinotransferratesandhavingaLatinotransferrateonparwiththeoveralltransferrate. Table14liststheinstitutionswithLatinotransferratesintheupperquartileoftheregion,listedindescendingorderaccordingtotheLatinotransferrateforthe2003‐04cohort.Takentogether,theLatinotransferrateacrossthisgroupofschoolswasaboutthesameastheoverallstateaverageatalmost40%.Onaverage,115studentsfromeachoftheseschoolstransferredwithinsixyears.
Table13.SouthernCaliforniaCommunityCollegeswithLowestOverall6‐YearTransferRates,2003‐04Cohort
Two‐YearInstitution County Black(%)
Asian(%)
Filipino(%) Latino(%) White(%)
Total(%)
RacialMajority
CopperMountainCollege
SanBernardino 5 0 0 14 17 15 White
PaloVerdeCollege
Riverside19 20 0 14 18 16 White
ComptonCommunityCollege
LosAngeles
17 33 0 19 0 19IntenselySegregated
LosAngelesSouthwestCollege
LosAngeles
28 67 ‐‐ 28 100 29IntenselySegregated
LosAngelesTrade‐TechnicalCollege
LosAngeles
32 49 25 27 10 29IntenselySegregated
RioHondoCollege LosAngeles 28 50 40 24 27 29 URMCollegeOfTheDesert
Riverside52 32 23 28 33 30 URM
OxnardCollege Ventura 33 65 35 27 31 30 URMSouthwesternCollege
SanDiego32 55 42 28 36 32 URM
CerritosCollege LosAngeles 25 57 30 27 28 32 URMEastLosAngelesCollege
LosAngeles28 47 33 26 39 32
IntenselySegregated
VictorValleyCollege
SanBernardino 33 35 25 26 36 33 HighlyDiverse
LosAngelesCityCollege
LosAngeles25 48 33 25 36 33 URM
Average 27 43 24 24 32 28
In2009,9,370LatinostudentstransferredtoaCSUorUCfromoneofthecommunitycollegesintheregion.Eighty‐threepercenttransferredtoaCSU.LosAngelescommunitycollegestransferred
31 UnrealizedPromises
CivilRightsProject/ProyectoDerechosCivilesJanuary,2012
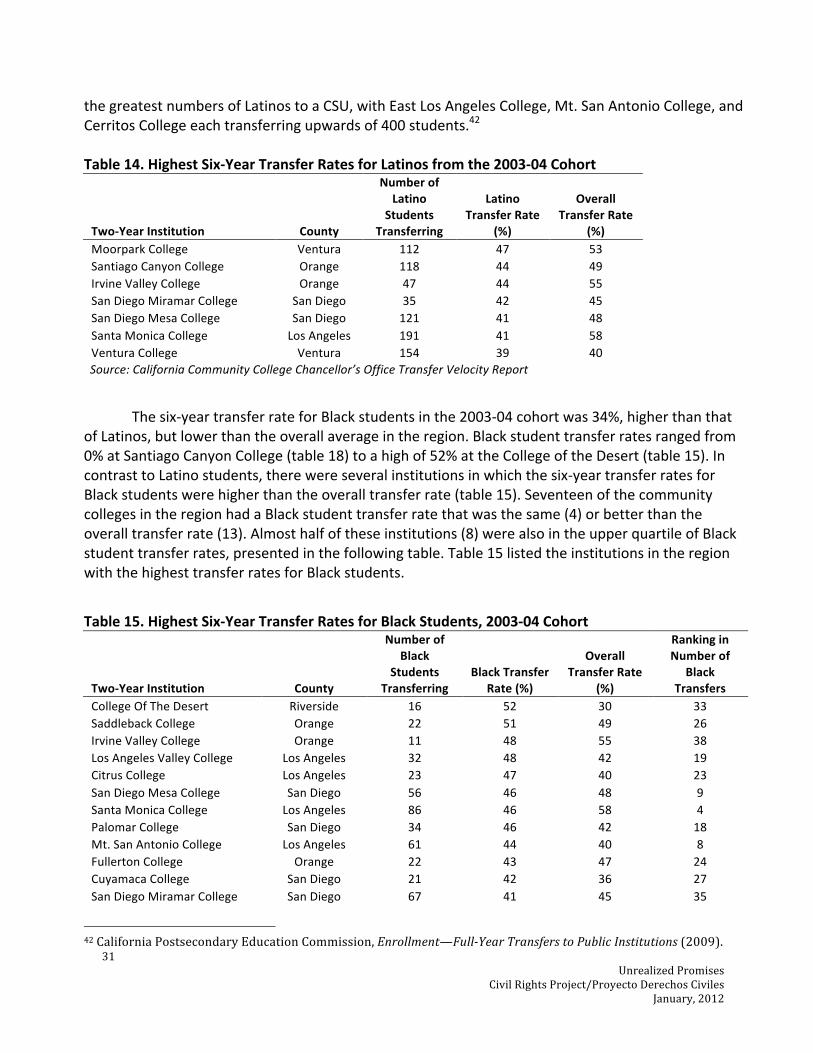
thegreatestnumbersofLatinostoaCSU,withEastLosAngelesCollege,Mt.SanAntonioCollege,andCerritosCollegeeachtransferringupwardsof400students.42Table14.HighestSix‐YearTransferRatesforLatinosfromthe2003‐04Cohort
Two‐YearInstitution County
NumberofLatino
StudentsTransferring
LatinoTransferRate
(%)
OverallTransferRate
(%)MoorparkCollege Ventura 112 47 53SantiagoCanyonCollege Orange 118 44 49IrvineValleyCollege Orange 47 44 55SanDiegoMiramarCollege SanDiego 35 42 45SanDiegoMesaCollege SanDiego 121 41 48SantaMonicaCollege LosAngeles 191 41 58VenturaCollege Ventura 154 39 40
Source:CaliforniaCommunityCollegeChancellor’sOfficeTransferVelocityReport
Thesix‐yeartransferrateforBlackstudentsinthe2003‐04cohortwas34%,higherthanthatofLatinos,butlowerthantheoverallaverageintheregion.Blackstudenttransferratesrangedfrom0%atSantiagoCanyonCollege(table18)toahighof52%attheCollegeoftheDesert(table15).IncontrasttoLatinostudents,therewereseveralinstitutionsinwhichthesix‐yeartransferratesforBlackstudentswerehigherthantheoveralltransferrate(table15).SeventeenofthecommunitycollegesintheregionhadaBlackstudenttransferratethatwasthesame(4)orbetterthantheoveralltransferrate(13).Almosthalfoftheseinstitutions(8)werealsointheupperquartileofBlackstudenttransferrates,presentedinthefollowingtable.Table15listedtheinstitutionsintheregionwiththehighesttransferratesforBlackstudents.
Table15.HighestSix‐YearTransferRatesforBlackStudents,2003‐04Cohort
Two‐YearInstitution County
NumberofBlack
StudentsTransferring
BlackTransferRate(%)
OverallTransferRate
(%)
RankinginNumberof
BlackTransfers
CollegeOfTheDesert Riverside 16 52 30 33SaddlebackCollege Orange 22 51 49 26IrvineValleyCollege Orange 11 48 55 38LosAngelesValleyCollege LosAngeles 32 48 42 19CitrusCollege LosAngeles 23 47 40 23SanDiegoMesaCollege SanDiego 56 46 48 9SantaMonicaCollege LosAngeles 86 46 58 4PalomarCollege SanDiego 34 46 42 18Mt.SanAntonioCollege LosAngeles 61 44 40 8FullertonCollege Orange 22 43 47 24CuyamacaCollege SanDiego 21 42 36 27SanDiegoMiramarCollege SanDiego 67 41 45 35
42CaliforniaPostsecondaryEducationCommission,Enrollment—FullYearTransferstoPublicInstitutions(2009).

32 UnrealizedPromises
CivilRightsProject/ProyectoDerechosCivilesJanuary,2012
CollegeoftheCanyons LosAngeles 43 41 43 32WestLosAngelesCollege LosAngeles 94 41 37 2
Source:CaliforniaCommunityCollegeChancellor’sOfficeTransferVelocityReport
Severalofthecommunitycollegesintheregionthatareintheupperquartilefortheoverall
transferratehavelargediscrepanciesbetweenthetransferratesbyrace,andactuallyhavemuchlowertransferratesforBlackandLatinostudents.Table16includestheinstitutionsintheregionwithdiscrepanciesofmorethan10percentagepointsbetweenBlackandLatinotransferratescomparedtotheoverallaverage.SinceBlackandLatinostudentsareincludedinthecalculationoftheoveralltransferrate,thegapbetweenBlackandLatinostudentsandAsianandwhitestudentsisgreaterstill.Allbutoneofthesecommunitycollegesismajoritywhite/Asian.
Table16.InstitutionswithGreatestTransferRateDiscrepanciesbyRace
Two‐YearInstitution County
BlackTransferRate(%)
LatinoTransferRate(%)
OverallTransferRate(%)
RacialMajority
GlendaleCommunityCollege LosAngeles 31 32 50 WhiteCoastlineCommunityCollege Orange 29 39 49 White/AsianOrangeCoastCollege Orange 30 37 48 White/AsianSantaMonicaCollege LosAngeles 46 41 58 White/AsianPierceCollege LosAngeles 31 32 45 White/AsianLosAngelesHarborCollege LosAngeles 29 26 41 URMPasadenaCityCollege LosAngeles 36 31 47 White/AsianCraftonHillsCollege SanBernardino 25 26 38 White
Source:CaliforniaCommunityCollegeChancellor’sOfficeTransferVelocityReport
TheaveragetransferrateforAsianstudentsintheregionwas51%,wellovertheregional
average,whileforwhitestudentsitwas41%.NativeAmerican,Filipino,andPacificIslandertransferratesweresimilartothoseofLatinosat31‐32%.43Includedinthisgroupofinstitutions,withthegreatesttransferratediscrepanciesbyrace,aresomeoftheinstitutionsservingthemoststudents:PasadenaCityCollegehadthelargestcohortin2003‐4,andOrangeCoastCollegeandSantaMonicaCollegebothhadcohortsthatweremuchlargerthattheregionalaverage.Theselargediscrepanciesimpactparticularlylargenumbersofstudents.Thesediscrepanciesrequirefurtherinvestigationbutdonot,ofcourse,showthattheyarecausedbythecommunitycolleges,sinceallgroupsdonotcometocollegewithequalpreparation.Evenbeingfarbelowtheaveragetransferrateinthestrongestcolleges,studentsofcoloraremuchmorelikelytotransferfromtheseinstitutionsthanfromlow‐transfercolleges.
MostinstitutionsinthebottomquartileforLatinosix‐yeartransferratesarealsointhebottomquartileforoveralltransferrates.Table17liststheinstitutionsintheregionwiththelowesttransferratesforLatinostudents.Inthisgroup,thetransferratesrangefromalowof14%toahighof
43NativeAmerican,Filipino,andPacificIslandertransferratesforthemostpartarenotincludedinthisreportduetospacelimitations.Thesedateareavailableuponrequestfromtheauthors,andalsoaccessibleviatheTransferVelocityProjectathttp://webprod.cccco.edu/datamarttrans/dmtrnsstucsel.aspx

33 UnrealizedPromises
CivilRightsProject/ProyectoDerechosCivilesJanuary,2012
27%.Interestingly,amongtheselow‐transferringinstitutionsaresomeoftheinstitutionsthatareactuallytransferringthegreatestrawnumbersofLatinostudentsrelativetotheregion.EastLosAngelesCollege,CerritosCollege,RioHondo,ChaffeyCollege,ElCaminoCollege,andOxnardCollegealltransferredmoreLatinostudentsthantheregionalaverage.Thatmeans,ofcourse,thattheyhadlargeLatinoenrollmentsandveryhighproportionsofLatinostudentswhofailedtotransfer.LosAngelesCountycommunitycollegeshavethemajorityofthecollegeswiththelowestLatinotransferrates.Indeed,halfofthecommunitycollegesinLosAngelesCountyareinthebottomquartile.AllbutoneofthesixcommunitycollegesinSanBernardinoareinthebottomquartileaswell(SanBernardinoValleyCollegeistheexception).
Table17.LowestTransferRatesforLatinos
Two‐YearInstitution County
NumberofLatinos
Transferring
LatinoTransferRate
(%)
OverallTransferRate
(%)
RankinginNumberofLatino
TransfersCopperMountainCollege SanBernardino 5 14 15 51PaloVerdeCollege Riverside 8 14 16 50ComptonCommunityCollege LosAngeles 41 19 19 44ElCaminoCollege LosAngeles 172 24 35 12RioHondoCollege LosAngeles 199 24 29 8LosAngelesCityCollege LosAngeles 97 25 33 30CraftonHillsCollege SanBernardino 36 26 38 45EastLosAngelesCollege LosAngeles 309 26 32 3LosAngelesHarborCollege LosAngeles 76 26 41 37VictorValleyCollege SanBernardino 54 26 33 39CerritosCollege LosAngeles 245 27 32 5ChaffeyCommunityCollege SanBernardino 186 27 34 10LosAngelesTrade‐TechnicalCollege LosAngeles 112 27 29 26OxnardCollege Ventura 133 27 30 18BarstowCollege SanBernardino 26 27 34 47AntelopeValleyCollege LosAngeles 88 27 34 33WestLosAngelesCollege LosAngeles 44 27 37 43
Source:CaliforniaCommunityCollegeChancellor’sOfficeTransferVelocityReport
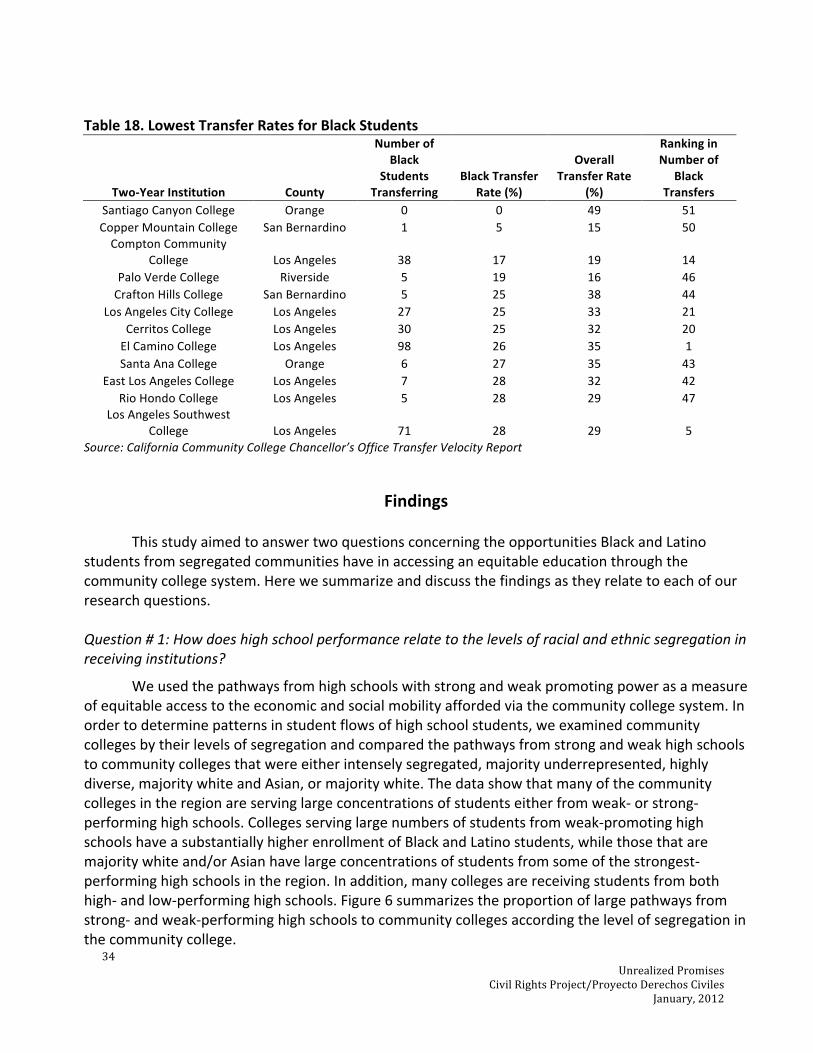
AswiththebottomquartiletransferrateschoolsforLatinos,someoftheinstitutionswithrelativelyhightransferrates(SantiagoCanyonCollege)actuallyhavequitelowtransferratesforBlackstudents.Table18liststheinstitutionsintheregionwiththelowesttransferratesforBlackstudents.ElCaminoCollege,whichtransferredthegreatestnumberofBlackstudentsinthe2003‐04cohort,alsohadoneofthelowesttransferratesforBlackstudentsat26%.Similarly,LosAngelesSouthwesttransferredarelativelyhighernumberofBlackstudents,thefifthhighestintheregion,buthadalowoverallandBlacktransferrate.ThesewereschoolswithlargeBlackenrollmentswithhighpercentagesofstudentsleftbehind.
34 UnrealizedPromises
CivilRightsProject/ProyectoDerechosCivilesJanuary,2012
Table18.LowestTransferRatesforBlackStudents
Two‐YearInstitution County
NumberofBlack
StudentsTransferring
BlackTransferRate(%)
OverallTransferRate
(%)
RankinginNumberof
BlackTransfers
SantiagoCanyonCollege Orange 0 0 49 51CopperMountainCollege SanBernardino 1 5 15 50ComptonCommunity
College LosAngeles 38 17 19 14PaloVerdeCollege Riverside 5 19 16 46CraftonHillsCollege SanBernardino 5 25 38 44
LosAngelesCityCollege LosAngeles 27 25 33 21CerritosCollege LosAngeles 30 25 32 20ElCaminoCollege LosAngeles 98 26 35 1SantaAnaCollege Orange 6 27 35 43
EastLosAngelesCollege LosAngeles 7 28 32 42RioHondoCollege LosAngeles 5 28 29 47
LosAngelesSouthwestCollege LosAngeles 71 28 29 5
Source:CaliforniaCommunityCollegeChancellor’sOfficeTransferVelocityReport
Findings ThisstudyaimedtoanswertwoquestionsconcerningtheopportunitiesBlackandLatinostudentsfromsegregatedcommunitieshaveinaccessinganequitableeducationthroughthecommunitycollegesystem.Herewesummarizeanddiscussthefindingsastheyrelatetoeachofourresearchquestions.Question#1:Howdoeshighschoolperformancerelatetothelevelsofracialandethnicsegregationinreceivinginstitutions?
Weusedthepathwaysfromhighschoolswithstrongandweakpromotingpowerasameasureofequitableaccesstotheeconomicandsocialmobilityaffordedviathecommunitycollegesystem.Inordertodeterminepatternsinstudentflowsofhighschoolstudents,weexaminedcommunitycollegesbytheirlevelsofsegregationandcomparedthepathwaysfromstrongandweakhighschoolstocommunitycollegesthatwereeitherintenselysegregated,majorityunderrepresented,highlydiverse,majoritywhiteandAsian,ormajoritywhite.Thedatashowthatmanyofthecommunitycollegesintheregionareservinglargeconcentrationsofstudentseitherfromweak‐orstrong‐performinghighschools.Collegesservinglargenumbersofstudentsfromweak‐promotinghighschoolshaveasubstantiallyhigherenrollmentofBlackandLatinostudents,whilethosethataremajoritywhiteand/orAsianhavelargeconcentrationsofstudentsfromsomeofthestrongest‐performinghighschoolsintheregion.Inaddition,manycollegesarereceivingstudentsfrombothhigh‐andlow‐performinghighschools.Figure6summarizestheproportionoflargepathwaysfromstrong‐andweak‐performinghighschoolstocommunitycollegesaccordingthelevelofsegregationinthecommunitycollege.

35 UnrealizedPromises
CivilRightsProject/ProyectoDerechosCivilesJanuary,2012
AlloftheintenselysegregatedcollegesarepartoftheLosAngelescommunitycollegedistrict,and,withtheexceptionofEastLosAngelesCollege,nonehavelargepathwaysfromstrong‐promotinghighschools.Theseareclearlyinstitutionswherestudentsfacecumulativeisolationandunequaleducationalopportunity.Communitycollegesthathavemajorityunderrepresentedminoritystudentenrollmentarecomparativelymorebalancedintheirpathwaysacrosstheregion,with55%ofthepathwaysweexaminedcomingfromhighschoolswithweak‐promotingpower.Conversely,majoritywhiteandAsiancollegesarealsomorebalancedwith58%ofthepathwaysweexaminedfromstrong‐promotinghighschools.Lastly,majoritywhitecollegesarestrikinglydifferent,with86%ofthepathwaysweexaminedfromstrong‐promotinghighschools.Attheextremesofthesecategoriesiswhereweseethestarkestdifferencesinlevelsofsegregationandeducationalopportunity.Studentswholivenearandattendcommunitycollegesthatareintenselysegregated,ormajorityBlackandLatino,typicallyareincollegeswhereagreatnumberoffellowstudentscomefromweak‐promotinghighschools,whereasstudentsfrommajoritywhiteand/ormajoritywhite/Asiancollegeswillencounterstudentscomingfromschoolswithhighpromotingpower.Studentsfromweakerhighschoolstendtohaveweakeracademicpreparationandrequiremoreremediation,andtheircollegesandtheirfacultytendtofocusmoreonthoseneeds.
Figure5.PathwaysfromLow‐andHigh‐PerformingHighSchoolsbyLevelofSegregation
Source:CaliforniaPostsecondaryEducationCommission
Question#2:Howdotransferoutcomesrelatetotheethnicandracialcompositionofthecommunitycollege?Specifically,whichinstitutionsintheregionhavethehighestandlowesttransferratesforBlackandLatinostudents?
0
5
10
15
20
25
30
35
40
IntenselySegregated
MajorityURM MajorityWhiteandAsian
MajorityWhite
HighPerformingHighSchools
Low‐PerformingHighSchools

36 UnrealizedPromises
CivilRightsProject/ProyectoDerechosCivilesJanuary,2012
Wefindaclearrelationshipbetweenlevelsofsegregationincommunitycollegesandrespectivetransferrates.Allofthecommunitycollegesintheupperquartileoftransferratesaremajoritywhite/Asianormajoritywhite.Mostofthecollegesinthebottomquartileoftransferratesaremajorityunderrepresentedminorityorintenselysegregated(morethan90%minority).However,twooftheseschools(PaloVerdeCollegeandCopperMountain)aremajoritywhite,andarelocatedinlow‐incomeneighborhoodsofRiversideandSanBernardinoCounties.ThereareissuesclearlyneedingfurtherexaminationinsomeoftheInlandEmpirecolleges,perhapsrelatedtotherelativelylessaffluentandlesseducatedwhiteandAsianpopulationsinthosecounties.
Turningourattentiontoinstitutionaldiscrepanciesintransferrates,wefoundlargegapsinthe
numberofBlackandLatinostudentsatsomeoftheleadingtransfercollegesintheregion.Thus,BlackandLatinostudentsatthesehigh‐transferinstitutionsarestilllesslikelytotransferthanwhiteandAsianstudentsfromthesamecollege—thoughmorelikelythantheircounterpartsinthesegregatedinstitutions.Inadditiontoneedingtoaddressthesegregationacrossinstitutions,thereisevidenceofsegregationwithintheinstitutions‐‐oftenreferredtoas“secondgenerationsegregation.”44
SomeofthecommunitycollegesintheregionservingsomeofthegreatestnumbersofLatino
students,andabletotransferthegreatestnumberofLatinosstudentseachyear,actuallyhavesomeofthelowestoveralltransferratesintheregion.Forexample,EastLosAngelesCommunityCollegehasa26%Latinotransferrate,oneofthelowestLatinotransferratesintheregion,yettransferred309students(fromthe2003‐04cohort),whichwasthethirdhighestnumberofLatinotransfersintheregion.Similarly,ElCaminoCommunityCollegehadalowtransferrateforBlackstudents(at26%),buttransferredmoreBlackstudentsthananyotherinstitutionintheregion.Thistellsusthatcommunitycollegesthatareservingsomeofthelargestnumbersofminoritystudents,andconsistentlytransferringmoreBlackandLatinostudentsacrosstheregion,havedismaloveralltransferratesforbothofthesegroups.
Conclusion
“Nowisthetimetobuildafirmer,strongerfoundationforgrowththatwillnotonlywithstandfutureeconomicstorms,butonethathelpsusthriveandcompeteinaglobaleconomy.It'stimetoreformourcommunitycollegessothattheyprovideAmericansofallagesachancetolearntheskillsandknowledgenecessarytocompeteforthejobsofthefuture.”
‐PresidentBarackObama
InJuly2009,PresidentBarackObamaoutlinedaplantoreformournation’scollegesinanaddressatMacombCommunityCollegeinMichigan.ThePresident’sAmericanGraduationInitiativecalledforanadditionalfivemillioncommunitycollegegraduatesby2020.Tohelpachievethisgoal,thepresidenthascalledfor$12billiondollarstoincreasegraduationrates,improvefacilitiesanddevelopnewtechnology.45Unfortunately,theAmericanGraduationInitiativefundingwas
44R.A.Mickelson,“SubvertingSwann:First‐andSecond‐GenerationSegregationintheCharlotte‐MecklenburgSchools,”AmericanEducationalResearchJournal38,no.2(2001):215.45M.ShearandD.DeVise,“ObamaAnnouncesCommunityCollegePlan,”TheWashingtonPost(July2009)http://www.washingtonpost.com/wp‐dyn/content/article/2009/07/14/AR2009071400819.html

37 UnrealizedPromises
CivilRightsProject/ProyectoDerechosCivilesJanuary,2012
significantlyslashedbythetimetheHealthcareandEducationReconciliationActwaspassed,butitisstillregardedaslandmarkhighereducationlegislation,particularlyforcommunitycolleges.Communitycollegeswillreceive$2billioninsupportfromtheCommunityCollegeandCareerTrainingInitiative,whichwillhelpcommunitycollegesincreasecompletionofdegrees,certificates,andotherindustry‐recognizedcredentials;morethan$3.5billionisaddedinstudentfinancialassistanceintheformofPellGrants,$1billioninworkforcetrainingprograms,and$40millioninworkstudyprograms.46TheHealthcareandEducationReconciliationActalsoprovides$2.55billionforHistoricallyBlackCollegesandUniversitiesandotherminorityservinginstitutions,$750millioningrantsthatstatescouldapplyfortobolsteraccessandgraduationratesand,mostimportantly,theinitiationoftheFederalDirectLoanprogramthatremovedthemiddlemenfromstudentloanprograms.Thesecomprehensivehighereducationreformsare,however,notuniquetotheObamaAdministration.DuringPresidentClinton’sadministration,therewasalsoasignificantpushtorecommittohighereducationbyincreasingPellgrantsandcreatingtheHOPEandLifetimeLearningcredits,whichprovidedmoreopportunitiesforstudentstoaccessacollegeeducation.OnemajordifferenceinPresidentObama’sinitiativeisanexplicitcommitmenttosupportinggrowthinourcommunitycolleges.InOctoberof2010,PresidentObamahostedthefirst‐everWhiteHouseSummitonCommunityColleges,highlightingtheimportantandcriticalrolecommunitycollegesplayindevelopingourworkforce,andreaffirminghisgoalofproducingfivemillionmoredegreesandcertificatesinthenext10years,inwhichcommunitycollegeswillplayasignificantrole.
Californiaisamongthestateswherecommunitycollegereformshavethepotentialtomakeasignificantimpact.By2020Californiawillneedonemillionneweducatedworkerstomeetthedemandsofourgrowingeconomy.IfCaliforniaistopreparesufficientworkerstomeettheneedsofthelabormarket,andtofulfillthepromiseofaccess,excellenceandaffordabilitysetforthintheMasterPlan,thenthereisnoalternativebuttoimprovetransferratestofour‐yearuniversitiesthroughoutthestateandespeciallyinSouthernCalifornia.
Systemicproblems,increasedenrollmentanddecreasedfundinghaveseverelycompromised
California’scommitmenttothecommunitycollegesystem,aspromisedintheMasterPlanforHigherEducation.Nowmorethanever,wehavetocallintoquestionthestate’spromiseofaccesstohighereducation,especiallyforBlackandLatinostudentswhosemajor‐‐andsometimesonly‐‐accesspointtoafour‐yearuniversityisthroughalocalcommunitycollege.
Californiahasahighlyselectiveandstratifiedhighereducationsystemthatreliesheavilyonits
communitycollegestoeducateandtransferstudentstoafour‐yearuniversity.Therealityisthatformoststudentswholiveandattendschoolsinraciallysegregatedcommunities,theiropportunitiesandaccesstoanequitableeducationareseverelycompromised.Intheabsenceofrealaccesstoeducation,inequalitiesareperpetuated.
Thereareseveredifferencesinaccessandopportunitiesthatexistacrossourregion.Whilethe51communitycollegesspreadacrossseveraldistrictsinourregionaretheoreticallypreparing
46WhiteHouseSummitonCommunityColleges,FactSheethttp://www.whitehouse.gov/sites/default/files/White_House_Summit_on_Community_Colleges_Fact_Sheet.pdf
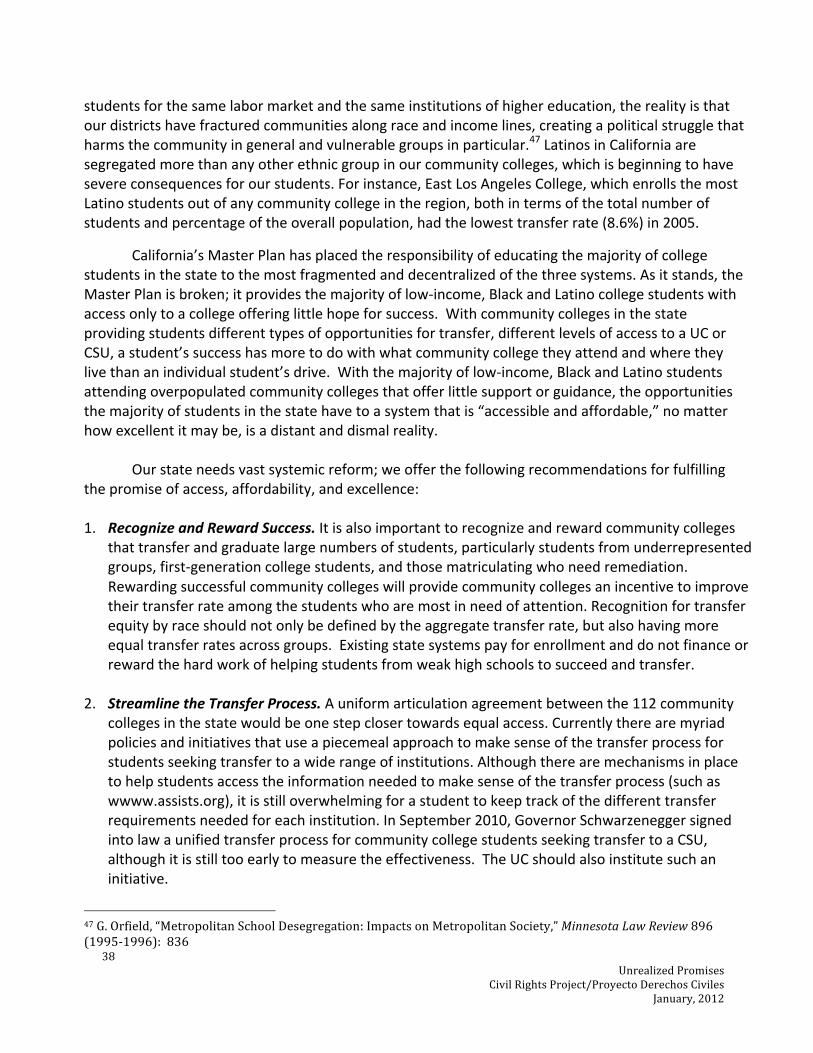
38 UnrealizedPromises
CivilRightsProject/ProyectoDerechosCivilesJanuary,2012
studentsforthesamelabormarketandthesameinstitutionsofhighereducation,therealityisthatourdistrictshavefracturedcommunitiesalongraceandincomelines,creatingapoliticalstrugglethatharmsthecommunityingeneralandvulnerablegroupsinparticular.47LatinosinCaliforniaaresegregatedmorethananyotherethnicgroupinourcommunitycolleges,whichisbeginningtohavesevereconsequencesforourstudents.Forinstance,EastLosAngelesCollege,whichenrollsthemostLatinostudentsoutofanycommunitycollegeintheregion,bothintermsofthetotalnumberofstudentsandpercentageoftheoverallpopulation,hadthelowesttransferrate(8.6%)in2005.
California’sMasterPlanhasplacedtheresponsibilityofeducatingthemajorityofcollegestudentsinthestatetothemostfragmentedanddecentralizedofthethreesystems.Asitstands,theMasterPlanisbroken;itprovidesthemajorityoflow‐income,BlackandLatinocollegestudentswithaccessonlytoacollegeofferinglittlehopeforsuccess.Withcommunitycollegesinthestateprovidingstudentsdifferenttypesofopportunitiesfortransfer,differentlevelsofaccesstoaUCorCSU,astudent’ssuccesshasmoretodowithwhatcommunitycollegetheyattendandwheretheylivethananindividualstudent’sdrive.Withthemajorityoflow‐income,BlackandLatinostudentsattendingoverpopulatedcommunitycollegesthatofferlittlesupportorguidance,theopportunitiesthemajorityofstudentsinthestatehavetoasystemthatis“accessibleandaffordable,”nomatterhowexcellentitmaybe,isadistantanddismalreality.
Ourstateneedsvastsystemicreform;weofferthefollowingrecommendationsforfulfillingthepromiseofaccess,affordability,andexcellence:1. RecognizeandRewardSuccess.Itisalsoimportanttorecognizeandrewardcommunitycolleges
thattransferandgraduatelargenumbersofstudents,particularlystudentsfromunderrepresentedgroups,first‐generationcollegestudents,andthosematriculatingwhoneedremediation.Rewardingsuccessfulcommunitycollegeswillprovidecommunitycollegesanincentivetoimprovetheirtransferrateamongthestudentswhoaremostinneedofattention.Recognitionfortransferequitybyraceshouldnotonlybedefinedbytheaggregatetransferrate,butalsohavingmoreequaltransferratesacrossgroups.Existingstatesystemspayforenrollmentanddonotfinanceorrewardthehardworkofhelpingstudentsfromweakhighschoolstosucceedandtransfer.
2. StreamlinetheTransferProcess.Auniformarticulationagreementbetweenthe112community
collegesinthestatewouldbeonestepclosertowardsequalaccess.Currentlytherearemyriadpoliciesandinitiativesthatuseapiecemealapproachtomakesenseofthetransferprocessforstudentsseekingtransfertoawiderangeofinstitutions.Althoughtherearemechanismsinplacetohelpstudentsaccesstheinformationneededtomakesenseofthetransferprocess(suchaswwww.assists.org),itisstilloverwhelmingforastudenttokeeptrackofthedifferenttransferrequirementsneededforeachinstitution.InSeptember2010,GovernorSchwarzeneggersignedintolawaunifiedtransferprocessforcommunitycollegestudentsseekingtransfertoaCSU,althoughitisstilltooearlytomeasuretheeffectiveness.TheUCshouldalsoinstitutesuchaninitiative.
47G.Orfield,“MetropolitanSchoolDesegregation:ImpactsonMetropolitanSociety,”MinnesotaLawReview896(1995‐1996):836
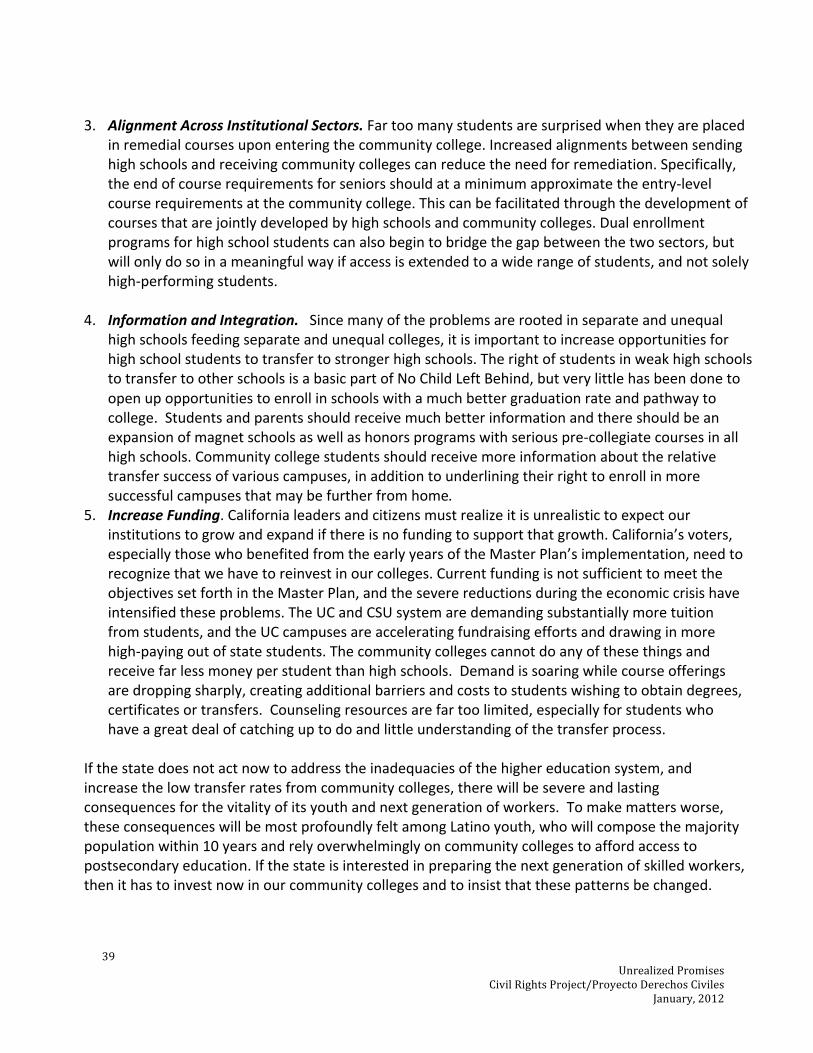
39 UnrealizedPromises
CivilRightsProject/ProyectoDerechosCivilesJanuary,2012
3. AlignmentAcrossInstitutionalSectors.Fartoomanystudentsaresurprisedwhentheyareplaced
inremedialcoursesuponenteringthecommunitycollege.Increasedalignmentsbetweensendinghighschoolsandreceivingcommunitycollegescanreducetheneedforremediation.Specifically,theendofcourserequirementsforseniorsshouldataminimumapproximatetheentry‐levelcourserequirementsatthecommunitycollege.Thiscanbefacilitatedthroughthedevelopmentofcoursesthatarejointlydevelopedbyhighschoolsandcommunitycolleges.Dualenrollmentprogramsforhighschoolstudentscanalsobegintobridgethegapbetweenthetwosectors,butwillonlydosoinameaningfulwayifaccessisextendedtoawiderangeofstudents,andnotsolelyhigh‐performingstudents.
4. InformationandIntegration.Sincemanyoftheproblemsarerootedinseparateandunequal
highschoolsfeedingseparateandunequalcolleges,itisimportanttoincreaseopportunitiesforhighschoolstudentstotransfertostrongerhighschools.TherightofstudentsinweakhighschoolstotransfertootherschoolsisabasicpartofNoChildLeftBehind,butverylittlehasbeendonetoopenupopportunitiestoenrollinschoolswithamuchbettergraduationrateandpathwaytocollege.Studentsandparentsshouldreceivemuchbetterinformationandthereshouldbeanexpansionofmagnetschoolsaswellashonorsprogramswithseriouspre‐collegiatecoursesinallhighschools.Communitycollegestudentsshouldreceivemoreinformationabouttherelativetransfersuccessofvariouscampuses,inadditiontounderliningtheirrighttoenrollinmoresuccessfulcampusesthatmaybefurtherfromhome.
5. IncreaseFunding.Californialeadersandcitizensmustrealizeitisunrealistictoexpectourinstitutionstogrowandexpandifthereisnofundingtosupportthatgrowth.California’svoters,especiallythosewhobenefitedfromtheearlyyearsoftheMasterPlan’simplementation,needtorecognizethatwehavetoreinvestinourcolleges.CurrentfundingisnotsufficienttomeettheobjectivessetforthintheMasterPlan,andtheseverereductionsduringtheeconomiccrisishaveintensifiedtheseproblems.TheUCandCSUsystemaredemandingsubstantiallymoretuitionfromstudents,andtheUCcampusesareacceleratingfundraisingeffortsanddrawinginmorehigh‐payingoutofstatestudents.Thecommunitycollegescannotdoanyofthesethingsandreceivefarlessmoneyperstudentthanhighschools.Demandissoaringwhilecourseofferingsaredroppingsharply,creatingadditionalbarriersandcoststostudentswishingtoobtaindegrees,certificatesortransfers.Counselingresourcesarefartoolimited,especiallyforstudentswhohaveagreatdealofcatchinguptodoandlittleunderstandingofthetransferprocess.
Ifthestatedoesnotactnowtoaddresstheinadequaciesofthehighereducationsystem,andincreasethelowtransferratesfromcommunitycolleges,therewillbesevereandlastingconsequencesforthevitalityofitsyouthandnextgenerationofworkers.Tomakemattersworse,theseconsequenceswillbemostprofoundlyfeltamongLatinoyouth,whowillcomposethemajoritypopulationwithin10yearsandrelyoverwhelminglyoncommunitycollegestoaffordaccesstopostsecondaryeducation.Ifthestateisinterestedinpreparingthenextgenerationofskilledworkers,thenithastoinvestnowinourcommunitycollegesandtoinsistthatthesepatternsbechanged.

40 UnrealizedPromises
CivilRightsProject/ProyectoDerechosCivilesJanuary,2012
Appendix
Table19.Six‐YearTransferRatesbyRace/Ethnicity,2003‐04Cohort
Two‐YearInstitution CountyBlack(%)
Asian(%)
Hispanic(%)
White(%) Total(%)
AntelopeValleyCollege LosAngeles 39 49 27 37 34BarstowCollege SanBernardino 33 50 27 35 34CerritosCollege LosAngeles 25 57 27 28 32ChaffeyCommunityCollege SanBernardino 32 48 27 38 34CitrusCollege LosAngeles 47 55 30 46 40CoastlineCommunityCollege Orange 29 64 39 37 49CollegeoftheCanyons LosAngeles 41 58 36 44 43CollegeOfTheDesert Riverside 52 32 28 33 30ComptonCommunityCollege LosAngeles 17 33 19 0 19CopperMountainCollege SanBernardino 5 0 14 17 15CraftonHillsCollege SanBernardino 25 40 26 41 38CuyamacaCollege SanDiego 42 40 29 38 36CypressCollege Orange 39 53 32 34 37EastLosAngelesCollege LosAngeles 28 47 26 39 32ElCaminoCollege LosAngeles 26 54 24 40 35FullertonCollege Orange 43 64 38 48 47GlendaleCommunityCollege LosAngeles 31 62 32 57 50GoldenWestCollege Orange 38 48 28 44 43GrossmontCollege SanDiego 34 51 32 42 40IrvineValleyCollege Orange 48 62 44 55 55LongBeachCityCollege LosAngeles 31 45 32 38 36LosAngelesCityCollege LosAngeles 25 48 25 36 33LosAngelesHarborCollege LosAngeles 29 49 26 41 41LosAngelesMissionCollege LosAngeles 29 59 32 34 35LosAngelesSouthwestCollege LosAngeles 28 67 28 100 29LosAngelesTrade‐TechnicalCollege LosAngeles 32 49 27 10 29LosAngelesValleyCollege LosAngeles 48 57 32 47 42MiraCostaCollege SanDiego 37 48 29 46 42MoorparkCollege Ventura 39 62 47 54 53Mt.SanAntonioCollege LosAngeles 44 58 30 41 40Mt.SanJacintoCollege Riverside 36 39 36 36 36OrangeCoastCollege Orange 30 57 37 49 48OxnardCollege Ventura 33 65 27 31 30PaloVerdeCollege Riverside 19 20 14 18 16PalomarCollege SanDiego 46 48 36 43 42PasadenaCityCollege LosAngeles 36 61 31 50 47PierceCollege LosAngeles 31 51 32 50 45RioHondoCollege LosAngeles 28 50 24 27 29
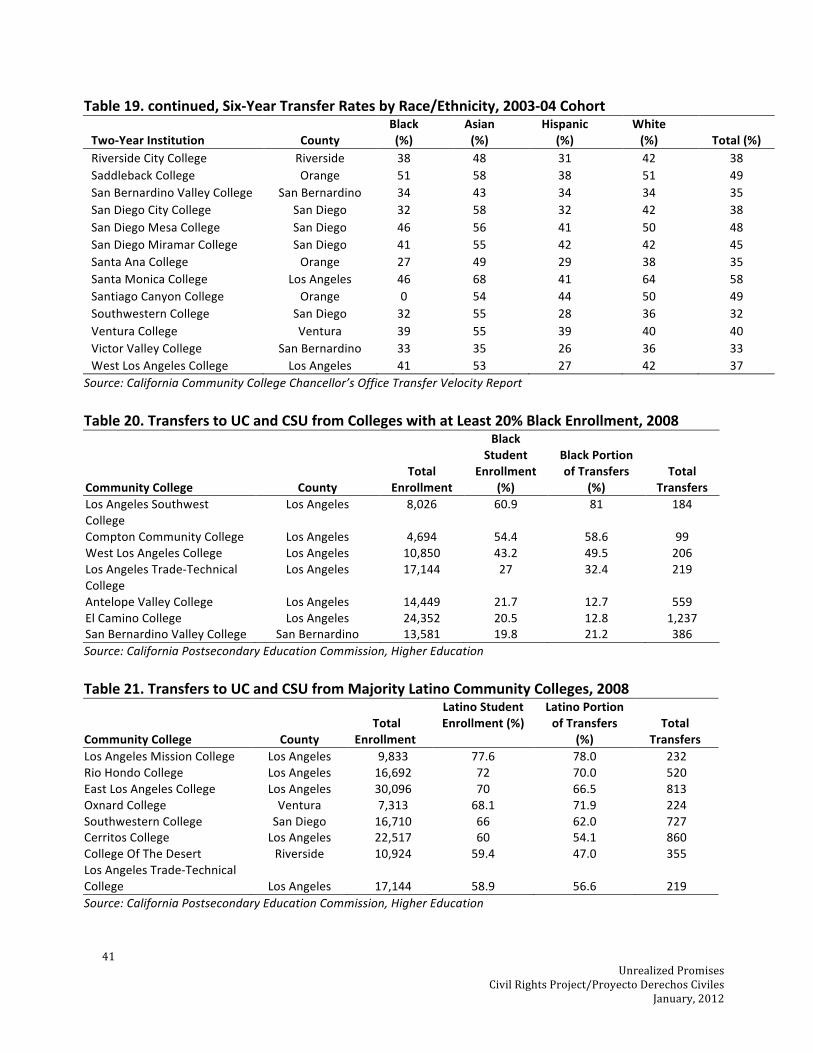
41 UnrealizedPromises
CivilRightsProject/ProyectoDerechosCivilesJanuary,2012
Table19.continued,Six‐YearTransferRatesbyRace/Ethnicity,2003‐04Cohort
Two‐YearInstitution CountyBlack(%)
Asian(%)
Hispanic(%)
White(%) Total(%)
RiversideCityCollege Riverside 38 48 31 42 38SaddlebackCollege Orange 51 58 38 51 49SanBernardinoValleyCollege SanBernardino 34 43 34 34 35SanDiegoCityCollege SanDiego 32 58 32 42 38SanDiegoMesaCollege SanDiego 46 56 41 50 48SanDiegoMiramarCollege SanDiego 41 55 42 42 45SantaAnaCollege Orange 27 49 29 38 35SantaMonicaCollege LosAngeles 46 68 41 64 58SantiagoCanyonCollege Orange 0 54 44 50 49SouthwesternCollege SanDiego 32 55 28 36 32VenturaCollege Ventura 39 55 39 40 40VictorValleyCollege SanBernardino 33 35 26 36 33WestLosAngelesCollege LosAngeles 41 53 27 42 37
Source:CaliforniaCommunityCollegeChancellor’sOfficeTransferVelocityReport
Table20.TransferstoUCandCSUfromCollegeswithatLeast20%BlackEnrollment,2008
CommunityCollege CountyTotal
Enrollment
BlackStudent
Enrollment(%)
BlackPortionofTransfers
(%)Total
TransfersLosAngelesSouthwestCollege
LosAngeles 8,026 60.9 81 184
ComptonCommunityCollege LosAngeles 4,694 54.4 58.6 99WestLosAngelesCollege LosAngeles 10,850 43.2 49.5 206LosAngelesTrade‐TechnicalCollege
LosAngeles 17,144 27 32.4 219
AntelopeValleyCollege LosAngeles 14,449 21.7 12.7 559ElCaminoCollege LosAngeles 24,352 20.5 12.8 1,237SanBernardinoValleyCollege SanBernardino 13,581 19.8 21.2 386Source:CaliforniaPostsecondaryEducationCommission,HigherEducation
Table21.TransferstoUCandCSUfromMajorityLatinoCommunityColleges,2008
CommunityCollege CountyTotalEnrollment
LatinoStudentEnrollment(%)
LatinoPortionofTransfers
(%)Total
TransfersLosAngelesMissionCollege LosAngeles 9,833 77.6 78.0 232RioHondoCollege LosAngeles 16,692 72 70.0 520EastLosAngelesCollege LosAngeles 30,096 70 66.5 813OxnardCollege Ventura 7,313 68.1 71.9 224SouthwesternCollege SanDiego 16,710 66 62.0 727CerritosCollege LosAngeles 22,517 60 54.1 860CollegeOfTheDesert Riverside 10,924 59.4 47.0 355LosAngelesTrade‐TechnicalCollege LosAngeles 17,144 58.9 56.6 219Source:CaliforniaPostsecondaryEducationCommission,HigherEducation

42 UnrealizedPromises
CivilRightsProject/ProyectoDerechosCivilesJanuary,2012
Table22.Racial/EthnicCompositionofSouthernCaliforniaCommunityCollegesbyCounty,2008
Asian(%)
Black(%) Filipino(%)
Latino(%)
White(%)
LOSANGELESCOUNTY AntelopeValleyCollege 3 22 3 33 37CerritosCollege 11 9 4 60 16CitrusCollege 7 6 3 47 34CollegeoftheCanyons 7 6 4 30 48ComptonCommunityCollege 3 54 2 36 3EastLosAngelesCollege 15 4 1 70 9ElCaminoCollege 14 20 5 36 22GlendaleCommunityCollege 9 2 5 24 59LongBeachCityCollege 12 15 4 37 28LosAngelesCityCollege 15 12 6 45 20LosAngelesHarborCollege 9 15 10 47 17LosAngelesMissionCollege 3 5 2 78 10LosAngelesSouthwestCollege 1 61 1 36 1LosAngelesTrade‐TechnicalCollege 5 27 2 59 6LosAngelesValleyCollege 7 6 4 45 32Mt.SanAntonioCollege 21 5 5 46 19PasadenaCityCollege 28 6 4 38 19PierceCollege 11 7 5 33 40RioHondoCollege 8 3 2 72 13SantaMonicaCollege 13 12 3 29 40WestLosAngelesCollege 7 43 2 31 15
LosAngelesAverage 13 12 4 45 26ORANGECOUNTY CoastlineCommunityCollege 25 10 2 17 43CypressCollege 21 6 8 32 31FullertonCollege 15 4 3 39 37GoldenWestCollege 30 2 3 20 42IrvineValleyCollege 29 2 3 12 51OrangeCoastCollege 24 2 2 22 47SaddlebackCollege 9 2 2 15 70SantaAnaCollege 11 3 1 47 34SantiagoCanyonCollege 6 2 2 42 43
OrangeCountyAverage 17 3 3 31 46RIVERSIDECOUNTY CollegeOfTheDesert 3 3 2 59 30Mt.SanJacintoCollege 4 8 4 33 48PaloVerdeCollege 5 10 2 30 52RiversideCityCollege 6 12 3 41 35
RiversideCountyAverage 5 10 3 43 39
43 UnrealizedPromises
CivilRightsProject/ProyectoDerechosCivilesJanuary,2012
Table22.continuedAsian(%)
Black(%) Filipino(%)
Latino(%)
White(%)
SANBERNARDINOCOUNTY BarstowCollege 4 14 2 28 49ChaffeyCommunityCollege 6 12 3 48 28CopperMountainCollege 3 7 3 17 67CraftonHillsCollege 4 5 2 28 59SanBernardinoValleyCollege 5 20 2 47 24VictorValleyCollege 3 13 2 35 45
SanBernardinoCountyAverage 5 14 2 42 37
SANDIEGOCOUNTY CuyamacaCollege 4 7 3 22 57GrossmontCollege 7 9 5 21 53MiraCostaCollege 6 5 3 26 57PalomarCollege 6 4 3 31 54SanDiegoCityCollege 8 13 5 36 33SanDiegoMesaCollege 17 7 6 22 45SanDiegoMiramarCollege 17 5 11 17 45SouthwesternCollege 3 5 12 66 13SanDiegoCountyAverage 9 7 6 32 46
VENTURACOUNTY MoorparkCollege 8 3 3 19 65OxnardCollege 4 4 5 68 18VenturaCollege 4 3 3 45 43
VenturaCountyAverage 6 3 3 40 48Source:CaliforniaPostsecondaryEducationCommission
Related Documents