UNLOCKING INVESTMENT IN INTANGIBLE ASSETS IN EUROPE EUROPEAN COMMISSION Anna Thum-Thysen, Peter Voigt, and Christoph Maier (DG ECFIN), Beñat Bilbao-Osorio and Diana Ognyanova (DG RTD) sels, 17 March 2017 06/07/2017, GPEARI workshop, Lisbon (PT)

Welcome message from author
This document is posted to help you gain knowledge. Please leave a comment to let me know what you think about it! Share it to your friends and learn new things together.
Transcript
UNLOCKING INVESTMENT IN INTANGIBLE ASSETS IN EUROPE
EUROPEAN COMMISSION
Anna Thum-Thysen, Peter Voigt, and Christoph Maier (DG ECFIN),
Beñat Bilbao-Osorio and Diana Ognyanova (DG RTD)
sels, 17 March 2017
06/07/2017, GPEARI workshop, Lisbon (PT)
Motivation
Context: Work on 3rd pillar of the Investment Plan for Europe
When looking at investments, do we need to differentiate between tangible vs. intangible assets? What are the specifics / links between asset types?
What are the driving forces / bottlenecks to investments?
Need for policy action with regard to intangibles?
Some need for clarification…
What are intangible assets? conceptual issues / definitions…
What about trend patterns / order of magnitude? data issues…
What is the role of intangibles for the economy? Why should we care?
Structure of the presentation
I. What are intangible assets?
II. What makes intangibles special?
III. Order of magnitude and trend patterns: stylized facts
IV. Empirical analyses
V.1 Growth accounting including intangible assets
V.2 Intangibles and TFP growth
V.3 Drivers and barriers to investment
V. Conclusions: findings and policy messages
I. What are intangible assets?
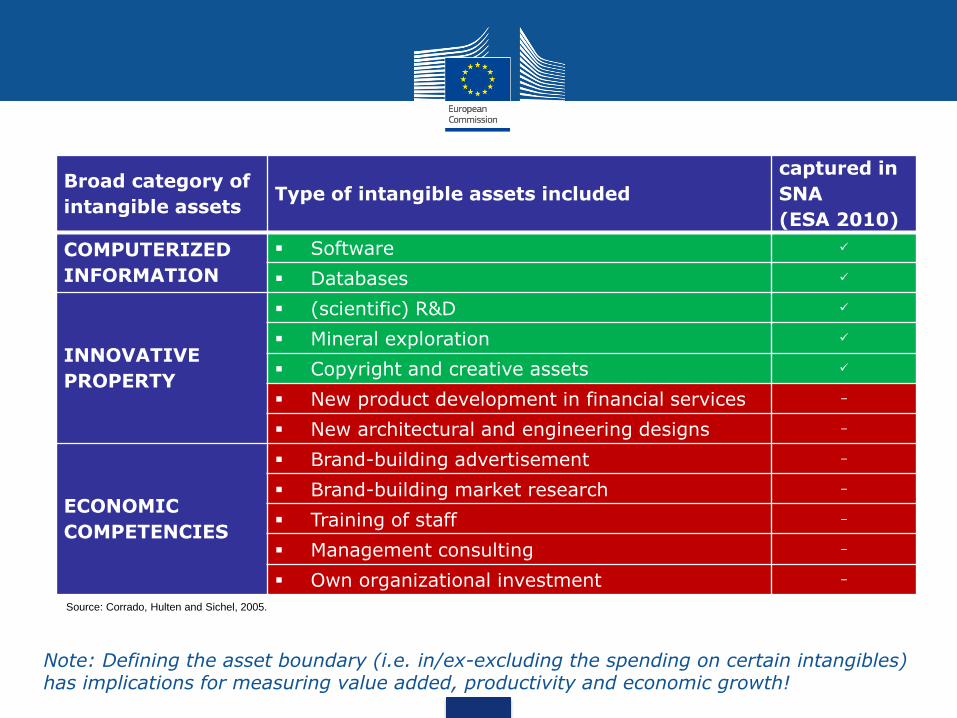
Broad category of
intangible assets Type of intangible assets included
captured in
SNA
(ESA 2010)
COMPUTERIZED
INFORMATION
Software
Databases
INNOVATIVE
PROPERTY
(scientific) R&D
Mineral exploration
Copyright and creative assets
New product development in financial services –
New architectural and engineering designs –
ECONOMIC
COMPETENCIES
Brand-building advertisement –
Brand-building market research –
Training of staff –
Management consulting –
Own organizational investment –
Source: Corrado, Hulten and Sichel, 2005.
Note: Defining the asset boundary (i.e. in/ex-excluding the spending on certain intangibles) has implications for measuring value added, productivity and economic growth!
II. What makes intangibles special?
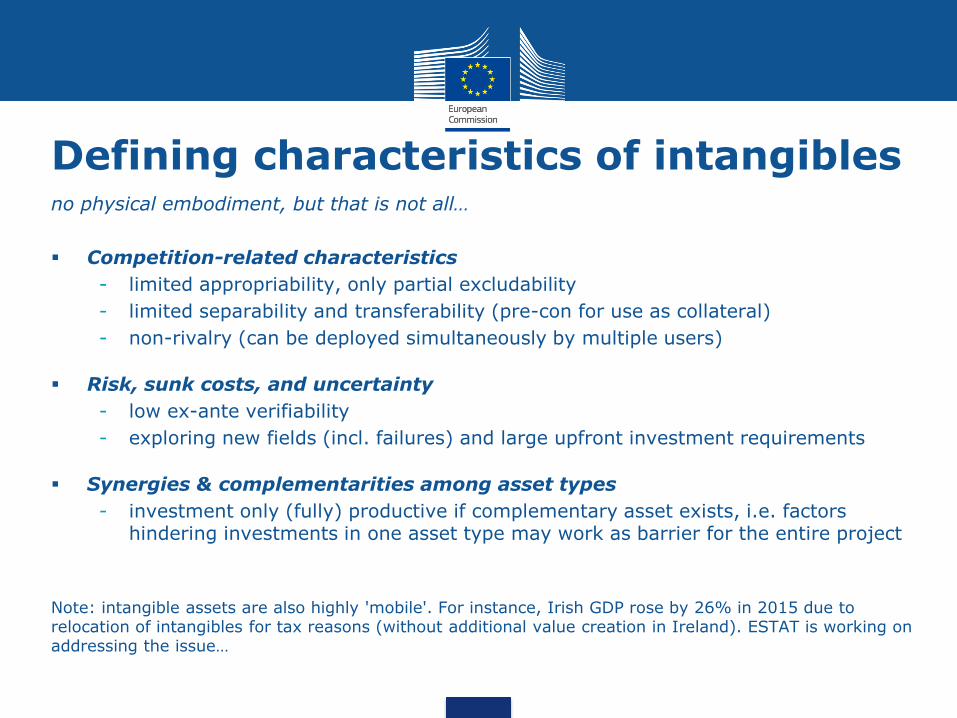
no physical embodiment, but that is not all…
Competition-related characteristics
- limited appropriability, only partial excludability
- limited separability and transferability (pre-con for use as collateral)
- non-rivalry (can be deployed simultaneously by multiple users)
Risk, sunk costs, and uncertainty
- low ex-ante verifiability
- exploring new fields (incl. failures) and large upfront investment requirements
Synergies & complementarities among asset types
- investment only (fully) productive if complementary asset exists, i.e. factors hindering investments in one asset type may work as barrier for the entire project
Note: intangible assets are also highly 'mobile'. For instance, Irish GDP rose by 26% in 2015 due to relocation of intangibles for tax reasons (without additional value creation in Ireland). ESTAT is working on addressing the issue…
Defining characteristics of intangibles
III. Taking a closer look at investments in intangible assets:
some stylized facts…
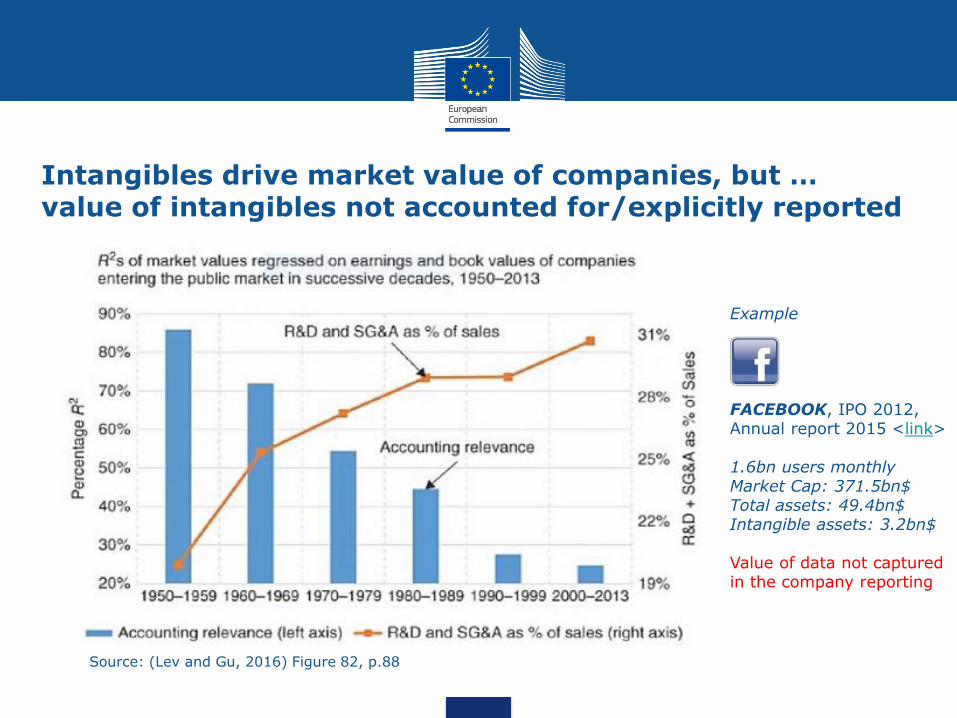
Source: (Lev and Gu, 2016) Figure 82, p.88
Intangibles drive market value of companies, but … value of intangibles not accounted for/explicitly reported
Example FACEBOOK, IPO 2012, Annual report 2015 <link> 1.6bn users monthly Market Cap: 371.5bn$ Total assets: 49.4bn$ Intangible assets: 3.2bn$ Value of data not captured in the company reporting
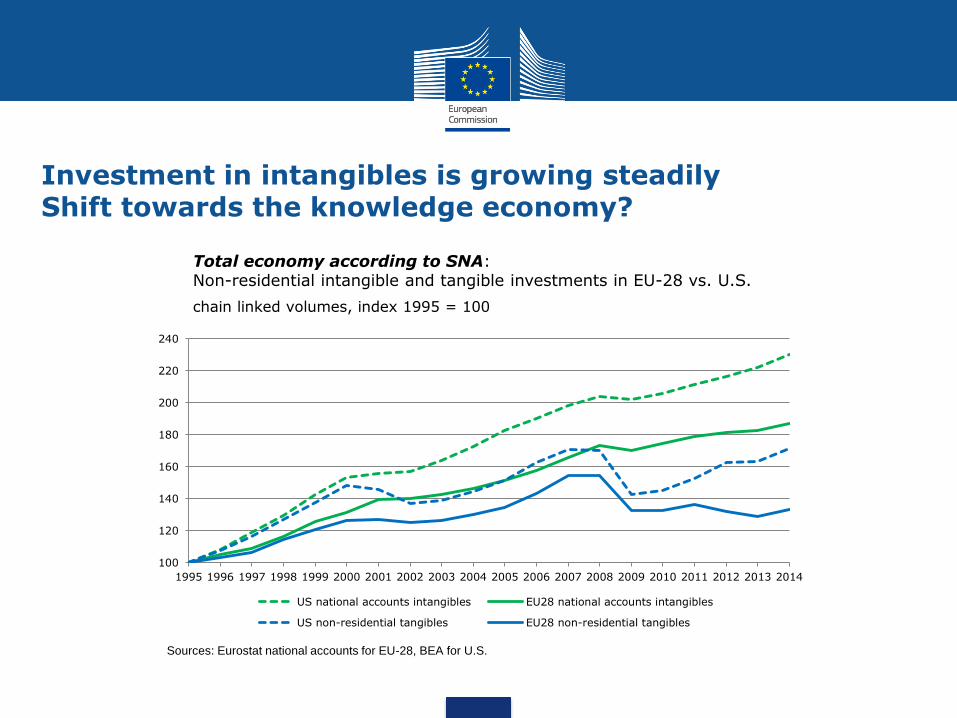
Total economy according to SNA: Non-residential intangible and tangible investments in EU-28 vs. U.S.
chain linked volumes, index 1995 = 100
Sources: Eurostat national accounts for EU-28, BEA for U.S.
100
120
140
160
180
200
220
240
1995 1996 1997 1998 1999 2000 2001 2002 2003 2004 2005 2006 2007 2008 2009 2010 2011 2012 2013 2014
US national accounts intangibles EU28 national accounts intangibles
US non-residential tangibles EU28 non-residential tangibles
Investment in intangibles is growing steadily Shift towards the knowledge economy?
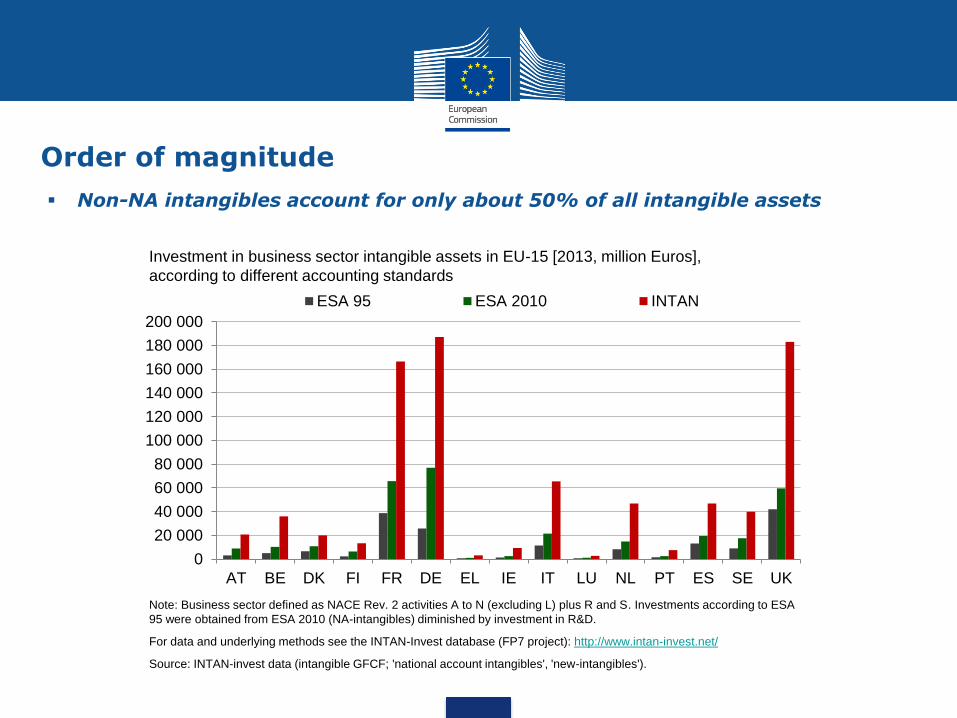
Investment in business sector intangible assets in EU-15 [2013, million Euros],
according to different accounting standards
Note: Business sector defined as NACE Rev. 2 activities A to N (excluding L) plus R and S. Investments according to ESA
95 were obtained from ESA 2010 (NA-intangibles) diminished by investment in R&D.
For data and underlying methods see the INTAN-Invest database (FP7 project): http://www.intan-invest.net/
Source: INTAN-invest data (intangible GFCF; 'national account intangibles', 'new-intangibles').
0
20 000
40 000
60 000
80 000
100 000
120 000
140 000
160 000
180 000
200 000
AT BE DK FI FR DE EL IE IT LU NL PT ES SE UK
ESA 95 ESA 2010 INTAN
Non-NA intangibles account for only about 50% of all intangible assets
Order of magnitude
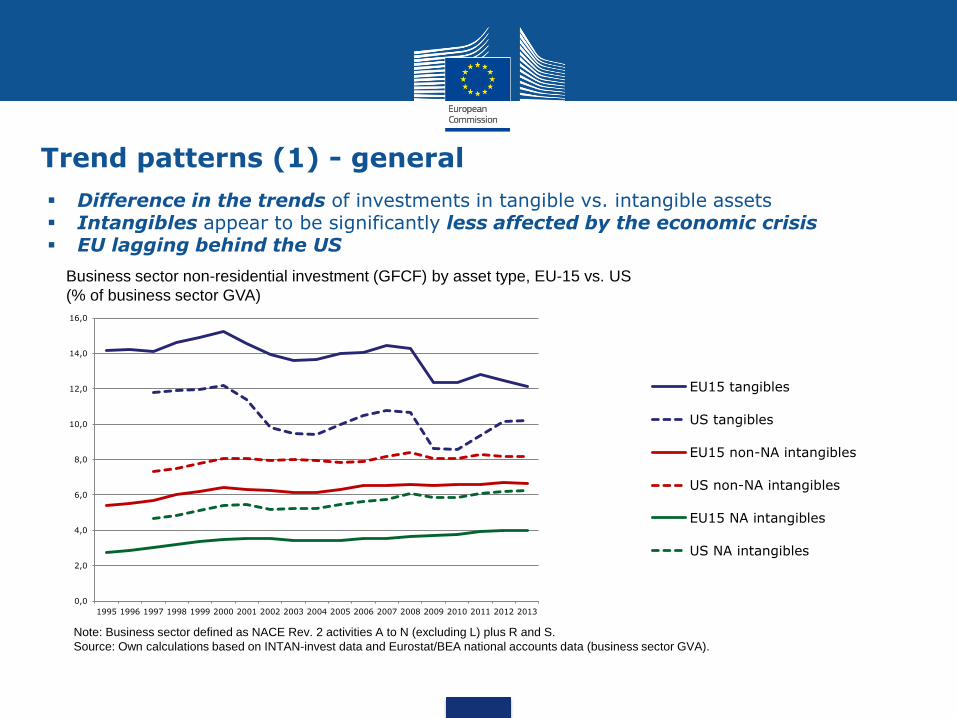
Note: Business sector defined as NACE Rev. 2 activities A to N (excluding L) plus R and S.
Source: Own calculations based on INTAN-invest data and Eurostat/BEA national accounts data (business sector GVA).
Business sector non-residential investment (GFCF) by asset type, EU-15 vs. US
(% of business sector GVA)
0,0
2,0
4,0
6,0
8,0
10,0
12,0
14,0
16,0
1995 1996 1997 1998 1999 2000 2001 2002 2003 2004 2005 2006 2007 2008 2009 2010 2011 2012 2013
EU15 tangibles
US tangibles
EU15 non-NA intangibles
US non-NA intangibles
EU15 NA intangibles
US NA intangibles
Difference in the trends of investments in tangible vs. intangible assets Intangibles appear to be significantly less affected by the economic crisis EU lagging behind the US
Trend patterns (1) - general
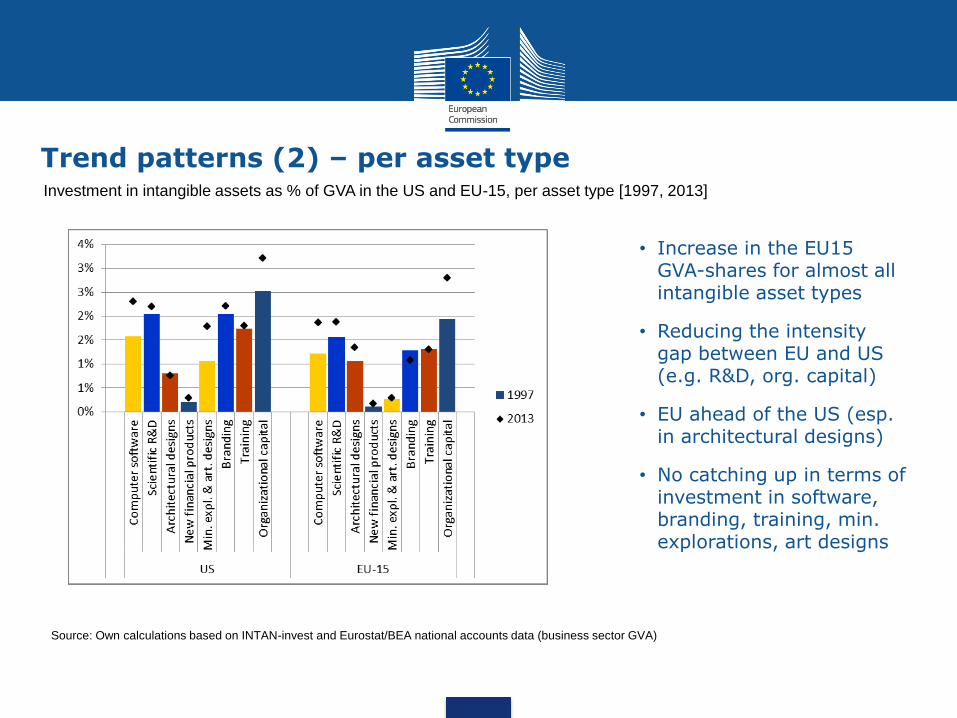
Investment in intangible assets as % of GVA in the US and EU-15, per asset type [1997, 2013]
Source: Own calculations based on INTAN-invest and Eurostat/BEA national accounts data (business sector GVA)
Trend patterns (2) – per asset type
• Increase in the EU15 GVA-shares for almost all intangible asset types
• Reducing the intensity gap between EU and US (e.g. R&D, org. capital)
• EU ahead of the US (esp. in architectural designs)
• No catching up in terms of investment in software, branding, training, min. explorations, art designs
IV. Empirical Analyses
1) Do intangibles contribute to economic growth? Growth accounting controlling for intangibles
2) Are intangibles linked with productivity? Regression analysis of intangibles and TFP growth
3) How can we unlock investment in intangibles? Investment regressions to test the role of drivers and barriers to investment in intangibles
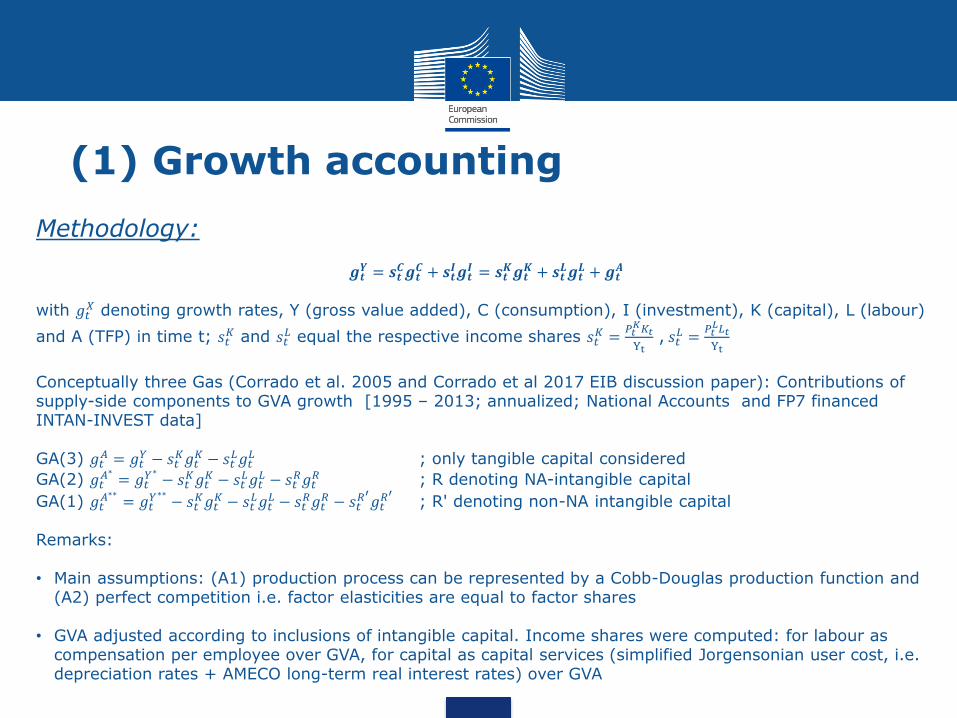
(1) Growth accounting
Methodology:
𝒈𝒕𝒀 = 𝒔𝒕
𝑪𝒈𝒕𝑪 + 𝒔𝒕
𝑰𝒈𝒕𝑰 = 𝒔𝒕
𝑲𝒈𝒕𝑲 + 𝒔𝒕
𝑳𝒈𝒕𝑳 + 𝒈𝒕
𝑨 with 𝑔𝑡
𝑋 denoting growth rates, Y (gross value added), C (consumption), I (investment), K (capital), L (labour)
and A (TFP) in time t; 𝑠𝑡𝐾 and 𝑠𝑡
𝐿 equal the respective income shares 𝑠𝑡𝐾 =𝑃𝑡𝐾𝐾𝑡
Yt , 𝑠𝑡𝐿 =𝑃𝑡𝐿𝐿𝑡
Yt
Conceptually three Gas (Corrado et al. 2005 and Corrado et al 2017 EIB discussion paper): Contributions of supply-side components to GVA growth [1995 – 2013; annualized; National Accounts and FP7 financed INTAN-INVEST data] GA(3) 𝑔𝑡
𝐴 = 𝑔𝑡𝑌 − 𝑠𝑡
𝐾𝑔𝑡𝐾 − 𝑠𝑡
𝐿𝑔𝑡𝐿 ; only tangible capital considered
GA(2) 𝑔𝑡𝐴∗ = 𝑔𝑡
𝑌∗ − 𝑠𝑡𝐾𝑔𝑡𝐾 − 𝑠𝑡
𝐿𝑔𝑡𝐿 − 𝑠𝑡
𝑅𝑔𝑡𝑅 ; R denoting NA-intangible capital
GA(1) 𝑔𝑡𝐴∗∗ = 𝑔𝑡
𝑌∗∗ − 𝑠𝑡𝐾𝑔𝑡𝐾 − 𝑠𝑡
𝐿𝑔𝑡𝐿 − 𝑠𝑡
𝑅𝑔𝑡𝑅 − 𝑠𝑡
𝑅′𝑔𝑡𝑅′ ; R' denoting non-NA intangible capital
Remarks: • Main assumptions: (A1) production process can be represented by a Cobb-Douglas production function and
(A2) perfect competition i.e. factor elasticities are equal to factor shares • GVA adjusted according to inclusions of intangible capital. Income shares were computed: for labour as
compensation per employee over GVA, for capital as capital services (simplified Jorgensonian user cost, i.e. depreciation rates + AMECO long-term real interest rates) over GVA
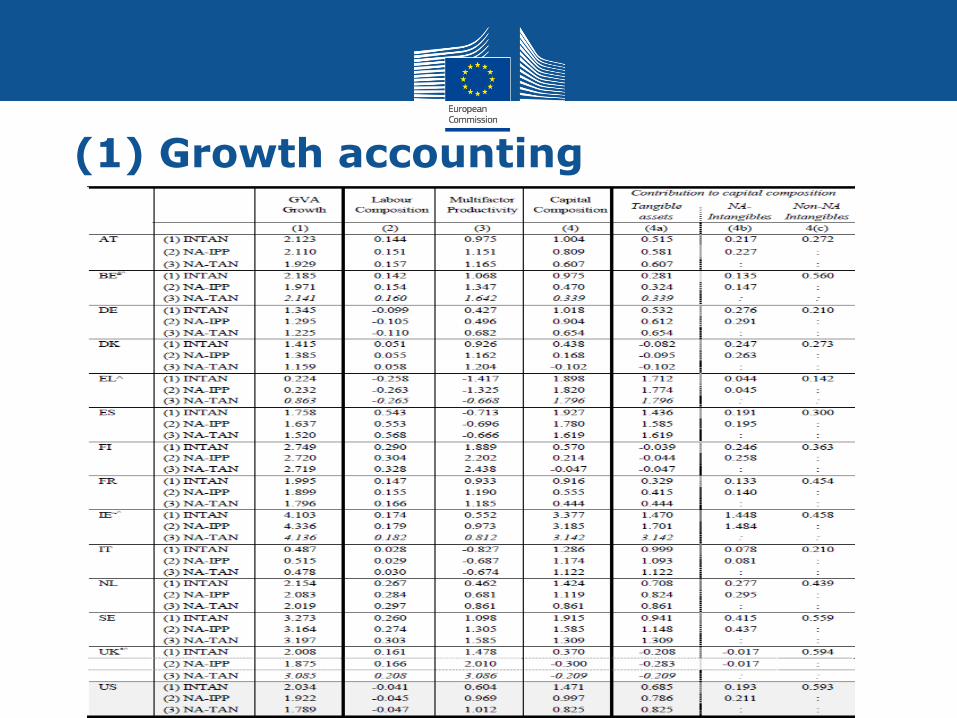
(1) Growth accounting
(1) Growth accounting
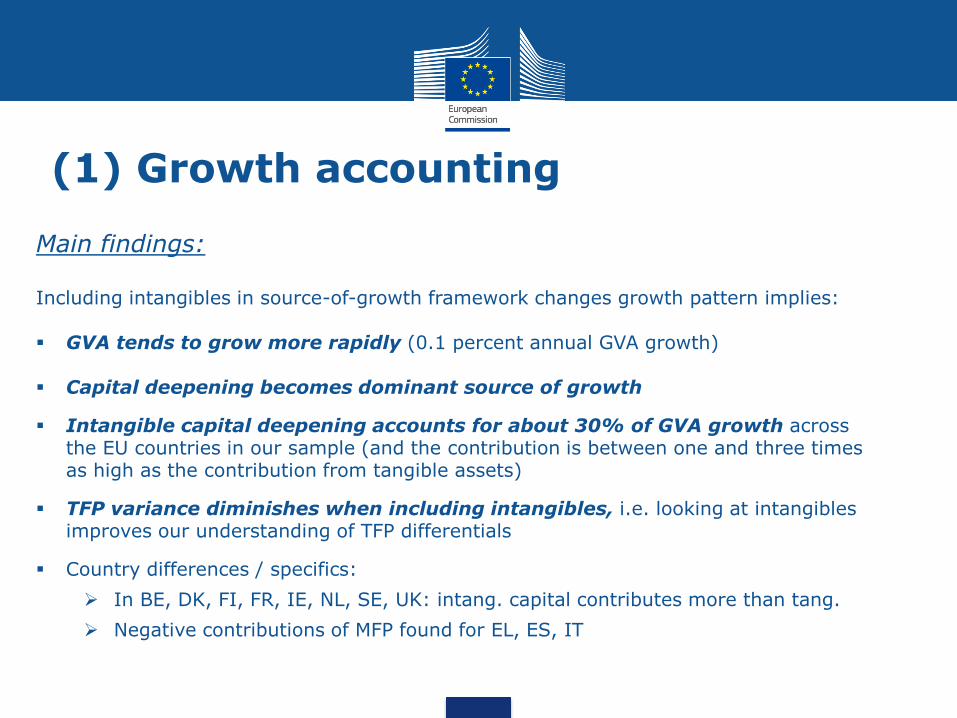
Main findings: Including intangibles in source-of-growth framework changes growth pattern implies:
GVA tends to grow more rapidly (0.1 percent annual GVA growth)
Capital deepening becomes dominant source of growth
Intangible capital deepening accounts for about 30% of GVA growth across the EU countries in our sample (and the contribution is between one and three times as high as the contribution from tangible assets)
TFP variance diminishes when including intangibles, i.e. looking at intangibles improves our understanding of TFP differentials
Country differences / specifics:
In BE, DK, FI, FR, IE, NL, SE, UK: intang. capital contributes more than tang.
Negative contributions of MFP found for EL, ES, IT
(2) Intangibles and TFP growth
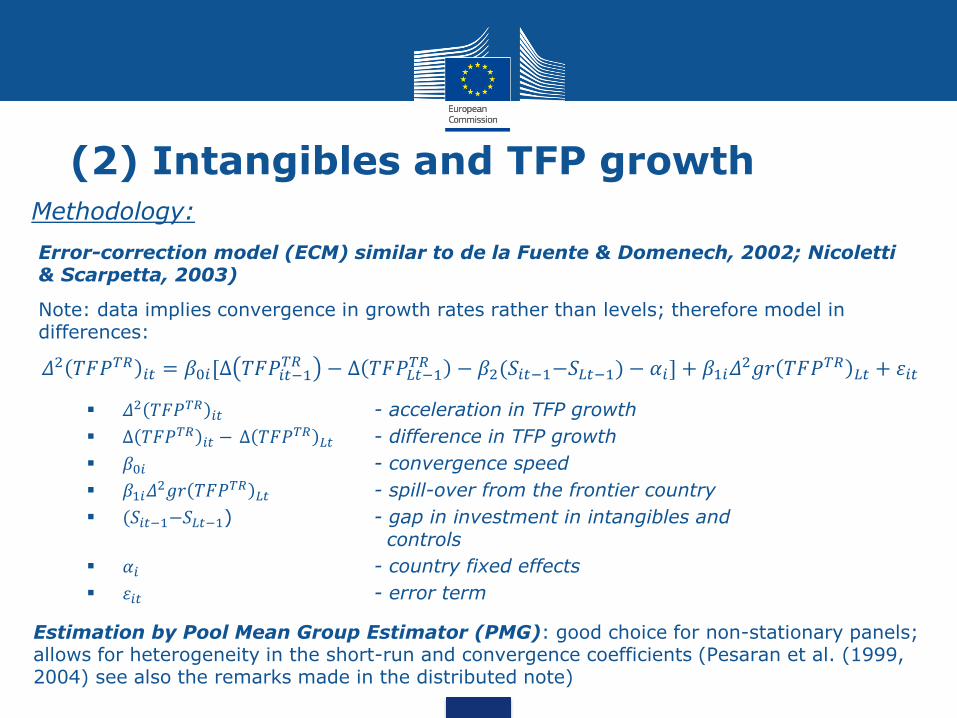
𝛥2 𝑇𝐹𝑃𝑇𝑅 𝑖𝑡 - acceleration in TFP growth
Δ 𝑇𝐹𝑃𝑇𝑅 𝑖𝑡 − Δ 𝑇𝐹𝑃𝑇𝑅𝐿𝑡 - difference in TFP growth
𝛽0𝑖 - convergence speed
𝛽1𝑖𝛥2𝑔𝑟 𝑇𝐹𝑃𝑇𝑅 𝐿𝑡 - spill-over from the frontier country
(𝑆𝑖𝑡−1−𝑆𝐿𝑡−1) - gap in investment in intangibles and controls
𝛼𝑖 - country fixed effects
휀𝑖𝑡 - error term
𝛥2 𝑇𝐹𝑃𝑇𝑅 𝑖𝑡 = 𝛽0𝑖[Δ 𝑇𝐹𝑃𝑖𝑡−1𝑇𝑅 − Δ 𝑇𝐹𝑃𝐿𝑡−1
𝑇𝑅 − 𝛽2(𝑆𝑖𝑡−1−𝑆𝐿𝑡−1) − 𝛼𝑖] + 𝛽1𝑖𝛥2𝑔𝑟 𝑇𝐹𝑃𝑇𝑅 𝐿𝑡 + 휀𝑖𝑡
Methodology:
Estimation by Pool Mean Group Estimator (PMG): good choice for non-stationary panels; allows for heterogeneity in the short-run and convergence coefficients (Pesaran et al. (1999, 2004) see also the remarks made in the distributed note)
Error-correction model (ECM) similar to de la Fuente & Domenech, 2002; Nicoletti & Scarpetta, 2003)
Note: data implies convergence in growth rates rather than levels; therefore model in differences:
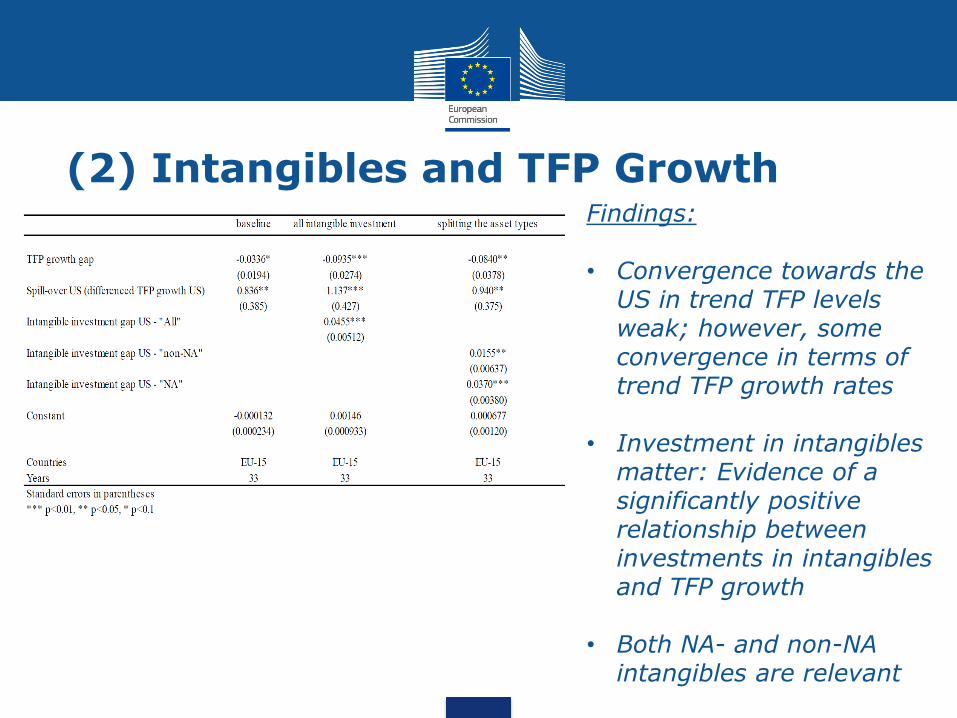
(2) Intangibles and TFP Growth Findings: • Convergence towards the
US in trend TFP levels weak; however, some convergence in terms of trend TFP growth rates
• Investment in intangibles matter: Evidence of a significantly positive relationship between investments in intangibles and TFP growth
• Both NA- and non-NA intangibles are relevant
(3) Drivers and barriers to investment We derived the following set of drivers and barriers from discussing the specific economic characteristics of intangibles
(1)competition-related characteristics, (2) risk and uncertainty, (3) synergies and complementarities
=>
1) Regulatory framework conditions: PMR, EPL, Doing Business Indicators [as intangibles are characterised by higher uncertainty and competition-related characteristics may lead to underinvestment]
2) Financial conditions: interest rates, debt-to-equity ratios,… [as intangibles are characterised by higher uncertainty]
3) Availability of human capital: high skilled, skill mismatch indicators,.. [as intangibles are likely to have synergies with other forms of capital in particular human capital]
4) Direct public intervention: R&D spending, private-public co-publications,...[competition related characteristics may lead to market failures]
5) Macro-economic conditions: proxied by accelerator term [as intangibles are characterised by higher uncertainty, the macro-economic environment may have a special impact]
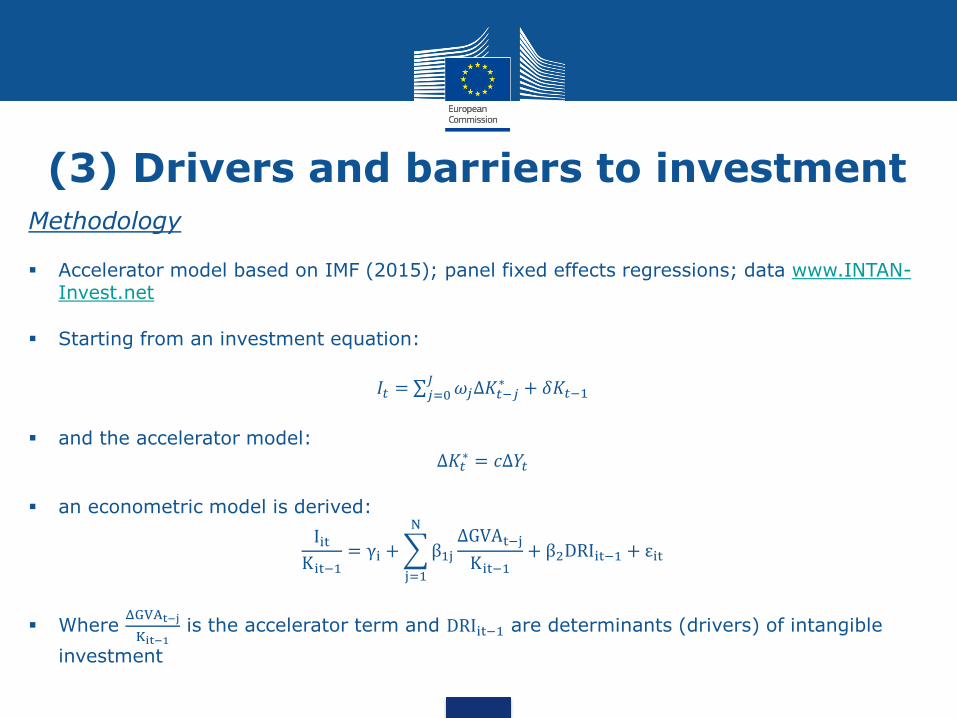
Methodology
Accelerator model based on IMF (2015); panel fixed effects regressions; data www.INTAN-Invest.net
Starting from an investment equation:
𝐼𝑡 = 𝜔𝑗Δ𝐾𝑡−𝑗∗ + 𝛿𝐾𝑡−1
𝐽𝑗=0
and the accelerator model: Δ𝐾𝑡∗ = 𝑐Δ𝑌𝑡
an econometric model is derived:
IitKit−1= γi + β1j
ΔGVAt−j
Kit−1
N
j=1
+ β2DRIit−1 + εit
Where ΔGVAt−j
Kit−1 is the accelerator term and DRIit−1 are determinants (drivers) of intangible
investment
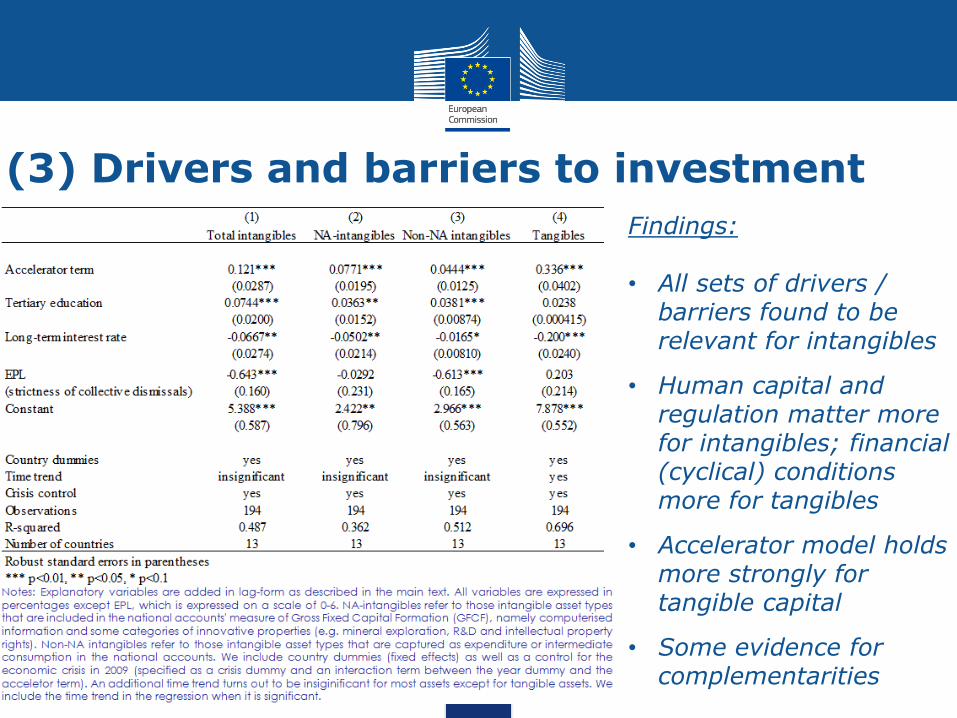
(3) Drivers and barriers to investment
(3) Drivers and barriers to investment
Findings: • All sets of drivers /
barriers found to be relevant for intangibles
• Human capital and regulation matter more for intangibles; financial (cyclical) conditions more for tangibles
• Accelerator model holds more strongly for tangible capital
• Some evidence for complementarities
V. What can we conclude from our analysis and which policy messages
can be drawn?
Empirical findings Investment in intangible assets tend to be underestimated. SNA captures only about
50% of the total investment in intangibles and also corporate financial reports provide only limited information => consequences for productivity and growth estimates!
Investment in industrialized countries tends to shift towards more intangible/knowledge-based capital as comparably high growth rates of investment in intangible assets show. However, the EU is lagging behind the US.
Trends in investment in intangible assets have been rather stable even during the recent crisis which may imply that the knowledge economy is a strong driver for investment in intangibles.
Intangibles are crucial for economic growth and productivity. In the EU-15, the contribution of total intangible assets to output growth is between one and three times as high as the contribution from tangible assets. Moreover, investment in intangible is positively associated with TFP growth.
Tangible and intangible assets appear to be affected differently by some key drivers and barriers: human capital, public investments in R&D and higher education and regulation matter more for intangible assets, while financial conditions tend to have a stronger effect on tangible investment.
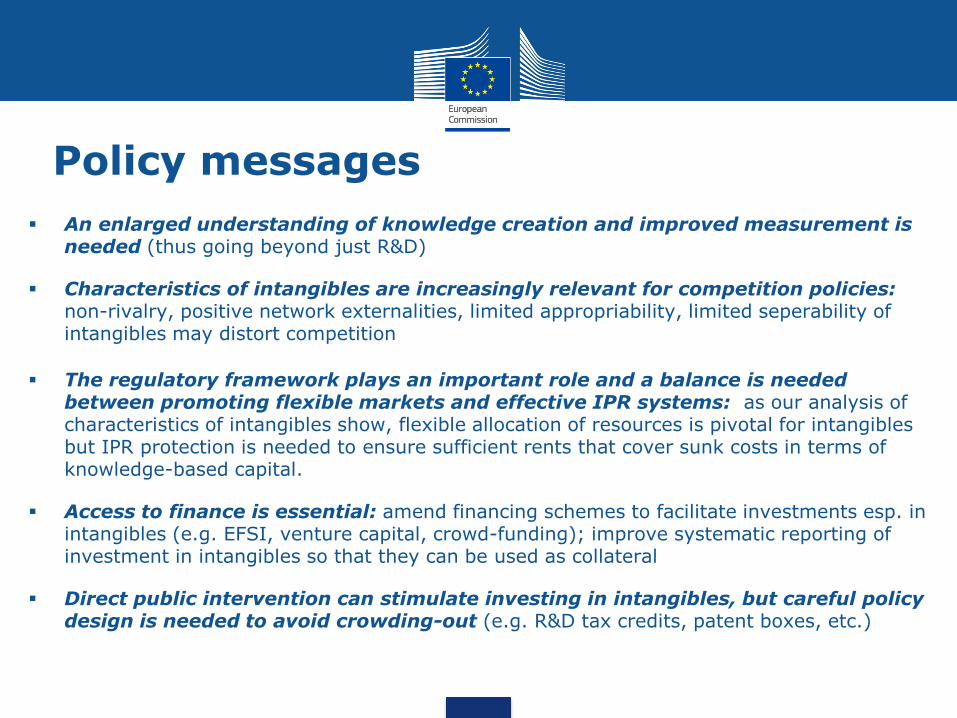
Policy messages
An enlarged understanding of knowledge creation and improved measurement is needed (thus going beyond just R&D)
Characteristics of intangibles are increasingly relevant for competition policies: non-rivalry, positive network externalities, limited appropriability, limited seperability of intangibles may distort competition
The regulatory framework plays an important role and a balance is needed between promoting flexible markets and effective IPR systems: as our analysis of characteristics of intangibles show, flexible allocation of resources is pivotal for intangibles but IPR protection is needed to ensure sufficient rents that cover sunk costs in terms of knowledge-based capital.
Access to finance is essential: amend financing schemes to facilitate investments esp. in intangibles (e.g. EFSI, venture capital, crowd-funding); improve systematic reporting of investment in intangibles so that they can be used as collateral
Direct public intervention can stimulate investing in intangibles, but careful policy design is needed to avoid crowding-out (e.g. R&D tax credits, patent boxes, etc.)
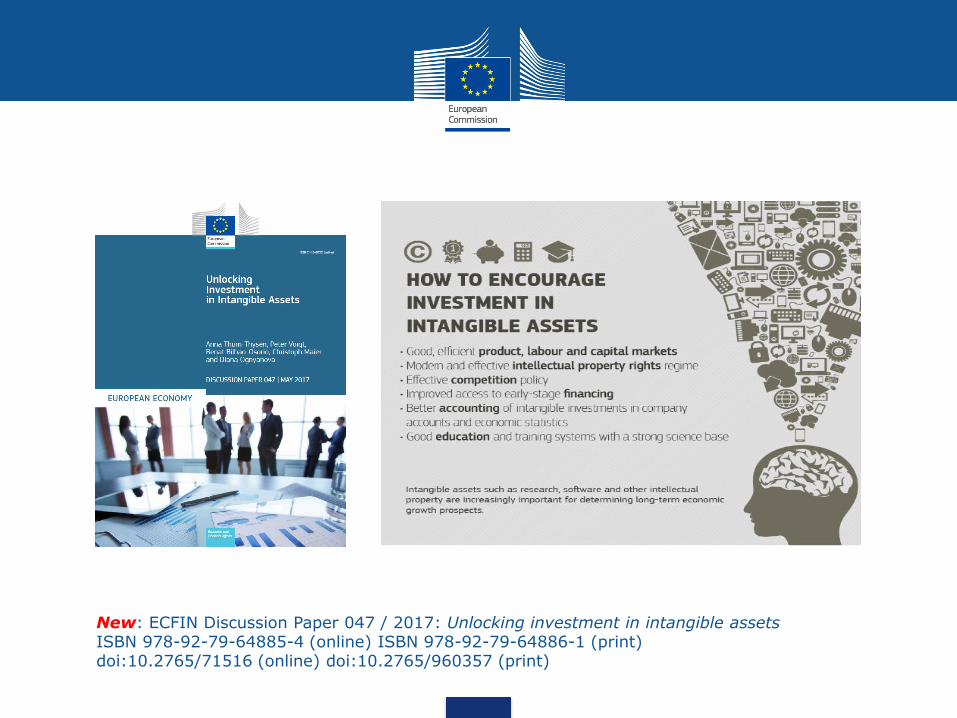
New: ECFIN Discussion Paper 047 / 2017: Unlocking investment in intangible assets ISBN 978-92-79-64885-4 (online) ISBN 978-92-79-64886-1 (print) doi:10.2765/71516 (online) doi:10.2765/960357 (print)
Related Documents


![INTANGIBLE VALUE –FACT OR FICTION - AI Home | … · [IAS 38.8] 3. INTANGIBLE VALUE –FACT OR FICTION ... 2.36 INTANGIBLE PROPERTY (INTANGIBLE ASSETS): Non-physical assets, …](https://static.cupdf.com/doc/110x72/5af0812f7f8b9ac2468e1bc2/intangible-value-fact-or-fiction-ai-home-ias-388-3-intangible-value.jpg)