Unleashing the Supply Chain Assessing the economic impact of a US crude oil free trade policy An IHS Energy / IHS Economics report March 2015 Executive summary

Welcome message from author
This document is posted to help you gain knowledge. Please leave a comment to let me know what you think about it! Share it to your friends and learn new things together.
Transcript
Unleashing the Supply ChainAssessing the economic impact of a US crude oil free trade policy
An IHS Energy / IHS Economics report
March 2015
Executive summary

© 2015 IHS ii March 2015
IHS Energy and IHS Economics | Unleashing the Supply Chain
About IHS (ihs.com)IHS (NYSE: IHS) is the leading source of information, insight and analytics in critical areas that shape today’s business landscape. Businesses and governments in more than 165 countries around the globe rely on the comprehensive content, expert independent analysis and fl exible delivery methods of IHS to make high-impact decisions and develop strategies with speed and confi dence. IHS has been in business since 1959 and became a publicly traded company on the New York Stock Exchange in 2005. Headquartered in Englewood, Colorado, USA, IHS is committed to sustainable, profi table growth and employs approximately 8,000 people in 31 countries around the world.
For more information, contact:Kurt Barrow
Vice President, Oil Markets & [email protected]
Brendan O’NeilManaging Director, Economics & Country Risk
For press information, contact:Je� Marn
Senior Manager, Public Relationsje� [email protected]
Jim DorseySenior Manager, Media Relations
IHS Energy and IHS EconomicsCopyright notice and legal disclaimer© 2015 IHS. No portion of this report may be reproduced, reused, or otherwise distributed in any form without prior written consent, with the exception of any internal client distribution as may be permitted in the license agreement between client and IHS. Content reproduced or redistributed with IHS permission must display IHS legal notices and attributions of authorship. The information contained herein is from sources considered reliable but its accuracy and completeness are not warranted, nor are the opinions and analyses which are based upon it, and to the extent permitted by law, IHS shall not be liable for any errors or omissions or any loss, damage or expense incurred by reliance on information or any statement contained herein. IHS and the IHS logo are trademarks of IHS. For more information, please contact IHS at www.ihs.com/CustomerCare.
© 2015 IHS iii March 2015
IHS Energy and IHS Economics | Unleashing the Supply Chain
Contents
Key fi ndings 1
Executive summary 3What is the supply chain? 3Great revival in US crude production and uncertain future 6The export policy problem 6
– Oil price decline 7 – BIS clarifi cation for condensate processing 8
Free trade impacts on the supply chain 8Broad benefi ts 10

© 2015 IHS iv March 2015
IHS Energy and IHS Economics | Unleashing the Supply Chain
© 2015 IHS v March 2015
IHS Energy and IHS Economics | Unleashing the Supply Chain
Project chairman• Daniel Yergin, Vice Chairman, IHS
Project directors• Kurt Barrow, Vice President, IHS Energy
• Mack P. Brothers, Vice President, IHS Economics & Country Risk
• Blake Eskew, Vice President, IHS Energy
Principal authors• Mohsen Bonakdarpour, Managing Director, IHS Economics & Country Risk
• James Fallon, Managing Director, IHS Energy
• Brendan O’Neil, Managing Director, IHS Economics & Country Risk
Senior advisors• Rick Bott, IHS External Senior Advisor
• Jim Burkhard, Vice President, IHS Energy
• Jamey Rosenfi eld, Senior Vice President, IHS
ContributorsLesle Alvarado, Tabitha Bailey, Sandi Barber, Chris Dowling, Sarah Frost, Richard Fullenbaum, Chris Hansen, Shawn Gallagher, Vardan Genanyan, Laura Hand, Tom Jackson, Mike Kelly, Travis Kennison, Leslie Levesque, Rita Linets, Je� Marn, Duyen Phan, Keri Semesnyei, Curtis Smith, Mihaela Solcan, Victor Solis, Patrick Thomson, Mfon Udo-Imeh, and Ron Whitfi eld.
Additional resourcesAppendices are available at www.ihs.com/crudeoilsupplychain. Additionally, the results included in this study are available on an interactive website that provides access to detailed data for the supply chain and congressional districts which can also be accessed through this website.
Study purposeBuilding on prior work assessing the industry and macroeconomic impact of changing US policy to allow exports of US crude oil, this study examines the impact on an intricate and interdependent supply chain that supports the oil industry and has made the scale-up of tight oil production possible. The analysis considers 60 separate supply chain industries and provides granular impact analysis at the congressional district level to fully understand the economic and job growth impact across the nation.
This report draws on the multidisciplinary expertise of IHS, including upstream, downstream and macroeconomic teams across IHS Energy and IHS Economics. The study has been supported by a group of sponsors in numerous industries. The analysis and conclusions contained in this report are entirely those of IHS Inc., which is solely responsible for the contents herein.
© 2015 IHS vi March 2015
IHS Energy and IHS Economics | Unleashing the Supply Chain
Related reportsThe “Great Revival” in US natural gas and crude oil production has caused signifi cant market and economic shifts. IHS has provided continuing analysis of these developments, their impact on global oil markets, and their infl uence on the US economy and US competitiveness. Some of the current studies include:
$30 or $130? Scenarios for the Global Oil Market to 2020
These are momentous times for the oil market. We are in a world without OPEC—at least as we knew it. Companies and investors face a heightened degree of uncertainty about the future of oil supply, price, and demand. IHS addresses the uncertainty through a new study, $30 or $130? Scenarios for the Global Oil Market to 2020. IHS Scenarios provide a coherent, dynamic framework to discuss several potential futures for the oil market and to test decisions. Through interactive workshops, study participants participate in the scenario development and helping identify key supply, demand, and geopolitical drivers that will shape the oil market to 2020. Decision making is more robust when analysis takes into account more than one view of the future.
For more information, contact Danut Cristian Muresan, [email protected].
Oil: The Great Defl ation
Through this framework series, IHS is providing insights and decision support to clients as they assess the impact and implications of the low oil price. IHS’s unique breadth and depth of expertise spans the energy value chain and into adjacent industries and overall economies providing a fully integrated and objective perspective. The series provide a framework for more detailed discussions and consulting on a wide range of topics including: the tight oil and global production response, capital programs, cost defl ation, storage and fi nancial market infl uences, company strategies, demand response and asset transactions. The series is delivered through IHS Connect and a webinar series.
For more information, contact Danut Cristian Muresan, [email protected].
America’s New Energy Future
America’s New Energy Future: The Unconventional Oil and Gas Revolution and the US Economy is a three-volume series based on IHS analyses of each shale gas and tight oil play. It calculates the investment of capital, labor and other inputs required to produce these hydrocarbons. The economic contributions of these investments are then calculated using the proprietary IHS economic contribution assessment and macroeconomic models to generate the contributions to employment, GDP growth, labor income and tax revenues that will result from the higher level of unconventional oil and natural gas development. Volume 3 in the study includes state-by-state analysis of the economic impacts and projections of additional investment in manufacturing as a result of these supplies.
See more at http://press.ihs.com/press-release/economics/us-unconventional-oil-and-gasrevolution-increase-disposable-income-more-270#.
Unleashing the Supply Chain study sponsors
The following organizations provided support for this study. The analysis and conclusions in this study are those of IHS, and IHS is solely responsible for the report and its content.
Baker Hughes, Chaparral Energy, Chesapeake Energy, Chevron, Concho Resources, ConcocoPhillips, Continental Resources , Devon Energy, Energy Equipment and Infrastructure Alliance, EOG Resources, Exxon Mobil, General Electric, Halliburton, Helmerich & Payne , Hess, Marathon Oil, Newfi eld Exploration, Oasis Petroleum, Occidental Petroleum, Pioneer Natural Resources, QEP Resources, Rosetta Resources, and WPX Energy
© 2015 IHS 1 March 2015
IHS Energy and IHS Economics | Unleashing the Supply Chain
Key fi ndings• The oil and gas industry depends on a diverse and far-reaching supply chain—a vast and interconnected
network of labor, commodities, technologies, and information services across the United States.
• When oil prices are lower, the potential negative impact on jobs and the economy are more—not less—sensitive to further price discounts resulting from an export ban. For example, a $3 per barrel change in a $50 environment can have the same e� ect as a $10 change in a $100 environment.
• The export ban causes US crude oil prices to be discounted versus international crude oil prices—an e� ect that reduces US oil production, supply chain activity, and job growth, but raises US gasoline prices. As of this writing, the spread between the international (Brent) and domestic (WTI) crude prices has widened, ranging from $7 to $12 per barrel.
• The industries that produce, transport and process oil are highly capital-intensive, supporting an extensive and diverse supply chain. Benefi ciaries of this investment include domestic companies in equipment and machinery, construction and well services, information technology, materials, and logistics, and in the professional, fi nancial and other services sectors.
• The economic benefi ts of oil and gas activity throughout this extensive supply chain far exceed benefi ts to the industry itself. Every new production job creates three jobs in the supply chain and another six jobs in the broader economy. Contributions to Gross Domestic Product (GDP) also multiply: every dollar of GDP created in the oil and gas sector generates two dollars in the supply chain.
• Lifting the ban on crude oil exports increases supply chain jobs and economic activity by stimulating capital investment, increasing crude oil production, and lowering gasoline prices. Based on two levels of crude production analyzed in this report, the positive impact on the crude oil supply chain of lifting the export ban is expected to add $26 billion to $47 billion to GDP and support 124,000 to 240,000 jobs per year on average during the 2016–30 period. The impact from a policy change is greatest in the short term (2016-20).
• The broader US economic impact is $86 billion to $170 billion additional GDP and 394,000 to 859,000 additional jobs.
• The supply chain benefi ts from lifting the export ban reach into every state and almost every US congressional district, from oil-producing Texas and California to states such as Illinois, Florida and New York, which have diversifi ed manufacturing and services economies. Massachusetts, with its strong information technology and professional and fi nancial services industries, also benefi ts from free trade. And in Washington State, which has strong information technology and manufacturing sectors, the supply chain contribution is almost half of the total state impact of lifting the crude oil export ban. Additionally, Illinois, ranked only 14th for oil production, accounts for roughly 10% of the overall supply chain impact. Furthermore, 5 of its congressional districts are in the top 20 in terms of value added, accounting for about 5% of that supply chain impact.

© 2015 IHS 3 March 2015
IHS Energy and IHS Economics | Unleashing the Supply Chain
Executive summaryA revival in US crude oil production—up 80% since 2005—is expanding economic activity across the nation through an interdependent, technology-driven supply chain. This supply chain encompasses dozens of important and diverse domestic industries well beyond what is commonly thought of as the “oil industry.” Consumers are now paying substantially less for gasoline, largely due to the impact on global markets of higher US oil production. But lower oil and gasoline prices are just one benefi t. In this report, IHS o� ers further analysis of the benefi ts that extend across the nation from free trade of crude oil—benefi ts that are also placed at risk by an outdated trade policy from an era of oil price controls that were abolished in 1981.
Crude oil production depends on an extensive supply chain—a vast network of interconnected labor, commodities and information that reaches into many communities and industries. For example, the diesel engines driving drilling rigs and hydraulic fracturing equipment are largely manufactured in the industrial heartland of Illinois, Indiana, Wisconsin, and Michigan. Many states — New York, Florida, Illinois, and Massachusetts, for example—with modest or negligible oil production sectors have strong manufacturing or service sectors supplying the oil industry in producing states. As IHS reported in its earlier report, US Crude Oil Export Decision (herein referred to as the Export Decision), if the trade ban is lifted, the number of US jobs is 394,000 to 859,000 higher each year, on average, under the Base Production and Potential Production cases, respectively, between 2016 and 2030. Supply chains represent a substantial share—about 30%—of the total jobs economy-wide: supply chain jobs under free trade average 124,000 to 240,000 annually in the Base and Potential cases, respectively.
What is the supply chain? This study, Unleashing the Supply Chain: Assessing the economic impact of a US crude oil free trade policy, tracks fl ows of capital expenditures through 60 industry sectors that comprise a large percentage of the oil industry’s upstream supply chain. The supply chain is the extended network of companies providing the labor, commodities, technology, and information required to extract oil and deliver it to the midstream (transportation and logistics) and downstream (processing and marketing) sectors.1 Capital investment and operating spending in the oil industry, as measured by direct spending within the oil industry’s Tier 1 suppliers, trigger multiple streams of additional economic activity throughout an extended, multi-tiered supply chain that has wide geographical impacts at the national, state and local levels. 2
1 Midstream specifi cally includes the pipelines, terminals and related logistics infrastructure used to move petroleum and downstream includes refi ning and product distribution.
2 Tier 1 suppliers are defi ned as those with whom upstream operators directly spend capital and operating funds.
© 2015 IHS 4 March 2015
IHS Energy and IHS Economics | Unleashing the Supply Chain
The key driver of the widespread macroeconomic benefi ts is investment in the upstream and midstream oil and gas industries. This investment in US energy infrastructure signifi cantly aided the return of US economic growth following the Great Recession. From 2008–13, while US GDP growth averaged 1.2% per year, economic output in the oil and gas industry grew four times faster, at 4.7%. Over the same period, total US employment declined by 0.1%, while oil and gas industry employment grew 4.3% per year. More broadly, the revolution in the production of “unconventional” oil and gas has been one of the major contributors to the US economic recovery; it is estimated by IHS to have added nearly 1% to US GDP annually, on average, over the past six years, explaining nearly 40% of overall GDP growth in that time.
These macroeconomic impacts would be enhanced by lifting the crude export ban as they extend through a diverse network of suppliers. Suppliers benefi t from the investment required for the exploration, production, processing, and transport of oil and gas. In turn, suppliers of materials, capital equipment and services enable operators to deploy technology to commercialize their resources. The “multiplier e� ect” accelerates as Tier 1 suppliers require more production of goods and services and development of e� cient technologies within their respective interlinking supply chains. This benefi t cascades across the industrial economy and all states.
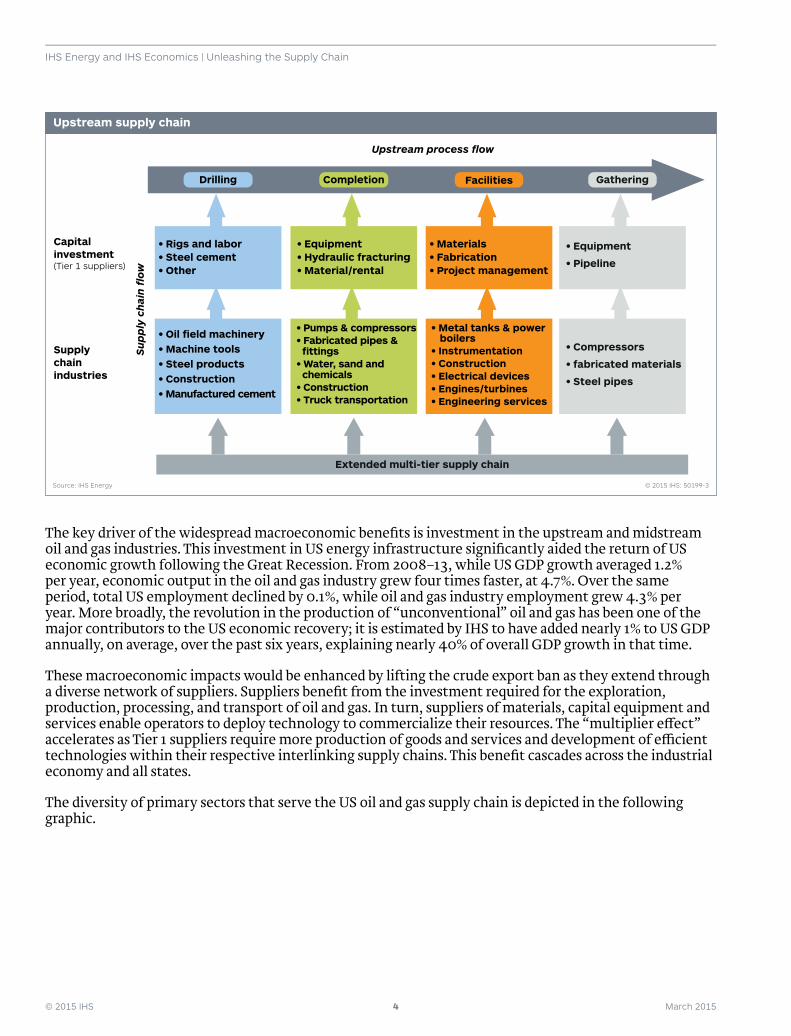
The diversity of primary sectors that serve the US oil and gas supply chain is depicted in the following graphic.
Drilling Completion Facilities Gathering
Extended multi-tier supply chain
Capitalinvestment(Tier 1 suppliers)
Supplychainindustries
• Metal tanks & power boilers• Instrumentation• Construction• Electrical devices• Engines/turbines• Engineering services
• Materials• Fabrication• Project management
• Equipment• Hydraulic fracturing• Material/rental
• Rigs and labor• Steel cement• Other
Su
pp
ly c
hai
n fl
ow
Upstream process flow
• Equipment
• Pipeline
• Compressors
• fabricated materials
• Steel pipes
• Pumps & compressors• Fabricated pipes & fittings• Water, sand and chemicals• Construction• Truck transportation
• Oil field machinery• Machine tools• Steel products• Construction• Manufactured cement
© 2015 IHS: 50199-3Source: IHS Energy
Upstream supply chain
© 2015 IHS 5 March 2015
IHS Energy and IHS Economics | Unleashing the Supply Chain
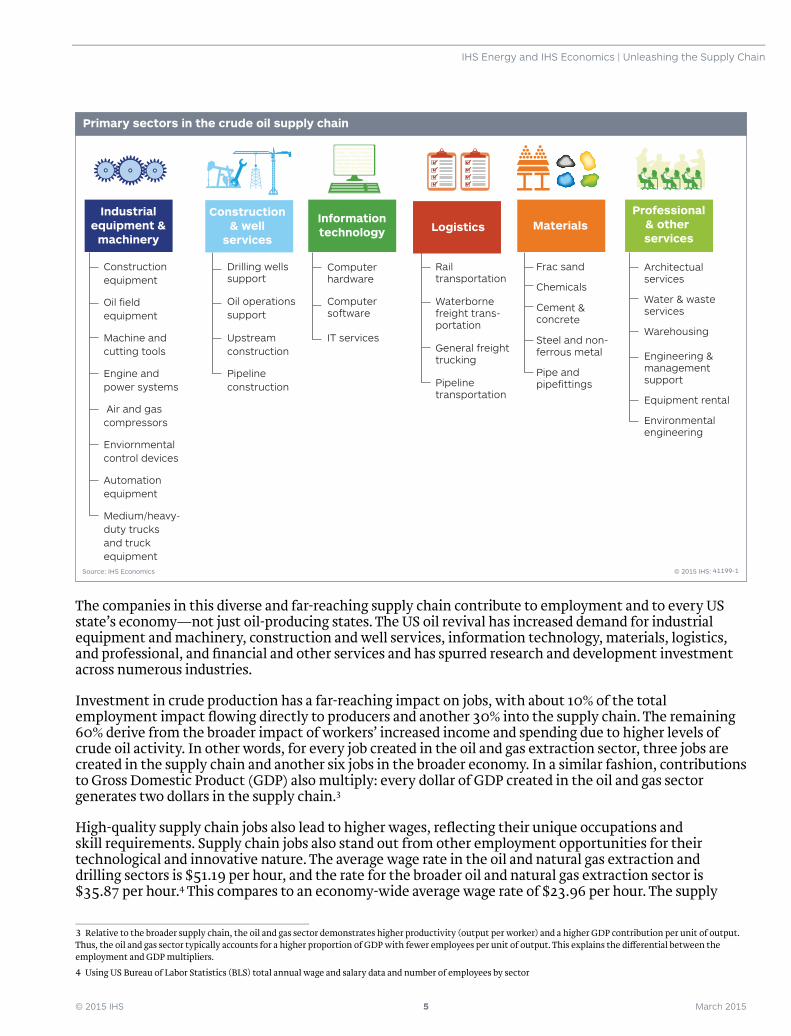
The companies in this diverse and far-reaching supply chain contribute to employment and to every US state’s economy—not just oil-producing states. The US oil revival has increased demand for industrial equipment and machinery, construction and well services, information technology, materials, logistics, and professional, and fi nancial and other services and has spurred research and development investment across numerous industries.
Investment in crude production has a far-reaching impact on jobs, with about 10% of the total employment impact fl owing directly to producers and another 30% into the supply chain. The remaining 60% derive from the broader impact of workers’ increased income and spending due to higher levels of crude oil activity. In other words, for every job created in the oil and gas extraction sector, three jobs are created in the supply chain and another six jobs in the broader economy. In a similar fashion, contributions to Gross Domestic Product (GDP) also multiply: every dollar of GDP created in the oil and gas sector generates two dollars in the supply chain.3
High-quality supply chain jobs also lead to higher wages, refl ecting their unique occupations and skill requirements. Supply chain jobs also stand out from other employment opportunities for their technological and innovative nature. The average wage rate in the oil and natural gas extraction and drilling sectors is $51.19 per hour, and the rate for the broader oil and natural gas extraction sector is $35.87 per hour.4 This compares to an economy-wide average wage rate of $23.96 per hour. The supply
3 Relative to the broader supply chain, the oil and gas sector demonstrates higher productivity (output per worker) and a higher GDP contribution per unit of output. Thus, the oil and gas sector typically accounts for a higher proportion of GDP with fewer employees per unit of output. This explains the di� erential between the employment and GDP multipliers.
4 Using US Bureau of Labor Statistics (BLS) total annual wage and salary data and number of employees by sector
Computerhardware
IT services
Computersoftware
Informationtechnology
Oil operationssupport
Drilling wellssupport
Upstreamconstruction
Pipelineconstruction
Construction& well
services
Architectualservices
Water & wasteservices
Equipment rental
Engineering &managementsupport
Warehousing
Environmentalengineering
Professional& other services
Frac sand
Cement &concrete
Chemicals
Steel and non-ferrous metal
Pipe andpipefittings
Materials
Railtransportation
Waterbornefreight trans-portation
General freighttrucking
Pipelinetransportation
Logistics
Constructionequipment
Oil fieldequipment
Machine andcutting tools
Engine andpower systems
Enviornmentalcontrol devices
Air and gascompressors
Automationequipment
Medium/heavy-duty trucksand truckequipment
Industrialequipment &
machinery
© 2015 IHS: 41199-1Source: IHS Economics
Primary sectors in the crude oil supply chain
© 2015 IHS 6 March 2015
IHS Energy and IHS Economics | Unleashing the Supply Chain
chain wage of $29.93 per hour is 25% above the national average.5 Higher wages result in larger multiplier and income e� ects across the economy as more income is spent on general consumer goods and services by oil and gas and supply chain sector workers.
Great revival in US crude production and uncertain futureThe large and rising production of US crude oil has signifi cantly reduced US dependence on imported oil—imports last year accounted for just 27% of US oil demand, down from 60% in 2005. With crude oil production now over 9 million barrels per day, the United States is the world’s third-largest crude-oil producer behind Saudi Arabia and Russia. It is the largest producer of oil and natural gas liquids combined.
Continued growth in the oil and gas industry and in the supply chain supporting it could be imperiled by low prices and outdated crude oil export policies that restrain market access and hinder future investment and production. In the early years of the industry’s revival, higher oil prices were unusually stable and allowed for the emergence and advancement of a vibrant domestic tight oil industry. Production techniques improved, costs fell, and higher oil output per well was achieved. It is the success and rapid growth of US production that contributed to the global supply surplus that has driven down global oil prices over the past six months. Consumers are already reaping great benefi ts from this drop in prices.
Production will certainly be a� ected by low prices, but the pace and degree of the impact remains uncertain. The market price has been roughly halved, and the adjustment process is evolving. Many factors will infl uence the outcome. Oil markets are prone to cycles, which are often rapid and extreme and refl ect the challenge of matching short-term changes in demand with long-term investment requirements. Price changes over the past decade refl ect the constant changes occurring in oil market fundamentals, economic conditions and geopolitical events that a� ect oil prices. The monthly average price of Brent crude oil climbed from $30 per barrel in early 2004 to over $130 per barrel in July 2008 before falling to $40 per barrel in December 2008. Prices then rebounded, exceeding $70 per barrel by August 2009 and remained in the $100 per barrel range from early 2011 through August 2014. As of this writing, the US benchmark price is below $60 per barrel. Crude oil price volatility is expected to continue. While low prices are the primary challenge facing the industry in 2015, the ban on exports of US crude oil production will hinder or even cut short any recovery tomorrow.
The export policy problem The US oil system is nearing gridlock due to a mismatch between the rapid growth of domestic light tight oil production and the inability of the US refi ning system to economically process the growing volumes. Seasonal gridlock occurred in the second half of 2013 due to refi nery maintenance downtimes. But the rapidly declining crude oil price and the increasing storage of crude oil have so far overshadowed the risk of a more permanent and impending gridlock and reduced the domestic crude price discount to global prices. In fact, gridlock would have a doubly chilling e� ect on investment and job growth in an environment of lower and volatile global crude prices. The supply chain in every region of the nation has benefi tted from investment in US oil production and infrastructure—benefi ts now put at risk.
The nation is benefi ting today from increased employment, lower gasoline prices and an improved trade balance as growing US production puts downward pressure on international oil prices. Lifting the export ban and allowing US crude oil to trade into international markets removes a risk that the full benefi ts from potential US oil production are not realized. The Export Decision report in May 2014 examined the historical context of US export policies; the oil industry’s response to a change in policy; and the estimated macroeconomic benefi ts from free trade accruing to US consumers and the broader US economy. The Export Decision analysis projected substantial increases in capital expenditures by upstream operators if the export ban is lifted, granting them access to global markets.
5 Based on a weighted average of the hourly wage rates for each of the supply chain sectors.
© 2015 IHS 7 March 2015
IHS Energy and IHS Economics | Unleashing the Supply Chain
Since completion of the previous study, two notable market events have occurred. First, the global crude price has declined sharply, largely due to US production increases and weak demand, and second, the Bureau of Industry and Standards (BIS) has clarifi ed existing rules that allow certain very light crude oil (condensate) to be exported as a “refi ned product” in defi ned situations involving su� cient processing.
Oil price declineThe rapid crude oil price decline—by roughly half since mid-2014—is a reminder of the cycles and uncertainty of oil and energy markets caused by the di� ering time scales of demand and supply adjustments. Producers are responding with reduced budgets, smaller drilling programs and cost cutting. While exploration and development costs are expected to also decline, the industry is expected to produce less crude oil as a result of the price decline, and the impact on employment is magnifi ed throughout the supply chain.
Lower global oil prices have the e� ect of increasing—rather than decreasing, as some might expect—the impact of the export ban. An export gridlock created by the ban would create a domestic oversupply resulting in US crude oil prices (for example, West Texas Intermediate) becoming disconnected and discounted from international prices, such as Brent crude. The resulting lower wellhead price for US producers dampens upstream investment and reduces economic activity and job creation. The resulting lower wellhead price for US producers dampens upstream investment; reduces economic activity and job creation; and, weakens the competiveness of US companies relative to their international peers.
These employment and economic benefi ts are increasingly sensitive to declines in crude oil prices. This is because the industry, at lower prices, has a “fl atter” supply curve, which means that a small change in price results in a larger supply loss. Therefore, the risk from the export ban is higher in today’s low-priced market.
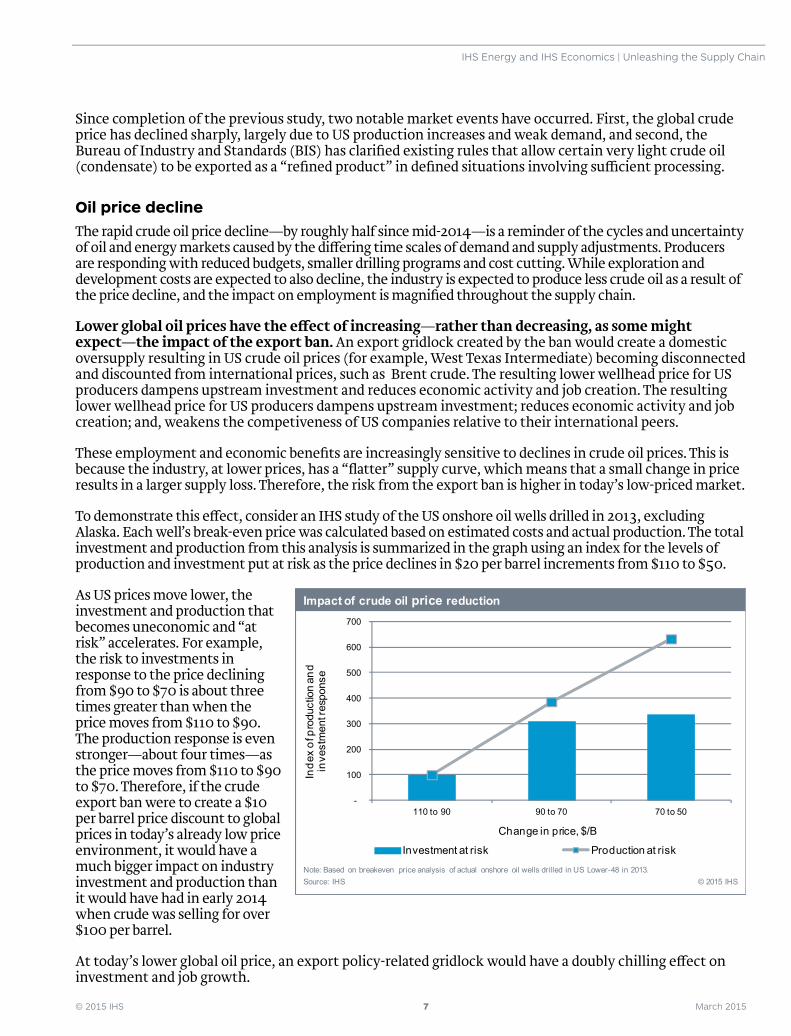
To demonstrate this e� ect, consider an IHS study of the US onshore oil wells drilled in 2013, excluding Alaska. Each well’s break-even price was calculated based on estimated costs and actual production. The total investment and production from this analysis is summarized in the graph using an index for the levels of production and investment put at risk as the price declines in $20 per barrel increments from $110 to $50.
As US prices move lower, the investment and production that becomes uneconomic and “at risk” accelerates. For example, the risk to investments in response to the price declining from $90 to $70 is about three times greater than when the price moves from $110 to $90. The production response is even stronger—about four times—as the price moves from $110 to $90 to $70. Therefore, if the crude export ban were to create a $10 per barrel price discount to global prices in today’s already low price environment, it would have a much bigger impact on industry investment and production than it would have had in early 2014 when crude was selling for over $100 per barrel.
At today’s lower global oil price, an export policy-related gridlock would have a doubly chilling e� ect on investment and job growth.
-
100
200
300
400
500
600
700
110 to 90 90 to 70 70 to 50
Investment at risk Production at risk
Impact of crude oil price reduction
Source: IHSNote: Based on breakeven price analysis of actual onshore oil wells drilled in US Lower-48 in 2013.
© 2015 IHS
Change in price, $/B
Inde
x of
pro
duct
ion
and
inve
stm
ent r
espo
nse
© 2015 IHS 8 March 2015
IHS Energy and IHS Economics | Unleashing the Supply Chain
The industry is dynamic, and e� ciencies in production are being realized each year. Still, there is good reason to believe that the shape of the 2013 supply curve is similar today and will remain so for the foreseeable future.
BIS clarifi cation for condensate processingSome types of very light crude oil (condensate) can be exported after transformation into petroleum products with su� cient processing, as explained by a nuanced clarifi cation of existing regulatory defi nitions of crude processing.6 The BIS has provided general guidance and has issued private rulings to a few companies to permit the export of this processed condensate petroleum (condensate product) from individual facilities that were approved based on equipment and processing confi guration. Due to minimal processing, the main product has a broad boiling range and is similar to unprocessed condensate. The condensate product is unfi nished and not usable as a fuel but only as a feedstock for further refi ning. More companies will be given permission or will otherwise be able to export this condensate product. These exports will provide some relief to the impending market gridlock. However, the volume of condensate product available for export remains unclear, because new infrastructure must be put into place to segregate this product stream. Condensate production is signifi cant and estimated to be near 800,000 barrels per day (there is no industry standard for the defi nition of condensate); however, little of this production is coastal, and so, to prevent commingling, additional infrastructure is needed to move the condensate product to export terminals. This new infrastructure must be separate from the three existing infrastructures for crude oil and condensate, for natural gas, and for natural gas liquids (NGL). This segregation creates market and capital ine� ciencies. Further, market distortions are likely to arise due to artifi cial distinctions between similar products (unprocessed condensate and condensate product). This policy-driven investment will likely duplicate more e� cient facilities already in place, another example of the economic ine� ciencies caused by the outdated crude oil export policy.
Despite a declining global oil price, the clarifi ed classifi cation of processed condensate, and the weaker US production outlook in the near-term, the crude oil export ban is a remnant of a long-past era that could constrain future US production growth and result in higher gasoline prices for US consumers. While the unpredictable events of the past six months may have delayed the most severe gridlock temporarily, these same events also highlight that this gridlock could return sooner than expected as US production growth is supported by greater e� ciencies and lower costs. When a recovery occurs, the export ban is expected to retard investment, reduce energy security and self-su� ciency, and ultimately lead to higher gasoline prices and lower job creation.
Free trade impacts on the supply chainIHS has evaluated a change in crude export policy under each of two scenarios for US crude oil production levels:
• The Base Production Case provides a conservative view based on known defi ned oil and gas plays and assumes limited technology improvements over current performance.
• The Potential Production Case includes additional known, but less well defi ned areas of existing plays and assumes moderate drilling performance and technology improvements in the future.
These scenarios use production outlooks developed in mid-2014 in the Export Decision study—before the dramatic fall in oil prices. Since then, actual production and e� ciency gains have been higher than forecasted but are now being o� set by the expected e� ects of the price decline. IHS’ current production forecast remains within the Base and Potential Production bands found in the prior study. The impact of moving from the current restricted trade policy to free trade is quantifi ed for 60 industries in the petroleum production supply chain under each scenario.
6 Processing at or near wellhead production.
© 2015 IHS 9 March 2015
IHS Energy and IHS Economics | Unleashing the Supply Chain
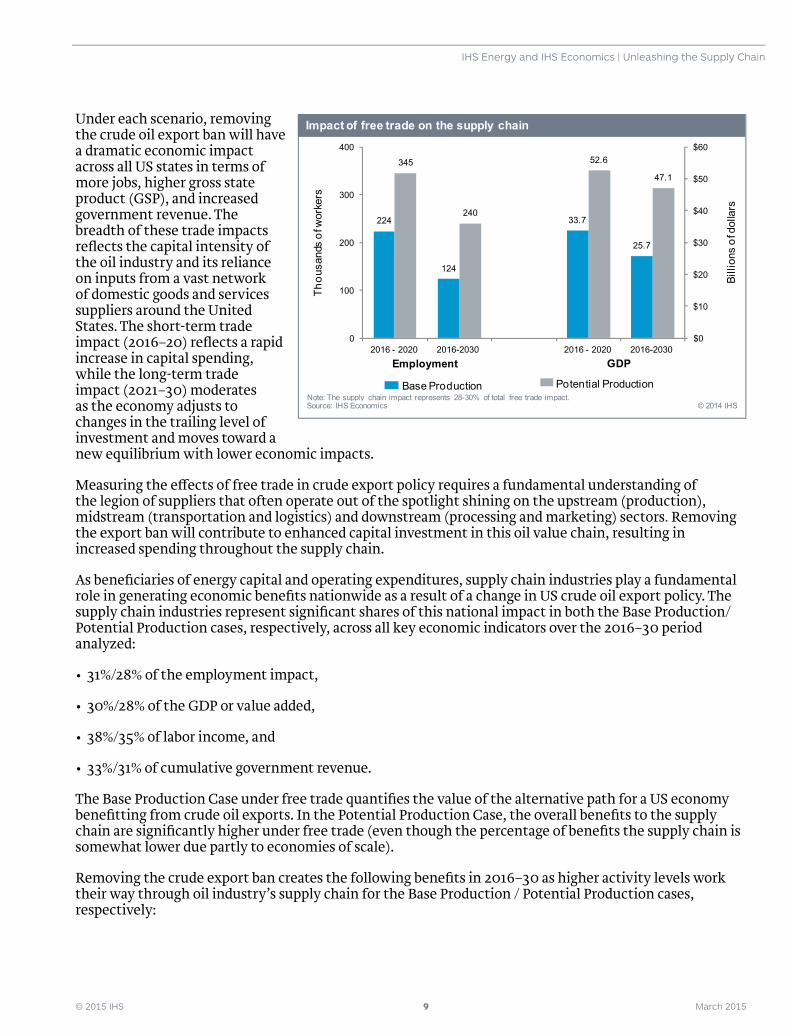
Under each scenario, removing the crude oil export ban will have a dramatic economic impact across all US states in terms of more jobs, higher gross state product (GSP), and increased government revenue. The breadth of these trade impacts refl ects the capital intensity of the oil industry and its reliance on inputs from a vast network of domestic goods and services suppliers around the United States. The short-term trade impact (2016–20) refl ects a rapid increase in capital spending, while the long-term trade impact (2021–30) moderates as the economy adjusts to changes in the trailing level of investment and moves toward a new equilibrium with lower economic impacts.
Measuring the e� ects of free trade in crude export policy requires a fundamental understanding of the legion of suppliers that often operate out of the spotlight shining on the upstream (production), midstream (transportation and logistics) and downstream (processing and marketing) sectors. Removing the export ban will contribute to enhanced capital investment in this oil value chain, resulting in increased spending throughout the supply chain.
As benefi ciaries of energy capital and operating expenditures, supply chain industries play a fundamental role in generating economic benefi ts nationwide as a result of a change in US crude oil export policy. The supply chain industries represent signifi cant shares of this national impact in both the Base Production/Potential Production cases, respectively, across all key economic indicators over the 2016–30 period analyzed:
• 31%/28% of the employment impact,
• 30%/28% of the GDP or value added,
• 38%/35% of labor income, and
• 33%/31% of cumulative government revenue.
The Base Production Case under free trade quantifi es the value of the alternative path for a US economy benefi tting from crude oil exports. In the Potential Production Case, the overall benefi ts to the supply chain are signifi cantly higher under free trade (even though the percentage of benefi ts the supply chain is somewhat lower due partly to economies of scale).
Removing the crude export ban creates the following benefi ts in 2016–30 as higher activity levels work their way through oil industry’s supply chain for the Base Production / Potential Production cases, respectively:
224
124
345
24033.7
25.7
52.6
47.1
$0
$10
$20
$30
$40
$50
$60
2016 - 2020 2016-2030 2016 - 2020 2016-2030 0
100
200
300
400
Impact of free trade on the supply chain
© 2014 IHS Source: IHS Economics
Thou
sand
s of
wor
kers
Billi
ons
of d
olla
rs
Base Production Potential Production
Employment GDP
Note: The supply chain impact represents 28-30% of total free trade impact.
© 2015 IHS 10 March 2015
IHS Energy and IHS Economics | Unleashing the Supply Chain
• The crude oil supply chain will add $26 billion /$47 billion to GDP per year.
• Supply chain jobs will be 124,000/240,000 higher per year, on average.
• Labor income improves by about $158/$285 per year, on average, for each household.
• Cumulative government revenues from corporate and personal taxes attributed to supply chain industries reach $429 billion/$868 billion.
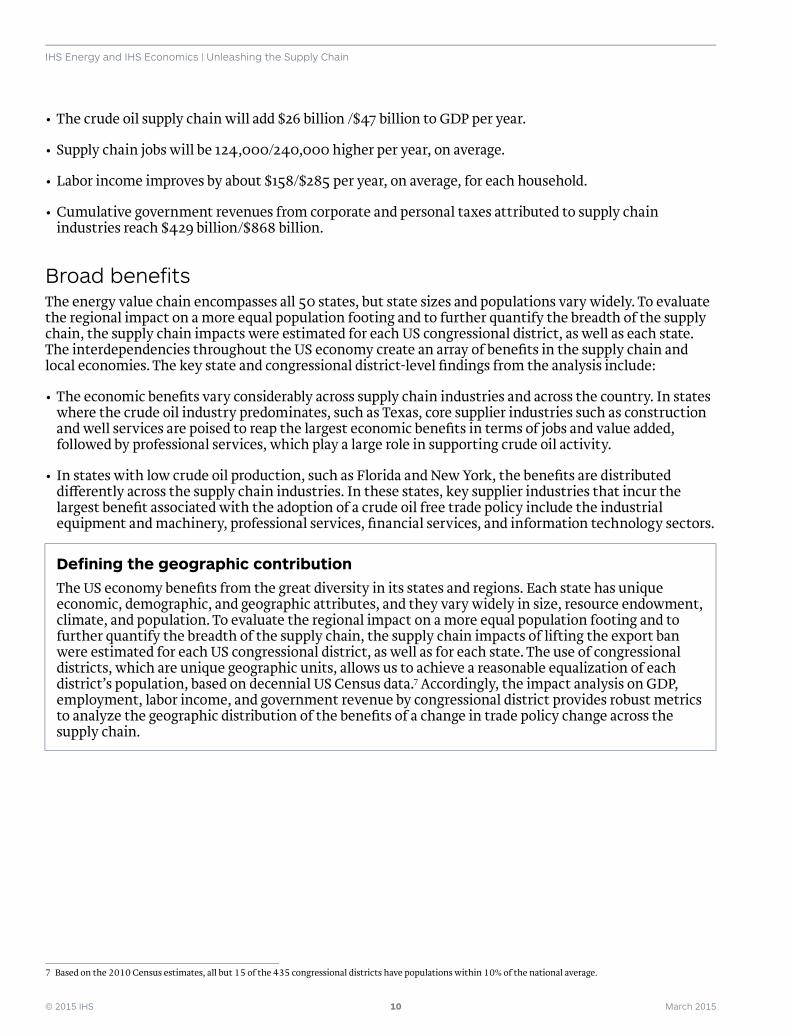
Broad benefi tsThe energy value chain encompasses all 50 states, but state sizes and populations vary widely. To evaluate the regional impact on a more equal population footing and to further quantify the breadth of the supply chain, the supply chain impacts were estimated for each US congressional district, as well as each state. The interdependencies throughout the US economy create an array of benefi ts in the supply chain and local economies. The key state and congressional district-level fi ndings from the analysis include:
• The economic benefi ts vary considerably across supply chain industries and across the country. In states where the crude oil industry predominates, such as Texas, core supplier industries such as construction and well services are poised to reap the largest economic benefi ts in terms of jobs and value added, followed by professional services, which play a large role in supporting crude oil activity.
• In states with low crude oil production, such as Florida and New York, the benefi ts are distributed di� erently across the supply chain industries. In these states, key supplier industries that incur the largest benefi t associated with the adoption of a crude oil free trade policy include the industrial equipment and machinery, professional services, fi nancial services, and information technology sectors.
Defi ning the geographic contributionThe US economy benefi ts from the great diversity in its states and regions. Each state has unique economic, demographic, and geographic attributes, and they vary widely in size, resource endowment, climate, and population. To evaluate the regional impact on a more equal population footing and to further quantify the breadth of the supply chain, the supply chain impacts of lifting the export ban were estimated for each US congressional district, as well as for each state. The use of congressional districts, which are unique geographic units, allows us to achieve a reasonable equalization of each district’s population, based on decennial US Census data.7 Accordingly, the impact analysis on GDP, employment, labor income, and government revenue by congressional district provides robust metrics to analyze the geographic distribution of the benefi ts of a change in trade policy change across the supply chain.
7 Based on the 2010 Census estimates, all but 15 of the 435 congressional districts have populations within 10% of the national average.
© 2015 IHS 11 March 2015
IHS Energy and IHS Economics | Unleashing the Supply Chain
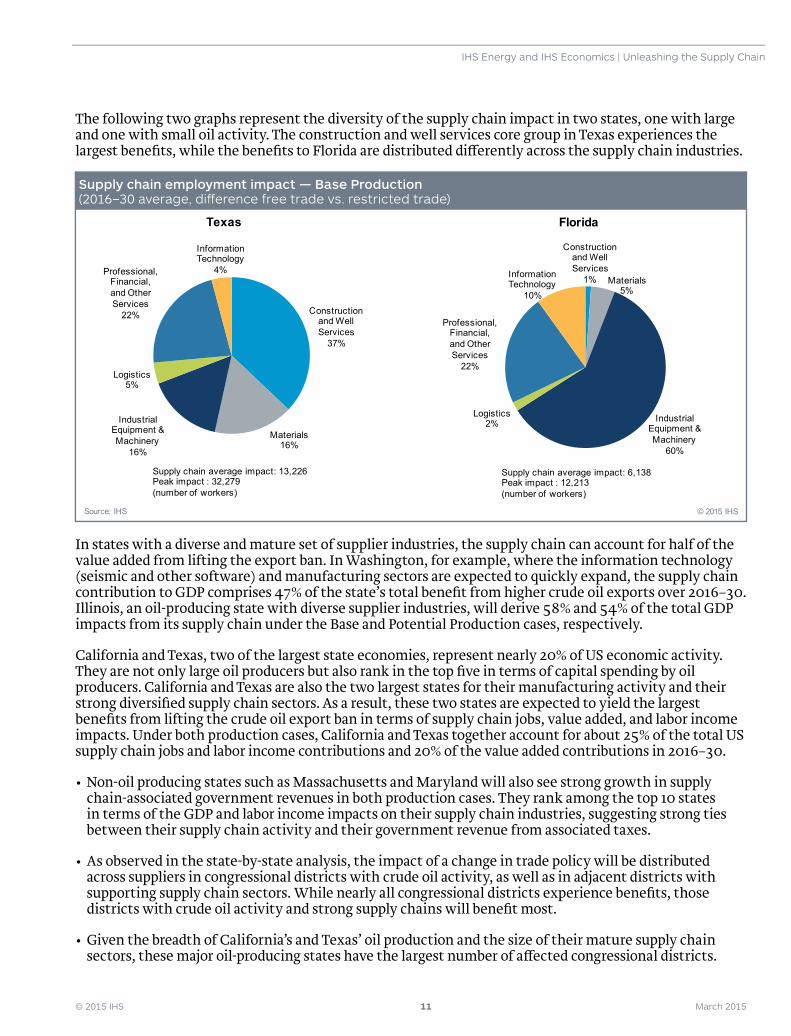
The following two graphs represent the diversity of the supply chain impact in two states, one with large and one with small oil activity. The construction and well services core group in Texas experiences the largest benefi ts, while the benefi ts to Florida are distributed di� erently across the supply chain industries.
In states with a diverse and mature set of supplier industries, the supply chain can account for half of the value added from lifting the export ban. In Washington, for example, where the information technology (seismic and other software) and manufacturing sectors are expected to quickly expand, the supply chain contribution to GDP comprises 47% of the state’s total benefi t from higher crude oil exports over 2016–30. Illinois, an oil-producing state with diverse supplier industries, will derive 58% and 54% of the total GDP impacts from its supply chain under the Base and Potential Production cases, respectively.
California and Texas, two of the largest state economies, represent nearly 20% of US economic activity. They are not only large oil producers but also rank in the top fi ve in terms of capital spending by oil producers. California and Texas are also the two largest states for their manufacturing activity and their strong diversifi ed supply chain sectors. As a result, these two states are expected to yield the largest benefi ts from lifting the crude oil export ban in terms of supply chain jobs, value added, and labor income impacts. Under both production cases, California and Texas together account for about 25% of the total US supply chain jobs and labor income contributions and 20% of the value added contributions in 2016–30.
• Non-oil producing states such as Massachusetts and Maryland will also see strong growth in supply chain-associated government revenues in both production cases. They rank among the top 10 states in terms of the GDP and labor income impacts on their supply chain industries, suggesting strong ties between their supply chain activity and their government revenue from associated taxes.
• As observed in the state-by-state analysis, the impact of a change in trade policy will be distributed across suppliers in congressional districts with crude oil activity, as well as in adjacent districts with supporting supply chain sectors. While nearly all congressional districts experience benefi ts, those districts with crude oil activity and strong supply chains will benefi t most.
• Given the breadth of California’s and Texas’ oil production and the size of their mature supply chain sectors, these major oil-producing states have the largest number of a� ected congressional districts.
Construction and Well Services
37%
Materials16%
Industrial Equipment & Machinery
16%
Logistics5%
Professional, Financial, and Other Services
22%
Information Technology
4%
Texas
Source: IHS © 2015 IHS
Supply chain average impact: 13,226 Peak impact : 32,279 (number of workers)
Construction and Well Services
1% Materials5%
Industrial Equipment & Machinery
60%
Logistics2%
Professional, Financial, and Other Services
22%
Information Technology
10%
Florida
Source: IHS © 2015 IHS
Supply chain average impact: 6,138Peak impact : 12,213 (number of workers)
Supply chain employment impact — Base Production(2016–30 average, di� erence free trade vs. restricted trade)
© 2015 IHS 12 March 2015
IHS Energy and IHS Economics | Unleashing the Supply Chain
However, impacts will be felt in clusters of congressional districts in other states such as Illinois, Florida, and New York, mainly due to their diversifi ed manufacturing and services sectors, and in Massachusetts due to its information technology and professional and fi nancial services.
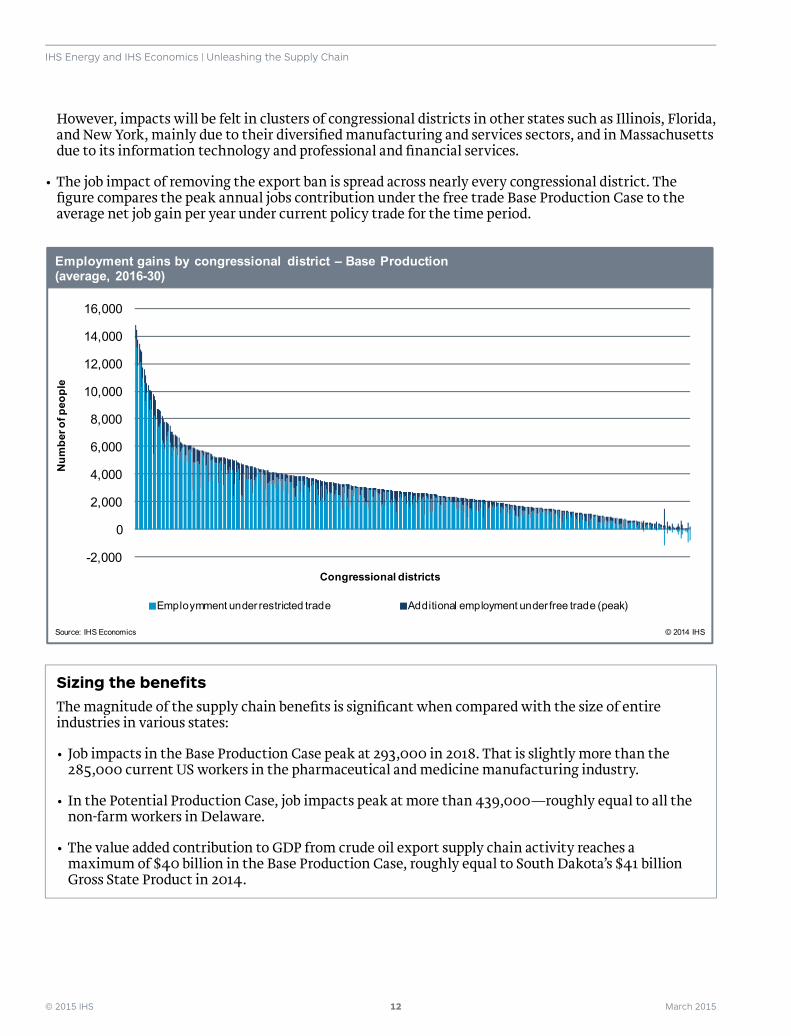
• The job impact of removing the export ban is spread across nearly every congressional district. The fi gure compares the peak annual jobs contribution under the free trade Base Production Case to the average net job gain per year under current policy trade for the time period.
Sizing the benefi tsThe magnitude of the supply chain benefi ts is signifi cant when compared with the size of entire industries in various states:
• Job impacts in the Base Production Case peak at 293,000 in 2018. That is slightly more than the 285,000 current US workers in the pharmaceutical and medicine manufacturing industry.
• In the Potential Production Case, job impacts peak at more than 439,000—roughly equal to all the non-farm workers in Delaware.
• The value added contribution to GDP from crude oil export supply chain activity reaches a maximum of $40 billion in the Base Production Case, roughly equal to South Dakota’s $41 billion Gross State Product in 2014.
-2,000
0
2,000
4,000
6,000
8,000
10,000
12,000
14,000
16,000
Employmment under restricted trade Additional employment under free trade (peak)
Employment gains by congressional district – Base Production (average, 2016-30)
Source: IHS Economics © 2014 IHS
Num
ber o
f peo
ple
Congressional districts
Related Documents