Number 17, October 2008 PEER REVIEW ARTICLES A Study on the development process of a multimedia learning environment according to the ADDIE model and students' opinions of the multimedia learning environment Selay Arkün & Buket Akkoyunlu pp. 1-19 University students' differences on attitudes towards computer use. Comparison with students' attitudes towards physical activity Evangelos Bebetsos & Panagiotis Antoniou pp. 20-28 An evaluation of the effectiveness of the instructional methods used with a student response system at a large university Coral M. Hanson, Charles R. Graham & Larry Seawright pp. 29-47 Personalised learning environments: core development issues for construction Sharifah Mazlina Syed Khuzzan, Jack Steven Goulding & Jason Underwood pp. 48-68

Welcome message from author
This document is posted to help you gain knowledge. Please leave a comment to let me know what you think about it! Share it to your friends and learn new things together.
Transcript
Number 17, October 2008
PEER REVIEW ARTICLES
A Study on the development process of a multimedia learning environmentaccording to the ADDIE model and students' opinions of the multimedia learning
environmentSelay Arkün & Buket Akkoyunlu
pp. 1-19
University students' differences on attitudes towards computer use. Comparisonwith students' attitudes towards physical activity
Evangelos Bebetsos & Panagiotis Antonioupp. 20-28
An evaluation of the effectiveness of the instructional methods used with a studentresponse system at a large university
Coral M. Hanson, Charles R. Graham & Larry Seawrightpp. 29-47
Personalised learning environments: core development issues for constructionSharifah Mazlina Syed Khuzzan, Jack Steven Goulding & Jason Underwood
pp. 48-68
Number 17, October 2008
Universitat de BarcelonaPg. de la Vall d'Hebron, 171
08035 – Barcelona, [email protected]
ISSN 1576 - 4990
EDITORIAL BOARD
Editor:José Luis Rodríguez Illera, Universitat de Barcelona (Spain)
Associate Editor:Fernando Albuquerque Costa, Universidade de Lisboa (Portugal)
Coordination:Mónica Kaechele Obreque, Universitat de Barcelona (Spain)
Editorial Review Board:Maria Ferraris, Istituto delle Tecnologie Didattiche (Italy)Carles Monereo, Universitat Autònoma de Barcelona (Spain)Francesco Caviglia, Aarhus Universitet (Denmark)Jaume Suau, Universitat de Barcelona (Spain)Josep Ma Monguet, Universitat Politècnica de Catalunya (Spain)Kinshuk, Massey University (New Zealand)Peter Slagter, Universiteit Utrecht (Holland)
Interactive Educational Multimedia (IEM) is a journal intended as a space for dialogue and reflectionabout the application of the multimedia technologies in education in all its facets: implementations anddesign of educational materials, multimedia, hypermedia, Internet, didactics, evaluation of theInformation and Communication Technologies (ICT) when applied to education.
The publication is open to all those investigators who wish to propose articles on this subject. We willaccept investigation work of the theoretical and bibliographic type, as well as the practical andexperiential.
The journal is published biannually, although extra issues may appear and/or monographs without afixed frequency. Also, the journal is published in English although the articles may appear in theiroriginal languages as well.
The journal publishes three different types of articles: Peer Review Articles (articles that have passedthe evaluation carried out by a group of experts), Guest Articles (articles approved by the editorialboard of the journal), Reviews (short articles about books, software or websites).
So that the journal can be a point of contact for people interested in educational multimedia, there isalso a news section, which will be updated periodically. Finally, this journal is the result of theintellectual work of the Virtual Teaching and Learning Research Group (GREAV), part of theDepartment of Theory and History of Education at Barcelona University.
GUIDELINES FOR ARTICLE SUBMISSION
1. The articles should focus on subjects related to implementations and design of educationalmaterials, multimedia, hypermedia, Internet, Didactics, evaluation of the Information andCommunication Technologies (ICT) when applied to education. We will accept investigation work ofthe theoretical and bibliographic type, as well as the practical and experiential.
2. The papers must be original and they must not be published previously. If they do not fill thoserequirements completely, an explanatory text at the end of the article is needed in which itspublication is justified.
3. The articles must be sent in Word or rich text format (RTF), and in English.
4. On the first page must appear: the title of the article; name, surnames and emails of theauthor or authors, followed by the name and address of the usual place of work.
5. At the beginning there must be a summary, of a maximum of 100 words, including descriptorsor Keywords from the article.
6. The extension of the body of the text is free. It is recommended that it has introduction,development and conclusions, and that it is divided in sections and subparagraphs.
7. The works should be accompanied by a bibliography at the end of the article. All the referencesquoted in the text should appear in this list, and be put in alphabetic order, complying as closely aspossible to the regulations of the APA: [APA (1998). Manual for the style of publications by theAmerican Psychological Association. Mexico, D.F.: The Modern Manual.] To quote online texts youmust also follow the APA regulation, which you can consult at http://www.beadsland.com/weapas/
8. The works, which must be unpublished, should be sent by e-mail: [email protected]
9. A copy can be sent to the following address:Interactive Educational MultimediaJosé Luis Rodríguez Illera, EditorUniversitat de BarcelonaPasseig de la Vall d'Hebron, 17108035 Barcelona, Spain
10. All the authors will receive notification of receipt of the work. Comments and the final decision ofthe review process will be sent to them in a period of no more than four months after the date ofreceipt of the article.
11. The editors of the journal reserve the right to publish the contributions in the issue which theyconsider most appropriate. Those articles which are not published because it is felt they are notappropriate for the journal will be returned and the authors will be notified by e-mail.
12. Interactive Educational Multimedia, IEM, does not accept any responsibility for the points of viewand statements made by the authors in their work.
13. The texts will be under a license Attribution-Noncommercial-No Derivative Works 2,5 Spain, ofCreative Commons. All the conditions of use in: http://creativecommons.org/licenses/by-nc-nd/2.5/es/deed.en_US
Interactive Educational Multimedia, Number 17 (October, 2008), pp. 1-19http://www.ub.edu/multimedia/iem / [email protected]
A Study on the development process of a multimedia learningenvironment according to the ADDIE model and students’ opinions of
the multimedia learning environment
Selay Arkü[email protected]
Buket Akkoyunlu [email protected]
Hacettepe University, Faculty of Education,Dep. of. Comp. and Inst. Tech. Ed.
Ankara, Turkey
Summary
In this study, the development process of the environment was examined accordingto the Analyze, Design, Develop, Implement, Evaluate, Instructional Design Model(ADDIE) and the effect on achievement of the environment and students’ opinions onthe learning environment was observed. The study group was composed of 85 fourthgrade primary school students, consisting of 50 females and 35 males. To be able tomeasure the effect on achievement, pre-test and post-test procedures were applied.In conclusion, it was discovered that the multimedia learning environment positivelyeffects achievement.
Keywords
Learning environment; multimedia learning environment; ADDIE instructional designmodel; achievement.
1. INTRODUCTION
The human profile required by today’s societies has changed according to the needs of the current era.
Globalization and improvements in science and technology are the main factors which determine the
manpower profile required by information society. Today, students are exposed to information in very
different ways and the amount of information is rapidly increasing. What lay at the core of this
explosion is the continually renewed efforts exerted for research and development purposes.
2
While facilitating the development of individuals, it should also be ensured that people have the
information, the attitude and are equipped with the skills, which are necessary for them to closely
monitor contemporary developments, then to make necessary adaptations in their life and from this
experience gain further knowledge. The understanding, which focuses on the individual, is oriented
towards globalization from sociality and cooperation and team work have become indispensable
components of contemporary life. In this context, education systems, besides constantly developing to
meet the needs of the current era, have been obliged to focus on the future and to go beyond the
needs of the current era. Today, the dimension emphasized in the definition of the concept of
education is the process of assisting students in acquiring the skills to access and use information more
than conveying the knowledge from teacher to student. This traditional method not only fails to meet
the needs of modern society but also excludes, or at least neglects adult education (which is
emphasized in informal training process but excluded at the definition level) should be expanded to
include lifelong and unlimited education.
Life-long learning has gained importance in the 21st century, the phrase denotes that learning is a
process which should be seriously addressed at any age from birth to death. Life-long learning can be
described as the provision of opportunities of education and professional training, which enable
individuals to update their current knowledge, skills and competencies and when needed to acquire
new knowledge, skills and competencies. This process brings about learning that is independent of
age, time and place, that is, unlimited learning. The process is learner-centered rather than dependent
on the teacher. All these developments necessitate a change in the education system and this has
required action on the part of Ministry of National Education (MoNE) to modify existing primary
education programs and, in turn, MoNE has developed new curriculum.
Eight common skills have been determined for all courses included in New Primary Education
Curriculum. These skills are: Critical thinking, creative thinking, communication, researching-
questioning, problem solving, using information technologies, entrepreneurship and using Turkish
language correctly and efficiently.
The skills for Using Information Technologies include those related with using technology in searching,
finding, processing, presenting and evaluating information (MONE, 2004). In this scope, effective and
efficient use of “Information and Communication Technologies” in line with the objectives gains
importance. Moreover, great importance has been given to using Information Technologies in courses
for the acquisitions to be obtained and activities to be carried out. By focusing on learning, the
emphasis is on creating environments where learning can be more lasting through the support of each
developed technology. When new instruction programs are reviewed, it is observed that they are
enriched with activities and they are student rather than teacher centered. Today, it is vital to design
different materials in different teaching environments and to use them for different purposes.
Studies conducted in this area have shown that the environments which appeal to more than one
sense organ positively affect the durability. It shows that people can remember 20% of what they
3
have only seen, 40% of what they have seen and heard, 75% of what they have seen, heard and done
(Neo, Neo, 2001) In a similar research (Bass, 1994), it has been revealed that we remember 10% of
what we have read, 20% of what we have heard, 30% of what we have both seen and heard, 50% of
what somebody has explained to us and 90% of what we have done ourselves. In this context,
multimedia which generally uses a combination of text, sound, graph and animation provides a more
effective and longer lasting learning experience.
1.1. What is multimedia?
Examining the word multimedia, it can be seen that there are two elements; “multi” meaning having
more than one form, and “media” meaning the environment where the information is conveyed
(Marmara University, 2003). In a simple way, those items which appeal to the eye, ear and sense of
touch can be described as multimedia. According to Heath (2000) using or presenting the data in two
or more forms is called multimedia. Similarly, Mayer (2001) describes it as supporting the presentation
of information with graphic and text. Jonassen, Peck and Wilson (1999) state that when multimedia is
mentioned, learning environments come to mind. While Newby et al., (2000) describes multimedia as
environments which are compiling systems composed of many tools in the computer environment;
Smith (2002) explains multimedia as the information environment which is formed by combining text,
sound and graphics in a digital environment. According to Heinich, Molenda, Russell and Smaldino
(2002), multimedia presents various tools simultaneously or uses them in one program in a similar
way. Roblyer (2003) describes multimedia as “multi tools” or “combination of tools”. Graham and
Hussain (2006) emphasize that multimedia is integrating text, sound, any kind of graphic and a
learning environment coherently in one digital information environment. McCauley (2000) reports that
multimedia provides information for the learners in a simple way; however, interactive multimedia
gives the control of information to the users and ensures their participation. Heinich et al., (2002) also
describe interactive multimedia as a multimedia which allows students to make implementations and
receive feedback.
Taking into account the definitions given above it can be seen that, in the most general meaning,
multimedia can be summarized as ensuring communication through various ways. This can be one way
as well as multi-way communication. However, when the communication gains more than one aspect,
the component of interaction becomes a part of the action, thus the communication is interactive.
Interactive multimedia learning environments used in education present information that can be seen
and heard by the learners who can also control aspects of the environment, and allow a non linear
progression through the learning experience. Heinich et al., (2002) summarize the advantages of using
interactive multimedia and refer to the participation of the user; the importance of individuality and
the opportunity for simulation and flexibility, in that the user has choices and is not forced into only
one path through the material presented.
Briefly, today, information and technology has rapidly developed and spread all over the world through
all parts of society. This has affected both the education systems and learning environments, and the
4
instruction materials and methods used in these environments have changed. With the creation of long
lasting learning, interactive experiences have gained importance.
When the design process of the instruction environments is examined, it can be seen that there are
various approaches which differ according to the learning theory they are based on. For example, the
designs which depend on behaviourist and cognitive learning theories are considerably structured, in
other words, the teacher of the subject is given importance and the activities aim to convey the
information and skills to be acquired by the learner are created accordingly. The designs which depend
on structural approach are student oriented, they support co-operation in learning, are flexible, can be
adapted to different teaching/learning environments and the learner is active in the learning
environment and has responsibility for their own learning. Models such as ADDIE, which systematically
addresses the instructional design and is based on the approaches mentioned above, have an
implementation oriented structure (Leshin et al, 1992).
1. 2. ADDIE Design Model
ADDIE is an instructional design model which is valid for any kind of education and despite the fact
that ADDIE comprises the components of all other design models it is a relatively simple model. Its
name is an acronym of the capital letters of the words: Analyze, Design, Develop, Implement, and
Evaluate which comprise the five steps as follows (McGriff, 2000; Kaminski, 2007).
Analysis: This step is the description process of what is going to be taught and forms the basis of all
other steps. In this step, the designer determines the needs and the difference between knowledge,
skills and behaviors, which the learners presently have, and behaviors which they must have or they
are expected to have. In other words, needs analysis is conducted. The system is analyzed and the
problem and the roots of the problem are described. The constraints are determined and the possible
solutions for the problem are found.
Design: This is the determination process of how the information is going to be learnt. In this step,
the development strategy is determined in accordance with the data obtained during the analysis
phase and how the objectives will be reached is clarified. In other words, it is the part where the
instruction method, learning activities and evaluation process become clear. During the analysis
process, the tasks are separated into learning steps, thus, the design can be implemented in a more
accurate and easy way.
Development: All of the components of multimedia are prepared during this phase. This is the
process of producing the instruction materials, all the tools which will be used during instruction and
any kind of support materials. The product is created during this phase and an evaluation, which is
mostly for correction, is made and modifications are carried out if necessary. The detailed plan
prepared during the phases of analysis and the design is implemented and all the components of the
learning environment are developed and the environment is prepared for the test.
5
Implementation: Regardless of whether the end use will be in the classroom, laboratory or on a
computer, it is necessary to put the design into practice with the actual learners. The purpose of this
part is to introduce the designed instruction in a way that it will be effective and efficient. During this
phase, the students should be supported to ensure that they understand the material and they are
aware of the objectives and there should be no doubt that the information is being transferred to the
learner.
Evaluation: This is the process of determining the instruction is sufficient and measuring the effect in
order to check to what extent the design meets the learning objectives and the needs of learners. The
evaluation is directly related to all of the previous four stages, and it may be necessary to return to
any one of the previous stages at the end of this phase. Moreover, at the end of the each of the stages
an evaluation is made to ensure that the process is being carried out in a more sound manner then at
the end of each evaluation, modifications, if necessary, are made for the next implementation.
As stated above, the information technologies are given importance in terms of its role in the learning-
teaching process in the revised Primary School Curriculum. Information technology is included in
different curriculum such as Mathematics, Turkish and Social Sciences. However, it has been realized
that resources and implementations appropriate for the understanding of this new way of learning are
still limited. Therefore, it is necessary to further develop multimedia learning environments and this
study aims to contribute to this need to some extent.
Within the scope of this study, multimedia learning environments were developed according to the
ADDIE Design Model, for a 4th grade Mathematics course and each phase of the development is
explained through the following questions. By doing so, it aims to contribute to the development of
computer-based multimedia or learning environments.
a. What was done during analysis phase?
b. What was done during the design phase?
c. What was done during the development phase?
d. What was done during the implementation phase?
e. What was done during the evaluation phase?
f . What are the opinions of students about the setting created by the multimedia learning
environment which has been developed according to the ADDIE design model?
2. METHOD
2.1. Study group
The study group was composed of 85 students in the fourth grade in primary schools.
2.2. Data Collection Tools
In this study the data was collected through,
6
1. The multimedia learning environment, developed by the researcher,
2. A multiple choice test, prepared by the researcher in order to determine the effect of
developed learning environment on student’s achievement,
3. An evaluation form to determine the opinions of expert judgments on the learning
environment,
4. An evaluation form to determine the opinions of teachers on the learning environment,
5. A student opinion questionnaire and interview form to determine the opinions of students on
the learning environment.
The process followed during the preparation of these tools and the features of the tools was as follows:
- Multimedia Learning Environment: By taking into consideration the stages of the ADDIE
design model, one multimedia learning environment was developed on the subject of “Column
Graphic”, which is included in the Mathematics program of fourth grade primary school classes.
- Achievement Test: This was created to determine the effect of prepared environment on the
student’s achievement. This test consists of 18 questions, which examine the acquisitions
included in the instruction program concerning the column graphic topic. The opinions of a
measurement and evaluation expert were obtained for this test and the necessary
modifications to the texts and choices were made. Then, this test (pre-test form) was
administered to 46 students who were progressing to the 5th grade class, and had previously
been introduced to this subject. Finally, test of 15 items was used as the pre-test and post-
test. The KR-20 reliability coefficient calculated according to the item statistics of the chosen
items was .89.
- Evaluation Form on Expert Judgments’ Opinion: This was prepared to obtain the opinions
of expert judgments who examined the prepared multimedia learning environment. It consists
of 25 questions, with two choices of “Yes” and “No”. In addition, there is a recommendation
section which was expected to be completed, particularly when the answer given was “No”.
Before using this form, there was consultation with experts in the field of Computer Education
and Instructional Technologies as for the content reliability.
- Evaluation Form on Teacher Opinion: This contained of 6 open-ended questions, and was
given to the computer and mathematics teachers who were observers during the pre-
implementation. The questions were designed to determine whether the environment was
student-centered, encourages the students to think, provides the opportunity for co-operative
work, facilitates a connection with student’s everyday life, develops different perspectives and
ensures students make their own evaluation.
- Questionnaire on Student Opinion and Interview Form: A multiple choice questionnaire,
composed of six questions was given to the students who participated in the implementation
7
during the evaluation phase of the design. The questions included in the questionnaire were
about the issues concerning the developed learning environment: “ease-of-use”, “ensuring
cooperation”, “encouraging thinking”, “being enjoyable”, “ensuring that students can use what
they have learnt” and “they make a self evaluation ”. The first five questions have 3 choices,
which are “Yes”, “A little” and “No”. For the question concerning self evaluation, the choices
were “Weak”, “Medium”, “Good” and “Very Good”. An interview form was developed,
composed of open-ended questions which were similar to those in the questionnaire. These
questions aimed to detail the student opinions. The interview aimed to collect answers and
opinions not specified in the questionnaires.
3. FINDINGS
The findings obtained from the study are presented in the same sequence as the questions were
posed,
Concerning the multimedia learning environment developed according to the ADDIE Design Model;
a. What was done during the analysis phase?
First, the subject field and the target group were determined in the Analysis phase of the multimedia
learning environment developed according to the ADDIE Design Model. The subject field was
Mathematics and the target group was selected as primary school fourth grade classes. The target group
was also examined as for the features of development and learning including pre-learning, the degree of
readiness concerning the subject and use of technology. Examining the target group as for these features
guided the determination of the content and the design of the multimedia learning environment (ease-of-
use). When the ages of the learners and the fact that they are continuing to take computer literacy
course beginning from their 1st class at school, therefore, they have the prerequisite skills were taken
into consideration, it was assumed that they would not face problems in using the multimedia learning
environment which is computer based. After the determination of subject field and the target group, the
aim(s) this environment would fulfill and for which purposes it would be used were determined. By taking
into consideration that there are not many technology based materials available, it was decided that the
prepared environment can be used for different purposes. These purposes include ensuring that the
students can practice and review materials at their own learning speed, compensating for insufficient
learning which occurred during the course and ensuring that what has been learnt during the course can
be transferred to everyday life).
During the analysis phase, the technological, economic and durational constraints were determined,
which assisted in the decision as to the type of environment to be developed and the duration of that
development. In this phase, the determination of subject field, target group and planned environment
contributed to the determination of the objectives and tasks which would guide the Design step and,
finally a task schedule was prepared.
8
b. What was done during the design phase?
During the design phase, it was discussed how to teach the subject field by taking into consideration
the features of the target group. Thus, the acquisitions concerning the subject in the instruction
program were determined. The acquisitions concerning the subject of “Column Graph” were included in
the fourth grade primary school Curriculum as follows; “Student creates a column graph” and “Student
interprets a column graph”. It is therefore necessary to think about the content for these acquisitions
and to develop appropriate instruction methods, learning activities and evaluation processes. The
features of the environment to be developed were determined. It was decided that the environment,
would be prepared according to the determined acquisitions, would be designed taking into
consideration the personal characteristics of any individual and in a way that it would demonstrate the
differences between individuals. Furthermore, discussion environments would be created to encourage
the students to exchange ideas; to ensure communication between students; to give the control to
students and; to give guiding role to the teacher during the process. In this context, it emerged that
the interaction component of the environment must gain importance. In the design phase, the content
was formed and the components of the cycle were determined, thus, the general framework of the
design (for example the screen design) was developed. The references, where the subjects chosen for
the content design are included, were reviewed and the content concerning the Column Graph topic
was determined.
As a requirement of the new curriculum; an event from everyday life that the students can relate to
was taken as a basis and, thus, the students were asked to help the organization of a birthday party
for one of their friends. The birthday party to be organized can be approached as a problem.
Accordingly, there 8 items which students should consider in organizing the party, were determined.
These were; Place, Time, Cake, Drinks, Music, Decorations, Gifts and Games.
It was decided that column graphs would be used while conveying the data which the students needed
in order to make decisions on the stated themes. It was thought that deciding on stated themes and
making choices concerning the birthday party would be based on how they interpret the column graph.
The environment was designed in a way that the learners would be able to make the choice according
to their interpretation, in other words, no choice would be right or wrong. This ensured that what the
students’ choices were not important as long as they justified their choices. Moreover, it was decided
that during the implementation, the students would be provided with the opportunity of returning and
changing their choice.
At the end of the implementation, different parties would be possibly created as a result of personal
differences because each student would prepare the party content according to his/her choice. Time
was allowed for the learners to read the questions and interpret the graphs included in the themes and
to make choices, then a discussion environment was created and learners could compare their answers
and the teacher could guide the process when necessary. It was decided that, in addition to the theme
section, questions would be included to contribute to learning and here, the teacher would have an
9
active role in checking the answers with the students and explaining any elements not clearly
understood by members of the class.
c. What was done during development phase?
The components of multimedia, planned in the design phase, were developed in this phase. Prepared
texts, graphs and sound components were put together in a balanced way and the texts were
supported with sound. In addition, the development level of the students was taken into consideration
while preparing the visual materials and the backgrounds, colors, switches, pop-up windows, figures
and human characters were designed according to the target group.
After developing the environment, pre-implementation was carried out in order to test the developed
environment. The study group for the evaluation of the pre-implementation test was composed of 22
students from a fourth grade class. The students examined the multimedia learning environment which
was prepared in a computer laboratory.
At the end of pre-implementation, a multiple choice questionnaire and a questionnaire which included
open-ended questions were applied in order to obtain the opinions of students on the software.
Moreover, researchers observed the students while they were carrying out the implementation and
took necessary notes and tried to determine where they had difficulty while using the software or
where they had not understood. As a result of the observations made during pre-implementation, it
emerged that the students had not understood only the feedback on the questions and consequently
this feedback was improved. In addition, as a result of the observations, it was seen that some
students had opinions such as “the environment is noisy”. This interpretation was considered as
accurate but it is not possible to prevent some degree of noise in the external environment, particularly
when there is communication and cooperation in the class.
Concerning the learning environment, different evaluation forms were given to the expert judgment as
well as the mathematics and computer teachers in order to obtain their opinions on the multimedia
environment. For the similar purpose, a questionnaire and an interview form were also given to the
students. Expert judgments gave their recommendations after examining the multimedia learning
environment. In the evaluation form, teachers stated that they considered the environment as positive
because it ensured that “students work in cooperation, they can make interpretations and express their
ideas comfortably”. Moreover, they stated that “students are enjoying themselves in the environment”.
As a result of all the data, the necessary corrections were made and the environment was prepared for
the real implementation.
d. What was done during implementation phase?
After the pre-implementation, according to the opinions of students and teachers, the problematic or
missing parts of the environment were reviewed and as a result of all the modifications, the multimedia
learning environment was prepared for the real implementation. The real implementation was carried
10
out with 85 fourth grade students comprising 50 females and 35 males. During the implementation
process which was conducted in computer laboratory, first the pre-test was given to students then they
passed to implementation process and the implementation lasted for one class hour. This procedure
was carried out for all classes in one day. Researchers acted as the teacher for each class. No problem
was experienced during the implementation. The post-test was applied in an appropriate class hour
following the implementation, on the condition that there was no Mathematics lesson between these
two processes. The results collected from the pre- and post-test, such as the right or wrong answers
that the students gave, guided the review of the multimedia instructional environment.
e. What was done during evaluation phase?
As a result of implementation phase, in order to evaluate the environment, the effect of multimedia
learning environment on achievement levels was examined. The data from the pre and post tests was
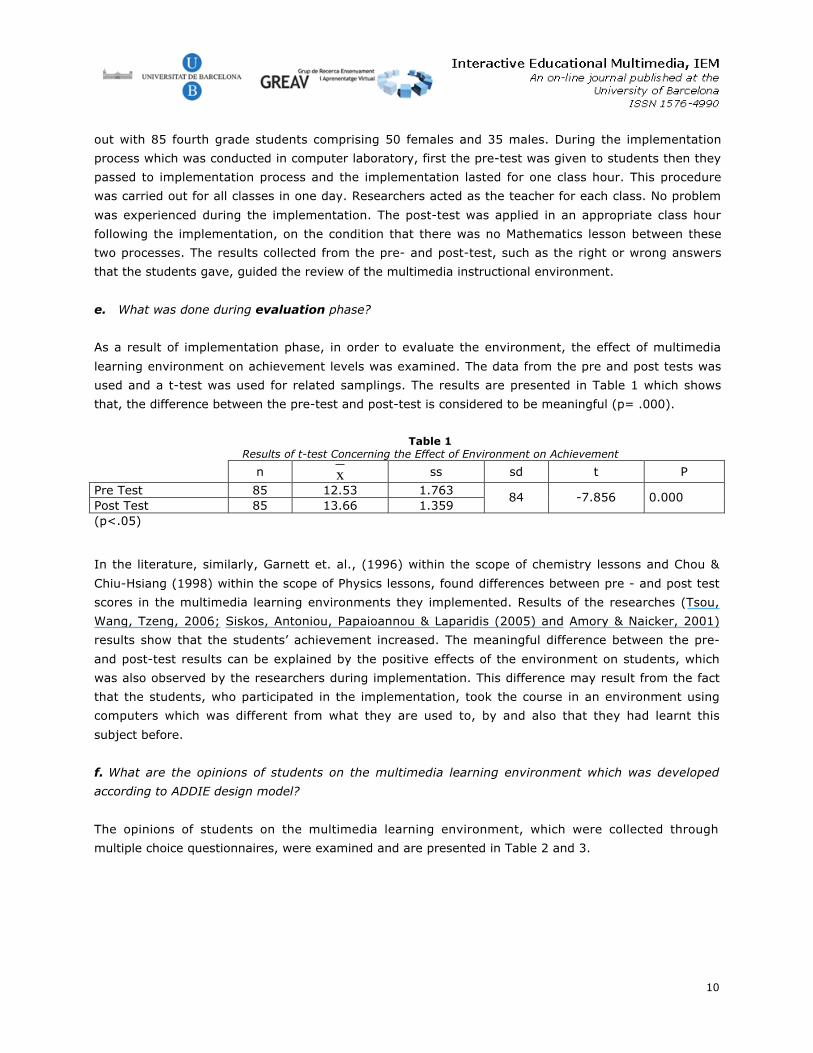
used and a t-test was used for related samplings. The results are presented in Table 1 which shows
that, the difference between the pre-test and post-test is considered to be meaningful (p= .000).
Table 1Results of t-test Concerning the Effect of Environment on Achievement
n x ss sd t P
Pre Test 85 12.53 1.763Post Test 85 13.66 1.359
84 -7.856 0.000
(p<.05)
In the literature, similarly, Garnett et. al., (1996) within the scope of chemistry lessons and Chou &
Chiu-Hsiang (1998) within the scope of Physics lessons, found differences between pre - and post test
scores in the multimedia learning environments they implemented. Results of the researches (Tsou,
Wang, Tzeng, 2006; Siskos, Antoniou, Papaioannou & Laparidis (2005) and Amory & Naicker, 2001)
results show that the students’ achievement increased. The meaningful difference between the pre-
and post-test results can be explained by the positive effects of the environment on students, which
was also observed by the researchers during implementation. This difference may result from the fact
that the students, who participated in the implementation, took the course in an environment using
computers which was different from what they are used to, by and also that they had learnt this
subject before.
f. What are the opinions of students on the multimedia learning environment which was developed
according to ADDIE design model?
The opinions of students on the multimedia learning environment, which were collected through
multiple choice questionnaires, were examined and are presented in Table 2 and 3.
11
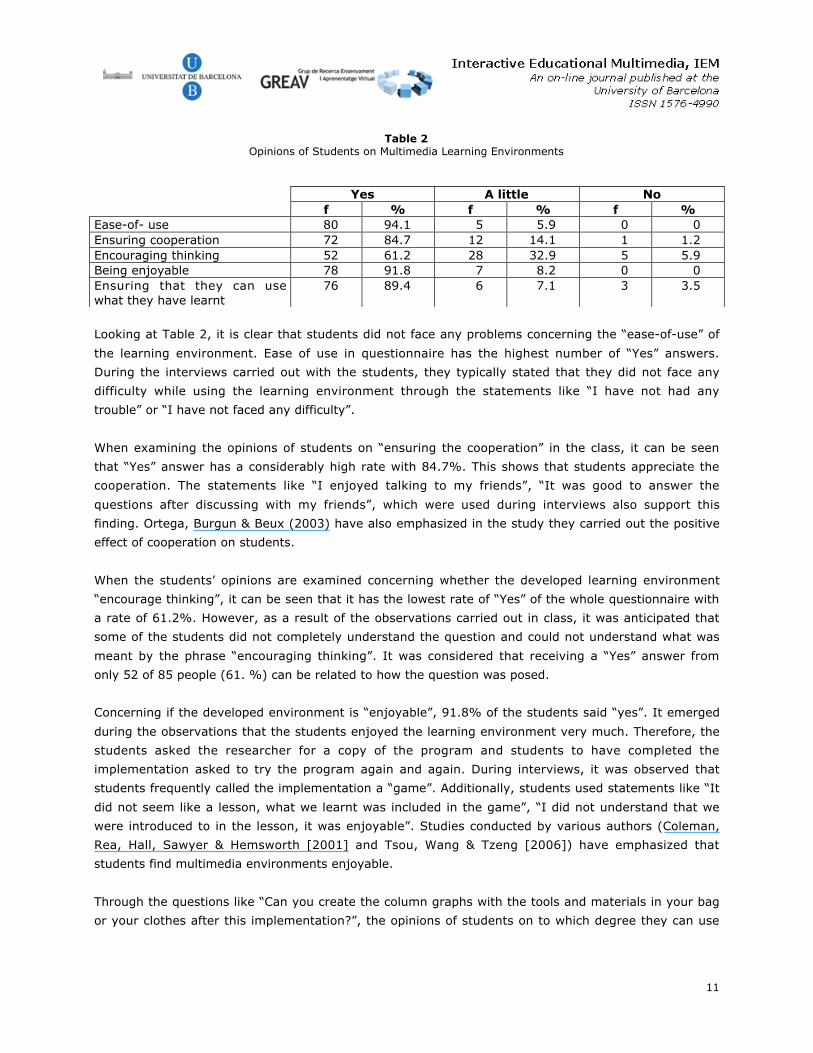
Table 2Opinions of Students on Multimedia Learning Environments
Looking at Table 2, it is clear that students did not face any problems concerning the “ease-of-use” of
the learning environment. Ease of use in questionnaire has the highest number of “Yes” answers.
During the interviews carried out with the students, they typically stated that they did not face any
difficulty while using the learning environment through the statements like “I have not had any
trouble” or “I have not faced any difficulty”.
When examining the opinions of students on “ensuring the cooperation” in the class, it can be seen
that “Yes” answer has a considerably high rate with 84.7%. This shows that students appreciate the
cooperation. The statements like “I enjoyed talking to my friends”, “It was good to answer the
questions after discussing with my friends”, which were used during interviews also support this
finding. Ortega, Burgun & Beux (2003) have also emphasized in the study they carried out the positive
effect of cooperation on students.
When the students’ opinions are examined concerning whether the developed learning environment
“encourage thinking”, it can be seen that it has the lowest rate of “Yes” of the whole questionnaire with
a rate of 61.2%. However, as a result of the observations carried out in class, it was anticipated that
some of the students did not completely understand the question and could not understand what was
meant by the phrase “encouraging thinking”. It was considered that receiving a “Yes” answer from
only 52 of 85 people (61. %) can be related to how the question was posed.
Concerning if the developed environment is “enjoyable”, 91.8% of the students said “yes”. It emerged
during the observations that the students enjoyed the learning environment very much. Therefore, the
students asked the researcher for a copy of the program and students to have completed the
implementation asked to try the program again and again. During interviews, it was observed that
students frequently called the implementation a “game”. Additionally, students used statements like “It
did not seem like a lesson, what we learnt was included in the game”, “I did not understand that we
were introduced to in the lesson, it was enjoyable”. Studies conducted by various authors (Coleman,
Rea, Hall, Sawyer & Hemsworth [2001] and Tsou, Wang & Tzeng [2006]) have emphasized that
students find multimedia environments enjoyable.
Through the questions like “Can you create the column graphs with the tools and materials in your bag
or your clothes after this implementation?”, the opinions of students on to which degree they can use
Yes A little Nof % f % f %
Ease-of- use 80 94.1 5 5.9 0 0Ensuring cooperation 72 84.7 12 14.1 1 1.2Encouraging thinking 52 61.2 28 32.9 5 5.9Being enjoyable 78 91.8 7 8.2 0 0Ensuring that they can usewhat they have learnt
76 89.4 6 7.1 3 3.5
12
what they have learnt or transfer the knowledge were examined. It was seen that students answered
this question as “yes”, with a rate of 89.4%. Having a meaningful difference between the pre and-post
tests concerning learning environment supports this finding.
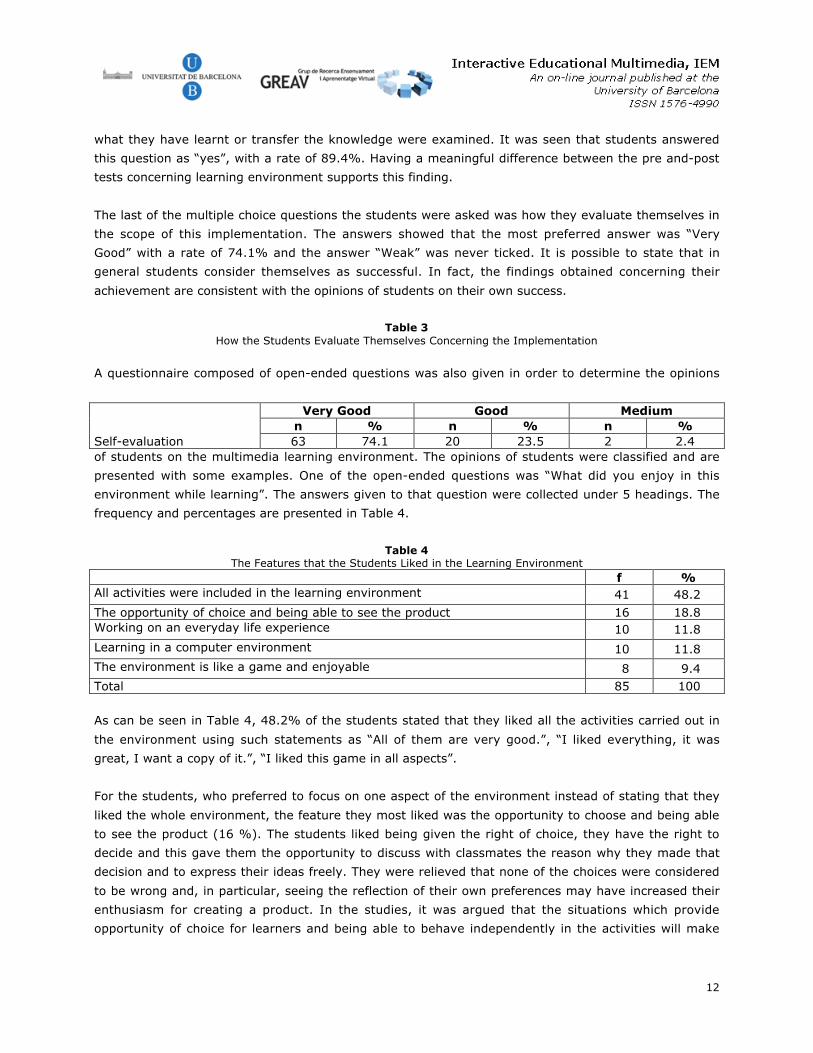
The last of the multiple choice questions the students were asked was how they evaluate themselves in
the scope of this implementation. The answers showed that the most preferred answer was “Very
Good” with a rate of 74.1% and the answer “Weak” was never ticked. It is possible to state that in
general students consider themselves as successful. In fact, the findings obtained concerning their
achievement are consistent with the opinions of students on their own success.
Table 3How the Students Evaluate Themselves Concerning the Implementation
A questionnaire composed of open-ended questions was also given in order to determine the opinions
of students on the multimedia learning environment. The opinions of students were classified and are
presented with some examples. One of the open-ended questions was “What did you enjoy in this
environment while learning”. The answers given to that question were collected under 5 headings. The
frequency and percentages are presented in Table 4.
Table 4The Features that the Students Liked in the Learning Environment
f %All activities were included in the learning environment 41 48.2
The opportunity of choice and being able to see the product 16 18.8Working on an everyday life experience 10 11.8
Learning in a computer environment 10 11.8The environment is like a game and enjoyable 8 9.4Total 85 100
As can be seen in Table 4, 48.2% of the students stated that they liked all the activities carried out in
the environment using such statements as “All of them are very good.”, “I liked everything, it was
great, I want a copy of it.”, “I liked this game in all aspects”.
For the students, who preferred to focus on one aspect of the environment instead of stating that they
liked the whole environment, the feature they most liked was the opportunity to choose and being able
to see the product (16 %). The students liked being given the right of choice, they have the right to
decide and this gave them the opportunity to discuss with classmates the reason why they made that
decision and to express their ideas freely. They were relieved that none of the choices were considered
to be wrong and, in particular, seeing the reflection of their own preferences may have increased their
enthusiasm for creating a product. In the studies, it was argued that the situations which provide
opportunity of choice for learners and being able to behave independently in the activities will make
Very Good Good Mediumn % n % n %
Self-evaluation 63 74.1 20 23.5 2 2.4
13
the activities more meaningful for the learners, will ensure that they adopt them, will increase their
motivation and will improve their skills (Alessi & Trollip, 2001). In addition, Chou (1998) and Bolliger
(2004) state that the freedom and the provision of choice which is provided for the students in their
multimedia learning environment is one of the reasons why they obtain positive results. Statements
such as “What I liked most was that I could choose the features of the party”, “What I liked was that I
could choose the cake, music”, which are included in the interviews carried out with students also
supports this finding.
Working on an everyday life experience, such as organizing a party, is another feature that students
liked and 10% of the students emphasized this fact. The importance of taking everyday life topics for
problem solving or projects can be understood at this point. It is possible to state that this may also be
the reason why students let themselves get deeply involved in the process. Some students even stated
that they would implement some of their choices in their own birthday party. Moreover, even the
participation of students who are not normally involved in the lesson is ensured because this
implementation provides the opportunity of using examples from their lives. Therefore, Alessi & Trollip
(2001) have recommended that learning environments should be designed in a way to enable making
connections with daily life and finding many ways of solving problems. In addition, in the study
conducted by Garnett et al. (1996), attention was paid to establishing the environment based on the
examples from daily life and it was found that restructuring multimedia learning environment has a
meaningful effect on achievement.
Another point which was touched upon was the learning/working column graph in the computer
environment and students explained their answers through the idea of “having learnt how to create a
column graph by this method” in general. After seeing the acquisitions in the prepared environment,
maybe the students compared them with other environments where they can learn the same topic and
in a sense they emphasized the positive effect of learning the topic in a multimedia learning
environment.
The last answer is that the implementation is “like a game” this answer to this question does not have
a high rate from all the answers given nevertheless, particularly during interviews, almost all students
used the word “game” while talking about the implementation and stated how they enjoyed it.
Moreover, the word ‘game’ was also used in different parts of the questionnaire, where the
implementation was defined. Assessing the material as a game can be one of the factors which
motivate them. Garris, Ahlers, Driskel & James (2002) stated that adding some specific features of
computer games to the curriculum has increased the motivation of the students. In addition Coleman,
Rea, Hall, Sawyer & Hemsworth (2001) and Tsou, Wang, Tzeng (2006) have emphasized the
contributions of an enjoyable environment in their studies.
The factors that the students liked and did not like in the learning environment were asked. However,
the students did not state any factor that they did not like.
14
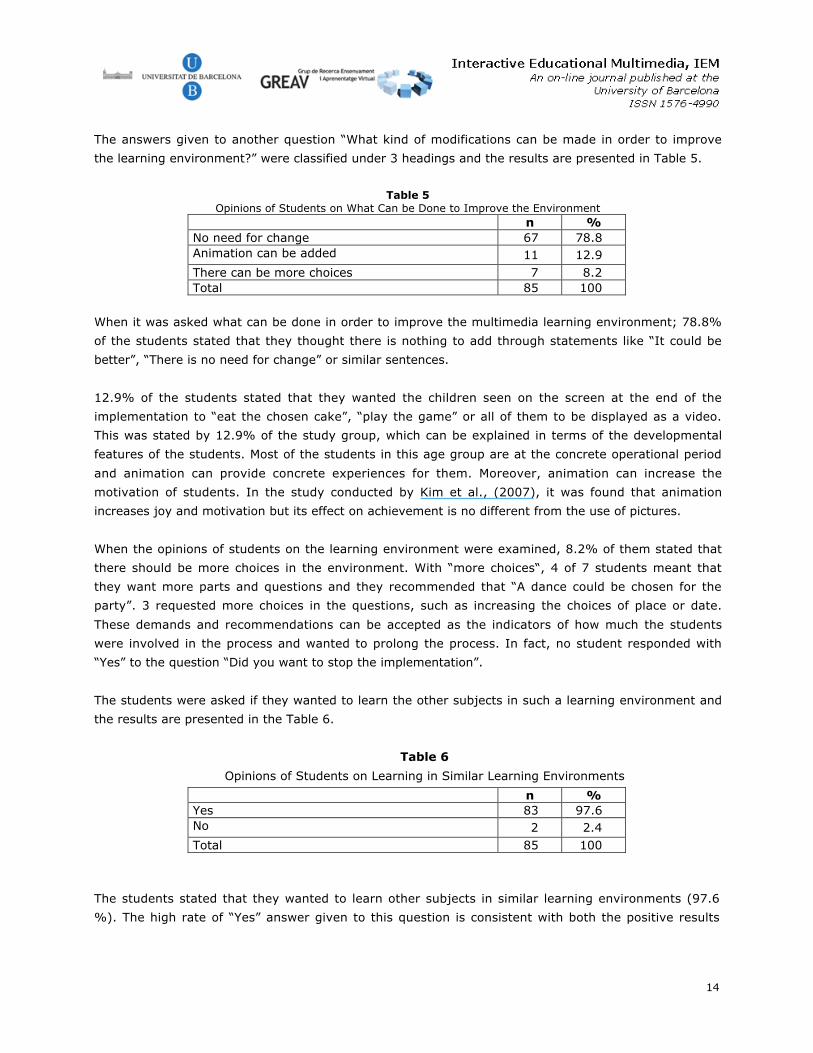
The answers given to another question “What kind of modifications can be made in order to improve
the learning environment?” were classified under 3 headings and the results are presented in Table 5.
Table 5Opinions of Students on What Can be Done to Improve the Environment
n %No need for change 67 78.8Animation can be added 11 12.9There can be more choices 7 8.2Total 85 100
When it was asked what can be done in order to improve the multimedia learning environment; 78.8%
of the students stated that they thought there is nothing to add through statements like “It could be
better”, “There is no need for change” or similar sentences.
12.9% of the students stated that they wanted the children seen on the screen at the end of the
implementation to “eat the chosen cake”, “play the game” or all of them to be displayed as a video.
This was stated by 12.9% of the study group, which can be explained in terms of the developmental
features of the students. Most of the students in this age group are at the concrete operational period
and animation can provide concrete experiences for them. Moreover, animation can increase the
motivation of students. In the study conducted by Kim et al., (2007), it was found that animation
increases joy and motivation but its effect on achievement is no different from the use of pictures.
When the opinions of students on the learning environment were examined, 8.2% of them stated that
there should be more choices in the environment. With “more choices“, 4 of 7 students meant that
they want more parts and questions and they recommended that “A dance could be chosen for the
party”. 3 requested more choices in the questions, such as increasing the choices of place or date.
These demands and recommendations can be accepted as the indicators of how much the students
were involved in the process and wanted to prolong the process. In fact, no student responded with
“Yes” to the question “Did you want to stop the implementation”.
The students were asked if they wanted to learn the other subjects in such a learning environment and
the results are presented in the Table 6.
Table 6
Opinions of Students on Learning in Similar Learning Environments
n %Yes 83 97.6No 2 2.4Total 85 100
The students stated that they wanted to learn other subjects in similar learning environments (97.6
%). The high rate of “Yes” answer given to this question is consistent with both the positive results
15
gathered in many studies, resources and with the findings of this study. It can be stated that students
saw and experienced many of the advantages of multimedia and responded to the questionnaire
accordingly. Many researchers (Garcia, Quiros, Santos, Gonzales & Fernanz [2005], Messer, Kan,
Cameron & Robinson [2002]) have stated that multimedia arouses considerable interest in learners
and they prefer a multimedia learning environment. Speaker (2004) researched the effect of
introducing a lesson using multimedia on the preference and selection of this lesson by the learners,
and a statistically meaningful difference was found. In other words, it can be stated that students
prefer the courses, which use multimedia and would like to attend lessons given by the teachers who
use multimedia. The results of this study also support the findings.
4. RESULTS AND CONCLUSION
The necessity of training individuals according to the needs of the current era has raised the need to
creating opportunities in the primary schools instruction programs and new instruction programs have
been prepared by the Ministry of National Education (MoNE). When the program was examined, it was
seen that the Skill for Using Information Technologies is one of the 8 skills specified in the new
instruction program. Moreover, using information technologies during learning and teaching was
highlighted in the new program. However, it was observed that resources and implementations
appropriate for the understanding of this new instruction program remain limited. Within the scope of
this study, a multimedia learning environment was developed according to the ADDIE Design Model for
a topic in the Mathematics course of fourth grade primary classes and the phases of development were
explained one by one. Thus, this work aims to contribute to the development of computer based
multimedia or learning environments.
The subject field was determined as Mathematics and the target group as primary school fourth grade
classes in the analysis phase of the study. The target group was also examined for features of
development and learning including; pre-learning, the degree of readiness concerning the subject and
use of technology. By taking into consideration that there are not many technology based materials
available, it was decided that prepared environment can be used for different purposes such as ensuring
the students practice and review according to their own learning speed, compensating for insufficient
learning occurring during the course and ensuring that what was learnt during the course are transferred
to everyday life.
During the design phase, it was discussed how to teach the subject field by taking into consideration
the features of the target group. Thus, the acquisitions concerning the subject in the instruction
program were determined. Content was developed for these acquisitions and appropriate instruction
methods, learning activities and evaluation processes were developed in line with these acquisitions to
determine the features of the environment. In addition, the measurement tools were developed.
During the Development phase, the components of multimedia, which were planned during the design
phase of the study, were developed. The students examined the multimedia learning environment
which was prepared in a computer laboratory. Prepared texts, graphs and sound components were put
16
together in a balanced way and the texts were supported with sound. After developing the
environment, pre-implementation was made in order to test the developed environment. The study
group for the evaluation of the pre-implementation was composed of 22 students from a fourth grade
class. At the end of pre-implementation, a multiple choice questionnaire and a questionnaire, which
included open-ended questions, were applied in order to obtain the opinions of students on the
software. Concerning the learning environment, a questionnaire was given to the mathematics and
computer teachers, as well as the students, in order to obtain teachers opinions about the multimedia
environment. The opinions of specialists on the issue were also taken. As a result of all these data,
necessary modification were made to text and switches and environment was prepared for the real
implementation by adding new visual materials in some parts.
During the evaluation phase, the effect of the multimedia learning environment on achievement was
examined in order to evaluate the environment and the difference between pre- and post-test results
was found to be meaningful. The results gathered from the questionnaires on learning environment
have contributed to reviewing the multimedia environment which was created for this study.
When the opinions of students on the ease-of-use of the learning environment were examined, it was
seen that students had not experienced any difficulty in using the software; when the opinions of
students on ensuring cooperation in learning environment were examined, it is seen that students
stated their appreciation concerning activities for cooperation in the learning environment; when the
opinions of students on facilitating thinking were examined, it is seen that this question has the lowest
positive response rate with 61.2%. Concerning having an enjoyable learning environment, 91.8% of
the students gave the answer “yes”. When opinions on whether the learning environment encourages
the students to use what they have learnt were examined, 89.4% of students answered “Yes”. The
students were asked to make self-evaluation according to the result of implementation and 74.1% of
the students evaluated themselves as “Very Good”. Moreover, the results gathered from the opinions
of students and teachers revealed that they want more animation to be included in the multimedia
environment.
5. RECOMMENDATIONS
With the experience gained in this study, it is possible to state that using an instruction model during
the process of designing instruction material facilitates the process and moreover guides the evaluation
of the process. Thus, it is recommended that the designer of the instruction should develop the
material according to a model. As was mentioned previously, multimedia learning environment was
tested on primary school students during the Evaluation phase and its effect on achievement was
examined. The permanence of learning can be measured by interrupting the delivery of learning
materials for 2 to 3 weeks and then making another implementation. The effect of the learning
environment on achievement can be examined according to the purpose of use (face-to-face or review
and making practice).
Moreover, by taking into consideration the issues that the designer faces during this process, for
designers, it is possible to state that ADDIE Model which was described as a linear mode in the
17
literature is a cyclic model when it is considered that each phase can refer back to previous phases or
forward to the next phases. Therefore, the ADDIE Model will be more effective in solving the problems
if it is utilized in this cyclical way.
References
Allesi, S. M. ve Trollip, A. R. (2001). Multimedia for learning: Methods and development. 3rd ed.. Massachusetts:Allyn and Bacon.
Amory, A. & Naicker, K. (2001). Web-based notes is an inadequate learning resource. In C. Montgomerie & J. Viteli(Eds.), Proceedings of World Conference on Educational Multimedia, Hypermedia and Telecommunications 2001 (pp. 37-42). Chesapeake, VA: AACE.
Bass, R. (1994). A brief guide to interactive multimedia and the study of the United States. Retrived November 15,2006, from http://www9.georgetown.edu/faculty/bassr/multimedia.html
Bolliger, D. U. (2004). Investigating student learning in a constructivist multimedia-rich learning environment.Paper presented at the annual meeting of the Association for Educational Communications and Technology,Chicago, IL. (ERIC Document Reproduction Service No. ED485028).
Chou, C. (1998). The effectiveness of using multimedia computer simulations coupled with social constructivistpedagogy in a college introductory physics classroom, Retrived November 15, 2006, fromhttp://digitalcommons.libraries.columbia.edu/dissertations/AAI9839055/
Coleman, G., Rea, T., Hall, M., Sawyer, A. & Hemsworth P. H. (2001). Multimedia training in the Pig Industry.Computers & Education. 37, 257–271.
Garcia, R., Quiros, J. S., Santos, R. G., Gonzales, S. M. & Fernanz, S. M. (2005), Interactive multimedia animationwith Macromedia Flash in descriptive geometry teaching. Computers & Education. 49, (3), 615-639.
Garnett, P., Hackling, M., & Oliver, R. (1996). Development of an interactive multimedia package designed toimprove students’ understanding of chemical equations. In WASEA Conference Proceedings (pp. 65 – 72).Perth: Australia.
Graham, D., & Hussain, A. (2006). Multimedia, a course in the information technology programme. Retrived Mayıs23, 2007 from http://www.cs.stir.ac.uk/courses/IT82/
Heath, S. (2000). Multimedia and communications technology (2nd ed.). Boston: Focal Press.
Heinich R., Molenda M., Russell JD. & Smaldino, S. E. (2002). Instructional media and technologies for learning,Washington: Merrill Prentice Hall.
Jonassen, D. H., Peck, K. L., & Wilson, B. G. (1999). Learning with technology: A constructive perspective. NewJersey: Prentice-Hall Inc.
Kaminski, J. (2007). Use ADDIE to design online courses. Retrived June 24, 2007 from http://www.nursing-informatics.com
Kim, S., Yoon, M., Whang, S. M., Tversky, B. & Morrison, J. B. (2007). The effect of animation on comprehensionand interest. Journal of Computer Assisted Learning. 23, (3), 260-270.
Leshin, C. B., Pollock, J., & Reigeluth, C. M. (1992). Instructional design strategies and tactics. New Jersey:Englewood Cliffs, Education Technology Publications.
Marmara University. (2003). Compıuter based multimedia applications. [Bilgisayar destekli medya uygulamalarıders programı]. Retrieved May 24, 2007 from http://iletisim.marmara.edu.tr/bilisim/BilDesMedUyg.htm.
Mayer, R. E. (2001). Multimedia learning. Cambridge: Cambridge University Press.
McCauley, G. (2000), The interactive multimedia software Project. A planning and development guide, Retrived May18, 2005 from http://home.earthlink.net/~gmmccauley/the_im_project.pdf
18
McGriff, S. J. (2000). Instructional system design (ISD): Using the ADDIE model. Retrived June 23, 2006 fromhttp://www.personal.psu.edu/faculty/s/j/sjm256/portfolio/kbase/IDD/ADDIE.pdf
Messer, L. B., Kan, K., Cameron, A., & Robinson R. (2002). Teaching paediatric dentistry by multimedia: A three-year report. Eur J Dent Educ. 6, 128–138.
Ministry of National Education (MoNE). (2004). Grade 1 – 8 mathemetics curriculum. [1 – 8 Matematik ilkö_retimprogramı]. Ankara.
Neo, M., & Neo, K. (2001). Innovative teaching: Using multimedia in a problem-based learning environment.Educational Technology & Society, 4 (4), 19 – 21.
Newby, T. J., Stepich, D. A., Lehman J. D., & Russell J. D. (2000). Instructional technology for teaching andlearning. Designing instruction, integrating computers, and using media. Washington: Merrill Prentice Hall.
Ortega, E. M., Burgun, A., & Beux, P.L. (2003). Designing a collaborative and multimedia learning environment formedical simulation-based training. In G. Richards (Ed.), Proceedings of World Conference on E – learning inCorporate, Government, Healthcare, and Higher Education 2003 (pp. 1336-1343). Chesapeake, VA: AACE.
Roblyer, M. D. (2003). Integrating educational technology into teaching. Washington: Merrill Prentice Hall.
Siskos, A., Antoniou, P., Papaioannou, A., & Laparidis, K. (2005). Effects of multimedia computer-assistedinstruction (MCAI) on academic achievement in physical education of Greek primary students, InteractiveEducational Multimedia. 10, 61-77.
Smith, L. (2002). Multimedia, what, why, how. 31N5: Multimedia and HCI. Retrived April 3, 2004 fromhttp://www.cs.stir.ac.uk/courses/IT82/Handouts/Intro2004_color.pdf.
Speaker, K. (2004). Student perspectives: Expectations of multimedia technology in a college literature class.Reading Improvement. 41 (4) Wint 2004, The H.W. Wilson Company.
Tsou,W., Wang, W. & Tzeng, Y. (2006). Applying a multimedia storytelling website in foreign language learning,Computers & Education. 47, 17–28.
19
In order to reference this document
Arkün, S. & Akkoyunlu, B (2008). A study on the development process of a multimedialearning environment according to the ADDIE model and students’ opinions of themultimedia learning environment. Interactive Educational Multimedia, 17, 1-19.Retreived dd/mm/yyyy, from www.ub.es/multimedia/iem
Copyright
If the opposite does not indicate itself, the texts published in Interactive EducationalMultimedia, IEM, are under a license Attribution-Noncommercial-No Derivative Works 2,5S p a i n , of C r e a t i v e C o m m o n s . All the conditions of use in:http://creativecommons.org/licenses/by-nc-nd/2.5/es/deed.en_US
In order to mention the works, you must give credit to the authors and to this Journal.
Interactive Educational Multimedia, IEM, does not accept any responsibility for the points ofview and statements made by the authors in their work.
Subscribe & Contact IEM
In order to subscribe to IEM, please fill out the form at www.ub.es/multimedia/iem (link:REGISTER)
20
Interactive Educational Multimedia, Number 17 (October, 2008), pp. 20-28http://www.ub.edu/multimedia/iem / [email protected]
University students’ differences on attitudes towards computer use.Comparison with students’ attitudes towards physical activity
Evangelos Bebetsos & Panagiotis [email protected]
Dept. of Phy. Ed. & Sport ScienceDemocritus University of Thrace, Komotini, Hellas
Summary
The aim of this study was to discover the differences on attitudes of Greek PhysicalEducation students towards the subject of computers, in comparison with theirinvolvement in physical activities (PA). The sample consisted of 165 freshmenstudents, 93 males and 72 females. They completed the “Computer Attitude Scale”questionnaire (Selwyn, 1997) of 21 items which consist four factors (affect, perceivedusefulness, perceived control, and behavioural) Additionally, each student received adiary where s/he should write down his/her daily physical activities (Samouel & Lee,2001) for 26 days. The diary was related to the computer usage and the occupationwith physical activity. The results indicated gender differences on two factors, “affect”and “perceived usefulness”. No gender differences were indicated on PA. Thestudents spent more of their free time on computer usage than doing a PA. Overall,the study supported previous results on gender differences and indicated thatstudents turn into computer usage rather than enjoying other activities.
Keywords
Attitudes; computers; physical activity.
Introduction
Attitudes are a personal factor and they are referring to one’s positive or negative judgement about a
concrete subject. Attitudes are determined by the analysis of the information regarding the result of an
action and by the positive or negative evaluation of these results (Ajzen & Fishbein, 1980). Aizen
(1988) specifies the word ‘attitude’ as an inclination which can be taught and can make people react to
a matter either in a positive or negative way. Attitudes can be taught either through imminent
21
experience or by other people. They reflect the way people think of, feel and intend to react under
certain circumstances. The development of different human activity sectors and consequently
behavior, are effected by computers and information communication technology in general. Past
research indicated that computer confidence and computer attitudes (Smith, Caputi, Crittenden,
Jayasuriya, & Rawstorne, 1999). Garland and Noyes (2005) pointed out that in the educational
context, confidence should lead to more positive attitudes towards computers, and this will enhance
learning and associated activities. Woodrow (1994) mentioned that the primary goal behind the
implementation of computers in education is the utilisation of them by the students.
Additionally, information technology and computers dexterities constitute a major part of educational
programs (Thomas & Stratton, 2006). Previous research in relation to gender differences in computer-
related attitudes in general, has shown that male students have more positive attitudes towards
computers, including anxiety, confidence, and liking, than female students (AiJabri, 1996; Tsai, Lin, &
Tsai, 2001). Another study indicated that most females tend to view technology as a tool while males
tend to view technology as a toy. Men try to compete and win, while women use the computer only to
help them attain their goal (Eck, Hale, Ruff, & Tjelmeland, 2002). Nigg (2003) indicated that
technological advantages have helped the development of highly physical activity interventions,
allowing large populations to participate in them.
Physical activity (PA) also is an integral part of education. According to the curriculum, one of its main
aims is to get students to have positive attitudes towards PA so that they will adopt a permanent
athletic lifestyle. The theories about attitudes mentioned above (Papaioannou, Theodorakis & Goudas
1999) explain to us how students can adopt a healthy way of life.
Kruscas’ (1999) survey, aimed on the examination of senior high school students’ attitudes towards
physical education (PE) programme. Another aim was to specify these program points which seem to
contribute to the development of the positive and negative attitudes towards PE and PA, in senior high
school. Results showed that the positive attitudes towards PE and PA were decreased between the last
class of primary school (around 12 years old) and the second class of junior high school (around 14
years old). Such a result was more obvious to girls rather than boys.
The surveys conducted in the field of PE and PA are influenced by the field of technology. Access to
World Wide Web (www) and personal computers highlight the meaningfulness of this development
(Nigg, 2003). Nigg (2003) examined the influence of technology on different aspects regarding
physical activity. After retrospection in bibliography, it was shown that technology contributed to a
temporary decrease in the occupation with physical activity. However, technology plays an important
role in the field of business, as far as physical activity is concerned. There are several web pages which
are occupied with issues about health and physical activity. Hence the role of technology is important
since it offers information about physical activity and a healthy lifestyle.
Samouel and Lee (2001) conducted a survey whose target was to determine the models of personal
computers’ usage among adolescents in Hong Kong and to examine whether it is connected to less PA
and less occupation with the social relations among adolescents. A number of 2.110 junior high school
22
students were questioned. The results of the survey showed that the male students who used a
computer in order to do their homework or school projects and have access to the Internet were
occupied with physical activities in the form of team sports. On the other hand, those who used a
computer to play computer games were not social enough and did not work out very often. As far as
the female students were concerned, their occupation with computers did not influence their lifestyle.
Finally, another research was conducted by Selwyn (1997) and its aim was to develop and testify a
theoretical parameter concerning students’ attitudes towards personal computers. There was shaped a
scale which consisted of four sub-scales: a) the emotional factor, b) the perceiving usage, c) the
perceiving control and d) the behavioural element. The results of the research showed that the scale
had a high-level internal credibility and validity. The researcher claims that the scale can be used for
the record of the attitudes towards computers in different fields of education. Moreover it can be used
for the tracking down of the main differences among the children’s attitudes, regarding their sex and
socioeconomic status.
The aim of the present survey was twofold: (a). To examine the university students’ differences on
attitudes towards computers, and (b). To examine whether or not the use of new technologies
(computers) affect students’ physical activity.
Method and procedure
Sample
The sample consisted of 165 freshmen university students, 93 males and 72 females between the ages
of 18-22 (M±19.3).
Instruments
The questionnaire ‘Computer Attitude Scale’ (Selwyn, 1997) were allocated to all students. The
questionnaire was translated into Greek in an earlier study (Antoniou, Patsi, Bebetsos, & Ifantidou,
2006). Additionally, each student received a diary where s/he wrote down his/her daily physical
activities (Samouel & Lee, 2001) for 26 days. The diary was related to the computer usage and the
occupation with physical activity. Because the students belonged to the Physical Education
Department, it was made clear to them before the completion of the diary, that physical activity
included activities only in their free-time (after university class hours).
The questionnaire ‘Computer Attitude Scale’ consisted of four sub-scales. They included:
1. 6 questions about “affect” (emotions about computers), (eg. Using a computer does not scare
me at all)
2. 5 questions about “perceived usefulness” (opinions and information regarding computers), (eg.
Computers help me organise my work better)
23
3. 6 questions about “perceived control” (intentions and actions in which there is shown a respect
towards computers) (eg. I can make the computer to do what I want it to) and,
4. 4 questions about “behavioural” (perceiving inactivity or difficulty in using a computer), (eg. I
will use computers regularly throughout college).
The answers were given on a 5-point scale, ranging from 1=Strongly Disagree to 5=Strongly Agree.
In parallel, a diary for tracking down activities (Samouel & Lee, 2001) was allocated to all students.
The diary included four questions regarding computer use and seven questions regarding the
occupation with physical activity. The former ones are given below:
(Computer use) How much time did you spend:
a) doing your homework? b) playing games? c) surfing the Net? d) communicating with others through
e-mail or chatting with them?
(Occupation with physical activity) How much time did you spend:
a) cycling? b) doing aerobics? c) doing weight-lifting? d) doing any sport? e) working out in a gym? f)
working out at home? g) walking e.g. in a park?
Procedure
The questionnaire and the diary were handed in all students. The students filled in the questionnaire
and returned them straightaway. Yet, the diary was completed daily – for a total of 26 days – while
they were at home, recording in minutes the time they spent for computer use and the time they
spent doing any physical activity.
Statistical analyses
There were used the following analyses: Reliability analysis, independed t-test analysis (the verification
statistic of variation among averages for independent specimens) in order to find any possible gender
differences on attitudes towards exercise, and univariate analysis in order to find any possible gender
differences on attitudes towards computers.
Results
Psychometric characteristics
Using the Cronbach coefficient _ internal consistency, the results showed that for “Effect” was .83, for
“Perceived Usefulness” was .72, for “Perceived Control” was .76, and for “Behavioral” was .79. All
values are over .70 so reliability is accepted.
24
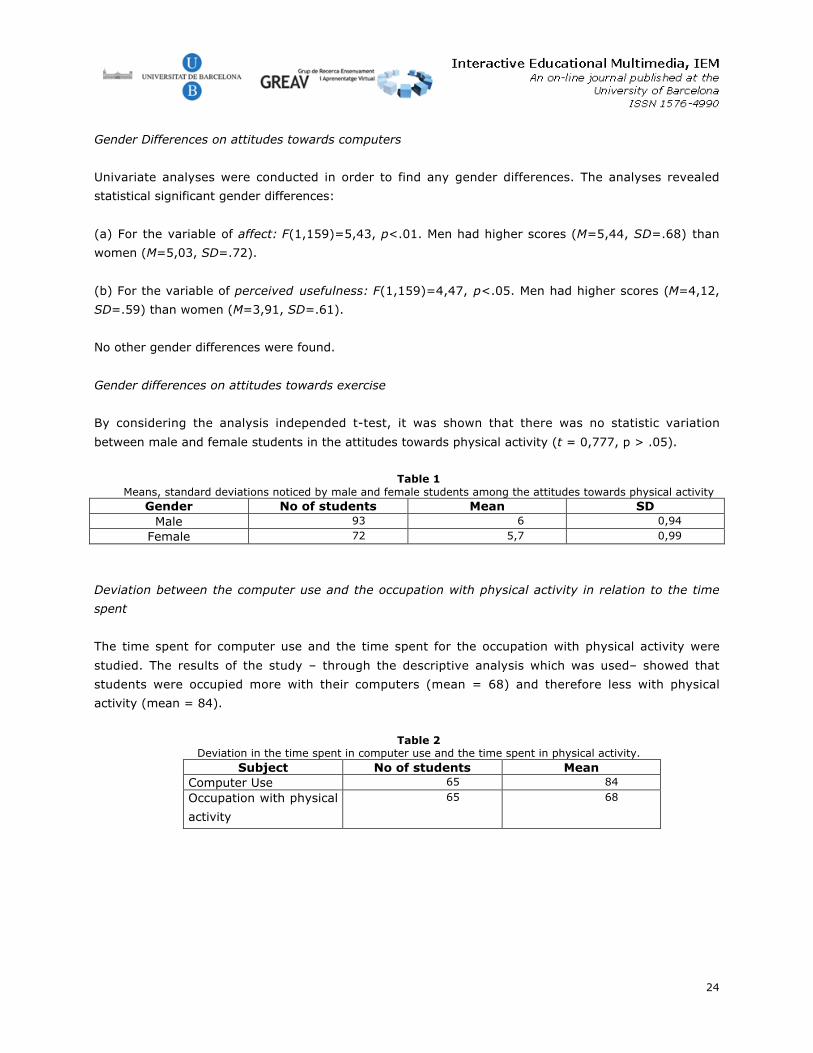
Gender Differences on attitudes towards computers
Univariate analyses were conducted in order to find any gender differences. The analyses revealed
statistical significant gender differences:
(a) For the variable of affect: F(1,159)=5,43, p<.01. Men had higher scores (M=5,44, SD=.68) than
women (M=5,03, SD=.72).
(b) For the variable of perceived usefulness: F(1,159)=4,47, p<.05. Men had higher scores (M=4,12,
SD=.59) than women (M=3,91, SD=.61).
No other gender differences were found.
Gender differences on attitudes towards exercise
By considering the analysis independed t-test, it was shown that there was no statistic variation
between male and female students in the attitudes towards physical activity (t = 0,777, p > .05).
Table 1Means, standard deviations noticed by male and female students among the attitudes towards physical activity
Gender No of students Mean SDMale 93 6 0,94
Female 72 5,7 0,99
Deviation between the computer use and the occupation with physical activity in relation to the time
spent
The time spent for computer use and the time spent for the occupation with physical activity were
studied. The results of the study – through the descriptive analysis which was used– showed that
students were occupied more with their computers (mean = 68) and therefore less with physical
activity (mean = 84).
Table 2Deviation in the time spent in computer use and the time spent in physical activity.
Subject No of students MeanComputer Use 65 84
Occupation with physical
activity
65 68
25
Discussion
The aim of the present survey was twofold: (a). To examine the students’ differences on attitudes
towards computers, and (b). To examine whether or not the use of new technologies (computers)
affect students’ physical activity.
The analyses in the present study have shown that there were statistical significant differences on two
variables due to gender, perceived usefulness and affective. More specifically, men were more positive
in the idea to use computers than women. Previous research has shown mixed results. Robertson,
Calder, Fung, Jones and O’Shea (1995) identified that female students had less positive attitudes
towards computers. Such attitudes include anxiety liking and confidence. Schumacher and Moharan-
Martin (2001) underlined that women generally have less computer experience than men, with result
to have negative attitudes towards computers. Also, Ho and Lee (2001) concluded that male students
have more computer experience than female students, and boys tend to have less computer anxiety,
more positive attitudes toward computers and higher computer confidence than girls. In an earlier
study, Nash and Moroz (1997) found out that the gender of a person does not have an effect on the
persons’ attitudes towards computers, rather than his/her actions do have the effect. Tsai and his
colleagues (2001) indicated that computer experience and more specifically internet experience were
positively related to students’ affection, control and behavior. Their results indicated that male
students had more positive attitudes than female. Finally, in a previous study in a sample of Greek
high school students, Antoniou, Patsi, Bebetsos and Ifantidou (2006) found no gender differences.
The results of the present study have also shown that there was no variation between the two genders
in the attitudes towards exercise. An explanation for this attitude is probably that both men and
women being Physical Education students adopt the same positive attitude towards exercise.
What’s more, students spent their time mostly in using computers (mean = 84 hours per week) and
not in being occupied with physical activity (mean = 68 hours per week). Due to the accelerating
development of new technologies, computers are attractive to students. Almost each student uses one
for school work or even has got a personal computer. Nonetheless sometimes the frequent occupation
with computers affects negatively the occupation with sports. Probably, students prefer surfing the Net
and playing computer games to doing any exercise. However, the variation between the two activities,
i.e. computers and PE, was not large. According to Nigg (2003), technology has played a role in the
temporary decrease in the occupation with physical activity. In addition, the survey conducted by
Stranger and Gridina (1999) has reached the conclusion that children aged from 2 to 17 were occupied
with computers for about 1 hour and 37 minutes daily. Yet there have not been conducted any surveys
on whether or not the time spent in computers puts aside other activities, such as watching TV
programmes, playing sports and having social relationships (Subrahmanyam, Greenfield, Kraut &
Gross, 2001).
Research has shown the direct relationship between the use of computers and physical activity.
Thomas and Stratton (2006) in their study on the importance of use of information communication
26
technology in physical education classes showed that Physical Education teachers had very positive
opinion on the integration of information communication technology into their classes and believed that
the use of technology as is a valuable tool in promoting effective teaching and learning. Nigg (2003)
argued that the use of technology is related to a decline in physical activity. However, he made some
very important points on how technology can influence positively physical activity. He pointed out that
technology can help on the large of recruitment of populations, can individualize interventions and
promote different physical activity interventions on large populations in different ways.
Other research supported the opinion that computer use can enhance physical activity. Ho and Lee
(2001) in their research on computer use and its relation to adolescent lifestyle in Hong Kong found
some very interesting results. Their sample consisted of 2110 secondary school students. The results
indicated that the total amount of time spent on computers was not associated with any social or
physical lifestyle. More specifically, their data showed that computers users have more active lifestyle
including more exercise and recreational activities. Additionally, they found out that the boys who were
heavier computer users, exercise more than boys who just use computers to play games. Koezuka,
Koo, Allison, Adlaf, Dwyer, Faulkner, and Goodman (2006) supported the above results. Their results
showed that computer use was a protective factor against inactivity among males and was not
significantly related to physical inactivity among females. More specifically, males using computers for
less than six hours/week, were about 40% less likely to be inactive compared to nonusers. Their
results suggest that the time spent on computers may not necessarily replace time spent on physical
activity.
Overall, the study indicated possible gender differences. As Christensen, Knezek and Overall
mentioned in an earlier study (2005), educators must monitor very closely equity issues within the
education system. The instructional model must include many types of female preferences. Possible
limitations should be mentioned. The sample of the study was university students and more specifically
students at a Physical Education Department. Future research should continue investigating similar and
other aspects that effect students’ attitudes towards computer use and physical activity.
References
Aijen, I. (1988) Attitudes, personality, and behavior. Bristol: Open University Press.
Ajzen, I., and Fishbein, M. (1980) Understanding attitudes and predicting social behaviour. Englewood Cliffs, NJ:Prentice- Hall.
AlJabri, I. M. (1996) Gender differences in computer attitudes among secondary school students in Saudi Arabia.Journal of Computer Information Systems, 37, 70-75.
Antoniou, P., Patsi, H., Bebetsos, E., & Ifantidou, G. (2006) Validity of scale and evaluation of students’ attitudestoward computers. Compare with students’ attitudes toward physical education and physical activity.Inquiries in Sport & Physical Education, 4 (1), 114-124.
Christensen, R., Knezek, G., & Overall, Th. (2005) Transition points for the gender gap in computer enjoyment.Journal of Research on Technology in Education, 38, 23-37.
Eck, J., Hale, M., Ruff, S., & Tjelmeland, M. (2002) An educator’s guide to access issues [Online document].Available: http:/lrs.ed.uiuc.edu/wp/access/index.html
27
Garland, K. J., & Noyes, J. M. (2004). Computer experience: a poor predictor of computer attitudes. Computers inHuman Behavior, 20(6), 823-840.
Garland, K. J., & Noyes, J. M. (2005) Attitudes and confidence towards computers and books as learning tools: across-sectional study of student cohorts. British Journal of Educational Technology, 36, 85-91.
Ho, S. M. Y., & Lee, T. M. C. (2001) Computer usage and its relationship with adolescent lifestyle in Hong Kong.Journal of Adolescent Health, 29, 258-266.
Koezuka, N. M., Koo, M., Allison, K. R., Adlaf, E. M., Dwyer, J. J. M., Faulkner, G., & Goodman, J. (2006) Therelationship between sedentary activities and physical inactivity among adolescents: Results from theCanadian Community Health Survey. Journal of Adolescent Health, 39, 515-522.
Krouscas, J. A. (1999). Middle school student’s attitudes toward a physical education program. Doctorate ofPhilosophy in Curriculum and Instruction. Virginia.
Nigg, C. N. (2003) Technology’s influence on physical activity and exercise science: the present and the future.Psychology of Sport and Exercise, 57-65.
Papaioannou, A., Theodorakis, G., and Goudas, M. (1999) For a better teaching of Physical Education. Thessaloniki.Salto. (In Greek).
Roberton, S., I., Calder, J., Fung, P., Jones, A., 7 O’Shea, T. (1995) Computer attitudes in an English secondaryschool. Computers & Education, 24, 73-81.
Samouel, M. Y. and Lee, T. M. C. (2001) Computer usage and its relationship with Adolescent lifestyle in HongKong. Journal of adolescent health, 258-266.
Selwyn, N. (1997) Students’ attitudes toward computers: validation of a computer attitude scale for 16-19education. Computers education, 35-41.
Schumacher, P., & Moharan-Martin, T. (2001) Gender, Internet and computer experiences. Computers in HumanBehavior, 17, 95-110.
Smith, B., Caputi, P., Crittenden, N., Jayasuriya, R., & Rawstorne, P. (1999). A review of construct of computerexperience. Computers in human Behavior, 15, 227-242.
Stranger, J.D. and Gridina, N. (1999) Media in the home 1999: The fourth annual survey of parents and children.Norwood, NJ: Annenberg Public Policy Center of the University of Pensylvania.
Subrahmanyam, K., Kraut, R., Greenfield, P. and Gross, E. (2001) The impact of computer use on children’s andadolescents development. Applied Developmental Psychology, 7-30.
Thomas, A., & Stratton, G. (2006) What we are really doing with ICT in physical education: a national audit ofequipment, use teacher attitudes, support, and training. British Journal of Educational Technology, 37 (4),617-632.
Tsai, C., Lin, S. S. J., & Tsai, M. (2001). Developing an internet attitude scale for high school students. Computers& Education, 37, 41-51.
Woodrow, J. E. J. (1994) The development of computer-related attitudes of secondary students. Journal ofEducational Computing Research, 11, 307-338.
28
In order to reference this document
Bebetsos, E. & Antoniou, P. (2008). University students’ differences on attitudes towardscomputer use. Comparison with students’ attitudes towards physical activity.Interactive Educational Multimedia, 17, 20-28. Retreived dd/mm/yyyy, fromwww.ub.es/multimedia/iem
Copyright
If the opposite does not indicate itself, the texts published in Interactive EducationalMultimedia, IEM, are under a license Attribution-Noncommercial-No Derivative Works 2,5S p a i n , of C r e a t i v e C o m m o n s . All the conditions of use in:http://creativecommons.org/licenses/by-nc-nd/2.5/es/deed.en_US
In order to mention the works, you must give credit to the authors and to this Journal.
Interactive Educational Multimedia, IEM, does not accept any responsibility for the points ofview and statements made by the authors in their work.
Subscribe & Contact IEM
In order to subscribe to IEM, please fill out the form at www.ub.es/multimedia/iem (link:REGISTER)
29
Interactive Educational Multimedia, Number 17 (October, 2008), pp. 29-47http://www.ub.edu/multimedia/iem / [email protected]
An Evaluation of the Effectiveness of the Instructional Methods Usedwith a Student Response System at a Large University
Coral M. [email protected]
Charles R. [email protected]
Larry Seawright1
Dept. of Phy. Ed. & Sport ScienceDemocritus University of Thrace, Komotini, Hellas
Summary
This study investigates the adoption of student response systems (SRS) across alarge university campus. The study sought to understand how faculty members wereusing the SRS and what instructional strategies student and faculty found to be mostvaluable to their learning. The term “helpful” and the concept of “helpfulness” is usedin place of “valuable” as it more clearly communicates to students and faculty theconcept of how an SRS is of worth to them. Students were generally positive aboutthe helpfulness of the instructional methods professors were using. Students foundthe ability to receive immediate feedback on their learning as the most helpful aspectof the SRS. They also felt their comprehension of course material, attendance tolecture, attentiveness/engagement during lecture, participation in lecture, andachievement in the course had increased from using the SRS. The cost of SRStransmitters had a negative effect on many students’ perceptions of the system’soverall utility. The least positive students felt that the cost of purchasing the clickeroutweighed the benefits of using a student response system. These students ratedthe instructional methods as less helpful and rated their comprehension, attendance,
1 Coral Hanson completed her Master’s of Science at Brigham Young University in the Instructional Psychology and
Technology Department in December 2007. She currently works for Brigham Young University in the Center forthe Improvement of Teacher Education and Schooling as the Assistant Director of the Assessment, Analysis, andResearch Team. Charles R. Graham is an Assistant Professor of Instructional Psychology and Technology atBrigham Young University with a focus on technology-mediated teaching and learning. His research interestsinclude the study of online collaborative learning environments and the use of technology to enhance teachingand learning. Larry Seawright is an Associate Director of the Center for Teaching and Learning at BrighamYoung University. He joined the Center as an Instructional Technologist after receiving his Ph.D. in InstructionalPsychology & Technology.
30
engagement, participation, and achievement increasing less than those that felt thecost was worth the benefit.
Keywords
Evaluation; student response system; instructional methods; student perceptions.
Introduction
The Center for Teaching and Learning (CTL) at Brigham Young University (BYU) became interested in
student response systems (SRS) several years ago. A student response system is a combination of
hardware and software that allows students to respond to questions posed by the instructor. Students
answer questions posed in class using a handheld transmitter. Student responses are collected by a
receiver that is attached to the instructor’s computer. The results are compiled instantly by the
software and charts summarizing the results can then be displayed for the entire class. After different
systems were explored and piloted the iClicker system was selected for campus-wide adoption and the
CTL was charged with evaluating the implementation to develop an understanding of limitations and
best practices that could be shared with faculty in the future. The evaluation took place Winter
semester 2007 (January to April 2007).
The primary purpose of the evaluation of the student response system at Brigham Young University
was to evaluate how well the technology (hardware and software) of the new system was functioning
and how well the system met the needs of professors and students. The CTL also identified the need to
provide instructional support to professors about ways of using a SRS in their course. The reason for
this was because professors would call the CTL asking if they should start using a SRS in their course
and ask for information about how other professors have used it or advantages of using one. The CTL
did not have information about this to provide to professors and so requested the evaluation also
address how professors are using the SRS and what instructional practices with the SRS students
perceived as helpful. This article focuses on the results from the evaluation of students’ perceptions of
the helpfulness of the instructional methods being used with the SRS and if students felt there were
benefits to using a SRS in class. There were several evaluation questions (EQ) that guided the
evaluation of the instructional methods, which including the following:
- EQ1. What instructional methods used with the SRS do students find helpful?
- EQ2. Do students feel using a SRS has increased their comprehension of course material,
attendance at lecture, attentiveness/engagement during lecture, participation in lecture, and
achievement in the course?
- EQ3. Do students feel the cost of purchasing the clicker is worth the benefit they receive from
using it?
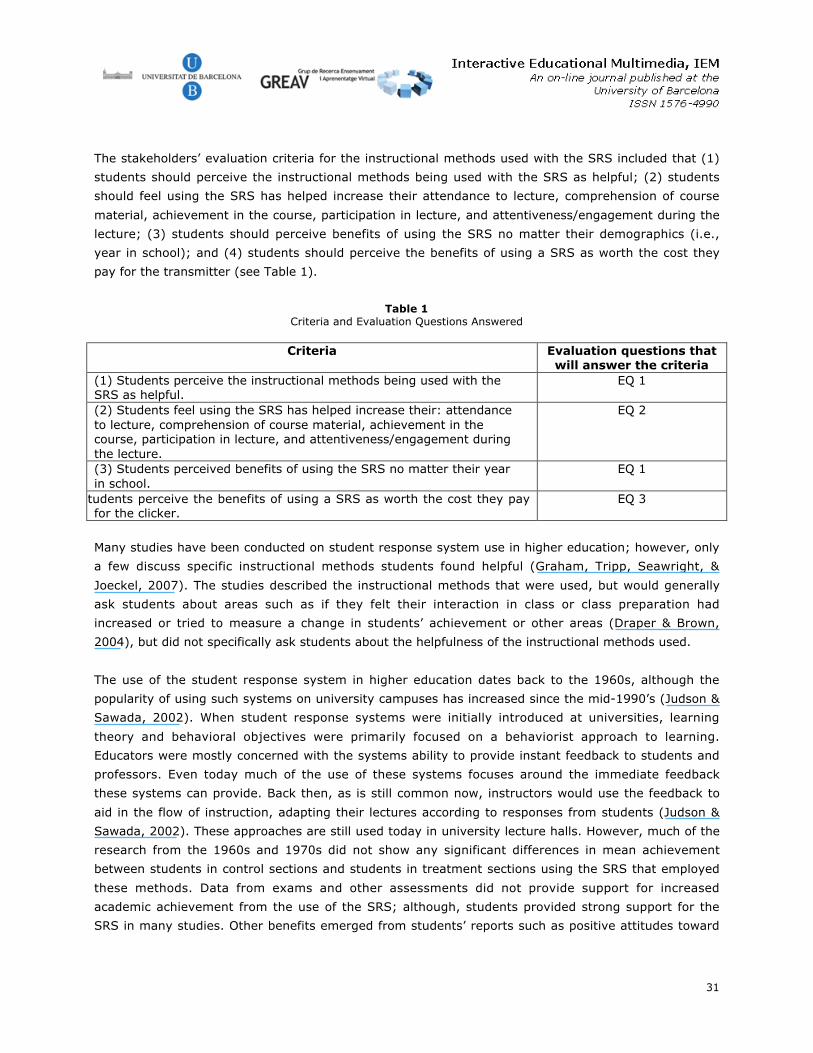
31
The stakeholders’ evaluation criteria for the instructional methods used with the SRS included that (1)
students should perceive the instructional methods being used with the SRS as helpful; (2) students
should feel using the SRS has helped increase their attendance to lecture, comprehension of course
material, achievement in the course, participation in lecture, and attentiveness/engagement during the
lecture; (3) students should perceive benefits of using the SRS no matter their demographics (i.e.,
year in school); and (4) students should perceive the benefits of using a SRS as worth the cost they
pay for the transmitter (see Table 1).
Many studies have been conducted on student response system use in higher education; however, only
a few discuss specific instructional methods students found helpful (Graham, Tripp, Seawright, &
Joeckel, 2007). The studies described the instructional methods that were used, but would generally
ask students about areas such as if they felt their interaction in class or class preparation had
increased or tried to measure a change in students’ achievement or other areas (Draper & Brown,
2004), but did not specifically ask students about the helpfulness of the instructional methods used.
The use of the student response system in higher education dates back to the 1960s, although the
popularity of using such systems on university campuses has increased since the mid-1990’s (Judson &
Sawada, 2002). When student response systems were initially introduced at universities, learning
theory and behavioral objectives were primarily focused on a behaviorist approach to learning.
Educators were mostly concerned with the systems ability to provide instant feedback to students and
professors. Even today much of the use of these systems focuses around the immediate feedback
these systems can provide. Back then, as is still common now, instructors would use the feedback to
aid in the flow of instruction, adapting their lectures according to responses from students (Judson &
Sawada, 2002). These approaches are still used today in university lecture halls. However, much of the
research from the 1960s and 1970s did not show any significant differences in mean achievement
between students in control sections and students in treatment sections using the SRS that employed
these methods. Data from exams and other assessments did not provide support for increased
academic achievement from the use of the SRS; although, students provided strong support for the
SRS in many studies. Other benefits emerged from students’ reports such as positive attitudes toward
Table 1Criteria and Evaluation Questions Answered
Criteria Evaluation questions thatwill answer the criteria
(1) Students perceive the instructional methods being used with theSRS as helpful.
EQ 1
(2) Students feel using the SRS has helped increase their: attendanceto lecture, comprehension of course material, achievement in thecourse, participation in lecture, and attentiveness/engagement duringthe lecture.
EQ 2
(3) Students perceived benefits of using the SRS no matter their yearin school.
EQ 1
Students perceive the benefits of using a SRS as worth the cost they payfor the clicker.
EQ 3
32
the class, feeling the system was useful, feelings of increased understanding, and increased
attendance even though there was no evidence of increased achievement in the course (Judson &
Sawada, 2002).
Recent research on the use of student response systems has shifted its focus from a behavioral
stimulus-response approach to creating interactive learning environments in the classroom employing
more constructivist oriented approaches. Current trends in learning theory and research have no doubt
contributed to this shift, but the reasons for adopting student response systems still vary. Common
reasons (Draper, Cargill, & Cutts, 2002) for current adoption of a SRS include increasing student
engagement in large lectures (Beatty, Gerace, Lenoard, & Dufresne, 2006), improving student
performance (Liu, Liang, Wang, & Chan, 2003), increasing teacher-student and peer interaction
(Silliman & McWilliams, 2004), providing immediate feedback from students to teacher (Barrett,
Bornsen, Erickson, Markey, & Spiering, 2005), guiding learners through the material (Williams, 2003),
monitoring of individual students from responses (Draper, Cargill, & Cutts, 2002), improving retention
and demographic comparisons (Judson & Sawada, 2002), enhancing group discussion (Blackman,
Dooley, Kuchinski, & Chapman, 2002), facilitating group discussion in large lectures (Greer & Heaney,
2004, Woods & Chiu, 2003), assessing teaching and learning methods in real time allowing professors
and students to gauge student understanding (Wit, 2003), increasing student engagement (Silliman &
McWilliams, 2004), and using it for classroom administration techniques (Liu, Liang, Wang, & Chan,
2003; Silliman & McWilliams, 2004).
Despite the varied reasons for adopting a SRS for in-class use, many researchers have recognized the
need to focus on the effective underlying pedagogy of using the system. (Judson & Sawada, 2002;
Draper & Brown, 2004). Judson & Sawada (2002) state the purpose of their review of the research on
student response systems is not to show incorporating technology as the key, but to point to the
instructional practices of educators using such a system. Wit (2003) stated, “Introducing technology in
the classroom just for the sake of it does not necessarily help the learner and can be sheer folly” (p.
14). With the current shift in focus to the underlying pedagogy of using student response systems and
many different reasons for using the systems, there are many instructional methods that may be used.
As discussed earlier, the behaviorist approach in the early years of its use has been replaced with a
more constructivist oriented approach to the instructional methods (Judson & Sawada, 2002). Much of
the focus of the instructional methods is on creating an interactive learning environment for students
and moving away from the traditional large lecture format of talking at students for the entire period
with students passively listening, which is seen as a weak method because of the lack of interactivity
(Draper & Brown, 2004). With the variety of instructional methods to be employed with a SRS,
instructors should realize that there are many factors along with the instructional methods they use
that may contribute to the success of their learning outcomes from using a SRS (Draper & Brown,
2004). However, the instructional methods used are still a significant contributor and so must be
carefully selected.
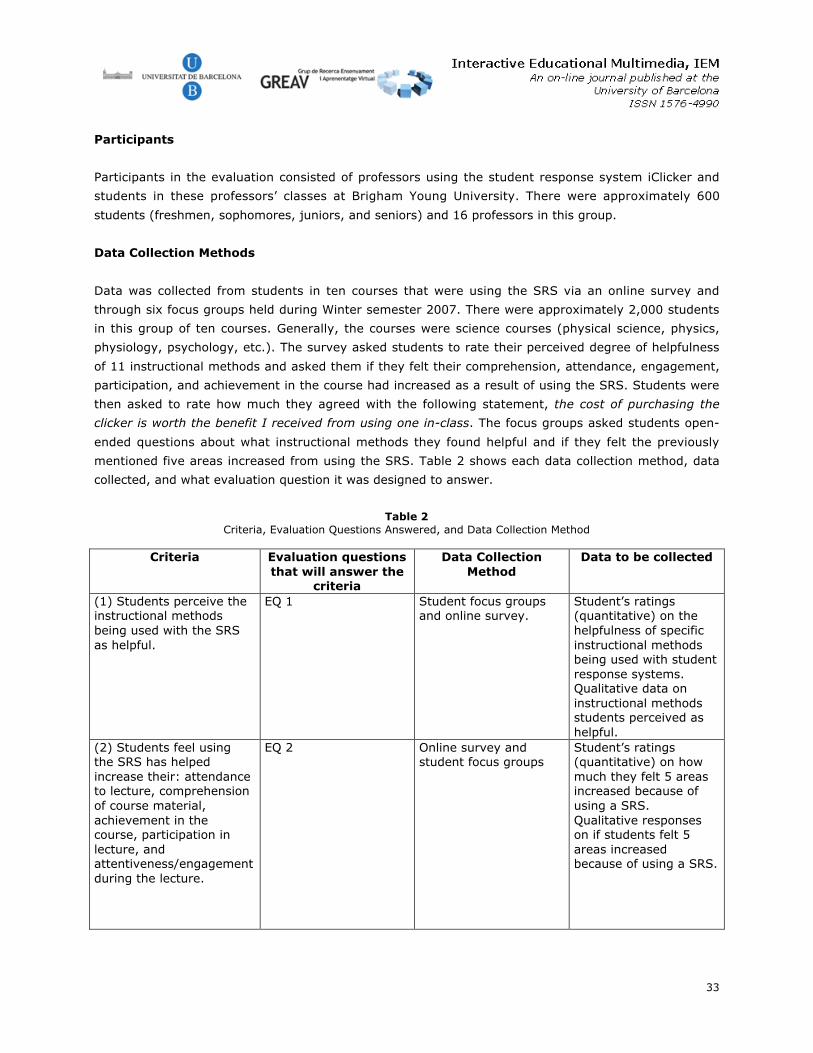
33
Participants
Participants in the evaluation consisted of professors using the student response system iClicker and
students in these professors’ classes at Brigham Young University. There were approximately 600
students (freshmen, sophomores, juniors, and seniors) and 16 professors in this group.
Data Collection Methods
Data was collected from students in ten courses that were using the SRS via an online survey and
through six focus groups held during Winter semester 2007. There were approximately 2,000 students
in this group of ten courses. Generally, the courses were science courses (physical science, physics,
physiology, psychology, etc.). The survey asked students to rate their perceived degree of helpfulness
of 11 instructional methods and asked them if they felt their comprehension, attendance, engagement,
participation, and achievement in the course had increased as a result of using the SRS. Students were
then asked to rate how much they agreed with the following statement, the cost of purchasing the
clicker is worth the benefit I received from using one in-class. The focus groups asked students open-
ended questions about what instructional methods they found helpful and if they felt the previously
mentioned five areas increased from using the SRS. Table 2 shows each data collection method, data
collected, and what evaluation question it was designed to answer.
Table 2Criteria, Evaluation Questions Answered, and Data Collection Method
Criteria Evaluation questionsthat will answer the
criteria
Data CollectionMethod
Data to be collected
(1) Students perceive theinstructional methodsbeing used with the SRSas helpful.
EQ 1 Student focus groupsand online survey.
Student’s ratings(quantitative) on thehelpfulness of specificinstructional methodsbeing used with studentresponse systems.Qualitative data oninstructional methodsstudents perceived ashelpful.
(2) Students feel usingthe SRS has helpedincrease their: attendanceto lecture, comprehensionof course material,achievement in thecourse, participation inlecture, andattentiveness/engagementduring the lecture.
EQ 2 Online survey andstudent focus groups
Student’s ratings(quantitative) on howmuch they felt 5 areasincreased because ofusing a SRS.Qualitative responseson if students felt 5areas increasedbecause of using a SRS.
34
Criteria Evaluation questionsthat will answer the
criteria
Data CollectionMethod
Data to be collected
(3) Students perceivedbenefits of using the SRSno matter their year inschool.
EQ 1 Online survey Demographics of thestudents (year inschool)
tudents perceive thebenefits of using a SRS asworth the cost they payfor the clicker.
EQ 3 Online survey Student’s ratings(quantitative) of if theyfelt the benefit theyreceived was worth thecost of purchasing theclicker.
Data Analysis
The focus in analyzing the data was to examine themes or trends regarding what students said about
the helpfulness of specific instructional methods and if they felt using a SRS had increased their
comprehension of course material, attendance at lecture, attentiveness/engagement during lecture,
participation in lecture, and achievement in the course and then determine if trends in students’
ratings of helpfulness of the instructional methods and those five areas corresponded with trends in
how the professors were using the SRS.
Results
The results have been organized around the three evaluation questions. The first section describes the
results from data collected about students’ perceptions of the helpfulness of the instructional methods
used with the SRS. The second section describes the results of areas students’ felt had increased as a
result of using the SRS (comprehension, attendance, engagement, participation, and achievement).
The last section describes the results of data collected about students’ perceptions of the cost of
purchasing the clicker being worth the benefit they received.
Evaluation Question 1: Helpfulness of Instructional Methods
EQ1. What instructional methods used with the SRS do students find helpful?
In order to address the evaluation question above, students’ responses to 11 survey questions and
responses from the focus groups from one open-ended question were examined. Table 3 contains the
11 instructional methods that students were asked to rate the helpfulness of on the survey. These
eleven methods were developed from an analysis of a prior preliminary evaluation done at the center.
This table has been included to give the full description as contained in the survey and the abbreviation
as contained in the figures and tables in this chapter.
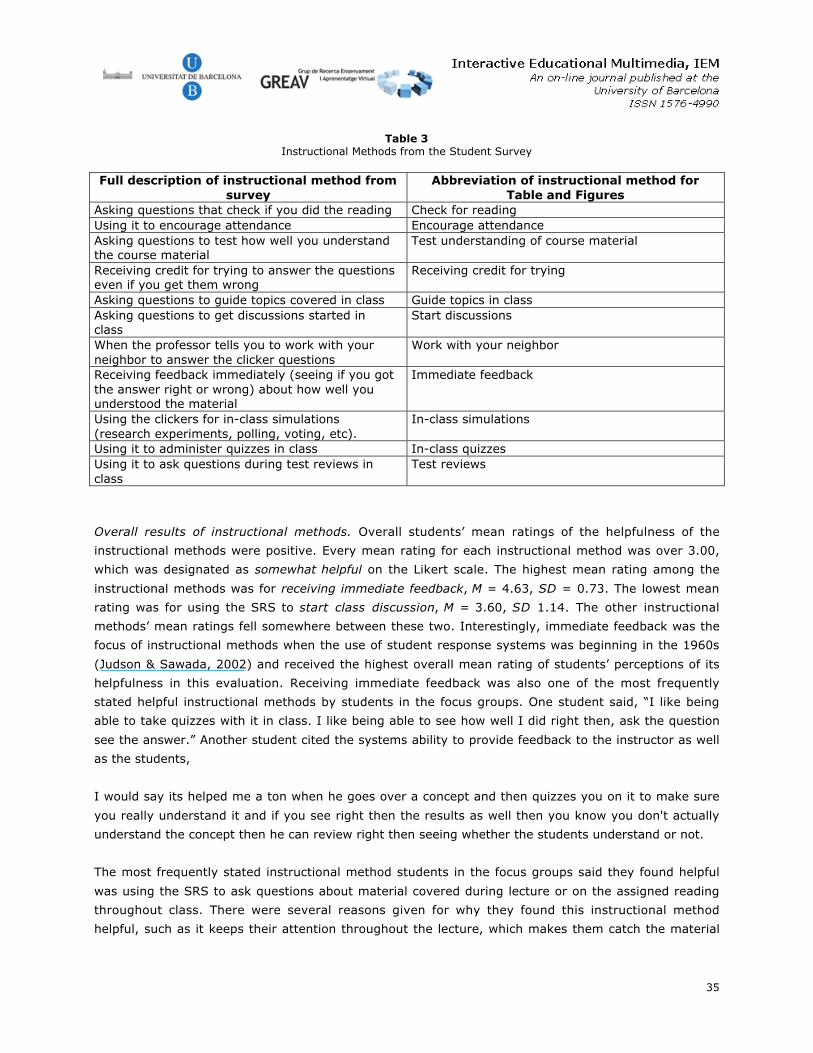
35
Table 3Instructional Methods from the Student Survey
Full description of instructional method fromsurvey
Abbreviation of instructional method forTable and Figures
Asking questions that check if you did the reading Check for readingUsing it to encourage attendance Encourage attendanceAsking questions to test how well you understandthe course material
Test understanding of course material
Receiving credit for trying to answer the questionseven if you get them wrong
Receiving credit for trying
Asking questions to guide topics covered in class Guide topics in classAsking questions to get discussions started inclass
Start discussions
When the professor tells you to work with yourneighbor to answer the clicker questions
Work with your neighbor
Receiving feedback immediately (seeing if you gotthe answer right or wrong) about how well youunderstood the material
Immediate feedback
Using the clickers for in-class simulations(research experiments, polling, voting, etc).
In-class simulations
Using it to administer quizzes in class In-class quizzesUsing it to ask questions during test reviews inclass
Test reviews
Overall results of instructional methods. Overall students’ mean ratings of the helpfulness of the
instructional methods were positive. Every mean rating for each instructional method was over 3.00,
which was designated as somewhat helpful on the Likert scale. The highest mean rating among the
instructional methods was for receiving immediate feedback, M = 4.63, SD = 0.73. The lowest mean
rating was for using the SRS to start class discussion, M = 3.60, SD 1.14. The other instructional
methods’ mean ratings fell somewhere between these two. Interestingly, immediate feedback was the
focus of instructional methods when the use of student response systems was beginning in the 1960s
(Judson & Sawada, 2002) and received the highest overall mean rating of students’ perceptions of its
helpfulness in this evaluation. Receiving immediate feedback was also one of the most frequently
stated helpful instructional methods by students in the focus groups. One student said, “I like being
able to take quizzes with it in class. I like being able to see how well I did right then, ask the question
see the answer.” Another student cited the systems ability to provide feedback to the instructor as well
as the students,
I would say its helped me a ton when he goes over a concept and then quizzes you on it to make sure
you really understand it and if you see right then the results as well then you know you don't actually
understand the concept then he can review right then seeing whether the students understand or not.
The most frequently stated instructional method students in the focus groups said they found helpful
was using the SRS to ask questions about material covered during lecture or on the assigned reading
throughout class. There were several reasons given for why they found this instructional method
helpful, such as it keeps their attention throughout the lecture, which makes them catch the material
36
as they go along and helps increase their preparation for class (they do the reading because they know
there will be questions on it). Students from the focus groups did not mention much about specific
types of questions professors would use to ask questions about the material; however, one student
gave a description of types of questions their professor used that they found helpful,
Ours did a lot of critical thinking so he will take the concept that we've just learned and then he'll have
6 or 7 different scenarios and you'll have to say if A does this then B does what? So its really helpful in
getting you to think more than just A is the right answer- you have to think why A is the right answer.
It's really helpful.
The similar instructional method of using the SRS to test students’ understanding of the course
material from the survey received an overall mean rating of M = 4.19, SD = 0.87. It was the fourth
highest rated instructional method by students.
From the overall responses from the survey and focus groups, receiving immediate feedback in class
appears to be the instructional method students find most helpful. However, in the focus groups asking
questions throughout class was also frequently cited as being a helpful instructional method. Students
find asking questions on the course material and reading helpful; additionally, as stated by students in
the focus groups, dispersing the questions throughout the lecture is also helpful to them.
Results by professor. When we asked students to rate the helpfulness of the instructional methods on
the survey, we also asked them to tell us which class they were in so we could see how students’
ratings varied according to professors participating in the evaluation. We did this to see if there were
differences in students’ ratings based on which class they were in, which could help inform us more
about the specific instructional methods each professor was using with the SRS. Descriptive statistics
(mean and standard deviation) were computed for each group of student responses by what
professors’ class they were in. By examining the mean rating for each professor there is a similar trend
of immediate feedback as generally having the highest mean rating across professor (Figure 1 the
heavy blue line with squares). Using the clicker to get discussions started in class generally has the
lowest mean rating across professor (see Figure 1, heavy brown line with circles) as was the result
from the overall mean ratings.
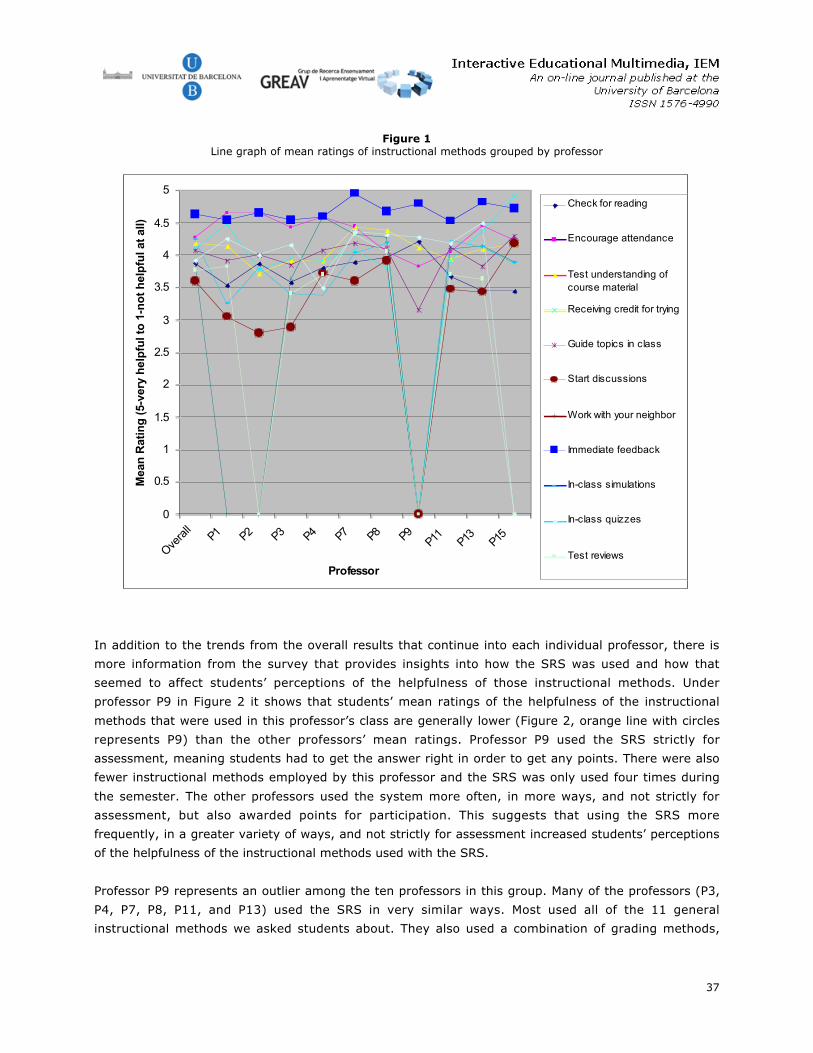
37
Figure 1Line graph of mean ratings of instructional methods grouped by professor
0
0.5
1
1.5
2
2.5
3
3.5
4
4.5
5
Overa
llP1 P2 P3 P4 P7 P8 P9 P11 P13 P15
Professor
Mea
n R
atin
g (
5-ve
ry h
elp
ful t
o 1
-no
t h
elp
ful a
t al
l)
Check for reading
Encourage attendance
Test understanding ofcourse material
Receiving credit for trying
Guide topics in class
Start discussions
Work with your neighbor
Immediate feedback
In-class simulations
In-class quizzes
Test reviews
In addition to the trends from the overall results that continue into each individual professor, there is
more information from the survey that provides insights into how the SRS was used and how that
seemed to affect students’ perceptions of the helpfulness of those instructional methods. Under
professor P9 in Figure 2 it shows that students’ mean ratings of the helpfulness of the instructional
methods that were used in this professor’s class are generally lower (Figure 2, orange line with circles
represents P9) than the other professors’ mean ratings. Professor P9 used the SRS strictly for
assessment, meaning students had to get the answer right in order to get any points. There were also
fewer instructional methods employed by this professor and the SRS was only used four times during
the semester. The other professors used the system more often, in more ways, and not strictly for
assessment, but also awarded points for participation. This suggests that using the SRS more
frequently, in a greater variety of ways, and not strictly for assessment increased students’ perceptions
of the helpfulness of the instructional methods used with the SRS.
Professor P9 represents an outlier among the ten professors in this group. Many of the professors (P3,
P4, P7, P8, P11, and P13) used the SRS in very similar ways. Most used all of the 11 general
instructional methods we asked students about. They also used a combination of grading methods,
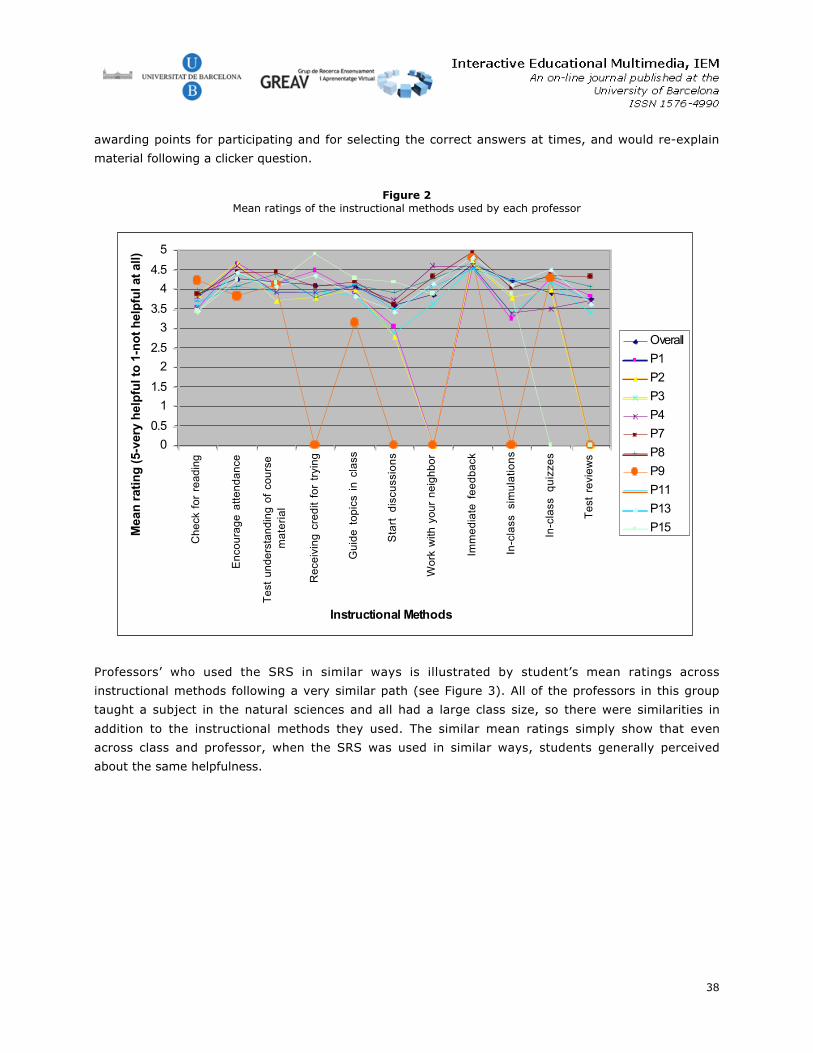
38
awarding points for participating and for selecting the correct answers at times, and would re-explain
material following a clicker question.
Figure 2Mean ratings of the instructional methods used by each professor
0
0.5
1
1.5
2
2.5
3
3.5
4
4.5
5
Ch
eck
fo
r re
ad
ing
En
cou
rag
e a
tte
nd
an
ce
Te
st u
nd
ers
tan
din
g o
f co
urs
em
ate
ria
l
Re
ceiv
ing
cre
dit
for
tryi
ng
Gu
ide
to
pic
s in
cla
ss
Sta
rt d
iscu
ssio
ns
Wo
rk w
ith y
ou
r n
eig
hb
or
Imm
ed
iate
fe
ed
ba
ck
In-c
lass
sim
ula
tion
s
In-c
lass
qu
izze
s
Te
st r
evi
ew
s
Instructional Methods
Mea
n r
atin
g (
5-ve
ry h
elp
ful t
o 1
-no
t h
elp
ful a
t al
l)
Overall
P1
P2
P3
P4
P7
P8
P9
P11
P13
P15
Professors’ who used the SRS in similar ways is illustrated by student’s mean ratings across
instructional methods following a very similar path (see Figure 3). All of the professors in this group
taught a subject in the natural sciences and all had a large class size, so there were similarities in
addition to the instructional methods they used. The similar mean ratings simply show that even
across class and professor, when the SRS was used in similar ways, students generally perceived
about the same helpfulness.
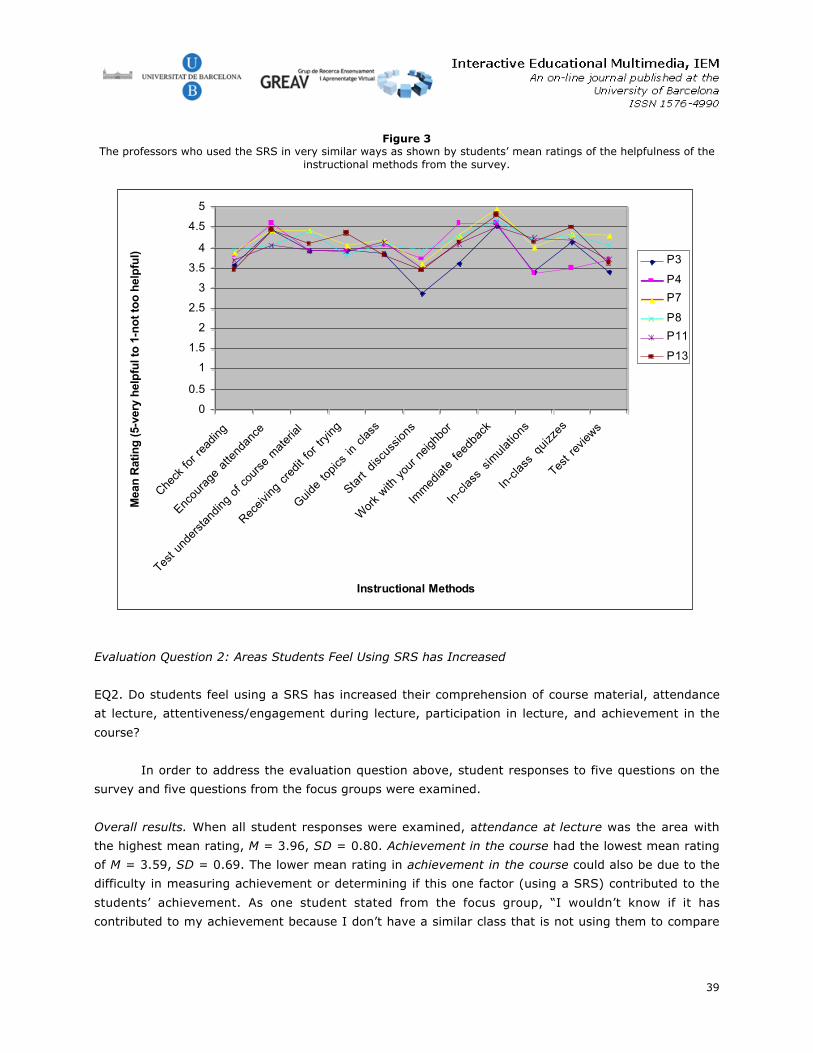
39
Figure 3The professors who used the SRS in very similar ways as shown by students’ mean ratings of the helpfulness of the
instructional methods from the survey.
0
0.5
1
1.5
2
2.5
3
3.5
4
4.5
5
Check
for r
eadin
g
Encou
rage
atte
ndan
ce
Test u
nder
stand
ing
of c
ours
e m
ater
ial
Recei
ving
cred
it fo
r try
ing
Guide
topi
cs in
cla
ss
Start
disc
ussio
ns
Wor
k with
you
r neig
hbor
Imm
edia
te fe
edba
ck
In-c
lass
sim
ulat
ions
In-c
lass
qui
zzes
Test r
evie
ws
Instructional Methods
Mea
n R
atin
g (
5-ve
ry h
elp
ful t
o 1
-no
t to
o h
elp
ful) P3
P4
P7
P8
P11
P13
Evaluation Question 2: Areas Students Feel Using SRS has Increased
EQ2. Do students feel using a SRS has increased their comprehension of course material, attendance
at lecture, attentiveness/engagement during lecture, participation in lecture, and achievement in the
course?
In order to address the evaluation question above, student responses to five questions on the
survey and five questions from the focus groups were examined.
Overall results. When all student responses were examined, attendance at lecture was the area with
the highest mean rating, M = 3.96, SD = 0.80. Achievement in the course had the lowest mean rating
of M = 3.59, SD = 0.69. The lower mean rating in achievement in the course could also be due to the
difficulty in measuring achievement or determining if this one factor (using a SRS) contributed to the
students’ achievement. As one student stated from the focus group, “I wouldn’t know if it has
contributed to my achievement because I don’t have a similar class that is not using them to compare
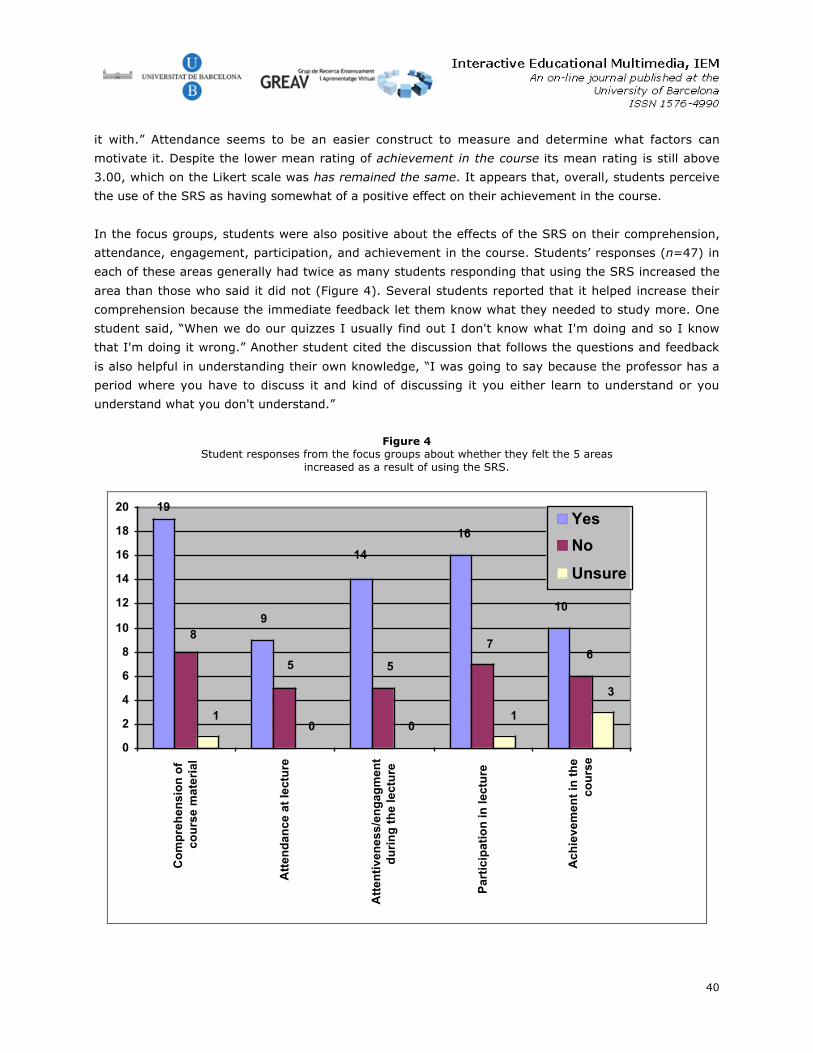
40
it with.” Attendance seems to be an easier construct to measure and determine what factors can
motivate it. Despite the lower mean rating of achievement in the course its mean rating is still above
3.00, which on the Likert scale was has remained the same. It appears that, overall, students perceive
the use of the SRS as having somewhat of a positive effect on their achievement in the course.
In the focus groups, students were also positive about the effects of the SRS on their comprehension,
attendance, engagement, participation, and achievement in the course. Students’ responses (n=47) in
each of these areas generally had twice as many students responding that using the SRS increased the
area than those who said it did not (Figure 4). Several students reported that it helped increase their
comprehension because the immediate feedback let them know what they needed to study more. One
student said, “When we do our quizzes I usually find out I don't know what I'm doing and so I know
that I'm doing it wrong.” Another student cited the discussion that follows the questions and feedback
is also helpful in understanding their own knowledge, “I was going to say because the professor has a
period where you have to discuss it and kind of discussing it you either learn to understand or you
understand what you don't understand.”
Figure 4Student responses from the focus groups about whether they felt the 5 areas
increased as a result of using the SRS.
10
16
14
9
19
67
55
8
3
100
1
0
2
4
6
8
10
12
14
16
18
20
Co
mp
reh
ensi
on
of
cou
rse
mat
eria
l
Att
end
ance
at
lect
ure
Att
enti
ven
ess/
eng
agm
ent
du
rin
g t
he
lect
ure
Par
tici
pat
ion
in le
ctu
re
Ach
ieve
men
t in
th
eco
urs
e
Yes
No
Unsure
41
The majority of students did say that they felt using the SRS had helped increase their attendance.
Major motivators were the points from quizzes or participating. Some students reported they would go
regardless of the SRS use or points. Even though this area had the highest mean rating, it was the
area that was the least responded to and least talked about in the focus group. Attendance is easier to
measure but may not be seen as important an issue to students as the SRS helping increase their
comprehension of the material or achievement in the course and so discussed it less in the focus
groups. When students were asked about increasing their attentiveness or engagement they reported
working together in groups was helpful. One student said, “Sometimes it's good because you can work
in these groups and understand stuff but other times if you're just doing an individual quiz it might not
be as engaging.” Many students said that they do not fall asleep in class because they know that there
are going to be questions/quizzes. They also said that it helped increase their participation because
when they would get an answer wrong they would want to know why and so would ask more
questions. Students said they felt more confident asking questions when they could see other students’
responses and see that others were thinking the way they were. Many of the students that felt using
the SRS in class helped increase their achievement in the course said it did because the clicker
questions were similar to ones on the tests and so helped them in their test preparation or knowing
what types of questions the professor would ask on the test. One student said,
On like the test it always helps because my teacher uses a lot of clicker questions on the exams of that
unit so that helps a lot. And he will put them on his website before as a review so it helps.
Overall, students are positive about the use of the SRS helping increase those five areas.
Results by professor. The results from this section follow a similar trend as in the overall results.
Generally, attendance at lecture (Figure 5, pink line with circles) had the highest mean rating across
professor and achievement in the course (Figure 5, purple line with squares) had the lowest mean
rating.
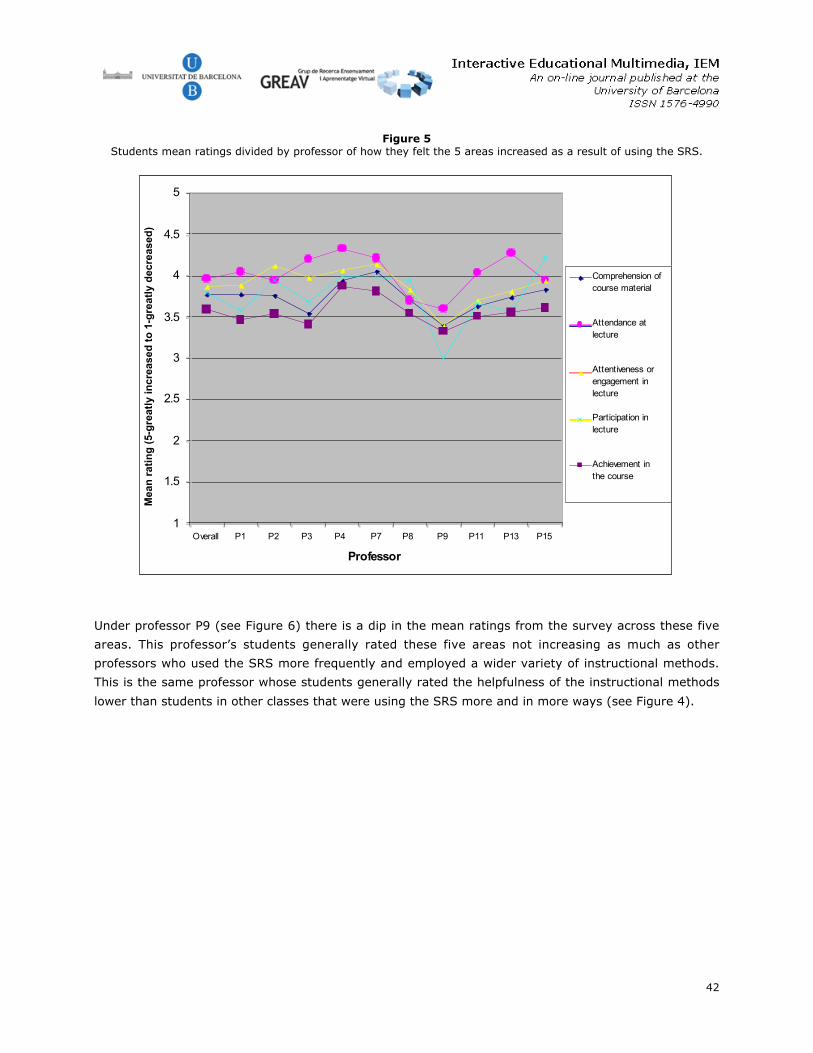
42
Figure 5Students mean ratings divided by professor of how they felt the 5 areas increased as a result of using the SRS.
1
1.5
2
2.5
3
3.5
4
4.5
5
Overall P1 P2 P3 P4 P7 P8 P9 P11 P13 P15
Professor
Mea
n r
atin
g (
5-g
reat
ly in
crea
sed
to
1-g
reat
ly d
ecre
ased
)
Comprehension ofcourse material
Attendance atlecture
Attentiveness orengagement inlecture
Participation inlecture
Achievement inthe course
Under professor P9 (see Figure 6) there is a dip in the mean ratings from the survey across these five
areas. This professor’s students generally rated these five areas not increasing as much as other
professors who used the SRS more frequently and employed a wider variety of instructional methods.
This is the same professor whose students generally rated the helpfulness of the instructional methods
lower than students in other classes that were using the SRS more and in more ways (see Figure 4).
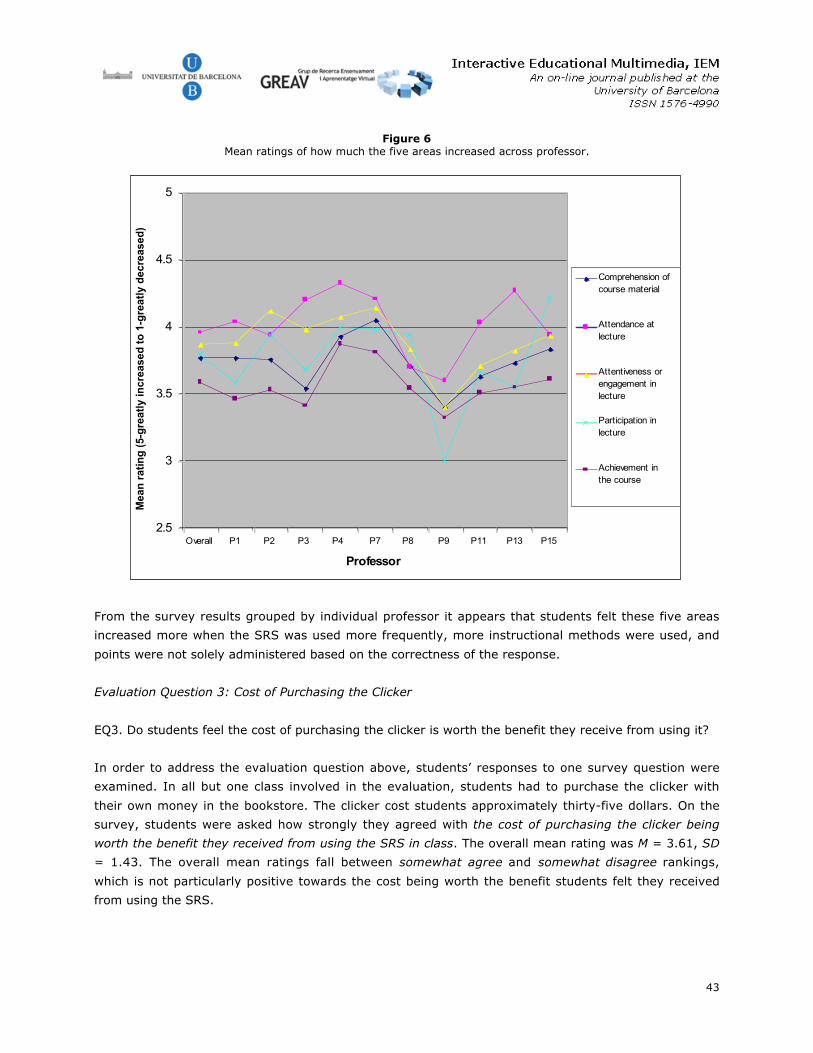
43
Figure 6Mean ratings of how much the five areas increased across professor.
2.5
3
3.5
4
4.5
5
Overall P1 P2 P3 P4 P7 P8 P9 P11 P13 P15
Professor
Mea
n r
atin
g (
5-g
reat
ly in
crea
sed
to
1-g
reat
ly d
ecre
ased
)
Comprehension ofcourse material
Attendance atlecture
Attentiveness orengagement inlecture
Participation inlecture
Achievement inthe course
From the survey results grouped by individual professor it appears that students felt these five areas
increased more when the SRS was used more frequently, more instructional methods were used, and
points were not solely administered based on the correctness of the response.
Evaluation Question 3: Cost of Purchasing the Clicker
EQ3. Do students feel the cost of purchasing the clicker is worth the benefit they receive from using it?
In order to address the evaluation question above, students’ responses to one survey question were
examined. In all but one class involved in the evaluation, students had to purchase the clicker with
their own money in the bookstore. The clicker cost students approximately thirty-five dollars. On the
survey, students were asked how strongly they agreed with the cost of purchasing the clicker being
worth the benefit they received from using the SRS in class. The overall mean rating was M = 3.61, SD
= 1.43. The overall mean ratings fall between somewhat agree and somewhat disagree rankings,
which is not particularly positive towards the cost being worth the benefit students felt they received
from using the SRS.
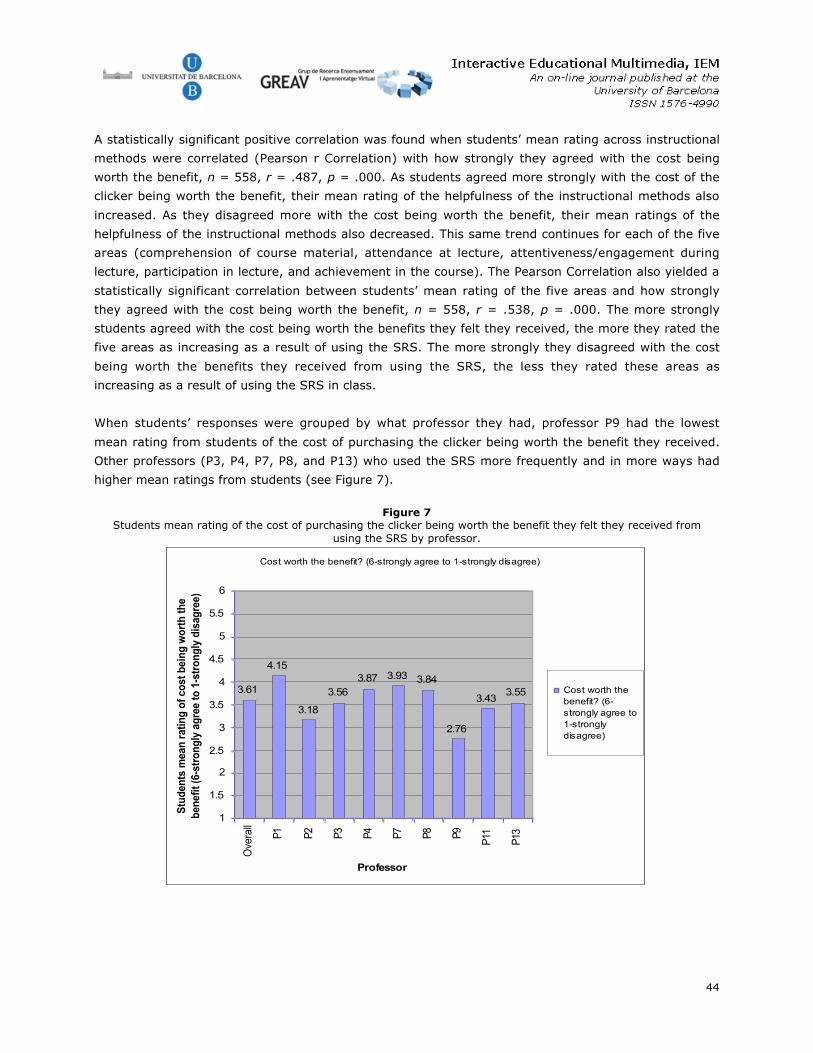
44
A statistically significant positive correlation was found when students’ mean rating across instructional
methods were correlated (Pearson r Correlation) with how strongly they agreed with the cost being
worth the benefit, n = 558, r = .487, p = .000. As students agreed more strongly with the cost of the
clicker being worth the benefit, their mean rating of the helpfulness of the instructional methods also
increased. As they disagreed more with the cost being worth the benefit, their mean ratings of the
helpfulness of the instructional methods also decreased. This same trend continues for each of the five
areas (comprehension of course material, attendance at lecture, attentiveness/engagement during
lecture, participation in lecture, and achievement in the course). The Pearson Correlation also yielded a
statistically significant correlation between students’ mean rating of the five areas and how strongly
they agreed with the cost being worth the benefit, n = 558, r = .538, p = .000. The more strongly
students agreed with the cost being worth the benefits they felt they received, the more they rated the
five areas as increasing as a result of using the SRS. The more strongly they disagreed with the cost
being worth the benefits they received from using the SRS, the less they rated these areas as
increasing as a result of using the SRS in class.
When students’ responses were grouped by what professor they had, professor P9 had the lowest
mean rating from students of the cost of purchasing the clicker being worth the benefit they received.
Other professors (P3, P4, P7, P8, and P13) who used the SRS more frequently and in more ways had
higher mean ratings from students (see Figure 7).
Figure 7Students mean rating of the cost of purchasing the clicker being worth the benefit they felt they received from
using the SRS by professor.
Cost worth the benefit? (6-strongly agree to 1-strongly disagree)
3.61
4.15
3.18
3.563.87 3.93 3.84
2.76
3.433.55
1
1.5
2
2.5
3
3.5
4
4.5
5
5.5
6
Ove
rall
P1 P2 P3 P4 P7 P8 P9
P11
P13
Professor
Stu
dent
s m
ean
ratin
g of
cos
t bei
ng w
orth
the
bene
fit (6
-str
ongl
y ag
ree
to 1
-str
ongl
y di
sagr
ee)
Cost worth thebenefit? (6-strongly agree to1-stronglydisagree)
45
The cost of purchasing a clicker appears to be a significant factor in students’ ratings of the helpfulness
of using a student response system practically and statistically. Students may have been predisposed
to start out with a more negative perception of the SRS because they were required to purchase the
transmitter at the beginning of the semester before they understood the purpose of it and how it could
help them. Deciding if the students will be responsible for the cost of the clicker or if the
department/course will be responsible for the cost is an important factor to consider when
implementing one of these systems. However, simply using the SRS more frequently, in more ways,
and not strictly for assessment appears to have a positive influence on how students feel about the
cost of purchasing the clicker.
Conclusions
Students were generally positive about the helpfulness of the instructional methods used by their
professors. The two instructional methods students perceived as most helpful were providing
immediate feedback and the ability to answer questions about lecture and reading material throughout
the lecture. Students also felt that using the SRS had helped increase (to some degree) their
comprehension of course material, attendance at lecture, attention/engagement during lecture,
participation in lecture, and achievement in the course. It appeared that students felt using the SRS
was more helpful when it was used frequently, when multiple instructional methods were used, and
when it was not used strictly for assessment. The cost of purchasing a clicker was a large disadvantage
for students and appears to influence their perceptions of the helpfulness of using a SRS. Still, many
students did perceive using a SRS to be helpful to them.
The results of this evaluation do provide helpful insights into the use of a SRS and students’
perceptions of the helpfulness of using such a system; however, care must be given to not
misinterpret the data by placing absolute qualifications on it. The data on students’ perceptions of the
helpfulness of the instructional methods is not meant to give the final word, but to provide general
guidance, and it should be noted that the information is based on students’ perceptions. More
investigation is needed to if stakeholders wish to gain more specific results of effective instructional
methods and the affect on students.
References
Barrett, S. M., Bornsen, S. E., Erickson, S. L., Markey, V., & Spiering, K. (2005). The personal response system asa teaching aid. Communication Teacher. 19(3), 89-92.
Beatty, I. D., Gerace, W. J., Leonard, W. J., & Dufresne, R. J. (2006). Designing effective questions for classroomresponse system teaching. American Association of Physics Teachers, 74(1), 31-39.
Blackman, M. S., Dooley, P., Kuchinski, B. & Chapman, D. (2002). It worked a different way. College Teaching.50(1), 27-29.
Draper, S. W., Cargill, J. & Cutts, W. (2002). Electronically enhanced classroom interaction. Australian Journal ofEducational Technology. 18(1), 13-23.
Draper, S. W., & Brown, M. I. (2004). Increasing interactivity in lectures using an electronic voting system. Journalof Computer Assisted Learning. 20(2), 81-94.
46
Graham, C. R., Tripp, T. R., Seawright, L., & Joeckel, G. L. (2007). Empowering or compelling reluctantparticipators using audience response systems. Active Learning in Higher Education, 8(3), 233-258.
Greer, L., & Heaney, P. J. (2004). Real-time analysis of student comprehension: An assessment of electronicstudent response technology in an introductory earth science course. Journal of Geoscience Education.52(4), 345-351.
Judson, E., & Sawada, D. (2002). Learning from past and present: Electronic response systems in college lecturehalls. Journal of Computers in Mathematics and Science Teaching, 21(2), 167-181.
Liu, T. C., Liang, J. K., Wang, H. Y., & Chan, T. W. (2003). The features and potential of interactive responsesystem. Presented at the 2003 International Conference on Computers in Education, Hong Kong.
Silliman, S. E., & McWilliams, L. (2004). Observations on benefits/limitations of an audience response system.Proceedings of the 2004 American Society for Engineering Education Annual Conference & Exposition, USA,1511.
Williams, J. B. (2003). Learning by remote control: Exploring the use of an audience response system as a vehiclefor content delivery. Proceedings of the 20th Annual Conference of the Australasian Society for Computers inLearning in Tertiary Education, Adelaide, Australia, 739-742.
Wit, E. (2003). Who wants to be... The use of a personal response system in statistics teaching. MSOR Connections,3(2), 14-20.
Woods, H. A., & Chiu, C. (2003, September/October). Wireless response technology in college classrooms. TheTechnology Source.
47
In order to reference this document
Hanson, C. M.; Graham, Ch. R. & Seawright. L. (2008). An Evaluation of the Effectiveness ofthe Instructional Methods Used with a Student Response System at a Large University.Interactive Educational Multimedia, 17, 29-47. Retreived dd/mm/yyyy, fromwww.ub.es/multimedia/iem
Copyright
If the opposite does not indicate itself, the texts published in Interactive EducationalMultimedia, IEM, are under a license Attribution-Noncommercial-No Derivative Works 2,5S p a i n , of C r e a t i v e C o m m o n s . All the conditions of use in:http://creativecommons.org/licenses/by-nc-nd/2.5/es/deed.en_US
In order to mention the works, you must give credit to the authors and to this Journal.
Interactive Educational Multimedia, IEM, does not accept any responsibility for the points ofview and statements made by the authors in their work.
Subscribe & Contact IEM
In order to subscribe to IEM, please fill out the form at www.ub.es/multimedia/iem (link:REGISTER)
48
Interactive Educational Multimedia, Number 17 (October, 2008), pp. 48-68http://www.ub.edu/multimedia/iem / [email protected]
Personalised learning environments: core development issues forconstruction
Sharifah Mazlina Syed [email protected]
Jack Steven [email protected]
Jason Underwood2
University of Salford, UK
Summary
The growth of e-Learning has been continual and sustained. This has been fuelled bydevelopments in Information and Communication Technologies (ICT) the nuances ofwhich are starting to reap considerable benefits in the educational and businessenvironments. Specific benefits have included e-interoperability, scalability,adaptability and the mass-customisation of learning packages to the distributedlearner community. Notwithstanding the technology related issues, from a pedagogicperspective, learning styles and instructional strategies are now being intensivelystudied in the ‘traditional’ classroom setting to leverage advantage. However, therehas been little research undertaken on the application of learning styles within theeducational arena, perhaps because of limited authoring applications or explicitchoice vis-à-vis the creation of instructional strategies for specific learning styles. Inthis context, some of the evidence identifies that the more thoroughly instructorsunderstand the differences in learning styles, the better chance they have of meetingthe diverse learning needs of learners. Therefore, the paradigm of ‘one size fits all’,by default, can only address the generic learner issues (and not the specific
2 Sharifah Mazlina Syed Khuzzan is currently a Graduate Teaching Assistant as well as a PhD candidate in the
School of Built Environment at the University of Salford, UK. She completed a master’s degree in IT Managementin Construction in 2002 from the same university. Her research interests include learning styles, personalisedlearning environment and learning objects. Dr. Jack Steven Goulding is currently the Deputy Director of theResearch Institute for the Built and Human Environment (BuHu) within the Faculty of Business Law and the BuiltEnvironment at the University of Salford, UK. His area of expertise covers Construction Management, IT StrategyDevelopment, Organisational Learning and e-Learning initiatives. Dr Jason Underwood is a lecturer inconstruction IT and currently the Director of PhD programme at the School of Built Environment at the Universityof Salford, UK. His background is in Civil Engineering and his research experience and areas of interest are inConstruction IT/innovation and in the field of Concurrent Engineering and Integrated and CollaborativeConstruction.
49
‘personalised’ learner requirements). This paper introduces the concepts and issuessurrounding the development (and barriers) of personalised learning environments,which incorporates learning styles.
Keywords
Personalised learning environment; learning objects; learning styles; pedagogy.
1. Introduction
The development of technology-enhanced learning is continually evolving (Bouzeghoub et al.,2006)
and with the advent of digital age the learning industry has experienced a major paradigm shift over
the last decade in e-Learning (Sampson et al., 2002; Venkatachary, 2002). This rapid development
has placed educational environments in a state of flux (Andrews & Crock, 1996) as institutions strive to
embrace these opportunities in order to innovate and dispel the conventional ‘intractable’ conditions
for learning (Benesova et al., 2002). Such conditions include the concept of synchronous
communication; inflexible learning geared to a specific timeframe; high learner to instructor ratios;
expensive materials, etc.
e-Learning involves different aspects of using e-documents for learning related activities. It tends to
embrace such issues as managing curriculum courses on the Web (advertising, registration,
scheduling, exams, etc.), through to online publishing, tutorials, assessment, etc. Specific efforts have
been made to create high-quality and relevant online learning material, as well as the support
infrastructure (to support and facilitate the learning process).
Learners often have different levels of motivation, different attitudes about teaching and learning, and
different responses to specific classroom environments and instructional practices. In this context, the
more thoroughly instructors understand these differences, the better chance they have of meeting the
diverse needs of their learners (Felder and Brent, 2005). Furthermore, Karagiannidis and Sampson
(2004) noted that there was a general shortage of evidence to back up the belief that e-learning
provided real advantages - the assumption of which was that ‘traditional’ mode of instruction (one –to-
many lecturing/one-to-one tutoring) cannot fully accommodate the different learning styles, strategies
and preferences of diverse learners. Following this train of thought, research is now being undertaken
on adaptive learning environments that can personalise the learning experience (Vercoustre et al.,
2005, Sampson and Karagiannidis, 2002).
2. Research Methodology
The research methodology approach adopted for this paper embraces the distillation of core research
material gathered from a detailed literature review. The literature review encompassed concepts and
issues surrounding the development (and barriers) of personalised learning environments, specifically
within the context of the management and social sciences fields. A qualitative approach was used in
this research, as this was considered more suitable for studying social and cultural phenomena (Berger
50
and Luckman, 1966). This paper explores the relationship between pedagogy and technology in the
context of the design and implementation of a Personalised Learning Environment (PLE). The
technology issue was addressed in terms of learning objects and standards, together with their roles
and functions in providing interoperability between delivery platforms, reusability and manageability of
e-learning materials, and accessibility. The implementation framework for the PLE adopted the
principles of the “Collaborative System Design" approach as identified by the Advanced Distributed
Learning (ADL) Initiative Guidelines (ADL, 2006).
3. e-Learning
The term ‘e-Learning’ is relatively new (Bose, 2003), and several definitions have been cited. For
example, Horton (2001) cites e-Learning as “the use of Internet and digital technologies to create
experiences that educate fellow human beings”, whereas Fry (2000) defines e-Learning as “delivery of
training and education via networked interactivity and a range of other knowledge collection and
distribution technologies”. Moreover, Roffe (2002) defines the term e-Learning, e-Education or online
learning as “…the way people communicate and learn electronically which has recently emerged as a
key source of competitive advantage in the information society”. Welsh et al (2003) define e-Learning
as “the use of computer network technology, primarily over or through the Internet, to deliver
information and instruction to individuals”.
In addition, Hirumi (2002) defines e-Learning as a “learning that is stimulated primarily through the
use of telecommunication technologies, such as electronic mail, bulletin board systems, electronic
whiteboards, inter-relay chat, desktop video conferencing and the worldwide-web. Urdan and Weggen
(2000) define e-Learning as “…a set of applications and processes, including computer based learning,
web based learning, virtual classrooms, and digital collaboration”. Tavangarian et al. (2004) define e-
Learning as “…..all forms of electronic supported learning and teaching, which are procedural in
character and aim to effect the construction of knowledge with reference to individual experience,
practice and knowledge of the learner. Information and communication systems, whether networked or
not, serve as specific media (specific in the sense elaborated previously) to implement the learning
process”.
3.1 Pedagogical Developments in e-Learning
From a pedagogical perspective, Bixler and Spotts (2000) reported that since e-Learning is a relatively
recent phenomenon, the underlying pedagogical principles have not really been fully considered, and in
this context it can be noted that the majority of pedagogical principles that apply to the ‘traditional’
classroom delivery method also apply to e-Learning. A number of pedagogies and approaches are
often quoted in the e-Learning literature (constructivism, communities of practice, collaboration).
However, it is suggested that much of what is described could more easily be explained in terms of
didactic and behaviourist approaches to learning (Canole et al., 2004). Thus, e-learning can not
continue to exist without pedagogical techniques, nor without incorporation and consideration of
domain-specific knowledge (Govindasamy, 2002). This situation poses a serious challenge to any
51
organisation embarking on (or implementing) e-Learning in their environment. Furthermore, in the
context of learning management systems (LMS), (Govindasamy, 2002) also noted that many features
and tools of LMS are often left unused. This could be construed as a waste of resources, since these
tools often account for a considerable amount of the resource expenditure. Furthermore, in the worst
case scenario, these tools may end up being a barrier to pedagogical principles (thus affecting its
effectiveness) let alone return on investment. From this standpoint, it is argued that pedagogical
principles are backbone theories that govern good practice, and which form the primary rubrics from
which teaching and learning coalesce. In relation to e-Learning, good practice of teaching or instruction
is well represented in a diverse linking science known as Instructional Technology (Govindasamy,
2002).
From a learning context, several models for learning have been proposed, such as Kolb’s experiential
learning cycle (Kolb, 1984), Jarvis’ model of reflection and learning (Jarvis, 1987), and Barnet’s
framework for higher education (Barnett, 1990). Each model has particular focus and emphasis, and is
aligned with a particular set of theoretical perspectives (Canole et al., 2004) to encourage specific
aspects of learning. Although e-Learning appears to offer benefits for adult learners, including 24/7
delivery, e-Learning courses have however been criticised for their lack of pedagogic underpinning.
When designing instructional material, it is therefore important to accommodate elements that reflect
these nuances, e.g. learning styles (Bajraktarevic et al., 2003). Furthermore, technological
developments have now made it much more important to concentrate on learning styles and
preferences (Weber and Brusilovsky, 2001), including the correlation between individual learning styles
and the learning environment (Beacham et al., 2002). Hence, these issues are currently being
‘mapped’ against technological developments, the process of which is creating very powerful
knowledge-based learning environments that can be tailored to suit individual learner needs (blending
learning content and learner styles), as a close relationship between pedagogy and technology
evolution is an important aspect in designing and managing educational systems – vis-à-vis the role of
technology evolution as an enabler of new pedagogical concepts(Pahl, 2003).
3.2 Instructional Design (ID) Theory
Instructional Design (ID) theory is “a theory that offers explicit guidance on how to help people learn
and develop” (Reigeluth, 1999). This sets out procedural steps to systematically design and develop
instructional materials (Dick and Carey, 1990; Gagne et al., 1988; Merrill et al., 1996). There are
many different theories that are used for Instructional Design (Dick and Carey, 1990; Gagne et al.
1988; Merril et al. (1996). One of the important characteristic of ID theory is that these are design-
oriented (or goal-oriented). ID theories require at least two components: (i) methods for facilitating
human learning and development and, (ii) indications as to when and when not to use those methods
(Reigeluth, 1999). According to Alshawi et al. (2005), ID theories focus on the learning process
through the implementation of cognitive approaches, e.g. the sequential steps for effective learning
(refer Alshawi et al., 2005 for key instructional ID theories). Merrill et al (1996) described a set of
perceptions for determining the appropriate instructional strategies needed to enable learners to
acquire instructional goals. This approach appears to also prescribe a variety of instructional methods
52
depending on the type and nature of the subject matter, individual learning styles, assessment
procedures and others.
3.3 Technical Developments in e-Learning
The rise in prominence of e-Learning evolved out of the dot-com boom (Bose, 2003). Since then, e-
Learning has become a relatively significant component of training and development within the
corporate environment (Waight and Steward, 2005). Knowledge of e-Learning has largely been
developed from the experiences of learners and teachers in education using Interactive internet
technologies to create online learning environments that support learning communities (Downes,
1998; Fisher et al., 2000; Hill and Hall, 2001). In addition, considerable resources have been
leveraged to create high quality and relevant online learning material, as well as to the design and
implementation of systems that support users in their learning process (Vercoustre and McLean,
2005). However, Vercoustre and McLean (2005) pointed that the process of creating learning materials
are labour intensive and time consuming, even with the existence of a detailed course descriptions and
lesson plans. In this context, Casey and McAlpine (2003) describe that preparing learning materials
typically involve:
- Finding good document sources relevant to the topics and to the audience.
- Selecting more specific parts of documents that could be reused, in particular graphics, tables,
images, which have a high illustrative power, and creating new material that can be adapted
for personalisation and future reuse.
- Defining the sequence in which documents and fragments about some concepts should be
accessed or presented.
- Defining the curriculum planning that would fit with the pedagogic approaches, and that will
hopefully adapt to the actual learner.
Boyle (2003) reinforced this mandate, noting that developing cost effective e-Learning material is now
considered as one of the most important factors, especially concerning the return on investment
equation. This fundamental cost can often be influenced by the level of interactivity used, as the higher
the level of interactivity then the greater the demand on resources (and vice versa). Hence, the cost of
developing high levels of learner interactivity can be quite considerable, with figures of around 300
hours for every 1 hour of e-Learning content developed being quoted (Collaborativelearningsystems,
2005). In addition, there are other costs to consider, e.g. the operational costs, content delivery costs,
maintenance costs, etc. This is however, highly dependant upon a number of factors, not least users’
learning styles, current knowledge base, adaptability, shareability, etc. (Watson and Ahmed, 2004). In
this capacity, programme authoring should try to define reusable learning material that can be
retrieved, adapted and assembled in a coherent way (Vercoustre and McLean, 2005; Rosenberg,
2001). Thus, it is apparent that one particular solution to these issues could be the potential use (and
reuse) of learning objects (Alshawi et al., 2005).
53
4. Learning Objects
A learning object is considered as any resource or content object that is supplied to a learner by a
provider with the intention of meeting the learner’s learning objective(s), and is used by the learner to
meet that learning objective(s) (Vercoustre and McLean, 2005). According to Dahl and Nygaard
(1966), the key notions behind learning objects are that they can be used and reused in different (and
multiple) learning contexts. Duncan (2003) considers learning object as something tangible that is
produced by bringing together subject knowledge and pedagogical expertise.
The current focus in the e-Learning domain has predominantly been centred upon the development of
technical infrastructures that support reusability, interoperability, durability and accessibility of
learning content (Bannan-Ritland et al., 2002 and Hummel et al., 2004), and the use and reuse of
these learning materials has been an issue for more than two decades (Collis and Strijker, 2003).
However, the ‘reusability’ of an electronic learning resource often depends on its ‘fit’ with the
language, culture, curriculum, computer-use-practices, and the pedagogical approaches of the
potential learners and their instructors. In this context, the reuse of learning objects has managed to
gain a lot of attention in the business world (Collis and Strijker, 2003), as reusability is an important
principle that serves as the foundation for describing a learning object (Polsani, 2003). According to
Collis and Strijker (2003), this issue often occurs in the context of the introduction of ‘e-Learning’ as
an alternative to ‘classroom courses. A lot of work has been focused on the development of standards
for learning objects and significant effort has been made to develop standard descriptions for
aggregations of learning objects, e.g. in the form of a course module (Lukasiak et al., 2005).
4.1 Characteristics of Learning Objects
The following entails the core characteristics that relate to learning objects (Longmire, 2000;
Knolmayer, 2003):
- A unit of learning material that should ideally not need to be redesigned or modified.
- have the ability to be subjected to any type of Instructional Strategy and not lose its meaning
or be altered.
- The reuse of such material in the construction of further new or different new material.
- There is no need to alter, or know exactly what is inside a specific object.
- To be taken from its knowledge structure and reused by placing it seamlessly into a new
knowledge structure to form a new course as desired.
- Refers to a set of steps whereby learners can search for a specific object, and if they require
this object for their new course, to simply choose it and insert it into their specific
requirements.
- Able to be searched.
- The ability for the Learning Objects to be used on multiple hardware.
54
- Enable the learner to integrate the disparate strands of instruction of the learning object into a
concrete holistic result.
4.2 Benefits of Learning Objects
Invariably with any type of paradigm shift and incorporation of new technology, there will always be
advantages and disadvantages associated with the dynamic change involved (James, 2003). The
benefit of learning objects comes from their reusability. As discrete units, they can be incorporated into
a wide range of courses or learning scenarios. Their standards-based structure makes them available
for use in many different learning management systems and other applications. They also appear to be
pedagogically effective.
According to Alsubaie (2006), learning objects are a cost-effective, efficient alternative to traditional
course construction and materials. Moreover, they are more cognitive aligning than traditional
material, thereby improving the learning process. Furthermore, they can be deployed within courses
within a distributed Learning Environment that can offer performance, location, cost and learning
advantages over traditional Learning Environments. They are reusable, self-contained, meta-tagged
and should contain learning outcome entities that can offer considerable cost, production and delivery
performances over traditional material, as well as leverage the elements required to successfully
improve the learning processes that are vital if a learner is to partake in the learning experience –
especially personalised learning (Alsubaie, 2006).
CLOEstories (2001) listed the following reasons why using learning objects can provide a positive value
for the instructor, the classroom and the learners:
1 Providing Different Ways and Modalities for Learning: Bringing a learning object into the
classroom can mean presenting content to the learner in new and novel ways. It could bring
some interest to a disinclined learner, even spark a euphoric moment for others. Presenting
content in a different and/or new way to how the information is traditionally taught in the
classroom can present a variety of fresh and even different perspectives.
2 Engaging the Learner in a New Way: Stemming from the point above, providing the learner
with learning objects in the classroom, something that is different from the traditional ways of
teaching, could create a greater engagement factor for the learner. Meeting the learners’
expectations, needs, etc can present added learning benefits.
3 Size, Flexibility, and Adaptability: Learning objects can be created in a variety of manageable
sizes. Putting a number of Learning Objects together can create a larger object, or even a
larger learning unit.
Listed below are among the benefits gained by organisations in using learning objects (Mortimer,
2002):
55
- Able to develop and deploy learning content quickly and efficiently.
- Able to port content easily between multiple learning management systems and learning
- Content management systems.
- Able to reduce content development and delivery costs.
- Able to reduce maintenance time and costs.
Likewise, learners benefit because they can access individualised learning paths, and competency-
based rather than course-based learning events. A distributed learning environment that may consist
of a PLE amongst other learning environments can potentially teach effective learning object-based,
personalised training programmes to a plethora of learners. According to Alsubaie (2006), this has
distinct advantages over utilising traditional material since it can allow potentially hundreds of learners
to access courses simultaneously. Furthermore, it enables the learner to learn in their own time and at
their own pace.
5. e-Learning Standards
Standards play an important role in the innovation, development, evolution and adoption of any
product (Alshawi et al., 2006). According to Alshawi et al. (2005), the e-Learning industry and
organisations need to protect their learning content and increase return on investment. Standards help
to protect the six ‘abilities’ which protect and even nurture e-Learning investments. The following e-
Learning standards have been identified by the e-Learning Consortium (2003):
Interoperability:
- Able to mix and match content from multiple sources (and within multiple systems).
- To enable multiple systems to communicate, exchange and interact transparently.
Re-usability
- To enable content and code to be reassembled, disassembled, and re-used quickly and easily.
- To enable content objects to be assembled/ used in a context other than that originally
designed.
Manageability
- To enable the systems track the appropriate information about the learner and the content.
- Management of the complex selection and assembly of personalised content.
Accessibility
- To enable learner to access the appropriate content at the appropriate time on the appropriate
device.
Durability
- To ensure buyers are not trapped by a particular vendor’s proprietary learning technology.
56
- To ensure that no additional investment is required for re-usability and interoperability.
Scalability
- To enable learning technologies to be configured in order to have expanded functionality to
serve broader populations and organisational purposes.
- To enable an organisation’s return on investment in e-Learning products to be increased if they
can be leveraged beyond the original scope.
Affordability
- To ensure that the learning technology investments are wise and diverse to risk.
According to Alshawi et al. (2006), there have not been official standards in e-Learning that content
providers must adhere to - only a collection of different specifications by different organisations.
However, many leading organisations have now started to share these concerns and beginning to
develop an official standard with interchange capability.
6. Personalised Learning Environment: Definitions and Attributes
Alsubaie (2006) defines a Personalised Learning Environment (PLE) as “an electronic learning
environment consisting of a learner and the Instructional System”. According to Alsubaie (2006), most
of the learning environments available claim to offer personalised learning. However, the effectiveness
of such programmes for individual learners is limited for a variety of reasons and as such these
elements have not fully attained their potential to create effective and efficient personalised learning.
These include: (i) information rather than instruction being delivered (e.g. the course material is thus
pedagogically ineffective); (ii) the lack of exchangeability and reusability between learning materials;
(iii) ineffective implementation strategies; and (iv) the mechanistic utilisation of technology, rather
than technology being utilised as an informatics driver.
Nevertheless, over the past few years PLE has increasingly become more popular. Personalised support
for learners becomes more important when e-Learning takes place in an open and dynamic learning
and information networks (Dolog and Sintek, 2004). The PLE should ideally be a robust and flexible
Instructional System-based learning environment which can provide cost-effective learning based on
the personal needs and background of the learner. It should be capable of delivering individual,
bespoke and personalised training matched to the individual needs and learning style. The usability of
a PLE is typically designed towards a specific end delivery system or a specific set of standards
(Sampson et al., 2005).
The emergence of the Knowledge Society and the Knowledge-based Economy signify a new era for
education and training (Sampson and Karagiannidis, 2002). According to Rosenberg (2001), the typical
demands made on the way education and training is planned, organised and delivered are as follows:
57
- Personalised training schemes tailored to the learner’s objectives, background, styles and
needs.
- Flexible access to lifelong learning as a continual process rather than a distinct event.
- Just-in-time training delivery.
- New learning models for efficient integration of training on workplaces.
- Cost effective methods for meeting training needs of globally distributed workforce.
The rapid evolution of ICT provides e-Learning as a new paradigm in education and training. Sampson
(2001) reported that e-Learning capitalises on advances information processing and internet
technologies to provide, among others:
- Personalisation: where training programmes are customised to individual learners, based on an
analysis of the learners’ objectives, current status of skills/knowledge, learning style
preferences, as well as constant monitoring of progress. On-line learning material can then
compiled to meet personal needs, capitalising on re-usable Learning Objects.
- Interactivity: where learners can experience active and situated learning through simulations
of real-world events and on-line collaboration with other learners and instructors.
- Media-rich content: where educational material can present in different forms and presentation
styles, and learning material can indexed and organised in such a way that it can be searched,
identified and retrieved remotely from several different learners providing the right material to
the right person at the right time.
- Just-in-time delivery: where technologies such as electronic performance support systems can
facilitate training delivery at the exact time and place that it is needed to complete a certain
task, and wearable computers can provide real-time assistance in actual work environments.
- User-centric environments: where the learner takes responsibility for his/her own learning, and
the instructor acts as the ‘guide on the side’ rather than a ‘sage on the stage.
The constitution and delivery aspects of a PLE should address the parameters of (and relationships
between) learners’ needs and requirements, learners’ learning process and the learning/ knowledge
repository (refer Alshawi et al., 2005; Alsubaie, 2006 for further detail). According to Alshawi et al.
(2005), learners are continually searching for ways to fulfil their individual needs, and in this context,
are influenced by their individual histories and preferences. Learning behaviours often differ by
preferred learning styles and environment as well as motivational and transformational factors.
Attaining a match between learners’ needs and the ‘supply side’ will require replacing traditional
educational approaches with alternatives that emphasise the primacy of the learning materials
architecture in order to deliver effective personalised learning environments.
The efficiency of the delivery process depends on a variety of factors to be achieved in terms of
creating, searching, reproducing, assembling and delivering the body of knowledge in support of the
learning experience; which are considered important, as substantial investments are made in the
creation of learning materials in a usable and acceptable format (Alshawi et al., 2005). This is where
58
the assembly of learning objects as the reusable digital resource comes in to naturally embrace the
relationships of object technology with pedagogy and learning.
6.1 Barriers Pertaining To the Development of PLE
Personalised learning is still a new concept, and there is as yet little evidence of where e-Learning fits
within it. While e-Learning has been said to present a cost-effective solution to these issues, ICT
awareness among teaching staff is patchy, and teacher competence in ICT also uneven. Awareness of
the benefits of online learning is high, but there is still a strong perception that it would leave staff
feeling isolated (Gunasekaran et al., 2002). Some of the barriers pertaining to the development of PLE
have been identified below:
- Over-Reliance on Technology: The genuineness of technology as a key driver for personalised
learning depends on how much it is fit for purpose and designed to meet the needs of users.
Technology should not be seen as the sole route towards a more personalised approach.
Personalised learning, interpreted through e-Learning, needs to avoid becoming isolated
individual learning, with the student entirely self-directed and interacting only with the
computer. The ability of technology to provide instant and regular feedback is a definite
advantage - but only when coupled with teacher support.
- Learner Resistance: e-Learning can in some circumstances adversely affect student retention,
with students citing the problem of having insufficient time, which seems to have replaced the
historical problem of distance to access and complete their e-Learning programmes. Lack of
familiarity with ICT can also present a serious barrier, according to an action research project.
Providers need to avoid self-satisfaction in assuming that prospective learners will be IT-
conversant.
- Staff Development: There seem to be a long way to go before personalised learning through e-
Learning can be fully realised. Confidence in adopting new technologies appears to be a key
issue. There needs to be a commitment to training at a senior level. Skills in selecting,
organising and adapting learning materials will become crucial in developing personalised
learning approaches, as will technical skills in the use of multimedia resources.
7. Learning Styles: Defined and Described
The critical learning concept of learning style should be addressed within all learning environments,
whether technology based or not. There is no single way to describe learning styles, as a number of
definitions appear in the literature (Sampson and Karagiannidis, 2002). For example, Conner (2005)
defines learning styles as “….the ways you prefer to approach new information”. Dunn (1990)
described learning styles as “….the way each learner begins to concentrate, process and retain new
and difficult information”. Moreover, Keefe (1979) defines learning styles as a ". . . diagnosis [that]
opens the door to placing individualised instruction on a more rational basis. It gives the most powerful
59
leverage yet available to educators to analyze, motivate, and assist students in school . . . it is the
foundation of a truly modern approach to education". In addition, Honey and Mumford (1992) define
learning styles as “…..a description of the attitudes and behaviour which determine an individual’s
preferred way of learning”.
The acquisition of different types of knowledge and skill appears to require different conditions for
learning (Gagné, 1985). According to Merrill et al. (1996), if an instructional experience or
environment does not include the instructional strategies required for the acquisition of the desired
knowledge or skill, then effective, efficient, and appealing learning of the desired outcome will not
occur. Sampson and Karagiannidis (2002) have classified learning styles into 11 models, namely:
Kolb’s Learning Styles Inventory; Dunn and Dunn; Felder and Silverman Index of Learning Styles;
Riding-Cognitive Style Analysis; Honey and Mumford-Learning Style Questionnaires; Gregoric-Mind
Styles and Gregoric Styles Delineator; McCarthy-4 Mat System; Gardner-Multiple Intelligence
Inventory; Grasha-Riechmann - Student Learning Style Scale; Hermann-Brain Dominance Model and
Mayers-Briggs – Type Indicator (Sampson and Karagiannidis, 2002).
7.1 Importance of Incorporating Learning Style into a PLE
Learning seems to be seen as an integral part of everyday life at work. The skill of knowing how to
learn is considered a must for every worker. It opens doors to all other learning and facilitates the
acquisition of other skills (Blackmoore, 1996). Student learning is a complex multivariate phenomenon.
Some individuals are heavily dominated by one learning styles, or are just particularly weak in one
style, so some learning activities are dominated by explicit or implicit assumptions about learning
styles (Honey and Mumford, 1992). The activity may be geared to a particular style of learning as to
cause a mismatch with any other learners whose own major styles are different. Also of course, there
are learners whose learning styles are wide spread, so there are learning activities which contain
opportunities to learn in different styles (Sims, 1990). According to Kim and Chris (2001) and Kolb
(1984), educational research and practices have demonstrated that learning can be enhanced when
the instructional process accommodates the various learning style of students. Learners come from
different backgrounds and have a great variety of differing profiles, learning styles, preferences and
knowledge hooks. Learning should be as personalised as possible (Vincent and Ross, 2001) as a ‘one
size fits all’ approach has been seen to be ineffective (Watson and Hardaker, 2005). Incorporation of
learning styles is said to bring an advantage during the development and implementation of a learning
environment (Sims, 1990).
The need for both teachers and trainers to take learning styles into account appears to be greater
today than before, due to the increasing use of technology-aided instruction. Technology offers a lot of
new ‘delivery mode’ options as compared to the traditional ‘face-to- face’ classroom format, including a
variety of computer and television-based delivery mode formats (Buch and Bartley, 2002). The
development process based on individual learning styles and preferences through adaptive
technologies has been a successful approach towards training that enables real-time performance
evaluation through behavioural and attitude measures (Watson and Hardaker, 2005). O'Conner (1998)
60
pointed out that technology offers new capabilities to reconstruct learning environments around
specific learning styles. An assumption was made that individuals with specific learning styles would
have a preference for specific training delivery formats (Buch and Bartley, 2002). Since e-Learning has
predominantly had a ‘one size-fits all’ approach, the idea of incorporating learning styles into the
learning environment will enable learners to learn more effectively and also be motivated to learn by
building a ‘road-map’ based on their individual psychological types and learning preferences
(Gunasekaran et al., 2002; Sims, 1990).
Teachers or instructors should: (i) know the material well before beginning to teach; (ii) write
objectives and keep them in focus from planning to evaluation; (iii) letting the students know what the
objectives are; and (iv) determine the learning style of students before teaching and educating
students according to their own learning style and showing them how to cope (Vincent and Ross,
2001). According to Vincent and Ross (2001), learners need to know what their own learning style is in
order to manage their learning more effectively and efficiently. At the same time, trainers should also
be aware of the learning styles of their students so that they can establish alternate ways of teaching
identical information to students. The Dunn and Dunn model of learning styles prescribes that all
individuals have a specific learning style; this differs from person to person, and each person has
learning style strengths or preferences. The model suggests that it is easier to learn through one’s
strengths or learning style preference. The central aim of the model is that the “closer the congruence
between students’ learning style and their teachers’ teaching styles”, the higher the level of
achievement (Pheiffer et al., 2005). Alsubaie (2006) suggests that learning styles should be
incorporated in a learning environment to achieve a holistic environment that appeals to a whole raft
of learners.
8 Personalised Learning Environment (Incorporation of Learning Styles) : Conceptual
Framework
Figure 1 explains the process involved in developing a PLE prototype which is divided into two phases;
(i) the development of the Diagnostic tool, which is the tool to identify the learners’ styles (Phase1)
and (ii) the development of the prototype itself (Phase 2).
8.1 Phase 1 – Development of ‘Diagnostic Tool’
During this phase, literature review is conducted in recognising the models of learning styles available.
The models of learning styles are then narrowed into three most cited and considered reliable models
of learning styles. Each of the three models of learning styles has their own instrument of learning
styles. By critically analysing and amalgamating the similarities of each learning styles in each model,
a proposed model of learning style is constructed. Within this model, there will be a set of learning
styles. This instrument will be known as a ‘Diagnostic Tool’ to measure a learner’s learning style and
will be developed based on critically studying the three core instruments chosen and amalgamating the
questions (merging the questions from all three core instruments and discarding the repeated ones to
avoid duplicates). This ‘Diagnostic Tool’ will have to look into the issues of reliability and validity. This
61
tool will then be validated by getting expert opinions in the field of learning styles. Once validated, the
tool will be tested within 50 learners from the University of Salford. The respondents of the
questionnaire will be targeted to address the following issues; (i) age, (ii) gender. (iii) educational
Background, (iv) ethic group, etc. to ensure that no biasness have occurred during the conduct of the
testing.
8.2 Phase 2 – Development of the Prototype
The development of the PLE prototype is the second phase of this research. ID theories will be used to
‘map’ pedagogy with technology. Learning objects will be used together with e-Learning standards and
interoperability between delivery platforms, reusability of e-learning materials, etc. The final stage of
this research will then incorporate a case study research approach in order to ascertain the construct
validity, relevance, and ‘market-fit.
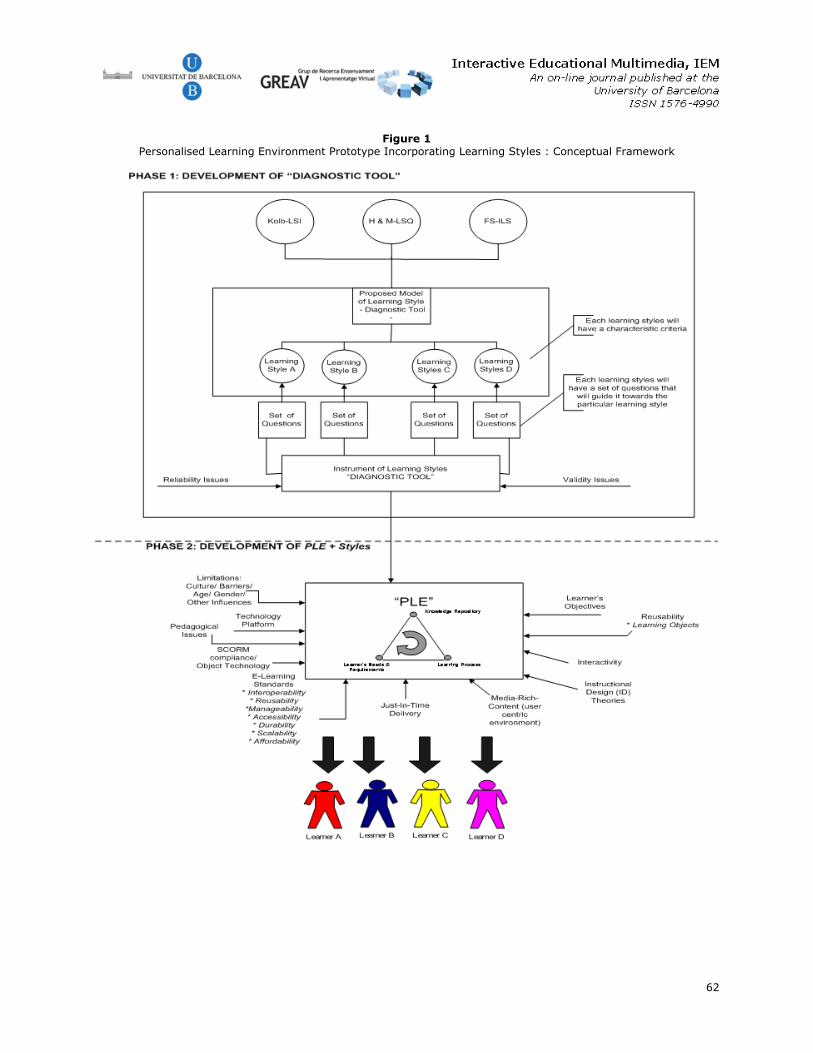
62
Figure 1Personalised Learning Environment Prototype Incorporating Learning Styles : Conceptual Framework
63
9. Conclusion
The advances in technology have increased the demand for new and innovative teaching approaches,
prompting the design and development of cost-effective and high quality e-Learning environments
which can efficiently respond to learners’ needs and requirements. Over the past decade, research has
attempted to address key areas in this field, such as the automation of the learning process, improving
the portability of e-learning materials, pedagogy, learning objects and e-Learning standards. The
relationship between pedagogy and technology also appears to be an important aspect in designing
educational systems.
It appears that the developments and strategic alliances in e-Learning could produce a revolution in
the way education and training is delivered in the knowledge-based economy, particularly increasing
the delivery of knowledge globally through the Web. It is widely accepted that learning through the
Web (e.g. e-Learning) can take place anywhere, at any time, through any computer and without
necessarily the presence of a human tutor. However, research findings have found that the majority of
e-Learning applications are rather static and represent a generic approach to tutoring that does not
take into account the individual needs (e.g. learning styles) of each student that is using the
educational application.
Hence, this paper has provided a literature on the issues (and barriers) of incorporating learning styles
into a PLE. The quality of technological delivery and developing effective pedagogies are crucial issues
in shaping the said e-Learning future. This paper briefly introduced the conceptual framework for the
development of a PLE (incorporating learning styles) from an educational, pedagogical, and
technological as well as standardisation perspective by adopting the principles of the "Collaborative
System Design" approach, as identified by the Advanced Distributed Learning (ADL) Initiative
Guidelines (Alshawi et. al, 2005). This conceptual model has not been tested and the author invites
rooms for discussions and comments for improvement. This conceptual framework will lead towards a
development of a personalised learning environment prototype which incorporates learning styles for
the UK construction industry leading towards a PhD study.
References
ADL (2006). Advanced Distributed Learning Initiative. URL http://www.adlnet.gov/index.cfm [Accessed 1 November2006].
Alshawi, M., Goulding, J. S. and Faraj, I. (2005), "Knowledge-based learning environments for construction",Journal for Education in the Built Environment, 1(1), 51-72. 17, 93-98.
Alsubaie, M. (2006), "Creating a personalised learning environment using learning objects", School of Constructionand Property Management, University of Salford.
Andrews, T., & Crock, M. (1996). “Putting the pieces of the puzzle together: Preparing students and staff forchanges in educational environments”. In S. Gregor & D. Oliver (Eds.), Proceedings: Processes OfCommunity Change (pp. 195-202). Rockhampton Queensland: Central Queensland University
64
Bajraktarevic, N., Hall, W. and Fullick, P. (2003), "Incorporating learning style in hypermedia environment:empirical evaluation". Proceedings of AH2003: Workshop on Adaptive Hypermedia and Adaptive Web-BasedSystems, May 20-24, Budapest, Hungary.
Bannan-Ritland B., Dabbagh N. and Murphy K. (2002) Learning object systems as constructivist learningenvironments: related assumptions, theories, and applications, in: D. A. Wiley (Ed.) The instructional use oflearning objects. Bloomington, IN: Agency for Instructional Technology and Association for EducationalCommunications & Technology, 61–97.
Barnett, R. (1990), The Idea of Higher Education, Open University Press, Buckingham.
Beacham, N. A., Elliott, J. L., Alty, J. L. and Al-sharrah, A. (2002), Media Combinations and Learning Style: DualCoding Approach, Denver, Colarado.
Berger, P. L. and Luckman, T. (1966), The Social Construction of Reality: a Treatise in the Sociology of Knowledge,Double Anchor, New York.
Bixler, B., & Spotts, J. (2000), “Screen design and levels of interactivity in web-based training”,http://www.clat.psu.edu/homes/jds/john/research/ivla1998/ivla98.htm. [Accessed 19 September 2006].
Blackmoore, J. (1996), "Learning style preferences online", Telecommunications for Remote Work and Learning,http://www.cyg.net/jblackmo/diglib/ , [Accessed 24 September 2006].
Bose, K. (2003), "An e-Learning Experience: A Written Analysis Based on my Experience With Primary SchoolTeachers in an e-Learning Pilot Project", e-Journal: International Review of Research in Open and DistanceLearning, 4 (2)
Bouzeghoub, A., Defude, B., Duitama, J. F. and Lecocq, C. (2006), "A knowledge-based approach to describe andadapt learning objects", International Journal on E-Learning, 5, 95-98.
Buch, K. and Bartley, S. (2002), "Learning style and training delivery mode preference", Journal of WorkplaceLearning, 14, 5-10.
Canole, G., Dyke, M., Oliver, M. and Seale, J. (2004), "Mapping pedagogy and tools for effective learning design",Computers and Education, 43, 17-33.
Casey, J. and McAlpine, M. (2003). "Writing and using reusable educational materials: a beginner's guide",http://www.gla.ac.uk/rcc/staff/mhairi , accessed 16 September 2006.
Cloestories (2001), "About learning objects", http://tlc.uwaterloo.ca/projects/ccco/cloe_about_ben.html , [Accessed10 October 2006].
Coffield, F. J., Moseley, D. V., Hall, E., & Ecclestone, K. (2004). “Learning Styles for Post 16 Learners: What Do WeKnow?”, London: Learning and Skills Research Centre/University of Newcastle upon Tyne.
Collaborativelearningsystems. (2005). URL:http://www.collaborativelearningsystems.com/co/publications/elearningcost.pdf [Accessed 11 November2006].
Collis, B. and Strijker, A. (2003), "Re-usable learning objects in context", International Journal on E-Learning, 2, 5-16.
Conner, M.L. (2005), “What’s Your Learning Style?”, http://www.agelesslearner.com/assess/learningstyle.html ,[Accessed 6 November 2006].
Dahl, O. J. and Nygaard, K. (1966), "Simula - an AGOL based simulation language", Communications of the ACM, 9,671-678.
Dolog, P. and Sintek, M. (2004), "Personalisation in Distributed E-Learning Environments". Proceedings of 13th
World Wide Web Conference, 17-22 May, New York.
Downes, S. (1998), “The future of on-line learning”, On-line Journal of Distance Learning Administration, 1 (3),http://westga.edu/~distance/downes13.html , [Accessed 30 September 2006].
65
Duncan, C. (2003), “The Value of Managing Learning Objects: An Intrallect White Paper”,http://www.intrallect.com/products/intralibrary/papers/value.pdf , [Accessed 19 November 2006].
Dunn, R. (1990). “Understanding the Dunn and Dunn Learning Styles Model and The Need for Individual Diagnosisand Prescription”. Reading, Writing and Learning Disabilities, 6, 223 – 247
Dunn, R.,&Griggs, S. A. (2000). “Practical approaches to using learning styles in higher education”. Westport, CT:Bergin and Garvey.
E-Learning Consortium. (2003). Making Sense of Learning Specifications and Standards a Decision Maker's Guide totheir Adoption. 2nd Ed., November, 2003, The Masie Center. URL:http://www.masie.com/standards/s3_2nd_edition.pdf [Accessed 8 October 2006].
Felder, R. M. and Brent, R. (2005), "Understanding students' differences", Journal of Engineering Education, 94, 57-72.
Fisher, K., Phelps, R. and Ellis, A. (2000), “Group processes on-line: teaching collaboration through collaborativeprocesses”, Educational Technology and Society, 3 (3), http://ifets.ieee.org/periodical , [Accessed 28 August2006].
Fry, K. (2000), ``Forum focus and overview'', in Fry, K. (Ed.), The Business of E-Learning: Bringing yourOrganisation in the Knowledge E-conomy, Telcam Group, University of Technology, Sydney
Gagne, R. M., Briggs, l. J. and Wager, W. W. (1988), Principles of Instructional Design, Holt, Rinehart and Winston,New York.
Gagné, Robert M. (1985). The Conditions of Learning and Theory of Instruction, 4th Ed. Holt, Rinehart and Winston.
Govindasamy, T. (2002), “Successful Implementation of e-Learning Pedagogical Considerations”, Internet andHigher Education, 4, 287-299.
Gunasekaren, A., McNeil, R.D. and Shaun, D. (2002), "E-Learning: research and applications", Industrial andCommercial Training, 34(2), 44-53.
Hill, J.R. and Hall, A. (2001), “Building community in web-based learning environments: strategies and techniques”,Proceedings AusWeb01: The Seventh Australian World Wide
Hirumi, A. (2002), "The design and sequencing of e-Learning interactions: a grounded approach", InternationalJournal on E-Learning, 1, 19-27.
Honey, P. (2001), "E-Learning: a performance appraisal and some suggestions for improvement", The LearningOrganisation, 8, 200-203.
Honey, P. and Mumford, A. (1992), The Manual of Learning Style, Peter Honey Maidenhead.
Horton, W. (2001), “Leading e-Learning”, American Society for Training and Development,http://www.elearninggurus.com/articles/html, [Accessed 20 September 2006].
Hummel H., Manderveld J., Tattersall C. and Koper R. (2004), “Educational modelling language and learning design:new opportunities for instructional reusability and personalised learning, International Journal of LearningTechnology, 1(1), 111–126.
James, G. A. (2003), "Strategic thinking: advantages and disadvantages of online learning",http://www.comminit.com/strategicthinking/st2003/thinking-93.html , [Accessed 20 September 2006].
Jarvis, P. (1987), "Adult learning in a social context", Croom Helm, London.
Karagiannidis, C. and Sampson, D. (2004), "Adaptation rules relating learning style research and learning objectsmeta-data". In Magoulas, G. D. and Chen, S. Y. (eds.), Proceedings of International Conference on AdaptiveHypermedia and Adaptive Web-Based Systems, August 23-26, Netherlands.
Keefe, J. W. (1979). School applications of the learning style concept. In National Associations of Secondary SchoolPrincipals (Eds.), Student learning styles: Diagnosing and prescribing programs (pp.123-132). Reston, VA:National Associations of Secondary School Principals.
66
Kim, B. and Chris, S. (2001), "Accommodating diverse learning style in the design and delivery of on-line learningexperiences", International Journal of Engineering Education
Knolmayer, G. F. (2003), "Decision support models for composing and navigating through e-learning objects",Proceedings of System Sciences, 36th Annual Hawaii International Conference, 6-9 January.
Kolb, D. A. (1984), Experiential Learning, Englewood Cliffs, Prentice Hall, N.J.
Longmire, W. (2000), "A primer on learning objects", American Society for Training and Development (ASTD),March.
Lukasiak, L., Agostinho, S., Bennett, S., Harper, B., Lockyer, L. and Powley, B. (2005), “Learning objects andlearning designs: an integrated system for reusable, adaptive and shareable learning content”, Research InLearning Technology, 13(2), 151-169
Merrill, M. D., Drake, L., Lacy, M. & Pratt, J. A. (1996). Reclaiming Instructional Design. Journal of EducationalTechnology, 36 (5), 5-7.
Mortimer, l. (2002), "(Learning) objects of desire: promise and practicality",http://www.learningcircuits.org/2002/apr2002/mortimer.html , [Accessed 29 September 2006].
O'Conner, T. (1998), "Using learning style to adapt technology for higher education".http://www.indstate.edu/ctl/styles/learning.html , [Accessed 29 September 2006].
Pahl, C. (2003). “Managing evolution and change in web-based teaching and learning environments”, Computer &Educations, 40(2), 99-114
Pheiffer, G., Holley, D. and Andrew, D. (2005), "Developing thoughful students: using learning style in an hecontext", Education and Training, 47, 422-431.
Reigeluth, C. (Ed). (1999). Instructional Design Theories and Models: A new Paradigm of Instructional Theory.Hillsdale. NJ: Lawrence Erlbaum Associates.
Roffe, I. (2002), “e-Learning: Engagement, enhancement and execution”, Quality Assurance in Education, 10 (1),40-50.
Rosenberg, M. (2001), E-Learning: Strategies for Delivering Knowledge in the Digital Age, McGraw-Hill, New York.
Sampson, D. (2001). Current and Future Research and Technology Developments in e-Learning. 2nd InternationalConference on New Horizons in Industry and Education, Milos Island, Greece, 13-14 September 2001.
Sampson, D., Karagiannidis, C. and Kinshuk (2002), "Personalised learning: educational, technological andstandardisation perspective", Interactive Educational Multimedia, 4, 24-39.
Sampson, D., Karampiperis, P. and Zervas, P. (2005), "ASK-LDT: a web- based learning scenarios authoringenvironment based on IMS learning design", International Journal on Advanced Technology for Learning,2(4).
Sims, R.R., (1990), “Adapting Training to Trainee Learning Styles”, Journal of European Industrial Training, 14(2),17-22
Tavangarian, D., Leypold, M.E., Nölting, K., Röser, M. and Voigt. D. (2004), “Is e-Learning the Solution forIndividual Learning”, Electronic Journal of E-Learning, 2(2), 273-280.
Vercoustre, A. M. and Mclean, A. (2005), "Reusing educational material for teaching and learning: currentapproaches and directions", International Journal on E-Learning, 4, 57-68.
Vincent, A. and Ross, D. (2001), "Personalise training: determine learning style, personality types and multipleintelligence", The Learning Organisation, 8, 36-43.
Waight, C.L. and Steward, B.L. (2005), “Valuing the Adult Learner in e-Learning: part one – a conceptual model forcorporate settings”, The Journal of Workplace Learning, 17 (5/6), 337-345
Watson, J. and Ahmed, P. K. (2004), "Learning in the age of global information technology: development of ageneric architecture for an advanced learning management system", Campus-Wide Information Systems,21, 4-21.

67
Watson, J. and Hardaker, G. (2005), "Steps towards personalised learner management system (LMS): SCORMimplementation". Campus-Wide Information Systems, 22, 56-70.
Weber, G. and Brusilovsky, P. (2001), "ELM-ART: an adaptive versatile system for web-based instruction",International Journal of Artificial Intelligence in Education, 12, 351-384.
Welsh, E. T., Wanberg, C. R., Brown, K. G. and Simmering, M. J. (2003), "E-Learning: emerging uses, empiricalresults and future directions". International Journal of Training and Development, 7, 245-258.
68
In order to reference this document
Syed Khuzzan, S. M.; Goulding, J. S. & Underwood, J. (2008). Personalised LearningEnvironments: Core Development Issues for Construction. Interactive EducationalMultimedia, 17, 48-68. Retreived dd/mm/yyyy, from www.ub.es/multimedia/iem
Copyright
If the opposite does not indicate itself, the texts published in Interactive EducationalMultimedia, IEM, are under a license Attribution-Noncommercial-No Derivative Works 2,5S p a i n , of C r e a t i v e C o m m o n s . All the conditions of use in:http://creativecommons.org/licenses/by-nc-nd/2.5/es/deed.en_US
In order to mention the works, you must give credit to the authors and to this Journal.
Interactive Educational Multimedia, IEM, does not accept any responsibility for the points ofview and statements made by the authors in their work.
Subscribe & Contact IEM
In order to subscribe to IEM, please fill out the form at www.ub.es/multimedia/iem (link:REGISTER)
Related Documents