University of Michigan Hospital’s Operating Room Utilization Analysis by: Jim Caidwell Bernice Lin Grace Yee Client: Dr. Timothy Rutter Project Coordinator: Liz Othman, R.N. JOE 481-Senior Design Project University of Michigan, Ann Arbor June 1, 1993

Welcome message from author
This document is posted to help you gain knowledge. Please leave a comment to let me know what you think about it! Share it to your friends and learn new things together.
Transcript
University of Michigan Hospital’s OperatingRoom Utilization Analysis
by:Jim CaidwellBernice LinGrace Yee
Client: Dr. Timothy RutterProject Coordinator: Liz Othman, R.N.
JOE 481-Senior Design ProjectUniversity of Michigan, Ann Arbor
June 1, 1993

n

University of Michigan Hospital’s OperatingRoom Utilization Analysis
by:I Jim Caidwell
Bernice LinGrace Yee
Client: Dr. Timothy RutterProject Coordinator: Liz Othman, RN.
IOE 481-Senior Design ProjectUniversity of Michigan, Ann Arbor
June 1, 1993

TABLE OF CONTENTS
CEXECUTWE SUMviARY 1
INTRODUCTIONBackground 2
APPROACH AND METHODOLOGYData Collection 4Simulation 5Strengths and Limitations of Simulation Model 6
RESULTSACSC 8UMHOR 9
RECOMMENDATIONS 10
APPENDIX

EXECUTIVE SUMMARY
The purpose of this project was to determine how moving outpatient surgeries from the (University of Michigan Hospitals (UMH) operating rooms to an Ambulatory CareSurgical Center (ACSC) will affect the utilization of the UN’fH operating room. This studycenters around a computer simulation that models the UMH scheduling practices andcalculates operating room utilization by service and by day. This simulation wasconstnicted for the present OR utilization analysis and the OR utilization under twoscenarios involving the removal of some outpatient services. A simulation model was alsowritten to determine the utilization of the ACSC under these two service removalscenarios. Both four room and six room capacities where modeled for the ACSC.
The results of the simulation show that the present utilization of the UN’IHOR including allservices is 84.83%. Under scenario 1, the total utilization drops to 80.18% and dropsagain to 77.99% using scenario 2. The total utilization of the ACSC under scenario 1 is95.81% for four operating rooms and 68.3 1% for six operating rooms. For scenario 2,the total utilization for four operating rooms is 100.00% and for six operating rooms, theutilization is 99.94%. A complete presentation of all the service utilization times per dayfor all scenarios (LTIVLHOR and ACSC) is provided in the Appendix.
With a desired service utilization of 75.00% for the UMH, it is our conclusion that bothscenarios would maintain desired utilization levels for the UMHOR while scenario 2would clearly utilize the ACSC better than scenario 1. The simulation models should beused involving other service removal scenarios to determine the optimal utilization timesfor the TJMHOR and the ACSC.
A complete guide to the simulation programs used in this study is provided in the UserManual supplement. Questions regarding model guidelines and assumptions, thesimulation language used for the models, and logic behind the simulation models areaddressed in the manual.
The project team would like to recognize Dr. Tim Rutter, Liz Othman R.N., ScottLovelace, Christopher Parin, and Alan Kalton for their invaluable help on this project.
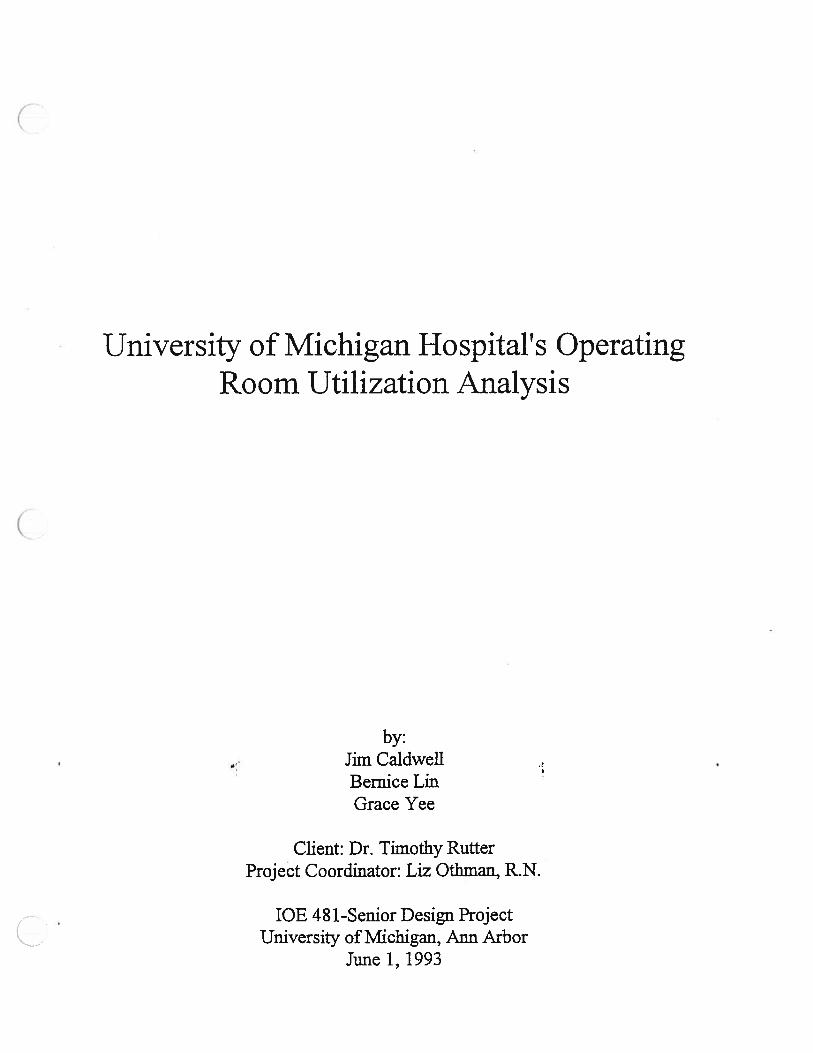
INTRODUCTION
I. Background
This project is a continuation of an ongoing study of the utilization of the UMH operatingrooms. Previous studies conducted by University of Michigan Industrial and OperationsEngineering students have focused on service surgery times, service turnaround times,and overall utilization of the operating rooms. The purpose of our project was toconstruct a simulation model that would closely model the UMF{ operating rooms andcapture the utilization of each surgery service per day (Monday - Friday). Afterdetermining utilization by service and by day, we modified the model to determine how theUMII utilization is affected after removing certain outpatient services. In addition, amodel was constructed to determine the utilization of the ACSC (with four and sixoperating rooms), based on the outpatient surgeries removed.
Actual OR time of AdvancedScheduled Cases + Turnover Time
Block Time Utilization= Block Assigned Time for
Advanced Scheduled CasesThe block time utilization as defined by the University of Michigan Hospital OperatingRooms Scheduling Department is:
Actual OR time of AdvancedScheduled Cases + Turnover Time
Block Time Utilization = Block Assigned Time forAdvanced Scheduled Cases
The services examined for this project and their abbreviations are as follows:
1. CARDIAC- Cardiac Surgery2. GYN- Gynecology3. LITHO- Lithotripter4. MEDSPORT- Sports Medicine5. NEURO- Neurosurgery6. OPTH- Opthamology7. ORAL- Oral Surgery8. ORTHO- Orthopedics9. OThER- Other Non-Specified Surgeries10. OTO- Otolaryngology11. PLASTICS- Plastic Surgery12. SEC- Endocrine Critical Care13. SGI- Gastroenterology14. SON- Oncology15. STX- Transplant
2
n

16. SVA- Vascular Surgery17. TBE- Traumal Burn18. THORACIC- Thoracic Surgery19. UROLOGY- Urology
Because some of the service data records were not dedicated to rooms, OPTH andOTHER were grouped into one room which was designated ROOMS for the simulationmodels.
The types of surgeries used in our study are Inpatient, Admission Day Procedure (ADP),and Outpatient Surgeries. Note that the study uses the term “Inpatient” to refer to bothInpatient and ADP surgeries. The two procedures were considered the same in our dataanalysis.
There are currently twenty-two operating rooms in the UMH. The number of roomsassigned to services varies by day. For example, cardiac is allocated three rooms onMonday and one room on Wednesday.
C
3

CAPPROACH AND METHODOLOGY
I. Data Collection
It was decided by Dr. Rutter that the data from the period of July 1992 - December 1992would be analyzed and used in the simulation model to determine operating roomutilization by service and day of the week.
The data was downloaded from the UMH SurgiServer database onto an IBM-DOSsystem. It was formatted into the DOS version of the Microsoft Excel spreadsheetprogram where it was parsed and prepared for data manipulation. The given data filescontained the following information:
• Date of Surgery • Working Physician• Day of Surgery •Start Time and Finish Time• Surgery Type • Total Surgery Time• Case Number • Surgery Type
The master data file was divided into separate files for each service to help facilitate easiermanipulation. Once the extracted file for each service was obtained, the data was sorted bysurgery type (inpatient or outpatient). A distribution of surgery times for inpatient andoutpatient cases for each service was constructed, using percentiles in increments of 10 (i.e. 0,10,20 100). The arrival rates of cases were calculated for each day by thefollowing equation:
Total Number of Cases for each Day of Week ( 6 mo. period)
(26 weeks)( 8 hours)( 60 minutes)
The following guidelines and assumptions were used regarding service surgery times:
• Service surgery times were calculated for inpatient and outpatient casesseparately.
• All surgery times from the data file were considered valid and used in distributioncalculations.
• Data for weekend and emergent cases were not considered for this study, sincethey do not reflect the normal working schedule.
The turnover time distributions were constructed in the same manner as service timedistributions. The turnover times were calculated in a previous study, using SurgiServer
4
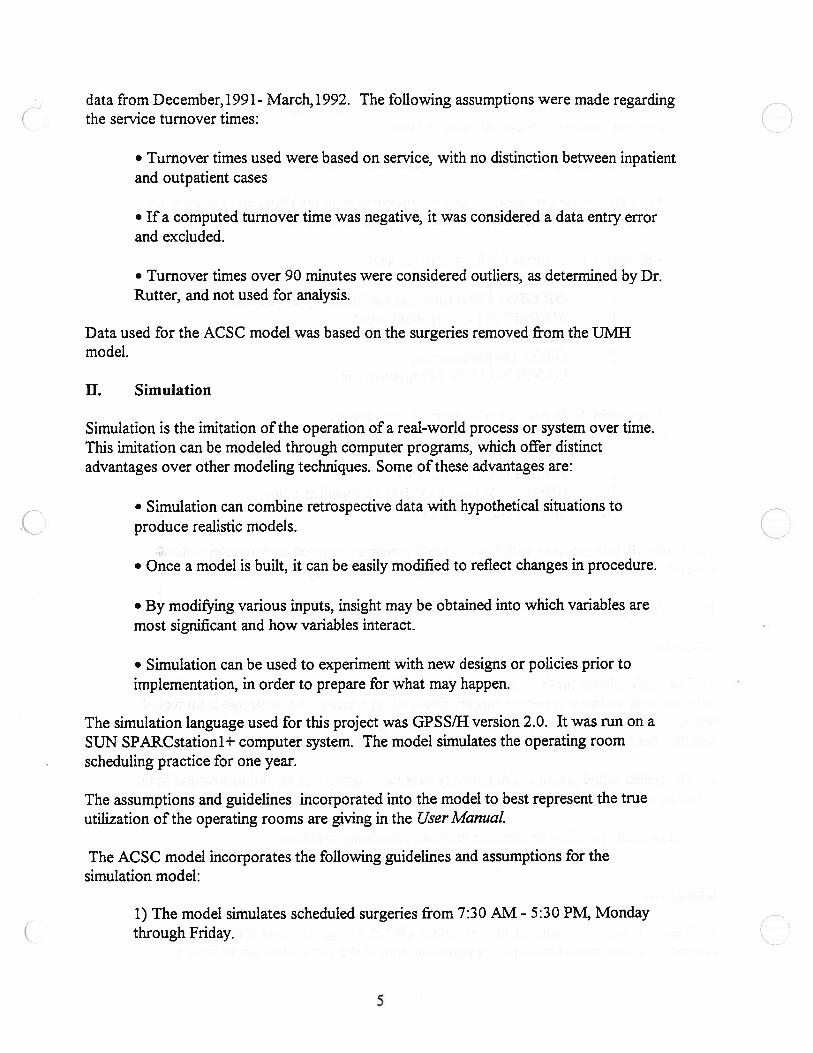
data from December, 1991- March, 1992. The following assumptions were made regarding
C the service turnover times:
• Turnover times used were based on service, with no distinction between inpatientand outpatient cases
• If a computed turnover time was negative, it was considered a data entry errorand excluded.
• Turnover times over 90 minutes were considered outliers, as determined by Dr.Rutter, and not used for analysis.
Data used for the ACSC model was based on the surgeries removed from the UMHmodel.
II. Simulation
Simulation is the imitation of the operation of a real-world process or system over time.This imitation can be modeled through computer programs, which offer distinctadvantages over other modeling techniques. Some of these advantages are:
• Simulation can combine retrospective data with hypothetical situations toproduce realistic models. C;• Once a model is built, it can be easily modified to reflect changes in procedure.
• By modifying various inputs, insight may be obtained into which variables aremost significant and how variables interact.
• Simulation can be used to experiment with new designs or policies prior toimplementation, in order to prepare for what may happen.
The simulation language used for this project was GPSS/H version 2.0. It was run on aSUN SPARCstationl+ computer system. The model simulates the operating roomscheduling practice for one year.
The assumptions and guidelines incorporated into the model to best represent the trueutilization of the operating rooms are giving in the User ManuaL
The ACSC model incorporates the following guidelines and assumptions for thesimulation model:
1) The model simulates scheduled surgeries from 7:30 AM - 5:30 PM, Mondaythrough Friday.
5

2) The simulation was modeled using both four and six operating rooms to seehow the number of rooms affected utilization.
3) The operating rooms are not dedicated to certain services.
4) At Dr. Rutter’s request, cases were removed from the UIVIEI and placed in theACSC under two different scenarios, which are as follows:
• Scenario 1: Remove the following services:
I. ORTHO (Hand surgeries performed by Dr. Louis)II. MEDSPORT ( Outpatient only)ifi. PLASTICS (Outpatient only)IV. OTO (Outpatient only)V. GYNECOLOGY ( Outpatient only)
• Scenario 2: In addition to scenario 1, remove thefollowing services:
I. MEDSPORT (Inpatient)II. UROLOGY (in LITHO) (Outpatient only)III. SON ( Outpatient only)
The UMHOR was modeled with both of these scenarios removed and these models arereferred to as Scenario 1 and Scenario 2 in the Results and Appendix sections.
III. Strengths and Limitations of the Simulation Model
Strengths
1) The model allows for randomness and variability for the service and turnover times.With the high variance in service surgery times, using a mean time to sample from wouldnot accurately reflect the operating room scheduling practice. However, using actualdistributions from retrospective data more accurately reflects reality.
2) Resembles actual practice, since service case type, service times, and turnaround timesare assigned based on proportions from retrospective data.
3) Can be easily modified to simulate different scheduling scenarios.
Limitations
1) There was only one turnover time given for OPTH during the entire four month period.Because one data point would not be representative of the service’s turnover time, a
6

standard time of 30 minutes, as defined by an earlier study on turnover times, wasassigned to OPTH. This reduced the accuracy, or “real-life” aspect of the model. C2) In practice, same surgeon, same type cases are sequentially scheduled as much aspossible to minimize turnover time. In the model, however, there is no consideration ofequipment constraints, staff constraints, or case type. Therefore, a case is scheduled to anyroom that is dedicated to the cases particular service.
7

RESULTSI.ACSC
Table 1. ACSC Utilization for Scenarios 1 and 2, with 4 and 6 rooms
4 rooms 6 roomsScenario 1 Scenario 2 Scenario 1 Scenario 2Utilization Utililization Utilization Utilihization
Monday 99.00% 100.00% 73.82% 99.99%Tuesday 91.87% 100.00% 61.96% 99.92%Wednesday 95.99% 100.00% 67.72% 99.98%Thursday 94.57% 100.00% 66.17% 99.82%Friday 97.64% 100.00% 71.88% 99.97%
Average Utilization 95.81%I 1O0.00% 68.3 1%j 99.94%
Table 1 shows the utilization times, by day, of the ACSC for Scenarios 1 and 2, with 4 and6 rooms. There is a 4.4% increase in utilization between scenarios with 4 rooms, whilethe increase is 46.3% with 6 rooms. Within a given scenario, when rooms are increasedfrom 4 to 6 rooms, the utilization times drop 28.7% and .06% for scenarios 1 and 2, (respectively.
C
8

II. UMHOR
Table 2. Average Service Utilization Times for Each Scenario (averaged from Monday -
Friday)
Table 2 gives the average service utilization times over the course of one week (M-F). All0.00% utilization times where not considered for average calculations. The completeresults for all of the simulation models is provided in the Appendix.
UMHOR Scenario 1 Scenario 2CARDIAC 99.3 1% 99.42% 99.60%GYN 93.10% 65.22% 65.22%NEURO 95.79% 95.75% 95.66%ORAL 80.18% 82.21% 80.71%ORTHO 99.50% 94.40% 94.40%OTO 99.26% 79.83% 79.83%PLASTICS 97.35% 91.19% 90.44%SEC 99.71% 99.78% 99.77%SGI 93.95% 94.17% 93.70%SON 93.22% 93.17% 75.48%STX 86.30% 86.83% 88.42%SVA 98.40% 98.06% 78.84%TBE 40.99% 41.28% 40.97%THORACIC 84.96% 85.17% 84.32%UROLOGY 88.50% 88.75% 67.80%MEDSPORT 85.54% 57.53% 0.00%LITHO 49.32% 49.22% 49.34%ROOMS 41.62% 41.24% 41.33%
C
(
9

RECOMMENDATIONS
I. From the results of the simulation models, it is clear that the removal of the outpatientservices under both scenarios does not bring the overall utilization of the UMHOR underthe desired level of 75.00%. Therefore, we recommend the removal of the services to theACSC and possibly the removal of more outpatient services if the demand is high enoughfor the ACSC and the total utilization does not deviate too far from the desired level.
II. The low utilization levels (40.00%50.00%) for TBE, LITHO, and ROOMS servicesindicate a need to restructure their scheduling blocks to decrease idle time.
ifi. The optimal scheduling system for the ACSC is scenario 2 with four rooms. Since theutilization for scenario 2 with six rooms is extremely high, we recommend a six roomACSC with the possible addition of more outpatient cases from the UMET if the demand isnecessary.
IV. For future project teams, we recommend simulating the ACSC with more operatingrooms and a higher caseload if the UMH desires to move more outpatient surgeries.
Note: Recommendations for the actual simulation models and code are given in the UserManual.
10

)
XIGN3JJV
)

C
(

TJMHOR Combined Scenarios
AVERAGE SERVICE UTILIZATION FOR EACHSCENARIO
UMHOR SCENARIO 1 SCENARIO 2
CARDIAC 99.31% 99.42% 99.60%
GYN 93.10% 65.22% 65.22%
NETJRO 95.79% 95.75% 95.66%
ORAL 80.18% 82.21% 80.71%
ORTHO 99.50% 94.40% 94.40%
OTO 99.26% 79.83% 79.83%
PLASTICS 97.35% 91.19% 90.44%
SEC 99.71% 99.78% 99.77%
SGI 93.95% 94.17% 93.70%
SON 93.22% 93.17% 75.48%
STX 86.30% 86.83% 88.42%
SVA 98.40% 98.06% 78.84%
ThE 40.99% 41.28% 40.97%
THORACIC 84.96% 85.17% 84.32%
UROLOGY 88.50% 88.75% 67.80%
MEDSPORT 85.54% 57.53% 0.00%
LITHO 49.32% 49.22% 49.34%
ROOMS 41.62% 41.24% 41.33%

::-•.E. :1::i• :. .-:i’ ‘sc’ :i..
.: ;.
— —a. .&. • — J .aaj.. • • . • . • —•
tt;.t-:‘
a) - nv.t. •rran. ... -_. - • - “- •. aj
it
I—
C
C:
•. • •I Jt•• •
C

UMH Operating Rooms
NUMBER OF PERSONS PER DAY BY SERVICE
MONDAY TUESDAY WEDNESDAY THURSDAY FRIDAY
CARD/DAY 4.44 4.21 3.12 4.03 3.96
GYN/DAY 6.85 6.79 5.90 4.85 5.85
NEURO/DAY 4.46 5.29 4.60 3.75 3.13
ORAL/DAY 0.00 2.60 0.00 0.96 0.00
ORTHO,DAY 6.40 7.75 5.73 5.85 8.33
OTO/DAY 7.46 7.23 9.88 7.35 7.58
PLAS/DAY 3.40 2.77 3.21 2.81 4.29
SEC/DAY 3.04 0.00 3.06 0.00 2.77
SGI/DAY 1.88 3.87 2.73 0.00 1.81
SON/DAY 0.00 2.85 0.00 4.83 3.69
STX/DAY 1.90 0.00 1.79 1.83 0.00
SVA/DAY 2.35 2.40 0.00 2.56 2.31
ThE/DAY 0.50 0.50 0.50 0.50 1.00
THORiDAY 1.00 1.94 2.71 0.00 1.98
TJROL/DAY 3.96 6.40 6.94 6.88 2.96
MEDS/DAY 2.00 3.96 3.00 3.00 0.00
LITHOiDAY 1.00 1.00 1.00 1.00 1.00
ROOMS/DAY 0.00 0.00 1.50 1.48 0.00
TOTAL 39.71 43.04 41.87 39.77 37.37SERVICED

U1v111 Operating Rooms
C.SERVICE UTILIZATION BY DAY
MONDAY TUESDAY WEDNESDAY THURSDAY FRIDAY
CARDIAC 99.91% 99.71% 99.04% 98.48% 99.41%
GYN 81.62% 99.85% 94.95% 93.22% 95.85%
NEURO 96.57% 99.00% 95.71% 90.52% 97.15%
ORAL 0.00% 97.67% 0.00% 62.68% 0.00%
ORTHO 100.00% 99.94% 99.55% 99.36% 98.64%
OTO 99.98% 99.91% 98.72% 99.94% 97.75%
PLASTICS 88.99% 99.77% 99.90% 98.44% 99.64%
SEC 100.00% 0.00% 100.00% 0.00% 99.13%
SGI 93.86% 92.05% 99.73% 0.00% 90.17%
SON 0.00% 96.14% 0.00% 92.81% 90.71%
STX 89.04% 0.00% 83.18% 86.67% 0.00%
SVA 97.46% 98.18% 0.00% 98.80% 99.16%
TEE 31.86% 31.79% 33.33% 0.00% 66.96%
THORACIC 64.07% 92.58% 86.79% 0.00% 96.38%
UROLOGY 75.78% 98.50% 99.96% 99.98% 68.27%
MEDSPORT 76.50% 93.63% 89.50% 82.53% 0.00%
LITHO 46.49% 49.09% 48.33% 49.94% 52.76%
ROOMS 0.00% 0.00% 36.22% 47.01% 0.00%
C

UMH Operating Rooms
AVERAGE WAIT TIME (MIN) IN WAITINGROOM BY SERVICE
MONDAY TUESDAY WEDNESDAY THURSDAY FRIDAY
CARDIAC 0.00 0.00 0.00 0.00 0.00
GYN 124.70 290.15 194.78 163.59 189.02
NEURO 197.15 250.02 202.45 126.39 212.07
ORAL 0.00 242.01 0.00 0.00 535.00
ORTHO 330.01 329.51 273.67 264.36 208.69
OTO 352.39 334.02 241.71 318.64 229.28
PLASTICS 0.00 0.00 0.00 0.00 0.00
SEC 318.50 595.00 377.28 595.00 222.88
SGI 151.25 137.97 333.95 0.00 113.33
SON 0.00 209.98 595.00 164.68 181.86
STX 132.36 572.12 95.56 121.94 514.42
SVA 244.69 252.00 0.00 255.79 241.76
TBE 297.50 297.50 297.50 297.50 0.00
THORACIC 0.00 0.00 0.00 0.00 0.00
UROLOGY 0.00 0.00 0.00 0.00 0.00
MEDSPORT 0.00 0.00 0.00 0.00 0.00
LITHO 0.00 0.00 0.00 0.00 0.00
ROOMS 595.00 595.00 0.00 0.00 0.00

UM}{ Operating Rooms
AVERAGE TIME (MIN) IN OPERATINGROOM BY SERVICE INCLUDES SURGERY TIME
AND TURNAROUND TIME
MONDAY TUESDAY WEDNESDAY THURSDAY FRtDAY
CARDIAC 274.73 287.25 291.06 291.56 275.69
GYN 199.14 180.29 188.45 218.12 175.93
NEURO 259.82 228.51 247.90 275.61 245.44
ORAL 0.00 230.76 0.00 260.96 0.00
ORTHO 193.32 197.25 211.85 208.45 194.53
OTO 164.99 171.30 180.97 168.38 173.99
PLASCS 219.30 235.10 197.91 220.42 202.87
SEC 210.58 0.00 207.69 0.00 202.66
SGI 292.17 273.90 236.94 0.00 259.96
SON 0.00 206.22 0.00 218.52 180.54
STX 255.71 0.00 236.41 244.68 0.00
SVA 263.76 257.83 0.00 238.05 251.58
TEE 135.75 135.36 144.61 137.52 252.92
THORACIC 278.25 278.88 266.78 0.00 253.88
UROLOGY 201.19 188.31 175.78 178.34 211.98
MEDSPORT 174.10 136.60 162.85 131.30 0.00
LITHO 161.27 176.83 172.29 182.18 166.98
ROOMS 0.00 0.00 129.62 198.39 0.00
(

TJMHOR Scenario 1
NUMBER OF PERSONS PER DAY BY SERVICE
MONDAY TUESDAY WEDNESDAY THURSDAY FRIDAY
CARD/DAY 4.25 4.25 3.04 4.17 4.04
GYN/DAY 2.38 3.85 1.94 3.83 1.92
NEURO/DAY 4.62 5.25 4.63 3.77 3.15
ORAL/DAY 0.00 2.54 0.00 1.00 0.00
ORTHO/DAY 5.19 6.19 5.23 4.52 4.77
OTO/DAY 3.67 3.69 4.52 4.63 3.56
PLAS/DAY 1.87 2.73 2.65 2.56 3.38
SEC/DAY 3.10 0.00 2.94 0.00 2.73
SGIJDAY 1.96 3.94 2.90 0.00 1.87
SON/DAY 0.00 2.77 0.00 4.90 3.60
STXLDAY 1.83 0.00 1.94 1.77 0.00
SVAiDAY 2.29 2.50 0.00 2.37 2.37
TBE/DAY 0.50 0.50 0.50 0.50 1.00
THOR/DAY 1.00 1.92 2.67 0.00 1.98
UROL,DAY 3.96 6.50 6.96 7.12 2.90
MEDS/DAY 1.00 1.00 1.00 1.00 0.00
LITHO/DAY 1.00 1.00 1.00 1.00 1.00
ROOMS/DAY 0.00 0.00 1.50 1.50 0.00
TOTAL 30.65 36.27 33.44 35.94 29.85SERVICED

UMHOR Scenario 1
SERVICE UTILIZATION BY DAY
MONDAY TUESDAY WEDNESDAY THURSDAY FRIDAY
CARDIAC 99.50 % 99.82 % 99.51 % 98.43 % 99.86 %
GYN 46.66 % 87.53 % 50.50 % 86.45 % 54.95 %
NEURO 97.08 % 98.92 % 95.62 % 90.08 % 97.06 %
ORAL 0.00 % 97.75 % 0.00 % 66.66 % 0.00 %
ORTHO 98.57 % 97.39 % 98.80 % 94.49 % 82.74 %
OTO 80.65 % 83.70 % 70.82 % 91.32 % 72.66 %
PLASTICS 73.76 % 99.31 % 94.43 % 94.96% 93.51 %
SEC 100.00 % 0.00 % 100.00 % 0.00 % 99.33 %
SGI 92.03 % 91.23 % 99.93 % 0.00 % 93.49 % C..SON 0.00 % 96.73 % 0.00 % 92.17 % 90.61 %
STX 88.99 % 0.00 % 88.22 % 83.29 % 0.00 %
SVA 97.12 % 98.00 % 0.00 % 97.87 % 99.25 %
TBE 30.37 % 33.92 % 32.34 % 0.00 % 68.49 %
THORACIC 67.26 % 93.43 % 85.01 % 0.00 % 94.96 %
UROLOGY 77.72 % 98.23 % 99.97 % 99.98 % 67.85 %
MEDSPORT 57.64 % 57.19 % 60.63 % 54.66 % 0.00 %
LITHO 49.21 % 48.62 % 47.37 % 47.51 % 53.37 %
ROOMS 0.00 % 0.00 % 38.82 % 43.65 % 0.00 %
(

UMHOR Scenario 1
AVERAGE WAIT TIME (MJN) IN WAITINGROOM BY SERVICE
MONDAY TUESDAY WEDNESDAY THURSDAY FRIDAY
CARDIAC 0.00 0.00 0.00 0.00 0.00
GYN 0.00 117.62 0.00 110.05 0.00
NEURO 195.30 247.15 200.12 127.16 223.26
ORAL 0.00 239.32 0.00 0.00 535.00
ORTHO 238.07 221.70 232.44 180.48 78.48
OTO 104.20 106.10 66.35 152.15 67.23
PLASTICS 0.00 0.00 0.00 0.00 0.00
SEC 322.07 595.00 375.35 595.00 228.65
SGI 134.60 131.31 325.73 0.00 126.97
SON 0.00 221.46 595.00 155.60 182.68
STX 118.72 549.23 125.57 93.52 493.85
SVA 252.51 240.62 0.00 256.23 240.69
ThE 297.50 297.50 297.50 297.50 0.00
THORACIC 0.00 0.00 0.00 0.00 0.00
UROLOGY 0.00 0.00 0.00 0.00 0.00
MEDSPORT 0.00 0.00 0.00 0.00 0.00
LITHO 0.00 0.00 0.00 0.00 0.00
ROOMS 595.00 595.00 0.00 0.00 0.00

UMHOR Scenario 1
AVERAGE TIME (MIN) IN OPERATINGROOM BY SERVICE INCLUDES SURGERY TIME
AND TURNAROUN]) TIME
MONDAY TUESDAY WEDNESDAY THURSDAY FRIDAY
CARDIAC 285.44 286.46 294.48 283.84 270.31
GYN 250.20 250.17 248.90 249.47 246.67
NEURO 251.48 230.22 245.63 270.00 239.84
ORAL 0.00 240.73 0.00 287.11 0.00
ORTHO 231.26 232.71 229.34 245.54 260.12
OTO 239.84 249.92 256.65 224.67 239.25
PLASTICS 272.86 231.17 218.84 218.69 210.70
SEC 203.85 0.00 216.35 0.00 213.41
SGI 264.34 260.64 221.00 0.00 267.61
SON 0.00 224.93 0.00 212.11 182.61
STX 276.57 0.00 249.86 243.95 0.00
SVA 267.91 238.59 0.00 255.74 247.90
TBE 129.13 150.45 138.63 135.82 265.79
THORACIC 304.34 286.01 262.79 0.00 251.20
UROLOGY 209.14 183.61 176.01 172.90 213.19
MEDSPORT 228.15 225.46 246.11 210.52 0.00
LITHO 177.56 174.00 166.54 167.64 170.30
ROOMS 0.00 0.00 147.53 173.19 0.00
C.,
UMHOR Scenario 2
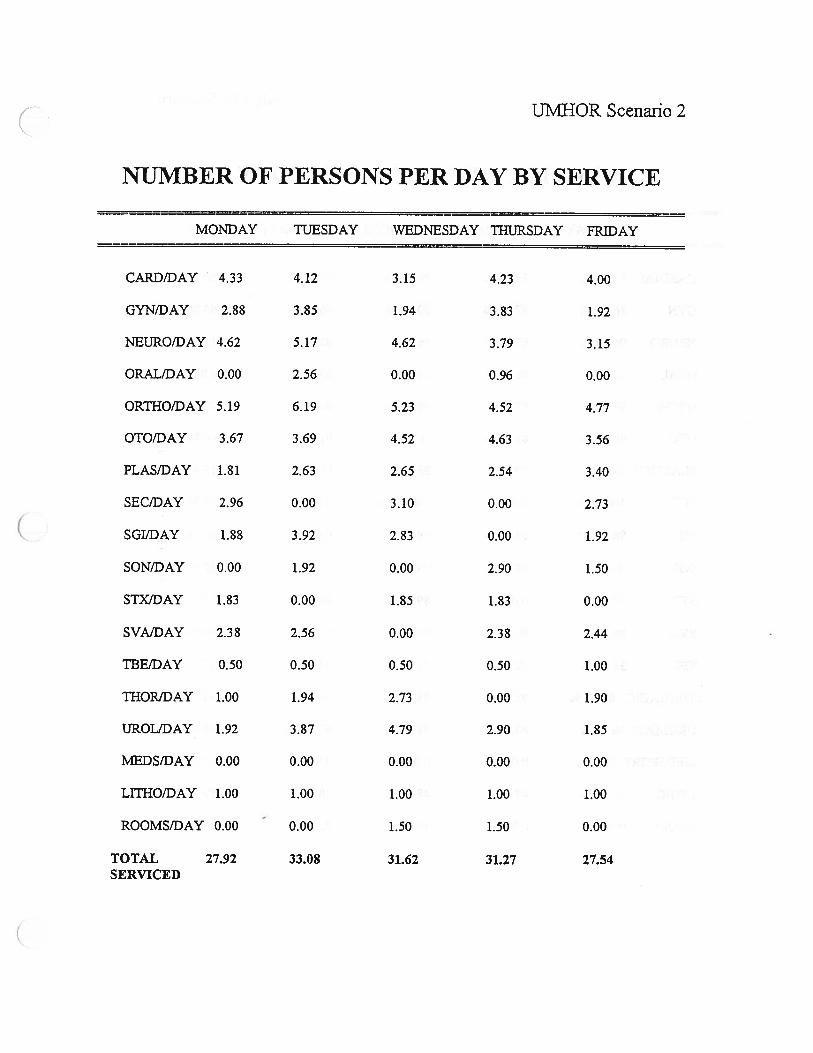
NUMBER OF PERSONS PER DAY BY SERVICE
MONDAY TUESDAY WEDNESDAY THURSDAY FRIDAY
CARD/DAY 4.33 4.12 3.15 4.23 4.00
GYN/DAY 2.88 3.85 1.94 3.83 1.92
NEURO/DAY 4.62 5.17 4.62 3.79 3.15
ORALIDAY 0.00 2.56 0.00 0.96 0.00
ORTHO/DAY 5.19 6.19 5.23 4.52 4.77
OTO/DAY 3.67 3.69 4.52 4.63 3.56
PLAS/DAY 1.81 2.63 2.65 2.54 3.40
SEC/DAY 2.96 0.00 3.10 0.00 2.73
SGIJDAY 1.88 3.92 2.83 0.00 1.92
SON/DAY 0.00 1.92 0.00 2.90 1.50
STX/DAY 1.83 0.00 1.85 1.83 0.00
SVAIDAY 2.38 2.56 0.00 2.38 2.44
TBEiDAY 0.50 0.50 0.50 0.50 1.00
THOR/DAY 1.00 1.94 2.73 0.00 1.90
IJROL/DAY 1.92 3.87 4.79 2.90 1.85
MEDS/DAY 0.00 0.00 0.00 0.00 0.00
LITHO/DAY 1.00 1.00 1.00 1.00 1.00
ROOMS/DAY 0.00 - 0.00 1.50 1.50 0.00
TOTAL 27.92 33.08 31.62 31.27 27.54SERVICED

UMHOR Scenario 2
CDSERVICE UTILIZATION BY DAY
MONDAY TUESDAY WEDNESDAY THURSDAY FRIDAY
CARDIAC 99.85 % 99.65 % 99.56 % 99.42 % 99.50 %
GYN 46.66 % 87.53 % 50.50 % 86.45 % 54.95 %
NEURO 96.25 % 99.54 % 96.49 % 88.90 % 97.11 %
ORAL 0.00 % 98.14 % 0.00 % 63.27 % 0.00 %
ORTHO 98.57 % 97.39 % 98.80 % 94.49 % 82.74 %
OTO 80.65 % 83.70 % 70.82 % 91.32 % 72.66 %
PLASTICS 69.70 % 99.02 % 93.65 % 96.71 % 93.13 %
SEC 100.00 % 0.00 % 100.00 % 0.00 % 99.30 %
SGI 88.78 % 91.86 % 99.98 % 0.00 % 94.16 %
SON 0.00 % 92.26 % 0.00 % 71.37 % 62.82 %
STX 89.29 % 0.00 % 89.08 % 86.88 % 0.00 %
SVA 98.13 % 99.27 % 0.00 % 97.74 % 99.04 %
TBE 31.27% 32.23 % 31.99 % 0.00 % 68.37 %
THOR.ACIC 62.93 % 92.62 % 88.09 % 0.00 % 93.65 %
UROLOGY 46.18 % 83.85 % 91.63 % 67.26 % 50.06 %
MEDSPORT 0.00 % 0.00 % 0.00 % 0.00 % 0.00 %
LITHO 50.11 % 47.55 % 48.05 % 48.07 % 52.93 %
ROOMS 0.00 % 0.00 % 39.73 % 42.93 % 0.00 %
C

UMHOR Scenario 2
AVERAGE WAIT TIME (MIN) IN WAITINGROOM BY SERVICE
MONDAY TUESDAY WEDNESDAY THURSDAY FRIDAY
CARDIAC 0.00 0.00 0.00 0.00 0.00
GYN 0.00 117.62 0.00 110.05 0.00
NEURO 190.03 252.86 187.75 121.05 221.87
ORAL 0.00 257.85 0.00 0.00 535.00
ORTHO 238.07 221.70 232.44 180.48 78.48
OTO 104.20 106.10 66.35 152.15 67.23
PLASTICS 0.00 0.00 0.00 0.00 0.00
SEC 324.91 595.00 371.53 595.00 224.49
SGI 120.24 138.02 326.25 0.00 126.73
SON 0.00 135.31 583.56 66.73 0.00
STX 118.94 560.67 118.48 114.27 514.42
SVA 242.63 239.26 0.00 231.52 240.44
TBE 297.50 297.50 297.50 297.50 0.00
THOR.ACIC 0.00 0.00 0.00 0.00 0.00
UROLOGY 0.00 0.00 0.00 0.00 0.00
M.EDSPORT 0.00 0.00 0.00 0.00 0.00
LITHO 0.00 0.00 0.00 0.00 0.00
ROOMS 595.00 595.00 0.00 0.00 0.00

TJM}jOR Scenario 2
AVERAGE TIME (MIN) IN OPERATING ROOMSERVICE INCLUDES SURGERY TIME AND
TURNAROUND TIME
MONDAY TUESDAY WEDNESDAY THURSDAY FRIDAY
CARDIAC 280.50 295.80 289.58 283.28 272.53
GYN 250.20 250.17 248.90 249.47 246.67
NEURO 247.36 233.74 249.05 259.78 248.54
ORAL 0.00 241.40 0.00 266.81 0.00
ORTHO 231.26 232.71 229.34 245.54 260.12
OTO 239.84 249.92 256.65 224.67 239.25
PLASTICS 275.65 240.50 211.89 231.96 208.56
SEC 227.88 0.00 212.50 0.00 206.44
SGI 259.42 267.78 226.88 0.00 254.61
SON 0.00 276.61 0.00 255.34 259.48
STX 263.86 0.00 268.45 253.60 0.00
SVA 259.19 250.51 0.00 255.86 226.89
TEE 132.24 137.97 136.55 123.24 262.83
THORACIC 269.09 281.32 270.47 0.00 262.87
UROLOGY 226.63 239.74 219.44 239.79 229.82
MEDSPORT 0.00 0.00 0.00 0.00 0.00
LITHO 183.00 167.63 170.59 170.96 167.88
ROOMS 0.00 0.00 152.98 168.88 0.00
C

ACC Scenario 1 (4 Rooms)
AVERAGE TIME (MIN) IN OPERATING ROOMBY SERVICE INCLUDES SURGERY TIME AND
TURNAROUND TIME
MONDAY TUESDAY WEDNESDAYTHtJRSDAY FRIDAY
GYNECOLOGY 166.84 172.93 167.14 171.20 131.77
ORTHOPEDICS 137.30 190.44 190.07 0.00 81.31
OTOLARYNGOLOGY138.52 146.94 144.18 143.07 166.72
PLASTIC SURGERY 166.15 0.00 129.13 182.38 183.69
SPORTS MEDICINE 0.00 116.14 125.73 120.06 106.28

ACC Scenario 1 (4 Rooms)
RESULTS
MONDAY TUESDAY WEDNESDAYTHtJRSDAY FRIDAY
UTILIZATION 99.00 % 91.87 % 95.99 % 94.57 % 97.64 %
WAIT (HOURS) 0.15 0.00 0.00 0.00 0.04
SERVICING 1.40 0.10 0.56 0.46 1.17(HOURS)
PREPARATION 1.81 0.85 1.63 1.10 1.94(HOURS)
AVG WAIT 251.44 211.25 225.61 222.98 242.63(MINUTES)
C

ACC Scenario 1 (6 Rooms)
RESULTS
MONDAY TUESDAY WEDNESDAYTHVRSDAY FRIDAY
UTILIZATION 73.82 % 61.96 % 67.72 % 66.17 % 71.88 %
WAIT (HOURS) 0.00 0.00 0.00 0.00 0.00
SERVICING 0.10 0.00 0.12 0.00 0.02(HOURS)
PREPARATION 0.17 0.00 0.04 0.00 0.10(HOURS)
AVG WAIT 251.44 116.14 124.35 127.42 136.31S)
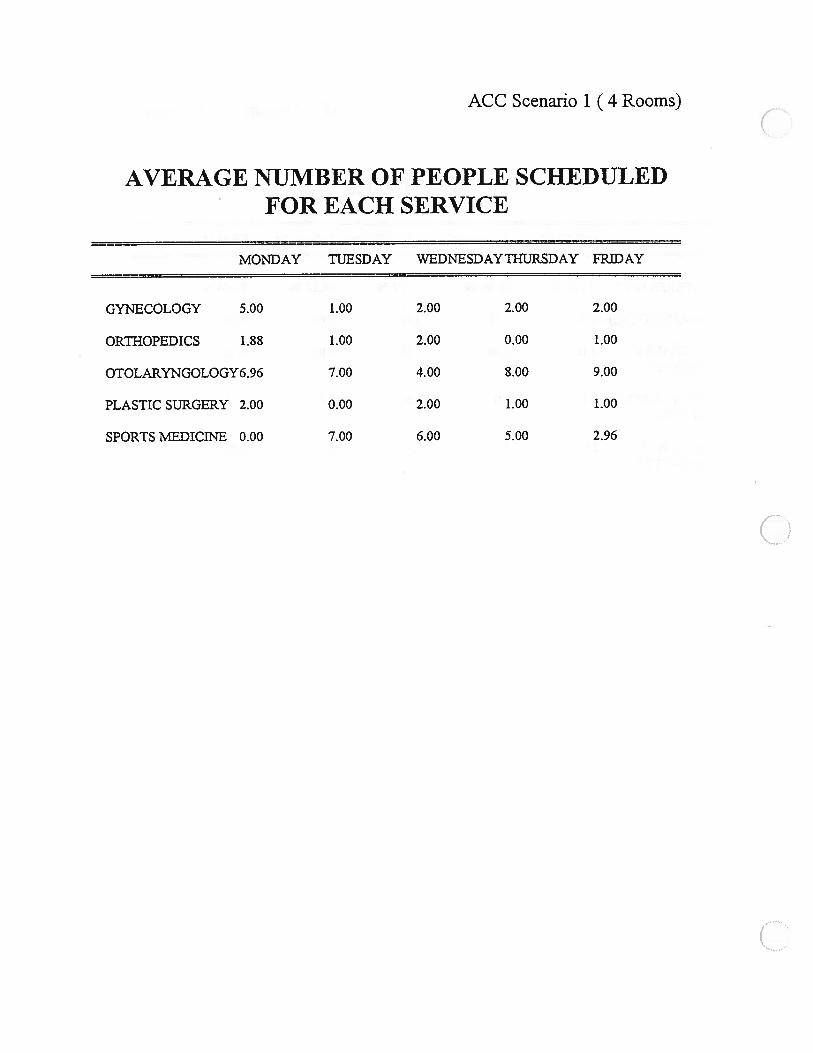
ACC Scenario 1 (4 Rooms)
CAVERAGE NUMBER OF PEOPLE SCHEDULED
FOR EACH SERVICE
MONDAY TUESDAY WEDNESDAYTHURSDAY FRIDAY
GYNECOLOGY 5.00 1.00 2.00 2.00 2.00
ORTHOPEDICS 1.88 1.00 2.00 0.00 1.00
OTOLARYNGOLOGY6.96 7.00 4.00 8.00 9.00
PLASTIC SURGERY 2.00 0.00 2.00 1.00 1.00
SPORTS MEDICrNE 0.00 7.00 6.00 5.00 2.96
C

ACC Scenario 1 (6 Rooms)
AVERAGE NUMBER OF PEOPLE SCHEDULEDFOR EACH SERVICE
MONDAY TUESDAY WEDNESDAY THURSDAY FRIDAY
GYNECOLOGY 5.00 1.00 2.00 2.00 2.00
ORTHOPEDICS 2.00 1.00 2.00 0.00 1.00
OTOLARYNGOLOGY7.0O 7.00 4.00 8.00 9.00
PLASTIC SURGERY 2.00 0.00 2.00 1.00 1.00
SPORTS MEDICiNE 0.00 7.00 6.00 5.00 3.00

ACC Scenario 1 (6 Rooms)
C,,AVERAGE TIME (MIN) IN OPERATING ROOMBY SERVICE INCLUDES SURGERY TIME ANT)
TURNAROUINI) TIME
MONDAY TUESDAY WEDNESDAYTHURSDAY FRiDAY
GYNECOLOGY 170.21 177.02 167.19 171.20 173.43
ORTHOPEDICS 194.98 190.44 190.07 0.00 191.50
OTOLARYNGOLOGY 146.94 146.94 149.01 156.22 167.11
PLASTIC SURGERY 194.01 0.00 186.35 182.02 184.68
SPORTS MEDICINE 0.00 119.21 125.75 121.40 120.22
C.

ACC Scenario 2 (4 Rooms)
AVERAGE TIME (MIN) IN OPERATING ROOMBY SERVICE INCLUDES SURGERY TIME A1NE
TURNAROUND TIME
MONDAY TUESDAY WEDNESDAY THURSDAY FRIDAY
GYNECOLOGY 166.50 152.99 0.00 164.96 166.68
ORTHOPEDICS 139.37 0.00 0.00 0.00 0.00
OTOLARYNGOLOGY147.13 156.69 148.84 130.94 144.80
PLASTIC SURGERY 80.00 0.00 178.18 184.24 199.99
SPORTS MEDICINE 118.74 122.27 66.44 103.13 108.38(OUTPATIENT ONLY)
SPORTS MEDICINE 166.29 185.47 139.01 216.99 196.08(INPATIENT ONLY)
UROLOGY 154.22 121.49 170.95 141.36 123.40
ONCOLOGY 0.00 138.36 171.53 177.13 178.80

ACC Scenario 2 (4 Rooms)
RESULTS
MONDAY TUESDAY WEDNESDAYTHURSDAY FRIDAY
UTILIZATION 100.00 % 100.00 % 100.00 % 100.00 % 100.00 %
WAIT 9.19 8.37 9.60 9.94 9.25(HOURS)
SERVICING 2.38 2.40 2.48 1.79 2.06(HOURS)
PREPARATION 1.62 1.60 1.52 2.21 1.94(HOURS)
AVG WAIT 374.80 365.97 384.08 386.50 382.68(MINUTES)
C

ACC Scenario 2 (6 Rooms)
RESULTS
MONDAY TUESDAY WEDNESDAY THURSDAY FRIDAY
UTILIZATION 99.99 % 99.92 % 99.98 % 99.82 % 99.97 %
WAIT 1.85 1.08 1.69 1.29 1.29(HOURS)
SERVICiNG 3.08 2.63 3.44 3.19 3.17(HOURS)
PREPARATION 2.88 3.12 2.50 2.56 2.75(HOURS)
AVG WAIT 270.03 256.73 274.74 276.71 267.87(MINUTES)

ACC Scenario 2 (4 Rooms)
AVERAGE NUMBER OF PEOPLE SCHEDULEDFOR EACH SERVICE
MONDAY TUESDAY WEDNESDAY THURSDAY FRIDAY
GYNECOLOGY 4.00 1.17 0.00 1.00 1.00
ORTHOPEDICS 1.88 0.00 0.00 0.00 0.00
OTOLARYNGOLOGY4.04 2.00 4.00 4.02 1.00
PLASTIC SURGERY 1.27 0.00 2.98 2.00 1.00
SPORTS MEDICINE 2.00 6.00 2.42 1.71 7.17(OUTPATIENT ONLY)
SPORTS MEDICINE 1.62 1.98 2.02 1.00 3.63(INPATIENT ONLY)
UROLOGY 2.00 3.56 3.98 4.33 1.94 (,)ONCOLOGY 0.00 2.92 1.00 2.00 1.00

ACC Scenario 2 (6 Rooms)
AVERAGE NUMBER OF PEOPLE SCHEDULEDFOR EACH SERVICE
MONDAY TUESDAY WEDNESDAY THURSDAY FRIDAY
GYNECOLOGY 4.69 3.85 0.00 1.00 3.54
ORTHOPEDICS 2.00 0.69 0.00 0.00 0.00
OTOLARYNGOLOGY6.15 3.98 4.00 6.46 3.94
PLASTIC SURGERY 4.46 0.00 3.00 3.83 1.00
SPORTS MEDICINE 2.00 6.00 4.00 2.00 8.00(OUTPATIENT ONLY)
SPORTS MEDICINE 2.85 3.40 3.98 1.00 5.23(INPATIENT ONLY)
UROLOGY 2.00 4.00 6.62 8.42 2.00
ONCOLOGY 0.00 3.00 2.71 2.00 1.00

ACC Scenario 2 (6 Rooms)
AVERAGE TIME (MIN) IN OPERATING ROOMBY SERVICE INCLUDES SURGERY TIME AND
TURNAROUND TIME
MONDAY TUESDAY WEDNESDAY THURSDAY FRIDAY
GYNECOLOGY 150.40 137.76 0.00 164.96 105.99
ORTHOPEDICS 187.34 29.28 0.00 0.00 0.00
OTOLARYNGOLOGY 135.69 124.34 149.01 135.53 114.73
PLASTIC SURGERY 137.06 0.00 181.74 136.02 203.78
SPORTS MEDICINE 118.74 122.27 119.80 124.28 121.72(OUTPATIENT ONLY)
SPORTS MEDICINE 168.20 179.55 185.95 223.15 204.00(INPATIENT ONLY)
UROLOGY 189.50 167.71 145.21 145.79 180.46
ONCOLOGY 0.00 178.87 112.28 177.61 178.80
C

GYNECOLOGY SERVICE
UT1 LIZATION
UMHOR E Scenario 1 Scenario 2
54.95%
30.00 40.00 50.00 60.00 70.00 80.00 90.00 100.00Of 0/ 0/ 0/ 0/ 0/ 0/
/0 /0 /0 /0 /0 /0 /0 /0
Friday
86.45%
U)
IThursday
Wednesday
Tuesday
Monday
150.50%94.95%
87.53%
87.53%
_CD
::81.62%
— I I
0.00% 10.00 20.000/ 0//0 /0
Utilization

CARDIAC SERVICE UTILIZATION
• UMHOR Scenario 1 Scenario 2
Friday
ci)ci)
Wednesday
Monday
199.65%___j 99.82%
199.91%
97.50% 98.50% 99.00% 100.00%
Thursday
99.86%
98.43%
99,51%
Tuesday
99.50%
I I98.00%
+ +99.50%
Utilization

Friday
0.00%
0.00%
0.00%
ORAL SURGERY SERVICEUTI LIZATION
Wednesday
Tuesday
Monday
0.00%
0.00%
70.00 80.00 90.00 100.000/ Of Of 0F10 /0 /0 /0
• UMHOR Li Scenario 1 Scenario 2
Thursday
ci 0.00%
aa.aa%2.68%
98.14%
97.75%
—97.a7%
0.00%
000%
0.00%
— I I
0.00% 10.00 20.00 30.00 40.000/ Of Of Of/0 /0 /0 /0
50.00 60.00Of Of/0 /0
Utilization

NEUROSURGERY SERVICEUTI LIZATION
I
Friday
Thursday
Wednesday
Tuesday
Monday
riUMHOR Scenario 1 Scenario 2
190.08%90.52%
97.15%
p6.49%
95.62%
99.00%
82.00% 84.00% 86.00% 88.00% 90.00% 92.00% 94.00% 96.00% 98.00% 100.000//0
197.06%
88.90%
j98.92%
[25%
-97.08%
96.57%I I I I I I
—i I I I
Utilization

OTOLARYNGOLOGY SERVICEUTI LIZATION
——-I—-—I————- -I
70.00 80.00 90.00 100.000/ 0/ 0 0f/0 /0 /0 /0
S UMHOR i Scenario 1 5 Scenario 2
+
172.66%72.66%
ci)
0>%
Friday
Thursday
Wednesday
Tuesday
Monday
91.32%
91.32%
+
170.82%
70.82%
.94%
198.72%
83.70%
____J99,91%
80.65%
I I
0.00% 10.00 20.00 30.00 40.00 50.00 60.000! 00/ Of 0
o io / % /0
199.98%
Utilization

(
ORTHOPEDIC SERVICEUTI LIZATION
Friday
Thursday
Wednesday
Tuesday
Monday
TS UMHOR LI Scenario 1 Scenario 2
82.74%
82.74%
j94.49%
98.57%
98.57%
I 100.00%
C
I I I I I I I
0.00% 10.000f/0
20.00 30.00 40.00 50.00 a0.00 70.000/ Of 0/ 0/ 0/ 0//0 /0 /0 /0 /0 /0
80.00 90.000/ 0//0 /0
100.000f/0
98.64%
.3.80%
98.80%
199.94%
Utilization

99.30%
99.33%
99.13%
100.00%
100.00%
100.00%
100.00%
100.00%
100.00%
SEC SERVICE UTILIZATION
• UMHOR Scenario 1 • Scenario 2
0.00%
0.00%
0.00%
Friday
Thursday
a)a)
Wednesday
>C
Tuesday
Monday
0.00% 10.00 20.00 30.00 40.00 50.00 60.00 70.00 80.00 90.00 100.000! 0! 0! 0! 0! 0! 0! 0! 0! 0!
- /0 /0 /0 /0 /0 /0 /0 /0 /0 /0
0.00%
0.00%
0.00%
I I I I I I I
Utilization

PLASTIC SURGERY SERVICEUTI LIZATION
Friday
Thursday
Wednesday
>
Tuesday
Monday
• UMHOR LI Scenario 1 Scenario 2
•93J3%
193.51%
99.64%
96.71%
93.65%
94.43%
99.90%
199.02%99.31%
99.77%
I I I I I I
0.00% 10.00 20.00 30.00 40.00 50.00 60.00 70.00 80.0001 Of 0! 0! 01 0! Of Of/0 /0 /0 /0 /0 /0 /0 /0
90.00 100.000! Of/0 /0
Utilization
C.
L( 7(OfU 7.1 U /0
73.76%

SON SERVICE UTILIZATION
0.00%
0.00%
0.00%
• UMHOR LI Scenario 1 Scenario 2
I I I
0.00% 10.00 20.00 30.00 40.00 50.00 60.00 70.00Of Of 0! Of Of Of 0//0 /0 /0 /0 /0 /0 /0
80.00 90.00 100.000/ 01 Of/0 /0 /0
Friday
Thursday
90.61%
90.71%
92.17%
171.37%
a)0.00%
0.00%
0.00%
Wednesday
Tuesday
Monday
96.73%
I I I I I I I
Utilization

Friday
SGI SERVICE UTILIZATION
93.49%
90.17%
S UMHOR Scenario 1 5 Scenario 2
0.00%
99.30%
0.00%
0.00%
Thursday
Wednesday
+
Tuesday
99.93%
99.73%
I91.86°’
91.23%
Monday 792.03%
0.00% 10.00 20.00 30.00 40.000/ 0/ 0/ 0!/0 /0 /0 /0
193.86%
50.000f/0
Utilization
60.00 70.00 80.000/ 0/ Of
0 /0 /0
90.00 100.000/ 0//0 /0

SVA SERVICE UTILIZATION
[ UMHOR E Scenario 1 Scenario 2
F F I
0.00% 10.00OfI0
20.00 30.00 40.00 50.00 60.00 70.00Of Of Of Of 01 Of/0 /0 /0 /0 /0 /0
80.00 90.00 100.000f 01 Of/0 /0 /0
T
Friday
Thursday
199.04%99.25%
99.16%
97.87%
.
a) 0.00%
Wednesday 0.00%
0.00%
Tuesday
Monday
99.27%
98.00%
98.18%
98.13%
97.12%
I I I I I I I
Utilization
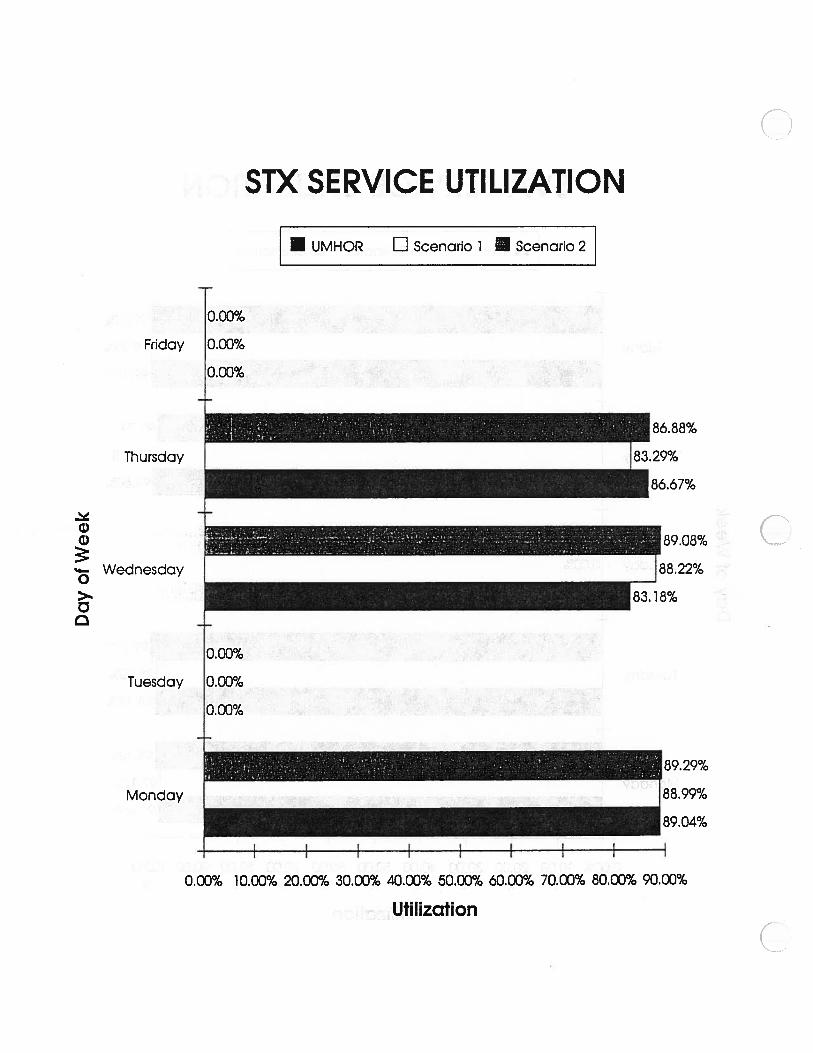
STX SERVICE UTILIZATION
C
0.00% 10.00% 20.00% 30.00% 40.00% 50.00% 60.00% 70.00% 80.00% 90.00%
Utilization
C
S UMHOR E Scenario 1 Scenario 2
0.00%
0.00%
0.00%
+
83.29%
Friday
Thursday
.
a)Wednesday
>
Tuesday
Monday
E
186.67%
C
0.00%
0.00%
0.00%
88.22%
1 001ole
I I I
]88.99%
_____
89.04%

Thursday
a)a)
Wednesday
>
Tuesday
THORACIC SERVICE UTILIZATION
I I
0.00% 10.00%
20.00 30.00 40.000/
Of 00 /0 /0
50.00 60.00 70.00 80.000! 0! Of Of/0 /0 /0 /0
Utilization
90.00 100.00of Of/0 /0
UMHOR E Scenario 1 Scenario 2
Friday
0.00%
193.65%94.96%
0.00%
0.00%
88.09%
85.01%I579%
192.62%
Monday
93.43%
Li 67.26%

TBE SERVICE UTILIZATION
UMHOR El Scenario 1 Scenario 2
30.37%
31.86%
20.00% 3000% 40.00% 50.00%
Utilization
0.00%
0.00%
0.00%
68.49%
a.9a%Friday
Thursday
1)
Wednesday
>%
Cl
Tuesday
Monday
1.99%
32.34%
h2.23%
33.92%
F.79%
I I
c
C.
0.00% 10.00% 60.00% 70.00%

MEDSPORT SERVICE UTILIZATION
57.64%
0.00% 10.000I/0
20.00 30.000/ 0//0 /0
40.00 50.000/ 0//0 /0
Utilization
60.00 70.00 80.00 90.00 100.00% % % % %
UMHOR El Scenario 1 Scenario 2
0.00%
0.00%
0.00%
0.00%
54.66%
0
I0.00%
Friday
Thursday
Wednesday
Tuesday
Monday
160.63%
82.53%
189.50%
0.00%
57.19%
0.00%

UROLOGY SERVICE UTILIZATION
UMHOR LI Scenario 1 Scenario 2
n
Friday
Thursday
C)C)
Wednesday
>%
Tuesday
Monday
+
+
67.85%
168.27%
167.26%
99.98%
191.63%
J99.97%
183.85°/’98.23%
J 77.72%
75.78%
40.00 50.00 60.00 70.00Of Of Of Of/0 /0 /0 /0
Utilization
[
146.18%
19850%
0.00% 10.00 20.00 30.00Of Of Of/0 /0 /0
80.00 90.00 100.000/ Of Of/0 /0 /0

ROOMS SERVICE UTILIZATION
0.00%
0.00%
0.00%
______ ________
[42.93%
43.a5%
I I I
0.00% 5.00% 10.00 15.000! 0!/0 /0
20.00 25.00 30.00 35.000! Of 0/ 0/0 /0 /0 /0
40.00 45.00Of 0//0 /0
50.0001/0
UMHOR E Scenario 1 E Scenario 2
Ha)
I
Friday
Thursday
Wednesday
Tuesday
Monday
38.82%
3622%
0.00%
0.00%
0.00%
0.00%
0.00%
0.00%
Utilization

(
LITHOTRIPTER SERVICEUTI LIZATION
S UMHOR E Scenario 1 5 Scenario 2
48.07%
47.51%
1)
I
Friday
Thursday
Wednesday
Tuesday
Monday
47.37%
C
52.93%
53.37%
I_276%
49.94%
48.a2%
149.09%
50.11%
49.21%
I -I-
42.00% 44.00% 46.00% 48.00% 50.00% 52.00% 54.00%
Utilization

ACC UTILIZATION (6 Rooms)
• Scenario 1 LI Scenario 2
Day of Week
!_‘ 99.98% 99.82% 99.97%
73.82°!
a7.72
C0
.4-
N
.4-
71.88°!
100.00%
90.00%
80.00%
7000%
60.00%
50.00%
40.00%
30.00%
20.00%
10.00% -
0.00% -
aa.17
— I
— I
-H +>.a a
-o4,,
o
>- >- >.0 0 00U)G) DC -
0 Ici)

(
ACC UTILIZATION (Scenario 1)
1>C0U,
ci)C
ci)
Day of Week
• 4.Rooms El 6 Rooms
91.87%95.99% 94.57%
97.64%
73.82%
1.9á%
C0-I
CN
100.00%
90.00%
80.00%
70.00%
60.00%
50.00%
40.00%
30.00%
20.00%
10.00%
0.00%
1.88%
a.17%
-H>.C0C0
>.CU,
ci)
>-C C0U,
U
I—
(
Related Documents