The Effects of Storage on the Quality of Vermicompost May 2012 Student Investigator: Andy Kiefer Advisor: Dr. Jonathan Rivin University of Wisconsin-Stevens Point UNIVERSITY OF WISCONSIN SYSTEM SOLID WASTE RESEARCH PROGRAM Student Project Report

Welcome message from author
This document is posted to help you gain knowledge. Please leave a comment to let me know what you think about it! Share it to your friends and learn new things together.
Transcript

The Effects of Storage on the Quality of Vermicompost
May 2012
Student Investigator: Andy Kiefer
Advisor: Dr. Jonathan Rivin
University of Wisconsin-Stevens Point
UNIVERSITY OF WISCONSIN SYSTEM SOLID WASTE RESEARCH PROGRAM Student Project Report

Abstract:
Fresh vermicompost was stored for three months and chemical and physical
characteristics were measured during this time interval. Different aged vermicompost was used
as a soil amendment in container media to assess plant response to changes in vermicompost
quality during storage. To examine the plant response, growth characteristics were measured and
a chemical analysis of the plant tissue was completed. Three different vermicompost varieties, in
age and feedstock, were used. The vermicompost was procured from Wisconsin vermicompost
producers and stored at room temperature.
Introduction:
Vermicompost is worm castings or digested excretions, and is largely used by gardeners
and landscapers as a soil amendment. These castings originate from organic materials, which the
worms feed on (Tejada et al. 2010). Once ingested the organic material undergoes enzymatic
digestion along with a number of other processes to ultimately create a casting. Vermicompost
contains many plant available nutrients, and research indicates castings improve soil structure by
enhancing soil porosity, aeration, and moisture holding capacity resulting in enhanced plant
growth ( Tejada et al. 2010, Hashemimajd et al. 2004, Atiyeh et al. 2000, Radha et al. 1992,
Handreck 1986, Grapelli et al. 1985)
Much of the research on vermicompost has focused on studying plant available nutrients
and changes in soil structure via soil porosity, aeration, and moisture holding capacity. (Grapelli,
Tomati, and Galli 1985, and Tejada et al. 2010, Handreck 1986, Hashemimajd et al. 2004, Radha
et al. 1992). Aging of vermicompost has been studied focusing on microbiological or
physical/chemical changes for up to 60 days of aging (Aira, et al., 2007, Hindell, et al., 1997, and

Parle 1963). No research has been conducted regarding changes in vermicompost quality over a
long period of time (ie, aging), and the impacts on plant growth, when the vermicompost is used
as a soil amendment.
Producing compost on a large scale, inevitably results in the need for storage, as
vermicompost is rarely made on demand. This research project studied the quality of
vermicompost over a fixed period of time and the effects of aged (ie, stored) vermicompost on
plant growth. This research will provide information for producers who want to make a
consistent high quality product and to their customers, whom would like to receive a high quality
product consistently.
Objectives:
1. Analyze the initial biological activity, chemical, and physical properties of fresh
vermicompost as well as periodic analysis throughout the experiment to compare the changes of
vermicompost as it ages.
2. Analyze and compare seed germination, plant growth and biomass using fresh vermicompost
and different aged vermicompost as components in container media.
Methods:
This project studied three separate varieties of compost. Batch 1 was purchased from
Wisconsin Worm Farm (Richland Center, WI) and was harvested November 30, 2011.
Wisconsin Worm Farm fed their worms a feedstock of primarily horse manure. This batch
arrived at the Daniel O. Trainer Natural Resource Building (TNR), University of Wisconsin -
Stevens Point on December 1, 2011. Batches 2 and 3 were procured from IntelliGrowth
Industries (Appleton, WI) and the worms were fed a proprietary blend based on milled grain.
Batch 2 was harvested in August 2011 and stored on-site until it had arrived in two 50 pound
bags at the TNR building on November 17, 2011. Batch 3 was harvest on December 1, 2011 and
also arrived in two 50lb bags at the TNR building on the same day. Hereafter the batch numbers
1, 2, and 3 will be referred as WF, IG8, and IG12 respectively.
Upon arrival, the bags were placed next to each other in room 151 in the TNR. The
room’s temperature ranged from 19.2°C to 25.1°C, with no humidity control. The relative
humidity ranged from 5.8% to 24.8% with an average of 13.3%. An environmental chamber was
initially going to be used to have the humidity and temperature controlled. However a failure in
temperature control on the second day of storage led to the disuse of the chamber.
A monthly analysis was conducted to measure ash, moisture, pH, and electrical
conductivity. Nutrients carbon, nitrogen, nitrate, ammonium, soluble reactive phosphorus, and
extractable calcium, magnesium, iron, and zinc were determined either monthly or bimonthly
depending on vermicompost variety.
To help understand the effects of aging vermicompost; greenhouse studies were
conducted in the TNR greenhouses. Two growing sessions took place. One began in
November/December and the other in February. During each growing session there were five
pots growing a single plant in compost amended soil and in non-amended soil (control). After the
five week session a physical assessment and nutrient analysis of the plants were completed.
All of the vermicompost and plant analysis were completed or prepared for further
analysis following University of Wisconsin – Stevens Point’s (UWSP) Soil Department standard
procedures (personal communication, R. Michitsch, 2011). All prepared nutrient samples were
analyzed by UWSP Soil Lab.
Vermicompost Analysis:
At the beginning of each month, from when the compost was obtained until April 2012
analyses were completed in triplicate for pH, electrical conductivity, organic matter, and
moisture content. Analysis of nutrients C, N, total ammoniacal nitrogen(TAN), nitrate (NO3),
soluble reactive phosphorus(SRP), Ca, Mg, Zn, and Fe were prepared in duplicates and were
analyzed by the UWSP Soil Lab. The vermicompost samples were oven dried at 65°C for 72
hours prior to all analysis.
Planting and Thinning:
Two greenhouse sessions (I&II) were performed for five weeks. Within each session two
sections (A&B) were grown, section A began two weeks prior to section B. Session IA, IB, IIA,
IIB began November 19, 2011; December 1, 2011; February 5, 2012; February 19, 2012
respectively. Section A analyzed plant growth in potting soil amended with IG-8 along with a
control(C-8). Section B analyzed plant growth in potting soil amended with WF, IG-12 along
with a control(C-12). Fresh vermicompost (IG-12 and WF) was received at UWSP within two
days of harvest: vermicompost IG-8 had been stored for three months before being shipped to
UWSP. The initial greenhouse study (session I) was initiated within several days after delivery.
For session II, IG-8 had been stored for~6 months; WF and IG-12 were 2.5 months old.
Five replicate pots were used for each analyzed vermicompost and control totaling 25
pots per session. Berger BM1(Saint-Modeste, Québec) was used as the potting media. For the
experimental pots a mixture was prepared of 1/3 by volume of the particular vermicompost being
analyzed and 2/3 of Berger BM1. The control pots were filled with only Berger BM1 potting
soil. The pots were 6 inches in diameter and 5 inches deep. For session I the potting media in

Figure 1
Plants (WF) after two weeks of growth ready to be thinned.
the pots was saturated, allowed to drain for 24 hours and then weighed (initial weight) prior to
planting. However for session II the pots were seeded and then watered until slight drainage.
Nine sunflower seeds were embedded ~1/2 inch into each pot, the configuration of the embedded
seeds can be seen in Figure 1.The planted pots were placed in the TNR’s unheated greenhouse
(moderate humidity, 14-16 hour day length, high light levels, warms
days, and cool nights). The pots were placed on a bench closest to
the south window and the pots were rotated every 3-5days to ensure
all pots were subjected to possible variations in light and other
conditions.
The first two weeks of the sessions, the number of germinations for each pot was
recorded every day to see if the vermicompost had any effect on germination rate. Two weeks
after planting each of the pots were thinned to have the nearest plant to the middle saved
(without the condition of the seedling being a factor).

During session I the pots were watered (using reverse osmosis (RO) water) daily until
they reached their initial weight until the final week and a half for fertilization. During session II
the pots were watered with RO water every day until slight drainage for the first two weeks after
planting. Following thinning, the plants were only watered with RO (until slight drainage) when
the soil surface became observably dry (about every 2-3 days). During the final 1 ½ weeks of the
five week session the pots received three fertilizations. The fertilization occurred on days which
the soil in the pots was observably dry were to be watered. Each pot received 150mL of aqueous
fertilizer plus enough RO water to obtain slight pot drainage. The fertilizer was diluted to ~
200ppm of nitrogen using Peters Professional 15-16-17 Peat-Lite Special®.
Plant Physical Assessment and Nutrient Analysis:
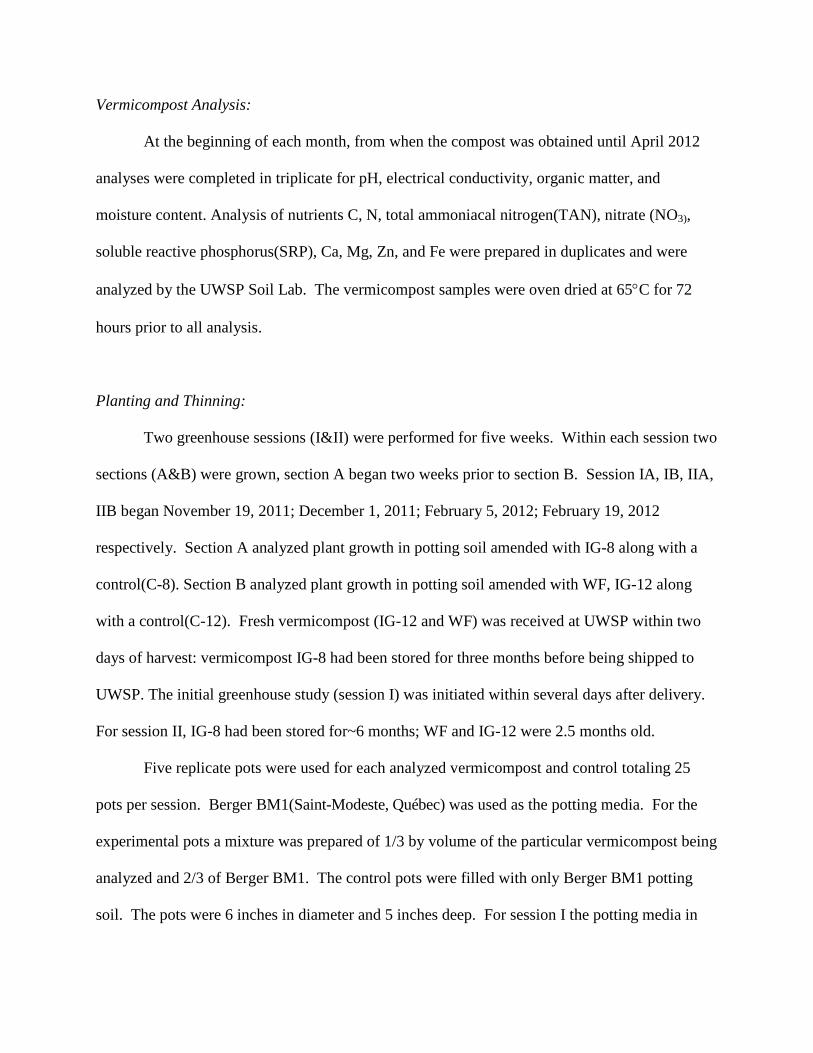
Once each five week session was completed all of the plants were harvested. During the
harvest the plants height, leaf width, leaf chlorophyll, and a plant nutrient analysis were
completed to assess the plants health; the harvest plants were also photographed. While the
plants were still standing in their pots all leaves extended on or near the third node from the
bottom were analyzed for chlorophyll and leaf width measured. Chlorophyll was analyzed using
a Spectrum Technologies Inc.’s (Plainfield, IL) SPAD 502 Plus Chlorophyll Meter. Three evenly
distributed measurements were taken of each leaf. Each leaf’s largest width was recorded.
The plants were cut right above where the first root appeared below the soil surface. The
measurement from this cutting point to the top of the plant’s stem was recorded as plant height.
A plant tissue analysis was completed by air drying the harvested plants (excluding roots) for
three days at 65°C, ground into smaller particles, stored individually in labeled plastic bags, and
tested for concentrations of Ca, Mg, Zn, P, total carbon, total nitrogen, and K. The extracted
samples were analyzed by the UWSP Soils Lab.
Results and Discussion:
Vermicompost:
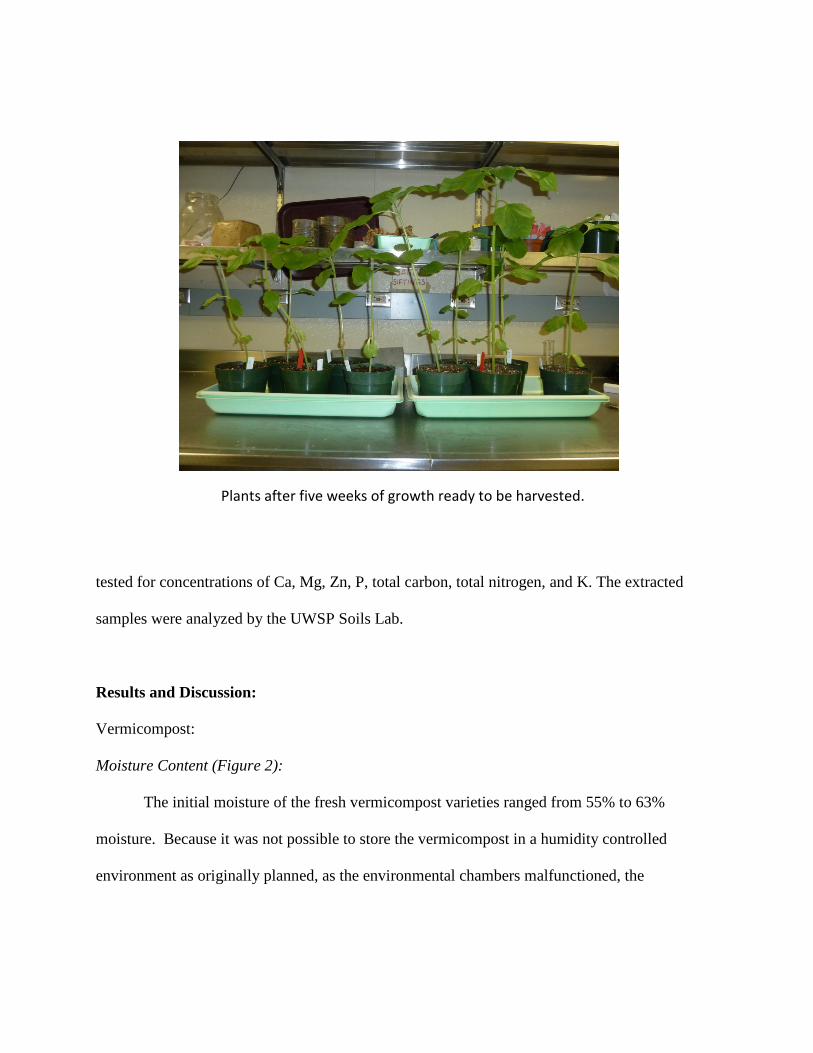
Moisture Content (Figure 2):
The initial moisture of the fresh vermicompost varieties ranged from 55% to 63%
moisture. Because it was not possible to store the vermicompost in a humidity controlled
environment as originally planned, as the environmental chambers malfunctioned, the
Plants after five weeks of growth ready to be harvested.

vermicompost dried out during storage. This moisture loss most likely resulted in the decrease
of microbial activity, which use some of the essential nutrients needed for plant growth.
Figure 2
% Organic Matter (Figure 3):
Slight increases in percent organic matter (OM) occurred from December to January for
IG12 and IG8 while WF stayed constant at 47 %OM for these two months. IG8 continued to
slightly rise in February while WF and IG12 decreased. In all of the vermicompost varieties OM
decreased in the month of March and then all increased in April. With micro-organisms
presence indicated by CO2 output, a decrease in organic matter would be expected due to the
natural process of decomposition. However the data collected didn’t represent a trend of an
organic matter loss or increase and therefore remains inconclusive.
Electrical Conductivity (Figure 4):
For all three vermicompost analyzed, a general increasing trend of electrical
conductivity can be seen in Figure 4. Electrical conductivity (EC) can be related to the
vermicompost’s water holding capacity, cation exchange capacity (CEC), porosity, texture, and
0
10
20
30
40
50
60
70
Dec Jan Feb Mar Apr
Perc
ent M
oist
ure
Month
% Moisture Content for 3 Vermicompost Varieties Over Time
IG8
IG12
WF

Figure 3
particle size. Higher particle water holding capacity, CEC, and porosity will result in a higher
EC (Grisso, 2009). Moisture content can be an indicator of water holding capacity, which can be
related to texture and particle size. When comparing Figure 2 to Figure 4, the vermicompost with
the higher percent moisture also had the highest EC values. Decomposition (see explanation
Figure 9) could have had effects on the vermicompost’s particle size and CEC. The loss of OM
most likely led to a higher concentration of ions which would increase EC.
Figure 4
0
10
20
30
40
50
60
Nov Dec Jan Feb March
Perc
ent O
rgan
ic M
atte
r
Month
% Organic Matter Based on Dry Weight for 3 Vermicompost Varieties Over Time
IG8
IG12
WF
012345678
Dec Jan Feb Mar Apr
mill
iSie
men
s (m
S/cm
)
Month
Electrical Conductivity for 3 Vermicompost Varieties Over Time
IG8
IG12
WF

pH (Figure 5):
pH was determined by using distilled (DI) water and potassium chloride (KCl) in
separate analysis. pH values using KCl and DI water showed a similar acidifying trend over
time as shown in Figure 5, which shows only DI water. WF decreased by 0.31, IG8 decreased
by 0.35 and IG12 decreased by 0.49 during the five months of analysis. These decreases can be
explained through the formation of acids by the process of nitrification. Nitrification can be
noted by the decrease in TAN and increase in nitrates as seen in Figure 6a and 6b.
Figure 5
Vermicompost Nutrient Analysis:
All of the vermicompost varieties were analyzed from November-April for the following
nutrients: soluble reactive phosphorus, ammonium, nitrate, carbon, nitrogen, iron, zinc, calcium,
and magnesium. Only IG8 was analyzed in November. IG8 was not analyzed for ammonium,
nitrate, carbon to nitrogen ratio, and soluble reactive phosphorus in March. IG12 and WF was
not analyzed in April for the cations iron, calcium, magnesium, and zinc. All other data that do
not show on graph represents a value of “0”.
0.001.002.003.004.005.006.007.008.009.00
Dec Jan Feb Mar Apr
pH V
alue
Month
pH for 3 Vermicompost Varieties Over Time Using Distilled Water
IG8
IG12
WF

Total Ammoniacal Nitrogen (NH4 and NH3) (Figure 6a and 6b):
IG8 was analyzed for (total ammonical nitrogen (TAN) in November with an average
level of 0.0204 mg TAN/g dry weight vermicompost (DWV), which increased to 0.0916 mg
TAN/g DWV in December. IG8, IG12, and WF all began with higher TAN levels (0.1123 mg
TAN/g DWV and 0.1889 mg TAN/g DWV, respectively) in December. Following December
the samples’ concentration decreased and remained relatively stable for the remaining months.
The TAN levels stabilized at levels ranging from 0.0153-0.0336 mg TAN/g DWV (Figure 6a and
6b). The spike seen from November and December for IG8 can be explained because prepared
November samples were stored for nearly 30 days in a refrigerator before analysis was
completed. This period of time would have allowed the ammonia to volatilize. From December
onward all samples for all vermicompost analysis were directly placed into a freezer following
preparation. The decrease from December to the stable levels can be explained because of the
nitrification of ammonium by microbial activity. Nitrification indicated by the slight decrease of
pH over time is shown in Figure 5.
Figure 6a
0
0.02
0.04
0.06
0.08
0.1
0.12
0.14
Nov Dec Jan Feb March Apr
mg/
g
Month
Milligrams of TAN per Gram of Dry Weight Material for 3 Samples of Vermicompost Over Time
IG8
IG12

Figure 6b
Soluble Reactive Phosphorus (Figure 7a and 7b):
Soluble reactive phosphorus (SRP) levels for IG8 remained at 0.00 mg SRP/g DWV from
November-December. IG8, IG12, and WF increased from December to January (0.00 mg SRP/g
DWV, 0.00 mg SRP/g DWV, and 0.1158 mg SRP/g DWV to 0.0042 mg SRP/g DWV, 0.009 mg
SRP/g DWV, and 0.282 mg SRP/g DWV respectively). IG8’s concentration of 0.00 mg SRP/g
DWV in November can be explained because of its long storage in a refrigerator prior to
analysis. The storage conditions may have allowed some of the SRP to precipitate, becoming
insoluble. The cause of the increase in SRP from December to January is uncertain. As seen in
Figure 7a, IG8 and IG12 decreased during the following months down to a level of 0.0006 mg
SRP/g DWV in April for IG12 and 0.0019 mg SRP/g DWV in February for IG8. WF once again
increased slightly from January to February and decreased to 0.0999 mg SRP/g DWV in March.
From March to April no significant change occurred for WF. A decrease is SRP can possibly be
explained because SRP is very easily taken up by organisms (Holtan, 1988). The organism
within the vermicompost most likely utilized the excess SRP. However once the moisture
content began to decrease, the microbial activity would have also decreased. This decrease
0
0.1
0.2
0.3
0.4
Nov Dec Jan Feb March Apr
mg/
g
Month
WF
WF

would consequently lower the utilization of SRP by micro-organisms. The decrease of SRP can
also possibly be explained by the precipitation of SRP with other cations making the SRP less
soluble. It is unclear why an increase occurred from December to January.
Figure7a
Figure 7b
0
0.002
0.004
0.006
0.008
0.01
0.012
Nov Dec Jan Feb March Apr
mg/
g
Month
Milligrams of Soluable Reactive Phosphorus per Dry Weight Material for 3 Samples of Vermicompost Over
Time
IG8
IG12
0
0.1
0.2
0.3
0.4
Nov Dec Jan Feb March Apr
mg/
g
Month
WF
WF

Nitrate (NO3) (Figure 8):
Nitrate levels increased and decreased (as seen in Figure 8)) during the duration of this
project for each variety of vermicompost. There may have been a couple of factors that caused
this increase and decrease in values. The sample from IG8 in November could have degraded
due to these samples being stored in a refrigerator for approximately 30 days prior to analysis.
Normal variation would be able to explain the increases and decreases that don’t follow the
trend. Also IG12 in March had an outlier at 1.43mg NO3/g DWV and without this outlier the
results would have been graphed near 0.61mg NO3/g DWV.
Figure 8
Carbon:Nitrogen Ratio (Figure 9):
As the graph shows, the carbon to nitrogen ratio (C:N) stays relatively constant through
time. No January samples were analyzed, IG8 samples were not analyzed in March or April, and
0
0.2
0.4
0.6
0.8
1
1.2
1.4
1.6
1.8
Nov Dec Jan Feb March Apr
mg/
g
Month
Milligrams of Nitrate per Gram of Dry Weight Material for 3 Samples of Vermicompost Over Time
IG8
IG12
WF

no samples were taken for WF and IG12 in November. There are slight increases and decreases
but the significance of these shifts is minimal.
Figure 9
Cations (Magnesium, Iron, Calcium, Zinc) (Figures 10a, 10b, 10c, and 10d):
An increase in concentration of zinc (Zn), iron (Fe), magnesium (Mg), and calcium (Ca)
occurred in all three varieties of vermicompost from December to February. However, IG8
concentrations of Fe and Ca decreased from February to April but increased in Zn. The increased
concentrations may be potentially explained by micro-organism converting solid carbon material
into CO2 gas, which escapes to the atmosphere. The loss of carbon material concentrates the
amount of cations per dry weight gram of vermicompost. The decrease of Fe and Ca may have
been caused by precipitating with phosphorus (Figure 7) and therefore reducing these cations’
availability during analytical extraction. The lower pH would make zinc more available for
extraction as Figure 10b shows. Mg remained relatively constant throughout the experiment.
0
2
4
6
8
10
12
14
16
18
20
Nov Dec Jan Feb March Apr
X Ca
rbon
:1 N
itrog
en
Month
Carbon:Nitrogen Ratio for Samples Vermicompost Over Time
IG8
IG12
WF
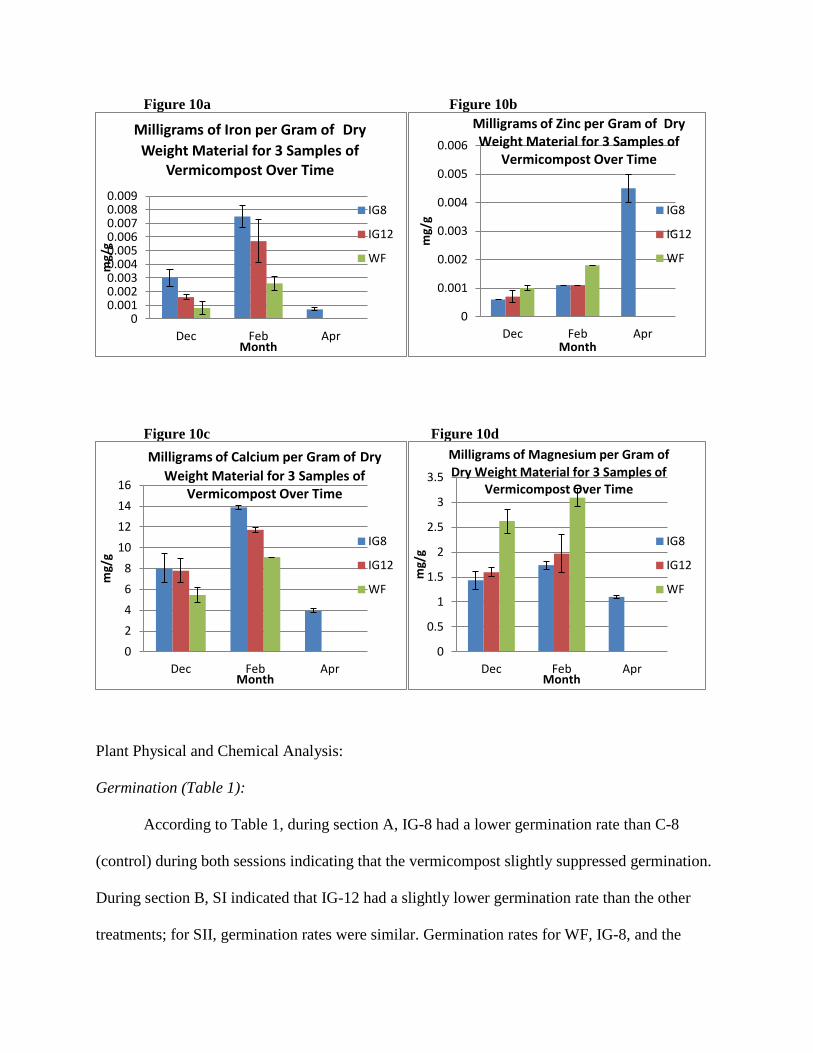
Figure 10a Figure 10b
Figure 10c Figure 10d
Plant Physical and Chemical Analysis:
Germination (Table 1):
According to Table 1, during section A, IG-8 had a lower germination rate than C-8
(control) during both sessions indicating that the vermicompost slightly suppressed germination.
During section B, SI indicated that IG-12 had a slightly lower germination rate than the other
treatments; for SII, germination rates were similar. Germination rates for WF, IG-8, and the
00.0010.0020.0030.0040.0050.0060.0070.0080.009
Dec Feb Apr
mg/
g
Month
Milligrams of Iron per Gram of Dry Weight Material for 3 Samples of
Vermicompost Over Time
IG8
IG12
WF
0
0.001
0.002
0.003
0.004
0.005
0.006
Dec Feb Apr
mg/
g
Month
Milligrams of Zinc per Gram of Dry Weight Material for 3 Samples of
Vermicompost Over Time
IG8
IG12
WF
02468
10121416
Dec Feb Apr
mg/
g
Month
Milligrams of Calcium per Gram of Dry Weight Material for 3 Samples of
Vermicompost Over Time
IG8
IG12
WF
0
0.5
1
1.5
2
2.5
3
3.5
Dec Feb Apr
mg/
g
Month
Milligrams of Magnesium per Gram of Dry Weight Material for 3 Samples of
Vermicompost Over Time
IG8
IG12
WF
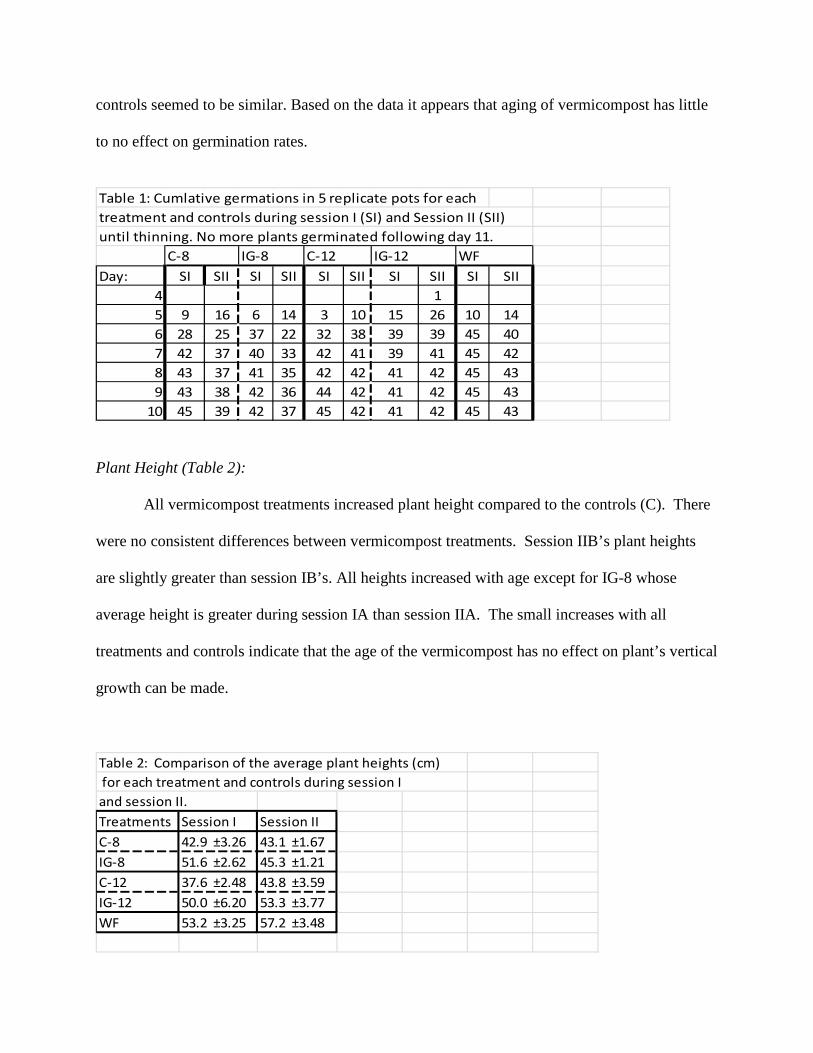
controls seemed to be similar. Based on the data it appears that aging of vermicompost has little
to no effect on germination rates.
Table 1: Cumlative germations in 5 replicate pots for eachtreatment and controls during session I (SI) and Session II (SII)until thinning. No more plants germinated following day 11.
Day: SI SII SI SII SI SII SI SII SI SII4 15 9 16 6 14 3 10 15 26 10 146 28 25 37 22 32 38 39 39 45 407 42 37 40 33 42 41 39 41 45 428 43 37 41 35 42 42 41 42 45 439 43 38 42 36 44 42 41 42 45 43
10 45 39 42 37 45 42 41 42 45 43
C-8 IG-8 C-12 WFIG-12
Plant Height (Table 2):
All vermicompost treatments increased plant height compared to the controls (C). There
were no consistent differences between vermicompost treatments. Session IIB’s plant heights
are slightly greater than session IB’s. All heights increased with age except for IG-8 whose
average height is greater during session IA than session IIA. The small increases with all
treatments and controls indicate that the age of the vermicompost has no effect on plant’s vertical
growth can be made.
Table 2: Comparison of the average plant heights (cm) for each treatment and controls during session I and session II.Treatments Session I Session IIC-8 42.9 ±3.26 43.1 ±1.67IG-8 51.6 ±2.62 45.3 ±1.21C-12 37.6 ±2.48 43.8 ±3.59IG-12 50.0 ±6.20 53.3 ±3.77WF 53.2 ±3.25 57.2 ±3.48

Leaf Width (Table 3):
Both of the controls (C-8 and C-12) slightly increased along with WF. IG-8 and IG-12
both slightly decreased from SI to SII. There did not seem to be a large difference over time (SI
to SII) in leaf width.
Table 3: Comparison of the average leaf width (cm) for each treatment and controls during session I and session IITreatments Session I Session IIC-8 7.9 ±0.89 8.6 ±0.29IG-8 7.8 ±1.06 7.5 ±1.25C-12 5.9 ±0.49 6.4 ±0.48IG-12 8.0 ±1.33 7.8 ±0.76WF 7.9 ±0.48 9.0 ±1.81
Chlorophyll (Table 4):
For all treatments and controls chlorophyll increased from session I and II. This increase
was most likely due to the added heat which stimulates growth. Session II was completed during
February and March (warmer than normal years) compared to session I which was completed
during December and January. Table 8 shows that magnesium levels within the plants were
higher in SII than SI. Magnesium plays an important role for the synthesis of chlorophyll.
These increased levels of magnesium could have also increased the synthesis of chlorophyll.
The increase of magnesium could also be contributed by the fresh batch of potting soil used
during SII (explained under the heading “potassium (K)”). Nutrient concentrations in the
aqueous fertilizers may have differed during the two sessions because a fertilizer mixture was
prepared for each session on different occasions. The added nutrients would have given the
plants an opportunity to uptake these excess nutrients (such as Mg). Therefore, it is possible that

the age of vermicompost does have an effect on chlorophyll levels which is a sign of plant
health.
Table 4: Comparison of the average chlorophyl for each treatment and controls during session I and session II.Treatments Session I Session IIC-8 33.5 ±0.95 35.3 ±1.68IG-8 32.2 ±1.13 32.5 ±0.88C-12 30.8 ±1.81 31.5 ±2.41IG-12 33.1 ±2.31 34.8 ±1.44WF 31.5 ±1.20 35.8 ±2.46
Potassium (Table 5):
Potassium (K) concentrations were all higher during session I than session II. Since the
controls followed the sample pattern as the treated pots there is no indication that vermicompost
age affects potassium uptake. This difference is most likely due to different batches of potting
soil (session I versus II) or the slight difference in concentrations of fertilizer nutrients used for
each session.
Table 5: Comparison of the average potassium (mg of K/g of dry plant matter) for each treatment and controls during session I and session II.Treatments Session I Session IIC-8 84.5 ±2.25 80.5 ±7.50IG-8 87.8 ±10.40 79.9 ±3.83C-12 97.6 ±7.46 70.2 ±7.53IG-12 80.8 ±7.12 65.1 ±8.28WF 101.2 ±86.90 86.9 ±5.97

Calcium (Table 6), Zinc (Table 7), Magnesium (Table 8), Phosphorus (Table 9):
Calcium (Ca), zinc (Zn), phosphorus (P), and magnesium (Mg) all increased dramatically
from session I to session II. During session II IG-8 and IG-12 had higher levels of these cations
when compared to the controls and WF remained close to C-12 levels. For phosphorus, C-12
and C-8 had higher levels than of the plants treated with vermicompost in both SI and SII. This
increase from SI to SII could be explained from the decrease in the vermicompost’s pH. The
decrease in pH would have made these cations more available for plants. Another reason could
be because of the concentration of nutrients in the fertilizer and possible variation in the exact
amount of fertilizer used during each session. During session I the plants were watered more than
session II. The excess water could have leached some of these nutrients out of the potting media
or helped the plant uptake the nutrients. All of these 4 nutrients were extracted using the same
methods. The methods called for a weak acid (0.1N HCl) and heat. It is possible that the weak
acids used in session I and II may have had different concentration levels and therefore different
extraction properties. The plant material and weak acid mixture were not heated for a specific
amount of time. This time variable could have altered the amount of nutrients extracted.
Variations in procedures may have contributed to variability in results.
Table 6: Comparison of the average calcium (mg of Ca/g of dry plant matter) for each treatment and controls during session I and session II.Treatments Session I Session IIC-8 0.30 ±0.18 14.37 ±3.39IG-8 0.29 ±0.16 19.03 ±2.23C-12 1.03 ±0.42 21.64 ±6.22IG-12 0.59 ±0.36 18.28 ±3.88WF 0.22 ±0.04 8.96 ±1.69

Table 8: Comparison of the average magnesium (mg of Mg/g of dry plant matter) for each treatment and controls during session I and session II.Treatments Session I Session IIC-8 0.21 ±0.04 4.17 ±0.48IG-8 0.22 ±0.07 6.55 ±0.59C-12 0.47 ±0.14 5.19 ±0.80IG-12 0.10 ±0.06 6.69 ±0.88WF 0.21 ±0.09 4.95 ±0.67
Table 9: Comparison of the average phosphorus (mg of P/g of dry plant matter) for each treatment and controls during session I and session II.Treatments Session I Session IIC-8 1.20 ±0.34 5.64 ±1.60IG-8 0.20 ±0.05 4.49 ±0.48C-12 3.62 ±1.24 5.26 ±0.54IG-12 0.06 ±0.03 2.96 ±0.62WF 0.34 ±0.05 4.59 ±0.60
Total Nitrogen (Table 10):
All of the controls and treatments had a higher level of total nitrogen (TN) in SI. WF had
the largest decrease from SI to SII. The possibility of the variance in aqueous fertilizer could
have made in a difference in the analysis. The vermicompost nitrogen could have volatilized as

figures 6a, 6b, and 8 indicate. This volatilization would have caused some loss of nitrogen and
therefore unable for the plant to use.
Table 10: Comparison of the averagetotal nitrogen (mg of TN/g of dry plant matter) for each treatment and controls during session I and session II.Treatments Session I Session IIC-8 52.80 ±1.62 48.28 ±5.90IG-8 57.08 ±2.71 54.48 ±1.91C-12 50.20 ±2.64 45.36 ±2.92IG-12 50.82 ±3.03 43.86 ±4.88WF 44.08 ±3.63 30.76 ±3.18
Conclusions: During storage, some changes to vermicompost characteristics do occur. Microbial
activity, nitrification and precipitation had the largest effects on the concentrations of nutrients..
Nitrification transforms TAN into nitrates creating acids and causing a reduction in pH. Lower
pH may make nutrients more available for uptake by plants. Due to microbial activity, some of
the nutrients, such as SRP, may be used and converted to less extractable forms while the loss of
organic matter can concentrate essential nutrients. Microbes are highly influenced by the amount
of moisture. During storage the vermicompost moisture decreases and microbial activity
declines, which slows the use of nutrients by these microbes. However, the drying process may
also cause precipitation of nutrients into less soluble forms, making them less extractable. If a
vermicompost producer plans to store their product, it is recommended to keep the vermicompost
in a low moisture area to reduce the amount of moisture available and to dry out the material in a
timely manner.
There were two plants, from two separate treatments (WF and IG-8 during SI), that did
not develop enough to be analyzed. Other than these two incidences all the plants grew to
suitable masses for use. By physical appearance, the plants seemed to be unaffected by the age
of vermicompost. The increased plant concentration of calcium, zinc, magnesium and
phosphorus may have been due to the slight decrease in pH of the vermicompost, which would
have increased the availability of these nutrients and increased watering schedule during session
II, which tends to increase nutrient uptake. Different batches of potting soil may also have
contributed to the different plant nutrient concentrations in sessions I and II. A future
experiment may need to be conducted by using a specific set of methods to clear up these
possible errors. A longer growing period may have better defined the consequences of using
aged vermicompost. As businesses sometimes store their vermicompost for longer than three
months (the duration of storage in this experiment) a longer storage period would provide useful
information. Overall it appeared the age of vermicompost had little to no effect onto early plant
growth.

Bibliography:
Aira, M., Monroy, F., and Dominguez, J. (2007), “Microbial biomass governs enzyme activity
decay during ageing of worm-worked substrates through vermicomposting”, Journal of
Environmental Quality, Vol. 36, pp. 448-452.
Atiyeh, R. M., Dorminguez, J., Subler, S. and Edwards, C.A. (2000). “Changes in biochemical
properties of cow manure during processing by earthworms (Eisenia andrei, Bouche) and
the effects on seedling growth”. Pedobiologia, 44. pp.709-724.
Grappelli, A., Tomati, U., and Galli, E. (1985), “Earthworm casting in plant propagation”,
Hortscience, 20(5), pp. 874-876.
Grisso, R., Aller, M., Holshouser, D., Thomason, W. (2009), “Precision Farming Tools: Soil
Electrical Conductivity”, Virginia Cooperative Extension, Publication 442-508.
Handreck, K. (1986), “Vermicomposts as components of potting media”, BioCycle, pp. 58-62.
Hashemimajd, K., Kalbasi, M., Golchin, A., and Shariatmadari, H. (2004), “Comparison of
vermicompost and composts as potting media for growth of tomatoes”, Journal of Plant
Nutrition, 27(6), pp. 1107-1123.
Hindell, R., McKenzie, B., and Tisdall, J. (1997), “Influence of drying and ageing on the
stabilization of earthworm casts”, Biology and Fertility of Soils, Vol. 25, pp. 27-35.
Holtan, H., Kamp-Nielsen, L., and O. Stuances, A. (1988), “Phosphorus in soil, water, and
sediment: and overview”, Hydrobiologia, 170(1), pp. 19-34.
Parle, J. (1963), “A microbiological study of earthworm casts”, Journal of General
Microbiology, Vol. 31, pp. 13-22.
Radha et al. (1992), “Influence of vermicompost application on the available macronutrients and
selected microbial populations in a paddy field”, Soil Biology and Biochemistry, 24(12),
pp. 1317-1320.

Tejada, M., Gomez, I., Hernandez, T., and Garcia, C. (2010), “Utilization of vermicomposts in
soil restoration: effects of soil biological properties”, Soil Science Society of America
Journal, 74(2), pp. 525-532.
Related Documents