UNIVERSITY OF STRATHCLYDE GRADUATE SCHOOL OF BUSINESS Master of Business Administration Assignment for Marketing Management, 2005-06 A Report into Competition for New Entrants in the UK Motor Car Industry Authors: Simon Axon, Student Registration No 200489732 Flexible Learning MBA – Huntly Date: September 2006

Welcome message from author
This document is posted to help you gain knowledge. Please leave a comment to let me know what you think about it! Share it to your friends and learn new things together.
Transcript
UNIVERSITY OF STRATHCLYDE GRADUATE SCHOOL OF BUSINESS
Master of Business Administration
Assignment for Marketing Management, 2005-06
A Report into Competition for New Entrants in the UK Motor Car Industry
Authors: Simon Axon, Student Registration No 200489732
Flexible Learning MBA – Huntly
Date: September 2006
A REPORT INTO COMPETITION FOR NEW ENTRANTS IN THE UK MOTOR CAR INDUSTRY
PAGE 2 OF 41
CONTENTS
1.0 ABSTRACT ...................................................................................................................................................6
2.0 INTRODUCTION .........................................................................................................................................6
3.0 THE CURRENT UK MARKET PLACE....................................................................................................7
3.1 MARKET SEGMENTS...........................................................................................................................7
3.2 KEY PLAYERS ...................................................................................................................................10
3.3 KEY PLAYERS MANUFACTURING IN UK – STRENGTHS & WEAKNESSES ..........................................11
3.4 KEY PLAYERS IMPORTING TO THE UK – STRENGTHS & WEAKNESSES.............................................12
3.5 KEY PLAYERS MANUFACTURING IN UK – OPPORTUNITIES & THREATS...........................................13
3.6 KEY PLAYERS IMPORTING TO THE UK – OPPORTUNITIES & THREATS .............................................13
3.7 PRODUCT LIFE CYCLE (PLC) ...........................................................................................................14
4.0 ELEMENTS OF THE MARKETING MIX..............................................................................................15
4.1 PROMOTION .....................................................................................................................................15
5.0 PRODUCT DIFFERENTIATION.............................................................................................................19
6.0 MOTOR CAR INDUSTRY COMPETITIVE ANALYSIS......................................................................20
6.1 PORTER’S FIVE FORCES ...................................................................................................................22
6.2 BARGAINING POWER OF SUPPLIERS .................................................................................................22
6.3 BARGAINING POWER OF BUYERS .....................................................................................................22
6.4 THREAT OF NEW ENTRANTS ............................................................................................................24
6.5 THREAT OF SUBSTITUTES.................................................................................................................25
6.6 COMPETITIVE RIVALRY IN INDUSTRY ..............................................................................................25
7.0 CONCLUSION & RECOMMENDATIONS ............................................................................................25
8.0 REFERENCES ............................................................................................................................................27
A REPORT INTO COMPETITION FOR NEW ENTRANTS IN THE UK MOTOR CAR INDUSTRY
PAGE 3 OF 41
APPENDIX
A1 THE HISTORY OF THE MOTOR CAR .................................................................................................29
A2 LIST OF CAR BRANDS SELLING IN THE UK MARKET .................................................................29
A3 TOP 5 BEST SELLERS BY SEGMENT (SMMT, 2006).........................................................................30
A4 LIST OF AUTOMOBILE MANUFACTURERS .....................................................................................31
A4.1 AUTOMOTIVE COMPANY GROUPS ....................................................................................................31
A5 SEGMENTATION SUMMARY NEW CARS @ JUNE 2006.................................................................33
A6 PROMOTION..............................................................................................................................................35
A7 KEY PLAYERS MANUFACTURING IN UK – STRENGTHS & WEAKNESSES ............................36
A8 KEY PLAYERS IMPORTING TO THE UK – STRENGTHS & WEAKNESSES ..............................37
A9 KEY PLAYERS MANUFACTURING IN UK – OPPORTUNITIES & THREATS ............................38
A10 KEY PLAYERS IMPORTING TO THE UK – OPPORTUNITIES & THREATS..............................39
A11 OTHER USEFUL REFERENCES (WEBSITES) ....................................................................................40
A REPORT INTO COMPETITION FOR NEW ENTRANTS IN THE UK MOTOR CAR INDUSTRY
PAGE 4 OF 41
TABLES & FIGURES
TABLE OF ACRONYMS ......................................................................................................................................5
TABLE 2.1.2 TOTAL NEW REGISTRATIONS IN UK 2001-2005 ..........................................................................6
FIGURE 3.1.1 THE SEGMENT MARKET SHARE FOR 2001-2005...........................................................................7
TABLE 3.1.3 FORD CAR MODELS AND RANGE OF ENGINE SIZES & TYPES .......................................................8
FIGURE 3.1.4 CAR BRAND UK MODELS – JULY 2006.......................................................................................9
FIGURE 3.2.1 UK TOP 5 MANUFACTURER VS. VOLUME .................................................................................10
TABLE 3.2.2 UK CAR MANUFACTURERS & IMPORTERS .................................................................................10
TABLE 3.3 KEY PLAYERS MANUFACTURING IN THE UK STRENGTHS & WEAKNESSES (2005) .......................11
TABLE 3.4 KEY PLAYERS IMPORTING TO UK STRENGTHS & WEAKNESSES (2005)........................................12
TABLE 3.5 KEY PLAYERS MANUFACTURING IN THE UK OPPORTUNITIES & THREATS (2005)........................13
TABLE 3.6 KEY PLAYERS IMPORTING TO UK OPPORTUNITIES & THREATS (2005) ........................................13
FIGURE 3.7.1 PLC ..........................................................................................................................................14
FIGURE 3.7.2 HISTORICAL PLC DISTRIBUTION – CARS ..................................................................................14
FIGURE 3.7.3 CAR MODELS WITH PRODUCT LIFE CYCLE 15+ YEARS ............................................................14
FIGURE 4.1 CAR MANUFACTURER OPERATING MARGINS (2004/2005)..........................................................17
FIGURE 4.2 CAR DEALERSHIP NETWORKS IN UK (TOP GEAR MAGAZINE, OCT 2006) ...................................18
TABLE 5.1 CAR PRODUCT DIFFERENTIATION .................................................................................................19
TABLE 5.2 COLOURS OF CARS ON UK ROADS 2004 - TOP FIVE .......................................................................19
FIGURE 6.1.1 NEW CAR REGISTRATIONS........................................................................................................20
FIGURE 6.1.2 CAR MANUFACTURER NEW PRODUCT PRICE RANGE 2006.......................................................21
FIGURE 6.1.3 PORTERS FIVE FORCES..............................................................................................................22
FIGURE 6.1.4 PORTERS FIVE FORCES IN ACTION – UK MOTOR CAR MARKET ...............................................23
FIGURE 6.3 RESEARCH & DEVELOPMENT EXPENDITURE (US$ EQUIV) ..........................................................24
FIGURE 6.4 RESEARCH & DEVELOPMENT AS PROPORTION OF REVENUES18 ....................................................24
TABLE A2 LIST OF CAR BRANDS SELLING IN THE UK ....................................................................................29
TABLE A4 AUTOMOTIVE COMPANY GROUPS .................................................................................................32
TABLE A5 SEGMENT COVERAGE – NEW CARS @ JUNE 2006.........................................................................34
TABLE A7 KEY PLAYERS MANUFACTURING IN THE UK STRENGTHS & WEAKNESSES ..................................36
TABLE A8 KEY PLAYERS IMPORTING TO UK STRENGTHS & WEAKNESSES ...................................................37
TABLE A9 KEY PLAYERS MANUFACTURING IN THE UK OPPORTUNITIES & THREATS ...................................38
TABLE A10 KEY PLAYERS IMPORTING TO UK OPPORTUNITIES & THREATS ..................................................39
A REPORT INTO COMPETITION FOR NEW ENTRANTS IN THE UK MOTOR CAR INDUSTRY
PAGE 5 OF 41
Abbreviation Description / Web address
AA The Automobile Association ACC Adaptive Cruise Control (Volvo Cars) ACEA Association des Constructeurs Européens d’Automobiles (a body representing car manufacturers in the EC) AG Audi Group BBC British Broadcasting Corporation BIMS British International Motor Show BIMTA British Independent Motor Traders Association BMW Bayerische Motoren Werke AG (Bavarian Motor Works) BEUC Bureau Européen des Unions des Consommateurs, (a body representing consumer organisations in the EC) BSIS Blind Spot Information Systems (Volvo Cars) CA Consumers’ Association CAGR Compound Annual Growth Rate CV Commercial Vehicles DETR Department of the Environment, Transport and the Regions DGFT Director General of Fair Trading DTI Department of Trade & Industry DTI-AU Department of Trade & Industry Automotive Unit EC European Community EEA European Economic Area EEurope Eastern Europe EU European Union Fleet Defined by the DVLA, the SMMT and many suppliers as 25 or more cars registered as being used by a single company FMCC Ford Motor Credit Company GCC Gulf Cooperation Council IDIS Intelligent Driver Information System (Volvo Cars) JAMA Japan Association of Automobile Manufacturers LCV Light Commercial Vehicles LDWS Citroën’s Lane Departure Warning System (detects any car changing lane >80 km/hr) NAmerica North America NCAP (European New Car Assessment Program) www.euroncap.com NCAP-AOR NCAP Adult Occupant Rating NCAP-CPR NCAP Child Protection Rating M-B Mercedes-Benz MPV Multi-Purpose Vehicle OEM Original Equipment Manufacturer OICA Organisation Internationale des Constructeurs d’Automobiles (The International Organization of Motor Vehicle Manufacturers) PC PSA Peugeot Citroën PLC Product Life Cycle Platform Commonality of design or manufacture in automobile production PSS Preventative Safety Systems (Volvo Cars) RAC Provides range of motoring and vehicle services to consumers and businesses RAC Foundation Independent body established to take on role of protecting interest of motorist R&D Research & Development RMI Retail Motor Industry Federation Limited RRP Recommended Retail Prices SMMT Society of Motor Manufacturers and Traders SMTA Scottish Motor Trade Association SSTI Secretary of State for Trade & Industry SUV Sports Utility Vehicle SWOT Strengths, Weaknesses, Opportunities & Threats US United States (of America) VER Voluntary Export Restraints (Regime of quantitative restrictions on the import of Japanese cars into UK, certain other countries & EC) VW Volkswagen Group WEurope Western Europe WRG Water Repellent Glass (Volvo Cars)
Table of Acronyms
A REPORT INTO COMPETITION FOR NEW ENTRANTS IN THE UK MOTOR CAR INDUSTRY
PAGE 6 OF 41
1.0 ABSTRACT
This report was assembled using research from published material and websites of manufacturers
within the motorcar industry. The motor industry is one of the most fiercely competitive industries in
the UK, with over fifty manufacturers vying for position in a very sizeable market. Despite ever
increasing environmental initiatives, the popularity of the motorcar as a mode of transport and status
symbol shows no sign of abating. This report considers the market segments, the key players and their
strengths, weaknesses, opportunities and threats as well as the marketing mix and methods of how
product differentiation is achieved. An analysis of the Product Life Cycle and market influencing
factors are considered using Porter’s Five Forces. Finally, the report culminates in some advice for new
entrants to the motorcar industry.
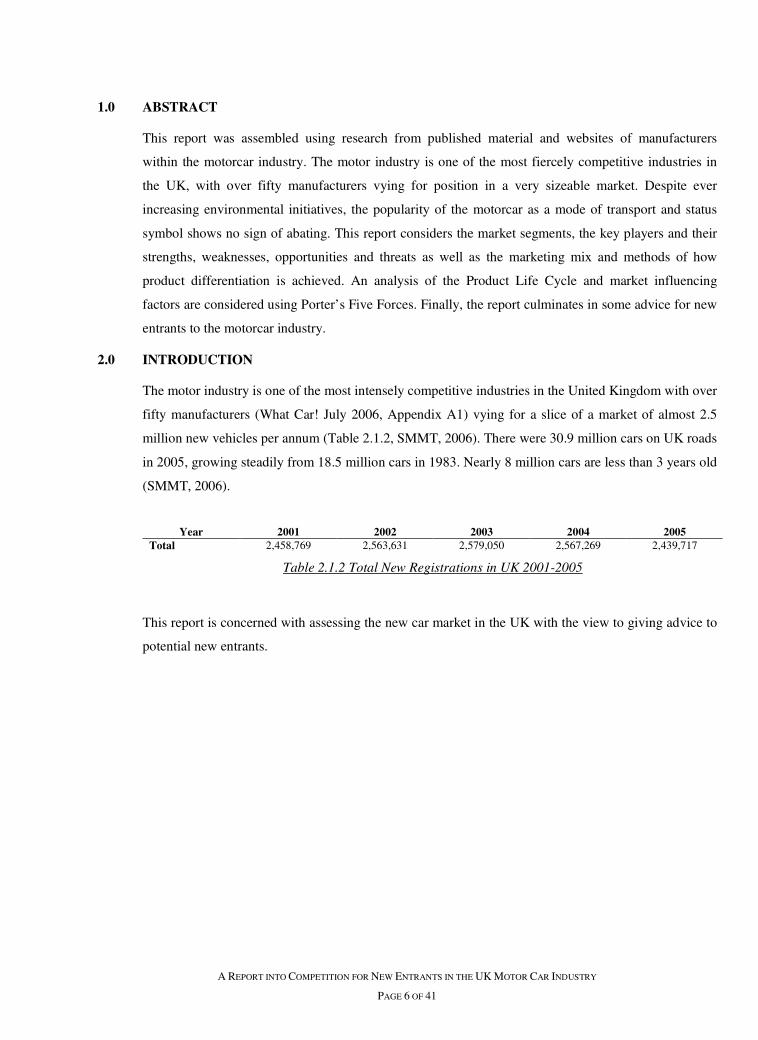
2.0 INTRODUCTION
The motor industry is one of the most intensely competitive industries in the United Kingdom with over
fifty manufacturers (What Car! July 2006, Appendix A1) vying for a slice of a market of almost 2.5
million new vehicles per annum (Table 2.1.2, SMMT, 2006). There were 30.9 million cars on UK roads
in 2005, growing steadily from 18.5 million cars in 1983. Nearly 8 million cars are less than 3 years old
(SMMT, 2006).
Year 2001 2002 2003 2004 2005
Total 2,458,769 2,563,631 2,579,050 2,567,269 2,439,717
Table 2.1.2 Total New Registrations in UK 2001-2005
This report is concerned with assessing the new car market in the UK with the view to giving advice to
potential new entrants.
A REPORT INTO COMPETITION FOR NEW ENTRANTS IN THE UK MOTOR CAR INDUSTRY
PAGE 7 OF 41
3.0 THE CURRENT UK MARKET PLACE
3.1 MARKET SEGMENTS
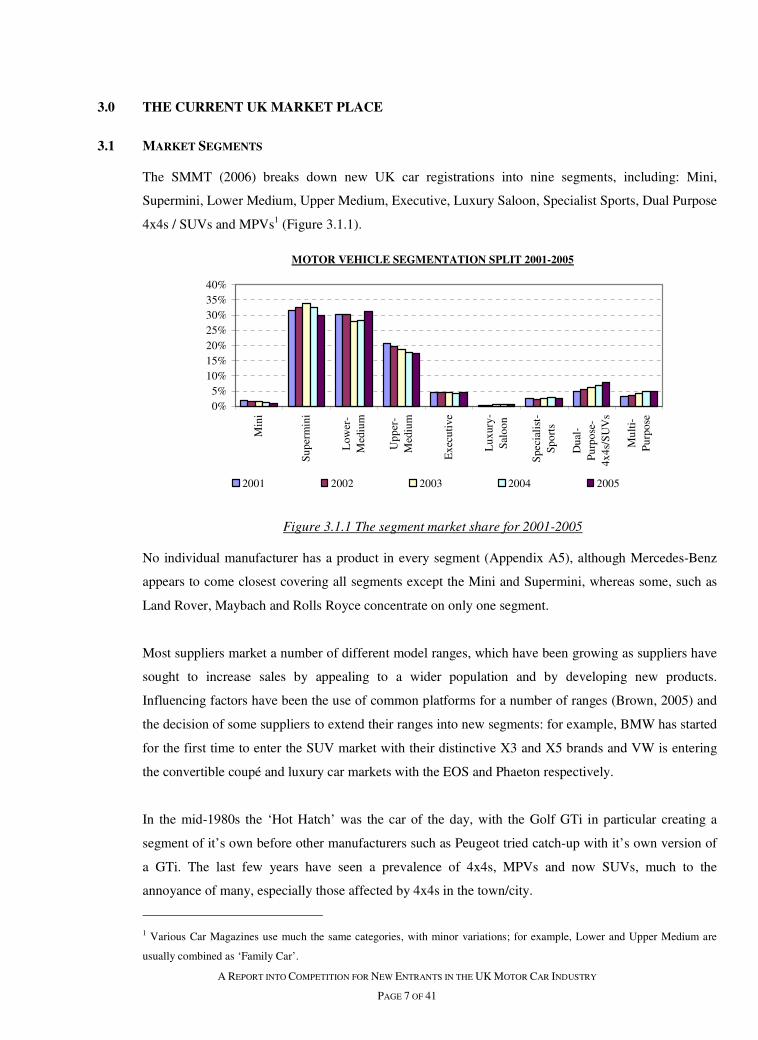
The SMMT (2006) breaks down new UK car registrations into nine segments, including: Mini,
Supermini, Lower Medium, Upper Medium, Executive, Luxury Saloon, Specialist Sports, Dual Purpose
4x4s / SUVs and MPVs1 (Figure 3.1.1).
Figure 3.1.1 The segment market share for 2001-2005
No individual manufacturer has a product in every segment (Appendix A5), although Mercedes-Benz
appears to come closest covering all segments except the Mini and Supermini, whereas some, such as
Land Rover, Maybach and Rolls Royce concentrate on only one segment.
Most suppliers market a number of different model ranges, which have been growing as suppliers have
sought to increase sales by appealing to a wider population and by developing new products.
Influencing factors have been the use of common platforms for a number of ranges (Brown, 2005) and
the decision of some suppliers to extend their ranges into new segments: for example, BMW has started
for the first time to enter the SUV market with their distinctive X3 and X5 brands and VW is entering
the convertible coupé and luxury car markets with the EOS and Phaeton respectively.
In the mid-1980s the ‘Hot Hatch’ was the car of the day, with the Golf GTi in particular creating a
segment of it’s own before other manufacturers such as Peugeot tried catch-up with it’s own version of
a GTi. The last few years have seen a prevalence of 4x4s, MPVs and now SUVs, much to the
annoyance of many, especially those affected by 4x4s in the town/city.
1 Various Car Magazines use much the same categories, with minor variations; for example, Lower and Upper Medium are
usually combined as ‘Family Car’.
MOTOR VEHICLE SEGMENTATION SPLIT 2001-2005
0%5%
10%15%20%25%30%35%40%
Min
i
Sup
erm
ini
Low
er-
Med
ium
Upp
er-
Med
ium
Exe
cuti
ve
Lux
ury-
Sal
oon
Spe
cial
ist-
Spo
rts
Dua
l-P
urpo
se-
4x4s
/SU
Vs
Mul
ti-
Pur
pose
2001 2002 2003 2004 2005
A REPORT INTO COMPETITION FOR NEW ENTRANTS IN THE UK MOTOR CAR INDUSTRY
PAGE 8 OF 41
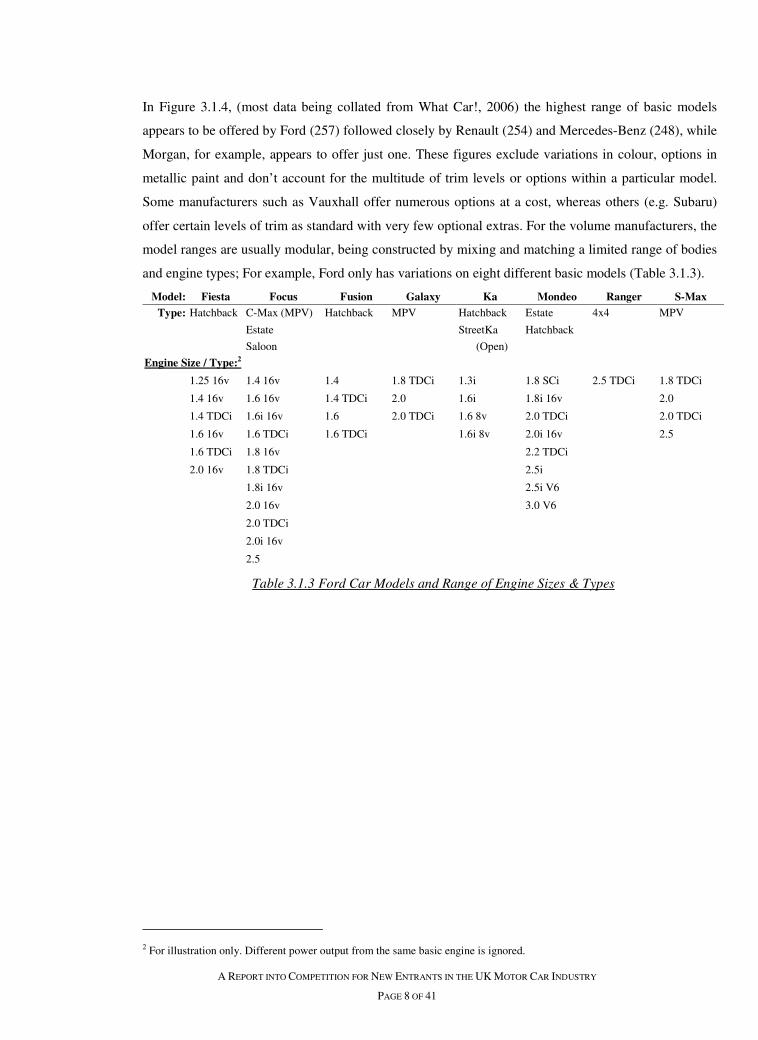
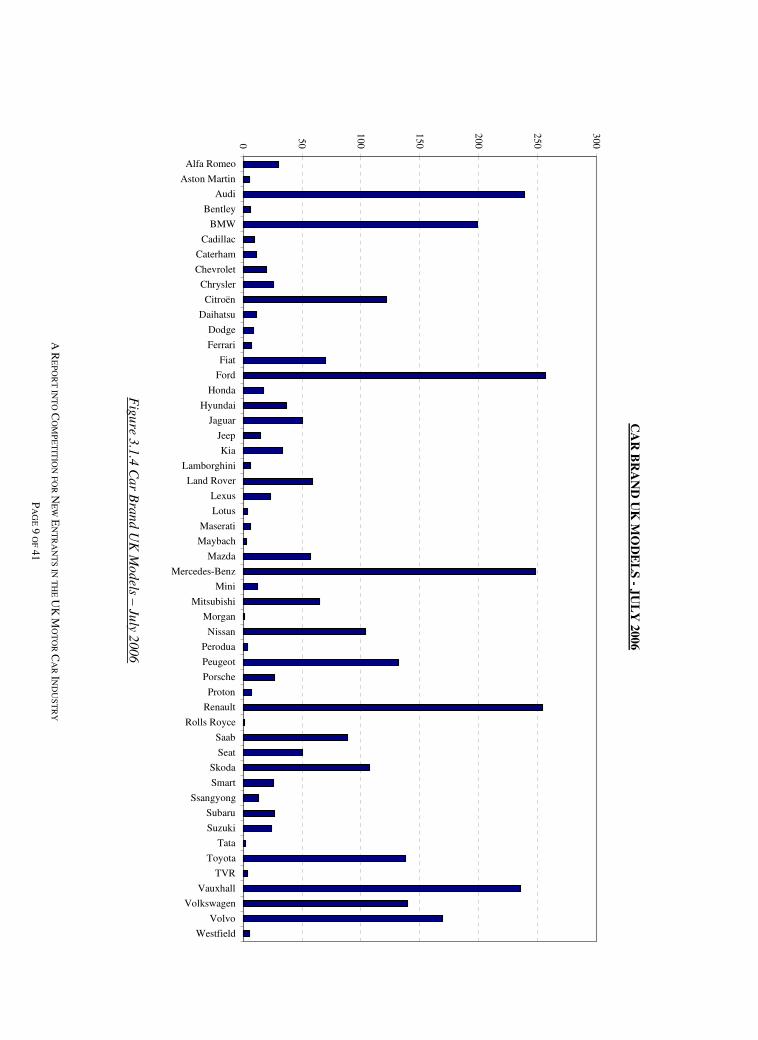
In Figure 3.1.4, (most data being collated from What Car!, 2006) the highest range of basic models
appears to be offered by Ford (257) followed closely by Renault (254) and Mercedes-Benz (248), while
Morgan, for example, appears to offer just one. These figures exclude variations in colour, options in
metallic paint and don’t account for the multitude of trim levels or options within a particular model.
Some manufacturers such as Vauxhall offer numerous options at a cost, whereas others (e.g. Subaru)
offer certain levels of trim as standard with very few optional extras. For the volume manufacturers, the
model ranges are usually modular, being constructed by mixing and matching a limited range of bodies
and engine types; For example, Ford only has variations on eight different basic models (Table 3.1.3).
Model: Fiesta Focus Fusion Galaxy Ka Mondeo Ranger S-Max
Type: Hatchback C-Max (MPV) Hatchback MPV Hatchback Estate 4x4 MPV Estate StreetKa Hatchback
Saloon (Open)
Engine Size / Type:2 1.25 16v 1.4 16v 1.4 1.8 TDCi 1.3i 1.8 SCi 2.5 TDCi 1.8 TDCi 1.4 16v 1.6 16v 1.4 TDCi 2.0 1.6i 1.8i 16v 2.0 1.4 TDCi 1.6i 16v 1.6 2.0 TDCi 1.6 8v 2.0 TDCi 2.0 TDCi 1.6 16v 1.6 TDCi 1.6 TDCi 1.6i 8v 2.0i 16v 2.5 1.6 TDCi 1.8 16v 2.2 TDCi 2.0 16v 1.8 TDCi 2.5i 1.8i 16v 2.5i V6 2.0 16v 3.0 V6 2.0 TDCi 2.0i 16v 2.5
Table 3.1.3 Ford Car Models and Range of Engine Sizes & Types
2 For illustration only. Different power output from the same basic engine is ignored.
A R
EP
OR
T IN
TO
CO
MP
ET
ITIO
N FO
R N
EW
EN
TR
AN
TS IN
TH
E U
K M
OT
OR
CA
R IN
DU
ST
RY
PA
GE
9 O
F 41
Fig
ure 3
.1.4
Ca
r Bra
nd U
K M
od
els – Ju
ly 2006
CA
R B
RA
ND
UK
MO
DE
LS
- JU
LY
200
6
0 50
100
150
200
250
300Alfa Romeo
Aston Martin
Audi
Bentley
BMW
Cadillac
Caterham
Chevrolet
Chrysler
Citroën
Daihatsu
Dodge
Ferrari
Fiat
Ford
Honda
Hyundai
Jaguar
Jeep
Kia
Lamborghini
Land Rover
Lexus
Lotus
Maserati
Maybach
Mazda
Mercedes-Benz
Mini
Mitsubishi
Morgan
Nissan
Perodua
Peugeot
Porsche
Proton
Renault
Rolls Royce
Saab
Seat
Skoda
Smart
Ssangyong
Subaru
Suzuki
Tata
Toyota
TVR
Vauxhall
Volkswagen
Volvo
Westfield
A REPORT INTO COMPETITION FOR NEW ENTRANTS IN THE UK MOTOR CAR INDUSTRY
PAGE 10 OF 41
3.2 KEY PLAYERS
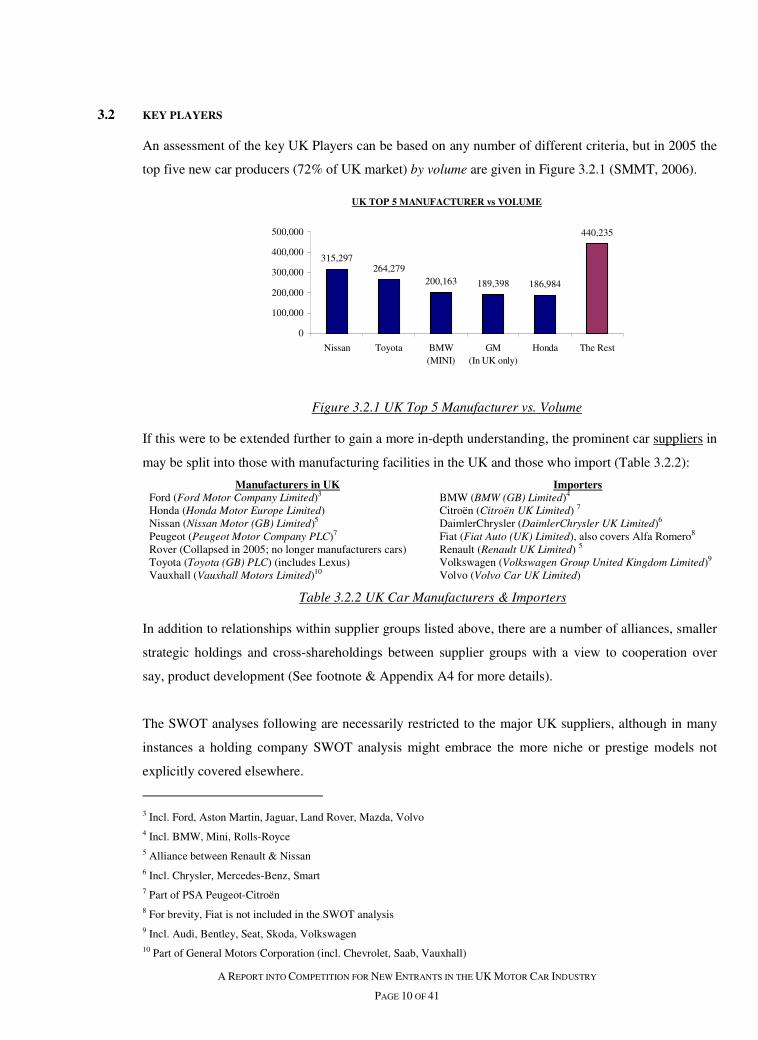
An assessment of the key UK Players can be based on any number of different criteria, but in 2005 the
top five new car producers (72% of UK market) by volume are given in Figure 3.2.1 (SMMT, 2006).
Figure 3.2.1 UK Top 5 Manufacturer vs. Volume
If this were to be extended further to gain a more in-depth understanding, the prominent car suppliers in
may be split into those with manufacturing facilities in the UK and those who import (Table 3.2.2):
Manufacturers in UK Importers Ford (Ford Motor Company Limited)3 BMW (BMW (GB) Limited)4 Honda (Honda Motor Europe Limited) Citroën (Citroën UK Limited) 7 Nissan (Nissan Motor (GB) Limited)5 DaimlerChrysler (DaimlerChrysler UK Limited)6 Peugeot (Peugeot Motor Company PLC)7 Fiat (Fiat Auto (UK) Limited), also covers Alfa Romero8 Rover (Collapsed in 2005; no longer manufacturers cars) Renault (Renault UK Limited) 5 Toyota (Toyota (GB) PLC) (includes Lexus) Volkswagen (Volkswagen Group United Kingdom Limited)9 Vauxhall (Vauxhall Motors Limited)10 Volvo (Volvo Car UK Limited)
Table 3.2.2 UK Car Manufacturers & Importers
In addition to relationships within supplier groups listed above, there are a number of alliances, smaller
strategic holdings and cross-shareholdings between supplier groups with a view to cooperation over
say, product development (See footnote & Appendix A4 for more details).
The SWOT analyses following are necessarily restricted to the major UK suppliers, although in many
instances a holding company SWOT analysis might embrace the more niche or prestige models not
explicitly covered elsewhere.
3 Incl. Ford, Aston Martin, Jaguar, Land Rover, Mazda, Volvo 4 Incl. BMW, Mini, Rolls-Royce 5 Alliance between Renault & Nissan 6 Incl. Chrysler, Mercedes-Benz, Smart 7 Part of PSA Peugeot-Citroën 8 For brevity, Fiat is not included in the SWOT analysis 9 Incl. Audi, Bentley, Seat, Skoda, Volkswagen 10 Part of General Motors Corporation (incl. Chevrolet, Saab, Vauxhall)
UK TOP 5 MANUFACTURER vs VOLUME
315,297264,279
200,163 189,398 186,984
440,235
0
100,000
200,000
300,000
400,000
500,000
Nissan Toyota BMW(MINI)
GM(In UK only)
Honda The Rest
A REPORT INTO COMPETITION FOR NEW ENTRANTS IN THE UK MOTOR CAR INDUSTRY
PAGE 11 OF 41
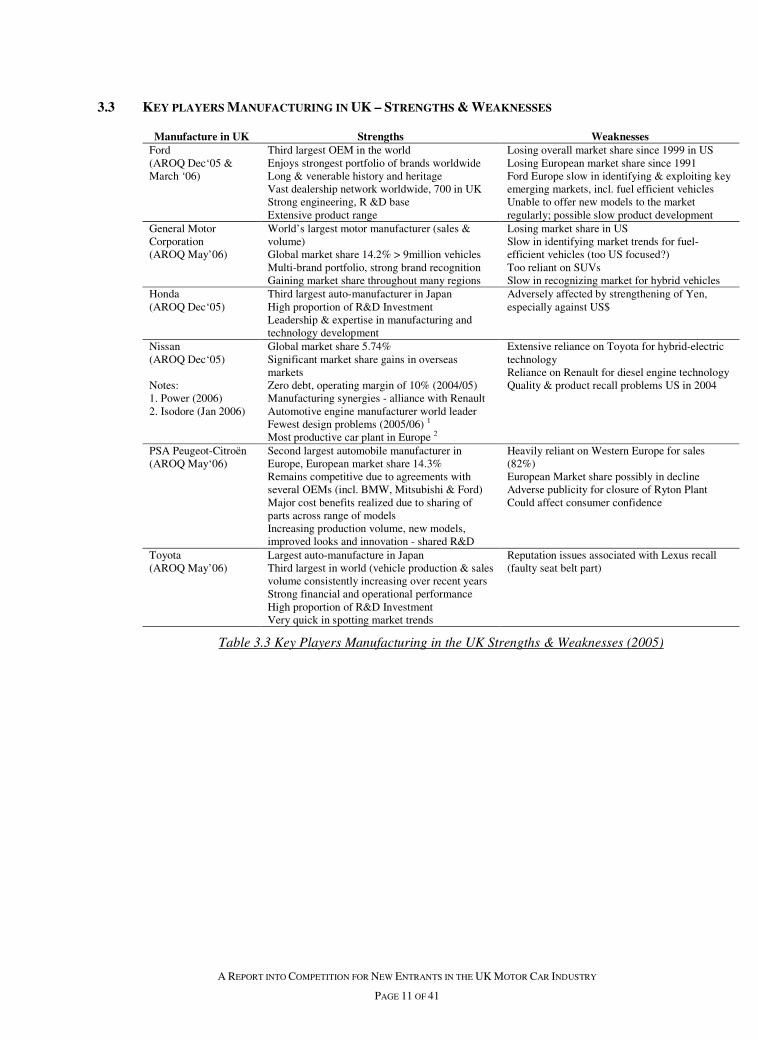
3.3 KEY PLAYERS MANUFACTURING IN UK – STRENGTHS & WEAKNESSES
Manufacture in UK Strengths Weaknesses Ford (AROQ Dec‘05 & March ‘06)
Third largest OEM in the world Enjoys strongest portfolio of brands worldwide Long & venerable history and heritage Vast dealership network worldwide, 700 in UK Strong engineering, R &D base Extensive product range
Losing overall market share since 1999 in US Losing European market share since 1991 Ford Europe slow in identifying & exploiting key emerging markets, incl. fuel efficient vehicles Unable to offer new models to the market regularly; possible slow product development
General Motor Corporation (AROQ May’06)
World’s largest motor manufacturer (sales & volume) Global market share 14.2% > 9million vehicles Multi-brand portfolio, strong brand recognition Gaining market share throughout many regions
Losing market share in US Slow in identifying market trends for fuel-efficient vehicles (too US focused?) Too reliant on SUVs Slow in recognizing market for hybrid vehicles
Honda (AROQ Dec‘05)
Third largest auto-manufacturer in Japan High proportion of R&D Investment Leadership & expertise in manufacturing and technology development
Adversely affected by strengthening of Yen, especially against US$
Nissan (AROQ Dec‘05) Notes: 1. Power (2006) 2. Isodore (Jan 2006)
Global market share 5.74% Significant market share gains in overseas markets Zero debt, operating margin of 10% (2004/05) Manufacturing synergies - alliance with Renault Automotive engine manufacturer world leader Fewest design problems (2005/06) 1 Most productive car plant in Europe 2
Extensive reliance on Toyota for hybrid-electric technology Reliance on Renault for diesel engine technology Quality & product recall problems US in 2004
PSA Peugeot-Citroën (AROQ May‘06)
Second largest automobile manufacturer in Europe, European market share 14.3% Remains competitive due to agreements with several OEMs (incl. BMW, Mitsubishi & Ford) Major cost benefits realized due to sharing of parts across range of models Increasing production volume, new models, improved looks and innovation - shared R&D
Heavily reliant on Western Europe for sales (82%) European Market share possibly in decline Adverse publicity for closure of Ryton Plant Could affect consumer confidence
Toyota (AROQ May’06)
Largest auto-manufacture in Japan Third largest in world (vehicle production & sales volume consistently increasing over recent years Strong financial and operational performance High proportion of R&D Investment Very quick in spotting market trends
Reputation issues associated with Lexus recall (faulty seat belt part)
Table 3.3 Key Players Manufacturing in the UK Strengths & Weaknesses (2005)
A REPORT INTO COMPETITION FOR NEW ENTRANTS IN THE UK MOTOR CAR INDUSTRY
PAGE 12 OF 41
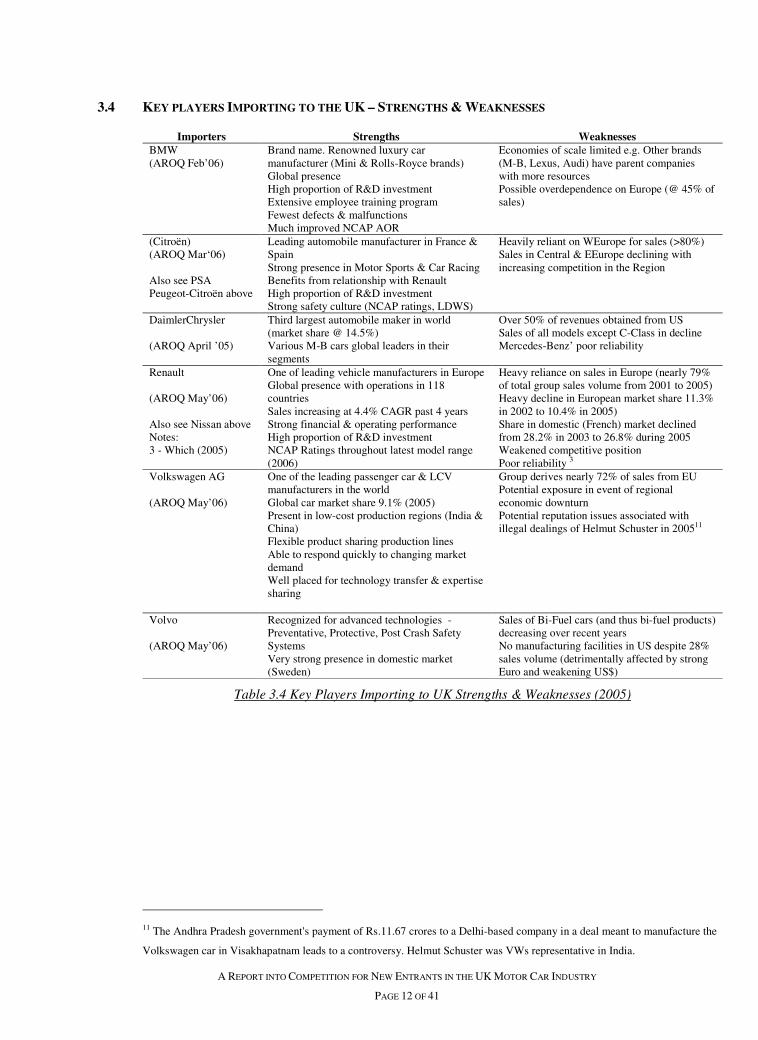
3.4 KEY PLAYERS IMPORTING TO THE UK – STRENGTHS & WEAKNESSES
Importers Strengths Weaknesses BMW (AROQ Feb’06)
Brand name. Renowned luxury car manufacturer (Mini & Rolls-Royce brands) Global presence High proportion of R&D investment Extensive employee training program Fewest defects & malfunctions Much improved NCAP AOR
Economies of scale limited e.g. Other brands (M-B, Lexus, Audi) have parent companies with more resources Possible overdependence on Europe (@ 45% of sales)
(Citroën) (AROQ Mar‘06) Also see PSA Peugeot-Citroën above
Leading automobile manufacturer in France & Spain Strong presence in Motor Sports & Car Racing Benefits from relationship with Renault High proportion of R&D investment Strong safety culture (NCAP ratings, LDWS)
Heavily reliant on WEurope for sales (>80%) Sales in Central & EEurope declining with increasing competition in the Region
DaimlerChrysler (AROQ April ’05)
Third largest automobile maker in world (market share @ 14.5%) Various M-B cars global leaders in their segments
Over 50% of revenues obtained from US Sales of all models except C-Class in decline Mercedes-Benz’ poor reliability
Renault (AROQ May’06) Also see Nissan above Notes: 3 - Which (2005)
One of leading vehicle manufacturers in Europe Global presence with operations in 118 countries Sales increasing at 4.4% CAGR past 4 years Strong financial & operating performance High proportion of R&D investment NCAP Ratings throughout latest model range (2006)
Heavy reliance on sales in Europe (nearly 79% of total group sales volume from 2001 to 2005) Heavy decline in European market share 11.3% in 2002 to 10.4% in 2005) Share in domestic (French) market declined from 28.2% in 2003 to 26.8% during 2005 Weakened competitive position Poor reliability 3
Volkswagen AG (AROQ May’06)
One of the leading passenger car & LCV manufacturers in the world Global car market share 9.1% (2005) Present in low-cost production regions (India & China) Flexible product sharing production lines Able to respond quickly to changing market demand Well placed for technology transfer & expertise sharing
Group derives nearly 72% of sales from EU Potential exposure in event of regional economic downturn Potential reputation issues associated with illegal dealings of Helmut Schuster in 200511
Volvo (AROQ May’06)
Recognized for advanced technologies - Preventative, Protective, Post Crash Safety Systems Very strong presence in domestic market (Sweden)
Sales of Bi-Fuel cars (and thus bi-fuel products) decreasing over recent years No manufacturing facilities in US despite 28% sales volume (detrimentally affected by strong Euro and weakening US$)
Table 3.4 Key Players Importing to UK Strengths & Weaknesses (2005)
11 The Andhra Pradesh government's payment of Rs.11.67 crores to a Delhi-based company in a deal meant to manufacture the
Volkswagen car in Visakhapatnam leads to a controversy. Helmut Schuster was VWs representative in India.
A REPORT INTO COMPETITION FOR NEW ENTRANTS IN THE UK MOTOR CAR INDUSTRY
PAGE 13 OF 41
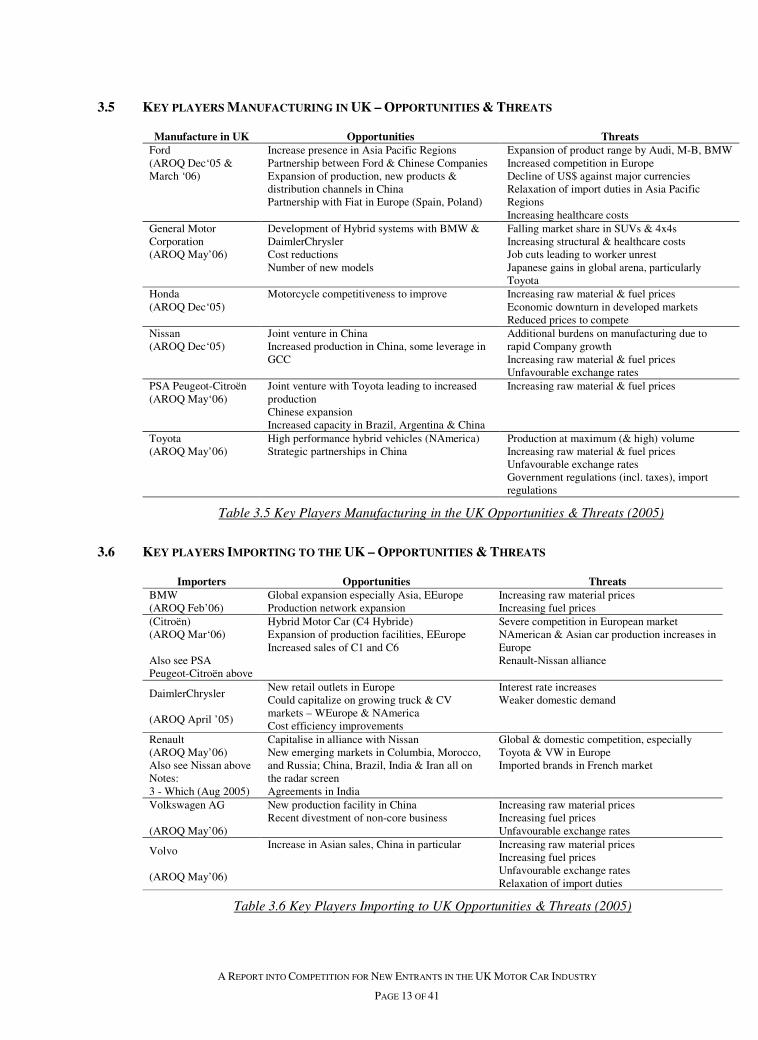
3.5 KEY PLAYERS MANUFACTURING IN UK – OPPORTUNITIES & THREATS
Manufacture in UK Opportunities Threats Ford (AROQ Dec‘05 & March ‘06)
Increase presence in Asia Pacific Regions Partnership between Ford & Chinese Companies Expansion of production, new products & distribution channels in China Partnership with Fiat in Europe (Spain, Poland)
Expansion of product range by Audi, M-B, BMW Increased competition in Europe Decline of US$ against major currencies Relaxation of import duties in Asia Pacific Regions Increasing healthcare costs
General Motor Corporation (AROQ May’06)
Development of Hybrid systems with BMW & DaimlerChrysler Cost reductions Number of new models
Falling market share in SUVs & 4x4s Increasing structural & healthcare costs Job cuts leading to worker unrest Japanese gains in global arena, particularly Toyota
Honda (AROQ Dec‘05)
Motorcycle competitiveness to improve Increasing raw material & fuel prices Economic downturn in developed markets Reduced prices to compete
Nissan (AROQ Dec‘05)
Joint venture in China Increased production in China, some leverage in GCC
Additional burdens on manufacturing due to rapid Company growth Increasing raw material & fuel prices Unfavourable exchange rates
PSA Peugeot-Citroën (AROQ May‘06)
Joint venture with Toyota leading to increased production Chinese expansion Increased capacity in Brazil, Argentina & China
Increasing raw material & fuel prices
Toyota (AROQ May’06)
High performance hybrid vehicles (NAmerica) Strategic partnerships in China
Production at maximum (& high) volume Increasing raw material & fuel prices Unfavourable exchange rates Government regulations (incl. taxes), import regulations
Table 3.5 Key Players Manufacturing in the UK Opportunities & Threats (2005)
3.6 KEY PLAYERS IMPORTING TO THE UK – OPPORTUNITIES & THREATS
Importers Opportunities Threats BMW (AROQ Feb’06)
Global expansion especially Asia, EEurope Production network expansion
Increasing raw material prices Increasing fuel prices
(Citroën) (AROQ Mar‘06) Also see PSA Peugeot-Citroën above
Hybrid Motor Car (C4 Hybride) Expansion of production facilities, EEurope Increased sales of C1 and C6
Severe competition in European market NAmerican & Asian car production increases in Europe Renault-Nissan alliance
DaimlerChrysler (AROQ April ’05)
New retail outlets in Europe Could capitalize on growing truck & CV markets – WEurope & NAmerica Cost efficiency improvements
Interest rate increases Weaker domestic demand
Renault (AROQ May’06) Also see Nissan above Notes: 3 - Which (Aug 2005)
Capitalise in alliance with Nissan New emerging markets in Columbia, Morocco, and Russia; China, Brazil, India & Iran all on the radar screen Agreements in India
Global & domestic competition, especially Toyota & VW in Europe Imported brands in French market
Volkswagen AG (AROQ May’06)
New production facility in China Recent divestment of non-core business
Increasing raw material prices Increasing fuel prices Unfavourable exchange rates
Volvo (AROQ May’06)
Increase in Asian sales, China in particular Increasing raw material prices Increasing fuel prices Unfavourable exchange rates Relaxation of import duties
Table 3.6 Key Players Importing to UK Opportunities & Threats (2005)
A REPORT INTO COMPETITION FOR NEW ENTRANTS IN THE UK MOTOR CAR INDUSTRY
PAGE 14 OF 41
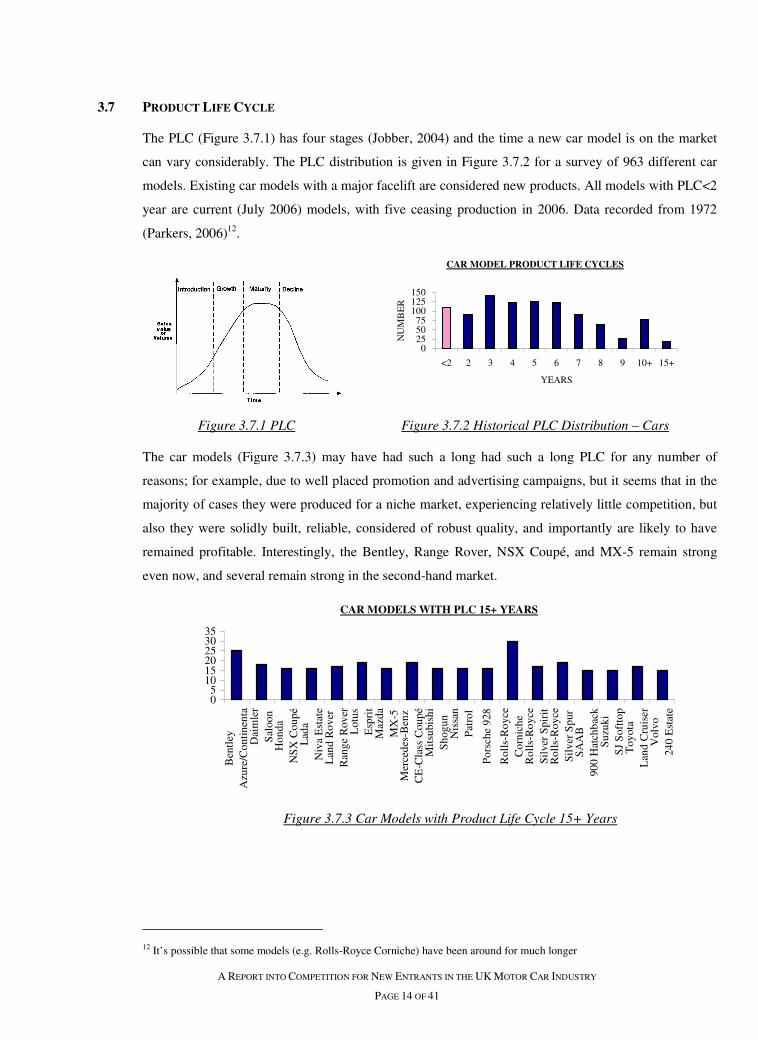
3.7 PRODUCT LIFE CYCLE
The PLC (Figure 3.7.1) has four stages (Jobber, 2004) and the time a new car model is on the market
can vary considerably. The PLC distribution is given in Figure 3.7.2 for a survey of 963 different car
models. Existing car models with a major facelift are considered new products. All models with PLC<2
year are current (July 2006) models, with five ceasing production in 2006. Data recorded from 1972
(Parkers, 2006)12.
Figure 3.7.1 PLC Figure 3.7.2 Historical PLC Distribution – Cars
The car models (Figure 3.7.3) may have had such a long had such a long PLC for any number of
reasons; for example, due to well placed promotion and advertising campaigns, but it seems that in the
majority of cases they were produced for a niche market, experiencing relatively little competition, but
also they were solidly built, reliable, considered of robust quality, and importantly are likely to have
remained profitable. Interestingly, the Bentley, Range Rover, NSX Coupé, and MX-5 remain strong
even now, and several remain strong in the second-hand market.
Figure 3.7.3 Car Models with Product Life Cycle 15+ Years
12 It’s possible that some models (e.g. Rolls-Royce Corniche) have been around for much longer
CAR MODEL PRODUCT LIFE CYCLES
0255075
100125150
<2 2 3 4 5 6 7 8 9 10+ 15+
YEARS
NU
MB
ER
CAR MODELS WITH PLC 15+ YEARS
05
101520253035
Ben
tley
Azu
re/C
onti
nent
aD
aim
ler
Sal
oon
Hon
daN
SX
Cou
péL
ada
Niv
a E
stat
eL
and
Rov
erR
ange
Rov
erL
otus
Esp
rit
Maz
daM
X-5
Mer
cede
s-B
enz
CE
-Cla
ss C
oupé
Mit
subi
shi
Sho
gun
Nis
san
Pat
rol
Por
sche
928
Rol
ls-R
oyce
Cor
nich
eR
olls
-Roy
ceS
ilve
r S
piri
tR
olls
-Roy
ceS
ilve
r S
pur
SA
AB
900
Hat
chba
ckS
uzuk
iS
J S
oftt
opT
oyot
aL
and
Cru
iser
Vol
vo24
0 E
stat
e
A REPORT INTO COMPETITION FOR NEW ENTRANTS IN THE UK MOTOR CAR INDUSTRY
PAGE 15 OF 41
4.0 ELEMENTS OF THE MARKETING MIX
4.1 PROMOTION
Promotion involves disseminating information about a product, product line, brand, or company
(Appendix A4). Kotler et al (2006) suggests that advertising offers a reason to buy, whereas sales
promotion offers incentive. Product promotion in the car industry uses a variety of media including:
NEWSPAPER AND MAGAZINE ADVERTISING
German manufacturers such as Audi, BMW, VW as well as Alfa Romeo, Lexus, Renault and Saab
seem to make use of half or full page spreads in broadsheet Sunday Newspapers and supplement
magazines such as the Daily and Sunday Telegraph, whereas cheaper cars rely more on dealerships
advertising in tabloid newspapers. This type of advertising can reach a specific targeted audience as
much is known about certain newspaper readers.
Perhaps the most influential are the plethora of Car Magazines such as ‘What Car? Top Gear and Car
Magazine; these include reviews and summaries of vehicle details and specifications13.
TV ADVERTISING
TV commercials are considered to be the most effective mass-market advertising format and are used
by many of the high volume car suppliers. Advertisements for different cars are often distinctive, such
as the Renault Mégane and the ‘Shaking Your Ass’ theme and Honda’s fascinating advertisements not
necessarily featuring a car! Other prominent manufacturers making use of UK TV fairly recently
include Citroën (skating robot), Vauxhall (prowling black car), and Audi and BMW with final imposing
head-on shots of one of their offerings, as well as the intriguing ‘Mini’ Adventure stories.
MOTOR SHOWS
In the UK, all major car manufacturers show their wares at the biannual BIMS (2006) where all the new
cars, world car premieres, and concept cars can be viewed. OICA accredited International Motor Shows
typically last 10 to 12 days (OICA, 2006) made up of a couple of Press days and a Dealer preview day
before general public access for a week. Motor Shows allow manufacturers to showcase their latest
offerings to the automotive press and general public. These events create buzz for hot new products that
often carries over into dealerships months down the line.
13 Fleet cars are covered in more specialist magazines such as Fleet News (EMAP Automotive Ltd) and Fleet World Magazine
(Stag Publications Ltd).
A REPORT INTO COMPETITION FOR NEW ENTRANTS IN THE UK MOTOR CAR INDUSTRY
PAGE 16 OF 41
WEBSITES & ONLINE ADVERTISING
All manufacturers referred to herein have eye-catching websites with high visual impact where
potential customers can view the product and also read the car specifications and in some view videos
of the vehicles in motion. Visitors will often have the opportunity to create their own model choice,
engine size and type, colour, and trim on top of the standard product. The web pages are eye catching,
dazzling, and easy to navigate. There is plenty of competition, so getting people’s attention can be
difficult.
Another form of advertising on the Internet is the use of pop-up windows, flash or banners, particularly
prominent on websites giving car reviews. Growth in online advertising is so strong that it has now
overtaken both outdoor and radio advertising in percentage of market share. (Eckford, 2005)
PERSONAL SELLING (CAR SALES, DEALERSHIPS)
This area of promotion is where a high percentage of motorcars are actually sold. This method of
selling is important as it builds up customer relationships. It is interactive, adaptable and useful for
addressing customer needs. This type of promotion takes in the original sale; but it can also include
long-term technical service and support and gives customer reassurance that they will be looked after.
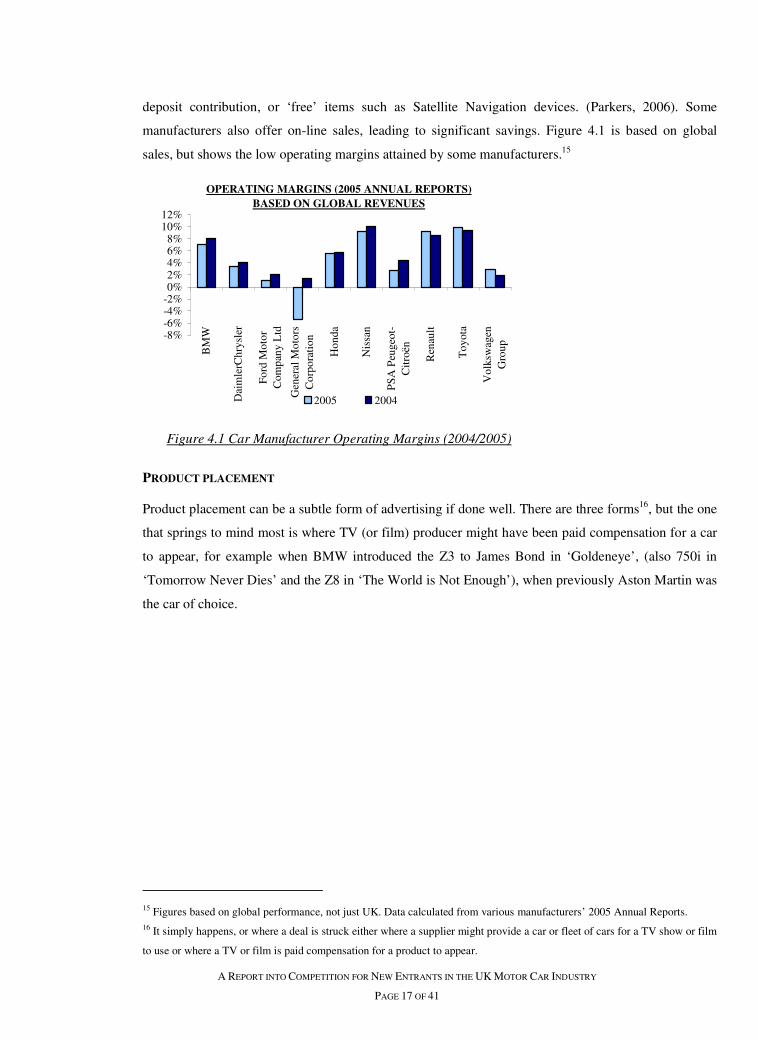
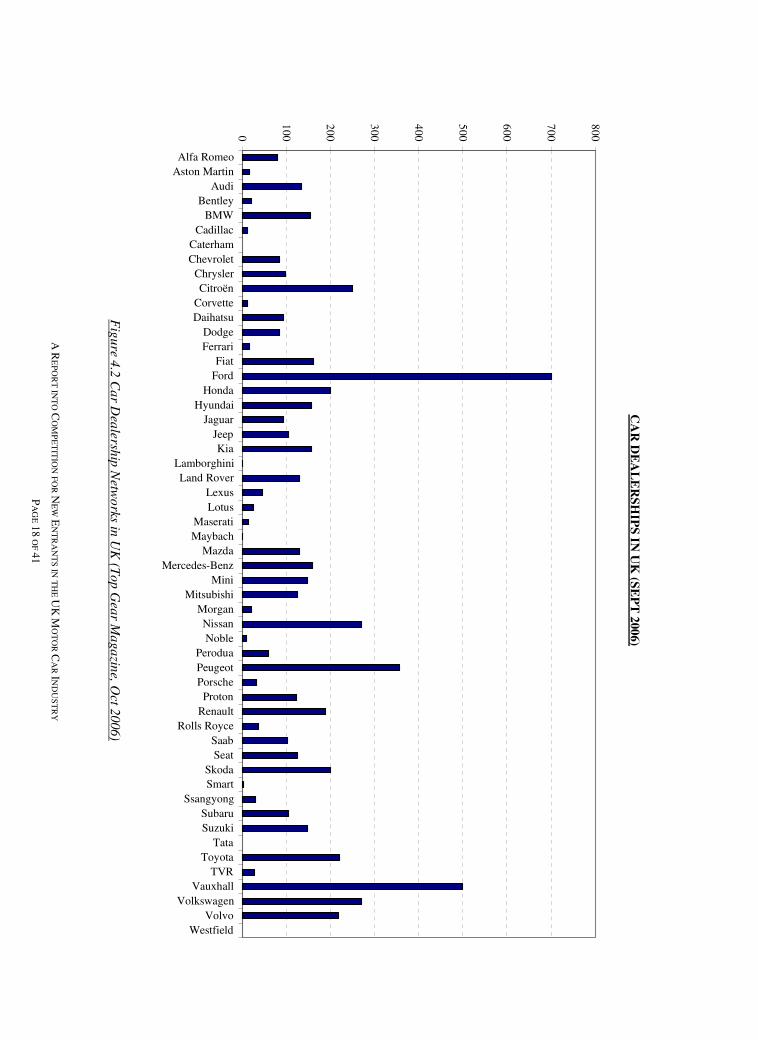
Distribution channels in the car industry are usually either directly with the manufacturer in the case of
smaller niche manufacturers, or through authorised dealership networks (Figure 4.2), with Ford having
the most dealerships in the UK with 70014, making it relatively easy for the company to introduce a new
product to market compared with companies with fewer dealerships.
POSTERS AND BILLBOARDS
Billboards or posters show large advertisements aimed at passing pedestrians and drivers, being
designed to catch a person's attention creating a memorable impression very quickly leaving the reader
thinking about the advertisement after they have gone past it. There are usually only a few large print
words and a humorous or arresting image in brilliant colour. Car manufacturers often use these showing
a vehicle with a short catchphrase or motto. Trudeau (1997) observes that the mind remembers pictures
more than words, which may go some way to understanding why the words on billboards are minimal.
PRICING
The UK car market is extremely competitive, and is notorious for low profitability (DTI-AU, 2004). In
general, suppliers appear to set their RRPs at about the same level as their competitors for equivalent
cars, and seek to compete through other means such as marketing, product quality, specifications and
special offers (SSTI, 2000). Special offers might include discounts, insurance deals, trim upgrades,
14 The number for Smart is perhaps misleading in that many M-B dealerships also deal in the Smart brand of car.
A REPORT INTO COMPETITION FOR NEW ENTRANTS IN THE UK MOTOR CAR INDUSTRY
PAGE 17 OF 41
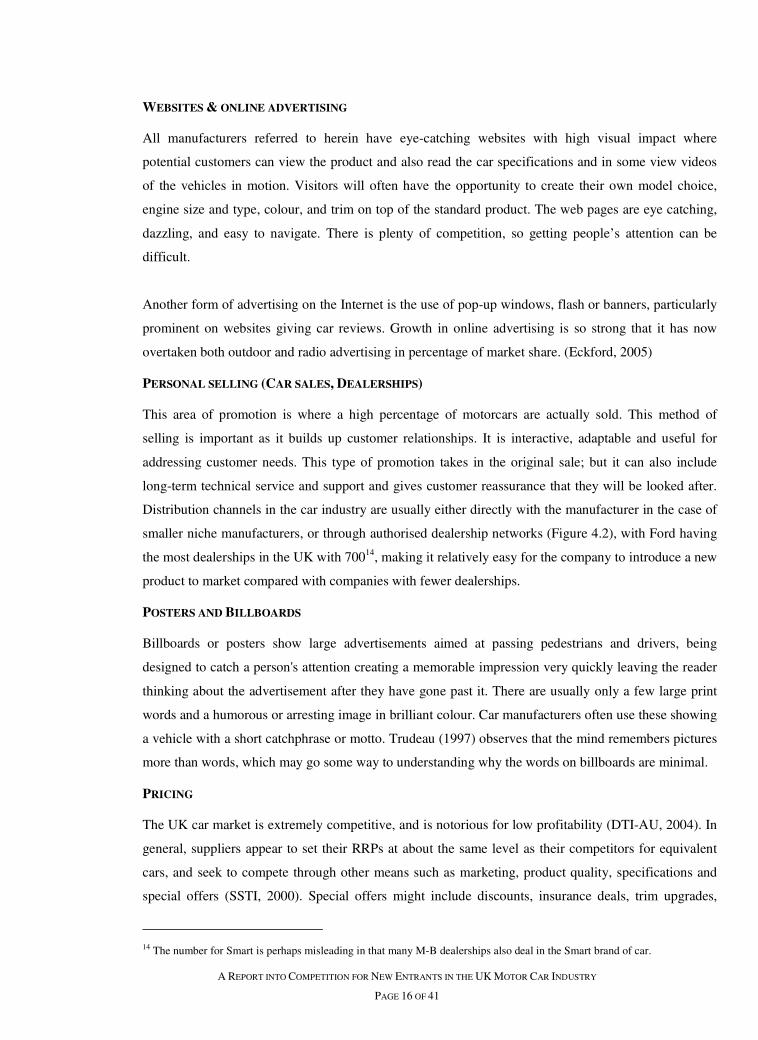
deposit contribution, or ‘free’ items such as Satellite Navigation devices. (Parkers, 2006). Some
manufacturers also offer on-line sales, leading to significant savings. Figure 4.1 is based on global
sales, but shows the low operating margins attained by some manufacturers.15
Figure 4.1 Car Manufacturer Operating Margins (2004/2005)
PRODUCT PLACEMENT
Product placement can be a subtle form of advertising if done well. There are three forms16, but the one
that springs to mind most is where TV (or film) producer might have been paid compensation for a car
to appear, for example when BMW introduced the Z3 to James Bond in ‘Goldeneye’, (also 750i in
‘Tomorrow Never Dies’ and the Z8 in ‘The World is Not Enough’), when previously Aston Martin was
the car of choice.
15 Figures based on global performance, not just UK. Data calculated from various manufacturers’ 2005 Annual Reports. 16 It simply happens, or where a deal is struck either where a supplier might provide a car or fleet of cars for a TV show or film
to use or where a TV or film is paid compensation for a product to appear.
OPERATING MARGINS (2005 ANNUAL REPORTS)
BASED ON GLOBAL REVENUES
-8%-6%-4%-2%0%2%4%6%8%
10%12%
BM
W
Dai
mle
rChr
ysle
r
For
d M
otor
Com
pany
Ltd
Gen
eral
Mot
ors
Cor
pora
tion
Hon
da
Nis
san
PS
A P
euge
ot-
Cit
roën
Ren
ault
Toy
ota
Vol
ksw
agen
Gro
up
2005 2004
A R
EP
OR
T IN
TO
CO
MP
ET
ITIO
N FO
R N
EW
EN
TR
AN
TS IN
TH
E U
K M
OT
OR
CA
R IN
DU
ST
RY
PA
GE
18 O
F 41
Fig
ure 4
.2 C
ar D
ealersh
ip N
etwo
rks in U
K (T
op
Gea
r Ma
ga
zine, O
ct 20
06)
CA
R D
EA
LE
RS
HIP
S IN
UK
(SE
PT
200
6)
0
100
200
300
400
500
600
700
800Alfa Romeo
Aston MartinAudi
BentleyBMW
CadillacCaterhamChevrolet
ChryslerCitroën
CorvetteDaihatsu
DodgeFerrari
FiatFord
HondaHyundai
JaguarJeepKia
LamborghiniLand Rover
LexusLotus
MaseratiMaybach
MazdaMercedes-Benz
MiniMitsubishi
MorganNissanNoble
PeroduaPeugeotPorsche
ProtonRenault
Rolls RoyceSaabSeat
SkodaSmart
SsangyongSubaruSuzuki
TataToyota
TVRVauxhall
VolkswagenVolvo
Westfield
A REPORT INTO COMPETITION FOR NEW ENTRANTS IN THE UK MOTOR CAR INDUSTRY
PAGE 19 OF 41
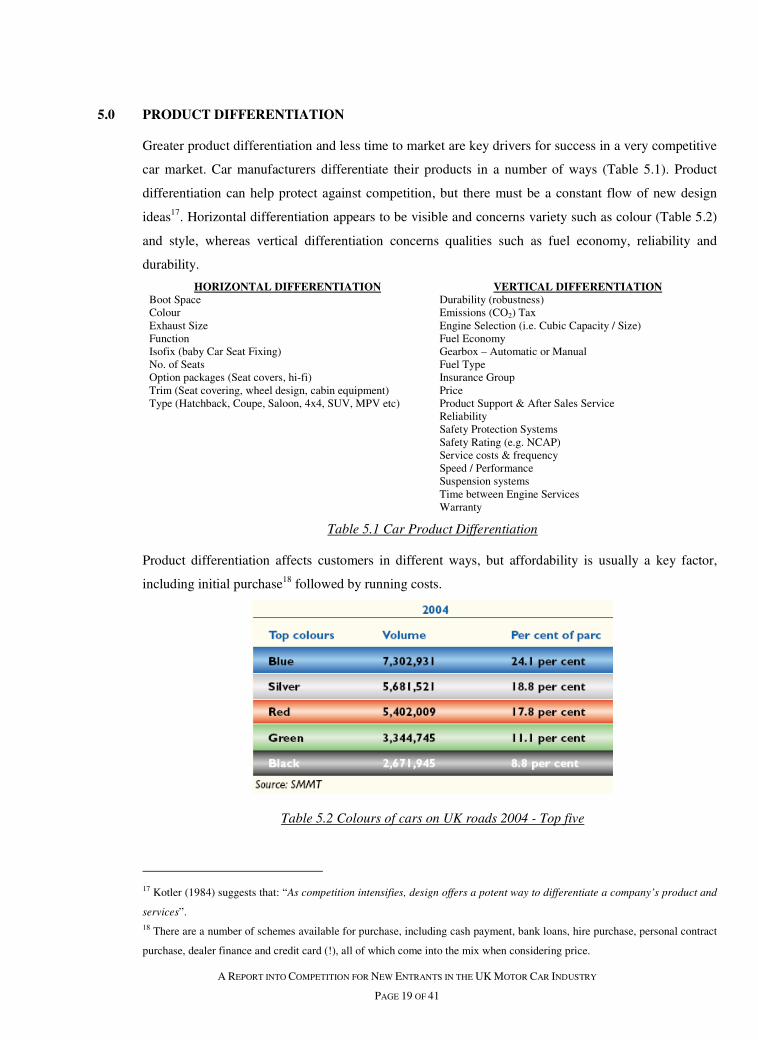
5.0 PRODUCT DIFFERENTIATION
Greater product differentiation and less time to market are key drivers for success in a very competitive
car market. Car manufacturers differentiate their products in a number of ways (Table 5.1). Product
differentiation can help protect against competition, but there must be a constant flow of new design
ideas17. Horizontal differentiation appears to be visible and concerns variety such as colour (Table 5.2)
and style, whereas vertical differentiation concerns qualities such as fuel economy, reliability and
durability.
HORIZONTAL DIFFERENTIATION VERTICAL DIFFERENTIATION Boot Space Durability (robustness) Colour Emissions (CO2) Tax Exhaust Size Engine Selection (i.e. Cubic Capacity / Size) Function Fuel Economy Isofix (baby Car Seat Fixing) Gearbox – Automatic or Manual No. of Seats Fuel Type Option packages (Seat covers, hi-fi) Insurance Group Trim (Seat covering, wheel design, cabin equipment) Price Type (Hatchback, Coupe, Saloon, 4x4, SUV, MPV etc) Product Support & After Sales Service Reliability Safety Protection Systems Safety Rating (e.g. NCAP) Service costs & frequency Speed / Performance Suspension systems Time between Engine Services Warranty
Table 5.1 Car Product Differentiation
Product differentiation affects customers in different ways, but affordability is usually a key factor,
including initial purchase18 followed by running costs.
Table 5.2 Colours of cars on UK roads 2004 - Top five
17 Kotler (1984) suggests that: “As competition intensifies, design offers a potent way to differentiate a company’s product and
services”. 18 There are a number of schemes available for purchase, including cash payment, bank loans, hire purchase, personal contract
purchase, dealer finance and credit card (!), all of which come into the mix when considering price.
A REPORT INTO COMPETITION FOR NEW ENTRANTS IN THE UK MOTOR CAR INDUSTRY
PAGE 20 OF 41
6.0 MOTOR CAR INDUSTRY COMPETITIVE ANALYSIS
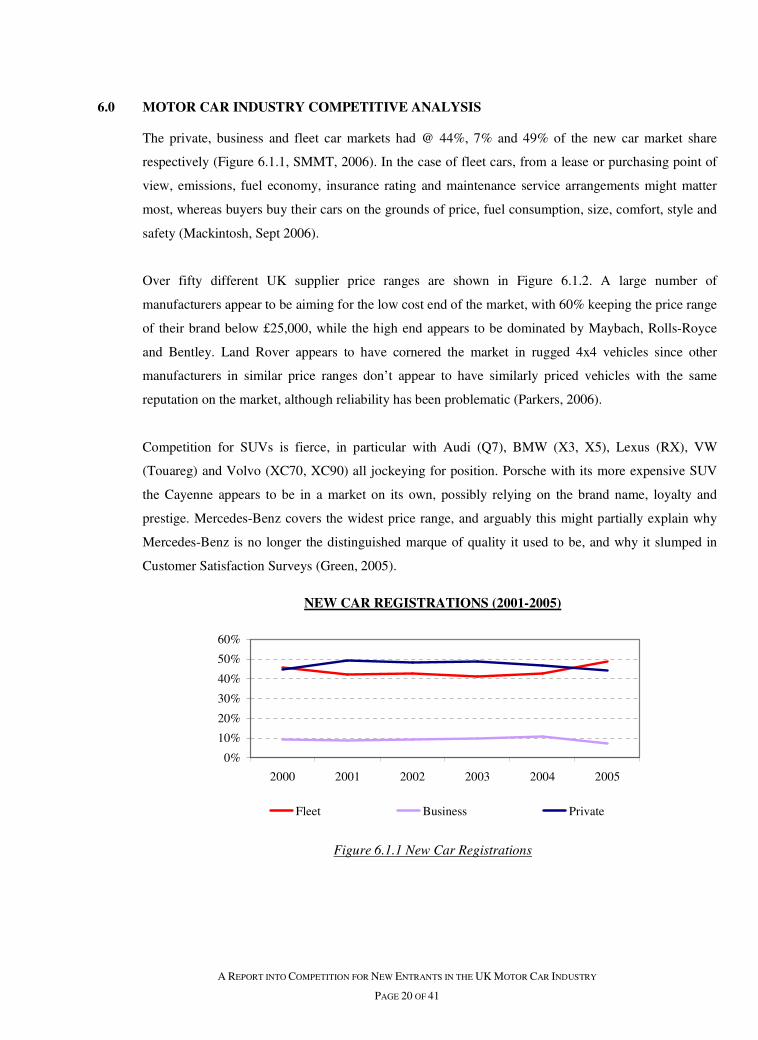
The private, business and fleet car markets had @ 44%, 7% and 49% of the new car market share
respectively (Figure 6.1.1, SMMT, 2006). In the case of fleet cars, from a lease or purchasing point of
view, emissions, fuel economy, insurance rating and maintenance service arrangements might matter
most, whereas buyers buy their cars on the grounds of price, fuel consumption, size, comfort, style and
safety (Mackintosh, Sept 2006).
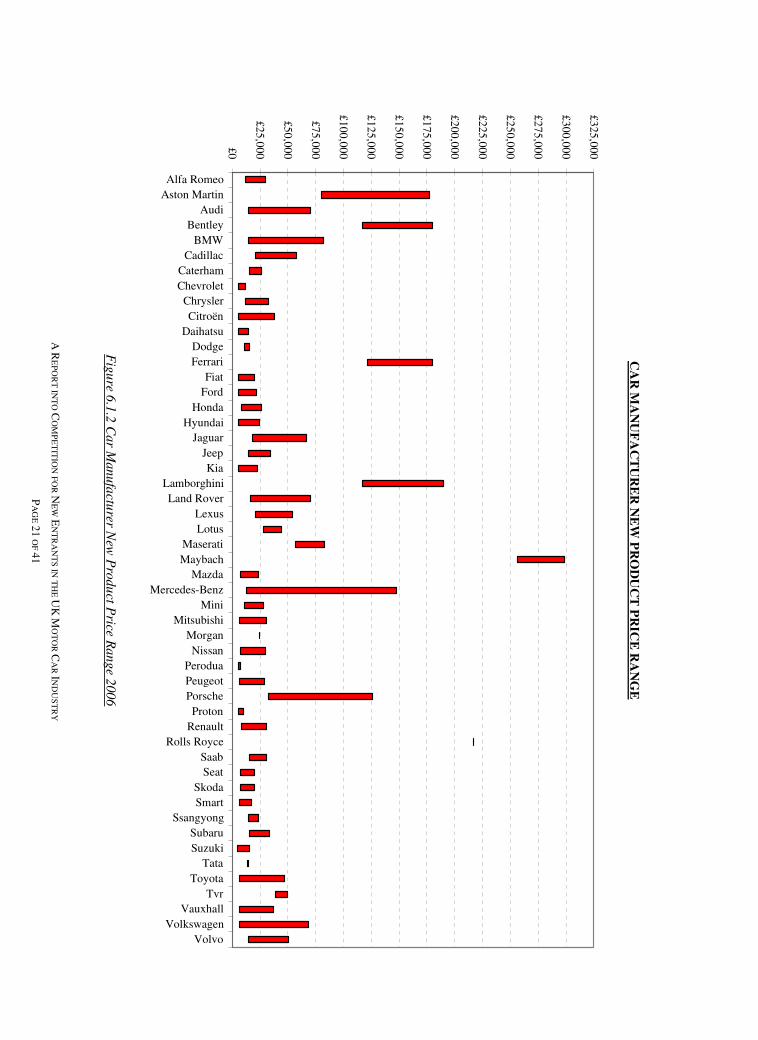
Over fifty different UK supplier price ranges are shown in Figure 6.1.2. A large number of
manufacturers appear to be aiming for the low cost end of the market, with 60% keeping the price range
of their brand below £25,000, while the high end appears to be dominated by Maybach, Rolls-Royce
and Bentley. Land Rover appears to have cornered the market in rugged 4x4 vehicles since other
manufacturers in similar price ranges don’t appear to have similarly priced vehicles with the same
reputation on the market, although reliability has been problematic (Parkers, 2006).
Competition for SUVs is fierce, in particular with Audi (Q7), BMW (X3, X5), Lexus (RX), VW
(Touareg) and Volvo (XC70, XC90) all jockeying for position. Porsche with its more expensive SUV
the Cayenne appears to be in a market on its own, possibly relying on the brand name, loyalty and
prestige. Mercedes-Benz covers the widest price range, and arguably this might partially explain why
Mercedes-Benz is no longer the distinguished marque of quality it used to be, and why it slumped in
Customer Satisfaction Surveys (Green, 2005).
Figure 6.1.1 New Car Registrations
NEW CAR REGISTRATIONS (2001-2005)
0%
10%
20%
30%
40%
50%
60%
2000 2001 2002 2003 2004 2005
Fleet Business Private
A R
EP
OR
T IN
TO
CO
MP
ET
ITIO
N FO
R N
EW
EN
TR
AN
TS IN
TH
E U
K M
OT
OR
CA
R IN
DU
ST
RY
PA
GE
21 O
F 41
Fig
ure 6
.1.2
Car M
anu
factu
rer New
Pro
du
ct Price R
ange 2
00
6
CA
R M
AN
UF
AC
TU
RE
R N
EW
PR
OD
UC
T P
RIC
E R
AN
GE
£0
£25,000
£50,000
£75,000
£100,000
£125,000
£150,000
£175,000
£200,000
£225,000
£250,000
£275,000
£300,000
£325,000Alfa Romeo
Aston MartinAudi
BentleyBMW
CadillacCaterhamChevrolet
ChryslerCitroën
DaihatsuDodgeFerrari
FiatFord
HondaHyundai
JaguarJeepKia
LamborghiniLand Rover
LexusLotus
MaseratiMaybach
MazdaMercedes-Benz
MiniMitsubishi
MorganNissan
PeroduaPeugeotPorscheProton
RenaultRolls Royce
SaabSeat
SkodaSmart
SsangyongSubaruSuzuki
TataToyota
TvrVauxhall
VolkswagenVolvo
A REPORT INTO COMPETITION FOR NEW ENTRANTS IN THE UK MOTOR CAR INDUSTRY
PAGE 22 OF 41
6.1 PORTER’S FIVE FORCES
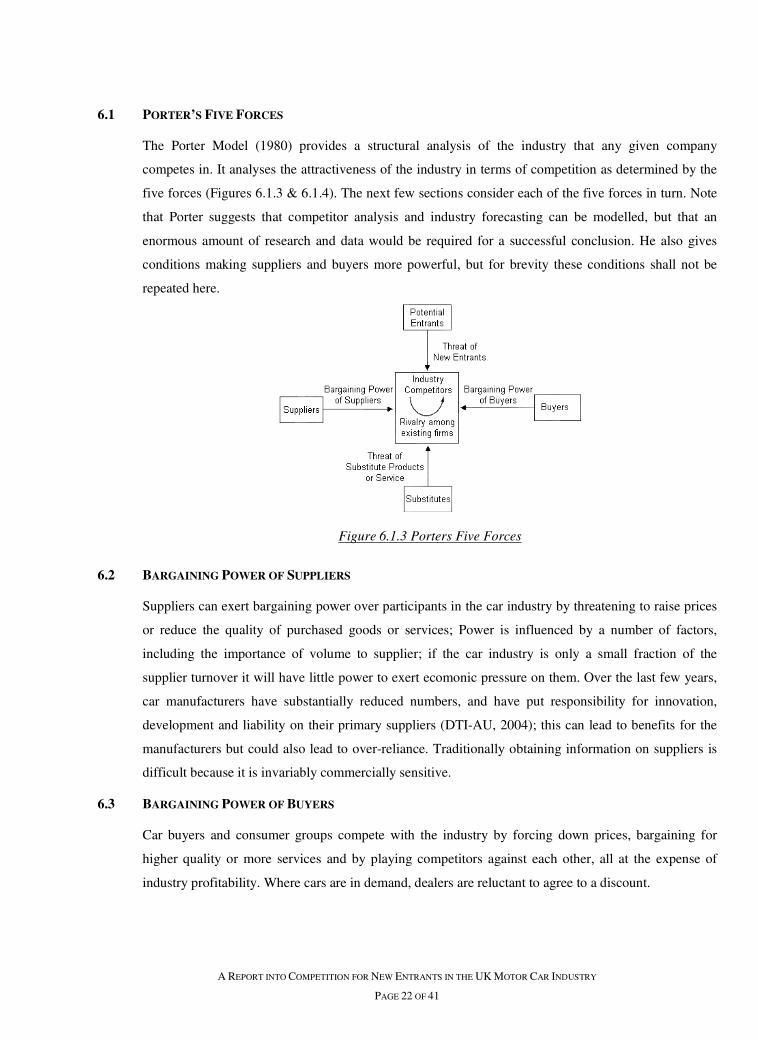
The Porter Model (1980) provides a structural analysis of the industry that any given company
competes in. It analyses the attractiveness of the industry in terms of competition as determined by the
five forces (Figures 6.1.3 & 6.1.4). The next few sections consider each of the five forces in turn. Note
that Porter suggests that competitor analysis and industry forecasting can be modelled, but that an
enormous amount of research and data would be required for a successful conclusion. He also gives
conditions making suppliers and buyers more powerful, but for brevity these conditions shall not be
repeated here.
Figure 6.1.3 Porters Five Forces
6.2 BARGAINING POWER OF SUPPLIERS
Suppliers can exert bargaining power over participants in the car industry by threatening to raise prices
or reduce the quality of purchased goods or services; Power is influenced by a number of factors,
including the importance of volume to supplier; if the car industry is only a small fraction of the
supplier turnover it will have little power to exert ecomonic pressure on them. Over the last few years,
car manufacturers have substantially reduced numbers, and have put responsibility for innovation,
development and liability on their primary suppliers (DTI-AU, 2004); this can lead to benefits for the
manufacturers but could also lead to over-reliance. Traditionally obtaining information on suppliers is
difficult because it is invariably commercially sensitive.
6.3 BARGAINING POWER OF BUYERS
Car buyers and consumer groups compete with the industry by forcing down prices, bargaining for
higher quality or more services and by playing competitors against each other, all at the expense of
industry profitability. Where cars are in demand, dealers are reluctant to agree to a discount.
A REPORT INTO COMPETITION FOR NEW ENTRANTS IN THE UK MOTOR CAR INDUSTRY
PAGE 23 OF 41
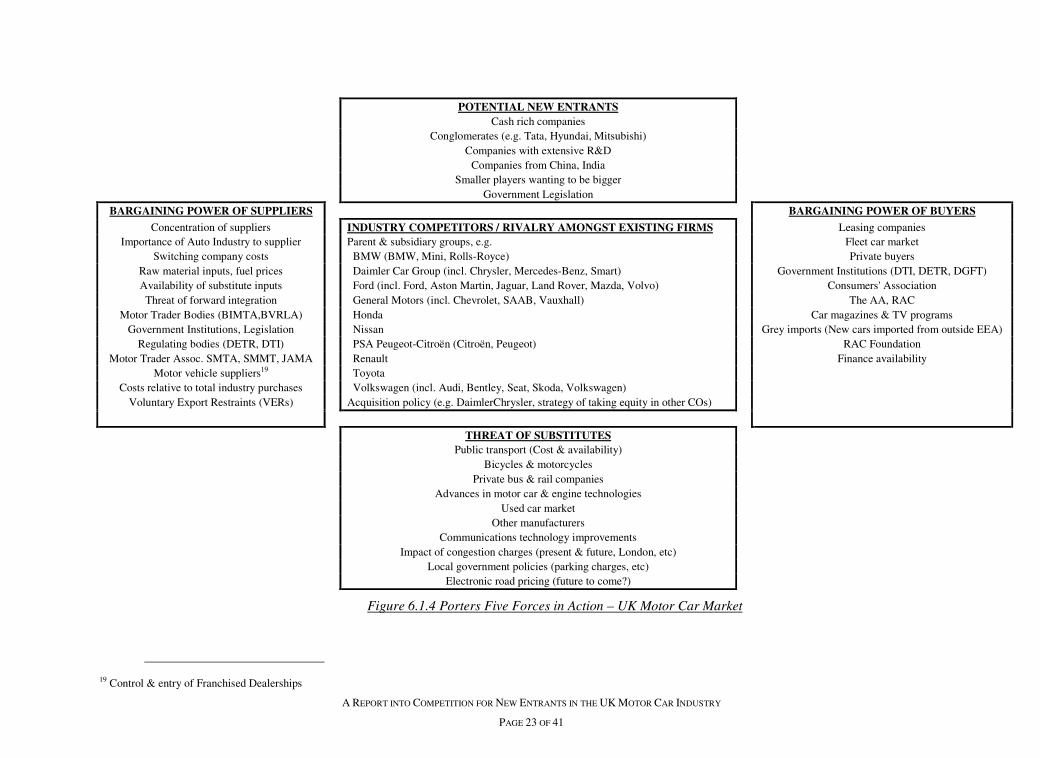
POTENTIAL NEW ENTRANTS Cash rich companies Conglomerates (e.g. Tata, Hyundai, Mitsubishi) Companies with extensive R&D Companies from China, India Smaller players wanting to be bigger
Government Legislation
BARGAINING POWER OF SUPPLIERS BARGAINING POWER OF BUYERS
Concentration of suppliers INDUSTRY COMPETITORS / RIVALRY AMONGST EXISTING FIRMS Leasing companies Importance of Auto Industry to supplier Parent & subsidiary groups, e.g. Fleet car market
Switching company costs BMW (BMW, Mini, Rolls-Royce) Private buyers Raw material inputs, fuel prices Daimler Car Group (incl. Chrysler, Mercedes-Benz, Smart) Government Institutions (DTI, DETR, DGFT) Availability of substitute inputs Ford (incl. Ford, Aston Martin, Jaguar, Land Rover, Mazda, Volvo) Consumers' Association Threat of forward integration General Motors (incl. Chevrolet, SAAB, Vauxhall) The AA, RAC
Motor Trader Bodies (BIMTA,BVRLA) Honda Car magazines & TV programs Government Institutions, Legislation Nissan Grey imports (New cars imported from outside EEA)
Regulating bodies (DETR, DTI) PSA Peugeot-Citroën (Citroën, Peugeot) RAC Foundation Motor Trader Assoc. SMTA, SMMT, JAMA Renault Finance availability
Motor vehicle suppliers19 Toyota Costs relative to total industry purchases Volkswagen (incl. Audi, Bentley, Seat, Skoda, Volkswagen)
Voluntary Export Restraints (VERs) Acquisition policy (e.g. DaimlerChrysler, strategy of taking equity in other COs)
THREAT OF SUBSTITUTES Public transport (Cost & availability) Bicycles & motorcycles Private bus & rail companies Advances in motor car & engine technologies Used car market Other manufacturers Communications technology improvements Impact of congestion charges (present & future, London, etc) Local government policies (parking charges, etc) Electronic road pricing (future to come?)
Figure 6.1.4 Porters Five Forces in Action – UK Motor Car Market
19 Control & entry of Franchised Dealerships
A REPORT INTO COMPETITION FOR NEW ENTRANTS IN THE UK MOTOR CAR INDUSTRY
PAGE 24 OF 41
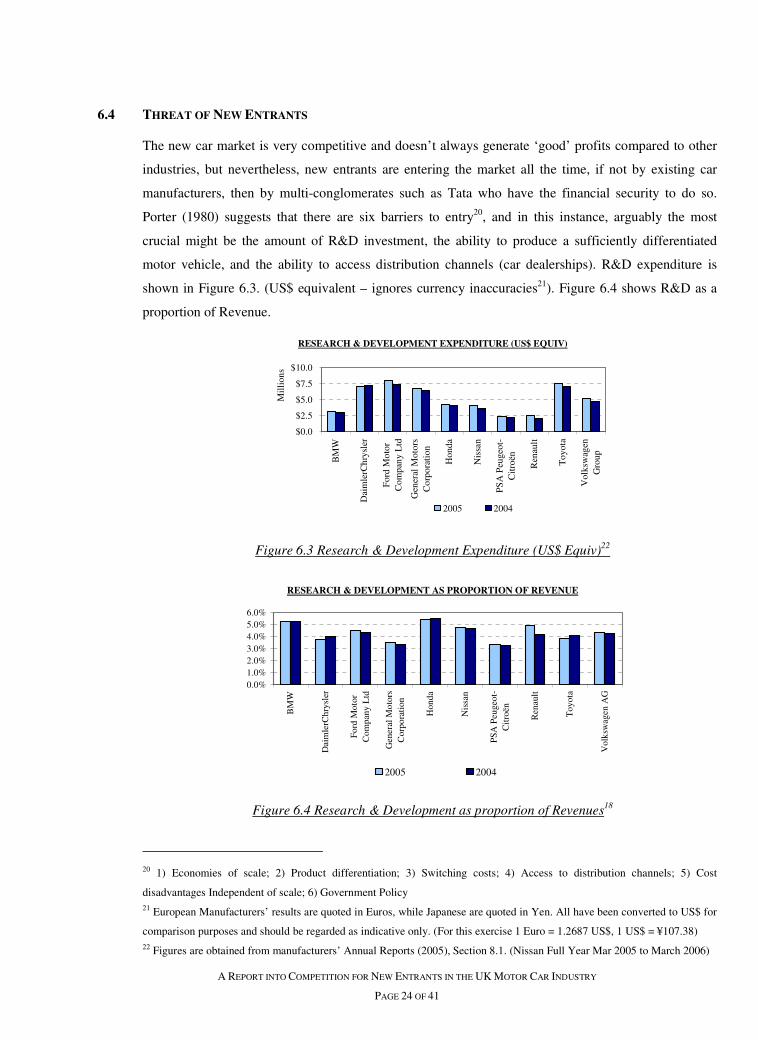
6.4 THREAT OF NEW ENTRANTS
The new car market is very competitive and doesn’t always generate ‘good’ profits compared to other
industries, but nevertheless, new entrants are entering the market all the time, if not by existing car
manufacturers, then by multi-conglomerates such as Tata who have the financial security to do so.
Porter (1980) suggests that there are six barriers to entry20, and in this instance, arguably the most
crucial might be the amount of R&D investment, the ability to produce a sufficiently differentiated
motor vehicle, and the ability to access distribution channels (car dealerships). R&D expenditure is
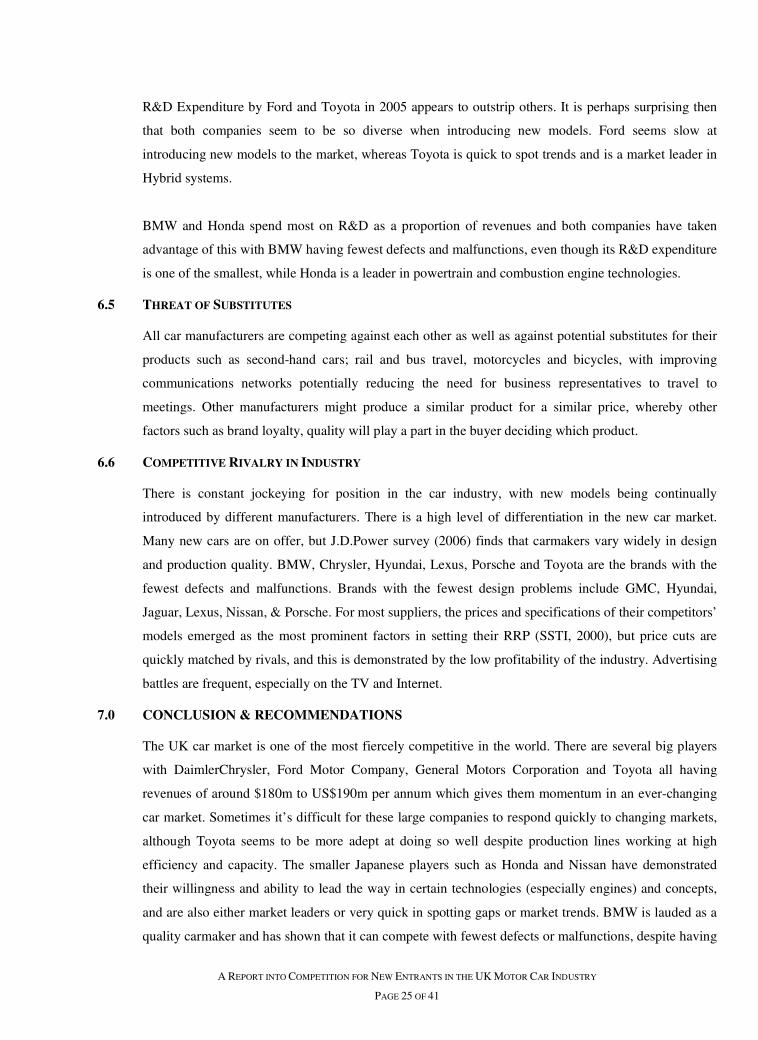
shown in Figure 6.3. (US$ equivalent – ignores currency inaccuracies21). Figure 6.4 shows R&D as a
proportion of Revenue.
Figure 6.3 Research & Development Expenditure (US$ Equiv)22
Figure 6.4 Research & Development as proportion of Revenues18
20 1) Economies of scale; 2) Product differentiation; 3) Switching costs; 4) Access to distribution channels; 5) Cost
disadvantages Independent of scale; 6) Government Policy 21 European Manufacturers’ results are quoted in Euros, while Japanese are quoted in Yen. All have been converted to US$ for
comparison purposes and should be regarded as indicative only. (For this exercise 1 Euro = 1.2687 US$, 1 US$ = ¥107.38) 22 Figures are obtained from manufacturers’ Annual Reports (2005), Section 8.1. (Nissan Full Year Mar 2005 to March 2006)
RESEARCH & DEVELOPMENT EXPENDITURE (US$ EQUIV)
$0.0
$2.5
$5.0
$7.5
$10.0
BM
W
Dai
mle
rChr
ysle
r
For
d M
otor
Com
pany
Ltd
Gen
eral
Mot
ors
Cor
pora
tion
Hon
da
Nis
san
PS
A P
euge
ot-
Cit
roën
Ren
ault
Toy
ota
Vol
ksw
agen
Gro
up
Mil
lion
s
2005 2004
RESEARCH & DEVELOPMENT AS PROPORTION OF REVENUE
0.0%1.0%2.0%3.0%4.0%5.0%6.0%
BM
W
Dai
mle
rChr
ysle
r
For
d M
otor
Com
pany
Ltd
Gen
eral
Mot
ors
Cor
pora
tion
Hon
da
Nis
san
PSA
Peu
geot
-C
itro
ën
Ren
ault
Toy
ota
Vol
ksw
agen
AG
2005 2004
A REPORT INTO COMPETITION FOR NEW ENTRANTS IN THE UK MOTOR CAR INDUSTRY
PAGE 25 OF 41
R&D Expenditure by Ford and Toyota in 2005 appears to outstrip others. It is perhaps surprising then
that both companies seem to be so diverse when introducing new models. Ford seems slow at
introducing new models to the market, whereas Toyota is quick to spot trends and is a market leader in
Hybrid systems.
BMW and Honda spend most on R&D as a proportion of revenues and both companies have taken
advantage of this with BMW having fewest defects and malfunctions, even though its R&D expenditure
is one of the smallest, while Honda is a leader in powertrain and combustion engine technologies.
6.5 THREAT OF SUBSTITUTES
All car manufacturers are competing against each other as well as against potential substitutes for their
products such as second-hand cars; rail and bus travel, motorcycles and bicycles, with improving
communications networks potentially reducing the need for business representatives to travel to
meetings. Other manufacturers might produce a similar product for a similar price, whereby other
factors such as brand loyalty, quality will play a part in the buyer deciding which product.
6.6 COMPETITIVE RIVALRY IN INDUSTRY
There is constant jockeying for position in the car industry, with new models being continually
introduced by different manufacturers. There is a high level of differentiation in the new car market.
Many new cars are on offer, but J.D.Power survey (2006) finds that carmakers vary widely in design
and production quality. BMW, Chrysler, Hyundai, Lexus, Porsche and Toyota are the brands with the
fewest defects and malfunctions. Brands with the fewest design problems include GMC, Hyundai,
Jaguar, Lexus, Nissan, & Porsche. For most suppliers, the prices and specifications of their competitors’
models emerged as the most prominent factors in setting their RRP (SSTI, 2000), but price cuts are
quickly matched by rivals, and this is demonstrated by the low profitability of the industry. Advertising
battles are frequent, especially on the TV and Internet.
7.0 CONCLUSION & RECOMMENDATIONS
The UK car market is one of the most fiercely competitive in the world. There are several big players
with DaimlerChrysler, Ford Motor Company, General Motors Corporation and Toyota all having
revenues of around $180m to US$190m per annum which gives them momentum in an ever-changing
car market. Sometimes it’s difficult for these large companies to respond quickly to changing markets,
although Toyota seems to be more adept at doing so well despite production lines working at high
efficiency and capacity. The smaller Japanese players such as Honda and Nissan have demonstrated
their willingness and ability to lead the way in certain technologies (especially engines) and concepts,
and are also either market leaders or very quick in spotting gaps or market trends. BMW is lauded as a
quality carmaker and has shown that it can compete with fewest defects or malfunctions, despite having
A REPORT INTO COMPETITION FOR NEW ENTRANTS IN THE UK MOTOR CAR INDUSTRY
PAGE 26 OF 41
a relatively small R&D budget. VW is able to respond quickly to changing market demand with its
flexible product lines, and is well placed for technology transfer and sharing of expertise.
As a minimum, any potential market entrant should take the following steps into account:
• Examine market segments (characteristic worthy of marketing focus) in detail
• Develop realistic and attainable marketing strategy, including goals and objectives
• Identify and anticipate competitors who serve the segment/s
• Allocate sufficient resources to the task
• Ensure that there is management focus
• Prepare a basis for defining new target market (focus for company’s offering)
• Prepare a basis for choice of target market (positioning)
It is anticipated that this will include the following:
• Research potential competitors thoroughly
• Understand competitors’ SWOT
• Try to understand the influences of Porter’s Five Forces Model23
• Try to predict or understand how competitors might respond, and whether they are able to
• Try to pick an area where potential competitors are least ready, enthusiastic or uncomfortable about
competition and where they may be most vulnerable
• Try to find a strategy involving a competitor moving into an area which is uncomfortable for them
given current circumstances – past legacies and current strategies could affect whether and how a
competitor might react
• The amount and proportion of R&D funding invested by competitors may be indicative of their
ability to respond with new products, but this notion is far from clear cut, as indicated by the
difference between Ford and Toyota
• Minimise time between product development and its release to the market, but ensure that product
quality isn’t overly compromised in doing so
• Ensure that the vehicle being introduced is sufficiently differentiated
23 Porter’s Five Forces model can be difficult to implement, particulary when considering power of suppliers, because of the
commercial sensitivity of the information required.
A REPORT INTO COMPETITION FOR NEW ENTRANTS IN THE UK MOTOR CAR INDUSTRY
PAGE 27 OF 41
8.0 REFERENCES
Note: For other useful references including car manufacturer’s websites, refer Appendix A11.
AROQ Ltd Limited www.AROQ Ltd.com (www.just-auto.com) Global automotive research source
AROQ Ltd (Feb’06) “Chapter 6: SWOT analysis. (BMW AG 2006 company profile edition 1)”
AROQ Ltd (Mar’06) “Ch 6: SWOT analysis. (Citroen 2006 Company profile edition 1)”
AROQ Ltd (April ’05) “Ch 6: SWOT analysis. (Daimler Chrysler: 2005 company profile edition 1)”
AROQ Ltd (June’06) “Ch 6: SWOT analysis. (Fiat SpA 2006 Company profile edition 2)”
AROQ Ltd (Dec’05) “Ch 6: SWOT analysis. (Ford Motor Company: 2005 company profile ed 3)”
AROQ Ltd (Mar ’06) “Ch 6: SWOT analysis. (Ford 2006: company profile edition 1)”
AROQ Ltd (May’06) “Ch 6: SWOT analysis. (GMC 2006 Company profile edition 1)”
AROQ Ltd (Dec’05) “Ch 6: SWOT analysis. (Honda Motor Co Ltd.: 2005 Company profile edition 3)”
AROQ Ltd (Dec’05) “Ch 6: SWOT analysis. (Nissan Motor Co Ltd: 2005 company profile edition 3)”
AROQ Ltd (May‘06) “Ch 6: SWOT analysis. (PSA Peugeot Citroen 2006 Company profile edition 1)”
AROQ Ltd (May’06) “Ch 6: SWOT analysis. (Renault SA 2006 company profile edition 1)”
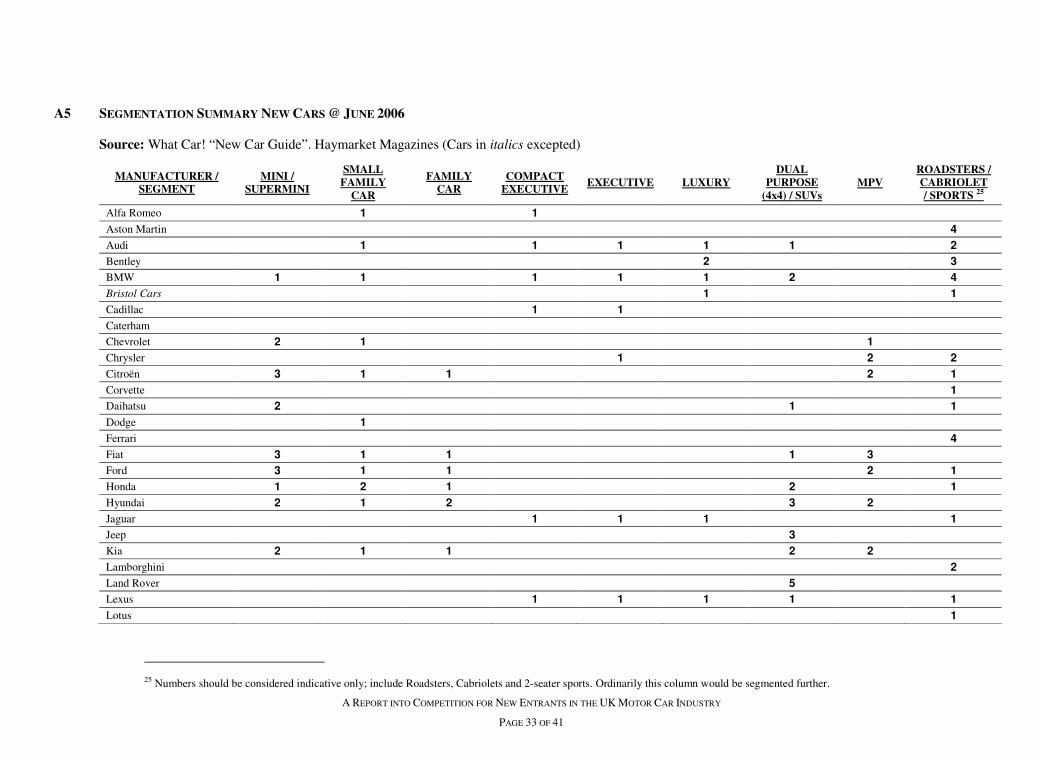
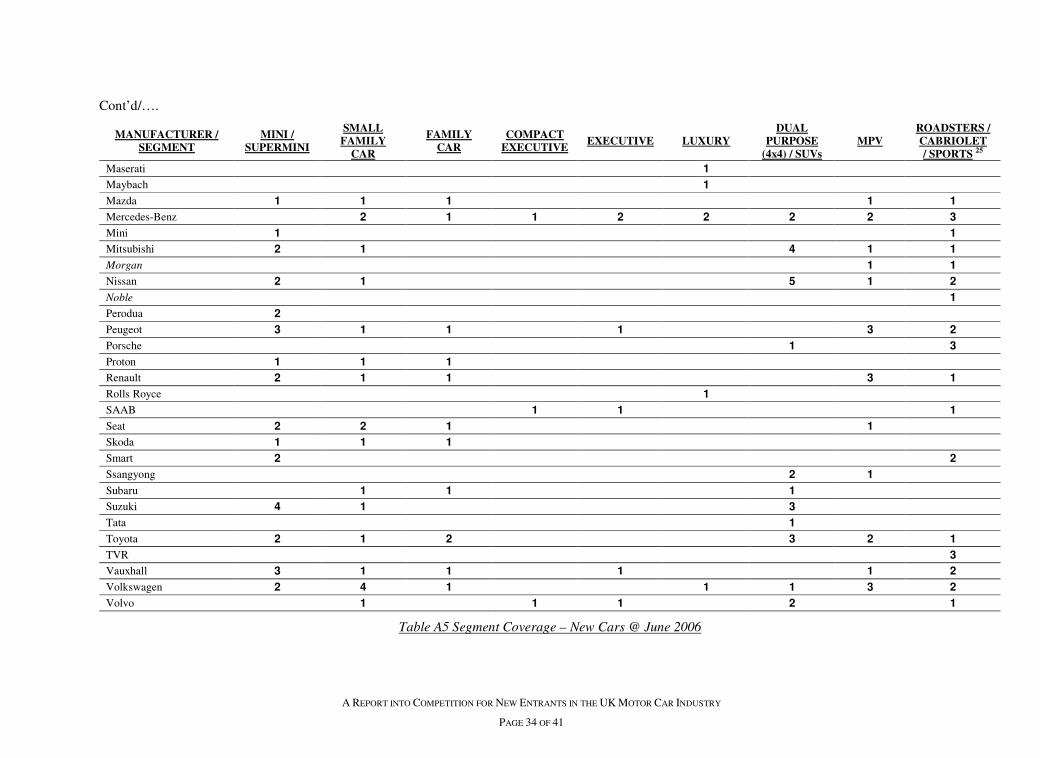
AROQ Ltd (May’06) “Ch 6: SWOT analysis. (Toyota Motor Corporation 2006 Company profile ed 1)
AROQ Ltd (May’06) “Ch 6: SWOT analysis. (Volkswagen AG 2006 company profile edition 1)”
AROQ Ltd (May’06) “Ch 6: SWOT analysis. (Volvo Car Corporation 2006 Company profile ed 1)”
Bellis, M. (June 2006) http://inventors.about.com/library/inventors/blcar.htm
BMW Annual Report (2005):
http://www.bmwgroup.com/bmwgroup_prod/e/0_0_www_bmwgroup_com/investor_relations/finanzbe
richte/geschaeftsberichte/2005/_pdf/gb2005_gesamt.pdf
British International Motor Show (2006) (www.britishmotorshow.com)
Brown, S. (July 2005) “An analysis of the top global automotive manufacturing platforms” www.just-
auto.com
Car Magazine www.carmagazine.co.uk (EMAP Automotive Ltd)
Citroën UK www.citroen.co.uk
DaimlerChrysler (2006) Annual Report (2005):
http://reports.equitystory.com/daimler/gb2005/pdf/en/DC_GB05_E_complete.pdf
DTI-AU (2004) “2004 Submission to the House of Commons Trade and Industry Committee - The UK
Automotive Motor Trade sector” DTI
Eckford, A. (Nov 2005) “Automotive companies click with internet ads.” Auto Trader Issue 13 Nov 05.
Ford Motor Company Annual Report (2005):
http://www.ford.com/NR/rdonlyres/emwjt42turmgvsborq7bqproy43vwvnf4cztbl56l4oos4sf545rswt6jd
h3gap4juvgevydld4g43xxky6y5znoote/2005_AR_full.pdf
General Motors Corporation Annual Report (2005):
http://www.gm.com/company/investor_information/docs/fin_data/gm05ar/download/gm05ar.pdf
A REPORT INTO COMPETITION FOR NEW ENTRANTS IN THE UK MOTOR CAR INDUSTRY
PAGE 28 OF 41
Green, Gavin (11 Oct 05). “Where does Mercedes go from here?” The Independent Newspaper
Honda Annual Report (2005): http://world.honda.com/investors/annualreport/2005/pdf/ar2005.pdf
J.D.Power Associates (2006) “Initial Quality Study SM” www.jdpower.com
Jobber, D. (2004) “Principles and Practices of Marketing” 4th Edition McGraw-Hill International
Isodore, C. (Jan 2006) “GM, Ford woes could bite Chrysler next”. www.CNNMoney.com
Kotler, P. (1984) “Design: A powerful but neglected strategy tool”. Journal of Business Strategy
(Autumn Edition)
Kotler, P. & Keller, K (2006) “Marketing Management 12e“ Pearson Prentice Hall
Mackintosh, J. (Sept 06). “Car buyers switch to hybrids as fuel costs rise.” FT Newspaper 15 Sept 06.
Nissan Motor Company Annual Report (2005):
http://www.nissan-global.com/EN/DOCUMENT/PDF/AR/2005/AR05_e_all.pdf
OICA (2006) http://www.oica.net/htdocs/shows/Shows_2005-2006.htm
Parkers (Oct 2006) “Car Price Guide” EMAP Automotive & www.parkers.co.uk
Porter M.E. (1980) “Competitive Strategy: Techniques for Analysing Industries and Competitors”, New
York Free Press.
PSA Peugeot-Citroen Annual Report (2005):
http://www.psa-peugeot-citroen.com/document/publication/annual_report_20051151075591.pdf
Renault Annual Report (2005):
http://www.renault.com/renault_com/en/images/Renault%20Annual%20Report%202005%20%20EN%
20290306%20V3_tcm1120-353236.pdf
SMMT (June 2006) www.SMMT.co.uk
SSTI (Mar 2000). “A Report on the supply of new motor cars with the UK” Competition Commission
Top Gear Magazine (Oct 2006) www.topgear.com BBC Magazines
Toyota Annual Report (2005): http://www.toyota.co.jp/en/ir/library/annual/pdf/2005/ar05_e.pdf
Trudeau, K. (1997). ”Mega Memory: How to Release Your Superpower Memory in 30 Minutes or Less
a Day” William Morrow (Paperback)
Volkswagen AG Annual Report (2005):
http://gb.volkswagen.de/fileadmin/g_bericht/pdf/en/Gbericht_2005_en.pdf
What Car? (July 2006) www.whatcar.co.uk Haymarket Motoring
Which? (04 Aug 2005) “Ford promoted, Mercedes drops into relegation zone” Corporate Press Release
A REPORT INTO COMPETITION FOR NEW ENTRANTS IN THE UK MOTOR CAR INDUSTRY
PAGE 29 OF 41
A1 THE HISTORY OF THE MOTOR CAR
A history of the Motor Car may be obtained at the following link. Although interesting, this article runs
into over 16 A4 pages, it has been omitted for brevity.
Ref: http://inventors.about.com/library/inventors/blcar.htm Bellis, M. (June 2006)
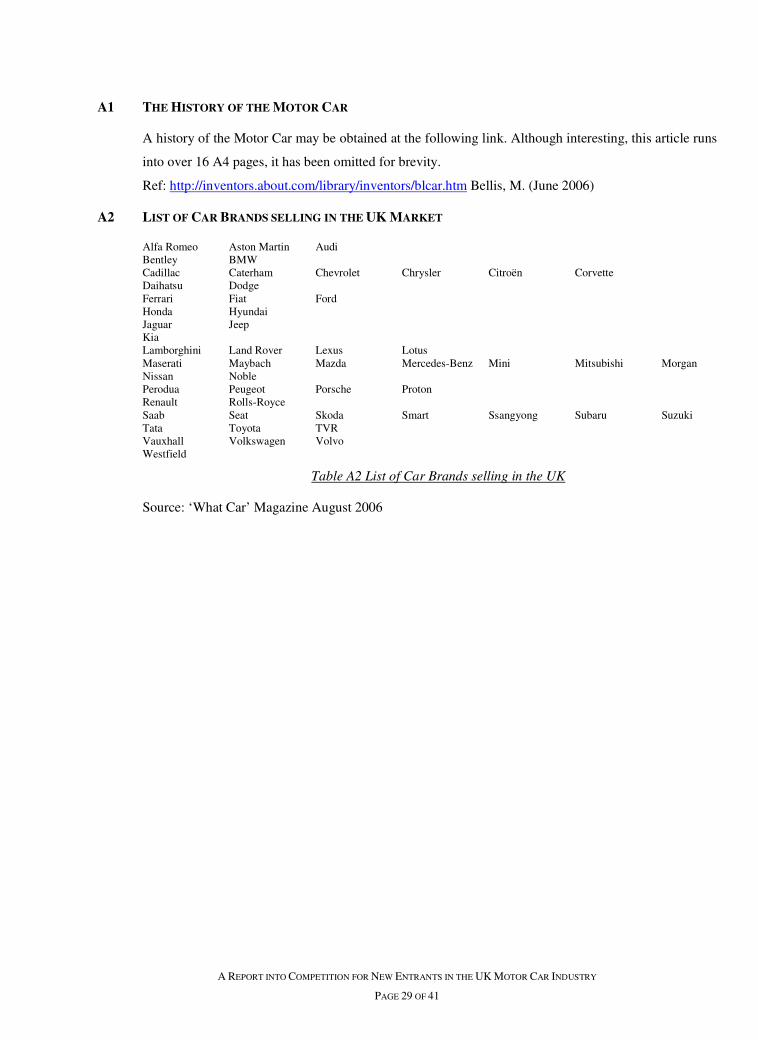
A2 LIST OF CAR BRANDS SELLING IN THE UK MARKET
Alfa Romeo Aston Martin Audi Bentley BMW Cadillac Caterham Chevrolet Chrysler Citroën Corvette Daihatsu Dodge Ferrari Fiat Ford Honda Hyundai Jaguar Jeep Kia Lamborghini Land Rover Lexus Lotus Maserati Maybach Mazda Mercedes-Benz Mini Mitsubishi Morgan Nissan Noble Perodua Peugeot Porsche Proton Renault Rolls-Royce Saab Seat Skoda Smart Ssangyong Subaru Suzuki Tata Toyota TVR Vauxhall Volkswagen Volvo Westfield
Table A2 List of Car Brands selling in the UK
Source: ‘What Car’ Magazine August 2006
A REPORT INTO COMPETITION FOR NEW ENTRANTS IN THE UK MOTOR CAR INDUSTRY
PAGE 30 OF 41
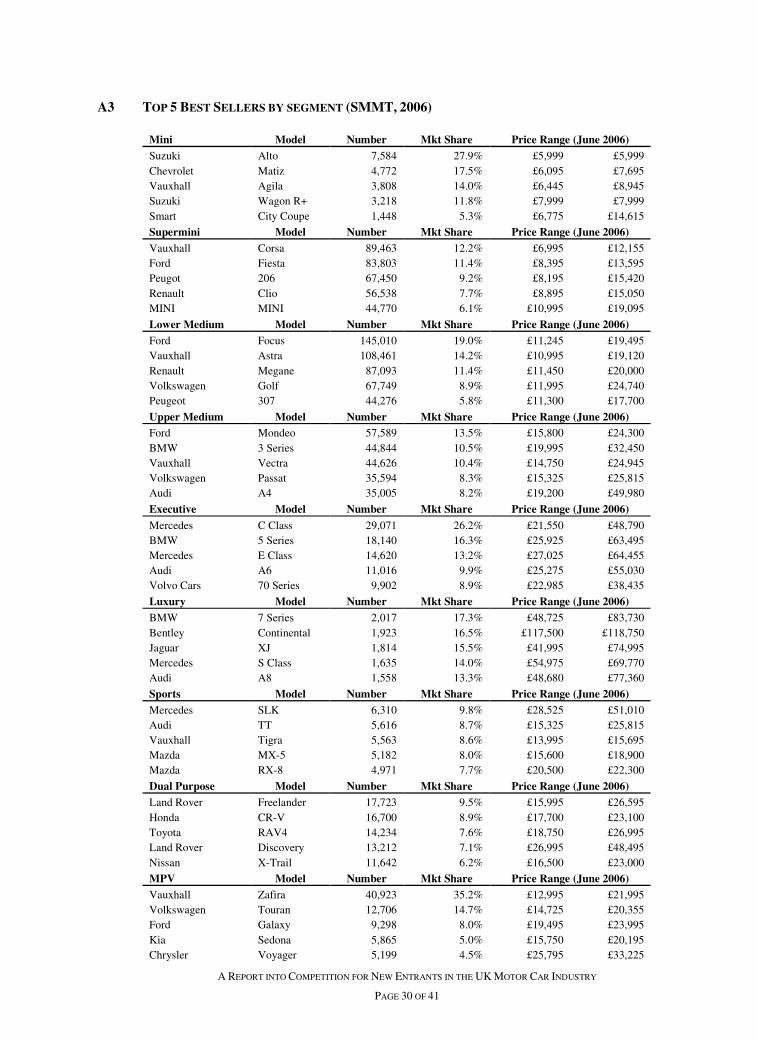
A3 TOP 5 BEST SELLERS BY SEGMENT (SMMT, 2006)
Mini Model Number Mkt Share Price Range (June 2006)
Suzuki Alto 7,584 27.9% £5,999 £5,999 Chevrolet Matiz 4,772 17.5% £6,095 £7,695 Vauxhall Agila 3,808 14.0% £6,445 £8,945 Suzuki Wagon R+ 3,218 11.8% £7,999 £7,999 Smart City Coupe 1,448 5.3% £6,775 £14,615
Supermini Model Number Mkt Share Price Range (June 2006)
Vauxhall Corsa 89,463 12.2% £6,995 £12,155 Ford Fiesta 83,803 11.4% £8,395 £13,595 Peugot 206 67,450 9.2% £8,195 £15,420 Renault Clio 56,538 7.7% £8,895 £15,050 MINI MINI 44,770 6.1% £10,995 £19,095
Lower Medium Model Number Mkt Share Price Range (June 2006)
Ford Focus 145,010 19.0% £11,245 £19,495 Vauxhall Astra 108,461 14.2% £10,995 £19,120 Renault Megane 87,093 11.4% £11,450 £20,000 Volkswagen Golf 67,749 8.9% £11,995 £24,740 Peugeot 307 44,276 5.8% £11,300 £17,700
Upper Medium Model Number Mkt Share Price Range (June 2006)
Ford Mondeo 57,589 13.5% £15,800 £24,300 BMW 3 Series 44,844 10.5% £19,995 £32,450 Vauxhall Vectra 44,626 10.4% £14,750 £24,945 Volkswagen Passat 35,594 8.3% £15,325 £25,815 Audi A4 35,005 8.2% £19,200 £49,980
Executive Model Number Mkt Share Price Range (June 2006)
Mercedes C Class 29,071 26.2% £21,550 £48,790 BMW 5 Series 18,140 16.3% £25,925 £63,495 Mercedes E Class 14,620 13.2% £27,025 £64,455 Audi A6 11,016 9.9% £25,275 £55,030 Volvo Cars 70 Series 9,902 8.9% £22,985 £38,435
Luxury Model Number Mkt Share Price Range (June 2006)
BMW 7 Series 2,017 17.3% £48,725 £83,730 Bentley Continental 1,923 16.5% £117,500 £118,750 Jaguar XJ 1,814 15.5% £41,995 £74,995 Mercedes S Class 1,635 14.0% £54,975 £69,770 Audi A8 1,558 13.3% £48,680 £77,360
Sports Model Number Mkt Share Price Range (June 2006)
Mercedes SLK 6,310 9.8% £28,525 £51,010 Audi TT 5,616 8.7% £15,325 £25,815 Vauxhall Tigra 5,563 8.6% £13,995 £15,695 Mazda MX-5 5,182 8.0% £15,600 £18,900 Mazda RX-8 4,971 7.7% £20,500 £22,300
Dual Purpose Model Number Mkt Share Price Range (June 2006)
Land Rover Freelander 17,723 9.5% £15,995 £26,595 Honda CR-V 16,700 8.9% £17,700 £23,100 Toyota RAV4 14,234 7.6% £18,750 £26,995 Land Rover Discovery 13,212 7.1% £26,995 £48,495 Nissan X-Trail 11,642 6.2% £16,500 £23,000
MPV Model Number Mkt Share Price Range (June 2006)
Vauxhall Zafira 40,923 35.2% £12,995 £21,995 Volkswagen Touran 12,706 14.7% £14,725 £20,355 Ford Galaxy 9,298 8.0% £19,495 £23,995 Kia Sedona 5,865 5.0% £15,750 £20,195 Chrysler Voyager 5,199 4.5% £25,795 £33,225
A REPORT INTO COMPETITION FOR NEW ENTRANTS IN THE UK MOTOR CAR INDUSTRY
PAGE 31 OF 41
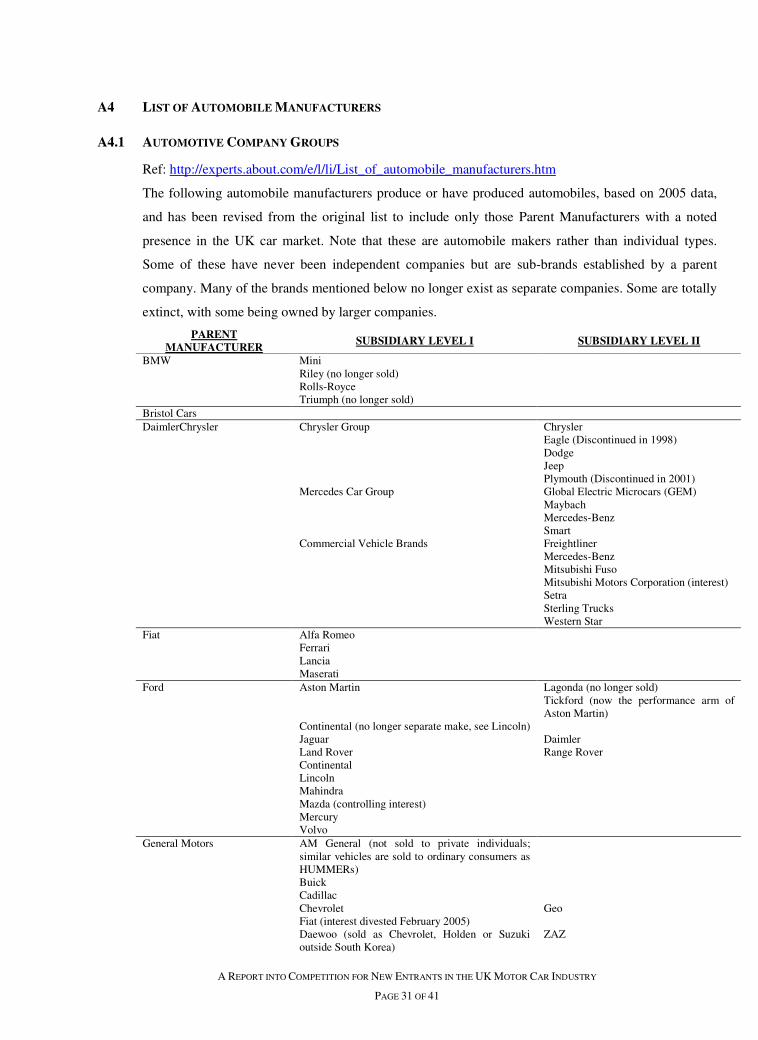
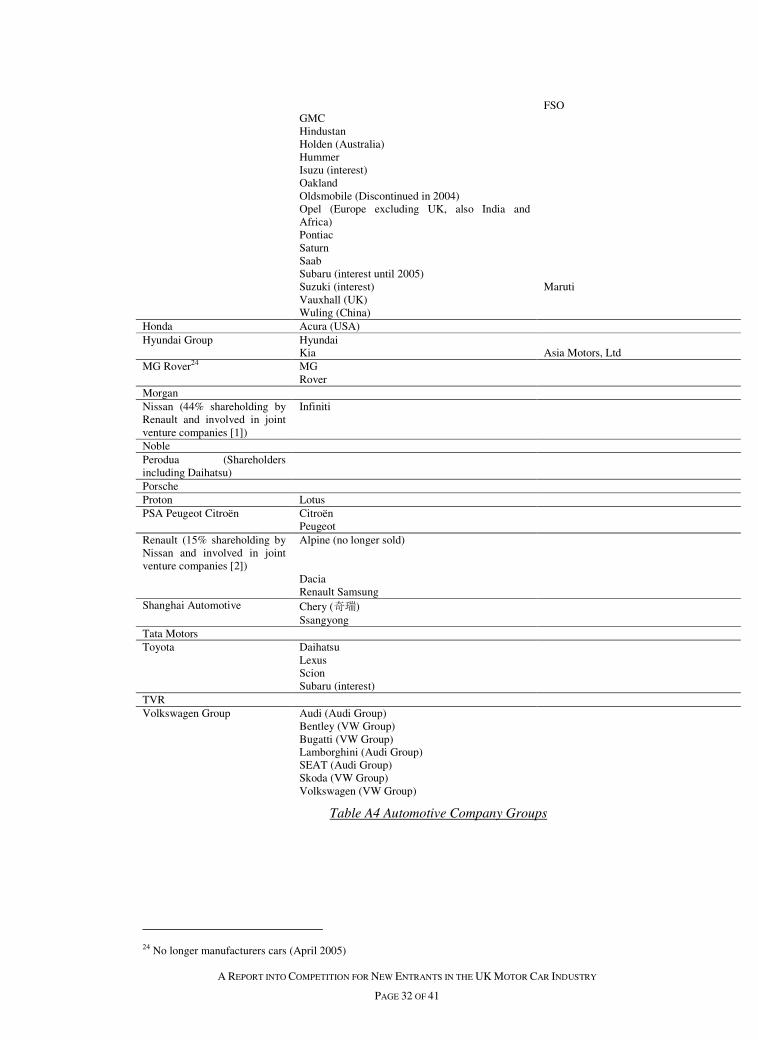
A4 LIST OF AUTOMOBILE MANUFACTURERS
A4.1 AUTOMOTIVE COMPANY GROUPS
Ref: http://experts.about.com/e/l/li/List_of_automobile_manufacturers.htm
The following automobile manufacturers produce or have produced automobiles, based on 2005 data,
and has been revised from the original list to include only those Parent Manufacturers with a noted
presence in the UK car market. Note that these are automobile makers rather than individual types.
Some of these have never been independent companies but are sub-brands established by a parent
company. Many of the brands mentioned below no longer exist as separate companies. Some are totally
extinct, with some being owned by larger companies.
PARENT MANUFACTURER
SUBSIDIARY LEVEL I SUBSIDIARY LEVEL II
BMW Mini Riley (no longer sold) Rolls-Royce Triumph (no longer sold) Bristol Cars DaimlerChrysler Chrysler Group Chrysler Eagle (Discontinued in 1998) Dodge Jeep Plymouth (Discontinued in 2001) Mercedes Car Group Global Electric Microcars (GEM) Maybach Mercedes-Benz Smart Commercial Vehicle Brands Freightliner Mercedes-Benz Mitsubishi Fuso Mitsubishi Motors Corporation (interest) Setra Sterling Trucks Western Star Fiat Alfa Romeo Ferrari Lancia Maserati Ford Aston Martin Lagonda (no longer sold) Tickford (now the performance arm of
Aston Martin) Continental (no longer separate make, see Lincoln) Jaguar Daimler Land Rover Range Rover Continental Lincoln Mahindra Mazda (controlling interest) Mercury Volvo General Motors AM General (not sold to private individuals;
similar vehicles are sold to ordinary consumers as HUMMERs)
Buick Cadillac Chevrolet Geo Fiat (interest divested February 2005) Daewoo (sold as Chevrolet, Holden or Suzuki
outside South Korea) ZAZ
A REPORT INTO COMPETITION FOR NEW ENTRANTS IN THE UK MOTOR CAR INDUSTRY
PAGE 32 OF 41
FSO GMC Hindustan Holden (Australia) Hummer Isuzu (interest) Oakland Oldsmobile (Discontinued in 2004) Opel (Europe excluding UK, also India and
Africa)
Pontiac Saturn Saab Subaru (interest until 2005) Suzuki (interest) Maruti Vauxhall (UK) Wuling (China) Honda Acura (USA) Hyundai Group Hyundai Kia Asia Motors, Ltd MG Rover24 MG Rover Morgan Nissan (44% shareholding by Renault and involved in joint venture companies [1])
Infiniti
Noble Perodua (Shareholders including Daihatsu)
Porsche Proton Lotus PSA Peugeot Citroën Citroën Peugeot Renault (15% shareholding by Nissan and involved in joint venture companies [2])
Alpine (no longer sold)
Dacia Renault Samsung Shanghai Automotive Chery (奇瑞) Ssangyong Tata Motors Toyota Daihatsu Lexus Scion Subaru (interest) TVR Volkswagen Group Audi (Audi Group) Bentley (VW Group) Bugatti (VW Group) Lamborghini (Audi Group) SEAT (Audi Group) Skoda (VW Group) Volkswagen (VW Group)
Table A4 Automotive Company Groups
24 No longer manufacturers cars (April 2005)
A REPORT INTO COMPETITION FOR NEW ENTRANTS IN THE UK MOTOR CAR INDUSTRY
PAGE 33 OF 41
A5 SEGMENTATION SUMMARY NEW CARS @ JUNE 2006
Source: What Car! “New Car Guide”. Haymarket Magazines (Cars in italics excepted)
MANUFACTURER / SEGMENT
MINI / SUPERMINI
SMALL FAMILY
CAR
FAMILY CAR
COMPACT EXECUTIVE
EXECUTIVE LUXURY DUAL
PURPOSE (4x4) / SUVs
MPV ROADSTERS / CABRIOLET / SPORTS 25
Alfa Romeo 1 1
Aston Martin 4
Audi 1 1 1 1 1 2
Bentley 2 3
BMW 1 1 1 1 1 2 4
Bristol Cars 1 1
Cadillac 1 1
Caterham
Chevrolet 2 1 1
Chrysler 1 2 2
Citroën 3 1 1 2 1
Corvette 1
Daihatsu 2 1 1
Dodge 1
Ferrari 4
Fiat 3 1 1 1 3
Ford 3 1 1 2 1
Honda 1 2 1 2 1
Hyundai 2 1 2 3 2
Jaguar 1 1 1 1
Jeep 3
Kia 2 1 1 2 2
Lamborghini 2
Land Rover 5
Lexus 1 1 1 1 1
Lotus 1
25 Numbers should be considered indicative only; include Roadsters, Cabriolets and 2-seater sports. Ordinarily this column would be segmented further.
A REPORT INTO COMPETITION FOR NEW ENTRANTS IN THE UK MOTOR CAR INDUSTRY
PAGE 34 OF 41
Cont’d/….
MANUFACTURER / SEGMENT
MINI / SUPERMINI
SMALL FAMILY
CAR
FAMILY CAR
COMPACT EXECUTIVE
EXECUTIVE LUXURY DUAL
PURPOSE (4x4) / SUVs
MPV ROADSTERS / CABRIOLET / SPORTS 25
Maserati 1
Maybach 1
Mazda 1 1 1 1 1
Mercedes-Benz 2 1 1 2 2 2 2 3
Mini 1 1
Mitsubishi 2 1 4 1 1
Morgan 1 1
Nissan 2 1 5 1 2
Noble 1
Perodua 2
Peugeot 3 1 1 1 3 2
Porsche 1 3
Proton 1 1 1
Renault 2 1 1 3 1
Rolls Royce 1
SAAB 1 1 1
Seat 2 2 1 1
Skoda 1 1 1
Smart 2 2
Ssangyong 2 1
Subaru 1 1 1
Suzuki 4 1 3
Tata 1
Toyota 2 1 2 3 2 1
TVR 3
Vauxhall 3 1 1 1 1 2
Volkswagen 2 4 1 1 1 3 2
Volvo 1 1 1 2 1
Table A5 Segment Coverage – New Cars @ June 2006
A REPORT INTO COMPETITION FOR NEW ENTRANTS IN THE UK MOTOR CAR INDUSTRY
PAGE 35 OF 41
A6 PROMOTION
There are four principle reasons for car manufacturer product promotion:
• To raise product awareness to potential customers
• To remind customers about it’s products
• To persuade customers to switch from rival manufacturers
• To improve and maintain the image of the company
Various authors including Kotler & Keller (2006) give advantages and limitations of major media
types.
A REPORT INTO COMPETITION FOR NEW ENTRANTS IN THE UK MOTOR CAR INDUSTRY
PAGE 36 OF 41
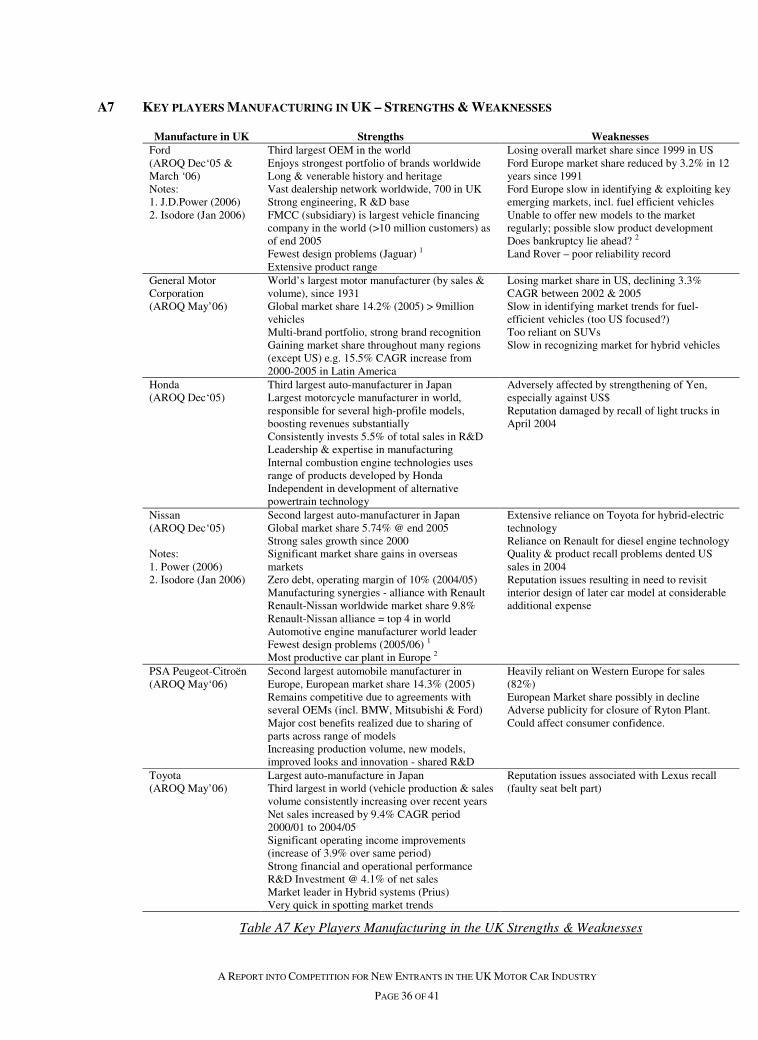
A7 KEY PLAYERS MANUFACTURING IN UK – STRENGTHS & WEAKNESSES
Manufacture in UK Strengths Weaknesses Ford (AROQ Dec‘05 & March ‘06) Notes: 1. J.D.Power (2006) 2. Isodore (Jan 2006)
Third largest OEM in the world Enjoys strongest portfolio of brands worldwide Long & venerable history and heritage Vast dealership network worldwide, 700 in UK Strong engineering, R &D base FMCC (subsidiary) is largest vehicle financing company in the world (>10 million customers) as of end 2005 Fewest design problems (Jaguar) 1 Extensive product range
Losing overall market share since 1999 in US Ford Europe market share reduced by 3.2% in 12 years since 1991 Ford Europe slow in identifying & exploiting key emerging markets, incl. fuel efficient vehicles Unable to offer new models to the market regularly; possible slow product development Does bankruptcy lie ahead? 2 Land Rover – poor reliability record
General Motor Corporation (AROQ May’06)
World’s largest motor manufacturer (by sales & volume), since 1931 Global market share 14.2% (2005) > 9million vehicles Multi-brand portfolio, strong brand recognition Gaining market share throughout many regions (except US) e.g. 15.5% CAGR increase from 2000-2005 in Latin America
Losing market share in US, declining 3.3% CAGR between 2002 & 2005 Slow in identifying market trends for fuel-efficient vehicles (too US focused?) Too reliant on SUVs Slow in recognizing market for hybrid vehicles
Honda (AROQ Dec‘05)
Third largest auto-manufacturer in Japan Largest motorcycle manufacturer in world, responsible for several high-profile models, boosting revenues substantially Consistently invests 5.5% of total sales in R&D Leadership & expertise in manufacturing Internal combustion engine technologies uses range of products developed by Honda Independent in development of alternative powertrain technology
Adversely affected by strengthening of Yen, especially against US$ Reputation damaged by recall of light trucks in April 2004
Nissan (AROQ Dec‘05) Notes: 1. Power (2006) 2. Isodore (Jan 2006)
Second largest auto-manufacturer in Japan Global market share 5.74% @ end 2005 Strong sales growth since 2000 Significant market share gains in overseas markets Zero debt, operating margin of 10% (2004/05) Manufacturing synergies - alliance with Renault Renault-Nissan worldwide market share 9.8% Renault-Nissan alliance = top 4 in world Automotive engine manufacturer world leader Fewest design problems (2005/06) 1 Most productive car plant in Europe 2
Extensive reliance on Toyota for hybrid-electric technology Reliance on Renault for diesel engine technology Quality & product recall problems dented US sales in 2004 Reputation issues resulting in need to revisit interior design of later car model at considerable additional expense
PSA Peugeot-Citroën (AROQ May‘06)
Second largest automobile manufacturer in Europe, European market share 14.3% (2005) Remains competitive due to agreements with several OEMs (incl. BMW, Mitsubishi & Ford) Major cost benefits realized due to sharing of parts across range of models Increasing production volume, new models, improved looks and innovation - shared R&D
Heavily reliant on Western Europe for sales (82%) European Market share possibly in decline Adverse publicity for closure of Ryton Plant. Could affect consumer confidence.
Toyota (AROQ May’06)
Largest auto-manufacture in Japan Third largest in world (vehicle production & sales volume consistently increasing over recent years Net sales increased by 9.4% CAGR period 2000/01 to 2004/05 Significant operating income improvements (increase of 3.9% over same period) Strong financial and operational performance R&D Investment @ 4.1% of net sales Market leader in Hybrid systems (Prius) Very quick in spotting market trends
Reputation issues associated with Lexus recall (faulty seat belt part)
Table A7 Key Players Manufacturing in the UK Strengths & Weaknesses
A REPORT INTO COMPETITION FOR NEW ENTRANTS IN THE UK MOTOR CAR INDUSTRY
PAGE 37 OF 41
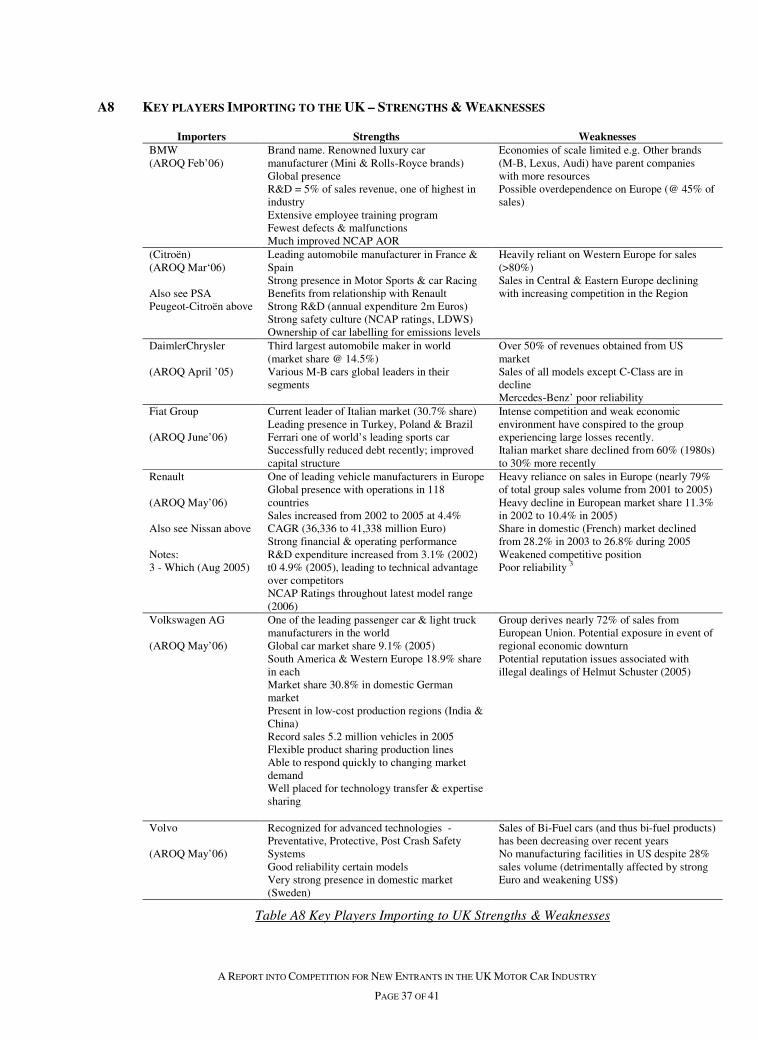
A8 KEY PLAYERS IMPORTING TO THE UK – STRENGTHS & WEAKNESSES
Importers Strengths Weaknesses BMW (AROQ Feb’06)
Brand name. Renowned luxury car manufacturer (Mini & Rolls-Royce brands) Global presence R&D = 5% of sales revenue, one of highest in industry Extensive employee training program Fewest defects & malfunctions Much improved NCAP AOR
Economies of scale limited e.g. Other brands (M-B, Lexus, Audi) have parent companies with more resources Possible overdependence on Europe (@ 45% of sales)
(Citroën) (AROQ Mar‘06) Also see PSA Peugeot-Citroën above
Leading automobile manufacturer in France & Spain Strong presence in Motor Sports & car Racing Benefits from relationship with Renault Strong R&D (annual expenditure 2m Euros) Strong safety culture (NCAP ratings, LDWS) Ownership of car labelling for emissions levels
Heavily reliant on Western Europe for sales (>80%) Sales in Central & Eastern Europe declining with increasing competition in the Region
DaimlerChrysler (AROQ April ’05)
Third largest automobile maker in world (market share @ 14.5%) Various M-B cars global leaders in their segments
Over 50% of revenues obtained from US market Sales of all models except C-Class are in decline Mercedes-Benz’ poor reliability
Fiat Group (AROQ June’06)
Current leader of Italian market (30.7% share) Leading presence in Turkey, Poland & Brazil Ferrari one of world’s leading sports car Successfully reduced debt recently; improved capital structure
Intense competition and weak economic environment have conspired to the group experiencing large losses recently. Italian market share declined from 60% (1980s) to 30% more recently
Renault (AROQ May’06) Also see Nissan above Notes: 3 - Which (Aug 2005)
One of leading vehicle manufacturers in Europe Global presence with operations in 118 countries Sales increased from 2002 to 2005 at 4.4% CAGR (36,336 to 41,338 million Euro) Strong financial & operating performance R&D expenditure increased from 3.1% (2002) t0 4.9% (2005), leading to technical advantage over competitors NCAP Ratings throughout latest model range (2006)
Heavy reliance on sales in Europe (nearly 79% of total group sales volume from 2001 to 2005) Heavy decline in European market share 11.3% in 2002 to 10.4% in 2005) Share in domestic (French) market declined from 28.2% in 2003 to 26.8% during 2005 Weakened competitive position Poor reliability 3
Volkswagen AG (AROQ May’06)
One of the leading passenger car & light truck manufacturers in the world Global car market share 9.1% (2005) South America & Western Europe 18.9% share in each Market share 30.8% in domestic German market Present in low-cost production regions (India & China) Record sales 5.2 million vehicles in 2005 Flexible product sharing production lines Able to respond quickly to changing market demand Well placed for technology transfer & expertise sharing
Group derives nearly 72% of sales from European Union. Potential exposure in event of regional economic downturn Potential reputation issues associated with illegal dealings of Helmut Schuster (2005)
Volvo (AROQ May’06)
Recognized for advanced technologies - Preventative, Protective, Post Crash Safety Systems Good reliability certain models Very strong presence in domestic market (Sweden)
Sales of Bi-Fuel cars (and thus bi-fuel products) has been decreasing over recent years No manufacturing facilities in US despite 28% sales volume (detrimentally affected by strong Euro and weakening US$)
Table A8 Key Players Importing to UK Strengths & Weaknesses
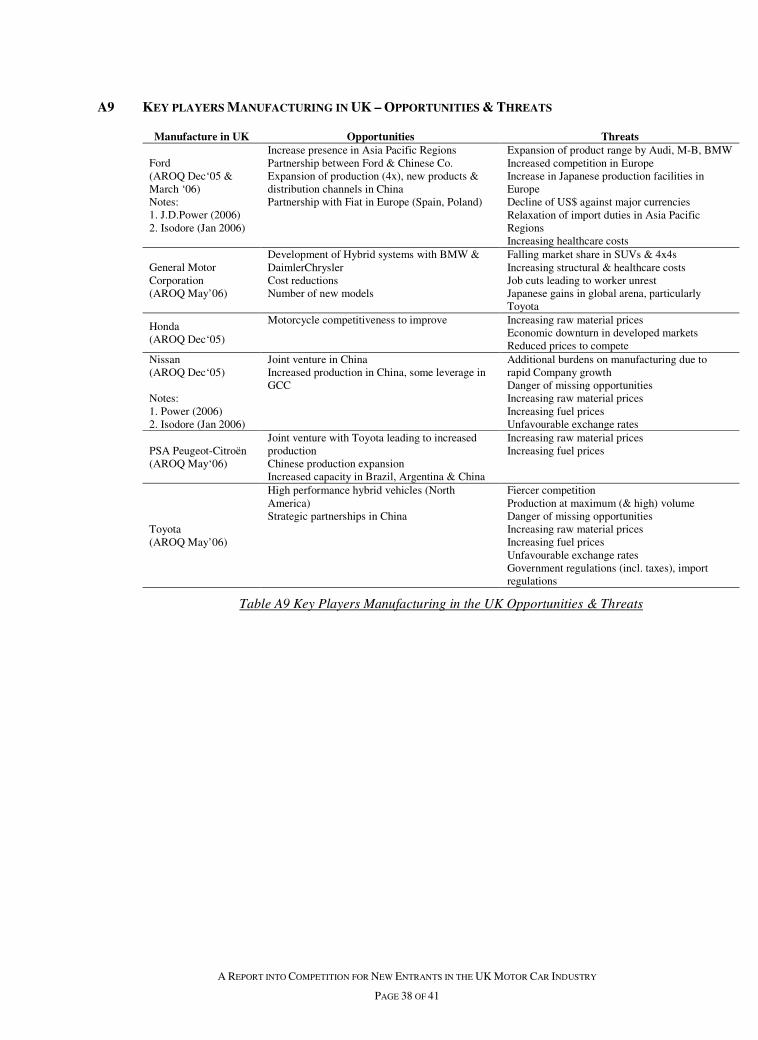
A REPORT INTO COMPETITION FOR NEW ENTRANTS IN THE UK MOTOR CAR INDUSTRY
PAGE 38 OF 41
A9 KEY PLAYERS MANUFACTURING IN UK – OPPORTUNITIES & THREATS
Manufacture in UK Opportunities Threats
Ford (AROQ Dec‘05 & March ‘06) Notes: 1. J.D.Power (2006) 2. Isodore (Jan 2006)
Increase presence in Asia Pacific Regions Partnership between Ford & Chinese Co. Expansion of production (4x), new products & distribution channels in China Partnership with Fiat in Europe (Spain, Poland)
Expansion of product range by Audi, M-B, BMW Increased competition in Europe Increase in Japanese production facilities in Europe Decline of US$ against major currencies Relaxation of import duties in Asia Pacific Regions Increasing healthcare costs
General Motor Corporation (AROQ May’06)
Development of Hybrid systems with BMW & DaimlerChrysler Cost reductions Number of new models
Falling market share in SUVs & 4x4s Increasing structural & healthcare costs Job cuts leading to worker unrest Japanese gains in global arena, particularly Toyota
Honda (AROQ Dec‘05)
Motorcycle competitiveness to improve Increasing raw material prices Economic downturn in developed markets Reduced prices to compete
Nissan (AROQ Dec‘05) Notes: 1. Power (2006) 2. Isodore (Jan 2006)
Joint venture in China Increased production in China, some leverage in GCC
Additional burdens on manufacturing due to rapid Company growth Danger of missing opportunities Increasing raw material prices Increasing fuel prices Unfavourable exchange rates
PSA Peugeot-Citroën (AROQ May‘06)
Joint venture with Toyota leading to increased production Chinese production expansion Increased capacity in Brazil, Argentina & China
Increasing raw material prices Increasing fuel prices
Toyota (AROQ May’06)
High performance hybrid vehicles (North America) Strategic partnerships in China
Fiercer competition Production at maximum (& high) volume Danger of missing opportunities Increasing raw material prices Increasing fuel prices Unfavourable exchange rates Government regulations (incl. taxes), import regulations
Table A9 Key Players Manufacturing in the UK Opportunities & Threats
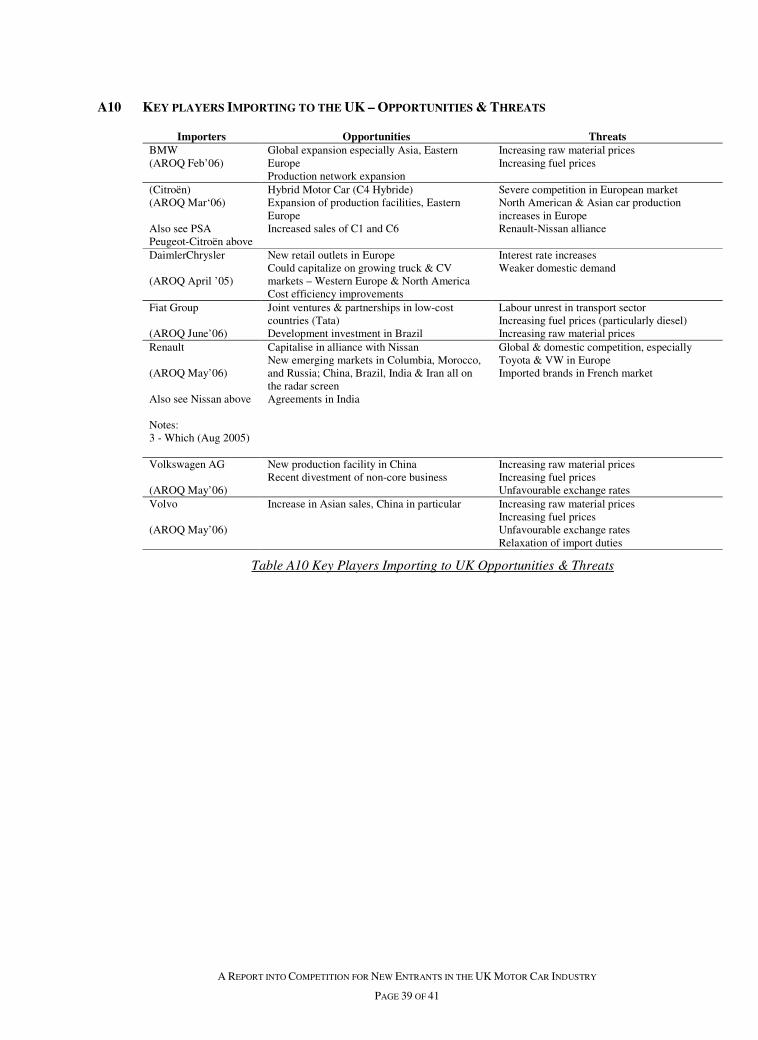
A REPORT INTO COMPETITION FOR NEW ENTRANTS IN THE UK MOTOR CAR INDUSTRY
PAGE 39 OF 41
A10 KEY PLAYERS IMPORTING TO THE UK – OPPORTUNITIES & THREATS
Importers Opportunities Threats BMW (AROQ Feb’06)
Global expansion especially Asia, Eastern Europe Production network expansion
Increasing raw material prices Increasing fuel prices
(Citroën) (AROQ Mar‘06) Also see PSA Peugeot-Citroën above
Hybrid Motor Car (C4 Hybride) Expansion of production facilities, Eastern Europe Increased sales of C1 and C6
Severe competition in European market North American & Asian car production increases in Europe Renault-Nissan alliance
DaimlerChrysler (AROQ April ’05)
New retail outlets in Europe Could capitalize on growing truck & CV markets – Western Europe & North America Cost efficiency improvements
Interest rate increases Weaker domestic demand
Fiat Group (AROQ June’06)
Joint ventures & partnerships in low-cost countries (Tata) Development investment in Brazil
Labour unrest in transport sector Increasing fuel prices (particularly diesel) Increasing raw material prices
Renault (AROQ May’06) Also see Nissan above Notes: 3 - Which (Aug 2005)
Capitalise in alliance with Nissan New emerging markets in Columbia, Morocco, and Russia; China, Brazil, India & Iran all on the radar screen Agreements in India
Global & domestic competition, especially Toyota & VW in Europe Imported brands in French market
Volkswagen AG (AROQ May’06)
New production facility in China Recent divestment of non-core business
Increasing raw material prices Increasing fuel prices Unfavourable exchange rates
Volvo (AROQ May’06)
Increase in Asian sales, China in particular Increasing raw material prices Increasing fuel prices Unfavourable exchange rates Relaxation of import duties
Table A10 Key Players Importing to UK Opportunities & Threats
A REPORT INTO COMPETITION FOR NEW ENTRANTS IN THE UK MOTOR CAR INDUSTRY
PAGE 40 OF 41
A11 OTHER USEFUL REFERENCES (WEBSITES)
All of the following website addresses have been visited as part of research for this report.
Note: Addresses primarily referenced are UK based websites, not necessarily parent company website.
AA www.theaa.com
Alfa Romeo UK www.alfaromeo.co.uk
Aston Martin UK www.astonmartin.com
Audi UK www.audi.co.uk
Audi, 2005 Annual Report, www.Audi.com
Bentley Motors UK www.bentleymotors.co.uk
BMW UK www.bmw.co.uk
Bristol Cars www.bristolcars.co.uk/BristolFighter.htm
Cadillac www.cadillac.com
Carpages (Aug 2006) http://www.carpages.co.uk/land_rover/land-rover-sales-06-01-06.asp
Carpages (Aug 2006) http://www.carpages.co.uk/mazda/mazda-sports-cars-28-01-06.asp
Caterham Cars UK www.caterham.co.uk
Chevrolet UK www.chevrolet.co.uk
Daewoo (actually GM Daewoo) www.gmdaewoo.co.kr
Daihatsu UK www.daihatsu.co.uk
DaimlerChrysler www.daimlerchrysler.com
Dodge UK www.dodge.co.uk
DTI-AU - Automotive Unit of the Department of Trade and Industry www.autoindustry.co.uk
DTI-AU (Post 2004) “Car Manufacturing in Britain” DTI www.autoindustry.co.uk/ukprofile/Cars
Ferrari Great Britain Ltd www.ferrari.co.uk
Fiat UK www.fiat.co.uk
Ford UK www.ford.co.uk
General Motors Corporation (www.gm.com)
General Motors Corporation Europe (www.gmeurope.com)
Honda UK www.honda.co.uk
Hyundai UK www.hyundai-car.co.uk
Jaguar UK www.jaguar.co.uk (www.jaguar.com worldwide website)
Jeep UK www.chryslerjeep.co.uk
Kia UK www.kia.co.uk
Lamborghini UK www.lamborghini.co.uk
Land Rover UK www.landrover.com
Lexus Europe www.lexus-europe.com
Lexus GB www.lexus.co.uk
A REPORT INTO COMPETITION FOR NEW ENTRANTS IN THE UK MOTOR CAR INDUSTRY
PAGE 41 OF 41
Lotus (Group Lotus plc) www.grouplotus.com
Maserati UK www.maserati.co.uk
Maybach www.maybach-manufaktur.com (Original website) (www.maybach.com being remodelled)
Mazda UK www.mazda.co.uk
Mercedes UK www.mercedes-benz.co.uk
Mercedes www.mercedes-benz.com
Mitsubishi Motor Cars UK www.mitsubishi-cars.co.uk
Morgan (The Morgan Motor Company) www.morgan-motor.co.uk
Nissan UK www.nissan.co.uk
Noble Automotive www.noblecars.com
Perodua UK www.perodua-uk.com
Peugeot UK www.peugeot.co.uk
Peugeot-Citroen (Aug 2006) http://www.psa-peugeot-citroen.com
Porsche www.porsche.com/uk
Proton UK www.proton.co.uk
RAC www.rac.co.uk
RAC Foundation www.racfoundation.org
Renault UK www.renault.co.uk
Renault (March 2006) www.renault.com Renault Atlas
Rolls Royce Motor Cars www.rolls-roycemotorcars.com
SAAB www.saab.com
Ssangyong UK www.syukcars.co.uk
Seat UK www.seat.co.uk
Škoda UK www.skoda.co.uk
Smart Car (The) UK www.thesmart.co.uk
Subaru UK www.subaru.co.uk
Suzuki GB www.suzuki.co.uk
Tata Motors www.tatacars.co.uk (Tata Motors Limited www.tatamotors.com)
Toyota Japan www.toyota.co.jp
Toyota UK www.toyota.co.uk
TVR www.tvr-eng.co.uk
Vauxhall UK www.vauxhall.co.uk
Volkswagen UK www.volkswagen.co.uk
Volkswagen AG www.volkswagen-ag.de/en
Volvo UK www.volvocars.co.uk
Westfield Sportscars UK http://www.westfield-sportscars.co.uk
Related Documents