„ AFOSR - TR » 7 G - 0 r ) : / *• UNIVERSITY OF NEVADA RENO - NEVAD/r - 89507 ^ Mackay School of Mines Sei smological Laboratory 05 CO ^Q ( Name of Contractor ARPA Order No. Program Code O Contract Expiration Date Ainount of Contract Dollars Contract Number Principal Investigators Program Manager Short Title of Work Report Prepared, By FINAL REPORT 10 April 1976 Telephone (702) 784-4975 2134 2F10 University of Nevada, Reno 30 November 1975 $309,291 F44620-72-C-0069 William A. Peppin, 702-784-4975 Alan Ryall, 702-784-4975 Alan Ryall, 702-784-4975 NEAR FIELD SMALL EARTHQUAKE LONG PERIOD SPECTRUM William A. Peppin a - , , : '. i 11 [7b). ' ... n C Sponsored by Advanced Research Projects Agency ARPA Order No. 2134 .-ü tTE

Welcome message from author
This document is posted to help you gain knowledge. Please leave a comment to let me know what you think about it! Share it to your friends and learn new things together.
Transcript
„ AFOSR - TR » 7 G - 0 r) : ■
/ *•
UNIVERSITY OF NEVADA RENO - NEVAD/r - 89507
^
Mackay School of Mines Sei smological Laboratory
05
CO
^Q ( Name of Contractor
ARPA Order No.
Program Code
O Contract Expiration Date
Ainount of Contract Dollars
Contract Number
Principal Investigators
Program Manager
Short Title of Work
Report Prepared, By
FINAL REPORT
10 April 1976
Telephone (702) 784-4975
2134
2F10
University of Nevada, Reno
30 November 1975
$309,291
F44620-72-C-0069
William A. Peppin, 702-784-4975 Alan Ryall, 702-784-4975
Alan Ryall, 702-784-4975
NEAR FIELD SMALL EARTHQUAKE LONG PERIOD SPECTRUM
William A. Peppin
a - , , :
'.
i
11
[7b).
'
...
n C Sponsored by
Advanced Research Projects Agency
ARPA Order No. 2134 .-ü tTE
in ii iii.iiiir..ii-<iM..iii.if. —■ ■■-■ - Ulli f Mil I mmifO- - - ..■..:.....- - -.-■^.. - —
TABLE OF CONTENTS
Introduction
I. SYSTEM DEVELOPMENT AND STATION DEPLOYMENT
A. System Development
B. Station Deployment and Data Collection
11. SIGNIFICANT RESULTS OBTAINED FROM THE NEVADA-WASHINGTON THEORY
A. Long-Period Spectral Level
ja. Explaining the Long-Period Spectrum
III. RESEARCH AT NEVADA AND EARTHQUAKE SOURCE THEORY
A. P-Wave Spectra of Nevada Test Site Events
j3. Spectral Investigations of the Oroville Earthquake
C^. P^. and SV-Wave Corner Frequencies
D. A Scaling Law for Explosions in Tuff
IV. ABSTRACTS OF OTHER RECENT PUBLICATIONS
V. SEISMIC SOURCE THEORY: CURRENT KNOWLEDGE
A. What Has Been Learned of Earthquake Sources
]J. What Remains Unknown of Earthquake Sources
C. What Data Remains to be Collected
D. Cause of the Ms;mb Discriminant
VI. REFERENCES CITED
VII. PUBLICATIONS COMPLETED DURING THE NEAR-FIELD PROJECT
■-"at-■■'-'"•-■" mtemaitim ^.■.A.|ji-|(|lllll'l^.~J.-....^..^..-.^. ..-■.- . ■—-■■-— i.
Page
1
1
1
3
3
4
5
6
6
14
17
22
26
32
32
32
34
34
35
40
■«*
- - -—.—-

^
^
,i
t
INTRODUCTION
This document constitutes the final report covering participation of the
University of Nevada in the Near Field Project (NFP) of Central California,
sponsored by the Air Force Office of Scientific Research. We first summarize
system development, station deployment, and data gathered by the Nevada-
Washington long-period array. We then discuss significant results that have
arisen from these data. The third section describes research done at Nevada
aimed at understanding the earthquake source. The final section, based on what
has been learned to date, addresses the following Important questions: (1)
what is known about earthquake sources? (2) what remains unknown about earth-
quake sources? (3) what data remains to be collected? (4) what causes the body
wave-surface wave discriminant between earthquakes and underground nuclear
explosions?
I. SYSTEM DEVELOPMENT AND STATION DEPLOYMENT
A. System Development
One major problem of the NFP was that earthquakes never occur at exactly
the right spot. Thus, although numerous earthquakes occurred around the Hol-
lister area during the operational time of the NFP, none was satisfactorily
recorded by the near-field instruments operated by the University of California.
Helmberger (1974), Bakuu ana Bufe (1975), and Helnberger and Malone (1975) have
shown how strongly propagation effects modify observed seismograms in the
Central California region (at the expense of information about the source).
Thus, complete azlmuthal coverage by the university of California close-in
array was crucial in the study of several key points; how do spectral corner
frequencies vary with azimuth? How do P- and S-wave corner frequencies relate?
i !
-■- - - ^-■--. -i-.- —■■itininin fi ^ - -■—--—»■»■-»-^ *--. ~ ■- -~ - iiiiWinnilriinint-'*"*----- i-ninniiiin iiiiinninlniiiiiii

i
2.
This information is crucial If we are to evaluate any possible role of
rupture propagation at the source (Peppin and Simlla, 1976).
One way to avoid the problem of earthquakes not occurring in the ideal
spot is to design maxim n portability into field gear which is also capable
of recording the necessary bandwidth and dynamic range. With self-contained
stations, the recording sites could be moved in hours to the aftershock zone
of an earthquake, and the required azimuthal coverage secured by knowledge
of the aftershock epicenters. It was for this purpose that our technical staff
has designed and built a three-component, digital, event-recording package.
The electronics and tape recorder for this unit are contained in a small
suitcase that weighs 25 pounds, and can be carried by rucksack. The unit is
low power (50 ma at 12 volts), and can be driven by air cells for many weeks.
The system response for very rapid field setups is 0.2 to 50 (or more) Hz,
flat in either displacement or velocity (the latter the choice for small
events: higher gain at higher frequencies). In more careful field setups.,
the LF passband can be extended to about .05 Hz. A trigger circuit continu-
ously monitors ground motion and is activated by a sudden increase in 3-Hz
ground motion. The trigger activates the tape recording mechanism. The
three components are serially digitized (12-bit resolution, 1 to 16 gain rang-
ing) and recorded, along with WWVB timing (filtered and passed through a Schmidt
trigger) on tape. An 8-second shift register permits recording the onset of P
and a noise sample preceding the event. A block diagram of the unit is shown
in Figure 1. Unfortunately, the unit was not completed in time for its use by
lllfll- ll^ M r II . .1,1 I.. M-.imMlHM.lhm -- ■ ■ -' :..-^. .„--.v.... ...., ^^^,.., -... ■■- ■ ^^1.;^.^-- - .. - ■

' /
seismometers
amplify C8K) filter
(20 Hz, 24 db) muitiolex
encoder ta pe.
recorder
•
f rom 1 rigger
Figure 1 • Block diagram of wideband digital seismic event recorder.
.i-.:..,,,., - ... _ v-..,-..-.,.. „■^.„-.■.- ■-»»aiiMaaaMaaai^^^ffi^iA.ja.,. ._^ ...^. I..,,.:-_.,;:.,;,^.„..A.... , -"'"'--'-"-"-■- ■ " --■-"'■»"WmliTWMIfftlliifliWlll

■^.
-
3.
the NFP; but we plan to use it for source studies In the Nevada region, thus
eventually carrying out the objectives of the NFP.
A concurrent development has been the general conversion of Laboratory
facilities to permit processing of expected large volumes of digital data from
the event recorders. Full analog/digital, digital/analog capability now exists
in the Laboratory, Including the capability of decoding the tapes written by
the event recorders in the field. With funds from AFOSR, NSF, and the USGS we
have invested considerably in software development for the laboratory mini-
computer, and in a floppy disc. We plan to construct a batch processing line
to the main University computer, giving high-volume, high-speed analysis capa-
bility: ideal for data analysis in connection with source studies. I believe
ihls effort will result in very significant new data on the earthquake source
within 12 months.
B. Station Deployment and Data Collection
The Nevada-Washington array operated at design specifications for the
duration of the NFP. Station deployment and data collected are described in
our previous technical reports. The Thanksgiving Day 197A sequence, plus
several other events in 1975 provided some additional data; however, since the
change to the Kronos 2.1 system on the University computer, we have been
unable to decode the tapes written by the Washington system. S. D. Malone
carried out some preliminary analysis on these events, and therefore It was
not thought profitable to pursue efforts to analyse these additional data.
II. SIGNIFICANT RESULTS OBTAINED FROM THE NEVADA-WASHINGTON ARRAY
The primary function of the NFP was to record successfully, over a range
of distance and azimuth, a moderate, local earthquake. The Nevada-Washington
array was to record the long-period (1-20 second) energy at 20-50 km. This it
rf - - ■-- - --■ - ■ - ■ n. ii.nii..lii-il..ii il.ii i ■ i n .n..i. ,.ifiiiii-iiliilji.^.1..i.inii^ili^. iKfinniiMnril
■_
1/
4.
successfully did for a number or earthquakes. The question Is: are the
long-period spectra flat as predicted by the commonly-accepted versions of
dislocation theory, or are they peaked, as predicted by Archambeau's (1968)
theory with Rs finite?
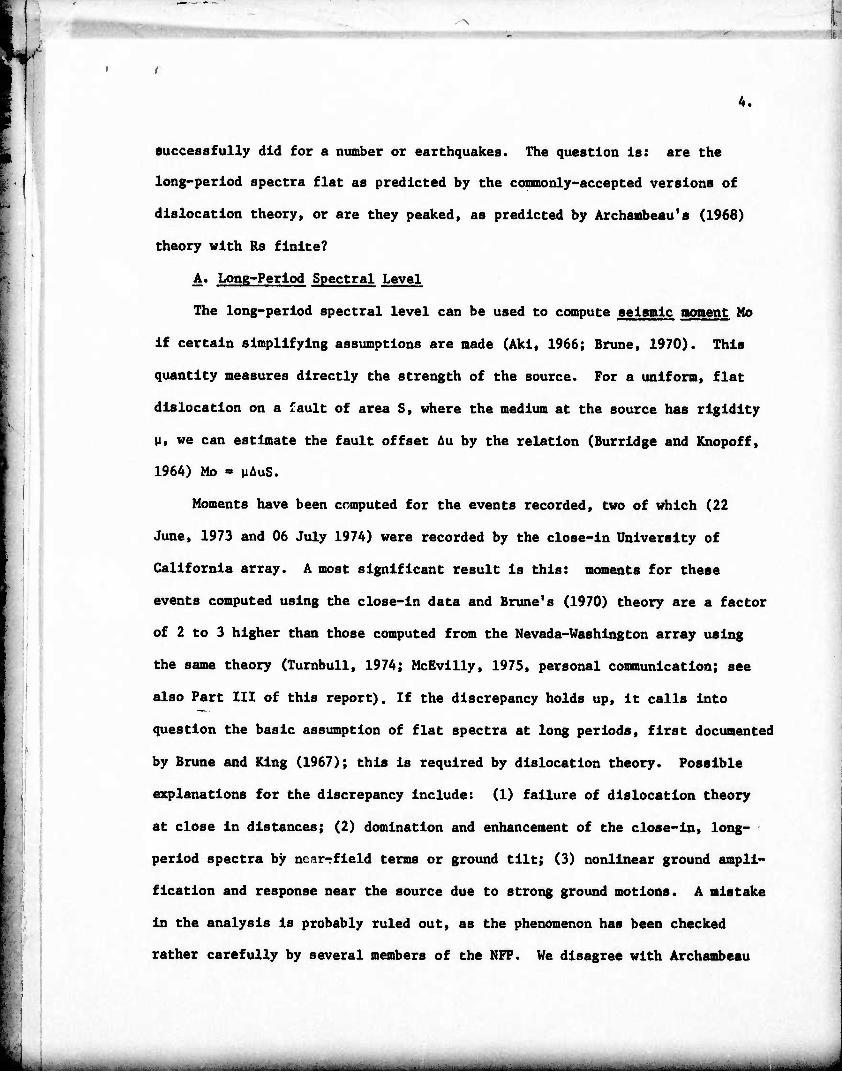
A. Long-Period Spectral Level
The long-period spectral level can be used to compute seismic moment Mo
if certain simplifying assumptions are made (Aki, 1966; Brune, 1970). This
quantity measures directly the strength of the source. For a uniform, flat
dislocation on a fault of area S, where the medium at the source has rigidity
M, we can estimate the fault offset Au by the relation (Burridge and Knopoff,
1964) Mo • MAUS.
Moments have been computed for the events recorded, two of which (22
June, 1973 and 06 July 1974) were recorded by the close-in University of
California array. A most significant result is this: moments for these
events computed using the close-in data and Brune*s (1970) theory are a factor
of 2 to 3 higher than those computed from the Nevada-Washington array using
the same theory (Turnbull, 1974; McEvilly, 1975, personal communication; see
also Part III of this report). If the discrepancy holds up, it calls into
question the basic assumption of flat spectra at long periods, first documented
by Brune and King (1967); this is required by dislocation theory. Possible
explanations for the discrepancy include: (1) failure of dislocation theory
at close in distances; (2) domination and enhancement of the close-in, long-
period spectra by near-field terms or ground tilt; (3) nonlinear ground ampli-
fication and response near the source due to strong ground motions. A mistake
in the analysis is probably ruled out, as the phenomenon has been checked
rather carefully by several members of the NFP. We disagree with Archambeau
■ibJli. ..<.. ...^•.^M^met^äiUiaJ&Ji.A^u^...... ' r' TI llimVi rililiiiriilililim'<laiMltMl<llWira'm'^^^ ,J,.^i,;,aKitoj^m^a^^i'.,«aa.a^../..,-.■...-.....-:.....■.■.■.,.. .^^^....^^aanim^
NrfoSN^ ■'
*
5.
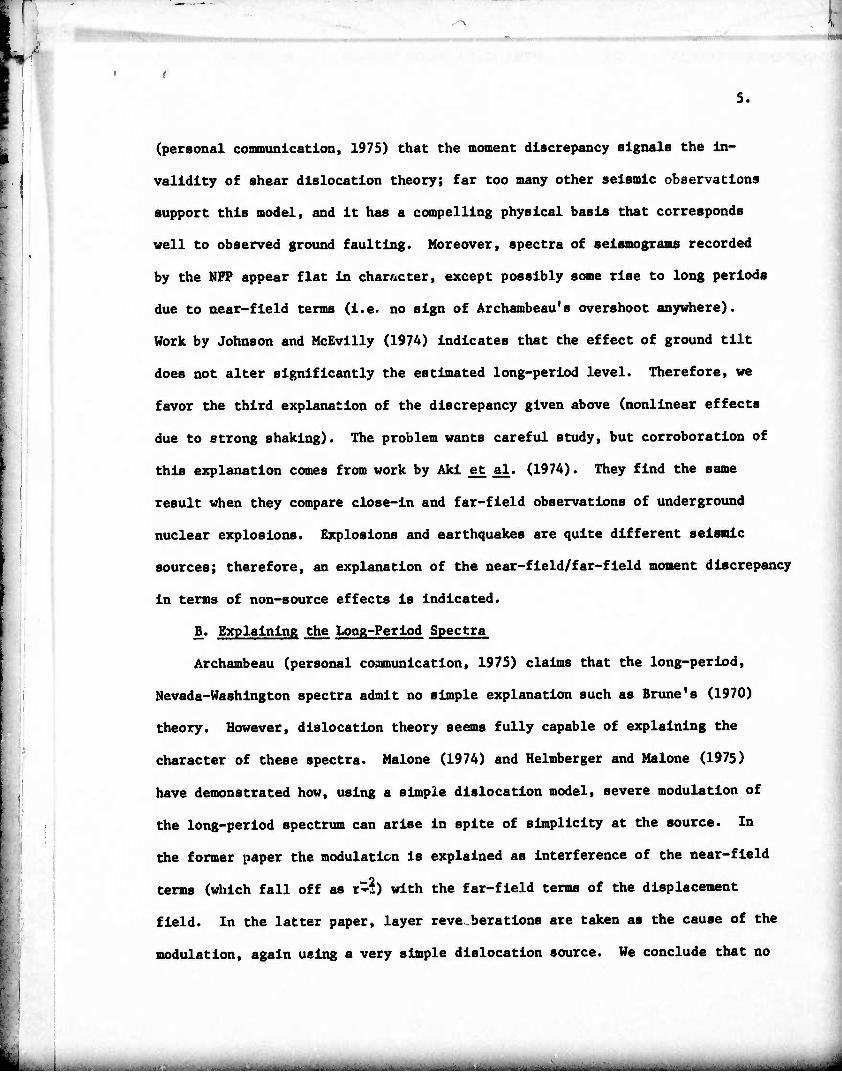
(personal communication, 1975) that the moment discrepancy signals the In-
validity of shear dislocation theory; far too many other seismic observations
support this model, and it has a compelling physical basis that corresponds
well to observed ground faulting. Moreover, spectra of seismograms recorded
by the NFP appear flat in character, except possibly some rise to long periods
due to near-field terms (i.e. no sign of Archambeau's overshoot anywhere).
Work by Johnson and McEvilly (1974) indicates that the effect of ground tilt
does not alter significantly the estimated long-period level. Therefore, we
favor the third explanation of the discrepancy given above (nonlinear effects
due to strong shaking). The problem wants careful study, but corroboration of
this explanation comes from work by Aki et al. (1974). They find the same
result when they compare close-in and far-field observations of underground
nuclear explosions. Explosions and earthquakes are quite different seismic
sources; therefore, an explanation of the near-field/far-field moment discrepancy
in terms of non-source effects is indicated.
jj. Explaining the Long-Period Spectra
Archambeau (personal communication, 1975) claims that the long-period,
Nevada-Washington spectra admit no simple explanation such as Brune's (1970)
theory. However, dislocation theory seems fully capable of explaining the
character of these spectra. Malone (1974) and Helmberger and Malone (1975)
have demonstrated how, using a simple dislocation model, severe modulation of
the long-period spectrum can arise in spite of simplicity at the source. In
the former paper the modulation is explained as interference of the near-field
terms (which fall off as r^?) with the far-field terms of the displacement
field. In the latter paper, layer reve berations are taken as the cause of the
modulation, again using a very simple dislocation source. We conclude that no
w^i»M,mM»>ifriWiietti^ . .■ ^mmmuti*.
6.
datura uncovered by the NFP compels rejection of the shear dislocation model
for earthquakes, that is, we need not go to the more complex source theory of
Archambeau (1968) to explain observations of earthquakes so far collected.
HI. RESEARCH AT NEVADA INTO EARTHQUAKE SOURCE THEORY
My interest has been in elucidating details at the source of earthquakes.
Because of my late entry into the NFP, and because the Washington group was well
along in the analysis of the Nevada-Washington data, I did only minimal work
with it. The main thrust of my research efforts have been aimed at the collec-
tion and analysis of spectral data in terms of seismic sources. This has led to
a number of publications, including one manuscript within a week of completion.
In this section we describe the principal results of these and then summarize
the main points as they relate to seismic sources.
A. P-Wave Spectra of Nevada Test Site Events at Near and Very-Near
Distances; Implications for a Near-Regional Body Wave-Surface Wave
Discriminant (to appear: June 1976 Bulletin of the Seismological Society
of America)
A detailed study of 140 P-wave spectra and their corner frequencies for
events on Nevada Test Site (NTS) has been made using three data sets, denoted
Dl, D2, and D3. Set Dl includes close-in (2.A to 13.7 km) seismograms written
by three-component, 50-Hz accelerometers (at two gain levels with 32 db sepa-
ration) of the large explosions JORUM (1430 GCT, 16 Sept 1969, 1100 ktons, Mj^ -
6.2), PIPKIN (1430 GCT, 08 October 1969, ca. 150 ktons, M^ - 5.7), and HANDLEY
(1900 GCT, 26 Mar 1970, 1100 ktons, ML - 6.3). Set D2 includes thrae-component,
50-Hz accelerometer data at 4 km from HANDLEY, and wideband (.1-20 Hz) velocity
data at 18 and 29 km from HANDLEY and 30 km from PIPKIN. Set D3 includes wide-
band (.03-20 Hz) velocity data from 45 NTS events including earthquakes and
akttMMMiiiitoMdaiaiiiii.ii r, j.aiiHiliiWiif^1-^^''^^
U/
7.
explosions, as recorded by the University of California Lawrence Llvermore
Laboratory (LLL) array at near-regional (200-300 km) distances. We first
summarize the significant aspects of the data, and then discuss some possible
Inferences about earthquakes and explosions as seismic sources.
1. Significant Aspects of the Data
a. Data Set Dl (close-In accelerometer data)
Data set Dl (20 selsmograms) has provided Important Information on the
seismic source spectrum of underground explosions In tuff. The spectra, char-
acterized by good slgnal-to-nolse ratio, provide four Important constraints on
the seismic source spectrum: (1) they are flat from 0.1 Hz to the corner fre-
quency, showing minimal spectral overshoot; (2) the corner frequencies are
higher than predicted by any recently-published scaling curves at one megaton
(1.5 to 2.0 Hz: Peppln, 1976, Table 1); (3) the corner frequencies scale with
yield as (yield)"* , far slower than for any recently-published scaling
curves; and (4) the spectra decay to high frequency as least as frequency
cubed.
b. Data Set D2 (close-in accelerometer and L-7 system data)
Data set D2 (15 selsmograms) provides additional close-in data of the large
explosions. These data corroborate- the results of Data Set Dl above with Its
Important Implications for source theory.
c. Data Set D3 (near-regional, broadband data)
Several points have been well established by the spectral data taken from
this data set (100+ selsmograms), other less definitely so. Best established
Is the relation between 0.8 to 1.0-Hz Pg spectral amplitude and 12-second
Raylelgh amplitude. Now the former quantity should be a measure of body wave
magnitude mb, while 12-eecond Raylelgh amplitude correlates well with yield ;,■■
8.
(Evernden and Filson, 1971). Plots of these quantities as determined at the
three LLL stations Mina, Kanab, and Landers show linear scaling (with unit
slope) over more than three orders of magnitude (Figure 2). As reported by
Springer and Hannon (1973), who found similar results, it is very difficult
to satisfy these data with conventional scaling laws which utilize cube-root
scaling.
Some less definitive.results
(i) Spectral overshoot
The most prominent of the less definitively-established results is
spectral overshoot ratio. Most of the Pg spectra of this data set are
strongly peaked due to layer reverberations (Peppin, 1976, Table 5).
However, no variation in overshoot for different shot media could be
seen. This supports Cherry et al. (1973), who, based on theoretical
calculations of conditions close to the source, find flat source spectra
for explosions in all media; it appears contradictory to the results of
Werth and Herbst (1963), however.
(ii) Separation of explosions from NTS earthquakes
Of interest is the fact that, in Figure 2, explosions and earthquakes
are indistinguishable. This is surprising, because we have plotted a
"body-wave" quantity, 1-Hz Pg spectral amplitude, versus a "surface-wave"
quantity. We should have expected separation based on the known effect ive-
ness of the teleseismic Ms:mb discriminant (SIPRI, 1968). A similar result
is found in Figure 3, where we plot spectral corner frequencies of explo-
sions and earthquakes recorded at near-regional distances (200-350 km).
In spite of published claims to the contrary (Viyss and Brune, 1970; Wyss
et al., 1970) it is impossible to tell explosions from earthquakes based
on gross differences in the spectral corner frequencies for events of
comparable magnitude.
Bi.1 i i...|-r1...iill.lnr...1il.l.i ..-■.i.i.i l.iir..nt i - ^.^—■- ■ ■ . . ..- - - - —■■ . .,„■

I
CDu> -a o u» ^j —
LL • irx
E CLO F~
E a''o X n a n F i_ o -*— o o —
CD
$Q
MINA explosion earthquake
•a •
10 100 1,000 KT
IZ "second Rayleigh amplitude
LANDERS ^ ♦ explosion o • earthquake
CDQ - X)
£■# ^s
IPiS
max
im
pect
ral
\0
10
0
• to
ih l6ü
cu^r
EEQ
E-Q
fc a) do </> —
IG3. 12-second Rayleigh amplitude
, . KANAB ■explosion ■ earthquake ^
io4
10 100 I03 10" IO3
12-second Rayleigh amplitude
Flprure 2. 0.8-1.0-Hz (averap-ed) Pp spectral amplitude versus 12-second
Rayleiph wa're amplitude as recorded at the LLL stations. The lines in
the figures have unit slope.
^ - -■ ■ ' ■-- —-—■-- '—■ ■■■■'-—-— - —■"■ —-"■"-■'■■—^- ' •«— ...^■,.-.^-^...... _.

N
ü c 0 D U 0 C_
Q--
c o c c o Ü
4r
3
0
• ♦
o e
♦ a
^a o ©
D 0
©
LLL data - NTS events
MNV explosion «»
earthquake • D
• o
♦•
D D H O* ®^ BO ♦ B»*D^AaaDDo^ on
□ D On ^ n 0 DO
e B
B»0
3.0 4.0 5.0
magnitude(ML)
D
KAN LAN
B 09
6.0
Figure 3. Spectral comer frequencies of explosions and NTS earthauakes as
recorded by the LLL stations. Note that explosions and earthquakes are In-
distinguishable en this plot.
■lIlTllliinlli-ft i.i IMIil „_■

■ .■:-■-.:, m. . . . ■ .,. ;.,-.,. ...■>■ ,-. ..*1.. .....,;,., v ,.,:;. .,..;:......;...|y ;,■,;,;,;;.-;. gMMMMMnHMIiMR
I
9.
(ill) Contamination of who. ^-record spectra
Another result obtained from the LLL data is important. Many pub-
lished spectra of explosions are computed from whole-record seismograms
(Lynch, 1969). Thus, they are contaminated by surface waves. This con-
tamination is evidently important, because while Lynch (1969) finds that
spectral amplitudes cube-root scale, the data in my paper, which include
P-only spectra, do not cube-root scale. This serves a warning to those
who would use whole-record spectra (or event surface-wave ones) to con-
struct scaling curves: These waves are probably much more influenced by
the propagation path than are the body waves. In support of this claim,
note that the depth of burial of NTS explosions cube-root scales to a
good approximation (Murphy, 1975, personal communication). Thus, we have
a ready explanation of the discrepancy between P-only and whole-record
spectra: the cube root scaling of whole-record spectra, rather than
showing cube root scaling of the source, is just measuring the shot depth.
Based on recently-published papers on the effect of layers and shot depth
on the spectra, such an explanation is reasonable.
2. Implications of These Data on the Ms:mb Discriminant
The data summarized here bear upon the question of what causes the body
wave-surface wave, or Ms:mb discriminant between earthquakes and underground
nuclear explosions (for a good review of this subject, see SIPRI, 1968).
Presently seismologists disagree as to the cause of this discriminant. The
theories that attempt to explain it can be broken into four groups. These four
adopt as the cause of the discriminant either: (1) spatial source dimension,
(2) the shape of the source spectrum, (3) source rise time, or (4) other causes.
We discuss each of these in order.
M^1lfllfiill1'aMfeaMi"t"^i'"^"-"-''>- ^.M^^^MMa^lM&Mi^^

,- »: _.
10.
a. Spatial source dimension
Suppose that source dimension is defined roughly as the maximum linear
dimension of the surface that surrounds either the explosion or earthquake
hypocenter outside of which elasticity theory applies. For earthquakes this
might be related to the dimension of faulting and for explosions it is called
the equivalent elastic radius. Those who believe that the source dimension
causes the Ms:mb discriminant also believe that, for the same Ms, earthquakes
have far larger source dimensions. Therefore, in analogy to electromagnetic
radiation from quarter-wavelength antennas (Keylls-Borok, 1961), this theory
would predict greater radiation of high frequency energy from explosions compared
to earthquakes of similar Ms (Wyss and Btrune, 1970; Wyss et al., 1971). The
discriminant is thus explained as a corner frequency phenomenon, with explosions
producing a higher corner frequency, thus higher value of mb relative to Ms for
sources of the same Ms. Some workers have found this explanation deficient,
and have so stated in £&• literature (Molnar, et al., 1969; Tsal and Aki, 1971;
McEvilly and Peppin, 1972; Peppin and McEvilly, 1974). The spectral data of
Figure 3 in this study show no significant deviation of explosion from earthquake
corner frequencies at the three ILL stations, so it appears that the Ms:mb dis-
criminant found in Peppin and McEvilly (1974) cannot be explained by this idea.
Everuden (1975) also believes that the source dimension causes the dis-
criminant, but on different grounds. He Invokes Archambeau's (1968) source
theory to show that the data demand very large source dimensions, even for small
earthquakes (the whole world undergoes a stress change as a result of even a
small earthquake). The problem with this idea is that it assumes small source
dimensions for explosions when by the same reasoning, they should also cause
a stress change over the whole world. That is, since both explosions and earth-
quakes can be represented as a combination of force dlpoles, the stresses and
,.^,.^.,„..,.:.^,^j..^^*i^!.^^t-^,. ■ ' --- '.«.f a-,-, mr — .....->■■■,■.-■.. ■ -,^.J.,..<^- - — - J
... . _
11.
displacements suffer the same geometric decay respectively with distance for
either source type.
6. Shape of the source spectrum
Some authors believe that the shapes of the far-field source spectra cl
explosions and earthquakes are different. In particular, explosion source
spectra are thought to be peaked, earthquake ones flat at long periods with no
peaking (Lieberman and Pomeroy, 1969; Molnar et al., 1969; Tsai, 1972; Aki
et al., 1974). This implies a steplike time history for earthquakes, and an
impulse-like one for explosions. Then the Ms:mb discriminant arises as follows.
We assume Ms and mb are, respectively, proportional to 20-8econd and 1-second
spectral level of the source spectrum. Imagine an earthquake and an explosion
of the same mb. Then the Ms values must differ because the spectral shapes are
different (if they are normalized to have the same l-second amplitude, the 20-
second amplitude must differ). We have seen that the near field data for
explosions in tuff show no overshoot. Yet Aki et al. (1974), based on data
from the 0SCUR0 and M0NER0 explosions, each in Yucca Flat tuff, inferred a peaked
scaling law. The 37 close-in spectra of this study are self-consistent and show
uniformly flat spectra with no overshoot, which is a strong argument against
such an eitplanation of the Ms:mb discriminant, at least for these explosions.
A further objection to this explanation is that the proportionality between the
20-secord source spectral amplitude and 20-second surface wave amplitude that
gives Ms has been established neither thoeretically nor empirically. In view
of Tsai and Aki's work, where Rayleigh wave spectral amplitude is shown to be
a fairly strong function of depth, it would appear that the relationship is not
a simple one for many real cases.
.....„^^^...^^.-..^„-.„^-^„...■^..„«.^^.^

12.
c. Source rise time
Some authors believe that explosions have much shorter source rise times
(SRT'ü) than earthquakes of the same magnitude (Davies and Smith, 1968; Marshall,
1970; McEvilly and Peppin, 1972; Peppin and McEvilly, 1974). This would result
in discrimination even if the source spectra had exactly the same shape provided:
(1) the spectral corner frequencies were caused by the SRT, (2) SRT's of earth-
quakes were of the order of seconds, and (3) SRT's of explosions were much
shorter. Thus the discriminant could again arise as a corner frequency phenom-
enon, just as for the source dimension. The problems with this explanation
are numerous. In the first place, current seismological thinking rejects the
possibility that the SRT can be long compared to the ratio of the source dimen-
sion to the shear wave velocity (Brune, 1970)(in recent model experiments
Archuleta and Brune (1975) have found that the SRT is of such an order that,
based on Brune's (1970) theory the corner frequency caused by the SRT would be
of the same order as that caused by the source dimension). Furthermore, there
is no available evidence that the SRT of small (M. near 3) earthquakes is any-
thing like a second; just about all studies suggest smaller numbers (Johnson
and McEvilly, 1974). In addition there is the data of Figure 3. The corner
frequencies of explosions and earthquakes of the same magnitude can differ by
little. There appears to be no way the SRT can be the cause c«f Peppin and
McEvilly's (1974) Ms:mb discriminant, and this agrees with the findings of
Tsai and Aki (1971).
d. Other explanations
Leet (1962), Douglas et al. (1971), Rodean (1971), and Tsai and Aki
(1971) have given explanations of the Ms:mb phenomenon that involve gross
differences between explosion and earthquake sources (the one an irrotational
yMayaitoMa^tMa^-iaa^^^
— —- -
13.
pressure pulse, the other a shear dislocation). Then the discriminant arises
because the earthquake generates far more S-wave energy relative to P than the
explosion. These S-waves excite Rayleigh waves at the free surface above the
source, so that Ma should be proportionately higher (by a factor of .7 to 1.0)
for earthquakes of the same P amplitude (i.e. the same mb). This explanation
is physic-lly appealing and potentially of great significance, because it
would indicate a considerable difficulty in any attempted evasion technique.
However, as Douglas et al. (1971) point out, there is the problem that explo-
sion sources are generally shallower v.by a factor of at least three in the
Western U. S.) than earthquakes, so that the depth of focus causes much of the
separation predicted theoretically between the two source types to disappear.
This occurs becf.usa the nearer is the source to the free surface the more
energy is transmitted as Rayleigh waves (Peppin, 1974, Figures 12(a), (f)).
This and related problems, as yet unresolved, are discussed in Peppin (1974),
and will be the subject of another paper. The results of that work indicate
that there is presently no theory based on infinitesimal elasticity that
definitively explains the Mstmb discriminant at near-regional distances docu-
mented by Peppin and McEvilly (1974).
3. Conclusions
Some 140 spectra of 45 events on Nevada Test Site have been studied. The
close-in (3-30 km) data for explosions in tuff give 37 stable, good-quality
P-wave spectra that exhibit no overshoot and which decay at least as frequency
cubed to high frequency. The corner frequencies are quite high for the explo-
sions compared with those predicted by several recent scaling theoiies, viz.
1.62 - .38 Hz for 1.1 megaton vertical data (14 observations), and 2.08 - .38
Hz for 150 kton data (5 observations), as compared to .7 and 1.1 Hz predicted
y m »BitiiiiMiiihir n ii i ^gtai^aMMiiiiaaia^ . . .;. . ■. . _ - .... ., J
■ _„ .
14.
by Murphy and Mueller (1971). The variation with yield is less than would be
expected for these events based on existing scaling theories. The near-
regional (190-300 km) spectra are less easy to interpret; they admit some
definitive and other less certain conclusions. The scaling of log 0.8 to 1.0
Hz Pg spectral amplitude with log 12-second Rayleigh wave amplitude (and
therefore log yeild) is well established as liner with unit slope for 3,6 £
ML £ 6.3 (ca. 5 to 1100 ktons). On such a plot explosions and earthquakes
cannot be distinguished, which suggests a basic similarity in the way these
events scale with magnitude. Observed corner frequencies of explosions and
earthquakes at near-regional distances are indistinguishable, but due to
strong propagation effects no such strong statement can be made about the
source spectra of these events; we can say that, for 3.0 £ M^ <_ 4.8, the
source corner frequencies of explosions and earthquakes can differ by little.
Based on these data, it appears that the near-regional Ms:mb discriminant of
Peppin and McEvilly (1974) cannot be explained as a spectral corner frequency
phenomenon, nor in terms of different source spectral shapes for explosions
versus earthquakes. Therefore, the following factors cannot explain this
discriminant: (1) the source dimension, (2) the source rise time, or (3) the
source time history.
C. Spectral Investigations of the 01 August, vville earthquake
sequence, W. A. Peppin, in Oroville, California arthquake 1 August
1975, California Division of Mines and Geology Special Report 124,
Sherburne and Hauge Ed.
The occurrence of the Oroville earthquakes of 01 August, 1975 and its
abundant aftershock sequence provided another excellent source of data of
relevance to the NFP. The Seismological Laboratory made a major effort at
__._ __._ __ __ : ,^ ^ iia^älMi^i/uÄ^...^...^Ji ...,.„,—....-„..^ w^.:^a Jii
'
xA
15.
obtaining data from this sequence. Including the deployment of high-gain
epicenter-location gear from 02 August 2300 GCT) to 28 August, 1975 (A to 7
stations) and of broadband, self-triggering, 50-Hz SMA-2 accelerometers, which
operated from 08 to 20 August, and which produced 45 useable accelerograms.
The near-regional University of California broadband array at WDC (150 km
NW), BRK (175 km SW) and JAS (175 km SSE) provided an opportunity to follow the
same earthquakes out to near-regional distances. Ground displacement spectra
were determined for the 15 August, 0548 GCT aftershock (M, ="4.0) using both
the close-in accelerometers (eplcentral distance 5 km) and the near-regional
data. Some Interesting Information relevant to earthquake source theory was
uncovered. This Is summarized below.
1. Long-period discrepancy
The close-in data provided a value for the seismic moment of the 16 August
event which Is three times higher than the value obtained at the near-regional
stations, a discrepancy similar to that found between the close-in and near-
regional records of the 22 June 1973 and 06 July 1974 Bear Valley events
(see above this report). The result Is surprising, because all of the spectra
we computed were flat at frequencies below a "corner frequency". Thus, there
Is no easy explanation of this discrepancy In terms of multiple spectral corner
frequencies. More data Is needed to corroborate this finding, and is In
possession of T. C. Hanks of the U. S. G. S.
2. Spectral corner frequencies.
Spectral corner frequencies of the SV and SH-phases recorded on the close-
in accelerometers were quite high for events of this magnitude (3.0 to 4.3),
falling in the range 10-20 Hz. These values are right at the upper side of
spectral parameters obtained by Tucker and Brune (1975) for the San Fernando
afcaafcgaaai iii munirtmiiiii ■ n ■ ^ -. .^.-,„...^....■■ ..■- —-■■■■ ■ '■— - -^■~- ..- -t-^. mm

16.
aftershocks, indicating relatively high stress drops. This observation might
be of importance, because there is some reason to believe that the Oroville
earthquake was triggered by the filling of Oroville reservoir in the months
March-August 1975. It would be significant if high (relative to other California
events) stress drops are associated with man-caused events.
3. Comparison of close-in and near-regional corner frequencies
There is evidence that the Oroville earthquakes were complex events. For
example, a partial accelerogram of the Oroville mainshock, obtained by the
California Department of Water Resources, shows a duration of not more than a
few seconds, with spectral corner frequency near 1.0 Hz. This is totally unlike
the clearly-defined corner frequencies (for the P-phase) of .1-.2 Hz found on
the JAS and WDC broadband systems. Hart,■ et al. (1975) have suggested that
the Oroville mainshock was characterized by rapid slip on a small section of
the fault (causing the close-in accelerometer duration observed) superimposed
upon a slow creep over the larger faulting surface (giving the near-regional
corner frequencies). If true, the suggestion Implies that we are not so close
to "routioe" estimation of fault parameters as we might hope, at least for these
earthquakes.
Data I have collected on a large (N L = 5.00) Oroville aftershock are also
suggestive of complex faulting. In Figure 4 we see the P- and SH-ground dis-
placement spectra of this earthquake at Berkeley. The SH-corner frequency is
ten times higher than the P-wave one, which is less than .2 Hz. On the other
hand, while we were in the field, at a distance of a few km from the epicenter
of this earthquake, we experienced the following sensations: a loud, clearly-
audible explosion lasting about a second (the P-wave) followed by inaudible
motion of the ground for a few seconds (the S-phase). To explain the total
-.^«^^^^^^■^^j^Mth,;«.»^.toi.«.iJ.M.^i.,ii..i., , A-.a^l^^^M»MMa^lii«ttM»li<ä

1/
P- PHASE
I
SH-PHASE
—H5 SECl
1 PPHASE 1.0 ' SH-PHASE .1
FREQUENCY (HZ)
t as recorded at Berkeley vertical (P) and FiPure 4 The 02 August 2023 GCT event a .bjLgure_ ^. iuo a «ntBa onprtrum eiven by dashed line. N45W (SH) instruments. Noise spectrum given uj.
vn •riliii.MtlW«-lf''-Ak'a'-aAM^ ■te.^ii«^^^a^^^
17.
inconslstancy of duration of P and S at close-in as compared with near-
regional distances, a mora complex model of faulting than a simple, uniform
dislocation seems required.
D. P^. and SV-wave Corner Frequencies over Low-Loss Paths: A Discriminant
for Earthquake Source Theories? W. A. Peppin and G. W. Simila,
submitted to Journal of Physics of the Earth.
One aim of the NFP was to study earthquakes at a wide range of azimuths,
so that the details of fault rupture could be inferred. In the absence of
adequate data from the Bear Valley arrays, we attempted to find another data
set with which to conduct such a study. We selected the University of California
broadband system at Jamestown, California (JAS), because: (1) it supplies
continuously-recorded data over a wide band (.025 to 10 Hz) at two gain levels,
either flat in displacement or velocity, and (2) it provides seismograms of
events travelling in and around the Sierra batholith, a known high-velocity,
homogeneous body of granites with presumed small attenuation properties. Each
of the above qualities is essential if meaningful spectra, capable of providing
seismic source parameters, are to be computed.
In this paper we study the relationship between P- and SV-wave spectral
corner frequencies in an attempt to resolve apparently contradictory investi-
gations of these which have appeared (Molnar et al., 1973; Stump, 1974; Bakun
et al., 1975). We first present the data and method of analysis. We then
discuss the implications of these data on recent earthquake source theories.
1. The Data
The events selected for analysis include all well-recorded trans-Sierra
Nevada events from 06 July 1974 to 31 August, 1975, and a representative
sampling of the many Oroville earthquake aftershocks. Epicenter and magnitude
■ -.-■.....- —■.-. ^ ^ ^.^..— _. ' ■
r — _. * ^-
/■■J«gfg(^lW.<<W^unMMIM>i{W>M«Mw-»~!—'--
18.
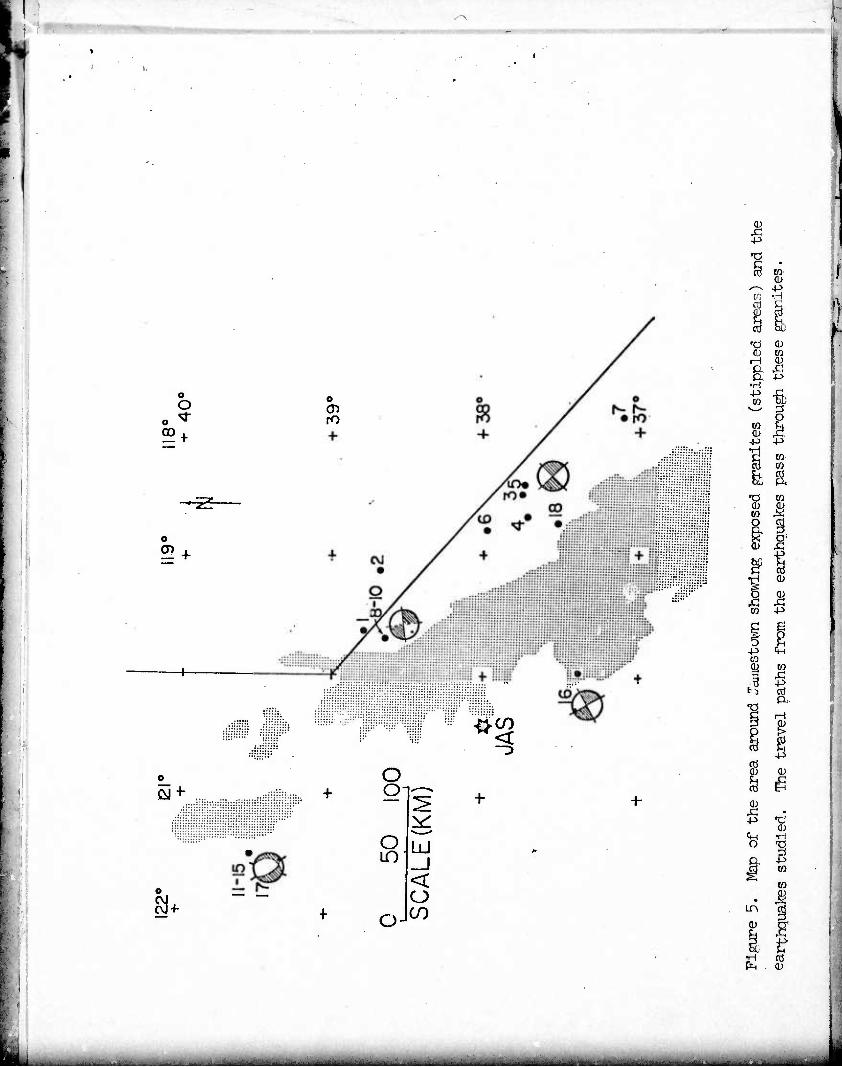
inforaation is given in Table 1 (Event nos. 1-18). The nature of the travel
paths to JAS can be seen in Figure 5^ which also shows the distribution of
exposed granites. Fault-p.^ane solutions could be constructed only for Events
8-10 (one nodal plane poorly constrained) and Event 17. The mechanism for
Event 26 was supplied by Karen (icNally (personal communication, 1975), while
the mechanisms for Events 3, 4 5, and 18 are assumed to be represented by the
composite solutions of Pitt and Steeples (1975), one of which is shown in
Figure 5.
2. Spectral Analysis
The JAS seismograms were digitized at 25 or 50 samples per second after
analog alias filtering. A 10% cosine taper was applied and spectral moduli
were computed for the entire vertical Pg or Sg phase, then smoothed (3-point
triangle window). The instrument response was removed, but not the 10-Hz
alias filter response. Identical processing was applied to a noise sample
(different for P than for SV) preceding each event. Corner frequencies for
all spectra were estimated by overlaying the spectra with a template, flat at
long period and decaying to high frequency as frequency squared or cubed
(whichever fit the individual spectrum better). The corner frequencies
selected are given together with an estimate of their uncertainty in Table 1.
3. Results
The corner frequencies were used to compuce R, and these values are given
in Table I. The observed value of R for all .18 earthquakes is .96 - .1/. The
earthquakes represent at least four distinct source areas at widely varying
azimuths from JAS; thus, we can safely say that these values, showing equal P-
and S-wave corner frequencies to a precision of 20%, are representative of
earthquakes in the Sierra Nevada province. The values of R are plotted in
riiViiirtfaiiiwWinir'iiniTM^^^ - ■ --^ ■'■■■ ---"- "" ..»..»M^^s^i^miam*^^

Al
an er
o m o o m m m o o m o m o O m o o o o m o .H CTv t-i vo rH cn <T r- !>. CN oo <r vO r-l o «n 00 oo vT cn -a- r- ^r vD CO in in 00 <t m ■<r vO in -* vO n CM >* vO r-i rH ^1
1
vor-.-<rcMiH<rooinvor^ vo i—i CM cg r^.<r cn m CT» r-~cr>OfHovcr\OrHoooa\cr>r^oo-<rr^iHr-.cMCMin
d ...............••■••.. --(l-l. H H rH 1-1 rH H H H
t/5Ä ocrioonrocv4i^cr»r»iniHint-ioo^-ocvjvrcvirHcv4 o^^ ......................
u-i incNjcM-a-cscncsiro-d-nfocvjcNCNiiHfo^ncnncn
^X ^N ^«N *^\ •—V /^ >^>. ^N •-V •-^ ^-N y-N /^N ^-N •—\ ^-V /^N ^-^ ^^ ^*S *** ***% «n U^UO'AtOOOU^f^iP^P^OOU^il^U^O
N p,K oooocr>oOi-iOr~-r-)or-o<tinnocoinr-»00-0 U^-' .....................
U-l cnCNCN'-a-CNrOCM-vt-vrcOn'CSlrHCMCvJCMCv4CN|«3--J,-<r
>-» r^mmcNj<rnovoc\ivDvocor^invaooor^.vooo-vr ►4 {nrornrnrncn-^rrornrororncnrncnro-vtcncvicNicvi
vO o o
w to 3 < < <
H cn rH rH
o vO
o oo ■<i- in
CN CTi er»
in m m rH rH
in in in O vo
m cn
m cn
in o
H CN CN CN
3:
CN CM CN CN CN cn >r>»
m tn
S ^ 3: ^ S S S !at S 'S- S .» > s S S 3 S S rs cn vO
o o cn
m CM
cr> cr\
cn r--
in m
rH m
CN in
cn in
CN in
o cn 00
m OO
in 0
•H
cr> •H -H rH
co H
00 rH rH
co -H rH
co rH rH
P>v , H H
rH rH
rH rH
c^ rH rH
rH CN rH
rH CN rH
rH CN rH
rH CN rH
rH CN rH
CT. rH rH
rH CN rH
O CN rH
rH CN rH
rH CN rH
rH CN rH
•z 2 K Z as SB S3 äs SS Z TU Z JS Ä SB » E5 23 5= Z 'S
cr\ vO
CN erv rH
rH vO
rH vD
rH VO
00 r^. -d-
CN O in cn
cn O O
o o
rH o co cn
co cn cn cn cn
OO <n
00 tn
OO cn
CTi cn
CTi m
CTi CTi cn
CTi cn cn cn cn
CO cn
OO cn
3 «n
o o CTi cn cn O CN <t CN cn <r oo rH m TM O cn vO rH cn o <r CN cn in CM m CN in in <r CN -d- in <r m <r o CN rH cn -d" o <r o <r in oo cn OA rH m a> CN rH p^ rH VD co -d- oo co I--»
rH •* CNl o m rH rH CN in cn CM m in <r <r rH ■vf ?M m o rH vD ~cr vO CN CM r^j rH vO vD cr> rH o o a\ VO m m O rH o O
1 O rH rH o rH O rH O o o CN o rH o rH rH o O CN o o
vf ~T <r ■d- •vT <f in m in in in in m m m m m m m m i.n
i r^ r~ r». r^ r--- r^ r-^ r^ r>. r-^ r- r~« r^. 1** r^ r^ r-» r^ vO vo o o> CTi <3\ <j\ cr> ov ■y\ (J> CTi o> OV Ov o (T> a\ CTi OS CJ\ CT> o> Ti
u
Q
rH rH rH rH rH rH rH rH rH rH rH rH rH rH rH rH H rH rH rH rH
>> w 4J JJ rH 60 > > > o .Q >v >v >S 00 to 00 60 es öO 00 to Ou D. X D o o o o (1) 0) rj ca tD a 3 3 3 3 3 3 3 (U 01 CJ ^ < 53 z SS Q pH X S ^> < < < < < < < < w 0 V3
vO m <f 00 rH r-> in in m r^ rH CN CM vT vo o vO r* o rH ■H
o rH rH r-l CN O CN o o O O O O O O rH rH rH rH rH -H
> c m
i..Bi -■„., ,™.,.i, ...,;^..;,....'.„„,. „.. -,■•.
vO
...,.,..; i »1-..5.
I
It 0) tn
M
iJ u 2 TO 1 • P.
4-1 •S (U
0)
1 T) w 3 4-1 p 4J C J—^
•H OJ Q ^> C s ^ r». M Qi ,-1 VD TO »-I CTl e P 'W H M ■H ^^ e
o TO
S >% I/) i •a >. o M VJ OJ Cu H
tr. X) OJ U-l c rH d TO -a o •H OJ ■a o U) c U-l j«: 0)
•H m < >, (U n c iJ u 4-1 T3 OJ 3 (13 T3 •H 1 PQ to
c u ig O rH r-l (U o o c O ■H M O H
•H ^H cfl 3 .a OJ 4-1 O. 4-1 (tf 3 a >. ^ >i o Sv« S-! fr~S (U Oi o OJ M a) d in o o 4-1 o 4J o r-l r-( rH •a rH rH O c TO
r-l dj ■H OJ o A c TO 3 J4 > r* u 4J
a »4 V4
tn •H -a
4J M (U « % w o £ (il
.
lO
- , ___....__ __ ...r,._,....,.: __ • _,_•_.:_-■„;.... '■-■ -^ >mi«M«nfiiiM«l ■.■■■!.--.:—<—'——- -■ ■^"■UMiMllliii ^..„-.^—„ ^■- M. *LtM
o 03
o O o
ro
5 +
CVJ-»-
L
o o-
o 10
o
+
UJ
< o CO
§ w (D
'-- -^> CO -H cd B
cö S)
■Ö <ü
-p to -a
o
«0
•H
g CO
-P to
il
cti
0)
CM O
in
to CO tO
to 0) CD to ^
H
(L) je -p
to
CO &
CD
a) ■H
^s -p to
CO I a1
fin
\-.~—j.. ../■ ^.— ..^ ».■■^.^-,^lM,^„.. ■„„f..;-,.-.. .-n- ■ l —--' ■ - :-.^--..——J
19.
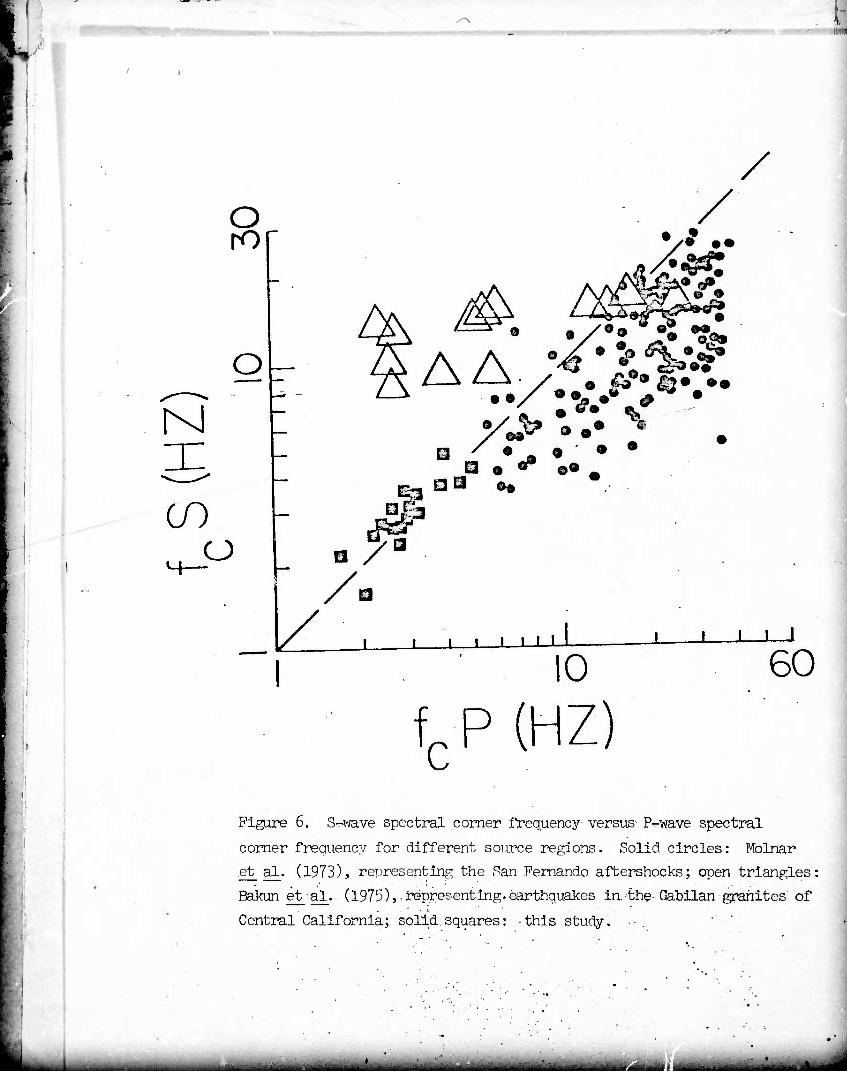
Figure 6 along with data from Molnar et al. (1973) and Bakun et al. (1975).
The main point of this paper Is that these three studies, each based on
excellent data, give quite different and distinctive patterns for R in the
three source regions represented.
4. Implications for Earthquake Source Theory
In the following cliscussion, we will assume that propagation effects have
not significantly altered the observed corner frequencies presented in Table 1,
so that these corner frequencies measure directly some source parameters. The
discussion is aimed at deducing what these source parameters might be.
In all of the recently-published source theories, the dimension of faulting
controls the P- and S-wave corner frequencies, and in all but two the predicted
variation with azimuth amounts to a factor of 2 or more. Thus, the resolution
of the data in Table 1 is adequate :o discriminate between source models
(subject to the assumption above). Berckhemer and Jacob (1968) employ subsonic
rupture propagation velocity, but concentration of energy from the center of a
circular dislocation to find equal P- and S-wave corner frequencies. Brune
(1970, 1971) and Hanks and Wyss (1972) employ an infinite rupture speed on a
circular fault to find higher corner frequencies for P than for S by the ratio
of the P- and S-wave velocities. Molnar et al. (1973) use uniform rupture at
high propagation velocity on a circular dislocation to find higher values for
P- than for S-wave corner frequencies. Sato and Hlrasawa (1973) use subsonic
rupture propagation on a circular dislocation with greater slip near the center
to find higher (> 50%) corner frequencies for P than for S. Burridge (1975)
considers self-similar rupture on a circular fault lacking cohesion at the P-
wave velocity. His formula (59) for I \e ratio of the P- to SV-phase corner
frequency is 1.2 averaged over the focal sphere, but the ratio is 2 or more
__. ,,:.-. - ^:.4.. ,...■:...: .-,;,.. , :^^,-*:.^:^.V.- :■ . :.^^.: -^^^ ^^^s^u^ajt^a^^auia^ia
« II
■
o ro
O
M
00 o
r
/
/
^
&■ AA ,
t • • -B • ^ o» .
»1 aa do •
#t •
/a
a
■ i i i i i i ■ iii
10
fc P (HZ) 60
Figure 6. S-wave spectral comer frequency- versus- P-wave spectral
comer frequency for different source regions. Solid circles: Molnar
et aL (1973), representing the San Fernando aftershocks; open triangles;
Bakun et_ al. (1975),.representing.earthquakes In.-the-Gabilan gi^ahltes of
Central California; solid,squares: this study.
' ..-J-- ■ ..^ -.._..,.. ■■■^^.^.-^-.■^ ^^—.. :-.->l.....,.~......^l. , ^„. -"•-•J-,-'J"- -
•^.
•
20.
on 50% of the focal sphere. Madarlaga (,1976) solves the problem of slip on a
circular crack when stress drop Is specified. The slip Is concentrated near
the center of the crack, and gives slightly higher (10-20%) P-corner frequencies
for subsonic rupture propagation. In contrast. Savage (1972) uses a Haskell
fault model with uniform, bilateral, subsonic rupture propagation at 90% of
the S-wave speed and uniform fault slip; he finds higher primary corner fre-
quencies for S than for P by a ratio (averaged over the focal sphere) of 1.65
to 1. Similarly, Da'ilen (1974) uses a combined dislocation and self-similar
crack model at subsonic rupture propagation with uniform fault slip; he finds
higher corner frequencies for S than for P (averaged over the focal sphere)
by the ratio 2.38 to 1 or 1.75 to 1, depending on whether the rupture propa-
gation velocity is 90% or 80% of the S-wave velocity. In summary, models which
have uniform slip and subsonic rupture propagation on circular or bilateral
faults predict higher corner frequencies for S than for P at all azimuths,
while models which employ supersonic rupture propagation velocity or slip con-
centrated near the fault center predict higher corner frequencies for P than
for S at all azinuchs (on the average); Table 2. Of the above-mentioned models,
only those of Berckhemer and Jacob ( ?%8) and Madarlaga (1976) cannot be ex-
cluded by the data of Table 1; but note that the former authors employ what
may be an unrealistic assumption, namely rupture propagation velocity decreasing
as the faulting front moves out.
Ihe quantity R, then;„ appears to be a rather sensitive source-model dis-
criminant. Our data could be explained by the models of Berckhemer and Jacob
(1968) or Madarlaga (1976), but not, for example, by the model of Savage (1972).
Bakun et al. (1975) find the opposite: Savage's model can describe their data
quite well. None of these three seems capable of explaining the high values
nMWliliiiiilitri .;'■ nir 'iiniteiWaiiMaMagiMMM«!»;'^'^^ uuaUBuikj IMhmmViirrt'iif-.r-irar^

«>4
'S U u
Pi
P-*
w >4-» Q) o •H H 0) cx O • VJ -H (U 3 rH x: 4-1 C/3
P 0)
(U CJ
3 to
Ö <u CJ m 0) o
Pä C 0)
«4-< o ■u n o -H r-l 3
. *J 3 4-1 CO u td o-
r-1 (U ^ 3 OJ 1-1 Prf
•H ■H J-l O c 0J
O >. aj -H 4-1 J-l -U -H 3 rt cJ 4J (30 o p- rt rH 3 o- a
Pi o > N
P4
4-i eu rH n. 3 tfl to x:
P4 CO
CM ^v s~^ cr\ n rH r- ^-t r~- to rH -3- cn r^- ^s %_• v—^ v—^ r-l cr> o v-' rH C C r-l C c
c>l v^ o CTi CS O o o 0) CTl •H cn •H 01 ■H •rl
oo r~« OJ 4-1 O 01 4J U 4J 4-1 ra n c (TJ CM rH to 3 nl nJ > 3 3 x> 3 60 3 3 ni • M cr • rt a" ■H cf cr to D. FQ OJ p- H 0) PM 01 cj
o U-l •H a 3
•rl -a u
LO
LO rH
rH A
o <4-( •H C 3
cn 3 o QJ C
4-1
in 3
M QJ O tj rH 0J
-H XI c Ö cfl n) O •H 4-1 tn J-l 3
^3 nJ rt 3 > 4J U) w
■3 U -a n •3 U
B
o U-l •H c 3
3 O QJ 3 rt
w
4J <-i 3 rt O •H
ra rH rt rt u
•H ■n 3 rt Qj
W Xi 4J
rt -rl •a rt vi
rH rH rt rt
•H -H T) ■3 rt rt Vi u
03 3 O 0) 3 rt 4J 3 rt
•H 'H
O •rl
o w n • rt a. 3 m
3 o cn
X> 3 U3
CJ ■H 3 u O •H M 3 M O QJ tn D. JO 3 3 U) W
in
I CNJ
U QJ 01 01 QJ QJ 0) O J-> 4J 4J 4-1 4J 4J
rt 3 rt 3 rt 3 S M QJ u QJ a M OJ 0 . e U 4J O 4-1 CJ 4-i a u u O 3 3 o 3 o o
U-l 0) M 53 u U-l 01 u U-l U-l iH CJ rt u rt •H CJ rt •H •H 3 3 QJ 3 c 3 3 QJ 3 3 3 O 3 O 3 3 o 3 3 3
O o o
rt r-l n rt QJ •rl 4J T) rt rt
■H u •H X>
o CJ •H •H 3 3 O O to rt
XI ,o 3 3 to tn
Vi Vi rt O rH
u n >-i K 15 u JH rH rt rt rt rt rt rt rt 3 VI CJ
rH r-» rH rH rH rH rH co rt -rl 3 3 3 3 3 3 3 3 rH 4J u CJ O ■ CJ ü u o rt 3 a u >-i M U |H VI Vi u 3 ft •H •H •H •r( •rl •rl -H o U rH U O U O O a CJ i -H rH
CJ 01
"3 (0 • r m 3 03 rH rt r- ^^ /"s
rt ^N *r-N >, rt vi . ON CM «* CO rH S •rl •^ rH t»» r^.
1-1 VO r^ ■ pc! rn v.^ o\ ON ol cr\ cr> •3 ^l r>. rt rH rH
B H rH 3 0)| tJ o> 01 60 \S >^ QJ v.^ rt 3 rH 00 rt x: M ^-N Vi ^-N rt ^> •3 fH a 3 ^ä rQ QJ o tn CM rt m •H U to 01 CJ O 3 1^» ^ r~ 3 r~. o rt Vi rt rt rH
vi CJ 3 a\ 3 CTk rH en 4-1 3 U ■3 > x: oi rt U H rt rH o rH rt rt 3 1 rt rt M ►O m »-^ Ä v^ ...3» •w» Ui (0 m to a
.:JV.:...-.. ■ «i^^tfA^^iiaMJ,^^^
■"^■^•^^
-r
21.
of R found by Molnar et al. (1975), but Brune's (1970, 1971) model with a modi-
fication by Hanks and Wyss (1972) can. We saw in Table 2 that R depends
largely upon the rupture propagation velocity on the fault; it is physically
reasonable that this quantity might vary in different source regions (e.g.
slower in areas of great heterogeneity, faster on smooth, well-developed fau^t
traces like the San Andreas). That is, we should not be surprised to find that
no one model can accurately predict the totality of earthquake phenomena (but
note in Table 2 the features common to the models: each can be formulated as
a specific case of Haskell dislocation theory).
The results of this investigation can be explained by another model. If the
corner frequency is determined by the time history of motion at the source for
these events, then equal and non-varying corner frequencies for P and S would
result at all azimuths. This particular model seems physically reasonable for
small-to-moderate earthquakes; it implies a source time duration that is long
compared with the rupture propagation time across the source. This explanation
was considered by Johnson and McEvilly (1974) for Central California earthquakes,
and would be consistent with the findings of Archuleta and Brune (1975) based
on model experiments in foam rubber. More complete azimuthal coverage would be
needed to test such a model.
CONCLUSIONS
P- and SV-wave spectral corner frequencies for 18 trans-Sierra earthquakes
give a ratio R of P-wave to SV-wave corner frequency of .96 - .17. These values
appear to be independent of propagation effects, and thus are indicative of
conditions at the source of the earthquakes. The SV-wave spectra permit a
minimum estimate of 480 for Q, which is high compared with other California
crustal paths previously studied. The precision with which we have determined
- :- --Iin Jill I Mil I ■ I lllllllir"""-"--'-^ ■■--- ■ --— ..■---.- . .„^J^U^SJIM^.^. -...Wl,.. ,. ^
(
22.
R allows us to eliminate all but two of the recently-published source models
as applicable to these earthquakes; in this way we find that R is a successful
discriminant among competing source models.
E. A Scaling Law for Explosions in Tuff, W. A. Peppin, manuscript near completion.
Considerable disagreement exists in the literature on the nature of under-
ground nuclear explosions as seismic sources. As a result, authors disagree
on the exact cause of the surface wave-body wave, or Ms:mb discriminant between
earthquake and underground nuclear explosions. In this paper we have studied
data which e^em incapable of explanation by existing source models for explosions.
We have accordingly constructed a model which does satisfy these data, but which
differs from existing models in several important respects. We summarize the
paper in three parts as follows: (1) the relevant data, (2) the construction
of theoretical seismograms, and (3) the construction of scaling curves for
explosions in tuff.
1. The relevant data
Of the large amount of data I have investigated, there are six classes of
observations that appear to be crucial in the construction of a source model
for explosions: (1) the ratio between body- and surface-wave amplitude is con-
sistently higher (by a factor of 5 to 20) for explosions than for earthquakes of
the same body-wave magnitude (SIPRI, 1968; Evernden et al., 1971; McEvilly and
Peppin, 1972; Peppin and McEvilly, 1974); (2) at near-regional distances, 0.8
to 1.0-Hz P-wave amplitudes scale linearly (unit slope) with 12-8econd Rayleigh-
wave amplitude from ca. 5 to 1100 ktons (Springer and Hannon, 1973, Figure 3;
Peppin, 1976, Figures 5a-5c); (3) the observed close-in spectra of explosions
fired in tuff are flat in displacement from 0.2 to 1.5 Hz, showing not more
than 1.5-to-l spectral overshoot (Rodean, 1971, p. 61; Peppin, 1976 Figures 2, 3);
.1 ■■- icii.r.1 ..-....- . -.-.-, ....^ ,, ^.■■-. . ■LnLiiin. '— ..,■-.- ■-..■ , -■■- ■ ^
23.
(4) the surface waves of explosions and their hole collapses are almost always
very similar in form, but 180° out of phase (Smith, 1963; McEvllly and Peppln,
1972, Figure 2); (5) close-in accelerometer data for explosions show that con-
siderable SV energy leaves the source; and (6) close-in displacement spectra
of explosions decay to high frequency as frequency cubed or (frequency) .
Observation (1) is satisfied by modelling an explosion in large part as a
center of dilatation which injects volume into the medium (a pure source of
compression). Observations (2), (3), and (6) are crucial in the construction
of scaling curves. Observations (A) and (5) appear to require that the explo-
sion source consist in part of an upward force impulse; a center of dilatation
alone cannot satisfy these data using (possibly inapplicable) elasticity theory.
2. Construction of theoretical seismograms
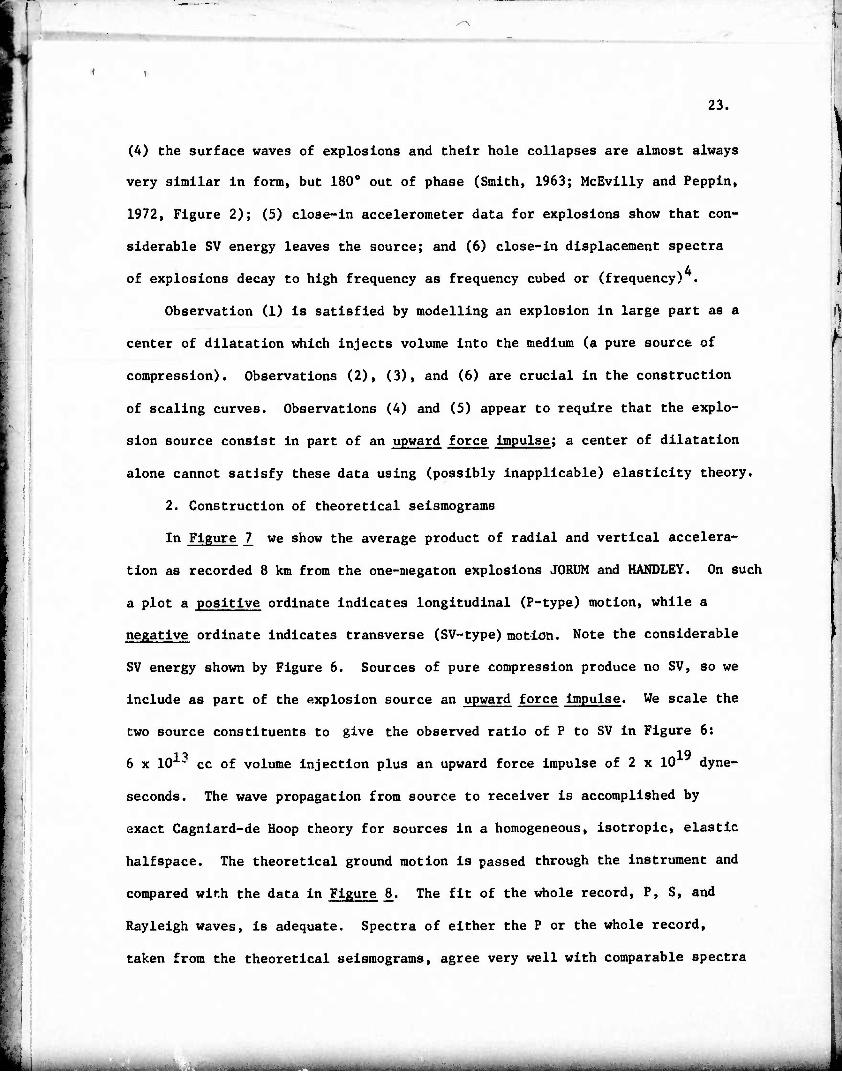
In Figure ]_ we show the average product of radial and vertical accelera-
tion as recorded 8 km from the one-megaton explosions JORUM and HANDLEY. On such
a plot a positive ordinate indicates longitudinal (P-type) motion, while a
negative ordinate indicates transverse (SV-type) motion. Note the considerable
SV energy shown by Figure 6. Sources of pure compression produce no SV, so we
Include as part of the explosion source an upward force impulse. We scale the
two source constituents to give the observed ratio of P to SV in Figure 6:
6 x 10 - cc of volume injection plus an upward force impulse of 2 x 10 dyne-
seconds. The wave propagation from source to receiver is accomplished by
exact Cagniard-de Hoop theory for sources in a homogeneous, Isotropie, elastic
halfspace. The theoretical ground motion is passed through the instrument and
compared with the data in Figure 8. The fit of the whole record, P, S, and
Raylelgh waves, is adequate. Spectra of either the P or the whole record,
taken from the theoretical seismograms, agree very well with comparable spectra
WHWmmiMMtMiailMlWMil^^ mnMwifrlMiai
.-
r FIVE SUMMED EXPLOSIONS
VERTICAL x RADIAL
15-POINT SMOOTHING
TIME (SEC) 8 10
! (
Figure 7- Product of radial tunes vertical acceleration from
five stacked accelerograms of the one megaton explosions JORUM
and HANDIEY. Positive ordlnate shows longitudinal mot3on, and
negative ordlnate shows transverse motion. This figure shows that
a sizeable amount of S-wave energy leaves the source of these
explosions.
Miimif-i'iirfttiWBiittaiM^ ,»^m..v.,^uaia^^i^^fcu^m^^^^^ .. .. ,, r.^^^^^^^^*^«^*!^,.*^

mm:
S-wave Raylelgji wave i
RADIAL
-r-
5 L>rival time In seconds (tune 0 - orxgin
6 time)
nmre 8. owarison or c.se^ accede, aata with t^UoaX seiSm0-
grams using source maäel described in text.
■ : . ■ ■ ._ai^ _, .„:„..,.:. . ■ .^u:^^^^m:^m^^i^^^aiu^mMiimaii^^ .^..la^t^ji^^,-^,^.^-^...^^.^,^;^,,,:,,.,.,^..,^..,^,^^,.^ ^..^^iimüt^
24.
of the data. It was crucial in obtaining even the fit shown in Figure 7 thtt
the far-field source spectrum of the explosion decay to high frequency as
frequency cubed; this has important consequences in the construction of the
scaling curves, shown in the next section.
3. Construction of the scaling curves.
The following features were built into the scaling curves we present in this
section: (a) decay as frequency cubed to high frequency; (b) relatively slow
shifting of the spectral corner frequency with yield (as (yield) ' ), in
agreement with the data of Peppin (1976), but in disagreement virh other publi-
shed scaling curves; (c) a secondary corner frequency, thought to measure source
radius, that scales according to the results of Mueller and Murphy (1971); (d)
the primary spectral corner frequencies at 1100 and 150 kt agree with observations
by Peppin (1976) for JORUM, HANDLEY, and PIPKIN, and with the data of Werth and
Herbst (1963) at 1.7 ktons for RAINER. We present the scaling curves in Figure 9.
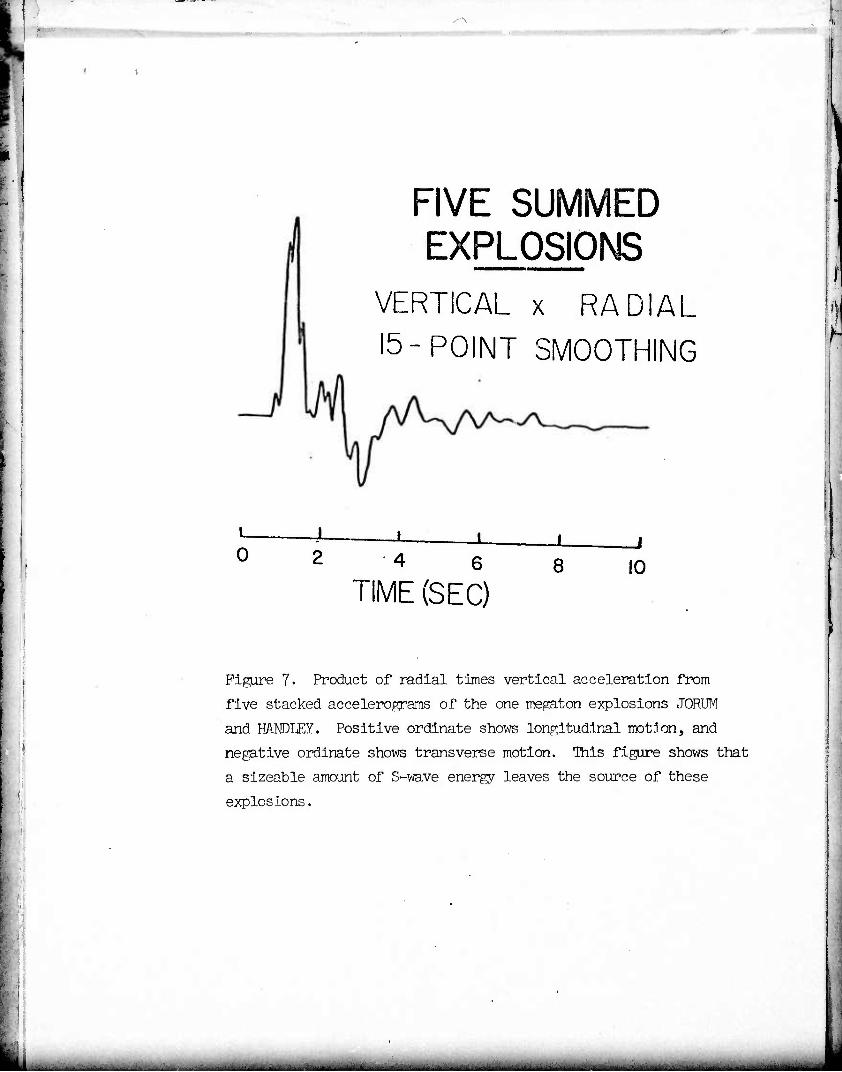
Consider a plot of 12-second Rayleigh amplitude versus 4.0-Hz Pg spectral
amplitude. This is shown in Figure 10, for explosions which range from 5 to 1100
ktons in yield. Unlike all other scaling curves published, only those of Figure
8 can satisfy these data (the predicted relation is shown also in Figure 9,
together with predicted relations from two other recently-published studies for
comparison). On the other hand, a significant objection can be raised against
these curves, namely the following fact: at teleseismic distances, explosion
spectra—both P and Rayleigh wave—appear to diminish toward long periods (Molnar,
et al., 1969). Some recently-collected data on the University of California
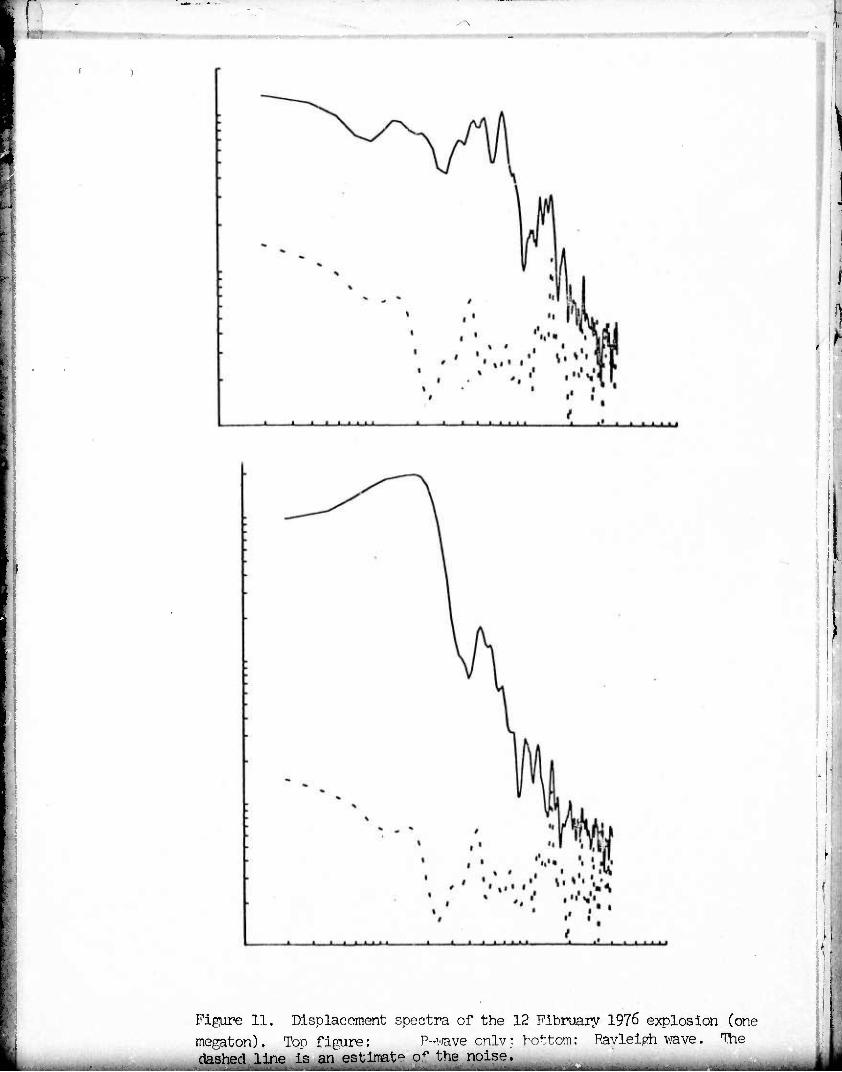
long-period displacement system at Jamestown is of interest here (Figure 11).
These show flat spectra from 40 seconds to the corner frequency for both P and
Rayl-igh waves. Aside from the fact that these spectra corroborate the scaling
curves of Figure 8, they are the only such spectra ever published for explosions.
_._. , _, , _...^: I ■ ■-■■..,J..I..-.. __._..„_,■ a.^ _• _.^_.„_._,:. _i._.„ ■ ,_ _• _..:_., ,__ ;._„..J..

\
SOURCE MODEL FOR TUFF
source dimension time function corner corner.
frequency(Hz} j00
amplitude (units of yield) IOOO
Figure 9. Scaling curves Intended to be specific to explosions fired In
tuff. Primary comer frequency scales with the source time duration, and
the secondary one scales with the source dimension according to Murphy and
Mueller (1971). Warning: no claim Is made here that these curves are gen-
erally valid; they are based on only four explosions.
jAtM,,; u.^.^^mUl^MIliU. «^^««».•■.-.^■^M.;.^.^^ ..ijj: :».;L.:-1,i__^li.».:c1_iiiS. i nMl-IrMMIMtlMI
-IO
icy 10 . 10 10 100 10
.8-1.0 Hz Pg spectral amplitude
o o o
o o
o
■4—
E a
Ü CD Q. (/)
a. N X o
w ■3
(D
o •H
I ft.
B •H
.c
CD "O
-p -p ^^ w
d is +3 .p
^
4^
Q-
H
-P ü 0 P. W
H
gj
u p o (D (Ü ft C
P-:
f o
d)
SI
-p
(D
to
p
p
p
bD s
w cö
CD "0
(1) I ra 8
<H -P a iH CD U
«d CD P Ü
•H d
p
p
s to
•H u 3
o p w CD & U
ra CM <^ o
I ra
ü CU CO
I CO P>
•H O r-l
^ I o 3 P rH O CO H K P-, -P
Ü < CD
a w to
P-.
IS]
5 o
•H
Ü
CO i
p I 15 rH CD
S UA
O rH
g a
o ra
«, -p
i § o > W . CD
. ..^I.-.: ..-.J,'.-....:.:... .!. :-..^' MaMa^^to^..,..^^^^^^ ,.■:-. ..:^,.■......1.««.^^..^ ^"-^""'"«^^
■_*__. -:
Figure 11. Displacement spectra of the 12 Fibruary 1976 explosion (one
megaton). Top figure; P--wave onlv: bottom: Rayleiph wave. The dashed line is an estimate o^ the noise.
..,_^„^_. . ■ ■.—^a...... ■■■-.^ ^...^ „ . ...,..__.,,„,........_....., ■ii'aligBtiriiiiilitiifaiiilflmli-niir
— -.* -
25.
Ihis provides clear evidence that the discrepancy between near-field data
of explosions (which show flat source spectra of explosions in tuff) and the
teleseismic data is a propagation effect. Perhaps the combination of pP reflec-
tion and slapdown conspire to annihilate the long periods which propagate to
teleseismic distances. The new spectral data will provide perhaps the last
crucial stimulus needed to pin down the complex circumstances which give rise
to the Ma:mb discriminant at near and at teleseismic. distances.
Conclusions
We have studied a broad class of close-in and near-regional data. These
data appear to demand a seismic source model for a one megaton explosion con-
sisting of: (1) the steplike (.6 second rise time) injection of 6 x lO1^ cc 0f
volume into the medium (with reasonable elastic moduli specified) and (2) an
19 upward force impulse of duration .6 second that imparts 2 x 10 dyne-second of
momentum to the mediur. The slow scaling of the primary corner frequency with
yield implies that this spectral parameter cannot be a measure of the equj.'ralent
source dimension, as this latter quantity is observed to scale more rapidly with
yield. Such a source model implies scaling curves for tuff different from other
published ones in that: (1) the primary corner frequency scales slowly, as
(yield) , (2) the high frequency fall-off is as frequency cubed, (3) the
long-period spectrum is flat from .025 to 1.0 Hz, showing slight or no overshoot.
This source model can satisfy our close-in and near-regional data as no other can.
The model contradicts Investigations of teleseismic distances of explosion seis-
mograms. We believe that the discrepancy is caused by some unaccounted-for near-
source effect such as the surface reflection; however, previous studies indicate
that the pP reflection alone cannot resolve the problem.
. .^m.^^,^.jM.^^liM.l,jai.tf|,M,a^ ^tiii^a^.,,...,. i -rrtMMifllli
26.
IV ABSTRACTS OF OTHER RECENT PUBLICATIONS
The following papers, all of which appeared in the last year, represent
work partly funded by AFOSR at the University of Nevada.
Ryall, A. and J. D. VanMormer, 1975. Field-seismic investigation of the
Oroville, California earthquakes of August, 1975, Oroville, California,
Earthquake of 1 August, 1975, California Div. Mines and Geology, Special
Report 124, R. Sherburne and C. - auge Ed.
ABSTRACT. The Oroville earthquake of August 1, 1975 (ML ■ 5.7) occurred
in an area of relatively low seismicity, 10 km from Lake Oroville (height
of dam 210 meters, 4,364 x 10 m capacity), seven years after initial
filling of the lake but only a month after the most rapid filling since
1968 (L. Fredrickson, personal communication). The main shock occurred
eight seconds after a magnitude 4.5 foreshock, and according to T. V.
McEvilly (personal communication), the two events were colocated (39°
26.3% 121* 31.7'W, depth 8 km). This location is on the eastern edge of
the Great Valley of California, in a zone separating valley sediments to
the west from Tertiary volcanics, Mesozoic intrusives, metavolcanics, and
Paleozoic marine deposits of the Sierra Nevada foothills to the east. In
general, lineaments in the vicinity of Lake Oroville trend about N 15° W,
and those to the west trend N. 35° W - N 40° W. One lineament on the
skylab photograph coincides with ground cracking observed just south of
Wyandotte (39° 25.9% 121* 28.1,W), and passes within 2 kilometers of the
lake.
Ryall, A. and Priestley, K., 1975. Seismicity, secular strain, and maximum
magnitude in the Excelsior Mountains area of western Nevada and
eastern California, Bull. Geol. Soc. Am., 86, 1585-1592.
^a^MM»A«^^uW.am»^,.^^^ ,i»^.,,..,.,..;.......^^M,;.^^^.a^^
■ „_ .
I
27.
ABSTRACT. Seismlcity in the Excelsior Mountains area appears to have been an
order of magnitude higher for at least several decades than that which
preceded great earthquakes in central Nevada in 1915 and 1954. A high
degree of crustal fracturing is indicated for the area by complex geology
and by a scattered distribution of epicenters. A composite fault-plane
solution is similar to those for large shocks at Fairview Peak and Rain-
bow Mountain in 1954, which shows the the same regional stress field is
acting to produce earthquakes in both areas. The slope of the recurrence
curve, or b value, is higher than average for the Nevada region. Crustal
.strains recorded at Mina indicate that periods of strain build-up alternate
with periods of strain release. Comparison of these characteristics with
results of laboratory experiments and observations in other regions sug-
gests that the area is one in which a moderate level of tectonic stress
combined with a high degree of crustal fracturing leads to strain release
by a continuing series of small-to-moderate earthquakes and fault creep.
If so, the magnitude of 6 1/4 tot the 1934 Excelsior Mountains earthquake
may represent a maximum magnitude for this area.
Douglas, B. M. and Ryall, A., 1975. Return periods for rock acceleration
in western Nevada, Bull. Seism. Soc. Am., 65, #6, 1599-1611.
ABSTRACT. A method is described for determining expected acceleration
return periods, based on calculations involving magnitude, fault length
and distance to the causative fault. The method permits earthquake magni-
tude and duration of strong motion to be associated with these return
periods. In addition, because attenuation equations are in terms of distance
to the causative fault, instead of focal distance, sites can be considered
which are in the immediate vicinity of potential faults. Results of calcu-
lations indicate that for an average site in the western Nevada region
— --- -
28.
maximum-amplitude, maximum-duration ground motion has a recurrence time
of the order of thousands of years. This result, based on a relatively
brief sample of Instrumental data. Is entirely consistent with geological
field data representing time periods two to three orders of magnitude
longer. Smaller ground motions have correspondingly smaller return periods,
down to about a decade for accelerations greater than 0.1 g, when caused
by all earthquakes with magnitude 5 or greater. Our results indicate that
evaluation of seismic risk in terms of a single peak ground-motion para-
meter may lead to risk estimates which are several times too high.
Savage, W. ü. 1S75. Earth Probability Models; Recurrence Curvas, Aftershocks
and Clusters, university of Nevada-Reno Ph.D. Dissertation; 137 pp.
ABSTRACT. The application of the one-dimensional Poisson probability model
to magnitude- and time-series of earthquakes can be an Important aid in
further understanding of the physics of earthquake occurrence, yet there
are many features of earthquake sequences that are not described by the
simple Poisson mc H1. From a detailed examination of the axiomatic basis
of the Poisson process in the context of observed earthquake magnitude-
frequency and occurrence-frequency distributions, specific non-Poisson
earthquake behavior patterns are identified and isolated for further study.
Emphasis is placed on understanding the process of earthquake occurrence
rather than on the determination of accurate mathematical models.
The frequency distribution of magnitude has been extensively dis-
cussed in terms of the linear relationship log N » a - bM. The Poisson
basis of the law is reviewed so as to apply proper statistical procedures
to evaluate data samples consistently and accurately. In studying the
Poisson behavior of magnitude distributions, three non-Poisson elements
...,.'..■;,.,..,.^.».......^. ..i-^M^fa^^tiwiMmaii'filiilillfillii'liitf liii^ - "-*"■' -"■■^•■'.-'■•^ ■ iMaMmwatiMiwar""'^--1'-""'---^'"- .. . . „..^^»J,^
_M _ . * __ ■ ■ ■ ,
29.
must be considered in order to perform a mathematically valid analysis
of b-values: determination of the minimum magnitude cutoff needed to
define a complete catalog, possible non-random characteristics of the
largest events, and magnitude-value biases or other sources of nonlinear
magnitude-frequency distributions. Close examination of the cumulative
magnitude-frequency plot combined with use of the maximum likelihood
estimator of b is the best b value analysis technique. In the analysis
of specific samples of fnreshocks and aftershocks, it is found that the
proposed dependence on compressive stress level within a fracture zone is
not statistically supported at a high confidence level.
For earthquake time-series, three processes based on the Poisson
model appear to describe earthquake behavior. The first is a simple
Poiscou occurrence of independent earthquakes that has a stationary or
slowly time-varying occurrence rate. The second is the triggered process
of aftershock occurrence, in which one of the independent events in the
simple Poisson process initiates a single sequence or multiple sequences
of aftershocks. Each aftershock sequence is composed of Poisson-
distributed independent events that follow an approximately hyperbolically
decaying rate law, with the trigger event generally of magnitude 4.0 or
larger. The third process is that of microearthquake clustering, occurring
among earthquakes of magnitude up to between 3.0 and 4.0. Clustering is
defined by spatial and temporal relatedness among earthquakes and is
identified in the seismically active regions of Nevada and central California.
A cluster is not characterized by a trigger event, but each cluster is
composed of events with magnitudes independent of one another. The cluster-
size frequency distribution is described by an inverse power law with
■. ■■... .■.,.. ^-...^.^
t:Mr,«k.^-»J>JaMMttiiita ^l^aMM^"»"»"^-^"'^"^'-"-^-»"^^^ - —

30.
with exponent near 3.5. Spatial and teuiporal statistical features of
clustering are analogous to those of the aftershock process in most
respects, but the pattern of energy release is synr-aetric about the center
of the cluster in contrast to the major energy release occurring with
the trigger event of an a'terchock sequence. Comparisons with laboratory
experiments suggest that the predominant occurrence of clusters of earth-
quakes containing events differ'ng by lecn than omi-half magnitude unit ic
asocciatcd with the suall size of the source voltcaes of the clustered
events and apparent rapid viscoclastic relo-.ding of the initial clip
surface.
Ryall, A., Peppin, U. A. and J. D. VcnWoraer, 1976. Field-soissaic investi-
gation of the August, 1275 Oroville-, California earthquake sequeaco,
submitted to Engineering Geology.
ABSTIEGT. Several thousand aftershocks of the August 1, 1975 Oroville,
California earthquake (Mt =5.7) were recorded by an 8-8tation fiold-saieal
network. Focal coordinates of 104 of these events -ere fit by least-
squares to a plane striking N 07'' W and dipping 59° U; the strike (but rat
the dip) of this plar^e is in good agreenant with that (IT C90 W) obtained
from a faultplane solution for a large foreshock 0 seconds before the main
shock, and it agrees fairly well with the trend (N 15° W) of structural
lineaments in the vicinity of lake Oroville. The surface trace of the
plane of fcci passes through the Oroville Dan, as well as through surface
cracking 12 km south of the dam. The main chock occurred 7 j'aar« after
the filling of Lake Oroville, but only a month after the most rapid filling
since 1963. The rate of aftershock occurrence during the first month
decayed approximately as 1/t. Event duration was measured for uoro than
2,000 aftershocks during August and September; average leg-duration, t-rken
■_ _, -..^..■i,....,-.-^ ^^_^i
31.
over samples of 100 events, decreased gradually during this period.
Close-in spectra obtained from strong-motion recordings of several of the
larger aftershocks have corner frequencies that are quite high compared
to other western U. S. earthquakes of similar magnitude. The Oroville
earthquakea had several features in common with another Sierra Nevada
earthquake sequence, near Truckee, California, in September, 1966.
Richins, W. D. and Ryall, A., 1976. Earthquake swara near Denio, Nevada,
February to April, 1973 and possible relation of northwest Nevada
earthquakes to geothermal activity, submitted for publication.
ABSTRACT. Historic seismicity in northwest Nevada has been lower by an
order of magnitude than that in the west-central p*.tt of the region. During
the last century no earthquake with magnitude greater than 5 3/4 has occur-
red in the northwest part of the state, and shocks with M > 5 have generally
been associated with Fwarms. In addition, the earthquake swarms are spati-
ally correlated with geothermal activity. One such swarm occurred during
February, March, and April, 1973, twenty kilometers south of Denio on the
Nevada/Oregon border. The largest event of the sequence was a magnitude
5.3 shock on 3 March. Fault plane solutions indicate right-lateral oblique-
slip motion on a plane striking N 11° W and dipping 60° E. This mechanism
is very similar to those of the 1954 Fairview Peak and other earthquakes
in the western Basin and Range, and is consistent with regional extension
In a WIIW-ESE direction. During March and April, a small tripartite array
recorded more than 1,500 events of this sequence, and 221 of them were
selected for detailed analysis. Epicenters of these events fall in a north-
south trending zone, 8 kilometers in length and 2 kilometers wide; focal
depths range from 5 1/2 to 8 1/2 kilometers. The b-value for this sequence
■MlliB^MM-"..^, - - ;. .. . ■.-.^"-'«-"'■i, ^.tia-»^,«^...^,.,...,,.,«.^.^^,^^
I '.
32.
is 1.00 which is higher than 0.81 found for northwest Nevada as a whole.
High b-values have been found in laboratory experiments for heterogeneous
materials and for rocks under low to moderate stress.
V. SEISMIC SOURCE THEORY: CURRENT KNOWLEDGE
This section is intended as a summary of what we have learned about seismic
source theory during the NFP. We discuss: (1) what has been established about
earthquake sources, (2) what remains unknown about earthquake source, (3) what
data reüiains to be collected, and (4) what causes the body wave-surface wave
discriminant between earthquakes and underground nuclear explosions.
A. \lhat Has teen Learned of Earthquake Sources
The most ir.portant finding of the "FP is that Haskell (1964) dislocation
theory serves as an adequate model of the earthquake source. That is, long-period
spectra of earthquakeippnr to be flat, not peaked, so that we need not invoke
a more complex theory depending upon tectonic stress (Archambeau's (1968) theory
with Rs finite). The more complex recent theories such as Madariaga (1976) also
predict flat source spectra. For all its complexity, such theory has really told
us nothing of first-order importance. According to Madariaga, the displacement
on the fault tapers off to zero at the edges, a much more physically plausible
model cha:. the uniform slip of Haskell (1964). However, Haskell theory is easily
modified to incorporate this feature (see Sato and Hirasawa, 1973). This detail
does not affect the long-period spectrum, but profoundly influences the estimated
stress drop. This latter parameter has not proved to be informative so far.
JJ. What Remains Unknown of Earthquake Sources
A constant theme runs through all the above-described work on source theory.
We still cannot be certain that we understand what is causing the observed spectral
corner frequency of seismic sources. All published papers on source theory infer
'
■ - — ■■- - - ««^ - — ■ ■ ■-■-- - ■■■- --■ — —i
33.
or utilize a direct, linear scaling of faulting length with spectral source
corner frequency (although it is certainly true that the constant of proportion-
ality varies quite widely among different theories). Cogent arguments are
advanced as to why this should be true. They usually conclude that the source
rise time is shorter than the transit time of elastic waves across the zone of
faulting, and thus cannot itself be the cause of the observed corner frequencies.
However, these arguments are dependent on several assumptions suspected to be
invalid near the source, e.g. that elasticity theory holds, that viscoelastic
or viscous creep effects not control the corner frequencies. If earthquakes
consist in large part of creep events (as appears to be the case for some recent
Central Cilifornia earthquakes), then the rise time might be much longer than
r-'? r.v believed. Significantly, this point can be investigated by seismic
r.ethods. Alr.ost any model of faulting in which the rise time is short will
predict an azinuthal variation in spectral corner frequency due to the geometry
of the zone of faulting. In contrast, if the corner frequency is caused by the
rise time, it would ba invariant at all azimuths of observation, consistent with
the data of Peppin and Simila (1976). A primary goal for future work should be
to make the required observations; we now have NSF support to carry out precisely
this task.
A deeper and more fundamental gap in our knowledge is just what an earthquake
consists of. Our usual models employ equivalent elastic wave theory on idealized,
planar faults. The real situation is almost certainly more complicated (e.g. en
echelon, multiple, parallel cracking in a volume around the fault). Therefore,
we have no real understanding of why or when earthquakes occur, or even if this
information is Itself of potential interest. The NFP has, in many respects,
carried the seismic observations of particular earthquakes to an extreme. If we
are to answer these more fundamental questions, it is likely that expensive in
situ experiments will be needed.
tt—^MiM |iiM^|t|,|j^ - iiaWlMflimi^..---.--^^^^ ■ riiiiUMMiaiMliiiittiiMlllilil
K' - ■^-' m.-.^*?*^-
•
34.
£• What Data Remains to be Collected
In my opinion, the NFP failed in two respects to acquire the best possible
seismic data. First, the Central California region is one characterized by quite
severe attenuation and highly variable geology. Thus, one is never sure when
variations in the data are cuased by some unaccountable propagation effect.
Second, we were never able to record a suitable earthquake which would penalt
P- and S-waves to be studied at all azimuths. Thus, since the variation of these
quantities is Intimately related to rupture propagation, we were not able to
pinpoint the fault motions for the earthquakes we recorded.
D. Cause of the Msimb Discriminant
Our work indicates rather unequivocally that explosions fired in tuff possess
flat source spectra with spectral corner frequencies similar to those of nearby
earthquakes of the same body wave magnitude. Since earthquakes also have flat
spectra, we cannot explain the clear discrimination of these events based on tho
shape of the source spectrum, nor differences in the source dimension or courcc
rise time. We have found that near-regional data disagree with teleseismic data
in this regard. We suggest that, if we are to explain the Ms:mb discriminant
at all distances, that different explanations will be needed at very-near and
at far-teleseismic distances. This results from the fact that crisale eaves
leaving the explosion source upward may be entirely different from those leaving
downward, due to different seismic coupling, etc. The implications for rendering
seismic discrimination ineffective are not clear and perhaps not accessible
by seismic methods.
Discrimination must be applied at teleseismic distances in a practical appli-
cation. Thus, we might be content to rely on the oft-stated basis for discrimin-
ation: explosions act like pressure pulses, and earthquakes like shear dislocations.
Niifti(ifflii;''''Ti,Y-''",1f''ii;r;''- - . —-■ ^t-^- ■ :-- - ..-.^.^--^ ^ -^^ --^ -.t-.^-.. .--- ^ -.—■^-.-..■_^.

k1 . ■ ^.■.:-i3.-..,.
36.
ßrune, J, N., 1971. Correction, Jour. Geophys. Res.. 76, no. 20, 5002.
Brune, J. N. and King, C, 1967. Excitation of mantle Rayleigh waves of
period 100 seconds as a function of magnitude, Bull. Seism. Soc. Am., 57,
no. 6, 1355-1365.
Burridge, R., 1975. The effect of sonic rupture velocity on the ratio of S to
P corner frequencies. Bull. Seism. Soc. Am., 65, #3, 667-676.
Burridge, R. and Knopoff, L., 1964. Body force equivalents for seismic
•'islocations. Bull. Seism. Soc. Am., 54, no. 6, 1875-1888.
Cherry, J. T., Bache, T. C. Savino, J. M., and Archambeau, C. B., 1973.
A Deterministic Approach to the Prediction of Teleseismic Ground Motion
from Nuclear Exgloglons. ARPA semiannual technical report. Systems,
Science, and Software Corp.
Dahlen, F. A., 1974. On the ratio of P-wave to S-wave corner frequencies for
shallow earthquake sources. Bull. Seism. Soc. Am., 64, #4, 1159-1180.
Davies, J. B. and Smith, S. W., 1968. Source parameters of earthquakes, and
discrimination between earthquakes and nuclear explosions. Bull. Seism.
Soc. Am., 58, no. 5, 1503-1517.
Douglas, A., Hudson, J. A. and Kembhavi, V. K., 1971. The relative excitation
of seismic surface and body waves by point sources, Geophys. J. R. A. S^.,
23, 451-460.
Evernden, J. F., 1975. Further studies in seismic discrimination. Bull. Seism.
Soc. Am., 65, no. 2, 359-392.
Evernden, J. F. and Filson, J., 1971. Regional dependence of surface-wave
versus body-wave magnitude. Jour. Geophys. Res., _76, 3303-3308.
- P^CEDim **** BUMCflo, T *mms
— -T m-n.
..a..i.>a..J.;a....,,..,K-ü'^'..:..-:.„,.■ «.,..,j:^..,,. : J. .i/ -...^...»«j;/. ■^aaAai^..».wv...».:^.-^ ^■»^^■M.^w^^^Aaaaa
:
37.
Hart, R. S., Butler, R. and Kanamori, H., 1975. Surface wave and ultra long
period body wave constraints on the August 1, 1975 Oroville earthquake,
E©S, Trans. Am. Geophys. Un., 56, no. 12, 1023.
Haskell, N. A., 1964. Total energy and energy spectral density of elastic wave
radiation from propagating faults. Bull. Seism. Soc. Am., 54, #6, 1811-1842.
Helmberger, D. V., 1974. Generalized ray theory for shear dislocations.
Bull. Seism. Soc. Am., 64, no. 1, 45-64.
Helmberger, D. V. and Malone, S. D., 1975. Modeling local earthquakes as shear
dislocations in a layered half space. Jour. Geophys. Res., 80, no. 35,
4881-4888.
Johnson, L. R. and McEvilly, T. V., 1974. Near-field observations and source
parameters of Central California earthquakes. Bull. Seism. Soc. Am., 64,
m. 6, 1855-1886.
Keylis-Borok, V. I., 1961. The difference in the spectrum of surface waves in
earthquakes and explosions. Seismic Effects of Underground Explosions, 0 "tu.
Schmidt Institute of Geophysics Transactions, 182, no. 15.
Leet, L. D., 1962. The detection of underground explosions. Sei. Am., 206,
no. 6, 55-59.
Liebermann, R. C. and Pomeroy, P. W., 196^. Relative excitation of surface waves
by earthquakes and underground explosions. Jour. Geophys. Res., 74, no. 6,
1575-1590.
Lynch, R. D., 1969. Response spectra for Pahute Mesa nuclear events.
Bull. Seism. Soc. Am., 59, no. 6, 2295-2310.
iladariaga, R., 1976. Dynamics of an expanding circular crack. Bull. Seism. Soc.
Am., June, in press.
^■■^^..^.^aMte^^^^

ft ,
38.
Malone, S. D., 1974. Observations of the static displacement field from a
medium sized nearby earthquake, E6S, Trans. Am. Geophys. Un., 56, no. 12,
1148.
Marshall, P. D., 1970. Aspects of the spectral differences between earthquakes
and underground explosions, Geophys. J. R. A. J5., 20, 397-416.
McEvilly, T. V. and Peppin, W. A., 1972. Source characteristics of earthquakes,
explosions, and after-events, Geophys. J. R. A. ]>., 31, 67-82.
Molnar, P., Savino, J., Sykes, L, R., Liebermann, R. C, Hade, G., and Pomeroy,
P. W., 1969. Small earthquakes and explosions in Western North America
recorded by new high gain, long period seismographs. Nature, 224, 1268-1273.
Molnar, P., B. E. Tucker, and J. N. Brune, 1973. Corner frequencies of P and S
waves and models of earthquake sources. Bull. Seism. Soc. Am., 63, #6,
2091-2.'.04.
Murphy, J. R., and Mueller, R. A., 1971. Seismic characteristics of underground
nuclear detonations. Part II. Elastic energy. Bull. Seism. Soc. Am., 61,
no. 6, 1693-1704.
Peppin, W. A., 1974. The Cause of the Body Wave-Surface Wave Discriminant
between Earthquakes and Underground Nuclear Explosions at Near-Regional
Distances, Ph.D. Thesis, University of California at Berkeley.
Peppin, W. A. and McEvilly, T. V., 1974. Discrimination among small magnitude
events on Nevada Test Site, Geophys. J. R. A. S^., 37.» no' 2» 227-244.
Peppin, W. A., 1976. P-wave spectra of Nevada Test Site events at near and
very-near distances: implications for a body wave-surface wave discriminant.
Bull. Seism. Soc. Am., 66, June, in press.
Peppin, W. A. and Simila, G. W., 1976. P- and SV-wave corner frequencies over
low-low paths: a discriminant for earthquake source theories? Jour. Phys.
Earth, submitted for publication.
■ • -■■-- ^- - ■ - .,■..-,-—... .. .-.■.■ . -^,.-.. ■.. ._ —...— ..^■_ ^ -,.. ■,...^
39.
Pitt, A. M. and Steeples, D. W,, 1975. Microearthquakes in the Mono Lake-
Northern Owens Valley, California Region from September 28 to October 18,
1970, Bull. Seism. Soc. Am., 6_5, no. 4, 835-844.
Rodeln, H. C., 1971. Nuclear Explosion Seismology. U.S.A.E.G. Division of
Technical Information.
Sato, T. and Hirasawa, T., 1973. Body wave spectra from propagating shear
cracks. Jour. Phys. Earth. 21, H, 415-432.
Savage, J. C., 1972. The relation of corner frequency to fault dimensions.
Jour. Geophys. Res. , _7Z» 3788-3795.
SIPRI, 1968. Seismic Methods for Monitoring Underground Explosions, Ii:t. Inst.
for Peace and Gonflict Research, (SIPRI), David Davies Ed.
Smith, S. W., 1963. Generation of seismic waves by underground explosions
and collapse of cavities. Jour. Geophys. Res.. 68, no. 5, 1- :""'-l'>83.
Springer, D. L. and Hannon, W. J., 1973. Amplituue-yield scaling for underground
explosions. Bull. Seism. Soc. Am., 63, 477-500.
Stump, B. E., 1974. P and S wave corner frequencies observed in the near P
and the effect of attenuation, E«S, Transactions. Amer s Geophys. Union.
56, no. 12, 1148.
Tsai, Y., 1972. Utility of Tsal/s Method for Seismic Discrimination.
semiannual technical report, Texas Instruments Corp.
Tsai, Y. and Aki, K., 1971. Amplitude spectra of surface waves from small
earthquakes and underground nuclear explosions. Jour. Geophys. Res.. 76,
no. 17, 3940-3952.
Tucker, B. E. and Brune, J. N., 1975. Source mechanism and surface wave excita-
tion for aftershocks of the San Fernando earthquake, unpublished manuscript.
._Joü^_; ■-»- . . : .-. ■ ...:■.-,, -,.,;:.■...„.. -,..„ ^....J ^ ;./ ■■-..: . ...-.■ .- . v . ■ ■ ■-;......,■ ■■ ■■■ ,.,^,. „t. ■.„-;., aa.al

H*M> ja t ,,
40.
Werth, G. C. and Herbst, R. F., 1963. Comparison of amplitudes of seismic
waves from nuclear explosions In four mediums. Jour. Geophys. Res., 68,
no. 5, 1463-1475.
Wyss, M. and Brune, J. N., 1970. Dimensions of nuclear explosions and small,
shallow earthquakes. Wood's Hole Conference on Seismic Discrimination,
July 20-23, 1970. Proceedings. 2.
Wyss, M., Brune, J. N., Hanks, T. C, and Tucker, B. £., 1970. Source dimensions
of nuclear explosions and small shallow earthquakes. Wood's Hole Conference
on Seismic Discrimination. July 20-23, 1970. Proceedings. 2.
VII. PUBLICATIONS COMPLETED DURING THE NEAR-FIELD PROJECT
Douglas, B. M. and A. Ryall (1975). Return periods for reck acceleration in the
Nevada seismic zone. Bull. Seism. Soc. Am., 65 (6), 1599-1611.
Gupta, I. N. (1973a). Dilatancy and premonitory variations of P, S travel times,
Bull. Seism. Soc. Am., 63, 1157-1161.
Gupta, I. N. (1973b). Premonitory changes in she^r velocity anisotropy in Nevada,
Proc. Conf. on Tectonic Problems of the San Andreas Fault System, Stanford
Univ., 479-488.
Gupta, I. N. (1973c). Premonitory variations in S-wave velocity anisotropy before
earthquakes in Nevada, Science. 182, 1129-1132.
Gupta, I, N. (1973d). Discussion on "Elastic velocity anisotropy in the presence
of an anisotropic initial stress" by F. A. Dahlen, Bull. Seism. Soc. Am.,
63 (3), 1174.
Koizumi, G. J., A. Ryall and K. F. Priestley (1973). Evidence for a high-velocity
lithospheric plate under northern Nevada, Bull. Seism. Soc. Am., 63,
2135-2144.
iuiiaUKl^... ,. ■.»Mt^m^mtmajjaaa. M^aa^...^...^....;. ,.l--.^M|lW|»nM..1,m.,.la-J.,i.aii^...: ■..■...^.^.»a^.^.i«^;..^^
41.
Peppin, W. A. (1975). Spectral investigations of the 1 August 1975 Oroville
earthquake sequence, Calif. Dlv. Mines and Geology, Spec. Report 124,
109-114.
Peppin, W. A., 1976a. P=wave spectra of Nevada 1. ite events at near and
very-near distances: implications for a near-regional body wave-surface
wave discriminant, Bull. Seism. Soc. Am., 66, June, in press.
Peppin, W. A., 1976b. An explosion source model for tuff, in preparation.
Peppin, W. A. and Simila, G. W., 1976. P- and SV-wave corner frequencies over
low-loss paths: a discriminant for earthquake source theories? Jour.
Physics Earth, submitted for publication.
Priestley, K. F. (1975). Possible premonitory strain changes associated with
an earthquake swarm near Mina, Nevada, Pure and Appl. Geophys., 113, 251-256.
Richins, W. D. (1974). Earthquake Swarm Near Denio, Nevada, February to April,
1973. Univ. Nevada MS Thesis, 57 pp.
Richins, W. D. and A. Ryall (1976). Northern Nevada earthquake swarm. February
to April, 1973, and possible relation to geothermal activity, submitted to
Bull. Seism. Soc. Am.
Ryall, A., W. U. Savage and C. J. Koizumi (1974). Seismic potential in the
western Nevada/eastern California region, Proc. Fifth World Conf. Earthquake
Engineering. 2, 1729-1732.
Ryall, A. and W. U. Savage (1974). S-wave splitting: key to earthquake
prediction? Bull. Seism. Soc. Am., 64 (6), 1943-1951.
Ryall, A. and K. F. Priestley (1975). Selsmicity, secular strain and maximum
magnitude in the Excelsior Mountains area, western Nevada and eastern
California, Bull. Geol. Soc. Am., 86, 1585-1592.
■ ■nn ■ ■ i- , .11 MimUumM - ■ — ■■■ ■ ■ - - '■-- --■ -' ;'~-''-'"-- ' ■ '■ -■ 'j " TiiiiitiTiiriiiinililtiil

UNCLASSIPIFD SECURITY CUASSI PICA WON Uf-I HIS PAGE (Wh»n i-Cir« f <d)
rs
I* F /I If I NEAR FIELD 5MLL EARTHQUME LCNG PERIOD
iPECTRÖM# ;
1. REPO
AFOS
f REPORT DOCUMENTATION PAGE
R -TR- 76" ^'IILJ^ 2. COVT ACCESSION NO
ITLE fand Sub(((l»;
7. AUTHOR£ll__
^/jji William-A^/Pepp in / /
9. PERFORMING ORGANIZATION NAME AND ADDRESS
Seismological Laboratory - ffeckay School of Mines «/ Uhiversity of Ne^da, Reno, NV 89507
READ INSTRUCTIONS BEFORE COMPLETING FORM
3. RECIPIENT'S CATALOG NUMBER
5. TYPE OF REPORT & PERIOD COVERED
. FINAL nV0l/73 - 12/20/75 C. PERFORMING ORG. REPORT NUMBER
U CONTRACT OR GRANT NUMBERf»)
' PM620-72-C-0Ö69
v V f\« ft* tnA / - l =-w I.HUR«M £mm)m\iu.
11. CONTROLLING OFFICE NAME AND ADDRESS
ARPA 1400 Wilson Blvd. Arlington. VA 22209
V
AREA A WORK UNIT NUMBERS
AC 213^6 2F10
rrm—
I2„''H
//
-»*¥*-"
ID MONITORING AGENCY NAME » ADDRESSf/.' dllltimt from Controlllna OHIc»)
Air Force Office of Scientific Research (MPG) Boiling AFB, BMg. 410 Washington, DC 20332
13V «qw 7— 42
15. SECURITY CLASS, fo/ thl» report;
UNCLASSIFIED
15« DECLASSIFICATION/DOWNGRADING SCHEDULE
16. DISTRIBUTION STATEMENT (ol this Report)
17. DISTRIB
Approved for public release; distribution unlimited
UTION STATEMENT fo/ «he «batrWTSrtwuJ rfn £HULIW; renf from Report)
■ ■ ■ ■ ■ ■
" '^ -#—
,4^ ^
Jg—^^PI EMENTARY NOTES—/
TECH, OTHER
19. KEY WORDS fCo.K/nue on reverse side // nece.sary and Ment//y by 6/orÄ .-.umber;
SOURCE THEORY SOURCE SPECTRUM NEAR-FIELD SPECTRUM SEISMIC DISCRIMINATIOM
NEAR-FIELD STUDIES SPECTRUM SOURCE Mstnto DISCRIMINANT
DISCRIMINANT
20. I ABSTRACT fCont/nue on rever.e aide f/necee.ery and/denary by block number; „ J- «- «♦.
WeWiomnute dlsnlacement spectra of explosion and earthauake seismoprams in an at- tenrot to study source narameters. ^e explosion data are at odds with several ^ recent source theories for explosions (e. e. flat P-^ave spectra from .025 to 1., Hz). These data are consistent with a study of trans-Sierra earthquakes in that the spectral comer frcauencv appears to be controlled by the source tline dura- tion.' These data should stimulate the investipatlon of source models for which the comer freauency measures the source time duration and not the source dimen-
I sion. •$—
nn urn. UNCLASSIFIED lIMLiliMillll iTiin nflnUBBrai
2 tag
42.
Ryall, A. and J. D. VanWormer (1975). Field-seismic investigation of the
Oroville, California, earthquakes of August, 1975, Calif. Div. Mines and
Geol., Spec. Report 124, 139-145.
Ryall, A., W. A. Peppin and J. D. VanWormer (1976). Field-seismic investigation
of the August, 1975 Oroville, California earthquake sequence, submitted to
Engineering Geol.
Ryall, A. and B. M. Douglas (1976). Selsmicity of northern Nevada related to
nuclear power plant siting, in preparation.
Savage, William U. (1975). Earthquake Probability Models; Recurrence Curves,
Aftershocks, and Clusters, Univ. Nevada PhD Dissertation, 137 pp.
■ ^.».--^.■—L-- ■ ■ ■ ....-■■ ,.(.,-. — - ■ - ^ ■ — ■— ■■ ■ ■ ..........1
Related Documents

![Computer Graphicsweb.cecs.pdx.edu/~lusi/CS447/slides/lecture_7_CS447_2017.pdfCanonical View Volume is the cube: [-1,1]×[-1,1]×[-1,1] Variants (later) with viewer looking down +z](https://static.cupdf.com/doc/110x72/5b23c2c27f8b9a4f4e8b627e/computer-lusics447slideslecture7cs4472017pdfcanonical-view-volume-is-the.jpg)