International Scientific Conference GEOBALCANICA 2018 15 APPLICATION OF ELECTRICAL RESISTIVITY TOMOGRAPHY FOR SAND UNDERWATER EXTRACTION DOI: http://dx.doi.org/10.18509/GBP.2018.02 UDC: 556.562(497.223) Maya Grigorova Ivaylo Koprev University of Mining and Geology “St. Ivan Rilski”, Bulgaria ABSTRACT The present research is performed to collect information about the presence, location and characteristics of sand and gravel in “Kriva bara” field and also its possible expansion. For this purpose is used one of the most high-resolution geophysical methods - electrical resistivity tomography (ERT). This is a geophysical technique for imaging sub-surface structures from electrical resistivity measurements made at the ground surface. The results illustrate the potential of electrical resistivity methods to separate different layers and monitor the subsurface based on electrical resistivity. This method proved to be very effective in mediums with comparatively different electrical resistivity properties and also offers non-destructive survey of the investigated area which is a key element in the modern geophysical prospection. Keywords: Electrical resistivity tomography (ERT), underwater extraction, geophysical prospection. INTRODUCTION Within the scope of the study is determination of the location, size and quality of the raw materials in the present “Pet mogili” deposit and also determination of the surrounding area (“Kriva bara” deposit) as its possible expansion. Considering the terrain and geological conditions of the area was designed electrical geophysical measurement. Electrical resistivity tomography is a useful method for characterising the sub-surface materials in terms of their electrical properties. Variations in electrical resistivity (or conductivity) typically correlate with variations in lithology, porosity and permeability, which may be used to map stratigraphic units, geological structure, fractures and groundwater. GEOLOGICAL - GEOGRAPHICAL FEATURE Area of "Kriva Bara" deposit is located in the left floodplain and the first overflowing terraces of the Iskar River. The terrain of the deposit is slightly hilly. Geographically it falls in the northeastern part of the Sofia valley. The geological structures of the deposit are presented the following lithostratigraphic units: - Quaternary - Alluvium; - Pliocene - Lozen's branch. The alluvial deposits include mostly clay, sand, with gravel (small and medium grain size). This clay covers the gravel-sand deposits throughout the area. According to the

Welcome message from author
This document is posted to help you gain knowledge. Please leave a comment to let me know what you think about it! Share it to your friends and learn new things together.
Transcript
International Scientific Conference GEOBALCANICA 2018
15
APPLICATION OF ELECTRICAL RESISTIVITY TOMOGRAPHY FOR SAND
UNDERWATER EXTRACTION
DOI: http://dx.doi.org/10.18509/GBP.2018.02
UDC: 556.562(497.223)
Maya Grigorova
Ivaylo Koprev University of Mining and Geology “St. Ivan Rilski”, Bulgaria
ABSTRACT
The present research is performed to collect information about the presence, location and
characteristics of sand and gravel in “Kriva bara” field and also its possible expansion.
For this purpose is used one of the most high-resolution geophysical methods - electrical
resistivity tomography (ERT). This is a geophysical technique for imaging sub-surface
structures from electrical resistivity measurements made at the ground surface. The
results illustrate the potential of electrical resistivity methods to separate different layers
and monitor the subsurface based on electrical resistivity. This method proved to be very
effective in mediums with comparatively different electrical resistivity properties and also
offers non-destructive survey of the investigated area which is a key element in the
modern geophysical prospection.
Keywords: Electrical resistivity tomography (ERT), underwater extraction, geophysical
prospection.
INTRODUCTION
Within the scope of the study is determination of the location, size and quality of the raw
materials in the present “Pet mogili” deposit and also determination of the surrounding
area (“Kriva bara” deposit) as its possible expansion.
Considering the terrain and geological conditions of the area was designed electrical
geophysical measurement. Electrical resistivity tomography is a useful method for
characterising the sub-surface materials in terms of their electrical properties. Variations
in electrical resistivity (or conductivity) typically correlate with variations in lithology,
porosity and permeability, which may be used to map stratigraphic units, geological
structure, fractures and groundwater.
GEOLOGICAL - GEOGRAPHICAL FEATURE
Area of "Kriva Bara" deposit is located in the left floodplain and the first overflowing
terraces of the Iskar River. The terrain of the deposit is slightly hilly. Geographically it
falls in the northeastern part of the Sofia valley.
The geological structures of the deposit are presented the following lithostratigraphic
units:
- Quaternary - Alluvium;
- Pliocene - Lozen's branch.
The alluvial deposits include mostly clay, sand, with gravel (small and medium grain
size). This clay covers the gravel-sand deposits throughout the area. According to the
Physical Geography
16
petrographic composition Iskar’s gravel is distinguished by predominant pieces of
granite, pegmatite, gneiss, quartz, quartzite, syenite, andesite, sandstone.
Under the alluvial deposits, Pliocene sediments are presented as follow clay, gravel,
(small and medium grain size), sand (finely grained). The power of Pliocene deposits
from the upper complex - Lozenets, for the region is set at 50-200 m [1].
DESCRIPTION OF THE TECHNOLOGY
In recent years geophysical methods have been commonly used to study alluvial plains,
the depositional mechanisms of river sediments, pollutant infiltration and etc. To
characterise the lithology and thickness of near water-bed materials is possible to be used
electrical resistivity tomography (ERT). This method has the potential to detect the near-
bed layer with significantly good resolution.
Electrical Resistivity Tomography (ERT) is one of the most useful geophysical methods
used to determine the subsurface’s resistivity distribution by making measurements
generally on the ground surface.
Variations in electrical resistivity typically correlate with variations in lithology, water
saturation, fluid conductivity, porosity and permeability, which may be used to map
stratigraphic units, geological structure, fractures and groundwater.
Two-dimensional electrical tomography surveys are usually carried out using a large
number of electrodes, 25 or more, connected to a multi-core cable [2].
The choice of the “best” array for a field survey depends on the type of structure to be
mapped, the sensitivity of the resistivity meter and the background noise level. In this
case study one of the most commonly used arrays for 2-D imaging the Wenner array is
preferred. Among the characteristics of an array that should be considered are:
- The depth of investigation;
- The sensitivity of the array to vertical and horizontal changes in the subsurface
resistivity;
- The horizontal data coverage and the signal strength [3].
ERT data are rapidly collected with an automated multi-electrode resistivity meter
Advanced Resistivity Scanner (ARS). It allows you to look for metals, minerals, caves,
voids and water. This is achieved through resistivity analysis. The ARS send electrical
current in the soil using 2 or 4 probes for depth up to 200 meters.
The measurements include inserting two probes half way in the ground. The device is
placed in the middle of the probes. The farther the probes are one from another, the deeper
the scan goes, so the lenght of the cable is very important. Standard equipment includes
4 cables (probes) of 25m which means that it could be reached depth up to 50 meters with
2 probes and 25 meters with the use of 4 probes. ARS runs with 110V therefore can
achieve up to 200m depth below the surface. ARS analyse the soil layers by layers and
tell the result on the screen then automatically export data to a PC.
RESULTS AND INTERPRETATION
Data processing is based on an iterative routine involving determination of a two-
dimensional (2D) model of the subsurface, which is then compared to the observed data
and revised. ERT data processing and modelling were done using the RES2DINV. This
is a computer program that automatically determines the 2D resistivity model for the data
obtained [4]. The program makes inversion by dividing the original data into rectangular
International Scientific Conference GEOBALCANICA 2018
17
bocks. The program uses the forward modelling to calculate the apparent resistivity value
[5]. The results from such surveys are plotted in the form of a pseudosection which gives
an approximate picture of the subsurface geology [6].
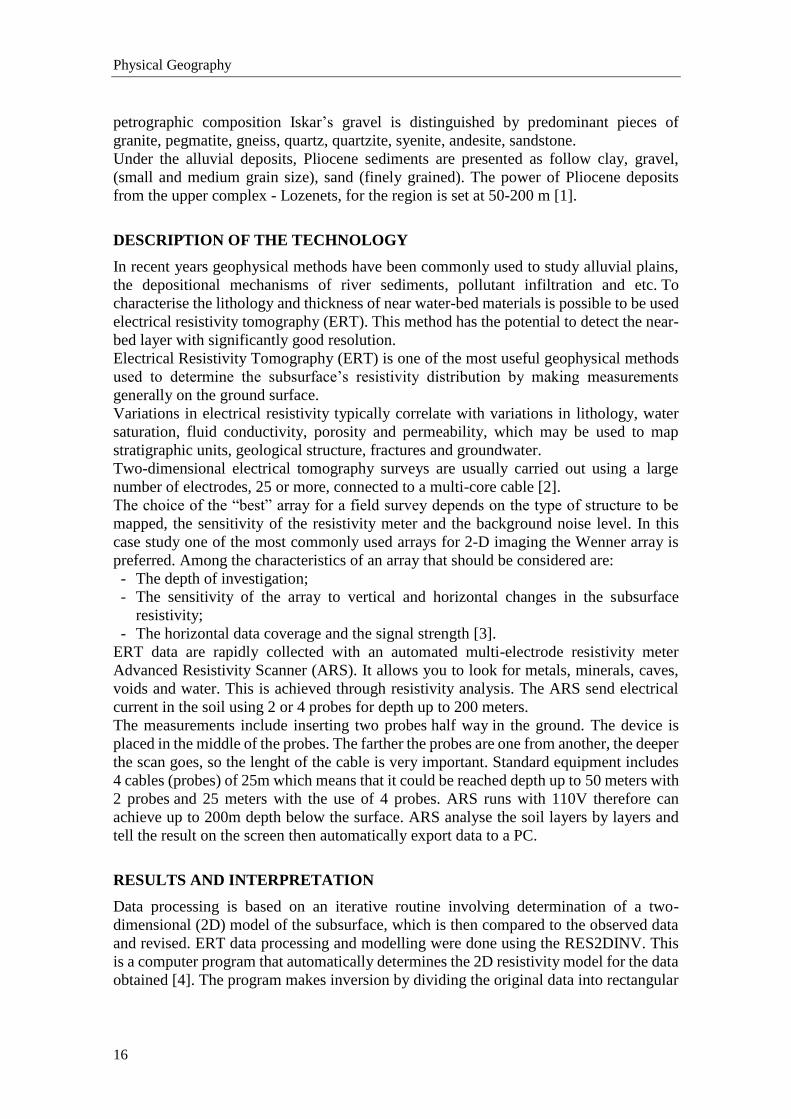
The precise location of the geophysical surveying lines in the area of “Kriva bara” deposit
is illustrated in Figure 2. The ERT field measurements were performed along 6 profiles
(red lines).
Figure 2. Field measurements situation plan
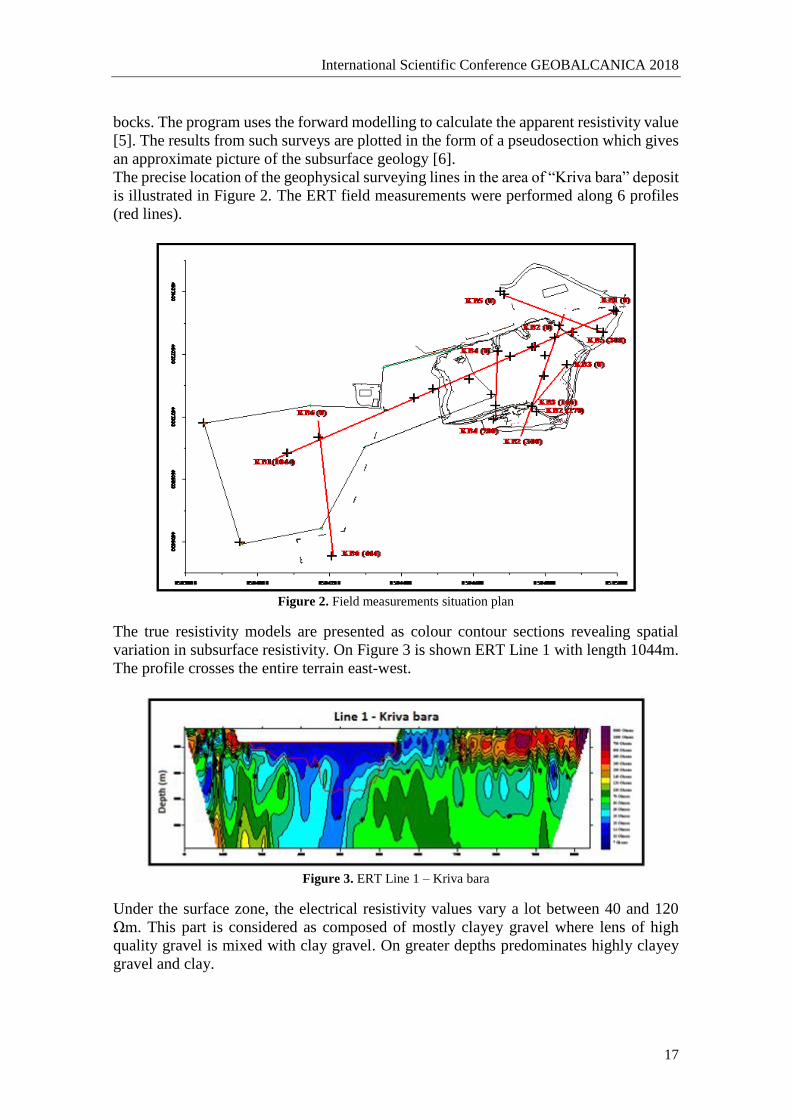
The true resistivity models are presented as colour contour sections revealing spatial
variation in subsurface resistivity. On Figure 3 is shown ERT Line 1 with length 1044m.
The profile crosses the entire terrain east-west.
Figure 3. ERT Line 1 – Kriva bara
Under the surface zone, the electrical resistivity values vary a lot between 40 and 120
Ωm. This part is considered as composed of mostly clayey gravel where lens of high
quality gravel is mixed with clay gravel. On greater depths predominates highly clayey
gravel and clay.
Physical Geography
18
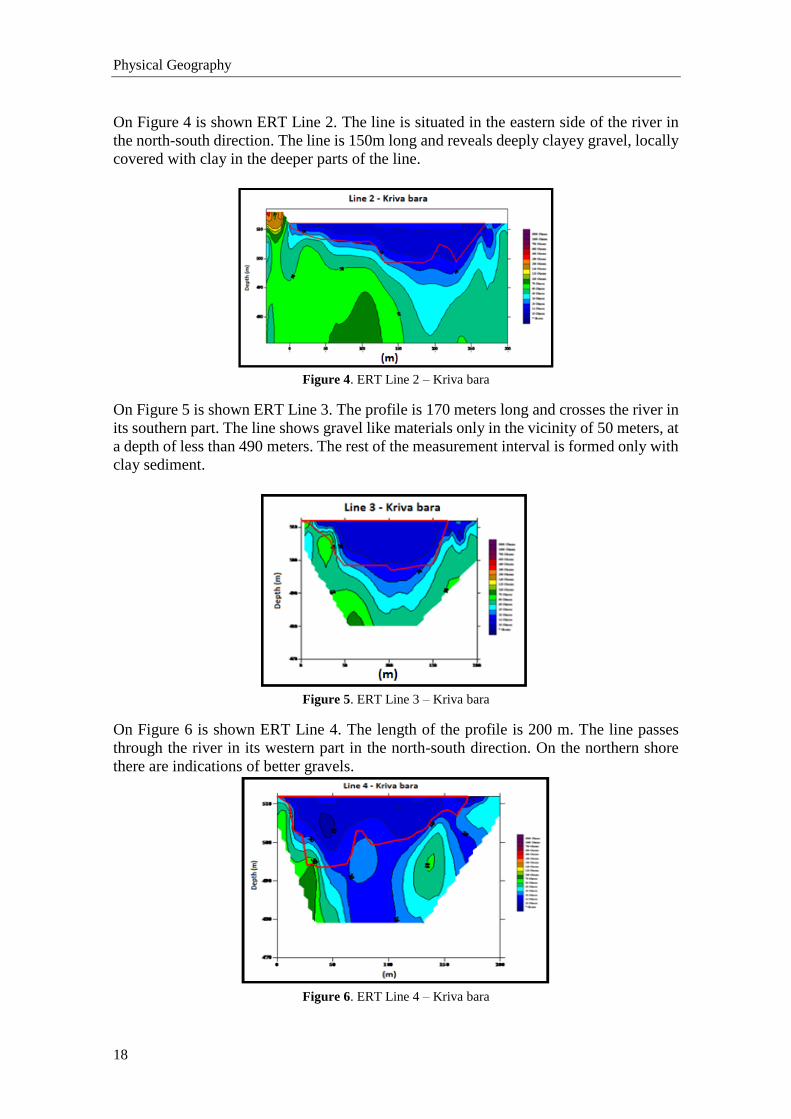
On Figure 4 is shown ERT Line 2. The line is situated in the eastern side of the river in
the north-south direction. The line is 150m long and reveals deeply clayey gravel, locally
covered with clay in the deeper parts of the line.
Figure 4. ERT Line 2 – Kriva bara
On Figure 5 is shown ERT Line 3. The profile is 170 meters long and crosses the river in
its southern part. The line shows gravel like materials only in the vicinity of 50 meters, at
a depth of less than 490 meters. The rest of the measurement interval is formed only with
clay sediment.
Figure 5. ERT Line 3 – Kriva bara
On Figure 6 is shown ERT Line 4. The length of the profile is 200 m. The line passes
through the river in its western part in the north-south direction. On the northern shore
there are indications of better gravels.
Figure 6. ERT Line 4 – Kriva bara
International Scientific Conference GEOBALCANICA 2018
19
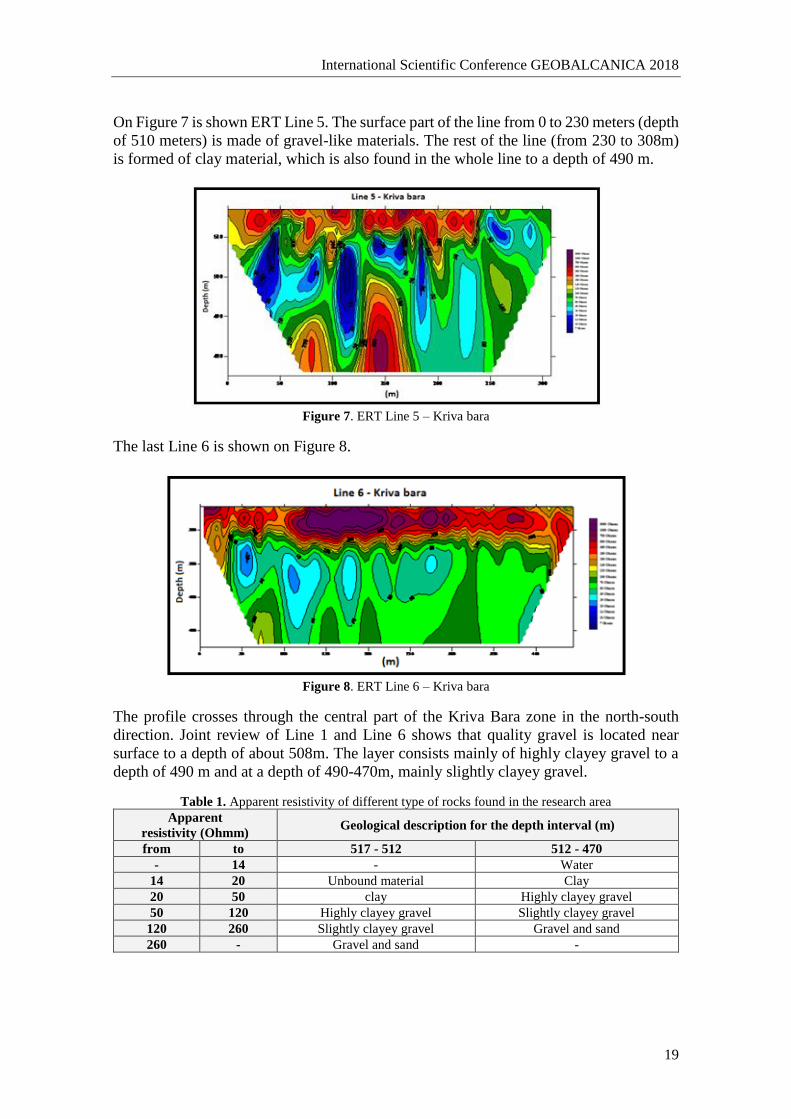
On Figure 7 is shown ERT Line 5. The surface part of the line from 0 to 230 meters (depth
of 510 meters) is made of gravel-like materials. The rest of the line (from 230 to 308m)
is formed of clay material, which is also found in the whole line to a depth of 490 m.
Figure 7. ERT Line 5 – Kriva bara
The last Line 6 is shown on Figure 8.
Figure 8. ERT Line 6 – Kriva bara
The profile crosses through the central part of the Kriva Bara zone in the north-south
direction. Joint review of Line 1 and Line 6 shows that quality gravel is located near
surface to a depth of about 508m. The layer consists mainly of highly clayey gravel to a
depth of 490 m and at a depth of 490-470m, mainly slightly clayey gravel.
Table 1. Apparent resistivity of different type of rocks found in the research area
Apparent
resistivity (Ohmm) Geological description for the depth interval (m)
from to 517 - 512 512 - 470
- 14 - Water
14 20 Unbound material Clay
20 50 clay Highly clayey gravel
50 120 Highly clayey gravel Slightly clayey gravel
120 260 Slightly clayey gravel Gravel and sand
260 - Gravel and sand -
Physical Geography
20
The electrical resistivity of the different types of rocks on the terrain was determined
empirically on the basis of a comparison between the geological profiles and geological
boreholes provided. Geological boundaries are defined for two depth intervals - a block
above the groundwater level of 517 to 512 m and a block below the groundwater level.
Apparent resistivity of different type of rocks for these intervals is described in Table 1.
CONCLUSION
The "Kriva Bara" deposit is made up of the alluvial deposits of the Iskar river, represented
by sand, gravel and clay. According to the measurement results and the interpretation of
the ERT lines is considered that the useful component is very variable. The best quality
raw material is located in the surface area (517 m). In the eastern part of the terrain at a
depth of about 505 m, the raw material is of varying quality. The depth interval of 505 to
490 m is mainly formed by the alternation of clayey sandstones and clays. The results
obtained from the geophysical investigation allow proceeding with inventory calculation
and subsequent development of the deposit.
REFERENCES
[1] Koprev, I., Report on the Geophysical Studies of the Kriva Bara Field, 2007.
[2] Griffiths D.H. & Barker R.D. Two-dimensional resistivity imaging and modelling in areas of
complex geology. Journal of Applied Geophysics, 29, 211-226, 1993;
[3] Loke, M., H. Tutorial: 2-D and 3-D electrical imaging surveys. 18, 1996-2015.
[4] Griffiths, D.H., Barker, R.D., “Two Dimensional Resistivity Imaging and Modeling in areas
of Complex Geology”, Journal of Applied Geophysics, (29) 211-226, 1993.
[5] DeGroot-Hedlin, C., Constable, S., Occam's inversion to generate smooth, two dimensional
models form magnetotelluric data. Geophysics, 55, 1613-1624, 1990.
[6] Maya Grigorova, M., Tzankov Ch., Kisyov, A., Koprev, I., Dimovski, S., Complex
geophysical prospection – electrical resistivity tomography and geomagnetic survey for detecting
limestone inclusions in mini Maritsa iztok EAD, International Scientific Conference
GEOBALCANICA, Macedonia, p.34, 2017.
Related Documents