University of Massachusetts ANNUAL FINANCIAL REPORT 2020

Welcome message from author
This document is posted to help you gain knowledge. Please leave a comment to let me know what you think about it! Share it to your friends and learn new things together.
Transcript

University of Massachusetts
AnnuAl FinAnciAl RepoRt 2020

University of Massachusetts
AnnuAl FinAnciAl RepoRt 20192University Administration
3Letter from the President
4Report of Independent Auditors
6Management’s Discussion and Analysis (unaudited)
18Financial Statements
Statements of Net Position . . . . . . . . . . . . . . . . . . . . . . . . . . . . 18
Statements of Revenues, Expenses, and Changes in Net Position . . . . . . . . . . . . . . . . . . . . . . . . . . . . . . . 19
Statements of Cash Flows . . . . . . . . . . . . . . . . . . . . . . . . . .20–21
Component Units Statements of Financial Position . . . . . . . 22
Component Units Statements of Activities . . . . . . . . . . . . . . 22
Notes to Financial Statements . . . . . . . . . . . . . . . . . . . . . . . . . 23
61Required Supplementary Information (unaudited)
Schedule of The University’s Proportionate Share of the Net Pension Liability — Massachusetts State Employees’ Retirement System . . . . . . . . . . . . . . . . . . . 61
Schedule of the University’s Contributions — Massachusetts State Employees’ Retirement System . . . . . 61
Schedule of the University’s Proportionate Share of the Net Other Postemployment Benefits (OPEB) Liability — State Retirees’ Benefit Trust . . . . . . . . . . . . . . . . . 62
Schedule of the University’s Contributions — State Retirees’ Benefit Trust . . . . . . . . . . . . . . . . . . . . . . . . . . . 62
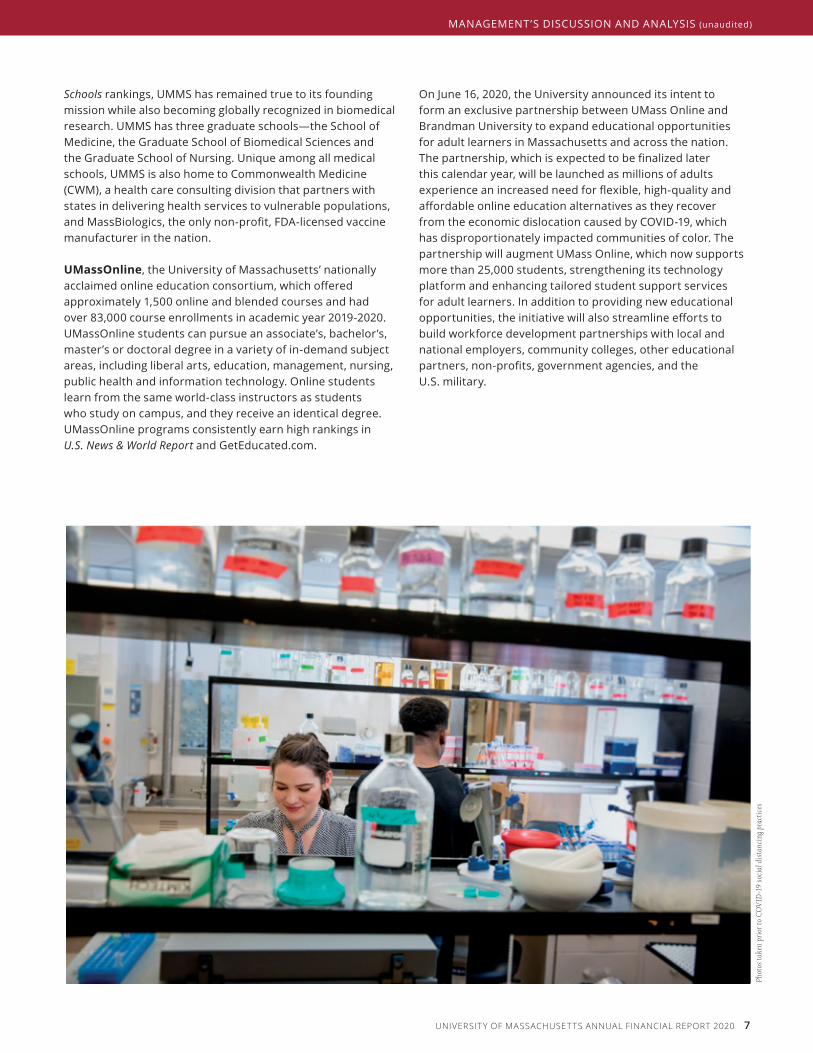
Photos taken prior to COVID-19 social distancing practices
Board of TrusTees
Robert J. Manning (Chairman)Swampscott, MA
R. Norman Peters, JD (Vice Chair)Paxton, MA
Mary L. BurnsLowell, MA
Ryan P. Callahan (UMass Lowell Student Trustee, Non‑voting)Chelmsford, MA
Peter Cruz-Gordillo (UMass Medical School Student Trustee, Non‑voting)Worcester, MA
Dakeyla N. Devaughn-Johnson(UMass Dartmouth Student Trustee, Non‑voting)Stoughton, MA
Robert EpsteinBoston, MA
Stephen R. KaramFall River, MA
Richard M. KelleherDuxbury, MA
Robert Lewis, Jr.Boston, MA
Michael V. O’BrienSouthborough, MA
Noreen C. Okawara, MDLowell, MA
Kerri E. Osterhaus-Houle, MDHudson, MA
Imari K. Paris Jeffries, MEd, MABoston, MA
Kush Patel,(UMass Boston Student Trustee, Voting)Marlborough, MA
James A. PeyserMilton, MA
Julie M. Ramos GagliardiSomerset, MA
Timothy Scalona (UMass Amherst Student Trustee, Voting)Amherst, MA
Elizabeth D. Scheibel, JDSouth Hadley, MA
Steven A. TolmanBoston, MA
Victor WoolridgeSpringfield, MA
Charles F. Wu, MBANewton, MA
officers of The universiTy
Martin T. Meehan, JDPresident
Kumble R. Subbaswamy, PhDChancellor, UMass Amherst
Marcelo Suáres-Orozco, PhDChancellor, UMass Boston
Mark Preble, SPHR, SHRM-SCPActing Chancellor, UMass Dartmouth
Jacqueline Moloney, EdDChancellor, UMass Lowell
Michael F. Collins, MDChancellor, UMass Medical School and Senior Vice President for Health Sciences
James R. Julian, JDExecutive Vice President and Chief Operating Officer
Katherine S. Newman, PhDSystem Chancellor for Academic Programs
Lisa A. CaliseSenior Vice President for Administration and Finance & Treasurer
Zunilka M. BarrettSecretary to the Board of Trustees
univeRsity AdministRAtionAs of December 2020
2 UNIVERSIT Y OF MASSACHUSET TS ANNUAL FINANCIAL REPORT 2020
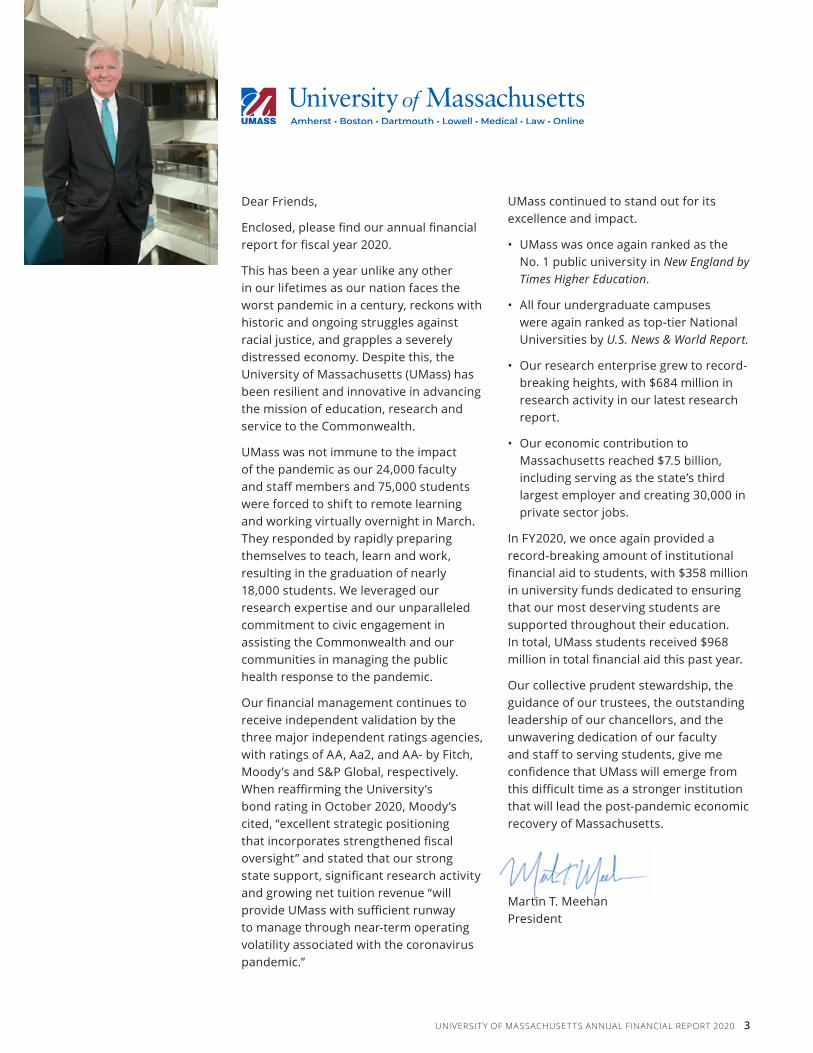
Dear Friends,
Enclosed, please find our annual financial report for fiscal year 2020.
This has been a year unlike any other in our lifetimes as our nation faces the worst pandemic in a century, reckons with historic and ongoing struggles against racial justice, and grapples a severely distressed economy. Despite this, the University of Massachusetts (UMass) has been resilient and innovative in advancing the mission of education, research and service to the Commonwealth.
UMass was not immune to the impact of the pandemic as our 24,000 faculty and staff members and 75,000 students were forced to shift to remote learning and working virtually overnight in March. They responded by rapidly preparing themselves to teach, learn and work, resulting in the graduation of nearly 18,000 students. We leveraged our research expertise and our unparalleled commitment to civic engagement in assisting the Commonwealth and our communities in managing the public health response to the pandemic.
Our financial management continues to receive independent validation by the three major independent ratings agencies, with ratings of AA, Aa2, and AA- by Fitch, Moody’s and S&P Global, respectively. When reaffirming the University’s bond rating in October 2020, Moody’s cited, “excellent strategic positioning that incorporates strengthened fiscal oversight” and stated that our strong state support, significant research activity and growing net tuition revenue “will provide UMass with sufficient runway to manage through near‑term operating volatility associated with the coronavirus pandemic.”
UMass continued to stand out for its excellence and impact.
• UMass was once again ranked as the No. 1 public university in New England by Times Higher Education.
• All four undergraduate campuses were again ranked as top‑tier National Universities by U.S. News & World Report.
• Our research enterprise grew to record-breaking heights, with $684 million in research activity in our latest research report.
• Our economic contribution to Massachusetts reached $7.5 billion, including serving as the state’s third largest employer and creating 30,000 in private sector jobs.
In FY2020, we once again provided a record‑breaking amount of institutional financial aid to students, with $358 million in university funds dedicated to ensuring that our most deserving students are supported throughout their education. In total, UMass students received $968 million in total financial aid this past year.
Our collective prudent stewardship, the guidance of our trustees, the outstanding leadership of our chancellors, and the unwavering dedication of our faculty and staff to serving students, give me confidence that UMass will emerge from this difficult time as a stronger institution that will lead the post‑pandemic economic recovery of Massachusetts.
Martin T. Meehan President
UNIVERSIT Y OF MASSACHUSET TS ANNUAL FINANCIAL REPORT 2020 3
Independent Auditors’ Report
Board of Trustees of the University of Massachusetts:
Report on the Financial StatementsWe have audited the accompanying financial statements of the business-type activities and aggregate discretely presented component units of the University of Massachusetts (the University), an enterprise fund of the Commonwealth of Massachusetts, as of and for the years ended June 30, 2020 and 2019, and the related notes to the financial statements, which collectively comprise the University’s basic financial statements for the years then ended as listed in the table of contents.
Management’s Responsibility for the Financial StatementsManagement is responsible for the preparation and fair presentation of these financial statements in accordance with U.S. generally accepted accounting principles; this includes the design, implementation, and maintenance of internal control relevant to the preparation and fair presentation of financial statements that are free from material misstatement, whether due to fraud or error.
Auditors’ ResponsibilityOur responsibility is to express opinions on these financial statements based on our audits. We conducted our audits in accordance with auditing standards generally accepted in the United States of America and the standards applicable to financial audits contained in Government Auditing Standards, issued by the Comptroller General of the United States. Those standards require that we plan and perform the audit to obtain reasonable assurance about whether the financial statements are free from material misstatement. The financial statements of the discretely presented component units identified in note 1 were not audited in accordance with Government Auditing Standards.
An audit involves performing procedures to obtain audit evidence about the amounts and disclosures in the financial statements. The procedures selected depend on the auditors’ judgment, including the assessment of the risks of material misstatement of the financial statements, whether due to fraud or error. In making those risk assessments, the auditor considers internal control relevant to the entity’s preparation and fair presentation of the financial statements in order to design audit procedures that are appropriate in the circumstances, but not for the purpose of expressing an opinion on the effectiveness of the entity’s internal control. Accordingly, we express no such opinion. An audit also includes evaluating the appropriateness of accounting policies used and the reasonableness of significant accounting estimates made by management, as well as evaluating the overall presentation of the financial statements.
We believe that the audit evidence we have obtained is sufficient and appropriate to provide a basis for our audit opinions.
OpinionsIn our opinion, the financial statements referred to above present fairly, in all material respects, the respective financial position of the business-type activities and the aggregate discretely presented component units of the University of Massachusetts, as of June 30, 2020 and 2019, and the respective changes in financial position
KPMG LLPTwo Financial Center60 South StreetBoston, MA 02111
KPMG LLP, a Delaware limited liability partnership and a member firm of the KPMG global organization of independent member firms affiliated with KPMG International Limited, a private English company limited by guarantee.
4 UNIVERSIT Y OF MASSACHUSET TS ANNUAL FINANCIAL REPORT 2020
and, where applicable, cash flows thereof for the years then ended in accordance with U.S. generally accepted accounting principles.
Emphasis of MatterAs discussed in Note 1, the financial statements of the University are intended to present the financial position, the changes in financial position and, where applicable, cash flows of only that portion of the business-type activities and the aggregate remaining fund information of the Commonwealth of Massachusetts that is attributable to the transactions of the University. They do not purport to, and do not, present fairly the financialposition of the Commonwealth of Massachusetts as of June 30, 2020 and 2019, the changes in its financial position, or where applicable, its cash flows for the years then ended in conformity with U.S. generally accepted accounting principles. Our opinion is not modified with respect to this matter.
Required Supplementary InformationU.S. generally accepted accounting principles require that the management’s discussion and analysis and required supplementary information, as listed in the table of contents (collectively referred to as RSI) bepresented to supplement the basic financial statements. Such information, although not a part of the basic financial statements, is required by the Governmental Accounting Standards Board who considers it to be an essential part of financial reporting for placing the basic financial statements in an appropriate operational, economic, or historical context. We have applied certain limited procedures to the RSI in accordance with auditing standards generally accepted in the United States of America, which consisted of inquiries of management about the methods of preparing the information and comparing the information for consistency with management’s responses to our inquiries, the basic financial statements, and other knowledge we obtained during our audit of the basic financial statements. We do not express an opinion or provide any assurance on the information because the limited procedures do not provide us with sufficient evidence to express an opinion or provide any assurance.
Other Reporting Required by Government Auditing StandardsIn accordance with Government Auditing Standards, we have also issued our report dated December 10, 2020on our consideration of the University’s internal control over financial reporting and on our tests of its compliance with certain provisions of laws, regulations, contracts, and grant agreements and other matters. The purpose of that report is solely to describe the scope of our testing of internal control over financial reporting and compliance and the results of that testing, and not to provide an opinion on the effectiveness of the University’s internal control over financial reporting or on compliance. That report is an integral part of an audit performed in accordance with Government Auditing Standards in considering the University’s internal control over financial reporting and compliance.
Boston, MassachusettsDecember 10, 2020
UNIVERSIT Y OF MASSACHUSET TS ANNUAL FINANCIAL REPORT 2020 5
introductionThis Management’s Discussion and Analysis provides an overview of the financial position and activities of the University of Massachusetts (the University or UMass) for the fiscal years ended June 30, 2020 and 2019, and should be read in conjunction with the accompanying financial statements and notes. The financial statements, notes and this discussion are the responsibility of management.
The University of Massachusetts was established in 1863 as the Massachusetts Agricultural College, located in Amherst. Since then it has grown into a five-campus system that is nationally and internationally known for the quality of its academic programs and the scope and excellence of its faculty research. From Nobel Prize-winning gene-silencing research to research in such areas as renewable energy, nanotechnology, cybersecurity, life sciences and marine science, the University of Massachusetts is expanding the boundaries of knowledge and opening doors of discovery that benefit the Commonwealth of Massachusetts (Commonwealth), the nation and the world. UMass consistently ranks as one of the best universities in the world and as one of the most innovative.
UMass Amherst is the flagship campus of the University. True to its land‑grant roots, UMass Amherst is engaged in research and creative work in all fields and is classified by the Carnegie Foundation for the Advancement of Teaching as a doctoral university with the “highest research activity”. Major areas of emphasis include climate science, food science, alternative energy, nano manufacturing, polymer science, computer science and linguistics. Consistently rated as a “Top Producer of Fulbright Students,” UMass Amherst is ranked 26th among the nation’s top public schools in the 2021 U.S. News & World Report Best Colleges rankings.
UMass Boston is nationally recognized as a model of excellence for urban public research universities. Located on Boston Harbor, it is the metropolitan area’s only public
Management’s Discussion and Analysis (unaudited)June 30, 2020
research university. UMass Boston’s distinguished intellectual contributions span the social sciences, education, health and wellness. With a student population that represents 150 countries. UMass Boston is committed to educating people from modest-income backgrounds, first-generation college students and those from urban areas here and abroad.
UMass Dartmouth distinguishes itself as a vibrant university dedicated to engaged learning and innovative research resulting in personal and lifelong student success. Located on 710 acres on the south coast of Massachusetts, UMass Dartmouth offers students high-quality academic programs through undergraduate majors and professional and doctoral programs, including the state’s only public law school.
UMass Law, which is part of UMass Dartmouth and the only public law school in Massachusetts, is committed to providing an excellent, affordable, and accessible legal education that balances legal theory, doctrine, skills, experience, and professionalism. UMass Law prepares students to thrive in a changing profession and advances justice through research, writing, teaching, learning, and practice. UMass Law’s July 2019 Massachusetts first-time bar passage rate was 82.6%, the fifth highest passage rate of the Massachusetts law schools.
UMass Lowell is ranked 87th among the nation’s top public schools within the 2021 U.S. News & World Report Best Colleges rankings, with programs supporting workforce and economic development through innovation, entrepreneurship and public-private partnerships. UMass Lowell prepares students emphasizing experiential learning through cooperative education, service and research.
UMass Medical School (UMMS), founded in 1962 and situated in Worcester, is the Commonwealth’s only public medical school and serves as the University’s Nobel-prize winning health sciences campus. Ranked 26th for primary care training in the 2021 U.S News & World Report Best Medical
6 UNIVERSIT Y OF MASSACHUSET TS ANNUAL FINANCIAL REPORT 2020
Schools rankings, UMMS has remained true to its founding mission while also becoming globally recognized in biomedical research. UMMS has three graduate schools—the School of Medicine, the Graduate School of Biomedical Sciences and the Graduate School of Nursing. Unique among all medical schools, UMMS is also home to Commonwealth Medicine (CWM), a health care consulting division that partners with states in delivering health services to vulnerable populations, and MassBiologics, the only non-profit, FDA-licensed vaccine manufacturer in the nation.
UMassOnline, the University of Massachusetts’ nationally acclaimed online education consortium, which offered approximately 1,500 online and blended courses and had over 83,000 course enrollments in academic year 2019-2020. UMassOnline students can pursue an associate’s, bachelor’s, master’s or doctoral degree in a variety of in‑demand subject areas, including liberal arts, education, management, nursing, public health and information technology. Online students learn from the same world‑class instructors as students who study on campus, and they receive an identical degree. UMassOnline programs consistently earn high rankings in U.S. News & World Report and GetEducated.com.
On June 16, 2020, the University announced its intent to form an exclusive partnership between UMass Online and Brandman University to expand educational opportunities for adult learners in Massachusetts and across the nation. The partnership, which is expected to be finalized later this calendar year, will be launched as millions of adults experience an increased need for flexible, high-quality and affordable online education alternatives as they recover from the economic dislocation caused by COVID‑19, which has disproportionately impacted communities of color. The partnership will augment UMass Online, which now supports more than 25,000 students, strengthening its technology platform and enhancing tailored student support services for adult learners. In addition to providing new educational opportunities, the initiative will also streamline efforts to build workforce development partnerships with local and national employers, community colleges, other educational partners, non-profits, government agencies, and the U.S. military.
UNIVERSIT Y OF MASSACHUSET TS ANNUAL FINANCIAL REPORT 2020 7
ManageMent’s Discussion anD analysis (unaudited)
Phot
os ta
ken
prio
r to
COVI
D-1
9 so
cial d
ista
ncin
g pra
ctice
s
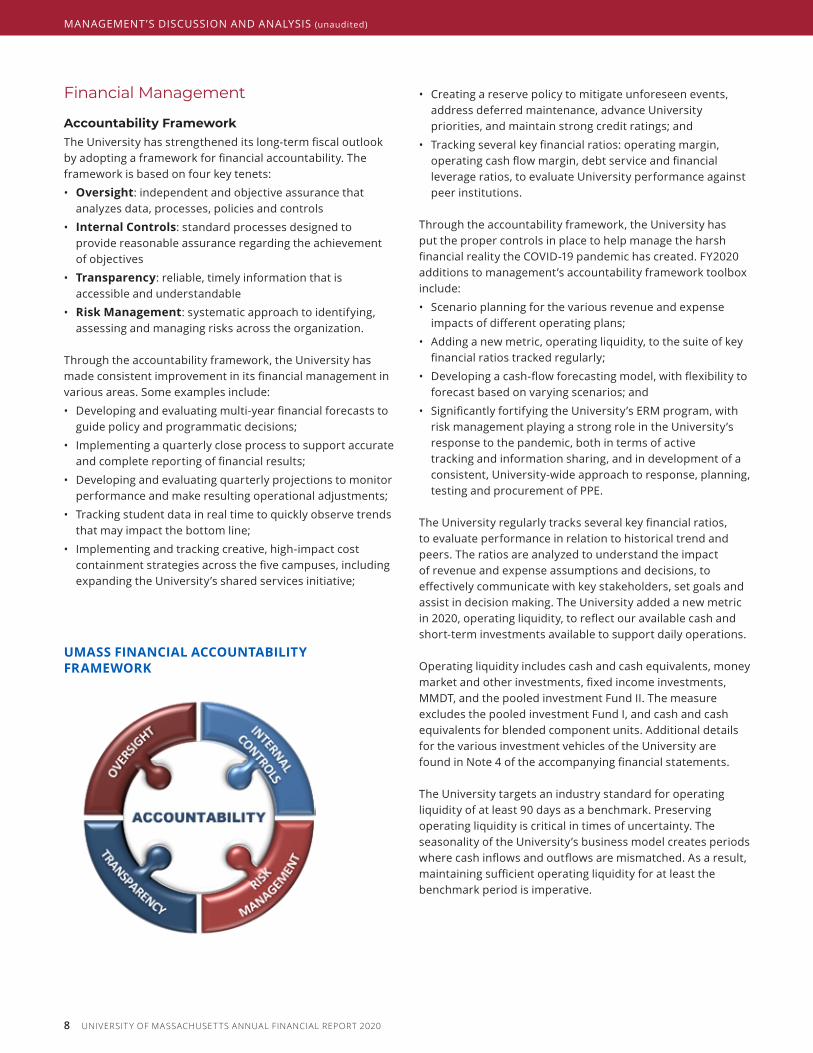
Financial Management
accountability frameworkThe University has strengthened its long-term fiscal outlook by adopting a framework for financial accountability. The framework is based on four key tenets:
• Oversight: independent and objective assurance that analyzes data, processes, policies and controls
• Internal Controls: standard processes designed to provide reasonable assurance regarding the achievement of objectives
• Transparency: reliable, timely information that is accessible and understandable
• Risk Management: systematic approach to identifying, assessing and managing risks across the organization.
Through the accountability framework, the University has made consistent improvement in its financial management in various areas. Some examples include:
• Developing and evaluating multi-year financial forecasts to guide policy and programmatic decisions;
• Implementing a quarterly close process to support accurate and complete reporting of financial results;
• Developing and evaluating quarterly projections to monitor performance and make resulting operational adjustments;
• Tracking student data in real time to quickly observe trends that may impact the bottom line;
• Implementing and tracking creative, high-impact cost containment strategies across the five campuses, including expanding the University’s shared services initiative;
• Creating a reserve policy to mitigate unforeseen events, address deferred maintenance, advance University priorities, and maintain strong credit ratings; and
• Tracking several key financial ratios: operating margin, operating cash flow margin, debt service and financial leverage ratios, to evaluate University performance against peer institutions.
Through the accountability framework, the University has put the proper controls in place to help manage the harsh financial reality the COVID-19 pandemic has created. FY2020 additions to management’s accountability framework toolbox include:
• Scenario planning for the various revenue and expense impacts of different operating plans;
• Adding a new metric, operating liquidity, to the suite of key financial ratios tracked regularly;
• Developing a cash-flow forecasting model, with flexibility to forecast based on varying scenarios; and
• Significantly fortifying the University’s ERM program, with risk management playing a strong role in the University’s response to the pandemic, both in terms of active tracking and information sharing, and in development of a consistent, University‑wide approach to response, planning, testing and procurement of PPE.
The University regularly tracks several key financial ratios, to evaluate performance in relation to historical trend and peers. The ratios are analyzed to understand the impact of revenue and expense assumptions and decisions, to effectively communicate with key stakeholders, set goals and assist in decision making. The University added a new metric in 2020, operating liquidity, to reflect our available cash and short-term investments available to support daily operations.
Operating liquidity includes cash and cash equivalents, money market and other investments, fixed income investments, MMDT, and the pooled investment Fund II. The measure excludes the pooled investment Fund I, and cash and cash equivalents for blended component units. Additional details for the various investment vehicles of the University are found in Note 4 of the accompanying financial statements.
The University targets an industry standard for operating liquidity of at least 90 days as a benchmark. Preserving operating liquidity is critical in times of uncertainty. The seasonality of the University’s business model creates periods where cash inflows and outflows are mismatched. As a result, maintaining sufficient operating liquidity for at least the benchmark period is imperative.
UMASS FInAnCIAL ACCoUnTABILITy FrAMEWorK
8 UNIVERSIT Y OF MASSACHUSET TS ANNUAL FINANCIAL REPORT 2020
ManageMent’s Discussion anD analysis (unaudited)
shared services initiativesAt a time of financial challenge for public higher education, the University must continuously push itself to find more efficient ways of doing business. In that spirit, in 2019 President Meehan called for the development and implementation of a shared services model of delivering administration and finance services to the campuses. The resulting plan, developed by a team of subject matter experts that included representatives from each campus, delineated the application of a shared services model for accounts payable and procurement, at an estimated total savings of $16.5 million. This effort also laid the foundation for the exploration of future efficiencies.
To implement this plan, the University formally kicked off its Unified Procurement Services Team (UPST) in January 2020, led by a new University Chief Procurement Officer. This team of professionals is tasked with providing high‑quality services while driving transaction efficiency. UPST supports the campuses in cost optimization through proactive commodity sourcing and contracting with innovative suppliers and partners that support UPST in delivering on its “better, faster, and cheaper” mission. The team manages approximately $1 billion in third‑party spend annually and approximately 30,000 suppliers and partners. The UPST manages this through leveraging optimized technology, data-driven business intelligence, training, and enhanced operational processes.
During FY2020, in its first few months of existence, the UPST achieved $6.6 million of strategic sourcing savings, $5.3M annualized savings from other benefits/impact activities with the campuses, and identified an additional $22.0 million of financial benefit opportunities for the University. The University expects to see further savings, efficiencies, and process improvements from the UPST as it continues to mature and further scale its operations.
Based on the success of the UPST, the University is embarking on a second shared service initiative in FY21 that is related to evaluating payroll services.
Financial HighlightsIn March 2020, the World Health Organization declared a pandemic as a result of the novel coronavirus (COVID-19). As cases began to increase in the country and in Massachusetts, in March 2020, the University suspended in-person education and other campus‑based activities and provided refunds to students for a portion of their residence and dining fees. The University took significant budget actions across all campuses to address the resulting loss of revenue. These actions included salary freezes, furloughs, and targeted operating and personnel reductions. The University was awarded $46.0 million of funding under the Coronavirus Aid, Relief, and Economic Security Act (CARES Act), half of which was required to be used to provide emergency financial aid to students. The University distributed $14.7 million in emergency aid to students. Of the portion to be used by the institution, $13.9 million was utilized to cover costs related to significant changes to the delivery of instruction due to the coronavirus, and to provide additional aid to students. The remaining unspent funds are expected to be used and corresponding revenue recognized in FY2021. The full extent of the impact of COVID-19 on the University’s finances is uncertain and will depend on the duration and depth of the pandemic.
Selected financial highlights for the fiscal year ended June 30, 2020 include:
The University’s loss before other revenues, expenses, gains, and losses was ($88.0 million) for FY2020. Postemployment benefit expenses related to Governmental Accounting Standards Board (GASB) Statement No. 75, Accounting and Financial Reporting for Postemployment Benefits Other Than
Phot
os ta
ken
prio
r to
COVI
D-1
9 so
cial d
ista
ncin
g pra
ctice
s
UNIVERSIT Y OF MASSACHUSET TS ANNUAL FINANCIAL REPORT 2020 9
ManageMent’s Discussion anD analysis (unaudited)
Pensions (GASB 75) and GASB 68, Accounting and Reporting for Pensions (GASB 68) contributed significantly to this loss. Excluding the impact of the postemployment expenses, the University’s income before other revenues, expenses, gains, and losses was a positive $34.1 million.
From FY2019 to FY2020, the University’s operating revenues decreased by $27.3 million driven primarily by refunds made to students for housing and dining costs related to the move to remote learning as a result of COVID-19. Operating expenses increased by $136.1 million primarily driven by increases in post-employment benefit expenses, depreciation and scholarships and fellowships expenses. Non-operating revenues increased $28.0 million primarily attributed to an increase in state appropriations and funding received under the CARES Act. As a result of the decrease in revenues and increase in expenses, the University’s combined net position decreased $39.6 million from $2.5 billion in FY 2019 to $2.4 billion in FY2020.
using the Annual Financial Report The University’s financial statements are prepared in accordance with U.S. generally accepted accounting principles as prescribed by GASB, which establishes financial reporting standards for public colleges and universities. The University’s significant accounting policies are summarized in Note 1 of the accompanying financial statements, including further information on the financial reporting entity.
This report includes the University’s Statements of Net Position, Statements of Revenues, Expenses and Changes in Net Position, and the Statements of Cash Flows for the fiscal years ended June 30, 2020 and 2019, as well as certain required supplementary information. The University’s net position (the difference between assets, deferred outflows, deferred inflows, and liabilities) is one indicator of the University’s financial health. Over time, increases or decreases in net position are indicators of the improvement in or erosion of an institution’s financial health when considered together with non-financial factors such as enrollment levels and the condition of facilities.
Statements of Net Position include all assets and liabilities, as well as deferred inflows and outflows of resources of the University. Net position is further broken down into three categories: net investment in capital assets, restricted and unrestricted. Amounts reported in net investment in capital assets represent the historical cost of property and equipment, reduced by the balance of related debt outstanding and depreciation expense charged over the years. Net position is reported as restricted when constraints are imposed by third parties, such as donors or enabling legislation. Restricted net position is either non-expendable, as in the case of endowment gifts to be held in perpetuity, or expendable, as in the case of funds to be spent on
scholarships and research. All other assets are unrestricted; however, they may be committed for use under contract or designation by the Board of Trustees (the Board). Note 15 to the accompanying financial statements depicts the designations of unrestricted net position at June 30, 2020 and 2019.
Statements of Revenues, Expenses and Changes in Net Position present the revenues earned and expenses incurred during the year. Activities are reported as either operating or non-operating, as prescribed by GASB. According to the GASB definitions, operating revenues and expenses include tuition and fees, grant and contract activity, auxiliary enterprises and activity for the general operations of the institution not including appropriations from state and federal sources. Non-operating revenues include appropriations, capital grants and contracts, gifts, investment income, and non‑operating federal grants (such as Pell grants). With a public university’s dependency on support from the state, Pell grants, and gifts, it is common for institutions to have operating expenses exceed operating revenues. This is because the financial reporting model prescribed by GASB classifies state and federal appropriations, Pell grants, and gifts as non‑operating revenues. Due to the materiality of the state appropriations upon which the University relies, these appropriation amounts are included in certain analyses throughout this MD&A as operating revenue. The utilization of capital assets is reflected in the financial statements as depreciation expense,
10 UNIVERSIT Y OF MASSACHUSET TS ANNUAL FINANCIAL REPORT 2020
ManageMent’s Discussion anD analysis (unaudited)
Phot
os ta
ken
prio
r to
COVI
D-1
9 so
cial d
ista
ncin
g pra
ctice
s
which amortizes the cost of a capital asset over its expected useful life. Depreciation expense is considered an operating expense.
Statements of Cash Flows present cash receipts and payments of the University. Their purpose is to present the sources of cash coming into the University, how that cash was expended, and the change in the cash balance during the year.
Notes to the Financial Statements present additional information to support the financial statements. Their purpose is to clarify and expand on the information in the financial statements.
Required Supplementary Information (RSI) presents additional information that differs from the basic financial statements in that the auditor applies certain limited procedures in reviewing the information. In this report, RSI includes this management’s discussion and analysis, as well as schedules of the University’s proportionate share of the Massachusetts State Employees’ Retirement System (MSERS) pension liability and Other Postemployment Benefits (OPEB) liability, contributions to the MSERS pension and OPEB plans and related ratios.
Reporting entityThe financial statements of the University include financial activities of the following blended component units: the University of Massachusetts Building Authority (Building Authority), Worcester City Campus Corporation and Subsidiary (WCCC), the University of Massachusetts Medical School Foundation (UMMSF), and the University of Massachusetts Amherst Foundation (UMAF). The individual financial statements of the Building Authority can be obtained by contacting the Building Authority directly: www.umassba.net.
Separate Statements of Financial Position and Statements of Activities are presented in this report for the University’s discretely presented component units, the University of Massachusetts Foundation, Inc. (UMF), and the University of Massachusetts Dartmouth Foundation, Inc. (UMDF). The statements for these entities are presented in accordance with Financial Accounting Standards Board (FASB) standards, which differ from GASB standards in certain areas such as reporting of pledges to endowment and net position. The individual financial statements of each foundation can be obtained by contacting the foundations directly: www.umassfoundation.org for UMF and [email protected] for UMDF.
university of Massachusetts foundation, inc.UMF was established in 1950 to foster and promote the growth, progress and general welfare of the University, and
to solicit, receive and administer gifts and donations for such purposes. UMF maintains a portion of the University’s investment portfolio, predominantly the endowment and the quasi-endowment investments. The total investments held at UMF on behalf of the University at June 30, 2020, 2019 and 2018 were $923.7 million, $738.7 million and $651.4 million, respectively.
university of Massachusetts dartmouth foundation, inc.UMDF was established in 1973 to raise funds for the development and improvement of the academic and educational environment for students at the Dartmouth campus and the continued engagement of its alumni. In addition to holding investments for the University, UMF holds a significant portion of the UMDF investments. The total investments of UMDF at June 30, 2020, 2019 and 2018 were $57.8 million, $60.3 million and $59.5 million, respectively, of which the majority is invested with UMF.
net position Condensed schedules of net position at June 30, 2020, 2019, and 2018, respectively, are presented on page 12.
Assets totaled $7.6 billion, $7.4 billion, and $7.3 billion at June 30, 2020, 2019, and 2018, respectively. These balances are primarily driven by capital assets, net of accumulated depreciation, which remain stable in the three years presented.
Liabilities totaled $5.4 billion, $5.0 billion and $5.1 billion at June 30, 2020, 2019, and 2018, respectively. The majority of the University’s long‑term liabilities in all three years are long‑term debt and pension and other postemployment benefit (OPEB) liabilities.
Net position represents the difference between total assets and total liabilities, and in addition to capital, includes cash, liquid investments, as well as non‑cash items and illiquid investments. Total net position was $2.4 billion, $2.5 billion and $2.4 billion at June 30, 2020, 2019 and 2018, respectively. The largest component of net assets for the University remains the net investment in capital assets which held steady at $2.3–$2.4 billion for the three years. Unrestricted net position is negative in all three years, due to large employee postemployment benefits (health and pension) liabilities totaling $1.3 billion.
Revenues, expenses, and changes in Net Position Condensed schedules of revenues, expenses, and changes in net position for the three years ended June 30, 2020, 2019, and 2018, are presented on page 12.
UNIVERSIT Y OF MASSACHUSET TS ANNUAL FINANCIAL REPORT 2020 11
ManageMent’s Discussion anD analysis (unaudited)

CONDENSED SCHEDULES OF NET POSITION
As of June 30, 2020, 2019, and 2018 ($ in thousands) 2020 2019 2018 AssetsCurrent assets $ 1,156,836 $ 921,582 $ 918,685 Noncurrent assets
Capital assets, net 5,206,569 5,164,200 5,075,476 All other noncurrent assets 1,225,544 1,281,662 1,291,309
Total assets 7,588,949 7,367,444 7,285,470
Deferred outflows of resources 531,271 357,541 341,335
Liabilities Current liabilities 680,069 799,310 934,525 Noncurrent liabilities 4,750,458 4,237,383 4,161,911 Total liabilities 5,430,527 5,036,693 5,096,436
Deferred inflows of resources 256,926 215,910 141,485
Net position Net investment in capital assets 2,376,333 2,343,872 2,288,599 Restricted:
Nonexpendable 22,252 28,617 28,022 Expendable 223,803 206,023 222,343
Unrestricted (189,621) (106,130) (150,080)
Total net position $ 2,432,767 $ 2,472,382 $ 2,388,884
ConDEnSED SChEDULES oF rEvEnUES, ExPEnSES, AnD ChAngES In nET PoSITIon
For the years ended June 30, 2020, 2019, and 2018 ($ in thousands) 2020 2019 2018 Operating revenuesTuition and fees, net of scholarships $ 917,876 $ 894,904 $ 874,826 Grants and contracts 581,850 593,086 560,990 Auxiliary enterprises 378,314 441,795 416,733 Other operating revenues 547,990 523,569 616,265 Total operating revenues 2,426,030 2,453,354 2,468,814
Operating expenses 3,437,442 3,301,311 3,300,392
Operating loss (1,011,412) (847,957) (831,578)
Nonoperating revenues (expenses) Federal appropriations 6,774 7,004 6,688 State appropriations 810,518 780,221 751,894 Interest on indebtedness (109,186) (116,217) (115,851)Nonoperating federal grants 115,601 84,454 81,590 Other nonoperating income 99,753 140,047 110,062 Total nonoperating revenues (expenses) 923,460 895,509 834,383
Income (loss) before other reveneus, expenses, gains and losses (87,952) 47,552 2,805
Other revenues, expenses, gains and losses Capital appropriations, grants and other sources 59,041 38,665 76,169 Other (deductions) additions (10,704) (2,719) (1,388) Total other revenues, expenses, gains, and losses 48,337 35,946 74,781
Total increase (decrease) in net position (39,615) 83,498 77,586
Net position Net position at the beginning of the year 2,472,382 2,388,884 3,054,280 Cumulative effect of adopting GASB 75 ‑ ‑ (742,982)Net position at the beginning of the year, restated 2,472,382 2,388,884 2,311,298
Net position at the end of the year $ 2,432,767 $ 2,472,382 $ 2,388,884
12 UNIVERSIT Y OF MASSACHUSET TS ANNUAL FINANCIAL REPORT 2020
ManageMent’s Discussion anD analysis (unaudited)
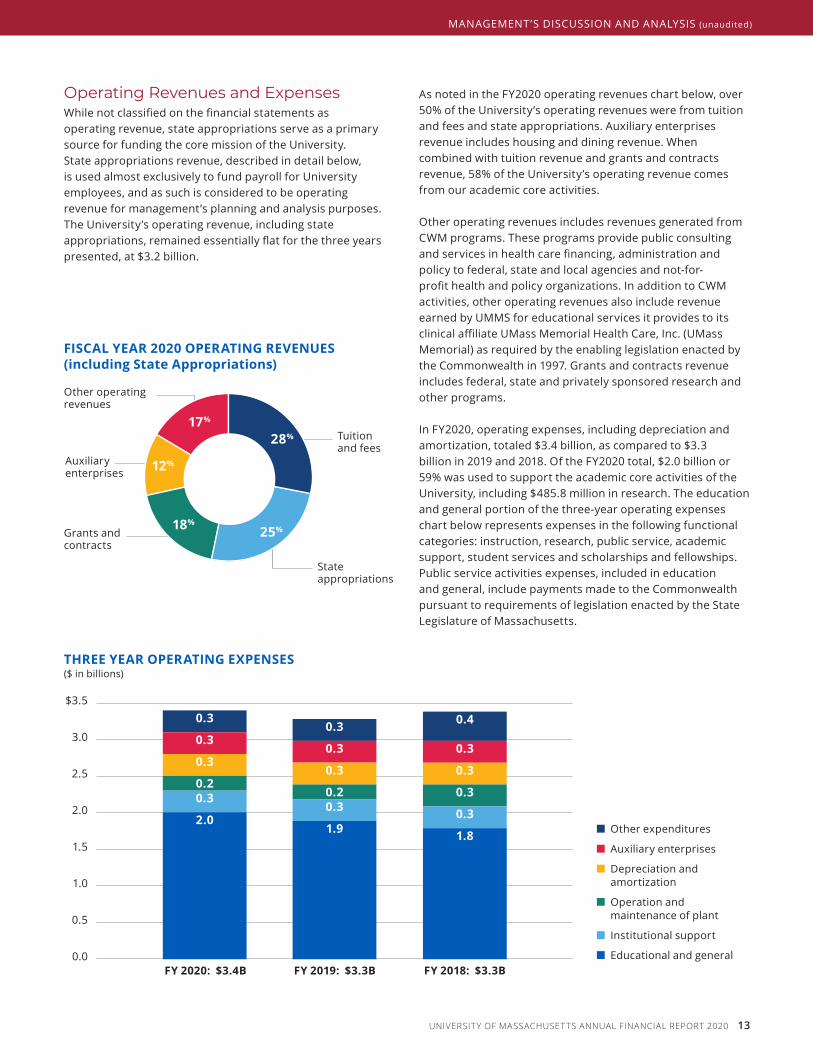
operating Revenues and expensesWhile not classified on the financial statements as operating revenue, state appropriations serve as a primary source for funding the core mission of the University. State appropriations revenue, described in detail below, is used almost exclusively to fund payroll for University employees, and as such is considered to be operating revenue for management’s planning and analysis purposes. The University’s operating revenue, including state appropriations, remained essentially flat for the three years presented, at $3.2 billion.
As noted in the FY2020 operating revenues chart below, over 50% of the University’s operating revenues were from tuition and fees and state appropriations. Auxiliary enterprises revenue includes housing and dining revenue. When combined with tuition revenue and grants and contracts revenue, 58% of the University’s operating revenue comes from our academic core activities.
Other operating revenues includes revenues generated from CWM programs. These programs provide public consulting and services in health care financing, administration and policy to federal, state and local agencies and not‑for‑profit health and policy organizations. In addition to CWM activities, other operating revenues also include revenue earned by UMMS for educational services it provides to its clinical affiliate UMass Memorial Health Care, Inc. (UMass Memorial) as required by the enabling legislation enacted by the Commonwealth in 1997. Grants and contracts revenue includes federal, state and privately sponsored research and other programs.
In FY2020, operating expenses, including depreciation and amortization, totaled $3.4 billion, as compared to $3.3 billion in 2019 and 2018. Of the FY2020 total, $2.0 billion or 59% was used to support the academic core activities of the University, including $485.8 million in research. The education and general portion of the three‑year operating expenses chart below represents expenses in the following functional categories: instruction, research, public service, academic support, student services and scholarships and fellowships. Public service activities expenses, included in education and general, include payments made to the Commonwealth pursuant to requirements of legislation enacted by the State Legislature of Massachusetts.
Auxiliary enterprises
State appropriations
Tuition and fees
Other operating revenues
Grants and contracts
FISCAL yEAr 2020 oPErATIng rEvEnUES (including State Appropriations)
■ Other expenditures
■ Auxiliary enterprises
■ Depreciation and amortization
■ Operation and maintenance of plant
■ Institutional support
■ Educational and general
ThrEE yEAr oPErATIng ExPEnSES($ in billions)
$3.5
3.0
2.5
2.0
1.5
1.0
0.5
0.0Fy 2018: $3.3B
0.3
0.3
0.3
0.3
0.2
2.0
Fy 2019: $3.3BFy 2020: $3.4B
0.3
0.3
0.3
0.20.3
1.9 1.8
0.4
0.3
0.3
0.3
0.3
17%
12%
18%
28%
25%
UNIVERSIT Y OF MASSACHUSET TS ANNUAL FINANCIAL REPORT 2020 13
ManageMent’s Discussion anD analysis (unaudited)
State AppropriationsIn FY2020, state appropriations represented approximately 25% of all operating and non-operating revenues. The level of state support is a key factor influencing the University’s overall financial condition. Although the state appropriations are unrestricted revenue, nearly 100% of the state appropriations support payroll and benefits for University employees. In addition to the direct state appropriation there are several smaller appropriations that add to the total state support for the University such as the Star Store lease at the Dartmouth campus and the Springfield Satellite Center, among others. While these smaller line items are in support of campus-specific programs and do not support general University operations, they are included in the state appropriations line in the accompanying financial statements, and in the state appropriations line in the table below.
The Commonwealth pays fringe benefits for University employees paid from state appropriations. Therefore, such fringe benefit support is added to the state appropriations financial statement line item in the accompanying Statements of Revenues, Expenses and Changes in Net Position. The University pays the Commonwealth for the fringe benefit cost of the employees paid from funding sources other than state appropriations. These amounts are not included in state appropriations.
The University’s state appropriations including fringe benefits increased in FY2020 by $30.3 million from FY2019 primarily due to increased collective bargaining costs determined by the State, as well as an increase in the State’s fringe benefit rate.
The table below details the state appropriations for the fiscal years ended June 30, 2020, 2019, and 2018.
State capital AppropriationsThe University faces a financial challenge to maintain and upgrade its capital assets including its infrastructure, buildings and grounds. To have a successful capital program, the University must rely on a combination of revenue sources to fund its capital investments. In FY2020, FY2019 and FY2018, the capital support provided to the University through appropriations and grants from the Commonwealth
was $51.5 million, $25.5 million and $67.4 million, respectively. Beginning in FY2019, the Commonwealth established a new strategic framework for approving the allocation of state funding for capital projects across higher education. The new framework provides funding in four distinct categories: major projects, critical repairs, critical infrastructure and readiness determination projects.
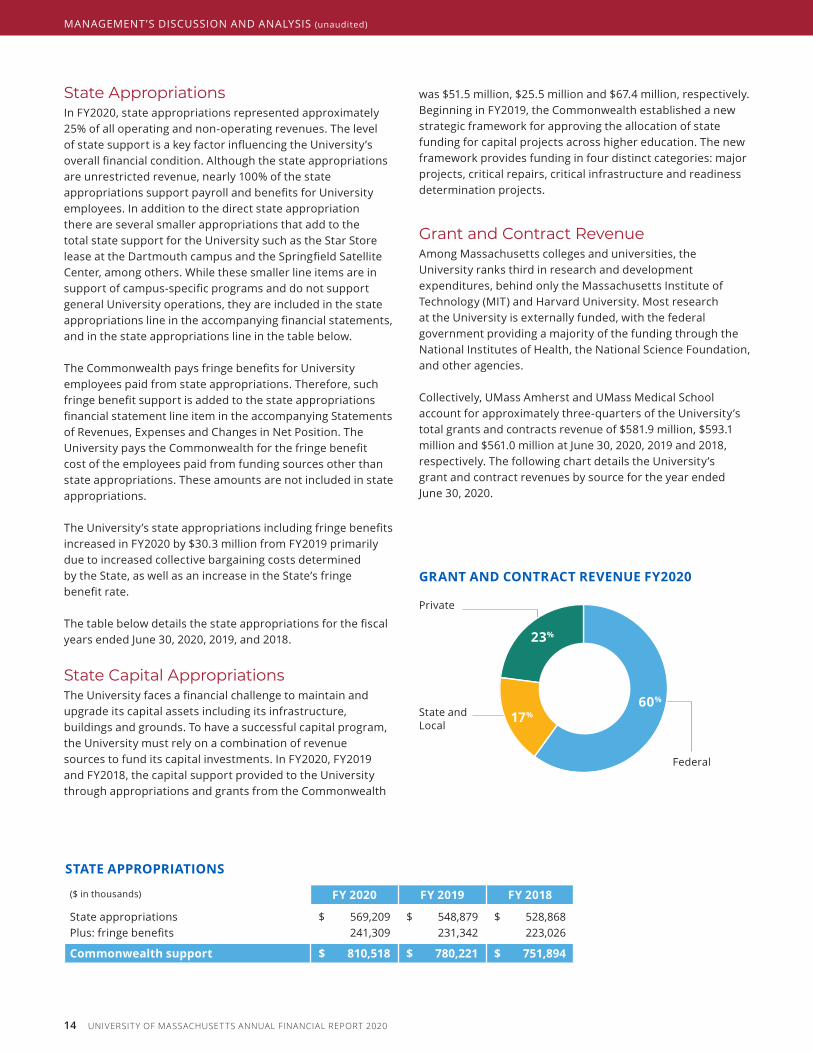
Grant and contract RevenueAmong Massachusetts colleges and universities, the University ranks third in research and development expenditures, behind only the Massachusetts Institute of Technology (MIT) and Harvard University. Most research at the University is externally funded, with the federal government providing a majority of the funding through the National Institutes of Health, the National Science Foundation, and other agencies.
Collectively, UMass Amherst and UMass Medical School account for approximately three‑quarters of the University’s total grants and contracts revenue of $581.9 million, $593.1 million and $561.0 million at June 30, 2020, 2019 and 2018, respectively. The following chart details the University’s grant and contract revenues by source for the year ended June 30, 2020.
STATE APProPrIATIonS
($ in thousands) Fy 2020 Fy 2019 Fy 2018
State appropriations $ 569,209 $ 548,879 $ 528,868Plus: fringe benefits 241,309 231,342 223,026
Commonwealth support $ 810,518 $ 780,221 $ 751,894
Federal
Private
State and Local
grAnT AnD ConTrACT rEvEnUE Fy2020
23%
17% 60%
14 UNIVERSIT Y OF MASSACHUSET TS ANNUAL FINANCIAL REPORT 2020
ManageMent’s Discussion anD analysis (unaudited)
tuition And FeesFor academic year 2019–2020, tuition was raised an average of 2.5% for in-state undergraduate students over the prior year. For academic year 2018–2019, tuition was raised on average 2.5% over the prior year. Affordability continues to be a priority of the University and increases in fees are considered in conjunction with State support on an annual basis.
Due to affordability considerations and impacts of the COVID‑19 pandemic, in‑state undergraduate tuition was frozen for the academic year 2020–2021.
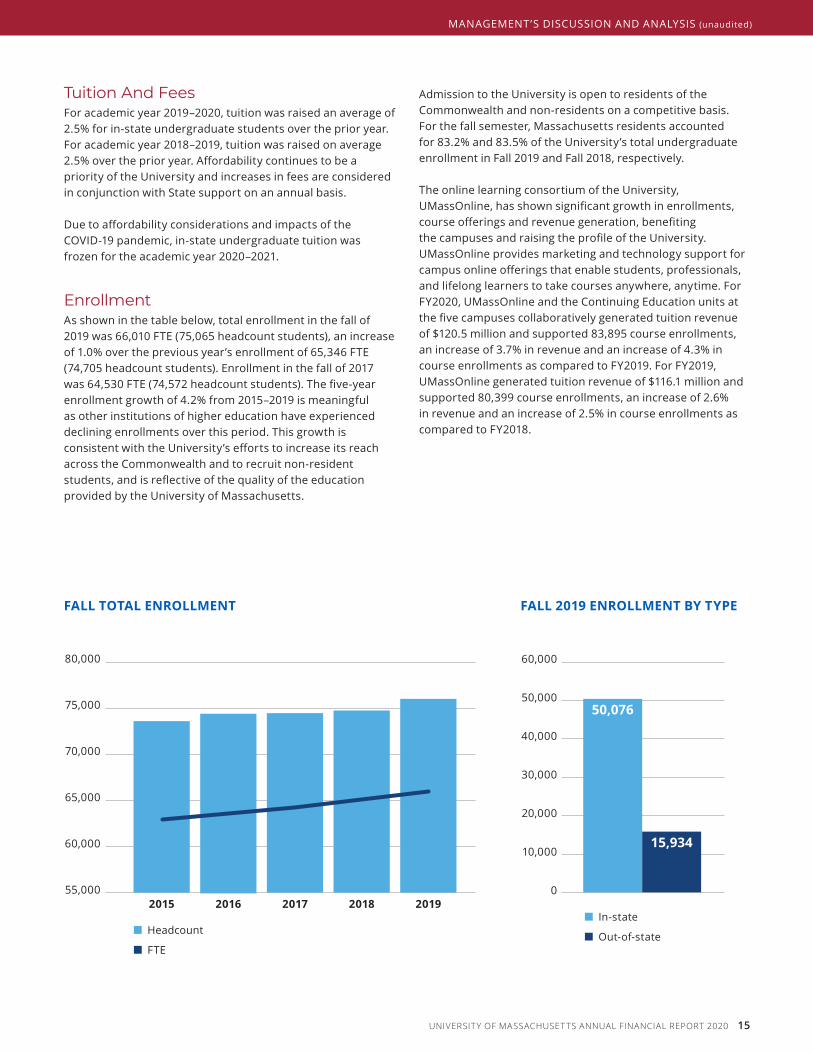
enrollmentAs shown in the table below, total enrollment in the fall of 2019 was 66,010 FTE (75,065 headcount students), an increase of 1.0% over the previous year’s enrollment of 65,346 FTE (74,705 headcount students). Enrollment in the fall of 2017 was 64,530 FTE (74,572 headcount students). The five-year enrollment growth of 4.2% from 2015–2019 is meaningful as other institutions of higher education have experienced declining enrollments over this period. This growth is consistent with the University’s efforts to increase its reach across the Commonwealth and to recruit non‑resident students, and is reflective of the quality of the education provided by the University of Massachusetts.
Admission to the University is open to residents of the Commonwealth and non-residents on a competitive basis. For the fall semester, Massachusetts residents accounted for 83.2% and 83.5% of the University’s total undergraduate enrollment in Fall 2019 and Fall 2018, respectively.
The online learning consortium of the University, UMassOnline, has shown significant growth in enrollments, course offerings and revenue generation, benefiting the campuses and raising the profile of the University. UMassOnline provides marketing and technology support for campus online offerings that enable students, professionals, and lifelong learners to take courses anywhere, anytime. For FY2020, UMassOnline and the Continuing Education units at the five campuses collaboratively generated tuition revenue of $120.5 million and supported 83,895 course enrollments, an increase of 3.7% in revenue and an increase of 4.3% in course enrollments as compared to FY2019. For FY2019, UMassOnline generated tuition revenue of $116.1 million and supported 80,399 course enrollments, an increase of 2.6% in revenue and an increase of 2.5% in course enrollments as compared to FY2018.
FALL 2019 EnroLLMEnT By TyPE
60,000
50,000
40,000
30,000
20,000
10,000
0
■ In-state
■ Out-of-state
50,076
15,934
FALL ToTAL EnroLLMEnT
80,000
75,000
70,000
65,000
60,000
55,000
■ Headcount
■ FTE
20192015 2016 2017 2018
UNIVERSIT Y OF MASSACHUSET TS ANNUAL FINANCIAL REPORT 2020 15
ManageMent’s Discussion anD analysis (unaudited)
long-term DebtLong-term debt is the University’s largest liability at June 30, 2020, 2019 and 2018. The University had outstanding long-term debt of $3.2 billion at June 30, 2020, $3.0 billion at June 30, 2019 and $3.1 billion at June 30, 2018. The principal issuer of the University’s debt is the Building Authority. Additional issuers utilized by the University include Massachusetts Health and Educational Facilities Authority (MHEFA), Massachusetts Development Financing Authority (MDFA), and WCCC.
The debt financed through the Building Authority is being used for construction and renovation of residence halls and general education buildings, replacement of core infrastructure, and construction of academic, laboratory, and research facilities. The proceeds from the UMass MHEFA bonds were used to create an internal revolving loan program and to fund the construction of two new campus centers at the Boston and Lowell campuses (funded jointly with the Commonwealth). For further details on outstanding balances with each issuer, refer to Note 9 of the accompanying financial statements.
university Bond RatingThe University relies on a carefully planned and executed debt strategy to support master and strategic planning at the campuses and for the University as a whole. Bonds issued by the University and the Building Authority are rated AA, Aa2 and AA‑ as rated by Fitch, Moody’s and Standard & Poor’s rating agencies, respectively.
Subsequent to FY2020, all three ratings agencies affirmed the University’s ratings, citing the University’s flagship role in public higher education in Massachusetts, strong fiscal oversight, steady enrollment, positive operating performance, growth in financial resources and solid support from the Commonwealth. The stable outlook for the University from Moody’s is also notable because Moody’s maintains a negative outlook for the higher education industry, with negative rating actions more likely on average in the higher education sector.
limitations on Additional indebtednessThe University may, without limit, issue additional indebtedness or request the Building Authority to issue additional indebtedness on behalf of the University so long as such indebtedness is payable from all available funds of the University. As noted in the Board of Trustee policy, each campus’ debt service cannot exceed 8% of its total operating expenditures.
The Building Authority is authorized by its enabling act to issue bonds with the unconditional guarantee of the Commonwealth for the punctual payment of the interest and principal on the guaranteed bonds. The full faith and credit of the Commonwealth are pledged for the performance of its guarantee. The enabling act, as amended, currently limits to $200.0 million the total principal amount of notes and bonds of the Building Authority that may be Commonwealth guaranteed and outstanding at any one time. The amount of bond obligations guaranteed by the Commonwealth at June 30, 2020, 2019 and 2018 was $108.9 million, $111.1 million and $113.5 million, respectively.
capital planA majority of the capital spending during FY2020 and FY2019 related to continued investments in deferred maintenance. In September 2018, the University’s Board approved an updated five-year capital plan for FY2019–FY2023 totaling $2.1 billion. The University’s capital plan is funded through a combination of University operations, bonds issued by the Building Authority and MHEFA, Commonwealth appropriations, and private fundraising.
16 UNIVERSIT Y OF MASSACHUSET TS ANNUAL FINANCIAL REPORT 2020
ManageMent’s Discussion anD analysis (unaudited)
Phot
os ta
ken
prio
r to
COVI
D-1
9 so
cial d
ista
ncin
g pra
ctice
s
The University’s five-year capital plan for FY2019–FY2023 includes major projects that were previously approved by the Board in prior-year capital plans. The University’s capital approval process provides for a multi‑step review process involving the President’s Office, the Building Authority and the Board. Additional approvals have been put in place for any capital project seeking alternative funding and/or delivery options.
Due to the COVID‑19 pandemic, the capital plan was reassessed, and $222 million of projects were put on hold in September 2020.
Factors impacting Future periodsThere are a number of issues of University‑wide importance that directly impact the financial operations of the University. By far, the biggest factor that impacted the University’s FY2020 and is expected to impact future periods is the COVID-19 pandemic. The full extent of the pandemic’s impact on FY2021 and beyond is not yet known, and will depend greatly on the trajectory the virus takes in Massachusetts, the ability of the Commonwealth to fund the University through annual appropriation, and the resulting impact on when the University can bring all students back to the campuses.
Other issues, such as improving academic quality, realizing strong financial results, investing in capital assets, expanding fundraising capacity, operating more efficiently, being the most effective University for students and the Commonwealth given the available resources, and measuring performance are ongoing activities of continuous importance to the Board and University leadership that impact the financial planning each year. Student enrollment, the level of state support, the impact of collectively bargained wage increases, and the ability of student‑fee supported activities to meet inflationary pressures determine the limits of program expansion, new initiatives and strategic investments, as well as the ability of the University to meet its core mission and ongoing operational needs.
contacting the universityThis financial report is designed to provide the University, the Commonwealth, the public and other interested parties with an overview of the financial results of the University and an explanation of the University’s financial condition. If you have any questions about this report or require additional information, please contact the University Controller, Barbara Cevallos by email at [email protected].
UNIVERSIT Y OF MASSACHUSET TS ANNUAL FINANCIAL REPORT 2020 17
ManageMent’s Discussion anD analysis (unaudited)
Photos taken prior to COVID-19 social distancing practices
Phot
os ta
ken
prio
r to
COVI
D-1
9 so
cial d
ista
ncin
g pra
ctice
s
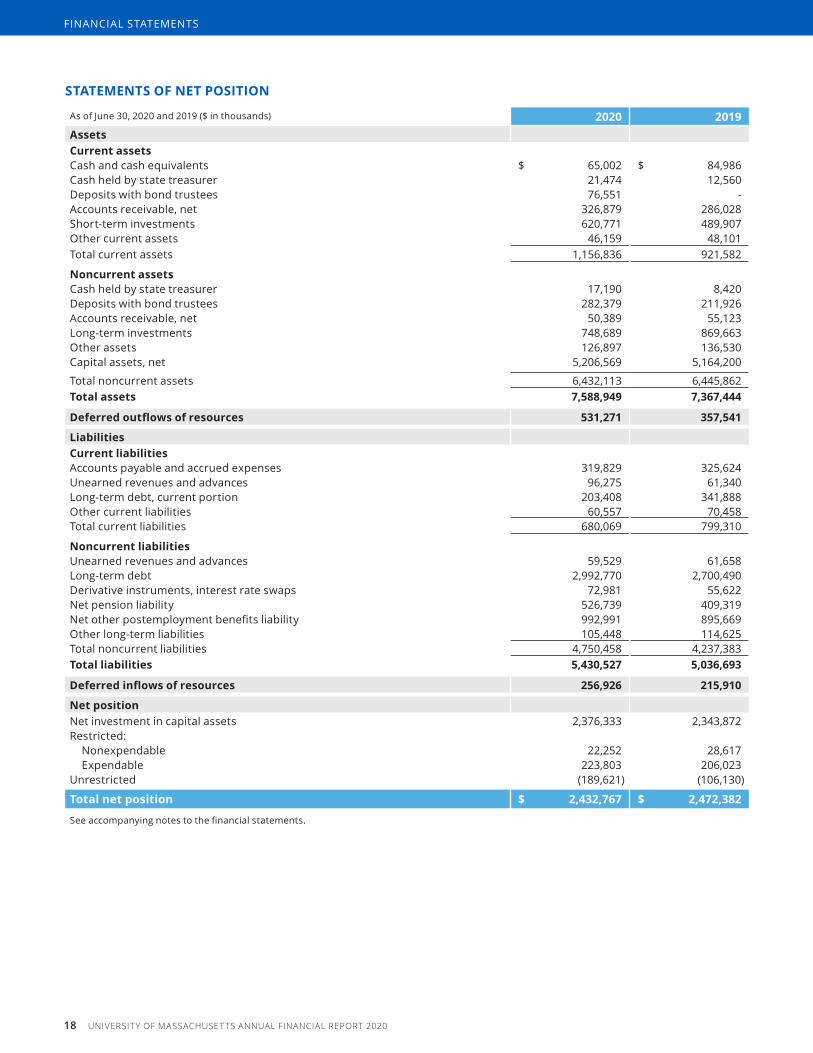
STATEMEnTS oF nET PoSITIon
As of June 30, 2020 and 2019 ($ in thousands) 2020 2019Assets Current assetsCash and cash equivalents $ 65,002 $ 84,986 Cash held by state treasurer 21,474 12,560 Deposits with bond trustees 76,551 ‑ Accounts receivable, net 326,879 286,028 Short‑term investments 620,771 489,907 Other current assets 46,159 48,101 Total current assets 1,156,836 921,582
Noncurrent assetsCash held by state treasurer 17,190 8,420 Deposits with bond trustees 282,379 211,926 Accounts receivable, net 50,389 55,123 Long‑term investments 748,689 869,663 Other assets 126,897 136,530 Capital assets, net 5,206,569 5,164,200
Total noncurrent assets 6,432,113 6,445,862 Total assets 7,588,949 7,367,444
Deferred outflows of resources 531,271 357,541
LiabilitiesCurrent liabilitiesAccounts payable and accrued expenses 319,829 325,624 Unearned revenues and advances 96,275 61,340 Long‑term debt, current portion 203,408 341,888 Other current liabilities 60,557 70,458 Total current liabilities 680,069 799,310
Noncurrent liabilitiesUnearned revenues and advances 59,529 61,658 Long‑term debt 2,992,770 2,700,490 Derivative instruments, interest rate swaps 72,981 55,622 Net pension liability 526,739 409,319 Net other postemployment benefits liability 992,991 895,669 Other long‑term liabilities 105,448 114,625 Total noncurrent liabilities 4,750,458 4,237,383 Total liabilities 5,430,527 5,036,693
Deferred inflows of resources 256,926 215,910
Net positionNet investment in capital assets 2,376,333 2,343,872 Restricted:
Nonexpendable 22,252 28,617 Expendable 223,803 206,023
Unrestricted (189,621) (106,130)
Total net position $ 2,432,767 $ 2,472,382
See accompanying notes to the financial statements.
18 UNIVERSIT Y OF MASSACHUSET TS ANNUAL FINANCIAL REPORT 2020
FINANCIAL STATEMENTS

STATEMEnTS oF rEvEnUES, ExPEnSES, AnD ChAngES In nET PoSITIon
For The Years Ended June 30, 2020 and 2019 ($ in thousands) 2020 2019RevenuesOperating revenuesTuition and fees (net of scholarship allowances of $343,031 at June 30, 2020 and $328,845 at June 30, 2019) $ 917,876 $ 894,904
Grants and contracts 581,850 593,086 Sales and services, educational activities 31,248 34,984 Auxiliary enterprises 378,314 441,795
Other operating revenues: Sales and services, independent operations 62,829 59,893 Sales and services, public service activities 337,709 291,085 Other 116,204 137,607
Total operating revenues 2,426,030 2,453,354
ExpensesOperating expensesEducational and general
Instruction 960,548 912,415 Research 485,759 490,887 Public service 84,248 86,251 Academic support 200,928 186,502 Student services 157,842 160,751 Institutional support 303,100 274,326 Operation and maintenance of capital assets 241,880 248,581 Depreciation and amortization 288,667 276,638 Scholarships and fellowships 65,469 49,511
Auxiliary enterprises 336,497 340,346 Other expenditures
Independent operations 56,256 48,282 Public service activities 256,248 226,821
Total operating expenses 3,437,442 3,301,311 Operating loss (1,011,412) (847,957)
Nonoperating revenues (expenses)Federal appropriations 6,774 7,004 State appropriations 810,518 780,221 Gifts 41,996 43,705 Investment income, net 32,762 48,943 Unrealized gain (loss) on investments (3,414) 18,082 Endowment return used for operations 28,113 27,741 Interest expense (109,186) (116,217)Nonoperating federal grants 115,601 84,454 Other nonoperating income 296 1,576 Net nonoperating revenues 923,460 895,509 Income (loss) before other revenues, expenses, gains, and losses (87,952) 47,552
Other revenues, expenses, gains and lossesCapital appropriations 51,525 25,500 Capital grants, contracts and gifts 7,516 13,165 Endowment return, net of amount used for operations (2,917) 13,467 Other deductions (7,787) (16,186)
Total other revenues, expenses, gains, and losses 48,337 35,946 Total increase (decrease) in net position (39,615) 83,498
Net position
Net position at beginning of year 2,472,382 2,388,884
Net position at end of year $ 2,432,767 $ 2,472,382
See accompanying notes to the financial statements.
UNIVERSIT Y OF MASSACHUSET TS ANNUAL FINANCIAL REPORT 2020 19
notes to financial statements
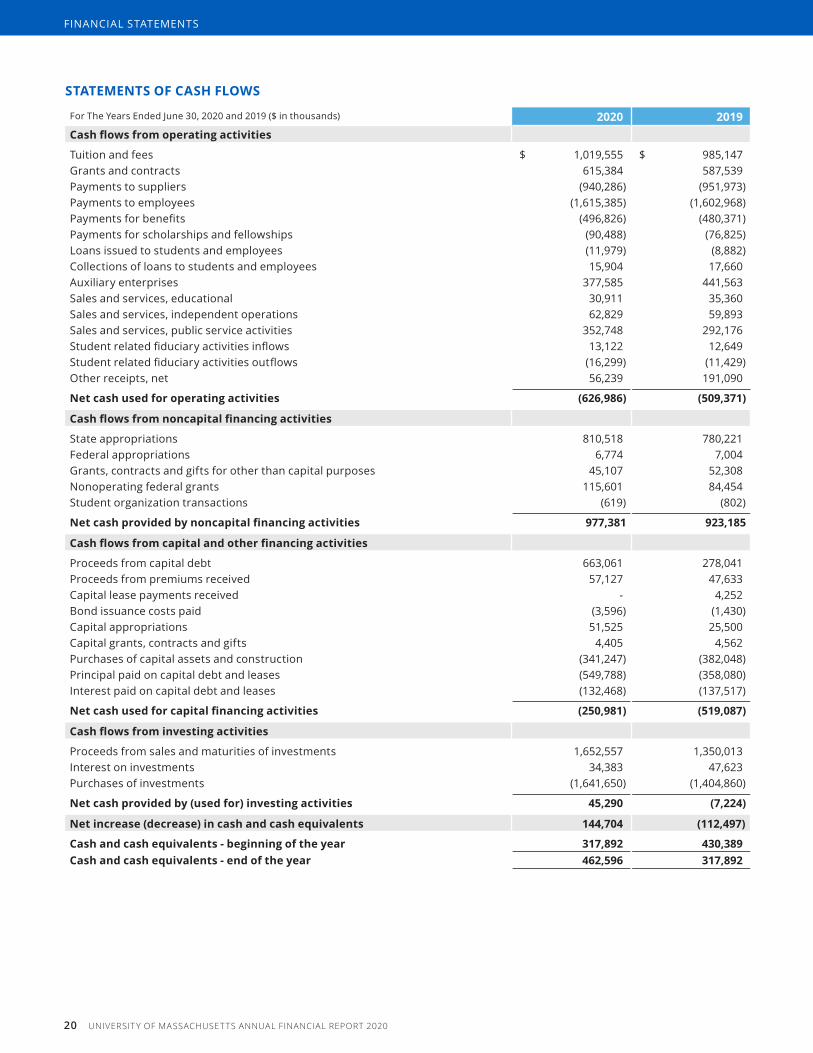
STATEMEnTS oF CASh FLoWS
For The Years Ended June 30, 2020 and 2019 ($ in thousands) 2020 2019 Cash flows from operating activities
Tuition and fees $ 1,019,555 $ 985,147Grants and contracts 615,384 587,539 Payments to suppliers (940,286) (951,973)Payments to employees (1,615,385) (1,602,968)Payments for benefits (496,826) (480,371)Payments for scholarships and fellowships (90,488) (76,825)Loans issued to students and employees (11,979) (8,882)Collections of loans to students and employees 15,904 17,660 Auxiliary enterprises 377,585 441,563 Sales and services, educational 30,911 35,360 Sales and services, independent operations 62,829 59,893 Sales and services, public service activities 352,748 292,176Student related fiduciary activities inflows 13,122 12,649Student related fiduciary activities outflows (16,299) (11,429)Other receipts, net 56,239 191,090
Net cash used for operating activities (626,986) (509,371)
Cash flows from noncapital financing activities
State appropriations 810,518 780,221 Federal appropriations 6,774 7,004 Grants, contracts and gifts for other than capital purposes 45,107 52,308 Nonoperating federal grants 115,601 84,454 Student organization transactions (619) (802)
net cash provided by noncapital financing activities 977,381 923,185
Cash flows from capital and other financing activities
Proceeds from capital debt 663,061 278,041 Proceeds from premiums received 57,127 47,633 Capital lease payments received ‑ 4,252 Bond issuance costs paid (3,596) (1,430)Capital appropriations 51,525 25,500 Capital grants, contracts and gifts 4,405 4,562 Purchases of capital assets and construction (341,247) (382,048)Principal paid on capital debt and leases (549,788) (358,080)Interest paid on capital debt and leases (132,468) (137,517)
net cash used for capital financing activities (250,981) (519,087)
Cash flows from investing activities
Proceeds from sales and maturities of investments 1,652,557 1,350,013 Interest on investments 34,383 47,623 Purchases of investments (1,641,650) (1,404,860)
Net cash provided by (used for) investing activities 45,290 (7,224)
Net increase (decrease) in cash and cash equivalents 144,704 (112,497)
Cash and cash equivalents - beginning of the year 317,892 430,389 Cash and cash equivalents - end of the year 462,596 317,892
20 UNIVERSIT Y OF MASSACHUSET TS ANNUAL FINANCIAL REPORT 2020
FINANCIAL STATEMENTS
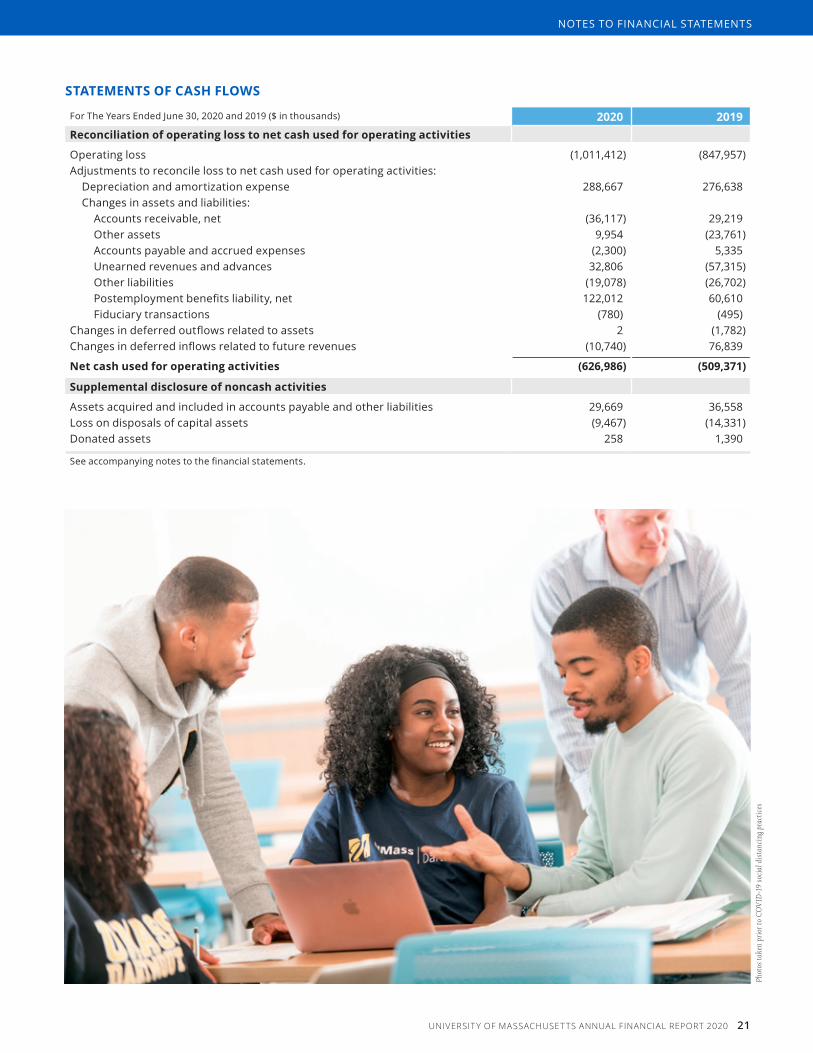
STATEMEnTS oF CASh FLoWS
For The Years Ended June 30, 2020 and 2019 ($ in thousands) 2020 2019Reconciliation of operating loss to net cash used for operating activities
Operating loss (1,011,412) (847,957)Adjustments to reconcile loss to net cash used for operating activities:
Depreciation and amortization expense 288,667 276,638 Changes in assets and liabilities:
Accounts receivable, net (36,117) 29,219 Other assets 9,954 (23,761)Accounts payable and accrued expenses (2,300) 5,335 Unearned revenues and advances 32,806 (57,315)Other liabilities (19,078) (26,702)Postemployment benefits liability, net 122,012 60,610 Fiduciary transactions (780) (495)
Changes in deferred outflows related to assets 2 (1,782)Changes in deferred inflows related to future revenues (10,740) 76,839
Net cash used for operating activities (626,986) (509,371)
Supplemental disclosure of noncash activities
Assets acquired and included in accounts payable and other liabilities 29,669 36,558 Loss on disposals of capital assets (9,467) (14,331)Donated assets 258 1,390
See accompanying notes to the financial statements.
UNIVERSIT Y OF MASSACHUSET TS ANNUAL FINANCIAL REPORT 2020 21
notes to financial statements
Phot
os ta
ken
prio
r to
COVI
D-1
9 so
cial d
ista
ncin
g pra
ctice
s
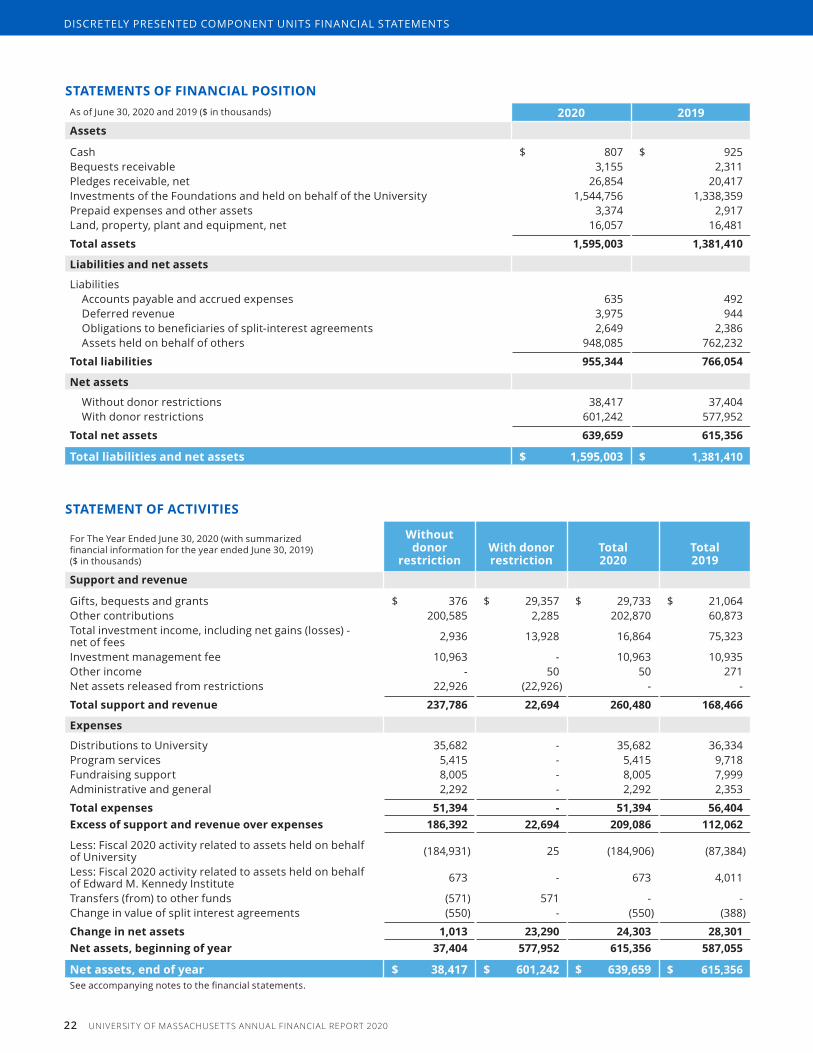
STATEMEnTS oF FInAnCIAL PoSITIonAs of June 30, 2020 and 2019 ($ in thousands) 2020 2019 Assets
Cash $ 807 $ 925 Bequests receivable 3,155 2,311 Pledges receivable, net 26,854 20,417 Investments of the Foundations and held on behalf of the University 1,544,756 1,338,359 Prepaid expenses and other assets 3,374 2,917 Land, property, plant and equipment, net 16,057 16,481
Total assets 1,595,003 1,381,410
Liabilities and net assets
LiabilitiesAccounts payable and accrued expenses 635 492 Deferred revenue 3,975 944 Obligations to beneficiaries of split-interest agreements 2,649 2,386 Assets held on behalf of others 948,085 762,232
Total liabilities 955,344 766,054
Net assets
Without donor restrictions 38,417 37,404 With donor restrictions 601,242 577,952
Total net assets 639,659 615,356
Total liabilities and net assets $ 1,595,003 $ 1,381,410
STATEMEnT oF ACTIvITIES
For The Year Ended June 30, 2020 (with summarized financial information for the year ended June 30, 2019) ($ in thousands)
Without donor
restrictionWith donor restriction
Total 2020
Total 2019
Support and revenue
Gifts, bequests and grants $ 376 $ 29,357 $ 29,733 $ 21,064 Other contributions 200,585 2,285 202,870 60,873 Total investment income, including net gains (losses) ‑ net of fees 2,936 13,928 16,864 75,323
Investment management fee 10,963 ‑ 10,963 10,935 Other income ‑ 50 50 271 Net assets released from restrictions 22,926 (22,926) ‑ ‑
Total support and revenue 237,786 22,694 260,480 168,466
Expenses
Distributions to University 35,682 ‑ 35,682 36,334 Program services 5,415 ‑ 5,415 9,718 Fundraising support 8,005 ‑ 8,005 7,999 Administrative and general 2,292 ‑ 2,292 2,353
Total expenses 51,394 - 51,394 56,404 Excess of support and revenue over expenses 186,392 22,694 209,086 112,062
Less: Fiscal 2020 activity related to assets held on behalf of University (184,931) 25 (184,906) (87,384)
Less: Fiscal 2020 activity related to assets held on behalf of Edward M. Kennedy Institute 673 ‑ 673 4,011
Transfers (from) to other funds (571) 571 ‑ ‑ Change in value of split interest agreements (550) ‑ (550) (388)
Change in net assets 1,013 23,290 24,303 28,301 Net assets, beginning of year 37,404 577,952 615,356 587,055
Net assets, end of year $ 38,417 $ 601,242 $ 639,659 $ 615,356See accompanying notes to the financial statements.
22 UNIVERSIT Y OF MASSACHUSET TS ANNUAL FINANCIAL REPORT 2020
DISCRETELy PRESENTED COMPONENT UNITS FINANCIAL STATEMENTS
notes to Financial Statements
1. Summary of Significant Accounting PoliciesReporting entityThe University of Massachusetts (University), a federal land grant institution, is governed by Massachusetts General Laws Chapter 75. Its Board of Trustees (Board or Trustees) consists of nineteen voting members and three non-voting members. The voting members consist of two full‑time students, the Secretary of Education of the Commonwealth of Massachusetts (Commonwealth) and sixteen members appointed by the governor. The three non-voting members are student representatives who may only participate in open meetings of the full Board of Trustees.
The University is a business-type activity of the Commonwealth. The financial balances and activities included in these financial statements are, therefore, also included in the Commonwealth’s comprehensive annual financial report.
The financial statements of the University include the campuses of Amherst, Boston, Dartmouth (including UMass Law), Lowell, Medical School, UMass Online, and the President’s Office of the University, Worcester City Campus Corporation (WCCC), the University of Massachusetts Amherst Foundation (UMAF), University of Massachusetts Medical School Foundation (UMMSF) as well as the University of Massachusetts Building Authority (Building Authority).
The Building Authority is a public instrumentality of the Commonwealth created by Chapter 773 of the Acts of 1960 (referred to as the Enabling Act), whose purpose is to provide dormitories, dining commons, and other buildings and structures for use by the University. WCCC is a tax-exempt organization founded to support research and real property activities for the University. The UMAF was established in 2003 to support private fundraising on behalf of the faculty and students of the Amherst campus. The UMMSF was established in 1991 to support fundraising and philanthropic activities of the Medical School. These component units are blended in the financial statements of the University because of the significance and exclusivity of their financial relationships with the University. Refer to Note 17 for condensed financial information for these blended component units.
The University also includes the financial information of its discretely presented component units, the University of Massachusetts Foundation, Inc. (UMF) and the University of Massachusetts Dartmouth Foundation, Inc. (UMDF). In these financial statements, UMF and UMDF are collectively known as The Foundations. These are related tax-exempt organizations founded to foster and promote the growth, progress and general welfare of the University.
The University of Massachusetts Lowell Applied Research Corporation (UMLARC), a legally separate 501(c)(3) non-profit corporation, was formed on June 24, 2020. The purpose of UMLARC is to promote efficient and effective applied research and development by entering into grants, contracts, and other contractual mechanisms for services, in conjunction with the University Massachusetts Lowell Research Institute and its research partners. UMLARC will also provide analytic and technology solutions to government and non-government entities to extend the impact of the University’s technology enterprise. There is no financial activity for the UMLARC included within the financial statements as of June 30, 2020. Because the memorandum of understanding between UMLARC and UMass Lowell is not yet complete, the determination of discrete or blended component unit is pending.
UNIVERSIT Y OF MASSACHUSET TS ANNUAL FINANCIAL REPORT 2020 23
notes to financial statements

Basis of presentation The accompanying financial statements have been prepared in accordance with U.S. generally accepted accounting principles (GAAP) as prescribed by the GASB using the economic resources measurement focus and the accrual basis of accounting. The Foundations’ financial statements are prepared in accordance with accounting and reporting requirements prescribed by the Financial Accounting Standards Board (FASB). As such, certain revenue recognition criteria and presentation features are different from GASB revenue recognition criteria and presentation features. No modifications have been made to the Foundations’ financial information in the University’s annual financial report for these differences.
The University’s activities are considered to be a single business‑type activity and accordingly, are reported in a single column in the financial statements. Business-type activities are those that are financed in whole or part by funds received from external parties for goods or services.
On the Statements of Revenues, Expenses and Changes in Net Position, the University’s operating activities consist of tuition and fees, grants and contracts, sales and services, auxiliary enterprise and other operating revenues. Other operating revenues include sales and services provided by the UMass Medical School (UMMS) under its Commonwealth Medicine (CWM) programs, which provide consulting and services in health care financing, administration and policy to federal, state and local agencies and not-for-profit health and policy organizations. Also included in other operating revenues are payments received by the Medical School for educational services it provides to its clinical affiliate, UMass Memorial Medical Center (UMass Memorial).
Operating expenses include, among other items, payroll, fringe benefits, utilities, supplies and services, depreciation, and amortization. Nonoperating revenues or expenses are those in which the University receives or gives value without directly giving or receiving equal value, such as State and Federal appropriations, CARES Act revenue, Federal Pell grants, private gifts, and investment income.
Revenues for exchange transactions are recognized when earned and expenses are recognized when incurred. Restricted grant revenue is recognized only when all eligibility requirements have been met. The University applies restricted net assets first when an expense or outlay is incurred for purposes for which both restricted and unrestricted net assets are available.
The University receives unconditional promises to give through private donations or pledges from corporations, foundations, alumni and other supporters of the University. Revenue is recognized when a pledge is received and all eligibility requirements, including time and purpose requirements, are met. Endowment pledges are not recorded until paid because the inherent time restriction has not been met until the funds are able to be invested in perpetuity.
net positionNet position is classified into the following categories:
• net investment in capital assets: Capital assets, at historical cost or fair market value on the date of gift, net of accumulated depreciation and outstanding principal balances of debt attributable to the acquisition, construction or improvement of those assets.
• restricted nonexpendable: Resources subject to externally imposed stipulations that they be maintained permanently by the University.
• restricted expendable: Resources whose use by the University is subject to externally imposed stipulations. Such assets include restricted grants and contracts, the accumulated net gains/losses on true endowment funds, as well as restricted funds loaned to students, restricted gifts and endowment income, and other similar restricted funds.
• Unrestricted: The net position that is not subject to externally imposed restrictions governing their use. The University’s unrestricted net position may be designated for specific purposes by management or the Board. Substantially all of the University’s unrestricted net position is designated to support academic and research initiatives or programs, auxiliary enterprises, quasi-endowments, or commitments to capital construction projects. Note 15 describes these designations in more detail.
cash and cash equivalents Cash and cash equivalents include cash balances maintained in checking accounts, overnight repurchase agreements and amounts held in permitted money market mutual funds with an original maturity date of three months or less.
In addition, the University is authorized to invest in the Massachusetts Municipal Depository Trust (“MMDT”), a pooled money market-like fund, established under Massachusetts General Laws, Chapter 29, Section 38A. MMDT is an external investment pool that meets the criteria to report its holdings at amortized cost. As such, the University reports its position in MMDT at amortized
24 UNIVERSIT Y OF MASSACHUSET TS ANNUAL FINANCIAL REPORT 2020
notes to financial statements
cost which approximates the net asset value of $1.00 (one dollar) per share. MMDT has a maturity of less than one year and is not rated.
Accounts receivable, netAccounts receivable consist of receivables for tuition and fees, grants and contracts, student loans, pledges and CWM related activities. The University establishes an allowance for accounts receivable based on management’s expectation regarding the collection of the receivables and the University’s historical experience for collections.
investmentsInvestments are reported at fair value. Short-term investments consist of deposits with original maturities of less than one year and are available for current use. Securities received as gifts are recorded at estimated fair value at the date of the gift. Investment income includes dividends and interest income and is recognized on the accrual basis. In computing realized gains and losses, cost is determined on a specific identification basis.
endowmentUMF maintains and administers the University’s endowment assets and other long-term investments. UMF utilizes the pooled investment concept whereby all invested funds are included in one investment pool, unless otherwise required by the donor.
Pooled investment funds will receive an annual distribution, based on the endowment fund’s average market value for the preceding twelve quarters on a one-year lag. Only quarters with funds on deposit are included in the average. In addition, a prudence rule is utilized, limiting spending from a particular endowment fund to be no lower than 93% of its carrying value. The spending rate approved for the years ended June 30, 2020 and 2019 was 4%.
capital assetsCapital assets are stated at cost on the date of acquisition or, in the case of gifts, fair value upon date of donation. Net interest costs incurred during the construction period for major capital projects are capitalized. Repairs and maintenance costs are expensed as incurred, whereas major improvements that extend the estimated useful lives of the assets are capitalized as additions to capital assets. The University does not capitalize works of art, historical treasures or library books.
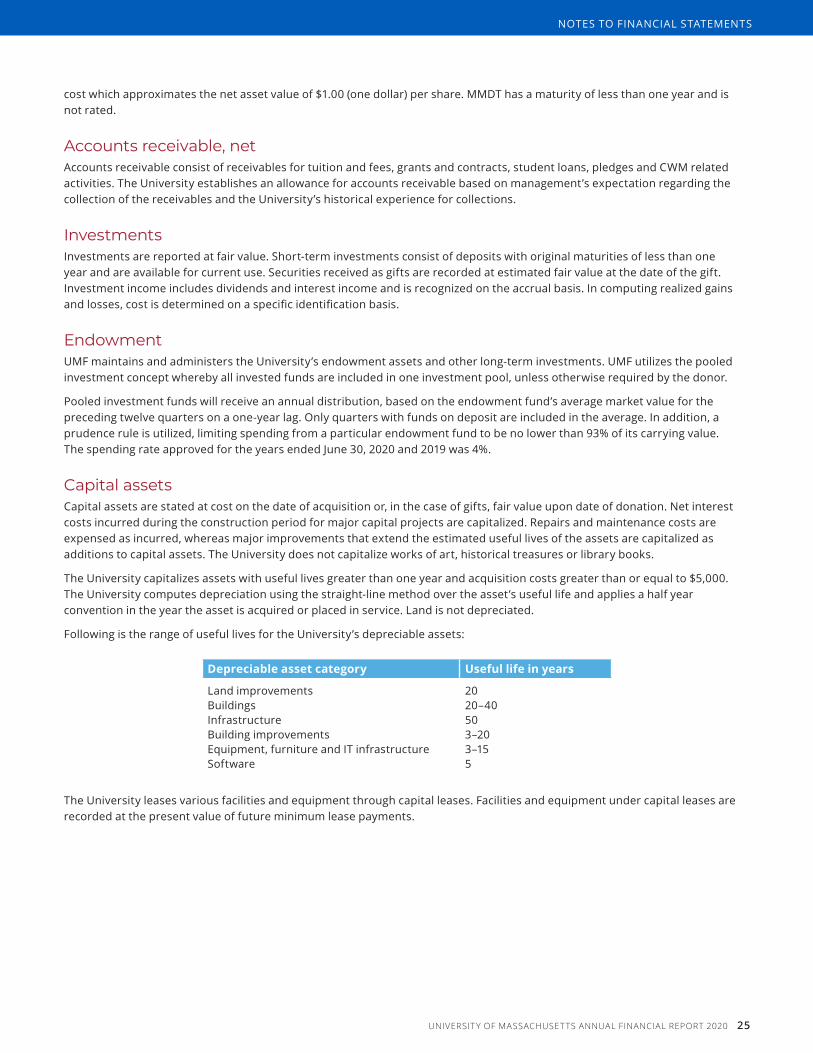
The University capitalizes assets with useful lives greater than one year and acquisition costs greater than or equal to $5,000. The University computes depreciation using the straight‑line method over the asset’s useful life and applies a half year convention in the year the asset is acquired or placed in service. Land is not depreciated.
Following is the range of useful lives for the University’s depreciable assets:
Depreciable asset category Useful life in years
Land improvements 20Buildings 20–40Infrastructure 50Building improvements 3–20Equipment, furniture and IT infrastructure 3–15Software 5
The University leases various facilities and equipment through capital leases. Facilities and equipment under capital leases are recorded at the present value of future minimum lease payments.
UNIVERSIT Y OF MASSACHUSET TS ANNUAL FINANCIAL REPORT 2020 25
notes to financial statements

Deferred outflows and inflows of resourcesThe University accounts for certain transactions that result in the consumption or acquisition in one period that are applicable to future periods as deferred outflows and deferred inflows, respectively, to distinguish them from assets and liabilities. Deferred outflows of resources increase net position, similar to assets and deferred inflows of resources decrease net position, similar to liabilities.
The components of deferred outflows and inflows of resources as of June 30, 2020 and 2019 included the following ($ in thousands):
As of June 30, 2020 and 2019 ($ in thousands) 2020 2019Deferred outflows of resourcesChange in fair value of interest rate swap agreements $ 52,978 $ 34,262 Debt refunding 79,648 69,119 Certain asset retirement obligations 1,781 1,782 Impact of assumption changes and investment losses to:
Pension liability 158,057 113,654 Other postemployment benefits liability 238,807 138,724
$ 531,271 $ 357,541
Deferred inflows of resources
Sale of future revenues 66,099 76,839 Experience gains for:
Pension liability 39,778 60,182 Other postemployment benefits liability 151,049 78,889
$ 256,926 $ 215,910
compensated absencesEmployees earn the right to be compensated during absences for annual vacation leave and sick leave. Upon retirement, termination, or death, certain employees are compensated for unused sick and vacation leave, subject to certain limitations, at their current rate of pay. Within the Statements of Net Position, a liability is recorded for vacation and sick leave benefits earned as of the fiscal year-end. The recorded liability is classified as current and noncurrent on the Statements of Net Position based on the amount estimated to be paid to eligible employees in one year and beyond one year, respectively.
unearned revenue and advancesUnearned revenue consists of amounts billed or received in advance of the University providing goods or services. Unearned revenue is subsequently earned as qualifying expenses are incurred.
Advances include funds advanced to the University by the U.S government under the Federal Perkins Loan Program (the Program). Under federal law, the authority for colleges and universities to make new loans under the Program ended on September 30, 2017, and final distributions were permitted through June 30, 2019. The University’s Statements of Net Position include both the notes receivable from students and the related refundable loan liability to the Federal government.
Bond issuance costsThe University incurs certain costs associated with bond issuances. For the years ended June 30, 2020 and 2019, bond issuance costs amounted to $3.6 million and $1.4 million, respectively, and were expensed.
tuition and fees, net of scholarship allowancesStudent tuition and fees, housing, dining, and other similar auxiliary revenues are reported net of any related scholarships and fellowships applied to student accounts. However, scholarships and fellowships paid directly to students are separately reported as scholarships and fellowships expense.
26 UNIVERSIT Y OF MASSACHUSET TS ANNUAL FINANCIAL REPORT 2020
notes to financial statements
Grants and contractsThe University receives grants and contracts for research and other activities including medical service reimbursements from federal and state government agencies. The University records revenue at the point all eligibility requirements (e.g. allowable costs are incurred) are met.
The University records the recovery of indirect costs applicable to research programs and other activities which provide for the full or partial reimbursement of such costs, as revenue. Recovery of indirect costs for the years ended June 30, 2020 and 2019 was $136.2 million and $136.8 million, respectively, and is a component of grants and contracts revenue on the Statements of Revenues, Expenses, and Changes in Net Position.
As a result of the COVID-19 pandemic, the University was awarded $46 million from the Higher Education Emergency Relief Fund (HEERF). $14.7 million of the funds awarded were used for emergency financial aid grants under the 18004(a)(1) CARES Act and recognized as non-operating federal grants revenue in fiscal 2020. An additional $13.9 million was used to cover costs related to significant changes to the delivery of instruction due to the coronavirus, and to provide additional financial aid to students, and was also recorded as non-operating federal grant revenue in fiscal 2020. The remaining unused awarded amounts will be recorded in fiscal 2021 as qualifying expenses for students and the University are incurred.
Auxiliary enterprisesAn auxiliary enterprise is an activity that exists to furnish a service to students, faculty or staff acting in a personal capacity, and that charges a fee for the use of goods and services. For the University, housing and dining revenues are included in auxiliary enterprises.
Fringe benefits for current employees and postemployment obligationsThe University participates in the Commonwealth’s fringe benefit programs, including active employee and postemployment health insurance, unemployment compensation, pension, and workers’ compensation benefits. Health insurance and pension costs for active employees and retirees are paid through a fringe benefit rate charged to the University by the Commonwealth. Workers’ compensation costs are assessed separately based on actual University experience.
use of estimatesThe preparation of financial statements in conformity with GAAP requires management to make estimates and assumptions that affect the reported amounts of assets and liabilities, the disclosure of contingent assets and liabilities at the dates of the financial statements, and the reported amounts of revenues and expenses during the reporting periods. Actual results could differ from these estimates. The most significant areas that require management estimates relate to valuation of certain investments and derivative instruments, useful lives and related depreciation of capital assets, and accruals for pension and other postemployment related benefits.
income tax statusThe University is exempt from Federal and state income tax under the doctrine of intergovernmental tax immunity. The University qualifies as a public charity eligible to receive charitable contributions under Section 170(b)(1)(A)(v) of the Internal Revenue Code, as amended (the Code).
WCCC, UMF, UMMSF and UMDF are organizations described in Section 501(c)(3) of the Code, and are generally exempt from income taxes pursuant to Section 501(a) of the Code. WCCC, UMF, UMMSF and UMDF are required to assess uncertain tax positions and have determined that there were no such positions that are material to the financial statements as of June 30, 2020 and 2019, respectively.
newly implemented accounting standards Effective for the fiscal year ended June 30, 2020, the University adopted GASB Statement No. 84, Fiduciary Activities, (“GASB 84”). This statement establishes criteria for identifying fiduciary activities and requires that fiduciary activities be reported in a Statement of Fiduciary Net Position and a Statement of Changes in Fiduciary Position. GASB 84 permits business-type activities, such as the University, to report activities that would otherwise be considered fiduciary activities in the University’s Statement of Net Position and Statement of Cash Flows as operating activities if upon receipt, the funds are normally expected to be held for three months or less. Given the majority of fiduciary activities are custodial amounts held for three months or less, the University did not report these activities within a Statement of Fiduciary Net Position or Statement of Changes in Fiduciary
UNIVERSIT Y OF MASSACHUSET TS ANNUAL FINANCIAL REPORT 2020 27
notes to financial statements
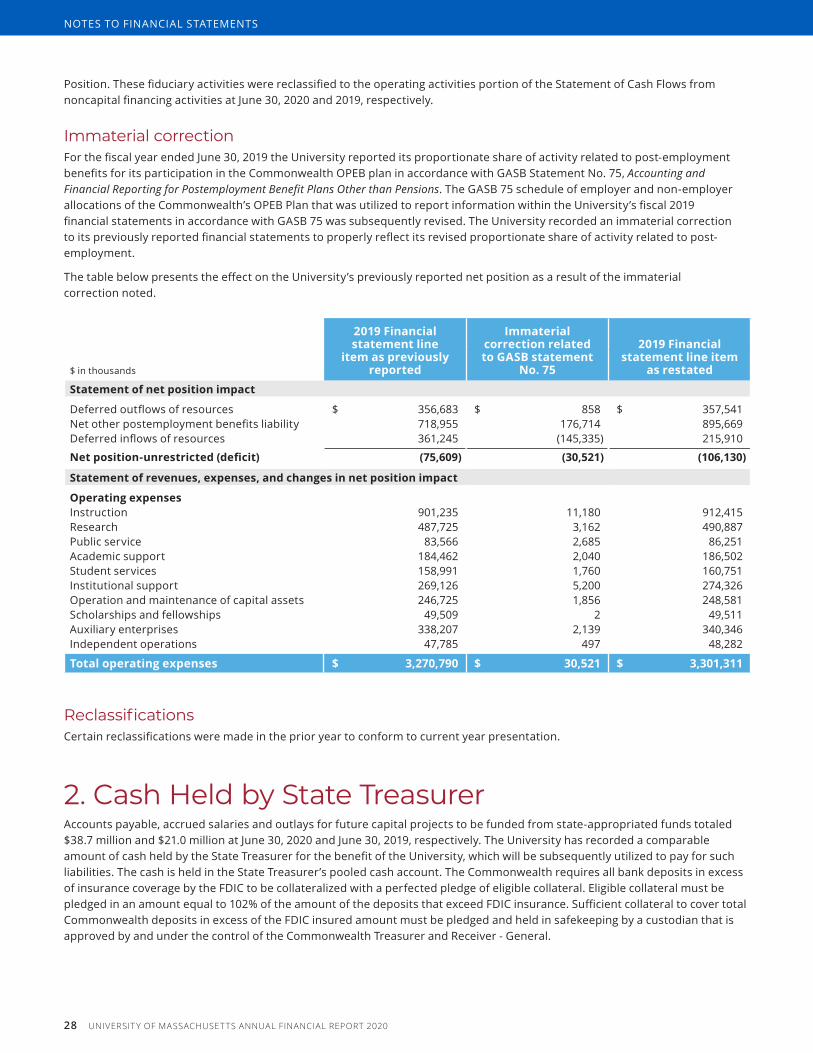
Position. These fiduciary activities were reclassified to the operating activities portion of the Statement of Cash Flows from noncapital financing activities at June 30, 2020 and 2019, respectively.
immaterial correctionFor the fiscal year ended June 30, 2019 the University reported its proportionate share of activity related to post-employment benefits for its participation in the Commonwealth OPEB plan in accordance with GASB Statement No. 75, Accounting and Financial Reporting for Postemployment Benefit Plans Other than Pensions. The GASB 75 schedule of employer and non-employer allocations of the Commonwealth’s OPEB Plan that was utilized to report information within the University’s fiscal 2019 financial statements in accordance with GASB 75 was subsequently revised. The University recorded an immaterial correction to its previously reported financial statements to properly reflect its revised proportionate share of activity related to post-employment.
The table below presents the effect on the University’s previously reported net position as a result of the immaterial correction noted.
2019 Financial statement line
item as previously reported
Immaterial correction related to gASB statement
No. 75
2019 Financial statement line item
as restated$ in thousands
Statement of net position impact
Deferred outflows of resources $ 356,683 $ 858 $ 357,541Net other postemployment benefits liability 718,955 176,714 895,669Deferred inflows of resources 361,245 (145,335) 215,910
net position-unrestricted (deficit) (75,609) (30,521) (106,130)
Statement of revenues, expenses, and changes in net position impact
Operating expensesInstruction 901,235 11,180 912,415Research 487,725 3,162 490,887Public service 83,566 2,685 86,251Academic support 184,462 2,040 186,502Student services 158,991 1,760 160,751Institutional support 269,126 5,200 274,326Operation and maintenance of capital assets 246,725 1,856 248,581Scholarships and fellowships 49,509 2 49,511Auxiliary enterprises 338,207 2,139 340,346Independent operations 47,785 497 48,282
Total operating expenses $ 3,270,790 $ 30,521 $ 3,301,311
Reclassifications Certain reclassifications were made in the prior year to conform to current year presentation.
2. cash Held by State treasurerAccounts payable, accrued salaries and outlays for future capital projects to be funded from state‑appropriated funds totaled $38.7 million and $21.0 million at June 30, 2020 and June 30, 2019, respectively. The University has recorded a comparable amount of cash held by the State Treasurer for the benefit of the University, which will be subsequently utilized to pay for such liabilities. The cash is held in the State Treasurer’s pooled cash account. The Commonwealth requires all bank deposits in excess of insurance coverage by the FDIC to be collateralized with a perfected pledge of eligible collateral. Eligible collateral must be pledged in an amount equal to 102% of the amount of the deposits that exceed FDIC insurance. Sufficient collateral to cover total Commonwealth deposits in excess of the FDIC insured amount must be pledged and held in safekeeping by a custodian that is approved by and under the control of the Commonwealth Treasurer and Receiver - General.
28 UNIVERSIT Y OF MASSACHUSET TS ANNUAL FINANCIAL REPORT 2020
notes to financial statements
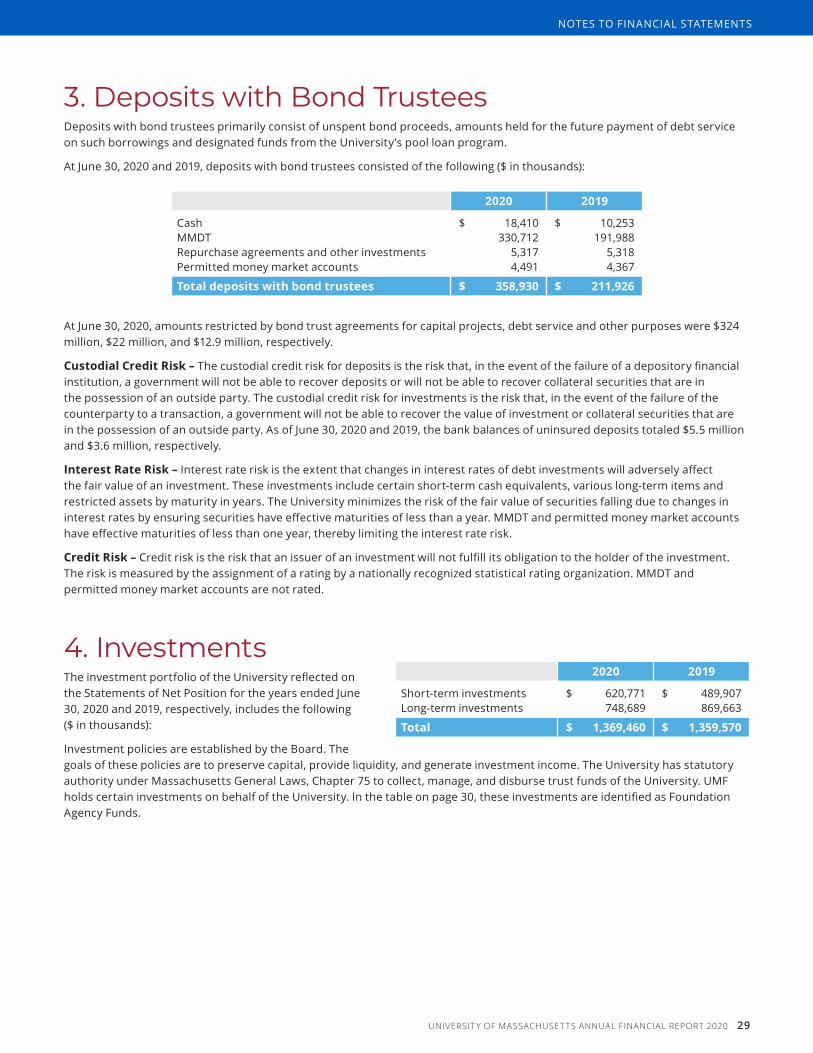
3. Deposits with Bond trusteesDeposits with bond trustees primarily consist of unspent bond proceeds, amounts held for the future payment of debt service on such borrowings and designated funds from the University’s pool loan program.
At June 30, 2020 and 2019, deposits with bond trustees consisted of the following ($ in thousands):
2020 2019
Cash $ 18,410 $ 10,253 MMDT 330,712 191,988 Repurchase agreements and other investments 5,317 5,318 Permitted money market accounts 4,491 4,367
Total deposits with bond trustees $ 358,930 $ 211,926
At June 30, 2020, amounts restricted by bond trust agreements for capital projects, debt service and other purposes were $324 million, $22 million, and $12.9 million, respectively.
Custodial Credit Risk – The custodial credit risk for deposits is the risk that, in the event of the failure of a depository financial institution, a government will not be able to recover deposits or will not be able to recover collateral securities that are in the possession of an outside party. The custodial credit risk for investments is the risk that, in the event of the failure of the counterparty to a transaction, a government will not be able to recover the value of investment or collateral securities that are in the possession of an outside party. As of June 30, 2020 and 2019, the bank balances of uninsured deposits totaled $5.5 million and $3.6 million, respectively.
Interest Rate Risk – Interest rate risk is the extent that changes in interest rates of debt investments will adversely affect the fair value of an investment. These investments include certain short-term cash equivalents, various long-term items and restricted assets by maturity in years. The University minimizes the risk of the fair value of securities falling due to changes in interest rates by ensuring securities have effective maturities of less than a year. MMDT and permitted money market accounts have effective maturities of less than one year, thereby limiting the interest rate risk.
Credit Risk – Credit risk is the risk that an issuer of an investment will not fulfill its obligation to the holder of the investment. The risk is measured by the assignment of a rating by a nationally recognized statistical rating organization. MMDT and permitted money market accounts are not rated.
4. investmentsThe investment portfolio of the University reflected on the Statements of Net Position for the years ended June 30, 2020 and 2019, respectively, includes the following ($ in thousands):
Investment policies are established by the Board. The goals of these policies are to preserve capital, provide liquidity, and generate investment income. The University has statutory authority under Massachusetts General Laws, Chapter 75 to collect, manage, and disburse trust funds of the University. UMF holds certain investments on behalf of the University. In the table on page 30, these investments are identified as Foundation Agency Funds.
2020 2019
Short‑term investments $ 620,771 $ 489,907 Long‑term investments 748,689 869,663
Total $ 1,369,460 $ 1,359,570
UNIVERSIT Y OF MASSACHUSET TS ANNUAL FINANCIAL REPORT 2020 29
notes to financial statements

The endowment and similar investment holdings of the University, Foundation Agency Funds, and the Foundations, as of June 30, 2020 and 2019, respectively are summarized below ($ in thousands):
University Foundations2020 2019 2020 2019
Cash and cash equivalents $ 40,009 $ 111,408 $ 36,318 $ 31,914 Money market and other investments 128,225 260,000 4,082 4,411 MMDT 117,000 95,000 ‑ ‑ Fixed income investments 144,045 139,398 1,558 3,784 Pooled investments ‑ Fund I ‑ ‑ 576,092 556,031 Commercial ventures and intellectual property 4,532 1,857 40 ‑ Annuity life income funds 11,972 13,160 2,989 3,472
$ 445,783 $ 620,823 $ 621,079 $ 599,612
Foundation agency funds:Pooled investments ‑ Fund I 608,763 415,445 608,763 415,445 Pooled investments ‑ Fund II 314,914 323,302 314,914 323,302
$ 1,369,460 $ 1,359,570 $ 1,544,756 $ 1,338,359
Fund I – This fund is the pool of funds that represent the endowment funds held at UMF. These funds include both donor-restricted endowments and quasi-endowments. The portion of the Pooled investments — Fund I under the Foundations column in the above table represents the University’s true endowment. The portion of the Pooled investments — Fund I that are noted as Foundation agency funds represent the quasi-endowments. The investment horizon for this portfolio is 5 to 10 years. During fiscal year 2020 the University transferred additional operating cash balances to UMF for longer term investment.
Fund II – This fund represents a portion of the operating cash balances of the University that have been transferred to UMF for investment purposes only. This portfolio is used by the University as an intermediate term investment vehicle. The University Treasurer has the authority to request the return of funds at any time in order to meet the operating needs of the University. In anticipation of future cash needs, particularly in light of COVID‑19 uncertainties, the majority of assets of Fund II were converted to cash equivalents in the 4th quarter of fiscal year 2020. These cash equivalent investments are included within short-term investments on the Statement of Net Position at June 30, 2020.
Custodial Credit Risk – Investment securities are exposed to custodial credit risk if they are uninsured or not registered in the name of the University and are held by either the counterparty or the counterparty’s trust department or agent but not in the University’s name.
The carrying amounts of cash balances with uninsured or uncollateralized deposits were $86.5 million and $107.1 million, at June 30, 2020 and 2019, respectively.
The University held non-money market investments with a fair market value of $729.9 million and $869.1 million at June 30, 2020 and 2019, respectively. In the event of negligence due to the University’s custodian and/or investment manager(s), it is expected that the investment balances would be fully recovered. However, these amounts are subject to both interest rate risk and credit risk.
Concentration of Credit Risk – As of June 30, 2020 and 2019, there is no concentration of investments from one issuer equal to or greater than 5% of the portfolio. Investments issued or guaranteed by the U.S. government, as well as investments in mutual funds and other pooled investments are excluded from consideration when evaluating concentration risk.
Credit Risk – The University’s Investment Policy and Guidelines Statement allows each portfolio manager full discretion within the parameters of the investment guidelines specific to that manager. Nationally recognized statistical rating organizations, such as Standards & Poor’s (S&P) assign credit ratings to security issues and issuers that indicate a measure of potential credit risk to investors.
30 UNIVERSIT Y OF MASSACHUSET TS ANNUAL FINANCIAL REPORT 2020
notes to financial statements
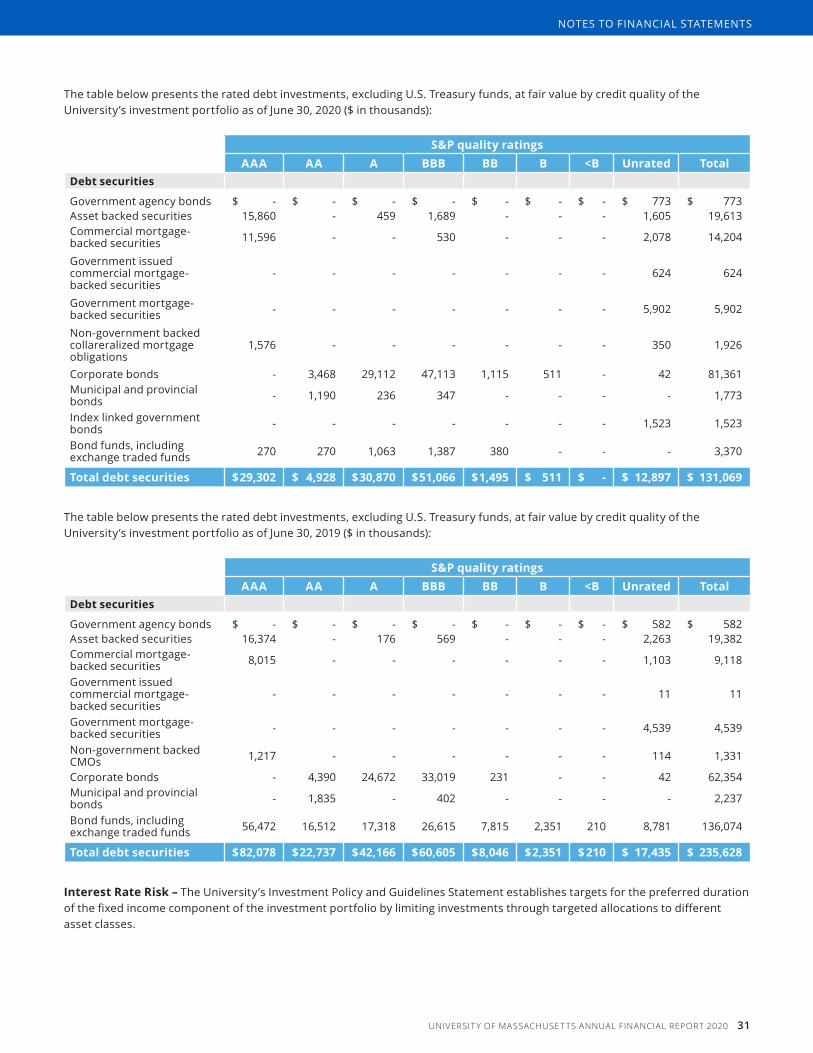
The table below presents the rated debt investments, excluding U.S. Treasury funds, at fair value by credit quality of the University’s investment portfolio as of June 30, 2020 ($ in thousands):
S&P quality ratingsAAA AA A BBB BB B <B Unrated Total
Debt securities
Government agency bonds $ ‑ $ ‑ $ ‑ $ ‑ $ ‑ $ ‑ $ ‑ $ 773 $ 773 Asset backed securities 15,860 ‑ 459 1,689 ‑ ‑ ‑ 1,605 19,613 Commercial mortgage‑backed securities 11,596 ‑ ‑ 530 ‑ ‑ ‑ 2,078 14,204
Government issued commercial mortgage‑backed securities
‑ ‑ ‑ ‑ ‑ ‑ ‑ 624 624
Government mortgage‑backed securities ‑ ‑ ‑ ‑ ‑ ‑ ‑ 5,902 5,902
Non‑government backed collareralized mortgage obligations
1,576 ‑ ‑ ‑ ‑ ‑ ‑ 350 1,926
Corporate bonds ‑ 3,468 29,112 47,113 1,115 511 ‑ 42 81,361 Municipal and provincial bonds ‑ 1,190 236 347 ‑ ‑ ‑ ‑ 1,773
Index linked government bonds ‑ ‑ ‑ ‑ ‑ ‑ ‑ 1,523 1,523
Bond funds, including exchange traded funds 270 270 1,063 1,387 380 ‑ ‑ ‑ 3,370
Total debt securities $ 29,302 $ 4,928 $ 30,870 $ 51,066 $ 1,495 $ 511 $ - $ 12,897 $ 131,069
The table below presents the rated debt investments, excluding U.S. Treasury funds, at fair value by credit quality of the University’s investment portfolio as of June 30, 2019 ($ in thousands):
S&P quality ratingsAAA AA A BBB BB B <B Unrated Total
Debt securities
Government agency bonds $ ‑ $ ‑ $ ‑ $ ‑ $ ‑ $ ‑ $ ‑ $ 582 $ 582 Asset backed securities 16,374 ‑ 176 569 ‑ ‑ ‑ 2,263 19,382 Commercial mortgage‑backed securities 8,015 ‑ ‑ ‑ ‑ ‑ ‑ 1,103 9,118
Government issued commercial mortgage‑backed securities
‑ ‑ ‑ ‑ ‑ ‑ ‑ 11 11
Government mortgage‑backed securities ‑ ‑ ‑ ‑ ‑ ‑ ‑ 4,539 4,539
Non‑government backed CMOs 1,217 ‑ ‑ ‑ ‑ ‑ ‑ 114 1,331
Corporate bonds ‑ 4,390 24,672 33,019 231 ‑ ‑ 42 62,354 Municipal and provincial bonds ‑ 1,835 ‑ 402 ‑ ‑ ‑ ‑ 2,237
Bond funds, including exchange traded funds 56,472 16,512 17,318 26,615 7,815 2,351 210 8,781 136,074
Total debt securities $ 82,078 $ 22,737 $ 42,166 $ 60,605 $ 8,046 $ 2,351 $ 210 $ 17,435 $ 235,628
Interest Rate Risk – The University’s Investment Policy and Guidelines Statement establishes targets for the preferred duration of the fixed income component of the investment portfolio by limiting investments through targeted allocations to different asset classes.
UNIVERSIT Y OF MASSACHUSET TS ANNUAL FINANCIAL REPORT 2020 31
notes to financial statements
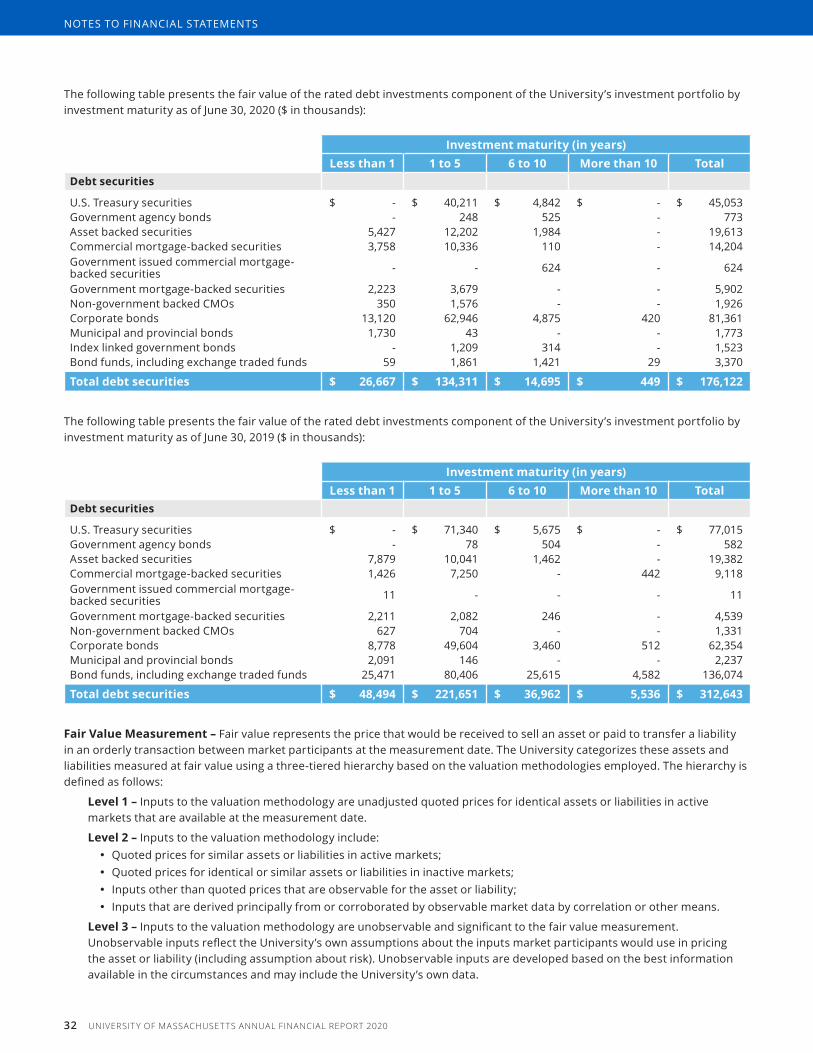
The following table presents the fair value of the rated debt investments component of the University’s investment portfolio by investment maturity as of June 30, 2020 ($ in thousands):
Investment maturity (in years)Less than 1 1 to 5 6 to 10 More than 10 Total
Debt securities
U.S. Treasury securities $ ‑ $ 40,211 $ 4,842 $ ‑ $ 45,053 Government agency bonds ‑ 248 525 ‑ 773 Asset backed securities 5,427 12,202 1,984 ‑ 19,613 Commercial mortgage‑backed securities 3,758 10,336 110 ‑ 14,204 Government issued commercial mortgage‑backed securities ‑ ‑ 624 ‑ 624
Government mortgage‑backed securities 2,223 3,679 ‑ ‑ 5,902 Non‑government backed CMOs 350 1,576 ‑ ‑ 1,926 Corporate bonds 13,120 62,946 4,875 420 81,361 Municipal and provincial bonds 1,730 43 ‑ ‑ 1,773 Index linked government bonds ‑ 1,209 314 ‑ 1,523 Bond funds, including exchange traded funds 59 1,861 1,421 29 3,370
Total debt securities $ 26,667 $ 134,311 $ 14,695 $ 449 $ 176,122
The following table presents the fair value of the rated debt investments component of the University’s investment portfolio by investment maturity as of June 30, 2019 ($ in thousands):
Investment maturity (in years)Less than 1 1 to 5 6 to 10 More than 10 Total
Debt securities
U.S. Treasury securities $ ‑ $ 71,340 $ 5,675 $ ‑ $ 77,015 Government agency bonds ‑ 78 504 ‑ 582 Asset backed securities 7,879 10,041 1,462 ‑ 19,382 Commercial mortgage‑backed securities 1,426 7,250 ‑ 442 9,118 Government issued commercial mortgage‑backed securities 11 ‑ ‑ ‑ 11
Government mortgage‑backed securities 2,211 2,082 246 ‑ 4,539 Non‑government backed CMOs 627 704 ‑ ‑ 1,331 Corporate bonds 8,778 49,604 3,460 512 62,354 Municipal and provincial bonds 2,091 146 ‑ ‑ 2,237 Bond funds, including exchange traded funds 25,471 80,406 25,615 4,582 136,074
Total debt securities $ 48,494 $ 221,651 $ 36,962 $ 5,536 $ 312,643
Fair Value Measurement – Fair value represents the price that would be received to sell an asset or paid to transfer a liability in an orderly transaction between market participants at the measurement date. The University categorizes these assets and liabilities measured at fair value using a three-tiered hierarchy based on the valuation methodologies employed. The hierarchy is defined as follows:
Level 1 – Inputs to the valuation methodology are unadjusted quoted prices for identical assets or liabilities in active markets that are available at the measurement date.
Level 2 – Inputs to the valuation methodology include:• Quoted prices for similar assets or liabilities in active markets;• Quoted prices for identical or similar assets or liabilities in inactive markets;• Inputs other than quoted prices that are observable for the asset or liability;• Inputs that are derived principally from or corroborated by observable market data by correlation or other means.
Level 3 – Inputs to the valuation methodology are unobservable and significant to the fair value measurement. Unobservable inputs reflect the University’s own assumptions about the inputs market participants would use in pricing the asset or liability (including assumption about risk). Unobservable inputs are developed based on the best information available in the circumstances and may include the University’s own data.
32 UNIVERSIT Y OF MASSACHUSET TS ANNUAL FINANCIAL REPORT 2020
notes to financial statements

When available, quoted prices are used to determine fair value. When quoted prices in active markets are available, investments are classified within Level 1 of the fair value hierarchy. The University’s Level 1 investments primarily consist of investments in U.S. Treasury obligations, equity securities, and mutual funds. When quoted prices in active markets are not available, fair values are based on evaluated prices received from the University’s investment custodian in conjunction with a third‑party service provider and are reported within Level 2 of the fair value hierarchy. The inputs for Level 2 include, but are not limited to, pricing models such as benchmarking yields, reported trades, broker‑dealer quotes, issuer spreads and benchmarking securities, among others. The University’s Level 2 investments primarily consist of investments in U.S. government and agency obligations, asset-backed securities, and corporate debt securities that did not trade on the University’s fiscal year end date.
As a practical expedient to estimate the fair value of the University’s interests, certain investments in commingled funds and limited partnerships are reported at the net asset value (NAV) determined by the fund managers. Because these investments are not readily marketable, their estimated fair values may differ from the values that would have been assigned had a ready market for such investments existed, and such differences could be material. As of June 30, 2020 and 2019, the University had no plans or intentions to sell such investments at amounts different from NAV.
The following table summarizes the fair value of the University’s investments by type as of June 30, 2020 ($ in thousands):
Investments measured
at nAv
Investments classified in the fair value hierarchy
Level 1 Level 2 Level 3 Total
Money market funds $ ‑ $ 452,044 $ ‑ $ ‑ $ 452,044
Debt securities
U.S. Treasury securities ‑ 45,053 ‑ ‑ 45,053 Government agency bonds ‑ ‑ 773 ‑ 773 Asset backed securities ‑ ‑ 19,613 ‑ 19,613 Commercial mortgage‑backed securities ‑ ‑ 14,204 ‑ 14,204 Government issued commercial mortgage‑backed securities
‑ ‑ 624 ‑ 624
Government mortgage‑backed securities ‑ ‑ 5,902 ‑ 5,902 Non‑government backed CMOs ‑ ‑ 1,602 324 1,926 Corporate bonds ‑ ‑ 81,115 42 81,157 Non US Corporate Bonds ‑ ‑ 204 ‑ 204 Municipal and provincial bonds ‑ ‑ 1,773 ‑ 1,773 Index linked government Bonds ‑ ‑ 1,523 ‑ 1,523 Bond funds, including exchange traded funds ‑ 3,370 ‑ ‑ 3,370
Total debt securities - 48,423 127,333 366 176,122
Equity securities
Domestic equities ‑ 68,117 ‑ 1,585 69,702 International equities ‑ 30,648 ‑ ‑ 30,648
Total equity securities - 98,765 - 1,585 100,350
Alternative investments
Multi‑strategy hedge fundsEquity 181,521 ‑ ‑ ‑ 181,521 Long/short 136,270 ‑ ‑ ‑ 136,270 Fixed income 32,332 ‑ ‑ ‑ 32,332 Absolute return 36,026 ‑ ‑ ‑ 36,026 Real assets 12,881 ‑ ‑ ‑ 12,881
Private equity and venture capital 32,420 ‑ ‑ ‑ 32,420 Private debt 11,148 ‑ ‑ ‑ 11,148 Private real estate 8,847 ‑ ‑ ‑ 8,847
Total alternative investments 451,445 - - - 451,445
Total investments at fair value 451,445 599,232 127,333 1,951 1,179,961 Cash and cash equivalents ‑ ‑ ‑ ‑ 72,499 MMDT ‑ ‑ ‑ ‑ 117,000
Total investments at cost - - - - 189,499
Total investments $ 451,445 $ 599,232 $ 127,333 $ 1,951 $ 1,369,460
UNIVERSIT Y OF MASSACHUSET TS ANNUAL FINANCIAL REPORT 2020 33
notes to financial statements
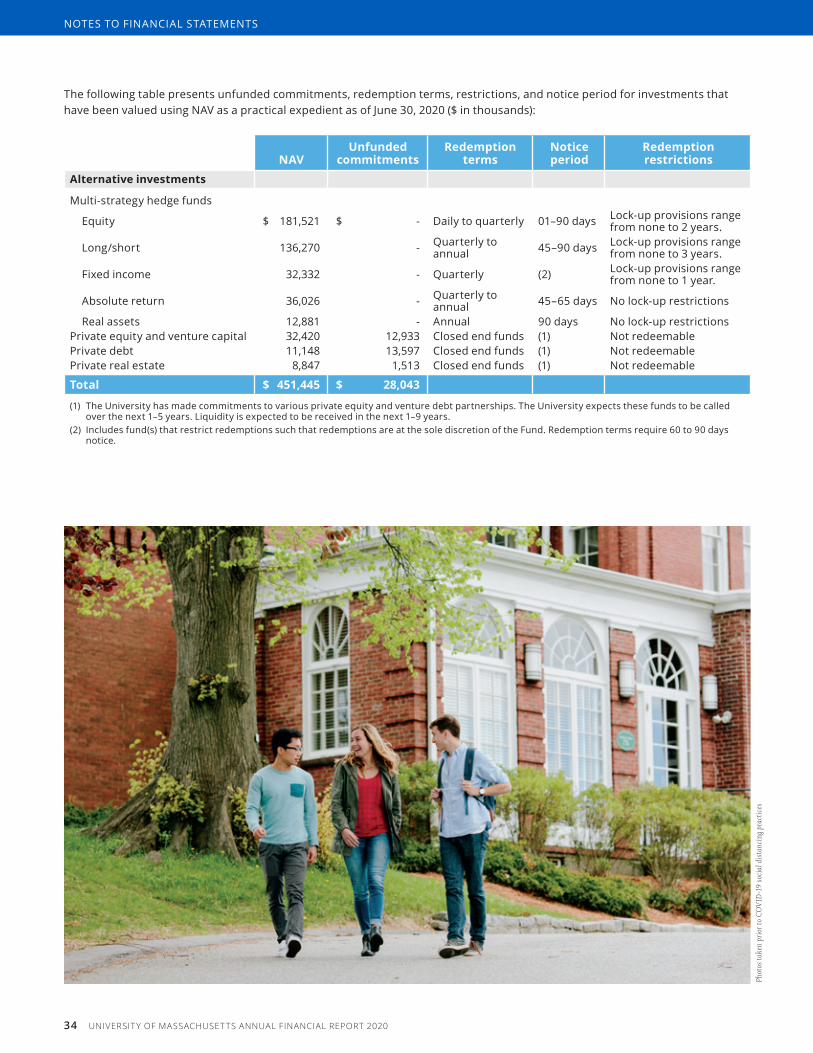
The following table presents unfunded commitments, redemption terms, restrictions, and notice period for investments that have been valued using NAV as a practical expedient as of June 30, 2020 ($ in thousands):
nAvUnfunded
commitmentsRedemption
termsNotice period
Redemption restrictions
Alternative investments
Multi‑strategy hedge funds
Equity $ 181,521 $ ‑ Daily to quarterly 01–90 days Lock‑up provisions range from none to 2 years.
Long/short 136,270 ‑ Quarterly to annual 45–90 days Lock‑up provisions range
from none to 3 years.
Fixed income 32,332 ‑ Quarterly (2) Lock‑up provisions range from none to 1 year.
Absolute return 36,026 ‑ Quarterly to annual 45–65 days No lock‑up restrictions
Real assets 12,881 ‑ Annual 90 days No lock‑up restrictionsPrivate equity and venture capital 32,420 12,933 Closed end funds (1) Not redeemablePrivate debt 11,148 13,597 Closed end funds (1) Not redeemablePrivate real estate 8,847 1,513 Closed end funds (1) Not redeemable
Total $ 451,445 $ 28,043
(1) The University has made commitments to various private equity and venture debt partnerships. The University expects these funds to be called over the next 1–5 years. Liquidity is expected to be received in the next 1–9 years.
(2) Includes fund(s) that restrict redemptions such that redemptions are at the sole discretion of the Fund. Redemption terms require 60 to 90 days notice.
34 UNIVERSIT Y OF MASSACHUSET TS ANNUAL FINANCIAL REPORT 2020
notes to financial statements
Phot
os ta
ken
prio
r to
COVI
D-1
9 so
cial d
ista
ncin
g pra
ctice
s
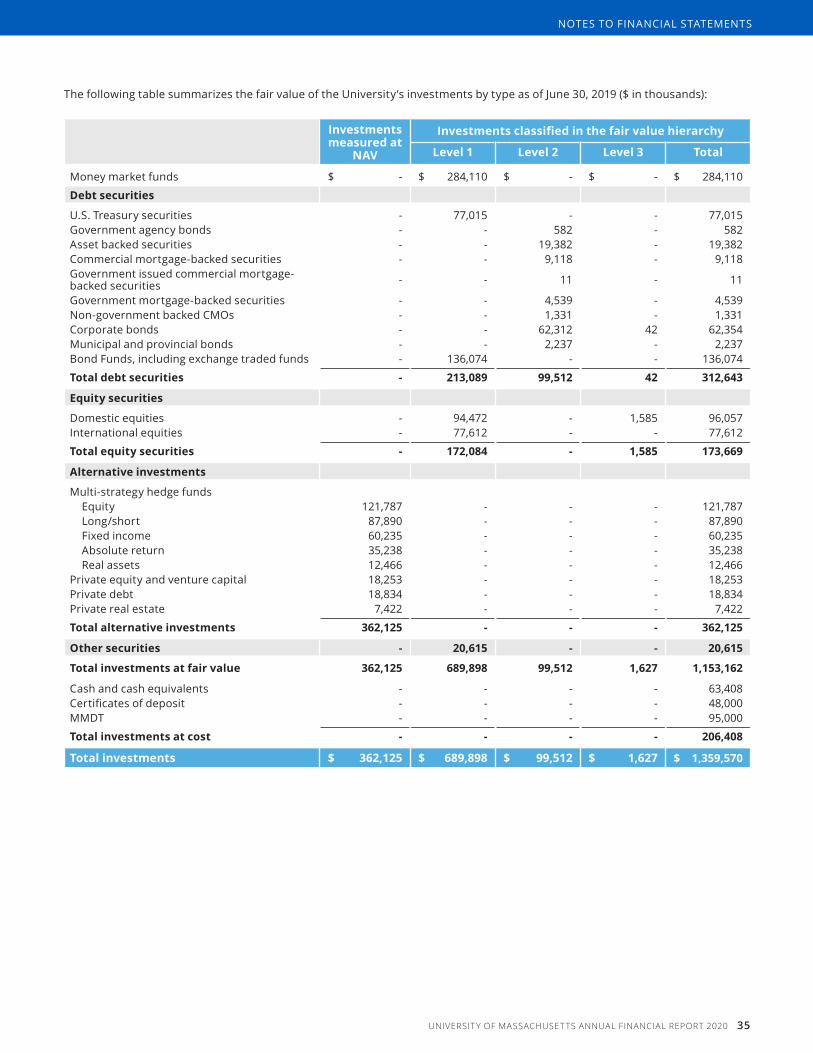
The following table summarizes the fair value of the University’s investments by type as of June 30, 2019 ($ in thousands):
Investments measured at
nAv
Investments classified in the fair value hierarchy
Level 1 Level 2 Level 3 Total
Money market funds $ ‑ $ 284,110 $ ‑ $ ‑ $ 284,110
Debt securities
U.S. Treasury securities ‑ 77,015 ‑ ‑ 77,015 Government agency bonds ‑ ‑ 582 ‑ 582 Asset backed securities ‑ ‑ 19,382 ‑ 19,382 Commercial mortgage‑backed securities ‑ ‑ 9,118 ‑ 9,118 Government issued commercial mortgage‑backed securities ‑ ‑ 11 ‑ 11
Government mortgage‑backed securities ‑ ‑ 4,539 ‑ 4,539 Non‑government backed CMOs ‑ ‑ 1,331 ‑ 1,331 Corporate bonds ‑ ‑ 62,312 42 62,354 Municipal and provincial bonds ‑ ‑ 2,237 ‑ 2,237 Bond Funds, including exchange traded funds ‑ 136,074 ‑ ‑ 136,074
Total debt securities - 213,089 99,512 42 312,643
Equity securities
Domestic equities ‑ 94,472 ‑ 1,585 96,057 International equities ‑ 77,612 ‑ ‑ 77,612
Total equity securities - 172,084 - 1,585 173,669
Alternative investments
Multi‑strategy hedge fundsEquity 121,787 ‑ ‑ ‑ 121,787 Long/short 87,890 ‑ ‑ ‑ 87,890 Fixed income 60,235 ‑ ‑ ‑ 60,235 Absolute return 35,238 ‑ ‑ ‑ 35,238 Real assets 12,466 ‑ ‑ ‑ 12,466
Private equity and venture capital 18,253 ‑ ‑ ‑ 18,253 Private debt 18,834 ‑ ‑ ‑ 18,834 Private real estate 7,422 ‑ ‑ ‑ 7,422
Total alternative investments 362,125 - - - 362,125
Other securities - 20,615 - - 20,615
Total investments at fair value 362,125 689,898 99,512 1,627 1,153,162
Cash and cash equivalents ‑ ‑ ‑ ‑ 63,408 Certificates of deposit ‑ ‑ ‑ ‑ 48,000 MMDT ‑ ‑ ‑ ‑ 95,000
Total investments at cost - - - - 206,408
Total investments $ 362,125 $ 689,898 $ 99,512 $ 1,627 $ 1,359,570
UNIVERSIT Y OF MASSACHUSET TS ANNUAL FINANCIAL REPORT 2020 35
notes to financial statements
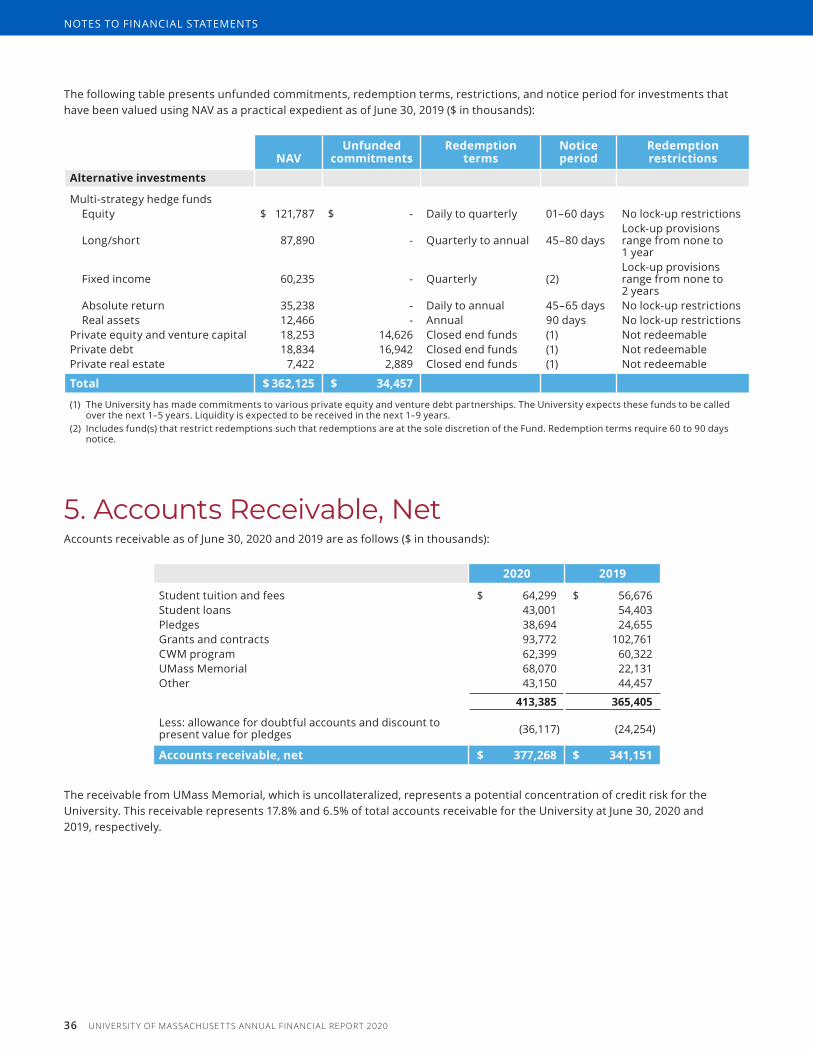
The following table presents unfunded commitments, redemption terms, restrictions, and notice period for investments that have been valued using NAV as a practical expedient as of June 30, 2019 ($ in thousands):
nAvUnfunded
commitmentsRedemption
termsNotice period
Redemption restrictions
Alternative investments
Multi‑strategy hedge fundsEquity $ 121,787 $ ‑ Daily to quarterly 01–60 days No lock‑up restrictions
Long/short 87,890 ‑ Quarterly to annual 45–80 days Lock‑up provisions range from none to 1 year
Fixed income 60,235 ‑ Quarterly (2)Lock‑up provisions range from none to 2 years
Absolute return 35,238 ‑ Daily to annual 45–65 days No lock‑up restrictionsReal assets 12,466 ‑ Annual 90 days No lock‑up restrictions
Private equity and venture capital 18,253 14,626 Closed end funds (1) Not redeemablePrivate debt 18,834 16,942 Closed end funds (1) Not redeemablePrivate real estate 7,422 2,889 Closed end funds (1) Not redeemable
Total $ 362,125 $ 34,457
(1) The University has made commitments to various private equity and venture debt partnerships. The University expects these funds to be called over the next 1–5 years. Liquidity is expected to be received in the next 1–9 years.
(2) Includes fund(s) that restrict redemptions such that redemptions are at the sole discretion of the Fund. Redemption terms require 60 to 90 days notice.
5. Accounts Receivable, netAccounts receivable as of June 30, 2020 and 2019 are as follows ($ in thousands):
2020 2019
Student tuition and fees $ 64,299 $ 56,676 Student loans 43,001 54,403 Pledges 38,694 24,655 Grants and contracts 93,772 102,761 CWM program 62,399 60,322 UMass Memorial 68,070 22,131 Other 43,150 44,457
413,385 365,405
Less: allowance for doubtful accounts and discount to present value for pledges (36,117) (24,254)
Accounts receivable, net $ 377,268 $ 341,151
The receivable from UMass Memorial, which is uncollateralized, represents a potential concentration of credit risk for the University. This receivable represents 17.8% and 6.5% of total accounts receivable for the University at June 30, 2020 and 2019, respectively.
36 UNIVERSIT Y OF MASSACHUSET TS ANNUAL FINANCIAL REPORT 2020
notes to financial statements

6. uMass Memorial Medical centerThe University has granted UMass Memorial the right to occupy portions of the University’s Medical School campus facilities for a period of 99 years, expiring on June 30, 2097. As part of the ongoing agreement entered into on June 24, 1998, UMass Memorial has agreed to share responsibility for various capital and operating expenses relating to the occupied premises. UMass Memorial also contributes to capital improvements to shared facilities.
In addition, UMass Memorial has agreed to make certain payments to the University, including an annual fee of $12.0 million, adjusted for inflation as necessary, for 99 years as long as the University continues to operate a medical school, and a participation payment based on a percentage of the net operating income of UMass Memorial. The University recognizes revenue when the participation payments are received.
The University is reimbursed by, and reimburses UMass Memorial for shared services, cross‑funded employees, and other agreed upon activities provided and purchased. For the years ended June 30, 2020 and 2019, the cash reimbursements received for services provided to UMass Memorial were $119.0 million and $177.1 million, respectively. Included in these amounts are payroll paid by the University on behalf of UMass Memorial in an agency capacity in the amount of $65.1 million and $109.3 million for the years ended June 30, 2020 and 2019, respectively. As of June 30, 2020 and 2019, the University has recorded a receivable in the amount of $68.1 million and $22.1 million, respectively from UMass Memorial which includes $38.6 million and $11.7 million, respectively, in payroll and related fringe charges. The University has recorded a payable of $4.8 million and $9.5 million at June 30, 2020 and 2019, respectively, primarily for cross-funded payroll.
7. capital AssetsThe following table represents the University’s capital assets activity for the years ended June 30, 2020 and 2019 ($ in thousands):
As of June 30, 2018 Additions
Retirements/ adjustments
As of June 30, 2019 Additions
Retirements/adjustments
As of June 30, 2020
Land $ 165,368 $ 1,336 $ (680) $ 166,024 $ ‑ $ ‑ $ 166,024 Buildings and improvements 6,498,865 642,801 (35,340) 7,106,326 257,356 (6,578) 7,357,104
Software 113,184 6,747 (5,639) 114,292 5,709 ‑ 120,001 Equipment and furniture 699,893 41,929 (24,779) 717,043 37,102 (41,632) 712,513
Library books 53,574 ‑ (6,609) 46,965 ‑ (7,347) 39,618
7,530,884 692,813 (73,047) 8,150,650 300,167 (55,557) 8,395,260
Accumulated depreciation (3,076,896) (276,638) 48,797 (3,304,737) (288,667) 45,643 (3,547,761)
4,453,988 416,175 (24,250) 4,845,913 11,500 (9,914) 4,847,499
Construction in progress 621,488 328,232 (631,433) 318,287 213,480 (172,697) 359,070
Total capital assets, net $ 5,075,476 $ 744,407 $ (655,683) $ 5,164,200 $ 224,980 $ (182,611) $ 5,206,569
The University has capitalized interest on borrowings, net of interest earned on related debt reserve funds, during the construction period of major capital projects. Capitalized interest is added to the cost of the underlying assets being constructed, and is amortized over the useful lives of the assets. For the years ended June 30, 2020 and 2019, the University capitalized net interest costs of $5.9 million and $8.7 million, respectively.
UNIVERSIT Y OF MASSACHUSET TS ANNUAL FINANCIAL REPORT 2020 37
notes to financial statements

8. public private partnerships and leases public private partnerships (ppps)On November 8, 2016, the Building Authority entered into an agreement whereby sub-leased land on the University of Massachusetts Boston campus to Provident Commonwealth Educational Resources, Inc. (PCER), a Massachusetts not-for-profit corporation, for a term of 40 years. The land is ground-leased to the Building Authority by the Commonwealth. PCER engaged a contractor to construct a 1,082-bed student housing facility on the site (the “Boston Project”). The Boston Project reverts to the Building Authority when the lease terminates. Commencing January 1, 2019, the annual rental amount payable to the Building Authority under the ground lease is $1.0 million.
The Boston Project was financed with $130.1 million of revenue bonds issued on October 26, 2016 (Series 2016 Bonds) by the Massachusetts Development Finance Agency (“MassDevelopment”) pursuant to a Loan and Trust Agreement between MassDevelopment and PCER. Neither the Building Authority, the University nor UMass Boston have pledged revenues to secure the payment of the Series 2016 bonds or have any obligation with respect to payment of the Series 2016 bonds.
Pursuant to a Dining Facility Sublease dated November 8, 2016 between PCER, as sub-lessor and the Building Authority, as sub-lessee, PCER leased the dining facility, located within the Boston Project, to the Building Authority and the Building Authority shall operate or cause to be operated the dining facility. The University funded the construction costs of the dining facility through debt issued by the Building Authority. This lease only relates to the operations and maintenance of the dining facility. The annual rent payable to PCER by the Building Authority is $1.00.
On November 14, 2018, the Building Authority entered into an agreement whereby the Building Authority sub-leased land on the University of Massachusetts Dartmouth campus to Provident Commonwealth Educational Resources II, Inc. (PCER II), a Massachusetts not-for-profit corporation, for a term of 45 years. The land is ground-leased to the Building Authority by the Commonwealth. PCER II engaged a contractor to construct a 1,210-bed student housing facility on the site (the “Dartmouth Project”). The Dartmouth Project reverts to the Building Authority when the lease terminates. Commencing approximately one year following the completion of the project, the annual rental amount received by the Building Authority under the ground lease will be $625.0 thousand, increasing by 3% every five years. The first ground lease payment is anticipated to be received in fiscal 2021.
The Dartmouth Project was financed with $132.2 million of revenue bonds issued on November 14, 2018 (Series 2018 Bonds) by MassDevelopment pursuant to a Loan and Trust Agreement between MassDevelopment and PCER II. Neither the Building Authority, the University nor UMass Dartmouth have pledged revenues to secure the payment of the Series 2018 bonds or have
any obligation with respect to payment of the Series 2018 bonds.
Pursuant to a Dining Facility Sublease dated November 13, 2018 between PCER II, as sub‑lessor and the Building Authority, as sub‑lessee, PCER II leased the dining facility, located within the Dartmouth Project, to the Building Authority and the Building Authority shall operate or cause to be operated the dining facility. The University funded the construction costs of the dining facility through debt issued by the Building Authority. This lease only relates to the operations and maintenance of the
38 UNIVERSIT Y OF MASSACHUSET TS ANNUAL FINANCIAL REPORT 2020
notes to financial statements
Phot
os ta
ken
prio
r to
COVI
D-1
9 so
cial d
ista
ncin
g pra
ctice
s

dining facility. The annual rent payable to PCER II by the Building Authority is $1.00.
Management evaluated the applicability of relevant GASB guidance (including GASB 14, The Financial Reporting Entity, GASB 39, Determining Whether Certain Organizations Are Component Units, GASB 60, Accounting for Financial Reporting for Service Concession Arrangements, and GASB 61, The Financial Reporting Entity: Omnibus) against the underlying Boston and Dartmouth Project agreements and indentures and has concluded that the associated debt should not be recognized on the financial statements of the Building Authority or the University.
capital leases On October 27, 2009, the Building Authority entered into an agreement to lease its facility located on Morrissey Boulevard in Dorchester, Massachusetts to the Edward M. Kennedy Institute for the United States Senate (“EMKI”), a charitable corporation registered in the District of Columbia. The lease agreement provides for an initial term of ninety‑nine years commencing in October 2009, and thereafter, at the option of EMKI, may be extended for two additional, 99-year periods.
The project was financed with $74.4 million of revenue bonds. Rent is equal to the debt service on the outstanding bonds and payable semi-annually through fiscal year 2043.
On October 27, 2009, the Building Authority also entered into an agreement whereby the Building Authority sub-leased land, ground-leased to the Building Authority by the Commonwealth, to EMKI. The sublease agreement provides for an initial term of ninety-nine years commencing in October 2009, and thereafter, at the option of EMKI, may be extended for two additional, 99-year periods. At the time of signing, the Building Authority received payment of $10.0 thousand in full payment of rent due for the initial term of the sublease.
other leases The Building Authority has executed long‑term leases with the Commonwealth, acting by and through the Trustees of the Building Authority, covering the land on which facilities owned by the Building Authority are located on the University’s campuses. These leases call for nominal annual payments to the Commonwealth. Certain of these leases renew automatically for subsequent five- or ten-year periods unless the Building Authority notifies the University that it does not wish to renew. Other leases require the Building Authority to notify the University of its desire to renew. As of June 30, 2020 and 2019, all leases with the Commonwealth were in good standing and any leases requiring action by the Building Authority during the year to facilitate their renewals were properly renewed.
As provided in the Enabling Act, each of the above‑referenced leases also terminates when the Building Authority no longer has any bonds outstanding, at which time all Building Authority property becomes the property of the Commonwealth.
On April 1, 2014, the Building Authority entered into a lease, as lessee, with Massachusetts Mutual Life Insurance Company, as lessor, for space at Tower Square, 1500 Main Street, Springfield, Massachusetts. The initial lease began August 1, 2014 and ends July 31, 2019. In fiscal 2019, the Building Authority exercised its option to extend the lease for a period of five years. The lease now ends on July 31, 2024. Annual rent payments range from $297.0 thousand to $320.0 thousand. The Building Authority subleases the space to the University to be used as classroom space for its Springfield Satellite campus.
On July 17, 2014, the Building Authority entered into a lease, as lessee, with One Beacon Street Limited Partnership, as lessor, for space at One Beacon Street, Boston, Massachusetts. The lease ends December 31, 2030. Annual rent payments range from $2.1 million to $2.6 million. The Building Authority subleases office and classroom space at One Beacon Street to the University.
The University leases certain equipment and facilities under operating leases with terms exceeding one year, which are cancelable at the University’s option with 30-day notice. The rent expense related to these operating leases amounted to $34.9 million and $34.6 million for the years ended June 30, 2020 and 2019, respectively. The leases primarily relate to
UNIVERSIT Y OF MASSACHUSET TS ANNUAL FINANCIAL REPORT 2020 39
notes to financial statements
Phot
os ta
ken
prio
r to
COVI
D-1
9 so
cial d
ista
ncin
g pra
ctice
s
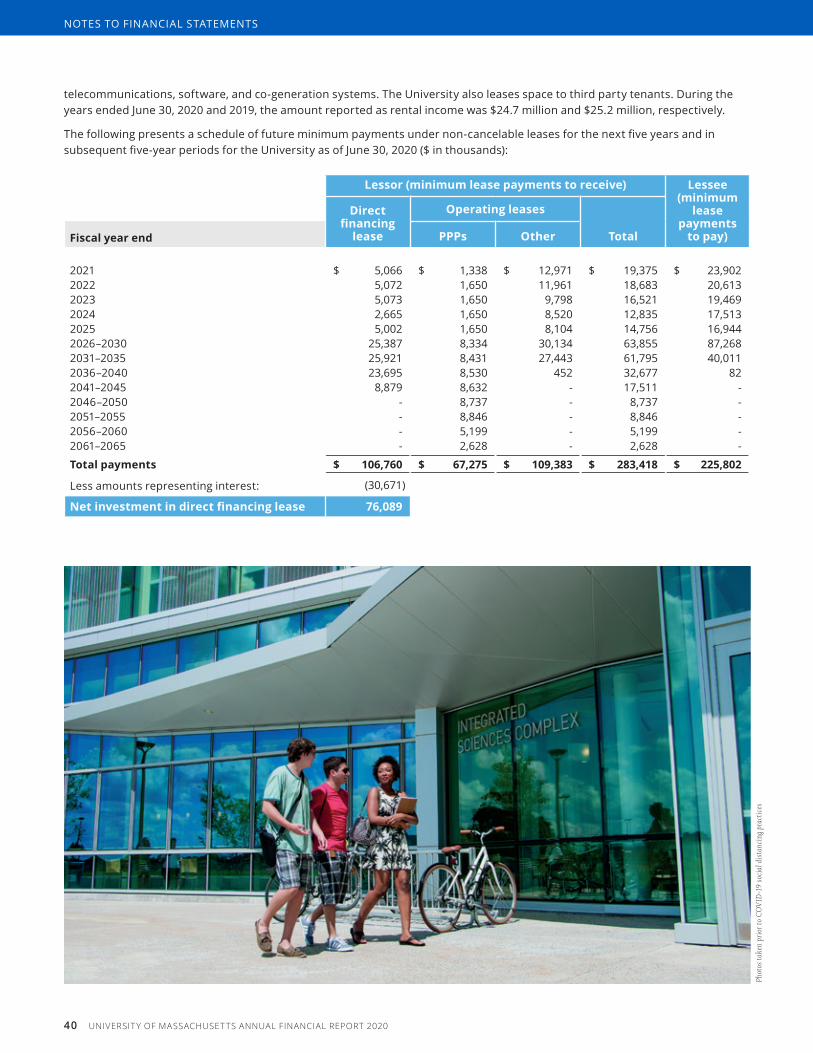
telecommunications, software, and co-generation systems. The University also leases space to third party tenants. During the years ended June 30, 2020 and 2019, the amount reported as rental income was $24.7 million and $25.2 million, respectively.
The following presents a schedule of future minimum payments under non-cancelable leases for the next five years and in subsequent five-year periods for the University as of June 30, 2020 ($ in thousands):
Lessor (minimum lease payments to receive) Lessee (minimum
lease payments
to pay)
Direct financing
lease
Operating leases
TotalFiscal year end PPPs Other
2021 $ 5,066 $ 1,338 $ 12,971 $ 19,375 $ 23,902 2022 5,072 1,650 11,961 18,683 20,613 2023 5,073 1,650 9,798 16,521 19,469 2024 2,665 1,650 8,520 12,835 17,513 2025 5,002 1,650 8,104 14,756 16,944 2026–2030 25,387 8,334 30,134 63,855 87,268 2031–2035 25,921 8,431 27,443 61,795 40,011 2036–2040 23,695 8,530 452 32,677 82 2041–2045 8,879 8,632 ‑ 17,511 ‑ 2046–2050 ‑ 8,737 ‑ 8,737 ‑ 2051–2055 ‑ 8,846 ‑ 8,846 ‑ 2056–2060 ‑ 5,199 ‑ 5,199 ‑ 2061–2065 ‑ 2,628 ‑ 2,628 ‑
Total payments $ 106,760 $ 67,275 $ 109,383 $ 283,418 $ 225,802
Less amounts representing interest: (30,671)
net investment in direct financing lease 76,089
Phot
os ta
ken
prio
r to
COVI
D-1
9 so
cial d
ista
ncin
g pra
ctice
s
40 UNIVERSIT Y OF MASSACHUSET TS ANNUAL FINANCIAL REPORT 2020
notes to financial statements
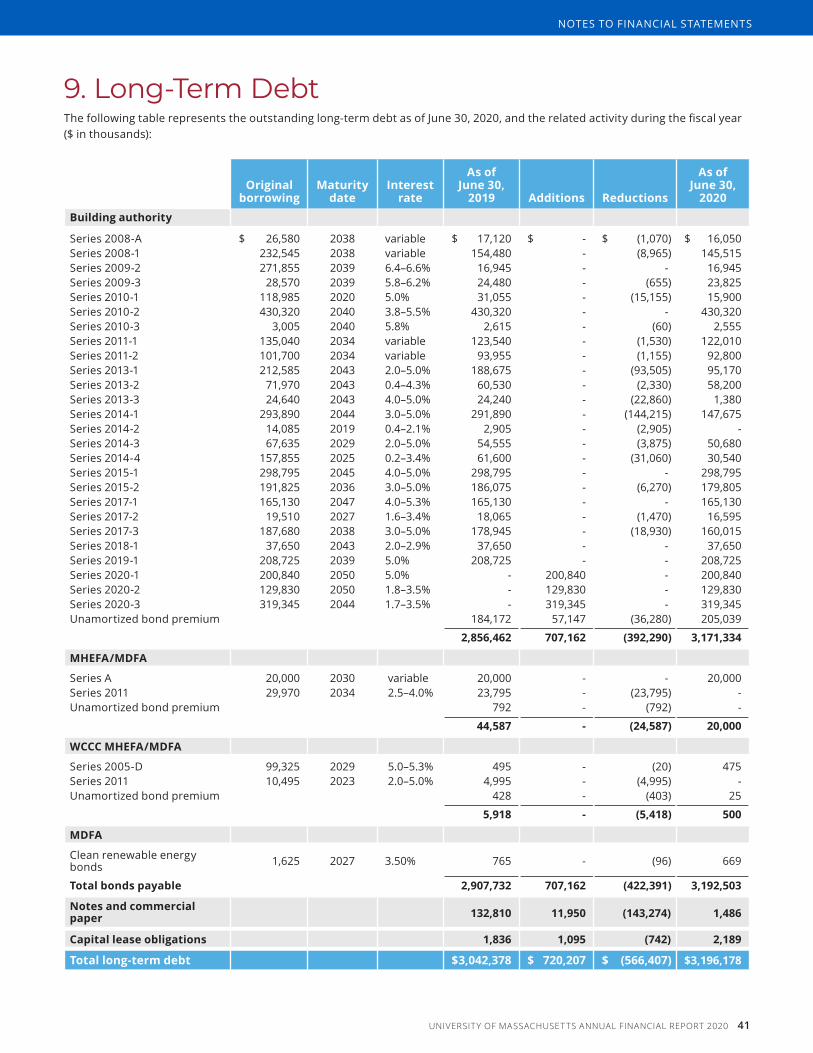
9. long-term DebtThe following table represents the outstanding long-term debt as of June 30, 2020, and the related activity during the fiscal year ($ in thousands):
Original borrowing
Maturity date
Interest rate
As of June 30,
2019 Additions Reductions
As of June 30,
2020Building authority
Series 2008-A $ 26,580 2038 variable $ 17,120 $ ‑ $ (1,070) $ 16,050 Series 2008-1 232,545 2038 variable 154,480 ‑ (8,965) 145,515 Series 2009-2 271,855 2039 6.4–6.6% 16,945 ‑ ‑ 16,945 Series 2009-3 28,570 2039 5.8–6.2% 24,480 ‑ (655) 23,825 Series 2010-1 118,985 2020 5.0% 31,055 ‑ (15,155) 15,900 Series 2010-2 430,320 2040 3.8–5.5% 430,320 ‑ ‑ 430,320 Series 2010-3 3,005 2040 5.8% 2,615 ‑ (60) 2,555 Series 2011-1 135,040 2034 variable 123,540 ‑ (1,530) 122,010 Series 2011-2 101,700 2034 variable 93,955 ‑ (1,155) 92,800 Series 2013-1 212,585 2043 2.0–5.0% 188,675 ‑ (93,505) 95,170 Series 2013-2 71,970 2043 0.4–4.3% 60,530 ‑ (2,330) 58,200 Series 2013-3 24,640 2043 4.0–5.0% 24,240 ‑ (22,860) 1,380 Series 2014-1 293,890 2044 3.0–5.0% 291,890 ‑ (144,215) 147,675 Series 2014-2 14,085 2019 0.4–2.1% 2,905 ‑ (2,905) ‑ Series 2014-3 67,635 2029 2.0–5.0% 54,555 ‑ (3,875) 50,680 Series 2014-4 157,855 2025 0.2–3.4% 61,600 ‑ (31,060) 30,540 Series 2015-1 298,795 2045 4.0–5.0% 298,795 ‑ ‑ 298,795 Series 2015-2 191,825 2036 3.0–5.0% 186,075 ‑ (6,270) 179,805 Series 2017-1 165,130 2047 4.0–5.3% 165,130 ‑ ‑ 165,130 Series 2017-2 19,510 2027 1.6–3.4% 18,065 ‑ (1,470) 16,595 Series 2017-3 187,680 2038 3.0–5.0% 178,945 ‑ (18,930) 160,015 Series 2018-1 37,650 2043 2.0–2.9% 37,650 ‑ ‑ 37,650 Series 2019-1 208,725 2039 5.0% 208,725 ‑ ‑ 208,725 Series 2020-1 200,840 2050 5.0% ‑ 200,840 ‑ 200,840 Series 2020-2 129,830 2050 1.8–3.5% ‑ 129,830 ‑ 129,830 Series 2020-3 319,345 2044 1.7–3.5% ‑ 319,345 ‑ 319,345 Unamortized bond premium 184,172 57,147 (36,280) 205,039
2,856,462 707,162 (392,290) 3,171,334
MhEFA/MDFA
Series A 20,000 2030 variable 20,000 ‑ ‑ 20,000 Series 2011 29,970 2034 2.5–4.0% 23,795 ‑ (23,795) ‑ Unamortized bond premium 792 ‑ (792) ‑
44,587 - (24,587) 20,000
WCCC MhEFA/MDFA
Series 2005-D 99,325 2029 5.0–5.3% 495 ‑ (20) 475 Series 2011 10,495 2023 2.0–5.0% 4,995 ‑ (4,995) ‑ Unamortized bond premium 428 ‑ (403) 25
5,918 - (5,418) 500
MDFA
Clean renewable energy bonds 1,625 2027 3.50% 765 ‑ (96) 669
Total bonds payable 2,907,732 707,162 (422,391) 3,192,503
Notes and commercial paper 132,810 11,950 (143,274) 1,486
Capital lease obligations 1,836 1,095 (742) 2,189
Total long-term debt $ 3,042,378 $ 720,207 $ (566,407) $ 3,196,178
UNIVERSIT Y OF MASSACHUSET TS ANNUAL FINANCIAL REPORT 2020 41
notes to financial statements

The following table represents the outstanding long-term debt as of June 30, 2019, and the related activity during the fiscal year ($ in thousands):
Original borrowing
Maturity date
Interest rate
As of June 30,
2018 Additions Reductions
As of June 30,
2019Building authority
Series 2008-A $ 26,580 2038 variable $ 18,150 $ ‑ $ (1,030) $ 17,120 Series 2008-1 232,545 2038 variable 163,115 ‑ (8,635) 154,480 Series 2009-1 247,810 2039 3.0–5.0% 15,285 ‑ (15,285) ‑ Series 2009-2 271,855 2039 6.4–6.6% 271,855 ‑ (254,910) 16,945 Series 2009-3 28,570 2039 5.8–6.2% 25,100 ‑ (620) 24,480 Series 2010-1 118,985 2020 5.0% 45,485 ‑ (14,430) 31,055 Series 2010-2 430,320 2040 3.8–5.5% 430,320 ‑ ‑ 430,320 Series 2010-3 3,005 2040 5.8% 2,675 ‑ (60) 2,615 Series 2011-1 135,040 2034 variable 124,990 ‑ (1,450) 123,540 Series 2011-2 101,700 2034 variable 95,055 ‑ (1,100) 93,955 Series 2013-1 212,585 2043 2.0–5.0% 193,745 ‑ (5,070) 188,675 Series 2013-2 71,970 2043 0.4–4.3% 62,825 ‑ (2,295) 60,530 Series 2013-3 24,640 2043 4.0–5.0% 24,640 ‑ (400) 24,240 Series 2014-1 293,890 2044 3.0–5.0% 292,490 ‑ (600) 291,890 Series 2014-2 14,085 2019 0.4–2.1% 5,750 ‑ (2,845) 2,905 Series 2014-3 67,635 2029 2.0–5.0% 58,160 ‑ (3,605) 54,555 Series 2014-4 157,855 2025 0.2–3.4% 92,095 ‑ (30,495) 61,600 Series 2015-1 298,795 2045 4.0–5.0% 298,795 ‑ ‑ 298,795 Series 2015-2 191,825 2036 3.0–5.0% 189,000 ‑ (2,925) 186,075 Series 2017-1 165,130 2047 4.0–5.3% 165,130 ‑ ‑ 165,130 Series 2017-2 19,510 2027 1.6–3.4% 19,510 ‑ (1,445) 18,065 Series 2017-3 187,680 2038 3.0–5.0% 184,760 ‑ (5,815) 178,945 Series 2018-1 75,000 2043 2.0–2.9% 37,650 ‑ ‑ 37,650 Series 2019-1 208,725 2039 5.0% ‑ 208,725 ‑ 208,725 Unamortized bond premium 150,699 47,633 (14,160) 184,172
2,967,279 256,358 (367,175) 2,856,462
MhEFA/MDFA
Series A 20,000 2030 variable 20,000 ‑ ‑ 20,000 Series 2011 29,970 2034 2.5–4.0% 24,880 ‑ (1,085) 23,795 Unamortized bond premium 817 ‑ (25) 792
45,697 - (1,110) 44,587
WCCC MhEFA/MDFA
Series 2005-D 99,325 2029 5.0–5.3% 615 ‑ (120) 495 Series 2011 10,495 2023 2.0–5.0% 5,860 ‑ (865) 4,995 Unamortized bond premium 526 ‑ (98) 428
7,001 - (1,083) 5,918
MDFA
Clean renewable energy bonds 1,625 2027 3.50% 860 ‑ (95) 765
Total bonds payable 3,020,837 256,358 (369,463) 2,907,732
Notes and commercial paper 65,969 69,061 (2,220) 132,810
Capital lease obligations 2,262 255 (681) 1,836
Total long-term debt $ 3,089,068 $ 325,674 $ (372,364) $ 3,042,378
42 UNIVERSIT Y OF MASSACHUSET TS ANNUAL FINANCIAL REPORT 2020
notes to financial statements
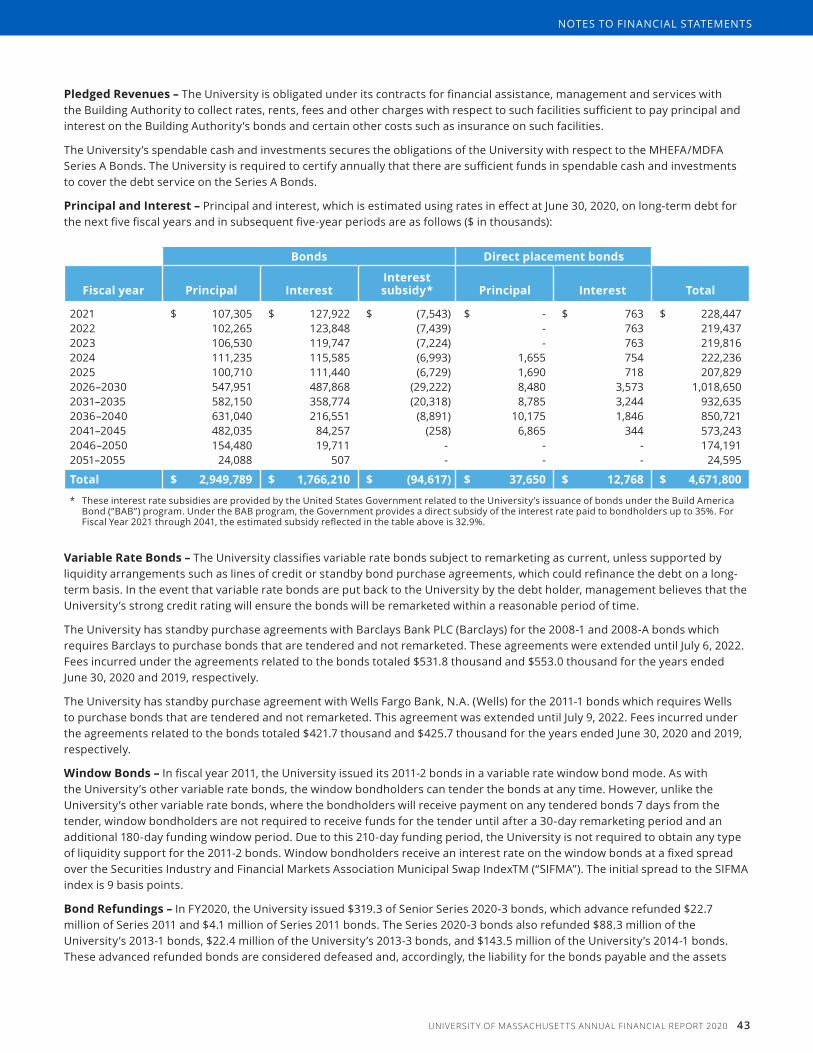
Pledged Revenues – The University is obligated under its contracts for financial assistance, management and services with the Building Authority to collect rates, rents, fees and other charges with respect to such facilities sufficient to pay principal and interest on the Building Authority’s bonds and certain other costs such as insurance on such facilities.
The University’s spendable cash and investments secures the obligations of the University with respect to the MHEFA/MDFA Series A Bonds. The University is required to certify annually that there are sufficient funds in spendable cash and investments to cover the debt service on the Series A Bonds.
Principal and Interest – Principal and interest, which is estimated using rates in effect at June 30, 2020, on long-term debt for the next five fiscal years and in subsequent five-year periods are as follows ($ in thousands):
Bonds Direct placement bonds
Fiscal year Principal InterestInterest subsidy* Principal Interest Total
2021 $ 107,305 $ 127,922 $ (7,543) $ ‑ $ 763 $ 228,447 2022 102,265 123,848 (7,439) ‑ 763 219,437 2023 106,530 119,747 (7,224) ‑ 763 219,816 2024 111,235 115,585 (6,993) 1,655 754 222,236 2025 100,710 111,440 (6,729) 1,690 718 207,829 2026–2030 547,951 487,868 (29,222) 8,480 3,573 1,018,650 2031–2035 582,150 358,774 (20,318) 8,785 3,244 932,635 2036–2040 631,040 216,551 (8,891) 10,175 1,846 850,721 2041–2045 482,035 84,257 (258) 6,865 344 573,243 2046–2050 154,480 19,711 ‑ ‑ ‑ 174,191 2051–2055 24,088 507 ‑ ‑ ‑ 24,595
Total $ 2,949,789 $ 1,766,210 $ (94,617) $ 37,650 $ 12,768 $ 4,671,800
* These interest rate subsidies are provided by the United States Government related to the University’s issuance of bonds under the Build America Bond (“BAB”) program. Under the BAB program, the Government provides a direct subsidy of the interest rate paid to bondholders up to 35%. For Fiscal Year 2021 through 2041, the estimated subsidy reflected in the table above is 32.9%.
Variable Rate Bonds – The University classifies variable rate bonds subject to remarketing as current, unless supported by liquidity arrangements such as lines of credit or standby bond purchase agreements, which could refinance the debt on a long-term basis. In the event that variable rate bonds are put back to the University by the debt holder, management believes that the University’s strong credit rating will ensure the bonds will be remarketed within a reasonable period of time.
The University has standby purchase agreements with Barclays Bank PLC (Barclays) for the 2008-1 and 2008-A bonds which requires Barclays to purchase bonds that are tendered and not remarketed. These agreements were extended until July 6, 2022. Fees incurred under the agreements related to the bonds totaled $531.8 thousand and $553.0 thousand for the years ended June 30, 2020 and 2019, respectively.
The University has standby purchase agreement with Wells Fargo Bank, N.A. (Wells) for the 2011-1 bonds which requires Wells to purchase bonds that are tendered and not remarketed. This agreement was extended until July 9, 2022. Fees incurred under the agreements related to the bonds totaled $421.7 thousand and $425.7 thousand for the years ended June 30, 2020 and 2019, respectively.
Window Bonds – In fiscal year 2011, the University issued its 2011-2 bonds in a variable rate window bond mode. As with the University’s other variable rate bonds, the window bondholders can tender the bonds at any time. However, unlike the University’s other variable rate bonds, where the bondholders will receive payment on any tendered bonds 7 days from the tender, window bondholders are not required to receive funds for the tender until after a 30-day remarketing period and an additional 180-day funding window period. Due to this 210-day funding period, the University is not required to obtain any type of liquidity support for the 2011-2 bonds. Window bondholders receive an interest rate on the window bonds at a fixed spread over the Securities Industry and Financial Markets Association Municipal Swap IndexTM (“SIFMA”). The initial spread to the SIFMA index is 9 basis points.
Bond Refundings – In FY2020, the University issued $319.3 of Senior Series 2020-3 bonds, which advance refunded $22.7 million of Series 2011 and $4.1 million of Series 2011 bonds. The Series 2020-3 bonds also refunded $88.3 million of the University’s 2013-1 bonds, $22.4 million of the University’s 2013-3 bonds, and $143.5 million of the University’s 2014-1 bonds. These advanced refunded bonds are considered defeased and, accordingly, the liability for the bonds payable and the assets
UNIVERSIT Y OF MASSACHUSET TS ANNUAL FINANCIAL REPORT 2020 43
notes to financial statements

held to repay the debt are not recorded on the University’s financial statements. The total loss on refunding was $16.4 million with cash flow savings of $35.5 million.
As of June 30, 2020, approximately $281 million of bonds outstanding from advance refunding activities is considered defeased.
In FY2019, the University issued $208.7 million of Refunding Revenue Senior Series 2019-1 Bonds which partially refunded the 2009-2 Senior Series Building America Bonds. This transaction was a current refunding.
other Current year Debt Activity – In FY2020, the University issued $330.67 million of Senior Series 2020-1 and 2020-2 Project Revenue bonds.
Bond Premium – In FY2020, the University received premiums at issuance totaling $57.1 million. Premiums received are amortized as a reduction of interest expense over the life of the respective bond issue. In FY2019, the University received premiums at issuance totaling $47.6 million.
Commercial Paper – The maximum aggregate principal amount of commercial paper the University may have outstanding at one time is $200.0 million. The University’s Series 2013-A are secured by standby liquidity facility agreement that expires on August 12, 2022. The Series 2013-B are secured by a standby liquidity facility agreement that expires on August 12, 2022.
During FY2020 and FY2019, the University issued $10.5 million and $69.1 million of commercial paper, respectively. As of June 30, 2020 and 2019, the University had an outstanding commercial paper balance of $0 and $131.9 million, respectively. The University incurred total fees of $0.7 million in FY2020 and FY2019, respectively, associated with the use of commercial paper.
Interest Rate Swaps – The University uses derivative instruments to manage the impact of interest rate changes on its cash flows and net position by mitigating its exposure to certain market risks associated with operations, and does not use derivative instruments for trading or speculative purposes.
The University’s contracts are evaluated pursuant to GASB Statement No. 53, Accounting and Financial Reporting for Derivative Instruments (“GASB No. 53”) to determine whether they meet the definition of derivative instruments, and if so, whether they effectively hedge the expected cash flows associated with interest rate risk exposures. The University applies hedge accounting for derivative instruments that are deemed effective hedges and under GASB No. 53 are referred to as hedging derivative instruments. Under hedge accounting, changes in the fair value of a hedging derivative instrument are reported as a deferred inflow or deferred outflow in the Statement of Net Position until the contract is settled or terminated.
All settlement payments or receipts for hedging derivative instruments are recorded as interest expense in the period settled.
Interest rate swap liabilities at June 30, 2020 and 2019 are as follows ($ in thousands):
Notional value
As of June 30,
2019Net
change
As of June 30,
2020Effective
dateTerm date
Authority pays Authority receives
Series 2008-1 $ 145,515 $ 23,308 $ 8,760 $ 32,068 05/01/08 05/01/38 3.39% 70% of 1-Month LIBORSeries 2008-A 16,050 2,720 1,075 3,795 11/13/08 05/01/38 3.38% 70% of 1-Month LIBORSeries 2006-1 214,810 29,594 7,524 37,118 04/20/06 11/01/34 3.48% 60% of 3-Month LIBOR
+ .18%
Total $ 55,622 $ 17,359 $ 72,981
44 UNIVERSIT Y OF MASSACHUSET TS ANNUAL FINANCIAL REPORT 2020
notes to financial statements

Swap Payments and Associated Debt – Using rates as of June 30, 2020, the debt service requirements of the variable-rate debt and net swap payments, assuming current interest rates remain the same for their term, were as follows ($ in thousands):
Fiscal year ending June 30 Principal Interest
Interest rate swaps, net Total
2021 $ 28,390 $ 7,000 $ 11,712 $ 47,102 2022 29,545 6,453 10,799 46,797 2023 33,915 5,855 9,798 49,568 2024 35,200 5,204 8,710 49,114 2025 28,625 4,602 7,703 40,930 2026–2030 148,230 14,489 24,257 186,976 2031–2035 70,085 3,329 5,574 78,988 2036–2040 2,385 94 158 2,637
Total $ 376,375 $ 47,026 $ 78,711 $ 502,112
10. other liabilitiesThe following table shows current and long‑term portions of other liabilities as recorded in the Statements of Net Position ($ in thousands).
As of June 30, 2019
Current portion as of June 30, 2019
As of June 30, 2020
Current portion as of June 30, 2020
Compensated absences* $ 107,398 $ 81,155 $ 113,892 $ 88,722Workers’ compensation* 13,850 2,882 13,256 2,550 Unearned revenues 88,863 54,946 135,816 91,037 Advances and deposits 34,135 6,394 19,988 5,238 Other liabilities 147,872 70,458 170,827 60,557
* The University includes the current portion of compensated absences and workers’ compensation liabilities within accounts payable and accrued expenses on the Statements of Net Position.
11. Fringe BenefitsDuring the years ended June 30, 2020 and 2019, the Commonwealth paid $383.5 million and $380.4 million, respectively, for the University’s portion of fringe benefit costs which includes pension expense, health insurance for active employees and retirees, and terminal leave. Of this amount, the University reimbursed the Commonwealth $142.2 million and $149.1 million during the years ended June 30, 2020 and 2019, respectively. The remaining portion is included in revenue as state appropriations.
12. Benefit PlansDefined benefit planThe Massachusetts State Employees’ Retirement System (MSERS) is a public employee retirement system (PERS) that administers a cost-sharing multi-employer defined benefit plan covering substantially all employees of the Commonwealth including University employees.
MSERS provides retirement, disability, survivor and death benefits to members and their beneficiaries. Massachusetts General Laws (MGL) establishes uniform benefit and contribution requirements for all contributory PERS. These requirements provide for superannuation retirement allowance benefits up to a maximum of 80% of a member’s highest three-year to five-year average annual rate of regular compensation depending on the date of hire. Benefit payments are based upon a member’s age,
UNIVERSIT Y OF MASSACHUSET TS ANNUAL FINANCIAL REPORT 2020 45
notes to financial statements

length of creditable service, and group creditable service, and group classification. The authority for amending these provisions rests with the Legislature.
The MSERS’ funding policies were established by Chapter 32 of MGL. The Legislature has the authority to amend these policies. The annuity portion of the MSERS retirement allowance is funded by employees, who contribute a percentage of their regular compensation. Costs of administering the plan are funded out of plan assets.
Member contributions for MSERS vary depending on the most recent date of membership:
Hire date % of Compensation
Prior to 1975 5% of regular compensation1975 – 1983 7% or regular compensation1984 – 6/30/1996 8% of regular compensation7/1/1996 – present 9% of regular compensation except for State Police which is 12% of regular compensation1979 – present An additional 2% of regular compensation in excess of $30,000
In addition, members within this group who join the system on or after April 2, 2012 will have their withholding rate reduced to 6% after achieving 30 years of creditable service.
The University makes contributions on behalf of the employees through a fringe benefit charge assessed by the Commonwealth. The fringe benefit charge amounted to $134.8 million and $125.5 million for the years ended June 30, 2020 and 2019, respectively. Annual covered payroll was 78% and 77.4% of annual total payroll for the University for the years ended June 30, 2020 and 2019, respectively.
Pension Liabilities, Pension Expense, and Deferred outflows of resources and Deferred Inflows of Resources Related to Pensions – The net pension liability as of June 30, 2020 was determined based on a measurement date of June 30, 2019 from an actuarial valuation as of January 1, 2019 rolled forward to June 30, 2019. The net pension liability measured as of June 30, 2019 was determined based on a measurement date of June 30, 2018 from an actuarial valuation as of January 1, 2018 rolled forward to June 30, 2018. There are no significant changes known which would impact the total pension liability between the measurement date and the reporting date, other than typical plan experience.
At June 30, 2020 and 2019, the University reported a liability of $526.7 million and $409.3 million, respectively, for its proportionate share of MSERS net pension liability, respectively. The University’s proportion of the net pension liability was based on a projection of the University’s long‑term share of contributions to the pension plan relative to the total projected contributions of all participating entities, actuarially determined. The University’s proportion of the pension plan at measurement dates of June 30, 2019 and 2018 was 3.60% and 3.09%, respectively.
For the fiscal years ended June 30, 2020 and 2019, the University recognized pension expense of $93.2 million and $52.2 million, respectively.
The University reported its proportionate share of MSERS’s deferred outflows of resources and deferred inflows of resources related to pensions from the following sources as of June 30, 2020 and 2019 ($ in thousands):
2020 2019
Deferred outflows of resources
Deferred inflows of resources
Deferred outflows of resources
Deferred inflows of resources
Changes of assumptions $ 39,043 $ ‑ $ 41,482 $ ‑ Changes in proportion due to internal allocation 59,974 25,043 22,245 37,534 Employer contributions after measurement date 40,617 ‑ 35,843 ‑ Differences between expected and actual experience 17,493 6,851 12,980 8,342 Net difference between projected and actual investment earnings on pension plan investments ‑ 7,857 ‑ 14,228
Changes in proportion from Commonwealth 930 27 1,104 78
Total $ 158,057 $ 39,778 $ 113,654 $ 60,182
46 UNIVERSIT Y OF MASSACHUSET TS ANNUAL FINANCIAL REPORT 2020
notes to financial statements
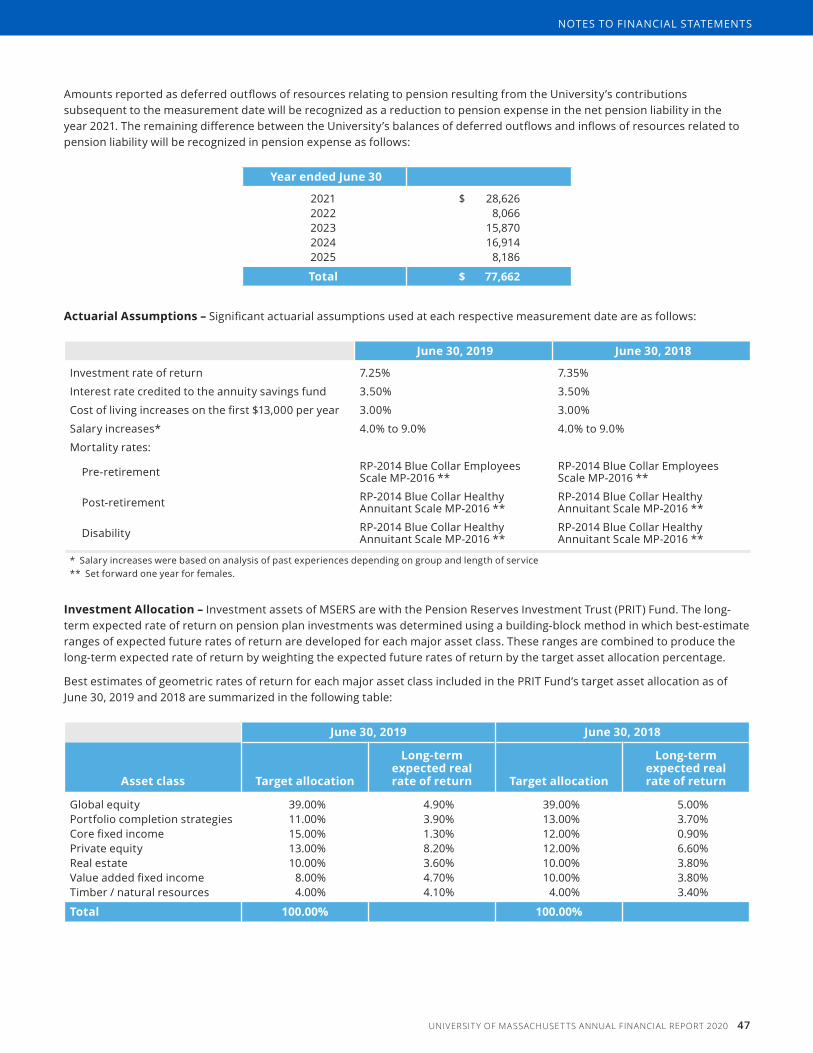
Amounts reported as deferred outflows of resources relating to pension resulting from the University’s contributions subsequent to the measurement date will be recognized as a reduction to pension expense in the net pension liability in the year 2021. The remaining difference between the University’s balances of deferred outflows and inflows of resources related to pension liability will be recognized in pension expense as follows:
year ended June 30
2021 $ 28,626 2022 8,066 2023 15,870 2024 16,914 2025 8,186
Total $ 77,662
Actuarial Assumptions – Significant actuarial assumptions used at each respective measurement date are as follows:
June 30, 2019 June 30, 2018
Investment rate of return 7.25% 7.35%
Interest rate credited to the annuity savings fund 3.50% 3.50%
Cost of living increases on the first $13,000 per year 3.00% 3.00%
Salary increases* 4.0% to 9.0% 4.0% to 9.0%
Mortality rates:
Pre‑retirement RP-2014 Blue Collar Employees Scale MP-2016 **
RP-2014 Blue Collar Employees Scale MP-2016 **
Post‑retirement RP-2014 Blue Collar Healthy Annuitant Scale MP-2016 **
RP-2014 Blue Collar Healthy Annuitant Scale MP-2016 **
Disability RP-2014 Blue Collar Healthy Annuitant Scale MP-2016 **
RP-2014 Blue Collar Healthy Annuitant Scale MP-2016 **
* Salary increases were based on analysis of past experiences depending on group and length of service** Set forward one year for females.
Investment Allocation – Investment assets of MSERS are with the Pension Reserves Investment Trust (PRIT) Fund. The long-term expected rate of return on pension plan investments was determined using a building‑block method in which best‑estimate ranges of expected future rates of return are developed for each major asset class. These ranges are combined to produce the long-term expected rate of return by weighting the expected future rates of return by the target asset allocation percentage.
Best estimates of geometric rates of return for each major asset class included in the PRIT Fund’s target asset allocation as of June 30, 2019 and 2018 are summarized in the following table:
June 30, 2019 June 30, 2018
Asset class Target allocation
Long-term expected real rate of return Target allocation
Long-term expected real rate of return
Global equity 39.00% 4.90% 39.00% 5.00%Portfolio completion strategies 11.00% 3.90% 13.00% 3.70%Core fixed income 15.00% 1.30% 12.00% 0.90%Private equity 13.00% 8.20% 12.00% 6.60%Real estate 10.00% 3.60% 10.00% 3.80%Value added fixed income 8.00% 4.70% 10.00% 3.80%Timber / natural resources 4.00% 4.10% 4.00% 3.40%
Total 100.00% 100.00%
UNIVERSIT Y OF MASSACHUSET TS ANNUAL FINANCIAL REPORT 2020 47
notes to financial statements
Discount Rate – The discount rate used to measure the total pension liability was 7.25% and 7.35% at June 30, 2019 and 2018, respectively. The projection of cash flows used to determine the discount rate assumed that plan member contributions will be made at the current contribution rates and the Commonwealth’s contributions will be made at rates equal to the difference between actuarially determined contribution rates and the member rates. Based on those assumptions, the net position was projected to be available to make all projected future benefit payments of current plan members. Therefore, the long-term expected rate of return on pension plan investments was applied to all periods of projected benefit payments to determine the total pension liability.
Sensitivity Analysis – The following illustrates the impact of a 1% change in the discount rate for the net pension liability at June 30, 2020 and 2019 ($ in thousands):
Fiscal year ended 1% Decrease Current discount rate 1% Increase
June 30, 2020 $ 701,230 $ 526,739 $ 377,816 June 30, 2019 551,694 409,319 287,666
Defined contribution planNon-vested faculty and certain other employees of the University can opt out of MSERS and participate in a defined contribution plan, the Optional Retirement Plan (ORP), administered by the Commonwealth’s Department of Higher Education. As of June 30, 2020 and 2019, there were 2,129 and 2,011 participants in the ORP, respectively. Employees contribute at the same rate as members in MSERS and the Commonwealth matches 5% of employee contributions. The Commonwealth contributed $8.0 million and $7.8 million in 2020 and 2019, respectively. University employees contributed $19.3 million and $18.8 million in 2020 and 2019, respectively.
The MSERS and ORP retirement contributions of employees who become members of MSERS or ORP after January 1, 2011 are subject to a state compensation limit. Effective January 1, 2011, the University established a defined contribution plan, the University of Massachusetts 401(a) Retirement Gap Plan (Gap Plan). Employees with MSERS or ORP membership dates after January 1, 2011 are eligible to participate in for the Gap Plan. Eligible employees begin participation in the Gap Plan when their regular compensation exceeds the state compensation limit in effect for the plan year, at which point their contributions to MSERS or ORP are required to stop for the remainder of the plan year. Employee contributions to the Gap Plan are mandatory and at the same rate as MSERS and ORP; the University contributes 5%. As of June 30, 2020 and 2019, the plan assets of the Gap Plan were $6.2 million and $4.7 million, respectively.
Phot
os ta
ken
prio
r to
COVI
D-1
9 so
cial d
ista
ncin
g pra
ctice
s
48 UNIVERSIT Y OF MASSACHUSET TS ANNUAL FINANCIAL REPORT 2020
notes to financial statements
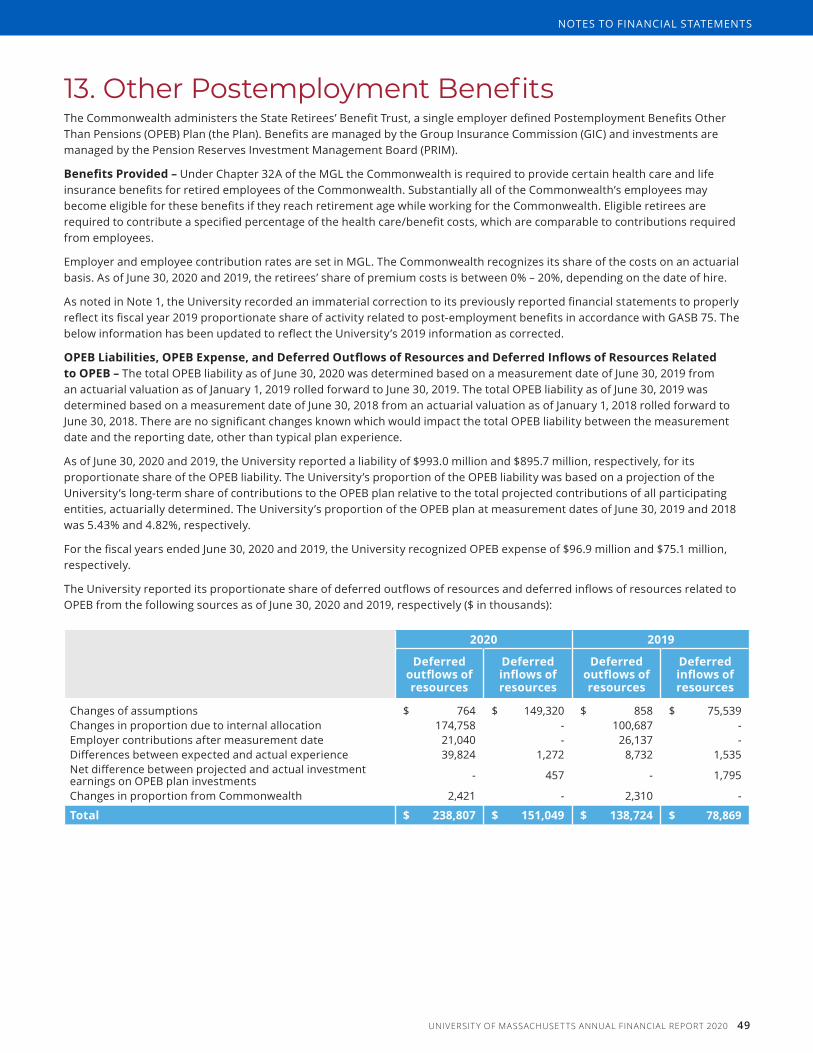
13. Other Postemployment BenefitsThe Commonwealth administers the State Retirees’ Benefit Trust, a single employer defined Postemployment Benefits Other Than Pensions (OPEB) Plan (the Plan). Benefits are managed by the Group Insurance Commission (GIC) and investments are managed by the Pension Reserves Investment Management Board (PRIM).
Benefits Provided – Under Chapter 32A of the MGL the Commonwealth is required to provide certain health care and life insurance benefits for retired employees of the Commonwealth. Substantially all of the Commonwealth’s employees may become eligible for these benefits if they reach retirement age while working for the Commonwealth. Eligible retirees are required to contribute a specified percentage of the health care/benefit costs, which are comparable to contributions required from employees.
Employer and employee contribution rates are set in MGL. The Commonwealth recognizes its share of the costs on an actuarial basis. As of June 30, 2020 and 2019, the retirees’ share of premium costs is between 0% – 20%, depending on the date of hire.
As noted in Note 1, the University recorded an immaterial correction to its previously reported financial statements to properly reflect its fiscal year 2019 proportionate share of activity related to post-employment benefits in accordance with GASB 75. The below information has been updated to reflect the University’s 2019 information as corrected.
oPEB Liabilities, oPEB Expense, and Deferred outflows of resources and Deferred Inflows of resources related to OPEB – The total OPEB liability as of June 30, 2020 was determined based on a measurement date of June 30, 2019 from an actuarial valuation as of January 1, 2019 rolled forward to June 30, 2019. The total OPEB liability as of June 30, 2019 was determined based on a measurement date of June 30, 2018 from an actuarial valuation as of January 1, 2018 rolled forward to June 30, 2018. There are no significant changes known which would impact the total OPEB liability between the measurement date and the reporting date, other than typical plan experience.
As of June 30, 2020 and 2019, the University reported a liability of $993.0 million and $895.7 million, respectively, for its proportionate share of the OPEB liability. The University’s proportion of the OPEB liability was based on a projection of the University’s long‑term share of contributions to the OPEB plan relative to the total projected contributions of all participating entities, actuarially determined. The University’s proportion of the OPEB plan at measurement dates of June 30, 2019 and 2018 was 5.43% and 4.82%, respectively.
For the fiscal years ended June 30, 2020 and 2019, the University recognized OPEB expense of $96.9 million and $75.1 million, respectively.
The University reported its proportionate share of deferred outflows of resources and deferred inflows of resources related to OPEB from the following sources as of June 30, 2020 and 2019, respectively ($ in thousands):
2020 2019
Deferred outflows of resources
Deferred inflows of resources
Deferred outflows of resources
Deferred inflows of resources
Changes of assumptions $ 764 $ 149,320 $ 858 $ 75,539 Changes in proportion due to internal allocation 174,758 ‑ 100,687 ‑ Employer contributions after measurement date 21,040 ‑ 26,137 ‑ Differences between expected and actual experience 39,824 1,272 8,732 1,535 Net difference between projected and actual investment earnings on OPEB plan investments ‑ 457 ‑ 1,795
Changes in proportion from Commonwealth 2,421 ‑ 2,310 ‑
Total $ 238,807 $ 151,049 $ 138,724 $ 78,869
UNIVERSIT Y OF MASSACHUSET TS ANNUAL FINANCIAL REPORT 2020 49
notes to financial statements

Amounts reported as deferred outflows of resources relating to OPEB resulting from the University’s contributions subsequent to the measurement date will be recognized as a reduction to OPEB expense in the net OPEB liability in the year 2021. The remaining difference between the University’s balances of deferred outflows and inflows of resources related to OPEB will be recognized in OPEB expense as follows:
year ended June 30
2021 $ 2,860 2022 2,860 2023 8,102 2024 25,897 2025 26,999
$ 66,718
Actuarial Assumptions – Significant actuarial assumptions used at the 2019 measurement date are as follows:
Long-term rate of return on investment 7.25%Annual healthcare cost trend rates
Medical 7.5% decreasing by 0.5% each year to 5.5% in 2023 and 2024 and then decreasing 0.5% each year to an ultimate rate of 4.5% in 2026 for medical and 4.5% for administration costs
Employer group waiver program 5% per year until 2025, then decrease to 4.5% in 2026
Administrative costs 4.5%
Mortality rates RP-2014 Blue Collar Employees projected with Scale MP-2016 with females set forward one year
Participation rates 100% of all retirees who currently have health care coverage will continue the same coverage, except the following:
• retirees under the age of 65 with POS/PPO coverage switch to Indemnity at age 65
• retirees over the age of 65 with POS/PPO coverage switched to HMO
Current retirees and spouses - Medicare coverage upon attainment of age 65
Future retirees - Medicare coverage upon attainment of age 65
85% of current and future contingent eligible participants will elect health care benefits at 55 or later
Actives, upon retirement, take coverage, and are assumed to have the following coverage:
Retirement age Under 65 Over 65
Indemnity 25.0% 85.0% POS/PPO 60.0% 0.0% HMO 15.0% 15.0%
50 UNIVERSIT Y OF MASSACHUSET TS ANNUAL FINANCIAL REPORT 2020
notes to financial statements
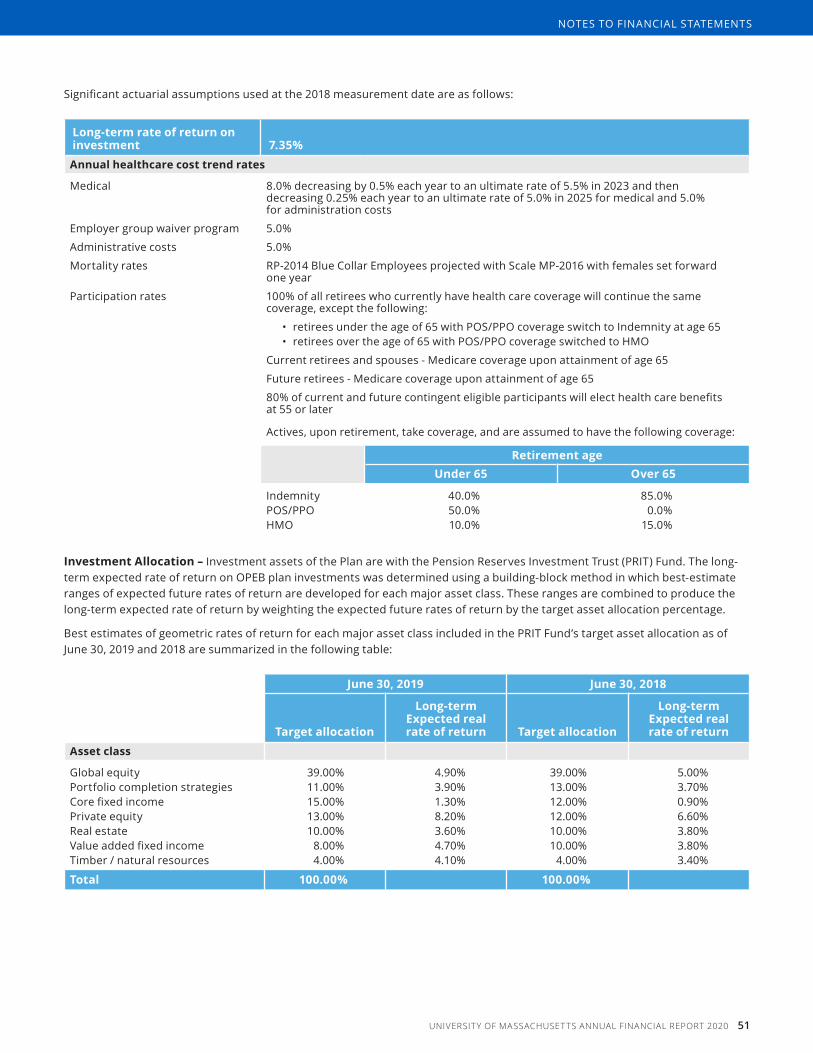
Significant actuarial assumptions used at the 2018 measurement date are as follows:
Long-term rate of return on investment 7.35%Annual healthcare cost trend rates
Medical 8.0% decreasing by 0.5% each year to an ultimate rate of 5.5% in 2023 and then decreasing 0.25% each year to an ultimate rate of 5.0% in 2025 for medical and 5.0% for administration costs
Employer group waiver program 5.0%
Administrative costs 5.0%
Mortality rates RP-2014 Blue Collar Employees projected with Scale MP-2016 with females set forward one year
Participation rates 100% of all retirees who currently have health care coverage will continue the same coverage, except the following:
• retirees under the age of 65 with POS/PPO coverage switch to Indemnity at age 65 • retirees over the age of 65 with POS/PPO coverage switched to HMO
Current retirees and spouses - Medicare coverage upon attainment of age 65
Future retirees - Medicare coverage upon attainment of age 65
80% of current and future contingent eligible participants will elect health care benefits at 55 or later
Actives, upon retirement, take coverage, and are assumed to have the following coverage:
Retirement ageUnder 65 Over 65
Indemnity 40.0% 85.0%POS/PPO 50.0% 0.0%HMO 10.0% 15.0%
Investment Allocation – Investment assets of the Plan are with the Pension Reserves Investment Trust (PRIT) Fund. The long-term expected rate of return on OPEB plan investments was determined using a building‑block method in which best‑estimate ranges of expected future rates of return are developed for each major asset class. These ranges are combined to produce the long-term expected rate of return by weighting the expected future rates of return by the target asset allocation percentage.
Best estimates of geometric rates of return for each major asset class included in the PRIT Fund’s target asset allocation as of June 30, 2019 and 2018 are summarized in the following table:
June 30, 2019 June 30, 2018
Target allocation
Long-term Expected real rate of return Target allocation
Long-term Expected real rate of return
Asset class
Global equity 39.00% 4.90% 39.00% 5.00%Portfolio completion strategies 11.00% 3.90% 13.00% 3.70%Core fixed income 15.00% 1.30% 12.00% 0.90%Private equity 13.00% 8.20% 12.00% 6.60%Real estate 10.00% 3.60% 10.00% 3.80%Value added fixed income 8.00% 4.70% 10.00% 3.80%Timber / natural resources 4.00% 4.10% 4.00% 3.40%
Total 100.00% 100.00%
UNIVERSIT Y OF MASSACHUSET TS ANNUAL FINANCIAL REPORT 2020 51
notes to financial statements
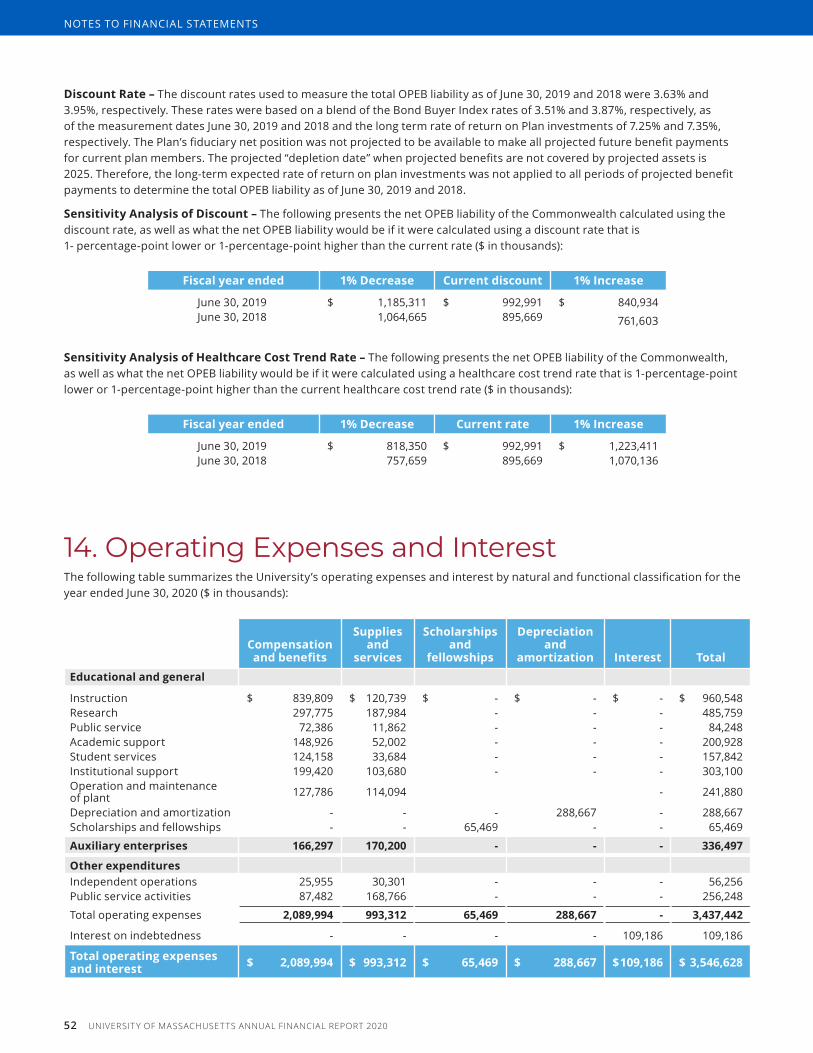
Discount Rate – The discount rates used to measure the total OPEB liability as of June 30, 2019 and 2018 were 3.63% and 3.95%, respectively. These rates were based on a blend of the Bond Buyer Index rates of 3.51% and 3.87%, respectively, as of the measurement dates June 30, 2019 and 2018 and the long term rate of return on Plan investments of 7.25% and 7.35%, respectively. The Plan’s fiduciary net position was not projected to be available to make all projected future benefit payments for current plan members. The projected “depletion date” when projected benefits are not covered by projected assets is 2025. Therefore, the long-term expected rate of return on plan investments was not applied to all periods of projected benefit payments to determine the total OPEB liability as of June 30, 2019 and 2018.
Sensitivity Analysis of Discount – The following presents the net OPEB liability of the Commonwealth calculated using the discount rate, as well as what the net OPEB liability would be if it were calculated using a discount rate that is 1‑ percentage‑point lower or 1‑percentage‑point higher than the current rate ($ in thousands):
Fiscal year ended 1% Decrease Current discount 1% Increase
June 30, 2019 $ 1,185,311 $ 992,991 $ 840,934 June 30, 2018 1,064,665 895,669 761,603
Sensitivity Analysis of healthcare Cost Trend rate – The following presents the net OPEB liability of the Commonwealth, as well as what the net OPEB liability would be if it were calculated using a healthcare cost trend rate that is 1‑percentage‑point lower or 1‑percentage‑point higher than the current healthcare cost trend rate ($ in thousands):
Fiscal year ended 1% Decrease Current rate 1% Increase
June 30, 2019 $ 818,350 $ 992,991 $ 1,223,411 June 30, 2018 757,659 895,669 1,070,136
14. operating expenses and interest The following table summarizes the University’s operating expenses and interest by natural and functional classification for the year ended June 30, 2020 ($ in thousands):
Compensation and benefits
Supplies and
services
Scholarships and
fellowships
Depreciation and
amortization Interest TotalEducational and general
Instruction $ 839,809 $ 120,739 $ ‑ $ ‑ $ ‑ $ 960,548Research 297,775 187,984 ‑ ‑ ‑ 485,759 Public service 72,386 11,862 ‑ ‑ ‑ 84,248 Academic support 148,926 52,002 ‑ ‑ ‑ 200,928 Student services 124,158 33,684 ‑ ‑ ‑ 157,842 Institutional support 199,420 103,680 ‑ ‑ ‑ 303,100 Operation and maintenance of plant 127,786 114,094 ‑ 241,880
Depreciation and amortization ‑ ‑ ‑ 288,667 ‑ 288,667 Scholarships and fellowships ‑ ‑ 65,469 ‑ ‑ 65,469
Auxiliary enterprises 166,297 170,200 - - - 336,497
Other expendituresIndependent operations 25,955 30,301 ‑ ‑ ‑ 56,256 Public service activities 87,482 168,766 ‑ ‑ ‑ 256,248
Total operating expenses 2,089,994 993,312 65,469 288,667 - 3,437,442
Interest on indebtedness ‑ ‑ ‑ ‑ 109,186 109,186
Total operating expenses and interest $ 2,089,994 $ 993,312 $ 65,469 $ 288,667 $ 109,186 $ 3,546,628
52 UNIVERSIT Y OF MASSACHUSET TS ANNUAL FINANCIAL REPORT 2020
notes to financial statements
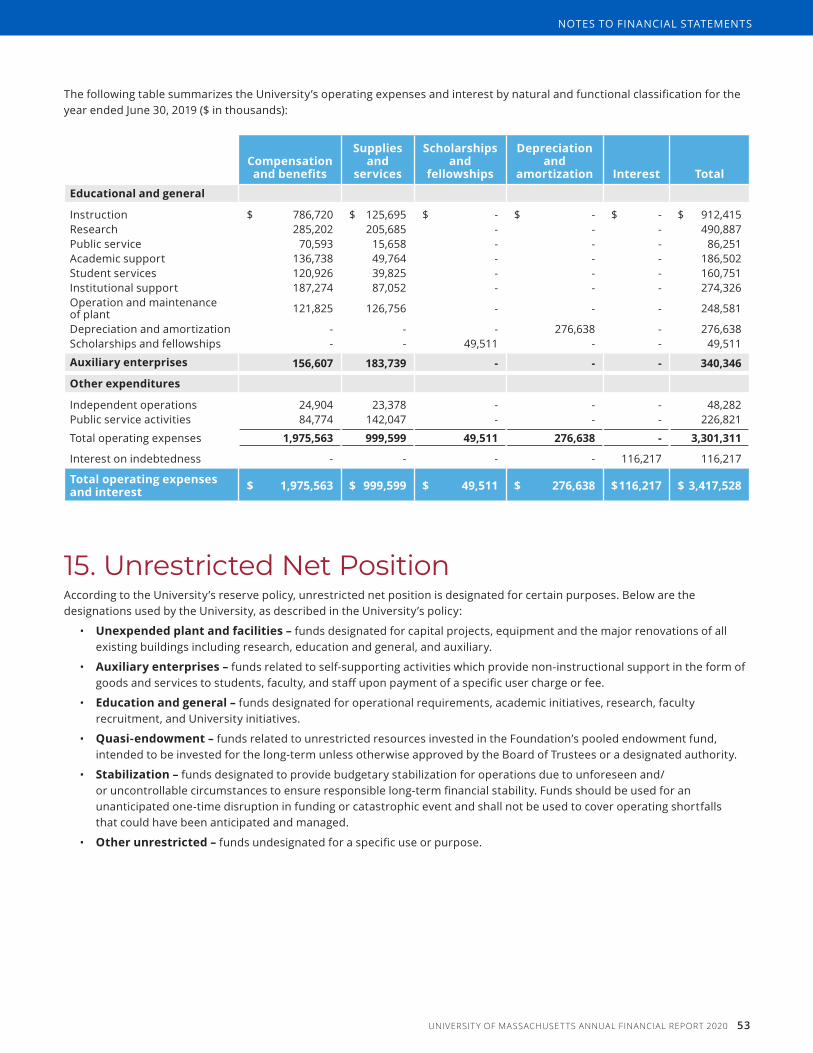
The following table summarizes the University’s operating expenses and interest by natural and functional classification for the year ended June 30, 2019 ($ in thousands):
Compensation and benefits
Supplies and
services
Scholarships and
fellowships
Depreciation and
amortization Interest TotalEducational and general
Instruction $ 786,720 $ 125,695 $ ‑ $ ‑ $ ‑ $ 912,415 Research 285,202 205,685 ‑ ‑ ‑ 490,887 Public service 70,593 15,658 ‑ ‑ ‑ 86,251 Academic support 136,738 49,764 ‑ ‑ ‑ 186,502 Student services 120,926 39,825 ‑ ‑ ‑ 160,751 Institutional support 187,274 87,052 ‑ ‑ ‑ 274,326 Operation and maintenance of plant 121,825 126,756 ‑ ‑ ‑ 248,581
Depreciation and amortization ‑ ‑ ‑ 276,638 ‑ 276,638 Scholarships and fellowships ‑ ‑ 49,511 ‑ ‑ 49,511
Auxiliary enterprises 156,607 183,739 - - - 340,346
Other expenditures
Independent operations 24,904 23,378 ‑ ‑ ‑ 48,282 Public service activities 84,774 142,047 ‑ ‑ ‑ 226,821
Total operating expenses 1,975,563 999,599 49,511 276,638 - 3,301,311
Interest on indebtedness ‑ ‑ ‑ ‑ 116,217 116,217
Total operating expenses and interest $ 1,975,563 $ 999,599 $ 49,511 $ 276,638 $ 116,217 $ 3,417,528
15. unrestricted net positionAccording to the University’s reserve policy, unrestricted net position is designated for certain purposes. Below are the designations used by the University, as described in the University’s policy:
• Unexpended plant and facilities – funds designated for capital projects, equipment and the major renovations of all existing buildings including research, education and general, and auxiliary.
• Auxiliary enterprises – funds related to self‑supporting activities which provide non‑instructional support in the form of goods and services to students, faculty, and staff upon payment of a specific user charge or fee.
• Education and general – funds designated for operational requirements, academic initiatives, research, faculty recruitment, and University initiatives.
• Quasi-endowment – funds related to unrestricted resources invested in the Foundation’s pooled endowment fund, intended to be invested for the long-term unless otherwise approved by the Board of Trustees or a designated authority.
• Stabilization – funds designated to provide budgetary stabilization for operations due to unforeseen and/or uncontrollable circumstances to ensure responsible long-term financial stability. Funds should be used for an unanticipated one‑time disruption in funding or catastrophic event and shall not be used to cover operating shortfalls that could have been anticipated and managed.
• Other unrestricted – funds undesignated for a specific use or purpose.
UNIVERSIT Y OF MASSACHUSET TS ANNUAL FINANCIAL REPORT 2020 53
notes to financial statements
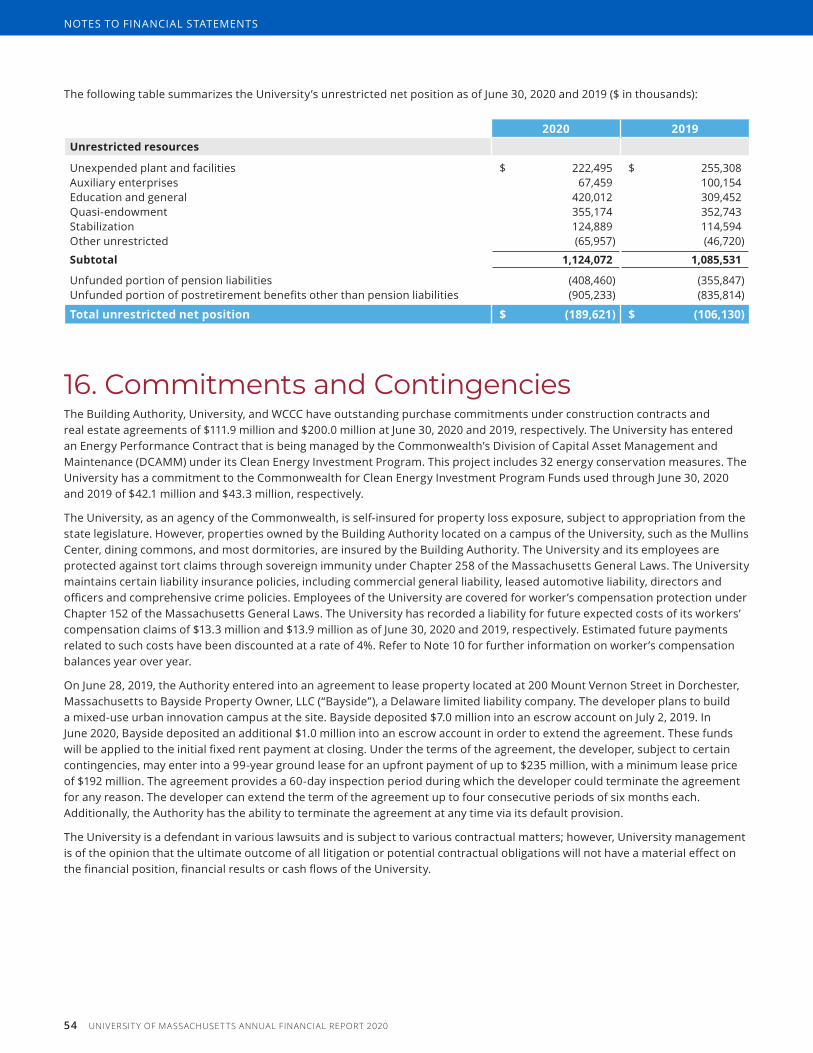
The following table summarizes the University’s unrestricted net position as of June 30, 2020 and 2019 ($ in thousands):
2020 2019Unrestricted resources
Unexpended plant and facilities $ 222,495 $ 255,308 Auxiliary enterprises 67,459 100,154 Education and general 420,012 309,452 Quasi‑endowment 355,174 352,743 Stabilization 124,889 114,594 Other unrestricted (65,957) (46,720)
Subtotal 1,124,072 1,085,531
Unfunded portion of pension liabilities (408,460) (355,847)Unfunded portion of postretirement benefits other than pension liabilities (905,233) (835,814)
Total unrestricted net position $ (189,621) $ (106,130)
16. commitments and contingenciesThe Building Authority, University, and WCCC have outstanding purchase commitments under construction contracts and real estate agreements of $111.9 million and $200.0 million at June 30, 2020 and 2019, respectively. The University has entered an Energy Performance Contract that is being managed by the Commonwealth’s Division of Capital Asset Management and Maintenance (DCAMM) under its Clean Energy Investment Program. This project includes 32 energy conservation measures. The University has a commitment to the Commonwealth for Clean Energy Investment Program Funds used through June 30, 2020 and 2019 of $42.1 million and $43.3 million, respectively.
The University, as an agency of the Commonwealth, is self‑insured for property loss exposure, subject to appropriation from the state legislature. However, properties owned by the Building Authority located on a campus of the University, such as the Mullins Center, dining commons, and most dormitories, are insured by the Building Authority. The University and its employees are protected against tort claims through sovereign immunity under Chapter 258 of the Massachusetts General Laws. The University maintains certain liability insurance policies, including commercial general liability, leased automotive liability, directors and officers and comprehensive crime policies. Employees of the University are covered for worker’s compensation protection under Chapter 152 of the Massachusetts General Laws. The University has recorded a liability for future expected costs of its workers’ compensation claims of $13.3 million and $13.9 million as of June 30, 2020 and 2019, respectively. Estimated future payments related to such costs have been discounted at a rate of 4%. Refer to Note 10 for further information on worker’s compensation balances year over year.
On June 28, 2019, the Authority entered into an agreement to lease property located at 200 Mount Vernon Street in Dorchester, Massachusetts to Bayside Property Owner, LLC (“Bayside”), a Delaware limited liability company. The developer plans to build a mixed-use urban innovation campus at the site. Bayside deposited $7.0 million into an escrow account on July 2, 2019. In June 2020, Bayside deposited an additional $1.0 million into an escrow account in order to extend the agreement. These funds will be applied to the initial fixed rent payment at closing. Under the terms of the agreement, the developer, subject to certain contingencies, may enter into a 99-year ground lease for an upfront payment of up to $235 million, with a minimum lease price of $192 million. The agreement provides a 60-day inspection period during which the developer could terminate the agreement for any reason. The developer can extend the term of the agreement up to four consecutive periods of six months each. Additionally, the Authority has the ability to terminate the agreement at any time via its default provision.
The University is a defendant in various lawsuits and is subject to various contractual matters; however, University management is of the opinion that the ultimate outcome of all litigation or potential contractual obligations will not have a material effect on the financial position, financial results or cash flows of the University.
54 UNIVERSIT Y OF MASSACHUSET TS ANNUAL FINANCIAL REPORT 2020
notes to financial statements
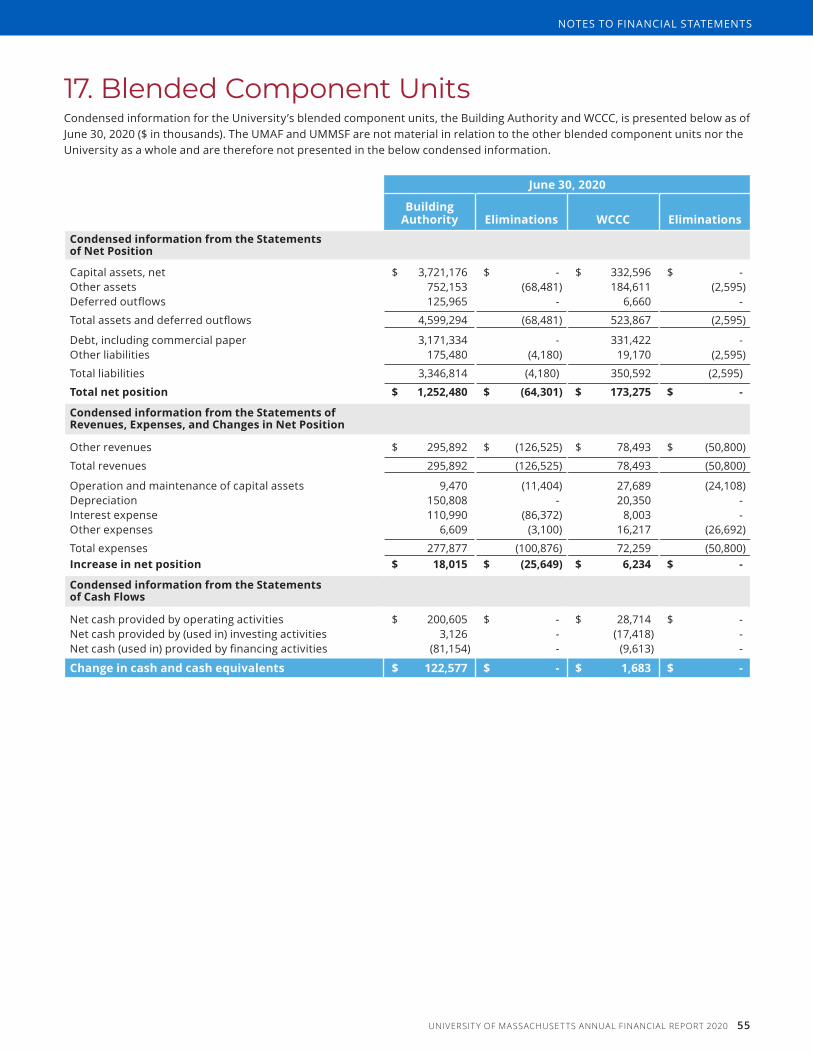
17. Blended component unitsCondensed information for the University’s blended component units, the Building Authority and WCCC, is presented below as of June 30, 2020 ($ in thousands). The UMAF and UMMSF are not material in relation to the other blended component units nor the University as a whole and are therefore not presented in the below condensed information.
June 30, 2020
Building Authority Eliminations WCCC Eliminations
Condensed information from the Statements of Net Position
Capital assets, net $ 3,721,176 $ ‑ $ 332,596 $ ‑ Other assets 752,153 (68,481) 184,611 (2,595)Deferred outflows 125,965 ‑ 6,660 ‑
Total assets and deferred outflows 4,599,294 (68,481) 523,867 (2,595)
Debt, including commercial paper 3,171,334 ‑ 331,422 ‑ Other liabilities 175,480 (4,180) 19,170 (2,595)
Total liabilities 3,346,814 (4,180) 350,592 (2,595)
Total net position $ 1,252,480 $ (64,301) $ 173,275 $ -
Condensed information from the Statements of Revenues, Expenses, and Changes in Net Position
Other revenues $ 295,892 $ (126,525) $ 78,493 $ (50,800)
Total revenues 295,892 (126,525) 78,493 (50,800)
Operation and maintenance of capital assets 9,470 (11,404) 27,689 (24,108)Depreciation 150,808 ‑ 20,350 ‑ Interest expense 110,990 (86,372) 8,003 ‑ Other expenses 6,609 (3,100) 16,217 (26,692)
Total expenses 277,877 (100,876) 72,259 (50,800)Increase in net position $ 18,015 $ (25,649) $ 6,234 $ -
Condensed information from the Statements of Cash Flows
Net cash provided by operating activities $ 200,605 $ ‑ $ 28,714 $ ‑ Net cash provided by (used in) investing activities 3,126 ‑ (17,418) ‑ Net cash (used in) provided by financing activities (81,154) ‑ (9,613) ‑
Change in cash and cash equivalents $ 122,577 $ - $ 1,683 $ -
UNIVERSIT Y OF MASSACHUSET TS ANNUAL FINANCIAL REPORT 2020 55
notes to financial statements
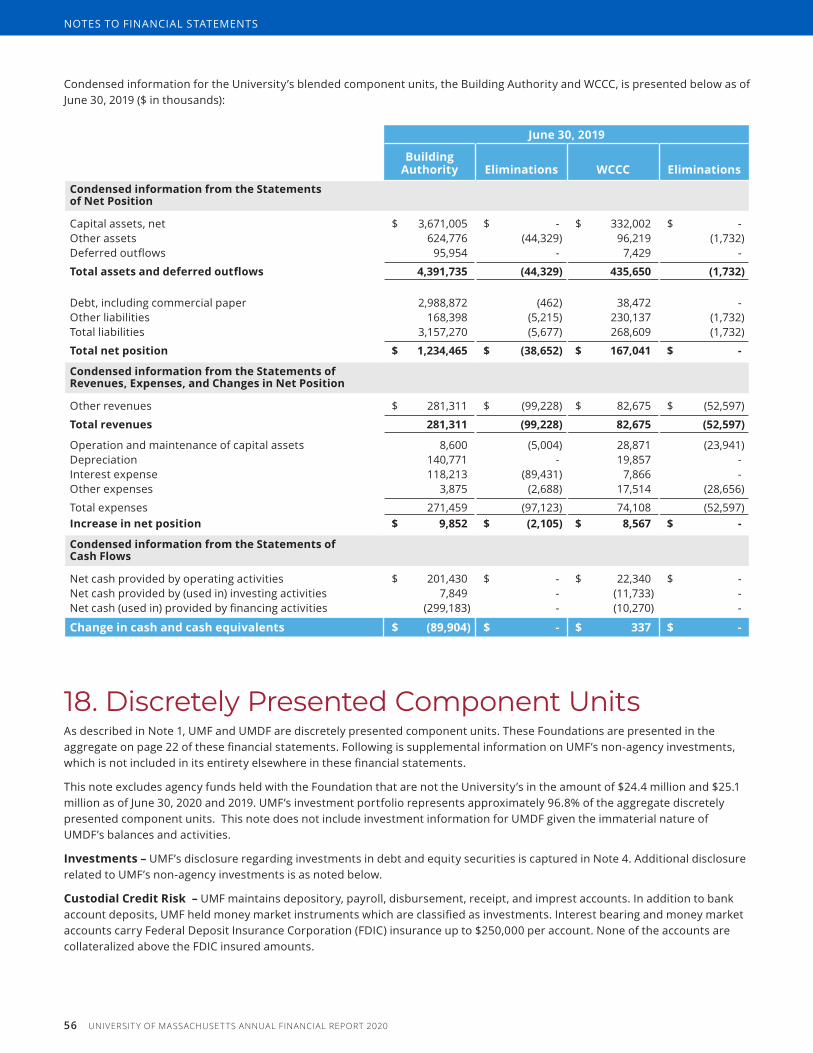
Condensed information for the University’s blended component units, the Building Authority and WCCC, is presented below as of June 30, 2019 ($ in thousands):
June 30, 2019
Building Authority Eliminations WCCC Eliminations
Condensed information from the Statements of Net Position
Capital assets, net $ 3,671,005 $ ‑ $ 332,002 $ ‑ Other assets 624,776 (44,329) 96,219 (1,732)Deferred outflows 95,954 ‑ 7,429 ‑
Total assets and deferred outflows 4,391,735 (44,329) 435,650 (1,732)
Debt, including commercial paper 2,988,872 (462) 38,472 ‑ Other liabilities 168,398 (5,215) 230,137 (1,732)Total liabilities 3,157,270 (5,677) 268,609 (1,732)
Total net position $ 1,234,465 $ (38,652) $ 167,041 $ -
Condensed information from the Statements of Revenues, Expenses, and Changes in Net Position
Other revenues $ 281,311 $ (99,228) $ 82,675 $ (52,597)
Total revenues 281,311 (99,228) 82,675 (52,597)
Operation and maintenance of capital assets 8,600 (5,004) 28,871 (23,941)Depreciation 140,771 ‑ 19,857 ‑ Interest expense 118,213 (89,431) 7,866 ‑ Other expenses 3,875 (2,688) 17,514 (28,656)
Total expenses 271,459 (97,123) 74,108 (52,597)Increase in net position $ 9,852 $ (2,105) $ 8,567 $ -
Condensed information from the Statements of Cash Flows
Net cash provided by operating activities $ 201,430 $ ‑ $ 22,340 $ ‑ Net cash provided by (used in) investing activities 7,849 ‑ (11,733) ‑ Net cash (used in) provided by financing activities (299,183) ‑ (10,270) ‑
Change in cash and cash equivalents $ (89,904) $ - $ 337 $ -
18. Discretely presented component unitsAs described in Note 1, UMF and UMDF are discretely presented component units. These Foundations are presented in the aggregate on page 22 of these financial statements. Following is supplemental information on UMF’s non-agency investments, which is not included in its entirety elsewhere in these financial statements.
This note excludes agency funds held with the Foundation that are not the University’s in the amount of $24.4 million and $25.1 million as of June 30, 2020 and 2019. UMF’s investment portfolio represents approximately 96.8% of the aggregate discretely presented component units. This note does not include investment information for UMDF given the immaterial nature of UMDF’s balances and activities.
Investments – UMF’s disclosure regarding investments in debt and equity securities is captured in Note 4. Additional disclosure related to UMF’s non-agency investments is as noted below.
Custodial Credit Risk – UMF maintains depository, payroll, disbursement, receipt, and imprest accounts. In addition to bank account deposits, UMF held money market instruments which are classified as investments. Interest bearing and money market accounts carry Federal Deposit Insurance Corporation (FDIC) insurance up to $250,000 per account. None of the accounts are collateralized above the FDIC insured amounts.
56 UNIVERSIT Y OF MASSACHUSET TS ANNUAL FINANCIAL REPORT 2020
notes to financial statements
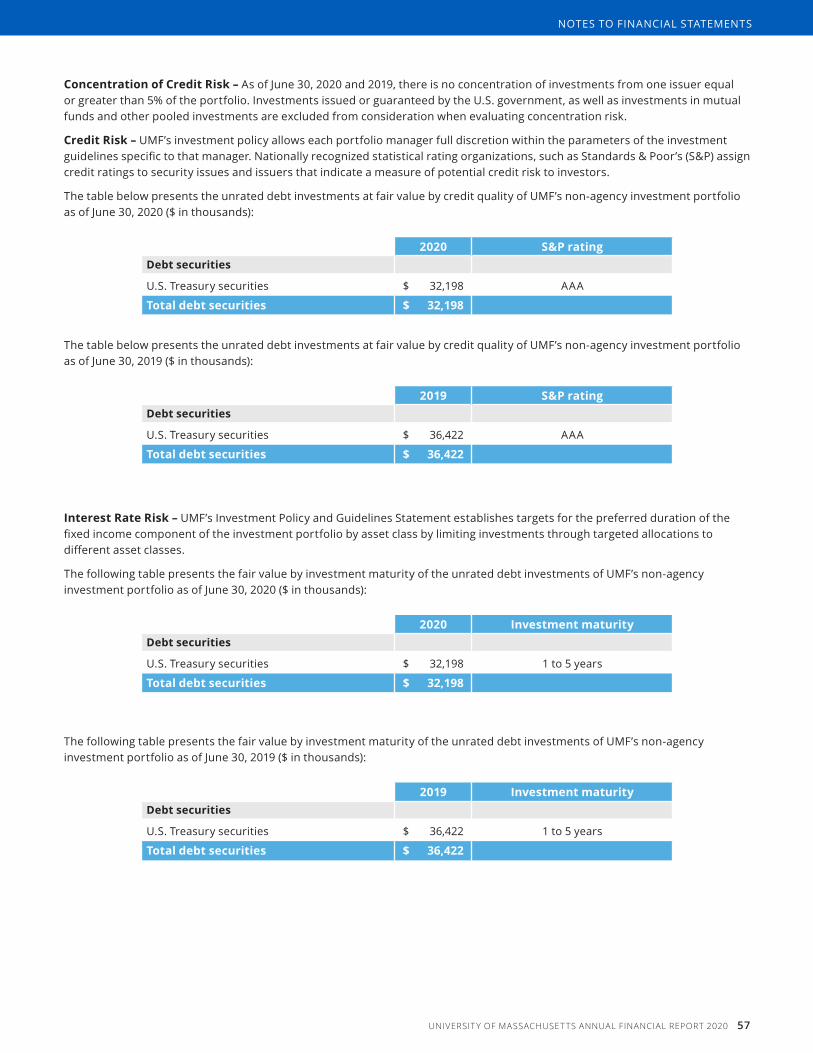
Concentration of Credit Risk – As of June 30, 2020 and 2019, there is no concentration of investments from one issuer equal or greater than 5% of the portfolio. Investments issued or guaranteed by the U.S. government, as well as investments in mutual funds and other pooled investments are excluded from consideration when evaluating concentration risk.
Credit Risk – UMF’s investment policy allows each portfolio manager full discretion within the parameters of the investment guidelines specific to that manager. Nationally recognized statistical rating organizations, such as Standards & Poor’s (S&P) assign credit ratings to security issues and issuers that indicate a measure of potential credit risk to investors.
The table below presents the unrated debt investments at fair value by credit quality of UMF’s non‑agency investment portfolio as of June 30, 2020 ($ in thousands):
2020 S&P ratingDebt securities
U.S. Treasury securities $ 32,198 AAA
Total debt securities $ 32,198
The table below presents the unrated debt investments at fair value by credit quality of UMF’s non‑agency investment portfolio as of June 30, 2019 ($ in thousands):
2019 S&P ratingDebt securities
U.S. Treasury securities $ 36,422 AAA
Total debt securities $ 36,422
Interest Rate Risk – UMF’s Investment Policy and Guidelines Statement establishes targets for the preferred duration of the fixed income component of the investment portfolio by asset class by limiting investments through targeted allocations to different asset classes.
The following table presents the fair value by investment maturity of the unrated debt investments of UMF’s non‑agency investment portfolio as of June 30, 2020 ($ in thousands):
2020 Investment maturityDebt securities
U.S. Treasury securities $ 32,198 1 to 5 years
Total debt securities $ 32,198
The following table presents the fair value by investment maturity of the unrated debt investments of UMF’s non‑agency investment portfolio as of June 30, 2019 ($ in thousands):
2019 Investment maturityDebt securities
U.S. Treasury securities $ 36,422 1 to 5 years
Total debt securities $ 36,422
UNIVERSIT Y OF MASSACHUSET TS ANNUAL FINANCIAL REPORT 2020 57
notes to financial statements
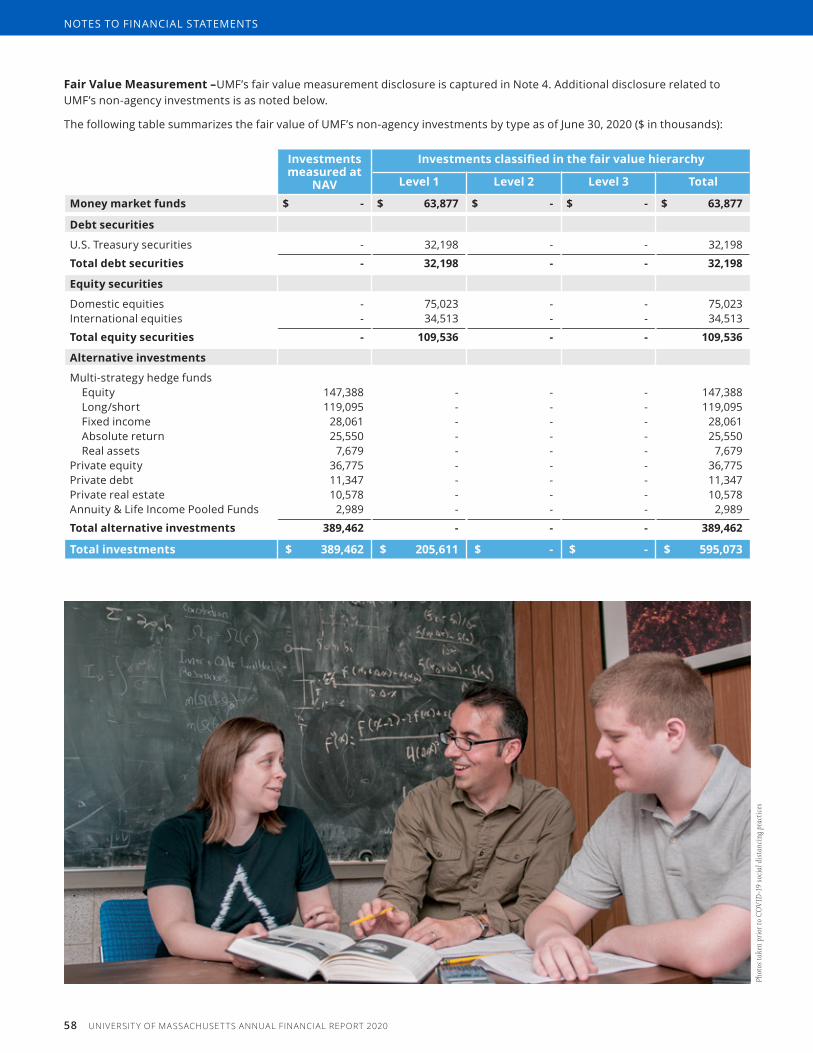
Phot
os ta
ken
prio
r to
COVI
D-1
9 so
cial d
ista
ncin
g pra
ctice
s
Fair Value Measurement –UMF’s fair value measurement disclosure is captured in Note 4. Additional disclosure related to UMF’s non-agency investments is as noted below.
The following table summarizes the fair value of UMF’s non-agency investments by type as of June 30, 2020 ($ in thousands):
Investments measured at
nAv
Investments classified in the fair value hierarchy
Level 1 Level 2 Level 3 Total
Money market funds $ - $ 63,877 $ - $ - $ 63,877
Debt securities
U.S. Treasury securities ‑ 32,198 ‑ ‑ 32,198
Total debt securities - 32,198 - - 32,198
Equity securities
Domestic equities ‑ 75,023 ‑ ‑ 75,023 International equities ‑ 34,513 ‑ ‑ 34,513
Total equity securities - 109,536 - - 109,536
Alternative investments
Multi‑strategy hedge fundsEquity 147,388 ‑ ‑ ‑ 147,388 Long/short 119,095 ‑ ‑ ‑ 119,095 Fixed income 28,061 ‑ ‑ ‑ 28,061 Absolute return 25,550 ‑ ‑ ‑ 25,550 Real assets 7,679 ‑ ‑ ‑ 7,679
Private equity 36,775 ‑ ‑ ‑ 36,775 Private debt 11,347 ‑ ‑ ‑ 11,347 Private real estate 10,578 ‑ ‑ ‑ 10,578 Annuity & Life Income Pooled Funds 2,989 ‑ ‑ ‑ 2,989
Total alternative investments 389,462 - - - 389,462
Total investments $ 389,462 $ 205,611 $ - $ - $ 595,073
58 UNIVERSIT Y OF MASSACHUSET TS ANNUAL FINANCIAL REPORT 2020
notes to financial statements

The following table summarizes the fair value of UMF’s non-agency investments by type as of June 30, 2019 ($ in thousands):
Investments measured at
nAv
Investments classified in the fair value hierarchy
Level 1 Level 2 Level 3 Total
Money market funds $ - $ 45,865 $ - $ - $ 45,865
Debt securities
U.S. Treasury securities ‑ 36,422 ‑ ‑ 36,422
Total debt securities - 36,422 - - 36,422
Equity securities
Domestic equities ‑ 97,129 ‑ ‑ 97,129 International equities ‑ 77,862 ‑ ‑ 77,862
Total equity securities - 174,991 - - 174,991
Alternative investments
Multi‑strategy hedge fundsEquity 90,962 ‑ ‑ ‑ 90,962 Long/short 83,234 ‑ ‑ ‑ 83,234 Fixed income 37,601 ‑ ‑ ‑ 37,601 Absolute return 26,540 ‑ ‑ ‑ 26,540 Real assets 7,807 ‑ ‑ ‑ 7,807
Private equity 23,409 ‑ ‑ ‑ 23,409 Private debt 18,020 ‑ ‑ ‑ 18,020 Private real estate 9,519 ‑ ‑ ‑ 9,519 Annuity & Life Income Pooled Funds 3,472 ‑ ‑ ‑ 3,472
Total alternative investments 300,564 - - - 300,564
Other securities ‑ 14,669 ‑ ‑ 14,669
Total investments $ 300,564 $ 271,947 $ - $ - $ 572,511
The following table presents unfunded commitments, redemption frequency and notice period for non‑agency investments that have been valued using NAV as a practical expedient as of June 30, 2020 ($ in thousands):
nAvUnfunded
commitmentsRedemption
termsNotice period
Redemption restrictions
Alternative investments
Multi‑strategy hedge funds
Equity $ 147,388 $ ‑ daily to quarterly 01–90 days Lock‑up provisions range from none to 2 years
Long/short 119,095 ‑ quarterly to annual 45–90 days Lock‑up provisions range from none to 3 years
Fixed income 28,061 ‑ quarterly (2) Lock‑up provisions range from none to 1 year
Absolute return 25,550 ‑ quarterly to annual 45–65 days No lock‑up restrictionsReal assets 7,679 ‑ annual 90 days No lock‑up restrictions
Private equity 36,775 15,464 closed end funds (1) Not redeemablePrivate debt 11,347 16,131 closed end funds (1) Not redeemablePrivate real estate 10,578 1,808 closed end funds (1) Not redeemableAnnuity & life income pooled funds 2,989 ‑ daily No lock‑up restrictions
Total $ 389,462 $ 33,403
(1) UMF has made commitments to various private equity, private debt and private real estate partnerships. UMF expects these funds to be called over the next 1–5 years. Liquidity is expected to be received in the next 1–9 years.
(2) Includes fund(s) that restrict redemptions such that redemptions are at the sole discretion of the Fund. Redemption terms require 60 to 90 days notice.
UNIVERSIT Y OF MASSACHUSET TS ANNUAL FINANCIAL REPORT 2020 59
notes to financial statements
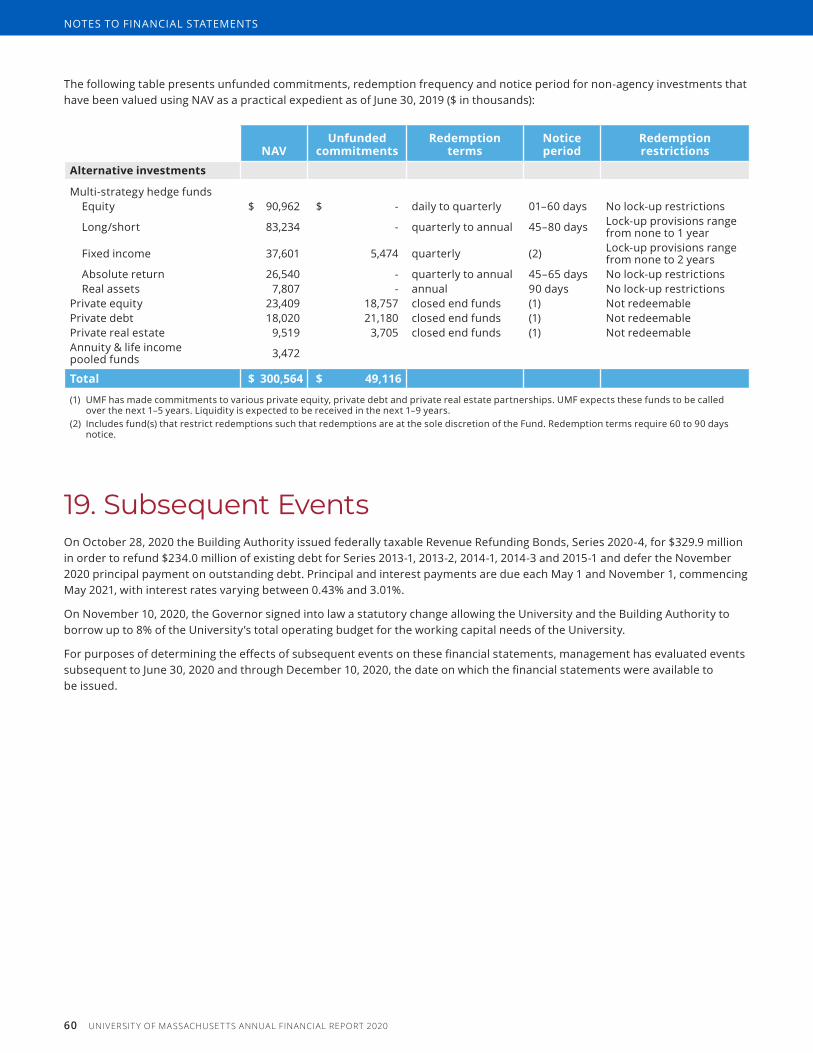
The following table presents unfunded commitments, redemption frequency and notice period for non‑agency investments that have been valued using NAV as a practical expedient as of June 30, 2019 ($ in thousands):
nAvUnfunded
commitmentsRedemption
termsNotice period
Redemption restrictions
Alternative investments
Multi‑strategy hedge fundsEquity $ 90,962 $ ‑ daily to quarterly 01–60 days No lock‑up restrictions
Long/short 83,234 ‑ quarterly to annual 45–80 days Lock‑up provisions range from none to 1 year
Fixed income 37,601 5,474 quarterly (2) Lock‑up provisions range from none to 2 years
Absolute return 26,540 ‑ quarterly to annual 45–65 days No lock‑up restrictionsReal assets 7,807 ‑ annual 90 days No lock‑up restrictions
Private equity 23,409 18,757 closed end funds (1) Not redeemablePrivate debt 18,020 21,180 closed end funds (1) Not redeemablePrivate real estate 9,519 3,705 closed end funds (1) Not redeemableAnnuity & life income pooled funds 3,472
Total $ 300,564 $ 49,116
(1) UMF has made commitments to various private equity, private debt and private real estate partnerships. UMF expects these funds to be called over the next 1–5 years. Liquidity is expected to be received in the next 1–9 years.
(2) Includes fund(s) that restrict redemptions such that redemptions are at the sole discretion of the Fund. Redemption terms require 60 to 90 days notice.
19. Subsequent eventsOn October 28, 2020 the Building Authority issued federally taxable Revenue Refunding Bonds, Series 2020-4, for $329.9 million in order to refund $234.0 million of existing debt for Series 2013-1, 2013-2, 2014-1, 2014-3 and 2015-1 and defer the November 2020 principal payment on outstanding debt. Principal and interest payments are due each May 1 and November 1, commencing May 2021, with interest rates varying between 0.43% and 3.01%.
On November 10, 2020, the Governor signed into law a statutory change allowing the University and the Building Authority to borrow up to 8% of the University’s total operating budget for the working capital needs of the University.
For purposes of determining the effects of subsequent events on these financial statements, management has evaluated events subsequent to June 30, 2020 and through December 10, 2020, the date on which the financial statements were available to be issued.
60 UNIVERSIT Y OF MASSACHUSET TS ANNUAL FINANCIAL REPORT 2020
notes to financial statements
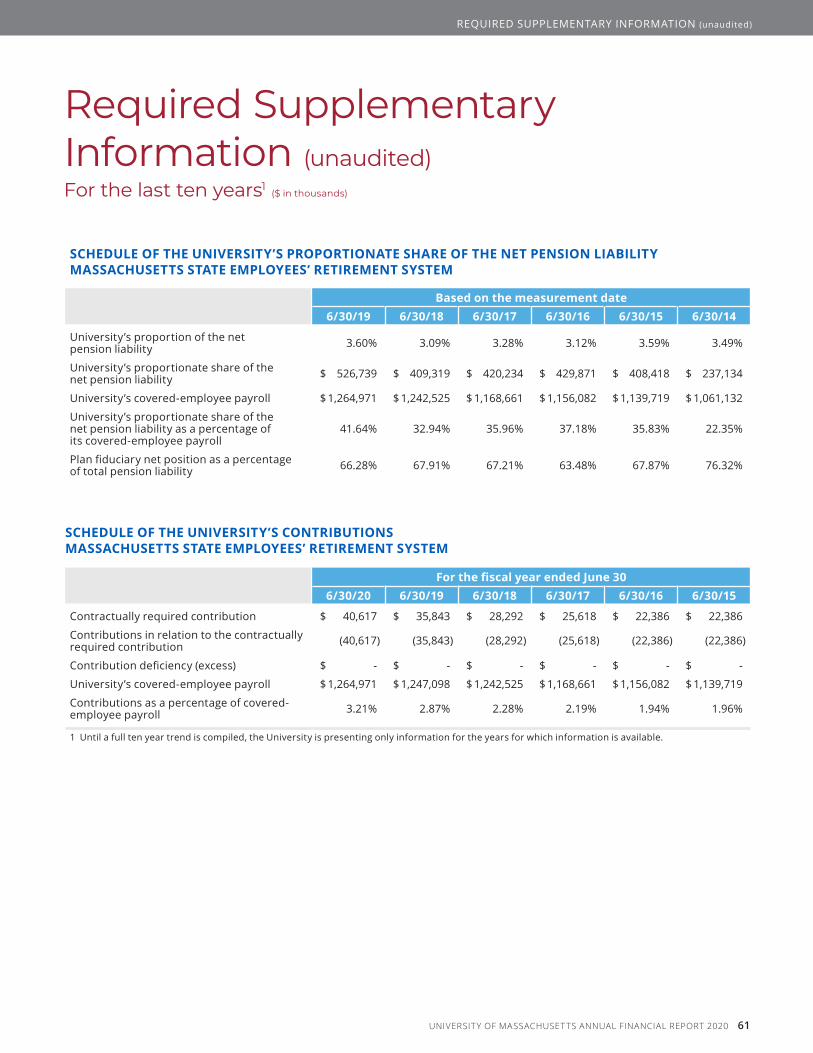
Required Supplementary information (unaudited)For the last ten years1
($ in thousands)
SChEDULE oF ThE UnIvErSITy’S ProPorTIonATE ShArE oF ThE nET PEnSIon LIABILITyMASSAChUSETTS STATE EMPLoyEES’ rETIrEMEnT SySTEM
Based on the measurement date6/30/19 6/30/18 6/30/17 6/30/16 6/30/15 6/30/14
University’s proportion of the net pension liability 3.60% 3.09% 3.28% 3.12% 3.59% 3.49%
University’s proportionate share of the net pension liability $ 526,739 $ 409,319 $ 420,234 $ 429,871 $ 408,418 $ 237,134
University’s covered‑employee payroll $ 1,264,971 $ 1,242,525 $ 1,168,661 $ 1,156,082 $ 1,139,719 $ 1,061,132
University’s proportionate share of the net pension liability as a percentage of its covered‑employee payroll
41.64% 32.94% 35.96% 37.18% 35.83% 22.35%
Plan fiduciary net position as a percentage of total pension liability 66.28% 67.91% 67.21% 63.48% 67.87% 76.32%
SChEDULE oF ThE UnIvErSITy’S ConTrIBUTIonSMASSAChUSETTS STATE EMPLoyEES’ rETIrEMEnT SySTEM
For the fiscal year ended June 306/30/20 6/30/19 6/30/18 6/30/17 6/30/16 6/30/15
Contractually required contribution $ 40,617 $ 35,843 $ 28,292 $ 25,618 $ 22,386 $ 22,386
Contributions in relation to the contractually required contribution (40,617) (35,843) (28,292) (25,618) (22,386) (22,386)
Contribution deficiency (excess) $ ‑ $ ‑ $ ‑ $ ‑ $ ‑ $ ‑
University’s covered‑employee payroll $ 1,264,971 $ 1,247,098 $ 1,242,525 $ 1,168,661 $ 1,156,082 $ 1,139,719
Contributions as a percentage of covered‑employee payroll 3.21% 2.87% 2.28% 2.19% 1.94% 1.96%
1 Until a full ten year trend is compiled, the University is presenting only information for the years for which information is available.
UNIVERSIT Y OF MASSACHUSET TS ANNUAL FINANCIAL REPORT 2020 61
required supplementary information (unaudited)
SChEDULE oF ThE UnIvErSITy’S ProPorTIonATE ShArE oF ThE nET oThEr PoSTEMPLoyMEnT BEnEFITS (oPEB) LIABILITySTATE rETIrEES’ BEnEFIT TrUST
Based on the measurement date6/30/19 6/30/18 (restated) 6/30/17
University’s proportion of the net OPEB 5.43% 4.82% 4.67%
University’s proportionate share of the net OPEB $ 992,991 $ 895,669 $ 817,357
University’s covered‑employee payroll $ 1,264,971 $ 1,242,525 $ 1,168,661
University’s proportionate share of the net OPEB as a percentage of its covered‑employee payroll 78.50% 72.08% 69.94%
Plan fiduciary net position as a percentage of total OPEB liability 6.96% 6.01% 4.80%
SChEDULE oF ThE UnIvErSITy’S ConTrIBUTIonSSTATE rETIrEES’ BEnEFIT TrUST
For the fiscal year ended June 306/30/20 6/30/19 6/30/18
Contractually required contribution $ 21,040 $ 26,137 $ 21,421
Contributions in relation to the contractually required contribution (21,040) (26,137) (21,421)
Contribution deficiency (excess) $ ‑ $ ‑ $ ‑
University’s covered‑employee payroll $ 1,264,971 $ 1,247,098 $ 1,242,525
Contributions as a percentage of covered‑employee payroll 1.66% 2.10% 1.72%
1 Until a full ten year trend is compiled, the University is presenting only information for the years for which information is available.
Phot
os ta
ken
prio
r to
COVI
D-1
9 so
cial d
ista
ncin
g pra
ctice
s
62 UNIVERSIT Y OF MASSACHUSET TS ANNUAL FINANCIAL REPORT 2020
required supplementary information (unaudited)

This page is intentionally left blank

This page is intentionally left blank

Phot
os ta
ken
prio
r to
COVI
D-1
9 so
cial d
ista
ncin
g pra
ctice
s
Phot
os ta
ken
prio
r to
COV
ID-1
9 so
cial
dis
tanc
ing
prac
tices

Controller’s Office University of Massachusetts President’s Office 333 South Street, Suite 450, Shrewsbury, MA
Related Documents