University of Leeds, 18-20 March 2008 University of Leeds, 18-20 March 2008 Domenica Rasulo ( Domenica Rasulo ( User Fellow User Fellow)

University of Leeds, 18-20 March 2008 Domenica Rasulo (User Fellow)
Dec 31, 2015
Welcome message from author
This document is posted to help you gain knowledge. Please leave a comment to let me know what you think about it! Share it to your friends and learn new things together.
Transcript

University of Leeds, 18-20 March 2008University of Leeds, 18-20 March 2008
Domenica Rasulo (Domenica Rasulo (User FellowUser Fellow))

Background concepts – life expectancyBackground concepts – life expectancy
Life expectancy represents the expected number of years Life expectancy represents the expected number of years
to be lived and is computed by using death and population to be lived and is computed by using death and population
counts counts
It does not indicate whether people live in good or bad It does not indicate whether people live in good or bad
health (e.g. the same number of years can be lived with or health (e.g. the same number of years can be lived with or
without diseases)without diseases)
Using measures of disease prevalence, the number of years Using measures of disease prevalence, the number of years
to be lived can be partitioned in years into with and without to be lived can be partitioned in years into with and without
diseasesdiseases

Partitioning life expectancyPartitioning life expectancy
The number of years of life expectancy is generally The number of years of life expectancy is generally
partitioned in years with and without limiting illness:partitioned in years with and without limiting illness:
Life expectancy (LE) = LE illness Life expectancy (LE) = LE illness + LE without illnessLE without illness
Years of life with ‘limiting long term illness’ in Years of life with ‘limiting long term illness’ in EnglandEngland
1991 73.4 59.4 13.9 78.9 61.8 17.0
1992 73.6 59.7 13.9 79.0 61.9 17.1
1993 73.9 59.4 14.5 79.2 61.7 17.5
1994 74.1 59.4 14.6 79.3 61.7 17.6
1995 74.3 59.2 15.1 79.5 61.6 17.9
1996 74.5 … … 79.6 … …
1997 74.8 59.1 15.6 79.8 60.8 19.0
1998 75.0 … … 79.9 … …
1999 75.3 60.6 14.7 80.1 62.6 17.5
2000 75.6 … … 80.3 … …
2001 76.0 60.8 15.1 80.6 62.9 17.7
Source: ONS
FEMALES, birth
Life expectancy
(LE)
LE without limiting
long term illness
LE with limiting long
term illness
MALES, birth
Years Life expectancy
(LE)
LE without limiting
long term illness
LE with limiting long
term illness

Years of life with ‘limiting long term illness’ in Years of life with ‘limiting long term illness’ in England (indexed values)England (indexed values)
1991 100.0 100.0 100.0 100.0 100.0 100.0
1992 100.3 100.4 99.9 100.1 100.1 100.4
1993 100.7 100.0 103.9 100.4 99.8 102.9
1994 100.9 100.0 104.9 100.5 99.8 103.1
1995 101.3 99.6 108.6 100.8 99.5 105.3
1996 101.5 … … 100.9 … …
1997 101.9 99.5 112.2 101.1 98.3 111.3
1998 102.2 … … 101.3 … …
1999 102.6 101.9 105.6 101.5 101.2 102.8
2000 103.1 … … 101.9 … …
2001 103.5 102.4 108.5 102.2 101.6 104.1
Source: Analysis of ONS data
FEMALES, birth - I ndex number (base=1991)
Lif e expectancy (LE)LE without limiting
long term illness
LE with limiting
long term illness
Years
MALES, birth - I ndex number (base=1991)
Lif e expectancy (LE)LE without limiting
long term illness
LE with limiting long
term illness

Policy issues arisingPolicy issues arising
The burden on the health system might be underestimated The burden on the health system might be underestimated
if only ‘long term limiting illness’ is considered if only ‘long term limiting illness’ is considered
People may have a long term illness but not consider it People may have a long term illness but not consider it
‘limiting’ but they still may:‘limiting’ but they still may:
take medicine on a daily basistake medicine on a daily basis require hospitalisation require hospitalisation require hospital visitsrequire hospital visits
a)a) Can we circumvent this by using a more general Can we circumvent this by using a more general
definition of illness? definition of illness?
b)b) Can we break the years in ill health down into different Can we break the years in ill health down into different
conditions e.g. in order to estimate economic cost?conditions e.g. in order to estimate economic cost?
c)c) People might have more than one disease so need to be People might have more than one disease so need to be
able to deal with co-morbidityable to deal with co-morbidity

Different definitions of long term Different definitions of long term illnessillnessThe life expectancy with different diseases can be analysed The life expectancy with different diseases can be analysed
using the Health Survey for England (HSE). It includes using the Health Survey for England (HSE). It includes
questions on questions on
‘ ‘limiting’ long-term illness (from 1997)limiting’ long-term illness (from 1997) long-term illness (from 1991)long-term illness (from 1991) specific diseases (from 1991)specific diseases (from 1991)
Using the HSE it is, therefore, possible to computeUsing the HSE it is, therefore, possible to compute
life expectancy with limiting long-term life expectancy with limiting long-term
illnessillness life expectancy with long-term illness life expectancy with long-term illness life expectancy with any disease life expectancy with any disease

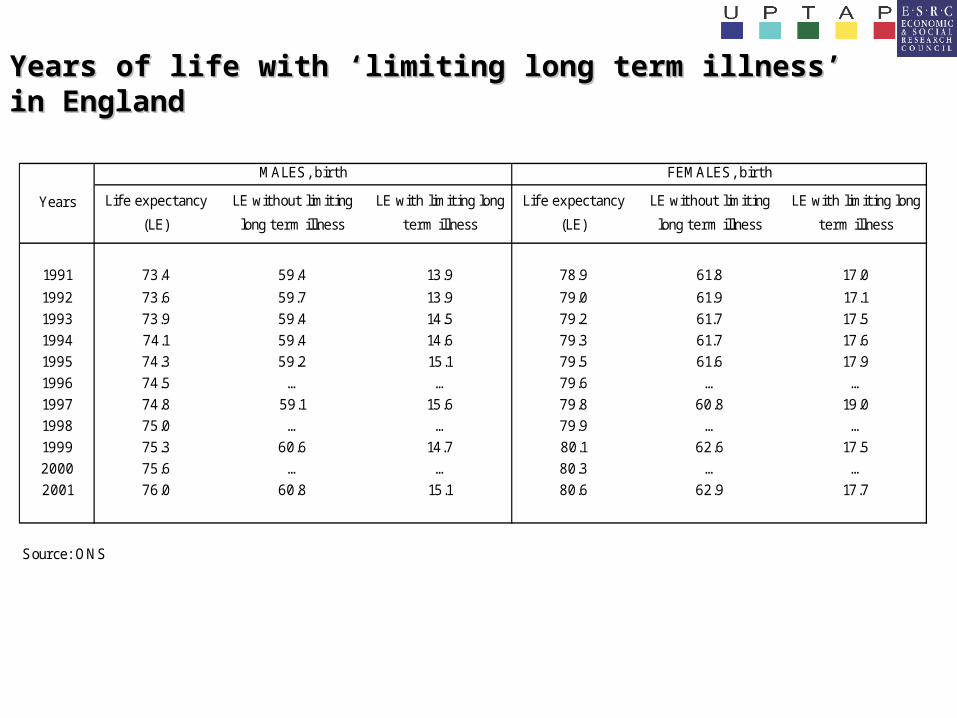
MethodologyMethodology
The diseases affecting a change in life expectancy with The diseases affecting a change in life expectancy with
disease can be identified using decomposition methods (e.g. disease can be identified using decomposition methods (e.g.
Sullivan 1971, Nussleder & Looman 2004Sullivan 1971, Nussleder & Looman 2004) )
Life expectancy with disease is computed by using mortality Life expectancy with disease is computed by using mortality
and disease data as followsand disease data as follows
LE with disease = total LE * disease LE with disease = total LE * disease
prevalenceprevalence
Changes over time can be decomposed by separating Changes over time can be decomposed by separating
mortality and disease effectsmortality and disease effects
Decomposition Decomposition (Arriaga 1989, Nussleder & Looman 2004(Arriaga 1989, Nussleder & Looman 2004) ) Let us suppose that life expectancy with disease has Let us suppose that life expectancy with disease has
changed between time changed between time tt and time and time t+nt+n
The change is attributable to a change in the number of The change is attributable to a change in the number of
person-years with disease (Lperson-years with disease (Ldisdis) which can be decomposed ) which can be decomposed
as followsas follows
t
Life
nt
Life
t
Dis
nt
Dist
Dis
nt
Dis
t
life
nt
lifeDis LL*
2*
2
LLL
Where the difference between the Where the difference between the DisDis depends on the depends on the
change of thechange of the prevalence ofprevalence of each cause of disease, and the each cause of disease, and the
difference betweendifference between the L the LLifeLife depends on the change of each depends on the change of each
cause of deathcause of death
Previous work on decompositionPrevious work on decomposition
The method was applied on Dutch data to explain the The method was applied on Dutch data to explain the
difference between the sexes in the period 1990-1994 difference between the sexes in the period 1990-1994
(Nussleder & Looman 2004)(Nussleder & Looman 2004)
The research indicated that the higher life expectancy with The research indicated that the higher life expectancy with
LLT illness among the women was mostly attributable to LLT illness among the women was mostly attributable to
arthritis.arthritis.
This required the identification of exclusive diseases This required the identification of exclusive diseases
conditions (i.e. they could not have more than one disease)conditions (i.e. they could not have more than one disease)

ObjectivesObjectives
Decompose the differences over time and between the Decompose the differences over time and between the
sexes in the life expectancy with disease by applying the sexes in the life expectancy with disease by applying the
Nussleder & Looman method (2004)Nussleder & Looman method (2004)
Three types of life expectancy with diseaseThree types of life expectancy with disease
life expectancy with limiting long-term life expectancy with limiting long-term
illnessillness life expectancy with long-term illness life expectancy with long-term illness life expectancy with any diseaselife expectancy with any disease
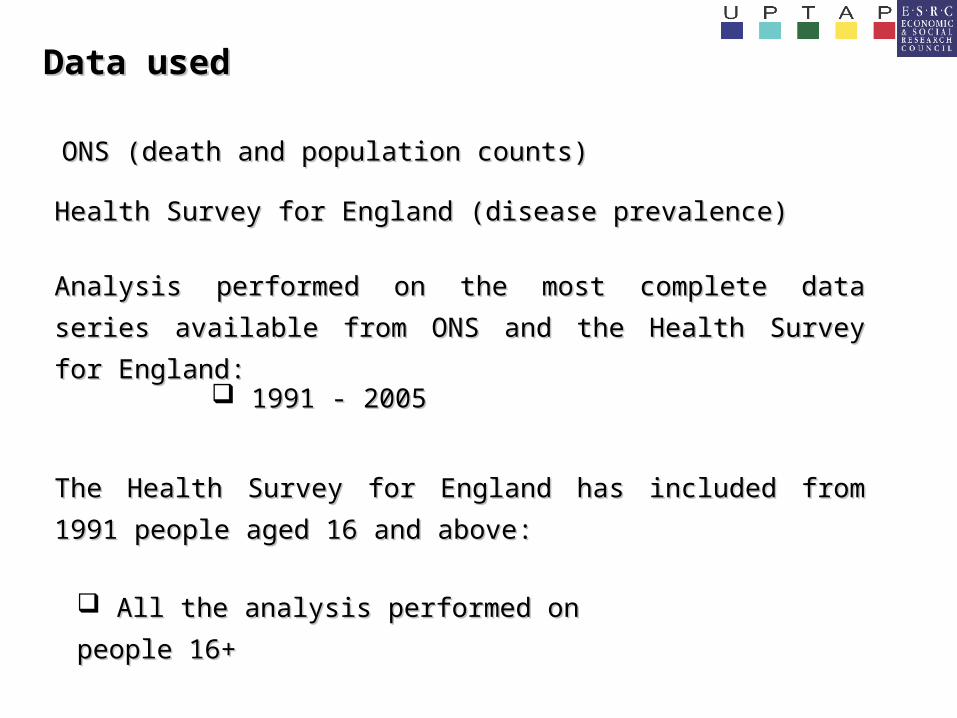
Data usedData used
ONS (death and population counts)ONS (death and population counts)
Health Survey for England (disease prevalence)Health Survey for England (disease prevalence)
Analysis performed on the most complete data series Analysis performed on the most complete data series
available from ONS and the Health Survey for England:available from ONS and the Health Survey for England:
1991 - 20051991 - 2005
The Health Survey for England has included from 1991 The Health Survey for England has included from 1991
people aged 16 and above:people aged 16 and above:
All the analysis performed on people All the analysis performed on people
16+16+

Analysis of mortality dataAnalysis of mortality data
Compute period life tables for each sex consistently with GAD using Compute period life tables for each sex consistently with GAD using
3 years data 3 years data
Code specific causes of death consistently through ICD IX Code specific causes of death consistently through ICD IX
and ICD X and ICD X
Aggregate specific causes of death in categories (e.g. neoplasm) Aggregate specific causes of death in categories (e.g. neoplasm)
Compute mortality rates for each category of cause of death Compute mortality rates for each category of cause of death
by age band and sex by age band and sex
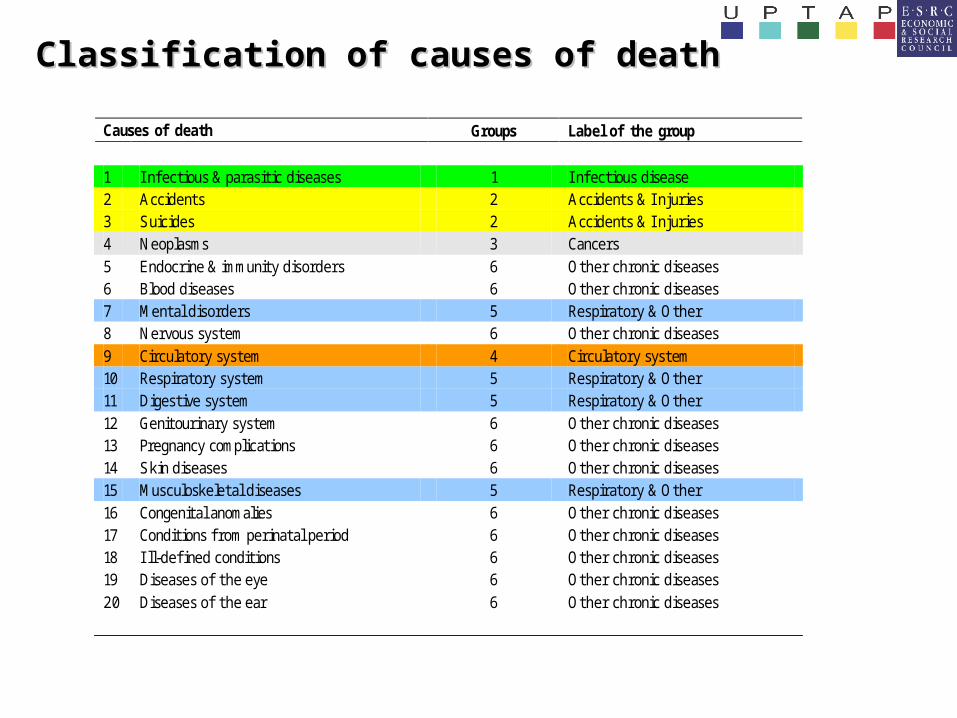
Classification of causes of deathClassification of causes of death
Causes of death Groups Label of the group 1 I nfectious & parasitic diseases 1 I nfectious disease 2 Accidents 2 Accidents & I njuries 3 Suicides 2 Accidents & I njuries 4 Neoplasms 3 Cancers 5 Endocrine & immunity disorders 6 Other chronic diseases 6 Blood diseases 6 Other chronic diseases 7 Mental disorders 5 Respiratory & Other 8 Nervous system 6 Other chronic diseases 9 Circulatory system 4 Circulatory system 10 Respiratory system 5 Respiratory & Other 11 Digestive system 5 Respiratory & Other 12 Genitourinary system 6 Other chronic diseases 13 Pregnancy complications 6 Other chronic diseases 14 Skin diseases 6 Other chronic diseases 15 Musculoskeletal diseases 5 Respiratory & Other 16 Congenital anomalies 6 Other chronic diseases 17 Conditions f rom perinatal period 6 Other chronic diseases 18 I ll-defi ned conditions 6 Other chronic diseases 19 Diseases of the eye 6 Other chronic diseases 20 Diseases of the ear 6 Other chronic diseases

Mortality rates by cause (Males)Mortality rates by cause (Males)
0
25
50
75
100
125
150
175
200
225
250
275
300
325
350
375
400
1992 1993 1994 1995 1996 1997 1998 1999 2000 2001 2002 2003 2004
Years
Accidents Cardiovascular
I nfections Neoplasm
Respiratory Chronic
Mortality rate per 1,000, Age 16+

Mortality rates by cause (Females)Mortality rates by cause (Females)
0
25
50
75
100
125
150
175
200
225
250
275
300
1992 1993 1994 1995 1996 1997 1998 1999 2000 2001 2002 2003 2004
Years
Accidents Cardiovascular
I nfections Neoplasm
Respiratory Chronic
Mortality rate per 1,000, Age 16+

Health Survey for EnglandHealth Survey for England
Measure the prevalence of different disease seriousness:Measure the prevalence of different disease seriousness:
prevalence of diseases (from 1991) prevalence of diseases (from 1991) prevalence of long-term illness (from 1991) prevalence of long-term illness (from 1991) prevalence of limiting long-term illness (from prevalence of limiting long-term illness (from
1997)1997)
Identify the diseases based on survey questionsIdentify the diseases based on survey questions
Compute exclusive disease categories for each year of Compute exclusive disease categories for each year of
survey for each person in the surveysurvey for each person in the survey

Information collected in different years (HSE 1991-2005)Information collected in different years (HSE 1991-2005)
Questions 1991 1992 1993 1994 1995 1996 1997 1998 1999 2000 2001 2002 2003 2004 2005 LT illness List of illnesses if LT illness is present
LLT illness Taking medicine for 1) Cardiovascular diseases 2) Digestive diseases 3) Respiratory diseases 4) Nervous system diseases 5) I nfections 6) Endocrine diseases 7) Genitourinary diseases 8) Neoplasm 9) Blood diseases 10) Musculoskeletal diseases 11) Eye/Ear diseases 12) Skin diseases Cardiovascular diseases Blood pressure Diabetes Asthma Bladder

Disease categories analysed (A)Disease categories analysed (A)
Number of diseases Disease categories
One Two Three Four Five
Cardiovascular diseases I nfections Neoplasm Respiratory Diseases & Other Chronic Diseases
Cardiovascular & Respiratory
Cardiovascular & Chronic
Cardiovascular & Neoplasm
Cardiovascular & I nfections
Respiratory & Chronic
Respiratory & Neoplasm
Respiratory & I nfections
Chronic & Neoplasm
Chronic & I nfections
Neoplasm & I nfections

Disease categories analysed (B)Disease categories analysed (B)
Number of diseases Disease categories
One Two Three Four Five
Cardiovascular & Respiratory & Chronic
Cardiovascular & Respiratory & Neoplasm
Cardiovascular & Respiratory & I nfections
Respiratory & Chronic & Neoplasm
Respiratory & Chronic & I nfections
Respiratory & Neoplasm & I nfections
Cardiovascular & Chronic & Neoplasm
Cardiovascular & Chronic & I nfections
Chronic & Neoplasm & I nfections
Cardiovascular & Respiratory & Chronic & Neoplasm
Cardiovascular & Respiratory & Chronic & I nfections
Cardiovascular & Respiratory & Neoplasm & I nfections
Cardiovascular & Chronic & Neoplasm & I nfections
Respiratory & Chronic & Neoplasm & I nfections
Cardiovascular & Resp. & Chronic & I nfections & Neoplasm

Prevalence of diseases by %Prevalence of diseases by %
Disease categories, Males Life expectancy
with disease(s)
Life expectancy
with LT illness
Life expectancy
with LLT illness
Cardiovascular diseases 16.0 15.1 9.8
I nfections 1.4 0.3 0.2
Neoplasm 1.0 1.1 1.0
Respiratory diseases 34.6 37.4 36.7
One disease
Chronic diseases 17.8 16.2 11.7
Cardiovascular & respiratory
diseases 7.7 8.3 11.3
Cardiovascular & chronic
diseases 5.8 5.7 5.9
Two diseases
Respiratory & chronic diseases 8.3 8.7 12.2
Three diseases Cardiovascular, respiratory &
chronic diseases 4.5 4.5 7.5
Two diseases
or more Other categories of diseases
3.0 2.7 3.6
Total 100.0 100.0 100.0
any disease LT illness LTLImales

101112131415161718192021222324252627282930313233
1992 1993 1994 1995 1996 1997 1998 1999 2000 2001 2002 2003 2004
Years
LE with disease LE with LT illness LE with LLT illness
Years of life with diseases Males, age 16
Results: Life expectancy with disease(s), Results: Life expectancy with disease(s), LT illness & LLT illness (Males)LT illness & LLT illness (Males)
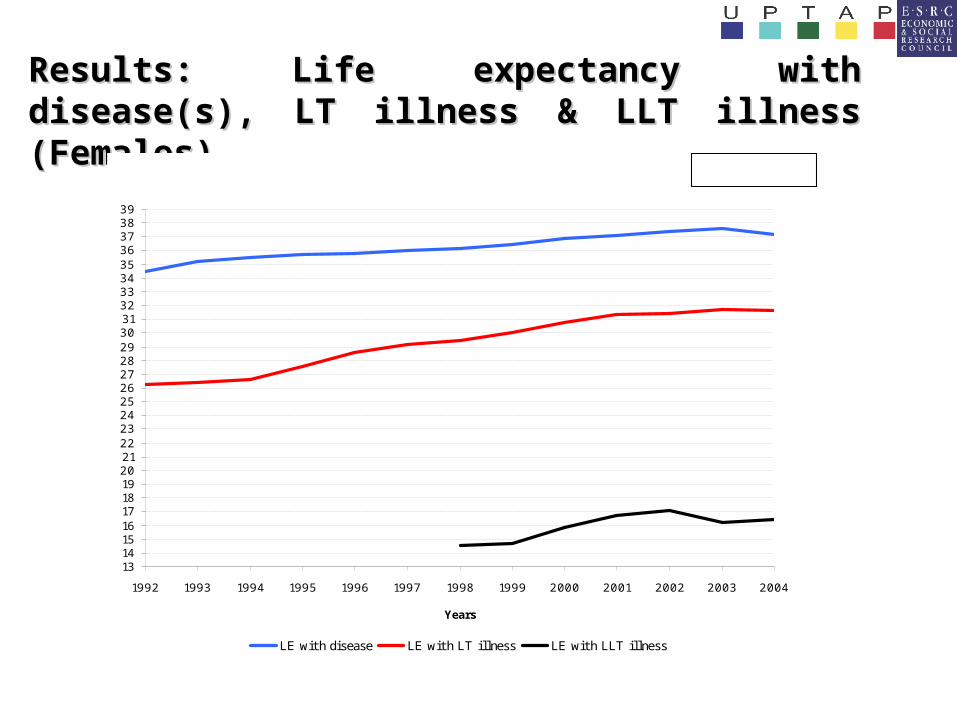
Results: Life expectancy with disease(s), Results: Life expectancy with disease(s), LT illness & LLT illness (Females)LT illness & LLT illness (Females)
131415161718192021222324252627282930313233343536373839
1992 1993 1994 1995 1996 1997 1998 1999 2000 2001 2002 2003 2004
Years
LE with disease LE with LT illness LE with LLT illness
Years of life with diseases Females, age 16

Life Expectancy with disease(s)Life Expectancy with disease(s)
Males Females Life expectancy at age 16
1991- 93 2003- 05 1991- 93 2003- 05
Lif e expectancy 58.4 61.5 63.7 65.7
Lif e expectancy with disease(s) 26.7 31.9 34.5 37.2
Lif e expectancy without disease(s) 31.7 29.6 29.2 28.5
Disease/ LE (%) 45.7 51.9 54.2 56.6
No disease/ LE (%) 54.3 48.1 45.8 43.4
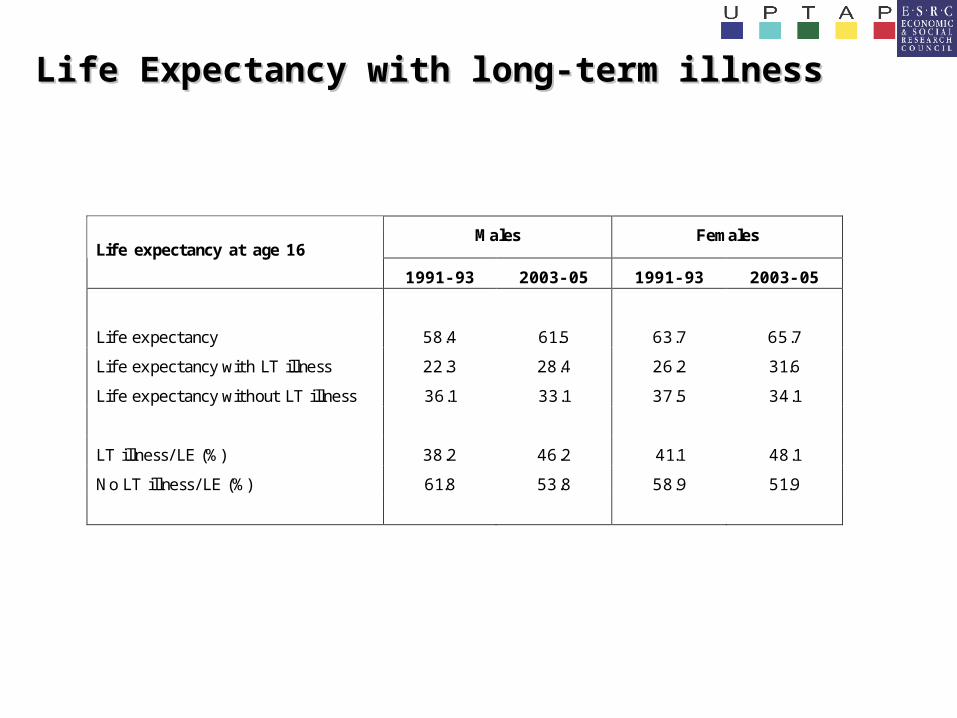
Life Expectancy with long-term illnessLife Expectancy with long-term illness
Males Females Life expectancy at age 16
1991- 93 2003- 05 1991- 93 2003- 05
Lif e expectancy 58.4 61.5 63.7 65.7
Lif e expectancy with LT illness 22.3 28.4 26.2 31.6
Lif e expectancy without LT illness 36.1 33.1 37.5 34.1
LT illness/ LE (%) 38.2 46.2 41.1 48.1
No LT illness/ LE (%) 61.8 53.8 58.9 51.9
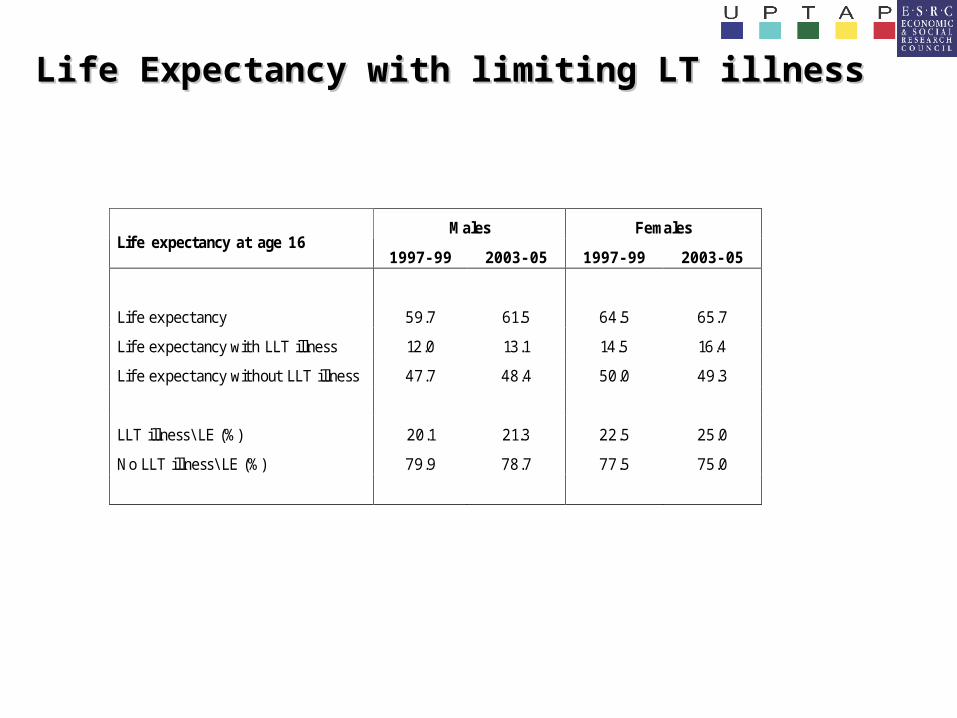
Life Expectancy with limiting LT illnessLife Expectancy with limiting LT illness
Males Females Life expectancy at age 16
1997- 99 2003- 05 1997- 99 2003- 05
Lif e expectancy 59.7 61.5 64.5 65.7
Life expectancy with LLT illness 12.0 13.1 14.5 16.4
Life expectancy without LLT illness 47.7 48.4 50.0 49.3
LLT illness\ LE (%) 20.1 21.3 22.5 25.0
No LLT illness\ LE (%) 79.9 78.7 77.5 75.0

Emerging conclusions (Males, age 16)Emerging conclusions (Males, age 16)
Between 1992 and 2004 the total life expectancy has Between 1992 and 2004 the total life expectancy has
increased by 3.1 yearsincreased by 3.1 years
In the same period the life expectancy with any disease In the same period the life expectancy with any disease
has increased by 5.2 years and the life expectancy with has increased by 5.2 years and the life expectancy with
long-term illness by 6.1 yearslong-term illness by 6.1 years
The life expectancy with limiting long-term illness has The life expectancy with limiting long-term illness has
increased by 1.1 years between 1998 and 2004increased by 1.1 years between 1998 and 2004
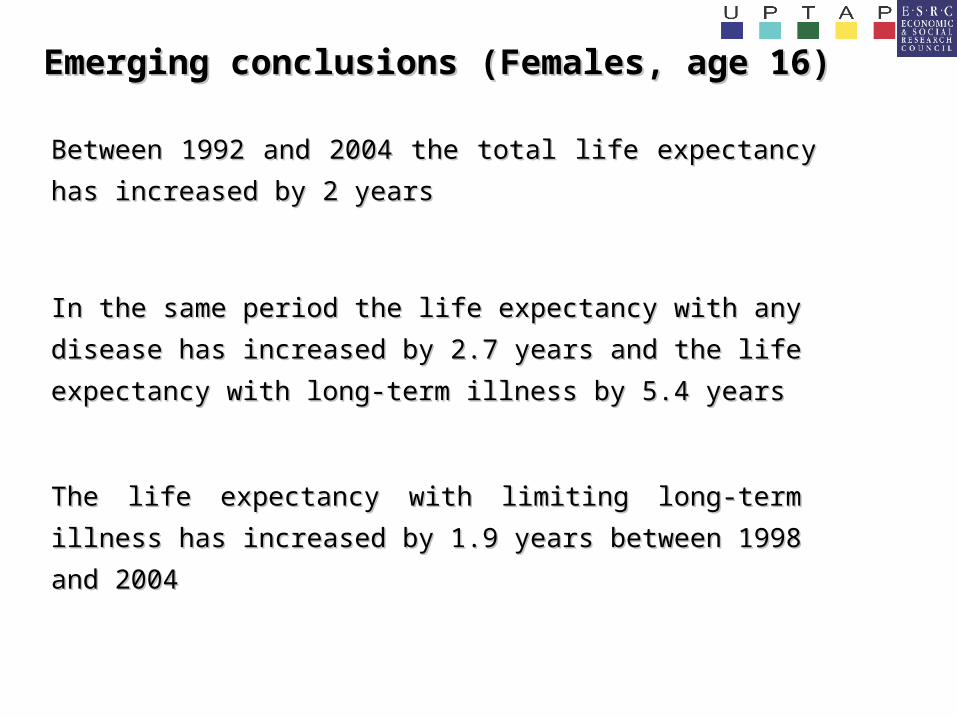
Emerging conclusions (Females, age 16)Emerging conclusions (Females, age 16)
Between 1992 and 2004 the total life expectancy has Between 1992 and 2004 the total life expectancy has
increased by 2 yearsincreased by 2 years
In the same period the life expectancy with any disease In the same period the life expectancy with any disease
has increased by 2.7 years and the life expectancy with has increased by 2.7 years and the life expectancy with
long-term illness by 5.4 yearslong-term illness by 5.4 years
The life expectancy with limiting long-term illness has The life expectancy with limiting long-term illness has
increased by 1.9 years between 1998 and 2004increased by 1.9 years between 1998 and 2004

Emerging conclusions (Co-morbidity)Emerging conclusions (Co-morbidity)
Between 1992 and 2004, out of 100 men with any Between 1992 and 2004, out of 100 men with any
disease or a long-term illness 29 have a co-morbidity disease or a long-term illness 29 have a co-morbidity
condition condition
Out of 100 men with a limiting long-term illness, 40 Out of 100 men with a limiting long-term illness, 40
have a co-morbidity condition have a co-morbidity condition
Out of 100 women with any disease or a long-term Out of 100 women with any disease or a long-term
illness, 32 have a co-morbidity condition illness, 32 have a co-morbidity condition
Out of 100 women with a limiting long-term illness, 44 Out of 100 women with a limiting long-term illness, 44
have a co-morbidity condition have a co-morbidity condition
Related Documents