A CRITICAL EVALUATION OF OPERATIONAL EFFICIENCY OF SUPPLY CHAIN MANAGEMENT OF BIOMASS AS FEED STOCK TO THE POWER PRODUCERS IN RAJASTHAN (WITH SPECIAL REFERENCE TO KOTA) A Thesis Submitted for the Award of Ph. D. Degree In Business Administration (Faculty of Commerce and Management) To the UNIVERSITY OF KOTA By Garima Jain Under the Supervision of Prof. Rajeev Jain Department of Commerce and Management UNIVERSITY OF KOTA, KOTA (RAJ.) 2020

Welcome message from author
This document is posted to help you gain knowledge. Please leave a comment to let me know what you think about it! Share it to your friends and learn new things together.
Transcript

A CRITICAL EVALUATION OF OPERATIONAL
EFFICIENCY OF SUPPLY CHAIN MANAGEMENT OF
BIOMASS AS FEED STOCK TO THE POWER
PRODUCERS IN RAJASTHAN (WITH SPECIAL
REFERENCE TO KOTA)
A Thesis
Submitted for the Award of Ph. D. Degree
In Business Administration
(Faculty of Commerce and Management)
To the
UNIVERSITY OF KOTA
By
Garima Jain
Under the Supervision of
Prof. Rajeev Jain
Department of Commerce and Management
UNIVERSITY OF KOTA, KOTA (RAJ.)
2020

i
CERTIFICATE
I feel great pleasure in certifying that the thesis entitled “A CRITICAL
EVALUATION OF OPERATIONAL EFFICIENCY OF SUPPLY CHAIN
MANAGEMENT OF BIOMASS AS FEED STOCK TO THE POWER
PRODUCERS IN RAJASTHAN (WITH SPECIAL REFERENCE TO KOTA)” By
Garima Jain under my guidance. She has completed the following requirements as per
Ph.D. regulations of the University:
(a) Course work as per the University rules.
(b) Residential requirements prescribed by the University.(200 days)
(c) Regularly submitted annual progress report.
(d) Presented her work in the department committee.
(e) Published research papers in a referred research journal.
I recommend the submission of the thesis.
Date: Prof. Rajeev Jain
Place: Kota (Research Supervisor)

ii
ANTI-PLAGIARISM CERTIFICATE
It is certified that Ph.D. Thesis Titled “A CRITICAL EVALUATION OF
OPERATIONAL EFFICIENCY OF SUPPLY CHAIN MANAGEMENT OF
BIOMASS AS FEED STOCK TO THE POWER PRODUCERS IN RAJASTHAN
(WITH SPECIAL REFERENCE TO KOTA)” By Garima Jain has been examined
by us with the following anti-plagiarism tools. We undertake the follows:
a. Thesis has significant new work/knowledge as compared already published or are under
consideration to be published elsewhere. No sentence, equation, diagram, table,
paragraph or section has been copied verbatim from previous work unless it is placed
under quotation marks and duly referenced.
b. The work presented is original and own work of the author (i.e. there is no plagiarism).
No ideas, processes, results or words of others have been presented as author‘s own
work.
c. There is no fabrication of data or results which have been compiled and analyzed.
d. There is no falsification by manipulating research material, equipment or processes, or
changing or omitting data or results such that the research is not accurately presented in
the research record.
e. The thesis has been checked using URKUND Software and found within limits as per
HEC plagiarism policy and instructions issued from time to time.
Garima Jain Prof. Rajeev Jain
(Research Scholar) (Research supervisor)
Date: Date:
Place: Kota Place:

iii
ABSTRACT
The present research is intended to study and evaluate the problems and challenges
faced by the farmers, middlemen, and the employees who are the main stakeholders of
the biomass supply chain. The primary aim of this research is to estimate the cost of
procuring biomass feed stock and to analyze the loss of calorific value in various stages
of supply chain (harvesting, storing, handling and transportation) so that power stations
will get biomass fuel of right specification, in the right amount, at the right time from
resources which are typically diverse and are seasonally dependent.
The study will give an insightful analysis of how to help the present and the upcoming
power generating companies with regard to the type of mix (biomass and coal) they
should use in the form of feedstock for the generation of power.
Biomass – the fourth largest energy source after coal, oil and natural gas is the most
important renewable energy option at present and can be used to produce different forms
of energy. As a result, together with the other renewable energy options, it is capable of
giving all the energy services required in a present-day society, both locally and
globally. The supply of sustainable energy is one of the main challenges that mankind
will face over the coming decades. Biomass can make a substantial contribution in
supplying future energy demand in a sustainable way as it is a versatile and renewable
source. The present study shows that the use of biomass must be increased all around
the world and the husk and waste of plants should be used efficiently to make the
environment pollution and carbon free.

iv
CANDIDATE’S DECLARATION
I hereby, certify that the work which is being presented in the thesis entitled “A
CRITICAL EVALUATION OF OPERATIONAL EFFICIENCY OF SUPPLY
CHAIN MANAGEMENT OF BIOMASS AS FEED STOCK TO THE POWER
PRODUCERS IN RAJASTHAN (WITH SPECIAL REFERENCE TO KOTA)” for
the partial fulfillment of the requirement for the award of the Degree of Doctor of
Philosophy, carried out under the supervision of Prof. Rajeev Jain submitted to the
Department of Commerce and Management, University of Kota, Kota represents my
ideas in my own words and where other ideas or words have been included, I have
adequately cited and referenced the original sources. The work presented in this thesis
has not been submitted elsewhere for the award of any other degree or diploma from any
institution.
I also declare that I have adhered to all principles of academic honesty and integrity and
have not misrepresented or fabricated or falsified any idea/data/fact/source in my
submission. I understand that any violation of the above will cause for disciplinary
action by the University and can also evoke penal action from the sources which have
not been properly cited or from whom proper permission has not been taken as needed.
Date: Garima Jain
Place: Kota
This is to certify that the above statements made by Garima Jain (Registration
No.RS/259/13) is correct to the best of my knowledge.
Date: Prof. Rajeev Jain
Place: (Research Supervisor)

v
ACKNOWLEDGEMENT
I express my deep sense of gratitude to my supervisor Prof. Rajeev Jain, Dean and
Chairman, Faculty of Management, JECRC University, Jaipur (former Dean and Head
department of Commerce and Management, University of Kota) whose incessant
guidance and valuable suggestions helped me to fulfill this research work. I am very
thankful to him for his continuous support, patience, motivation, enthusiasm and
immense knowledge.
Nobody has been more important to me in the pursuit of this research than my family,
friends and my colleagues.
I thank my Father-in-law late Shri Dr. R. K. Jain who motivated and guided me day by
day to complete my work, though it was lacking on my part. I wish my father-in-law
would have lived few more years to see me completing my doctoral studies. I thank my
mother-in-law Mrs. Chitra Jain for her continuous support and help. I also thank both
my parents Dr. G.C Jain and Mrs. Asha Jain. It was their continuous push;
encouragement and motivation that made me complete my thesis.
This research work would not have been possible without the unwavering support of my
husband Er. Ashish Jain his moral support, encouraging assistance, paramount
eagerness, his technical knowledge during my work and understanding throughout the
years of research, made it possible for me to complete my work. I am also thankful to
both my son Pulkit and my daughter Paridhi. Their patience and knowledge forced me
to continuously work on my research and come out of it with full enthusiasm and hope.
Further, I would like to thank the management and employees of the selected Biomass
units for their cooperation in helping me provide the required information and who
supported and convinced me to make this research work and its data collection possible.

vi
Finally, I would like to thank all the people who have knowingly and unknowingly
helped me in completing this study. I owe it to Almighty God for granting me the
wisdom, health and strength to undertake this research task and enabling me in the
completion of work.
Garima Jain

vii
TABLE OF CONTENTS
S. No. Title Page No.
Certificate i
Anti-plagiarism certificate ii
Abstract iii
Candidate‘s declaration iv
Acknowledgement v
Table of Contents vii
List of Tables ix
List of Figures and Graphs xii
Abbreviations xiii
Chap 1 An Overview of Biomass Power Generation and its
Supply Chain Management
1-44
1.1 Introduction 2
1.2 Sources of Biomass 3
1.3 Global scenario of biomass 5
1.4 Overview of biomass power sector in India 7
1.5 Overview of Biomass in Rajasthan 15
1.6 Overview of Biomass in Kota 20
1.7 Biomass potential 26
1.8 Biomass fuel and its properties 30
1.9 Biomass based power generation 34
1.10 Supply chain of Biomass 37
References 43
Chap 2 Review of Literature 45-79
2.1 Introduction 46
2.2 Research related to Biomass for Bioenergy and Biofuel 46
2.3 Papers related to Biomass Power Generation 58
2.4 Literature related to supply chain management of Biomass 65
viii
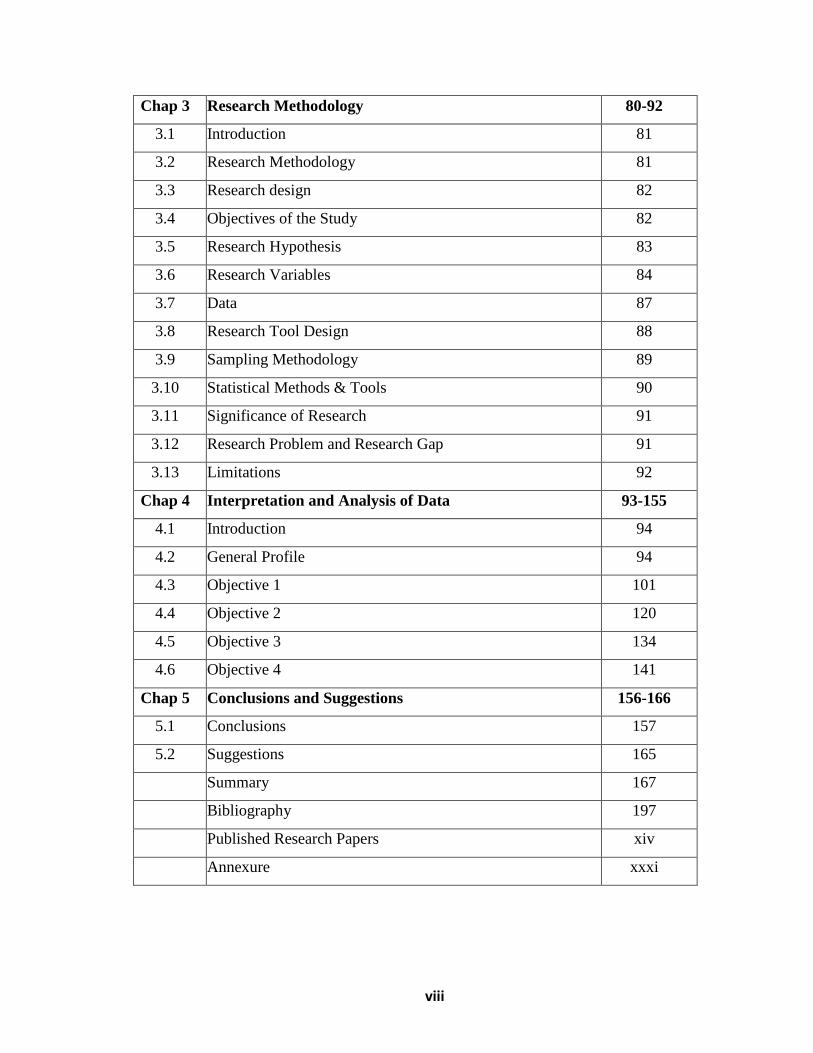
Chap 3 Research Methodology 80-92
3.1 Introduction 81
3.2 Research Methodology 81
3.3 Research design 82
3.4 Objectives of the Study 82
3.5 Research Hypothesis 83
3.6 Research Variables 84
3.7 Data 87
3.8 Research Tool Design 88
3.9 Sampling Methodology 89
3.10 Statistical Methods & Tools 90
3.11 Significance of Research 91
3.12 Research Problem and Research Gap 91
3.13 Limitations 92
Chap 4 Interpretation and Analysis of Data 93-155
4.1 Introduction 94
4.2 General Profile 94
4.3 Objective 1 101
4.4 Objective 2 120
4.5 Objective 3 134
4.6 Objective 4 141
Chap 5 Conclusions and Suggestions 156-166
5.1 Conclusions 157
5.2 Suggestions 165
Summary 167
Bibliography 197
Published Research Papers xiv
Annexure xxxi

ix
LIST OF TABLES
Table No. Title Page No.
1.1 Sectorwise categorization of grid based & off grid based
biomass power plants
10
1.2 State wise biomass power and cogeneration projects with
capacity in MW
11
1.3 Estimated state wise Biomass generation, biomass surplus
and power potential of Agro residues and forest &
wasteland residues
13
1.4 District wise Generation, Consumption and Surplus
amount of biomass in Rajasthan
16
1.5 Generation and Consumption pattern of Biomass in
Rajasthan in MT/year
17
1.6 Biomass Power Potential in Various Tehsils of Rajasthan 19
1.7 Biomass Generation, Consumption & Surplus in Kota 21
3.1 List of Companies 89
4.1 The prominent hardship in business of biomass 95
4.2 Type of Biomass traders 96
4.3 Locality of Biomass trader 97
4.4 Total power generation capacity of thermal unit 98
4.5 Type of Boilers 99
4.6 Type of boiler * Type of mix 100
4.7 Availability of Biomass in months 101
4.8 Challenges faced by the companies 102
4.9 Strategies adopted by the power generating companies 103
4.10 Types of Biomass vendors and Type of mix 105
4.11 Comparison of Procurement cost of biomass - Fuel mix 107
4.12 Multiple Comparisons of Procurement cost of Biomass 107
4.13 Comparison of Handling cost of biomass from storage area
to boiler feed - Fuel mix 108
4.14 Multiple Comparisons of Handling cost of Biomass 109
4.15 Total Procurement cost 110

x
4.16 Comparison of Total Procurement Cost per MT of mix
Fuel mix
110
4.17 Multiple Comparisons of Total Procurement Cost per MT
of mix
111
4.18 Comparison of Average transportation cost of Biomass /
Km / MT (in Rs.) – Supplier
112
4.19 Multiple Comparisons of Average transportation cost of
Biomass / Km / MT (in Rs.)
112
4.20 Comparison of Average storage cost of Biomass (in Rs.) –
Supplier
113
4.21 Multiple Comparisons of Average storage cost of Biomass
(in Rs.)
113
4.22 Last year consumption of Biomass (in MT) - Fuel Mix 115
4.23 Dependent Variable:Last year consumption of Biomass (in
MT)
115
4.24 Comparison of Last year quantity of Biomass trading (in
MT) - Supplier
117
4.25 Multiple Comparisons of Last year quantity of Biomass
trading (in MT)
117
4.26 Ash content of mix (%) - Fuel Mix 119
4.27 Multiple Comparisons of Ash content of mix (%) 119
4.28 Biomass mix ratio ( Coal: Biomass) in the boiler fuel 121
4.29 Technical / engineering difficulties faced in using biomass 122
4.30 Engineering changes done in the plant to facilitate the use
of biomass
123
4.31 Boiler efficiency * Type of mix 125
4.32 Thermal unit efficiency * Type of mix 127
4.33 Power generated due to biomass with respect to total
power generation in the plant * Type of mix
129
4.34 Descriptive of GCV of mix (Kcal/Kg) 130
4.35 ANOVA Tool for GCV of mix (Kcal/Kg) 131
4.36 Multiple Comparisons of GCV of mix (Kcal/Kg) 131
4.37 Descriptives of Cost per 1000 Kcal energy using Mix (Rs) 132
4.38 ANOVA Tool for Cost per 1000 Kcal energy using Mix
(Rs) 133
4.39 Multiple Comparisons of Cost per 1000 Kcal energy using
Mix (Rs) 133
4.40 Type of loss of GCV during storage 134

xi
4.41 Type of loss of GCV during storage * Type of mix 136
4.42 Type of loss of GCV during storage * Types of Biomass
vendors 138
4.43 Descriptives of GCV loss in mix (%) 139
4.44 ANOVA Tool for GCV loss in mix (%) 140
4.45 Multiple Comparisons of GCV loss in mix (%) 140
4.46 Role in biomass supply chain 142
4.47 Types of Biomass vendors 143
4.48 Mode of transporting Biomass from field / storage to the
power plant
144
4.49 Ways of storing Biomass 145
4.50 Ways of storing Biomass * Type of mix 146
4.51 Ways of storing Biomass * Types of Biomass vendors 147
4.52 Mode of transporting Biomass from field / storage to the
power plant * Role in Biomass supply chain Cross
tabulation
149
4.53 Major Problems, Challenges and Advantages faced by
Employees
150
4.54 Biomass power plants reserved area in Rajasthan 152
4.55 Major Problems, Challenges and Advantages faced by
Middlemen
154
4.56 Major Problems, Challenges and Advantages faced by
Farmers
155

xii
LIST OF FIGURES AND GRAPHS
Fig No. Title Page No.
1.1 Types of available biomass resources in India 4
1.2 Global Renewable Energy Share 6
1.3 Total installed renewable energy capacity in India (74.79
GW) as in 2018
8
1.4 The total installed power capacity mix in India 9
1.5 Map showing the biomass power plants in the state of
Rajasthan
15
1.6 Opportunities in Business related to biomass energy 27
1.7 Estimated Potential of Renewable Power in India( Source
wise) as on Mar‘17
29
1.8 Pellets of Biomass 31
1.9 Bales of Biomass 32
1.10 Biomass Briquettes 33
1.11 Supply chain of Biomass 39
1.12 Biomass supply chain in Forest area 40
1.13 Basic biomass supply chain design 42
4.1 The prominent hardship in business of biomass 95
4.2 Type of Biomass Traders 96
4.3 Locality of Biomass Traders 97
4.4 Type of Boilers 99
4.5 Challenges faced by the companies 102
4.6 Strategies adopted by the power generating companies 104
4.7 Biomass mix ratio ( Coal: Biomass) in the boiler fuel 121
4.8 Technical / engineering difficulties faced in using biomass 122
4.9 Engineering changes done in the plant to facilitate the use
of biomass
123
4.10 Boiler efficiency * Type of mix 125
4.11 Thermal unit efficiency * Type of mix 127
4.12 Power generated due to biomass with respect to total
power generation in the plant * Type of mix
129
4.13 Type of loss of GCV during storage 135
4.14 Role in biomass supply chain 142
4.15 Types of Biomass vendors 143
4.16 Ways of storing Biomass 145
4.17 Average price of biomass from the year 2006 to 2020-21 153

xiii
ABBREVIATIONS
BPG Biomass Power Generation
CDM Clean Development Mechanism
CHP Combined Heat and Power
EERE Energy Efficiency and Renewable Energy
EJ Exa Joule
GCV Gross Calorific Value
GHG Green House Gas
GW Giga watt
GWh Giga watt hour
HHV High Heating Value
IISc Indian Institute of Science
IPCC Inter-governmental Panel on Climate Change
KT/Yr Kilo Tons per year
LCA Life Cycle Assessment
LHV Lower Heating Value
MNRE Ministry of New and Renewable Energy
MT/Yr Metric tons per year
MW Megawatt
RREC Rajasthan Renewable Energy Corporation
SAR Second Assessment Report
SCM Supply Chain Management
SSCM Sustainable Supply Chain Management
TGA Thermo Gravimetric Analysis
WAB Waste Agriculture Biomass

1
CHAPTER-1
An Overview of Biomass Power
Generation and its Supply Chain
Management

2
1.1 Introduction
Biomass is biological material derived from living, organisms. It most often refers to
plants or plant-based materials which are specifically called ligno cellulosic biomass.
Biomass is defined as any organic matter that is available on a renewable or recurring
basis. It comprises of all crop residues and materials derived from plants, which include
agricultural crops and trees, wood and wood residues, grasses, aquatic plants, animal
manure, municipal residues, and other left over materials.
It is derived from numerous sources, including the by-products from the wood industry,
agricultural crops, major parts of household waste, raw material from the forest and
wood.
Industrial biomass can be grown from numerous types of plants including miscanthus,
switchgrass, hemp, corn, poplar, willow, sorgham, sugarcane, and a variety of tree
species, ranging from Eucalyptus to oil palm (palm oil). The particular plant used is
usually not important for the end results, but it does affect the processing of the raw
material.
Biomass does not add carbon dioxide to the atmosphere as it absorbs the same amount
of carbon in growing as it releases when consumed as a fuel. One of the major
advantages of biomass is that it can be used to generate electricity with the same
equipment or power plants that are now burning fossil fuels. Biomass is an important
source of energy and the most important fuel all over the world after coal, oil and
natural gas.
As an energy source, biomass can either be used directly via combustion to produce
heat, or indirectly after converting it to various forms of biofuel. Conversion of biomass
to biofuel can be achieved by different methods which are broadly classified into:
thermal, chemical, and biochemical methods.

3
Instead of burning the loose biomass fuel directly, it is more useful to compress it into
briquettes (compressed block of coal or biomass material), bales and pellets thereby
increase its usefulness and convenience of use. Such biomass in the dense briquetted
form can either be used directly as fuel instead of coal in the traditional chulhas and
furnaces or in the gasifier. Gasifier converts solid fuel into a more convenient-to-use
gaseous form of fuel called producer gas, a combustible gas consisting of carbon
monoxide, hydrogen, and traces of methane. This gas mixture can provide fuel for
various essential processes, such as internal combustion engines, as well as a substitute
for furnace oil in direct heat applications.
1.2 Sources of Biomass
India being agriculture based country so biomass availability is not a problem in Indian
villages. The third largest renewable energy resource for electrical generation is
biomass.
Till date for biomass energy wood is the best source examples include forest residues
(such as dead trees, branches and tree stumps), yard clippings, wood chips and even
municipal solid waste. Therefore it means, biomass also includes plant or animal matter
that can be converted into fibers or biofuels etc.
Plant energy is produced by crops specifically grown for use as fuel that offer high
biomass output per hectare with low input energy. Some examples of these plants are
wheat, which yields 7.5–8 tons of grain per hectare and it yields 3.5–5 tons of straw per
hectare in the UK. The grain can be used for liquid transportation fuels while the straw
can be burned to produce heat or electricity. Plant biomass can also be degraded from
cellulose to glucose through a series of chemical treatments, and the resulting sugar can
then be used as a first generation biofuel. The figure below shows the various available
resources of biomass in India.

4
Figure 1.1: Types of available biomass resources in India
Source:https://www.sciencedirect.com/science/article/abs/pii/S1364032115000957

5
1.3 Global scenario of biomass
Biomass – the fourth largest energy source after coal, oil and natural gas is the most
important renewable energy option at present and can be used to produce different forms
of energy. As a result, together with the other renewable energy options, it is capable of
giving all the energy services required in a present-day society, both locally and
globally. The other significant characteristics of biomass are its renewability and
versatility. Moreover, compared to other renewables, biomass resources are quite
common and widespread across the globe.
As of now, the measure of land used for developing vitality crops for biomass powers is
just 0.19% of the world's complete land zone and just 0.5-1.7% of worldwide
horticultural land. Despite the fact that the enormous capability of algae growth as an
asset of biomass for vitality isn't considered over in this report, there are results that
show that algae growth can, on a basic level, be utilized as a sustainable power source.
Biomass is presently the largest global contributor of renewable energy, and has
considerable potential to expand in the production of heat, electricity, and fuels for
transport.
The supply of sustainable energy is one of the main challenges that mankind will face
over the coming decades. Biomass can make a substantial contribution by supplying
future energy demand in a sustainable way.
The production of biofuels as well as the introduction of power cars, has gained a lot of
attention in the recent years, many studies suggest that a far more better use of plant
material in the energy system is to produce electricity, and then to use that electricity for
a variety of purposes, including transportation.
Like hydro power, biomass can be stored, making it a dispatchable source of power.
Power generation can also be combined with heat/cooling production in (CHP) plants,
which utilize a much higher share of the energy content than stand-alone power plants.

6
Globally the production of biomass and biofuels is on the increase due to the rising
prices of fossil fuels like coal etc., growing environmental concerns and the increase in
the use of renewable energy.
18% percent of the energy consumed globally for heating, power, and transportation
came from renewable sources in 2017 as given in figure 1.2 below. Nearly 60 percent of
this came from modern renewables (i.e., biomass, geothermal, solar, hydro, wind, and
biofuels) and the remaining 7.5% from traditional biomass (used in residential heating
and cooking in developing countries).
Renewables made up 26.2 percent of global electricity generation in 2018. That‘s
expected to rise to 45 percent by 2040. Most of the increase will likely come from solar,
wind, and hydropower.
The International Energy Agency puts forward that the development and exploitation of
renewable energy technologies will depend mostly on government policies and financial
support to make renewable energy cost-competitive.
Figure 1.2: Global Renewable Energy Share
Source: Renewable Energy Policy Network
7
Biomass is an important source of energy contributing to more than 13% of the global
energy supply. About 38% of such energy is consumed in developing countries,
especially in the rural and traditional sectors of the economy.
Latest studies show that biomass energy is contributing 150-200 EJ/year by 2050, due to
which less CO2 is emitted in the environment. According to previous global energy
scenarios there is a rising trend towards the use of biofuel, at small or no additional cost,
and Latin America and Africa are becoming the large net exporters of liquid biofuels.
World energy council (WEC) projects that 62 EJ of energy will be contributed by the
developing countries in 2020. Same kind of projections are done by the International
energy agency (IEA) (1998) that biomass fuels will grow at 1.2 percent per year to 60
EJ in 2020; Lazarus et al. project 91 EJ in 2030. So the common vision is that there is a
large and increasing potential for biofuels all around the world and across the globe.
Finland, USA and Sweden in these countries the per capita biomass energy used is
higher than it is in India, China or in Asia.
1.4 Overview of biomass power sector in India
From the conventional times biomass has been a significant non fossil and carbon free
fuel for the nation, considering the advantages and promises it offers. Biomass power
projects not only provide much needed relief from power shortages in the rural areas but
these projects also generate employment in the villages and nearby areas.
Sources of power generation range from traditional sources such as coal, oil, lignite, and
natural gas to viable modern sources such as wind, solar, biomass, nuclear and hydro.
The demand for the electricity in the country is continuously rising and is expected to
grow further in the near future. In order to meet this increasing demand for electricity in
the country, immense addition to the installed generating capacity is required. There has
been a visible impact of renewable energy in the Indian economy during the last five
years. Renewable energy sector in India has experienced remarkable changes in the
policy framework during the last few years.
8
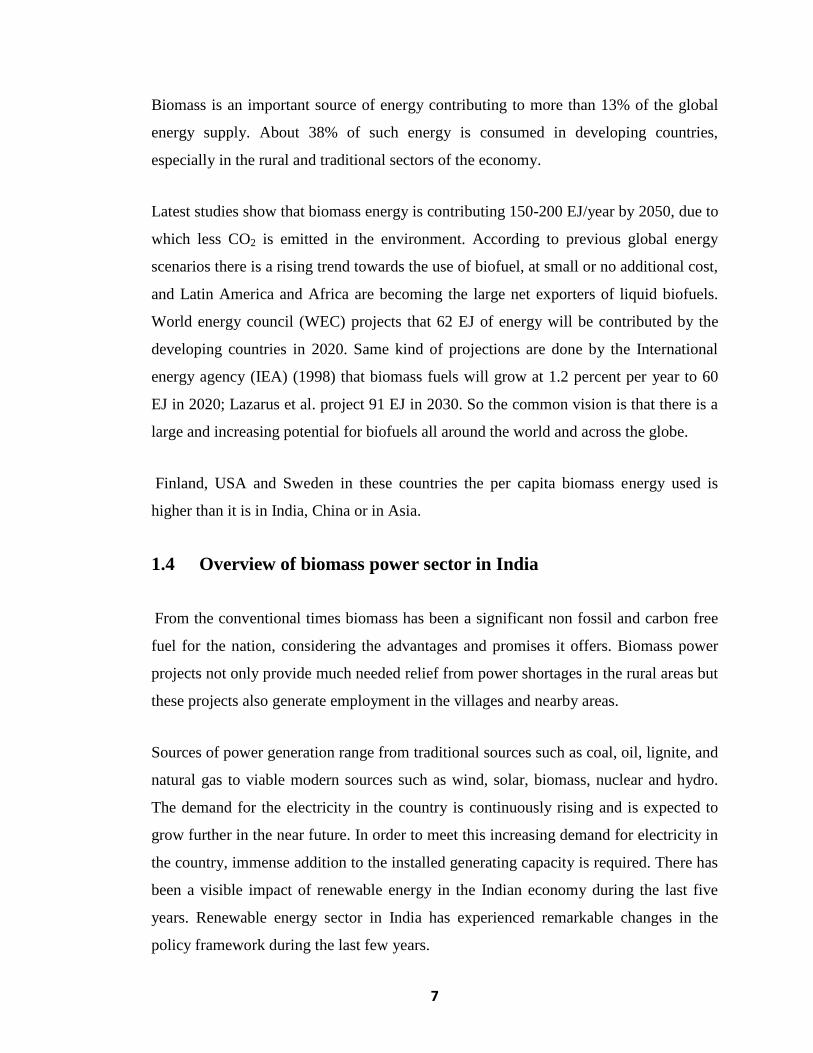
Prime Minister Narendra Modi had set striving goal for India in the year 2015 to
generate 175 Gigawatts (GW) of renewable energy by 2022. According to the most
recent data released by the Ministry of New and Renewable Energy, India has installed a
total capacity of 74.79 GW of renewable power as of December 31, 2018 as shown in
the graph below. While India has already installed around 75 GW of renewable energy
capacity, it has a long way to go if it is to meet its target of 175 GW by 2022. The
average rate at which India added renewable capacity from 2015-2016 to 2018-2019 is
9.20 GW per year. Now to add another 100 GW of energy by 2021-2022, such a task
would require a growth rate of over three times the current rate – nearly 33.40 GW per
year. The 100 GW goal out of 175 GW would be from solar power, 60 GW from
wind, 10 GW from biomass and 5 GW from small hydro power, according to the
ministry of new and renewable energy.
Figure1.3: Total installed renewable energy capacity in India (74.79 GW) as in
2018
Source: Ministry of New and Renewable Energy and Press Information Bureau, Government of India.
9
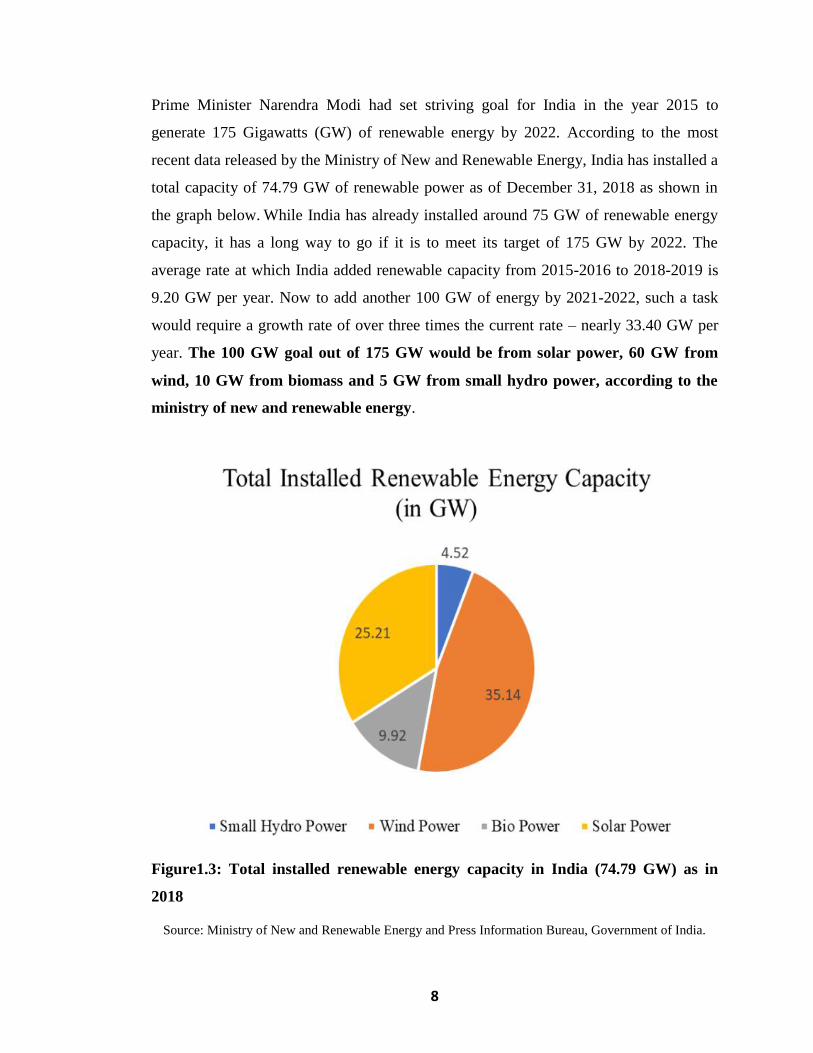
Figure 1.4: The total installed power capacity mix in India
Source:https://asian-power.com/project/exclusive/renewable-energy-jumped-16-indias-energy-mix
Renewable energy generation in India continues to grow, accounting for ~16.10 percent
of India‘s energy mix. The country‘s total installed generation capacity is 315,369.08
MW with renewables accounting for 50,745 MW of it.
The Ministry of New and Renewable Energy (MNRE), Government of India has started
a number of programs and schemes for the promotion of efficient biomass conversion
technologies, to be used in various sectors of the country as it has realized the potential
and role of biomass energy in the Indian context.

10
Table 1.1
Sectorwise categorization of grid based & off grid based biomass power plants
Programme/scheme wise physical progress
Sector Achievements (capacity in MW as on 31.03.2016)
I. Grid Interactive Power (Capacities in MW)
Biomass Power (Combustion, Gasification
and Bagasse Cogeneration)
4,831.33
Waste to Power 115.08
Sub-total Grid Interactive 4,946.41
II. Off-Grid / Captive Power (Capacities in MW)
Biomass (non bagasse) Cogeneration 651.91
Biomass Gasifiers
·Rural
·Industrial 18.15
164.24
Waste to Energy 160.16
Sub-total Off-Grid 994.46
Total Biomass Based Power 5940.87 Source: https://biomasspower.gov.in/About-us-3-Biomass%20Energy%20scenario-4.php
As can be seen in the table 1.1 above India has around 5,940 MW biomass based
power plants of which 4,946 MW are grid connected and 994 MW are off-grid
connected power plants. Major share comes from bagasse cogeneration in the total grid
connected capacity, and around 115 MW comes from waste to energy power plants. The
off-grid capacity comprises of 652 MW non bagasse co-generation, mainly as captive
power plants. For meeting electricity needs in rural areas and for thermal applications in
industries about 18 MW and 164 MW biomass gasifier systems are also being used
respectively.

11
Table 1.2
State wise biomass power and cogeneration projects with capacity in MW
State wise biomass power and cogeneration projects
State Capacity (MW)
Andhra Pradesh* 389.75
Bihar 43.42
Chhattisgarh 264.90
Gujarat 55.90
Haryana 52.30
Karnataka 737.28
Madhya Pradesh 36.00
Maharashtra 1,112.78
Odisha 20.00
Punjab 140.50
Rajasthan 111.30
Tamil Nadu 662.30
Uttarakhand 30.00
Uttar Pradesh 936.70
West Bengal 26.00
Total 4,761.00
* - Capacity includes projects of both Andhra Pradesh and Telangana
Source: MNRE Annual Report 2015-16
After analyzing the present status of State wise biomass power and cogeneration
projects it is seen that around 4761 MW of capacity is installed as per report of MNRE
annual report.

12
Biomass is an important renewable source of energy that accounts for nearly 75% of
rural energy needs, and the rural population constitutes 70% of the total population of
India. Even though biomass satisfies a main part of the total energy supplies it does not
find a suitable place in the energy balance of India if taken as a whole, probably due to
versatility and diversity of biomass sources, resulting in insufficient availability of
documented data about availability, consumption and utilization patterns.
Under the Ministry of New and Renewable Energy (MNRE), the Indian Institute of
Science (IISc) has developed an electronic atlas, which provides an outlook of the
biomass resources in the country with special reference to their potential for power
generation. The Biomass Atlas is a graphical atlas of all the states in India with
demography and land use details at state, district and taluka levels. Estimated Biomass
resource and associated power potential for the categories of agro and forest &
wasteland residues are provided in the table below.

13
Table 1.3
Estimated state wise Biomass generation, biomass surplus and power potential of
Agro residues and forest & wasteland residues
State Agro-residues Forest and wasteland residues
Biomass
Generatio
n (kT/Yr)
Biomass
Surplus
(kT/Yr)
Power
Potential
(MW)
Biomass
Generatio
n (kT/Yr)
Biomass
Surplus
(kT/Yr)
Power
Potential
(MW)
Andhra
Pradesh
24871.7 4259.4 520.8 3601.0 2435.5 341.1
Arunachal
Pradesh
400.4 74.5 9.2 8313.1 6045.4 846.3
Assam 11443.6 2436.7 283.7 3674.0 2424.4 339.4
Bihar 25756.9 5147.2 640.9 1248.3 831.9 116.3
Chhattisgarh 11272.8 2127.9 248.3 13592.3 9066.0 1269.2
Goa 668.5 161.4 20.9 180.7 119.2 16.7
Gujarat 29001.0 9058.3 1224.8 12196.3 8251.9 1150.0
Haryana 29034.7 11343.0 1456.9 393.3 259.5 36.3
Himachal
Pradesh
2896.9 1034.7 132.6 3054.6 2016.1 282.2
Jammu and
Kashmir
1591.3 279.5 37.1 11461.7 7564.6 1059.1
Jharkhand 3644.9 890.0 106.7 4876.6 3249.8 455.0
Karnataka 34167.3 9027.3 1195.9 10001.3 6601.0 924.3
Kerala 11644.3 6351.9 864.4 2122.1 1429.2 200.0
Madhya
Pradesh
33344.8 10329.2 1373.3 18398.2 12271.2 1718.0
Maharashtra 47624.8 14789.9 1983.7 18407.1 12440.1 1741.6
Manipur 909.4 114.4 14.3 1264.0 834.3 116.7
Meghalaya 61.1 91.6 11.3 1705.9 1125.7 157.5
Mizoram 511.1 8.5 1.1 1590.9 1050.1 147.0
Nagaland 492.2 85.2 10.0 843.8 556.9 77.9
Odisha 20069.5 3676.7 429.1 9370.2 6084.6 851.8
Punjab 50847.6 24843.0 3172.1 398.5 263.0 36.9
Rajasthan 29851.3 8645.6 1126.7 9541.6 6297.4 881.6
Sikkim 149.5 17.8 2.3 531.5 350.7 49.1
Tamil Nadu 22507.6 8899.9 1159.8 4652.4 3070.6 429.9
Telangana 19021.5 2697.2 342.5 1550.7 1048.9 147.0
Tripura 40.9 21.3 3.0 1035.5 683.4 95.7
Uttar Pradesh 60322.2 13753.7 1748.3 5478.4 3672.1 514.1
Uttarakhand 2903.2 638.4 81.0 4559.2 3055.5 427.8
West Bengal 35989.9 4301.5 529.2 1430.7 949.1 133.0
Total 511040.9 145105.7 18729.9 155473.9 104048.1 14561.5 Source: https://biomasspower.gov.in/biomass-info-asa-fuel-resources.php

14
Most of India‘s‘ Biomass Electricity is being produced in, Maharashtra, Karnataka,
Andhra Pradesh, Tamil Nadu, and Rajasthan. New capacity is being developed in
Punjab and Chhattisgarh as well. India with a total biomass capacity of around 1 GW
has plans to enlarge it by 10 times to 10 GW by 2020. For supporting 1 MW of Biomass
capacity around 200-600 acres of land is required which is much more than what is
required for even a small thin film of solar energy, which is approx. 10 acres. The large
land requirements make Biomass energy generation a tough task. However, it is of great
use in niche applications where huge amount of crop and animal residue/waste is
available.
15
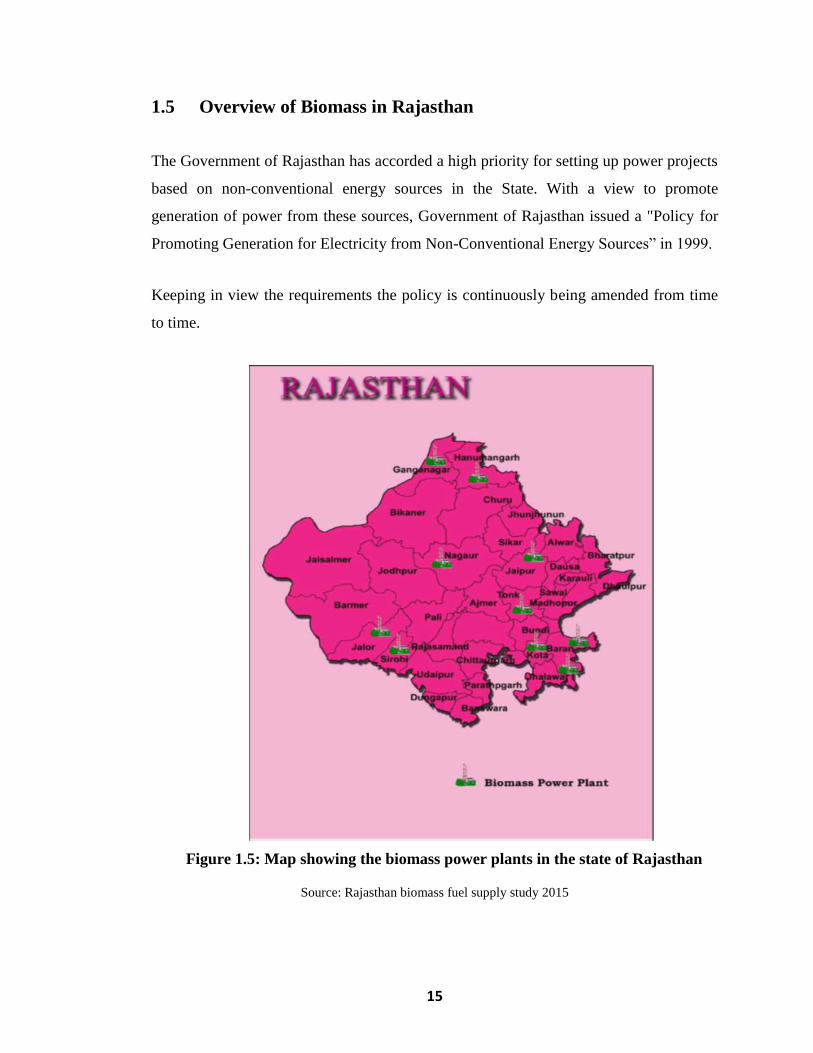
1.5 Overview of Biomass in Rajasthan
The Government of Rajasthan has accorded a high priority for setting up power projects
based on non-conventional energy sources in the State. With a view to promote
generation of power from these sources, Government of Rajasthan issued a "Policy for
Promoting Generation for Electricity from Non-Conventional Energy Sources‖ in 1999.
Keeping in view the requirements the policy is continuously being amended from time
to time.
Figure 1.5: Map showing the biomass power plants in the state of Rajasthan
Source: Rajasthan biomass fuel supply study 2015
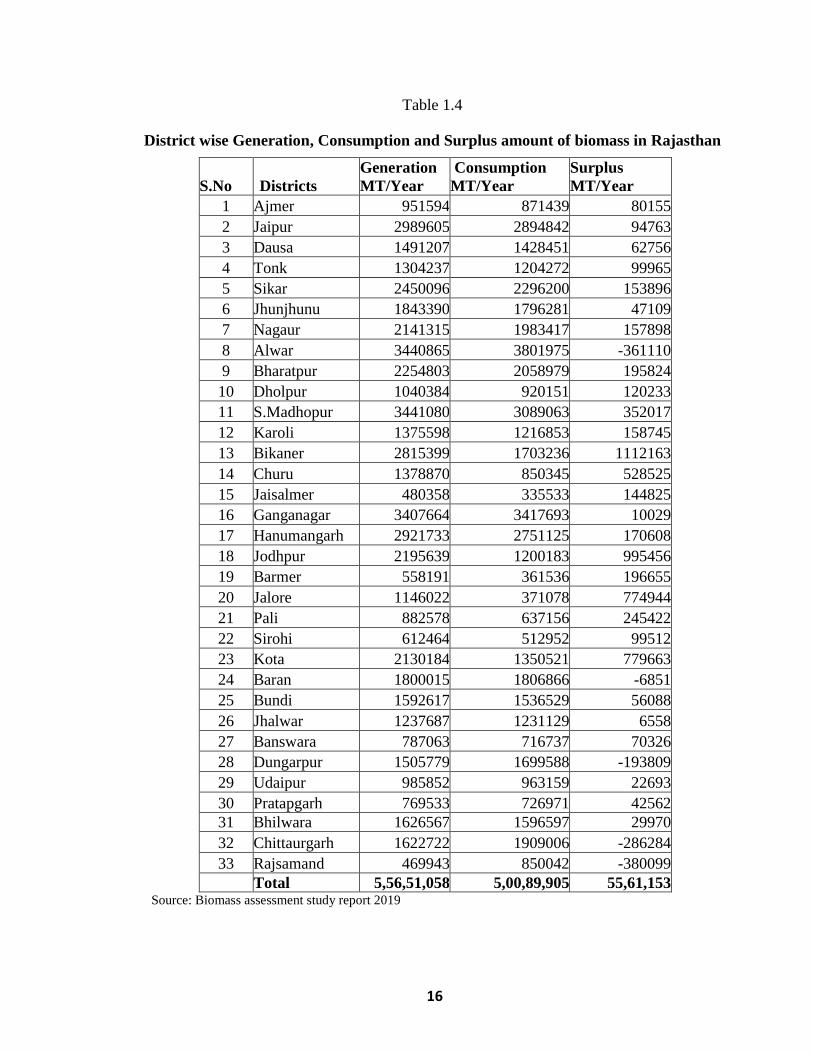
16
Table 1.4
District wise Generation, Consumption and Surplus amount of biomass in Rajasthan
S.No Districts
Generation
MT/Year
Consumption
MT/Year
Surplus
MT/Year
1 Ajmer 951594 871439 80155
2 Jaipur 2989605 2894842 94763
3 Dausa 1491207 1428451 62756
4 Tonk 1304237 1204272 99965
5 Sikar 2450096 2296200 153896
6 Jhunjhunu 1843390 1796281 47109
7 Nagaur 2141315 1983417 157898
8 Alwar 3440865 3801975 -361110
9 Bharatpur 2254803 2058979 195824
10 Dholpur 1040384 920151 120233
11 S.Madhopur 3441080 3089063 352017
12 Karoli 1375598 1216853 158745
13 Bikaner 2815399 1703236 1112163
14 Churu 1378870 850345 528525
15 Jaisalmer 480358 335533 144825
16 Ganganagar 3407664 3417693 10029
17 Hanumangarh 2921733 2751125 170608
18 Jodhpur 2195639 1200183 995456
19 Barmer 558191 361536 196655
20 Jalore 1146022 371078 774944
21 Pali 882578 637156 245422
22 Sirohi 612464 512952 99512
23 Kota 2130184 1350521 779663
24 Baran 1800015 1806866 -6851
25 Bundi 1592617 1536529 56088
26 Jhalwar 1237687 1231129 6558
27 Banswara 787063 716737 70326
28 Dungarpur 1505779 1699588 -193809
29 Udaipur 985852 963159 22693
30 Pratapgarh 769533 726971 42562
31 Bhilwara 1626567 1596597 29970
32 Chittaurgarh 1622722 1909006 -286284
33 Rajsamand 469943 850042 -380099
Total 5,56,51,058 5,00,89,905 55,61,153 Source: Biomass assessment study report 2019
17
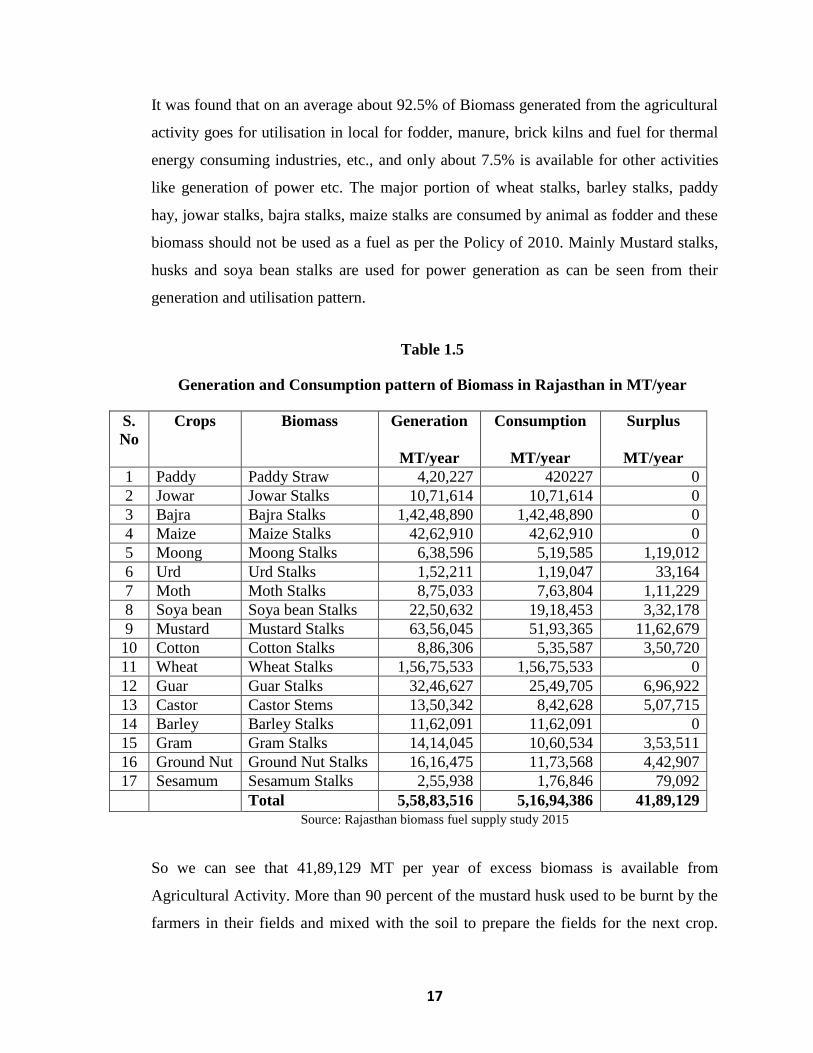
It was found that on an average about 92.5% of Biomass generated from the agricultural
activity goes for utilisation in local for fodder, manure, brick kilns and fuel for thermal
energy consuming industries, etc., and only about 7.5% is available for other activities
like generation of power etc. The major portion of wheat stalks, barley stalks, paddy
hay, jowar stalks, bajra stalks, maize stalks are consumed by animal as fodder and these
biomass should not be used as a fuel as per the Policy of 2010. Mainly Mustard stalks,
husks and soya bean stalks are used for power generation as can be seen from their
generation and utilisation pattern.
Table 1.5
Generation and Consumption pattern of Biomass in Rajasthan in MT/year
S.
No
Crops Biomass Generation
MT/year
Consumption
MT/year
Surplus
MT/year
1 Paddy Paddy Straw 4,20,227 420227 0
2 Jowar Jowar Stalks 10,71,614 10,71,614 0
3 Bajra Bajra Stalks 1,42,48,890 1,42,48,890 0
4 Maize Maize Stalks 42,62,910 42,62,910 0
5 Moong Moong Stalks 6,38,596 5,19,585 1,19,012
6 Urd Urd Stalks 1,52,211 1,19,047 33,164
7 Moth Moth Stalks 8,75,033 7,63,804 1,11,229
8 Soya bean Soya bean Stalks 22,50,632 19,18,453 3,32,178
9 Mustard Mustard Stalks 63,56,045 51,93,365 11,62,679
10 Cotton Cotton Stalks 8,86,306 5,35,587 3,50,720
11 Wheat Wheat Stalks 1,56,75,533 1,56,75,533 0
12 Guar Guar Stalks 32,46,627 25,49,705 6,96,922
13 Castor Castor Stems 13,50,342 8,42,628 5,07,715
14 Barley Barley Stalks 11,62,091 11,62,091 0
15 Gram Gram Stalks 14,14,045 10,60,534 3,53,511
16 Ground Nut Ground Nut Stalks 16,16,475 11,73,568 4,42,907
17 Sesamum Sesamum Stalks 2,55,938 1,76,846 79,092
Total 5,58,83,516 5,16,94,386 41,89,129
Source: Rajasthan biomass fuel supply study 2015
So we can see that 41,89,129 MT per year of excess biomass is available from
Agricultural Activity. More than 90 percent of the mustard husk used to be burnt by the
farmers in their fields and mixed with the soil to prepare the fields for the next crop.

18
Sometimes the farmers had to pay money to get their fields cleaned off this waste. Even
now 1.5" to 2" long stems, left in the field while manually cutting the plant, are either
ploughed or burnt and mixed with the soil and thus are not being used for better
purposes like converting it into energy or making proper manure for agricultural
purposes.
Rajasthan Government has given special emphasis on Clean Energy Development
through the setting up of the Rajasthan Renewable Energy Corporation (RREC), the
State's nodal agency responsible for identification, promotion and development of non-
conventional energy sources. The RREC has setup an independent CDM (Clean
Development Mechanism) promotion cell for facilitation of small scale CDM projects
building in renewable energy, energy efficiency and other relevant sectors. RREC also
works as a nodal agency for capacity building, providing consultancy and helping
entrepreneurs in earning CERs (Certified Emission Reductions). Various workshops and
seminars have been organized to train stakeholders and for communicating information.
Rajasthan has immense potential in form of Juli-flora (Vilayati Babool), Mustard husk,
Rice husk and other agriculture residues for the biomass fuel. Biomassbased Power
Projects totalling to 113 MW have already been registered with RREC. The RREC has
identified 19 locations to employ the 'Village Energy Security through Biomass', for
meeting energy supplies of a village through locally available biomass resources with
complete participation of the local community. The locations selected are un-electrified
remote villages/hamlets of the electrified villages which could not be electrified by
conventional means up to 2012.
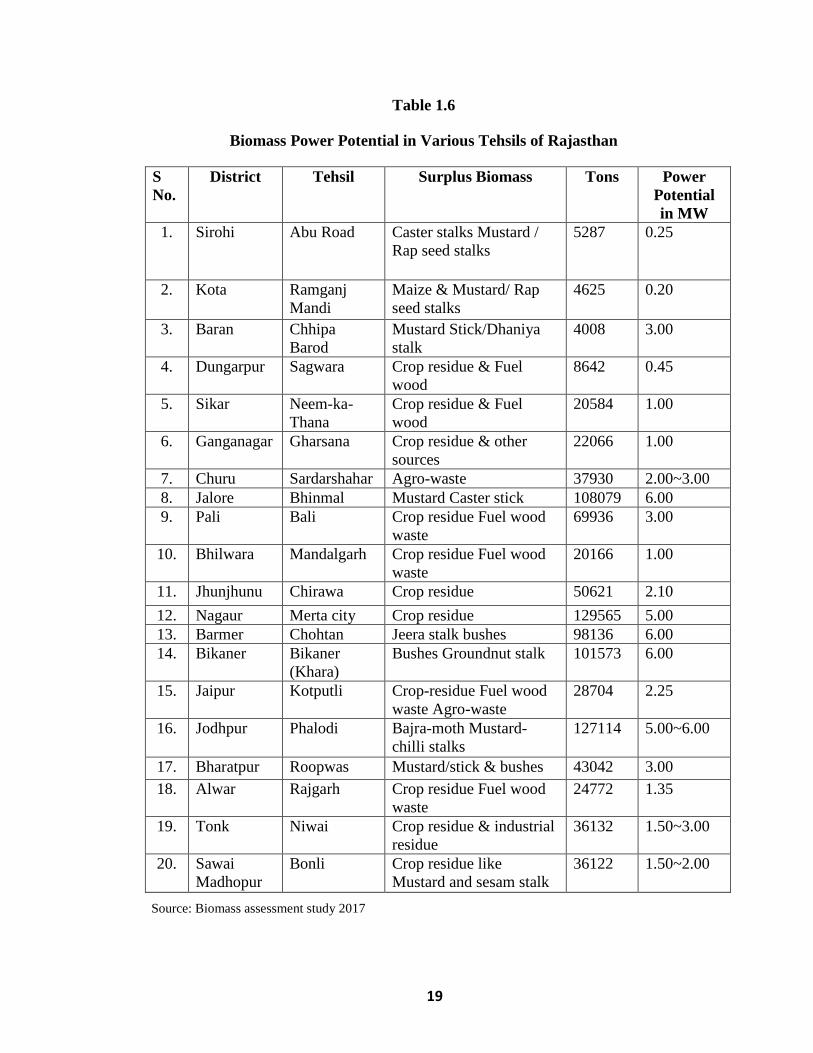
19
Table 1.6
Biomass Power Potential in Various Tehsils of Rajasthan
S
No.
District Tehsil Surplus Biomass Tons Power
Potential
in MW
1. Sirohi Abu Road Caster stalks Mustard /
Rap seed stalks
5287 0.25
2. Kota Ramganj
Mandi
Maize & Mustard/ Rap
seed stalks
4625 0.20
3. Baran Chhipa
Barod
Mustard Stick/Dhaniya
stalk
4008 3.00
4. Dungarpur Sagwara Crop residue & Fuel
wood
8642 0.45
5. Sikar Neem-ka-
Thana
Crop residue & Fuel
wood
20584 1.00
6. Ganganagar Gharsana Crop residue & other
sources
22066 1.00
7. Churu Sardarshahar Agro-waste 37930 2.00~3.00
8. Jalore Bhinmal Mustard Caster stick 108079 6.00
9. Pali Bali Crop residue Fuel wood
waste
69936 3.00
10. Bhilwara Mandalgarh Crop residue Fuel wood
waste
20166 1.00
11. Jhunjhunu Chirawa Crop residue 50621 2.10
12. Nagaur Merta city Crop residue 129565 5.00
13. Barmer Chohtan Jeera stalk bushes 98136 6.00
14. Bikaner Bikaner
(Khara)
Bushes Groundnut stalk 101573 6.00
15. Jaipur Kotputli Crop-residue Fuel wood
waste Agro-waste
28704 2.25
16. Jodhpur Phalodi Bajra-moth Mustard-
chilli stalks
127114 5.00~6.00
17. Bharatpur Roopwas Mustard/stick & bushes 43042 3.00
18. Alwar Rajgarh Crop residue Fuel wood
waste
24772 1.35
19. Tonk Niwai Crop residue & industrial
residue
36132 1.50~3.00
20. Sawai
Madhopur
Bonli Crop residue like
Mustard and sesam stalk
36122 1.50~2.00
Source: Biomass assessment study 2017

20
1.6 Overview of Biomass in Kota
Kota is a city located in the south-eastern part of Rajasthan. It is located about 240
kilometers south of the state capital, Jaipur and is situated on the banks of river
Chambal. Kota is one of the industrial hubs in northern India, with chemical, cement,
engineering and power plants based here.
The power plants located in Kota are using all types of renewable and nonrenewable
resources like water, gas, coal, and biomass as fuels for generating energy.
Biomass energy generates far less emissions than fossil fuels. Its use leads to various
environment benefits. The most important one is the reduction of atmospheric CO2
concentrations. In India the principal competing source for electricity is the coal based
power. Associated with conventional electric power plants are some negative social and
environmental externalities. Throughout the coal and nuclear fuel cycles there are
significant environmental and social damages, contrarily biomass energy cost is highly
variable depending upon the source, location etc.
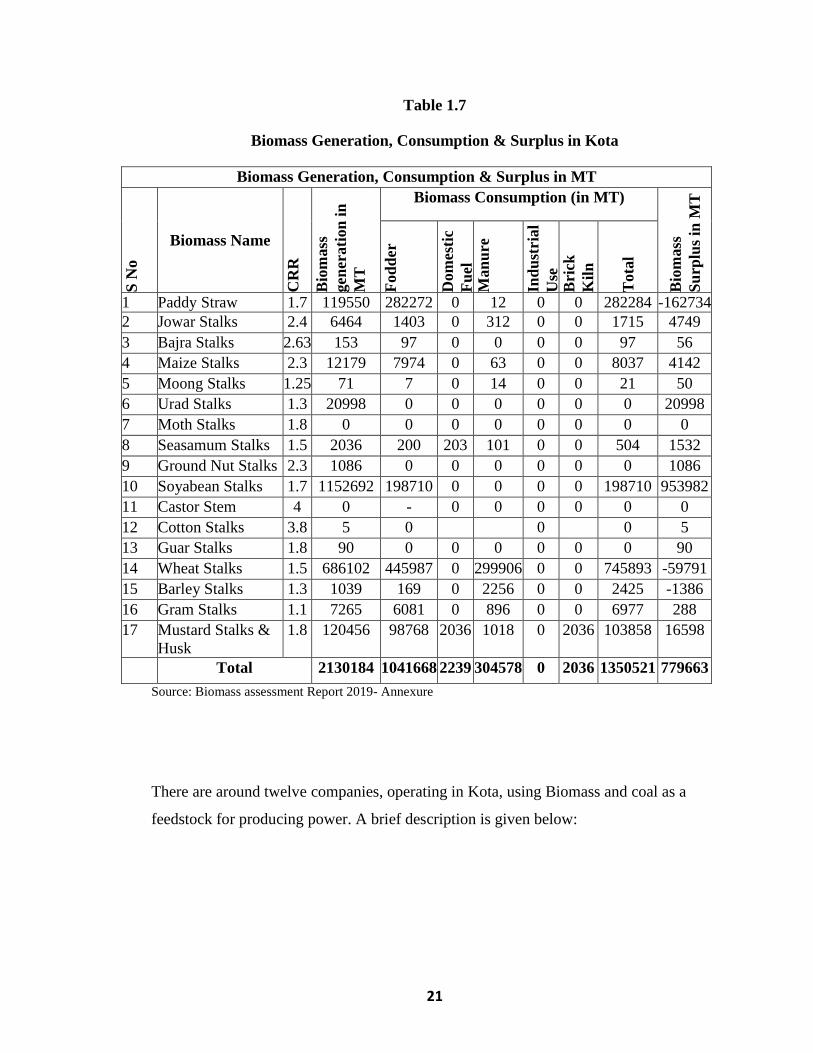
The amount of total Biomass generation in Kota is 21,30,184 MT/year. Whereas, the
consumption is around 13,50,521 MT/Year and so the surplus amount i.e. 7,79,663
MT/Year can be utilized for power generation. The details are given in table below.
21
Table 1.7
Biomass Generation, Consumption & Surplus in Kota
Biomass Generation, Consumption & Surplus in MT
S N
o
Biomass Name
CR
R
Bio
ma
ss
gen
era
tio
n i
n
MT
Biomass Consumption (in MT)
Bio
ma
ss
Su
rplu
s in
MT
Fo
dd
er
Do
mest
ic
Fu
el
Ma
nu
re
Ind
ust
ria
l
Use
B
rick
Kil
n
To
tal
1 Paddy Straw 1.7 119550 282272 0 12 0 0 282284 -162734
2 Jowar Stalks 2.4 6464 1403 0 312 0 0 1715 4749
3 Bajra Stalks 2.63 153 97 0 0 0 0 97 56
4 Maize Stalks 2.3 12179 7974 0 63 0 0 8037 4142
5 Moong Stalks 1.25 71 7 0 14 0 0 21 50
6 Urad Stalks 1.3 20998 0 0 0 0 0 0 20998
7 Moth Stalks 1.8 0 0 0 0 0 0 0 0
8 Seasamum Stalks 1.5 2036 200 203 101 0 0 504 1532
9 Ground Nut Stalks 2.3 1086 0 0 0 0 0 0 1086
10 Soyabean Stalks 1.7 1152692 198710 0 0 0 0 198710 953982
11 Castor Stem 4 0 - 0 0 0 0 0 0
12 Cotton Stalks 3.8 5 0 0 0 5
13 Guar Stalks 1.8 90 0 0 0 0 0 0 90
14 Wheat Stalks 1.5 686102 445987 0 299906 0 0 745893 -59791
15 Barley Stalks 1.3 1039 169 0 2256 0 0 2425 -1386
16 Gram Stalks 1.1 7265 6081 0 896 0 0 6977 288
17 Mustard Stalks &
Husk
1.8 120456 98768 2036 1018 0 2036 103858 16598
Total 2130184 1041668 2239 304578 0 2036 1350521 779663
Source: Biomass assessment Report 2019- Annexure
There are around twelve companies, operating in Kota, using Biomass and coal as a
feedstock for producing power. A brief description is given below:

22
I. DCM Shriram Ltd.
DCM Shriram is a diversified group with manufacturing facilities of Fertiliser, Chloro
Vinyl & Cement in Kota (Rajasthan) and of Chlor- Alkali in Kota and Bharuch
(Gujarat). The company operates coal-based captive power, facilities in Kota rated at
191 MW at Kota. Company is using Biomass and coal as a feedstock for generating
power. The company has done modifications and changes in the boiler as instead of coal
now the feedstock is in the form of biomass and coal both. Although Biomass has a
lower calorific value as compared to coal but utilising biomass which is environment
friendly has proved to be really very fruitful for the organization and for the farmers as
well. If this biomass is not used as a feedstock then it will neither be eaten by the
animals nor will be of any use to the farmers so it will be left over in the fields and burnt
away by the farmers which will again create pollution and other hazards in the
atmosphere.
In biomass the problem of adulteration is quite severe. To overcome this problem the
company is using mud separator which removes mud, sand, stones and other such
particles from biomass making it suitable to be used in the boiler. This equipment has
proved to be very useful for them. This is a great innovation for companies procuring
biomass as a feedstock for power generation.
One of the Sr. Manager told us that using biomass is very challenging for them as it is
very light in weight, difficult to handle and store, it is easily blown away by wind and
not available all the year round especially if the rainy season is prolonged one. Now
they have developed various methods and processes to overcome these challenges. They
have installed an additional belt conveyor to feed biomass from stock yard to boiler.
Also, they have developed warehouses for storage of biomass in nearby villages.
II. Shriram Rayons Ltd.
Another major company in Kota is Shriram Rayons, it is a major producer of rayon tyre
cord and it is also generating power using Biomass and coal as a feedstock.

23
It has also proposed increasing captive power generation capacity to 11.2 MW from 7.2
MW. They have four boilers one is working completely on coal, another on Mustard
husk and other two on coal and mustard husk both. Their daily consumption of biomass
husk is around 300 MT. The price of Biomass husk at factory gate is approx.
3000Rs./MT which keeps on varying according to the availability of Biomass across the
year which is quite less if we compare it with coal (price is around 6500Rs./MT) or any
other fossil fuel used for generating power.
III. Kalpataru Power Ltd
Kalpataru Power is one of the largest and fastest growing specialized EPC companies in
India engaged in power transmission & distribution, oil & gas pipeline, railways,
infrastructure development and warehousing & logistics business with a strong
international presence in power transmission & distribution. The company is currently
executing several contracts in India, Africa, Middle East, CIS, SAARC and Far East.
Biomass power plants are an integral part of inclusive development at Kalpataru Power
as these projects generate rural employment as well as contribute positively to a greener
environment by converting waste materials into clean energy.
The company has set up a Biomass plant at Padampur in the Ganganagar district of
Rajasthan in 2003. This plant uses agricultural waste and crop residues (biomass) as
inputs and generates 7.8 MW of power. Kalpataru Power has set up another biomass
plant in Tonk District of Rajasthan in 2006 of 8 MW capacity. This plant also uses
agriculture waste and crop residues (biomass) as inputs. Both Plants have logistics
infrastructure to collect approx. 200,000 MTs of such inputs every year.
IV. Surya Chambal Ltd
Surya Chambal ltd, is a 7.5 MW capacity biomass (mustard husk) based power plant,
located at Rangpur Village of District Kota, about 8 kms from Kota railway station on
the banks of the river Chambal. The project was started in April 2004 and the plant was
commissioned and synchronized with the Rajasthan Power Grid at 33 KV on 31st

24
March, 2006. Thus starting the supply of power through its Gopal Mill GSS situated
near Kota railway station. The company is now expanding and putting up another unit of
10 MW at Khatoli village in Kota, about 100 km from Rangpur. Its sister concerns,
Sathyam Power Pvt. Ltd. is putting up a 10 MW plant at Merta Road in Nagaur district
and Prakriti Power Pvt. Ltd. is putting up a 12 MW Power Plant at Gangapur city in
SawaiMadhopur district.
The company has never used fossil fuel to support biomass for the plant and purchases
Rs.10~12 crore of biomass annually and thereby generates income for farmers and
others in a region of 50 km radius from the plant. The company faced initial teething
troubles. However, after carrying out certain technical modifications, it started yielding
satisfactory results.
V. Orient Green Power Company Rajasthan Pvt Ltd
Another company operating near Kota is Orient Green Power ltd located in Kishanganj
which is in Baran district near Kota. They are using Mustard husk as a feedstock for
generating power. The company faced initial problems while setting the project.
However, after carrying out certain technical modifications, it started yielding adequate
results. They have developed additional infrastructure for feeding the biomass in the
boiler and for handling the biomass.
VI. Goyal Proteins
Goyal Proteins is another such company in Jhalawar near Kota which is also using
biomass mustard and soya bean husk as a feedstock for generating power. Goyal Group
of Industries is the epitome of premium quality edible oil manufacturers. They are the
trusted name behind renowned brands. Being a quality driven group, they have a perfect
blend of excellence and quality as they procure selected oil seeds from reputable
vendors of the industry. They use latest processing equipments for accomplishing the
targets.

25
VII. Ruchi Soya Industries Ltd.
These companies are producing power using the mustard husk of biomass. Ruchi Soya
Industries Limited. (Ruchi Soya) is a leading manufacturer and India‘s largest marketer
of healthier edible oils, soya food, premium table spread, Vanaspati and bakery fats.
They emerged as an integrated player, from farm to fork with open access to oil palm
plantations in India and other key regions of the world.. They are diversifying into
various other businesses like generating power and they are also the highest exporter of
soya meal, lecithin and other food ingredients from India.
VIII. Shiv Edible Ltd.
Shiv Edible Industries are located in Ranpur in Kota. They have attained complete client
satisfaction and recognition amongst the best and the most reliable manufacturers of
Agro Products in the nation. They are using biomass husk for generating power and are
helping farmers and middlemen in having an extra income from the business of
biomass.
IX. S.M. Environmental Technologies Pvt. Ltd.
They have a plant of 8 MW at Kishanganj Baran which is utilizing mustard husk as a
feed stock for generation of power. Their other portfolio includes biogas, wind energy
and small hydroelectric projects at various stages of development. As on January 2014
their portfolio of operating projects included 506.205 MW of aggregate installed
capacity, which comprises 420.205 MW of wind energy projects and 86 MW of biomass
Projects.
X. Sharda Solvent Ltd
Their company is using mustard husk as feedstock for generating power. Initially they
faced problems of availability of biomass as many companies came up in their

26
proximity but slowly and slowly they established the network of suppliers due to which
things went on smoothly.
XI. Shriram EPC
The company has many portfolios like Process & Metallurgy, Power, Water
Infrastructure and Mining & Mineral Processing. They use biomass husk for generation
of power which they procure locally from the farmers and vendors. The prices of
biomass husk are continuously increasing, this is due to large number of companies are
venturing into this business so the problem of timely availability of the husk is there.
XII. Mangalam Cement
Apart from making cement, waste heat recovery plants (WHR) are generating power of
5.15 MW capacity and another of 5.85 MW capacity. They have established themselves
into this business from last many years so a good network of suppliers have been
established and using new technologies & innovating new equipments for feeding husk
into the boiler have made them stay amongst significant players.
Since the biomass is available in surplus amount in Kota and nearby areas, there is a
huge potential for generation of power using Biomass as feedstock by the power
producing companies.
1.7 Biomass potential
Biomass has very high potential for business growth and it is also providing
opportunities for mass employment as well. It is one of the leading source of primary
energy for most of the countries as it is characterized by low cost technology and freely
available raw material.
Biomass provides business opportunities in various sectors like R&D, Engineering
procurement and construction(EPC), Agriculture (biomass cultivation and processing),

27
transport services, bioenergy generation, core equipments manufacturing etc. as shown
in the below representation.
Figure 1.6 Opportunities in Business related to biomass energy
Source: http://www.eai.in/ref/ae/bio/biz/biomass_biz_opp.html
Biomass has a large energy potential. Globally if we see the current biomass use is
clearly below the available potential. In Asia the scene is a bit different the current use
of biomass exceeds the available potential, i.e. non-sustainable biomass use. As a result,
biomass use can be increased and energy can be generated to a larger extent throughout
the world. The future demand for renewable energy can be covered, by greater
utilization of forest remains and remains from the wood processing industry.
28
Renewable transportation fuels from biomass have the potential to considerably reduce
greenhouse gas emissions and extend global fuel supplies. Thermal conversion by fast
pyrolysis converts up to 75% of the starting plant material (and its energy content) to a
bio-oil intermediate suitable for upgrading to motor fuel.
Woody biomass is mostly preferred in thermo chemical processes due to its low ash
content and high quality bio-oil produced. However, the availability and cost of biomass
resources, e.g. forest residues, agricultural residues, or dedicated energy crops, vary
greatly by region and are the key determinates in the overall economic feasibility of a
pyrolysis-to-fuel process.
India has a potential of about 18 GW of energy from Biomass. At present, about 32% of
all out essential energy utilized in India comes from Biomass. Over 70% of the nation's
population relies on biomass for its energy requirements.
There is high potential for generation of renewable energy from various sources wind,
solar, biomass, small hydro and cogeneration bagasse. The total potential for renewable
power generation in the country as on 31.03.17 is estimated as 10,01,132 MW. This
includes solar power potential of 6,49,342 MW (64.86%), wind power potential of
3,02,251 MW (30.19%) at 100 m hub height, SHP (small-hydro power) potential of
21,134 MW (2%), biomass power of 18,601 MW (1.86%), 7,260 MW (0.73%) from
bagasse-based cogeneration in sugar mills and 2554 MW (0.26%) from waste to energy.

29
Figure 1.7: Estimated Potential of Renewable Power in India( Source wise) as on
Mar’17
Source: Energy Statistics 2018
65%
0
30%
0
2% 0 2%
0 0.73%
0 0.26%
solar
wind
small hydro power
biomass
cogeneration bagasse
waste to energy

30
1.8 Biomass fuel and its properties
Biomass contains carbon, hydrogen and oxygen. It also contains small amounts of
nitrogen and small quantities of other atoms, including alkali, alkaline earth and heavy
metals. The chemical composition of biomass varies among different species, but in
general biomass consists of 25% lignin and 75% carbohydrates or sugars.
Methane gas or transportation fuels like ethanol and biodiesel can be very easily made
from biomass. Decaying garbage, agricultural and human waste, all discharge methane
gas—also called "biogas" or "landfill gas".
Biomass is available in a number of different formats like fine dust, sawdust, chips,
pellets, briquettes, and bales.
Chips and dust are the formats which requires vey less post-harvest processing and also
cost very less when used as a fuel if production is available locally.
Chips can be milled to form wood dust (sawdust). We can store them in open for very
long hours if continuous monitoring is done regarding self-ignition and heating. The
bulk density of chips is comparatively lower than that of pellets, so their transportation
will be more expensive per unit of energy.
Pellets and briquettes are generally more cost effective to transport due to their higher
bulk density of typically 600–700 kg/m3and are less prone to ―hang-up‖ in the bunkers
and conveyors but it is more expensive to produce them as compared to chips. Pellets
are bio-fuel compressed into small cylinders with a typical diameter of 5–15 mm and a
length of 10–50 mm.

31
Figure 1.8: Pellets of Biomass
Source: https://www.indiamart.com/proddetail/biomass-pellets-7047325955.html
Biomass can also be delivered to the power station in bales. This format is mostly used
for straw and special equipment is required to remove the strings and break up the bales
or a plant is designed specially to burn the bales. Bales are comparatively easy to
transport and their bulk density is also good. They can also be stored in the open for
shorter periods of time. A modern large bale can weigh up to 300–500 kg.

32
Figure 1.9: Bales of Biomass
Source:https://www.canr.msu.edu/news/storing_biomass_in_round_bales
Another form in which biomass can be stored for future use is the biomass briquettes.
Instead of coal and charcoal their substitute i.e. biomass briquettes can be used as a bio-
fuel substitute. Briquettes can be used in the areas, where it is difficult to find fuels used
for cooking. In the developed countries use of briquettes is done quite often, to heat
industrial boilers in order to generate electricity from steam. The briquettes are co-fired
with coal and the heat produced is transferred to the boiler.
Biomass briquettes are the compressed form of biomass mostly made of agriculture
waste and other organic materials, used for heating purposes, as a cooking fuel and for
power generation. Various organic materials, like rice husk, ground nut shells, bagasse,
agricultural waste and municipal solid waste together make the briquettes. According to
the availability of raw materials, the composition of the briquettes varies from one
region to another. The raw materials are collected and condensed into briquettes in order
to burn them for a longer time. The briquettes when burnt produce less greenhouse gas

33
emissions in comparison to fossil fuels like coal etc. as the raw materials used are
already a part of the carbon cycle.
Figure 1.10 Biomass Briquettes
Source: https://en.wikipedia.org/wiki/Biomass_briquettes
Today in modern times biomass is not used to the extent it was used in traditional times.
In the developed countries biomass is again becoming very significant for applications
such as combined heat and power generation. In addition, biomass energy is having a
good potential to be used for power generation and as a source of clean heat for
domestic heating and community heating applications.

34
1.9 Biomass based power generation
In today‘s time electricity is a basic necessity for not just the developed world, but also
for the developing countries like Indonesia, Afghanistan etc. and for the underdeveloped
nations like Mali, South Sudan etc. Still the feed stocks used for power generation are
mostly dependent on fossil fuels, which are nonrenewable in nature and which will soon
be depleted and exhausted from the environment. They will also create pollution in the
form of Greenhouse emissions which will in turn harm the ozone layer leading to global
warming.
The countries across the globe should now start using more and more greener and
renewable fuels for power generation. To derive power directly or indirectly variety of
biomass is used and there are also manifold pathways to produce power using biomass,
It is imperative for India too, to start using more of renewable energy sources as there
are serious concerns related to pollution and global warming across the world. More and
more sources of renewable energy should be explored by our country, which can
generate power in a distributed way and on small scales, so that more than 60,000
villages that have no access to electricity can get benefit from it. It is at this place where
biomass based combustion power, and particularly biomass gasification based power
would be used.
1.9.1 Primary Routes for Power from Biomass
Combustion, Gasification and Anaerobic Digestion are the three primary routes for
conversion of biomass to power:
Combustion of biomass for generation of power could either be in the form of co-
firing (when it is burned along with coal) or purely biomass based combustion where
no mixing of fuel is there in the feed stock, only purely biomass is feeded into the
boiler.
35
In the process of biomass gasification the biomass is first burned in a very
controlled supply of air to form a gas consisting of various other gases like carbon
dioxide, hydrogen, carbon monoxide and other such related gases and some
contaminants, and this gas is then cleaned for use in boilers and turbines to generate
heat and power.
Kitchen waste, sewage waste and other organic wastes are used for producing
energy through anaerobic digestion. In this process the microbes act upon the
untreated matter present in the biomass under anaerobic (absence of air) conditions
and convert it into biogas,
Pyrolysis is a forthcoming route for biomass based power. In this, process of pyrolysis
the biomass is swiftly heated to very high temperatures of about 450 - 600°C in the
absence of air, which ends up with an output known as bio-oil also called the pyrolysis
oil, which can again be used for firing the boilers.
1.9.2 Benefits of biomass based power generation
Distributed generation of biomass power
Biomass is very easily available everywhere across the globe in the form of agriculture
residues or wastes of many forms especially in rural areas and country sides. The
process of gasification based power generation can be done on small scales (as low as
20 kW) and this method can be used for distributed generation of power as against the
centralized power production method which is mostly used in todays‘ era.
Continuous power generation
Continuous power generation is possible with biomass energy sources as biomass can
be made available anywhere and anytime. Such plants which provide continuous power
generation are called base load power plants, they are only turned off during periodic
maintenance, upgrading, overhauling or servicing. Solar and wind energy sources

36
provide unsteady and uneven supply of energy so they cannot as be used for continuous
power generation.
Suited for villages and rural areas
For villages situated in remote areas where there is no access to grid but large and bulky
amounts of biomass are available, biomass based power generation is very good means
of having access to the basic necessity of electricity.
Capacity to have small, KW scale power production
Sources of power like thermal and nuclear require larger scales for generation of power
whereas biomass gasification based power production can be done at small scales – as
small as 20 KW. This is ideally suitable for smaller villages that are having only a few
households.
Rural economic upliftment
The prosperity of rural areas increase as employment and opportunities are generated for
the rural masses by installing the power plants for power generation and also a very
efficient supply chain starts beginning from the farmer to the customer. For generating
1 MW power from biomass around 200-600 acres of land is required so the
opportunities for rural employment are certainly significant.
Ecofriendly
Biomass power also emits carbon like coal and other forms of nonrenewable fuels emit
carbon on burning, but this carbon emitted is taken back by the plants during
photosynthesis, so biomass based power generation is also called carbon neutral.
Biomass power is ecofriendly and due to it the atmosphere is also pollution free.
Proper utilization of renewable organic resources

37
Biomass power generation is an efficient process which results in the use of mostly
animal and crop wastes which if not consumed in a proper manner would be converted
into carbon dioxide in the atmosphere.
Multiple feedstock
Large variety of feedstock such as wood pellets, mustard husk, soya bean husk, rice
husk, bagasse etc. can be used to generate biomass power. If these crop residues are left
over in the fields, they are of no use to the farmers and they in turn burn the husk and
the crop stubble (parali) which creates pollution in the atmosphere.
Resource of Low Cost
Biomass power can be generated cost-effectively which can be competitive to grid
power, if there is regular and good availability of feed stock.
1.10 Supply chain of Biomass
Biomass energy production requires the flow of biomass material from the land to its
ultimate end use. Along the way, biomass passes through a series of processes in what is
called the biomass supply chain.
Various elements of the biomass supply chain require unique sets of information,
knowledge, technology and activity. These include growing, harvesting, transporting,
aggregating, storing and converting biomass. Depending on the energy and the biomass
type pre-processing may also be an important step along the pathway from the land to
energy use.
Transport, storage and handling are key issues throughout the supply chain and link the
various segments to each other. The various stages along the biomass supply chain are
frequently interdependent and interconnected, with changes in productivity and
technology in one stage affecting that in other stages.

38
Several key issues influence the entire biomass supply chain: existence of biomass
markets, getting connected to markets, and supply logistics. All these activities are made
possible by the farmers, middlemen and the employees of the power generating
company. They are the key stakeholders of the supply chain.

39
Figure 1.11 Supply chain of Biomass
Source: https://www.researchgate.net/figure/Graphical-Representation-of-a-Biomass-Supply-Chain-
BSC_fig1_266486110

40
Figure 1.12 Biomass supply chain in Forest area
Source: https://www.sciencedirect.com/science/article/abs/pii/S1364032114002688
The biomass supply chain is made up of a range of activities which include harvesting,
baling, storing, drying and transport of the biomass both on the field and to the bio
refinery, handling and transport of residues and by products. The activities required to
supply biomass from its production point to a power station are as follows, which are
also depicted in the above figures:
Harvesting/collection of the biomass in the field/forest.

41
In-field/forest handling and transport to move the biomass to a point where road
transport vehicles can be used.
Storage-Many types of biomass are characterized by seasonal availability, as
they are harvested at a specific time of the year but are required at the power
station on a year-round basis; it is therefore necessary to store them. The storage
point can be located in the farm/forest, at the power station or at an intermediate
site.
Loading and unloading of the road transportation vehicles. Once the biomass has
been moved to the roadside it will need to be loaded to road transportation
vehicles for conveyance to the power station. The biomass will need to be
unloaded from the vehicles at the power station.
Transport by road transportation vehicles. There are varying opinions in the
literature and studies available on whether it is more economical to use heavy
goods vehicles or agricultural/forestry equipment for biomass transport to the
power station. Ultimately, it appears to be a matter of the average transport
distance, biomass density, the carrying capacity and travelling speed of the
respective vehicles, and the availability of the vehicles.
Processing biomass to improve its handling efficiency and the quantity that can
be transported. Processing can occur at any stage in the supply chain but will
often be done before transportation and it generally costs very less when
combined with the harvesting. The various stages are depicted in the below
figure:

42
Fig 1.13 Basic biomass supply chain design
Source: https://www.researchgate.net/figure/Generic-biomass-supply-chain-design_fig1_223824022
The whole network which operates in time and space that coordinates, in order to
estimate the logistics costs, a global view of the processes, which are strongly
interlinked, is needed. The main characteristics of the supply chain, that influence the
logistics efficiency, are that the raw materials are produced over large geographical
areas, have a limited availability window, and often are handled as very voluminous
material.
The statistics shown with respect to various aspects like globally, in our country, in our
state Rajasthan and in our city Kota shows that on an average biomass is available in
surplus and its use is also increasing day by day which is the need of the hour.

43
References
1 A review on biomass energy resources, potential, conversion and policy in India by Anil
Kumar et al
2 http://www.eai.in/ref/ae/bio/biz/biomass_biz_opp.html
3 (Parrika, 2004).
4 Energy statistics 2018
5 https://worldbioenergy.org/uploads/WBA%20GBS%202017_hq.pd f
6 Hall et al., 2000
7 https://www.indiamart.com/proddetail/biomass-pellets-7047325955.html
8 https://www.canr.msu.edu/news/storing_biomass_in_round_bales
9 https://en.wikipedia.org/wiki/Biomass_briquettes
10 http://www.eai.in/ref/ae/bio/why/why_biomass_power.html
11 http://www.eai.in/ref/ae/bio/bppm/biomass_power_production_methods.html
12 https://biomasspower.gov.in/About-us-3-Biomass%20Energy%20scenario-4.php
13 MNRE Annual Report 2015-16
14 http://www.eai.in/ref/ae/bio/ben/benefits_biomass_power.html
15 https://www.researchgate.net/figure/Graphical-Representation-of-a-Biomass-Supply-
Chain-BSC_fig1_266486110
16 https://www.sciencedirect.com/science/article/abs/pii/S1364032114002688
17 Allen J, Browne M, Hunter A, Boyd J, Palmer H. Logistics management and costs of
biomass fuel supply. Int J PhysDistrib Logistics Manage1998;28:463–77

44
18 Huisman W, Venturi P, Molenaar J. Costs of supply chains of Miscanthusgiganteus. Ind
Crops Prod 1997;6:353–66.
19 Tatsiopoulos IP, Tolis AJ. Economic aspects of the cotton-stalk biomasslogistics and
comparison of supply chain methods. Biomass Bioenergy2003;24:199–214.
20 Logistics issues of biomass: The storage problem and the multi-biomass supply
chainAthanasios A. Rentizelas *, Athanasios J. Tolis, Ilias P. Tatsiopoulos
21 Optimized harvest and logistics for biomass supply chainA. Sambra, C. G. Sørensen, E.
F. KristensenUniversity of Aarhus, Faculty of Agricultural Sciences, Dept. of
Agricultural EngineeringSchüttesvej 17 DK-8700 Horsens, Denmark
22 Rajasthan biomass fuel supply study 2015
https://biomasspower.gov.in/document/Reports/Rajasthan%20biomass%20fuel%20supp
ly%20study%202015%20(1).pdf
23 Biomass assessment study 2017http://investrajasthan.com/lib/bpulse/022006/bio.html
24 Global Potential of Sustainable Biomass for Energy report by Svetlana Ladanai Johan
Vinterbäck
25 https://pub.epsilon.slu.se/4523/1/ladanai_et_al_100211.pdf
26 Biomass assessment study 2019
27 https://biomasspower.gov.in/biomass-info-asa-fuel-resources.php
28 World Bioenergy Statistics 2019

45
CHAPTER-2
Review
of
Literature

46
2.1 Introduction
The Literature review provides an account and consolidation of the most relevant
literature in the fields of renewable energy especially related to biomass. A review of
literature of various studies related to Biomass as an energy fuel, a source of power
generation and its effective logistics and supply chain management shows that very
limited research has been carried out in this area especially in the Indian context.
Various International and National Research papers were studied and reviewed to find
out the research gap. Areas of Literature reviewed in this chapter include biomass for
bioenergy and biofuels, biomass for power generation and supply chain management of
Biomass.
2.2 Research related to Biomass for Bioenergy and Biofuels
Vlosky and Smithhart (2011) have stated that Biomass has a large energy potential.
Only about two-fifths of the existing biomass energy potential is used if a comparison is
done between the available potential with the current situation, on a global level.
Current biomass use is clearly below the available potential in most areas of the world.
However, in Asia, the current use exceeds the available potential, i.e. non-sustainable
biomass use. The subtropical and tropical forests comprise 56% of the world‘s forests,
while boreal and temperate forests account for 44% (FAO, 2001). For growing biomass
tropical countries are having favorable conditions. However, issues related to optimal
use of biomass as an energy source are still to be resolved. Still some main issues are
there like lack of information and technology transfer and some legal and institutional
barriers. Furthermore, common misapprehensions about biomass energy have to be
taken care of. They have signified that the larger part of wood fuels is coming from non-
forest land; the root cause of deforestation is not the use of wood fuel.

47
Therefore, increased biomass use, e.g. for upgrading is possible in most countries. A
possible alternative is to cover the future demand for renewable energy, by increased
utilization of forest residues and residues from the wood processing industry, e.g. for
production of densified biofuels (Parrika, 2004). They have concluded in their paper
that the tropical Asian countries have a large potential for biomass production. It is
expected that under the initiatives of both industrialized countries and tropical Asian
countries, through Clean Development Mechanism (CDM) schemes various projects of
large scale energy crop production (e.g. cassava, oil palm, sugar cane, etc.) will be
implemented in the near future.
Mohapatra and Gadgil (2013) have stated in their studies that growth of civilization
with rapid increase in energy utilization through severe energy crisis has shifted the
attention towards renewable resources i.e. biomass. Terrific growth in population has
increased the energy consumption at such a rate that an alternate route for energy
generation has become a very essential requirement. This is where the role of renewable
energy systems comes in. Biomass is considered as the renewable energy source with
the highest potential to contribute to the energy needs of today‘s society. This is the only
replenishable source which could generate energy and feedstock approx. 14% of the
renewable energy is in the form of biomass energy.
Biomass is not only a source of renewable energy but also a source of petrochemical and
chemical feedstock. Many new technologies are available which can convert biomass
into thermal and electrical energy. If biomass is consumed in a proper way then it can
replace the consumption of fossil fuels to a great extent. Generation of power through
biomass is carbon neutral as the amount of carbon released on its combustion is taken
back by the plants in the form of carbon dioxide. Conventional sources of energy are
going to deplete sooner or later. So it is important to shift to new and modern sources of
energy.

48
Various experiments were conducted in the laboratory with wood chips and saw dust
and as standard biomass to convert it into valuable products.
This paper describes the different routes along with the experimental studies that have
been undertaken towards achieving the goal of converting biomass into useful energy.
Research should be diverted towards the formation of value added chemicals from bio-
mass rather than the use of biomass as direct fuel. Government subsidy is also necessary
to improve the economic viability of the above technologies. The current energy
scenario demands the need of alternate sources of energy. However complete switching
to cleaner source is difficult to achieve because of the economic, technical and social
constraints. The existing technologies have many merits and demerits. Thus it may be
concluded that there are many possibilities as well as restrictions in the use of biomass
in energy supply.
Osman et al (2014) have reviewed about forestry biomass in their research article with
main emphasis about Malaysia. Forestry biomass is a material particularly derived from
plantation forest, rubber plantation of Malaysia natural forest, material gathered from
log production and major wood manufacturing activities. The information helps to
anticipate the potential of these promising waste resources to be used for energy
products. In Malaysia the tropical and humid climate throughout the year provides
significant opportunity to tap this resource completely. Supplementing vitality sources
from timber land biomass is another approach to help its population. This paper aims to
estimate waste generated and to calculate their energy value from these particular
materials and ultimately, to forecast the potential of this feedstock. The word biomass
and energy are the same and bioenergy is been used interchangeably in our day to day
life. The generation of energy from woody biomass has become intense in Malaysia as
supported by ―National Biomass Strategy 2020‖. From previous section it has been
concluded that the amount of woody biomass material available is not so important but
the amount of energy that can be generated from it is more valuable. The energy content
of biomass is always reported as dry biomass, and the term higher heating value ―HHV

49
refers to the energy released in combustion when the water vapour resulting from the
combustion is condensed thus realizing the latent heat of evaporation‖ meanwhile the
lower heating value or ―LHV reports the energy released when the water vapor remains
in a gaseous state‖.
Mahar etal (2012) have discussed in their paper how waste agricultural biomass
(WAB) can be used as source of energy for industrial and domestic purposes in
Pakistan. In respect of this vision, nine WAB samples were taken from district Sanghar
and analyzed as per standard methods for the level of moisture content, for total solids
and for volatile solids by thermo-gravimetric analysis (TGA). The results pointed out
that WAB has remarkable energy potential in terms of methane, which can be utilized
for cooking, heating and power generation purposes. Biomass can be converted into a
variety of energy forms which includes heat (direct burning), electricity (steam and
gasification), ethanol, hydrogen and methane. Number of factors like conversion
efficiencies, energy transport, economics, and type of technology and environmental
impact of conversion process are to be considered while converting biomass into various
forms. Methane is an ideal fuel in most circumstances.
In this paper importance of Biogas and digested substrate, and their advantages for the
society were also discussed. Biogas can be utilized for several purposes. The simplest
use of biogas is that it can be directly used for cooking and lighting. It can also be used
for combined heat and power generation (CHP).
Generation of digested substrate creates new jobs related to the collection and supply of
feedstock, manufacture of biogas plant equipments, construction, operation and
maintenance of biogas plants etc. In Pakistan, many domestic bio gas plants are in
operation but their feedstock is the dung of buffaloes and cows. In developed countries
there is good number of commercial as well as farm scale biogas plants in operation
with a feedstock of animals dung and WAB, but in Pakistan practice of using the co-
digestion of WAB with animal dung is not there. Huge quantity of WAB is wasted in

50
district Sanghar. This analytical study has been carried out for the first time in order to
highlight the benefits of the biogas from WAB and its potential in Pakistan.
Blaschke and Biberacher et al (2013) in their paper have examined the ways in which
future ‗energy landscapes‘ can be modeled in time and space. Biomass is an energy
carrier that may be purposely useful in circumstances where other renewable energy
carriers are likely to deliver less. An important issue considered in this article is whether
an immense expansion in the use of biomass will allow us to create future scenarios
while repositioning the ‗energy landscape‘ as an object of study. A second important
issue is the exploitation of heat from biomass energy plants. Biomass energy also has a
larger geographical footprint than other carriers such as, for example, solar energy. This
article tends to provide a link between energy modeling and territorial planning.
―Energy landscapes‖ provides a link between physics-based views on energy supplies
and their geographical footprints on one hand, and the ‗energy landscape‘ concept and
how common men think about geographic space on the other hand. Such ―energy
landscapes‖ may in future become a valid understanding concept for territorial planning
and may provide geographical analysis capabilities and methods with which to plan
future action. The authors consider their framework to be a starting point, targeting to
inspire interdisciplinary discussions between physicists, energy experts, global
geographical planners and future ―energy landscape‖ managers. The authors conclude
that most areas currently used for energy production, and specifically for bioenergy
which is, again and again stated, a land-consuming form of renewable energy
production were not selected to meet specific predefined goals concerning their location,
quantity, and spatial display. Many existing bioenergy production areas in Austria and
Germany are found in areas that are very appropriate for other purposes (such as
agriculture or urban development) or were selected for their own unusual reasons.

51
Sathaye (2011) has pointed out in his paper that most energy efficiency technologies are
cost effective and wind generation technologies are the lowest cost renewable energy
sources, and that their implementation is held back by institutional, practical and process
barriers. The main goal of this report is to text approaches that ensure that public policy
and programs work with market forces and businesses for functioning of energy
efficiency and renewable energy (EERE).
This report points out certain on-going programs and policies that are overcoming
hurdles in the industrial and power sectors, and notes key issues that need to be
addressed for their imitation in India. Future growth in energy demand will place
considerable stress on India‘s ability to acquire domestic and imported energy supplies.
Regular energy shortages and environmental pollution, particularly in urban areas, may
be aggravated, and the country may continue to be susceptible to potential oil and gas
supply disruptions, and to the instability of petroleum crude prices. Exclusive
dependence on supply sources would exaggerate the energy security risk posed by such
disruptions. Energy efficiency offers a lucrative solution to overcoming this threat
which is almost entirely within the control of the Indian government and private sector.
Building ability to plan and execute energy efficiency programs will help advance
India‘s energy security and alleviate the local environmental and global warming impact
of abandoned energy growth, specifically coal. If improvement is needed in India‘s
energy productivity then a regular and intensive effort is needed by all sectors.
Renewable energy offers a considerable potential for producing electricity. Wind power
plants are rapidly expanding of over the last five years, so in that sense renewable
energy sector is the fastest growing section amongst all the power generation sources.
Along with wind power, solar power plants can also contribute to the removal of
electricity shortages, reduction of local pollution and carbon emissions from
conventional power plants. Policies that encourage faster growth of wind energy,
development of new transmission grids, and ways to combine renewable sources into
the grid are being worked on and confidently will be set up soon to speed up wind
penetration.

52
Shukla has concluded in his research paper that the various merits of biomass energy
has made the policy makers aware about the future prospects related to biomass due to
which conditions are created for it to make inroads into the energy market. Modern
biomass has potential to break through in four segments:
Process heat applications in companies producing biomass waste,
Cooking energy in household and commercial sectors (through charcoal
and briquettes),
Electricity production and
Transportation sector by means of liquid fuels.
Various economic reforms have opened the doors for competition in energy and power
sectors in India. Biomass energy future lies in its use with modern state of the art
technologies. An investigation under competitive dynamics in energy and electric power
markets using the Indian-―MARKAL model‖ (Shukla, 1996; Loulou et al., 1997) has
suggested that biomass energy has considerable potential to enter the Indian energy
market under strong worldwide greenhouse gas improvement scenarios in future. The
future potential of biomass energy depends on providing reliable energy services at
viable costs. If biomass energy services can compete on a fair market, then this will
happen very soon in India. Policy priorities should be to disseminate biomass energy
services towards market and to transform the market towards fair competition. The best
option is to utilize the waste material effectively.
If 10,000 MW power has to be generated then potential availability of agro residues and
wood processing waste in India is required. However Biomass waste shall be inadequate
to support the rising demands for biomass resources. If sustained supply of biomass is
required then production of energy crops, wood fuel plantations etc. is required to be
done on a large scale. Land contribution, improved biomass productivity, cost-effective
operations of plantations and planning the infrastructure are significant areas which shall
determine the future of biomass in India.

53
Heinimö et al (2007) have mentioned in their paper that the markets of biomass for
energy are developing very fast and becoming more international. A remarkable
increase is there in the use of biomass for energy needs, and there will be plenty of
challenges to overcome. The main objective of the study was to clarify the alternative
potential scenarios for the international biomass market until the year 2020, and based
on the circumstances, to identify essential steps needed towards the critical working and
sustainable biomass market for energy and power purposes.
Faaij (2007) have pointed in their publication that Biomass is a multipurpose energy
source that can be used for production of heat, power, and transportation fuels, as well
as biomaterials and when generated can be used on an enduring basis, it can also make a
large input to reducing greenhouse gas (GHG) emissions. In this publication the authors
have mentioned the significance of biomass as a bioenergy. A comparison is also done
with other fuel options. Biomass is the most important renewable energy option in
today‘s time and will most probably maintain that position during the first half of this
century and also beyond that [IPCC, 2007; IEA, 2006a].
For converting solid biomass to power and heat many combined heat and power (CHP),
co-firing and various combustion concepts provide trustworthy, efficient, and clean
conversion routes. Production and use of biofuels is growing at a very quick pace.
Although the future role of bioenergy will depend on its competitiveness with fossil
fuels and on agricultural policies globally, it seems realistic to expect that the current
contribution of bioenergy of 40-55 EJ per year will increase significantly. A range from
200 to 400 EJ may be expected during this century, making biomass a more important
energy supply option than mineral oil today, large enough to supply one third of the
world‘s total energy needs. Bioenergy markets provide major business opportunities,
environmental benefits, and rural expansion on a worldwide level. If indeed the global
bioenergy market is to develop to a size of 300 EJ over this century (which is quite
possible given the findings of recent global potential assessments) the value of that
market at E4-8/GJ (considering pre-treated biomass such as pellets up to liquid fuels

54
such as ethanol or syn fuels) amounts to some E1.2 ~ 2.4 trillion per year. Feed stocks
can be provided by the residues from agriculture/ forestry, and from the timber industry,
biomass produced from degraded and marginal lands, and biomass produced from good
quality grazing and agricultural lands without endangering the world‘s food and feed
supply, forests, and biodiversity. The prerequisite to achieve such a situation is that
agricultural land-use efficiency is increased, especially in developing countries.
Murtala et al (2012) in their paper have identified in the developing countries some of
the major biomass resources and their potentials for a sustainable energy production and
utilization. They have highlighted some conversion techniques and channels for the
biomass resources as well as the terms of some adequate actions for their proper
utilization. The use of biomass as energy source will provide a tremendous opportunity
for easing of greenhouse gas emission and reducing global warming through the
substitution of conventional fossil-based energy sources.
Anil Kumar et al (2015) have discussed in their paper about biomass energy resource,
its potential, energy conversion and policy for promotion as implemented by
Government of India .On 31st March 2013 the total installed capacity for electricity
generation in India was 2666.64 GW. Out of total generation, 10.5% is contributed by
renewable energy, out of which 12.83% power is being produced using biomass. India
has excess of agricultural and forest area which includes about 500 million metric tons
of biomass availability per year. In India total biomass power generation capacity is
17,500 MW.
At present power being generated is 2665 MW which include 1666 MW by
cogeneration. Various categories of biomass in India are also discussed in this paper.
Their research reveals that India has huge potential for biomass feed stock from
different sources. Government of India has implemented different policies and

55
programs, and also executed various projects for biomass power generation. Such
approaches have included the whole biomass energy sector which incorporates the bio
gas, bio diesel etc. in the policies. Government of India has focused on the exploitation
and development of biomass energy sector with strategic policy and program which is
remarkable portion of this review paper.
Bauen and Berndes et al have stated a concise review on various aspects of bioenergy
like technical, environmental, economic, social and policy issues in their paper. The
paper discusses about the future potential of bioenergy and the main aspects for
exploitation of biomass energy in the short and medium term. It also discusses the
principal risks and problems associated with the development of bioenergy, and how
they may restrict its use. The aim of this paper is to assist policy and other decision
makers with information that is beneficial to exploiting the opportunities and reducing
the risks associated with bioenergy, and which may help in the sustainable development
of the sector.
Daugherty have discussed in their research paper about the efficiency of Biomass
Energy Systems which are analyzed through a Life Cycle Assessment. In the paper they
have shown that biomass energy growth can meet rising global electricity demand in the
midst of international concerns over fossil fuel dependence, global warming, and
problems of land use. This study presents a life cycle assessment (LCA) of biomass
energy systems to analyze some of the limiting factors. Limiting factors or the
constraints such as increased land use, fossil fuel use, and corresponding CO2 emissions
further influence international biomass development efforts. The life cycle assessment
evaluated alternative processes that might increase effectiveness. The LCA pointed out
that ―integrating Salix short-rotation forests, biological fertilizers, and integrated
gasification technologies into the biomass energy system would reduce fossil fuel use
and CO2 emissions by 74 percent and land use by roughly 97 percent‖. By implementing

56
Salix, biological fertilizer, and gasification technologies biomass energy systems can
become much more efficient and competitive for generation of renewable electricity.
Dimpl (2011) have stated in their publication, how small-scale electricity generation
from biomass takes place and he has tried to find out how wood or other dry biomass is
transformed into a combustible gas and then into electricity via a generator set which is
a perfect solution for isolated rural areas where problem of electricity is quite regular,
but at country side there is an abundance of shrubs, rice husk, mustard husk and peanut
husks straw or other forms of biomass.
The technology, known as biomass gasification, is quite popular, from more than a
hundred years now. Continuous rising prices of fossil fuels since 2008 and the debate
about climate change, this know-how has again come under consideration as a
renewable energy source in villages and remote areas. However, converting biomass to
electricity is not an easy task as some manufacturers would like to make us consider.
The ―Deutsche Gesellschaftfür Internationale Zusammenarbeit (GIZ)‖ on behalf of the
German Ministry for Economic Cooperation and Development has been looking for
sustainable solutions to provide access to vital energy services in villages and has
analyzed experiences with small-scale applications of the gasification technology over
the last ten years. This analysis was based on publicly available documents, as well as
interviews and email discussions with experts in this field. This study refers to small
scale applications of less than 100 KW which can be put in through biomass gasification
technology and the potential available for providing fundamental energy services to
households and people living in remote areas. The biomass gasification technology is a
remarkable option for rural development. It promises the following:
Sustainable change of locally available biomass into electricity for local supplies;
A local value chain with income generation for the suppliers of the biomass as fuel;

57
Incentives for afforestation.
Hence, it will remain on the energy development plan. However, as given above; many
problems still remain unsolved, especially for small applications:
No reliable technology is readily available.
High costs for technical development, repair and maintenance make it
unbeneficial.
Due to toxic waste hazardous threats to the environment and to health exist.
Suitable management of such a intricate system and the sustainable provision of
appropriate feedstock are needed for all biomass based electrification
technologies.
In short, the viability of the technology has been proven and the costs are fairly
competitive. Hence, more pilot projects with a certain research component are needed.
Moreira (2005) have stated in their paper about the Global Biomass Energy Potential.
He has tried to find out that the rigorous use of renewable energy is one of the options to
stabilize CO2 atmospheric concentration at levels of 350 to 550 ppm. However what is
really significant is to quantify the amount of final energy since the use of replenishable
sources may involve conversion efficiencies, from primary to final energy, different
from the ones of traditional energy sources. In reality, IPCC (Inter governmental Panel
on Climate Change) does not provide a complete account of the final energy from
renewables, but using several options which are available to moderate climate change, it
is possible to stabilize atmospheric carbon dioxide (CO2) concentration at a low level.
58
In this paper, the author has evaluated in detail biomass primary and final energy using
sugarcane crop as a substitute since it is one of the highest energy density forms of
biomass, and through reforestation using a model presented in IPCC Second Assessment
Report (SAR). The conclusion is that the primary-energy potential for biomass has been
under-evaluated by many authors and by IPCC and this under-evaluation is even more
for final energy since sugarcane allows co-production of electricity and liquid fuel.
Regarding forests, IPCC results are reproduced for primary energy and calculated final
energy. Sugarcane is a tropical crop and cannot be produced in all the land area
forecasted for biomass energy plantation in the IPCC/TAR evaluation (i.e. 1280 Mha).
However, there are large areas of unexploited land, mainly in Latin America and Africa
where the weather is warm and comfortable and good rainfall is there. With the use of
143 Mha of these lands it is possible to produce 164 EJ/yr of main energy using farming
productivities.
2.3 Papers related to Biomass Power Generation
Hao & Luo (2012) have put forward some counter measures for the orderly
development of China‘s biomass power generation in their paper. Some of which are as
follows:
Investigation and real time assessment of the biomass resources.
Development of mechanism for biomass power generation industry.
Comfortable environment for investment, and well-coordinated and unified
regulation institution.

59
They have also analysed in their paper how biomass power generation‘s industry
development is taking place over the period in advanced Countries. The key points of
which are:
Development of planning and strategies.
Policy support and the development of biomass energy market.
Creation of market of energy industry.
How to ensure the raw materials supply in a continuous basis.
Technology research and development.
Cooperation and competitiveness of the industry, internationally.
In their paper, Constraints in China‘s Biomass Energy Development have also been
discussed which are as follows:
Lacking of systematic and scientific overall planning.
Technology research and development ability for biomass power generation.
Costly generation of power by Biomass.
Irrelevance of law and government support policy.
Limited investment and financing channel.
Unsound market mechanism.
Undeveloped and insufficient supporting mechanism.
Uncertain biomass resources distribution.

60
Blocked supply channel of raw materials.
Weak foundation of technology industrialization.
Market environment not suitable.
Mohan &Partheeban (2012) have tried to point out that use of Biomass is growing
globally. Although advancements in biomass energy technologies, mostly bio-energy
consumption in India still remains confined to traditional uses. The latest advancement
of technologies opens the possibilities to convert biomass into synthetic gaseous or
liquid fuels (like ethanol and methanol) and electricity (Johansson et al, 1993). Absence
of biomass energy market has been the primary barrier to the penetration of latest
biomass technologies. Authors have also studied that transformation in biomass energy
in Asia has happened in the last two decades along the following three routes:
Improvement of technologies in traditional biomass applications for example
cooking and rural industries.
Development of process for conversion of raw biomass to superior fuels (such as
liquid fuels, gas and briquettes).
Deep penetration of biomass based electricity generation technologies.
These developments have opened new avenues for biomass energy in several Asian
countries, besides India. China, in early 1980‘s, initiated a nationwide program to
distribute improved cook stove and biogas technologies. The program led to raising
energy efficiency of cook stoves to 20 percent, saving nearly a ton of wood fuel per
household (Shuhua et al, 1997). In 1995, nearly 6 million biogas digesters produced 1.5
billion m3 gases annually (Baofen and Xiangjun, 1997). Another 24,000 biogas
purification digesters, with a capacity of 1 million m3, were in use for treating waste
61
water for 2 million urban populations (Keyun, 1995). Two hundred small biogas based
power plants, adding to a capacity of 3.5 MW, produced 3 GWh of electricity annually
(Ravindranath and Hall, 1995). Research and development in China has paying attention
on a process for converting a high quality Chinese sorghum breed into liquid fuel,
pyrolysis technology and gasification of agriculture residue and wood. Lately, Biomass
based electricity generation technologies have penetrated in the Chinese market. The
policy support brings to a promising future for modern biomass in China. Biomass
contributes 44% of the total energy in Philippines; it is a major biomass using nation.
First nation to initiate the modern biomass program was Philippines. In 1970‘s, a three
quarters of electricity in Philippines was produced from oil and diesel fired power
plants.
In the study by Liu et al (2014), a comparative evaluation of 5 typical Biomass power
generation (BPG systems) has been conducted through a hybrid life cycle inventory
(LCI) approach. They have analyzed that requirements of fossil energy savings, and
greenhouse gas (GHG) emission reductions, as well as emission reductions of SO2 and
NO𝑥, can be achieved by the BPG systems. The co firing systems were found to result
better than the biomass-only fired system and the biomass gasification systems in terms
of energy savings and GHG emission reductions. Comparing with results of
conventional process-based LCI, an important point to note is the important contribution
of infrastructure, equipment, and maintenance of the plant, which require the input of
various types of materials, fuels, services, and the consequent GHG emissions. The
results show characteristics and differences of BPG systems and help locate critical
opportunities for biomass power development in China.
In the study, the authors Sun &Guo (2014) have tried to find out that biomass energy
resource is rich in China, and it has the potential for development. However, the
distribution of biomass energy resource is scattered, and different regions have different
resource reserves. Henan and Shandong provinces are the main distribution regions of

62
biomass energy, and the regional industrial efficiencies are higher than other regions due
to the conducive environment of fuel resource market and power grid. Meanwhile, the
potential distribution of biomass energy resource is equivalent with that of conventional
primary energy source to some extent, which makes the regions with low reserves of
primary energy source have great potential for utilizing biomass energy.
In their paper Kader et al (2012) have tried to explain that in Bangladesh, the
contribution of renewable source in electricity generation is almost negligible. But it has
potential sources for electricity generation such as biomass and solar power system.
Bangladesh is an agricultural country and has huge biomass resource such as
agricultural residue, municipal solid waste, poultry droppings etc. Government support
could significantly encourage biomass-fueled electricity and other low carbon energy
technologies.
A techno-economic evaluation was done by Purohit & Chaturvedi in 2018 where
modern bioenergy was recognized as a low-carbon resource by policy-makers around
the world to meet climate policy targets. India considers bioenergy as a boon in
electricity generation as well as in other applications. In two different forms bioenergy
for power generation can be used i.e. pelletized and non-pelletized. For co-firing in coal
thermal power plants or biomass power plants the non-pelletized form has been used.
International trade is increasing because of climate policy targets adopted by developed
countries & biomass pellets are used on large scale. Estimation of the cost of biomass
pellet-based electricity production and assessing its financial viability has been done by
the researcher.
Transport and storage costs are minimized, handling is improved, and the volumetric
calorific value is increased because of pelletization process. Pelletization may not

63
increase the energy density on a mass basis, but it can increase the energy content of the
fuel on a volume basis. Hence, for long-distance transport, it makes sense to transport
pellets rather than biomass feedstock only. In terms of agriculture and forestry residues
potential of the different states varies. States like Karnataka and Andhra Pradesh have
more potential for producing forest and agriculture residue in comparison to Tamil
Nadu. On the basis of financial analysis researchers concluded that the cost of electricity
production will be higher, based on the import of biomass pellets. With high carbon
price or stringent targets for biomass-based electricity generation for states that do not
have surplus agricultural/forestry, residue availability can only help.
Zhao & Feng (2014) conducted a research in China where significance of bioenergy
was realised. They stated that developing bioenergy is must due to scarcity of fossil fuel
resources, reduction in the demand for greenhouse gas and environmental protection.
The study throws light on current development situation of biomass power industry in
China, discusses the dilemmas of industry‘s development in a perspective of industry
chain and gives recommendations. The research also brings various development
strategies on the table along with development objectives, technology roadmap, and the
related policy guarantee measures for the biomass power industry. Although, the
industry is not market-oriented, the equipment technology is lagging, supply of the raw
materials and production equipment are a big constrain but still, the development of
biomass power generation industry in China has made considerable progress in terms of
investment, installed capacity and on-grid energy, and also made enormous
contributions to carbon reduction. It can be concluded that with scientific and
technological progress, China‘s biomass power industry will develop rapidly with
reduced cost. From the perspective of government planning, goal of biomass power
generation industry is to reach to its installed capacity to 13 million KW in 2015 and 30
million KW in 2020. To ensure stable and fast development, recommendations given
above will provide policy support as well as development direction. The appropriate
conclusions will be fruitful for reference to the scholars who want to study the biomass

64
power industry development. In order to ensure the accomplishment of the goal
government support, development of biomass power generation industry, both in terms
of promoting market mechanisms or the electricity price policy, as well as the research
and development input, in the future with scientific and technological progress, and
economic and social development, China‘s biomass power industry will expand rapidly,
and the cost will be further reduced. There is a promising future for the development of
biomass power industry in China.
Gebreegziabher, Oyedun et al (2014) studied the research paper on designing and
optimization of biomass power plant & concluded that among the various renewable
energy sources, biomass provides some benefits because of its low cost and presumed
zero-carbon emission when compared with fossil fuels. The moisture content of biomass
is often high that lowers its heating value, reduces the combustion temperature and
create operational problems. Due to which, while burning biomass for power generation,
biomass is often dried prior to the combustion. While performing it, heat integration
studies are performed on to a biomass power plant that burns empty fruit bunches
(EFB) as fuel. To identify opportunities of heat integration among the drying and power
generation systems & to visualize the intensity, composite curves of all studied cases are
plotted. In order to maximize the power output of a biomass power plant or reduce the
drying cost, proper heat integration in between the steam power plant and the drying
process is required. From this study one can conclude that with proper drying and heat
integration, the overall efficiency of a biomass power plant can be improved
significantly.
65
2.4 Literature related to supply chain management of Biomass
A review of the paper authored by Wu et al (2013) shows that according to the National
Medium and Long-term technology development plan of China (2005-2020), the
important development areas of bio energy in China in the coming 10 years are bio
power generation, bio gas engineering, bio fuels and solid fuels. In 2020, the total use of
bio energy per year will account for 4% of the total energy consumption in China. Due
to the characteristics of agricultural biomass use such as variable distribution, seasonal
work, and different types of ownership, the collection, storage and transportation of
agricultural biomass become the bottlenecks of large-scale utilization of agricultural
biomass. Therefore, it is essential to establish a reasonable and efficient agricultural
biomass supply chain management system so as to support the sustainable development
of bio energy industry.
A Case Study by Alam, Pulkki, Shahi, et al (2012) investigates an optimal biomass
supply chain for four large-scale biomass-based power plants in Northwestern Ontario.
It has been a priority research area recently due to greater emphasis put on green energy
sources in Canada FMU's. Power plants can increase their profits from FMUs that are
closer to the power plants. However, their profits significantly increase if the power
plants offer higher prices. This is possible only if the suppliers maintain the quality
standards and lead time requirements of the buyers. The variations in costs and gross
margin structures under various model scenarios are explained by location of depletion
cells relative to power plants, availability of each type of biomass in depletion cells,
biomass demands, and differential processing costs for two types of biomass. This
modeling framework may be applied elsewhere to study the similar problem of biomass
supply chain. The results of such modeling can help managers make improved decisions
relating to biomass supply chains for bioenergy production.
66
In the dissertation authored by Chaabane in (2011), he has pointed out about the
Sustainable supply chain management and that it covers interactions between the
economic dimension, the environment, and society. In this article, he has presented a
generic mathematical model to assist decision makers in designing sustainable supply
chains over the entire life cycle. The methodology presented him is general enough and
may be applied to other supply chain studies to evaluate their performance in term of
cost and carbon emissions.
In the paper, Sokhansanj et al (2008) have developed the Integrated Biomass Supply
Analysis and Logistics (IBSAL) model to replicate biomass supply chains from the field
to the bio refinery. The model simulates the flow of biomass through collection,
transport, storage, and preprocessing and estimates energy utilisation and costs. It
identifies the potential minor improvements at every step of the supply chain (optimum
designs) and critical improvements for the integration of the entire feedstock supply
infrastructure (logistics).
The research paper by Sambra et al is a part of a continuing project, BioREF (Bio
refinery for sustainable Reliable Economical Fuel production from energy crops).
BioREF is planned to develop, in an energetic way, a yardstick for future integrated and
sustainable bioenergy production systems that will contribute to improve Denmark‘s
position in the biofuel production. The objectives of the work mentioned in this paper
are to optimize the harvest and logistics for the movement of oilseed crops and
appropriate agricultural residues for production facilities and return the process residues
for agricultural use as part of the overall biomass feedstock infrastructure. In this
respect, the supply chain is required to comprise of optimized steps of harvesting the
crop, collecting residues, storing and transporting.
67
Vlachos et al (2008) have discussed in their paper about a quantitative analysis based
approach, how it is evolved and that it takes into account all major aspects in the design
of waste biomass supply chains, developed for energy generation. By this a
comprehensive biomass supply chain optimization model is offered for the strategic
allocation of its nodes and its related flows. They conclude by developing the
application of the planned methodology on a test case study for a biomass supply
network for the Region of Central Macedonia, Greece. Logistics and supply chain
management have come up as disciplines of utmost importance for the utilization of
natural substrates and waste biomass.
Astro logistics Inc have stated in their article the best practices in developing efficient
and effective transportation systems within the supply chain some of which are as
follows:
Buy-in throughout the organization; distribute executive-level responsibility;
support policies.
Arrange supply chain goals with business goals.
Exploit efficiencies; reorganize processes and use automation to handle
transactional operations.
Become a role model; cooperate with suppliers and customers to share benefits.
Create close-loop process for reporting and recounting of inventory.
Establish vital criteria for transportation vendor selection within the supply
chain.
Enhance allotment in a manner so that cost and trips are reduced. Combine and
optimize routes to reduce loads.
Rentizelas, Tolis, et al (2009) have shed the light on the rarely investigated issue i.e.
the biomass storage problem (esp. because of seasonal availability) and the multi-
biomass supply chain. Generally, researchers choose the lowest cost storage method

68
available, ignoring the effects this choice may have on the total system efficiency but
here researchers analyzed the three most frequently used biomass storage methods and
applied it to a case study to come up with tangible comparative results. Moreover to
reduce the storage space requirement they have introduced the innovative concept of
combining multiple biomass supply chains and an application of it is also performed for
the case study examined. From the case study, it was concluded that the lowest cost
storage method indeed constitutes the system-wide most efficient solution, and that the
multi-biomass approach is more advantageous when combined with relatively expensive
storage methods. Since everything has its own pros & cons this method also do, as this
low cost biomass storage method do bear increased health, safety and technological
risks.
Allen, Browne et al published a research paper where they addressed the issue of
considering logistics costs and the integrated management of logistics activities vital for
the success or failure of a product or industry supply chain considerations and costs of
using biomass fuel on a large scale for electricity generation at power stations.
The focus of the paper was to examine the options for supplying the end user with
biomass fuel of the right measurement in the right quantity at the right time from
resources which are characteristically diverse and often seasonally dependent. It is at
this scale, the logistics of biomass fuel supply are likely to be both complex and
potentially problematic, as logistics costs will have a huge impact on the total delivered
cost of biomass (i.e. the total cumulative cost of biomass fuel at the point of delivery to
a power station). The study assessed potential supply systems for the supply of fuel to
power stations, calculated the delivered costs of these supply chains, and identified the
relative advantages of the various systems and the environmental impacts of biomass
fuel supply. It concentrated on the supply chain components from the point of
harvesting through to delivery at the power station.

69
Röser (2012) has applied a three-dimensional approach in his paper which investigates
the forest energy supply chains from a technical, economic and social viewpoint. Four
case studies in different operational environments have been conceded to investigate the
applicability of the three dimensional approach to increase operational efficiency.
The literature demonstrates that the chosen approach was practical to find out the
complex relationships between the selected technologies and different supply chain
elements and stakeholders thereby contributing to maintain or increase operational
efficiency of forest energy supply chains. Also, it captures the effect of different aspects
and characteristics of the various operational environments on the setup and
organization of supply chains. This will be an important knowledge to ensure or
improve operational efficiency when adapting existing forest energy supply chains or
when building up supply chains in new operational environments.
Windisch, Sikanen et al (2010) investigates how modern supply chain management
applications can be increasing the profitability of forest fuel procurement operations.
Since profit margins are low, decreasing the provision costs could boost wood-based
bioenergy business. The study is based on the investigation of two Finnish forest owners
associations (FOA) deals in forest fuel procurement using a modern SCM tool. The
investigation is done by cost-benefit analysis (CBA) using the net present value (NPV)
methodology to find out the profitability.
The study has proved that supply chain management applications can increase the
efficiency and profitability of forestry in the rapid growing field of forest fuel
procurement. The results of the cost-benefit analysis are important since they prove that
SCM systems can help to increase forest energy business.

70
Tallaksen (2011) had studied in their paper that establishing a biomass supply chain is
rather simple in concept. However, there are more details that must be considered to
make the feedstock supply chain work as an efficient system. Since every situation is
unique, supply chain forming needs to be based on the conditions for the each facility or
market, the biomass will supply. The common elements that apply to developing
successful supply chains are that they are using sustainable volumes of bulky biomass
and that the biomass is reached to the conversion facility at an economically viable cost.
Correct project planning and operations are needed to make sure that these elements are
part of any new supply chain and will help to have a successful biomass to energy
project.
The aim of the research paper by Svanberg (2013) is to explain how principles of
supply chain management (SCM) give important conditions for the production,
accessibility and use of energy, from the point of origin to the point of consumption.
The paper identifies three separate trajectories in which the interplay between SCM and
energy can release potential for research and practice.
Energy resources are important to power industrial processes in manufacturing and
logistics, while their use is also a main contributor to carbon emissions. The
consolidative nature of SCM provides conditions for enhancement in use and
accessibility of energy, and can make possible the transition in which fossil fuels are
replaced with a system of supply and conversion of renewable energy. These
opportunities are highlighted by building a set of three trajectories, which range from a
true supply chain perspective on the energy sector, to an up-stream and down-stream
perspective.
Nilsson et al (2011) have explored themes and challenges in making supply chains
environmentally sustainable. The study starts with a systematic review, and content

71
analysis of articles in top-ranking related journals from logistics, transport, sustainability
and environmental areas, and ended with research propositions contributing to the
further improvement of supply chain management.
From the systematic review five major areas of challenges for supply chain management
are derived as:
costs,
complexity,
operationalisation,
mindset, cultural changes, and
uncertainties.
They have concluded that there is a essential need for models and frameworks that take
into consideration the complexity involved, take holistic perspectives, and challenge the
basic assumptions underlying most of the research published (i.e. reductionism,
positivism and economic growth).
Johnson describes woody biomass feedstock supply chains that support the biofuels and
utility industries. Following key issues have not been acknowledged or fully addressed:
Existing forest products industry and allied demand requirements.
Extended supply chain through many industries adds complication in supplying
woody biomass for biofuels through the consumer.
Resource restrictions associated with many industries demanding the same
feedstock (i.e., logs).

72
Insecurity in the logging industry.
Harvesting limitations of federal- and state-owned lands, and
Additional processing of logs (i.e., chipping and shredding) required by biofuels
and utilities industries that is not plentiful in the current supply system.
Additional issues include the transportation infrastructure requirements needed to
transport woody-biomass feedstock via truck, rail, barge, or intermodal combination.
Alam, Pulkki et al (2012) have tried to put across the complexities of buying woody
biomass feedstock to the Atikokan generating station (AGS) in northwestern Ontario
(NWO) in the cost effective way. The paper applies two optimization models to analyze
the impacts of biomass competition on cost structures and gross profit margins for four
biomass-based power plants in northwestern Ontario. Model scenarios are run to study
the impacts of changes in parameters related to biomass type and processing technology,
and prices of inputs costs and outputs costs for procurement.
Ji, Sittibud et al (2017) have tried to explain that biomass is a biological material
derived from living organisms and can be utilised as sources of energy. This paper is
concerned about optimizing the biomass supply chain focusing particularly in Loei
province, Thailand. A mixed integer linear programming model is used to establish the
best possible biomass production and supplier allocation that result in the lowest cost to
meet electricity demand.
Mitra, Datta (2013) have done a survey of sustainable supply chain management
practices in Indian manufacturing firms. They have developed India-specific items for
the survey based on the related literature and feedback from companies. The objects on
SSCM practices and firm‘s achievement may be of use to research scholars and
73
professors, experts as key success factors (KSF) and key performance indicators (KPI),
respectively for further reference. In this literature an outline is made related to the
scope of adoption of SSCM practices by Indian manufacturing companies. The authors
expect that the outcomes of the study would help in the development of a suitable
regulatory framework and implementation of SSCM practices to a greater extent in
India‘s search for environmental sustainability.
Niu (2010) have stated in their dissertation the importance of information and
technology on the supply chain management. Specifically, the study focuses on the
technology circumstances and performance effects of knowledge management by supply
chain organizations. Taking the view point of a supply chain dyad, the study first
presents a survey research that examines the association between the supply chain‘s IT
capability and knowledge management capacity and the knowledge management
capacity‘s impact on supply chain performance. The outcomes and results indicate that
the ability of supply chain firms to jointly manage knowledge resources is an essential
requirement of supply chain strategic performance.
Azmi, Hamid, et al (2017) outlines the importance of integration in supply chain
management (SCM) by linking the functions of logistics as it applies in strategic
business process. Often, business processes are developed at the strategic level but are
never identified precisely in logistics or in SCM. Various processes like Customer
Service Management (CSM), Demand Management, Supplier Relationship Management
(SRM), and Customer Relationship Management (CRM), are not directly connected to
logistics or SCM. This paper also identifies the literature that expressed the importance
of integration and how business processes can be pertinent in the implementation of key
logistics activities in the supply chain context.
74
Lichocik and Sadowski (2013) have discussed in their paper the problem of supply
chain management efficiency in the context of common theoretical considerations
pertaining to supply chain management. The authors have also highlighted determinants
and realistic implications of supply chain management efficiency in tactical and
operational contexts. In this study critical analysis of logistics literature is done, along
with free-form of interviews are conducted with top management representatives of a
company in the transport service limited (TSL) sector.
Efficiency of supply chains is not only a task for which a logistics department is
responsible as it is a strategic decision taken by the management as regards the method
of future company's operation. Properly planned and completed logistics tasks may
result in improving performance of the industries and companies as well as of the entire
supply chain. Fundamental improvements in supply chain efficiency may be ensured by
examining theoretical models on the strategic level and implementing a chosen concept.
Agustina et al (2018) have stated in their literature about the design, planning and
management of biomass supply chain. According to them biomass energy is one of the
most significant renewable energy source apart from solar, wind, hydropower and
geothermal, which can replace fossil fuel energy. Over the years, researchers have been
exploring the process of producing and converting biomass into bioenergy, but the
importance of logistics was observed recently. Efficiency and effectiveness are the
important parameters of supply chain management and logistics. This paper presents a
literature review of articles published in journal articles from 1992 to2017, which
includes the bioenergy production interface and logistical issues and supply chain
management.
This review will contribute to researchers and practitioners in understanding the design,
planning and management of biomass supply chains by considering detailed modeling
analysis. The review also presented the issues and challenges related to biomass supply
chain modeling. Many studies focus on bioenergy forests, as many industries that use

75
forest resources already have sufficient infrastructure, networks and process
technologies. Based on the rising issues of the broad study, it has identified a need to
involve uncertainty and sustainability in the optimization of important systems. In the
real world, demand, capacity and cost affect the supply chain complexity to some
extent. Aspects related to economy, environment and society will definitely be affected
by issues related to sustainability in the near future.
Lautala, Hilliard et al (2015) have stated in their paper the various opportunities and
challenges faced during the design and analysis of biomass supply chains, they have
tried to explain the main components of biomass supply chains, examples of related
simulating applications, and how they address aspects related to environmental metrics
and management. This paper introduces a concept of integrated supply systems for long
term biomass trade and the factors that influence the bioenergy supply chain landscape,
including models that can be used to examine the factors.
The paper also covers various aspects of shipping and transportation logistics, ranging
from alternative modal and multi-modal alternatives for the introduction of support tools
for transportation analysis. They have carried out an analysis that the biomass supply
chain is one of the most critical elements of large-scale bioenergy production and in
many cases a key hurdle for procuring initial funding for new developments on specific
energy crops. Most of the productions depend on complex transforming chains which
are linked to food and supply markets. The term ‗supply chain‘ covers several issues
ranging from farming and harvesting of the biomass, to treatment, supplying and storage
of biomass. After energy conversion, the product must be delivered to final point of
consumption, either in the form of heat, electricity or more substantial products, such as
pellets and biofuels. Effective supply chains are very important for bioenergy
generation, as biomass tends to have challenging seasonal production cycles and low
mass, energy and bulk densities.

76
Petridis, Arabatzis et al (2018) have explained in their paper that the design of a
biomass supply chain is a big challenge where multiple stakeholders with often differing
objectives are involved. To have room for the aspects of the stakeholder, the supply
chain design should integrate multiple objectives. In addition to the supply chain design,
the management of energy from biomass is a challenging task, as the procedure of
generation of biomass products needs to be allied with the rest of the operations of the
biomass supply chain. For the optimal design of biomass supply chain a mathematical
framework is presented in this paper. An integrated statistical framework, that models
biomass generation, transportation and warehousing throughout the terminals of a
biomass supply chain is studied in this paper. Owing to inconsistent objectives, weights
are imposed on each aspect, and a 0-1 weighted goal programming mixed-integer linear
programming (WGP MILP) model is developed and used under environmental,
economic and social criteria for all possible weight representations.
The results of the study show that if importance is given to the environmental aspect,
expressed with high values in the environmental condition then it considerably reduces
the level of CO2 emissions resulting from the transportation of biomass through the
various nodes of the supply chain. Environmental and economic criteria seem to be
moving in the same path for high weight values in the equivalent aspect. From the
outcomes it is seen that, as compared to environmental and economic criteria, social
criterion seems to move in the opposite direction. An integrated mathematical
framework is presented modeling biomass production, transportation and warehousing.
To the best of the authors‘ knowledge, such a framework that integrates multiple goals
and objectives with supply chain design is yet to be published.
Zamar, Gopaluni et al (2017) have analyzed that the supply chain optimization for
biomass-based power plants is an important research area due to greater importance on
renewable power energy sources. Deterministic mathematical models help in studying
about the biomass supply chain design and operational planning models. While these
models are advantageous for making decisions, their applicability to real world

77
problems may be incomplete because they do not take into account all the issues
occurring in the supply chain, including uncertainties in the parameters. So through this
article a statistically strong quantile based approach for stochastic optimization under
uncertainty, is built upon scenario analysis. The authors have applied and evaluated the
performance of the approach to address the problem of analyzing competing biomass
supply chains subject to random demand and supply. The proposed approach was found
to do better than alternative methods in terms of computational efficiency and ability to
meet the random problem requirements.
Sharma et al (2013) have discussed in their report the basis, overview, modeling,
challenges, and future about biomass supply chain design. They have studied that
biofuels are identified as the potential solution for diminishing fossil fuel reserves,
increasing oil prices, and providing a clean and replenishable energy source. The major
barrier preventing the commercialization of lingo-cellulosic bio refineries is the
complex conversion process and their respective supply chain. Efficient supply chain
management of a lingo-cellulosic biomass is essential for success of second generation
biofuels. This paper analytically describes energy needs, energy targets, biofuel feed
stocks, conversion processes, and finally provides a comprehensive review of Biomass
Supply Chain (BSC) design and modeling. Specially this paper presents a detailed
review of mathematical programming models developed for BSC and identifies key
problems and potential opportunities. After reading this review readers will have an idea
about biomass feed stocks and biofuel production as well as an idea about complete
analysis of the BSC modeling and design.
Akhtari et al (2019 have tried to find out that economic viability is one of the main
considerations in bioenergy and biofuel projects and is greatly influenced by uncertainty
in biomass availability, cost, and quality, and bioenergy and biofuel demand and prices.
One important aspect of decision making under uncertainty is the viewpoint of the
decision maker towards risk, which is not taken care of in the biomass supply chain
management literature. In this paper, the gap is addressed by evaluating alternative

78
supply chain designs taking into account uncertain future conditions resulting from
changes in biomass availability and cost, and bio product and energy prices. Three
decision rules, maximax, minimax regret, and maximin, representing, respectively,
optimistic, opportunistic, and pessimistic perspectives, are used for evaluation. It is
assumed that the decision maker has knowledge about the prospective future events, but
the probability of their occurrence is not known. According to the outcomes of the case
study, based on optimistic and opportunistic viewpoints, investment in bio energy and
biofuel conversion facilities was suggested. Production of both biofuels and bio energy
would not be profitable under negative conditions. Therefore, investment in only bio
energy facilities was prescribed under negative and pessimistic conditions.
Ulonska and König et al have described in their work about the optimization of
multiproduct bio refinery processes with consideration of biomass supply chain
management and market developments. The authors have tried to find out that even
though a shift from conventional to renewable resources is anticipated, lingo-cellulosic
bio refinery concepts still struggle with economic feasibility and sustainability. In order
to overcome these barriers, a full analysis from biomass supply chain, process
performance development, and product-portfolio assortment is targeted. Addressing the
economic viability and sustainability already at an early process development stage
when only limited knowledge is available, Process Network Flux Analysis (PNFA)
[Ulonska et al., AIChE J.2017,62, 3096–3108] is capable of methodically identifying
the most valuable processing pathways. This enables a first performance ranking based
on the profit or global warming potential of pathways, thereby accelerating development
of the process. The methodology is herein extended to consider biomass supply chain
optimization and market-dependent price developments such that all main influencing
factors are considered as till only processing networks have been taken care of. The
absolute methodology is validated identifying reasonable plant locations in North
Rhine-Westphalia, Germany. Enhancing economic viability of the finest performing
biofuel ethanol, a multiproduct bio refinery is targeted coproducing value-added

79
chemicals. Herein, a coproduction of iso-butanol raises the profit significantly: a mass
ratio of at most 1.9 (ethanol: iso-butanol) is required to break even.
Martins and Carneiro et al have stated in their paper that how the demand for biomass
has risen due to increasing needs of de-carbonising energy intensive processes. Biomass
production, distribution and use for energy generation involve several supply chain
systems of which understanding requires a complete analysis of the biomass supply
chain management. The present article gives an idea of the volume and variety of
research carried out in the production and management of biomass supply chains for
energy production. The authors have critically evaluated that how well studies have
captured multifaceted issues related to the supply chain management of biomass used
for energy production and identified future research trends in this field. The VOS viewer
(Center for Science and Technology Studies, Leiden University, Leiden, The
Netherlands) and SciMat (University of Granada, Spain) tools are employed for the
construction of scientific maps that exhibit the evolution of research in the biomass
supply chain management area for energy production. In America, England and Italy the
results discovered that research on the biomass supply chain for power generation is
booming. Nevertheless in Brazil, India and China, studies are still at an infant stage.
There is increasing concern about the emerging new trends related to biomass supply
chain management for energy production, especially if clean energy aims to hold a
prominent place in the global energy template.

80
CHAPTER-3
Research Methodology

81
3.1 Introduction
Research means search for knowledge. Research methodology is a logical procedure of
identifying the research problem, gathering and analyzing data to find out the conclusion
and solution to a problem undertaken. This chapter covers the research methodology of
this study. It explains the need, importance, objectives and hypothesis of the study.
Research methodology states the procedure meant absolutely for the research design as
well as for the structure of the said research theme. This tends to highlight more on the
research procedure to work effectively. Thereby the idea of the research structure
encompasses for the intellectual potential to get some way in to the concept. The idea
which considers the research issues as well as the research aims, objectives and research
questions. According to Jill Collis and Roger Hussey (2003) for the successful research
analysis the researcher has to roll down on the technically approved techniques.
This technique satisfies the research framework which is meant for the proper
channelization of the research procedure. Thereby the researcher focuses on the
quantitative as well as qualitative data procedures to generate the data analysis.
Consequently the study covers sampling techniques, and various tools and techniques
used for the purpose of data analysis and interpretation.
3.2 Research Methodology
Research methodology consists of all the methods & techniques applied by the
researcher to carry on the research. It is a systematic procedure for solving a problem.
Gradually it specifies the flow of research. In essence the procedures by which
researchers go about their work of describing, elucidating and predicting phenomena is
called research methodology.
The aim of this research is to estimate the cost of procuring biomass feed stock and to
examine the loss of calorific value in various stages of supply chain (harvesting, storing,
handling and transportation) so that power stations will get biomass fuel of right

82
requirement in the right amount at the right time from resources which are
characteristically diverse and are seasonally dependent
3.3 Research design
Research design is an abstract structure with in which research is done. It helps in
collection, measurement and investigation of data. Research design is an outline of what
researcher will do from writing the assumptions to the final data analysis.
The entire study was done through the combination of qualitative and quantitative
approaches. For qualitative analysis interviews of key persons in companies ,
farmers and traders were conducted. For carrying out quantitative analysis primary
data was collected. The research done here is of exploratory and descriptive type.
Exploratory research is basically getting more information on the research topic.
Exploratory research is an introductory research conducted to increase under-
standing of a concept, to elucidate the exact nature of the problem to be solved, or to
recognize important variables to be studied. Descriptive research is used to describe
characteristics of a population or event being studied. This study has concentrated on
the supply chain components from the point of harvesting through to feeding in the
boiler at the power station.
Study involved mainly structured questions which were predetermined and looked-for
large number of respondents. Structured Surveys uses formal lists of questions asked of
all respondents in the same way. Questionnaire designed was a close ended
questionnaire with multiple choices & scaled questions. Closed ended questions include
all possible answers/prewritten response groups, and respondents are asked to select
among them.
3.4 Objectives of the Study
Research objectives must be clear, succinct and as a declarative statement. The
objectives of research study must be in a state to summarize that what is to be achieved

83
from the study. Based on the scope of the research, following objectives were
formulated. These objectives are:
1 To ascertain the extent of economic viability of using biomass feed stocks with
respect to fossil fuels for the power producers.
2 To illustrate how procurement mix of existing biomass feed stock reduces
overall power generation costs and assures regular availability of feed stocks.
3 To evaluate the loss of GCV of Mustard husk biomass feedstock during various
stages of Supply Chain Management.
4 To evaluate different transportation configurations which involve middle men
(stockiest, contractors and transporters, etc) that will add value in the existing
supply chain.
3.5 Research Hypothesis
After conducting the literature review, recognition of research gap and setting of
research objectives, research hypotheses had been developed. To fulfill the research
objectives, following hypotheses were formulated and tested using suitable statistical
techniques:
1 H0: There is no significant difference in cost of biomass procured by companies
for power generation using different mixes of fuel.
H1: There is a significant difference in cost of biomass procured by companies
for power generation using different mixes of fuel.
2 H0: There is no significant difference in GCV loss of biomass procured by
companies for power generation using different mixes of fuel.

84
H1: There is a significant difference in GCV loss of biomass procured by
companies for power generation using different mixes of fuel.
3 H0: There is no significant association between Supply chain stake holders and
mode of transportation of biomass
H1: There is a significant association between Supply chain stake holders and
mode of transportation of biomass
3.6 Research Variables
Procurement cost of Biomass
For procuring the biomass the companies take the help of the middlemen and the
farmers. The middlemen collect the biomass from the farmers and supply it to the power
generating units. It is the cost incurred by the companies in procuring biomass from the
source to the point where it is put to use. The procurement cost of biomass is less as
compared to that of coal.
Procurement cost = Cost incurred to purchase biomass (Rs per MT)
Handling cost of Mix
This is the cost incurred in handling biomass in the organization after it has been
supplied by the middlemen or the farmers i.e. to handle it from the yards to the boiler
area. As biomass is a bulky and voluminous material its handling cost is high as
compared to coal.
Handling cost = Cost incurred in handling biomass from yard to the boiler area (Rs per
MT)

85
Total procurement cost
The total procurement cost is the sum of procurement cost and the handling cost of
biomass.
Transportation cost
It is the cost incurred by the company in transporting biomass from the source to the
place of power generation.
Storage cost
The average storage cost is the cost incurred by the middlemen in storing the biomass at
his place after collecting it from the fields through the farmers or at his own.
Last year quantity of Biomass trading (in MT)
It is the amount of biomass supplied by the middlemen to the company in a year.
Ash content as residual of Fuel Mix
Ash content is the waste left out after biomass or coal is burnt to generate electricity.
Biomass mix ratio
This ratio shows the combination in the feedstock i.e. the amount of coal and the amount
of biomass used in the mix which is fed into the boiler.
Boiler efficiency
It is a rate at which the boiler runs efficiently. In short, 80-88% is the generated heating
value after the fuel is burnt by the boiler; the remaining of 12-20% is loss. Loss may be

86
due to radiating loss from boiler‘s adjacent wall, or due to incomplete combustion of the
fuel.
Thermal unit efficiency
It is the ratio of output of heat energy to the input. So, for a boiler that produces 210
kW (or 700,000 BTU/h) output for each 300 kW (or 1,000,000 BTU/h) heat-equivalent
input, its thermal efficiency is 210/300 = 0.70, or 70%. This means that 30% of the
energy is lost to the environment. The thermal efficiency is a dimensionless
performance measure of a device that uses thermal energy.
Power generated due to biomass with respect to total power generation in the plant
It is the amount of power generated due to biomass in the respect of total power
generation in the plant.
Gross calorific value of the mix
It is the heat produced by burning a unit quantity of a solid or liquid fuel at a constant
volume. The gross calorific value of coal is higher than that of biomass i.e. on burning
coal we get higher amount of heat energy as compared to biomass.
Cost per 1000 KCal energy using Mix (Rs) of fuel mix
The cost absorbed by the companies in generating 1000kcal of energy using the various
mixes of biomass and coal.
Cost of energy = Total Procurement cost of fuel / GCV of Fuel

87
Type of loss of GCV during storage
Loss of GCV during storage may be due to biomass blown away with the wind,
Moisture addition in biomass, or may be due to adulteration of biomass with sand.
GCV loss (%) of Fuel Mix
This is the loss in % in the gross calorific value of the fuel mix. There is a loss in GCV
of the fuel mix while storing and supplying it from the farmer to the companies.
3.7 Data
Primary data is collected through structured and planned questionnaire consisting of
close ended questions. Primary data is information gathered specially for the research
purpose. It is often gathered after the researcher has gained an insight into the issue by
assessing secondary research i.e. through Review of Literature.
Secondary Data is collected from published journals, literatures and reference books,
newspapers, magazines as well as reports published in science direct journals, MNRE
annual reports, biomass assessment study reports, Bioenergy India magazine etc
Qualitative data is collected through interviews conducted of key persons of
companies, selected traders and farmers. The qualitative analysis was done using
interview method. In this, interview schedules were prepared for three stakeholders
namely employees, traders and farmers. We had an interaction with the business heads
of nine companies and a detailed discussion with them regarding their strategies, future
prospects, problems and advantages of the use of biomass for power generation.
We had conversation with the selected middlemen regarding logistics problems in the
business of biomass, the merits and demerits they find in this business and other
troubles that come in their way while supplying this fuel from the farmers to the power
producers. We had interacted with some of the farmers also. With their limitations in

88
literacy levels, they were not able to define our requirement up to the expectations. So
we succeeded in having a small interview with them regarding the advantages and
disadvantages in selling the biomass husk to the middlemen or to the power producers.
3.8 Research Tool Design
The questionnaire method was used for primary data collection. The questionnaire is
designed in a manner grouping questions in accordance with the objectives of
research. Besides questionnaire other methods like interviews were also adopted to
enhance the progress of data collection through questionnaire and to observe closely
the hidden and unexplored aspects related to the objectives of the study.
Questionnaire was designed in two stages:
Stage 1: A rough draft was framed keeping in mind factors extracted from quantitative
research and by reviewing questionnaires from the research papers and journals.
Stage 2: The rough draft of questionnaire was discussed and reviewed with the industry
experts, renewable energy consultants and statisticians. Questionnaire was designed and
sent to industry experts, certain questions were removed and some were added as per
their advice. The final framework of questionnaire was designed as per the
recommendation of the experts and statisticians.

89
3.9 Sampling Methodology
1 Employees
Total 12 companies were there having different business models which were using
biomass as a feed stock for power generation in Kota region. Out of these 12 companies
only 9 companies responded. In our survey we found respondents covering
procurement, quality, technical/ engineering and costing departments having
approximately 250 employees. We tried to contact 125 employees (50% of total
population) and successfully 141 employees responded. All visits to the companies were
arranged by their respective HR departments. It was not an easy task to survey the
employees of private/ public organizations as the matter is confidential in terms of
strategies and figures. The list is given below.
Table 3.1
List of Companies
S No. Company Name
1 DCM Shriram Ltd.
2 ShriramRayons Ltd
3 Kalpataru Power
4 Surya Chambal Power Ltd.
5 Orient Green Power Ltd.
6 Goyal Proteins Ltd.
7 Ruchi Soya Industries Ltd.
8 Shiv Edibles Ltd.
9 S.M. Environmental Technologies Pvt. Ltd.
2 Traders
The information regarding the traders who are involved in the supply chain management
of biomass was gathered through the companies. In total 38 traders/middlemen
responded us and shared their business model as well as the difficulties faced by them.
Purposive sampling was done to select the traders.
90
3.10 Statistical Methods & Tools
Mainly One way ANOVA and Chi square tests were applied for carrying out the
analysis and for testing the hypothesis.
One way ANOVA
An ANOVA test is a way to find out if survey or experiment results are significant. In
other words, they help to figure out if there is a need to reject the null hypothesis or
accept the alternate hypothesis. Basically, in it groups are tested to see if there's a
difference between them. The analysis of variance frequently referred to as the ANOVA
is a statistical technique particularly designed to test whether the means of more than
two quantitative populations are equal. This technique was developed by, R. A. Fisher in
1920s and is capable of productive application to a diversity of practical problems.
Basically, in this classifying and cross classifying of statistical results is done and then
they are tested to see whether the means of a specified classification differ considerably
or not. In this way it is determined whether the given classification is significant in
affecting the results.
Chi-Square Test,
It is written as χ2 test, is a statistical hypothesis test that is valid to perform when the test
statistic is chi-square distributed under the null hypothesis, specially Pearson's chi-
square test and variants thereof. Pearson's chi-square test is used to find out whether
there is a statistically significant difference between the expected frequencies and the
observed frequencies in one or more groups of a contingency table.
For analysis MS Excel and SPSS 22.0 trial version were used for analysis.

91
3.11 Significance of Research
Through this research we are trying to estimate the cost of procuring biomass feed stock
and also trying to analyse the loss of calorific value in various stages of supply chain
(harvesting, storing, handling and transportation) so that power stations will get biomass
fuel of right measurement in the right amount at the right time from resources which are
very diverse and are seasonally dependent.
Very few research studies have been done in this area especially in Kota region. So this
study will definitely help the present power generating companies and the upcoming
companies with regard to the type of mix (biomass and coal) they should use in the form
of feedstock for generation of power. Distributed generation of power is possible using
biomass based electric power generation technologies. The large scale dispersion of
biomass power technologies depends on their delivered cost and consistency in direct
competition with conventional electricity sources in centralized electricity supply. In
India, the principal competing source for electricity supply is the coal based power.
Associated with conventional electric power plants are some negative social and
environmental issues. All through the coal and nuclear fuel cycles, there are significant
environmental and social damages. On the contrarily, biomass energy cost is highly
variable, depending upon the source, location etc and it also offers positive
environmental and social benefits. Biomass plantation is often a best way to recover
degraded lands and to generate considerable employment.
3.12 Research Problem and Research Gap
This study aims at filling the existing research gap in an emerging potential energy
scenario. Review of literature suggests that many studies have been done in the areas
related to biomass energy, biomass power generation and supply chain management of
biomass but very few or no studies have been done in the areas related to the
procurement cost of using biomass fuel, logistics and the means of supplying and
transporting biomass from the farmers end to the power generating end of the
companies.

92
This study begins with analyzing the stakeholders (employees, traders and farmers) of
the various power producing companies, who are using biomass as a feedstock for
power generation in Kota. The research work becomes more relevant in this region as it
addresses the supply chain considerations and the costs and benefits of procuring
biomass fuel on large scale for electricity generation at power stations. It is at this extent
of use that the logistics of biomass fuel supply is likely to be both intricate and
potentially challenging and logistic costs will have an important impact on the total
delivered cost of biomass. It is important to recognize that logistics costs and integrated
management of logistics activities play an important role to the success or failure of a
power station.
3.13 Limitations
In order to make the study more precise, specified and objective oriented, this
research has been confined to the Kota region. Data analysis is done for the
middlemen, employees and transporters attached to the selected power producers
of Kota region. Sample drawn from the selected region shall not be applicable to
any other part of country as supply chain is very specific to location and product
handled.
Very large data sampling was not possible as there are only few companies in
Kota region who are into this business of generating power using biomass.
Not possible to collect data from the farmers as they are not willing to respond
and tell much about themselves.
Due to competition in procurement of biomass companies are not publishing and
declaring statistics and data and they are not willing to disclose their
procurement strategies also.
Secondary data was not available to a larger extent as very less periodicals and
magazines are available.

93
CHAPTER-4
Interpretation
and
Analysis of Data

94
4.1 Introduction:
The purpose of the chapter is to highlight the outcomes of the study, resulted by the
application of analytical and statistical tools for testing the hypothesis. A wide variety of
researches related to biomass studies provides a good combination of theoretical and
practical insight into various proportions of this developing necessity-based energy
industry.
Data Analysis and Interpretation is a process of assigning a meaning to the information
gathered from the Data source (primary and secondary) and to draw conclusions out of
them. Data Analysis can be of two types qualitative and quantitative. In this research
both quantitative and qualitative data analysis is done.
A. QUANTITATIVE DATA ANALYSIS
4.2 General Profile:
In quantitative data analysis primary data was collected using questionnaires. Primary
data is information gathered specially for the research purpose. It is often gathered after
the researcher has gained an insight into the issue by assessing secondary research i.e.
through Review of Literature. The parameters of general profile are –the prominent
hardship in business, types of traders, locality of traders, total power generation capacity
of thermal unit, types of boilers and type of boilers * type of mix.
4.2.1 The prominent hardship in business of biomass
Various problems are being faced by the people who are involved in the business of
biomass. The major problems are fire, rains, problem of transporting, overloading,
chances of accident if trolleys are overloaded with the biomass husk. As can be seen in
the table 4.1, 47.4% suppliers say that theft, rains, overloading and fire are the main
problems faced by the people involved in the supply chain of biomass.
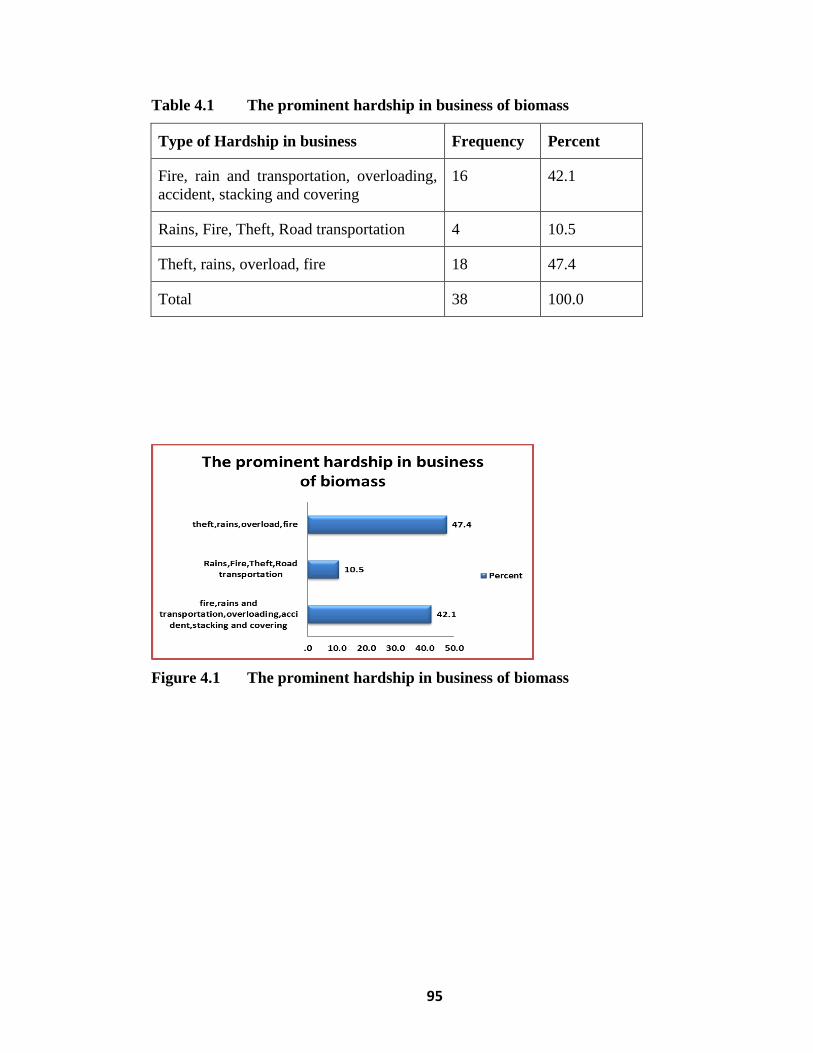
95
Table 4.1 The prominent hardship in business of biomass
Type of Hardship in business Frequency Percent
Fire, rain and transportation, overloading,
accident, stacking and covering
16 42.1
Rains, Fire, Theft, Road transportation 4 10.5
Theft, rains, overload, fire 18 47.4
Total 38 100.0
Figure 4.1 The prominent hardship in business of biomass
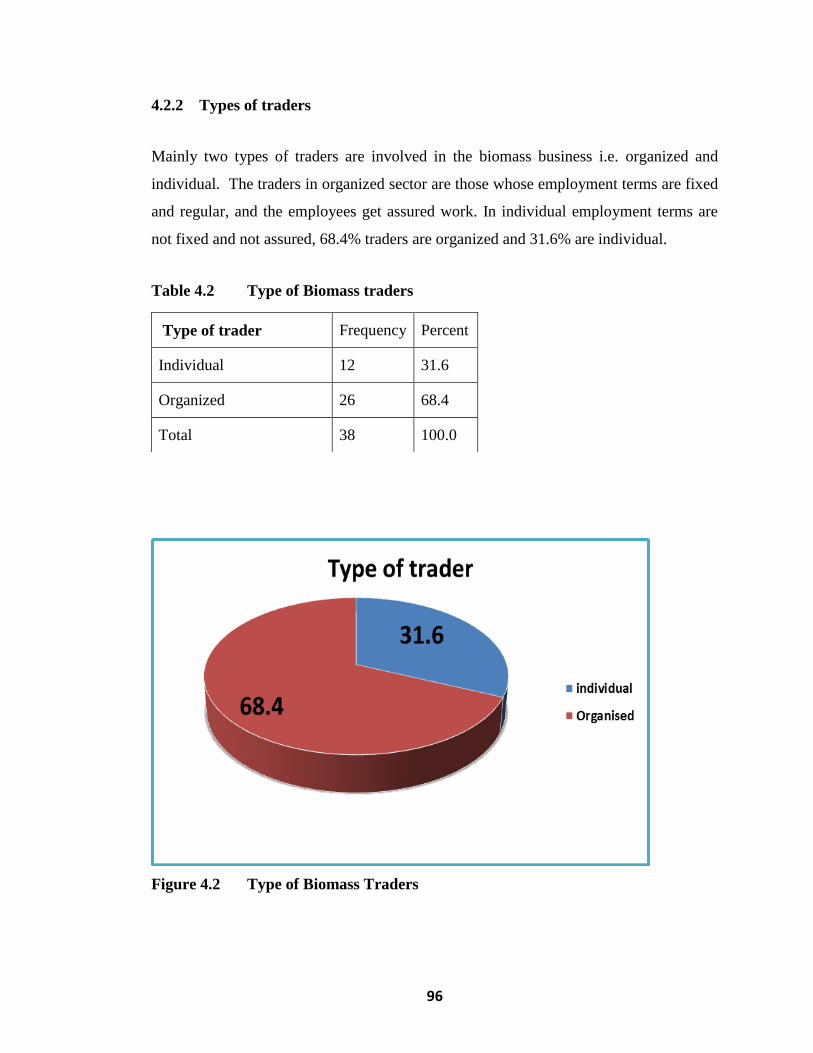
96
4.2.2 Types of traders
Mainly two types of traders are involved in the biomass business i.e. organized and
individual. The traders in organized sector are those whose employment terms are fixed
and regular, and the employees get assured work. In individual employment terms are
not fixed and not assured, 68.4% traders are organized and 31.6% are individual.
Table 4.2 Type of Biomass traders
Figure 4.2 Type of Biomass Traders
Type of trader Frequency Percent
Individual 12 31.6
Organized 26 68.4
Total 38 100.0

97
4.2.3 Locality of traders
Traders are categorized as rural and urban. Rural traders are those living in rural areas
i.e. nearby villages. They are having friendly contacts with the farmers in the villages
and so can be of good help to the power producing plants for supplying the biomass
husk through the farmers. Urban traders are those living in cities and the nearby areas.
Table 4.3 Locality of Biomass trader
Locality of trader Frequency Percent
Rural 20 52.6
Urban 18 47.4
Total 38 100.0
Figure 4.3 Locality of Biomass Traders

98
4.2.4 Total power generation capacity of thermal unit
The total power generation capacity of thermal unit is from 6-50 MW for most of the
companies
Table 4.4 Total power generation capacity of thermal unit
Total power generation capacity of thermal unit
No. %
6 – 50 MW 141 100.0
4.2.5 Type of Boiler
All the companies are using different types of boilers for utilization of different types of
feed stocks. Stoker fired boilers are used by 77.3% of people, Pressurized Fluidized bed
boilers are used by 12.1%, 10.6% people are using Bubbling fluidized bed boilers.
Mostly Stoker fired boilers are used as these types of boilers can be operated efficiently
on a variety of fuels namely rice husks, biomass, bagasse, wood, coal, etc. and/or with
supplementary fuels such as oil gas. The combustion efficiency for this system is far
better than the normal firing system.
In fluidized bed boilers, quick mixing ensures uniformity of temperature. The main
advantage of fluidized bed combustion system is that biomass, agricultural waste,
municipal waste, plant sludge, and other high moisture fuels can be used for heat
generation.
In Pressurized Fluidized bed boilers, the combustion machine and hot gas cyclones are
all enclosed in a pressure vessel. Coal has to be fed across the pressure vessel, and
similar provision for ash removal is there.

99
Table 4.5 Type of Boilers
Type of boiler
Type No. %
Stoker fired 109 77.3
Fluidized bed boilers 17 12.1
Bubbling fluidized bed boilers 15 10.6
Total 141 100.0
Figure 4.4 Type of Boilers

100
4.2.6 Type of boiler *Type of mix
The type of Boiler is selected according to the type of mix. When the mix is of Biomass
only type the boiler used is stoker fired boiler (85.6%). When coal major mix is used
then Pressurized Fluidized bed boilers are mostly used (71.4%).
Table 4.6 Type of boiler * Type of mix
Type of boiler * Type of mix
Type of mix
Total Biomass
only
Biomass
Major
Mix
Coal
Major
Mix
Type of
boiler
Stoker fired
Count 89 16 4 109
% within Type of
mix 85.6% 69.6% 28.6% 77.3%
Pressurized
Fluidized bed
boilers
Count 0 7 10 17
% within Type of
mix 0.0% 30.4% 71.4% 12.1%
Bubbling
fluidized bed
boilers
Count 15 0 0 15
% within Type of
mix 14.4% 0.0% 0.0% 10.6%
Total
Count 104 23 14 141
% within Type of
mix 100.0% 100.0% 100.0% 100.0%

101
4.3 OBJECTIVE 1:
To ascertain the extent of economic viability of using biomass feed stocks with
respect to fossil fuels for the power producers.
To illustrate how procurement mix of existing and new feedstock reduces overall
procurement costs and secures availability. How optimization of biomass procurement
supply chain using multiple feed stocks will increase profit margins of power producing
plants. Since Biomass is available at lower cost, economics is to be compared with coal
having higher cost. To illustrate this objective we have used four parameters namely
Availability, Procurement, Consumption & Residual Disposal.
4.3.1 Availability
Biomass of mustard crop is available mostly in the months when mustard is harvested
i.e. in the months of March-May. Mustard is a Rabi crop so after its harvesting season
its waste is utilized for energy generating purposes. Lowest availability of biomass is
from August-October, as can be seen below in table-4.7. Biomass is made available to
the power generating companies through the farmers or through the middle-men.
Table 4.7 Availability of Biomass in months
Sample Size - Traders (38)
Availability Months Frequency Percent
Highest availability month of
Biomass
March - April 20 52.6
April - May 18 47.4
Lowest availability month of
Biomass
August &September 28 73.7
September &October 10 26.3

102
4.3.1.1 Challenges faced by the power generating companies
Various challenges are being faced by the power generating companies to make the
biomass regularly available. 78% employees say that due to heavy rains, if the crop is
damaged then it leads to heavy loss to the crop in the fields and then in turn it leads to
the damage to the biomass. 67.4% employees are of the opinion that entry of new
consumer in the nearby area is a big hurdle for them and for 63.8% employees demand
supply gap is a very big challenge. Various challenges are depicted in Table 4.8 below:
Table 4.8 Challenges faced by the companies
Figure 4.5 Challenges faced by the companies
Sample Size - Employees (141)
Factor Options Yes Percent
Challenges
faced by the
companies
Heavy rains leading to crop damage 110 78.0
Entry of new consumer of biomass in the
region 95 67.4
Demand supply gap 90 63.8
Drought 89 63.1
All of the above 56 39.7

103
4.3.1.2 Strategies adopted by the power generating companies for increasing the
power generation through Biomass
For procuring the biomass various strategies are adopted by the employees of the power
generating companies as can be seen in the Table 4.9, 66.7% employees have
subcontracted the procurement activity by developing middlemen in the supply chain.
59.6% people are increasing the in-house storage capacity within the plant. 58.2%
employees monitor the rates of the market to wait for the favorable price of biomass in
the region and 58.2% have developed storage areas in the nearby regions.
Table 4.9 Strategies adopted by the power generating companies
Sample Size - Employees (141)
Factor Options Yes Percent
Strategies
adopted by the
power
generating
companies for
increasing the
power
generation
through Biomass
Sub-contracting of
procurement activity by
developing middle men in
supply chain management
94 66.7
Increasing the in-house
storage capacity within the
plant.
84 59.6
Market monitoring of rates to
wait for the favourable price
of biomass in the region
82 58.2
Development of storage area
in the region 82 58.2
Maximize the procurement
from nearest source to cater
the high demand supply gap
81 57.4
Development of alternate
ways of storing the biomass 75 53.2

104
Figure 4.6 Strategies adopted by the power generating companies
4.3.1.3 Biomass vendors
Biomass is mainly made available to the power generating companies by the farmers
and the middlemen. Analysis was done for finding out the relationship between the
types of biomass vendors and the type of fuel mix.
H01: There is no significant association between types of biomass vendors and the
type of mix.
H11: There is a significant association between types of biomass vendors and the
type of mix.

105
52.9% of employees who are using Biomass only are procuring biomass by the
middlemen. 78.3% of employees who are using Biomass major mix are mainly
procuring the mix by the stockiest and 85.7% of employees who are using coal major
mix are mainly procuring the mix by the stockiest as can be seen in the table 4.10. The P
value of chi square test is less than 0.05 and there is a significant association between
the types of biomass vendors and the types of mix therefore rejecting the null
hypothesis.
Table 4.10 Types of Biomass vendors and Type of mix
Type of mix Total
Biomass
only
Biomass
Major
Mix
Coal
Major
Mix
Types of
Biomass
vendors
Stockiest Count 14 18 12 44
% within
Type of mix
13.5% 78.3% 85.7% 31.2%
Middlemen
or Agent
Count 55 5 2 62
% within
Type of mix
52.9% 21.7% 14.3% 44.0%
Farmer Count 35 0 0 35
% within
Type of mix
33.7% 0.0% 0.0% 24.8%
Total Count 104 23 14 141
% within
Type of mix
100.0% 100.0% 100.0
%
100.0
%
Pearson Chi-Square Value Df P value
59.865 4 0.000
Inference: Null Hypothesis Rejected
106
4.3.2 Procurement
For procuring the biomass the companies take the help of the middlemen and the
farmers. The middlemen collect the biomass from the farmers and supply it to the power
generating units. The procurement cost of biomass is less as compared to that of coal.
4.3.2.1 Procurement cost of Biomass
H02: There is no significant difference among mean procurement costs of biomass
in different fuel mix.
H12: There is significant difference among mean procurement costs of biomass in
different fuel mix.
As can be seen in table 4.11 the mean value of procurement cost of biomass in biomass
only (mix) is 2391.12 Rs., in biomass major mix is 2670 Rs. and in coal major mix is
2756.57 Rs which shows that there is a significant association between procurement cost
of biomass in different fuel mix and the ANOVA P value is less than 0.05, hence
rejecting the null hypothesis.

107
Table 4.11 Comparison of Procurement cost of biomass - Fuel mix
Fuel Mix N Mean Std.
Deviation
Std.
Error Minimum Maximum
ANOVA Inference
of Null
Hypothesis F P
value
Biomass only 104 2391.12 388.489 38.095 2000.00 3400.00
12.765 0.000 Rejected
Biomass
Major Mix 23 2670.00 186.895 49.950 2345.00 3000.00
Coal Major
Mix 14 2756.57 175.958 36.690 2345.00 3000.00
Total 141 2478.42 375.750 31.644 2000.00 3400.00
Table 4.12 Multiple Comparisons of Procurement cost of Biomass
Multiple Comparisons
Dependent
Variable
(I) Type
of mix
(J) Type of
mix
Mean
Difference
(I-J)
Std. Error P value
Procurement cost
of biomass
Biomass
only
Biomass
Major Mix -365.450 80.110 .000
Biomass
only
Coal Major
Mix -278.885 98.975 .015
Biomass
Major Mix
Coal Major
Mix 86.565 117.852 .743

108
4.3.2.2 Handling cost of Biomass
This is the cost incurred in handling biomass in the organization after it has been
supplied by the middlemen or the farmers i.e. to handle it from the yards to the boiler
area. As biomass is a bulky and voluminous material its handling cost is high as
compared to coal.
H03: There is no significant difference among mean handling costs of biomass in
different fuel mix.
H13: There is significant difference among mean handling costs of biomass in
different fuel mix.
As can be seen in the table 4.13 the mean value of handling cost of biomass from
storage area to boiler feed is maximum in case of Biomass only i.e. 251.96 and least in
case of coal major mix i.e. 202.86 which shows that there is a significant association
between handling cost of biomass from storage area to boiler feed and the fuel mix. The
P value is less than 0.05 hence rejecting the null hypothesis.
Table 4.13 Comparison of Handling cost of biomass from storage area to boiler
feed - Fuel mix
Fuel Mix N Mean Std.
Deviation
Std.
Error Minimum Maximum
ANOVA In
fere
nce
of
Null
Hypo
thes
is
F P
value
Biomass
only
104 251.96 42.231 8.806 150.00 300.00
15.503 0.000
Rej
ecte
d
Biomass
Major Mix
23 205.57 21.436 5.729 150.00 250.00
Coal Major
Mix
14 202.86 39.294 3.853 142.00 300.00
Total 141 211.13 42.269 3.560 142.00 300.00

109
Table 4.14 Multiple Comparisons of Handling cost of Biomass
Multiple Comparisons
Dependent Variable (I) Type
of mix
(J) Type
of mix
Mean
Difference
(I-J)
Std. Error P value
Handling cost of
biomass from
storage area to boiler
feed
Biomass
only
Biomass
Major
Mix
-49.101 8.865 0.000
Biomass
only
Coal
Major
Mix
-2.716 10.952 0.967
Biomass
Major
Mix
Coal
Major
Mix
46.385 13.041 0.001
4.3.2.3 Total procurement cost
The total procurement cost is the sum of procurement cost and the handling cost of
biomass. The procurement cost of biomass is 2000 (minimum value) and
3400(maximum value) and the mean value is 2478 as shown in table 4.15. Handling
cost of biomass from storage area to boiler feed is 142 (minimum value) and maximum
value is 300 (maximum value) and 211 is the mean value .Adding the two costs gives us
the total procurement cost.
H04: There is no significant difference among mean total procurement costs of
biomass in different fuel mix.
H14: There is significant difference among mean total procurement costs of
biomass in different fuel mix.
The total procurement cost is Maximum (mean value) in case of coal major mix
(3447.16) and lowest in case of employees using Biomass only (2593.97) as shown in
table 4.16. This shows that there is a close association between total procurement cost

110
per MT of mix and the fuel mix. As P value is less than 0.05. Therefore Null hypothesis
is rejected.
Table 4.15 Total Procurement cost
Descriptive Statistics - Employees (141)
Minimum Maximum Mean SD
Procurement cost of
biomass 2000 3400 2478.42 375.750
Handling cost of
biomass from storage
area to boiler feed
142 300 211.13 42.269
Total Procurement cost 2185.00 3641.00 2689.55 398.845
Table 4.16 Comparison of Total Procurement Cost per MT of mix - Fuel mix
Fuel Mix N Mean Std.
Deviation
Std.
Error Minimum Maximum
ANOVA
Infe
rence
of
Null
Hypoth
esis
F P
value
Biomass
only 104 2593.97 409.482 40.153 2185.00 3641.00
41.281 0.000
Rej
ecte
d Biomass
Major
Mix
23 3037.59 178.144 37.146 2629.92 3290.30
Coal
Major
Mix
14 3447.16 250.511 66.952 3003.50 3761.00
Total 141 2751.05 463.087 38.999 2185.00 3761.00

111
Table 4.17 Multiple Comparisons of Total Procurement Cost per MT of mix
Multiple Comparisons
Dependent Variable (I) Type
of mix
(J) Type
of mix
Mean
Difference
(I-J)
Std. Error P value
Total Procurement Cost
per MT of mix
Biomass
only
Biomass
Major
Mix
-443.614 85.012 0.000
Biomass
only
Coal
Major
Mix
-853.188 105.032 0.000
Biomass
Major
Mix
Coal
Major
Mix
-409.574 125.064 0.004
4.3.2.4 Transportation cost
It is the cost incurred by the company in transporting biomass from the source to the
place of power generation.
H05: There is no significant difference among mean transportation costs of biomass
in different fuel mix.
H15: There is significant difference among mean transportation costs of biomass in
different fuel mix.
The transportation cost‘s mean value is maximum in case of middle men(1.34) as
indicated in table 4.18 and less in case of stockiest(1.08) which shows that there is a
significant association between average transportation cost of Biomass per Km per MT
(in Rs.) and the supplier. As P value is less than 0.05 hence null hypothesis is rejected.

112
Table 4.18 Comparison of Average transportation cost of Biomass / Km / MT
(in Rs.) – Supplier
Supplier N Mean Std.
Deviation
Std.
Error Min Max
ANOVA
Infe
rence
of
Null
Hypoth
esis
F P value
Stockiest 18 1.08 0.094 0.022 1.00 1.20
10.781 0.000
Rej
ecte
d
Middlemen
or Agent 10 1.34 0.196 0.062 1.00 1.50
Farmer 10 1.16 0.158 0.050 1.00 1.40
Total 38 1.17 0.177 0.029 1.00 1.50
Table 4.19 Multiple Comparisons of Average transportation cost of Biomass /
Km / MT (in Rs.)
Multiple Comparisons
Dependent Variable
(I) Role in
Biomass
supply
chain
(J) Role in
Biomass
supply
chain
Mean
Difference
(I-J)
Std.
Error P value
Average
transportation cost of
Biomass per Km per
MT (in Rs.)
Stockiest Middlemen
or Agent -0.262 0.057 0.000
Stockiest Farmer 0.180 0.064 0.022
Middlemen
or Agent Stockiest 0.262 0.057 0.000
4.3.2.5 Storage cost
The average storage cost is the cost incurred by the middlemen in storing the biomass at
his place after collecting it from the fields through the farmers or at his own.
H06: There is no significant difference among mean storage costs of biomass in
different fuel mix.
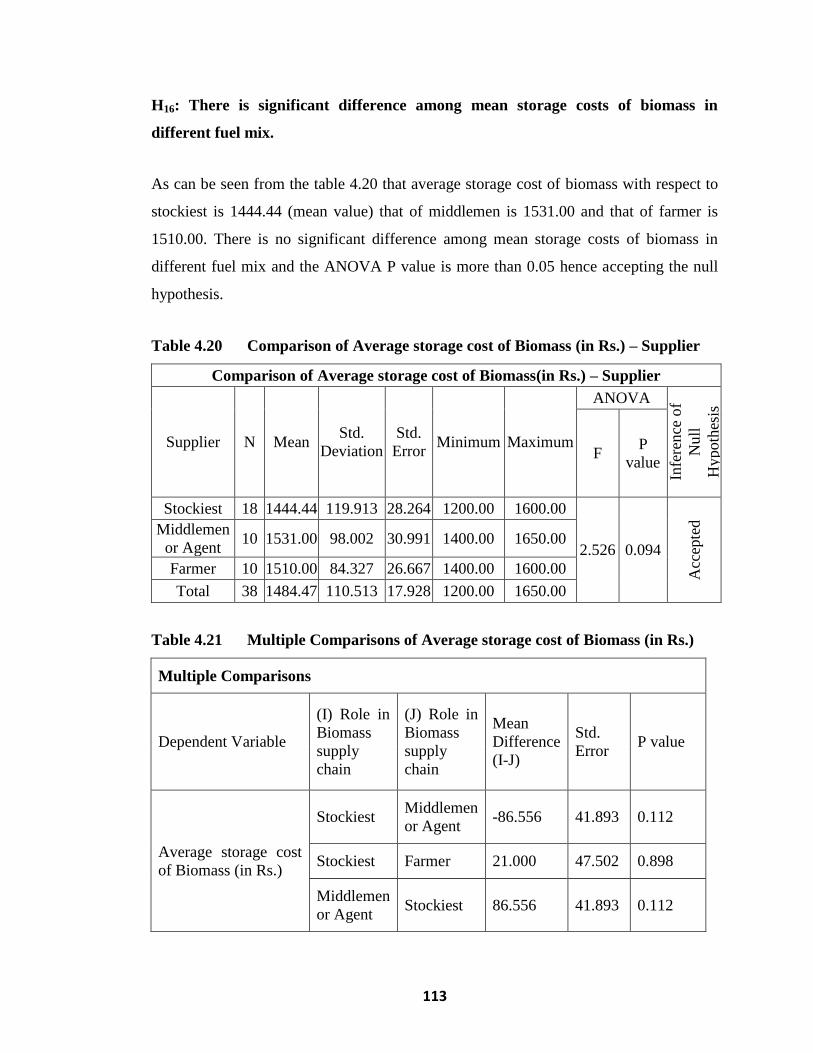
113
H16: There is significant difference among mean storage costs of biomass in
different fuel mix.
As can be seen from the table 4.20 that average storage cost of biomass with respect to
stockiest is 1444.44 (mean value) that of middlemen is 1531.00 and that of farmer is
1510.00. There is no significant difference among mean storage costs of biomass in
different fuel mix and the ANOVA P value is more than 0.05 hence accepting the null
hypothesis.
Table 4.20 Comparison of Average storage cost of Biomass (in Rs.) – Supplier
Comparison of Average storage cost of Biomass(in Rs.) – Supplier
Supplier N Mean Std.
Deviation
Std.
Error Minimum Maximum
ANOVA
Infe
rence
of
Null
Hypoth
esis
F P
value
Stockiest 18 1444.44 119.913 28.264 1200.00 1600.00
2.526 0.094
Acc
epte
d
Middlemen
or Agent 10 1531.00 98.002 30.991 1400.00 1650.00
Farmer 10 1510.00 84.327 26.667 1400.00 1600.00
Total 38 1484.47 110.513 17.928 1200.00 1650.00
Table 4.21 Multiple Comparisons of Average storage cost of Biomass (in Rs.)
Multiple Comparisons
Dependent Variable
(I) Role in
Biomass
supply
chain
(J) Role in
Biomass
supply
chain
Mean
Difference
(I-J)
Std.
Error P value
Average storage cost
of Biomass (in Rs.)
Stockiest Middlemen
or Agent -86.556 41.893 0.112
Stockiest Farmer 21.000 47.502 0.898
Middlemen
or Agent Stockiest 86.556 41.893 0.112

114
4.3.3 Consumption
It is the amount of Biomass consumed by the various power generating organizations.
H07: There is no significant difference among mean consumption of biomass in
different fuel mix.
H17: There is significant difference among mean consumption of biomass in
different fuel mix.
As can be seen in the table 4.22 the mean value of last year consumption of Biomass in
different fuel mix is, 50026.87 MT in biomass major mix, 49150.68 in Biomass only
mix which shows that there is a significant association between the last year
consumption of biomass and the type of fuel mix. The p value is less than 0.05 hence
rejecting the null hypothesis.

115
Table 4.22 Last year consumption of Biomass (in MT) - Fuel Mix
Table 4.23 Last year consumption of Biomass (in MT)
Dependent Variable (I) Type
of mix
(J) Type of
mix
Mean
Difference
(I-J)
Std. Error P value
Last year
consumption of
Biomass (in MT)
Biomass
only
Biomass
Major Mix
-876.187 4467.120 0.979
Biomass
only
Coal Major
Mix
22494.540 5519.080 0.000
Biomass
Major
Mix
Coal Major
Mix
23370.727 6571.724 0.001
N Mean
Std.
Deviation Std. Error Minimum Maximum
ANOVA
Infe
rence
of
Null
Hypoth
esis
F P
value
Biomass
only 104 49150.68 20464.244 2006.684 23000.00 80000.00
8.628 0.000
Rej
ecte
d
Biomass
Major
Mix
23 50026.87 19190.272 4001.448 23000.00 64915.00
Coal
Major
Mix
14 26656.14 6963.311 1861.023 23000.00 50000.00
Total 141 47060.11 20415.779 1719.319 23000.00 80000.00
116
4.3.3.1 Last year quantity of Biomass trading (in MT)
It is the amount of biomass supplied by the middlemen to the company in a year.
H08: There is no significant difference among mean quantity of biomass been
supplied by the middleman in last year to the companies using different fuel mix.
H18: There is significant difference among mean quantity of biomass been supplied
by the middleman in last year to the companies using different fuel mix.
As can be seen in the table 4.24 mean value of last year quantity of Biomass trading (in
MT) as done by the middle men is 35049.00 and as done by farmer is 26000.00 which
shows that there is a significant association between the quantity of trading and the
supplier. The p value is less than 0.05 hence rejecting the null hypothesis.

117
Table 4.24 Comparison of Last year quantity of Biomass trading (in MT) -
Supplier
Table 4.25 Multiple Comparisons of Last year quantity of Biomass trading (in
MT)
Multiple Comparisons
Dependent
Variable
(I) Role in
Biomass
supply
chain
(J) Role in
Biomass
supply
chain
Mean
Difference
(I-J)
Std. Error P value
Last year quantity
of Biomass trading
(in MT)
Stockiest Middlemen
or Agent
-3049.000 2856.646 0.540
Stockiest Farmer 6000.000 2856.646 0.104
Middlemen
or Agent
Farmer 9049.000 3239.132 0.022
Comparison of Last year quantity of Biomass trading (in MT) - Supplier
Supplier N Mean Std.
Deviation Std. Error Minimum Maximum
Infe
rence
of
Null
Hypoth
esis
F P
value
Stockiest 18 32000.00 8838.419 2083.235 18000.00 50000.00
4.099 0.025
Rej
ecte
d Middleme
n or Agent 10 35049.00 5774.427 1826.034 25000.00 40000.00
Farmer 10 26000.00 4807.402 1520.234 23000.00 35000.00
Total 38 31223.42 7826.054 1269.554 18000.00 50000.00

118
4.3.4 Residual Disposal
Residual disposal is the waste left out after Biomass or coal is used as a feedstock to
generate electricity. The amount of ash content in coal is very high as compared to
Biomass.
H09: There is no significance difference among mean ash content as residual of Fuel
Mix
H19: There is significance difference among mean ash content as residual of Fuel
Mix
As depicted in table 4.26 that the mean value of ash content of Coal major mix is
30.46% and of Biomass major mix is 9.60% and of biomass only is 8.17% which shows
that coal has more of ash content. So it shows that there is a close association between
ash content as residual of fuel mix. The ANOVA P value is less than 0.05. Hence
rejecting the null hypothesis.
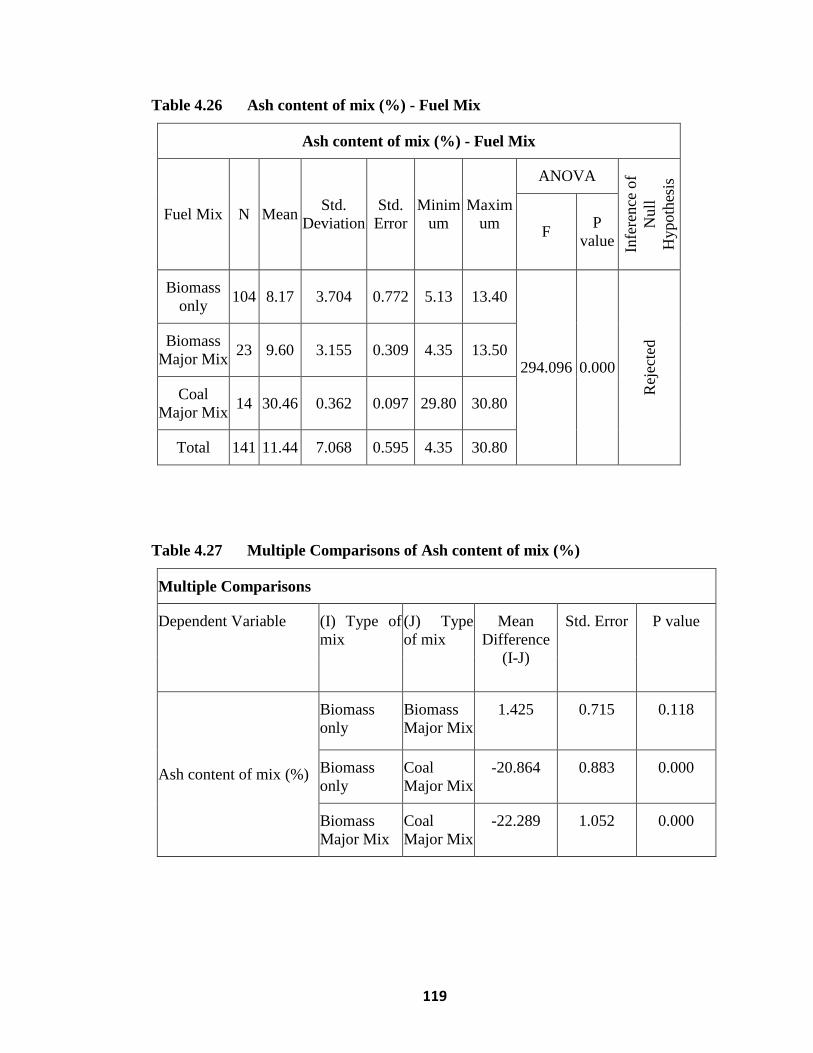
119
Table 4.26 Ash content of mix (%) - Fuel Mix
Ash content of mix (%) - Fuel Mix
Fuel Mix N Mean Std.
Deviation
Std.
Error
Minim
um
Maxim
um
ANOVA
Infe
rence
of
Null
Hypoth
esis
F P
value
Biomass
only 104 8.17 3.704 0.772 5.13 13.40
294.096 0.000
Rej
ecte
d Biomass
Major Mix 23 9.60 3.155 0.309 4.35 13.50
Coal
Major Mix 14 30.46 0.362 0.097 29.80 30.80
Total 141 11.44 7.068 0.595 4.35 30.80
Table 4.27 Multiple Comparisons of Ash content of mix (%)
Multiple Comparisons
Dependent Variable (I) Type of
mix
(J) Type
of mix
Mean
Difference
(I-J)
Std. Error P value
Ash content of mix (%)
Biomass
only
Biomass
Major Mix
1.425 0.715 0.118
Biomass
only
Coal
Major Mix
-20.864 0.883 0.000
Biomass
Major Mix
Coal
Major Mix
-22.289 1.052 0.000

120
4.4 OBJECTIVE 2:
To illustrate how procurement mix of existing biomass feed stock reduces overall
power generation costs and assures regular availability of feed stocks.
To optimize the mixing ratio of biomass with coal as a feedstock and to find out whether
the low gross calorific value and low cost biomass is more beneficial to the companies
as compared to the high cost coal having high gross calorific value.
To illustrate this objective certain factors are taken into consideration
1) Biomass mix ratio
2) Technical engineering difficulties
3) Engineering changes done in the plant to facilitate the use of biomass
4) Boiler efficiency
5) Thermal unit efficiency
6) Power generated due to biomass with respect to total power generation in the
plant
7) Gross calorific value
8) Cost per 1000 KCal energy
4.4.1 Biomass mix ratio
This ratio shows the combination in the feedstock i.e. the amount of coal and the
amount of biomass used in the mix which is feeded into the boiler. As can be seen in
the table 4.28 that 104 employees are using 0% coal and 100% Biomass (Biomass

121
only), 23 employees are using majorly biomass and very less coal (Biomass major
mix) and Only 14 employees are using around 93-94% coal and 6-7% biomass (Coal
major),
Table 4.28 Biomass mix ratio ( Coal: Biomass) in the boiler fuel
Coal, Biomass Name of Mix No. %
0,100 Biomass only 104 73.8
3,97 Biomass major 9 6.4
4,96 Biomass major 4 2.8
6,94 Biomass major 5 3.5
7,93 Biomass major 5 3.5
93,7 Coal major 6 4.3
94,6 Coal major 8 5.7
Total 141 100.0
Figure 4.7 Biomass mix ratio ( Coal: Biomass) in the boiler fuel

122
4.4.2 Technical and engineering difficulties faced by the power generating
companies
For making the biomass available various technical and engineering difficulties are
faced by the companies. These are depicted in table-4.29. 66% employees are of the
opinion that Biomass is prone to catch fire, if left in open especially in the hot
summer days. 65.2% employees are pointing out that large storage area is needed
due to very low bulk density of Biomass. 63.1% employees feel that there are
deposits in super heater area of the boiler which create problems for the employees.
Table 4.29 Technical / engineering difficulties faced in using biomass
Factor Options Yes Percent
Technical /
engineering
difficulties faced
in using biomass
Prone to catch fire 93 66.0
Large storage area due
to very low bulk density 92 65.2
Deposits in super heater
area 89 63.1
Figure 4.8 Technical / engineering difficulties faced in using biomass

123
4.4.3 Engineering changes done in the plant to facilitate the use of biomass
Many engineering and technical changes are done by the plant to aid in the use of
biomass. 58.9% employees use additional infrastructure to feed the biomass in the
boiler. Modification is done in the boiler area by 55.3% employees, this is done
mostly by those companies who are previously using coal or any other fossil fuel
and then switching over to Biomass. Resizing of steam control unit is done by
44.7% employees as can be seen in table 4.30
Table 4.30 Engineering changes done in the plant to facilitate the use of biomass
Factor Options Yes Percent
Engineering
changes done
in the plant to
facilitate the
use of
biomass
Additional infrastructure to
feed the biomass in the boiler 83 58.9
Modification in boiler area 78 55.3
Resizing of steam control
unit 63 44.7
Figure 4.9 Engineering changes done in the plant to facilitate the use of biomass

124
4.4.4 Boiler efficiency
Boiler efficiency is a measure of how effectively chemical energy in fuel is
converted into heat energy in steam which is supplied to the turbines. In order to
calculate boiler efficiency, total energy output of a boiler is divided by total energy
input given to the boiler, multiplied by hundred.
H010: There is no significant association between boiler efficiency and type of
fuel mix
H110: There is significant association between boiler efficiency and type of fuel
mix
In the table 4.31 below boiler efficiency is in the range of 70-80% when 76.9% of
the employees are those who are using Biomass only mix. The efficiency is between
80-90% when 92.9% employees are those who are using coal major mix. The
Pearson chi square value is less than 0.05 and there is significant association
between boiler efficiency and the type of mix the null hypothesis is therefore
rejected.

125
Table 4.31 Boiler efficiency * Type of mix
Type of mix
Total Biomass
only
Biomass
Major
Mix
Coal
Major
Mix
Boiler
efficiency
Below
70.0 %
Count 5 0 0 5
% within
Type of mix 4.8% 0.0% 0.0% 3.5%
70.1 –
80.0 %
Count 80 14 1 95
% within
Type of mix 76.9% 60.9% 7.1% 67.4%
80.1 –
90.0 %
Count 19 9 13 41
% within
Type of mix 18.3% 39.1% 92.9% 29.1%
Total
Count 104 23 14 141
% within
Type of mix 100.0% 100.0% 100.0% 100.0%
Pearson Chi-Square Value df
Asymp. Sig. (2-
sided)
35.432 4 .000
Figure 4.10 Boiler efficiency * Type of mix

126
4.4.5 Thermal unit efficiency
The thermal efficiency of a boiler is the effectiveness of the heat exchanger of the
boiler which transfers the heat energy from fireside to water side. Thermal efficiency
is badly affected by the formation of scales or soot on the boiler tubes.
H011: There is no significant association between Thermal unit efficiency and
type of fuel mix
H111: There is significant association between Thermal unit efficiency and type
of fuel mix
As can be seen from the table 4.32 the thermal unit efficiency is between 25-30%
when 50% employees are those who are using Biomass only mix, and 39%
employees are those who are using biomass major mix The thermal unit efficiency is
above 45% when the users are majorly biomass ones.
The Pearson chi square value is less than 0.05. Hence the null hypothesis is rejected.
This shows that there is a significant association between thermal unit efficiency and the
types of mixes.

127
Table 4.32 Thermal unit efficiency * Type of mix
Type of mix
Total Biomass
only
Biomass
Major
Mix
Coal
Major
Mix
Thermal
unit
efficiency
25.1 –
30.0 %
Count 52 9 14 75
% within
Type of mix 50.0% 39.1% 100.0% 53.2%
30.1 –
40.0 %
Count 39 14 0 53
% within
Type of mix 37.5% 60.9% 0.0% 37.6%
Above
45.0 %
Count 13 0 0 13
% within
Type of mix 12.5% 0.0% 0.0% 9.2%
Total
Count 104 23 14 141
% within
Type of mix 100.0% 100.0% 100.0% 100.0%
Pearson Chi-Square Value Df
Asymp. Sig. (2-
sided)
20.025 4 .000
Figure 4.11 Thermal unit efficiency * Type of mix

128
4.4.6 Power generated due to biomass with respect to total power generation in
the plant
H012: There is no significant association between Power generated due to
biomass and type of fuel mix
H112: There is significant association between Power generated due to biomass
and type of fuel mix
According to this table 4.33 Maximum power is generated (81-100%) by Biomass
only i.e. when companies are using more of biomass (76%) at that time maximum
power is generated. When majorly coal mix is being used i.e. 78.6% at that time
only 6-10% power is generated. The Pearson chi square value is less than 0.05
which shows that there is a significant association between power generated due to
biomass with respect to total power generation in the plant and the type of mix.
Therefore rejecting the null hypothesis.
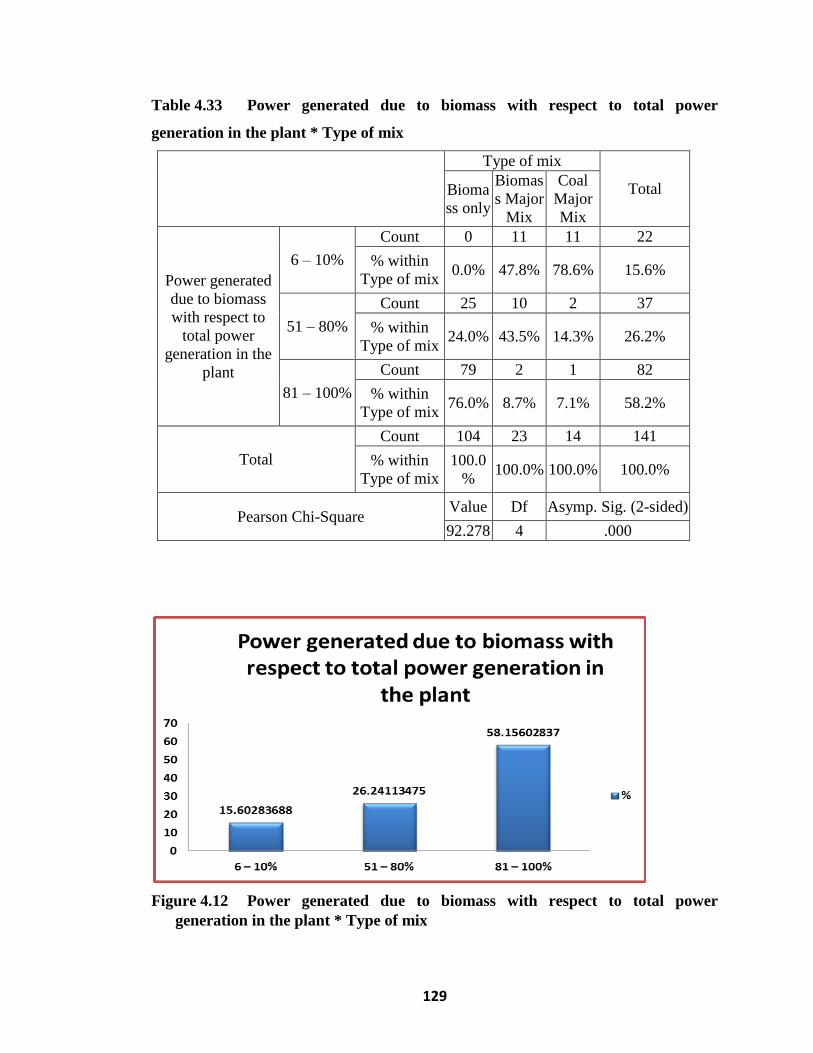
129
Table 4.33 Power generated due to biomass with respect to total power
generation in the plant * Type of mix
Type of mix
Total Bioma
ss only
Biomas
s Major
Mix
Coal
Major
Mix
Power generated
due to biomass
with respect to
total power
generation in the
plant
6 – 10%
Count 0 11 11 22
% within
Type of mix 0.0% 47.8% 78.6% 15.6%
51 – 80%
Count 25 10 2 37
% within
Type of mix 24.0% 43.5% 14.3% 26.2%
81 – 100%
Count 79 2 1 82
% within
Type of mix 76.0% 8.7% 7.1% 58.2%
Total
Count 104 23 14 141
% within
Type of mix
100.0
% 100.0% 100.0% 100.0%
Pearson Chi-Square Value Df Asymp. Sig. (2-sided)
92.278 4 .000
Figure 4.12 Power generated due to biomass with respect to total power
generation in the plant * Type of mix

130
4.4.7 Gross calorific value of the mix
It is the heat produced by combustion of unit quantity of a solid or liquid fuel when
burnt at a constant volume. The Gross calorific value of coal is higher than that of
biomass i.e. on burning coal we get higher amount of heat energy as compared to
biomass.
H013: There is no significance difference among mean gross calorific value of fuel
mix
H113: There is significance difference among mean gross calorific value of fuel mix
The mean value of GCV of coal mix (4280.17) is the highest among all the three
mixes as can be seen in the table 4.34 whereas the GCV of biomass only (3142.28)
and biomass major (3183.61) is less. The ANOVA P value is less than 0.05 which
shows that there is a close association between GCV of mix and types of mixes.
Therefore null hypothesis is rejected.
Table 4.34 Descriptives of GCV of mix (Kcal/Kg)
N Mean
Std.
Deviatio
n
Std.
Error
95% Confidence
Interval for Mean
Minim
um
Maxi
mum
Lower
Bound
Upper
Bound
GCV
of mix
(Kcal/
Kg)
Biomass
only 104 3142.288 360.668 35.366 3072.1474 3212.4295 2100.0 3667.0
Biomass
Major
Mix
23 3183.610 116.281 24.246 3133.3263 3233.8937 3018.0 3427.0
Coal
Major
Mix
14 4280.179 186.262 49.780 4172.6344 4387.7241 3823.0 4424.1
Total 141 3262.011 465.159 39.173 3184.5628 3339.4591 2100.0 4424.1

131
Table 4.35 ANOVA Tool for GCV of mix (Kcal/Kg)
ANOVA
Sum of
Squares df
Mean
Square F Sig.
GCV of mix
(Kcal/Kg)
Between
Groups
16145390.265 2 8072695.133 78.747 0.000
Within
Groups
14146920.846 138 102513.919
Total 30292311.112 140
Table 4.36 Multiple Comparisons of GCV of mix (Kcal/Kg)
Dependent
Variable
(I) Type
of mix
(J) Type
of mix
Mean
Difference
(I-J)
Std.
Error
Sig. 95% Confidence
Interval
Lower
Bound
Upper
Bound
GCV of mix
(Kcal/Kg)
Biomass
only
Biomass
Major Mix
-41.321 73.775 .841 -216.1160 133.4729
Biomass
only
Coal
Major Mix
-1137.890 91.148 .000 -1353.8475 -921.9341
Biomass
Major
Mix
Coal
Major Mix
-1096.569 108.533 .000 -1353.7150 -839.4235

132
4.4.8 Cost per 1000 Kcal energy using Mix (Rs.) of fuel mix
In this parameter we are trying to analyze the cost absorbed by the companies in
generating 1000KCal of energy using the various mixes of biomass and coal.
H014: There is no significance difference among mean Cost per 1000 Kcal energy
using Mix (Rs.) of Fuel Mix
H114: There is significance difference among mean Cost per 1000 Kcal energy using
Mix (Rs.) of Fuel Mix
Cost of coal major mix is (0.8081), of biomass only mix is (0.8539) and of biomass
major mix is (0.9558) as can be seen in the table 4.37 below. This shows that there is no
significant association of the cost used to generate 1000 KCal of energy with the mixes.
The ANOVA P value is more than 0.05. Hence the null hypothesis is accepted.
Table 4.37 Descriptives of Cost per 1000 Kcal energy using Mix (Rs)
N Mean
Std.
Devi
ation
Std.
Error
95%
Confidence
Interval for
Mean Mini
mum
Maxi
mum
Lower
Bound
Upper
Bound
Cost
per
1000
Kcal
energy
using
Mix
(Rs)
Biomass
only 104 .8539 .266 .026 .802 .906 .63 1.66
Biomass
Major
Mix
23 .9558 .072 .015 .924 .987 .79 1.07
Coal
Major
Mix
14 .8081 .084 .022 .760 .856 .68 .98
Total 141 .8660 .235 .020 .827 .905 .63 1.66

133
Table 4.38 ANOVA Tool for Cost per 1000 Kcal energy using Mix (Rs)
ANOVA
Sum of
Squares df
Mean
Square F Sig.
Cost per 1000
Kcal energy
using Mix (Rs)
Between
Groups .248 2 .124
2.289 .105 Within
Groups 7.471 138 .054
Total 7.719 140
Table 4.39 Multiple Comparisons of Cost per 1000 Kcal energy using Mix (Rs)
Dependent
Variable
(I) Type
of mix
(J) Type
of mix
Mean
Difference
(I-J)
Std.
Error Sig.
95%
Confidence
Interval
Lower
Bound
Upper
Bound
Cost per
1000 Kcal
energy using
Mix (Rs)
Biomass
only
Biomass
Major
Mix
-.101932 .053612 .142 -
.22895 .02509
Biomass
only
Coal
Major
Mix
.045823 .066238 .769 -
.11111 .20276
Biomass
Major
Mix
Coal
Major
Mix
.147755 .078871 .150 -
.03911 .33462

134
4.5 OBJECTIVE 3:
To evaluate the loss of GCV of Mustard husk biomass feedstock during various
stages of Supply Chain Management.
At every stage of supply chain management i.e. starting from the farmers to the power
producing companies there is a loss of GCV in the biomass husk, as we store biomass
for a longer time its heat generating capacity is reduced to certain extent approx 1%. It is
due to many reasons.
To illustrate this objective certain factors are taken into consideration
Type of loss of GCV during storage, Type of loss of GCV during storage * Type of mix
Type of loss of GCV during storage * Types of Biomass vendors, GCV loss (%):-
4.5.1 Type of loss of GCV during storage
While looking at the table 4.40 it is seen that during storage biomass can be blown away
with the wind and during the rainy season addition of moisture is there into it as biomass
has to be left in open. It is also adulterated with sand and stone pieces etc. As biomass
gets mixed with these foreign particles its heat producing capacity gets reduced and
hence the GCV is lost. Coal has a high calorific value and adulteration of coal is less as
compared to biomass so less heat loss is there in case of coal.
Table 4.40 Type of loss of GCV during storage
No. %
Biomass blown away with the wind 46 32.6
Moisture addition in biomass 62 44.0
Adulteration of biomass with sand 33 23.4
Total 141 100.0

135
Figure 4.13 Type of loss of GCV during storage
4.5.2 Type of loss of GCV during storage * Type of mix
H015: There is no significant association between Type of loss of GCV during
storage and Type of mix
H115: There is significant association between Type of loss of GCV during
storage and Type of mix
If we look at the table 4.41 below it is observed that maximum biomass is blown
away with the wind when mix is of biomass only type (44.2%). Maximum moisture
addition is done in the biomass when the mix is biomass major mix (52.2%) and
biomass only (40.4%). Adulteration of biomass with sand is done maximum when
the mix is biomass major mix or biomass only type. This shows that there is
significant association between type of loss of GCV during storage and the type of
mix. The Chi square value is less than 0.05. Therefore, rejecting the null hypothesis.

136
Table 4.41 Type of loss of GCV during storage * Type of mix
Type of mix
Total Biomass
only
Biomass
Major
Mix
Coal
Major
Mix
Type of
loss of
GCV
during
storage
Biomass blown away
with the wind
Count 46 0 0 46
% within
Type of mix 44.2% 0.0% 0.0% 32.6%
Moisture addition in
biomass
Count 42 12 8 62
% within
Type of mix 40.4% 52.2% 57.1% 44.0%
Adulteration of
biomass with sand
Count 16 11 6 33
% within
Type of mix 15.4% 47.8% 42.9% 23.4%
Total
Count 104 23 14 141
% within
Type of mix 100.0% 100.0% 100.0% 100.0%
Pearson Chi-Square Value df
Asymp. Sig. (2-
sided)
28.557 4 .000

137
4.5.3 Type of loss of GCV during storage * Types of Biomass vendors
As can be seen in the table 4.42 that maximum biomass is blown away with wind
when the vendors are the farmers. Maximum moisture addition is done in biomass
when the vendor is the stockiest. Maximum adulteration of biomass with sand is
done when the vendors are the middlemen
H016: There is no significant association between Type of loss of GCV during
storage and Types of Biomass vendors
H116: There is significant association between Type of loss of GCV during
storage and Types of Biomass vendors
As the chi square value is less than 0.05 and the type of loss of GCV during storage
is significantly associated with the types of vendors the null hypothesis is rejected.

138
Table 4.42 Type of loss of GCV during storage * Types of Biomass vendors
Types of Biomass vendors
Total Stockiest
Middlemen
or Agent Farmer
Type of
loss of
GCV
during
storage
Biomass blown
away with the
wind
Count 1 26 19 46
% within Types
of Biomass
vendors
2.3% 41.9% 54.3% 32.6%
Moisture
addition in
biomass
Count 32 21 9 62
% within Types
of Biomass
vendors
72.7% 33.9% 25.7% 44.0%
Adulteration of
biomass with
sand
Count 11 15 7 33
% within Types
of Biomass
vendors
25.0% 24.2% 20.0% 23.4%
Total
Count 44 62 35 141
% within Types
of Biomass
vendors
100.0% 100.0% 100.0% 100.0%
Pearson Chi-Square Value df
Asymp. Sig. (2-
sided)
31.70957 4 .000

139
4.5.4 GCV loss (%):-
H017: There is no significance difference among mean GCV loss (%) of fuel mix
H117: There is significance difference among mean GCV loss (%) of fuel mix
The mean value of GCV loss in mix% is maximum in case of biomass major mix
(5.6974). In case of coal major mix it is (3.6236) and in case of biomass only it is
(5.5865) which shows that GCV loss is minimum in case of coal major mix. There is
significant difference among mean GCV loss% of fuel mixes. The ANOVA P value
is less than 0.05. Hence the null hypothesis is rejected.
Table 4.43 Descriptives of GCV loss in mix (%)
N Mean
Std.
Deviation
Std.
Error
95%
Confidence
Interval for
Mean Minimu
m Maximum
Lower
Bound
Upper
Bound
GCV
loss in
mix
(%)
Biomass
only 104 5.5865 2.96782 .29102 5.0094 6.1637 1.00 10.00
Biomass
Major
Mix
23 5.6974 2.25912 .47106 4.7205 6.6743 1.24 9.76
Coal
Major
Mix
14 3.6236 1.35361 .36177 2.8420 4.4051 1.14 5.24
Total 141 5.4097 2.79431 .23532 4.9445 5.8750 1.00 10.00

140
Table 4.44 ANOVA Tool for GCV loss in mix (%)
ANOVA
Sum of
Squares df
Mean
Square F Sig.
GCV
loss in
mix
(%)
Between Groups 49.819 2 24.910
3.295 .040 Within Groups 1043.321 138 7.560
Total 1093.140 140
Table 4.45 Multiple Comparisons of GCV loss in mix (%)
Dependent
Variable (I) Type of mix
(J) Type
of mix
Mean
Difference
(I-J)
Std.
Error Sig.
95%
Confidence
Interval
Lower
Bound
Upper
Bound
GCV loss in
mix (%)
Biomass only
Biomass
Major
Mix
-.11085 .63356 .983 -1.6119 1.3902
Biomass only
Coal
Major
Mix
1.96297 .78276 .035 .1084 3.8175
Biomass Major
Mix
Coal
Major
Mix
2.07382 .93206 .071 -.1345 4.2821

141
4.6 OBJECTIVE 4:
To evaluate different transportation configurations which involve middle men
(stockiest, contractors and transporters, etc.) that will add value in the existing
supply chain
Through this objective we are trying to find out the different transportation methods
used by the middlemen in supplying the feedstock from the farmers to the power
generators and the value addition (in the form of using some new techniques of
storage or using some new vehicles of transportation) these middlemen are doing in
the supply chain.
For this, certain parameters were taken– Role in biomass supply chain, Types of
biomass vendors, Mode of transporting biomass from field / storage to the power
plant and Ways of storing biomass.
4.6.1 Role in biomass supply chain
When analysis was done for the role the vendors are playing in the supply chain it
was found that 47.4% persons are playing the role of stockiest, 26.3% are playing
the role of middlemen and other 26.3% persons are acting as farmers.

142
Table 4.46 Role in biomass supply chain
Role in Biomass supply chain
Frequency Percent
Stockiest 18 47.4
Middlemen or Agent 10 26.3
Farmer 10 26.3
Total 38 100.0
Figure 4.14 Role in biomass supply chain

143
4.6.2 Types of Biomass vendors
Mainly three types of Biomass vendors are supplying biomass from the farmers to
the power generators. They are stockiest, middlemen and farmers. Mainly there are
middlemen as can be seen in the table (44%).
Table 4.47 Types of Biomass vendors
Types of Biomass vendors
No. %
Stockiest 44 31.2
Middlemen or Agent 62 44.0
Farmer 35 24.8
Total 141 100.0
Figure 4.15 Types of Biomass vendors

144
4.6.3 Mode of transporting Biomass from field / storage to the power plant
Various means of transportation are used by the middlemen like tractor, trolley, loading
truck. Mainly Tractor trolley (42.1%) and Tractor & Truck (47.4%) are used as can be
seen in the table 4.48 below. Very less percentage of middlemen are using loading
trucks as specific fuel consumption is more in trucks and it is affordable to use tractor
and trolleys.
Table 4.48 Mode of transporting Biomass from field / storage to the power plant
Mode of transporting Biomass from field / storage to the power plant
Frequency Percent
Tractor trolley 16 42.1
Loading truck 4 10.5
Tractor & Truck 18 47.4
Total 38 100.0
4.6.4 Ways of storing Biomass
Biomass is stored in various forms. In the survey done for the ways of storing Biomass it
was found that 61.7% people leave the husk loose – at the farm land, while 29.1%
people leave it loose at plant storage area with compacting and the remaining 9.2%
people made briquettes out of the husk which is a very better way of storing it. As
shown in table 4.49 below.
Biomass Briquettes is a biofuel substitute of charcoal and coal. They are used to heat,
cook, and also used for generating energy, where they heat industrial boilers in order to
produce electricity from steam. The most common use of the briquettes is in the
developing world, where energy sources are not as broadly available.

145
Table 4.49 Ways of storing Biomass
Ways of storing Biomass
No. %
Briquettes 13 9.2
Loose - At farm land 87 61.7
Loose - At plant storage area with
compacting 41 29.1
Total 141 100.0
Figure 4.16 Ways of storing Biomass

146
4.6.5 Ways of storing Biomass * Type of mix
H018: There is no significant association between Ways of storing and Type of mix.
H118: There is significant association between Ways of storing and Type of mix.
When the analysis was done for the ways of storing biomass and the type of mix it was
found that Briquettes are mainly formed when the mix is of either biomass only type
(1.9%) or of biomass major mix type (47.8%). No briquettes are formed out of coal.
Biomass is left loose at farm land when the mix is of Biomass only type (63.5%) and of
biomass major mix type (47.8%). As shown in the table 4.50 below. The Chi square
value is less than 0.05. This shows that there is a significant association between ways of
storing Biomass and the type of mix. Hence, rejecting the null hypothesis.
Table 4.50 Ways of storing Biomass * Type of mix
Type of mix
Total Biomass
only
Biomass
Major
Mix
Coal
Major
Mix
ways of
storing
Biomass
Briquettes
Count 2 11 0 13
% within
Type of mix 1.9% 47.8% 0.0% 9.2%
Loose - At farm
land
Count 66 11 10 87
% within
Type of mix 63.5% 47.8% 71.4% 61.7%
Loose - At plant
storage area with
compacting
Count 36 1 4 41
% within
Type of mix 34.6% 4.3% 28.6% 29.1%
Total
Count 104 23 14 141
% within
Type of mix 100.0% 100.0% 100.0% 100.0%
Pearson Chi-Square Value df
Asymp. Sig. (2-
sided)
51.397 4 .000

147
4.6.6 Ways of storing Biomass * Types of Biomass vendors
H019: There is no significant association between ways of storing and type of
biomass vendors.
H119: There is significant association between ways of storing and type of biomass
vendors.
Briquettes are formed from biomass for storage when mainly the types of vendors are
the stockiest (18.2%) and the farmer (5.7%). It is left loose at the farm land mainly when
the vendors are farmers (62.9%) and middlemen (69.4%). It is left loose at plant storage
area with compacting at this time the types of vendors are all the three types. This shows
that there is no significant association between the ways of storing biomass and the types
of biomass vendors. The chi square value is more than 0.05 hence accepting the null
hypothesis. As shown in Table 4.51 below.
Table 4.51 Ways of storing Biomass * Types of Biomass vendors
Ways of storing Biomass * Types of Biomass vendors
Types of Biomass vendors
Total Stockiest
Middlemen
or Agent Farmer
Ways of
storing
Biomass
Briquettes
Count 8 3 2 13
% within Types of
Biomass vendors 18.2% 4.8% 5.7% 9.2%
Loose - At farm
land
Count 22 43 22 87
% within Types of
Biomass vendors 50.0% 69.4% 62.9% 61.7%
Loose - At plant
storage area
with compacting
Count 14 16 11 41
% within Types of
Biomass vendors 31.8% 25.8% 31.4% 29.1%
Total
Count 44 62 35 141
% within Types of
Biomass vendors 100.0% 100.0% 100.0% 100.0%
Pearson Chi-Square Value df
Asymp. Sig. (2-
sided)
7.571 4 .109

148
4.6.7 Mode of transporting Biomass from field / storage to the power plant *
Role in Biomass supply chain
H020: There is no significant association between mode of transporting Biomass
from field / storage to the power plant and Role in biomass supply chain
H120: There is significant association between mode of transporting Biomass
from field / storage to the power plant and Role in biomass supply chain
While doing the analysis for the mode of transportation and the role of suppliers in
the biomass supply chain it was found that that there is no significant association
between the above two parameters as in either case i.e. stockiest, middlemen,
farmers the mode of transportation is tractor trolley, loading truck or tractors.
The null hypothesis is accepted as the chi square value is more than 0.05 as shown in
table 4.52 and which shows that there is no significant association between the mode
of transporting biomass from field / storage to the power plant and the role in
biomass supply chain.

149
Table 4.52 Mode of transporting biomass from field / storage to the power plant
* Role in biomass supply chain cross tabulation
Role in Biomass supply chain
Total Stockiest
Middlemen
or Agent Farmer
Mode of
transporting
Biomass
from field /
storage to the
power plant
Tractor
trolley
Count 6 4 6 16
% within Role in
Biomass supply
chain
33.3% 40.0% 60.0% 42.1%
Loading truck
Count 2 2 0 4
% within Role in
Biomass supply
chain
11.1% 20.0% 0.0% 10.5%
Tractor &
Truck
Count 10 4 4 18
% within Role in
Biomass supply
chain
55.6% 40.0% 40.0% 47.4%
Total
Count 18 10 10 38
% within Role in
Biomass supply
chain
100.0% 100.0% 100.0% 100.0%
Pearson Chi-Square Value df
Asymp. Sig. (2-
sided)
3.495 4 .479
B. QUALITATIVE DATA ANALYSIS
Qualitative data was collected from the power plants of the 9 companies. The
Business Heads and the employees of the various companies represent the demand
side of the supply chain. Various problems, challenges and advantages as discussed
by the Business heads are given below in table 4.53.

150
Table 4.53 Major Problems, Challenges and Advantages faced by Employees
Problems and Challenges Advantages
DCM Shriram Ltd. Biomass husk is available in
maximum quantity in the months
of April and May. Acute
shortage is in the months of
September and October.
Requirement of biomass is
throughout the year but company
has to smoothen, the peaks in
demand.
Having a mud segregation unit
which separates sand/mud from
biomass feedstock making it
easier and faster to generate
energy from the waste.
ShriramRayons
Ltd.
High investment is required, to
modify existing machineries so
as to use biomass as a feedstock
instead of coal.
Have very strong network of
suppliers and traders due to which
supply of husk is regular and
shortage of biomass is not there.
Kalpataru Power It has never used any fossil fuel
as a feed stock for power
generation. Right from the
inception of the project the
company is totally dependent on
biomass.
Tonk and Ganganagar Plants
have logistics infrastructure to
collect approx. 200,000 MTs of
such inputs every year
Surya Chambal
Power Ltd.
It is an IPP (independent power
producer) and producing power
using biomass is the only
business of this company so if
husk is not available in good
quantity all the year round as
may be due to heavy rains or any
other natural calamity then it has
to suffer losses and face certain
They are using a combined
harvestor machine for removing
the waste from the fields and
cutting it from the very bottom.
For solving the problem of
farmers the company had
installed special plates in the
harvesting machines so that the
remains of the plants could be

151
problems.
Problem of viability of project
due to unavailability of biomass
may be there.
As per policy of Government of
Rajasthan Renewable Energy
Conservation Promotion policy
2004 there was restriction of
using biomass by other plant
within 70 km radius,( table 4.54)
but unfortunately there are a lot
of plants using biomass near this
area due to which prices of
biomass are continuously rising
as can be seen in the figure 4.17
below and also the availability is
hindered.
removed from a very lower side
and least part of the plant is
wasted.
Orient Green
Power Company
Rajasthan Pvt Ltd.
They are facing the problem of
storing the biomass as traders
and middle men are demanding
very high prices and less biomass
is available in their nearby area
so they have to procure it from
far away distances which creates
the problem of logistics and
supply chain.
Ash content in biomass is less so
minimum wastage is there and
this as can be used as a manure.
Goyal Proteins
Ltd.
Different pricing and
procurement strategies are
adopted by different power
producers for procurement of
biomass.
Biomass availability is done by
local vendors and farmers.

152
Table 4.54 Biomass power plants reserved area in Rajasthan
Capacity (MW) Area reserved (Radius in km)
5 60
More than 5 and up to 7.5 75
More than 7.5 and up to 10 80
More than 10 and up to 12.5 85
More than 12.5 and up to 15 90
More than 15 and up to 20 100 Source : Report of Dalkia Energy services Ltd., New Delhi submitted to RRECL
Ruchi Soya
Industries Ltd.
High investment and
construction cost per KW and
higher operation cost for the
biomass project.
They have made many storage
locations in the villages and near
the factory where they collect and
supply the biomass as and when
required.
Shiv Edibles Ltd. High investment is required in
the boiler and other machineries
Procurement cost of biomass is
less as compared to coal so quite
beneficial.
S.M.
Environmental
Technologies Pvt.
Ltd.
There is no organized market for
the supply of biomass feed stock.
Availability of infrastructure to
feed the biomass in the boiler.
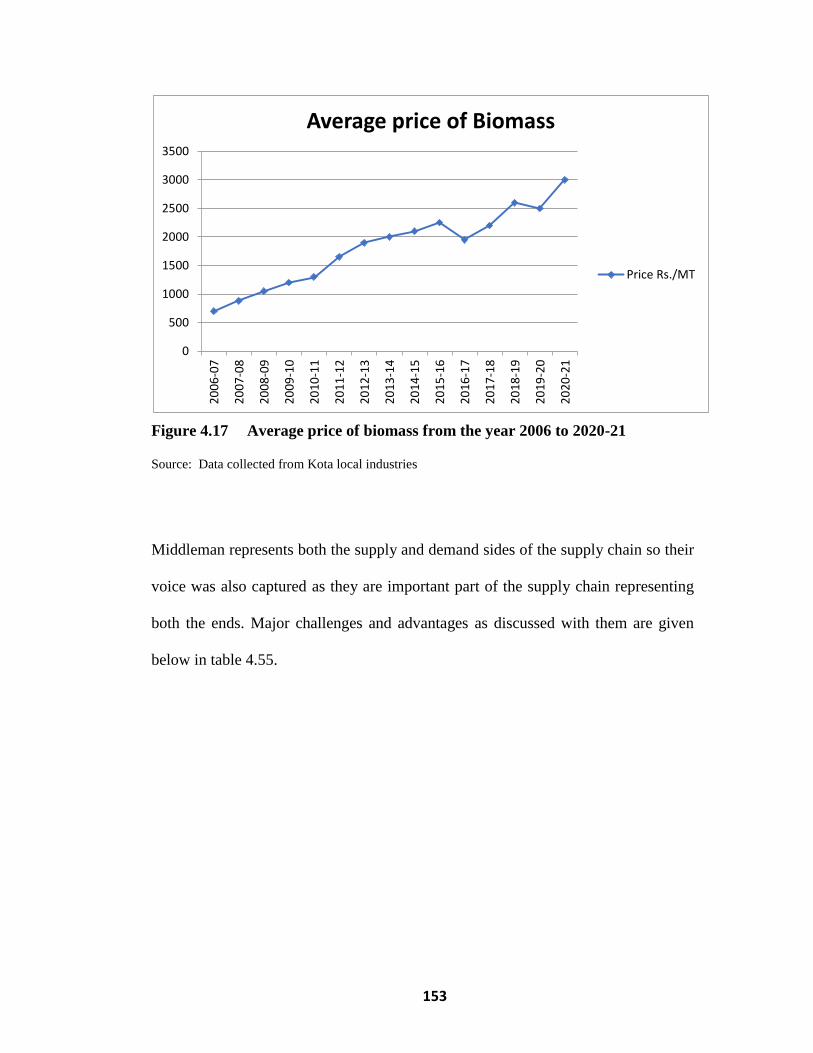
153
Figure 4.17 Average price of biomass from the year 2006 to 2020-21
Source: Data collected from Kota local industries
Middleman represents both the supply and demand sides of the supply chain so their
voice was also captured as they are important part of the supply chain representing
both the ends. Major challenges and advantages as discussed with them are given
below in table 4.55.
0
500
1000
1500
2000
2500
3000
3500
20
06
-07
20
07
-08
20
08
-09
20
09
-10
20
10
-11
20
11
-12
20
12
-13
20
13
-14
20
14
-15
20
15
-16
20
16
-17
20
17
-18
20
18
-19
20
19
-20
20
20
-21
Average price of Biomass
Price Rs./MT
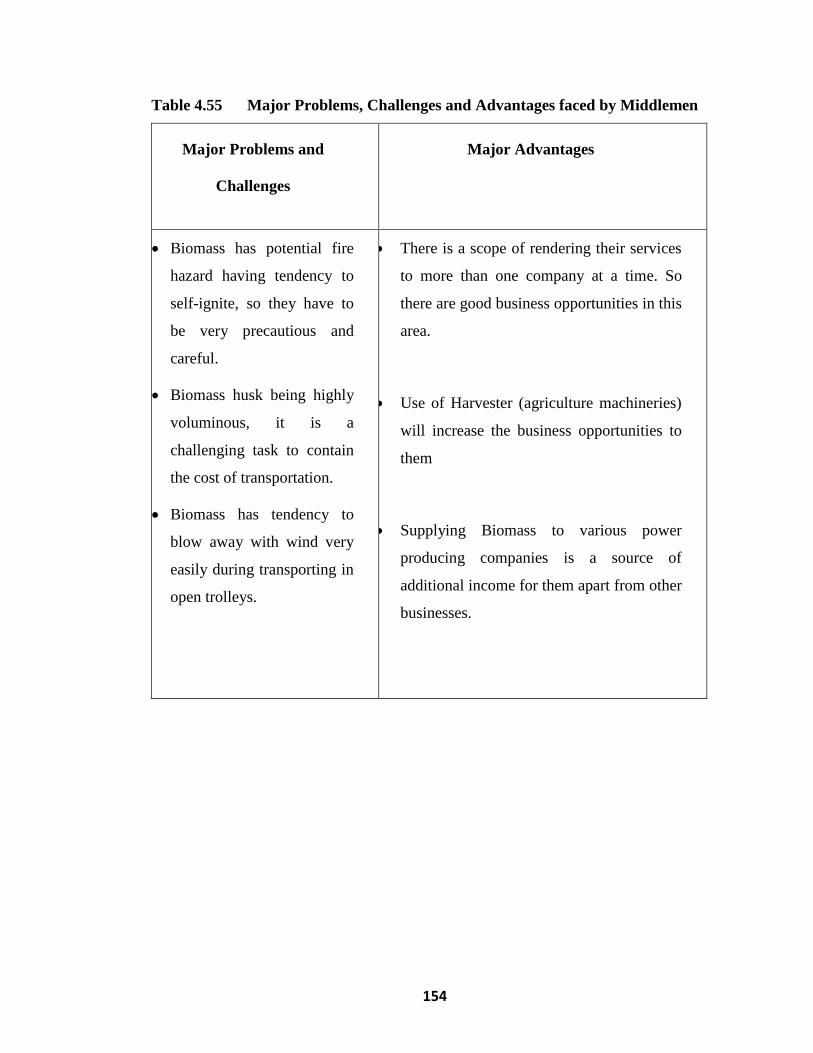
154
Table 4.55 Major Problems, Challenges and Advantages faced by Middlemen
Major Problems and
Challenges
Major Advantages
Biomass has potential fire
hazard having tendency to
self-ignite, so they have to
be very precautious and
careful.
Biomass husk being highly
voluminous, it is a
challenging task to contain
the cost of transportation.
Biomass has tendency to
blow away with wind very
easily during transporting in
open trolleys.
There is a scope of rendering their services
to more than one company at a time. So
there are good business opportunities in this
area.
Use of Harvester (agriculture machineries)
will increase the business opportunities to
them
Supplying Biomass to various power
producing companies is a source of
additional income for them apart from other
businesses.
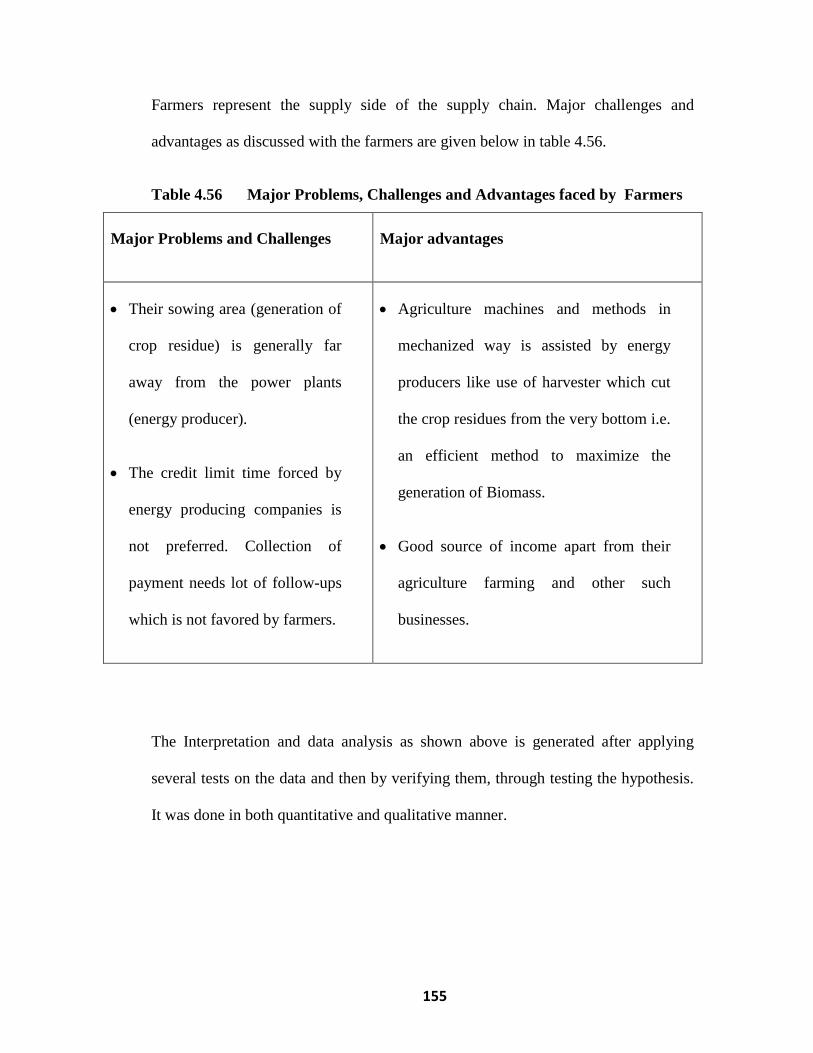
155
Farmers represent the supply side of the supply chain. Major challenges and
advantages as discussed with the farmers are given below in table 4.56.
Table 4.56 Major Problems, Challenges and Advantages faced by Farmers
Major Problems and Challenges Major advantages
Their sowing area (generation of
crop residue) is generally far
away from the power plants
(energy producer).
The credit limit time forced by
energy producing companies is
not preferred. Collection of
payment needs lot of follow-ups
which is not favored by farmers.
Agriculture machines and methods in
mechanized way is assisted by energy
producers like use of harvester which cut
the crop residues from the very bottom i.e.
an efficient method to maximize the
generation of Biomass.
Good source of income apart from their
agriculture farming and other such
businesses.
The Interpretation and data analysis as shown above is generated after applying
several tests on the data and then by verifying them, through testing the hypothesis.
It was done in both quantitative and qualitative manner.

156
CHAPTER-5
Conclusions
and
Suggestions

157
5.1 Conclusions
From this Research and study it has been concluded that the use of renewable energy is
on the rise across the world with many projects which are ready to capture the wind
energy, hydro energy, solar energy and biomass energy are coming up in the near future.
More and more entrepreneurs and industrialists across our country are becoming aware
about the use of Biomass husk and they are venturing into this area to make the best use
of biomass husk.
In Rajasthan and also in Kota the conditions are on the better side i.e. the excess amount
of biomass husk left after consumption and utilization in brick kilns and after being used
for manure & fodder etc. is being used by the farmers who are either using the husk for
heating or burning purpose or supplying it to the middlemen. Who in turn are supplying
it to power producing companies but still initiatives need to be taken by the local and
government authorities.
5.1.1 Major Conclusions from quantitative data analysis
It has been concluded that Biomass of mustard crop is available mainly in the
months of March, April, and May and lowest availability of mustard husk is in the
monsoon season and in the months of September and October.
To make the biomass available from the fields to the power producers vendors play
a major role. Stockiest(31.2%), middlemen(44%) and farmers(24.8%) are acting as
vendors and are mainly procuring the biomass husk and supplying it to the various
companies who are generating power. It is concluded that mainly middlemen (44%)
are acting as vendors.
From the research it has been concluded that various challenges are being faced by
the companies in making the biomass available to the power producers- for (63.8%)
employees demand supply gap is a major challenge, for (67.4%) employees entry of

158
new consumer of biomass in the region is a big hurdle, Heavy rains leading to crop
damage is a problem for 78% employees, for (63.1%) drought is a big challenge.
It has been concluded that various problems are being faced by the people who are
involved in the business of biomass. The major problems are- biomass husk catches
fire very easily, problem of rains due to which moisture is added into the husk,
problem of transporting, overloading, chances of accident if trolleys are overloaded
with the biomass husk.
For procuring the biomass various strategies are adopted by the employees of the
power generating companies viz. (66.7%) of the employees of the various
companies have subcontracted the procurement activity by developing middlemen in
the supply chain, (59.6%) of the employees of the companies have increased the in-
house storage capacity within the plant and (58.2%) employees monitor the rates of
the market to wait for the favorable price of biomass in the region.
After testing the hypothesis, for the analysis related to types of Biomass vendors and
the type of mix, it is concluded that there is a significant association between the
types of Biomass vendors and the type of mix as biomass only(52.9%) is mainly
procured by the middlemen and coal major mix(85.7%) is mainly procured by the
stockiest, biomass major mix(78.3%) is mainly procured by the stockiest, p value
was found to be less than 0.05, and therefore null hypothesis is rejected.
Mean values of procurement cost of Biomass, in Biomass only (mix) is Rs. 2391.12,
in biomass major mix is Rs. 2670. and in coal major mix is Rs. 2756.57 The results
revealed that the procurement cost of biomass is maximum when majorly coal is
used and lowest when purely biomass is used hence it can be concluded that there is
a significant association between procurement cost of biomass and the fuel mix, p
value is less than 0.05 therefore rejecting the null hypothesis.
The mean value of handling cost of biomass from storage area to boiler feed is
maximum in case of Biomass only mix i.e.251.96 and least in case of coal major

159
mix i.e. 202.86 and in biomass major mix its value is 205.57. It is concluded that
that there is a significant association between handling cost of biomass from storage
area to boiler feed and the fuel mix. The P value after applying ANOVA test is less
than 0.05, therefore null hypothesis is rejected.
The total procurement cost is Maximum (mean value) in case of coal major mix
(3447.16) and lowest in case of employees using Biomass only (2593.97) and the
mean value in biomass major mix is (3037.59).Therefore the conclusion is that there
is a close association between total procurement cost per MT of mix and the fuel
mix and it shows that it is economic viable to use biomass feed stocks in comparison
to coal. As P value is less than 0.05. Therefore Null hypothesis is rejected.
By testing the hypothesis and applying the tests it is concluded that there is a
significant association between average transportation cost of biomass per Km per
MT (in Rs.) and the supplier, as the transportation cost‘s mean value is maximum in
case of middlemen (1.34) and minimum in case of stockiest(1.08), the P value is less
than 0.05 hence null hypothesis is rejected.
The average storage cost of biomass with respect to stockiest is 1444.44 (mean
value) that of middlemen is 1531.00 and that of farmer is 1510.00 and the ANOVA
P value is more than 0.05 therefore null hypothesis is accepted. The conclusion is
that there is no significant association between average storage cost of biomass in
different fuel mix. Very little differences are there in the storage costs of various
suppliers.
After doing the data analysis it was found and concluded that the mean value of last
year consumption of Biomass major mix is 50026.87 MT. The mean value of
Biomass only is approx. 49150.68 and the mean value of coal major mix is
26656.14, which shows that there is a significant association between the last year
consumption of biomass and the type of fuel mix. The P value is less than 0.05.
Hence rejecting the null hypothesis.

160
The mean value of last year quantity of Biomass trading (in MT) as done by the
middle men is 35049.00 as done by the farmer is 26000.00 and as done by the
stockiest is 32000.00 which shows that maximum trading is done by the middlemen
therefore it is concluded that there is a significant association between the quantity
of biomass trading and the supplier. The P value is less than 0.05. Hence rejecting
the null hypothesis.
The analysis shows that the mean value of ash content of coal major mix is 30.46%
and of biomass major mix is 9.60% and of biomass only is 8.17%. So the conclusion
is that coal major mix has more of ash content which is just a waste for the
companies so the power producers should use more of biomass as a feedstock and
decrease the amount of coal as a feed stock to reduce the amount of waste. The
results show that there is a close association between ash content of mix % and the
fuel mix. This proves that using biomass feedstock is economically viable if
considered in terms of ash content. The P value is less than 0.05. Hence rejecting the
null hypothesis.
A bird‘s eye view shows that in the 9 companies surveyed by us, 104 employees are
using 0% coal and 100% biomass depicted as (Biomass only), 23 employees are
using majorly biomass 93-94% and very less coal 6-7% shown as(Biomass major
mix) and Only 14 persons are using around 93-94% coal and 6-7% biomass shown
as(Coal major mix).
When analysis was done for the boiler efficiency it was found that when 76.9%
employees are using (Biomass only) at that time boiler efficiency is in the range of
70-80%.The efficiency is between 80-90% when 92.9% employees are using coal
mix. The conclusion is that when maximum use of biomass is used as feedstock,
efficiency to produce power is quite good. The Pearson chi square value is less than
0.05. Hence rejecting the null hypothesis. Therefore the conclusion is that there is a
significant association between boiler efficiency and the type of mix.

161
Maximum thermal unit efficiency i.e. around 45% is achieved when the type of mix
is biomass only, the thermal efficiency is between 30-40% when the type of mix
used is biomass major type and when the coal major mix is used at that time the
efficiency is between 25-30%. The Pearson chi square value is less than 0.05. Hence
rejecting the null hypothesis. It can be concluded that there is a significant
association between thermal unit efficiency and the types of mixes.
Maximum power is generated in the range of (81-100%) when Biomass only is used
by the companies i.e. when companies are using more of biomass at that time
maximum power is generated. When majorly coal mix is being used i.e. 78.6% at
that time only 6-10% power is generated. Hence the conclusion is that there is a
significant association between power generated due to biomass with respect to total
power generation in the plant and the type of mix. Null hypothesis is therefore
rejected.
The GCV of coal mix is maximum amongst all the mixes, its mean value is
4280.179 whereas the GCV of biomass only is having the mean value as 3142.288
and the mean value of biomass major is 3183.610. Therefore the conclusion is that
there is a close association between GCV of mix and the types of mixes, rejecting
the null hypothesis.
The cost absorbed by the companies in generating 1000KCal of energy using the
various mixes of biomass and coal is approximately the same, not much difference is
there in their mean values. Cost of coal major mix (mean value is 0.8081) is approx.
same as the cost of biomass only mix (0.8539) and biomass major mix (0.9558). The
conclusion is that there is no significant association of the cost used to generate
1000KCal of energy with the fuel mixes. The ANOVA value is more than 0.05.
Hence accepting the null hypothesis.
It is concluded from the analysis for the type of loss of GCV for biomass during
storage and the type of mix that maximum loss in GCV is due to the adulteration in
coal major mix by addition of moisture. Even biomass major mix is mainly

162
adulterated by moisture. Biomass only is mostly blown away with wind. Therefore
there is significant association between type of loss of GCV during storage and the
type of mix. The Chi square value is less than 0.05. Hence rejecting the null
hypothesis.
It can be concluded that type of loss of GCV during storage is significantly
associated with the types of biomass vendors as when the type of vendor is the
stockiest (72.7%) then maximum GCV loss is due to the moisture addition in
biomass. In case of farmer (54.3%) maximum loss is due to the wind and in the case
of middlemen (41.9%) also maximum loss is by the wind. As the chi square value is
less than 0.05. Rejecting the null hypothesis.
It can be concluded that the that there is significant difference among mean GCV
loss% of fuel mixes as the mean values of GCV loss in mix% is maximum in case of
biomass major mix (5.6974). In case of coal major mix it is (3.6236) and in case of
biomass only it is (5.5865) which shows that GCV loss is minimum in case of coal
major mix. The ANOVA P value is less than 0.05. Hence rejecting the null
hypothesis.
It is concluded that there is a close association between the ways of storing biomass
and the type of mix. When the analysis was done it was found that briquettes are
mainly formed when the mix is of either biomass only type (1.9%) or of biomass
major mix type (47.8%). No briquettes are formed out of coal major mix (0%).
When the mix is of Biomass only type (63.5%) then mainly it is left open at the farm
land. Very few organizations are making the briquettes. Instead more companies
should concentrate on making the briquettes as in them GCV loss is very less and
compact form of husk is there so easy to store and handle. The Chi square value is
less than 0.05. Therefore rejecting the null hypothesis.
When the type of vendor is the stockiest (50%) then mainly the biomass is left loose
at the farm land when the middlemen (69.4%) are supplying the biomass husk at that
time also the husk is left loose at the farms . Therefore it is concluded that there is no

163
significant association between the ways of storing biomass and the types of
biomass vendors. The chi square value is more than 0.05 hence accepting the null
hypothesis.
It is also concluded that there is no significant association between the mode of
transporting biomass from field / storage to the power plant and the role of suppliers
in the biomass supply chain as in either case i.e. stockiest, middlemen, farmers the
mode of transportation is tractor trolley, loading truck or tractors. Null hypothesis is
accepted as the chi square value is more than 0.05.
5.1.2 Major Conclusions from qualitative data analysis
It is concluded that the strategy of using mixes of coal and biomass is making the
companies and industries very good competitive players in the power generation
field.
Companies have reduced the operation costs and power generating costs by the use
of mix of coal and biomass both.
More and more companies and industries are now coming up in this area of
generating power using the husk and residues of the agriculture waste left out in
fields.
It is concluded that the use of new equipment and machines by the companies to cut
the crop residue and waste has improved the situations in fields. Both middlemen
and farmers are happy and satisfied by it.
Farmers are becoming more aware about the use of husk left out in fields and they
are also becoming conscious with regards to the atmospheric pollution level that will
rise if waste is burnt in fields.

164
Middlemen indicated that they are rendering their services to more than one
company at a time i.e. they are supplying biomass to many power producing
companies at a time.
Biomass has potential fire hazard, having tendency to self-ignite. During interaction
with middlemen it was disclosed that such incidents of catching fire takes place
during peak summer in the warehouses and dump yards. So they have to be very
precautious and careful.
The credit limit time forced by energy producing companies is not preferred.
Collection of payment needs lot of follow-ups which is not favored by farmers

165
5.2 Suggestions
5.2.1 Suggestions for Companies
Technical ways by which one can measure the GCV of biomass should be developed
in companies so that more precise and sound results can be obtained.
Companies and organizations are suggested to publish and make the public aware
about the various sources and uses of biomass so that more and more businessmen
and traders come forward and make full use of this eco-friendly fuel.
The companies should use biomass only mix as a feed stock as it is ecofriendly, it
contains less of ash as compared to coal and its procurement cost is also less as
compared to coal.
The companies which are leaving the husk loose must concentrate on forming the
briquettes as they will yield a better GCV as compared to lose husk in which GCV
loss is seen
5.2.2 Suggestions for Government Authorities
The government authorities are suggested to develop structured market (mandi) of
biomass so that more farmers and traders will involve themselves into the business
of biomass and more trading will be done of this renewable fuel.
New technological advancements and innovations are needed in this area so as to
maximize the generation of biomass.
Government authorities should help and guide the farmers and peasants with regard
to the benefits of not burning the husk of the crops instead helping the farmers in
making full utilization of the waste and husk left over in fields.

166
As compared to other renewable fuels like solar power, wind power, hydro power
not much awareness is there about Biomass power. The authorities and agencies
should make people (who are involved in making bricks in brick kilns and other
small scale business men) aware about the merits of this renewable fuel.
As per guidelines of Government of Rajasthan Renewable energy promotion policy
2004 there was a restriction of using biomass by other companies in a radius of 70
Km but many companies are not following this policy and are coming up with their
power plants within this area, due to which prices of biomass husk are continuously
rising and industrialists are facing problem with regard to availability and prices of
biomass. The local authorities should take care of these issues.
Availability of Biomass for power generation is not ascertained through any
government funding reports.
5.2.3 Suggestions for Vendors and Farmers
Since biomass is a byproduct of crop farmers are not giving due importance to
maximize the quantity of biomass generated. Farmers are therefore suggested to give
due weight age to the husk generated out of the crops and use this husk for power
generation and not burn it in the farmland as it creates a lot of pollution.
Farmers are suggested to use the ash (residual disposal left after burning of biomass)
in the form of manure in fields.

167
Summary

168
Chapter 1
An Overview of Biomass power generation and its supply chain management
1.1. Introduction
Biomass is defined as any organic matter that is available on a renewable or recurring
basis. It comprises of all crop residues and materials derived from plants, which includes
agricultural crops and trees, wood and wood residues, grasses, aquatic plants, animal
manure, municipal residues, and other left over materials. Its major benefit is that it can
be used to generate electricity with the same equipment or power plants that are now
burning fossil fuels. Biomass is an important source of energy and the most important
fuel all over the world after coal, oil and natural gas.
1.2. Biomass resources
Various resources of biomass are available like energy crops, agro industrial waste,
agriculture wastes, municipal solid wastes and forest waste. One of the most promising
sectors for growth in bioenergy production is in the form of residues from agriculture
sector. Currently, the sector contributes less than 3% to the total bioenergy production.
1.3. Global scenario of biomass
Biomass – the largest energy source after coal, oil and natural gas is the most important
renewable energy option at present and can be used to produce different forms of energy.
Moreover, compared to other renewables, biomass resources are common and
widespread across the globe. 18% of the energy consumed globally for heating, power,
and transportation came from renewable sources in 2017. Nearly 60 percent of this came
from modern renewables (i.e., biomass, geothermal, solar, hydro, wind, and biofuels)
and the remaining 7.5% from traditional biomass (used in residential heating and
cooking in developing countries).

169
Renewable made up 26.2 percent of global electricity generation in 2018. That‘s
expected to rise to 45 percent by 2040. Most of the increase will likely come from solar,
wind, and hydropower.
1.4. Overview of biomass in India
Sources of power generation range from conventional sources such as coal, lignite,
natural gas, and oil to viable non- conventional sources such as wind, solar, hydro and
nuclear and biomass. Renewable energy sector in India has experienced tremendous
changes in the policy framework during the last few years.
In 2015, Prime Minister Narendra Modi set an ambitious goal for India to generate 175
gigawatts (GW) of renewable energy by 2022. According to latest data released by the
Ministry of New and Renewable Energy, India has installed a total capacity of 74.79
GW of renewable power as of December 31, 2018.
Most of India‘s biomass electricity is being generated in Andhra Pradesh, Maharashtra,
Tamil Nadu, Karnataka and Rajasthan. A lot of new capacity is being built in Punjab and
Chhattisgarh as well. India with a total biomass capacity of around 1 GW is planning to
increase it by 10 times to 10 GW by 2020. Between 200-600 acres of land are required
to support 1 MW of Biomass capacity. This is much more than what is required for even
a thin film of solar energy, which is around 10 acres. The large land requirements make
biomass energy scaling a difficult proposition. However, it has a great use in niche
applications where there is a large amount of crop and animal residue/waste available.
1.5. Overview of Biomass in Rajasthan
Rajasthan has immense potential in form of, Mustard husk, soya bean husk, Rice, Juli-
flora (Vilayati Babool) husk and other agriculture residues for the biomass fuel.
Biomass-based Power Projects totaling to 113 MW have already been registered with
RREC.

170
The Rajasthan state consists of 33 districts and the average cultivated area of Rajasthan
state for the past three years is coming around 2,24,79,599 Ha. The total generation of
biomass in districts is around 5,56,51,058 MT/Yr, whereas the total consumption is
5,00,89,905 MTs/yr and therefore the surplus is 55,61,153 MT/Yr. Maximum amount of
biomass is left in Kota, Bikaner, Jaisalmer, Jodhpur and Bundi districts which can be
used for power generation. The major portion of wheat stalks, barley stalks, paddy hay,
jowar stalks, bajra stalks, maize stalks are consumed by animal as fodder and these
biomass should not used as a fuel per the Policy of 2010. Mainly Mustard stalks/husks,
soya bean stalks, guar stalks and groundnut stalks are in surplus which can be used for
power generation as per the Rajasthan biomass fuels supply study.
1.6. Overview of Biomass in Kota
The amount of total Biomass generation in Kota is 21lakh MT/year. Whereas, the
consumption is around 13lakh MT/Year and so the surplus amount i.e. 7lakh MT/Year
can be utilized for power generation as per the biomass assessment study 2019.
Various companies and industries are operating in Kota which are using biomass for
power generation DCM Shriram, Shriram Rayons, Kalpataru Power, Surya Chambal,
Orient Green Power company Raj Pvt Ltd, Goyal Proteins, Ruchi Soya Industries Ltd,
Shiv Edible Ltd, S.M. Environmental Technologies Pvt. Ltd., Sharda Solvent Ltd,
Shriram EPC, Mangalam Cement.
Some of them are using purely biomass husk like Surya Chambal, Kalpataru power
whereas some are using mix of biomass and coal like DCM Shriram and Shriram
Rayons. The middlemen and farmers are happy and satisfied as they are having extra
income from this business.
1.7. Biomass fuel and its properties
Biomass is available in a number of different formats like fine dust, sawdust, chips,
pellets, briquettes, and bales. Instead of burning the loose biomass fuel directly, it is

171
more useful to compress it into briquettes (compressed block of coal or biomass
material), bales and pellets thereby increasing its usefulness and convenience. Such
biomass in the dense briquetted form can either be used directly as fuel instead of coal in
the traditional chulhas and furnaces.
1.8. Benefits and Challenges of biomass based power generation
Some of the benefits are- distributed generation, base load power, suited for rural areas,
Ability to have small KW scale power production, rural economic upliftment, carbon
neutral and efficient utilization of renewable biological sources.
Highly voluminous material, availability, seasonal restrictions and efficiency are some
of the challenges faced in using biomass.
1.9. Biomass Supply chain
Biomass energy production requires the flow of biomass material from the land to its
ultimate end use. Along the way, biomass passes through a series of processes in what is
called the biomass supply chain. Various stages of biomass supply chain are biomass
field collection, loading and processing, transportation, unloading and handling, storage
and last is energy exploitation.
Various elements of the biomass supply chain require unique sets of information,
knowledge, technology and activity. These include growing, harvesting, transporting,
aggregating, storing and converting biomass into some useful form. The main
characteristics of the supply chain, that influence the logistics efficiency, are that the raw
materials are produced over large geographical areas, have a limited availability
window, and often are handled as very voluminous material. All these activities are
made possible by the farmers, middlemen and the employees of the power generating
company. They are the key stakeholders of the supply chain.

172
Chapter 2
Review of literature
2.1 Introduction
A review of literature of various studies related to Biomass as an energy fuel, a source of
power generation and its effective logistics and supply chain management shows that
very limited research has been carried out in this area especially in the Indian context.
Various International and National research papers were studied and reviewed to find
out the research gap. Areas of Literature reviewed in this chapter include biomass
for bioenergy and biofuels, biomass for power generation and supply chain
management of Biomass.
2.2 Research related to biomass for bioenergy and biofuels
2.2.1 Faaij (2007) have pointed out in their paper that biomass is a versatile energy
source that can be used for production of heat, power, and transport fuels, as well as
biomaterials and, when produced can be used on a sustainable basis, it can also make a
large contribution to reducing greenhouse gas (GHG) emissions. In this publication the
authors have mentioned the importance of biomass as a bioenergy. A comparison is also
done with other fuel options.
2.2.2 Anil Kumar et al (2015) have discussed in their paper about Biomass energy
resource, its potential, energy Conversion and policy for promotion as implemented by
Government of India. The total installed capacity for electricity generation in India is
2666.64 GW as on 31st March 2013. Renewable energy is contributing 10.5% of total
generation out of which 12.83% power is being generated using biomass. India has
surplus agricultural and forest area which comprises about 500 million metric tons of
biomass availability per year. In India total biomass power generation capacity is 17,500
MW.

173
2.3 Papers related to biomass power generation
2.3.1 Hao & Luo (2012) have put forward in the research article, some counter
measures for the orderly development of China‘s biomass power generation which are as
follows:
Investigation and Assessment of the Biomass Resources,
Development Mechanism for Biomass Power Generation Industry,
Good Environment for Investment, and Well-coordinated and Unified regulation
Institution.
In this paper Constraints in China‘s Biomass Energy Development has also been
discussed which are as follows:
Lack of Systematic and Scientific Overall Planning
Independent Technology Research and Development Ability for Biomass Power
Generation
The High Cost of Biomass Power Generation
The Relevant Law and Government Support Policy
Single Investment and Financing Channel and Unsound Market Mechanism
Insufficient Supporting Mechanism
2.3.2 Purohit & Chaturvedi (2018) have stated in their paper that modern bioenergy
is being recognized as an increasingly important low-carbon resource by policy-makers
around the world to meet climate policy targets. In India also, there is a clear recognition
of the significant role of bioenergy in electricity generation as well as in other

174
applications. Bioenergy for power generation can be used in two different forms—
pelletized and non-pelletized. The non-pelletized form has been used for a long time for
co-firing in coal thermal power plants or biomass power plants.
Biomass pellets are now being used extensively and international trade is increasing year
on year, largely driven by climate policy targets adopted by developed countries. The
authors then estimate the cost of 100% biomass pellet-based electricity production and
assess its financial viability.
2.4 Literature related to supply chain management of biomass
2.4.1 Allen, Browne et al. have stated in their paper the supply chain considerations
and costs of using biomass fuel on a large scale for electricity generation at power
stations. It is at this scale of use that the logistics of biomass fuel supply are likely to be
both complex and potentially problematic, and logistics costs will have an important
bearing on the total delivered cost of biomass (i.e. the total cumulative cost of biomass
fuel at the point of delivery to a power station). It is important to recognize that logistics
costs and the integrated management of logistics activities can be vital to the success or
failure of a product or industry, especially in the case of a new industry.
2.4.2 Agustina et al (2018) have stated in their paper that Biomass is one of the most
important renewable energy sources besides geothermal, wind, hydropower and solar,
which can substitute fossil energy. Over the years, researchers have been investigating
the process of producing and converting biomass into bioenergy, but the importance of
logistics was detected recently. Critical parameters of supply chain management and
logistics are efficiency and effectiveness. This paper presents a literature review of
articles published in journal articles from 1992 to 2017, which includes the bioenergy
production interface and logistical issues and supply chain management.

175
Chapter 3
Research methodology
3.1 Introduction of Research methodology
Research methodology consists of all the methods & techniques used by the researcher
to conduct the research. It is a systematic method for solving a problem. It specifies the
flow of research in a step by step way. Essentially, the procedure by which researchers
go about their work of describing, explaining and predicting phenomena is called
research methodology.
The aim of this research is to estimate the cost of procuring biomass feed stock and to
analyze the loss of calorific value in various stages of supply chain (harvesting, storing,
handling and transportation) so that power stations will get biomass fuel of right
specification, in the right quantity, at the right time from resources which are typically
diverse and are seasonally dependent.
3.2 Research tool design
The questionnaire method was used for primary data collection. Besides questionnaire
other methods like interviews were also adopted to enhance the progress of data
collection through questionnaire and to observe closely the hidden and unexplored
aspects related to the objectives of the study.
3.3 Objectives of the Study
To ascertain the extent of economic viability of using biomass feed stocks with respect
to fossil fuels for the power producers.
To illustrate how procurement mix of existing biomass feed stock reduces overall power
generation costs and assures regular availability of feed stocks.

176
To evaluate the loss of GCV of Mustard husk biomass feedstock during various stages of
Supply Chain Management.
To evaluate different transportation configurations which involve middle men (stockiest,
contractors and transporters, etc.) that will add value in the existing supply chain.
3.4 Research Hypothesis
1 H0: There is no significant difference in cost of biomass procured by
companies for power generation using different mixes of fuel.
H1: There is a significant difference in cost of biomass procured by companies for
power generation using different mixes of fuel.
2 H0: There is no significant difference in GCV loss of biomass procured by
companies for power generation using different mixes of fuel.
H1: There is a significant difference in GCV loss of biomass procured by companies
for power generation using different mixes of fuel.
3 H0: There is no significant association between Supply chain stake holders
and Mode of transportation of biomass
H1: There is a significant association between Supply chain stake holders and Mode
of transportation of biomass
3.5 Research Variables
Some of the variables are Procurement cost of Biomass, Handling cost of Mix, Total
procurement cost, Transportation cost, Storage cost, Gross calorific value of the mix,
Type of loss of GCV during storage and GCV loss (%) of Fuel Mix
3.6 Data:

177
Primary data is collected through structured questionnaire consisting of close ended
questions. Primary data is information collected specially for the research purpose. It is
often collected after the researcher has gained an insight into the issue by reviewing
secondary research i.e. through Review of Literature.
Secondary Data is collected from Published journals, literatures and reference books,
newspapers, magazines as well as reports published in science direct journals, MNRE
annual reports, biomass assessment study reports, Bioenergy India magazine etc.
Qualitative data is collected through interviews conducted of key persons of
companies, selected traders and farmers. The qualitative analysis was done using
interview method. In this, interview schedules were prepared for three stakeholders
namely employees, traders and farmers. We had interaction with business heads of nine
companies We had detailed discussion with them regarding their strategies, future
prospects, problems and advantages of the use of biomass for power generation.
Conversation was held with the selected middlemen regarding logistics problems in the
business of biomass, the merits and demerits they find in this business and other troubles
that come their way while supplying this fuel from the farmers to the power producers.
We had interacted with some of the farmers also. With their limitations in literacy levels,
they were not able to define our requirement up to the expectations. So an interview was
conducted with them regarding the advantages and disadvantages in selling the biomass
husk to the middlemen or to the power producers.
3.7 Sampling Methodology
a Employees
Total 12 companies were there having different business models which were using
Biomass as a feedstock for power generation in Kota region. Out of these 12 companies
only 9 companies responded.

178
In our survey we found respondents covering procurement, quality, technical/
engineering and costing departments having approximately 250 employees. We tried to
contact 125 employees (50% of total population) and successfully 141 employees
responded. All visits to the companies were arranged by their respective HR
departments. It was not an easy task to survey the employees of private/ public
organizations as the matter is confidential in terms of strategies and figures.
b Traders
The information regarding the traders who are involved in the supply chain management
of biomass was gathered through the companies. In total 38 traders/middlemen
responded us and shared their business model as well as the difficulties faced by them.
Purposive sampling was done to select the traders.
3.8 Statistical Methods & Tools
Mainly One way ANOVA and Chi square tests were applied for carrying out the
analysis and for testing the hypothesis.
3.9 Significance of Research
Through this research we are trying to estimate the cost of procuring biomass feed stock
and to analyze the loss of calorific value in various stages of supply chain (harvesting,
storing, handling and transportation) so that power stations will get biomass fuel of right
specification, in the right quantity, at the right time from resources which are typically
diverse and are seasonally dependent.
Very few research studies have been done in this area especially in Kota region. So this
study will definitely help the present power generating companies and the upcoming
companies with regard to the type of mix (biomass and coal) they should use in the form
of feedstock for generation of power.
3.10 Research Gap
179
Review of literature suggests that many studies have been done in the areas related to
biomass energy, biomass power generation and supply chain management of biomass
but very few or no studies have been done in the areas related to the procurement cost of
using biomass fuel, logistics and the means of supplying and transporting biomass from
the farmers end to the power generating end of the companies. This study begins with
analyzing the stakeholders (employees, traders and farmers) of the various power
producing companies, who are using biomass as a feedstock for power generation in
Kota region of Rajasthan. The research work becomes more relevant in this region as it
addresses the supply chain considerations and the costs and benefits of procuring
biomass fuel on large scale for electricity generation at power stations.
3.11 Limitations
In order to make the study more precise, specified and objective oriented, this
research has been confined to the Kota region. Data analysis is done for the
middlemen, employees and transporters attached to the selected power producers
of Kota region. Sample drawn from the selected region shall not be applicable to
any other part of country as supply chain is very specific to location and product
handled.
Very large data sampling was not possible as there are only few companies in
Kota region who are into this business of generating power using biomass.
Not possible to collect data from the farmers as they are not willing to respond
and tell much about themselves.
Due to competition in procurement of biomass companies are not publishing and
declaring statistics and data and they are not willing to disclose their procurement
strategies also.
Secondary data not available to a larger extent as very less periodicals and
magazines are available.

180
Chapter 4
Interpretation and analysis of data
The purpose of the chapter is to highlight the outcomes of the study, resulted by the
application of statistical tools for testing the hypothesis.
4.1 Parameters of General Profile
The prominent hardship in business of biomass, types of traders, locality of traders, total
power generation capacity of thermal unit and type of boiler,
4.2 Objective 1
To illustrate this objective we have used four parameters namely Availability,
Procurement, Consumption & Residual Disposal.
4.2.1 Availability
The Highest availability months of Biomass are from March to May and the
lowest availability months of biomass are from August to October.
Various challenges are being faced by the power generating companies in
making the biomass available like heavy rains leading to crop damage, Entry of new
consumer of biomass in the region etc.
Several strategies are adopted by the power generating companies for increasing
the power generation through Biomass viz. maximize the procurement from nearest
source to cater the high demand supply gap, Sub-contracting of procurement activity by
developing middle men in supply chain management

181
Biomass only is mainly procured by the middlemen and the farmers. Biomass
major mix and coal major mix is mainly procured by the stockiest.
4.2.2 Procurement
Procurement cost of Biomass
H02: There is no significant difference among mean procurement costs of biomass
in different fuel mix.
H12: There is significant difference among mean procurement costs of biomass in
different fuel mix.
Procurement cost of biomass is highest in case when majorly coal (Rs. 2756.57) is being
used and lowest when purely biomass (Rs. 2391.12) is used which shows that there is a
significant association between procurement cost of feedstock with the fuel mix and p
value is less than 0.05 hence rejecting the null hypothesis.
Handling cost of Mix
H03: There is no significant difference among mean handling costs of biomass in
different fuel mix.
H13: There is significant difference among mean handling costs of biomass in
different fuel mix.
The mean value of handling cost of biomass from storage area to boiler feed is
maximum in case of Biomass only i.e. 251.96 and least in case of coal major mix i.e.
202.86 which shows that there is a significant association between handling cost of
biomass from storage area to boiler feed and the fuel mix. The P value is less than 0.05
hence we reject the null hypothesis.

182
Total procurement cost
The total procurement cost is the sum of procurement cost and the handling cost of
biomass. The total procurement cost is maximum in case of coal major mix (Rs.3447.16)
and lowest in case of employees using biomass only (Rs.2593.97).
H04: There is no significant difference among mean total procurement costs of
biomass in different fuel mix.
H14: There is significant difference among mean total procurement costs of biomass
in different fuel mix.
This shows that there is a close association between total procurement cost of biomass
mix in different fuel mix. As ANOVA P value is less than 0.05. Therefore null
hypothesis is rejected.
Transportation cost
It is the cost incurred by the company in transporting biomass from the source to the
place of power generation.
H05: There is no significant difference among mean transportation costs of biomass
in different fuel mix.
H15: There is significant difference among mean transportation costs of biomass in
different fuel mix.
The transportation cost‘s mean value is maximum in case of middle men (1.34) and
minimum in case of stockiest (1.08), which shows that there is a significant association
among mean transportation costs of biomass in different fuel mix. As ANOVA P value
is less than 0.05, hence rejecting the null hypothesis.

183
Storage cost
The average storage cost of Biomass is not much different with respect to the stockiest,
Middlemen and farmer.
4.2.3 Consumption
It is the amount of Biomass consumed by the various power generating organizations.
H07: There is no significant difference among mean consumption of biomass in
different fuel mix.
H17: There is significant difference among mean consumption of biomass in
different fuel mix.
The mean values of the three mixes are different. Therefore there is a significant
association between the last year consumption of biomass and the type of fuel mix. The
p value is less than 0.05 hence rejecting the null hypothesis.
4.2.4 Residual Disposal
Residual disposal is the waste left out after Biomass or coal is burned to generate
electricity. The amount of ash content in coal is very high as compared to Biomass.
H09: There is no significance difference among mean ash content as residual of Fuel
Mix
H19: There is significance difference among mean ash content as residual of Fuel
Mix
The mean value of ash content of coal major mix (30.46%) is highest as compared to
biomass major mix (9.60%) and of biomass only (8.17%), which shows that coal has

184
more of ash content and so there is a close association between ash content of mix % and
the fuel mix. The P value is less than 0.05. Hence rejecting the null hypothesis
4.3 Objective 2
For this we have taken certain parameters- Biomass mix ratio, Technical and
engineering changes, Power generated due to biomass with respect to total power
generation in the plant and gross calorific value
4.3.1 Biomass mix ratio
This ratio shows the combination in the feedstock i.e. the amount of coal and the
amount of biomass used in the mix which is feeded into the boiler.
4.3.2 Technical and Engineering changes
It was found that many engineering and technical changes are done by the power
plants to aid in the use of biomass, like use of additional infrastructure to feed the
biomass in the boiler. Modifications are done in the boiler area, resizing of steam control
unit is also done.
4.3.3 Power generated due to biomass with respect to total power generation in the
plant
Maximum power is generated by Biomass only i.e. when companies are using
more of biomass at that time maximum power is generated. When majorly coal mix is
being used at that time very less power is generated. The Pearson chi square value is less
than 0.05 which shows that there is a significant association between power generated
due to biomass with respect to total power generation in the plant and the type of mix.
Hence rejecting the null hypothesis.
4.3.4 Gross calorific value of the mix

185
It is the heat produced by combustion of unit quantity of a solid or liquid fuel
when burnt at a constant volume The Gross calorific value of coal is higher than that of
biomass i.e. on burning coal we get higher amount of heat energy as compared to
biomass.
H013: There is no significance difference among mean Gross calorific value of Fuel
Mix
H113: There is significance difference among mean Gross calorific value of Fuel Mix
The GCV of coal mix is highest, whereas the GCV of biomass only and biomass major
is less. The ANOVA P value is less than 0.05 which shows that there is a close
association between GCV of mix and types of mixes. Hence rejecting the null
hypothesis.
4.4 Objective 3
For this we have taken certain parameters -Type of loss of GCV during storage, Type of
loss of GCV during storage * Type of Biomass vendors, GCV loss (%)
4.4.1 Type of loss of GCV during storage
Biomass can be blown away with the wind, as biomass has to be left in open; addition of
moisture is there into it during the rainy season. It is adulterated with sand and stone
pieces etc. It gets mixed with the foreign particles therefore its heat producing capacity
gets reduced and hence the GCV is lost. Coal has a high calorific value and adulteration
of coal is less as compared to biomass so less heat loss is there in case of coal.
4.4.2 Type of loss of GCV during storage * Types of Biomass vendors

186
When the type of vendor is the farmer and middlemen then maximum GCV loss is due
to wind. Biomass gets blown away with the wind and when the type of vendor is the
stockiest then maximum GCV loss is due to the moisture addition in biomass.
H016: There is no significant association between Type of loss of GCV during
storage and Types of Biomass vendors
H116: There is significant association between Type of loss of GCV during storage
and Types of Biomass vendors
As the chi square value is less than 0.05, we reject the null hypothesis and we can say
that the type of loss of GCV during storage is significantly associated with the types of
vendors. The ANOVA P value is less than 0.05 which shows that both the above factors
are significantly associated.
4.4.3 GCV loss (%)
H017: There is no significance difference among mean GCV loss (%) of Fuel Mix
H117: There is significance difference among mean GCV loss (%) of Fuel Mix
The GCV loss in mix% is highest in case of Biomass major mix and least in coal major
mix. The ANOVA P value is less than 0.05 hence rejecting the null hypothesis.
Therefore there is significant difference among mean GCV loss% of fuel mixes.
4.5 Objective 4
For this we have taken certain parameters – Types of Biomass vendors, Ways of storing
Biomass, Ways of storing Biomass*type of mix, , Mode of transporting Biomass from
field / storage to the power plant * Role in Biomass supply chain.
4.5.1 Types of biomass vendors

187
Mainly three types of Biomass vendors are supplying biomass from the farmers to the
power generators. They are stockiest, middlemen and farmers
4.5.2 Ways of storing Biomass
Biomass is stored in various forms like it can be left loose at farm land, loose - At plant
storage area with compacting, or it can be stored in the form of briquettes. Mostly it is
left loose at farm land.
4.5.3 Ways of storing Biomass * Type of mix
Briquettes are mainly formed when the mix is of either biomass only type or of biomass
major mix type. No briquettes are formed out of coal. When the mix is of Biomass only
type, then mainly it is left open at the farm land.
H018: There is no significant association between Ways of storing and Type of mix.
H118: There is significant association between Ways of storing and Type of mix.
There is a close association between the ways of storing biomass and the type of mix
.When we did the analysis it was found that Briquettes are mainly formed when the mix
is of either biomass only type or of biomass major mix type. No briquettes are formed
out of coal. When the mix is of biomass only type then mainly it is left open at the farm
land. The Chi square value is less than 0.05. Therefore it shows that there is a significant
association between ways of storing biomass and the type of mix. Hence rejecting the
null hypothesis.
4.5.4 Mode of transporting Biomass from field / storage to the power plant * Role in
Biomass supply chain
H020: There is no significant association between Mode of transporting Biomass
from field / storage to the power plant and Role in Biomass supply chain

188
H120: There is significant association between Mode of transporting Biomass from
field / storage to the power plant and Role in Biomass supply chain
While doing the analysis in which we compared the mode of transportation and the role
of suppliers in the biomass supply chain we found that there is no significant association
between the above two parameters as in either case i.e. stockiest, middlemen, farmers
the mode of transportation is tractor trolley, loading truck or tractors. Accepting the null
hypothesis as the chi square value is more than 0.05.
4.6 Qualitative data analysis
Various problems, challenges and advantages as discussed by the Business heads are
given below.
Problems and challenges
Biomass husk is available in maximum quantity in the months of April and May.
Acute shortage is in the months of September and October.
High investment is required, to modify existing machineries so as to use biomass
as a feedstock instead of coal.
Different pricing and procurement strategies are adopted by different power
producers for procurement of biomass.
There is no organized market for the supply of biomass feed stock.
Advantages
Having a mud segregation unit which separates sand/mud from biomass
feedstock making it easier and faster to generate energy from the waste.

189
They are using a combined harvester machine for removing the waste from the
fields and cutting it from the very bottom.
Biomass availability is done by local vendors and farmers.
Ash content in biomass is less so minimum wastage is there and this as can be
used as a manure.
Major problems/challenges as discussed by the middlemen and farmers.
Biomass has potential fire hazard having tendency to self-ignite, so they have to
be very precautious and careful.
Biomass husk being highly voluminous, it is a challenging task to contain the
cost of transportation.
Their sowing area (generation of crop residue) is generally far away from the
power plants (energy producer).
The credit limit time forced by energy producing companies is not preferred.
Collection of payment needs lot of follow-ups which is not favored by farmers.
Major Advantages as discussed by the middlemen and farmers
Agriculture machines and methods in mechanized way are assisted by energy
producers like use of harvester which cut the crop residues from the very bottom i.e. an
efficient method to maximize the generation of Biomass.
Supplying Biomass to various power producing companies is a source of
additional income for them apart from other businesses.

190
Chapter 5
Conclusions and Suggestions
5.1 Major Conclusions of the quantitative Research
To make the biomass available from the fields to the power producers vendors
play a major role. Stockiest(31.2%), middlemen(44%) and farmers(24.8%) are acting as
vendors and are mainly procuring the biomass husk and supplying it to the various
companies who are generating power. It is concluded that mainly middlemen (44%) are
acting as vendors.
From the research it has been concluded that various challenges are being faced
by the companies in making the biomass available to the power producers- for (63.8%)
employees demand supply gap is a major challenge, for (67.4%) employees entry of new
consumer of biomass in the region is a big hurdle, Heavy rains leading to crop damage is
a problem for 78% employees, for (63.1%) drought is a big challenge.
After testing the hypothesis, for the analysis related to types of Biomass vendors and
the type of mix, it is concluded that there is a significant association between the
types of biomass vendors and the type of mix as biomass only (52.9%) is mainly
procured by the middlemen and coal major mix (85.7%) is mainly procured by the
stockiest, biomass major mix (78.3%) is mainly procured by the stockiest, P value
was found to be less than 0.05, and therefore null hypothesis is rejected.
Mean values of procurement cost of Biomass, in Biomass only (mix) is 2391.12 Rs,
in biomass major mix is 2670 Rs. and in coal major mix is 2756.57 The results
revealed that the procurement cost of biomass is maximum when majorly coal is
used and lowest when purely biomass is used hence it can be concluded that there is
a significant association between procurement cost of biomass and the fuel mix, P
value is less than 0.05 therefore rejecting the null hypothesis.

191
The mean value of handling cost of biomass from storage area to boiler feed is
maximum in case of Biomass only mix i.e. 251.96 and least in case of coal major
mix i.e. 202.86 and in biomass major mix its value is 205.57. It is concluded that that
there is a significant association between handling cost of biomass from storage area
to boiler feed and the fuel mix. The P value after applying ANOVA test is less than
0.05, therefore null hypothesis is rejected.
The total procurement cost is Maximum (mean value) in case of coal major mix
(3447.16) and lowest in case of employees using Biomass only (2593.97) and the
mean value in biomass major mix is (3037.59).Therefore the conclusion is that there
is a close association between total procurement cost per MT of mix and the fuel mix
and it shows that it is economic viable to use biomass feed stocks in comparison to
coal. As P value is less than 0.05. Therefore Null hypothesis is rejected.
By testing the hypothesis and applying the tests it is concluded that there is a
significant association between average transportation cost of biomass per Km per
MT (in Rs.) and the supplier, as the transportation cost‘s mean value is maximum in
case of middle men (1.34) and minimum in case of stockiest(1.08), the P value is less
than 0.05 hence null hypothesis is rejected.
The average storage cost of Biomass with respect to stockiest is 1444.44(mean
value) that of middlemen is 1531.00 and that of farmer is 1510.00 and the anova P
value is more than 0.05 therefore null hypothesis is accepted. The conclusion is that
there is no significant association between Average storage cost of Biomass (in Rs.)
and the Supplier. Very little differences are there in the storage costs of various
suppliers.
The analysis shows that the mean value of ash content of Coal major mix is 30.46%
and of Biomass major mix is 9.60% and of biomass only is 8.17% .So the conclusion
is that coal major mix has more of ash content which is just a waste for the
companies so the power producers should use more of biomass as a feedstock and
192
decrease the amount of coal as a feed stock to reduce the amount of waste. The
results show that there is a close association between ash content of mix % and the
fuel mix. This proves that using biomass feedstock is economically viable if we
consider in terms of ash content. The P value is less than 0.05. Hence rejecting the
null hypothesis.
A bird‘s eye view shows that in the 9 companies surveyed by us, 104 employees are
using 0% coal and 100% Biomass depicted as (Biomass only), 23 employees are
using majorly biomass 93-94% and very less coal 6-7% shown as (Biomass major
mix) and Only 14 employees are using around 93-94% coal and 6-7% biomass
shown as(Coal major mix).
When analysis was done for the boiler efficiency it was found that when 76.9%
employees are using (Biomass only) at that time boiler efficiency is in the range of
70-80%. The efficiency is between 80-90% when 92.9% employees are using coal
mix. The conclusion is that when maximum use of biomass is used as feedstock,
efficiency to produce power is quite good. The Pearson chi square value is less than
0.05 hence rejecting the null hypothesis. Therefore the conclusion is that there is a
significant association between boiler efficiency and the type of mix.
Maximum power is generated in the range of (81-100%) when biomass only is used
by the companies i.e. when companies are using more of biomass at that time
maximum power is generated. When majorly coal mix is being used i.e. 78.6% at
that time only 6-10% power is generated. Hence the conclusion is that there is a
significant association between power generated due to biomass with respect to total
power generation in the plant and the type of mix. Null hypothesis is therefore
rejected.
The GCV of coal mix is maximum amongst all the mixes, its mean value is 4280.179
whereas the GCV of biomass only is having the mean value as 3142.288 and the
mean value of biomass major is 3183.610. Therefore the conclusion is that there is a

193
close association between GCV of mix and the types of mixes, rejecting the null
hypothesis.
It is concluded from the analysis for the type of loss of GCV for biomass during
storage and the type of mix that maximum loss in GCV is due to the adulteration in
coal major mix by addition of moisture. Even biomass major mix is mainly
adulterated by moisture. Biomass only is mostly blown away with wind. Therefore
there is significant association between type of loss of GCV during storage and the
type of mix. The chi square value is less than 0.05. Rejecting the null hypothesis.
It can be concluded that Type of loss of GCV during storage is significantly
associated with the Types of Biomass vendors as when the type of vendor is the
stockiest (72.7%) then maximum GCV loss is due to the moisture addition in
biomass. In case of farmer (54.3%) maximum loss is due to the wind and in the case
of middlemen (41.9%) also maximum loss is by the wind. As the chi square value is
less than 0.05. Rejecting the null hypothesis.
It can be concluded that the that there is significant difference among mean GCV
loss% of fuel mixes as the mean values of GCV loss in mix% is maximum in case of
Biomass major mix (5.6974). In case of coal major mix it is (3.6236) and in case of
biomass only it is (5.5865) which shows that GCV loss is minimum in case of coal
major mix. The ANOVA value is less than 0.05 hence rejecting the null hypothesis.
It is concluded that there is a close association between the ways of storing biomass
and the type of mix. When the analysis was done it was found that Briquettes are
mainly formed when the mix is of either biomass only type or of biomass major mix
(47.8%) type. No briquettes are formed out of coal major mix (0%). When the mix is
of Biomass only (63.5%) type then mainly it is left open at the farm land. Very few
organizations are making the briquettes. Instead more companies should concentrate
on making the briquettes as in them GCV loss is very less and compact form of husk

194
is there so easy to store and handle. The Chi square value is less than 0.05. Therefore
rejecting the null hypothesis.
When the type of vendor is the stockiest (50%) then mainly the biomass is left loose
at the farm land when the Middlemen (69.4%) are supplying the biomass husk at that
time also the husk is left loose at the farms . Therefore it is concluded that there is no
significant association between the ways of storing Biomass and the types of
Biomass vendors. The chi square value is more than 0.05 hence accepting the null
hypothesis.
It is concluded that there is no significant association between the mode of
transporting biomass from field / storage to the power plant and the role of suppliers
in the Biomass supply chain as in either case i.e. stockiest, middlemen, farmers the
mode of transportation is tractor trolley, loading truck or tractors. Null hypothesis is
accepted as the chi square value is more than 0.05.
5.2 Major Conclusions of qualitative analysis
It is concluded that the strategy of using mixes of coal and biomass is making the
companies and industries very good competitive players in the power generation
field.
Companies have lowered the operation costs and power generating costs by the use
of mix of coal and biomass both.
More and more companies and industries are now coming up in this area of
generating power using the husk and residues of the agriculture waste left out in
fields.
It is concluded that the use of new equipment and machines by the companies to cut
the crop residue and waste has improved the situations in fields and middlemen and
farmers both are happy and satisfied by it.

195
Middlemen indicated that they are rendering their services to more than one
company at a time i.e. they are supplying biomass to many power producing
companies at a time.
Biomass has potential fire hazard, having tendency to self-ignite. During interaction
with middlemen it was disclosed that such incidents of catching fire takes place
during peak summer in the warehouses and dump yards. So they have to be very
precautious and careful.
The credit limit time forced by energy producing companies is not preferred.
Collection of payment needs lot of follow-ups which is not favored by farmers
5.3 Suggestions
Suggestions for Companies
Technical ways by which one can measure the GCV of biomass should be developed in
companies so that more precise and sound results can be obtained.
Companies and organizations are suggested to publish and make the public aware about
the various sources of biomass and the various uses of biomass so that more and more
businessmen and traders come forward and make full use of this eco friendly fuel.
The companies which are leaving the husk loose must concentrate on forming the
briquettes as they will yield a better GCV as compared to loose husk in which GCV loss
is seen.
Suggestions for Government authorities
The government authorities are suggested to develop structured market (mandi) of
biomass so that more farmers and traders will involve themselves into the business of
biomass and more trading will be done of this renewable fuel.
196
New technological advancements and innovations are needed in this area so as to
maximize the generation of biomass.
Government authorities should help and guide the farmers and peasants with regard to
the benefits of not burning the husk of the crops and also help the farmers in making full
utilization of that waste and husk left over in fields.
As compared to other renewable fuels like solar power, wind power, hydro power not
much awareness is there about Biomass power. The authorities and agencies should
make people (who are involved in making bricks in brick kilns and other small scale
business men) aware about the merits of this renewable fuel.
As per guidelines of Government of Rajasthan Renewable energy promotion policy
2004 there was a restriction of using biomass by other companies in a radius of 70km
but many companies are not following this policy and are coming up with their power
plants within this area, due to which prices of biomass husk are continuously rising and
industrialists are facing problem with regard to availability and prices of biomass. The
local authorities should take care of these issues.
Suggestions for Vendors and farmers
Since biomass is a byproduct of crop farmers are not giving due importance to maximize
the quantity of biomass generated. Farmers are therefore suggested to give due
weightage to the husk generated out of the crops and supply this husk for power
generation and not burn it in the farmland as that creates a lot of pollution.
Farmers are suggested to use the ash left out after biomass is burnt as it has many
properties of good manure.

197
Bibliography

198
Journals & Publications
Ahmed Murtala, Bello Aliyu and Gutti Babagana, (2012). Biomass resource as a
source of sustainable energy production in developing countries, Journal of Applied
hytotechnology in Environmental Sanitation, 1 (2): 103-112.
Ahuja, D. and M. Tatsutani, (2009). Sustainable energy for developing countries,
S.A.P.I.EN.S 2.1, Vol.2 / No.1
Allen J, Browne M, Hunter A, Boyd J, Palmer H., (1998). Logistics management
and costs of biomass fuel supply. International Journal of Physical Distribution &
Logistics Management; 28: 463–77.
Ang A, (1997). Present status of biomass energy technologies in Malaysia, Regional
Consultation on Modern Biomass Energy Technologies, Regional Wood Energy
Development Programme, FAO, Kuala Lumpur, Malaysia.
Anil Kumar, Nitin Kumar, Prashant Baredar, Ashish Shukla, (2015). A review on
biomass energy resources, potential, conversion and policy in India, Renewable and
Sustainable Energy Reviews; 45: 530-539
Ataseven C. and Nair A., (2017). Assessment of supply chain integration and
performance relationships: A meta-analytic investigation of the literature,
International Journal of Production Economics; 185(1): 252- 265.
Athanasios A. Rentizelas, Athanasios J. Tolis, Ilias P. Tatsiopoulos, (2009).
Logistics issues of biomass: The storage problem and the multi-biomass supply
chain, Renewable and Sustainable Energy Reviews; 13(4): Pp 887-894
Atul K, Pallav P, Santosh R, Tara C K, (2002). An approach to the estimation of the
value of agricultural residues used as biofuels, Biomass and Bioenergy; 22: 195-203.

199
Ba B.H., C. Prins and C. Prodhon, (2016). Models for optimization and performance
evaluation of biomass supply chains: An Operations Research perspective,
Renewable Energy; vol. 87: pp. 977–989.
Bagchi P.K. and Virum H., (1998). Logistical alliances: trends and prospects in
integrated, Europe Journal of Business Logistics; 19(1): 191-213.
Bagchi P.K. and Chun B., (2005). Supply chain integration: A European survey, The
International Journal of Logistics Management; 16(20): 275-294.
Bain, R. L., (1993). Electricity from biomass in the United States: Status and future
direction, Bioresource Technology; 46 (1-2): 86-93.
Bairamzadeh S., M. Saidi-mehrabad and M. S. Pishvaee, (2017). Modelling different
types of uncertainty in biofuel supply network design and planning: A robust
optimization approach, Renewable Energy; vol. 116(PA): pp 500-517.
Balachandra P., (2011). Modern energy access to all in rural India: an integrated
implementation strategy, Energy Policy 2011;39: 7803–14.
Ballou R.H., (2007). The evolution and future of logistics and supply chain
management. European Business Review; 19(4): 332-348
Baofen, L and Xiangjun, Y, (1997). Development and utilization of biomass in
China, Regional Consultation on Modern Biomass Energy Technologies, Regional
Wood Energy Development Programme, FAO, Kuala Lumpur, Malaysia.
Basnet C. and Wisner J., (2012). Nurturing internal supply chain integration,
Operations & Supply Chain Management: An International Journal; 5(1): 27-41.
200
Bawagan, P.V and Semana, J.A (1980), Dendrothermal Power Plants: Prospects and
Problems, workshop on Forestry and the Energy Crisis, Forest Research Institute
Central Office, Los Banos, Philippines.
Baxter L, (2005). Biomass-coal co-combustion: opportunity for affordable
renewable energy, Fuel; 84: 1295–1302
Bedarul Md. Alam, Reino Pulkki, Chander Shahi, and Thakur Prasad Upadhyay,
(2012). Economic analysis of biomass supply chains: A Case Study of Four
Competing bioenergy power plants in Northwestern Ontario, Renewable Energy;
Vol. 2012: 12 pgs
Bergman, P. C.A. and J. H.A. Kiel., (2005). Torrefaction for biomass upgrading,
14th Biomass Conference & Exhibition, at Paris, France.
Berndes G., Hoogwijk M., Van Den Broek R., (2003). The contribution of biomass
in the future global energy supply: a review of 17 studies, Biomass and Bioenergy;
25:1-28.
Bhat PR, Chanakya HN, Ravindranath NH, (2001). Biogas plant dissemination:
success story of Sirsi, India, Energy Sustainable Dev 2001;V: 39-41.
Bhattacharyya SC, (2006). Energy access problem of the poor in India: Is rural
electrification a remedy?, Energy Policy 2006; 34: 3387–3397.
Birka W., E. Smeets, H. Watson and A. Faaij, (2011). The Current bioenergy
production potential of semi-arid and arid regions in Sub-Saharan Africa, Biomass
and Bioenergy; 35: 2773-2786.
Brooks N, Bhojvaid V, Jeuland MA, Lewis JJ, Patange O and Pattanayak SK,
(2016). How much do alternative cookstoves reduce biomass fuel use? Evidence
from North India, Resource Energy Economics; 43:153–171

201
Cardozo E, Erlich C, Malmquist A, Alejo L, (2014). Integration of a wood pellet
burner and a Stirling engine to produce residential heat and power, Applied Thermal
Engineering; 73:669–678
Carroll JP and Finnan J, (2012). Physical and chemical properties of pellets from
energy crops and cereal straws, Biosystems engineering; 112(2):151–159
Chanakya H N, Srikumar K G, Anand V, Modak J, Jagadish K S, (1999).
Fermentation properties of agro-residues, leaf biomass and urban market garbage in
a solid phase biogas fermenter. Biomass and Bioenergy 1999; 16: 417-429.
Chanakya HN, Reddy BVV, Modak J, (2009). Biomethanation of herbaceous
biomass residues using 3-zone plug flow like digesters-a case study from India.,
Renewable Energy 2009;34: 416–20.
Chaturvedi P., (1993). Bioenergy production and utilization in India- Expert
consultation on biofuels for sustainable development; Their Potential as suitable to
fossil fuels and CO2. Emission reduction, (FAO) Food and Agriculture
Organization, Rome.
Chaturvedi V, Eom J, Clarke L, Shukla PR, (2014). Long term building energy
demand for India: disaggregating end use energy services in an integrated
assessment modeling framework, Energy Policy; 64: 226–242
Chauhan S. S., J. M. Frayret, and L. LeBel, (2009). Multi-commodity supply
network planning in the forest supply chain, European Journal of Operational
Research; vol. 196, No. 2: pp. 688–696.
Chikkatur AP, Sagar AD, Sankar TL, (2009). Sustainable development of the Indian
coal sector. Energy; 34: 942–953
202
Clair, Lee, (2010). Biomass – An Emerging Fuel for Power Generation, Norbridge
Inc., Available at
http://www.renewableenergyworld.com/rea/news/article/2010/02/biomass-an-
emergingfuel-for-power-generation
Cruijessen F., Dullaert W. and Fleuren H., (2007). Horizontal cooperation in
transport and logistics: A literature review, Transportation Journal; 46(3): 22-39.
Demirbas A., (1997). Calculation of higher heating values of biomass fuels. Fuel
1997; 76(5): 431-34.
Demirbas, M. F., M. Balat and H. Balat, (2009). Potential contribution of biomass to
the sustainable energy development, Energy Conversion and Management; 50:
1746–1760.
Dornburg, V. and Faaij, A., (2001). Efficiency and economy of wood fired biomass
energy systems in relation to scale regarding heat and power generation using
combustion and gasification technologies, Biomass and Bioenergy; Vol. 21. No.2:
Pp. 91-108.
Dwivedi P, Khanna M, Bailis R, Ghilardi A, (2014). Potential greenhouse gas
benefits of transatlantic wood pellet trade. Environment Research Letters; 9: 1– 11
Edward, M.W.S., A.P.C. Faaij, I.M. Lewandow ski and W. C. Turkenburg, (2007).
A bottom-up assessment and review of global bio-energy potentials to 2050,
Progress in Energy and Combustion Science; 33: 56–106.
Ehrig R, Behrendt F, (2013). Co-firing of imported wood pellets: An option to
efficiently save CO2 emissions in Europe, Energy Policy; 59: 283– 300
Ekholm T, Krey V, Pachauri S and Riahi K, (2010) Determinants of household
energy consumption in India, Energy Policy 2010; 38: 5696–707.

203
Ekşioǧlu S. D., A. Acharya, L. E. Leightley and S. Arora, (2009). Analyzing the
design and management of biomass-to-biorefinery supply chain, Comput. Industrial.
Engineering; vol. 57, No. 4: pp. 1342–1352
Esper T. L., Defee C. C., Mentzer J. T., (2010). A framework of supply chain
orientation, The International Journal of Logistics Management; 21(2): 161-179.
Faaij, A., (2006). Modern biomass conversion technologies. Mitigation and
Adaptation Strategies for Global Change, Vol 11, No. 2: Pp 335-367.
Faaij, A.P.C. and Domac, J., (2006). Emerging international bioenergy markets and
opportunities for socio-economic development. Energy for Sustainable Development
(Special Issue on Emerging International Bio-energy markets and opportunities for
socioeconomic development; Vol. X. No. 1: Pp. 7-19.
Fernandes U. and M. Costa, (2010). Potential of biomass residues for energy
production and utilization in a Region of Portugal, Biomass and Bioenergy; 34:
661–666.
Flynn B.B., Huo B. and Zhao X., (2010). The impact of supply chain integration on
performance: A contingency configuration approach, Journal of Operations
Management; 28(1): 58–71.
Freppaz D., R. Minciardi, M. Robba, M. Rovatti, R. Sacile, and A. Taramasso,
(2004). Optimizing forest biomass exploitation for energy supply at a regional level,
Biomass and Bioenergy; vol. 26, No. 1: pp. 15–25.
Frisch, L.E, (1993). Reliable cogeneration utilizing wood as a primary fuel, ASME
Power Conference.

204
Frohlich M. T. and Westbrook R., (2001). Arcs of integration: An international
study of supply chain strategies, Journal of Operations Management; 19(2): 185–
200.
Frombo F., R. Minciardi, M. Robba, F. Rosso, and R. Sacile, (2009). Planning
woody biomass logistics for energy production: a strategic decision model, Biomass
and Bioenergy; vol. 33, No. 3: pp. 372–383.
Gadgil K, (2003). Role of biomass in renewable energy systems, TWOWS
International conference in Bangalore; November, 2003.
Gan J. and C. T. Smith, (2006). Availability of logging residues and potential for
electricity production and carbon displacement in the USA, Biomass and Bioenergy;
vol. 30, No. 12: pp. 1011– 1020.
Ganesh A. and Banerjee R., (2001). Biomass pyrolysis for power generation—a
potential technology. Renewable Energy 2001; 22: 9–14.
Gemtos TA and Tsiricoglou T., (1999). Harvesting of cotton residue for energy
production, Biomass Bioenergy; 16: 51–9.
Gentry J.J., (1996). The role of carries in buyer-supplier strategic partnerships: a
supply chain management approach, Journal of Business Logistics; 17 (2): 35-55.
Gold S. and S. Seuring, (2011). Supply chain and logistics issues of bio-energy
production, Journal of Cleaner Production; vol. 19, No. 1: pp. 32–42.
Goldemberg J, Coelho ST, (2004). Renewable energy—traditional biomass vs.
modern biomass, Energy Policy; 32(6):711–714

205
Graham RL, English BC and Noon CE, (2000). A Geographic Information system
based modeling system for evaluating the cost of delivered energy crop feedstock.
Biomass Bioenergy 2000; 18: 309–29.
Graham RL, LiuW, Downing M, Noon CE, Daly M and Moore A, (1997). The
effect of location and facility demand on the marginal cost of delivered wood chips
from energy crops: A case study of the state of Tennessee, Biomass Bioenergy
1997;13: 117–23.
Gunnarsson H., M. R¨onnqvist, and J. T. Lundgren, (2004). Supply chain modelling
of forest fuel, European Journal of Operational Research; vol. 158, No. 1: pp. 103–
123.
Gupta SK, Purohit P, (2013). Renewable energy certificate mechanism in India: A
preliminary assessment, Renewable and Sustainable Energy Reviews; 22: 380–392
Hamzeh,Y., A. Ashori, B. Mirzaei, A. Abdulkhani and M. Molaei, (2011). Current
and potential capabilities of biomass for green energy in Iran, Renewable and
Sustainable Energy Reviews; 15: 4934– 4938.
Heinimö J and Junginger M., (2009). Production and trading of biomass for energy -
An overview of the global status. Biomass and Bioenergy; 33(9): 1310-1320.
Hewett C E, C J High, N Marshall, and R Wildermuth, (1981). Wood Energy in the
United States, Annual Review of Energy, November 9, 139-170.
Hillring, B (1997), Price Trends in the Swedish Wood-Fuel Market, Biomass and
Bioenergy; Vol. 12, No. 1.
Hiloidhari M, Das D, Baruah DC, (2014). Bioenergy potential from crop residue
biomass in India, Renewable and Sustainable Energy Reviews; 32: 504–512

206
Hiremath RB, Kumar B, Balachandra P, Ravindranath NH, Raghunandan BN,
(2008). Decentralized renewable energy: Scope, relevance and applications in the
Indian context. Energy Sustainable Dev 2008; 13: 4.
Hoogwijk M., (2004). On the global and regional potential of renewable energy
sources, Utrecht University, Department of Science, Technology and Society, pp
256
Hoogwijk M., A. Faaija, R. van den Broek, G. Berndes, D. Giele and W.
Turkenburg, (2003). Exploration of the ranges of the global potential of biomass for
energy, Biomass and Bioenergy; 25: 119 – 133.
Huisman W, Venturi P, Molenaar J, (1997). Costs of supply chains of Miscanthus
giganteus, Industrial Crops and Products; Vol 6(3-4): Pp 353-366
Isci A and Demirer G N, (2007). Biogas production potential from cotton wastes,
Renewable Energy 2007; 32: 750-757.
Jager-Waldau A, Ossenbrink H., (2004). Progress of electricity from biomass, wind
and photovoltaics in the European Union, Renewable Sustainable Energy Reviews
2004;8: 157–82.
Jenkins B. M. and Ebeling J.M., (1985). Correlation of physical and chemical
properties of terrestrial biomass with conversion, symposium energy from biomass
and waste IX IGT; 1985: 371.
Johansson, T.B, Williams, R.H, Ishitani, H and Edmonds, J.A (1996), Options for
reducing CO2 emissions from the energy supply sector, Energy Policy, Vol. 24, No
10.
Johnston CMT and van Kooten GC, (2015). Economics of co-firing coal and
biomass: An application to Western Canada, Energy Econ; 48: 7–17
207
Kalia V C, Sonakya V, Raizada N, (2000). Anaerobic digestion of banana stems
waste. Bioresource Technology 2000; 73: 191-193.
Kaliyan N and Morey RV, (2009). Factors affecting strength and durability of
densified biomass products, Biomass and Bioenergy; 33(3): 337–359
Kamal M.M. and Irani Z., (2014). Analysing supply chain integration through a
systematic literature review: A normative perspective, Supply Chain Management;
19(5-6): 523-557.
Kim J., M. J. Realff, and J. H. Lee, (2011). Optimal design and global sensitivity
analysis of biomass supply chain networks for biofuels under uncertainty,
Computers and Chemical Engineering; vol. 35, no. 9: pp. 1738–1751.
Kim, S., and B. E. Dale, (2004). Global potential bioethanol production from wasted
crops and crop residues, Biomass and Bioenergy; 26 (4): 361-375.
Kishore VVN, Bhandari PM, Gupta P, (2004). Biomass energy technologies for
rural infrastructure and village power-opportunities and challenges in the context of
global climate change concerns, Energy Policy 2004; 32: 801–810.
Koppejan J., (2007). Fuel Storage, handling and preparation and system analysis for
biomass combustion technologies, Proceeding of the European Biomass Conference,
Berlin, Germany, May 2007, Available at http://www.conference-biomass.com/.
Kotcio˘glu, I., (2011). Clean and sustainable energy policies in Turkey, Renewable
and Sustainable Energy Reviews; 15: 5111– 5119.
Kothari, R., V.V. Tyagi and P. Ashish, 2010. Waste-to-Energy: A way from
renewable energy sources to sustainable development, Renewable and Sustainable
Energy Reviews; 14: 3164-3170.

208
Kumar A, Purohit P, Rana S, Kandpal TC, (2002). An approach to the estimation of
value of agricultural residues used as biofuels. Biomass and Bioenergy; 22(3):195–
203
Lambert D.M., (2004). The eight essential supply chain management processes,
Supply Chain Management Review; 8(6): 18-26.
Lewandowski, I., J. Weger, A. van Hooijdonk, K. Havlickova, J. van Dam and A.
Faaij, (2006). The Potential biomass for energy production in the Czech Republic,
Biomass and Bioenergy; 30: 405–421.
Li J, Ren D and Zhuang X, (2001). Systemic evaluation method of renewable energy
resources and its practical application, Journal of Natural Resources; 16(4): 373-380.
Li S, Yang B, Wang J, et al., (2008). Development of straw collection technology
for major agricultural crops. Farm Machinery, 2008; (16): 23-26.
Liu Z, Mi B, Jiang Z, Fei B, Cai Z, Liu X, (2016). Improved bulk density of bamboo
pellets as biomass for energy production. Renewable Energy; 86: 1–7
Lu G, Yan Y, Cornwell S, Whitehouse M, Riley G, (2008). Impact of cofiring coal
and biomass on flame characteristics and stability, Fuel; 87: 1133–1140
Mafakheri F. and F. Nasiri, (2014). Modeling of biomass to energy supply chain
operations: Applications, challenges and research directions, Energy Policy; vol. 67:
pp. 116–126.
Maheshwari RC, (1975). Utilization of rice husk as fuel, Agricultural Engineering
Department, IIT, Kharagpur, India.

209
Mahmoudi M., T. Sowlati, and S. Sokhansanj, (2009). Logistics of supplying
biomass from a mountain pine beetle-infested forest to a power plant in British
Columbia, Scandinavian Journal of Forest Research; vol. 24, No.1: pp. 76–86.
Mani S, Sokhansanj S, Bi X, Turhollow A, (2006). Economics of producing fuel
pellets from biomass, Applied Engineering in Agriculture; 22: 421–426
Martosudirjo, S (1997), Biomass waste utilization for energy in Indonesia, Regional
consultation on modern biomass energy technologies, Regional Wood Energy
Development Programme, FAO, Kuala Lumpur, Malaysia.
Mathews, J.A., (2008). Opinion: Is growing biofuel crops a crime against
humanity?, Biofuels, Bioproducts and Biorefining; Vol 2, Issue 2: 97–99.
McKendry P, (2002). Energy production from biomass (Part 1): Overview of
biomass, Bio resource Technology 2002; 83(1): 37 46.
McKendry P., (2002). Energy production from biomass (Part 2): overview of
biomass, Bio resource Technology 2002; 83(2): 47 54.
McMillan, J. D., (2004). Biotechnological routes to biomass conversion,
USDOE/NASULGC-Biomass and Solar Energy Workshops.
Mentzer J. T., (2001). Managing the supply chain-managerial and research
implications, Supply Chain Management, pp. 437–461
Miller, A.S, Mintzer, I.M, Hoagland, S.H (1986), Growing power bioenergy for
development and industry, World Resources Institute; Study 5: Washington, D.C.,
U.S.A.
Mohan D, Pittman Jr. CU and Steele PH, (2006). Pyrolysis of wood/biomass for bio-
oil: A critical review, Energy Fuels 2006; 20, 3: 848–89.

210
Moses, H. D., G. Sai and B.H. Essel, (2011). A Comprehensive review of biomass
resources and biofuels Potential in Ghana, Renewable and Sustainable Energy
Reviews; 15: 404–415
Murali S, Shrivastava R, Saxena M, (2008). Quantification of agricultural residues
for energy generation-A case study, Jounal of Inst Public Health Eng 2008; 08(3):27
Nallathambi G V, (1997). Anaerobic digestion of biomass for methane Production:
A review, Biomass and Bioenergy; 13: 83-114.
Okello C, Pindozzi S, Faugno S, Boccia L, (2013). Development of bioenergy
technologies in Uganda: A review of progress, Renewable and Sustainable Energy
Reviews; 18: 55-63.
Omer, M., (2008). Energy environment and sustainable development, Renewable
and Sustainable Energy Reviews; 12: 2265–2300.
Pachauri S., Jiang L., (2008). The household energy transition in India and China,
Energy Policy 2008; 36: 4022–35.
Panwara N.L., S.C. Kaushik and S. Kotharia, (2011). Role of renewable energy
Sources in environmental protection: A Review, Renewable and Sustainable Energy
Reviews; 15: 1513–1524.
Panyathanya, W (1997), Modern industrial biomass technology in Thailand,
Regional Consultation on Modern Biomass Energy Technologies, Regional Wood
Energy Development Programme, FAO, Kuala Lumpur, Malaysia.
Parikka, M., (2004). Global biomass fuel resources, Biomass and Bioenergy; 27 (6):
613-620.

211
Pereza A.T.E., Camargoa M., Rinconb P.C.N. and Marchantc M.A., (2017). Key
challenges and requirements for sustainable and industrialized biorefinery supply
chain design and management: A bibliographic analysis. Renewable and Sustainable
Energy Reviews; 69: pp. 350–359.
Perpi˜n´a C., D. Alfonso, A. P´erez-Navarro, E. Pe˜nalvo, C.Vargas, and R.
C´ardenas, (2009). Methodology based on geographic information systems for
biomass logistics and transport optimisation, Renewable Energy; vol. 34, No. 3: pp.
555–565.
Prasad S, Singh A and Joshi HC, (2007). Ethanol as an alternative fuel from
agricultural, industrial and urban residues, Resource Conservation and Recycling
2007; 50(2007):1–39.
Rai S.N. and Chakrabarti S.K. (1996). Demand and Supply of fuelwood, timber and
fodder in India, Forest Survey of India Report, Ministry of Environment and
Forests, Government of India, New Delhi.
Rauch P. and M. Gronalt, (2010). The terminal location problem in the forest fuels
supply network, International Journal of Forest Engineering; vol. 21, No. 2.
Rauch P., M. Gronalt, and P. Hirsch, (2010). Co-operative forest fuel procurement
strategy and its saving effects on overall transportation costs, Scandinavian Journal
of Forest Research; vol. 25, No. 3: pp. 251–261.
Ravindranath NH and Balachandra P, (2009). Sustainable bioenergy for India:
technical, economic and policy analysis, Energy 2009; 34(8): 1003–13.
Ravindranath NH, Somashekar HI, Nagaraja MS, Sudha P, Sangeetha G,
Bhattacharya SC, et al., (2005). Assessment of non-plantation biomass resources
potential for energy in India. Biomass and Bioenergy; 29: 178–90.

212
Reddy AKN, (1995). The blessing of the commons. Energy Sustainable Dev 1995,
International Conference on "Common Property, Collective Action and Ecology; II
(1): 48–50.
Rentizelas A.A., Tolis A.J. and Tatsiopoulos I.P., (2009). Logistics issues of
biomass: The storage problem and the multi biomass supply chain, Renewable and
Sustainable Energy Reviews; vol. 13, pp: 887-894.
Sahito A R, (2010). Characterization and quantification of waste agricultural
biomass and its energy potential in District Sanghar., Institute of Environmental
Engineering & Management, Mehran University of Engineering & Technology
Jamshoro, Pakistan.
Sambra A., C. G. Sørensen, E. F. Kristensen University of Aarhus, Optimized
harvest and logistics for biomass supply chain Faculty of Agricultural Sciences,
Dept. of Agricultural Engineering Schüttesvej 17 DK-8700 Horsens, Denmark
Shabani N, Akhtari S, Sowlati T, (2013). Value chain optimization of forest biomass
for bioenergy production: A review, Renewable and Sustainable Energy Reviews;
23: 299-311.
Sharma A, Unni BG, Singh HD., (1999). A novel fed batch system for bio
methanation of plant biomasses. Journal of bioscience and bioengineering; 87(5):
678–82.
Sharma B., R. G. Ingalls, C. L. Jones and A. Khanchi, (2013). Biomass supply chain
design and analysis: Basis, overview, modeling, challenges, and future, Renewable
and Sustainable Energy Reviews; vol. 24: pp. 608–627.
Shi, L. S., (2004). Analysis on the current situation of Chinese and renewable energy
source development plan. Renewable energy source; (5): 1-4.

213
Smeets, E., Faaij, A., Lewandowski, I. and Turkenburg, W., (2007). A quick scan of
global bioenergy potentials to 2050, Energy and Combustion Science; Volume 33,
Issue 1, February: Pp 56-106.
Soccel C R, et. al., (2005). Brazilian biofuel program: An overview, Journal of
Scientific and Industrial Research; Vol. 64: pp 897-904
Sokhansanj S, Kumar A and Turhollow AF, (2000). Development and
implementation of integrated biomass supply analysis and logistics model (IBSAL),
Biomass and Bioenergy 2006; 30: 838–47.
Souza, Samuel Nelson M, Werncke Ivan, Marques Cleber Aimoni, Bariccatti
Reinaldo A, Santos Reginaldo F, et al., (2013). Electric energy micro-production in
a rural property using biogas as primary source, Renewable Sustainable Energy
Reviews; 28: 385–91.
Sowlati T., (2009). Forest Products and Forest Biomass Transportation and
Logistics, FORAC, 2009, Available at http://www.forac.ulaval.ca/.
Steubing, B., R. Zah, P. Waeger and C. Ludwig, (2010). Bioenergy in Switzerland:
Assessing the Domestic Sustainable Biomass Potential, Renewable and Sustainable
Energy Reviews; 14: 2256– 2265.
Tahvanainen T. and A. Perttu, 2011). Supply chain cost analysis of long-distance
transportation of energy wood in Finland, Biomass and Bioenergy; vol. 35, No. 8:
pp. 3360–3375.
Tatsiopoulos IP, Tolis AJ., (2003). Economic aspects of the cotton-stalk biomass
logistics and comparison of supply chain methods. Biomass and Bioenergy; 24: 199-
214.
214
Tye, Y.Y., K. T. Lee, W. N. Wan Abdullah and C.P. Leh, (2011). Second-generation
bioethanol as a sustainable energy Source in Malaysia transportation Sector: Status,
Potential and Future Prospects, Renewable and Sustainable Energy Reviews; 15:
4521–4536.
Varshney R, Bhagoria JL, Mehta CR, (2010). Small scale biomass gasification
technology in India-An overview, Journal Engineering Science Management;3: 33-
40
Wang J., (2007). Woody biomass resources, utilization, and opportunities in West
Virginia, USA, Proceedings of the 3rd Forest Engineering Conference, Mont-
Treblant.
Wu J, Ma L, Lin W, (2012). Literature review on biomass power generation
technology and economic feasibility, Forest Engineering; 28(5): 102-106.
Xu, Y, M.A. Hanna and L. Isom, (2008). Green Chemicals from Renewable
Agricultural Biomass - A Mini Review, The Open Agriculture Journal; 2: 54-61.
Yamamoto H, Fujino J, Yamaji K., (2001). Evaluation of bioenergy potential with a
multi-regional global-land-use-and-energy model, Biomass and Bioenergy; 21: 185–
203.
Yi X, Sun L, Guo D, et al., (2005). Pretreatment technology of raw biomass stalks,
Renewable Energy, 2005; (2): 31-33.
Zhang Q, J. Chang, T. Wang and Y. Xu, (2007). Review of Biomass pyrolysis oil
properties and upgrading research, Energy Conversion and Management; 48: 87–92.
Zhang Y, Wang F, Zhao L, et al., (2009). The operating model, existing problems
and development strategies for China's straw storage and transportation system.
Renewable Energy, 2009; 27(01): 1-5.

215
Books & Reports
Amanda B. An Overview of municipal waste and landfills; How cities deal with
garbage, recycling, landfills, and dumps, Available at
https://www.thoughtco.com/municipal-waste-and-landfills-overview-1434949
Bowersox D.J. and Closs D.J., (1996). Logistical management: The integrated
supply chain process; McGraw-Hill Higher Education, New York, NY.
Bowersox D.J., (2007). Supply chain logistics management; McGraw-Hill Higher
Education, New York, NY.
Bowersox D.J., Closs D.J., Cooper M.B. and Bowersox J.C., (2013). Supply Chain
Logistics management; 4th ed., McGraw-Hill Higher Education, New York, NY.
Bowersox D.J., Closs, D.J. and Cooper M.B., (2007), Supply Chain Logistics
Management; McGraw-Hill, Boston, MA.
Brown, R.C., (2003). Bio-renewable Resources: Engineering New Products from
Agriculture, Ames, Iowa: Iowa State Press 4.
Christopher M., (1992). Logistics, the strategic Issues. London; Chapman and Hall
Das CR, Ghatnekar SD., (1979). Replacement of cowdung by fermentation of
aquatic and terrestrial plants for use as fuel, fertilizer and biogas plant feed. India; N.
p., 1979.
Davis SC, Hay W, Pierce J, (2014). Biomass in the energy industry: An
introduction; United Kingdom, London: BP p.l.c.
Grover P D, Iyer P V R and Rao T R, (2002). Biomass- thermochemical
characterization. 3rd Ed. IIT Delhi: MNES; 2002.

216
Hobson PN, Bousefield R and Summers R, (1981). Methane production from
agricultural and domestic wastes. Applied Science Publishers Ltd, London; 1981: p.
121.
James, H. C. and I.D. Fabien, (2008). Introduction to Chemical from Biomass; John
Wiley and Sons, Ltd., United Kingdom.
Joshi V, Ramana Sinha C.S, Karuppaswamy M, Srivastava K.K, and Singh P.B.
(1992). Rural Energy Data Base; TERI, New Delhi.
Kapoor RP, Agarwal A, (1992). Investments in afforestation: trends and prospects.
In: Agarwal A. (ed.), The Price of Forests; Centre for Science and Environment,
New Delhi: pp. 173-178
Loulou R, Shukla P.R and Kanudia A (1997), Energy and Environment Policies for
a Sustainable Future: Analysis with the Indian MARKAL Model; Allied Publishers,
New Delhi, India.
Perlack R, Wright, L., Turhollow, A., Graham, R., Stokes, B.and Erbach, D., (2005).
Biomass as a Feedstock for a Bioenergy and Bioproducts Industry: The Technical
Feasibility of a Billion-Ton Annual Supply, Energy. Oak Ridge, Tennessee: DOE.
Rajan, T.P.S (1995), Eco-friendly fuels from perennial and renewable resources –
Indian Scene, Chemical Weekly; Vol. 40, No. 11.
Ramana P.V, Sinha C.S and Shukla P.R. (1997). Environmental Issues in Rural
Energy: Policy Responses for the future, in energy strategies and greenhouse gas
mitigation (Ed.P.R. Shukla); Allied Publishers, New Delhi, India.
Ravindranath N.H. and Hall D.O (1995), Biomass energy and environment- A
developing country Perspective from India; Oxford University Press, Oxford.

217
Teodorita A S, Dominik R, Heinz P, Michael K, Tobias F, Silke V, Rainer J. Biogas
Handbook; University of Southern Denmark, Denmark. 2008.
The Japan Institute of Energy, 2008, The Asian Biomass Handbook: A guide for
biomass production and utilization; Available at:
http://www.jie.or.jp/biomass/AsiaBiomassHandbook/English/All_E-080917.pdf
Zafar S. (2008) Waste to energy conversion-a global perspective; EARTHTOYS the
renewable energy e-magzine.
Zafar S., (2009). Biomass wastes, alternative energy e-Magzine. Available at:
AltEnergyMag.com;
Zhu, Y. Q., Zhu, L. Z. and Zhao, H. Y., (2010). New energy and distributed power
generation technology; Beijing, Peking University Press.
Annual Akshay Urja report MNRE, Avaible at: http://mnre.gov.in/mission-and-
vision-2/publications/akshay-urja
Annual Energy Outlook 2014, Available at:
http://www.nirs.org/alternatives/sundayforecast414.pdf
Annual report 2013-14. MNRE, Available
at:http://www.mnre.gov.in/annualreport/2010_11_English/index.htm.
Biomass assessment study 2017, Available at:
http://investrajasthan.com/lib/bpulse/022006/bio.html
CEA (2014) CO2 baseline database for the Indian power sector user guide -Ver 9.0.
Central Electricity Authority (CEA), Ministry of Power, Govt. of India, New Delhi

218
CEA (2015) Executive summary: power sector. Central Electricity Authority (CEA),
Ministry of Power, Govt. of India, New Delhi
CEA (2017) Executive summary: Power sector. Central Electricity Authority (CEA),
Ministry of Power, Government of India, New Delhi
CEA (2018) Executive summary: Power sector. Central Electricity Authority (CEA),
Ministry of Power, Govt. of India, New Delhi. Available at:
http://www.cea.nic.in/reports/monthly/executivesummary/2018/exe_summary-
03.pdf.
CERC (2015) Determination of generic levelized generation tariff for the FY 2015-
16 under Regulation 8 of the CERC (terms and conditions for tariff determination
from renewable energy sources) Regulations 2012. Central Electricity Regulatory
Commission (CERC), New Delhi
EBIA (2012), Biomass pelleting: Economics, applications and standards, European
Biomass Industry Association (EBIA), Brussels. Available at:
http://www.eubia.org/index.php/about-biomass/ biomass-pelleting/economics-
applications-and-standards.
Energy in Developing Countries, January 1991, OTA Project: OTA-E-486 NTIS
order #PB91-133694.
Energy statistics report (2014), Govt. of India.
Energy statistics report (2018), Govt. of India.
FAO (1981), FAO Yearbook of Forest Products 1979, Food and Agricultural
Organisation of the United Nations, Rome.

219
FAO (1986), FAO Yearbook of Forest Products 1984, Food and Agricultural
Organisation of the United Nations, Rome.
FAO (1996), FAO Yearbook of Forest Products 1994, Food and Agricultural
Organisation of the United Nations, Rome.
FAO (1997), Review of Wood Energy Data in RWEDP Member Countries, Field
Document No. 47, Bangkok.
FAO (2001), FAO State of the World‘s Forests-2001, www.fao.org
FAO (2005), Food and Agriculture Organization of the United Nations,
―Bioenergy,‖ paper presented to the Committee on Agriculture, Available at:
http://www.fao.org/docrep/meeting/009/j4313e.htm.
FAO (2011), Global forest resources assessment 2010. FAO Forestry Paper 163,
Food and Agriculture Organization of the United Nations, Rome
FAO (2017), FAOSTAT. Food and Agriculture Organization, Rome. Available at:
http://www.fao.org/faostat/en/#data/FO. Accessed 7 Sep 2017
Global Potential of Sustainable Biomass for Energy report by Svetlana Ladanai
Johan Vinterbäck
IEA (1998) World energy outlook 1998. International Energy Agency (IEA), Paris.
www.iea.org, 1998.
IEA (2014) World energy outlook 2014. International Energy Agency (IEA), Paris
IEA (2016) World energy outlook 2016. International Energy Agency (IEA), Paris

220
IRENA (2016) Roadmap for a renewable energy future. International Renewable
Energy Agency (IRENA), Abu Dhabi
MNES. In: Ministry of non-conventional energy sources. Government of India, B-
14, CGO complex, Lodhi Road, New Delhi, India; 1996.
MNRE (2011). Annual report 2010-11. Ministry of New & Renewable Energy
(MNRE), Govt. of India, New Delhi
MNRE (2012). Tracking renewable power regulatory framework, Ministry of New
and Renewable Energy (MNRE), Government of India, New Delhi. Available at:
(http://mnre.gov.in/filemanager/UserFiles/november_month_2012_rerf.pdf).
MNRE (2013). Annual report 2012-13. Ministry of New and Renewable Energy
(MNRE), Govt. of India, New Delhi.
MNRE (2013). Biomass power and cogeneration programme of the Ministry of New
and Renewable Energy (MNRE), Govt of India, New Delhi.
MNRE (2013). Tracking renewable power regulatory framework, Ministry of New
& Renewable Energy (MNRE), Govt. of India, New Delhi
MNRE (2016). Annual Report 2015-16. Ministry of New and Renewable Energy
(MNRE), Govt. of India, New Delhi.
NPC (1987). A report on improvement of agricultural residues and agro-by-products
utilization, National Productivity Council; Lodhi Road: New Delhi, India
OECD/IEA Report, 2006. Energy for Cooking in Developing Countries.

221
Rajasthan biomass fuel supply study 2015. Available at:
https://biomasspower.gov.in/document/Reports/Rajasthan%20biomass%20fuel%20s
upply%20study%202015%20(1).pdf
Sudha P., (1996) Plantation forestry; land availability and bio-mass production
potential in Asia. Report submitted to ARPEEC, Sida, Energy Program, AIT,
Bangkok.
Sustainable Energy for Developing Countries, (2008). A Report to TWAS, the
Academy of Sciences for the Developing World.
White Paper for a Community Strategy and Action Plan, European Commission
Communication from the Commission: Energy for the Future, 1997, Renewable
Energy Sources COM 599.

222
Webliography
http://www.eai.in/ref/ae/bio/ben/benefits_biomass_power.html
http://www.eai.in/ref/ae/bio/biz/biomass_biz_opp.html
http://www.eai.in/ref/ae/bio/bppm/biomass_power_production_methods.html
http://www.eai.in/ref/ae/bio/why/why_biomass_power.html
https://biomasspower.gov.in/About-us-3-Biomass%20Energy%20scenario-4.php
https://en.wikipedia.org/wiki/Biomass
https://en.wikipedia.org/wiki/Biomass_briquettes
https://pub.epsilon.slu.se/4523/1/ladanai_et_al_100211.pdf
https://worldbioenergy.org/uploads/WBA%20GBS%202017_hq.pd f
https://www.canr.msu.edu/news/storing_biomass_in_round_bales
https://www.indiamart.com/proddetail/biomass-pellets-7047325955.html
https://www.researchgate.net/figure/Graphical-Representation-of-a-Biomass-
Supply-Chain-BSC_fig1_266486110
https://www.sciencedirect.com/science/article/abs/pii/S1364032114002688

xiv
Published Research Papers
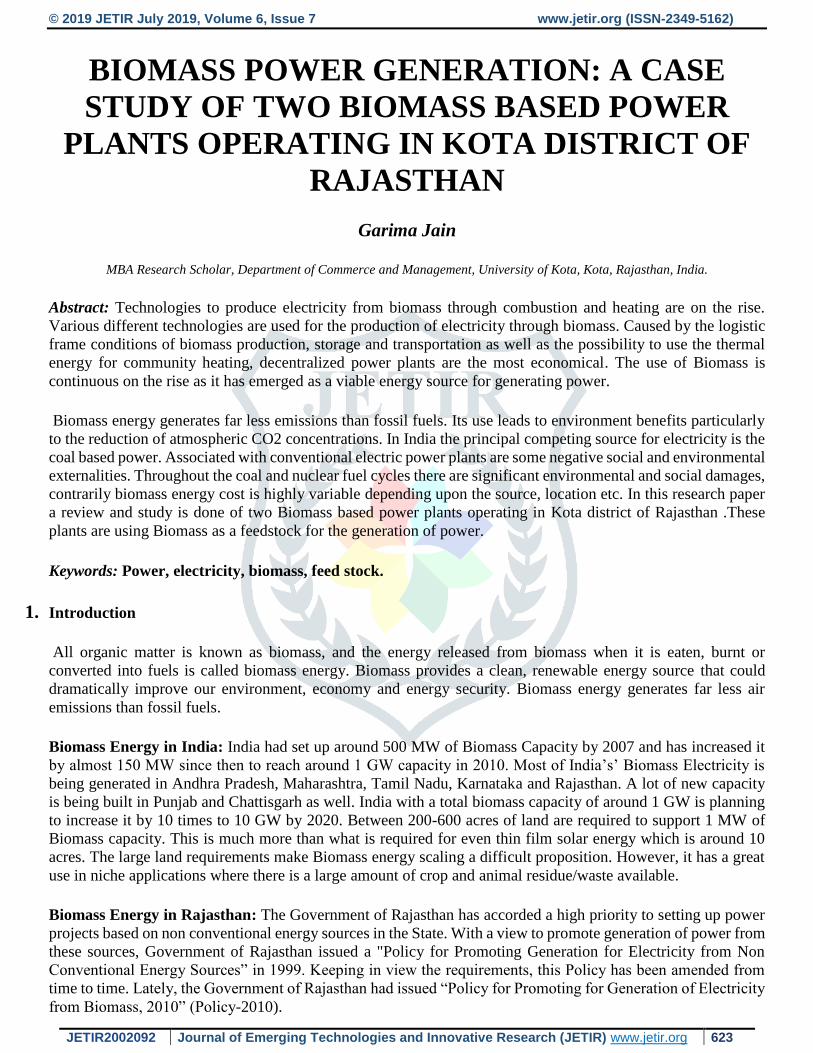
© 2019 JETIR July 2019, Volume 6, Issue 7 www.jetir.org (ISSN-2349-5162)
JETIR2002092 Journal of Emerging Technologies and Innovative Research (JETIR) www.jetir.org 623
BIOMASS POWER GENERATION: A CASE
STUDY OF TWO BIOMASS BASED POWER
PLANTS OPERATING IN KOTA DISTRICT OF
RAJASTHAN
Garima Jain
MBA Research Scholar, Department of Commerce and Management, University of Kota, Kota, Rajasthan, India.
Abstract: Technologies to produce electricity from biomass through combustion and heating are on the rise.
Various different technologies are used for the production of electricity through biomass. Caused by the logistic
frame conditions of biomass production, storage and transportation as well as the possibility to use the thermal
energy for community heating, decentralized power plants are the most economical. The use of Biomass is
continuous on the rise as it has emerged as a viable energy source for generating power.
Biomass energy generates far less emissions than fossil fuels. Its use leads to environment benefits particularly
to the reduction of atmospheric CO2 concentrations. In India the principal competing source for electricity is the
coal based power. Associated with conventional electric power plants are some negative social and environmental
externalities. Throughout the coal and nuclear fuel cycles there are significant environmental and social damages,
contrarily biomass energy cost is highly variable depending upon the source, location etc. In this research paper
a review and study is done of two Biomass based power plants operating in Kota district of Rajasthan .These
plants are using Biomass as a feedstock for the generation of power.
Keywords: Power, electricity, biomass, feed stock.
1. Introduction
All organic matter is known as biomass, and the energy released from biomass when it is eaten, burnt or
converted into fuels is called biomass energy. Biomass provides a clean, renewable energy source that could
dramatically improve our environment, economy and energy security. Biomass energy generates far less air
emissions than fossil fuels.
Biomass Energy in India: India had set up around 500 MW of Biomass Capacity by 2007 and has increased it
by almost 150 MW since then to reach around 1 GW capacity in 2010. Most of India’s’ Biomass Electricity is
being generated in Andhra Pradesh, Maharashtra, Tamil Nadu, Karnataka and Rajasthan. A lot of new capacity
is being built in Punjab and Chattisgarh as well. India with a total biomass capacity of around 1 GW is planning
to increase it by 10 times to 10 GW by 2020. Between 200-600 acres of land are required to support 1 MW of
Biomass capacity. This is much more than what is required for even thin film solar energy which is around 10
acres. The large land requirements make Biomass energy scaling a difficult proposition. However, it has a great
use in niche applications where there is a large amount of crop and animal residue/waste available.
Biomass Energy in Rajasthan: The Government of Rajasthan has accorded a high priority to setting up power
projects based on non conventional energy sources in the State. With a view to promote generation of power from
these sources, Government of Rajasthan issued a "Policy for Promoting Generation for Electricity from Non
Conventional Energy Sources” in 1999. Keeping in view the requirements, this Policy has been amended from
time to time. Lately, the Government of Rajasthan had issued “Policy for Promoting for Generation of Electricity
from Biomass, 2010” (Policy-2010).

© 2019 JETIR July 2019, Volume 6, Issue 7 www.jetir.org (ISSN-2349-5162)
JETIR2002092 Journal of Emerging Technologies and Innovative Research (JETIR) www.jetir.org 624
It was found that on an average about 92.5% of Biomass generated from the agricultural activity goes for
consumption in local for fodder, manure, fuel for thermal energy consuming industries, biomass power plants,
brick kilns etc, and about only 7.5% is available for other activities or exported to nearby states. The major portion
of wheat stalks, barley stalks, paddy hay, jowar stalks, bajra stalks, maize stalks are consumed by animal as fodder
and these biomass should not used as a fuel per the Policy of 2010. Mainly Mustard stalks, husks and soyabeen
stalks are used for power generation as can be seen from their generation and consumption pattern. There is a
surplus of 11,62,679 tons /year of Mustard stalks and husks. Similarly, there is a surplus of 3,32,178 tons/year of
Soyabeen stalks and husks which can be used as feedstock in the power generators . This mustard husk, which is
considered a total waste and not even used as fodder for cattle, is very light with a density of about 105 Kg/m3.
Around 10-12 power plants are operating in the Kota region of Rajasthan. Some of them are totally dependent on
biomass husk which is used as a feedstock for generating power. One of them is Surya Chambal and the other
one is Shriram Rayons.
2. Surya Chambal Power Ltd.,
Formally known as Chambal Power Ltd., is a 7.5 MW capacity biomass (mustard husk) based power plant,
located at Rangpur Village of District Kota, about 8 kms from Kota railway station on the banks of the Chambal
river. The project was started in April 2004 and the plant was commissioned and synchronized with the Rajasthan
Power Grid at 33 KV on 31st March, 2006. Thus starting the supply of power through its Gopal Mill GSS situated
near Kota railway station. The company collects biomass for the whole year during the season of harvesting of
mustard ie from March to May directly from the farmers. The biomass collected are the remains of the plants of
mustard which are of no use to the farmer, which if not used would be burnt by them as parali which is a terrific
cause of the air pollution. As can be seen in Punjab, Haryana, and NCR areas that the air pollution is on the rise
which is on a large scale affecting the lungs and causing health issues.
Stubble burning in Punjab and Haryana in northwest India has been cited as a major cause of air pollution in
Delhi. Smoke from this burning produces a cloud of particulates visible from space, and has produced a "toxic
cloud" in New Delhi, resulting in declarations of an air-pollution emergency. Stubble burning is a relatively new
phenomenon. Historically, farmers harvested and plowed fields manually, tilling plant debris back into the soil.
When mechanized harvesting became popular in the 1980s, stubble burning became common because the
machines leave stalks that are about one-foot tall. For solving this problem of farmers the company (Surya
Chambal) had installed special plates in the harvesting machines so that the remains of the plants could be
removed from a very lower side and least part of the plant is wasted.

© 2019 JETIR July 2019, Volume 6, Issue 7 www.jetir.org (ISSN-2349-5162)
JETIR2002092 Journal of Emerging Technologies and Innovative Research (JETIR) www.jetir.org 625
Fig 1 : Combine Harvestor
Source:https://www.reference.com/business-finance/uses-combine-harvester-99d801be86cd7604
Technical details of Surya Chambal Biomass Plant are as follows:
Power generation capacity of the thermal unit is 7.5 MW
Type of boiler-Stoker Fired
Boiler effeciency-70.1-80.0%
Type of fuel used in the boiler- mustard husk
Gross calorific value of biomass is around 3598 Kcal
Ash content in biomass is around 6.8%
Fig 2 : Surya Chambal Biomass power plant Kota
Source: https://biomasspower.gov.in/document/Magazines/Bioenergy%20Magazine-MNRE/Issue%201-%20Sep%202009.pdf
The company has never used fossil fuel to support biomass and purchases Rs. 10–12 crore of biomass annually
and thereby generates income for farmers and others in a region of 50 km radius from the plant. This has improved
the quality of life of villagers who are now using cooking gas, buying television sets, motor cycles and even
sending their children to the school. The company faced initial teething troubles. However, after carrying out
certain technical modifications, it started yielding satisfactory results.
The company is also engaged in continuous improvement programs for operating the plant at optimum efficiency
and projects for energy saving etc. The company is fully conscious of its social responsibilities and carries out
various activities to raise the quality of life of the villagers of Rangpur, like repairing of roads, providing water
and lighting facilities, development of village school, encouragement to children by providing them with
scholarships, conducting various sports & games, awarding prizes at functions and competitions, conducting
blood donation camps, joining and participating in religious functions/festivals, etc.
Having gained confidence by successfully running the plant at Rangpur, the company is now expanding and
putting up another unit of 10 MW at Khatoli village in Kota, about 100 kms. from Rangpur. Its sister concerns,
Sathyam Power Pvt. Ltd. is putting up a 10 MW plant at Merta Road in Nagaur district and Prakriti Power Pvt.
Ltd. is putting up a 12 MW Power Plant at Gangapur city in Sawai Madhopur district.
3. Shriram Rayons

© 2019 JETIR July 2019, Volume 6, Issue 7 www.jetir.org (ISSN-2349-5162)
JETIR2002092 Journal of Emerging Technologies and Innovative Research (JETIR) www.jetir.org 626
Another major producer of energy using Biomass is DCM Shriram Rayons located in Shriram Nagar Kota
Rajasthan. Their power generation capacity is 9.2 MW. They have four boilers one is working completely on
coal, another on Mustard husk and other two on coal and mustard husk both. Their daily consumption of biomass
husk is around 300 tonnes. The price of Biomass husk at factory gate is approx 3000 Rs/MT which keeps on
varying according to the availability of Biomass across the year. So roughly they purchase biomass of thirty six
crores (36 crores) in a year which is quite less if we compare it with coal (price is around 6500Rs/MT) or any
other fossil fuel used for generating power. The main advantage of such plants is the concern shown by
organizations for the environment and use of renewable resources like biomass for generating energy which is
otherwise a waste.
Technical details of Shriram Rayons Biomass Plant are as follows:
Power generation capacity of the thermal unit is 9.2MW
Type of boiler-Stoker Fired
Boiler effeciency-70.1-80.0%
Thermal unit efficiency of the plant is 30.1-40.0%
Type of fuel used in the boiler- Soyabeen husk, mustard husk and Bituminous coal
Gross calorific value of biomass is around 6000-6300Btu/lb
Gross calorific value of coal is 7000-7500 Btu/lb
Ash content in biomass is around 4.36%
Ash content in coal is around 30-40%
Fig 3 : Shriram Rayons Kota
Source:https://www.financialexpress.com/industry/shriram-rayons-gets-green-nod-for-rs-163cr-expansion-project/358760/
© 2019 JETIR July 2019, Volume 6, Issue 7 www.jetir.org (ISSN-2349-5162)
JETIR2002092 Journal of Emerging Technologies and Innovative Research (JETIR) www.jetir.org 627
On regular basis the company is engaged in advancement of the people living in nearby DCM Rayons, the
company is also very well aware of its social responsibilities and carries out various activities to raise the quality
of life of the villagers of nearby areas, like repairing of roads, providing water and lighting facilities, development
of village school, provide encouragement to children by helping them with scholarships and also providing fees
and books to the poor children, conducting various sports & games, awarding prizes and gifts at various functions
and competitions, conducting blood donation and medical camps, joining and participating in religious
functions/festivals, etc.
4. Challenges and Problems faced by both the companies
a) Prices
As per policy of Government of Rajasthan Renewable Energy Conservation Promotion policy 2004 there was
restriction of using biomass by other plant within 70 km radius, but unfortunately there are a lot of plants using
biomass near this area due to which prices of biomass become high and also the availability is hindered. There is
no organized market for the supply of biomass feed stock. Different pricing and procurement strategies are
adopted by different power producers for procurement of biomass.
b) Weather
It has a great influence on the proper harvest of biomass because it can reduce the yield of the crop, affect the
biomass quality, and pose difficulty in the harvesting process by giving bad condition. The rainy season may
harm the biomass stored on fields, moisture may affect the quality of biomass to be fed as a feedstock in the
power generators.
c) Storage
The method of on-field storage has the advantage of low cost but on the other hand, biomass material loss is
significant and biomass moisture cannot be controlled and reduced to a desired level, thus leading to potential
problems in the power plant technological devices. Further-more, health and safety issues exist, such as the danger
of spores and fungus formation and self-ignition due to increased moisture. Finally, the farmers may not allow
on-farm storage of the biomass for a longer time period, as they may want to prepare the land for the next crop.
Several authors consider the use of intermediate storage locations between the fields and the power plant. For all
biomass fuels in which the use of intermediate storage has been modeled, the fuel has to be transported twice by
road transport vehicles (first from farm/forest to the intermediate storage facility and then from storage to the
power station). This fact will result in a higher delivered cost than a system in which there is only one road
transport movement (directly from farm/ forest to power station). Using an intermediate storage stage may add
in the region of 10–20% to the delivered costs, as a result of the additional transportation and handling costs
incurred.
d) High production cost
Nearly all the elements involved in biomass power generation mechanism suffer from the high cost, including
raw materials, logistics service, equipment as calculated per unit of power generating capacity, maintenance of
the grid-connecting device, and the overall operation of the plant. However, due to a lack of professional logistics
operators, the biomass power plant has to purchase raw materials either at a designated place or directly from
scattered farmers. There is simply no scale benefit in the acquisition of raw materials, therefore increasing
purchasing cost. Furthermore, compared with conventional power plants, the generating capacity of biomass
© 2019 JETIR July 2019, Volume 6, Issue 7 www.jetir.org (ISSN-2349-5162)
JETIR2002092 Journal of Emerging Technologies and Innovative Research (JETIR) www.jetir.org 628
power plant is smaller, yet additional facilities are required, especially special storage fuel collecting and storage
facilities. Moreover, power plants are responsible for power transformation and transmission onto the grid. The
aforementioned factors contributed to high investment and construction cost per KW and higher operation cost
for the biomass project.
e) Low density fuel
Most forms of biomass is very voluminous i.e. it has relatively low energy density per unit of mass compared to
fossil fuels. This makes handling, storage and transportation more costly per unit of energy carried. Being lighter
weight, approximately 2% by weight of Biomass is blown away with wind when stored in open area
f) Capital Investment
Biomass power generation is an emerging industry, of which the technology development and market cultivation
demands a large amount of capital investment. Currently, while there lacks the investment and financing channel,
the market operation mechanism is also incomplete. The maturing market mechanism gives rise to insufficient
input of investment and R&D from the investors and production entities in both domestic and foreign markets,
as well as the excessive development in certain aspects.
Three types of losses are considered during the storage of biomass in the biomass yard.
Land Settlement: Biomass at bottom of heap gets mixed with sand and cannot be used in boiler. However, with
leveling of ground and proper drainage system, land settlement loss can be reduced to about 0.4%
Loss of Fuel during Sand Storm: This loss can be completely eliminated by covering the biomass with tarpaulin.
GCV Loss due to decaying of biomass: Decaying loss can be reduced to about 1.5% by covering the biomass
with tarpaulin and proper drainage.
5. Conclusion
Very little study has been done in the field of biomass especially in Rajasthan. Through this study one can come
to know about the companies operating in Kota district which are using Biomass as a feed stock and generating
power, various initiatives taken by the companies and the various problems and challenges faced by them. The
study will definitely help in implementation of bio-energy production projects and the researchers for further
improvement.
6. References
[1] Athanasios A. Rentizelas, Athanasios J. Tolis and Ilias P. Tatsiopoulos, “Logistics issues of biomass: The storage problem and the multi-
biomass supply chain”, Science Direct, Renewable and Sustainable Energy
[2]E. Iakovou and A. Karagiannidis et al, “Waste biomass-to-energy supply chain management: A critical synthesis”, 30 (2010) Pg 1860–
1870
[3]R.Mohan, N.Partheeban, “Power Generation Using Bio-Mass Power Plant”
[4] Allen J, Browne M, Hunteretal, “H. Logistics managementand costs of biomass fuel supply. Int J PhysDistrib Logistics
Manage1998;28:463–77
[5]Huisman W, Venturi P, Molenaar J.,“Costs of supply chains of MiscanthusGiganteus.” Ind Crops Prod 1997;6:353–66.

© 2019 JETIR July 2019, Volume 6, Issue 7 www.jetir.org (ISSN-2349-5162)
JETIR2002092 Journal of Emerging Technologies and Innovative Research (JETIR) www.jetir.org 629
[6]Tatsiopoulos IP, Tolis AJ.,” Economic aspects of the cotton-stalk biomass logistics and comparison of supply chain methods. Biomass
Bioenergy” 2003;24:199–214.
[7]A. Sambra, C. G. Sørensen, etal, “Optimized harvest and logistics for biomass supply chain” University of Aarhus, Faculty of Agricultural
Sciences, Dept. of Agricultural EngineeringSchüttesvej 17 DK-8700 Horsens, Denmark
[8]http://www.eai.in/ref/ae/bio/powr/biomass_power.html
[9] https://en.wikipedia.org/wiki/Stubble_burning
[10] Biomass assessment study 2017
[11] https://www.financialexpress.com/industry/shriram-rayons-gets-green-nod-for-rs-163cr-expansion-project/358760/
[12] https://biomasspower.gov.in/document/Magazines/Bioenergy%20Magazine-MNRE/Issue%201-%20Sep%202009.pdf

The Board ofJournal of Emerging Technologies and Innovative Research (ISSN : 2349-5162)
Is hereby awarding this certificate to
Garima JainIn recognition of the publication of the paper entitled
Biomass Power Generation: A Case study of two Biomass based powerplants operating in Kota district of Rajasthan
Published In JETIR ( www.JETIR.org ) ISSN UGC Approved (Journal No:63975) & 5.87 Impact Factor
Published in Volume 6 Issue 7 , July-2019 | Date of Publication: 2019-07-16
EDITOR IN CHIEF
JETIR2002092
EDITOR
JETIR2002092 Research Paper Weblink http://www.jetir.org/view?paper=JETIR2002092 Registration ID : 227332

© 2019 IJRAR June 2019, Volume 6, Issue 2 www.ijrar.org (E-ISSN 2348-1269, P- ISSN 2349-5138)
IJRAR19K7186 International Journal of Research and Analytical Reviews (IJRAR) www.ijrar.org 350
A STUDY AND REVIEW OF THE SUPPLY CHAIN
OF BIOMASS IN KOTA REGION OF RAJASTHAN
Garima Jain
MBA Research Scholar, Department of Commerce and Management, University of Kota, Kota, Rajasthan, India;
Abstract: Biomass is a biological material derived from living or recently living organisms. It is used as a source of
energy and refers to plants or plant-based materials. As energy sources, it can either be used directly by combustion to
produce heat or indirectly after converting it to different forms of biofuel.
Biomass energy has become more popular recently as a new form of renewable energybut the nature of biomass energy
is complicated due to the bulky, distributed nature of biomass feedstocks and the high volumes of the relatively low
energy density materials that have to be moved to the conversion equipment.
In this study I am reviewing the supply chain of biomass in Kota region of Rajasthan. A typical biomass supply chain
is comprised of severaldistinct processes. These processes may include groundpreparation and planting, cultivation,
harvesting, handling,storage, in-field/forest transportation, road transportation andutilization of the fuel at the power
station.
Keywords: Feedstocks, Biofuel, supplychain, power station
1. Introduction
All organic matter is known as biomass, and the energy released from biomass when it is eaten, burnt or converted into
fuels is called biomass energy. Bioenergy production requires the flow of biomass material from the land to its
eventual end use. Along the way, biomass passes through a series of processes in what is called the biomass supply
chain. Various segments of the biomass supply chain require unique sets of knowledge, technology and activity. These
include growing, harvesting, transporting, aggregating, storing and converting biomass. Additionally, and depending
on the biomass type and the conversion technology used, pre-processing may also be a necessary step along the
pathway from the land to energy use.
Renewable energy sources play a pivotal role in the current global strategies for reducing greenhouse gas emissions
and partially replacing fossil fuels. Reserves of fossil fuels, such as oil, gas and coal are the main sources of energy
spread over only a small number of countries, thus forming a fragile energy supply that is expected to reach its limit
within the foreseeable future.
The usage of fossil fuels causes numerous environmental problems, such as atmospheric pollution, acidification and
the emission of greenhouse gases. The development of cleaner and renewable energy sources appears as a meaningful
intervention for addressing these problems. More specifically, biomass emerges as a promising option, mainly due to
its potential worldwide availability, its conversion efficiency and its ability to be produced and consumed on a CO2-
neutral basis.

© 2019 IJRAR June 2019, Volume 6, Issue 2 www.ijrar.org (E-ISSN 2348-1269, P- ISSN 2349-5138)
IJRAR19K7186 International Journal of Research and Analytical Reviews (IJRAR) www.ijrar.org 351
2. Characteristics of a Biomass supply chain
The biomass supply chain presents several distinctive characteristics that diversify it from a typical supply chain.
First of all, agricultural biomass types are usually characterised by seasonal availability. The period when these
biomass types are available is very limited and is determined by the crop harvesting period, the weather conditions and
the need to re-plant the fields. Since most of the biomass-to-energy applications to date concern single biomass use,
there is a need of storing very large amounts of biomass for a significant time period, if year round operation of the
power plant is desired.
Another characteristic of the biomass supply chain is that it has to deal with low density materials. As a result, there is
increased need for transportation and handling equipment, as well as storage space. This problem is enhanced by the
low heating value, which is partly due to the increased moisture of most agricultural biomass types. The low density of
biomass increases further the cost of collection, handling, transport and storage stages of the supply chain.
Finally, several biomass types require customized collection and handling equipment, leading to a complicated
structure of the supply chain. For example, there are different requirements on handling and transportation equipment
and storage space configuration if biomass is procured in the forms of sticks or chips. Therefore, the form in which the
biomass will be procured often determines the investment and operational costs of the respective bioenergy
exploitation system, as it affects the requirements and design of the biomass supply chain.
The main characteristics of the supply chain, that influence the logistics efficiency, are that the raw materials are
produced over large geographical areas, have a limited availability window, and often are handled as very voluminous
material.
All of the abovementioned factors lead to increased supply chain cost and require significant attention in designing a
biomass power plant, in order to reduce their negative impact to the financial yield of the entire system. The multi-
biomass approach aims at reducing the impact of these factors.
The biomass supply chain is made up of a range ofactivities which include harvesting, baling, storing, drying and
transport of the biomass both on the field and to the biorefinery& handling and transport of residues and by products.
The activities required to supply biomass from its productionpoint to a power station are the following:
Harvesting/collection of the biomass in the field/forest.
In-field/forest handling and transport to move the biomass toa point where road transport vehicles can be used.
Storage. Many types of biomass are characterized by seasonalavailability, as they are harvested at a specific time of
the yearbut are required at the power station on a year-round basis; itis therefore necessary to store them. The storage
point can belocated in the farm/forest, at the power station or at anintermediate site. The power plant Shriram Rayons
has a storage site Khajoori near Kota which is at a distance from the plant. During the season of the cutting and
harvesting of mustard i.e. from March to June the farmers and transporters collect the biomass husk of the mustard
plant from the farmers at this site to be used by the plant throughout the year.
Loading and unloading of the road transport vehicles.
Once the biomass has been moved to the roadside it will need to be loaded to road transport vehicles for conveyance
tothe power station. The biomass will need to be unloaded fromthe vehicles at the power station. In regions near Kota
mostly tractors and trolleys are used for this purpose.
Transport by road transportation vehicles.There are varyingopinions of whether it is more economical touse heavy
goods vehicles or agricultural/forestryequipment for biomass transport to the power station.Ultimately, it appears to be
a matter of the average transportdistance, biomass density, the carrying capacity andtravelling speed of the respective
vehicles, as well as their
Availability, which decides the final transportation vehicle.

© 2019 IJRAR June 2019, Volume 6, Issue 2 www.ijrar.org (E-ISSN 2348-1269, P- ISSN 2349-5138)
IJRAR19K7186 International Journal of Research and Analytical Reviews (IJRAR) www.ijrar.org 352
Processing biomass to improve its handling efficiency and thequantity that can be transported.Processing can occur at
any stage in the supply chain but willoften precede road transport and is generally cheaper whenintegrated with the
harvesting.
Fig. 1. Generic biomass supply chain design Source: Logistics issues of biomass: The storage problem and the multi-biomass supply chainAthanasios A. Rentizelas ,Athanasios J. Tolis, Ilias P. Tatsiopoulos
3. Generation of Bioenergy from Biomass
Biomass to power value chain starts from collection and procurement of residual feedstock from various sources (so
can even be exclusively produced from dedicated energy crops as well). After collection and procurement biomass is
processed and subsequently transported, to the biomass power plant or taken to the storage yards (usually the biomass
collection centers) for storage. The energy either as chemical fuel or heat from biomass acts as an ultimate driving
force for transformation to power in turbine/engine-generator complex. The steps involved in the biomass to power
production have been illustrated below:
Fig 2: Generation of Bioenergy from Biomass source: http://www.eai.in/ref/ae/bio/powr/biomass_power.html
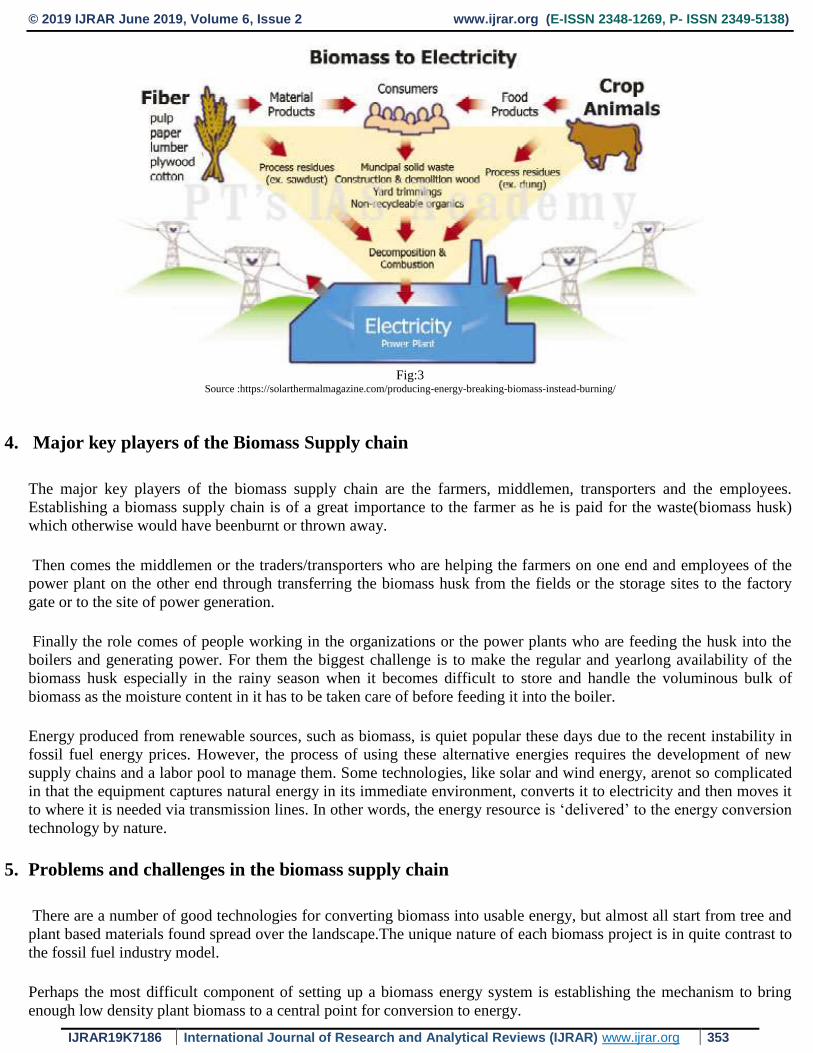
© 2019 IJRAR June 2019, Volume 6, Issue 2 www.ijrar.org (E-ISSN 2348-1269, P- ISSN 2349-5138)
IJRAR19K7186 International Journal of Research and Analytical Reviews (IJRAR) www.ijrar.org 353
Fig:3
Source :https://solarthermalmagazine.com/producing-energy-breaking-biomass-instead-burning/
4. Major key players of the Biomass Supply chain
The major key players of the biomass supply chain are the farmers, middlemen, transporters and the employees.
Establishing a biomass supply chain is of a great importance to the farmer as he is paid for the waste(biomass husk)
which otherwise would have beenburnt or thrown away.
Then comes the middlemen or the traders/transporters who are helping the farmers on one end and employees of the
power plant on the other end through transferring the biomass husk from the fields or the storage sites to the factory
gate or to the site of power generation.
Finally the role comes of people working in the organizations or the power plants who are feeding the husk into the
boilers and generating power. For them the biggest challenge is to make the regular and yearlong availability of the
biomass husk especially in the rainy season when it becomes difficult to store and handle the voluminous bulk of
biomass as the moisture content in it has to be taken care of before feeding it into the boiler.
Energy produced from renewable sources, such as biomass, is quiet popular these days due to the recent instability in
fossil fuel energy prices. However, the process of using these alternative energies requires the development of new
supply chains and a labor pool to manage them. Some technologies, like solar and wind energy, arenot so complicated
in that the equipment captures natural energy in its immediate environment, converts it to electricity and then moves it
to where it is needed via transmission lines. In other words, the energy resource is ‘delivered’ to the energy conversion
technology by nature.
5. Problems and challenges in the biomass supply chain
There are a number of good technologies for converting biomass into usable energy, but almost all start from tree and
plant based materials found spread over the landscape.The unique nature of each biomass project is in quite contrast to
the fossil fuel industry model.
Perhaps the most difficult component of setting up a biomass energy system is establishing the mechanism to bring
enough low density plant biomass to a central point for conversion to energy.

© 2019 IJRAR June 2019, Volume 6, Issue 2 www.ijrar.org (E-ISSN 2348-1269, P- ISSN 2349-5138)
IJRAR19K7186 International Journal of Research and Analytical Reviews (IJRAR) www.ijrar.org 354
In the fossil fuel industry, standardization is a key to lowering production costs. The technologies and methods used in
finding and delivering fossil fuels have evolved to be efficient and relatively uniformly applied, thus reducing costs.
In biomass projects, the distinct features of a particular feedstock in a particular location mean that the collection and
delivery systems often have to be specially developed to match a particular project. Proper planning and review are
important for developing an effective and efficient supply chain. A large biomass energy facility can cost lot of money
and require 15 to 20 years to pay back capital costs. In case of power plants using biomass as feedstock the boilers
used by them previously for the fossil fuels have to be modified and redesigned and this incurs them a cost.
Environmental sustainability is also an important concern for a biomass supply chain. Poor environmental planning can
hurt the environment, damage the image of biomass energy, and limit available resources. Many power plants in India
and also in Rajasthan had started few years back using biomass as a feedstock but due to lack of planning and due to
unavailability of resources were closed and shut down.
Avery crucial step of the supply chain is to find out the locally occurring biomass resources that may be available for
use. Once a suitable resource has been identified, the roles of individuals and organizations in the supply chain should
be clarified. It is helpful to first review what biomass is and what properties make it suitable for conversion to energy
or refining to bio-based products, in order to completely identify all potential sources of biomass for a supply chain.
Biomass conversion technologies are usually selected to minimize complications due to contaminants or undesired
properties.
6. Solutions and alternatives
Various alternatives are available to overcome the problems faced in the supply chain.
One strategy to maintain resource availability and reduce costs is by using multiple feedstocks. There are a number of
conversion technologies that can use the same equipment to produce energy from different feedstocks or multiple
biomass. This is convenient for short term purchasing because it allows purchasing of the cheapest usable biomass at a
given point in time. In the long term, it also protects against major availability changes in a feedstock. During project
development, fuel flexibility gives an extra margin of error for facilities that may use most of the regionally available
pool of a single biomass feedstock. In years where the biomass supply becomes difficult, they may need to switch to a
more frequently available biomass source. Looking at multiple feedstocks may be the only option for some facilities
where one source alone cannot fulfill those facilities’ resource demands.
For example in Kota region companys like Shriram Rayons and Shriram Fetilisers are using mustard and soyabeen
husk as feedstocks along with coal. Surya Chambal is using biomass husk as feedstock for the power generation. This
company is not using coal or any other fossil fuel in the boiler ie they are independent power producer(IPP). So Surya
Chambal has to manage the year round availability of biomass husk very effectively and very cautiously sothat
continuous process of generation of electricity and power is not interrupted.
7. Supply chain of biomass in Kota
Field survey report and report of Department of Agriculture of Govt. of Rajasthan shows that, in Kota region, nearly 14
industries are using biomass (Table 1) and out of these four industries are involved in producing power using biomass
as feed stock. These four biomass based power plants (IPP) in Rajasthan supplies power to the Rajasthan Power Grid.
Total consumption demand in this region is approximately 6.35 Lac MT per annum.
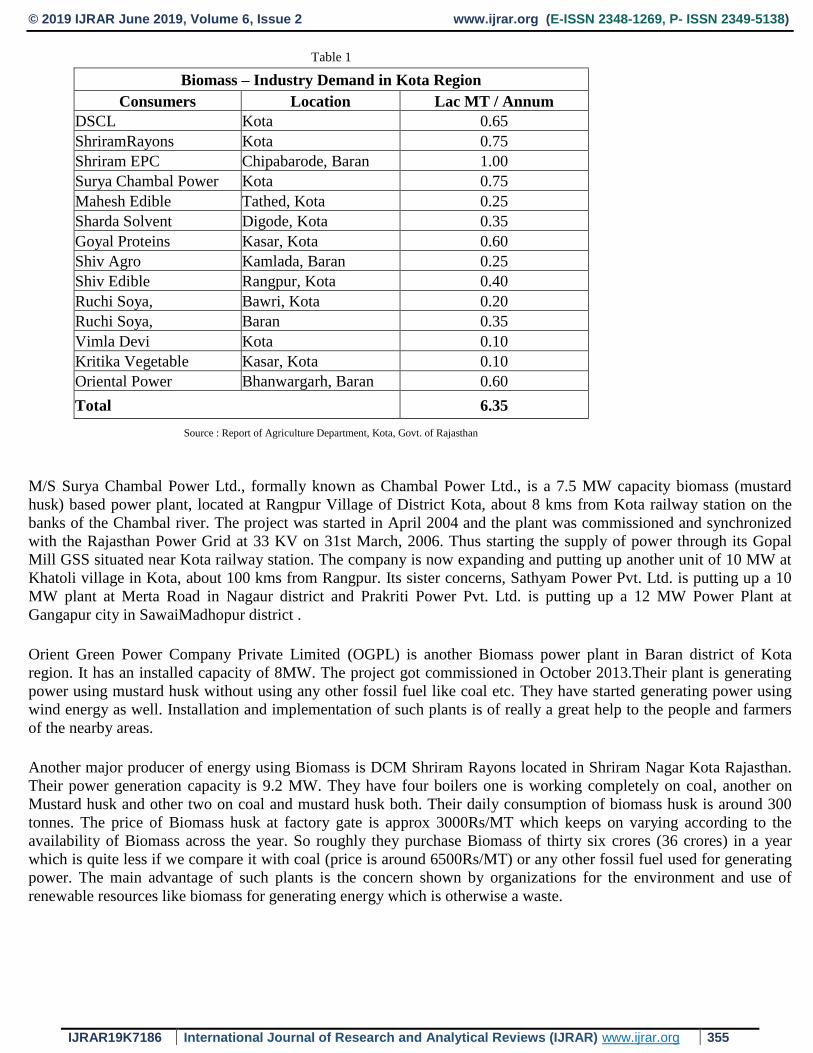
© 2019 IJRAR June 2019, Volume 6, Issue 2 www.ijrar.org (E-ISSN 2348-1269, P- ISSN 2349-5138)
IJRAR19K7186 International Journal of Research and Analytical Reviews (IJRAR) www.ijrar.org 355
Table 1
Biomass – Industry Demand in Kota Region
Consumers Location Lac MT / Annum
DSCL Kota 0.65
ShriramRayons Kota 0.75
Shriram EPC Chipabarode, Baran 1.00
Surya Chambal Power Kota 0.75
Mahesh Edible Tathed, Kota 0.25
Sharda Solvent Digode, Kota 0.35
Goyal Proteins Kasar, Kota 0.60
Shiv Agro Kamlada, Baran 0.25
Shiv Edible Rangpur, Kota 0.40
Ruchi Soya, Bawri, Kota 0.20
Ruchi Soya, Baran 0.35
Vimla Devi Kota 0.10
Kritika Vegetable Kasar, Kota 0.10
Oriental Power Bhanwargarh, Baran 0.60
Total 6.35
Source : Report of Agriculture Department, Kota, Govt. of Rajasthan
M/S Surya Chambal Power Ltd., formally known as Chambal Power Ltd., is a 7.5 MW capacity biomass (mustard
husk) based power plant, located at Rangpur Village of District Kota, about 8 kms from Kota railway station on the
banks of the Chambal river. The project was started in April 2004 and the plant was commissioned and synchronized
with the Rajasthan Power Grid at 33 KV on 31st March, 2006. Thus starting the supply of power through its Gopal
Mill GSS situated near Kota railway station. The company is now expanding and putting up another unit of 10 MW at
Khatoli village in Kota, about 100 kms from Rangpur. Its sister concerns, Sathyam Power Pvt. Ltd. is putting up a 10
MW plant at Merta Road in Nagaur district and Prakriti Power Pvt. Ltd. is putting up a 12 MW Power Plant at
Gangapur city in SawaiMadhopur district .
Orient Green Power Company Private Limited (OGPL) is another Biomass power plant in Baran district of Kota
region. It has an installed capacity of 8MW. The project got commissioned in October 2013.Their plant is generating
power using mustard husk without using any other fossil fuel like coal etc. They have started generating power using
wind energy as well. Installation and implementation of such plants is of really a great help to the people and farmers
of the nearby areas.
Another major producer of energy using Biomass is DCM Shriram Rayons located in Shriram Nagar Kota Rajasthan.
Their power generation capacity is 9.2 MW. They have four boilers one is working completely on coal, another on
Mustard husk and other two on coal and mustard husk both. Their daily consumption of biomass husk is around 300
tonnes. The price of Biomass husk at factory gate is approx 3000Rs/MT which keeps on varying according to the
availability of Biomass across the year. So roughly they purchase Biomass of thirty six crores (36 crores) in a year
which is quite less if we compare it with coal (price is around 6500Rs/MT) or any other fossil fuel used for generating
power. The main advantage of such plants is the concern shown by organizations for the environment and use of
renewable resources like biomass for generating energy which is otherwise a waste.

© 2019 IJRAR June 2019, Volume 6, Issue 2 www.ijrar.org (E-ISSN 2348-1269, P- ISSN 2349-5138)
IJRAR19K7186 International Journal of Research and Analytical Reviews (IJRAR) www.ijrar.org 356
8. Conclusion
In Rajasthan very little work has been done on the power generation from biomass. Through this study we have tried to
find out what are the steps of a biomass supply chain and who are the key players of this chain. The problems faced by
the key players in operating the supply chain and the solutions and alternatives available for implementing the supply
chain. Factors like biomass product quality, handling of voluminous materials, weather related variability, localized
agricultural capacity and seasonality and the demand can be taken care of by adopting new technologies and the
government can take initiatives and provide financial and social help to the power generators and to the new
entrepreneurs. The study will definitely help in implementation of bio-energy production projects and the researchers for
further improvement.
9. References
[1] Athanasios A. Rentizelas, Athanasios J. Tolis and Ilias P. Tatsiopoulos, “Logistics issues of biomass: The storage problem and the multi-
biomass supply chain”, Science Direct, Renewable and Sustainable Energy
[2]E. Iakovou and A. Karagiannidis et al, “Waste biomass-to-energy supply chain management: A critical synthesis”, 30 (2010) Pg 1860–1870
[3]R.Mohan, N.Partheeban, “Power Generation Using Bio-Mass Power Plant”
[4] Allen J, Browne M, Hunteretal, “H. Logistics managementand costs of biomass fuel supply. Int J PhysDistrib Logistics Manage1998;28:463–77
[5]Huisman W, Venturi P, Molenaar J.,“Costs of supply chains of MiscanthusGiganteus.” Ind Crops Prod 1997;6:353–66.
[6]Tatsiopoulos IP, Tolis AJ.,” Economic aspects of the cotton-stalk biomass logistics and comparison of supply chain methods. Biomass
Bioenergy” 2003;24:199–214.
[7]A. Sambra, C. G. Sørensen, etal, “Optimized harvest and logistics for biomass supply chain” University of Aarhus, Faculty of Agricultural
Sciences, Dept. of Agricultural EngineeringSchüttesvej 17 DK-8700 Horsens, Denmark
[8]http://www.eai.in/ref/ae/bio/powr/biomass_power.html
[9]Joel Tallaksen, “Biomass Gasification: A Comprehensive Demonstration of a Community Scale Biomass Energy” System Final Report: 2011-
USDA Biomass Gasification Project Coordinator West Central Research and Outreach Center University of Minnesota
[10] Biomass assessment study 2017
[11]Bioenergy –a Sustainableand Reliable Energy Source IEA Bioenergy main report 2009

The Board of
International Journal of Research and Analytical Reviews (IJRAR)
Is hereby awarding this certificate to
Garima JainIn recognition of the publication of the paper entitled
A STUDY AND REVIEW OF THE SUPPLY CHAIN OF BIOMASS IN KOTA REGION OF RAJASTHAN
Published In IJRAR ( www.ijrar.org ) UGC Approved (Journal No : 43602) & 5.75 Impact Factor
Volume 6 Issue 2 , Date of Publication:June 2019 2019-06-04 08:51:48
PAPER ID : IJRAR19K7186Registration ID : 212590
UGC and ISSN Approved - International Peer Reviewed Journal, Refereed Journal, Indexed Journal, Impact Factor: 5.75 Google Scholar
EDITOR IN CHIEF

xxxi
Annexure
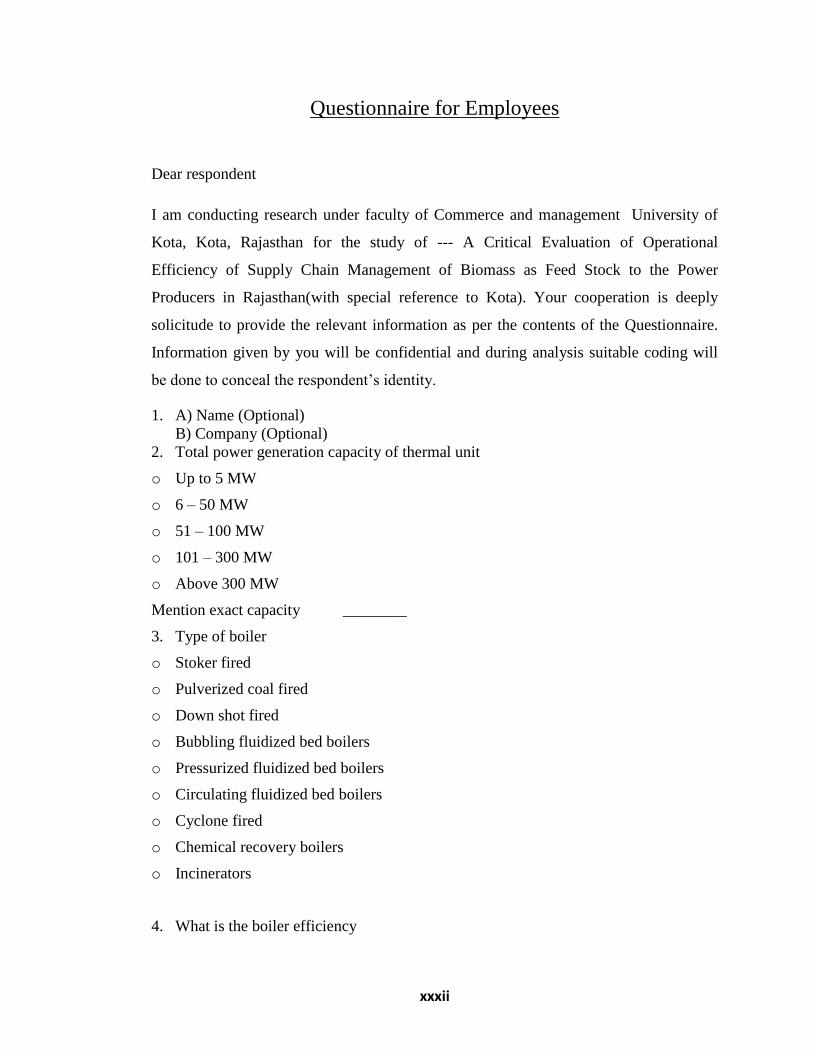
xxxii
Questionnaire for Employees
Dear respondent
I am conducting research under faculty of Commerce and management University of
Kota, Kota, Rajasthan for the study of --- A Critical Evaluation of Operational
Efficiency of Supply Chain Management of Biomass as Feed Stock to the Power
Producers in Rajasthan(with special reference to Kota). Your cooperation is deeply
solicitude to provide the relevant information as per the contents of the Questionnaire.
Information given by you will be confidential and during analysis suitable coding will
be done to conceal the respondent‘s identity.
1. A) Name (Optional)
B) Company (Optional)
2. Total power generation capacity of thermal unit
o Up to 5 MW
o 6 – 50 MW
o 51 – 100 MW
o 101 – 300 MW
o Above 300 MW
Mention exact capacity ________
3. Type of boiler
o Stoker fired
o Pulverized coal fired
o Down shot fired
o Bubbling fluidized bed boilers
o Pressurized fluidized bed boilers
o Circulating fluidized bed boilers
o Cyclone fired
o Chemical recovery boilers
o Incinerators
4. What is the boiler efficiency

xxxiii
o Below 70.0 %
o 70.1 – 80.0 %
o 80.1 – 90.0 %
o 90.1 – 98.5 %
5. What is the thermal unit efficiency
o Below 25.0 %
o 25.1 – 30.0 %
o 30.1 – 40.0 %
o 40.1 – 45.0 %
o Above 45.0 %
6. Power generated due to biomass with respect to total power generation in the plant
o 0 – 5%
o 6 – 10%
o 11 – 30%
o 31 – 50%
o 51 – 80%
o 81 – 100%
Mention exact percentage also (if possible) ___
7. What is the biomass mix ratio in the boiler fuel?(Total should be 100)
o Coal : ________
o Biomass : ________
8. What is the Last year consumption of Biomass (in MT__?
9. What is the last year consumption of Coal (in MT) ___?
10. What is the Gross Calorific Value (GCV) of Biomass used in the boiler?
11. What is the Gross Calorific Value (GCV) of coal used in the boiler?
12. What is the Last year average GCV of Biomass
13. What is the last year average GCV of Coal
14. What is the Ash content in Biomass used in the boiler?
15. What is the Ash content in coal used in the boiler?
16. What is the Last year average Ash content of Biomass (in %age)
17. What is the last year average Ash content of Coal (in %age)
18. What is the procurement cost of biomass? Give Last year average cost (in Rs. per
MT)

xxxiv
19. What is the procurement cost of Coal? Give Last year average cost (in Rs. per MT)
20. What are the types of Biomass vendors?
o Stockiest
o Middlemen or Agent
o Farmer
21. What are the ways of storing Biomass?
o Briquettes
o Loose - At farm land
o Silos
o Loose - At plant storage area with compacting
o Any other form (mention it) ____________
22. Type of loss of GCV during storage
o Biomass blown away with the wind
o Moisture addition in biomass
o Adulteration of biomass with sand
o Any other type of loss (mention it) ____Degradation________
23. What was average percentage loss of GCV in Biomass during storage last year?
24. What was average percentage loss of GCV in coal during storage last year?
25. What is the handling cost of biomass from storage area to boiler feed, Give Last year
average cost (in Rs. per MT of biomass)
26. What are the technical / engineering difficulties faced in using biomass.
(May tick more than one)
o Prone to catch fire
o Deposits in super heater area
o Large storage area due to very low bulk density
o Loss of GCV due to degradation with time_/ Adulteration by farmers/ high
transportation cost
27. What are the engineering changes done in the plant to facilitate the use of biomass
(May tick more than one)
o Modification in boiler area
o Resizing of steam control unit
o Additional infrastructure to feed the biomass in the boiler

xxxv
o Additional Infrastructure to handle
biomass______________________________________
28. What challenges are faced by your company by the rising prices of biomass waste?
(May tick more than one)
o Demand supply gap
o Heavy rains leading to crop damage
o Drought
o Entry of new consumer of biomass in the region
o All of the above
o Unavailability of the project______________________________________
29. What strategies are adopted by your organization with regards to power generation
with biomass?
(May tick more than one)
o Maximize the procurement from nearest source to cater the high demand supply gap
o Market monitoring of rates to wait for the favorable price of biomass in the region
o Sub contracting of procurement activity by developing middle men in supply chain
management
o Development of storage area in the region
o Increasing the in-house storage capacity within the plant.
o Development of alternate ways of storing the biomass
30. Further information, you would like to share

xxxvi
Questionnaire for Biomass Trader Dear respondent
I am conducting research under faculty of Commerce and management University of
Kota, Kota, Rajasthan for the study of --- A Critical Evaluation of Operational
Efficiency of Supply Chain Management of Biomass as Feed Stock to the Power
Producers in Rajasthan(with special reference to Kota). Your cooperation is deeply
solicitude to provide the relevant information as per the contents of the Questionnaire.
Information given by you will be confidential and during analysis suitable coding will
be done to conceal the respondent‘s identity.
1. Name ( Optional)
2. Name of Firm/company/trading unit (NA for Farmer) (Optional)
3. Type of trader
o Individual
o Organized
4. Locality of trader
o Rural
o Urban
5. What is your role in Biomass supply chain?
o Stockiest
o Middlemen or Agent
o Farmer
6. What is the mode of transporting Biomass from field / storage to the power plant?
o Tractor trolley
o Loading truck
o Bullock Cart
o Any other mode _________
7. What was your last year quantity of Biomass trading (in MT) ___________?
8. How much is Sowing Area in your scope of business (in hectare) ___________?
9. How much is Storage Area in your scope of business (in hectare) ___________?
10. What is the yearly average transportation cost of Biomass per Km per MT (in
Rs.)___________?
11. What is the yearly average storage cost of Biomass (in Rs.)___________?

xxxvii
12. Availability of Biomass (Months of the year)
a) Highest availability month of Biomass
b) Lowest availability month of Biomass
13. The prominent hardship in the business of biomass
14. Further information, you would like to share
Related Documents