University of Groningen Coping with uncertainty Mwangi, Joseph IMPORTANT NOTE: You are advised to consult the publisher's version (publisher's PDF) if you wish to cite from it. Please check the document version below. Document Version Publisher's PDF, also known as Version of record Publication date: 2019 Link to publication in University of Groningen/UMCG research database Citation for published version (APA): Mwangi, J. (2019). Coping with uncertainty: Adapting to stochasticity in an unpredictable tropical environment. University of Groningen. Copyright Other than for strictly personal use, it is not permitted to download or to forward/distribute the text or part of it without the consent of the author(s) and/or copyright holder(s), unless the work is under an open content license (like Creative Commons). The publication may also be distributed here under the terms of Article 25fa of the Dutch Copyright Act, indicated by the “Taverne” license. More information can be found on the University of Groningen website: https://www.rug.nl/library/open-access/self-archiving-pure/taverne- amendment. Take-down policy If you believe that this document breaches copyright please contact us providing details, and we will remove access to the work immediately and investigate your claim. Downloaded from the University of Groningen/UMCG research database (Pure): http://www.rug.nl/research/portal. For technical reasons the number of authors shown on this cover page is limited to 10 maximum. Download date: 20-04-2022

Welcome message from author
This document is posted to help you gain knowledge. Please leave a comment to let me know what you think about it! Share it to your friends and learn new things together.
Transcript
University of Groningen
Coping with uncertaintyMwangi, Joseph
IMPORTANT NOTE: You are advised to consult the publisher's version (publisher's PDF) if you wish to cite fromit. Please check the document version below.
Document VersionPublisher's PDF, also known as Version of record
Publication date:2019
Link to publication in University of Groningen/UMCG research database
Citation for published version (APA):Mwangi, J. (2019). Coping with uncertainty: Adapting to stochasticity in an unpredictable tropicalenvironment. University of Groningen.
CopyrightOther than for strictly personal use, it is not permitted to download or to forward/distribute the text or part of it without the consent of theauthor(s) and/or copyright holder(s), unless the work is under an open content license (like Creative Commons).
The publication may also be distributed here under the terms of Article 25fa of the Dutch Copyright Act, indicated by the “Taverne” license.More information can be found on the University of Groningen website: https://www.rug.nl/library/open-access/self-archiving-pure/taverne-amendment.
Take-down policyIf you believe that this document breaches copyright please contact us providing details, and we will remove access to the work immediatelyand investigate your claim.
Downloaded from the University of Groningen/UMCG research database (Pure): http://www.rug.nl/research/portal. For technical reasons thenumber of authors shown on this cover page is limited to 10 maximum.
Download date: 20-04-2022
Coping with uncertainty
Adapting to stochasticity in an unpredictable
tropical environment
Coping with uncertainty
Adapting to stochasticity in an unpredictable tropical environment
PhD thesis
to obtain the degree of PhD at the University of Groningen on the authority of the
Rector Magnificus Prof. E. Sterken and in accordance with
the decision by the College of Deans.
This thesis will be defended in public on
Friday 14 June 2019 at 12.45 hours
By
Joseph Mutahi Mwangi
born on 30 August 1982
in Nyeri, Kenya
The research presented in this thesis was carried out at the Behavioral & Physiological Ecology group (BPE), part of the Groningen Institute for Evolutionary Life Sciences (GELIFEs), University of Groningen. The research was funded by The Netherlands Fellowship Programme of Nuffic (grants no. CF9159/2013 to BIT and JMM) with additional funding from The Netherlands Fellowship Programme of Nuffic (grants no. CF6833/2010 to BIT and HKN), the Netherlands Organization for Scientific Research (NWO-VIDI 864.10.012 to BIT), Lucie Burgers foundation (to JMM) and two grants from the Ecology fund of the Royal Netherlands Academy of Arts and Sciences (to JMM). The printing of this thesis was partly funded by the University of Groningen and the Faculty of Science and Engineering Lay-out: Loes Kema Cover design: J. Mwangi Photos: Claudia Burger and J. Mwangi Paranimfen: Maaike Versteegh and Kirsten Otten Dutch translation of thesis summary: Kirsten Otten Printed by: GVO drukkers & vormgevers, Ede, NL ISBN: 978-94-034-1732-5 ISBN: 978-94-034-1731-8 (electronic version) ©2019 J. Mwangi ([email protected])

Table of contents Chapter 1 Chapter 2 Chapter 3 Chapter 4 Chapter 5 Chapter 6 References Summary Samenvatting Acknowledgements Affiliations of co-authors
General introduction Nest survival in year-round breeding tropical red-capped larks Calandrella cinerea increases with higher nest abundance but decreases with higher invertebrate availability and rainfall Joseph Mwangi, Henry K. Ndithia, Rosemarie Kentie, Muchane Muchai, B. Irene Tieleman Published in Journal of Avian Biology (2018) e01645 doi: 10.1111/jav.01645 Home ranges of tropical Red-capped Larks are influenced by breeding rather than vegetation, rainfall or invertebrate availability Joseph Mwangi, Raymond H. G. Klaassen, Muchane Muchai, B. Irene Tieleman
Published in Ibis (In Press) Body mass decreases with more favorable social-environmental conditions independent of life history stage in a stochastic aseasonal environment Joseph Mwangi, Henry K. Ndithia, Maaike A, Versteegh, Muchane Muchai, B. Irene Tieleman
Unpublished Manuscript Immune function varies more with socio-environmental factors than with life history stage in a stochastic aseasonal environment Joseph Mwangi, Henry K. Ndithia, Samuel N. Bakari, Muchane Muchai, B. Irene Tieleman
Unpublished manuscript General Discussion and synthesis
7 17 35 57 81 101 111 127 129 135 140
Supervisor Prof. B.I. Tieleman
Co-supervisor Dr. M. Muchai
Assessment Committee Prof. J. Komdeur
Prof. H. Olff
Prof. W. Cresswell
Table of contents Chapter 1 Chapter 2 Chapter 3 Chapter 4 Chapter 5 Chapter 6 References Summary Samenvatting Acknowledgements Affiliations of co-authors
General introduction Nest survival in year-round breeding tropical red-capped larks Calandrella cinerea increases with higher nest abundance but decreases with higher invertebrate availability and rainfall Joseph Mwangi, Henry K. Ndithia, Rosemarie Kentie, Muchane Muchai, B. Irene Tieleman Published in Journal of Avian Biology (2018) e01645 doi: 10.1111/jav.01645 Home ranges of tropical Red-capped Larks are influenced by breeding rather than vegetation, rainfall or invertebrate availability Joseph Mwangi, Raymond H. G. Klaassen, Muchane Muchai, B. Irene Tieleman
Published in Ibis (In Press) Body mass decreases with more favorable social-environmental conditions independent of life history stage in a stochastic aseasonal environment Joseph Mwangi, Henry K. Ndithia, Maaike A, Versteegh, Muchane Muchai, B. Irene Tieleman
Unpublished Manuscript Immune function varies more with socio-environmental factors than with life history stage in a stochastic aseasonal environment Joseph Mwangi, Henry K. Ndithia, Samuel N. Bakari, Muchane Muchai, B. Irene Tieleman
Unpublished manuscript General Discussion and synthesis
7 17 35 57 81 101 111 127 129 135 140
Table of contents Chapter 1 Chapter 2 Chapter 3 Chapter 4 Chapter 5 Chapter 6 References Summary Samenvatting Acknowledgements Affiliations of co-authors
General introduction Nest survival in year-round breeding tropical red-capped larks Calandrella cinerea increases with higher nest abundance but decreases with higher invertebrate availability and rainfall Joseph Mwangi, Henry K. Ndithia, Rosemarie Kentie, Muchane Muchai, B. Irene Tieleman Published in Journal of Avian Biology (2018) e01645 doi: 10.1111/jav.01645 Home ranges of tropical Red-capped Larks are influenced by breeding rather than vegetation, rainfall or invertebrate availability Joseph Mwangi, Raymond H. G. Klaassen, Muchane Muchai, B. Irene Tieleman
Published in Ibis (In Press) Body mass decreases with more favorable social-environmental conditions independent of life history stage in a stochastic aseasonal environment Joseph Mwangi, Henry K. Ndithia, Maaike A, Versteegh, Muchane Muchai, B. Irene Tieleman
Unpublished Manuscript Immune function varies more with socio-environmental factors than with life history stage in a stochastic aseasonal environment Joseph Mwangi, Henry K. Ndithia, Samuel N. Bakari, Muchane Muchai, B. Irene Tieleman
Unpublished manuscript General Discussion and synthesis
7 17 35 57 83 103 113 129 131 137 142
Supervisor Prof. B.I. Tieleman
Co-supervisor Dr. M. Muchai
Assessment Committee Prof. J. Komdeur
Prof. H. Olff
Prof. W. Cresswell
Table of contents Chapter 1 Chapter 2 Chapter 3 Chapter 4 Chapter 5 Chapter 6 References Summary Samenvatting Acknowledgements Affiliations of co-authors
General introduction Nest survival in year-round breeding tropical red-capped larks Calandrella cinerea increases with higher nest abundance but decreases with higher invertebrate availability and rainfall Joseph Mwangi, Henry K. Ndithia, Rosemarie Kentie, Muchane Muchai, B. Irene Tieleman Published in Journal of Avian Biology (2018) e01645 doi: 10.1111/jav.01645 Home ranges of tropical Red-capped Larks are influenced by breeding rather than vegetation, rainfall or invertebrate availability Joseph Mwangi, Raymond H. G. Klaassen, Muchane Muchai, B. Irene Tieleman
Published in Ibis (In Press) Body mass decreases with more favorable social-environmental conditions independent of life history stage in a stochastic aseasonal environment Joseph Mwangi, Henry K. Ndithia, Maaike A, Versteegh, Muchane Muchai, B. Irene Tieleman
Unpublished Manuscript Immune function varies more with socio-environmental factors than with life history stage in a stochastic aseasonal environment Joseph Mwangi, Henry K. Ndithia, Samuel N. Bakari, Muchane Muchai, B. Irene Tieleman
Unpublished manuscript General Discussion and synthesis
7 17 35 57 81 101 111 127 129 135 140
Table of contents Chapter 1 Chapter 2 Chapter 3 Chapter 4 Chapter 5 Chapter 6 References Summary Samenvatting Acknowledgements Affiliations of co-authors
General introduction Nest survival in year-round breeding tropical red-capped larks Calandrella cinerea increases with higher nest abundance but decreases with higher invertebrate availability and rainfall Joseph Mwangi, Henry K. Ndithia, Rosemarie Kentie, Muchane Muchai, B. Irene Tieleman Published in Journal of Avian Biology (2018) e01645 doi: 10.1111/jav.01645 Home ranges of tropical Red-capped Larks are influenced by breeding rather than vegetation, rainfall or invertebrate availability Joseph Mwangi, Raymond H. G. Klaassen, Muchane Muchai, B. Irene Tieleman
Published in Ibis (In Press) Body mass decreases with more favorable social-environmental conditions independent of life history stage in a stochastic aseasonal environment Joseph Mwangi, Henry K. Ndithia, Maaike A, Versteegh, Muchane Muchai, B. Irene Tieleman
Unpublished Manuscript Immune function varies more with socio-environmental factors than with life history stage in a stochastic aseasonal environment Joseph Mwangi, Henry K. Ndithia, Samuel N. Bakari, Muchane Muchai, B. Irene Tieleman
Unpublished manuscript General Discussion and synthesis
7 17 35 57 81 101 111 127 129 135 140
Table of contents Chapter 1 Chapter 2 Chapter 3 Chapter 4 Chapter 5 Chapter 6 References Summary Samenvatting Acknowledgements Affiliations of co-authors
General introduction Nest survival in year-round breeding tropical red-capped larks Calandrella cinerea increases with higher nest abundance but decreases with higher invertebrate availability and rainfall Joseph Mwangi, Henry K. Ndithia, Rosemarie Kentie, Muchane Muchai, B. Irene Tieleman Published in Journal of Avian Biology (2018) e01645 doi: 10.1111/jav.01645 Home ranges of tropical Red-capped Larks are influenced by breeding rather than vegetation, rainfall or invertebrate availability Joseph Mwangi, Raymond H. G. Klaassen, Muchane Muchai, B. Irene Tieleman
Published in Ibis (In Press) Body mass decreases with more favorable social-environmental conditions independent of life history stage in a stochastic aseasonal environment Joseph Mwangi, Henry K. Ndithia, Maaike A, Versteegh, Muchane Muchai, B. Irene Tieleman
Unpublished Manuscript Immune function varies more with socio-environmental factors than with life history stage in a stochastic aseasonal environment Joseph Mwangi, Henry K. Ndithia, Samuel N. Bakari, Muchane Muchai, B. Irene Tieleman
Unpublished manuscript General Discussion and synthesis
7 17 35 57 83 103 113 129 131 137 142
Supervisor Prof. B.I. Tieleman
Co-supervisor Dr. M. Muchai
Assessment Committee Prof. J. Komdeur
Prof. H. Olff
Prof. W. Cresswell

Chapter 1
GENERAL INTRODUCTION
Joseph M. Mwangi
Chapter 1
GENERAL INTRODUCTION
Joseph M. Mwangi
Chapter 1
GENERAL INTRODUCTION
Joseph M. Mwangi
Chapter 1
GENERAL INTRODUCTION
Joseph M. Mwangi
Chapter 1
8
The environment and life history strategies Organisms vary in many aspects of their lives. These variations have intrigued ecologists and animal biologists for centuries even before the popular theories of ‘inheritance of acquired characteristics’ proposed by Jean-Baptiste Lamarck in 1801 and the ‘theory of natural selection’ by Charles Darwin in 1859 and Alfred Russel Wallace (Darwin 1859, Burkhardt 2013). From the broader concepts introduced by these pioneer biologists to more specific theories, be it in the fields of comparative physiology, life history or behavioral ecology is a general acknowledgment that the environment is a major part of the equation. Many animals are exposed to fluctuations in the deterioration and renewal of their environments (Nelson et al. 1990). How and to what extent environmental variation influences an organism’s behavior, physiology and morphology have formed a basis of many ecological and evolutionary studies and is a fundamental question in evolutionary biology. Environmental variability encompasses two non-exclusive types: spatial heterogeneity, where conditions are changing across space, and temporal variation, in which organisms face different environmental conditions in time within the same environment (Price et al. 2013). Spatial and temporal variation in environmental factors often means that also the costs and benefits of engaging in the different life history activities vary in space and time; hence, no single behavioral and/or physiological phenotype will be consistently optimal (Ricklefs and Wikelski 2002). In the face of changing environmental conditions, natural selection favors individuals that interact with the environment in a way that increases fitness (Stearns 1992). Consequently, selection should favor individuals that possess mechanisms permitting them to detect and respond to cues that predict impending relevant changes in the environment (Hahn and MacDougall-Shackleton 2008). To cope with these changes, animals may migrate to areas with more favorable environmental conditions while residents adjust through adaptive behavioral and /or physiological changes in direct response to the environmental changes. While our understanding of adaptation in seasonal predictive environments has considerably progressed both theoretically and empirically over the past decades (Perrins 1970, Martin 1987, Sheldon and Verhulst 1996, Ricklefs and Wikelski 2002, Wikelski et al. 2003, Visser et al. 2012), how birds adapt to and cope with unpredictable stochastic environments remains poorly understood despite the pioneering studies of Moreau (1944) and Skutch (1949). Contrary to seasonal breeding in temperate zones, Skutch (1949, 1966) and Moreau (1950) observed that nesting in tropical birds occurred throughout the year and breeding seasons of particular species tended to be vague. Skutch (1949) also noted that tropical birds lay smaller clutches than temperate birds. Following the studies by Skutch and Moreau, majority of the tropical studies have focused on explaining timing of breeding (Brown and Britton 1980, Hau 2001, Wikelski et al. 2003, Ndithia et al. 2017a) and clutch size variation (Lack 1947, Skutch 1985, Ricklefs and Wikelski 2002), but there is need for a better understanding of how birds adapt to the stochastic aseasonal environments.
“Despite the fact that about 80% of passerines breed in the tropics, more behavioral ecology papers have been published on the Red‐winged blackbird Agelaius phoeniceus, than for all
tropical bird species combined” Stutchbury and Morton (2001)
Adaptations of birds to a stochastic non-seasonal environment Even under stochastic environments, birds have to match breeding, molt and associated behavioural and physiological adjustments to optimal environmental conditions (Lack 1950, Hau 2001, Ricklefs and Wikelski 2002, Freed and Cann 2012). Two major environmental factors that determine what adaptive mechanisms would be favored in an environment are the amplitude of the fluctuations and the precision within which these fluctuations occur each year (its predictability) (Lofts and Murton 1968, Hau 2001, Bleuven and Landry 2016). Under different environmental predictability regimes, even life history phenologies of the same species have been shown to differ. For example in East Africa, the irregular timing of the onset of rain, induces the red-billed quelea Quelea quelea to breed erratically from year to year while in West Africa, where the onset of the rainy season is more consistent each year, the quelea display a predictable breeding season (Nelson et al. 1990). Under predictable environments, birds are more likely to match their phenotypes to the environments through phylogenetic history and/or adaptive phenology through anticipatory gene regulation or the maintenance of past events in memory (Brown 1980, Helm and Gwinner 1999).
Alternatively, birds may adjust their phenotype to match prevailing environmental conditions through phenotypic plasticity (Guenther and Trillmich 2013). Plasticity encompasses the flexibility in morphology, behaviour, life history and physiology (Piersma and Drent 2003). Under unpredictable stochastic environments, birds may favor phenotypic plasticity in that the same individual bird experiencing different environmental conditions could, by virtue of this plasticity, generate quite different and highly appropriate phenotypes in those different environments (Hahn and MacDougall-Shackleton 2008). Phenotypic plasticity is not characteristic of only non-seasonal environments. Even in seasonal environments, resultant of climate change many bird species have been shown to track changes in the spring phenology through phenotypic plasticity by advancing their migration and breeding schedules (Merilä and Hoffmann 2016). Even within the same species, individuals occupying unpredictable environments can display phenotypic plasticity as we previously showed in Red-billed quelea (Nelson et al. 1990). Similar to the Red-billed quelea, when faced with a predictable environment Australian zebra finches Taeniopygia guttata breed seasonally, but in unpredictable environments they show plasticity in breeding schedule and breed opportunistically by keeping their reproductive organs in a near-functional state in order not to miss narrow periods ideal for breeding despite this being a costly strategy (Perfito et al. 2007).
Earlier work setting the context for this thesis This thesis builds upon the work initiated by Ndithia et al. (2017a, b) investigating the timing of breeding, nestling growth and immune function in Red-capped lark Calandrella cinerea, in relation to spatiotemporal variation in weather conditions and food resources in a tropical environment. Contrary to expectations, Ndithia et al. (2017a) showed that neither current weather patterns nor food availability could explain the timing of breeding. Instead, they observed a highly unpredictable and irregular variation in environmental variables, invertebrate biomass, and breeding of Larks, among months and among years. Despite the highly unpredictable stochastic environmental conditions, Red-capped larks breed year-round (Ndithia et al. 2017a). However, despite year-round breeding, body mass and size at hatching, and rate of growth were influenced by social-environmental conditions (Ndithia et al. 2017b) which suggest the environment is not always optimal and point to likely direct and indirect relationships between environmental factors and performance.
General introduction
9
The environment and life history strategies Organisms vary in many aspects of their lives. These variations have intrigued ecologists and animal biologists for centuries even before the popular theories of ‘inheritance of acquired characteristics’ proposed by Jean-Baptiste Lamarck in 1801 and the ‘theory of natural selection’ by Charles Darwin in 1859 and Alfred Russel Wallace (Darwin 1859, Burkhardt 2013). From the broader concepts introduced by these pioneer biologists to more specific theories, be it in the fields of comparative physiology, life history or behavioral ecology is a general acknowledgment that the environment is a major part of the equation. Many animals are exposed to fluctuations in the deterioration and renewal of their environments (Nelson et al. 1990). How and to what extent environmental variation influences an organism’s behavior, physiology and morphology have formed a basis of many ecological and evolutionary studies and is a fundamental question in evolutionary biology. Environmental variability encompasses two non-exclusive types: spatial heterogeneity, where conditions are changing across space, and temporal variation, in which organisms face different environmental conditions in time within the same environment (Price et al. 2013). Spatial and temporal variation in environmental factors often means that also the costs and benefits of engaging in the different life history activities vary in space and time; hence, no single behavioral and/or physiological phenotype will be consistently optimal (Ricklefs and Wikelski 2002). In the face of changing environmental conditions, natural selection favors individuals that interact with the environment in a way that increases fitness (Stearns 1992). Consequently, selection should favor individuals that possess mechanisms permitting them to detect and respond to cues that predict impending relevant changes in the environment (Hahn and MacDougall-Shackleton 2008). To cope with these changes, animals may migrate to areas with more favorable environmental conditions while residents adjust through adaptive behavioral and /or physiological changes in direct response to the environmental changes. While our understanding of adaptation in seasonal predictive environments has considerably progressed both theoretically and empirically over the past decades (Perrins 1970, Martin 1987, Sheldon and Verhulst 1996, Ricklefs and Wikelski 2002, Wikelski et al. 2003, Visser et al. 2012), how birds adapt to and cope with unpredictable stochastic environments remains poorly understood despite the pioneering studies of Moreau (1944) and Skutch (1949). Contrary to seasonal breeding in temperate zones, Skutch (1949, 1966) and Moreau (1950) observed that nesting in tropical birds occurred throughout the year and breeding seasons of particular species tended to be vague. Skutch (1949) also noted that tropical birds lay smaller clutches than temperate birds. Following the studies by Skutch and Moreau, majority of the tropical studies have focused on explaining timing of breeding (Brown and Britton 1980, Hau 2001, Wikelski et al. 2003, Ndithia et al. 2017a) and clutch size variation (Lack 1947, Skutch 1985, Ricklefs and Wikelski 2002), but there is need for a better understanding of how birds adapt to the stochastic aseasonal environments.
“Despite the fact that about 80% of passerines breed in the tropics, more behavioral ecology papers have been published on the Red‐winged blackbird Agelaius phoeniceus, than for all
tropical bird species combined” Stutchbury and Morton (2001)
Adaptations of birds to a stochastic non-seasonal environment Even under stochastic environments, birds have to match breeding, molt and associated behavioural and physiological adjustments to optimal environmental conditions (Lack 1950, Hau 2001, Ricklefs and Wikelski 2002, Freed and Cann 2012). Two major environmental factors that determine what adaptive mechanisms would be favored in an environment are the amplitude of the fluctuations and the precision within which these fluctuations occur each year (its predictability) (Lofts and Murton 1968, Hau 2001, Bleuven and Landry 2016). Under different environmental predictability regimes, even life history phenologies of the same species have been shown to differ. For example in East Africa, the irregular timing of the onset of rain, induces the red-billed quelea Quelea quelea to breed erratically from year to year while in West Africa, where the onset of the rainy season is more consistent each year, the quelea display a predictable breeding season (Nelson et al. 1990). Under predictable environments, birds are more likely to match their phenotypes to the environments through phylogenetic history and/or adaptive phenology through anticipatory gene regulation or the maintenance of past events in memory (Brown 1980, Helm and Gwinner 1999).
Alternatively, birds may adjust their phenotype to match prevailing environmental conditions through phenotypic plasticity (Guenther and Trillmich 2013). Plasticity encompasses the flexibility in morphology, behaviour, life history and physiology (Piersma and Drent 2003). Under unpredictable stochastic environments, birds may favor phenotypic plasticity in that the same individual bird experiencing different environmental conditions could, by virtue of this plasticity, generate quite different and highly appropriate phenotypes in those different environments (Hahn and MacDougall-Shackleton 2008). Phenotypic plasticity is not characteristic of only non-seasonal environments. Even in seasonal environments, resultant of climate change many bird species have been shown to track changes in the spring phenology through phenotypic plasticity by advancing their migration and breeding schedules (Merilä and Hoffmann 2016). Even within the same species, individuals occupying unpredictable environments can display phenotypic plasticity as we previously showed in Red-billed quelea (Nelson et al. 1990). Similar to the Red-billed quelea, when faced with a predictable environment Australian zebra finches Taeniopygia guttata breed seasonally, but in unpredictable environments they show plasticity in breeding schedule and breed opportunistically by keeping their reproductive organs in a near-functional state in order not to miss narrow periods ideal for breeding despite this being a costly strategy (Perfito et al. 2007).
Earlier work setting the context for this thesis This thesis builds upon the work initiated by Ndithia et al. (2017a, b) investigating the timing of breeding, nestling growth and immune function in Red-capped lark Calandrella cinerea, in relation to spatiotemporal variation in weather conditions and food resources in a tropical environment. Contrary to expectations, Ndithia et al. (2017a) showed that neither current weather patterns nor food availability could explain the timing of breeding. Instead, they observed a highly unpredictable and irregular variation in environmental variables, invertebrate biomass, and breeding of Larks, among months and among years. Despite the highly unpredictable stochastic environmental conditions, Red-capped larks breed year-round (Ndithia et al. 2017a). However, despite year-round breeding, body mass and size at hatching, and rate of growth were influenced by social-environmental conditions (Ndithia et al. 2017b) which suggest the environment is not always optimal and point to likely direct and indirect relationships between environmental factors and performance.
Chapter 1
10
The discrepancy between the timing of breeding, and the environmental conditions Ndithia et al. (2017a) investigated may point to three possible explanations. The first explanation I propose is that even though the environmental factors vary in a stochastic and unpredictable manner, their amplitude is within the range that can always support breeding and therefore they are not the main drivers in timing of breeding. Rather, as Ndithia et al. (2017a) suggested, occurrence of breeding and possibly other phenotypic adjustments are under stronger influence of other drivers such as nest predation levels or disease risk, or organismal mechanisms such as body condition or immune function of the birds (Chmura et al. in press). For instance, nest predation, the major cause of nest failure in most bird species is said to be higher in tropical environments than in higher latitude areas (Skutch 1949, Martin 1993 a, b). Insights into nesting success at different times of the year and/or under different environmental conditions in this system may help understand the causes and consequences of breeding at different times, by shifting the focus from the number of breeding birds to the success of their nests. Additionally, tropical areas are characterized by higher parasite diversity and pathogen pressures compared to their temperate counterparts (Salkeld et al. 2008). Consequently, investment in immune function hypothesized to represent a trade-off with other energetically expensive life-events (Sheldon and Verhulst 1996) dependent on infection risk might exert a higher selective pressure to breeding than resource availability. Integrating physiological measures reflective of the level of other environmental threats such as immune indices indicative of pathogen pressure and disease risk (Horrocks et al. 2011, 2012) can lead to a better understanding of how individuals allocate resources in these equatorial zones despite year-round breeding.
Secondly, it may be that birds in these unpredictable stochastic environments adjust their phenotype through behavioural and/or physiological mechanisms to enable them to breed at all times irrespective of prevailing environmental conditions (Guenther and Trillmich 2013). For instance, Ndithia et al (2017b) found that nestling body mass and size at hatching in Red-capped larks were lowest in the more arid area reflective of lower resource availability and consequently lower investment of the females to eggs but nestlings in the arid areas grew faster than in the more resource rich cool and wet areas. This may suggest that females in arid areas may compensate for food shortage through a behavioral adjustment by increasing their feeding rate or alternatively exploiting larger areas to search for food. Similar to possible behavioral adjustments to buffer or reduce effects of resource variation, quantifying variation in abundance of food and/or environmental factors influencing resource availability does not account for species phenotypic adjustments to resource and/or environmental changes. It is well-established by both theoretical and empirical studies that birds accumulate body reserves in preparation for food scarcity or before engaging in breeding (Ekman and Hake 1990, Cuthill 2000) and birds in good condition are likely to have higher reproductive success independent of breeding time (Nilsson and Svensson 1993). Understanding behavioral and physiological adjustments rather than just quantifying environmental factors can, therefore, provide more insights into Red-capped Lark interaction with the environment, and a better understanding on strategies and mechanisms used by the birds to enable year-round breeding despite spatial-temporal changes of the environment.
Alternatively, the currently reported discrepancy between the timing of breeding, weather patterns and food availability (Ndithia et al. 2017a) could be indicative of a mismatch between the phenotype and the environmental conditions (Visser et al. 2012). Studies conducted in East Africa in the past reported seasonal changes in weather between a dry season and two rainy seasons (Brown 1980, Helm and Gwinner 1999). Of particular interest to our study, Brown (1980) in the most comprehensive analysis of nest records in East Africa to date covering the period 1961-1976,
reported that breeding was seasonal. Given that equatorial East Africa was considered seasonal, (Brown 1980, Helm and Gwinner 1999), observed life history schedules and phenotypic changes may have been shaped by adaptation to predictably changing environmental conditions through adaptive specialization and/or phylogenetic history. For instance, African stonechats from Kenya, close to the equator, where the photoperiod is nearly constant, are responsive to photoperiodic changes (Helm and Gwinner 1999) which may suggest the presence of a genetically programmed mechanism (Versteegh et al. 2014). Considering the crucial role of matching life history stages (especially breeding and molting) with favorable weather conditions, food and con-specific activities to enhance fitness, is the reported asynchrony between breeding and environment factors reflective of a mismatch with current environmental factors? With the current interest in how global climate change may affect different populations, studying these stochastic environments can serve as model systems to study how/if birds adapt to different environments and/or cope with the observed disrupted fit between fixed annual programs and environmental unpredictability.
In my thesis, I explore these alternatives by investigating if/how the stochastic environment influences temporal variation in nest success, and whether Red-capped larks adjust their phenotype through behavioral space use and physiological adjustments of body mass and immune function to adapt to the stochastic environment. I also test whether variation in body mass and immune function follows the historical seasonal or a stochastic pattern reminiscent of current environmental variation.
This will provide an important step towards a better understanding of life history strategies in these unpredictable stochastic environments that are suggested to have differences in cue-use and responses to environmental drivers as compared with their much studied high latitude counterparts. The stochastic nature of near-equatorial tropical areas with occurrence of year-round breeding provides “natural experiments”, offering an opportunity to tease apart effects of environmental factors and life history stages in natural populations in influencing behavior and physiological condition of birds. This is an important step because thus far the majority of studies focused on temperate zone environments where seasonal changes of weather and associated resources are highly correlated and synchronized with energetically intensive life history events such as breeding and molting. In such seasonal temperate zone environments it is impossible to tease apart independent effects of different environmental factors on nest survival, behavior, body condition and immune function independent of each other. A brief description of the study area and study species Following pioneering studies initiated by Tieleman and her students (Horrocks et al. 2012, Ndithia et al. 2017a), Red-capped Larks in Kedong, Kenya, have been shown to be an excellent system to study birds’ adaptations and responses to a non-seasonal stochastic equatorial environment.
Red-capped Larks are small gregarious birds found in short-grass and bare-ground habitats widely distributed across Africa (Zimmerman et al. 2005). They feed on a variety of insects and seeds (Ndithia et al. 2017a, Mwangi et al. 2018). Males and females form pairs during breeding but interact in mixed-sex flocks when not breeding. Pairs build ground-level open-cup nests and typically lay two eggs per clutch. Clutch size is usually two eggs but 1–3 egg clutches occur occasionally (Ndithia et al. 2017a). The female incubates eggs for 12–14 d with nestlings leaving the nest at around the age of 10 days. We studied Red-capped Larks Calandrella cinerea in Kedong Ranch, Naivasha, Kenya (S 00° 53.04ʹ, E 036° 24.51ʹ). Kedong Ranch is a 30 000 ha privately-owned ranch that lies at an altitude of between 1500 and 2200 m a.s.l. sandwiched between Mt Longonot and Hell's Gate National Parks on the floor of the Rift Valley escarpment in Naivasha,
General introduction
11
The discrepancy between the timing of breeding, and the environmental conditions Ndithia et al. (2017a) investigated may point to three possible explanations. The first explanation I propose is that even though the environmental factors vary in a stochastic and unpredictable manner, their amplitude is within the range that can always support breeding and therefore they are not the main drivers in timing of breeding. Rather, as Ndithia et al. (2017a) suggested, occurrence of breeding and possibly other phenotypic adjustments are under stronger influence of other drivers such as nest predation levels or disease risk, or organismal mechanisms such as body condition or immune function of the birds (Chmura et al. in press). For instance, nest predation, the major cause of nest failure in most bird species is said to be higher in tropical environments than in higher latitude areas (Skutch 1949, Martin 1993 a, b). Insights into nesting success at different times of the year and/or under different environmental conditions in this system may help understand the causes and consequences of breeding at different times, by shifting the focus from the number of breeding birds to the success of their nests. Additionally, tropical areas are characterized by higher parasite diversity and pathogen pressures compared to their temperate counterparts (Salkeld et al. 2008). Consequently, investment in immune function hypothesized to represent a trade-off with other energetically expensive life-events (Sheldon and Verhulst 1996) dependent on infection risk might exert a higher selective pressure to breeding than resource availability. Integrating physiological measures reflective of the level of other environmental threats such as immune indices indicative of pathogen pressure and disease risk (Horrocks et al. 2011, 2012) can lead to a better understanding of how individuals allocate resources in these equatorial zones despite year-round breeding.
Secondly, it may be that birds in these unpredictable stochastic environments adjust their phenotype through behavioural and/or physiological mechanisms to enable them to breed at all times irrespective of prevailing environmental conditions (Guenther and Trillmich 2013). For instance, Ndithia et al (2017b) found that nestling body mass and size at hatching in Red-capped larks were lowest in the more arid area reflective of lower resource availability and consequently lower investment of the females to eggs but nestlings in the arid areas grew faster than in the more resource rich cool and wet areas. This may suggest that females in arid areas may compensate for food shortage through a behavioral adjustment by increasing their feeding rate or alternatively exploiting larger areas to search for food. Similar to possible behavioral adjustments to buffer or reduce effects of resource variation, quantifying variation in abundance of food and/or environmental factors influencing resource availability does not account for species phenotypic adjustments to resource and/or environmental changes. It is well-established by both theoretical and empirical studies that birds accumulate body reserves in preparation for food scarcity or before engaging in breeding (Ekman and Hake 1990, Cuthill 2000) and birds in good condition are likely to have higher reproductive success independent of breeding time (Nilsson and Svensson 1993). Understanding behavioral and physiological adjustments rather than just quantifying environmental factors can, therefore, provide more insights into Red-capped Lark interaction with the environment, and a better understanding on strategies and mechanisms used by the birds to enable year-round breeding despite spatial-temporal changes of the environment.
Alternatively, the currently reported discrepancy between the timing of breeding, weather patterns and food availability (Ndithia et al. 2017a) could be indicative of a mismatch between the phenotype and the environmental conditions (Visser et al. 2012). Studies conducted in East Africa in the past reported seasonal changes in weather between a dry season and two rainy seasons (Brown 1980, Helm and Gwinner 1999). Of particular interest to our study, Brown (1980) in the most comprehensive analysis of nest records in East Africa to date covering the period 1961-1976,
reported that breeding was seasonal. Given that equatorial East Africa was considered seasonal, (Brown 1980, Helm and Gwinner 1999), observed life history schedules and phenotypic changes may have been shaped by adaptation to predictably changing environmental conditions through adaptive specialization and/or phylogenetic history. For instance, African stonechats from Kenya, close to the equator, where the photoperiod is nearly constant, are responsive to photoperiodic changes (Helm and Gwinner 1999) which may suggest the presence of a genetically programmed mechanism (Versteegh et al. 2014). Considering the crucial role of matching life history stages (especially breeding and molting) with favorable weather conditions, food and con-specific activities to enhance fitness, is the reported asynchrony between breeding and environment factors reflective of a mismatch with current environmental factors? With the current interest in how global climate change may affect different populations, studying these stochastic environments can serve as model systems to study how/if birds adapt to different environments and/or cope with the observed disrupted fit between fixed annual programs and environmental unpredictability.
In my thesis, I explore these alternatives by investigating if/how the stochastic environment influences temporal variation in nest success, and whether Red-capped larks adjust their phenotype through behavioral space use and physiological adjustments of body mass and immune function to adapt to the stochastic environment. I also test whether variation in body mass and immune function follows the historical seasonal or a stochastic pattern reminiscent of current environmental variation.
This will provide an important step towards a better understanding of life history strategies in these unpredictable stochastic environments that are suggested to have differences in cue-use and responses to environmental drivers as compared with their much studied high latitude counterparts. The stochastic nature of near-equatorial tropical areas with occurrence of year-round breeding provides “natural experiments”, offering an opportunity to tease apart effects of environmental factors and life history stages in natural populations in influencing behavior and physiological condition of birds. This is an important step because thus far the majority of studies focused on temperate zone environments where seasonal changes of weather and associated resources are highly correlated and synchronized with energetically intensive life history events such as breeding and molting. In such seasonal temperate zone environments it is impossible to tease apart independent effects of different environmental factors on nest survival, behavior, body condition and immune function independent of each other. A brief description of the study area and study species Following pioneering studies initiated by Tieleman and her students (Horrocks et al. 2012, Ndithia et al. 2017a), Red-capped Larks in Kedong, Kenya, have been shown to be an excellent system to study birds’ adaptations and responses to a non-seasonal stochastic equatorial environment.
Red-capped Larks are small gregarious birds found in short-grass and bare-ground habitats widely distributed across Africa (Zimmerman et al. 2005). They feed on a variety of insects and seeds (Ndithia et al. 2017a, Mwangi et al. 2018). Males and females form pairs during breeding but interact in mixed-sex flocks when not breeding. Pairs build ground-level open-cup nests and typically lay two eggs per clutch. Clutch size is usually two eggs but 1–3 egg clutches occur occasionally (Ndithia et al. 2017a). The female incubates eggs for 12–14 d with nestlings leaving the nest at around the age of 10 days. We studied Red-capped Larks Calandrella cinerea in Kedong Ranch, Naivasha, Kenya (S 00° 53.04ʹ, E 036° 24.51ʹ). Kedong Ranch is a 30 000 ha privately-owned ranch that lies at an altitude of between 1500 and 2200 m a.s.l. sandwiched between Mt Longonot and Hell's Gate National Parks on the floor of the Rift Valley escarpment in Naivasha,
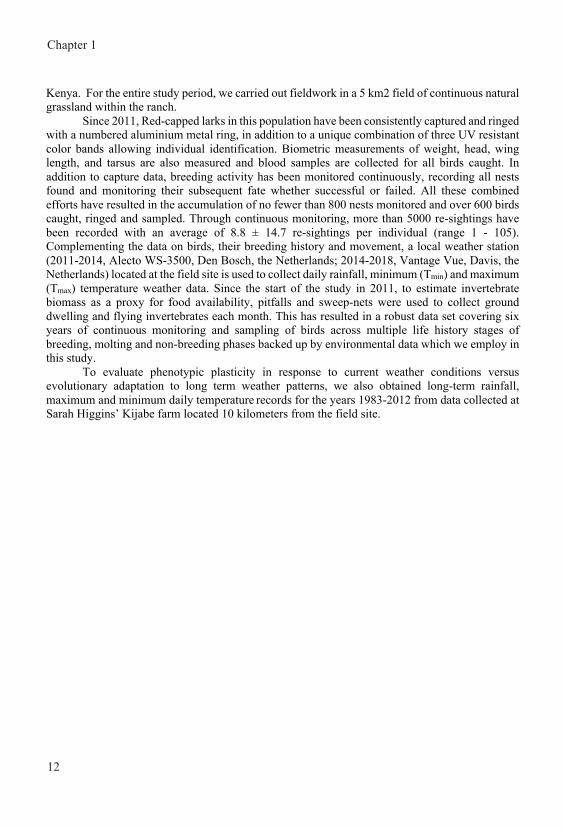
Chapter 1
12
Kenya. For the entire study period, we carried out fieldwork in a 5 km2 field of continuous natural grassland within the ranch.
Since 2011, Red-capped larks in this population have been consistently captured and ringed with a numbered aluminium metal ring, in addition to a unique combination of three UV resistant color bands allowing individual identification. Biometric measurements of weight, head, wing length, and tarsus are also measured and blood samples are collected for all birds caught. In addition to capture data, breeding activity has been monitored continuously, recording all nests found and monitoring their subsequent fate whether successful or failed. All these combined efforts have resulted in the accumulation of no fewer than 800 nests monitored and over 600 birds caught, ringed and sampled. Through continuous monitoring, more than 5000 re-sightings have been recorded with an average of 8.8 ± 14.7 re-sightings per individual (range 1 - 105). Complementing the data on birds, their breeding history and movement, a local weather station (2011-2014, Alecto WS-3500, Den Bosch, the Netherlands; 2014-2018, Vantage Vue, Davis, the Netherlands) located at the field site is used to collect daily rainfall, minimum (Tmin) and maximum (Tmax) temperature weather data. Since the start of the study in 2011, to estimate invertebrate biomass as a proxy for food availability, pitfalls and sweep-nets were used to collect ground dwelling and flying invertebrates each month. This has resulted in a robust data set covering six years of continuous monitoring and sampling of birds across multiple life history stages of breeding, molting and non-breeding phases backed up by environmental data which we employ in this study.
To evaluate phenotypic plasticity in response to current weather conditions versus evolutionary adaptation to long term weather patterns, we also obtained long-term rainfall, maximum and minimum daily temperature records for the years 1983-2012 from data collected at Sarah Higgins’ Kijabe farm located 10 kilometers from the field site.
Figure 1: A composite figure of the study system showing the country where the study was carried out(top right), study species (top left), the field site (top center), and below starting from left weather station, pitfall invertebrate sampling, nest type, mist net capture method and biometric measurements.
General introduction
13
Kenya. For the entire study period, we carried out fieldwork in a 5 km2 field of continuous natural grassland within the ranch.
Since 2011, Red-capped larks in this population have been consistently captured and ringed with a numbered aluminium metal ring, in addition to a unique combination of three UV resistant color bands allowing individual identification. Biometric measurements of weight, head, wing length, and tarsus are also measured and blood samples are collected for all birds caught. In addition to capture data, breeding activity has been monitored continuously, recording all nests found and monitoring their subsequent fate whether successful or failed. All these combined efforts have resulted in the accumulation of no fewer than 800 nests monitored and over 600 birds caught, ringed and sampled. Through continuous monitoring, more than 5000 re-sightings have been recorded with an average of 8.8 ± 14.7 re-sightings per individual (range 1 - 105). Complementing the data on birds, their breeding history and movement, a local weather station (2011-2014, Alecto WS-3500, Den Bosch, the Netherlands; 2014-2018, Vantage Vue, Davis, the Netherlands) located at the field site is used to collect daily rainfall, minimum (Tmin) and maximum (Tmax) temperature weather data. Since the start of the study in 2011, to estimate invertebrate biomass as a proxy for food availability, pitfalls and sweep-nets were used to collect ground dwelling and flying invertebrates each month. This has resulted in a robust data set covering six years of continuous monitoring and sampling of birds across multiple life history stages of breeding, molting and non-breeding phases backed up by environmental data which we employ in this study.
To evaluate phenotypic plasticity in response to current weather conditions versus evolutionary adaptation to long term weather patterns, we also obtained long-term rainfall, maximum and minimum daily temperature records for the years 1983-2012 from data collected at Sarah Higgins’ Kijabe farm located 10 kilometers from the field site.
Figure 1: A composite figure of the study system showing the country where the study was carried out(top right), study species (top left), the field site (top center), and below starting from left weather station, pitfall invertebrate sampling, nest type, mist net capture method and biometric measurements.
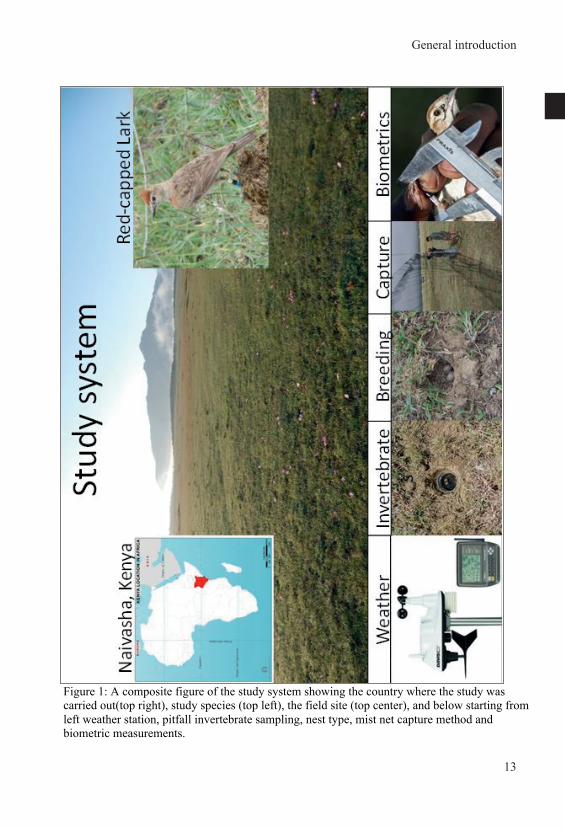
Chapter 1
14
Thesis outline The aim of the current thesis is to investigate how nesting success varies with time and environmental conditions in a year-round breeding population in a stochastic environment and how the birds adjust their behavior and physiology to cope with the unpredictable environment. With breeding and non-breeding co-occurring year round, and breeding occurring without direct associations with rainfall, temperature, and invertebrate biomass, in chapter 2, we capitalize on the year-round breeding to better understand the factors that determine nest survival. This provides a shift from the usually reported pattern of occurrence and timing of breeding to the implication of timing on success. By shifting focus from timing of breeding to variation in nest success, we provide the first intensive long-term monitoring of nest fates in a tropical ground-breeding bird and, to the best of our knowledge, the first to investigate the effects of various socio-environmental factors on nest survival and daily nest survival rates in Afrotropical grasslands.
In chapter 3 of this thesis, we exploit the opportunity to tease apart effects of breeding, food availability and weather conditions on home range and space use of Red-capped larks. We predicted that the costs and benefits associated with spacing behaviour, and with the closely related home range, change markedly with spatial and temporal variations of resources in the environment and with behaviour of conspecifics. Consequently, changes in the temporal and spatial distribution of critical resources should lead to differences in social organization and home ranges of individual birds.
In chapter 4 and 5, we investigate how engaging in different life history stages irrespective of environmental conditions influences physiology of Red-capped larks by comparing body mass and immune indices of birds in differing life history stages at particular environmental conditions. Within these two chapters, building on the reported lack of relationship between breeding and environmental factors, we investigate if observed variation in body mass and immune function (representative of the current phenotype) is evolutionarily adapted to long-term weather patterns, and consequently mismatched with current weather conditions, or alternatively responds through phenotypic plasticity to current weather conditions.
The last part of this thesis (chapter 6) provides a general discussion integrating the results from the four data chapters. In this last chapter, I highlight possible reasons why breeding of Red-capped Larks in Kedong occurs year-round and propose predation and disease risk as the main drivers influencing phenotypic adjustments of body mass and immune function in response to the environmental factors.
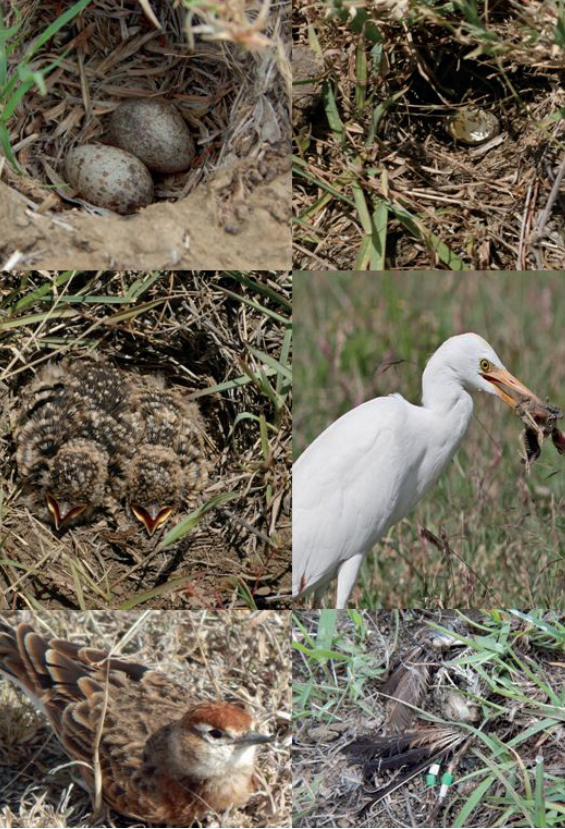
Chapter 2
Nest survival in year-round breeding tropical red-capped larks Calandrella cinerea increases with higher nest abundance but
decreases with higher invertebrate availability and rainfall
Joseph Mwangi
Henry K. Ndithia
Rosemarie Kentie
Muchane Muchai
B. Irene Tieleman
Journal of Avian Biology2018: e01645 doi: 10.1111/jav.01645
Chapter 2
18
Nest survival is critical to breeding in birds and plays an important role in life-history evolution and population dynamics. Studies evaluating the proximate factors involved in explaining nest survival and the resulting temporal patterns are biased in favor of temperate regions. Yet, such studies are especially pertinent to the tropics, where nest predation rates are typically high and environmental conditions often allow for year-round breeding. To tease apart the effects of calendar month and year, population level breeding activity and environmental conditions, we studied nest survival over a 64-month period in equatorial, year-round breeding red-capped larks Calandrella cinerea in Kenya. We show that daily nest survival rates varied with time, but not in a predictable seasonal fashion among months or consistently among years. We found negative influences of flying invertebrate biomass and rain on nest survival and higher survival of nests when nests were more abundant, which suggests that nest predation resulted from incidental predation. Although an increase in nest predation is often attributed to an increase in nest predators, we suggest that in our study, it may be caused by altered predator activity resulting from increased activity of the primary prey, invertebrates, rather than activity of the red-capped larks. Our results emphasize the need to conduct more studies in Afro-tropical regions because proximate mechanisms explaining nest predation can be different in the unpredictable and highly variable environments of the tropics compared with the relatively predictable seasonal changes found in temperate regions. Such studies will aid in better understanding of the environmental influences on life-history variation and population dynamics in birds.
Introduction Nest survival is an important component of natality for birds (Shaffer and Burger 2004), and thus plays critical roles in avian life-history evolution (Grant et al. 2005) and population dynamics (Cowardin and Johnson 1979, Arnold et al. 1993). Among the factors affecting nest survival, nest predation has been shown to be the major cause of nest failure in most bird species (Ricklefs 1969, França et al. 2016). For many species, nest survival varies over time (Grant et al. 2005, Koczur et al. 2014, Berkunsky et al. 2016, França et al. 2016, Polak 2016). Yet, studies evaluating the proximate factors involved in explaining nest survival, such as food, weather, and breeding activities of conspecifics, have mostly been carried out in temperate areas and rarely in the tropics (Thomson 1950, Martin 1987, Stutchbury and Morton 2008). Understanding the patterns and causes of temporal variation in daily nest survival rates is especially pertinent to the tropics, where nest predation rates are typically high (Skutch 1966, Ricklefs 1969, Robinson et al. 2000, Stutchbury and Morton 2008), and environmental conditions are favorable for breeding during much of the year (Moreau 1950, Stutchbury and Morton 2008, Ndithia et al. 2017b). Birds are thought to time their breeding to optimize fitness, by balancing favourable environmental conditions, such as the well-studied factors of day length, temperature, and food availability for growing nestlings, with the risk of nest predation (Morton 1971, Dawson et al. 2001, Preston and Rotenberry 2006). In temperate zones, where calendar time predicts the environmental conditions that are important for successful nesting, breeding is synchronized and generally takes place during spring (Lack 1950). In these temperate regions, seasonal variation in nest survival is well studied, and differences in nest predation between early and late nests is well-documented for many bird species with some species reportedly showing an increase, others a decrease and some show no variation with season (Götmark 2002, Grant et al. 2005, Wilson et al. 2007, Borgmann et al. 2013, Kentie et al. 2015). However, although some birds are known to forego breeding when perceived nest predation is too high (Spaans et al. 1998), birds faced with strong seasonal environments will not generally delay breeding to avoid higher nest predation (Preston and Rotenberry 2006). Many tropical bird species have extended breeding seasons or even breed year round. In the tropics environmental factors, such as temperature, food availability and breeding activities of conspecifics, do not predictably covary with calendar month. Here, factors that determine their breeding are often less clear (Moreau 1950, Ndithia et al. 2017b). In addition, the predictive value of calendar month for nest predation risk is poorly studied in tropical regions (but see Spanhove et al. 2014). However, if nest survival rates do vary predictably over time, it could be hypothesized that tropical birds, especially, should time their breeding to coincide with comparatively low nest predation rates. Factors that affect success rates of nests are manifold, varying from nest abundance (Sofaer et al. 2014, França et al. 2016), the behaviour of parents or offspring in and around the nest (Martin et al. 2000, Haff and Magrath 2011), predator numbers and foraging behaviour (Vickery et al. 1992) to environmental factors such as rainfall, temperature and food availability (Simons and Martin 1990, Shiao et al. 2015). These factors often interact with each other. For example, rainfall and low temperatures can lead to reduced parental visitation rates, increased brooding time for eggs/chicks in the nest (Siikamäki 1995, Öberg et al. 2015), increased begging behaviour by young as a result of decreased provisioning rates, and reduced foraging efficiency of parents due to reduced availability of prey (Siikamäki 1996). Food available to parents and nestlings has been
AB
STR
AC
TNest survival in tropical Red-capped Larks
19
Nest survival is critical to breeding in birds and plays an important role in life-history evolution and population dynamics. Studies evaluating the proximate factors involved in explaining nest survival and the resulting temporal patterns are biased in favor of temperate regions. Yet, such studies are especially pertinent to the tropics, where nest predation rates are typically high and environmental conditions often allow for year-round breeding. To tease apart the effects of calendar month and year, population level breeding activity and environmental conditions, we studied nest survival over a 64-month period in equatorial, year-round breeding red-capped larks Calandrella cinerea in Kenya. We show that daily nest survival rates varied with time, but not in a predictable seasonal fashion among months or consistently among years. We found negative influences of flying invertebrate biomass and rain on nest survival and higher survival of nests when nests were more abundant, which suggests that nest predation resulted from incidental predation. Although an increase in nest predation is often attributed to an increase in nest predators, we suggest that in our study, it may be caused by altered predator activity resulting from increased activity of the primary prey, invertebrates, rather than activity of the red-capped larks. Our results emphasize the need to conduct more studies in Afro-tropical regions because proximate mechanisms explaining nest predation can be different in the unpredictable and highly variable environments of the tropics compared with the relatively predictable seasonal changes found in temperate regions. Such studies will aid in better understanding of the environmental influences on life-history variation and population dynamics in birds.
Introduction Nest survival is an important component of natality for birds (Shaffer and Burger 2004), and thus plays critical roles in avian life-history evolution (Grant et al. 2005) and population dynamics (Cowardin and Johnson 1979, Arnold et al. 1993). Among the factors affecting nest survival, nest predation has been shown to be the major cause of nest failure in most bird species (Ricklefs 1969, França et al. 2016). For many species, nest survival varies over time (Grant et al. 2005, Koczur et al. 2014, Berkunsky et al. 2016, França et al. 2016, Polak 2016). Yet, studies evaluating the proximate factors involved in explaining nest survival, such as food, weather, and breeding activities of conspecifics, have mostly been carried out in temperate areas and rarely in the tropics (Thomson 1950, Martin 1987, Stutchbury and Morton 2008). Understanding the patterns and causes of temporal variation in daily nest survival rates is especially pertinent to the tropics, where nest predation rates are typically high (Skutch 1966, Ricklefs 1969, Robinson et al. 2000, Stutchbury and Morton 2008), and environmental conditions are favorable for breeding during much of the year (Moreau 1950, Stutchbury and Morton 2008, Ndithia et al. 2017b). Birds are thought to time their breeding to optimize fitness, by balancing favourable environmental conditions, such as the well-studied factors of day length, temperature, and food availability for growing nestlings, with the risk of nest predation (Morton 1971, Dawson et al. 2001, Preston and Rotenberry 2006). In temperate zones, where calendar time predicts the environmental conditions that are important for successful nesting, breeding is synchronized and generally takes place during spring (Lack 1950). In these temperate regions, seasonal variation in nest survival is well studied, and differences in nest predation between early and late nests is well-documented for many bird species with some species reportedly showing an increase, others a decrease and some show no variation with season (Götmark 2002, Grant et al. 2005, Wilson et al. 2007, Borgmann et al. 2013, Kentie et al. 2015). However, although some birds are known to forego breeding when perceived nest predation is too high (Spaans et al. 1998), birds faced with strong seasonal environments will not generally delay breeding to avoid higher nest predation (Preston and Rotenberry 2006). Many tropical bird species have extended breeding seasons or even breed year round. In the tropics environmental factors, such as temperature, food availability and breeding activities of conspecifics, do not predictably covary with calendar month. Here, factors that determine their breeding are often less clear (Moreau 1950, Ndithia et al. 2017b). In addition, the predictive value of calendar month for nest predation risk is poorly studied in tropical regions (but see Spanhove et al. 2014). However, if nest survival rates do vary predictably over time, it could be hypothesized that tropical birds, especially, should time their breeding to coincide with comparatively low nest predation rates. Factors that affect success rates of nests are manifold, varying from nest abundance (Sofaer et al. 2014, França et al. 2016), the behaviour of parents or offspring in and around the nest (Martin et al. 2000, Haff and Magrath 2011), predator numbers and foraging behaviour (Vickery et al. 1992) to environmental factors such as rainfall, temperature and food availability (Simons and Martin 1990, Shiao et al. 2015). These factors often interact with each other. For example, rainfall and low temperatures can lead to reduced parental visitation rates, increased brooding time for eggs/chicks in the nest (Siikamäki 1995, Öberg et al. 2015), increased begging behaviour by young as a result of decreased provisioning rates, and reduced foraging efficiency of parents due to reduced availability of prey (Siikamäki 1996). Food available to parents and nestlings has been
Chapter 2
18
Nest survival is critical to breeding in birds and plays an important role in life-history evolution and population dynamics. Studies evaluating the proximate factors involved in explaining nest survival and the resulting temporal patterns are biased in favor of temperate regions. Yet, such studies are especially pertinent to the tropics, where nest predation rates are typically high and environmental conditions often allow for year-round breeding. To tease apart the effects of calendar month and year, population level breeding activity and environmental conditions, we studied nest survival over a 64-month period in equatorial, year-round breeding red-capped larks Calandrella cinerea in Kenya. We show that daily nest survival rates varied with time, but not in a predictable seasonal fashion among months or consistently among years. We found negative influences of flying invertebrate biomass and rain on nest survival and higher survival of nests when nests were more abundant, which suggests that nest predation resulted from incidental predation. Although an increase in nest predation is often attributed to an increase in nest predators, we suggest that in our study, it may be caused by altered predator activity resulting from increased activity of the primary prey, invertebrates, rather than activity of the red-capped larks. Our results emphasize the need to conduct more studies in Afro-tropical regions because proximate mechanisms explaining nest predation can be different in the unpredictable and highly variable environments of the tropics compared with the relatively predictable seasonal changes found in temperate regions. Such studies will aid in better understanding of the environmental influences on life-history variation and population dynamics in birds.
Introduction Nest survival is an important component of natality for birds (Shaffer and Burger 2004), and thus plays critical roles in avian life-history evolution (Grant et al. 2005) and population dynamics (Cowardin and Johnson 1979, Arnold et al. 1993). Among the factors affecting nest survival, nest predation has been shown to be the major cause of nest failure in most bird species (Ricklefs 1969, França et al. 2016). For many species, nest survival varies over time (Grant et al. 2005, Koczur et al. 2014, Berkunsky et al. 2016, França et al. 2016, Polak 2016). Yet, studies evaluating the proximate factors involved in explaining nest survival, such as food, weather, and breeding activities of conspecifics, have mostly been carried out in temperate areas and rarely in the tropics (Thomson 1950, Martin 1987, Stutchbury and Morton 2008). Understanding the patterns and causes of temporal variation in daily nest survival rates is especially pertinent to the tropics, where nest predation rates are typically high (Skutch 1966, Ricklefs 1969, Robinson et al. 2000, Stutchbury and Morton 2008), and environmental conditions are favorable for breeding during much of the year (Moreau 1950, Stutchbury and Morton 2008, Ndithia et al. 2017b). Birds are thought to time their breeding to optimize fitness, by balancing favourable environmental conditions, such as the well-studied factors of day length, temperature, and food availability for growing nestlings, with the risk of nest predation (Morton 1971, Dawson et al. 2001, Preston and Rotenberry 2006). In temperate zones, where calendar time predicts the environmental conditions that are important for successful nesting, breeding is synchronized and generally takes place during spring (Lack 1950). In these temperate regions, seasonal variation in nest survival is well studied, and differences in nest predation between early and late nests is well-documented for many bird species with some species reportedly showing an increase, others a decrease and some show no variation with season (Götmark 2002, Grant et al. 2005, Wilson et al. 2007, Borgmann et al. 2013, Kentie et al. 2015). However, although some birds are known to forego breeding when perceived nest predation is too high (Spaans et al. 1998), birds faced with strong seasonal environments will not generally delay breeding to avoid higher nest predation (Preston and Rotenberry 2006). Many tropical bird species have extended breeding seasons or even breed year round. In the tropics environmental factors, such as temperature, food availability and breeding activities of conspecifics, do not predictably covary with calendar month. Here, factors that determine their breeding are often less clear (Moreau 1950, Ndithia et al. 2017b). In addition, the predictive value of calendar month for nest predation risk is poorly studied in tropical regions (but see Spanhove et al. 2014). However, if nest survival rates do vary predictably over time, it could be hypothesized that tropical birds, especially, should time their breeding to coincide with comparatively low nest predation rates. Factors that affect success rates of nests are manifold, varying from nest abundance (Sofaer et al. 2014, França et al. 2016), the behaviour of parents or offspring in and around the nest (Martin et al. 2000, Haff and Magrath 2011), predator numbers and foraging behaviour (Vickery et al. 1992) to environmental factors such as rainfall, temperature and food availability (Simons and Martin 1990, Shiao et al. 2015). These factors often interact with each other. For example, rainfall and low temperatures can lead to reduced parental visitation rates, increased brooding time for eggs/chicks in the nest (Siikamäki 1995, Öberg et al. 2015), increased begging behaviour by young as a result of decreased provisioning rates, and reduced foraging efficiency of parents due to reduced availability of prey (Siikamäki 1996). Food available to parents and nestlings has been
AB
STR
AC
T
Nest survival in tropical Red-capped Larks
19
Nest survival is critical to breeding in birds and plays an important role in life-history evolution and population dynamics. Studies evaluating the proximate factors involved in explaining nest survival and the resulting temporal patterns are biased in favor of temperate regions. Yet, such studies are especially pertinent to the tropics, where nest predation rates are typically high and environmental conditions often allow for year-round breeding. To tease apart the effects of calendar month and year, population level breeding activity and environmental conditions, we studied nest survival over a 64-month period in equatorial, year-round breeding red-capped larks Calandrella cinerea in Kenya. We show that daily nest survival rates varied with time, but not in a predictable seasonal fashion among months or consistently among years. We found negative influences of flying invertebrate biomass and rain on nest survival and higher survival of nests when nests were more abundant, which suggests that nest predation resulted from incidental predation. Although an increase in nest predation is often attributed to an increase in nest predators, we suggest that in our study, it may be caused by altered predator activity resulting from increased activity of the primary prey, invertebrates, rather than activity of the red-capped larks. Our results emphasize the need to conduct more studies in Afro-tropical regions because proximate mechanisms explaining nest predation can be different in the unpredictable and highly variable environments of the tropics compared with the relatively predictable seasonal changes found in temperate regions. Such studies will aid in better understanding of the environmental influences on life-history variation and population dynamics in birds.
Introduction Nest survival is an important component of natality for birds (Shaffer and Burger 2004), and thus plays critical roles in avian life-history evolution (Grant et al. 2005) and population dynamics (Cowardin and Johnson 1979, Arnold et al. 1993). Among the factors affecting nest survival, nest predation has been shown to be the major cause of nest failure in most bird species (Ricklefs 1969, França et al. 2016). For many species, nest survival varies over time (Grant et al. 2005, Koczur et al. 2014, Berkunsky et al. 2016, França et al. 2016, Polak 2016). Yet, studies evaluating the proximate factors involved in explaining nest survival, such as food, weather, and breeding activities of conspecifics, have mostly been carried out in temperate areas and rarely in the tropics (Thomson 1950, Martin 1987, Stutchbury and Morton 2008). Understanding the patterns and causes of temporal variation in daily nest survival rates is especially pertinent to the tropics, where nest predation rates are typically high (Skutch 1966, Ricklefs 1969, Robinson et al. 2000, Stutchbury and Morton 2008), and environmental conditions are favorable for breeding during much of the year (Moreau 1950, Stutchbury and Morton 2008, Ndithia et al. 2017b). Birds are thought to time their breeding to optimize fitness, by balancing favourable environmental conditions, such as the well-studied factors of day length, temperature, and food availability for growing nestlings, with the risk of nest predation (Morton 1971, Dawson et al. 2001, Preston and Rotenberry 2006). In temperate zones, where calendar time predicts the environmental conditions that are important for successful nesting, breeding is synchronized and generally takes place during spring (Lack 1950). In these temperate regions, seasonal variation in nest survival is well studied, and differences in nest predation between early and late nests is well-documented for many bird species with some species reportedly showing an increase, others a decrease and some show no variation with season (Götmark 2002, Grant et al. 2005, Wilson et al. 2007, Borgmann et al. 2013, Kentie et al. 2015). However, although some birds are known to forego breeding when perceived nest predation is too high (Spaans et al. 1998), birds faced with strong seasonal environments will not generally delay breeding to avoid higher nest predation (Preston and Rotenberry 2006). Many tropical bird species have extended breeding seasons or even breed year round. In the tropics environmental factors, such as temperature, food availability and breeding activities of conspecifics, do not predictably covary with calendar month. Here, factors that determine their breeding are often less clear (Moreau 1950, Ndithia et al. 2017b). In addition, the predictive value of calendar month for nest predation risk is poorly studied in tropical regions (but see Spanhove et al. 2014). However, if nest survival rates do vary predictably over time, it could be hypothesized that tropical birds, especially, should time their breeding to coincide with comparatively low nest predation rates. Factors that affect success rates of nests are manifold, varying from nest abundance (Sofaer et al. 2014, França et al. 2016), the behaviour of parents or offspring in and around the nest (Martin et al. 2000, Haff and Magrath 2011), predator numbers and foraging behaviour (Vickery et al. 1992) to environmental factors such as rainfall, temperature and food availability (Simons and Martin 1990, Shiao et al. 2015). These factors often interact with each other. For example, rainfall and low temperatures can lead to reduced parental visitation rates, increased brooding time for eggs/chicks in the nest (Siikamäki 1995, Öberg et al. 2015), increased begging behaviour by young as a result of decreased provisioning rates, and reduced foraging efficiency of parents due to reduced availability of prey (Siikamäki 1996). Food available to parents and nestlings has been
Chapter 2
20
shown to alter nest survival (Yom-Tov 1974, Simons and Martin 1990, Haley and Rosenberg 2013). In addition, the total food available to nest predators may affect nest predation by affecting nest predator numbers (Holmes 2011), or nest predators opportunistically encountering nests when in search of other food (Vickery et al. 1992). Opposite effects may also be possible, for example when breeding in synchrony reduces nest predation by diluting the effects of nest predators or by fostering group defence against nest predation (Westneat 1992). To better understand the factors determining nest survival in the tropics, we exploited the opportunity to tease apart the effects of population-level breeding activity and environmental conditions on a year-round breeding bird, the red-capped lark Calandrellla cinerea, in the understudied region of equatorial Africa (Xiao et al. 2017). Red-capped larks are ground-breeding open-cup nesters that experience high rates of nest predation, like many lark species (Tieleman et al. 2008, Praus et al. 2014, Ndithia et al. 2017a). At our study site in Kedong, Kenya, they breed year round and the timing of their breeding activities is not affected by rainfall, temperature or invertebrate availability (Ndithia et al. 2017b), although nestling growth rates increase with higher rainfall (Ndithia et al. 2017a). Insights into nest predation in this system may help understand the causes and consequences of breeding at different times, by shifting the focus from the number of breeding birds to the success of their nests. During a period of 64 months, we investigated variation in daily nest survival rates of equatorial, year-round breeding red-capped larks over time and in relation to social and environmental factors. We continuously observed breeding activities, monitored nest survival, and recorded rainfall and temperature, in addition to sampling the availability of flying and ground-dwelling invertebrates. We made the following predictions: 1) daily nest survival rates will not show a predictable seasonal pattern, or consistent differences among years, in line with the lack of seasonal/annual patterns found in the timing of breeding (Ndithia et al. 2017a); nest survival rate will be 2) negatively correlated with nest index due to a higher probability of predators encountering nests, 3) positively correlated with rainfall and temperature as factors that increase food available for nestlings, and 4) positively correlated with invertebrate biomass as a proxy for food availability. Material and methods Study species and study site We studied a population of red-capped larks in Kedong Ranch, Naivasha, Kenya (00°53.04¢S, 036°24.51¢E, 1890 m a.s.l.). The red-capped lark is a small gregarious bird found in short grass and bare-ground habitats (Zimmerman et al. 1996). Males and females form pairs during breeding but interact in mixed-sex flocks when not breeding (unpubl.). Clutch size is usually 2 eggs but 1–3 egg clutches occur occasionally (Ndithia et al. 2017a). The female incubates eggs for 12–14 d (mean 12.3 ± 0.21 SE, n = 38). Nestlings leave the nest at around the age of 10 d (mean 10.1 ± 0.10 SE, n = 56). Kedong Ranch is a 30 000 ha privately-owned ranch that lies at an altitude of between 1500 and 2200 m a.s.l. sandwiched between Mt Longonot and Hell’s Gate National Parks on the floor of the Rift Valley escarpment in Naivasha, Kenya. For the entire study period, we monitored nests in a 5 km2 field of continuous natural grassland within the ranch. The ranch is located 90 km from Nairobi and its land is used for extensive ranching with livestock and horticultural farming. Wildlife roams freely throughout the ranch and the adjacent national parks. Our study grassland
was occasionally under mild grazing of livestock (< 100 heads of cattle on average 4 d a month) and continuously used by free ranging wildlife. Wildlife species found within the grassland consisted of mostly impala Aepyceros melampus, giraffe Giraffa camelopardalis, zebra Equus
quagga, Thomson’s Eudorcas thomsonii and Grant’s gazelle Nanger granti, coke’s hartebeest Alcelaphus buselaphus cokii and bat-eared fox Otocyon megalotis. The area consists of grasslands dominated by the grasses Cynodon digitaria, Digitaria spp. and Themeda triandra interspersed with scattered woodlands dominated by short shrubs (Acacia drepanolobium and Tarchonanthus
camphoratus). Weather We set up a weather station (2011–2014, Alecto WS-3500, Den Bosch, the Netherlands; 2014–2016, Vantage Vue, Davis, the Netherlands) in Kedong that recorded daily rainfall (mm), minimum (Tmin, °C) and maximum (Tmax, °C) temperature. Based on these measurements, we calculated monthly totals of rainfall and monthly averages of Tmin and Tmax. Nests We searched for nests, on average, for 20 ± 1.0 (SE) days per month (range 7–31 d month–1) and 245 ± 31.2 (SE) hours per month (range 17–825 h month–1) from January 2011 until June 2016, by observing breeding behaviour or flushing birds from nests (for details, see Ndithia et al. 2017b). To quantify breeding intensity at the population level for each month, we calculated a monthly nest index, defined as the total number of nests found in a month per 10 person hours of search effort (Ndithia et al. 2017b). We did this because our search effort varied over time, but we assume that nest index was correlated to nest abundance. We quantified the person hours of search effort as number of hours searching for nests multiplied by the number of persons searching. The area searched for nests was constant during the entire study period. We recorded GPS coordinates for nests and monitored them every 3 d to determine nest fate until nestlings fledged or the nest failed. Nest failure was further classified into nest predation (when the entire contents of the nest, with eggs or nestlings that were too young to fledge, disappeared) or abandonment (if the nest contents were still (partially) present but not attended to by the parents). Nests were considered successful if they reached the expected fledging date. Invertebrate biomass To estimate invertebrate biomass as a proxy for food availability, we used pitfalls and sweep-nets to collect ground dwelling and flying invertebrates each month except in October 2011, September 2012, April and October 2014 due to tampering of the pitfall traps by local herders (Ausden and Drake 2006). For details, see Ndithia et al. (2017a, b). Briefly, we used four transects with five plastic cups each, inserted in the ground so that the top of the trap was level with the soil surface. Traps were half filled with formaldehyde to preserve invertebrates, harvested after five days in the field, and the contents sorted to taxonomic group. We also walked along the transects with a sweep net on the day we collected the contents of pitfalls. Invertebrates were identified using the National Museums of Kenya database collection as reference (Ndithia et al. 2017a) and Picker et al. (2003). To estimate monthly insect biomass, we used invertebrate calibration curves specific for 10 taxa categories to calculate dry mass from body length and width (Ndithia et al. 2017a). We used mean monthly biomass estimates to explore relationships among invertebrate biomass and daily nest survival rates.
Nest survival in tropical Red-capped Larks
21
shown to alter nest survival (Yom-Tov 1974, Simons and Martin 1990, Haley and Rosenberg 2013). In addition, the total food available to nest predators may affect nest predation by affecting nest predator numbers (Holmes 2011), or nest predators opportunistically encountering nests when in search of other food (Vickery et al. 1992). Opposite effects may also be possible, for example when breeding in synchrony reduces nest predation by diluting the effects of nest predators or by fostering group defence against nest predation (Westneat 1992). To better understand the factors determining nest survival in the tropics, we exploited the opportunity to tease apart the effects of population-level breeding activity and environmental conditions on a year-round breeding bird, the red-capped lark Calandrellla cinerea, in the understudied region of equatorial Africa (Xiao et al. 2017). Red-capped larks are ground-breeding open-cup nesters that experience high rates of nest predation, like many lark species (Tieleman et al. 2008, Praus et al. 2014, Ndithia et al. 2017a). At our study site in Kedong, Kenya, they breed year round and the timing of their breeding activities is not affected by rainfall, temperature or invertebrate availability (Ndithia et al. 2017b), although nestling growth rates increase with higher rainfall (Ndithia et al. 2017a). Insights into nest predation in this system may help understand the causes and consequences of breeding at different times, by shifting the focus from the number of breeding birds to the success of their nests. During a period of 64 months, we investigated variation in daily nest survival rates of equatorial, year-round breeding red-capped larks over time and in relation to social and environmental factors. We continuously observed breeding activities, monitored nest survival, and recorded rainfall and temperature, in addition to sampling the availability of flying and ground-dwelling invertebrates. We made the following predictions: 1) daily nest survival rates will not show a predictable seasonal pattern, or consistent differences among years, in line with the lack of seasonal/annual patterns found in the timing of breeding (Ndithia et al. 2017a); nest survival rate will be 2) negatively correlated with nest index due to a higher probability of predators encountering nests, 3) positively correlated with rainfall and temperature as factors that increase food available for nestlings, and 4) positively correlated with invertebrate biomass as a proxy for food availability. Material and methods Study species and study site We studied a population of red-capped larks in Kedong Ranch, Naivasha, Kenya (00°53.04¢S, 036°24.51¢E, 1890 m a.s.l.). The red-capped lark is a small gregarious bird found in short grass and bare-ground habitats (Zimmerman et al. 1996). Males and females form pairs during breeding but interact in mixed-sex flocks when not breeding (unpubl.). Clutch size is usually 2 eggs but 1–3 egg clutches occur occasionally (Ndithia et al. 2017a). The female incubates eggs for 12–14 d (mean 12.3 ± 0.21 SE, n = 38). Nestlings leave the nest at around the age of 10 d (mean 10.1 ± 0.10 SE, n = 56). Kedong Ranch is a 30 000 ha privately-owned ranch that lies at an altitude of between 1500 and 2200 m a.s.l. sandwiched between Mt Longonot and Hell’s Gate National Parks on the floor of the Rift Valley escarpment in Naivasha, Kenya. For the entire study period, we monitored nests in a 5 km2 field of continuous natural grassland within the ranch. The ranch is located 90 km from Nairobi and its land is used for extensive ranching with livestock and horticultural farming. Wildlife roams freely throughout the ranch and the adjacent national parks. Our study grassland
was occasionally under mild grazing of livestock (< 100 heads of cattle on average 4 d a month) and continuously used by free ranging wildlife. Wildlife species found within the grassland consisted of mostly impala Aepyceros melampus, giraffe Giraffa camelopardalis, zebra Equus
quagga, Thomson’s Eudorcas thomsonii and Grant’s gazelle Nanger granti, coke’s hartebeest Alcelaphus buselaphus cokii and bat-eared fox Otocyon megalotis. The area consists of grasslands dominated by the grasses Cynodon digitaria, Digitaria spp. and Themeda triandra interspersed with scattered woodlands dominated by short shrubs (Acacia drepanolobium and Tarchonanthus
camphoratus). Weather We set up a weather station (2011–2014, Alecto WS-3500, Den Bosch, the Netherlands; 2014–2016, Vantage Vue, Davis, the Netherlands) in Kedong that recorded daily rainfall (mm), minimum (Tmin, °C) and maximum (Tmax, °C) temperature. Based on these measurements, we calculated monthly totals of rainfall and monthly averages of Tmin and Tmax. Nests We searched for nests, on average, for 20 ± 1.0 (SE) days per month (range 7–31 d month–1) and 245 ± 31.2 (SE) hours per month (range 17–825 h month–1) from January 2011 until June 2016, by observing breeding behaviour or flushing birds from nests (for details, see Ndithia et al. 2017b). To quantify breeding intensity at the population level for each month, we calculated a monthly nest index, defined as the total number of nests found in a month per 10 person hours of search effort (Ndithia et al. 2017b). We did this because our search effort varied over time, but we assume that nest index was correlated to nest abundance. We quantified the person hours of search effort as number of hours searching for nests multiplied by the number of persons searching. The area searched for nests was constant during the entire study period. We recorded GPS coordinates for nests and monitored them every 3 d to determine nest fate until nestlings fledged or the nest failed. Nest failure was further classified into nest predation (when the entire contents of the nest, with eggs or nestlings that were too young to fledge, disappeared) or abandonment (if the nest contents were still (partially) present but not attended to by the parents). Nests were considered successful if they reached the expected fledging date. Invertebrate biomass To estimate invertebrate biomass as a proxy for food availability, we used pitfalls and sweep-nets to collect ground dwelling and flying invertebrates each month except in October 2011, September 2012, April and October 2014 due to tampering of the pitfall traps by local herders (Ausden and Drake 2006). For details, see Ndithia et al. (2017a, b). Briefly, we used four transects with five plastic cups each, inserted in the ground so that the top of the trap was level with the soil surface. Traps were half filled with formaldehyde to preserve invertebrates, harvested after five days in the field, and the contents sorted to taxonomic group. We also walked along the transects with a sweep net on the day we collected the contents of pitfalls. Invertebrates were identified using the National Museums of Kenya database collection as reference (Ndithia et al. 2017a) and Picker et al. (2003). To estimate monthly insect biomass, we used invertebrate calibration curves specific for 10 taxa categories to calculate dry mass from body length and width (Ndithia et al. 2017a). We used mean monthly biomass estimates to explore relationships among invertebrate biomass and daily nest survival rates.
Chapter 2
22
Statistical analysis As not all nests were found immediately after they were initiated, estimating the percentage of nests fledged would lead to an overestimate of nest survival because nests that failed before they were found would not be included. Therefore, we estimated daily nest survival rates (Mayfield 1975, Dinsmore et al. 2002), and evaluated how year and month, monthly nest index, rainfall, Tmin, Tmax, and invertebrate biomass affected daily nest survival rates. We pooled the egg and chick phases because we were able to estimate the age of only 31% of the nests (i.e. those found during laying, or those that hatched or fledged during our monitoring), due to the high nest predation rates.
Prior to model selection, we assessed the collinearity of the covariates with the variance inflation factor (VIF), using the function vifcor of R package usdm (Naimi 2015). The highest VIF was 1.4, and we thus did not consider collinearity (Zuur et al. 2010). We modelled daily nest survival with the package RMark ver. 2.2.0 (Laake 2013), which uses the R interface to run nest survival models in the program MARK (White and Burnham 1999). We did model selection of nest survival models using an information theoretical approach based on second-order Akaike information criterion for small sample sizes (AICc) (Burnham and Anderson 2002). We used month as the temporal grouping variable to test for effects of the various covariates on daily nest survival. We followed a hierarchical modelling approach. Due to lack of seasonal or predictable temporal patterns of weather (rainfall, maximum and minimum daily temperature), food availability (invertebrate biomass) or breeding in our study (Ndithia et al. 2017b), we first tested for yearly and monthly effects on daily nest survival rates to choose a temporal variable that might best explain variation (Table 1A). Because some months during some years had no breeding larks, we included a variable year month which described each year and month combination with nests. Hence, we did not test for the interaction of year and month. We then proceeded to model the variation in daily nest survival by substituting monthly effects by monthly nest index, weather covariates and invertebrate biomasses (Table 1B). To model effects of the covariates on daily nest survival, we excluded the four months lacking invertebrate data. With no single best model and to account for model selection uncertainty, we computed with the package MuMIn (Grueber et al. 2011, Barton 2018) a weighted average of the parameter estimates and 95% confidence limits for all the variables contained in the models which have a summed weight < 0.90 % (Table 2). We performed all statistical analyses in R 3.3.0 (R Core Team). Results Nest number and fate We found and monitored a total of 848 nests during 41 of the 65 months of field work (Fig. 1A). We found nests at different stages: 260 (30.6%) during nest-construction, 44 (5.2%) during egg laying, 447 (52.7%) during incubation and 97 (11.4%) with chicks. From all the nests found, a total of 99 nests reached the fledgling stage. The remainder, 88.3% of all nests found, failed at various stages. Nest predation at 90% was the most likely cause of nest failure, while abandonment accounted for 10%. We could only determine the cause of nest abandonment of 13 of the 75 abandoned nests: three of the nests had been abandoned due to nest flooding after heavy downpour, three nests after an attack on chicks and brooding parents on nests by ants, four nests were demolished, and three nests were abandoned after trampling by a herbivore. Based on the pooled
data over the entire study period, the overall daily nest survival rate was 0.88 (± 0.004 SE), leading to a 5% chance that a nest would produce fledglings (nest survival rate) when considering 24 d of nesting activity.
Figure 1. Temporal variation during January 2011–May 2016 in (A) monthly nest index (number of nests/10 search hours), (B) daily nest survival rates (± SE) of red-capped larks, (C) rainfall (mm), (D) average monthly minimum (Tmin) and maximum (Tmax) temperature (°C), and (E) biomasses (g dry weight) of ground-dwelling and flying invertebrates in Kedong Ranch, Kenya. Data for weather variables, invertebrates and monthly nest index for the period 2011–2013 were taken from Ndithia et al. (2017a).
Nest survival in tropical Red-capped Larks
23
Statistical analysis As not all nests were found immediately after they were initiated, estimating the percentage of nests fledged would lead to an overestimate of nest survival because nests that failed before they were found would not be included. Therefore, we estimated daily nest survival rates (Mayfield 1975, Dinsmore et al. 2002), and evaluated how year and month, monthly nest index, rainfall, Tmin, Tmax, and invertebrate biomass affected daily nest survival rates. We pooled the egg and chick phases because we were able to estimate the age of only 31% of the nests (i.e. those found during laying, or those that hatched or fledged during our monitoring), due to the high nest predation rates.
Prior to model selection, we assessed the collinearity of the covariates with the variance inflation factor (VIF), using the function vifcor of R package usdm (Naimi 2015). The highest VIF was 1.4, and we thus did not consider collinearity (Zuur et al. 2010). We modelled daily nest survival with the package RMark ver. 2.2.0 (Laake 2013), which uses the R interface to run nest survival models in the program MARK (White and Burnham 1999). We did model selection of nest survival models using an information theoretical approach based on second-order Akaike information criterion for small sample sizes (AICc) (Burnham and Anderson 2002). We used month as the temporal grouping variable to test for effects of the various covariates on daily nest survival. We followed a hierarchical modelling approach. Due to lack of seasonal or predictable temporal patterns of weather (rainfall, maximum and minimum daily temperature), food availability (invertebrate biomass) or breeding in our study (Ndithia et al. 2017b), we first tested for yearly and monthly effects on daily nest survival rates to choose a temporal variable that might best explain variation (Table 1A). Because some months during some years had no breeding larks, we included a variable year month which described each year and month combination with nests. Hence, we did not test for the interaction of year and month. We then proceeded to model the variation in daily nest survival by substituting monthly effects by monthly nest index, weather covariates and invertebrate biomasses (Table 1B). To model effects of the covariates on daily nest survival, we excluded the four months lacking invertebrate data. With no single best model and to account for model selection uncertainty, we computed with the package MuMIn (Grueber et al. 2011, Barton 2018) a weighted average of the parameter estimates and 95% confidence limits for all the variables contained in the models which have a summed weight < 0.90 % (Table 2). We performed all statistical analyses in R 3.3.0 (R Core Team). Results Nest number and fate We found and monitored a total of 848 nests during 41 of the 65 months of field work (Fig. 1A). We found nests at different stages: 260 (30.6%) during nest-construction, 44 (5.2%) during egg laying, 447 (52.7%) during incubation and 97 (11.4%) with chicks. From all the nests found, a total of 99 nests reached the fledgling stage. The remainder, 88.3% of all nests found, failed at various stages. Nest predation at 90% was the most likely cause of nest failure, while abandonment accounted for 10%. We could only determine the cause of nest abandonment of 13 of the 75 abandoned nests: three of the nests had been abandoned due to nest flooding after heavy downpour, three nests after an attack on chicks and brooding parents on nests by ants, four nests were demolished, and three nests were abandoned after trampling by a herbivore. Based on the pooled
data over the entire study period, the overall daily nest survival rate was 0.88 (± 0.004 SE), leading to a 5% chance that a nest would produce fledglings (nest survival rate) when considering 24 d of nesting activity.
Figure 1. Temporal variation during January 2011–May 2016 in (A) monthly nest index (number of nests/10 search hours), (B) daily nest survival rates (± SE) of red-capped larks, (C) rainfall (mm), (D) average monthly minimum (Tmin) and maximum (Tmax) temperature (°C), and (E) biomasses (g dry weight) of ground-dwelling and flying invertebrates in Kedong Ranch, Kenya. Data for weather variables, invertebrates and monthly nest index for the period 2011–2013 were taken from Ndithia et al. (2017a).
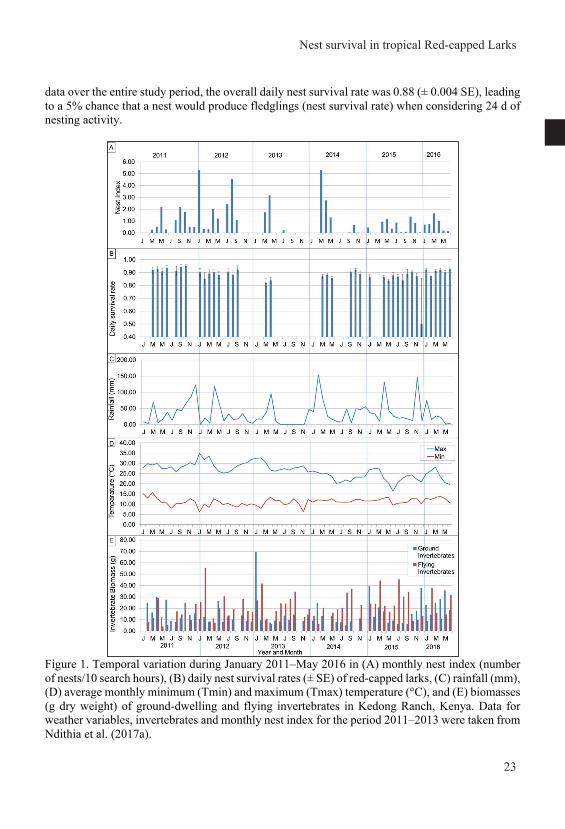
Chapter 2
24
Variation of daily nest survival rates with month and year Daily nest survival rates varied between months and years (Fig. 1B). The highest daily nest survival rate was 0.95 (± 0.01 SE) in October 2011, which would correspond to a nest survival rate of 30%. The lowest daily nest survival rate was 0.50 (± 0.35 SE) in December 2015, corresponding to a nest survival rate of < 1%.
Exploring the explanatory power of month and year for daily nest survival rate, we found that the best model included yearmonth (AIC weight 0.99, Table 1A) followed by year + month (AIC weight = 0.002), whereas month by itself explained almost no variation (AIC weight = 0.000, Table 1A) and year by itself explained slightly more but still very little variation (AIC weight = 0.001, Table 1A). This suggests that daily nest survival rates varied substantially with time but that there was no consistent annually recurring seasonal pattern or systematic differences among years.
Social and environmental factors influencing daily nest survival rates To further explore the variation in daily nest survival rate, we replaced month with monthly nest index, weather parameters and invertebrate biomasses, which varied considerably over time (Fig. 1A, C, D, and E). Monthly nest index varied between 0.02 (November 2014) and 5.3 (March 2014) with a mean of 1.2 ± 0.21 SE during the 41 months in which breeding occurred (Fig. 1A). Rainfall varied annually between 224 mm (2013) and 531 mm (2014), and monthly between 0 mm (6 months, mainly in 2013) and 153 mm (February 2014), with no consistent intra-annual pattern (see also Ndithia et al. 2017b) (Fig. 1C). Mean monthly Tmax was 26.3 ± 0.46°C (SE, n = 66), and Tmin was 11.2 ± 0.22°C (SE, n = 66). Between months, the monthly mean Tmax ranged from 16.4°C to 34.9°C while Tmin ranged from 6.2°C to 15.6°C (Fig. 1D). The mean monthly ground-dwelling invertebrate biomass was 15.7 mg ± 1.26 SE (n = 60) with the highest values recorded in January 2013 (69.3 mg), which was 14 times higher than the lowest values in August 2014 (5.0 mg, Fig. 1E). The mean monthly flying invertebrate biomass was 21.0 mg ± 1.31 SE (n = 58) with the highest value in February 2012 (55.5 mg), which was 13.7 times higher than the lowest values in May 2011 (4.1 mg, Fig. 1E).
Including this social and environmental variation in our model selection analysis, as well as year, we found that the highest ranked model, with the lowest AICc and a weight of 0.19, included monthly nest index, rain, flying invertebrate biomass, and year as the best predictors of daily nest survival rate (Table 1B). The next-best three models appeared to be within delta AICc < 2, but we note that this was within the penalty of 2 units with an addition of one parameter (from 9 to 10), which shows little support for adding the extra parameters (Arnold 2010). Table 2 shows model averaging results of all models with a summed weight of < 0.90. Monthly nest index and ground invertebrate biomass were positively correlated with daily nest survival rate, whereas rainfall, flying invertebrate biomass, minimum and maximum daily temperature were negatively correlated with daily nest survival rate (Table 2, Fig. 2). However, confidence intervals for monthly nest index, ground invertebrate biomass, minimum and maximum daily temperature confidence intervals include zero, showing little evidence that they affect daily nest survival.
Figure 2. Marginal response curves (solid line) and 95% confidence intervals (dashed lines) of the two extreme years 2011 (year with highest nest survival) and 2014 (year with lowest nest survival showing variation of daily nest survival probability (DSR) of redcapped larks with the three parameters in the best model: (A) monthly nest index, (B) rainfall and (C) flying invertebrates. The response curve for each variable was constructed while keeping the other two variables at their average value. We show the effects of only two years because the trend was the same for all years so we could reduce overcrowding of lines in the figure.
Nest survival in tropical Red-capped Larks
25
Variation of daily nest survival rates with month and year Daily nest survival rates varied between months and years (Fig. 1B). The highest daily nest survival rate was 0.95 (± 0.01 SE) in October 2011, which would correspond to a nest survival rate of 30%. The lowest daily nest survival rate was 0.50 (± 0.35 SE) in December 2015, corresponding to a nest survival rate of < 1%.
Exploring the explanatory power of month and year for daily nest survival rate, we found that the best model included yearmonth (AIC weight 0.99, Table 1A) followed by year + month (AIC weight = 0.002), whereas month by itself explained almost no variation (AIC weight = 0.000, Table 1A) and year by itself explained slightly more but still very little variation (AIC weight = 0.001, Table 1A). This suggests that daily nest survival rates varied substantially with time but that there was no consistent annually recurring seasonal pattern or systematic differences among years.
Social and environmental factors influencing daily nest survival rates To further explore the variation in daily nest survival rate, we replaced month with monthly nest index, weather parameters and invertebrate biomasses, which varied considerably over time (Fig. 1A, C, D, and E). Monthly nest index varied between 0.02 (November 2014) and 5.3 (March 2014) with a mean of 1.2 ± 0.21 SE during the 41 months in which breeding occurred (Fig. 1A). Rainfall varied annually between 224 mm (2013) and 531 mm (2014), and monthly between 0 mm (6 months, mainly in 2013) and 153 mm (February 2014), with no consistent intra-annual pattern (see also Ndithia et al. 2017b) (Fig. 1C). Mean monthly Tmax was 26.3 ± 0.46°C (SE, n = 66), and Tmin was 11.2 ± 0.22°C (SE, n = 66). Between months, the monthly mean Tmax ranged from 16.4°C to 34.9°C while Tmin ranged from 6.2°C to 15.6°C (Fig. 1D). The mean monthly ground-dwelling invertebrate biomass was 15.7 mg ± 1.26 SE (n = 60) with the highest values recorded in January 2013 (69.3 mg), which was 14 times higher than the lowest values in August 2014 (5.0 mg, Fig. 1E). The mean monthly flying invertebrate biomass was 21.0 mg ± 1.31 SE (n = 58) with the highest value in February 2012 (55.5 mg), which was 13.7 times higher than the lowest values in May 2011 (4.1 mg, Fig. 1E).
Including this social and environmental variation in our model selection analysis, as well as year, we found that the highest ranked model, with the lowest AICc and a weight of 0.19, included monthly nest index, rain, flying invertebrate biomass, and year as the best predictors of daily nest survival rate (Table 1B). The next-best three models appeared to be within delta AICc < 2, but we note that this was within the penalty of 2 units with an addition of one parameter (from 9 to 10), which shows little support for adding the extra parameters (Arnold 2010). Table 2 shows model averaging results of all models with a summed weight of < 0.90. Monthly nest index and ground invertebrate biomass were positively correlated with daily nest survival rate, whereas rainfall, flying invertebrate biomass, minimum and maximum daily temperature were negatively correlated with daily nest survival rate (Table 2, Fig. 2). However, confidence intervals for monthly nest index, ground invertebrate biomass, minimum and maximum daily temperature confidence intervals include zero, showing little evidence that they affect daily nest survival.
Figure 2. Marginal response curves (solid line) and 95% confidence intervals (dashed lines) of the two extreme years 2011 (year with highest nest survival) and 2014 (year with lowest nest survival showing variation of daily nest survival probability (DSR) of redcapped larks with the three parameters in the best model: (A) monthly nest index, (B) rainfall and (C) flying invertebrates. The response curve for each variable was constructed while keeping the other two variables at their average value. We show the effects of only two years because the trend was the same for all years so we could reduce overcrowding of lines in the figure.
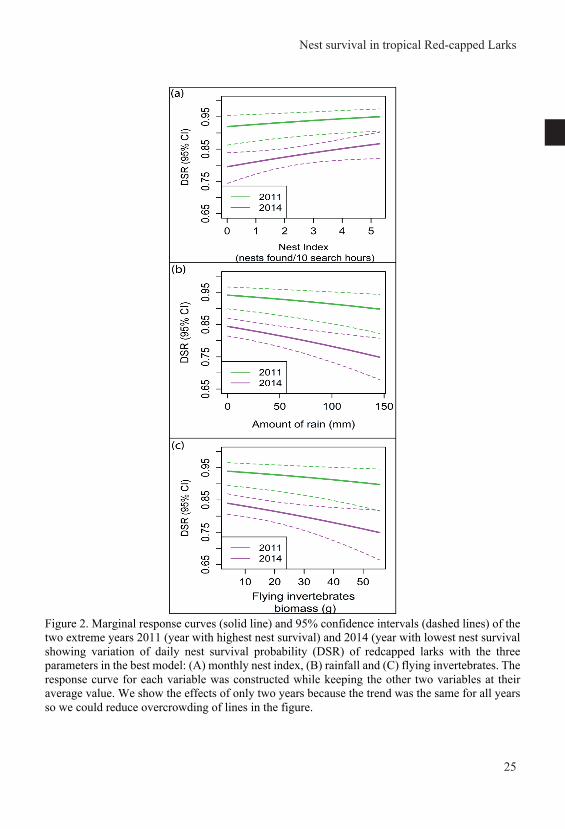
Chapter 2
26
Discussion In this study, we showed that daily nest survival rates of red-capped larks in Kedong varied with time, but not in a predictable seasonal fashion among months or consistently among years. Including socio-ecological and environmental factors in our model selection approach showed that monthly nest index, rainfall and flying invertebrate biomass had the highest relative importance in influencing daily nest survival. Daily nest survival was positively correlated with nesting activities of con-specifics and negatively correlated with rainfall and the availability of flying invertebrates. These findings support our first prediction that daily nest survival rates would not show an annually predictable seasonal pattern or consistent differences among years, in line with the lack of such patterns in the timing of breeding (Ndithia et al. 2017b). However, we did not find the expected negative relationship between daily nest survival rate and nest abundance, but instead found a weak positive relationship. Finally, in contrast with our third and fourth predictions, increased rainfall and flying invertebrate abundance was correlated with lower daily nest survival rates, while ground-dwelling invertebrates showed no correlation. Our study provides the first intensive long-term monitoring of nest fates in a tropical ground-breeding bird and, to the best of our knowledge, is the first to model the effects of various covariates on long term nest survival and daily survival rates in Afrotropical grasslands. High nest predation in the tropics Nest predation accounted for most of the nest losses in red-capped larks, which is consistent with patterns reported from other tropical (Skutch 1949, Newmark and Stanley 2011), subtropical (Robinson et al. 2000), and temperate (Ricklefs 1969, Maphisa et al. 2009, Martin 1993b) regions. Although 75 nests were classified as abandoned 86% were suspected to be linked to depredation, the other 14% (18 nests) occurrences were few and far apart and so we did not distinguish between the specific causes of nest failure in calculating daily survival probabilities. Nest survival of red-capped larks is comparable to those reported for Afrotropical birds (Newmark and Stanley 2011) and sub-tropical birds in Panama (Robinson et al. 2000). Within the lark family, of which all members are ground-nesting grassland breeders, daily nest survival rates of red-capped larks were lower compared with species in more temperate regions (thekla lark Galerda theklae and lesser short-toed lark Calandrella rufescens (DSR = 0.91), (Yanes and Suarez 1996), Rudd’s lark Heteromirafra ruddi (DSR = 0.96), (Maphisa et al. 2009), skylarks Alauda arvensis and woodlarks Lullula arborea (DSR = 0.95, DSR = 0.94), (Praus et al. 2014)), but similar to those of hoopoe larks Alaemon alaudipes in the Arabian Desert (DSR = range 0.81– 0.87, (Tieleman et al. 2008)). Our study, therefore, supports the postulation that tropical ground-nesting birds experience higher predation rates than their temperate counterparts (Skutch 1949, Ricklefs 1969, Soderstrom 1999, but see Oniki 1979). Similar results have also been reported in forest species showing tropical nesting success to be approximately 23% lower than in temperate regions (Robinson et al. 2000). Higher nest predation in the tropics is attributed to a higher diversity of predators (Skutch 1949, Ricklefs 1969). We indeed observed a diverse range of predators preying upon red-capped lark nests, such as lesser kestrels Falco naumanni, black chested-snake eagles Circaetus pectoralis, domestic dogs Canis lupus familiaris, bat-eared foxes Otocyon megalotis, cattle egrets Bubulcus
ibis and an unidentified snake. Although we were not able to quantify the relative contributions of the various predators to daily nest survival rate, most of the nest predation was carried out by bat-eared foxes and common kestrels (unpubl.).
Temporal variation in nest survival In well-defined breeding seasons, both in tropical and temperate areas, temporal variation in nest predation is widely documented but the nature of the pattern varies among species, with some studies showing an increase as breeding season progresses (Grant et al. 2005), while others show a decrease (Davis 2005, Shustack and Rodewald 2011). Our study of a year-round breeding bird without a well defined breeding season showed high and unpredictable temporal variation in nest predation rates, a result that is consistent with two other Afrotropical studies, namely on the white-starred robin Pogonocichla stellata (Spanhove et al. 2009) and Cabanis’s greenbul Phyllastrephus cabanisi (Spanhove et al. 2014) in Taita Hills (south-east Kenya). In our study, nest abandonment was not large enough to explain the variation in nest success. Temporal variation in the strength and direction of nest predation rates suggest that nest predators change and vary over time heterogeneously, e.g. with predator density and abundance (Yanes and Suarez 1996, Borgmann et al. 2013), predator activity patterns (Schmidt et al. 2001), primary prey availability and distribution (Vickery et al. 1992) or availability of alternative prey (Borgmann et al. 2013). We propose that the unpredictability of the temporal variation makes it difficult for red-capped larks to use nest predation risk as a cue to time their breeding. Influence of monthly nest index on nest survival Daily nest survival increased, albeit weakly supported, when more larks in the population were nesting. This, together with the inverse relationship between daily nest survival and flying invertebrate food, suggests that nest predation was incidental, i.e. lark nest contents were a secondary prey encountered by predators searching for a different primary prey (Vickery et al. 1992, Schmidt et al. 2001). When nest predation is caused by a primary nest predator, the relationship between nest abundance and survival is typically inverse, as reported in most studies (Schmidt and Whelan 1999, Gunnarsson and Elmberg 2008, Elmberg et al. 2009, Sofaer et al. 2014, França et al. 2016). A pattern similar to ours was reported for ground-nesting birds whose main predator were striped skunks Mephitis mephitis that primarily target invertebrates (Vickery et al. 1992). Indeed, the primary food of bat-eared foxes and lesser kestrels, the main nest predators that we observed, are invertebrates, although their diet also includes other opportunistic prey, such as birds and eggs (Nel 1978, Anderson et al. 1999, Stuart et al. 2003, Klare et al. 2011).
Nest predation by incidental predators can be the major cause of nest failure and significantly decrease daily nest survival rates (Vickery et al. 1992, Yanes and Suarez 1996, Martínez-Padilla and Fargallo 2008). An alternative explanation for the positive relationship between daily nest survival rates and monthly nest index is that most birds start breeding when nest survival is high. We find this an unlikely explanation for year-round, opportunistically breeding birds such as our red-capped larks (Grant and Boag 1980, Ndithia et al. 2017b) because it requires that birds can accurately predict temporal variation of conditions influencing nest survival (Emmering and Schmidt 2011, Ibáñez-Álamo et al. 2015). Our interpretation that incidental nest predation may be the major cause of reduced nest survival in red-capped larks is also congruent with the negative relationship between daily survival rate and flying invertebrate biomass, the primary prey for the incidental nest predators. Influence of rain and invertebrate biomass on nest survival In contrast with our expectation that higher rainfall would increase invertebrate availability and thereby lead to higher nest survival (Illera and Díaz 2006), we found that increased rainfall decreased nest survival in red-capped larks. Moreover, we found that increased rain had a significantly negative effect on flying invertebrate biomass (F 1, 56 = 8.62, p = 0.005, Fig. 3),
Nest survival in tropical Red-capped Larks
27
Discussion In this study, we showed that daily nest survival rates of red-capped larks in Kedong varied with time, but not in a predictable seasonal fashion among months or consistently among years. Including socio-ecological and environmental factors in our model selection approach showed that monthly nest index, rainfall and flying invertebrate biomass had the highest relative importance in influencing daily nest survival. Daily nest survival was positively correlated with nesting activities of con-specifics and negatively correlated with rainfall and the availability of flying invertebrates. These findings support our first prediction that daily nest survival rates would not show an annually predictable seasonal pattern or consistent differences among years, in line with the lack of such patterns in the timing of breeding (Ndithia et al. 2017b). However, we did not find the expected negative relationship between daily nest survival rate and nest abundance, but instead found a weak positive relationship. Finally, in contrast with our third and fourth predictions, increased rainfall and flying invertebrate abundance was correlated with lower daily nest survival rates, while ground-dwelling invertebrates showed no correlation. Our study provides the first intensive long-term monitoring of nest fates in a tropical ground-breeding bird and, to the best of our knowledge, is the first to model the effects of various covariates on long term nest survival and daily survival rates in Afrotropical grasslands. High nest predation in the tropics Nest predation accounted for most of the nest losses in red-capped larks, which is consistent with patterns reported from other tropical (Skutch 1949, Newmark and Stanley 2011), subtropical (Robinson et al. 2000), and temperate (Ricklefs 1969, Maphisa et al. 2009, Martin 1993b) regions. Although 75 nests were classified as abandoned 86% were suspected to be linked to depredation, the other 14% (18 nests) occurrences were few and far apart and so we did not distinguish between the specific causes of nest failure in calculating daily survival probabilities. Nest survival of red-capped larks is comparable to those reported for Afrotropical birds (Newmark and Stanley 2011) and sub-tropical birds in Panama (Robinson et al. 2000). Within the lark family, of which all members are ground-nesting grassland breeders, daily nest survival rates of red-capped larks were lower compared with species in more temperate regions (thekla lark Galerda theklae and lesser short-toed lark Calandrella rufescens (DSR = 0.91), (Yanes and Suarez 1996), Rudd’s lark Heteromirafra ruddi (DSR = 0.96), (Maphisa et al. 2009), skylarks Alauda arvensis and woodlarks Lullula arborea (DSR = 0.95, DSR = 0.94), (Praus et al. 2014)), but similar to those of hoopoe larks Alaemon alaudipes in the Arabian Desert (DSR = range 0.81– 0.87, (Tieleman et al. 2008)). Our study, therefore, supports the postulation that tropical ground-nesting birds experience higher predation rates than their temperate counterparts (Skutch 1949, Ricklefs 1969, Soderstrom 1999, but see Oniki 1979). Similar results have also been reported in forest species showing tropical nesting success to be approximately 23% lower than in temperate regions (Robinson et al. 2000). Higher nest predation in the tropics is attributed to a higher diversity of predators (Skutch 1949, Ricklefs 1969). We indeed observed a diverse range of predators preying upon red-capped lark nests, such as lesser kestrels Falco naumanni, black chested-snake eagles Circaetus pectoralis, domestic dogs Canis lupus familiaris, bat-eared foxes Otocyon megalotis, cattle egrets Bubulcus
ibis and an unidentified snake. Although we were not able to quantify the relative contributions of the various predators to daily nest survival rate, most of the nest predation was carried out by bat-eared foxes and common kestrels (unpubl.).
Temporal variation in nest survival In well-defined breeding seasons, both in tropical and temperate areas, temporal variation in nest predation is widely documented but the nature of the pattern varies among species, with some studies showing an increase as breeding season progresses (Grant et al. 2005), while others show a decrease (Davis 2005, Shustack and Rodewald 2011). Our study of a year-round breeding bird without a well defined breeding season showed high and unpredictable temporal variation in nest predation rates, a result that is consistent with two other Afrotropical studies, namely on the white-starred robin Pogonocichla stellata (Spanhove et al. 2009) and Cabanis’s greenbul Phyllastrephus cabanisi (Spanhove et al. 2014) in Taita Hills (south-east Kenya). In our study, nest abandonment was not large enough to explain the variation in nest success. Temporal variation in the strength and direction of nest predation rates suggest that nest predators change and vary over time heterogeneously, e.g. with predator density and abundance (Yanes and Suarez 1996, Borgmann et al. 2013), predator activity patterns (Schmidt et al. 2001), primary prey availability and distribution (Vickery et al. 1992) or availability of alternative prey (Borgmann et al. 2013). We propose that the unpredictability of the temporal variation makes it difficult for red-capped larks to use nest predation risk as a cue to time their breeding. Influence of monthly nest index on nest survival Daily nest survival increased, albeit weakly supported, when more larks in the population were nesting. This, together with the inverse relationship between daily nest survival and flying invertebrate food, suggests that nest predation was incidental, i.e. lark nest contents were a secondary prey encountered by predators searching for a different primary prey (Vickery et al. 1992, Schmidt et al. 2001). When nest predation is caused by a primary nest predator, the relationship between nest abundance and survival is typically inverse, as reported in most studies (Schmidt and Whelan 1999, Gunnarsson and Elmberg 2008, Elmberg et al. 2009, Sofaer et al. 2014, França et al. 2016). A pattern similar to ours was reported for ground-nesting birds whose main predator were striped skunks Mephitis mephitis that primarily target invertebrates (Vickery et al. 1992). Indeed, the primary food of bat-eared foxes and lesser kestrels, the main nest predators that we observed, are invertebrates, although their diet also includes other opportunistic prey, such as birds and eggs (Nel 1978, Anderson et al. 1999, Stuart et al. 2003, Klare et al. 2011).
Nest predation by incidental predators can be the major cause of nest failure and significantly decrease daily nest survival rates (Vickery et al. 1992, Yanes and Suarez 1996, Martínez-Padilla and Fargallo 2008). An alternative explanation for the positive relationship between daily nest survival rates and monthly nest index is that most birds start breeding when nest survival is high. We find this an unlikely explanation for year-round, opportunistically breeding birds such as our red-capped larks (Grant and Boag 1980, Ndithia et al. 2017b) because it requires that birds can accurately predict temporal variation of conditions influencing nest survival (Emmering and Schmidt 2011, Ibáñez-Álamo et al. 2015). Our interpretation that incidental nest predation may be the major cause of reduced nest survival in red-capped larks is also congruent with the negative relationship between daily survival rate and flying invertebrate biomass, the primary prey for the incidental nest predators. Influence of rain and invertebrate biomass on nest survival In contrast with our expectation that higher rainfall would increase invertebrate availability and thereby lead to higher nest survival (Illera and Díaz 2006), we found that increased rainfall decreased nest survival in red-capped larks. Moreover, we found that increased rain had a significantly negative effect on flying invertebrate biomass (F 1, 56 = 8.62, p = 0.005, Fig. 3),
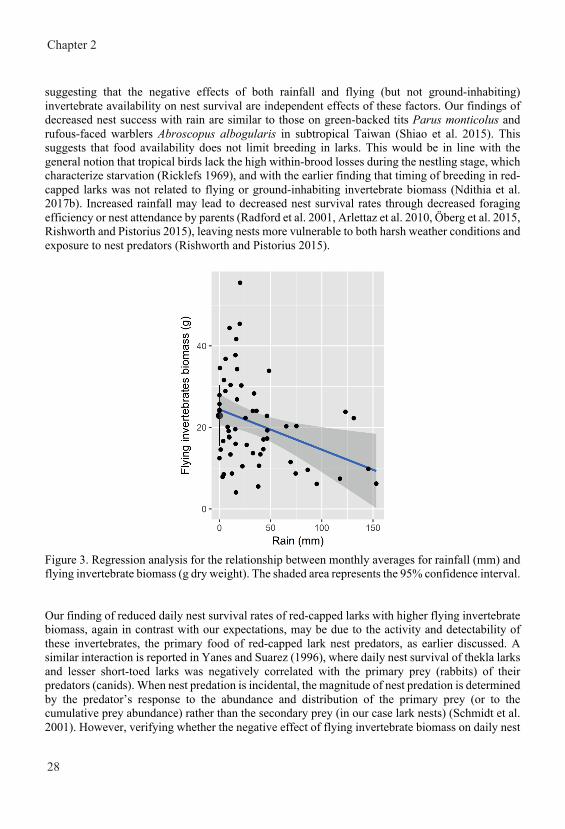
Chapter 2
28
suggesting that the negative effects of both rainfall and flying (but not ground-inhabiting) invertebrate availability on nest survival are independent effects of these factors. Our findings of decreased nest success with rain are similar to those on green-backed tits Parus monticolus and rufous-faced warblers Abroscopus albogularis in subtropical Taiwan (Shiao et al. 2015). This suggests that food availability does not limit breeding in larks. This would be in line with the general notion that tropical birds lack the high within-brood losses during the nestling stage, which characterize starvation (Ricklefs 1969), and with the earlier finding that timing of breeding in red-capped larks was not related to flying or ground-inhabiting invertebrate biomass (Ndithia et al. 2017b). Increased rainfall may lead to decreased nest survival rates through decreased foraging efficiency or nest attendance by parents (Radford et al. 2001, Arlettaz et al. 2010, Öberg et al. 2015, Rishworth and Pistorius 2015), leaving nests more vulnerable to both harsh weather conditions and exposure to nest predators (Rishworth and Pistorius 2015).
Figure 3. Regression analysis for the relationship between monthly averages for rainfall (mm) and flying invertebrate biomass (g dry weight). The shaded area represents the 95% confidence interval. Our finding of reduced daily nest survival rates of red-capped larks with higher flying invertebrate biomass, again in contrast with our expectations, may be due to the activity and detectability of these invertebrates, the primary food of red-capped lark nest predators, as earlier discussed. A similar interaction is reported in Yanes and Suarez (1996), where daily nest survival of thekla larks and lesser short-toed larks was negatively correlated with the primary prey (rabbits) of their predators (canids). When nest predation is incidental, the magnitude of nest predation is determined by the predator’s response to the abundance and distribution of the primary prey (or to the cumulative prey abundance) rather than the secondary prey (in our case lark nests) (Schmidt et al. 2001). However, verifying whether the negative effect of flying invertebrate biomass on daily nest
survival rate is due to higher nest predation by incidental predators would require a detailed study on the identity and behaviour of nest predators. Data Accessibility Data available from the Dryad Digital Repository: < http://dx.doi.org/10.5061/dryad.gd6555j > (Mwangi et al. 2018). Acknowledgements We would like to thank the management of Kedong for permission to conduct this research in the ranch. We are indebted to Peter Kinyanjui, Samuel Bakari, Paul Kimani, Abraham Mwangi, Mary Mwangi, Naomi Wanjiku, Ken Njuguna, Johana Kamau and Maaike Versteegh for the invaluable help in data collection. Sarah Higgins of Lake Naivasha Riparian Association provided accommodation and a base for logistics for the research team during the years of fieldwork. We also thank Esther Chang for comments on the manuscript. The National Museums of Kenya organized permission letters for access to the study area.
Funding – Funding for the study was provided by The Netherlands Fellowship Programme of Nuffic (grants no. CF9159/2013 to BIT and JMM, CF6833/2010 to BIT and HKN), the Netherlands Organization for Scientific Research (NWO-VIDI 864.10.012 to BIT), Lucie Burgers foundation (to JMM) and two grants from the Ecology fund of the Royal Netherlands Academy of Arts and Sciences (to JMM).
Nest survival in tropical Red-capped Larks
29
suggesting that the negative effects of both rainfall and flying (but not ground-inhabiting) invertebrate availability on nest survival are independent effects of these factors. Our findings of decreased nest success with rain are similar to those on green-backed tits Parus monticolus and rufous-faced warblers Abroscopus albogularis in subtropical Taiwan (Shiao et al. 2015). This suggests that food availability does not limit breeding in larks. This would be in line with the general notion that tropical birds lack the high within-brood losses during the nestling stage, which characterize starvation (Ricklefs 1969), and with the earlier finding that timing of breeding in red-capped larks was not related to flying or ground-inhabiting invertebrate biomass (Ndithia et al. 2017b). Increased rainfall may lead to decreased nest survival rates through decreased foraging efficiency or nest attendance by parents (Radford et al. 2001, Arlettaz et al. 2010, Öberg et al. 2015, Rishworth and Pistorius 2015), leaving nests more vulnerable to both harsh weather conditions and exposure to nest predators (Rishworth and Pistorius 2015).
Figure 3. Regression analysis for the relationship between monthly averages for rainfall (mm) and flying invertebrate biomass (g dry weight). The shaded area represents the 95% confidence interval. Our finding of reduced daily nest survival rates of red-capped larks with higher flying invertebrate biomass, again in contrast with our expectations, may be due to the activity and detectability of these invertebrates, the primary food of red-capped lark nest predators, as earlier discussed. A similar interaction is reported in Yanes and Suarez (1996), where daily nest survival of thekla larks and lesser short-toed larks was negatively correlated with the primary prey (rabbits) of their predators (canids). When nest predation is incidental, the magnitude of nest predation is determined by the predator’s response to the abundance and distribution of the primary prey (or to the cumulative prey abundance) rather than the secondary prey (in our case lark nests) (Schmidt et al. 2001). However, verifying whether the negative effect of flying invertebrate biomass on daily nest
survival rate is due to higher nest predation by incidental predators would require a detailed study on the identity and behaviour of nest predators. Data Accessibility Data available from the Dryad Digital Repository: < http://dx.doi.org/10.5061/dryad.gd6555j > (Mwangi et al. 2018). Acknowledgements We would like to thank the management of Kedong for permission to conduct this research in the ranch. We are indebted to Peter Kinyanjui, Samuel Bakari, Paul Kimani, Abraham Mwangi, Mary Mwangi, Naomi Wanjiku, Ken Njuguna, Johana Kamau and Maaike Versteegh for the invaluable help in data collection. Sarah Higgins of Lake Naivasha Riparian Association provided accommodation and a base for logistics for the research team during the years of fieldwork. We also thank Esther Chang for comments on the manuscript. The National Museums of Kenya organized permission letters for access to the study area.
Funding – Funding for the study was provided by The Netherlands Fellowship Programme of Nuffic (grants no. CF9159/2013 to BIT and JMM, CF6833/2010 to BIT and HKN), the Netherlands Organization for Scientific Research (NWO-VIDI 864.10.012 to BIT), Lucie Burgers foundation (to JMM) and two grants from the Ecology fund of the Royal Netherlands Academy of Arts and Sciences (to JMM).
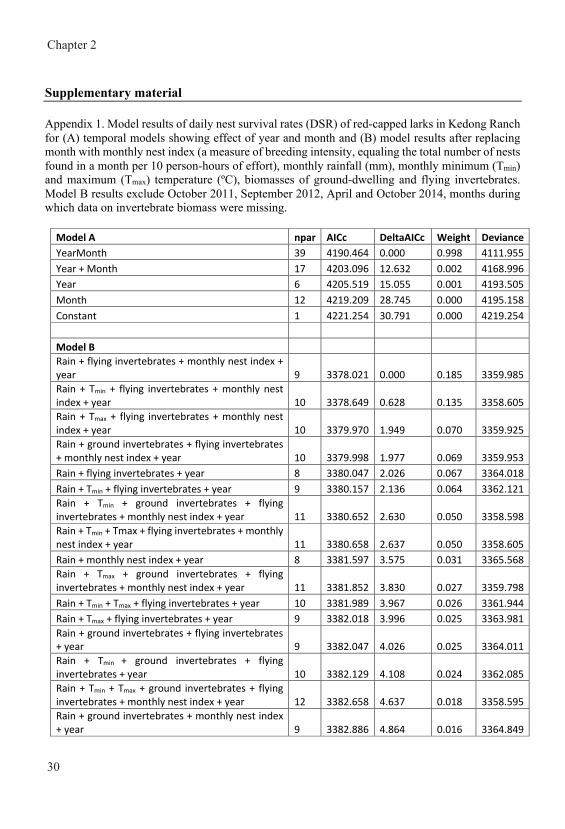
Chapter 2
30
Supplementary material Appendix 1. Model results of daily nest survival rates (DSR) of red-capped larks in Kedong Ranch for (A) temporal models showing effect of year and month and (B) model results after replacing month with monthly nest index (a measure of breeding intensity, equaling the total number of nests found in a month per 10 person-hours of effort), monthly rainfall (mm), monthly minimum (Tmin) and maximum (Tmax) temperature (ºC), biomasses of ground-dwelling and flying invertebrates. Model B results exclude October 2011, September 2012, April and October 2014, months during which data on invertebrate biomass were missing.
Model A npar AICc DeltaAICc Weight Deviance YearMonth 39 4190.464 0.000 0.998 4111.955 Year + Month 17 4203.096 12.632 0.002 4168.996 Year 6 4205.519 15.055 0.001 4193.505 Month 12 4219.209 28.745 0.000 4195.158 Constant 1 4221.254 30.791 0.000 4219.254
Model B Rain + flying invertebrates + monthly nest index + year 9 3378.021 0.000 0.185 3359.985 Rain + Tmin + flying invertebrates + monthly nest index + year 10 3378.649 0.628 0.135 3358.605 Rain + Tmax + flying invertebrates + monthly nest index + year 10 3379.970 1.949 0.070 3359.925 Rain + ground invertebrates + flying invertebrates + monthly nest index + year 10 3379.998 1.977 0.069 3359.953 Rain + flying invertebrates + year 8 3380.047 2.026 0.067 3364.018 Rain + Tmin + flying invertebrates + year 9 3380.157 2.136 0.064 3362.121 Rain + Tmin + ground invertebrates + flying invertebrates + monthly nest index + year 11 3380.652 2.630 0.050 3358.598 Rain + Tmin + Tmax + flying invertebrates + monthly nest index + year 11 3380.658 2.637 0.050 3358.605 Rain + monthly nest index + year 8 3381.597 3.575 0.031 3365.568 Rain + Tmax + ground invertebrates + flying invertebrates + monthly nest index + year 11 3381.852 3.830 0.027 3359.798 Rain + Tmin + Tmax + flying invertebrates + year 10 3381.989 3.967 0.026 3361.944 Rain + Tmax + flying invertebrates + year 9 3382.018 3.996 0.025 3363.981 Rain + ground invertebrates + flying invertebrates + year 9 3382.047 4.026 0.025 3364.011 Rain + Tmin + ground invertebrates + flying invertebrates + year 10 3382.129 4.108 0.024 3362.085 Rain + Tmin + Tmax + ground invertebrates + flying invertebrates + monthly nest index + year 12 3382.658 4.637 0.018 3358.595 Rain + ground invertebrates + monthly nest index + year 9 3382.886 4.864 0.016 3364.849
Rain + Tmin + monthly nest index + year 9 3383.349 5.328 0.013 3365.313 Rain + Tmax + monthly nest index + year 9 3383.566 5.545 0.012 3365.530 Rain + year 7 3383.766 5.744 0.011 3369.743 Rain + Tmin + Tmax + ground invertebrates + flying invertebrates + year 11 3383.786 5.765 0.010 3361.733 Rain + Tmax + ground invertebrates + flying invertebrates + year 10 3383.986 5.964 0.009 3363.941 Rain + Tmin + ground invertebrates + monthly nest index + year 10 3384.724 6.703 0.007 3364.680 Rain + Tmax + ground invertebrates + monthly nest index + year 10 3384.796 6.775 0.006 3364.751 Rain + Tmin + Tmax + monthly nest index + year 10 3385.354 7.333 0.005 3365.309 Tmax + Rain + year 8 3385.361 7.339 0.005 3369.331 Tmin + flying invertebrates + year 8 3385.363 7.341 0.005 3369.333 Rain + ground invertebrates + year 8 3385.411 7.390 0.005 3369.382 Tmin + Rain + year 8 3385.622 7.601 0.004 3369.593 Tmin + flying invertebrates + monthly nest index + year 9 3385.719 7.698 0.004 3367.683 Rain + Tmin + Tmax + ground invertebrates + monthly nest index + year 11 3386.543 8.522 0.003 3364.489 Tmin + ground invertebrates + flying invertebrates + year 9 3386.991 8.970 0.002 3368.954 Tmin + Tmax + flying invertebrates + year 9 3387.157 9.136 0.002 3369.121 Rain + Tmax + ground invertebrates + year 9 3387.263 9.242 0.002 3369.226 Tmin + Tmax + Rain + year 9 3387.314 9.292 0.002 3369.277 Rain + Tmin + ground invertebrates + year 9 3387.316 9.295 0.002 3369.280 Tmin + ground invertebrates + flying invertebrates + monthly nest index + year 10 3387.508 9.486 0.002 3367.463 Tmin + Tmax + flying invertebrates + monthly nest index + year 10 3387.691 9.670 0.002 3367.646 Tmin + Tmax + ground invertebrates + flying invertebrates + year 10 3388.247 10.226 0.001 3368.202 flying invertebrates + year 7 3388.618 10.596 0.001 3374.595 flying invertebrates + monthly nest index + year 8 3388.806 10.785 0.001 3372.777 Rain + Tmin + Tmax + ground invertebrates + year 10 3389.215 11.194 0.001 3369.171 Tmin + Tmax + ground invertebrates + flying invertebrates + monthly nest index + year 11 3389.254 11.232 0.001 3367.200 monthly nest index + year 7 3389.285 11.263 0.001 3375.262 ground invertebrates + flying invertebrates + year 8 3390.358 12.337 0.000 3374.329 Tmax + flying invertebrates + year 8 3390.612 12.591 0.000 3374.583 ground invertebrates + flying invertebrates + monthly nest index + year 9 3390.675 12.653 0.000 3372.638 Tmax + flying invertebrates + monthly nest index + year 9 3390.776 12.754 0.000 3372.739
Nest survival in tropical Red-capped Larks
31
Supplementary material Appendix 1. Model results of daily nest survival rates (DSR) of red-capped larks in Kedong Ranch for (A) temporal models showing effect of year and month and (B) model results after replacing month with monthly nest index (a measure of breeding intensity, equaling the total number of nests found in a month per 10 person-hours of effort), monthly rainfall (mm), monthly minimum (Tmin) and maximum (Tmax) temperature (ºC), biomasses of ground-dwelling and flying invertebrates. Model B results exclude October 2011, September 2012, April and October 2014, months during which data on invertebrate biomass were missing.
Model A npar AICc DeltaAICc Weight Deviance YearMonth 39 4190.464 0.000 0.998 4111.955 Year + Month 17 4203.096 12.632 0.002 4168.996 Year 6 4205.519 15.055 0.001 4193.505 Month 12 4219.209 28.745 0.000 4195.158 Constant 1 4221.254 30.791 0.000 4219.254
Model B Rain + flying invertebrates + monthly nest index + year 9 3378.021 0.000 0.185 3359.985 Rain + Tmin + flying invertebrates + monthly nest index + year 10 3378.649 0.628 0.135 3358.605 Rain + Tmax + flying invertebrates + monthly nest index + year 10 3379.970 1.949 0.070 3359.925 Rain + ground invertebrates + flying invertebrates + monthly nest index + year 10 3379.998 1.977 0.069 3359.953 Rain + flying invertebrates + year 8 3380.047 2.026 0.067 3364.018 Rain + Tmin + flying invertebrates + year 9 3380.157 2.136 0.064 3362.121 Rain + Tmin + ground invertebrates + flying invertebrates + monthly nest index + year 11 3380.652 2.630 0.050 3358.598 Rain + Tmin + Tmax + flying invertebrates + monthly nest index + year 11 3380.658 2.637 0.050 3358.605 Rain + monthly nest index + year 8 3381.597 3.575 0.031 3365.568 Rain + Tmax + ground invertebrates + flying invertebrates + monthly nest index + year 11 3381.852 3.830 0.027 3359.798 Rain + Tmin + Tmax + flying invertebrates + year 10 3381.989 3.967 0.026 3361.944 Rain + Tmax + flying invertebrates + year 9 3382.018 3.996 0.025 3363.981 Rain + ground invertebrates + flying invertebrates + year 9 3382.047 4.026 0.025 3364.011 Rain + Tmin + ground invertebrates + flying invertebrates + year 10 3382.129 4.108 0.024 3362.085 Rain + Tmin + Tmax + ground invertebrates + flying invertebrates + monthly nest index + year 12 3382.658 4.637 0.018 3358.595 Rain + ground invertebrates + monthly nest index + year 9 3382.886 4.864 0.016 3364.849
Rain + Tmin + monthly nest index + year 9 3383.349 5.328 0.013 3365.313 Rain + Tmax + monthly nest index + year 9 3383.566 5.545 0.012 3365.530 Rain + year 7 3383.766 5.744 0.011 3369.743 Rain + Tmin + Tmax + ground invertebrates + flying invertebrates + year 11 3383.786 5.765 0.010 3361.733 Rain + Tmax + ground invertebrates + flying invertebrates + year 10 3383.986 5.964 0.009 3363.941 Rain + Tmin + ground invertebrates + monthly nest index + year 10 3384.724 6.703 0.007 3364.680 Rain + Tmax + ground invertebrates + monthly nest index + year 10 3384.796 6.775 0.006 3364.751 Rain + Tmin + Tmax + monthly nest index + year 10 3385.354 7.333 0.005 3365.309 Tmax + Rain + year 8 3385.361 7.339 0.005 3369.331 Tmin + flying invertebrates + year 8 3385.363 7.341 0.005 3369.333 Rain + ground invertebrates + year 8 3385.411 7.390 0.005 3369.382 Tmin + Rain + year 8 3385.622 7.601 0.004 3369.593 Tmin + flying invertebrates + monthly nest index + year 9 3385.719 7.698 0.004 3367.683 Rain + Tmin + Tmax + ground invertebrates + monthly nest index + year 11 3386.543 8.522 0.003 3364.489 Tmin + ground invertebrates + flying invertebrates + year 9 3386.991 8.970 0.002 3368.954 Tmin + Tmax + flying invertebrates + year 9 3387.157 9.136 0.002 3369.121 Rain + Tmax + ground invertebrates + year 9 3387.263 9.242 0.002 3369.226 Tmin + Tmax + Rain + year 9 3387.314 9.292 0.002 3369.277 Rain + Tmin + ground invertebrates + year 9 3387.316 9.295 0.002 3369.280 Tmin + ground invertebrates + flying invertebrates + monthly nest index + year 10 3387.508 9.486 0.002 3367.463 Tmin + Tmax + flying invertebrates + monthly nest index + year 10 3387.691 9.670 0.002 3367.646 Tmin + Tmax + ground invertebrates + flying invertebrates + year 10 3388.247 10.226 0.001 3368.202 flying invertebrates + year 7 3388.618 10.596 0.001 3374.595 flying invertebrates + monthly nest index + year 8 3388.806 10.785 0.001 3372.777 Rain + Tmin + Tmax + ground invertebrates + year 10 3389.215 11.194 0.001 3369.171 Tmin + Tmax + ground invertebrates + flying invertebrates + monthly nest index + year 11 3389.254 11.232 0.001 3367.200 monthly nest index + year 7 3389.285 11.263 0.001 3375.262 ground invertebrates + flying invertebrates + year 8 3390.358 12.337 0.000 3374.329 Tmax + flying invertebrates + year 8 3390.612 12.591 0.000 3374.583 ground invertebrates + flying invertebrates + monthly nest index + year 9 3390.675 12.653 0.000 3372.638 Tmax + flying invertebrates + monthly nest index + year 9 3390.776 12.754 0.000 3372.739
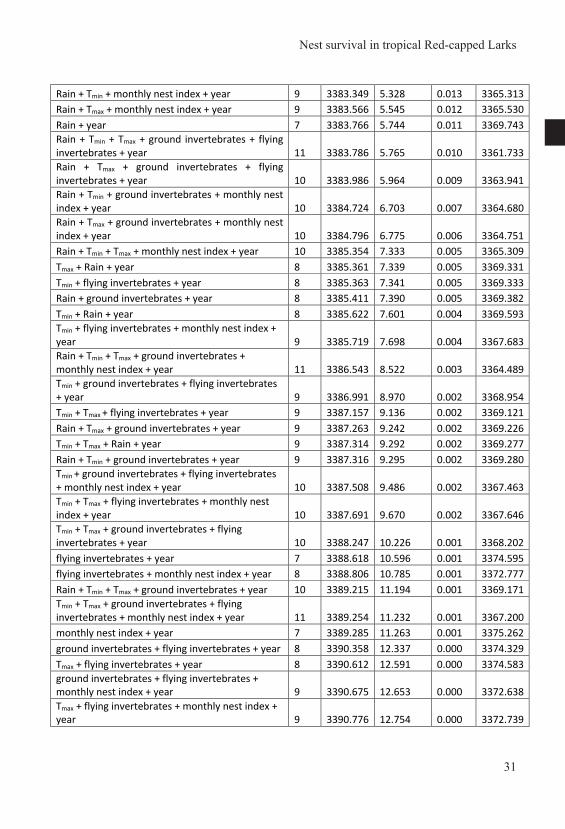
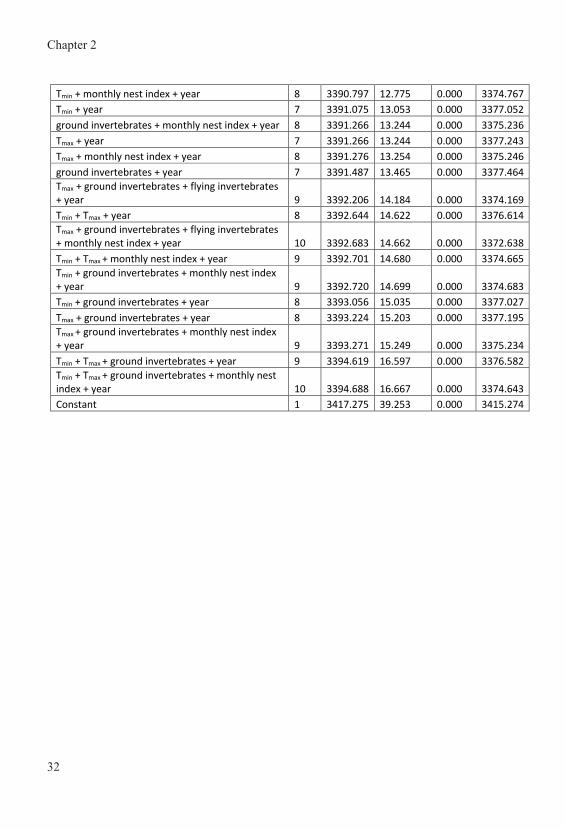
Chapter 2
32
Tmin + monthly nest index + year 8 3390.797 12.775 0.000 3374.767 Tmin + year 7 3391.075 13.053 0.000 3377.052 ground invertebrates + monthly nest index + year 8 3391.266 13.244 0.000 3375.236 Tmax + year 7 3391.266 13.244 0.000 3377.243 Tmax + monthly nest index + year 8 3391.276 13.254 0.000 3375.246 ground invertebrates + year 7 3391.487 13.465 0.000 3377.464 Tmax + ground invertebrates + flying invertebrates + year 9 3392.206 14.184 0.000 3374.169 Tmin + Tmax + year 8 3392.644 14.622 0.000 3376.614 Tmax + ground invertebrates + flying invertebrates + monthly nest index + year 10 3392.683 14.662 0.000 3372.638 Tmin + Tmax + monthly nest index + year 9 3392.701 14.680 0.000 3374.665 Tmin + ground invertebrates + monthly nest index + year 9 3392.720 14.699 0.000 3374.683 Tmin + ground invertebrates + year 8 3393.056 15.035 0.000 3377.027 Tmax + ground invertebrates + year 8 3393.224 15.203 0.000 3377.195 Tmax + ground invertebrates + monthly nest index + year 9 3393.271 15.249 0.000 3375.234 Tmin + Tmax + ground invertebrates + year 9 3394.619 16.597 0.000 3376.582 Tmin + Tmax + ground invertebrates + monthly nest index + year 10 3394.688 16.667 0.000 3374.643 Constant 1 3417.275 39.253 0.000 3415.274
Tmin + monthly nest index + year 8 3390.797 12.775 0.000 3374.767 Tmin + year 7 3391.075 13.053 0.000 3377.052 ground invertebrates + monthly nest index + year 8 3391.266 13.244 0.000 3375.236 Tmax + year 7 3391.266 13.244 0.000 3377.243 Tmax + monthly nest index + year 8 3391.276 13.254 0.000 3375.246 ground invertebrates + year 7 3391.487 13.465 0.000 3377.464 Tmax + ground invertebrates + flying invertebrates + year 9 3392.206 14.184 0.000 3374.169 Tmin + Tmax + year 8 3392.644 14.622 0.000 3376.614 Tmax + ground invertebrates + flying invertebrates + monthly nest index + year 10 3392.683 14.662 0.000 3372.638 Tmin + Tmax + monthly nest index + year 9 3392.701 14.680 0.000 3374.665 Tmin + ground invertebrates + monthly nest index + year 9 3392.720 14.699 0.000 3374.683 Tmin + ground invertebrates + year 8 3393.056 15.035 0.000 3377.027 Tmax + ground invertebrates + year 8 3393.224 15.203 0.000 3377.195 Tmax + ground invertebrates + monthly nest index + year 9 3393.271 15.249 0.000 3375.234 Tmin + Tmax + ground invertebrates + year 9 3394.619 16.597 0.000 3376.582 Tmin + Tmax + ground invertebrates + monthly nest index + year 10 3394.688 16.667 0.000 3374.643 Constant 1 3417.275 39.253 0.000 3415.274
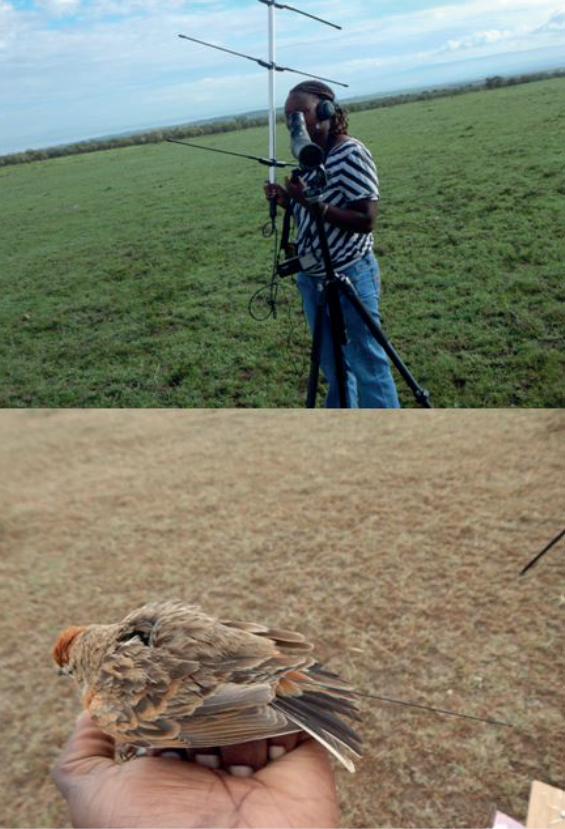
Chapter 3
Home ranges of tropical Red-capped Larks are influenced by breeding rather than vegetation, rainfall or invertebrate
availability
Joseph Mwangi
Raymond H. G. Klaassen
Muchane Muchai
B. Irene Tieleman
Ibis (In Press)
Chapter 3
Home ranges of tropical Red-capped Larks are influenced by breeding rather than vegetation, rainfall or invertebrate
availability
Joseph Mwangi
Raymond H. G. Klaassen
Muchane Muchai
B. Irene Tieleman
Ibis (In Press)
Chapter 3
Home ranges of tropical Red-capped Larks are influenced by breeding rather than vegetation, rainfall or invertebrate
availability
Joseph Mwangi
Raymond H. G. Klaassen
Muchane Muchai
B. Irene Tieleman
Ibis (In Press)
Chapter 3
Home ranges of tropical Red-capped Larks are influenced by breeding rather than vegetation, rainfall or invertebrate
availability
Joseph Mwangi
Raymond H. G. Klaassen
Muchane Muchai
B. Irene Tieleman
Ibis (In Press)
Chapter 3
36
Home range studies have received considerable attention from ecologists, but are greatly skewed towards the north temperate areas. Tropical areas offer an ideal setting to tease apart hypotheses about weather, food availability and social interactions as important factors influencing home range. In this study, we investigated home range and movement patterns of the tropical Red-capped Lark Callandrella cineria, a year-round breeding bird with a dynamic social structure. We tracked 56 individuals using radio transmitters and color-ring readings over a 23-month period. Our objective was to understand year-round variation in home range size in the context of the highly aseasonal and unpredictable variation in weather and resources, typical of many equatorial habitats, in addition to the birds’ changing social structure and year round breeding. The mean composite monthly home range of Red-capped Larks was 58.0 ha, and the mean individual home range size was 19.9 ha, but this varied considerably between individuals. The total number of nests found per month (breeding intensity) best predicted home range size of non-breeding birds, and of breeding and non-breeding birds combined. We show for the first time that breeding intensity decreases the home range size of non-breeding individuals. Our study also underlines the relevance of conducting more studies in aseasonal tropical areas in order to disentangle effects of weather, food availability and breeding that vary in parallel, peaking simultaneously in most seasonal areas.
Introduction
In many animals, survival and reproduction depend on the general habitat type and the specific resources available within an individual’s home range (Odum & Kuenzler 1955, Germain et al. 2015). Understanding factors influencing home range size therefore provides insights into a species’ ecology (Ofstad et al. 2016). The availability of structural and functional resources such as nest sites and food availability can change with time, for example over months, seasons or years (Wiebe & Gow 2013). The home range is therefore not static, but likewise varies over time (Takano & Haig 2004). Additionally to varying with time, habitats are spatially heterogeneous, and within an individual’s home range different areas may be suitable for different life cycle events (Orians & Wittenberger 1991). Movement decisions within the home range and intensity of utilization of the different areas are therefore important factors in influencing performance (Fuller & Harrison 2010).
Home range size, and intensity of utilization of the different areas within a home range, depend on environmental factors such as weather conditions and food resources (Rolando 1998), but also on life cycle and social factors such as breeding (Börger et al. 2006, Saïd et al. 2009, Holland et al. 2017). Weather patterns determine the need for shelter and the accessibility of food resources (Tieleman & Williams 2000). In most organisms, home range size is inversely related to the abundance of food (Margalida et al. 2016). In many habitats, food availability, abundance and distribution change under the influence of weather and season. In response to such change, organisms may either remain within the same home ranges, increase or decrease home range size, or completely move to different home ranges. How individuals respond to habitat heterogeneity within the home range and/or spatial and temporal resource change will also depend on their reproductive status (Anich et al. 2010), sex (Holland et al. 2017), and social organization (Margalida et al. 2016). Birds have been shown to increase home range size from non-breeding to breeding periods due to putative higher nutritional demands of the breeding season, while at the same time during breeding periods movement is often limited and central to location of nests (van Beest et al. 2011). Birds also change social organization through fission-fusion dynamics where large groups break into smaller groups or vice versa to adjust their socio-spatial structure to changing environmental conditions and resource availability (Griesser et al. 2009, Silk et al. 2014). To prepare for breeding, birds can also change their social organization from flocks to pairs, or engage in territorial defense which excludes non-breeding individuals to access some areas. However, in a system with year round breeding, how the number of breeding birds in a population affects the home ranges of breeding and non-breeding individuals where both statuses frequently co-occur is currently unknown.
Studies investigating home range in birds have primarily been conducted on temperate zone birds, with only a few exceptions focusing on tropical birds, especially afro-tropical residents (Baldwin et al. 2010). The strong ‘temperate zone bias’ may lead to biased interpretations of the causes and correlates of home range variation, as birds in the tropics and temperate regions experience very different conditions. In addition, interpretation of variation in home range size is hampered by fact that animals breed when resources are plentiful in temperate zones, thus it is difficult to tease the different effects apart. Even fewer studies have quantified home range sizes of resident non-migratory species at small temporal scales (e.g. monthly) and over longer time periods such as years (Tsao et al. 2009). With the majority of home range and movement studies focusing on temperate zone environments where annual and seasonal changes of weather and associated resources are predictable, unpredictable low latitude environments remain understudied.
AB
STR
AC
T Home range of Tropical Red-capped Larks
37
Home range studies have received considerable attention from ecologists, but are greatly skewed towards the north temperate areas. Tropical areas offer an ideal setting to tease apart hypotheses about weather, food availability and social interactions as important factors influencing home range. In this study, we investigated home range and movement patterns of the tropical Red-capped Lark Callandrella cineria, a year-round breeding bird with a dynamic social structure. We tracked 56 individuals using radio transmitters and color-ring readings over a 23-month period. Our objective was to understand year-round variation in home range size in the context of the highly aseasonal and unpredictable variation in weather and resources, typical of many equatorial habitats, in addition to the birds’ changing social structure and year round breeding. The mean composite monthly home range of Red-capped Larks was 58.0 ha, and the mean individual home range size was 19.9 ha, but this varied considerably between individuals. The total number of nests found per month (breeding intensity) best predicted home range size of non-breeding birds, and of breeding and non-breeding birds combined. We show for the first time that breeding intensity decreases the home range size of non-breeding individuals. Our study also underlines the relevance of conducting more studies in aseasonal tropical areas in order to disentangle effects of weather, food availability and breeding that vary in parallel, peaking simultaneously in most seasonal areas.
Introduction
In many animals, survival and reproduction depend on the general habitat type and the specific resources available within an individual’s home range (Odum & Kuenzler 1955, Germain et al. 2015). Understanding factors influencing home range size therefore provides insights into a species’ ecology (Ofstad et al. 2016). The availability of structural and functional resources such as nest sites and food availability can change with time, for example over months, seasons or years (Wiebe & Gow 2013). The home range is therefore not static, but likewise varies over time (Takano & Haig 2004). Additionally to varying with time, habitats are spatially heterogeneous, and within an individual’s home range different areas may be suitable for different life cycle events (Orians & Wittenberger 1991). Movement decisions within the home range and intensity of utilization of the different areas are therefore important factors in influencing performance (Fuller & Harrison 2010).
Home range size, and intensity of utilization of the different areas within a home range, depend on environmental factors such as weather conditions and food resources (Rolando 1998), but also on life cycle and social factors such as breeding (Börger et al. 2006, Saïd et al. 2009, Holland et al. 2017). Weather patterns determine the need for shelter and the accessibility of food resources (Tieleman & Williams 2000). In most organisms, home range size is inversely related to the abundance of food (Margalida et al. 2016). In many habitats, food availability, abundance and distribution change under the influence of weather and season. In response to such change, organisms may either remain within the same home ranges, increase or decrease home range size, or completely move to different home ranges. How individuals respond to habitat heterogeneity within the home range and/or spatial and temporal resource change will also depend on their reproductive status (Anich et al. 2010), sex (Holland et al. 2017), and social organization (Margalida et al. 2016). Birds have been shown to increase home range size from non-breeding to breeding periods due to putative higher nutritional demands of the breeding season, while at the same time during breeding periods movement is often limited and central to location of nests (van Beest et al. 2011). Birds also change social organization through fission-fusion dynamics where large groups break into smaller groups or vice versa to adjust their socio-spatial structure to changing environmental conditions and resource availability (Griesser et al. 2009, Silk et al. 2014). To prepare for breeding, birds can also change their social organization from flocks to pairs, or engage in territorial defense which excludes non-breeding individuals to access some areas. However, in a system with year round breeding, how the number of breeding birds in a population affects the home ranges of breeding and non-breeding individuals where both statuses frequently co-occur is currently unknown.
Studies investigating home range in birds have primarily been conducted on temperate zone birds, with only a few exceptions focusing on tropical birds, especially afro-tropical residents (Baldwin et al. 2010). The strong ‘temperate zone bias’ may lead to biased interpretations of the causes and correlates of home range variation, as birds in the tropics and temperate regions experience very different conditions. In addition, interpretation of variation in home range size is hampered by fact that animals breed when resources are plentiful in temperate zones, thus it is difficult to tease the different effects apart. Even fewer studies have quantified home range sizes of resident non-migratory species at small temporal scales (e.g. monthly) and over longer time periods such as years (Tsao et al. 2009). With the majority of home range and movement studies focusing on temperate zone environments where annual and seasonal changes of weather and associated resources are predictable, unpredictable low latitude environments remain understudied.
Chapter 3
36
Home range studies have received considerable attention from ecologists, but are greatly skewed towards the north temperate areas. Tropical areas offer an ideal setting to tease apart hypotheses about weather, food availability and social interactions as important factors influencing home range. In this study, we investigated home range and movement patterns of the tropical Red-capped Lark Callandrella cineria, a year-round breeding bird with a dynamic social structure. We tracked 56 individuals using radio transmitters and color-ring readings over a 23-month period. Our objective was to understand year-round variation in home range size in the context of the highly aseasonal and unpredictable variation in weather and resources, typical of many equatorial habitats, in addition to the birds’ changing social structure and year round breeding. The mean composite monthly home range of Red-capped Larks was 58.0 ha, and the mean individual home range size was 19.9 ha, but this varied considerably between individuals. The total number of nests found per month (breeding intensity) best predicted home range size of non-breeding birds, and of breeding and non-breeding birds combined. We show for the first time that breeding intensity decreases the home range size of non-breeding individuals. Our study also underlines the relevance of conducting more studies in aseasonal tropical areas in order to disentangle effects of weather, food availability and breeding that vary in parallel, peaking simultaneously in most seasonal areas.
Introduction
In many animals, survival and reproduction depend on the general habitat type and the specific resources available within an individual’s home range (Odum & Kuenzler 1955, Germain et al. 2015). Understanding factors influencing home range size therefore provides insights into a species’ ecology (Ofstad et al. 2016). The availability of structural and functional resources such as nest sites and food availability can change with time, for example over months, seasons or years (Wiebe & Gow 2013). The home range is therefore not static, but likewise varies over time (Takano & Haig 2004). Additionally to varying with time, habitats are spatially heterogeneous, and within an individual’s home range different areas may be suitable for different life cycle events (Orians & Wittenberger 1991). Movement decisions within the home range and intensity of utilization of the different areas are therefore important factors in influencing performance (Fuller & Harrison 2010).
Home range size, and intensity of utilization of the different areas within a home range, depend on environmental factors such as weather conditions and food resources (Rolando 1998), but also on life cycle and social factors such as breeding (Börger et al. 2006, Saïd et al. 2009, Holland et al. 2017). Weather patterns determine the need for shelter and the accessibility of food resources (Tieleman & Williams 2000). In most organisms, home range size is inversely related to the abundance of food (Margalida et al. 2016). In many habitats, food availability, abundance and distribution change under the influence of weather and season. In response to such change, organisms may either remain within the same home ranges, increase or decrease home range size, or completely move to different home ranges. How individuals respond to habitat heterogeneity within the home range and/or spatial and temporal resource change will also depend on their reproductive status (Anich et al. 2010), sex (Holland et al. 2017), and social organization (Margalida et al. 2016). Birds have been shown to increase home range size from non-breeding to breeding periods due to putative higher nutritional demands of the breeding season, while at the same time during breeding periods movement is often limited and central to location of nests (van Beest et al. 2011). Birds also change social organization through fission-fusion dynamics where large groups break into smaller groups or vice versa to adjust their socio-spatial structure to changing environmental conditions and resource availability (Griesser et al. 2009, Silk et al. 2014). To prepare for breeding, birds can also change their social organization from flocks to pairs, or engage in territorial defense which excludes non-breeding individuals to access some areas. However, in a system with year round breeding, how the number of breeding birds in a population affects the home ranges of breeding and non-breeding individuals where both statuses frequently co-occur is currently unknown.
Studies investigating home range in birds have primarily been conducted on temperate zone birds, with only a few exceptions focusing on tropical birds, especially afro-tropical residents (Baldwin et al. 2010). The strong ‘temperate zone bias’ may lead to biased interpretations of the causes and correlates of home range variation, as birds in the tropics and temperate regions experience very different conditions. In addition, interpretation of variation in home range size is hampered by fact that animals breed when resources are plentiful in temperate zones, thus it is difficult to tease the different effects apart. Even fewer studies have quantified home range sizes of resident non-migratory species at small temporal scales (e.g. monthly) and over longer time periods such as years (Tsao et al. 2009). With the majority of home range and movement studies focusing on temperate zone environments where annual and seasonal changes of weather and associated resources are predictable, unpredictable low latitude environments remain understudied.
AB
STR
AC
T
Home range of Tropical Red-capped Larks
37
Home range studies have received considerable attention from ecologists, but are greatly skewed towards the north temperate areas. Tropical areas offer an ideal setting to tease apart hypotheses about weather, food availability and social interactions as important factors influencing home range. In this study, we investigated home range and movement patterns of the tropical Red-capped Lark Callandrella cineria, a year-round breeding bird with a dynamic social structure. We tracked 56 individuals using radio transmitters and color-ring readings over a 23-month period. Our objective was to understand year-round variation in home range size in the context of the highly aseasonal and unpredictable variation in weather and resources, typical of many equatorial habitats, in addition to the birds’ changing social structure and year round breeding. The mean composite monthly home range of Red-capped Larks was 58.0 ha, and the mean individual home range size was 19.9 ha, but this varied considerably between individuals. The total number of nests found per month (breeding intensity) best predicted home range size of non-breeding birds, and of breeding and non-breeding birds combined. We show for the first time that breeding intensity decreases the home range size of non-breeding individuals. Our study also underlines the relevance of conducting more studies in aseasonal tropical areas in order to disentangle effects of weather, food availability and breeding that vary in parallel, peaking simultaneously in most seasonal areas.
Introduction
In many animals, survival and reproduction depend on the general habitat type and the specific resources available within an individual’s home range (Odum & Kuenzler 1955, Germain et al. 2015). Understanding factors influencing home range size therefore provides insights into a species’ ecology (Ofstad et al. 2016). The availability of structural and functional resources such as nest sites and food availability can change with time, for example over months, seasons or years (Wiebe & Gow 2013). The home range is therefore not static, but likewise varies over time (Takano & Haig 2004). Additionally to varying with time, habitats are spatially heterogeneous, and within an individual’s home range different areas may be suitable for different life cycle events (Orians & Wittenberger 1991). Movement decisions within the home range and intensity of utilization of the different areas are therefore important factors in influencing performance (Fuller & Harrison 2010).
Home range size, and intensity of utilization of the different areas within a home range, depend on environmental factors such as weather conditions and food resources (Rolando 1998), but also on life cycle and social factors such as breeding (Börger et al. 2006, Saïd et al. 2009, Holland et al. 2017). Weather patterns determine the need for shelter and the accessibility of food resources (Tieleman & Williams 2000). In most organisms, home range size is inversely related to the abundance of food (Margalida et al. 2016). In many habitats, food availability, abundance and distribution change under the influence of weather and season. In response to such change, organisms may either remain within the same home ranges, increase or decrease home range size, or completely move to different home ranges. How individuals respond to habitat heterogeneity within the home range and/or spatial and temporal resource change will also depend on their reproductive status (Anich et al. 2010), sex (Holland et al. 2017), and social organization (Margalida et al. 2016). Birds have been shown to increase home range size from non-breeding to breeding periods due to putative higher nutritional demands of the breeding season, while at the same time during breeding periods movement is often limited and central to location of nests (van Beest et al. 2011). Birds also change social organization through fission-fusion dynamics where large groups break into smaller groups or vice versa to adjust their socio-spatial structure to changing environmental conditions and resource availability (Griesser et al. 2009, Silk et al. 2014). To prepare for breeding, birds can also change their social organization from flocks to pairs, or engage in territorial defense which excludes non-breeding individuals to access some areas. However, in a system with year round breeding, how the number of breeding birds in a population affects the home ranges of breeding and non-breeding individuals where both statuses frequently co-occur is currently unknown.
Studies investigating home range in birds have primarily been conducted on temperate zone birds, with only a few exceptions focusing on tropical birds, especially afro-tropical residents (Baldwin et al. 2010). The strong ‘temperate zone bias’ may lead to biased interpretations of the causes and correlates of home range variation, as birds in the tropics and temperate regions experience very different conditions. In addition, interpretation of variation in home range size is hampered by fact that animals breed when resources are plentiful in temperate zones, thus it is difficult to tease the different effects apart. Even fewer studies have quantified home range sizes of resident non-migratory species at small temporal scales (e.g. monthly) and over longer time periods such as years (Tsao et al. 2009). With the majority of home range and movement studies focusing on temperate zone environments where annual and seasonal changes of weather and associated resources are predictable, unpredictable low latitude environments remain understudied.
Chapter 3
38
Yet, unpredictable weather patterns and resource availability observed in the tropics coupled with a diversity of life history strategies, even within a population, make the tropics ideal for the study of the drivers of animal-movement patterns. In addition, studying home range variation at smaller scales can be relevant for conservation, especially in heterogeneous landscapes where habitat specialists might be confined to very specific habitats (Bevanda et al. 2015).
Red-capped Larks are small gregarious birds found in short-grass and bare-ground habitats widely distributed across Africa (Zimmerman et al. 2005). They feed on a variety of insects and seeds (Ndithia et al. 2017a, Mwangi et al. 2018). Tropical populations of Red-capped Larks Calandrella cinerea, with year round breeding at the population level and frequent co-occurrence of breeding and non-breeding individuals (Ndithia et al. 2017a, b), provide an ideal study system to tease apart effects of breeding intensity, weather and food availability on home range. Breeding year-round conveys the advantage of comparing the home range of birds under an energetically expensive life history stage of breeding with non-breeding birds experiencing the same environmental conditions. Likewise, abundance of invertebrates, the main food for Red-capped Larks, is unpredictable and not linked to weather patterns (Ndithia et al. 2017b, Mwangi et al. 2018, Mwangi, J., Ndithia, H. K., Versteegh, M. A., Muchai, M., Tieleman, B. I. Unpublished data), while neither weather patterns nor food availability explains timing of breeding (Ndithia et
al. 2017a). The Red-capped Lark’s shift in social structure, congregating in mixed sex flocks when not breeding (fusion) and splitting up into pairs during breeding (fission; Ndithia et al. 2017a, Mwangi et al. 2018), suggests that changes in habitat use are an essential component of its life history. Studying their home range and movement patterns over multiple years can provide insights into their habitat needs during different life cycle stages, independent of the time of the year.
In this study we investigated home range sizes of resident equatorial Red-capped Larks during a 23 month period (August 2014 - June 2016). We explored how month-to-month variation in home range sizes were associated with variation in weather, food availability and breeding intensity, based on the entire data set, and based on non-breeding birds only. We also compared, at the individual level, the home range sizes of non-breeding and breeding individuals. At the population level, we predicted that home range sizes: 1) would be negatively correlated with monthly rainfall due to its favorable effect on food availability, and likewise negatively correlated with EVI and invertebrate abundance as proxies for food availability; and, 2) would decrease at the population level when more birds were breeding and hence be confined to the nest. When restricting these analyses to the non-breeders only, we expected no association between home range and breeding intensity. Finally, we predicted sex differences in home range due to different roles, especially during breeding, when males are predicted to be more active in defending their nesting areas than females (pers. obs. J. Mwangi).
Methods Study area and study species We studied Red-capped Larks in Kedong Ranch, Naivasha, Kenya (S 00° 53.04ʹ, E 036° 24.51ʹ, 1890 m above sea level). Our study area, Kedong Ranch, is a privately-owned ranch with extensively grazed grasslands, sandwiched between Mt Longonot and Hell’s Gate National Parks on the floor of the Rift Valley escarpment.
Bird capture and tracking During the period March 2014 – June 2016, we captured 620 Red-capped Larks using mists nets and we ringed each bird with a numbered aluminium metal ring, in addition to a unique combination of three UV resistant colour bands (Appendix 1). We monitored movement patterns throughout the study area to record bird locations six days a week. Between the period May 2015 - March 2016, we also tagged 50 birds with VHF frequency radio transmitters, each transmitting at a unique frequency and with a battery life of six months (JDJC Corp, 3205 GREENWOOD DR, DEWEY, Illinois, USA) to allow more detailed tracking. Transmitters weighed 0.9 g, which was on average 3.7 % ± 0.3 sd (range 2.5-4.4%, n = 46) of the bird's mass (mean 24.0 g ± 1.7 sd, n = 695). We fitted the transmitters using a backpack loop (Pimentel & Hansbauer 2013). We tracked radio-marked birds by homing on foot using handheld radio receivers (SIKA Radio Tracking Receiver, Biotrack limited, Wareham, United Kingdom) attached to a 3-element flexible antenna (Yagi 173 MHz, Biotrack limited, Wareham, United Kingdom). We approached slowly when the signal indicated that the bird was close (≤ 30 m). When the signal was above 95% (≤ 15 m) we detected the bird visually with binoculars and telescope, and recorded the location with a GPS (Garmin, Kansas, United States). We searched for birds 6 days a week for 8 hours per day, targeting a minimum of one fix per bird per week. For birds for which we did not receive a signal, we searched the immediate areas (10 km by 10 km grid) around the study site once a week using a car-mounted receiver (Appendix 1). Molecular sexing To determine the sex of our birds, we collected a small blood sample upon capture from the brachial wing vein in the field. The blood samples were then carried on ice and stored in a freezer until the lab analysis (see Ndithia et al. 2017b). We extracted DNA from red blood cells using an ammonium acetate method (Richardson et al. 2001), and determined sex following Van der Velde et al. (2017). Weather, EVI, invertebrates and breeding intensity We recorded rainfall and temperature using weather stations (2011-2014, Alecto WS-3500, Den Bosch, the Netherlands; 2014-2016, Vantage Vue, Davis, the Netherlands) located within the study site. To measure vegetation change, we used the Enhanced Vegetation Index (EVI), which has been shown to be more accurate than Normalized Difference Vegetation Index (NDVI) as the latter does not correct for the variations in solar angle (Matsushita et al. 2007). We downloaded MODIS EVI 16-day composite grid data (MOD13Q1 tile h21v09) for the entire study site in HDF format from August 2014 to June 2016 (45 composite periods) from the USGS Earth explorer. For each composite period, we extracted the EVI and reprojected the images in the WGS84 projection. We then cleaned the raw EVI data stack using the quality data stack to generate a clean EVI raster layer (Hijmans 2016). We extracted time series EVI data by clipping the study area and taking the EVI of evenly spaced coordinate points separated by double the ground pixel size of the EVI MODIS satellite to avoid taking values from the same quadrant. We calculated the mean monthly EVI value for each month by averaging all EVI time series values falling within the month.
We measured ground invertebrate biomass using pitfalls, and flying invertebrate biomass using sweep nets once a month (Ndithia et al. 2017a, Mwangi et al. 2018). We recorded ground and flying invertebrates in all months with the exception of December and October 2015, due to tampering of the pitfall traps by local herders. Briefly, we used four transects subjectively selected as representative of vegetation within the study area with five plastic cups each, inserted in the ground and half filled with formaldehyde to preserve invertebrates, which we then harvested after five days in the field. We also walked along the transects with a sweep net on the day we collected
Home range of Tropical Red-capped Larks
39
Yet, unpredictable weather patterns and resource availability observed in the tropics coupled with a diversity of life history strategies, even within a population, make the tropics ideal for the study of the drivers of animal-movement patterns. In addition, studying home range variation at smaller scales can be relevant for conservation, especially in heterogeneous landscapes where habitat specialists might be confined to very specific habitats (Bevanda et al. 2015).
Red-capped Larks are small gregarious birds found in short-grass and bare-ground habitats widely distributed across Africa (Zimmerman et al. 2005). They feed on a variety of insects and seeds (Ndithia et al. 2017a, Mwangi et al. 2018). Tropical populations of Red-capped Larks Calandrella cinerea, with year round breeding at the population level and frequent co-occurrence of breeding and non-breeding individuals (Ndithia et al. 2017a, b), provide an ideal study system to tease apart effects of breeding intensity, weather and food availability on home range. Breeding year-round conveys the advantage of comparing the home range of birds under an energetically expensive life history stage of breeding with non-breeding birds experiencing the same environmental conditions. Likewise, abundance of invertebrates, the main food for Red-capped Larks, is unpredictable and not linked to weather patterns (Ndithia et al. 2017b, Mwangi et al. 2018, Mwangi, J., Ndithia, H. K., Versteegh, M. A., Muchai, M., Tieleman, B. I. Unpublished data), while neither weather patterns nor food availability explains timing of breeding (Ndithia et
al. 2017a). The Red-capped Lark’s shift in social structure, congregating in mixed sex flocks when not breeding (fusion) and splitting up into pairs during breeding (fission; Ndithia et al. 2017a, Mwangi et al. 2018), suggests that changes in habitat use are an essential component of its life history. Studying their home range and movement patterns over multiple years can provide insights into their habitat needs during different life cycle stages, independent of the time of the year.
In this study we investigated home range sizes of resident equatorial Red-capped Larks during a 23 month period (August 2014 - June 2016). We explored how month-to-month variation in home range sizes were associated with variation in weather, food availability and breeding intensity, based on the entire data set, and based on non-breeding birds only. We also compared, at the individual level, the home range sizes of non-breeding and breeding individuals. At the population level, we predicted that home range sizes: 1) would be negatively correlated with monthly rainfall due to its favorable effect on food availability, and likewise negatively correlated with EVI and invertebrate abundance as proxies for food availability; and, 2) would decrease at the population level when more birds were breeding and hence be confined to the nest. When restricting these analyses to the non-breeders only, we expected no association between home range and breeding intensity. Finally, we predicted sex differences in home range due to different roles, especially during breeding, when males are predicted to be more active in defending their nesting areas than females (pers. obs. J. Mwangi).
Methods Study area and study species We studied Red-capped Larks in Kedong Ranch, Naivasha, Kenya (S 00° 53.04ʹ, E 036° 24.51ʹ, 1890 m above sea level). Our study area, Kedong Ranch, is a privately-owned ranch with extensively grazed grasslands, sandwiched between Mt Longonot and Hell’s Gate National Parks on the floor of the Rift Valley escarpment.
Bird capture and tracking During the period March 2014 – June 2016, we captured 620 Red-capped Larks using mists nets and we ringed each bird with a numbered aluminium metal ring, in addition to a unique combination of three UV resistant colour bands (Appendix 1). We monitored movement patterns throughout the study area to record bird locations six days a week. Between the period May 2015 - March 2016, we also tagged 50 birds with VHF frequency radio transmitters, each transmitting at a unique frequency and with a battery life of six months (JDJC Corp, 3205 GREENWOOD DR, DEWEY, Illinois, USA) to allow more detailed tracking. Transmitters weighed 0.9 g, which was on average 3.7 % ± 0.3 sd (range 2.5-4.4%, n = 46) of the bird's mass (mean 24.0 g ± 1.7 sd, n = 695). We fitted the transmitters using a backpack loop (Pimentel & Hansbauer 2013). We tracked radio-marked birds by homing on foot using handheld radio receivers (SIKA Radio Tracking Receiver, Biotrack limited, Wareham, United Kingdom) attached to a 3-element flexible antenna (Yagi 173 MHz, Biotrack limited, Wareham, United Kingdom). We approached slowly when the signal indicated that the bird was close (≤ 30 m). When the signal was above 95% (≤ 15 m) we detected the bird visually with binoculars and telescope, and recorded the location with a GPS (Garmin, Kansas, United States). We searched for birds 6 days a week for 8 hours per day, targeting a minimum of one fix per bird per week. For birds for which we did not receive a signal, we searched the immediate areas (10 km by 10 km grid) around the study site once a week using a car-mounted receiver (Appendix 1). Molecular sexing To determine the sex of our birds, we collected a small blood sample upon capture from the brachial wing vein in the field. The blood samples were then carried on ice and stored in a freezer until the lab analysis (see Ndithia et al. 2017b). We extracted DNA from red blood cells using an ammonium acetate method (Richardson et al. 2001), and determined sex following Van der Velde et al. (2017). Weather, EVI, invertebrates and breeding intensity We recorded rainfall and temperature using weather stations (2011-2014, Alecto WS-3500, Den Bosch, the Netherlands; 2014-2016, Vantage Vue, Davis, the Netherlands) located within the study site. To measure vegetation change, we used the Enhanced Vegetation Index (EVI), which has been shown to be more accurate than Normalized Difference Vegetation Index (NDVI) as the latter does not correct for the variations in solar angle (Matsushita et al. 2007). We downloaded MODIS EVI 16-day composite grid data (MOD13Q1 tile h21v09) for the entire study site in HDF format from August 2014 to June 2016 (45 composite periods) from the USGS Earth explorer. For each composite period, we extracted the EVI and reprojected the images in the WGS84 projection. We then cleaned the raw EVI data stack using the quality data stack to generate a clean EVI raster layer (Hijmans 2016). We extracted time series EVI data by clipping the study area and taking the EVI of evenly spaced coordinate points separated by double the ground pixel size of the EVI MODIS satellite to avoid taking values from the same quadrant. We calculated the mean monthly EVI value for each month by averaging all EVI time series values falling within the month.
We measured ground invertebrate biomass using pitfalls, and flying invertebrate biomass using sweep nets once a month (Ndithia et al. 2017a, Mwangi et al. 2018). We recorded ground and flying invertebrates in all months with the exception of December and October 2015, due to tampering of the pitfall traps by local herders. Briefly, we used four transects subjectively selected as representative of vegetation within the study area with five plastic cups each, inserted in the ground and half filled with formaldehyde to preserve invertebrates, which we then harvested after five days in the field. We also walked along the transects with a sweep net on the day we collected
Chapter 3
40
the contents of pitfalls. We then identified all contents, sorted them to taxonomic groups based on morphology and used a category-specific calibration curve relating dry mass as a function of length and width to estimate biomass (Ndithia et al. 2017a). We searched for nests, on average (± se), for 20 ± 1.0 days per month (range 7-31 days/month) and 245 ± 31.2 hours per month (range 17-825 hours/month) during the study period (Mwangi et al. 2018). To quantify breeding intensity, we calculated a monthly nest index, defined as the total number of nests found in a month per 10-person hours of search effort. We did this because our search effort varied over time, but the area searched for nests was constant during the entire study period (Ndithia et al. 2017a, 2017b, Mwangi et al. 2018).
Statistical analysis Nature of the data and approaches used in data analysis Our data set is robust as a result of continuous daily tracking of birds over a 23-month period. Following the assumption of a stochastic environment (Ndithia et al. 2017a,b, Mwangi et al. 2018), we measured all factors at a finer temporal resolution of the month compared to the coarser temporal scale of season used in most seasonal studies. In addition, individuals were tracked for long time periods (varying from 4 to 21 months), covering multiple breeding and non-breeding phases as well as repeated changes in social organization from group living to pair formation. However, the number of location fixes varied among individuals and among months, with often few fixes per individual per month (Appendix 1). Although breeding birds were well-represented, our data set was biased towards non-breeding birds (Appendix 2). This partly resulted from having to define the breeding period as the period during which an individual was attending its nest (nest building until fledging), a period lasting 24 days in this species (Mwangi et al. 2018). Following our sampling protocol as described earlier, we obtained too few positions per individual per week/month to warrant an analysis of home range size in relation to breeding stage at the individual level.
To explore home range sizes and their associations with weather, food availability and breeding, we combined two approaches and used two methods for estimation of home range size, the minimum convex polygon (MCP, White & Garrott 1990) and kernel density estimation (KDE; Worton 1985). MCP creates a geometrically bound polygon containing all locations of birds, i.e. ‘fixes', where all vertices are convex, while KDE estimates the probability that an individual uses an area defined by a series of density isopleths (Worton 1985, White & Garrott 1990).
To describe home range variation among individuals within the population and to compare males with females, we calculated home ranges for each individual based on all its location fixes collected over the entire 23-month period using KDE with least squares cross validation (Worton 1995). To determine how weather, food availability and breeding intensity were associated with home range sizes, we computed a composite home range for the population per month based on all observations from all individuals within a given month using MCP, because within a month we had too few location fixes per individual to compute monthly home ranges at the individual level (White & Garrott 1990, Seaman et al. 1999). Although we are aware of the debate on the limitations of MCP (Nilsen et al. 2008), we used the method to calculate composite home ranges because we were interested in the geometrically bound area containing all locations of birds within that month (Minderman et al. 2010).
Spatial and temporal patterns of habitat use To show how the spatial distribution of birds changed through time, we plotted per month all locations where each marked individual was sighted on the study site (using the R package ggplot 2; Wickham 2009). We assumed that the probability of sighting a bird was the same for marked and unmarked birds, and therefore that our marked bird observations reflected movement patterns of the entire population. To calculate composite home ranges for the population for each month, we merged the median centers and median axes of individual birds (Fig. 1). We calculated these home ranges based on 95% MCP including all birds for which we had at least two fixes per month. Because home range estimates of individual birds are sometimes affected by the number of fixes (Seaman et al. 1999), we explored the influence of number of fixes per bird in a month on the home range estimate for that month. To do so, we used data from July-October 2015, during which we observed individuals with twelve fixes per month. From this data set, we randomly selected two to twelve fixes per individual, each time calculating the resulting monthly home range. We repeated this five times, and concluded that in our data set, the number of fixes per individual did not affect home range size estimates (P > 0.05).
Figure 1. Stepwise illustration on how to combine and assemble fixes of individual birds within a month to create a common median center and axes for calculation of a composite home range for the population for that month, showing an example of four individual Red-capped Larks (RC1-4). Step 1: Plot monthly fixes of sighted birds. Step 2: Calculate the median point of the monthly fixes (separately for each individual) and re-plot the fixes around its median with a local x, y coordinate (the median falling on the x = 0, y = 0 coordinate). Step 3: Overlay all median centers to create a composite picture of all monthly fixes of all birds. Step 4: Calculate 95% MCP home range for the month. NB each symbol denotes location points of a different individual.
Home range of Tropical Red-capped Larks
41
the contents of pitfalls. We then identified all contents, sorted them to taxonomic groups based on morphology and used a category-specific calibration curve relating dry mass as a function of length and width to estimate biomass (Ndithia et al. 2017a). We searched for nests, on average (± se), for 20 ± 1.0 days per month (range 7-31 days/month) and 245 ± 31.2 hours per month (range 17-825 hours/month) during the study period (Mwangi et al. 2018). To quantify breeding intensity, we calculated a monthly nest index, defined as the total number of nests found in a month per 10-person hours of search effort. We did this because our search effort varied over time, but the area searched for nests was constant during the entire study period (Ndithia et al. 2017a, 2017b, Mwangi et al. 2018).
Statistical analysis Nature of the data and approaches used in data analysis Our data set is robust as a result of continuous daily tracking of birds over a 23-month period. Following the assumption of a stochastic environment (Ndithia et al. 2017a,b, Mwangi et al. 2018), we measured all factors at a finer temporal resolution of the month compared to the coarser temporal scale of season used in most seasonal studies. In addition, individuals were tracked for long time periods (varying from 4 to 21 months), covering multiple breeding and non-breeding phases as well as repeated changes in social organization from group living to pair formation. However, the number of location fixes varied among individuals and among months, with often few fixes per individual per month (Appendix 1). Although breeding birds were well-represented, our data set was biased towards non-breeding birds (Appendix 2). This partly resulted from having to define the breeding period as the period during which an individual was attending its nest (nest building until fledging), a period lasting 24 days in this species (Mwangi et al. 2018). Following our sampling protocol as described earlier, we obtained too few positions per individual per week/month to warrant an analysis of home range size in relation to breeding stage at the individual level.
To explore home range sizes and their associations with weather, food availability and breeding, we combined two approaches and used two methods for estimation of home range size, the minimum convex polygon (MCP, White & Garrott 1990) and kernel density estimation (KDE; Worton 1985). MCP creates a geometrically bound polygon containing all locations of birds, i.e. ‘fixes', where all vertices are convex, while KDE estimates the probability that an individual uses an area defined by a series of density isopleths (Worton 1985, White & Garrott 1990).
To describe home range variation among individuals within the population and to compare males with females, we calculated home ranges for each individual based on all its location fixes collected over the entire 23-month period using KDE with least squares cross validation (Worton 1995). To determine how weather, food availability and breeding intensity were associated with home range sizes, we computed a composite home range for the population per month based on all observations from all individuals within a given month using MCP, because within a month we had too few location fixes per individual to compute monthly home ranges at the individual level (White & Garrott 1990, Seaman et al. 1999). Although we are aware of the debate on the limitations of MCP (Nilsen et al. 2008), we used the method to calculate composite home ranges because we were interested in the geometrically bound area containing all locations of birds within that month (Minderman et al. 2010).
Spatial and temporal patterns of habitat use To show how the spatial distribution of birds changed through time, we plotted per month all locations where each marked individual was sighted on the study site (using the R package ggplot 2; Wickham 2009). We assumed that the probability of sighting a bird was the same for marked and unmarked birds, and therefore that our marked bird observations reflected movement patterns of the entire population. To calculate composite home ranges for the population for each month, we merged the median centers and median axes of individual birds (Fig. 1). We calculated these home ranges based on 95% MCP including all birds for which we had at least two fixes per month. Because home range estimates of individual birds are sometimes affected by the number of fixes (Seaman et al. 1999), we explored the influence of number of fixes per bird in a month on the home range estimate for that month. To do so, we used data from July-October 2015, during which we observed individuals with twelve fixes per month. From this data set, we randomly selected two to twelve fixes per individual, each time calculating the resulting monthly home range. We repeated this five times, and concluded that in our data set, the number of fixes per individual did not affect home range size estimates (P > 0.05).
Figure 1. Stepwise illustration on how to combine and assemble fixes of individual birds within a month to create a common median center and axes for calculation of a composite home range for the population for that month, showing an example of four individual Red-capped Larks (RC1-4). Step 1: Plot monthly fixes of sighted birds. Step 2: Calculate the median point of the monthly fixes (separately for each individual) and re-plot the fixes around its median with a local x, y coordinate (the median falling on the x = 0, y = 0 coordinate). Step 3: Overlay all median centers to create a composite picture of all monthly fixes of all birds. Step 4: Calculate 95% MCP home range for the month. NB each symbol denotes location points of a different individual.
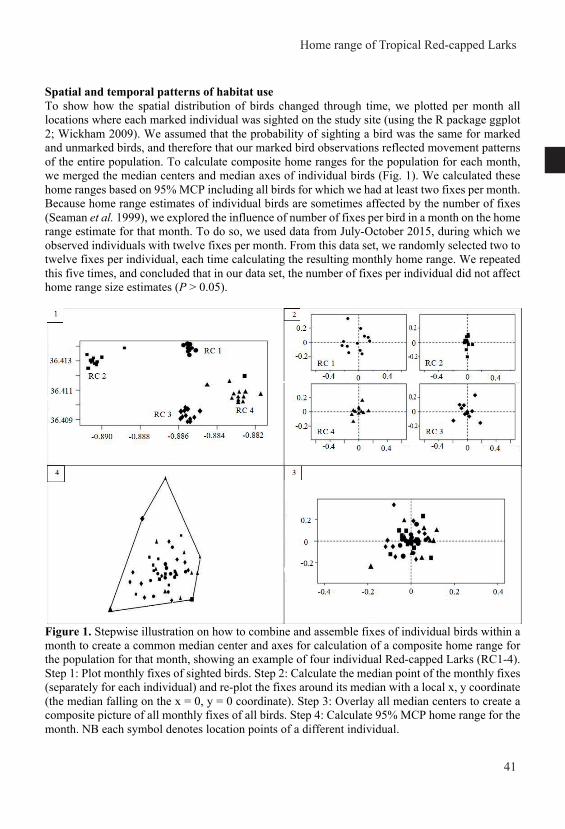
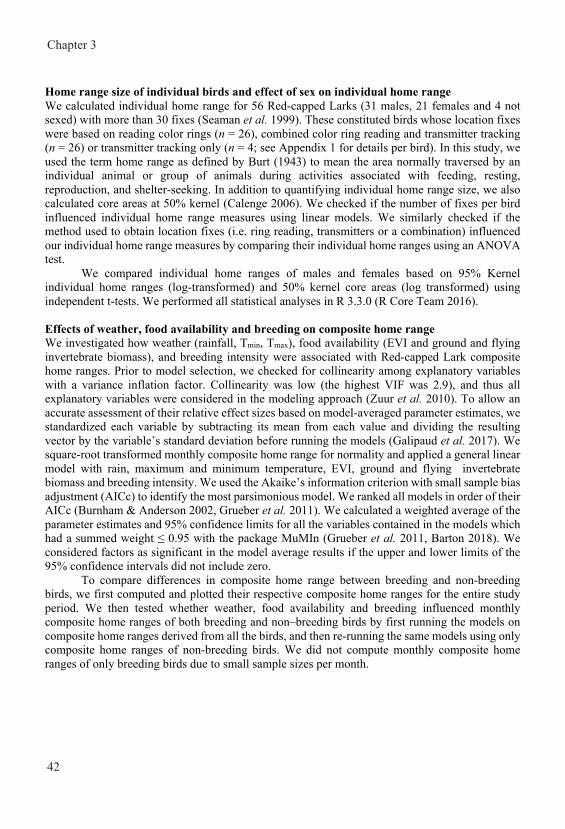
Chapter 3
42
Home range size of individual birds and effect of sex on individual home range We calculated individual home range for 56 Red-capped Larks (31 males, 21 females and 4 not sexed) with more than 30 fixes (Seaman et al. 1999). These constituted birds whose location fixes were based on reading color rings (n = 26), combined color ring reading and transmitter tracking (n = 26) or transmitter tracking only (n = 4; see Appendix 1 for details per bird). In this study, we used the term home range as defined by Burt (1943) to mean the area normally traversed by an individual animal or group of animals during activities associated with feeding, resting, reproduction, and shelter-seeking. In addition to quantifying individual home range size, we also calculated core areas at 50% kernel (Calenge 2006). We checked if the number of fixes per bird influenced individual home range measures using linear models. We similarly checked if the method used to obtain location fixes (i.e. ring reading, transmitters or a combination) influenced our individual home range measures by comparing their individual home ranges using an ANOVA test.
We compared individual home ranges of males and females based on 95% Kernel individual home ranges (log-transformed) and 50% kernel core areas (log transformed) using independent t-tests. We performed all statistical analyses in R 3.3.0 (R Core Team 2016). Effects of weather, food availability and breeding on composite home range We investigated how weather (rainfall, Tmin, Tmax), food availability (EVI and ground and flying invertebrate biomass), and breeding intensity were associated with Red-capped Lark composite home ranges. Prior to model selection, we checked for collinearity among explanatory variables with a variance inflation factor. Collinearity was low (the highest VIF was 2.9), and thus all explanatory variables were considered in the modeling approach (Zuur et al. 2010). To allow an accurate assessment of their relative effect sizes based on model-averaged parameter estimates, we standardized each variable by subtracting its mean from each value and dividing the resulting vector by the variable’s standard deviation before running the models (Galipaud et al. 2017). We square-root transformed monthly composite home range for normality and applied a general linear model with rain, maximum and minimum temperature, EVI, ground and flying invertebrate biomass and breeding intensity. We used the Akaike’s information criterion with small sample bias adjustment (AICc) to identify the most parsimonious model. We ranked all models in order of their AICc (Burnham & Anderson 2002, Grueber et al. 2011). We calculated a weighted average of the parameter estimates and 95% confidence limits for all the variables contained in the models which had a summed weight ≤ 0.95 with the package MuMIn (Grueber et al. 2011, Barton 2018). We considered factors as significant in the model average results if the upper and lower limits of the 95% confidence intervals did not include zero.
To compare differences in composite home range between breeding and non-breeding birds, we first computed and plotted their respective composite home ranges for the entire study period. We then tested whether weather, food availability and breeding influenced monthly composite home ranges of both breeding and non–breeding birds by first running the models on composite home ranges derived from all the birds, and then re-running the same models using only composite home ranges of non-breeding birds. We did not compute monthly composite home ranges of only breeding birds due to small sample sizes per month.
Results Spatial and temporal patterns of habitat use Between April 2014 and June 2016, we captured and ringed 620 Red-capped Larks, which we resighted a total of 5515 times, with on average 8.8 ± 14.7 resightings per individual (range 1 - 105). Bird distribution varied with month, showing that larks spread throughout the study area at some times, while at other times they concentrated in particular parts of the study area (Fig. 2), suggesting fission-fusion dynamics. The mean composite monthly home range of Red-capped Larks was 58.0 ha ± 47.9 (range 2.6 - 154.05, n = 23). The composite monthly home range varied among months with the smallest composite home range in November 2015 being 75 times smaller than the largest in November 2014, based on 95% MCP. Composite home range of breeding birds was 9.6 hectares, while that of non-breeding birds was 142.9 hectares (Fig. 3).
Figure 2. Spatial and temporal change in Red-capped Lark distribution per month within the study area during the period August 2014 - June 2016. An individual bird is only represented once per grid per month, and variation in black gradient represents continuous transformation from low (grey) to high (black) density as shown on the scale.
Home range of Tropical Red-capped Larks
43
Home range size of individual birds and effect of sex on individual home range We calculated individual home range for 56 Red-capped Larks (31 males, 21 females and 4 not sexed) with more than 30 fixes (Seaman et al. 1999). These constituted birds whose location fixes were based on reading color rings (n = 26), combined color ring reading and transmitter tracking (n = 26) or transmitter tracking only (n = 4; see Appendix 1 for details per bird). In this study, we used the term home range as defined by Burt (1943) to mean the area normally traversed by an individual animal or group of animals during activities associated with feeding, resting, reproduction, and shelter-seeking. In addition to quantifying individual home range size, we also calculated core areas at 50% kernel (Calenge 2006). We checked if the number of fixes per bird influenced individual home range measures using linear models. We similarly checked if the method used to obtain location fixes (i.e. ring reading, transmitters or a combination) influenced our individual home range measures by comparing their individual home ranges using an ANOVA test.
We compared individual home ranges of males and females based on 95% Kernel individual home ranges (log-transformed) and 50% kernel core areas (log transformed) using independent t-tests. We performed all statistical analyses in R 3.3.0 (R Core Team 2016). Effects of weather, food availability and breeding on composite home range We investigated how weather (rainfall, Tmin, Tmax), food availability (EVI and ground and flying invertebrate biomass), and breeding intensity were associated with Red-capped Lark composite home ranges. Prior to model selection, we checked for collinearity among explanatory variables with a variance inflation factor. Collinearity was low (the highest VIF was 2.9), and thus all explanatory variables were considered in the modeling approach (Zuur et al. 2010). To allow an accurate assessment of their relative effect sizes based on model-averaged parameter estimates, we standardized each variable by subtracting its mean from each value and dividing the resulting vector by the variable’s standard deviation before running the models (Galipaud et al. 2017). We square-root transformed monthly composite home range for normality and applied a general linear model with rain, maximum and minimum temperature, EVI, ground and flying invertebrate biomass and breeding intensity. We used the Akaike’s information criterion with small sample bias adjustment (AICc) to identify the most parsimonious model. We ranked all models in order of their AICc (Burnham & Anderson 2002, Grueber et al. 2011). We calculated a weighted average of the parameter estimates and 95% confidence limits for all the variables contained in the models which had a summed weight ≤ 0.95 with the package MuMIn (Grueber et al. 2011, Barton 2018). We considered factors as significant in the model average results if the upper and lower limits of the 95% confidence intervals did not include zero.
To compare differences in composite home range between breeding and non-breeding birds, we first computed and plotted their respective composite home ranges for the entire study period. We then tested whether weather, food availability and breeding influenced monthly composite home ranges of both breeding and non–breeding birds by first running the models on composite home ranges derived from all the birds, and then re-running the same models using only composite home ranges of non-breeding birds. We did not compute monthly composite home ranges of only breeding birds due to small sample sizes per month.
Results Spatial and temporal patterns of habitat use Between April 2014 and June 2016, we captured and ringed 620 Red-capped Larks, which we resighted a total of 5515 times, with on average 8.8 ± 14.7 resightings per individual (range 1 - 105). Bird distribution varied with month, showing that larks spread throughout the study area at some times, while at other times they concentrated in particular parts of the study area (Fig. 2), suggesting fission-fusion dynamics. The mean composite monthly home range of Red-capped Larks was 58.0 ha ± 47.9 (range 2.6 - 154.05, n = 23). The composite monthly home range varied among months with the smallest composite home range in November 2015 being 75 times smaller than the largest in November 2014, based on 95% MCP. Composite home range of breeding birds was 9.6 hectares, while that of non-breeding birds was 142.9 hectares (Fig. 3).
Figure 2. Spatial and temporal change in Red-capped Lark distribution per month within the study area during the period August 2014 - June 2016. An individual bird is only represented once per grid per month, and variation in black gradient represents continuous transformation from low (grey) to high (black) density as shown on the scale.
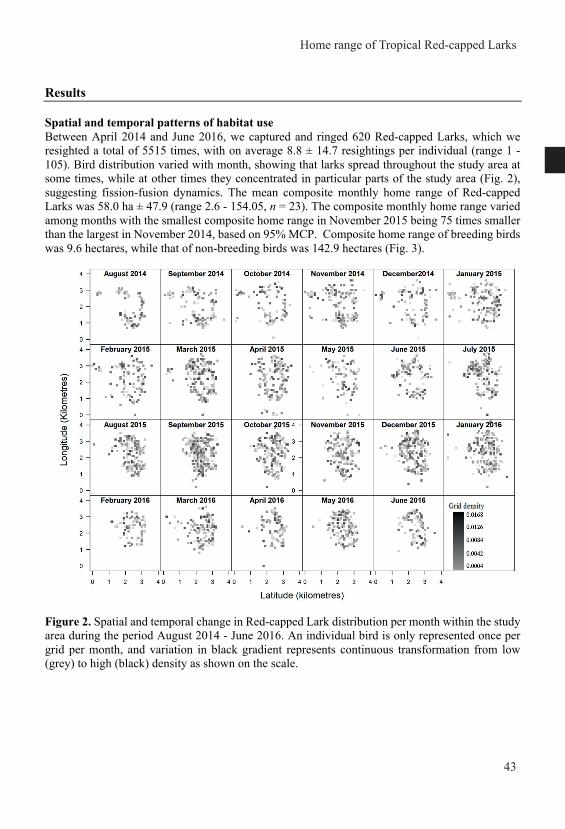
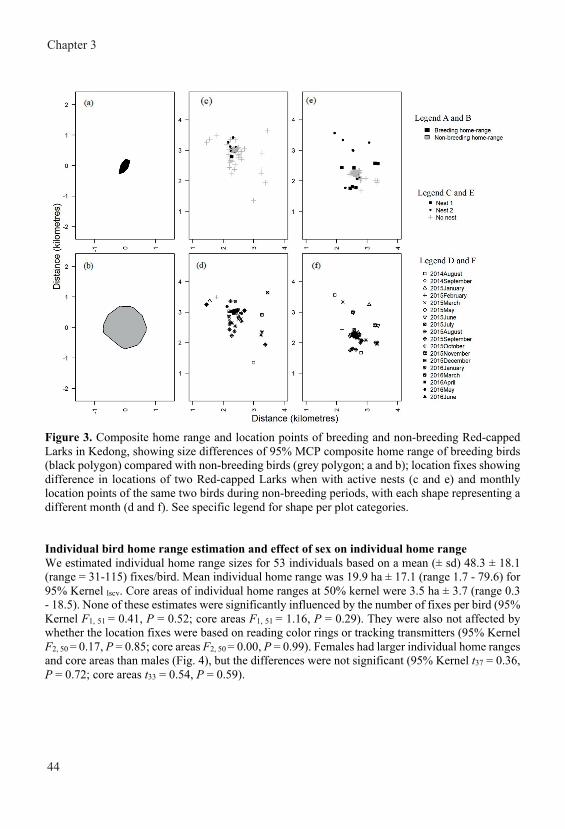
Chapter 3
44
Figure 3. Composite home range and location points of breeding and non-breeding Red-capped Larks in Kedong, showing size differences of 95% MCP composite home range of breeding birds (black polygon) compared with non-breeding birds (grey polygon; a and b); location fixes showing difference in locations of two Red-capped Larks when with active nests (c and e) and monthly location points of the same two birds during non-breeding periods, with each shape representing a different month (d and f). See specific legend for shape per plot categories. Individual bird home range estimation and effect of sex on individual home range We estimated individual home range sizes for 53 individuals based on a mean (± sd) 48.3 ± 18.1 (range = 31-115) fixes/bird. Mean individual home range was 19.9 ha ± 17.1 (range 1.7 - 79.6) for 95% Kernel lscv. Core areas of individual home ranges at 50% kernel were 3.5 ha ± 3.7 (range 0.3 - 18.5). None of these estimates were significantly influenced by the number of fixes per bird (95% Kernel F1, 51 = 0.41, P = 0.52; core areas F1, 51 = 1.16, P = 0.29). They were also not affected by whether the location fixes were based on reading color rings or tracking transmitters (95% Kernel F2, 50 = 0.17, P = 0.85; core areas F2, 50 = 0.00, P = 0.99). Females had larger individual home ranges and core areas than males (Fig. 4), but the differences were not significant (95% Kernel t37 = 0.36, P = 0.72; core areas t33 = 0.54, P = 0.59).
Figure 4. Average individual home range and core area estimates for male and female Red-capped Larks. The central bold lines and colored areas represent mean ± SD, bars represent the range of values, and the black bold circles show the data points (individual Red-capped Lark home ranges of the respective categories). Effects of weather, food availability and breeding on composite home range Evaluating how well weather, food availability and intensity of breeding explained variation in composite home ranges of Red-capped Larks, we found that composite home range significantly decreased with an increase in monthly nesting intensity (Fig. 5, Table 1). There was a near-significant decrease in composite home range with an increase in EVI (Table 1). When we removed location fixes of birds with active nests, consistent with the analysis of breeding and non-breeding birds together, composite home range decreased with an increase in monthly nesting index (Table 2). The other environmental factors were not significantly related to composite home ranges of Red-capped Larks.
Home range of Tropical Red-capped Larks
45
Figure 3. Composite home range and location points of breeding and non-breeding Red-capped Larks in Kedong, showing size differences of 95% MCP composite home range of breeding birds (black polygon) compared with non-breeding birds (grey polygon; a and b); location fixes showing difference in locations of two Red-capped Larks when with active nests (c and e) and monthly location points of the same two birds during non-breeding periods, with each shape representing a different month (d and f). See specific legend for shape per plot categories. Individual bird home range estimation and effect of sex on individual home range We estimated individual home range sizes for 53 individuals based on a mean (± sd) 48.3 ± 18.1 (range = 31-115) fixes/bird. Mean individual home range was 19.9 ha ± 17.1 (range 1.7 - 79.6) for 95% Kernel lscv. Core areas of individual home ranges at 50% kernel were 3.5 ha ± 3.7 (range 0.3 - 18.5). None of these estimates were significantly influenced by the number of fixes per bird (95% Kernel F1, 51 = 0.41, P = 0.52; core areas F1, 51 = 1.16, P = 0.29). They were also not affected by whether the location fixes were based on reading color rings or tracking transmitters (95% Kernel F2, 50 = 0.17, P = 0.85; core areas F2, 50 = 0.00, P = 0.99). Females had larger individual home ranges and core areas than males (Fig. 4), but the differences were not significant (95% Kernel t37 = 0.36, P = 0.72; core areas t33 = 0.54, P = 0.59).
Figure 4. Average individual home range and core area estimates for male and female Red-capped Larks. The central bold lines and colored areas represent mean ± SD, bars represent the range of values, and the black bold circles show the data points (individual Red-capped Lark home ranges of the respective categories). Effects of weather, food availability and breeding on composite home range Evaluating how well weather, food availability and intensity of breeding explained variation in composite home ranges of Red-capped Larks, we found that composite home range significantly decreased with an increase in monthly nesting intensity (Fig. 5, Table 1). There was a near-significant decrease in composite home range with an increase in EVI (Table 1). When we removed location fixes of birds with active nests, consistent with the analysis of breeding and non-breeding birds together, composite home range decreased with an increase in monthly nesting index (Table 2). The other environmental factors were not significantly related to composite home ranges of Red-capped Larks.
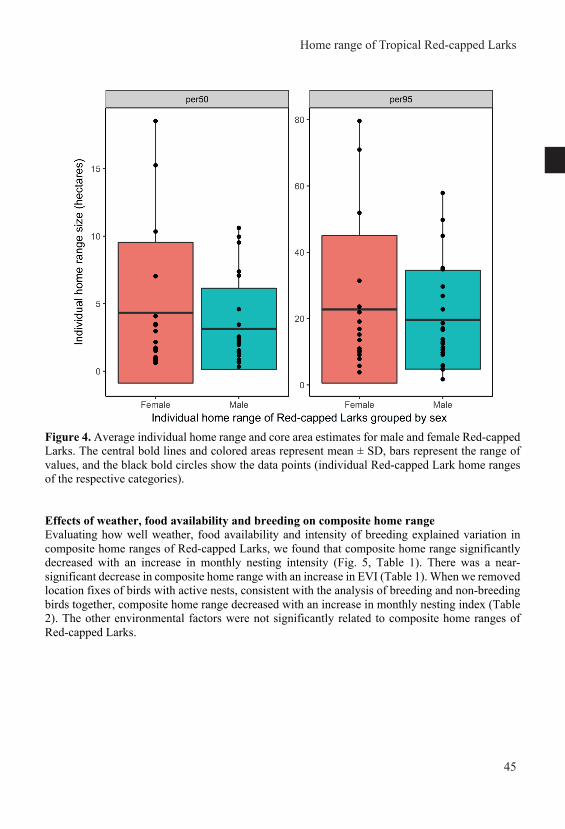
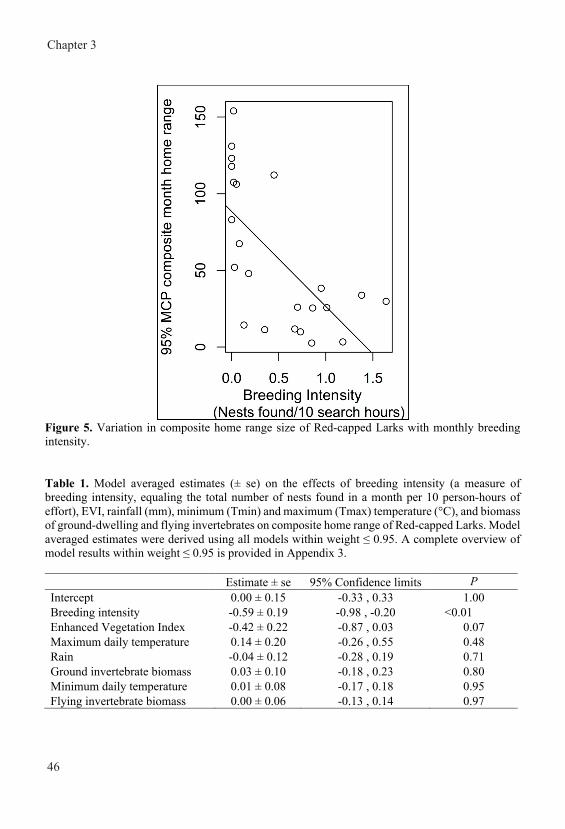
Chapter 3
46
Figure 5. Variation in composite home range size of Red-capped Larks with monthly breeding intensity. Table 1. Model averaged estimates (± se) on the effects of breeding intensity (a measure of breeding intensity, equaling the total number of nests found in a month per 10 person-hours of effort), EVI, rainfall (mm), minimum (Tmin) and maximum (Tmax) temperature (°C), and biomass of ground-dwelling and flying invertebrates on composite home range of Red-capped Larks. Model averaged estimates were derived using all models within weight ≤ 0.95. A complete overview of model results within weight ≤ 0.95 is provided in Appendix 3. Estimate ± se 95% Confidence limits P
Intercept 0.00 ± 0.15 -0.33 , 0.33 1.00 Breeding intensity -0.59 ± 0.19 -0.98 , -0.20 <0.01 Enhanced Vegetation Index -0.42 ± 0.22 -0.87 , 0.03 0.07 Maximum daily temperature 0.14 ± 0.20 -0.26 , 0.55 0.48 Rain -0.04 ± 0.12 -0.28 , 0.19 0.71 Ground invertebrate biomass 0.03 ± 0.10 -0.18 , 0.23 0.80 Minimum daily temperature 0.01 ± 0.08 -0.17 , 0.18 0.95 Flying invertebrate biomass 0.00 ± 0.06 -0.13 , 0.14 0.97
Discussion In general, and in agreement with previous studies in this sytem (Ndithia et al. 2017a, b), we found no consistent pattern characteristic of seasonal environments in rainfall, temparature, vegetation, invertebrates or nesting throughout our two study years (see Appendix 5). Composite home range sizes of resident equatorial Red-capped Larks showed substantial variation from month to month, over the 23-month period of our study, partly associated with changes in environmental and social factors. Confirming the fission-fusion dynamics from breeding in pairs to flocking when not breeding, we found that the spacing behavior and distribution of Red-capped Larks within our study area varied among months. Individual home ranges varied almost four fold among individuals, but did not differ between sexes. Contrary to predictions, our combined analysis of non-breeding and breeding birds at the population level showed that composite home range was not influenced by rainfall or invertebrate biomass, as potential indicators of food availability. However, conforming to our predictions, we found that composite home ranges decreased in size with more vegetation albeit weakly, and with higher breeding intensity. This suggested that Red-capped Larks had smaller home ranges during breeding because movements are confined to the nest area. Surprisingly, restricting these analyses to non-breeding individuals only, we found the same associations with breeding intensity. To our knowledge, this is the first evidence that breeding intensity can affect the home range sizes of non-breeding individuals. At the individual level, home ranges were 15-fold the size in non-breeding compared with breeding individuals. Table 2. Model averaged estimates (± se) on the effects of breeding intensity (expressed as the total number of nests found in a month per 10 person-hours of effort), EVI, rainfall (mm), minimum (Tmin) and maximum (Tmax) temperature (°C), and biomass of ground-dwelling and flying invertebrates, on composite home range of non-breeding Red-capped Larks. Model averaged estimates were derived using all models within weight ≤ 0.95. A complete overview of model results within weight ≤ 0.95 is provided in Appendix 4. Estimate ± se 95% Confidence limits P
Intercept -0.00 ± 0.16 -0.34 , 0.34 1.00 Breeding intensity -0.56 ± 0.21 -0.98 , -0.13 0.01 Maximum daily temperature 0.18 ± 0.23 -0.27 , 0.64 0.43 Enhanced Vegetation Index -0.39 ± 0.24 -0.88 , 0.09 0.11 Rain -0.05 ± 0.13 -0.32 , 0.21 0.69 Ground invertebrate biomass 0.03 ± 0.11 -0.19 , 0.25 0.80 Minimum daily temperature 0.01 ± 0.09 -0.19 , 0.21 0.92 Flying invertebrate biomass 0.00 ± 0.07 -0.14 , 0.15 0.98
Home range of Tropical Red-capped Larks
47
Figure 5. Variation in composite home range size of Red-capped Larks with monthly breeding intensity. Table 1. Model averaged estimates (± se) on the effects of breeding intensity (a measure of breeding intensity, equaling the total number of nests found in a month per 10 person-hours of effort), EVI, rainfall (mm), minimum (Tmin) and maximum (Tmax) temperature (°C), and biomass of ground-dwelling and flying invertebrates on composite home range of Red-capped Larks. Model averaged estimates were derived using all models within weight ≤ 0.95. A complete overview of model results within weight ≤ 0.95 is provided in Appendix 3. Estimate ± se 95% Confidence limits P
Intercept 0.00 ± 0.15 -0.33 , 0.33 1.00 Breeding intensity -0.59 ± 0.19 -0.98 , -0.20 <0.01 Enhanced Vegetation Index -0.42 ± 0.22 -0.87 , 0.03 0.07 Maximum daily temperature 0.14 ± 0.20 -0.26 , 0.55 0.48 Rain -0.04 ± 0.12 -0.28 , 0.19 0.71 Ground invertebrate biomass 0.03 ± 0.10 -0.18 , 0.23 0.80 Minimum daily temperature 0.01 ± 0.08 -0.17 , 0.18 0.95 Flying invertebrate biomass 0.00 ± 0.06 -0.13 , 0.14 0.97
Discussion In general, and in agreement with previous studies in this sytem (Ndithia et al. 2017a, b), we found no consistent pattern characteristic of seasonal environments in rainfall, temparature, vegetation, invertebrates or nesting throughout our two study years (see Appendix 5). Composite home range sizes of resident equatorial Red-capped Larks showed substantial variation from month to month, over the 23-month period of our study, partly associated with changes in environmental and social factors. Confirming the fission-fusion dynamics from breeding in pairs to flocking when not breeding, we found that the spacing behavior and distribution of Red-capped Larks within our study area varied among months. Individual home ranges varied almost four fold among individuals, but did not differ between sexes. Contrary to predictions, our combined analysis of non-breeding and breeding birds at the population level showed that composite home range was not influenced by rainfall or invertebrate biomass, as potential indicators of food availability. However, conforming to our predictions, we found that composite home ranges decreased in size with more vegetation albeit weakly, and with higher breeding intensity. This suggested that Red-capped Larks had smaller home ranges during breeding because movements are confined to the nest area. Surprisingly, restricting these analyses to non-breeding individuals only, we found the same associations with breeding intensity. To our knowledge, this is the first evidence that breeding intensity can affect the home range sizes of non-breeding individuals. At the individual level, home ranges were 15-fold the size in non-breeding compared with breeding individuals. Table 2. Model averaged estimates (± se) on the effects of breeding intensity (expressed as the total number of nests found in a month per 10 person-hours of effort), EVI, rainfall (mm), minimum (Tmin) and maximum (Tmax) temperature (°C), and biomass of ground-dwelling and flying invertebrates, on composite home range of non-breeding Red-capped Larks. Model averaged estimates were derived using all models within weight ≤ 0.95. A complete overview of model results within weight ≤ 0.95 is provided in Appendix 4. Estimate ± se 95% Confidence limits P
Intercept -0.00 ± 0.16 -0.34 , 0.34 1.00 Breeding intensity -0.56 ± 0.21 -0.98 , -0.13 0.01 Maximum daily temperature 0.18 ± 0.23 -0.27 , 0.64 0.43 Enhanced Vegetation Index -0.39 ± 0.24 -0.88 , 0.09 0.11 Rain -0.05 ± 0.13 -0.32 , 0.21 0.69 Ground invertebrate biomass 0.03 ± 0.11 -0.19 , 0.25 0.80 Minimum daily temperature 0.01 ± 0.09 -0.19 , 0.21 0.92 Flying invertebrate biomass 0.00 ± 0.07 -0.14 , 0.15 0.98
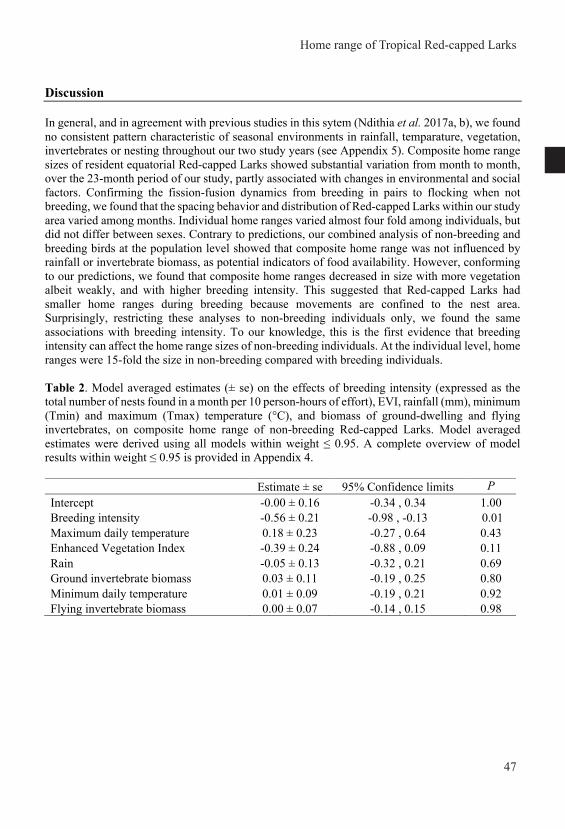
Chapter 3
48
Home range and change in social organization from groups to pairs in Red-capped Larks The mean individual home range size of Red-capped Lark of 19.9 ha was larger than that reported for phylogenetically related Dupont’s Lark Chersophilus duponti (Garza et al. 2005), resident afro-tropical insectivorous birds (Newmark et al. 2010), and similar sized neotropical savannah species (Lopes & Marini 2006). The relatively large individual home range may result from the fission-fusion behavior in Red-capped Larks. Fusion into larger groups allows birds to exploit larger home-ranges as shown in the Apostlebird Struthidea cinerea (Griesser et al. 2009). The observed temporal variation in movement and distribution within the habitat of Red-capped Larks could be attributed to fusion of breeding pairs into groups when not breeding, allowing birds to have access to a larger area and move longer distance for resources, e.g. for food, as shown in other birds (Griesser et al. 2009, Loretto et al. 2017). By assembling in flocks, individual birds could enhance foraging efficiency, e.g. through a beater effect where feeding insects are flushed out by the other individuals within the group (Herremans & Herremans-Tonnoeyr 1997), or through finding optimal foraging patches within the habitat (Darrah & Smith 2014). Another advantage of flocking in Red-capped Larks may be to increase protection from predators via dilution of risk for individuals, predator confusion and increased vigilance shared by flock members (Darrah & Smith 2014, Ofstad et al. 2016). Effect of weather, EVI, invertebrate biomass and breeding on composite home range The lack of influence of weather and invertebrate biomass on monthly variation in composite home range from this study supports the conclusions by Ndithia et al. (2017a) that food availability and other resources may be sufficient year round. Unlike temperate latitudes, our tropical system lacks the radical seasonal changes in weather and food availability experienced by birds (Skutch 1949). Because we did not observe a direct effect of invertebrates on composite home range, decreased composite home range with higher EVI, albeit weakly, may have reflected another mechanism than vegetation as a food availability proxy. Instead, our results could be explained if vegetation indicates the physical characteristics of the habitat related to availability of nesting sites (Scott et
al. 1998), and for protection from predators (Ofstad et al. 2016). With tropical conditions proposed to be characterized by high levels of predation (Skutch. 1949), it is plausible that home range may be highly influenced by habitat characteristics such as cover, moderating the risk of predation. During periods with less vegetation, Red-capped Larks may increase the size of the home range to include areas with sufficient cover from predators.
Similar to our results, home ranges in birds have been shown to vary with breeding status, some species reportedly showing an increase in home range with breeding (Jahn et al. 2010, Kolts & McRae 2017), others a decrease (Willey & Van Riper Iii 2014, Morganti et al. 2017), while some show no variation between (Winiarski et al. 2017). The need to defend nest sites, coupled with nest attendance and chick provisioning, may constrain movement of breeding Red-capped Larks to areas closer to their nests. The high cost associated with territorial defense may impose the maximum limit to the area that can be defended (Morganti et al. 2017).
To the best of our knowledge, we show for the first time that the home range of Red-capped Larks that were not breeding were influenced by breeding intensity, indicating that home range and associated movement behavior of non-breeding individuals may also more strongly depend on breeding status of conspecifics than previously assumed. Nest area territoriality by breeding birds may exclude other birds from using areas near the nest, and thus the higher the number of breeding individuals, the bigger the size of defended areas (Nakamura 1995). This not only reduces the area available to non-breeding birds, but also creates patchiness in areas accessible for them to forage, restricting them to smaller areas that are not defended by the breeding pairs.
Acknowledgment We are indebted to P. Kinyanjui, P. Kimani, A. Mwangi, M. Mwangi, N. Wanjiku, K. Njuguna and J. Kamau for their invaluable help in data collection. The late S. Higgins of Lake Naivasha Riparian Association provided accommodation and a base for logistics for the research team during the years of fieldwork. We are very grateful to M. van der Velde for assisting with lab work and R. Howison for help in analyzing EVI images. We would like to thank the management of Kedong for permission to conduct this research in the ranch. We would also like to greatly thank two anonymous reviewers and Eivin Roskaft for valuable suggestions, which were of great help in revising earlier drafts. Funding for the study was provided by The Netherlands Fellowship Programme of Nuffic (grants no. CF9159/2013 to BIT and JMM), the Netherlands Organization for Scientific Research (NWO-VIDI 864.10.012 to BIT), Lucie Burgers foundation (to JMM) and two grants from the Ecology fund of the Royal Netherlands Academy of Arts and Sciences (to JMM). The National Museums of Kenya organized permission letters for access to the study area.
Home range of Tropical Red-capped Larks
49
Home range and change in social organization from groups to pairs in Red-capped Larks The mean individual home range size of Red-capped Lark of 19.9 ha was larger than that reported for phylogenetically related Dupont’s Lark Chersophilus duponti (Garza et al. 2005), resident afro-tropical insectivorous birds (Newmark et al. 2010), and similar sized neotropical savannah species (Lopes & Marini 2006). The relatively large individual home range may result from the fission-fusion behavior in Red-capped Larks. Fusion into larger groups allows birds to exploit larger home-ranges as shown in the Apostlebird Struthidea cinerea (Griesser et al. 2009). The observed temporal variation in movement and distribution within the habitat of Red-capped Larks could be attributed to fusion of breeding pairs into groups when not breeding, allowing birds to have access to a larger area and move longer distance for resources, e.g. for food, as shown in other birds (Griesser et al. 2009, Loretto et al. 2017). By assembling in flocks, individual birds could enhance foraging efficiency, e.g. through a beater effect where feeding insects are flushed out by the other individuals within the group (Herremans & Herremans-Tonnoeyr 1997), or through finding optimal foraging patches within the habitat (Darrah & Smith 2014). Another advantage of flocking in Red-capped Larks may be to increase protection from predators via dilution of risk for individuals, predator confusion and increased vigilance shared by flock members (Darrah & Smith 2014, Ofstad et al. 2016). Effect of weather, EVI, invertebrate biomass and breeding on composite home range The lack of influence of weather and invertebrate biomass on monthly variation in composite home range from this study supports the conclusions by Ndithia et al. (2017a) that food availability and other resources may be sufficient year round. Unlike temperate latitudes, our tropical system lacks the radical seasonal changes in weather and food availability experienced by birds (Skutch 1949). Because we did not observe a direct effect of invertebrates on composite home range, decreased composite home range with higher EVI, albeit weakly, may have reflected another mechanism than vegetation as a food availability proxy. Instead, our results could be explained if vegetation indicates the physical characteristics of the habitat related to availability of nesting sites (Scott et
al. 1998), and for protection from predators (Ofstad et al. 2016). With tropical conditions proposed to be characterized by high levels of predation (Skutch. 1949), it is plausible that home range may be highly influenced by habitat characteristics such as cover, moderating the risk of predation. During periods with less vegetation, Red-capped Larks may increase the size of the home range to include areas with sufficient cover from predators.
Similar to our results, home ranges in birds have been shown to vary with breeding status, some species reportedly showing an increase in home range with breeding (Jahn et al. 2010, Kolts & McRae 2017), others a decrease (Willey & Van Riper Iii 2014, Morganti et al. 2017), while some show no variation between (Winiarski et al. 2017). The need to defend nest sites, coupled with nest attendance and chick provisioning, may constrain movement of breeding Red-capped Larks to areas closer to their nests. The high cost associated with territorial defense may impose the maximum limit to the area that can be defended (Morganti et al. 2017).
To the best of our knowledge, we show for the first time that the home range of Red-capped Larks that were not breeding were influenced by breeding intensity, indicating that home range and associated movement behavior of non-breeding individuals may also more strongly depend on breeding status of conspecifics than previously assumed. Nest area territoriality by breeding birds may exclude other birds from using areas near the nest, and thus the higher the number of breeding individuals, the bigger the size of defended areas (Nakamura 1995). This not only reduces the area available to non-breeding birds, but also creates patchiness in areas accessible for them to forage, restricting them to smaller areas that are not defended by the breeding pairs.
Acknowledgment We are indebted to P. Kinyanjui, P. Kimani, A. Mwangi, M. Mwangi, N. Wanjiku, K. Njuguna and J. Kamau for their invaluable help in data collection. The late S. Higgins of Lake Naivasha Riparian Association provided accommodation and a base for logistics for the research team during the years of fieldwork. We are very grateful to M. van der Velde for assisting with lab work and R. Howison for help in analyzing EVI images. We would like to thank the management of Kedong for permission to conduct this research in the ranch. We would also like to greatly thank two anonymous reviewers and Eivin Roskaft for valuable suggestions, which were of great help in revising earlier drafts. Funding for the study was provided by The Netherlands Fellowship Programme of Nuffic (grants no. CF9159/2013 to BIT and JMM), the Netherlands Organization for Scientific Research (NWO-VIDI 864.10.012 to BIT), Lucie Burgers foundation (to JMM) and two grants from the Ecology fund of the Royal Netherlands Academy of Arts and Sciences (to JMM). The National Museums of Kenya organized permission letters for access to the study area.
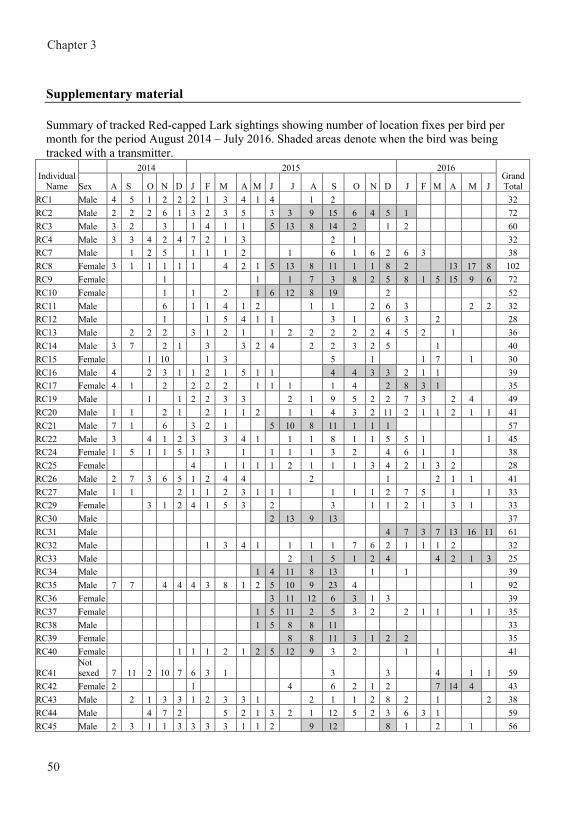
Chapter 3
50
Supplementary material Summary of tracked Red-capped Lark sightings showing number of location fixes per bird per month for the period August 2014 – July 2016. Shaded areas denote when the bird was being tracked with a transmitter.
Individual Name
2014 2015 2016 Grand Total Sex A S O N D J F M A M J J A S O N D J F M A M J
RC1 Male 4 5 1 2 2 2 1 3 4 1 4 1 2 32 RC2 Male 2 2 2 6 1 3 2 3 5 3 3 9 15 6 4 5 1 72 RC3 Male 3 2 3 1 4 1 1 5 13 8 14 2 1 2 60 RC4 Male 3 3 4 2 4 7 2 1 3 2 1 32 RC7 Male 1 2 5 1 1 1 2 1 6 1 6 2 6 3 38 RC8 Female 3 1 1 1 1 1 4 2 1 5 13 8 11 1 1 8 2 13 17 8 102 RC9 Female 1 1 1 7 3 8 2 5 8 1 5 15 9 6 72 RC10 Female 1 1 2 1 6 12 8 19 2 52 RC11 Male 6 1 1 4 1 2 1 1 2 6 3 2 2 32 RC12 Male 1 1 5 4 1 1 3 1 6 3 2 28 RC13 Male 2 2 2 3 1 2 1 1 2 2 2 2 2 4 5 2 1 36 RC14 Male 3 7 2 1 3 3 2 4 2 2 3 2 5 1 40 RC15 Female 1 10 1 3 5 1 1 7 1 30 RC16 Male 4 2 3 1 1 2 1 5 1 1 4 4 3 3 2 1 1 39 RC17 Female 4 1 2 2 2 2 1 1 1 1 4 2 8 3 1 35 RC19 Male 1 1 2 2 3 3 2 1 9 5 2 2 7 3 2 4 49 RC20 Male 1 1 2 1 2 1 1 2 1 1 4 3 2 11 2 1 1 2 1 1 41 RC21 Male 7 1 6 3 2 1 5 10 8 11 1 1 1 57 RC22 Male 3 4 1 2 3 3 4 1 1 1 8 1 1 5 5 1 1 45 RC24 Female 1 5 1 1 5 1 3 1 1 1 1 3 2 4 6 1 1 38 RC25 Female 4 1 1 1 1 2 1 1 1 3 4 2 1 3 2 28 RC26 Male 2 7 3 6 5 1 2 4 4 2 1 2 1 1 41 RC27 Male 1 1 2 1 1 2 3 1 1 1 1 1 1 2 7 5 1 1 33 RC29 Female 3 1 2 4 1 5 3 2 3 1 1 2 1 3 1 33 RC30 Male 2 13 9 13 37 RC31 Male 4 7 3 7 13 16 11 61 RC32 Male 1 3 4 1 1 1 1 7 6 2 1 1 1 2 32 RC33 Male 2 1 5 1 2 4 4 2 1 3 25 RC34 Male 1 4 11 8 13 1 1 39 RC35 Male 7 7 4 4 4 3 8 1 2 5 10 9 23 4 1 92 RC36 Female 3 11 12 6 3 1 3 39 RC37 Female 1 5 11 2 5 3 2 2 1 1 1 1 35 RC38 Male 1 5 8 8 11 33 RC39 Female 8 8 11 3 1 2 2 35 RC40 Female 1 1 1 2 1 2 5 12 9 3 2 1 1 41
RC41 Not sexed 7 11 2 10 7 6 3 1 3 3 4 1 1 59
RC42 Female 2 1 4 6 2 1 2 7 14 4 43 RC43 Male 2 1 3 3 1 2 3 3 1 2 1 1 2 8 2 1 2 38 RC44 Male 4 7 2 5 2 1 3 2 1 12 5 2 3 6 3 1 59 RC45 Male 2 3 1 1 3 3 3 3 1 1 2 9 12 8 1 2 1 56
RC46 Not sexed 1 3 4 7 5 8 6 7 3 1 3 1 6 1 56
RC47 Male 4 7 2 2 6 3 5 3 2 1 1 1 2 2 2 5 48 RC48 Female 1 1 1 1 1 1 12 9 12 2 2 2 2 12 13 10 82
RC49 Not sexed 1 4 2 6 1 2 3 3 1 2 1 2 1 2 5 1 1 38
RC50 Female 2 3 5 1 1 2 1 1 4 6 14 5 3 1 49 RC51 Male 2 3 1 1 1 8 4 3 2 3 2 1 1 1 33 RC52 Female 6 1 2 1 2 1 3 2 5 1 1 2 3 2 5 9 2 6 5 2 1 62
RC54 Not sexed 5 6 4 7 4 7 3 2 3 1 1 4 3 1 51
RC55 Female 1 7 14 2 1 4 1 1 7 15 12 8 73 RC56 Female 3 11 14 1 2 3 34 RC57 Female 2 10 16 3 2 2 35 RC58 Male 4 7 12 2 1 6 1 33 RC59 Female 1 1 1 1 2 1 2 3 14 13 9 48 RC60 Male 1 7 14 7 3 4 6 42 RC62 Male 3 1 1 4 1 6 4 2 5 12 8 16 1 3 6 3 76 RC63 Female 5 7 14 4 1 31 Total Number of Points 84 90 54 123 69 86 71 107 84 35 90 207 215 398 116 71 161 127 39 72 118 102 65 2581 Total Number of Birds 25 24 21 33 25 31 32 34 30 28 30 38 38 51 40 35 43 32 21 24 18 20 15
Home range of Tropical Red-capped Larks
51
Supplementary material Summary of tracked Red-capped Lark sightings showing number of location fixes per bird per month for the period August 2014 – July 2016. Shaded areas denote when the bird was being tracked with a transmitter.
Individual Name
2014 2015 2016 Grand Total Sex A S O N D J F M A M J J A S O N D J F M A M J
RC1 Male 4 5 1 2 2 2 1 3 4 1 4 1 2 32 RC2 Male 2 2 2 6 1 3 2 3 5 3 3 9 15 6 4 5 1 72 RC3 Male 3 2 3 1 4 1 1 5 13 8 14 2 1 2 60 RC4 Male 3 3 4 2 4 7 2 1 3 2 1 32 RC7 Male 1 2 5 1 1 1 2 1 6 1 6 2 6 3 38 RC8 Female 3 1 1 1 1 1 4 2 1 5 13 8 11 1 1 8 2 13 17 8 102 RC9 Female 1 1 1 7 3 8 2 5 8 1 5 15 9 6 72 RC10 Female 1 1 2 1 6 12 8 19 2 52 RC11 Male 6 1 1 4 1 2 1 1 2 6 3 2 2 32 RC12 Male 1 1 5 4 1 1 3 1 6 3 2 28 RC13 Male 2 2 2 3 1 2 1 1 2 2 2 2 2 4 5 2 1 36 RC14 Male 3 7 2 1 3 3 2 4 2 2 3 2 5 1 40 RC15 Female 1 10 1 3 5 1 1 7 1 30 RC16 Male 4 2 3 1 1 2 1 5 1 1 4 4 3 3 2 1 1 39 RC17 Female 4 1 2 2 2 2 1 1 1 1 4 2 8 3 1 35 RC19 Male 1 1 2 2 3 3 2 1 9 5 2 2 7 3 2 4 49 RC20 Male 1 1 2 1 2 1 1 2 1 1 4 3 2 11 2 1 1 2 1 1 41 RC21 Male 7 1 6 3 2 1 5 10 8 11 1 1 1 57 RC22 Male 3 4 1 2 3 3 4 1 1 1 8 1 1 5 5 1 1 45 RC24 Female 1 5 1 1 5 1 3 1 1 1 1 3 2 4 6 1 1 38 RC25 Female 4 1 1 1 1 2 1 1 1 3 4 2 1 3 2 28 RC26 Male 2 7 3 6 5 1 2 4 4 2 1 2 1 1 41 RC27 Male 1 1 2 1 1 2 3 1 1 1 1 1 1 2 7 5 1 1 33 RC29 Female 3 1 2 4 1 5 3 2 3 1 1 2 1 3 1 33 RC30 Male 2 13 9 13 37 RC31 Male 4 7 3 7 13 16 11 61 RC32 Male 1 3 4 1 1 1 1 7 6 2 1 1 1 2 32 RC33 Male 2 1 5 1 2 4 4 2 1 3 25 RC34 Male 1 4 11 8 13 1 1 39 RC35 Male 7 7 4 4 4 3 8 1 2 5 10 9 23 4 1 92 RC36 Female 3 11 12 6 3 1 3 39 RC37 Female 1 5 11 2 5 3 2 2 1 1 1 1 35 RC38 Male 1 5 8 8 11 33 RC39 Female 8 8 11 3 1 2 2 35 RC40 Female 1 1 1 2 1 2 5 12 9 3 2 1 1 41
RC41 Not sexed 7 11 2 10 7 6 3 1 3 3 4 1 1 59
RC42 Female 2 1 4 6 2 1 2 7 14 4 43 RC43 Male 2 1 3 3 1 2 3 3 1 2 1 1 2 8 2 1 2 38 RC44 Male 4 7 2 5 2 1 3 2 1 12 5 2 3 6 3 1 59 RC45 Male 2 3 1 1 3 3 3 3 1 1 2 9 12 8 1 2 1 56
RC46 Not sexed 1 3 4 7 5 8 6 7 3 1 3 1 6 1 56
RC47 Male 4 7 2 2 6 3 5 3 2 1 1 1 2 2 2 5 48 RC48 Female 1 1 1 1 1 1 12 9 12 2 2 2 2 12 13 10 82
RC49 Not sexed 1 4 2 6 1 2 3 3 1 2 1 2 1 2 5 1 1 38
RC50 Female 2 3 5 1 1 2 1 1 4 6 14 5 3 1 49 RC51 Male 2 3 1 1 1 8 4 3 2 3 2 1 1 1 33 RC52 Female 6 1 2 1 2 1 3 2 5 1 1 2 3 2 5 9 2 6 5 2 1 62
RC54 Not sexed 5 6 4 7 4 7 3 2 3 1 1 4 3 1 51
RC55 Female 1 7 14 2 1 4 1 1 7 15 12 8 73 RC56 Female 3 11 14 1 2 3 34 RC57 Female 2 10 16 3 2 2 35 RC58 Male 4 7 12 2 1 6 1 33 RC59 Female 1 1 1 1 2 1 2 3 14 13 9 48 RC60 Male 1 7 14 7 3 4 6 42 RC62 Male 3 1 1 4 1 6 4 2 5 12 8 16 1 3 6 3 76 RC63 Female 5 7 14 4 1 31 Total Number of Points 84 90 54 123 69 86 71 107 84 35 90 207 215 398 116 71 161 127 39 72 118 102 65 2581 Total Number of Birds 25 24 21 33 25 31 32 34 30 28 30 38 38 51 40 35 43 32 21 24 18 20 15
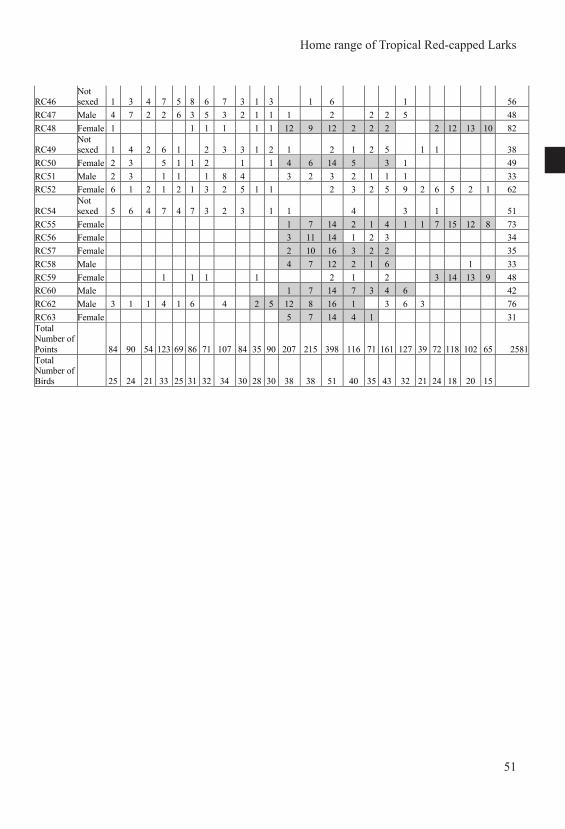
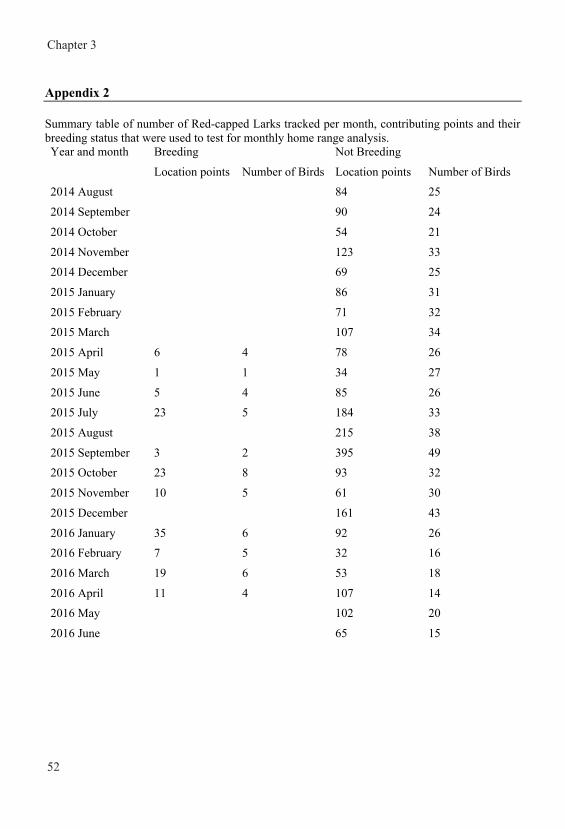
Chapter 3
52
Appendix 2 Summary table of number of Red-capped Larks tracked per month, contributing points and their breeding status that were used to test for monthly home range analysis. Year and month Breeding Not Breeding Location points Number of Birds Location points Number of Birds 2014 August 84 25 2014 September 90 24 2014 October 54 21 2014 November 123 33 2014 December 69 25 2015 January 86 31 2015 February 71 32 2015 March 107 34 2015 April 6 4 78 26 2015 May 1 1 34 27 2015 June 5 4 85 26 2015 July 23 5 184 33 2015 August 215 38 2015 September 3 2 395 49 2015 October 23 8 93 32 2015 November 10 5 61 30 2015 December 161 43 2016 January 35 6 92 26 2016 February 7 5 32 16 2016 March 19 6 53 18 2016 April 11 4 107 14 2016 May 102 20 2016 June 65 15
Appendix 3 General linear models with effects of rainfall (rain), maximum temperature (Tmax), minimum temperature (Tmin), EVI (EVI), ground invertebrate biomass (GIB), flying invertebrate biomass (FIB) and breeding intensity (BI) on monthly home range of Red-capped Larks. Models are ranked using Akaike’s information criterion corrected for small sample size (AICc). Only model results within weight ≤ 0.95 are included.
Intercept BI Tmax Tmin GIB Rain FIB EVI Df logLik AICc Delta weight 0.00 -0.56 -0.49 4.00 -19.39 49.45 0.00 0.20 0.00 -0.64 0.29 -0.39 5.00 -17.59 49.47 0.03 0.19 0.00 -0.50 -0.21 -0.53 5.00 -18.47 51.23 1.78 0.08 0.00 -0.59 0.19 -0.57 5.00 -18.63 51.54 2.10 0.07 0.00 -0.58 0.27 -0.17 -0.43 6.00 -16.83 52.12 2.67 0.05
-0.00 -0.69 0.44 4.00 -20.79 52.24 2.79 0.05 0.00 -0.62 0.11 -0.48 5.00 -19.22 52.72 3.28 0.04 0.00 -0.55 0.02 -0.49 5.00 -19.38 53.05 3.61 0.03 0.00 -0.64 0.26 0.10 -0.44 6.00 -17.39 53.24 3.79 0.03 0.00 -0.61 0.32 -0.07 -0.39 6.00 -17.53 53.52 4.07 0.03 0.00 -0.64 0.29 -0.00 -0.39 6.00 -17.59 53.65 4.20 0.02 0.00 -0.53 0.19 -0.20 -0.60 6.00 -17.69 53.85 4.40 0.02 0.00 -0.59 0.18 -0.24 -0.51 6.00 -17.98 54.41 4.97 0.02 0.00 -0.53 0.26 0.15 -0.57 6.00 -18.30 55.05 5.61 0.01
-0.00 -0.57 3.00 -23.86 55.22 5.77 0.01 0.00 -0.52 -0.22 -0.05 -0.54 6.00 -18.42 55.30 5.86 0.01
-0.00 -0.68 0.46 -0.11 5.00 -20.55 55.39 5.94 0.01 -0.00 -0.67 0.43 -0.08 5.00 -20.67 55.62 6.17 0.01 0.00 -0.59 0.02 0.19 -0.56 6.00 -18.63 55.71 6.27 0.01
-0.00 -0.66 0.43 0.06 5.00 -20.72 55.72 6.28 0.01 -0.00 -0.65 0.47 -0.08 5.00 -20.73 55.74 6.30 0.01 0.00 -0.59 0.23 0.10 -0.18 -0.49 7.00 -16.59 56.52 7.08 0.01 0.00 -0.61 0.14 0.07 -0.46 6.00 -19.15 56.76 7.32 0.01 0.00 -0.35 -0.57 4.00 -23.05 56.78 7.33 0.01 0.00 -0.61 0.27 -0.19 -0.06 -0.45 7.00 -16.74 56.82 7.37 0.00 0.00 -0.59 0.26 0.02 -0.18 -0.43 7.00 -16.83 56.99 7.54 0.00 0.00 -0.51 3.00 -24.86 57.21 7.77 0.00 0.00 -0.69 0.20 4.00 -23.44 57.55 8.11 0.00 0.00 -0.59 0.29 -0.12 0.13 -0.46 7.00 -17.22 57.76 8.32 0.00 0.00 -0.61 0.24 0.14 0.07 -0.45 7.00 -17.31 57.96 8.51 0.00
Home range of Tropical Red-capped Larks
53
Appendix 2 Summary table of number of Red-capped Larks tracked per month, contributing points and their breeding status that were used to test for monthly home range analysis. Year and month Breeding Not Breeding Location points Number of Birds Location points Number of Birds 2014 August 84 25 2014 September 90 24 2014 October 54 21 2014 November 123 33 2014 December 69 25 2015 January 86 31 2015 February 71 32 2015 March 107 34 2015 April 6 4 78 26 2015 May 1 1 34 27 2015 June 5 4 85 26 2015 July 23 5 184 33 2015 August 215 38 2015 September 3 2 395 49 2015 October 23 8 93 32 2015 November 10 5 61 30 2015 December 161 43 2016 January 35 6 92 26 2016 February 7 5 32 16 2016 March 19 6 53 18 2016 April 11 4 107 14 2016 May 102 20 2016 June 65 15
Appendix 3 General linear models with effects of rainfall (rain), maximum temperature (Tmax), minimum temperature (Tmin), EVI (EVI), ground invertebrate biomass (GIB), flying invertebrate biomass (FIB) and breeding intensity (BI) on monthly home range of Red-capped Larks. Models are ranked using Akaike’s information criterion corrected for small sample size (AICc). Only model results within weight ≤ 0.95 are included.
Intercept BI Tmax Tmin GIB Rain FIB EVI Df logLik AICc Delta weight 0.00 -0.56 -0.49 4.00 -19.39 49.45 0.00 0.20 0.00 -0.64 0.29 -0.39 5.00 -17.59 49.47 0.03 0.19 0.00 -0.50 -0.21 -0.53 5.00 -18.47 51.23 1.78 0.08 0.00 -0.59 0.19 -0.57 5.00 -18.63 51.54 2.10 0.07 0.00 -0.58 0.27 -0.17 -0.43 6.00 -16.83 52.12 2.67 0.05
-0.00 -0.69 0.44 4.00 -20.79 52.24 2.79 0.05 0.00 -0.62 0.11 -0.48 5.00 -19.22 52.72 3.28 0.04 0.00 -0.55 0.02 -0.49 5.00 -19.38 53.05 3.61 0.03 0.00 -0.64 0.26 0.10 -0.44 6.00 -17.39 53.24 3.79 0.03 0.00 -0.61 0.32 -0.07 -0.39 6.00 -17.53 53.52 4.07 0.03 0.00 -0.64 0.29 -0.00 -0.39 6.00 -17.59 53.65 4.20 0.02 0.00 -0.53 0.19 -0.20 -0.60 6.00 -17.69 53.85 4.40 0.02 0.00 -0.59 0.18 -0.24 -0.51 6.00 -17.98 54.41 4.97 0.02 0.00 -0.53 0.26 0.15 -0.57 6.00 -18.30 55.05 5.61 0.01
-0.00 -0.57 3.00 -23.86 55.22 5.77 0.01 0.00 -0.52 -0.22 -0.05 -0.54 6.00 -18.42 55.30 5.86 0.01
-0.00 -0.68 0.46 -0.11 5.00 -20.55 55.39 5.94 0.01 -0.00 -0.67 0.43 -0.08 5.00 -20.67 55.62 6.17 0.01 0.00 -0.59 0.02 0.19 -0.56 6.00 -18.63 55.71 6.27 0.01
-0.00 -0.66 0.43 0.06 5.00 -20.72 55.72 6.28 0.01 -0.00 -0.65 0.47 -0.08 5.00 -20.73 55.74 6.30 0.01 0.00 -0.59 0.23 0.10 -0.18 -0.49 7.00 -16.59 56.52 7.08 0.01 0.00 -0.61 0.14 0.07 -0.46 6.00 -19.15 56.76 7.32 0.01 0.00 -0.35 -0.57 4.00 -23.05 56.78 7.33 0.01 0.00 -0.61 0.27 -0.19 -0.06 -0.45 7.00 -16.74 56.82 7.37 0.00 0.00 -0.59 0.26 0.02 -0.18 -0.43 7.00 -16.83 56.99 7.54 0.00 0.00 -0.51 3.00 -24.86 57.21 7.77 0.00 0.00 -0.69 0.20 4.00 -23.44 57.55 8.11 0.00 0.00 -0.59 0.29 -0.12 0.13 -0.46 7.00 -17.22 57.76 8.32 0.00 0.00 -0.61 0.24 0.14 0.07 -0.45 7.00 -17.31 57.96 8.51 0.00
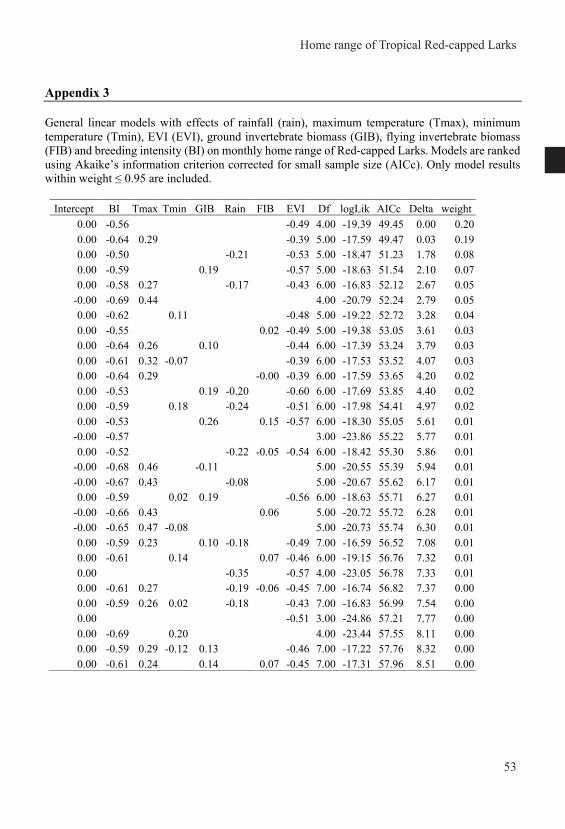
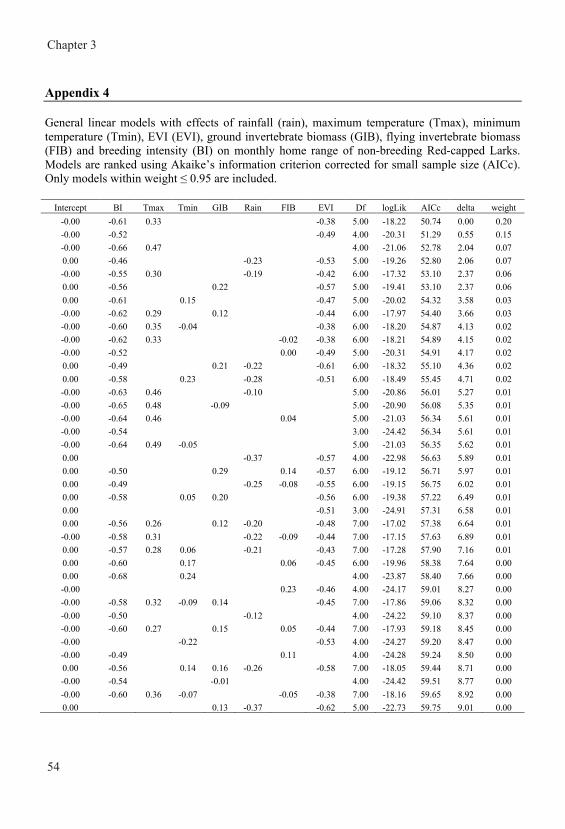
Chapter 3
54
Appendix 4 General linear models with effects of rainfall (rain), maximum temperature (Tmax), minimum temperature (Tmin), EVI (EVI), ground invertebrate biomass (GIB), flying invertebrate biomass (FIB) and breeding intensity (BI) on monthly home range of non-breeding Red-capped Larks. Models are ranked using Akaike’s information criterion corrected for small sample size (AICc). Only models within weight ≤ 0.95 are included.
Intercept BI Tmax Tmin GIB Rain FIB EVI Df logLik AICc delta weight -0.00 -0.61 0.33 -0.38 5.00 -18.22 50.74 0.00 0.20 -0.00 -0.52 -0.49 4.00 -20.31 51.29 0.55 0.15 -0.00 -0.66 0.47 4.00 -21.06 52.78 2.04 0.07 0.00 -0.46 -0.23 -0.53 5.00 -19.26 52.80 2.06 0.07 -0.00 -0.55 0.30 -0.19 -0.42 6.00 -17.32 53.10 2.37 0.06 0.00 -0.56 0.22 -0.57 5.00 -19.41 53.10 2.37 0.06 0.00 -0.61 0.15 -0.47 5.00 -20.02 54.32 3.58 0.03 -0.00 -0.62 0.29 0.12 -0.44 6.00 -17.97 54.40 3.66 0.03 -0.00 -0.60 0.35 -0.04 -0.38 6.00 -18.20 54.87 4.13 0.02 -0.00 -0.62 0.33 -0.02 -0.38 6.00 -18.21 54.89 4.15 0.02 -0.00 -0.52 0.00 -0.49 5.00 -20.31 54.91 4.17 0.02 0.00 -0.49 0.21 -0.22 -0.61 6.00 -18.32 55.10 4.36 0.02 0.00 -0.58 0.23 -0.28 -0.51 6.00 -18.49 55.45 4.71 0.02 -0.00 -0.63 0.46 -0.10 5.00 -20.86 56.01 5.27 0.01 -0.00 -0.65 0.48 -0.09 5.00 -20.90 56.08 5.35 0.01 -0.00 -0.64 0.46 0.04 5.00 -21.03 56.34 5.61 0.01 -0.00 -0.54 3.00 -24.42 56.34 5.61 0.01 -0.00 -0.64 0.49 -0.05 5.00 -21.03 56.35 5.62 0.01 0.00 -0.37 -0.57 4.00 -22.98 56.63 5.89 0.01 0.00 -0.50 0.29 0.14 -0.57 6.00 -19.12 56.71 5.97 0.01 0.00 -0.49 -0.25 -0.08 -0.55 6.00 -19.15 56.75 6.02 0.01 0.00 -0.58 0.05 0.20 -0.56 6.00 -19.38 57.22 6.49 0.01 0.00 -0.51 3.00 -24.91 57.31 6.58 0.01 0.00 -0.56 0.26 0.12 -0.20 -0.48 7.00 -17.02 57.38 6.64 0.01 -0.00 -0.58 0.31 -0.22 -0.09 -0.44 7.00 -17.15 57.63 6.89 0.01 0.00 -0.57 0.28 0.06 -0.21 -0.43 7.00 -17.28 57.90 7.16 0.01 0.00 -0.60 0.17 0.06 -0.45 6.00 -19.96 58.38 7.64 0.00 0.00 -0.68 0.24 4.00 -23.87 58.40 7.66 0.00 -0.00 0.23 -0.46 4.00 -24.17 59.01 8.27 0.00 -0.00 -0.58 0.32 -0.09 0.14 -0.45 7.00 -17.86 59.06 8.32 0.00 -0.00 -0.50 -0.12 4.00 -24.22 59.10 8.37 0.00 -0.00 -0.60 0.27 0.15 0.05 -0.44 7.00 -17.93 59.18 8.45 0.00 -0.00 -0.22 -0.53 4.00 -24.27 59.20 8.47 0.00 -0.00 -0.49 0.11 4.00 -24.28 59.24 8.50 0.00 0.00 -0.56 0.14 0.16 -0.26 -0.58 7.00 -18.05 59.44 8.71 0.00 -0.00 -0.54 -0.01 4.00 -24.42 59.51 8.77 0.00 -0.00 -0.60 0.36 -0.07 -0.05 -0.38 7.00 -18.16 59.65 8.92 0.00 0.00 0.13 -0.37 -0.62 5.00 -22.73 59.75 9.01 0.00
A
ppen
dix
5 Te
mpo
ral v
aria
tion
durin
g A
ugus
t 201
4 –
June
201
6 in
(A) m
onth
ly h
ome
rang
e of
Red
-cap
ped
Lark
s, (B
) rai
nfal
l (m
m),
(C) a
vera
ge
mon
thly
min
imum
(Tm
in) a
nd m
axim
um (T
max
) tem
pera
ture
(ºC)
, (D
) EV
I (EV
I), (E
) bio
mas
ses (
g dr
y w
eigh
t) of
gro
und-
dwel
ling
and
flyin
g in
verte
brat
es, a
nd (F
) bre
edin
g in
tens
ity (n
umbe
r of n
ests/
10 se
arch
hou
rs) i
n K
edon
g Ra
nch,
Ken
ya.
Mon
thly
rain
fall
aver
aged
37.
2 ±
36.9
1 m
m (r
ange
1.2
- 14
5.49
mm
; B),
mos
t mon
ths
rece
ivin
g be
twee
n 10
mm
and
55
mm
of r
ain.
Th
e m
onth
ly m
ean
max
imum
tem
pera
ture
was
23.
1°C
± 2.
90 s
d (ra
nge
16.3
5 - 2
8.14
), w
hile
the
mea
n m
inim
um te
mpa
ratu
re e
qual
ed
11.9
°C ±
1.1
5 sd
(ran
ge 9
.47
- 13.
85) (
C). M
onth
ly m
ean
EVI w
as 0
.44
± 0.
10 sd
(ran
ge 0
.26
- 0.6
1) (D
). M
onth
ly g
roun
d in
verte
brat
e dr
y bi
omas
s ave
rage
d 17
.4 g
± 1
0.71
sd (
rang
e 4.
95 -
39.5
6) w
hile
flyi
ng in
verte
brat
e dr
y bi
omas
s was
24.
2 g
± 11
.64
sd (
rang
e 8.
69 -
45.4
2; E
). Re
d-ca
pped
Lar
ks n
este
d in
19
of th
e 23
mon
ths
mon
itore
d (F
). M
ean
bree
ding
inte
nsity
was
0.5
1 ±
0.52
sd
nests
/10
hour
s se
arch
effo
rt (ra
nge
0 - 1
.64)
.
Home range of Tropical Red-capped Larks
55
Appendix 4 General linear models with effects of rainfall (rain), maximum temperature (Tmax), minimum temperature (Tmin), EVI (EVI), ground invertebrate biomass (GIB), flying invertebrate biomass (FIB) and breeding intensity (BI) on monthly home range of non-breeding Red-capped Larks. Models are ranked using Akaike’s information criterion corrected for small sample size (AICc). Only models within weight ≤ 0.95 are included.
Intercept BI Tmax Tmin GIB Rain FIB EVI Df logLik AICc delta weight -0.00 -0.61 0.33 -0.38 5.00 -18.22 50.74 0.00 0.20 -0.00 -0.52 -0.49 4.00 -20.31 51.29 0.55 0.15 -0.00 -0.66 0.47 4.00 -21.06 52.78 2.04 0.07 0.00 -0.46 -0.23 -0.53 5.00 -19.26 52.80 2.06 0.07 -0.00 -0.55 0.30 -0.19 -0.42 6.00 -17.32 53.10 2.37 0.06 0.00 -0.56 0.22 -0.57 5.00 -19.41 53.10 2.37 0.06 0.00 -0.61 0.15 -0.47 5.00 -20.02 54.32 3.58 0.03 -0.00 -0.62 0.29 0.12 -0.44 6.00 -17.97 54.40 3.66 0.03 -0.00 -0.60 0.35 -0.04 -0.38 6.00 -18.20 54.87 4.13 0.02 -0.00 -0.62 0.33 -0.02 -0.38 6.00 -18.21 54.89 4.15 0.02 -0.00 -0.52 0.00 -0.49 5.00 -20.31 54.91 4.17 0.02 0.00 -0.49 0.21 -0.22 -0.61 6.00 -18.32 55.10 4.36 0.02 0.00 -0.58 0.23 -0.28 -0.51 6.00 -18.49 55.45 4.71 0.02 -0.00 -0.63 0.46 -0.10 5.00 -20.86 56.01 5.27 0.01 -0.00 -0.65 0.48 -0.09 5.00 -20.90 56.08 5.35 0.01 -0.00 -0.64 0.46 0.04 5.00 -21.03 56.34 5.61 0.01 -0.00 -0.54 3.00 -24.42 56.34 5.61 0.01 -0.00 -0.64 0.49 -0.05 5.00 -21.03 56.35 5.62 0.01 0.00 -0.37 -0.57 4.00 -22.98 56.63 5.89 0.01 0.00 -0.50 0.29 0.14 -0.57 6.00 -19.12 56.71 5.97 0.01 0.00 -0.49 -0.25 -0.08 -0.55 6.00 -19.15 56.75 6.02 0.01 0.00 -0.58 0.05 0.20 -0.56 6.00 -19.38 57.22 6.49 0.01 0.00 -0.51 3.00 -24.91 57.31 6.58 0.01 0.00 -0.56 0.26 0.12 -0.20 -0.48 7.00 -17.02 57.38 6.64 0.01 -0.00 -0.58 0.31 -0.22 -0.09 -0.44 7.00 -17.15 57.63 6.89 0.01 0.00 -0.57 0.28 0.06 -0.21 -0.43 7.00 -17.28 57.90 7.16 0.01 0.00 -0.60 0.17 0.06 -0.45 6.00 -19.96 58.38 7.64 0.00 0.00 -0.68 0.24 4.00 -23.87 58.40 7.66 0.00 -0.00 0.23 -0.46 4.00 -24.17 59.01 8.27 0.00 -0.00 -0.58 0.32 -0.09 0.14 -0.45 7.00 -17.86 59.06 8.32 0.00 -0.00 -0.50 -0.12 4.00 -24.22 59.10 8.37 0.00 -0.00 -0.60 0.27 0.15 0.05 -0.44 7.00 -17.93 59.18 8.45 0.00 -0.00 -0.22 -0.53 4.00 -24.27 59.20 8.47 0.00 -0.00 -0.49 0.11 4.00 -24.28 59.24 8.50 0.00 0.00 -0.56 0.14 0.16 -0.26 -0.58 7.00 -18.05 59.44 8.71 0.00 -0.00 -0.54 -0.01 4.00 -24.42 59.51 8.77 0.00 -0.00 -0.60 0.36 -0.07 -0.05 -0.38 7.00 -18.16 59.65 8.92 0.00 0.00 0.13 -0.37 -0.62 5.00 -22.73 59.75 9.01 0.00
A
ppen
dix
5 Te
mpo
ral v
aria
tion
durin
g A
ugus
t 201
4 –
June
201
6 in
(A) m
onth
ly h
ome
rang
e of
Red
-cap
ped
Lark
s, (B
) rai
nfal
l (m
m),
(C) a
vera
ge
mon
thly
min
imum
(Tm
in) a
nd m
axim
um (T
max
) tem
pera
ture
(ºC)
, (D
) EV
I (EV
I), (E
) bio
mas
ses (
g dr
y w
eigh
t) of
gro
und-
dwel
ling
and
flyin
g in
verte
brat
es, a
nd (F
) bre
edin
g in
tens
ity (n
umbe
r of n
ests/
10 se
arch
hou
rs) i
n K
edon
g Ra
nch,
Ken
ya.
Mon
thly
rain
fall
aver
aged
37.
2 ±
36.9
1 m
m (r
ange
1.2
- 14
5.49
mm
; B),
mos
t mon
ths
rece
ivin
g be
twee
n 10
mm
and
55
mm
of r
ain.
Th
e m
onth
ly m
ean
max
imum
tem
pera
ture
was
23.
1°C
± 2.
90 s
d (ra
nge
16.3
5 - 2
8.14
), w
hile
the
mea
n m
inim
um te
mpa
ratu
re e
qual
ed
11.9
°C ±
1.1
5 sd
(ran
ge 9
.47
- 13.
85) (
C). M
onth
ly m
ean
EVI w
as 0
.44
± 0.
10 sd
(ran
ge 0
.26
- 0.6
1) (D
). M
onth
ly g
roun
d in
verte
brat
e dr
y bi
omas
s ave
rage
d 17
.4 g
± 1
0.71
sd (
rang
e 4.
95 -
39.5
6) w
hile
flyi
ng in
verte
brat
e dr
y bi
omas
s was
24.
2 g
± 11
.64
sd (
rang
e 8.
69 -
45.4
2; E
). Re
d-ca
pped
Lar
ks n
este
d in
19
of th
e 23
mon
ths
mon
itore
d (F
). M
ean
bree
ding
inte
nsity
was
0.5
1 ±
0.52
sd
nests
/10
hour
s se
arch
effo
rt (ra
nge
0 - 1
.64)
.
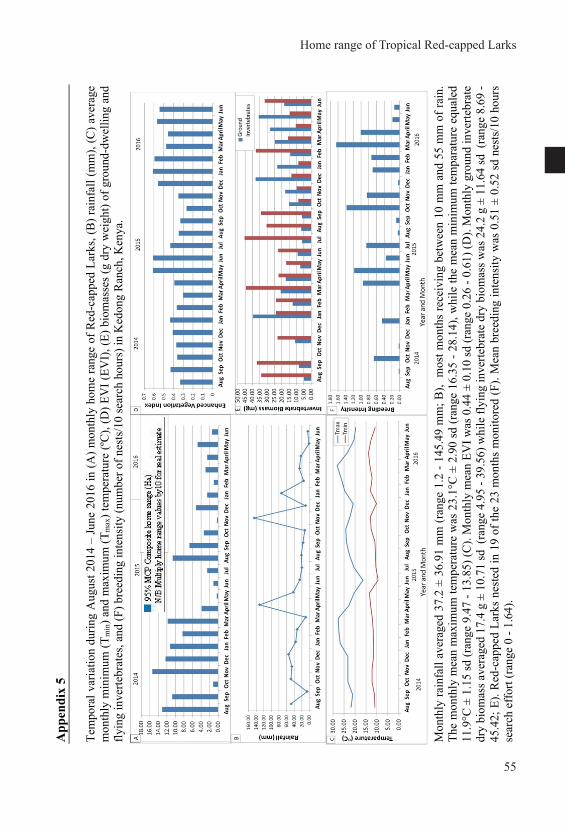
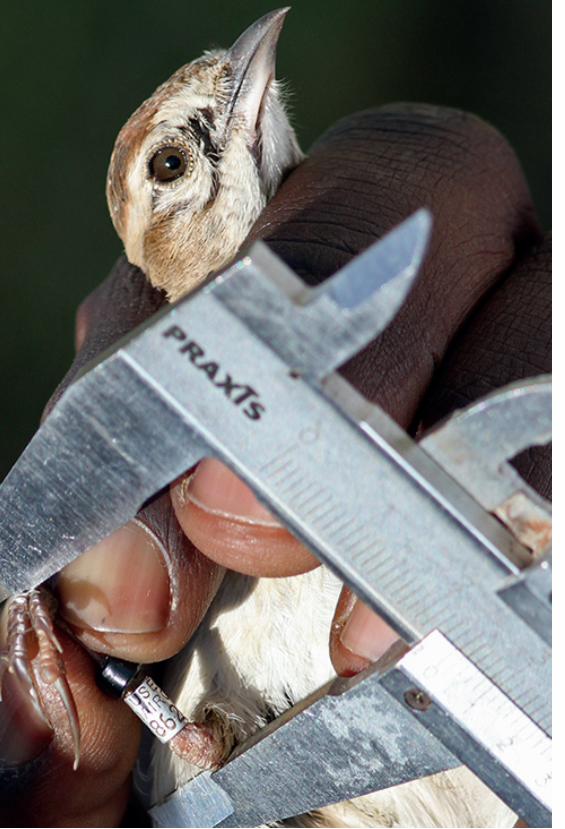
Chapter 4
Body mass decreases with more favorable social-environmental conditions independent of life history stage in a stochastic
aseasonal environment
Joseph Mwangi
Henry K. Ndithia
Maaike A, Versteegh
Muchane Muchai
B. Irene Tieleman
Unpublished manuscript
Chapter 4
Body mass decreases with more favorable social-environmental conditions independent of life history stage in a stochastic
aseasonal environment
Joseph Mwangi
Henry K. Ndithia
Maaike A, Versteegh
Muchane Muchai
B. Irene Tieleman
Unpublished manuscript
Chapter 4
Body mass decreases with more favorable social-environmental conditions independent of life history stage in a stochastic
aseasonal environment
Joseph Mwangi
Henry K. Ndithia
Maaike A, Versteegh
Muchane Muchai
B. Irene Tieleman
Unpublished manuscript
Chapter 4
Body mass decreases with more favorable social-environmental conditions independent of life history stage in a stochastic
aseasonal environment
Joseph Mwangi
Henry K. Ndithia
Maaike A, Versteegh
Muchane Muchai
B. Irene Tieleman
Unpublished manuscript
Chapter 4
58
While adaptive regulation of body mass with life history stage or food and weather has been shown before in the wild, earlier studies have been unable to tease apart their independent contributions because they were conducted in seasonal environments where life history stage covaries with environmental conditions. Whether seasonal or temporal variation in body mass results from phenotypically plastic responses to current environmental conditions or from evolutionary adaptation to long term patterns is also not clear, yet very relevant in light of reports about disruption of the fit between fixed annual programs of birds and environmental variation due to climate change. Hence, we examined body mass variation in Red-capped Larks in an equatorial system that was previously described as seasonal but currently stochastic, and asked (1). Is body mass variation better explained by evolutionary adaptation to long term weather patterns or by phenotypically plastic responses to current weather conditions? (2). How strong of a cue are weather patterns in predicting future food availability or does food vary in an unpredictable manner, and if so, (3). Do Red-capped Larks’ body masses vary dependent on life history stage or increase with higher food availability to buffer against unanticipated harsh times in the stochastic environment, independent of life history stage? In this study we found the phenotypically plastic response of body mass to weather differed between sexes which may reflect differing sex linked fitness costs to plasticity. Contrary to prediction, we provide strong evidence that despite the unpredictable and stochastic environment Red-capped larks reduced body mass with increased food and favorable weather. However, body mass did not differ between birds in quiescence and birds in breeding although molting females were lighter than females in quiescence and in breeding. These observations suggest that Red-capped larks maintain preparedness year-round to opportunistically breed but are leaner during molting that entails aerodynamic costs due to missing flight feathers.
Introduction It is well-established by both theoretical and empirical studies that body mass of birds reflects a trade-off between having extra body reserves to reduce the risk of starvation (the starvation hypothesis) and having the lowest mass possible to maximize the chance of escape from predators (the mass-dependent predation hypotheses); a phenomenon termed adaptive body mass regulation (e.g. Ekman & Hake 1990, Lilliendahl 1997, Ratikainen and Wright 2013). Increased body mass resultant of higher body reserves allows birds to survive better during harsh environmental conditions e.g. food shortage (Ratikainen and Wright 2013). In addition, it allows individuals to engage in energy demanding activities of self maintenance and breeding when energy requirements may exceed energy intake (Lima 1986). However, associated costs of attaining and maintaining high body mass are manifold and include increased energy costs of locomotion, hampered movement during foraging, and higher predation vulnerability due to reduced agility and speed and/or more intensive foraging (Lima, 1986; Zimmer et al., 2011; Heldstab et al., 2017). Body reserves in birds are therefore maintained below the physiological capacity at an optimal level dependent on the trade-off between benefits and costs, and shaped by a bird’s environment (Brodin 2001, Nettle et al. 2017, Ekman and Hake 1990, Lilliendahl 1997) and the energy requirements associated with the various life history stages (Yasué et al. 2003, Hoye and Buttemer 2011).
In seasonal environments, including temperate environments and tropical areas with distinct dry and wet seasons, environmental factors influencing adaptive body mass variation such as rainfall, ambient temperature and food availability are highly correlated. Similarly, energetically intensive life history events such as breeding and molting are highly synchronized with the seasonal weather patterns and generally occur during peak food availability (Drent and Daan 1980, Sharp 1996, Wikelski et al. 2000). For birds in these environments, adaptive body mass therefore changes in a preprogrammed seasonal pattern in simultaneous response to environmental conditions and life history stage demands (Cresswell 1998, Macleod et al. 2005). In contrast, non-seasonal environments, including some equatorial tropical environments in East Africa, experience stochastic fluctuations in food availability and weather, both within and between years. Birds living in these areas are faced with a challenge in planning and often breed year-round. In these stochastic environments it has been suggested that birds should constantly maintain reserves to opportunistically breed and molt (Vleck and Priedkalns 1985), because they (1) cannot fully anticipate the expected start of favorable environmental conditions for breeding and (2) cannot respond immediately to changes in the environment (because physiological preparations take considerable time) (Tökölyi et al. 2012). While some studies have investigated the effect of either life history stage (Moreno 1989, Swaddle and Witter 1997, Nwaogu et al. 2017) or food and environment (Cuthill et al. 2000, Cresswell 2003, Macleod and Gosler 2006, Cooper 2007) separately on body mass variation, we are not aware of studies that have considered these factors simultaneously. Yet, non-seasonal environments with year round breeding are especially suited to simultaneously study and disentangle effects of environment (weather and food availability) and life history stage in adaptive body mass regulation.
For birds living in stochastic equatorial tropical environments the optimal strategy of body mass regulation will depend on the predictive power of local environmental cues (Cuthill et al. 2000). Whereas in predictable seasonal environments, evolutionary adaptations of annual programs of body mass change have been found, in unpredictable or non-seasonal environments, phenotypically plastic ability to adjust to the environment in real time at the moment may be the better strategy (Sergio et al. 2011). Studies analyzing phenology, determinants and influences of
AB
STR
AC
TBody mass variation in a stochastic aseasonal environment
59
While adaptive regulation of body mass with life history stage or food and weather has been shown before in the wild, earlier studies have been unable to tease apart their independent contributions because they were conducted in seasonal environments where life history stage covaries with environmental conditions. Whether seasonal or temporal variation in body mass results from phenotypically plastic responses to current environmental conditions or from evolutionary adaptation to long term patterns is also not clear, yet very relevant in light of reports about disruption of the fit between fixed annual programs of birds and environmental variation due to climate change. Hence, we examined body mass variation in Red-capped Larks in an equatorial system that was previously described as seasonal but currently stochastic, and asked (1). Is body mass variation better explained by evolutionary adaptation to long term weather patterns or by phenotypically plastic responses to current weather conditions? (2). How strong of a cue are weather patterns in predicting future food availability or does food vary in an unpredictable manner, and if so, (3). Do Red-capped Larks’ body masses vary dependent on life history stage or increase with higher food availability to buffer against unanticipated harsh times in the stochastic environment, independent of life history stage? In this study we found the phenotypically plastic response of body mass to weather differed between sexes which may reflect differing sex linked fitness costs to plasticity. Contrary to prediction, we provide strong evidence that despite the unpredictable and stochastic environment Red-capped larks reduced body mass with increased food and favorable weather. However, body mass did not differ between birds in quiescence and birds in breeding although molting females were lighter than females in quiescence and in breeding. These observations suggest that Red-capped larks maintain preparedness year-round to opportunistically breed but are leaner during molting that entails aerodynamic costs due to missing flight feathers.
Introduction It is well-established by both theoretical and empirical studies that body mass of birds reflects a trade-off between having extra body reserves to reduce the risk of starvation (the starvation hypothesis) and having the lowest mass possible to maximize the chance of escape from predators (the mass-dependent predation hypotheses); a phenomenon termed adaptive body mass regulation (e.g. Ekman & Hake 1990, Lilliendahl 1997, Ratikainen and Wright 2013). Increased body mass resultant of higher body reserves allows birds to survive better during harsh environmental conditions e.g. food shortage (Ratikainen and Wright 2013). In addition, it allows individuals to engage in energy demanding activities of self maintenance and breeding when energy requirements may exceed energy intake (Lima 1986). However, associated costs of attaining and maintaining high body mass are manifold and include increased energy costs of locomotion, hampered movement during foraging, and higher predation vulnerability due to reduced agility and speed and/or more intensive foraging (Lima, 1986; Zimmer et al., 2011; Heldstab et al., 2017). Body reserves in birds are therefore maintained below the physiological capacity at an optimal level dependent on the trade-off between benefits and costs, and shaped by a bird’s environment (Brodin 2001, Nettle et al. 2017, Ekman and Hake 1990, Lilliendahl 1997) and the energy requirements associated with the various life history stages (Yasué et al. 2003, Hoye and Buttemer 2011).
In seasonal environments, including temperate environments and tropical areas with distinct dry and wet seasons, environmental factors influencing adaptive body mass variation such as rainfall, ambient temperature and food availability are highly correlated. Similarly, energetically intensive life history events such as breeding and molting are highly synchronized with the seasonal weather patterns and generally occur during peak food availability (Drent and Daan 1980, Sharp 1996, Wikelski et al. 2000). For birds in these environments, adaptive body mass therefore changes in a preprogrammed seasonal pattern in simultaneous response to environmental conditions and life history stage demands (Cresswell 1998, Macleod et al. 2005). In contrast, non-seasonal environments, including some equatorial tropical environments in East Africa, experience stochastic fluctuations in food availability and weather, both within and between years. Birds living in these areas are faced with a challenge in planning and often breed year-round. In these stochastic environments it has been suggested that birds should constantly maintain reserves to opportunistically breed and molt (Vleck and Priedkalns 1985), because they (1) cannot fully anticipate the expected start of favorable environmental conditions for breeding and (2) cannot respond immediately to changes in the environment (because physiological preparations take considerable time) (Tökölyi et al. 2012). While some studies have investigated the effect of either life history stage (Moreno 1989, Swaddle and Witter 1997, Nwaogu et al. 2017) or food and environment (Cuthill et al. 2000, Cresswell 2003, Macleod and Gosler 2006, Cooper 2007) separately on body mass variation, we are not aware of studies that have considered these factors simultaneously. Yet, non-seasonal environments with year round breeding are especially suited to simultaneously study and disentangle effects of environment (weather and food availability) and life history stage in adaptive body mass regulation.
For birds living in stochastic equatorial tropical environments the optimal strategy of body mass regulation will depend on the predictive power of local environmental cues (Cuthill et al. 2000). Whereas in predictable seasonal environments, evolutionary adaptations of annual programs of body mass change have been found, in unpredictable or non-seasonal environments, phenotypically plastic ability to adjust to the environment in real time at the moment may be the better strategy (Sergio et al. 2011). Studies analyzing phenology, determinants and influences of
Chapter 4
58
While adaptive regulation of body mass with life history stage or food and weather has been shown before in the wild, earlier studies have been unable to tease apart their independent contributions because they were conducted in seasonal environments where life history stage covaries with environmental conditions. Whether seasonal or temporal variation in body mass results from phenotypically plastic responses to current environmental conditions or from evolutionary adaptation to long term patterns is also not clear, yet very relevant in light of reports about disruption of the fit between fixed annual programs of birds and environmental variation due to climate change. Hence, we examined body mass variation in Red-capped Larks in an equatorial system that was previously described as seasonal but currently stochastic, and asked (1). Is body mass variation better explained by evolutionary adaptation to long term weather patterns or by phenotypically plastic responses to current weather conditions? (2). How strong of a cue are weather patterns in predicting future food availability or does food vary in an unpredictable manner, and if so, (3). Do Red-capped Larks’ body masses vary dependent on life history stage or increase with higher food availability to buffer against unanticipated harsh times in the stochastic environment, independent of life history stage? In this study we found the phenotypically plastic response of body mass to weather differed between sexes which may reflect differing sex linked fitness costs to plasticity. Contrary to prediction, we provide strong evidence that despite the unpredictable and stochastic environment Red-capped larks reduced body mass with increased food and favorable weather. However, body mass did not differ between birds in quiescence and birds in breeding although molting females were lighter than females in quiescence and in breeding. These observations suggest that Red-capped larks maintain preparedness year-round to opportunistically breed but are leaner during molting that entails aerodynamic costs due to missing flight feathers.
Introduction It is well-established by both theoretical and empirical studies that body mass of birds reflects a trade-off between having extra body reserves to reduce the risk of starvation (the starvation hypothesis) and having the lowest mass possible to maximize the chance of escape from predators (the mass-dependent predation hypotheses); a phenomenon termed adaptive body mass regulation (e.g. Ekman & Hake 1990, Lilliendahl 1997, Ratikainen and Wright 2013). Increased body mass resultant of higher body reserves allows birds to survive better during harsh environmental conditions e.g. food shortage (Ratikainen and Wright 2013). In addition, it allows individuals to engage in energy demanding activities of self maintenance and breeding when energy requirements may exceed energy intake (Lima 1986). However, associated costs of attaining and maintaining high body mass are manifold and include increased energy costs of locomotion, hampered movement during foraging, and higher predation vulnerability due to reduced agility and speed and/or more intensive foraging (Lima, 1986; Zimmer et al., 2011; Heldstab et al., 2017). Body reserves in birds are therefore maintained below the physiological capacity at an optimal level dependent on the trade-off between benefits and costs, and shaped by a bird’s environment (Brodin 2001, Nettle et al. 2017, Ekman and Hake 1990, Lilliendahl 1997) and the energy requirements associated with the various life history stages (Yasué et al. 2003, Hoye and Buttemer 2011).
In seasonal environments, including temperate environments and tropical areas with distinct dry and wet seasons, environmental factors influencing adaptive body mass variation such as rainfall, ambient temperature and food availability are highly correlated. Similarly, energetically intensive life history events such as breeding and molting are highly synchronized with the seasonal weather patterns and generally occur during peak food availability (Drent and Daan 1980, Sharp 1996, Wikelski et al. 2000). For birds in these environments, adaptive body mass therefore changes in a preprogrammed seasonal pattern in simultaneous response to environmental conditions and life history stage demands (Cresswell 1998, Macleod et al. 2005). In contrast, non-seasonal environments, including some equatorial tropical environments in East Africa, experience stochastic fluctuations in food availability and weather, both within and between years. Birds living in these areas are faced with a challenge in planning and often breed year-round. In these stochastic environments it has been suggested that birds should constantly maintain reserves to opportunistically breed and molt (Vleck and Priedkalns 1985), because they (1) cannot fully anticipate the expected start of favorable environmental conditions for breeding and (2) cannot respond immediately to changes in the environment (because physiological preparations take considerable time) (Tökölyi et al. 2012). While some studies have investigated the effect of either life history stage (Moreno 1989, Swaddle and Witter 1997, Nwaogu et al. 2017) or food and environment (Cuthill et al. 2000, Cresswell 2003, Macleod and Gosler 2006, Cooper 2007) separately on body mass variation, we are not aware of studies that have considered these factors simultaneously. Yet, non-seasonal environments with year round breeding are especially suited to simultaneously study and disentangle effects of environment (weather and food availability) and life history stage in adaptive body mass regulation.
For birds living in stochastic equatorial tropical environments the optimal strategy of body mass regulation will depend on the predictive power of local environmental cues (Cuthill et al. 2000). Whereas in predictable seasonal environments, evolutionary adaptations of annual programs of body mass change have been found, in unpredictable or non-seasonal environments, phenotypically plastic ability to adjust to the environment in real time at the moment may be the better strategy (Sergio et al. 2011). Studies analyzing phenology, determinants and influences of
AB
STR
AC
T
Body mass variation in a stochastic aseasonal environment
59
While adaptive regulation of body mass with life history stage or food and weather has been shown before in the wild, earlier studies have been unable to tease apart their independent contributions because they were conducted in seasonal environments where life history stage covaries with environmental conditions. Whether seasonal or temporal variation in body mass results from phenotypically plastic responses to current environmental conditions or from evolutionary adaptation to long term patterns is also not clear, yet very relevant in light of reports about disruption of the fit between fixed annual programs of birds and environmental variation due to climate change. Hence, we examined body mass variation in Red-capped Larks in an equatorial system that was previously described as seasonal but currently stochastic, and asked (1). Is body mass variation better explained by evolutionary adaptation to long term weather patterns or by phenotypically plastic responses to current weather conditions? (2). How strong of a cue are weather patterns in predicting future food availability or does food vary in an unpredictable manner, and if so, (3). Do Red-capped Larks’ body masses vary dependent on life history stage or increase with higher food availability to buffer against unanticipated harsh times in the stochastic environment, independent of life history stage? In this study we found the phenotypically plastic response of body mass to weather differed between sexes which may reflect differing sex linked fitness costs to plasticity. Contrary to prediction, we provide strong evidence that despite the unpredictable and stochastic environment Red-capped larks reduced body mass with increased food and favorable weather. However, body mass did not differ between birds in quiescence and birds in breeding although molting females were lighter than females in quiescence and in breeding. These observations suggest that Red-capped larks maintain preparedness year-round to opportunistically breed but are leaner during molting that entails aerodynamic costs due to missing flight feathers.
Introduction It is well-established by both theoretical and empirical studies that body mass of birds reflects a trade-off between having extra body reserves to reduce the risk of starvation (the starvation hypothesis) and having the lowest mass possible to maximize the chance of escape from predators (the mass-dependent predation hypotheses); a phenomenon termed adaptive body mass regulation (e.g. Ekman & Hake 1990, Lilliendahl 1997, Ratikainen and Wright 2013). Increased body mass resultant of higher body reserves allows birds to survive better during harsh environmental conditions e.g. food shortage (Ratikainen and Wright 2013). In addition, it allows individuals to engage in energy demanding activities of self maintenance and breeding when energy requirements may exceed energy intake (Lima 1986). However, associated costs of attaining and maintaining high body mass are manifold and include increased energy costs of locomotion, hampered movement during foraging, and higher predation vulnerability due to reduced agility and speed and/or more intensive foraging (Lima, 1986; Zimmer et al., 2011; Heldstab et al., 2017). Body reserves in birds are therefore maintained below the physiological capacity at an optimal level dependent on the trade-off between benefits and costs, and shaped by a bird’s environment (Brodin 2001, Nettle et al. 2017, Ekman and Hake 1990, Lilliendahl 1997) and the energy requirements associated with the various life history stages (Yasué et al. 2003, Hoye and Buttemer 2011).
In seasonal environments, including temperate environments and tropical areas with distinct dry and wet seasons, environmental factors influencing adaptive body mass variation such as rainfall, ambient temperature and food availability are highly correlated. Similarly, energetically intensive life history events such as breeding and molting are highly synchronized with the seasonal weather patterns and generally occur during peak food availability (Drent and Daan 1980, Sharp 1996, Wikelski et al. 2000). For birds in these environments, adaptive body mass therefore changes in a preprogrammed seasonal pattern in simultaneous response to environmental conditions and life history stage demands (Cresswell 1998, Macleod et al. 2005). In contrast, non-seasonal environments, including some equatorial tropical environments in East Africa, experience stochastic fluctuations in food availability and weather, both within and between years. Birds living in these areas are faced with a challenge in planning and often breed year-round. In these stochastic environments it has been suggested that birds should constantly maintain reserves to opportunistically breed and molt (Vleck and Priedkalns 1985), because they (1) cannot fully anticipate the expected start of favorable environmental conditions for breeding and (2) cannot respond immediately to changes in the environment (because physiological preparations take considerable time) (Tökölyi et al. 2012). While some studies have investigated the effect of either life history stage (Moreno 1989, Swaddle and Witter 1997, Nwaogu et al. 2017) or food and environment (Cuthill et al. 2000, Cresswell 2003, Macleod and Gosler 2006, Cooper 2007) separately on body mass variation, we are not aware of studies that have considered these factors simultaneously. Yet, non-seasonal environments with year round breeding are especially suited to simultaneously study and disentangle effects of environment (weather and food availability) and life history stage in adaptive body mass regulation.
For birds living in stochastic equatorial tropical environments the optimal strategy of body mass regulation will depend on the predictive power of local environmental cues (Cuthill et al. 2000). Whereas in predictable seasonal environments, evolutionary adaptations of annual programs of body mass change have been found, in unpredictable or non-seasonal environments, phenotypically plastic ability to adjust to the environment in real time at the moment may be the better strategy (Sergio et al. 2011). Studies analyzing phenology, determinants and influences of
Chapter 4
60
life history stages have mostly focused on the population level, assuming that populations have either evolved adaptive fixed traits over the course of generations or the required flexibility to adopt adaptive behavior according to local social and environmental conditions (Ricklefs and Wikelski 2002). However, although in tropical environments lack of seasonality in life history stages at the population level is attributed to the ability of individuals to breed under different environmental conditions, it is generally unknown if these individuals differ in condition or in their response to environmental and social conditions (Nwaogu et al. 2018). Hence, within-individual patterns are required to decouple relationships between body mass change, environmental or social factors, and life history stages.
Red-capped Larks in Kedong, Kenya, have previously shown to be an excellent system to study birds’ adaptations and responses to a non-seasonal stochastic equatorial environment. In this population, Red-capped Larks breed year-round with no seasonality, while weather patterns lack any predictable seasonal fashion (Ndithia et al. 2017a). Likewise, invertebrate abundances, the main food for Red-capped Larks, are unpredictable as well (Ndithia et al. 2017b, Mwangi et al. 2018). Neither current weather patterns nor food availability could explain timing of breeding (Ndithia et al. 2017a). Using an established color-ringed population, following individual birds is possible in addition to the population level studies.
In this study, we examined which environmental and social factors best explained body mass variation in Red-capped Larks in an aseasonal tropical environment. Specifically, we first investigated if Red-capped Larks body mass is better explained by evolutionary adaptation to long term weather patterns or by phenotypically plastic responses to current weather conditions. Second, to investigate how strong of a cue weather patterns are in predicting body mass and future food availability, we explored the critical time windows, per environmental factor, that explained A. body mass, and B. food availability. Third, we examined if and how body mass was explained by all current socio-environmental factors combined, using two analyses. The first analysis included males and females in breeding and molt, and hence allowed inclusion of sex and life history stage interactions. The second analysis was restricted to females only, which allowed inclusion of birds in quiescence, in addition to breeding and molt. Finally, we investigated if within individual differences in body mass among life history stages resembled the population level patterns. We predicted that, in our non-seasonal stochastic study system, 1) phenotypic plasticity in response to current weather conditions better explained body mass than evolutionary adaptation to long-term weather patterns, and 2) weather time-windows had no predictive value for either body mass or food availability. In addition, to reduce starvation risk and to maintain reserves to opportunistically breed and molt, we predicted that 3) Red-capped larks increased body mass under good conditions as measured by food availability, rainfall, temperature and nesting activities. With year round breeding and hence continuous preparedness to breed, 4) we did not expect within individual differences in body mass among phases of breeding and quiescence. Materials and methods Study species and study site We studied a population of Red-capped larks (Calandrella cinerea) at Kedong ranch (S 00° 53.04ʹ, E 036° 24.51ʹ, 1890 m above sea level), Naivasha, Kenya. Red-capped larks are resident birds distributed widely in Africa. They occur in short grasslands where they predominantly feed on invertebrates (Ndithia et al. 2017a). Red-capped Larks breed year round, and breeding and non-
breeding individuals frequently co-occur in the same population (Ndithia et al. 2017a, b, Mwangi et al. 2018). Kedong ranch is an extensive ranch located on the floor of the Rift valley and sandwiched between two national reserves (Ndithia et al. 2017a). The area consists of grasslands interspersed with scattered woodlands, and is mainly used by free ranging wildlife and extensive livestock grazing (Mwangi et al. 2018). Dominant wildlife species in the ranch include Zebra Equus burchelli, Kongoni Alcephalus buselaphus and Thomson's gazelle Gazella thomsonii (Kiringe 1993). Capturing and measuring birds and assessing life history stages We caught 463 adult Red-capped larks in a total of 619 capture events during 64 months, from February 2011 to May 2016, using mists nets and nest traps. We caught 105 birds more than once (mean ± SD = 2.49 ± 0.90, range 2 - 6), accounting for 261 capture events. We ringed all birds with a unique numbered aluminum ring and ultraviolet resistant color bands for individual identification. We measured body mass to the nearest 0.1g using a 50g Pesola scale. We also measured tarsus length, wing length, and head. We classified the molt life history stage of each bird (yes/no) based on presence of molting primary wing feathers. Breeding life history stage of females was determined by presence or absence of a brood patch. In males, we could only assign breeding with certainty when we caught them with an active nest. As a result, we classified the life history stage categories of females as breeding, molting or quiescence, and of males as breeding, molting or unknown. As some females, especially during breeding, have the same rufous crown as males, we collected blood samples for molecular sexing from all individuals using brachial veni puncture. Blood samples were carried on ice and stored in a freezer until lab analysis (Ndithia et al. 2017b). We extracted DNA from red blood cells using an ammonium acetate method (Richardson et al., 2001) and determined sex following Van der Velde et al. (2017). Using this combination of field sexing (presence/absence of brood patch during breeding) and the molecular method 244 birds were sexed as females and 182 as males. We were unable to identify the sex of 37 individuals, which were subsequently excluded from further analysis. Red-capped larks mean body mass was 24.0 ± 1.75 g SD (range 18 - 36.6 g). Body mass was lower in females (mean ± SD = 23.9 ± 1.56 g, n = 236) than in males (mean ± SD = 24.2 ± 2.01 g, n = 174), but the difference was not significant (F 1, 408 = 2.20, P = 0.14). Weather, invertebrate biomass and population level breeding We recorded current weather conditions, monitoring daily rainfall (Crain) and minimum (CTmin) and maximum (CTmax) temperature using weather stations (2011-2014, Alecto WS-3500, Den Bosch, the Netherlands; 2014-2016, Vantage Vue, Davis, the Netherlands) located at the field site. Yearly Crain averaged 420.6 ± 136.08 mm (SD) (N = 5) and monthly Crain was 35.1 ± 37.27 mm (n = 64) with no consistent intra-annual patterns. Mean monthly CTmax was 26.3 ± 3.71 °C (n = 64), while mean monthly CTmin was 11.2 ± 1.73 °C (n = 64). We also obtained long term weather records of rainfall (Lrain), maximum (LTmax) and minimum (LTmin) temperature for the years 1983-2012 from data collected at Sarah Higgins Kijabe farm located 10 kilometers from the field site. From these weather records we calculated the average monthly rainfall and the maximum and minimum average daily temperature per month as the long term weather patterns.
Every month, we sampled ground invertebrate biomass using pitfalls, and flying invertebrates using sweep nets. For ground invertebrates, we used four transects with five pitfalls each, inserted in the ground so that the top of the trap was level with the soil surface. We walked transects with a sweep net on the day we collected the contents of pitfalls. To estimate monthly insect biomass, we used invertebrate calibration curves specific for 10 taxa categories to calculate
Body mass variation in a stochastic aseasonal environment
61
life history stages have mostly focused on the population level, assuming that populations have either evolved adaptive fixed traits over the course of generations or the required flexibility to adopt adaptive behavior according to local social and environmental conditions (Ricklefs and Wikelski 2002). However, although in tropical environments lack of seasonality in life history stages at the population level is attributed to the ability of individuals to breed under different environmental conditions, it is generally unknown if these individuals differ in condition or in their response to environmental and social conditions (Nwaogu et al. 2018). Hence, within-individual patterns are required to decouple relationships between body mass change, environmental or social factors, and life history stages.
Red-capped Larks in Kedong, Kenya, have previously shown to be an excellent system to study birds’ adaptations and responses to a non-seasonal stochastic equatorial environment. In this population, Red-capped Larks breed year-round with no seasonality, while weather patterns lack any predictable seasonal fashion (Ndithia et al. 2017a). Likewise, invertebrate abundances, the main food for Red-capped Larks, are unpredictable as well (Ndithia et al. 2017b, Mwangi et al. 2018). Neither current weather patterns nor food availability could explain timing of breeding (Ndithia et al. 2017a). Using an established color-ringed population, following individual birds is possible in addition to the population level studies.
In this study, we examined which environmental and social factors best explained body mass variation in Red-capped Larks in an aseasonal tropical environment. Specifically, we first investigated if Red-capped Larks body mass is better explained by evolutionary adaptation to long term weather patterns or by phenotypically plastic responses to current weather conditions. Second, to investigate how strong of a cue weather patterns are in predicting body mass and future food availability, we explored the critical time windows, per environmental factor, that explained A. body mass, and B. food availability. Third, we examined if and how body mass was explained by all current socio-environmental factors combined, using two analyses. The first analysis included males and females in breeding and molt, and hence allowed inclusion of sex and life history stage interactions. The second analysis was restricted to females only, which allowed inclusion of birds in quiescence, in addition to breeding and molt. Finally, we investigated if within individual differences in body mass among life history stages resembled the population level patterns. We predicted that, in our non-seasonal stochastic study system, 1) phenotypic plasticity in response to current weather conditions better explained body mass than evolutionary adaptation to long-term weather patterns, and 2) weather time-windows had no predictive value for either body mass or food availability. In addition, to reduce starvation risk and to maintain reserves to opportunistically breed and molt, we predicted that 3) Red-capped larks increased body mass under good conditions as measured by food availability, rainfall, temperature and nesting activities. With year round breeding and hence continuous preparedness to breed, 4) we did not expect within individual differences in body mass among phases of breeding and quiescence. Materials and methods Study species and study site We studied a population of Red-capped larks (Calandrella cinerea) at Kedong ranch (S 00° 53.04ʹ, E 036° 24.51ʹ, 1890 m above sea level), Naivasha, Kenya. Red-capped larks are resident birds distributed widely in Africa. They occur in short grasslands where they predominantly feed on invertebrates (Ndithia et al. 2017a). Red-capped Larks breed year round, and breeding and non-
breeding individuals frequently co-occur in the same population (Ndithia et al. 2017a, b, Mwangi et al. 2018). Kedong ranch is an extensive ranch located on the floor of the Rift valley and sandwiched between two national reserves (Ndithia et al. 2017a). The area consists of grasslands interspersed with scattered woodlands, and is mainly used by free ranging wildlife and extensive livestock grazing (Mwangi et al. 2018). Dominant wildlife species in the ranch include Zebra Equus burchelli, Kongoni Alcephalus buselaphus and Thomson's gazelle Gazella thomsonii (Kiringe 1993). Capturing and measuring birds and assessing life history stages We caught 463 adult Red-capped larks in a total of 619 capture events during 64 months, from February 2011 to May 2016, using mists nets and nest traps. We caught 105 birds more than once (mean ± SD = 2.49 ± 0.90, range 2 - 6), accounting for 261 capture events. We ringed all birds with a unique numbered aluminum ring and ultraviolet resistant color bands for individual identification. We measured body mass to the nearest 0.1g using a 50g Pesola scale. We also measured tarsus length, wing length, and head. We classified the molt life history stage of each bird (yes/no) based on presence of molting primary wing feathers. Breeding life history stage of females was determined by presence or absence of a brood patch. In males, we could only assign breeding with certainty when we caught them with an active nest. As a result, we classified the life history stage categories of females as breeding, molting or quiescence, and of males as breeding, molting or unknown. As some females, especially during breeding, have the same rufous crown as males, we collected blood samples for molecular sexing from all individuals using brachial veni puncture. Blood samples were carried on ice and stored in a freezer until lab analysis (Ndithia et al. 2017b). We extracted DNA from red blood cells using an ammonium acetate method (Richardson et al., 2001) and determined sex following Van der Velde et al. (2017). Using this combination of field sexing (presence/absence of brood patch during breeding) and the molecular method 244 birds were sexed as females and 182 as males. We were unable to identify the sex of 37 individuals, which were subsequently excluded from further analysis. Red-capped larks mean body mass was 24.0 ± 1.75 g SD (range 18 - 36.6 g). Body mass was lower in females (mean ± SD = 23.9 ± 1.56 g, n = 236) than in males (mean ± SD = 24.2 ± 2.01 g, n = 174), but the difference was not significant (F 1, 408 = 2.20, P = 0.14). Weather, invertebrate biomass and population level breeding We recorded current weather conditions, monitoring daily rainfall (Crain) and minimum (CTmin) and maximum (CTmax) temperature using weather stations (2011-2014, Alecto WS-3500, Den Bosch, the Netherlands; 2014-2016, Vantage Vue, Davis, the Netherlands) located at the field site. Yearly Crain averaged 420.6 ± 136.08 mm (SD) (N = 5) and monthly Crain was 35.1 ± 37.27 mm (n = 64) with no consistent intra-annual patterns. Mean monthly CTmax was 26.3 ± 3.71 °C (n = 64), while mean monthly CTmin was 11.2 ± 1.73 °C (n = 64). We also obtained long term weather records of rainfall (Lrain), maximum (LTmax) and minimum (LTmin) temperature for the years 1983-2012 from data collected at Sarah Higgins Kijabe farm located 10 kilometers from the field site. From these weather records we calculated the average monthly rainfall and the maximum and minimum average daily temperature per month as the long term weather patterns.
Every month, we sampled ground invertebrate biomass using pitfalls, and flying invertebrates using sweep nets. For ground invertebrates, we used four transects with five pitfalls each, inserted in the ground so that the top of the trap was level with the soil surface. We walked transects with a sweep net on the day we collected the contents of pitfalls. To estimate monthly insect biomass, we used invertebrate calibration curves specific for 10 taxa categories to calculate
Chapter 4
62
dry mass from body length and width (Ndithia et al. 2017a). The mean ± SD monthly ground invertebrate biomass was 15.6 mg ± 10.89 (n = 61) while the monthly flying invertebrate biomass was 20.8 mg ± 11.24 (n = 57).
To quantify population level breeding intensity we searched for nests throughout the sampling period. Our search intensity averaged 20 ± 1.0 (SE) days per month (range 7-31 d/mo) and 245 ± 31.2 (SE) hours per month (range 17-825 h/mo). To standardize effort, we calculated a monthly nesting intensity as number of nests found per month per ten search hours. We recorded nesting in 42 of the 64 months monitored with a mean ± SD monthly nesting intensity of 1.3 ± 1.34 nests/10 search hours (n = 42) and found Red-capped larks nesting in all calendar months (Ndithia et al. 2017b, Mwangi et al. 2018).
Statistical Analysis We performed all statistical analyses in R 3.3.0 (R Core Team 2016) within the R-studio graphical user interface (RStudio Team 2016). Although it is common practice to calculate a body condition index by relating body mass against a linear measure of size to calculate either ratio indices (Labocha et al. 2014) or the scaled mass index (Peig and Green 2009), doing so in our study did not change the results due to weak correlation between body mass and our two linear measures of size, tarsus and wing length (both < 0.20). We therefore decided to use body mass of the birds for all statistical tests rather than a body condition index. Phenotypic plasticity versus long-term evolutionary adaptation: Body mass variation in Red-capped Larks relative to current and long term weather conditions To assess whether body mass of Red-capped Larks was better explained by current prevailing weather or long-term average weather patterns, while also taking into consideration sex and life history stage, we used general linear models. We first ran models with current weather, long term weather, life history stage and the interaction life history stage x weather separately for males and females. Secondly we ran models with current weather, long term weather, sex and the interaction sex x weather separately for breeding and molting birds. Lrain, LTmax and LTmin were correlated and so we ran the models for each weather factor separately. After running each general linear model, we then generated a subset of models from the global model using the dredge function (Barton 2018) by restricting the model set to only those models containing either current or long term weather but not both. We did this including either life history stage (for the separate models for males and females) or sex (for the separate models for breeding and molting birds). Finally, we computed a weighted average of the parameter estimates based on the new subset of models and 95% confidence limits for all the variables contained in the sub models. We considered factors as significant in the model average results if the upper and lower limits of the 95% confidence intervals did not include zero. Climatic windows predicting body mass of breeding and molting Red-capped larks and food availability To investigate possible time lags and the relative importance of current past weather (Crain, CTmax and CTmin) on body mass of Red-capped larks, we used the sliding window approach within the Climwin R package (van de Pol et al. 2016, Bailey and van de Pol 2016) to identify the critical time window (time period) which best explained the observed variation in body mass (van de Pol
and Cockburn 2011). To assess the performance of competing time window models, we used a linear response function and created a baseline regression (null) model with sex and life history stage as predictor variables (body mass ~ life history stage + sex). We then set the program to create and compare weekly windows of the weather factors starting as far as two months to one week prior to the day each bird was captured and weighed (Jarjour et al. 2017). For each weather factor (Crain, CTmin and CTmax), we compared the best window identified for three aggregate statistics (mean, minimum and maximum). This approach is more robust and fundamentally different from the vast majority of studies that use a fixed period over which weather is deemed to be important for a trait chosen a priori. The Climwin approach varies the start and end dates of an interval of days to examine every possible window of climate by ranking the windows via model goodness-of-fit (AICc weights) (van de Pol and Cockburn 2011, van de Pol et al. 2016, Jarjour et al. 2017). To allow inclusion of sex and life history stage in the null model, we restricted our analysis to breeding and molting males and females because we could assess quiescence only with certainty in females.
To analyse the first steps of the proposed pathway of weather influencing food availability and consequently body mass, we also employed the sliding window approach to identify the critical time window which best predicted the observed variation in ground and flying invertebrate biomass as proxies for food availability. Similar to the previous analysis, we set the program to create and compare weekly windows starting as far as two months to one week prior to the day we sampled the invertebrates (Jarjour et al. 2017). To quantify the likelihood of obtaining strong model support by chance due to the high number of models tested, we performed 1000 randomizations and compared the DeltaAICc of the best model fitted to the observed data to the distribution of DeltaAICc values from the best model in each randomized data set (Bailey and van de Pol 2016). Body mass variation with current weather, food and nesting intensity To analyze effects of weather, food and nesting intensity during the month of capture on body mass, we fitted general linear models with body mass as dependent variable and with independent variables monthly Crain, monthly average CTmin and CTmax, ground and flying invertebrate biomass and nesting intensity. We also included “life history stage” (two-level factor: breeding and molting) and “sex” (two-level factor: male and female). Each full model included all 2-way and 3-way interactions between sex, life history stage and all other independent variables. To allow inclusion of sex and life history stage, we first performed these analyses on breeding and molting males and females, excluding “unknown” males and females in quiescence. We then restricted the data set to only females, and included all three life history stage categories of breeding, molting and quiescence. We again fitted general linear models with independent variables monthly Crain, CTmin and CTmax, ground and flying invertebrate biomass, nesting intensity and “life history stage” (three-level factor: breeding, molting and quiescent). Each full model also included all 2-way interactions between life history stage and the other independent variables.
We performed all our model selection using a stepwise regression approach starting from the full model and removing non-significant interactions one at a time. We always kept sex, life history stage, ground and flying invertebrates, CTmax, CTmin, Crain and nesting intensity in the final models. We employed Tukey’s HSD post-hoc tests to conduct pair wise comparisons when any interaction including sex or life history stage was significant. We considered response slopes in continuous factors as different from zero if the upper and lower limits of the 95% confidence intervals did not include zero.
Body mass variation in a stochastic aseasonal environment
63
dry mass from body length and width (Ndithia et al. 2017a). The mean ± SD monthly ground invertebrate biomass was 15.6 mg ± 10.89 (n = 61) while the monthly flying invertebrate biomass was 20.8 mg ± 11.24 (n = 57).
To quantify population level breeding intensity we searched for nests throughout the sampling period. Our search intensity averaged 20 ± 1.0 (SE) days per month (range 7-31 d/mo) and 245 ± 31.2 (SE) hours per month (range 17-825 h/mo). To standardize effort, we calculated a monthly nesting intensity as number of nests found per month per ten search hours. We recorded nesting in 42 of the 64 months monitored with a mean ± SD monthly nesting intensity of 1.3 ± 1.34 nests/10 search hours (n = 42) and found Red-capped larks nesting in all calendar months (Ndithia et al. 2017b, Mwangi et al. 2018).
Statistical Analysis We performed all statistical analyses in R 3.3.0 (R Core Team 2016) within the R-studio graphical user interface (RStudio Team 2016). Although it is common practice to calculate a body condition index by relating body mass against a linear measure of size to calculate either ratio indices (Labocha et al. 2014) or the scaled mass index (Peig and Green 2009), doing so in our study did not change the results due to weak correlation between body mass and our two linear measures of size, tarsus and wing length (both < 0.20). We therefore decided to use body mass of the birds for all statistical tests rather than a body condition index. Phenotypic plasticity versus long-term evolutionary adaptation: Body mass variation in Red-capped Larks relative to current and long term weather conditions To assess whether body mass of Red-capped Larks was better explained by current prevailing weather or long-term average weather patterns, while also taking into consideration sex and life history stage, we used general linear models. We first ran models with current weather, long term weather, life history stage and the interaction life history stage x weather separately for males and females. Secondly we ran models with current weather, long term weather, sex and the interaction sex x weather separately for breeding and molting birds. Lrain, LTmax and LTmin were correlated and so we ran the models for each weather factor separately. After running each general linear model, we then generated a subset of models from the global model using the dredge function (Barton 2018) by restricting the model set to only those models containing either current or long term weather but not both. We did this including either life history stage (for the separate models for males and females) or sex (for the separate models for breeding and molting birds). Finally, we computed a weighted average of the parameter estimates based on the new subset of models and 95% confidence limits for all the variables contained in the sub models. We considered factors as significant in the model average results if the upper and lower limits of the 95% confidence intervals did not include zero. Climatic windows predicting body mass of breeding and molting Red-capped larks and food availability To investigate possible time lags and the relative importance of current past weather (Crain, CTmax and CTmin) on body mass of Red-capped larks, we used the sliding window approach within the Climwin R package (van de Pol et al. 2016, Bailey and van de Pol 2016) to identify the critical time window (time period) which best explained the observed variation in body mass (van de Pol
and Cockburn 2011). To assess the performance of competing time window models, we used a linear response function and created a baseline regression (null) model with sex and life history stage as predictor variables (body mass ~ life history stage + sex). We then set the program to create and compare weekly windows of the weather factors starting as far as two months to one week prior to the day each bird was captured and weighed (Jarjour et al. 2017). For each weather factor (Crain, CTmin and CTmax), we compared the best window identified for three aggregate statistics (mean, minimum and maximum). This approach is more robust and fundamentally different from the vast majority of studies that use a fixed period over which weather is deemed to be important for a trait chosen a priori. The Climwin approach varies the start and end dates of an interval of days to examine every possible window of climate by ranking the windows via model goodness-of-fit (AICc weights) (van de Pol and Cockburn 2011, van de Pol et al. 2016, Jarjour et al. 2017). To allow inclusion of sex and life history stage in the null model, we restricted our analysis to breeding and molting males and females because we could assess quiescence only with certainty in females.
To analyse the first steps of the proposed pathway of weather influencing food availability and consequently body mass, we also employed the sliding window approach to identify the critical time window which best predicted the observed variation in ground and flying invertebrate biomass as proxies for food availability. Similar to the previous analysis, we set the program to create and compare weekly windows starting as far as two months to one week prior to the day we sampled the invertebrates (Jarjour et al. 2017). To quantify the likelihood of obtaining strong model support by chance due to the high number of models tested, we performed 1000 randomizations and compared the DeltaAICc of the best model fitted to the observed data to the distribution of DeltaAICc values from the best model in each randomized data set (Bailey and van de Pol 2016). Body mass variation with current weather, food and nesting intensity To analyze effects of weather, food and nesting intensity during the month of capture on body mass, we fitted general linear models with body mass as dependent variable and with independent variables monthly Crain, monthly average CTmin and CTmax, ground and flying invertebrate biomass and nesting intensity. We also included “life history stage” (two-level factor: breeding and molting) and “sex” (two-level factor: male and female). Each full model included all 2-way and 3-way interactions between sex, life history stage and all other independent variables. To allow inclusion of sex and life history stage, we first performed these analyses on breeding and molting males and females, excluding “unknown” males and females in quiescence. We then restricted the data set to only females, and included all three life history stage categories of breeding, molting and quiescence. We again fitted general linear models with independent variables monthly Crain, CTmin and CTmax, ground and flying invertebrate biomass, nesting intensity and “life history stage” (three-level factor: breeding, molting and quiescent). Each full model also included all 2-way interactions between life history stage and the other independent variables.
We performed all our model selection using a stepwise regression approach starting from the full model and removing non-significant interactions one at a time. We always kept sex, life history stage, ground and flying invertebrates, CTmax, CTmin, Crain and nesting intensity in the final models. We employed Tukey’s HSD post-hoc tests to conduct pair wise comparisons when any interaction including sex or life history stage was significant. We considered response slopes in continuous factors as different from zero if the upper and lower limits of the 95% confidence intervals did not include zero.
Chapter 4
64
Within individual differences in body mass variation in relation to life history stage To test for within individual differences in body mass between birds caught at more than one life history stage, we used paired t tests. This included 14 males and 18 females caught both during breeding and molting, 12 females caught both during breeding and when in quiescence, and seven females caught both during molting and when in quiescence. To ensure that there was no sampling bias towards specific environmental conditions, we checked and ensured that the birds included in these analyses were caught at varying times and spread out across the sampling period (the earliest bird was caught in May 2011 and the latest in June 2016, a difference of five years between the dates of capture). Results Long-term evolutionary adaptation versus short-term phenotypic plasticity to weather in Red-capped Larks Evaluating how well long-term and current weather factors explained variation in body mass of Red-capped larks, we found support for an evolutionary adaptation to long-term weather patterns in the interaction between LTmax and life history stage and for a phenotypically plastic response in the relation between CTmin and life history stage (Table 1). In contrast, we found no support for adaptation or adjustment to either long-term weather patterns or current weather when grouping the analysis by life history stage irrespective of sex (Table 2). Further exploring the interaction LTmax x life history stage revealed that body masses of breeding males were higher when LTmax was higher while that of molting males was lower with an increase in LTmax (Figure 1A); both slopes significantly differed from zero (breeding estimate ± S.E = 0.60 ± 0.20, 95% C.I. = 0.19, 1.00; molting estimate ± S.E = -1.59 ± 0.52, 95% C.I. = -2.62, -0.56). Similarly, exploring the interaction CTmin x life history stage revealed that body masses of breeding males were higher when CTmin was higher while that of molting males was lower with an increase in CTmin (Figure 1B); only the slopes of molting males significantly differed from zero (breeding estimate ± S.E = -0.03 ± 0.18, 95% C.I. = -0.40, 0.34; molting estimate ± S.E = -1.83 ± 0.45, 95% C.I. = -2.72, -0.94).
Table 1: Model averaged estimates (± SE) on the effects of life history stage and (1A) current (Crain) and long term rainfall (Lrain), (1B) current (CTmax) and long term (LTmax) maximum average daily temperature, and (1C) current (CTmin) and long term (LTmin) minimum average daily temperature on body mass of female (left column) and male (right column) Red-capped Larks in Kedong Ranch. We restricted the model set to include only those models containing life history stage and either current or long term weather but not both. A complete overview of the model set is provided in Appendix 2. In bold are statistically significant 95% confidence intervals.
Female Male 1A) Current and long term rainfall Factor Estimate ± SE 95% Confidence limits Estimate ± SE 95% Confidence limits Intercept 24.04 ± 0.23 23.59 , 24.49 23.17 ± 0.83 21.53 , 24.81 Crain 0.00 ± 0.00 -0.00 , 0.01 -0.00 ± 0.00 -0.00 , 0.00 Molting 0.15 ± 0.59 -1.01 , 1.32 2.04 ± 1.86 -1.63 , 5.70 Crain: Molting -0.06 ± 0.03 -0.11 , 0.00 0.00 ± 0.01 -0.02 , 0.02 Lrain 0.00 ± 0.00 -0.00 , 0.00 0.02 ± 0.01 -0.01 , 0.04 Lrain: Molting -0.00 ± 0.01 -0.02 , 0.02 -0.03 ± 0.04 -0.11 , 0.05 1B) Current and long term maximum average daily temperature
Estimate ±SE 95% Confidence limits Estimate ± SE 95% Confidence limits Intercept 26.20 ± 3.39 19.51 , 32.89 13.79 ± 5.93 2.06 , 25.52 CTmax -0.01 ± 0.03 -0.06 , 0.04 -0.01 ± 0.03 -0.07 , 0.05 Molting 3.97 ± 8.55 -12.84 , 20.78 45.71 ± 15.61 14.88 , 76.54 CTmax: Molting -0.06 ± 0.1 -0.25 , 0.13 -0.00 ± 0.01 -0.02 , 0.02 LTmax -0.07 ± 0.13 -0.33 , 0.20 0.41 ± 0.22 -0.02 , 0.85 LTmax: Molting -0.14 ± 0.35 -0.82 , 0.55 -1.79 ± 0.62 -3.01 , -0.57 1C) Current and long term minimum average daily temperature
Estimate ± SE 95% Confidence limits Estimate ± SE 95% Confidence limits Intercept 23.21 ± 1.79 19.68 , 26.74 20.79 ± 1.50 17.82 , 23.77 CTmin 0.03 ± 0.05 -0.07 , 0.12 0.28 ± 0.12 0.05 , 0.51 Molting 1.34 ± 4.90 -8.31 , 10.98 24.81 ± 5.12 14.64 , 34.99 CTmin: Molting -0.13 ± 0.32 -0.75 , 0.50 -2.17 ± 0.48 -3.11 , -1.23 LTmin 0.05 ± 0.13 -0.20 , 0.31 0.00 ± 0.06 -0.11 , 0.12 LTmin: Molting -0.05 ± 0.28 -0.59 , 0.50 -0.01 ± 0.13 -0.25 , 0.24
Body mass variation in a stochastic aseasonal environment
65
Within individual differences in body mass variation in relation to life history stage To test for within individual differences in body mass between birds caught at more than one life history stage, we used paired t tests. This included 14 males and 18 females caught both during breeding and molting, 12 females caught both during breeding and when in quiescence, and seven females caught both during molting and when in quiescence. To ensure that there was no sampling bias towards specific environmental conditions, we checked and ensured that the birds included in these analyses were caught at varying times and spread out across the sampling period (the earliest bird was caught in May 2011 and the latest in June 2016, a difference of five years between the dates of capture). Results Long-term evolutionary adaptation versus short-term phenotypic plasticity to weather in Red-capped Larks Evaluating how well long-term and current weather factors explained variation in body mass of Red-capped larks, we found support for an evolutionary adaptation to long-term weather patterns in the interaction between LTmax and life history stage and for a phenotypically plastic response in the relation between CTmin and life history stage (Table 1). In contrast, we found no support for adaptation or adjustment to either long-term weather patterns or current weather when grouping the analysis by life history stage irrespective of sex (Table 2). Further exploring the interaction LTmax x life history stage revealed that body masses of breeding males were higher when LTmax was higher while that of molting males was lower with an increase in LTmax (Figure 1A); both slopes significantly differed from zero (breeding estimate ± S.E = 0.60 ± 0.20, 95% C.I. = 0.19, 1.00; molting estimate ± S.E = -1.59 ± 0.52, 95% C.I. = -2.62, -0.56). Similarly, exploring the interaction CTmin x life history stage revealed that body masses of breeding males were higher when CTmin was higher while that of molting males was lower with an increase in CTmin (Figure 1B); only the slopes of molting males significantly differed from zero (breeding estimate ± S.E = -0.03 ± 0.18, 95% C.I. = -0.40, 0.34; molting estimate ± S.E = -1.83 ± 0.45, 95% C.I. = -2.72, -0.94).
Table 1: Model averaged estimates (± SE) on the effects of life history stage and (1A) current (Crain) and long term rainfall (Lrain), (1B) current (CTmax) and long term (LTmax) maximum average daily temperature, and (1C) current (CTmin) and long term (LTmin) minimum average daily temperature on body mass of female (left column) and male (right column) Red-capped Larks in Kedong Ranch. We restricted the model set to include only those models containing life history stage and either current or long term weather but not both. A complete overview of the model set is provided in Appendix 2. In bold are statistically significant 95% confidence intervals.
Female Male 1A) Current and long term rainfall Factor Estimate ± SE 95% Confidence limits Estimate ± SE 95% Confidence limits Intercept 24.04 ± 0.23 23.59 , 24.49 23.17 ± 0.83 21.53 , 24.81 Crain 0.00 ± 0.00 -0.00 , 0.01 -0.00 ± 0.00 -0.00 , 0.00 Molting 0.15 ± 0.59 -1.01 , 1.32 2.04 ± 1.86 -1.63 , 5.70 Crain: Molting -0.06 ± 0.03 -0.11 , 0.00 0.00 ± 0.01 -0.02 , 0.02 Lrain 0.00 ± 0.00 -0.00 , 0.00 0.02 ± 0.01 -0.01 , 0.04 Lrain: Molting -0.00 ± 0.01 -0.02 , 0.02 -0.03 ± 0.04 -0.11 , 0.05 1B) Current and long term maximum average daily temperature
Estimate ±SE 95% Confidence limits Estimate ± SE 95% Confidence limits Intercept 26.20 ± 3.39 19.51 , 32.89 13.79 ± 5.93 2.06 , 25.52 CTmax -0.01 ± 0.03 -0.06 , 0.04 -0.01 ± 0.03 -0.07 , 0.05 Molting 3.97 ± 8.55 -12.84 , 20.78 45.71 ± 15.61 14.88 , 76.54 CTmax: Molting -0.06 ± 0.1 -0.25 , 0.13 -0.00 ± 0.01 -0.02 , 0.02 LTmax -0.07 ± 0.13 -0.33 , 0.20 0.41 ± 0.22 -0.02 , 0.85 LTmax: Molting -0.14 ± 0.35 -0.82 , 0.55 -1.79 ± 0.62 -3.01 , -0.57 1C) Current and long term minimum average daily temperature
Estimate ± SE 95% Confidence limits Estimate ± SE 95% Confidence limits Intercept 23.21 ± 1.79 19.68 , 26.74 20.79 ± 1.50 17.82 , 23.77 CTmin 0.03 ± 0.05 -0.07 , 0.12 0.28 ± 0.12 0.05 , 0.51 Molting 1.34 ± 4.90 -8.31 , 10.98 24.81 ± 5.12 14.64 , 34.99 CTmin: Molting -0.13 ± 0.32 -0.75 , 0.50 -2.17 ± 0.48 -3.11 , -1.23 LTmin 0.05 ± 0.13 -0.20 , 0.31 0.00 ± 0.06 -0.11 , 0.12 LTmin: Molting -0.05 ± 0.28 -0.59 , 0.50 -0.01 ± 0.13 -0.25 , 0.24
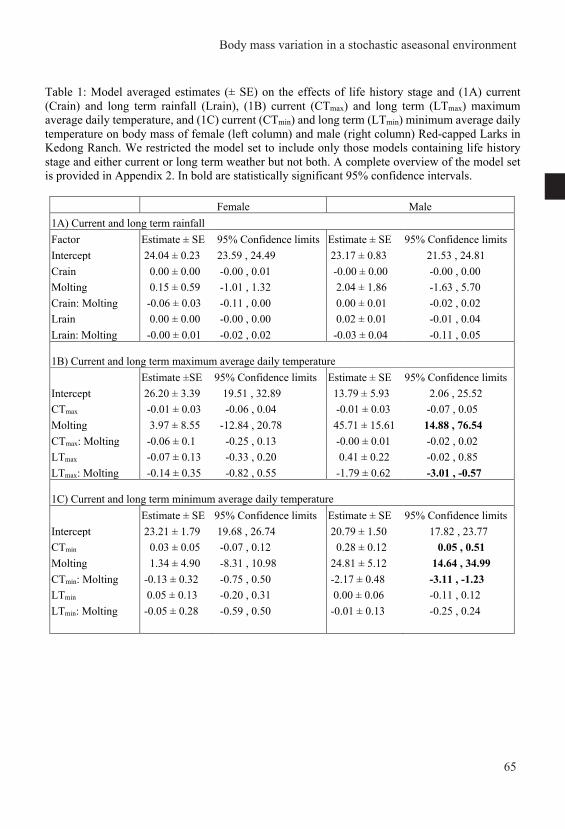
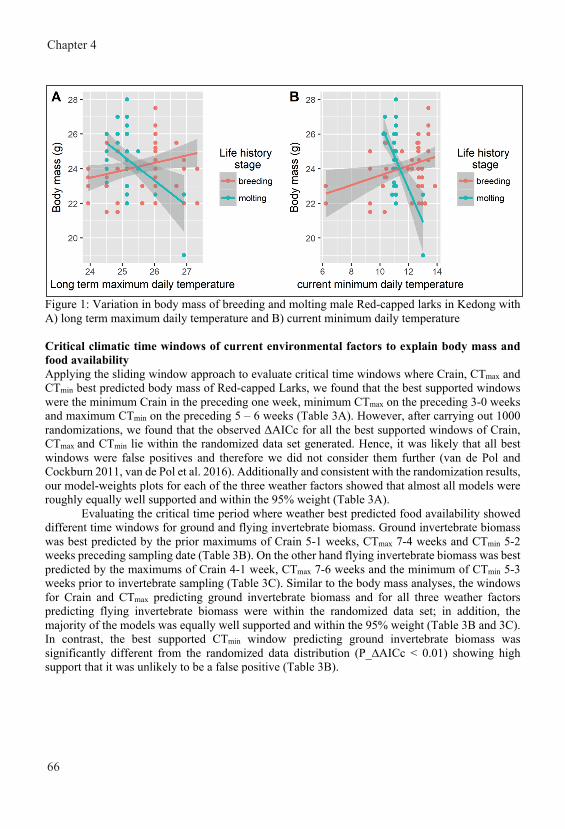
Chapter 4
66
Figure 1: Variation in body mass of breeding and molting male Red-capped larks in Kedong with A) long term maximum daily temperature and B) current minimum daily temperature Critical climatic time windows of current environmental factors to explain body mass and food availability Applying the sliding window approach to evaluate critical time windows where Crain, CTmax and CTmin best predicted body mass of Red-capped Larks, we found that the best supported windows were the minimum Crain in the preceding one week, minimum CTmax on the preceding 3-0 weeks and maximum CTmin on the preceding 5 – 6 weeks (Table 3A). However, after carrying out 1000 randomizations, we found that the observed ΔAICc for all the best supported windows of Crain, CTmax and CTmin lie within the randomized data set generated. Hence, it was likely that all best windows were false positives and therefore we did not consider them further (van de Pol and Cockburn 2011, van de Pol et al. 2016). Additionally and consistent with the randomization results, our model-weights plots for each of the three weather factors showed that almost all models were roughly equally well supported and within the 95% weight (Table 3A).
Evaluating the critical time period where weather best predicted food availability showed different time windows for ground and flying invertebrate biomass. Ground invertebrate biomass was best predicted by the prior maximums of Crain 5-1 weeks, CTmax 7-4 weeks and CTmin 5-2 weeks preceding sampling date (Table 3B). On the other hand flying invertebrate biomass was best predicted by the maximums of Crain 4-1 week, CTmax 7-6 weeks and the minimum of CTmin 5-3 weeks prior to invertebrate sampling (Table 3C). Similar to the body mass analyses, the windows for Crain and CTmax predicting ground invertebrate biomass and for all three weather factors predicting flying invertebrate biomass were within the randomized data set; in addition, the majority of the models was equally well supported and within the 95% weight (Table 3B and 3C). In contrast, the best supported CTmin window predicting ground invertebrate biomass was significantly different from the randomized data distribution (P_∆AICc < 0.01) showing high support that it was unlikely to be a false positive (Table 3B).
Table 2: Model averaged estimates (± SE) on the effects of sex and (2A) current (Crain) and long term rainfall (Lrain), (2B) current (CTmax) and long term (LTmax) maximum average daily temperature, and (2C) current (CTmin) and long term (LTmin) minimum average daily temperature on body mass of breeding (left column) and molting (right column) Red-capped Larks in Kedong Ranch. We restricted the model set to include only those models containing sex and either current or long term weather but not both. A complete overview of the sub model sets is provided in Appendix 3.
Breeding Molting 2A) Current and long term rainfall
Estimate ± SE 95% Confidence limits Estimate ± SE 95% Confidence limits Intercept 23.81 ± 0.41 22.99 , 24.62 24.39 ± 0.84 22.72 , 26.06 Crain 0.00 ± 0.00 -0.00 , 0.01 -0.04 ± 0.03 -0.10 , 0.02 Male -0.38 ± 0.72 -1.79 , 1.04 0.53 ± 0.84 -1.14 , 2.20 Crain: Male -0.00 ± 0.00 -0.01 , 0.01 0.04 ± 0.05 -0.06 , 0.15 Lrain 0.01 ± 0.01 -0.01 , 0.02 -0.01 ± 0.02 -0.05 , 0.03 LRain: Male 0.00 ± 0.01 -0.01 , 0.02 0.00 ± 0.01 -0.02 , 0.02 2B) Current and long term maximum average daily temperature
Estimate ± SE 95% Confidence limits Estimate ± SE 95% Confidence limits Intercept 25.18 ± 3.25 18.78 , 31.59 46.54 ± 11.27 24.23 , 68.84 CTmax -0.01 ± 0.02 -0.06 , 0.04 -0.01 ± 0.05 -0.10 , 0.08 Male -4.21 ± 8.40 -20.70 , 12.27 6.96 ± 12.65 -18.04 , 31.96 CTmax: Male -0.03 ± 0.07 -0.16 , 0.09 0.00 ± 0.02 -0.04 , 0.04 LTmax -0.03 ± 0.13 -0.27 , 0.22 -0.90 ± 0.47 -1.83 , 0.02 LTmax: Male 0.19 ± 0.30 -0.40 , 0.79 -0.24 ± 0.50 -1.23 , 0.76 2C) Current and long term minimum average daily temperature
Estimate ± SE 95% Confidence limits Estimate ± SE 95% Confidence limits Intercept 22.10 ± 2.35 17.47 , 26.72 30.40 ± 5.29 19.92 , 40.87 CTmin 0.01 ± 0.04 -0.06 , 0.08 -0.62 ± 0.48 -1.57 , 0.32 Male -6.97 ± 5.98 -18.73 , 4.78 13.22 ± 9.10 -4.75 , 31.19 CTmin: Male 0.02 ± 0.08 -0.14 , 0.19 -1.09 ± 0.82 -2.71 , 0.53 LTmin 0.14 ± 0.17 -0.20 , 0.48 -0.00 ± 0.04 -0.09 , 0.09 LTmin: Male 0.47 ± 0.44 -0.40 , 1.34 -0.00 ± 0.04 -0.08 , 0.08
Body mass variation in a stochastic aseasonal environment
67
Figure 1: Variation in body mass of breeding and molting male Red-capped larks in Kedong with A) long term maximum daily temperature and B) current minimum daily temperature Critical climatic time windows of current environmental factors to explain body mass and food availability Applying the sliding window approach to evaluate critical time windows where Crain, CTmax and CTmin best predicted body mass of Red-capped Larks, we found that the best supported windows were the minimum Crain in the preceding one week, minimum CTmax on the preceding 3-0 weeks and maximum CTmin on the preceding 5 – 6 weeks (Table 3A). However, after carrying out 1000 randomizations, we found that the observed ΔAICc for all the best supported windows of Crain, CTmax and CTmin lie within the randomized data set generated. Hence, it was likely that all best windows were false positives and therefore we did not consider them further (van de Pol and Cockburn 2011, van de Pol et al. 2016). Additionally and consistent with the randomization results, our model-weights plots for each of the three weather factors showed that almost all models were roughly equally well supported and within the 95% weight (Table 3A).
Evaluating the critical time period where weather best predicted food availability showed different time windows for ground and flying invertebrate biomass. Ground invertebrate biomass was best predicted by the prior maximums of Crain 5-1 weeks, CTmax 7-4 weeks and CTmin 5-2 weeks preceding sampling date (Table 3B). On the other hand flying invertebrate biomass was best predicted by the maximums of Crain 4-1 week, CTmax 7-6 weeks and the minimum of CTmin 5-3 weeks prior to invertebrate sampling (Table 3C). Similar to the body mass analyses, the windows for Crain and CTmax predicting ground invertebrate biomass and for all three weather factors predicting flying invertebrate biomass were within the randomized data set; in addition, the majority of the models was equally well supported and within the 95% weight (Table 3B and 3C). In contrast, the best supported CTmin window predicting ground invertebrate biomass was significantly different from the randomized data distribution (P_∆AICc < 0.01) showing high support that it was unlikely to be a false positive (Table 3B).
Table 2: Model averaged estimates (± SE) on the effects of sex and (2A) current (Crain) and long term rainfall (Lrain), (2B) current (CTmax) and long term (LTmax) maximum average daily temperature, and (2C) current (CTmin) and long term (LTmin) minimum average daily temperature on body mass of breeding (left column) and molting (right column) Red-capped Larks in Kedong Ranch. We restricted the model set to include only those models containing sex and either current or long term weather but not both. A complete overview of the sub model sets is provided in Appendix 3.
Breeding Molting 2A) Current and long term rainfall
Estimate ± SE 95% Confidence limits Estimate ± SE 95% Confidence limits Intercept 23.81 ± 0.41 22.99 , 24.62 24.39 ± 0.84 22.72 , 26.06 Crain 0.00 ± 0.00 -0.00 , 0.01 -0.04 ± 0.03 -0.10 , 0.02 Male -0.38 ± 0.72 -1.79 , 1.04 0.53 ± 0.84 -1.14 , 2.20 Crain: Male -0.00 ± 0.00 -0.01 , 0.01 0.04 ± 0.05 -0.06 , 0.15 Lrain 0.01 ± 0.01 -0.01 , 0.02 -0.01 ± 0.02 -0.05 , 0.03 LRain: Male 0.00 ± 0.01 -0.01 , 0.02 0.00 ± 0.01 -0.02 , 0.02 2B) Current and long term maximum average daily temperature
Estimate ± SE 95% Confidence limits Estimate ± SE 95% Confidence limits Intercept 25.18 ± 3.25 18.78 , 31.59 46.54 ± 11.27 24.23 , 68.84 CTmax -0.01 ± 0.02 -0.06 , 0.04 -0.01 ± 0.05 -0.10 , 0.08 Male -4.21 ± 8.40 -20.70 , 12.27 6.96 ± 12.65 -18.04 , 31.96 CTmax: Male -0.03 ± 0.07 -0.16 , 0.09 0.00 ± 0.02 -0.04 , 0.04 LTmax -0.03 ± 0.13 -0.27 , 0.22 -0.90 ± 0.47 -1.83 , 0.02 LTmax: Male 0.19 ± 0.30 -0.40 , 0.79 -0.24 ± 0.50 -1.23 , 0.76 2C) Current and long term minimum average daily temperature
Estimate ± SE 95% Confidence limits Estimate ± SE 95% Confidence limits Intercept 22.10 ± 2.35 17.47 , 26.72 30.40 ± 5.29 19.92 , 40.87 CTmin 0.01 ± 0.04 -0.06 , 0.08 -0.62 ± 0.48 -1.57 , 0.32 Male -6.97 ± 5.98 -18.73 , 4.78 13.22 ± 9.10 -4.75 , 31.19 CTmin: Male 0.02 ± 0.08 -0.14 , 0.19 -1.09 ± 0.82 -2.71 , 0.53 LTmin 0.14 ± 0.17 -0.20 , 0.48 -0.00 ± 0.04 -0.09 , 0.09 LTmin: Male 0.47 ± 0.44 -0.40 , 1.34 -0.00 ± 0.04 -0.08 , 0.08
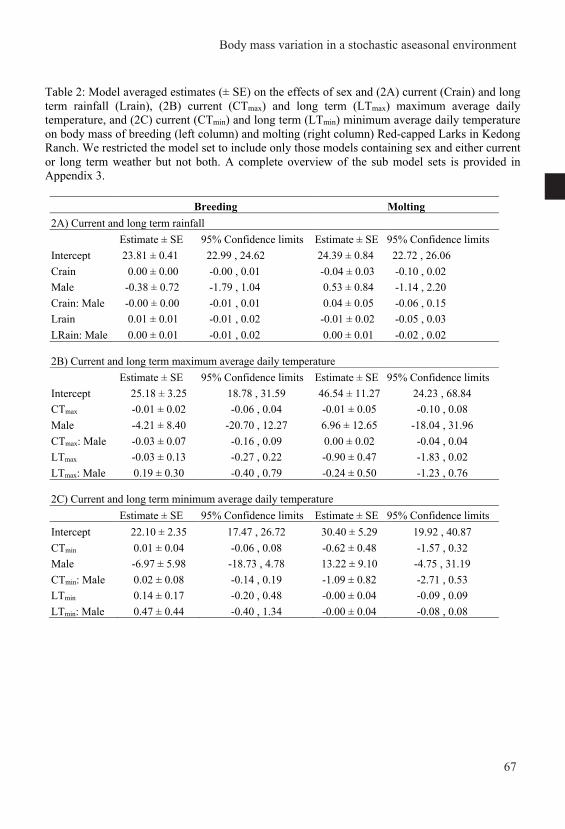
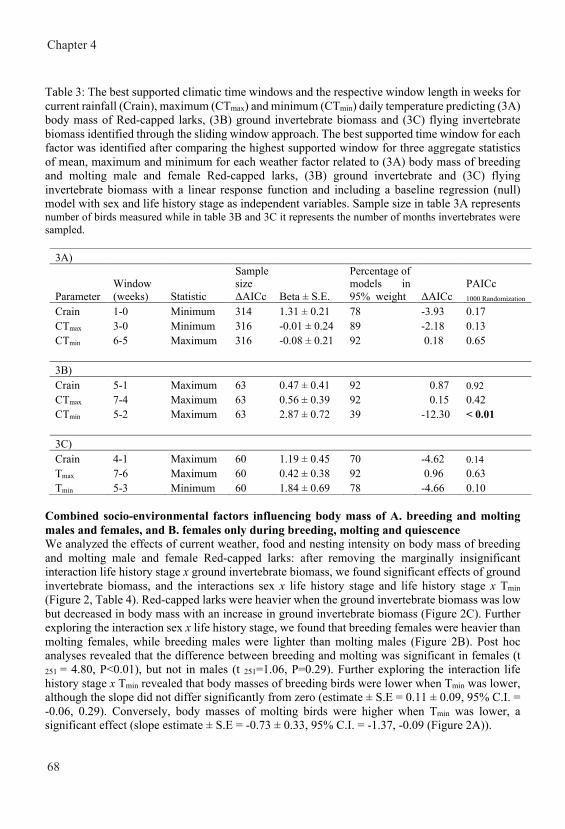
Chapter 4
68
Table 3: The best supported climatic time windows and the respective window length in weeks for current rainfall (Crain), maximum (CTmax) and minimum (CTmin) daily temperature predicting (3A) body mass of Red-capped larks, (3B) ground invertebrate biomass and (3C) flying invertebrate biomass identified through the sliding window approach. The best supported time window for each factor was identified after comparing the highest supported window for three aggregate statistics of mean, maximum and minimum for each weather factor related to (3A) body mass of breeding and molting male and female Red-capped larks, (3B) ground invertebrate and (3C) flying invertebrate biomass with a linear response function and including a baseline regression (null) model with sex and life history stage as independent variables. Sample size in table 3A represents number of birds measured while in table 3B and 3C it represents the number of months invertebrates were sampled.
3A)
Parameter Window (weeks) Statistic
Sample size ΔAICc Beta ± S.E.
Percentage of models in 95% weight ΔAICc
PAICc 1000 Randomization
Crain 1-0 Minimum 314 1.31 ± 0.21 78 -3.93 0.17 CTmax 3-0 Minimum 316 -0.01 ± 0.24 89 -2.18 0.13 CTmin 6-5 Maximum 316 -0.08 ± 0.21 92 0.18 0.65 3B) Crain 5-1 Maximum 63 0.47 ± 0.41 92 0.87 0.92 CTmax 7-4 Maximum 63 0.56 ± 0.39 92 0.15 0.42 CTmin 5-2 Maximum 63 2.87 ± 0.72 39 -12.30 < 0.01 3C) Crain 4-1 Maximum 60 1.19 ± 0.45 70 -4.62 0.14 Tmax 7-6 Maximum 60 0.42 ± 0.38 92 0.96 0.63 Tmin 5-3 Minimum 60 1.84 ± 0.69 78 -4.66 0.10
Combined socio-environmental factors influencing body mass of A. breeding and molting males and females, and B. females only during breeding, molting and quiescence We analyzed the effects of current weather, food and nesting intensity on body mass of breeding and molting male and female Red-capped larks: after removing the marginally insignificant interaction life history stage x ground invertebrate biomass, we found significant effects of ground invertebrate biomass, and the interactions sex x life history stage and life history stage x Tmin (Figure 2, Table 4). Red-capped larks were heavier when the ground invertebrate biomass was low but decreased in body mass with an increase in ground invertebrate biomass (Figure 2C). Further exploring the interaction sex x life history stage, we found that breeding females were heavier than molting females, while breeding males were lighter than molting males (Figure 2B). Post hoc analyses revealed that the difference between breeding and molting was significant in females (t 251 = 4.80, P<0.01), but not in males (t 251=1.06, P=0.29). Further exploring the interaction life history stage x Tmin revealed that body masses of breeding birds were lower when Tmin was lower, although the slope did not differ significantly from zero (estimate ± S.E = 0.11 ± 0.09, 95% C.I. = -0.06, 0.29). Conversely, body masses of molting birds were higher when Tmin was lower, a significant effect (slope estimate ± S.E = -0.73 ± 0.33, 95% C.I. = -1.37, -0.09 (Figure 2A)).
Table 4: Results of general linear models examining the effects of weather (Crain, CTmax and CTmin), food (ground and flying invertebrate biomass), and nesting intensity on the body mass of breeding and molting male and female Red-capped larks. Each full model also included all 2-way and 3-way interactions between sex and life history stage and all independent variables. In bold are statistically significant P-values.
Df F Value P(>F) Sex 1, 251 2.66 0.10 Life history stage 1, 251 14.18 < 0.01 Ground invertebrates 1, 251 23.67 < 0.01 Flying invertebrates 1, 251 2.11 0.15 CTmax 1, 251 0.01 0.91 CTmin 1, 251 0.66 0.42 Crain 1, 251 2.44 0.12 Nesting intensity 1, 251 1.43 0.23 Sex: life history stage 1, 251 9.29 < 0.01 Life history stage: CTmin 1, 251 6.47 0.01 Life history stage: flying invertebrates 1, 250 2.41 0.12 Life history stage: CTmax 1, 249 2.48 0.12 Life history stage: ground invertebrates 1, 248 3.83 0.051 Sex: CTmin 1, 247 1.42 0.24 Sex: flying invertebrates 1, 246 1.48 0.23 life history stage: nesting intensity 1, 245 0.23 0.63 life history stage: Crain 1, 244 0.34 0.56 Sex: Crain 1, 243 0.31 0.58 Sex: ground invertebrates 1, 242 0.20 0.65 Sex: life history stage: nesting intensity 2, 240 2.52 0.08 Sex: nesting intensity 1, 239 0.00 0.98 Sex: life history stage: Crain 1, 238 1.74 0.19 Sex: life history stage: flying invertebrates 1, 237 1.04 0.31 Sex: life history stage: CTmax 1, 236 0.07 0.80 Sex: life history stage: ground invertebrates 1, 235 0.00 0.96 Sex: life history stage: CTmin 1, 235 0.00 0.96
Body mass variation in a stochastic aseasonal environment
69
Table 3: The best supported climatic time windows and the respective window length in weeks for current rainfall (Crain), maximum (CTmax) and minimum (CTmin) daily temperature predicting (3A) body mass of Red-capped larks, (3B) ground invertebrate biomass and (3C) flying invertebrate biomass identified through the sliding window approach. The best supported time window for each factor was identified after comparing the highest supported window for three aggregate statistics of mean, maximum and minimum for each weather factor related to (3A) body mass of breeding and molting male and female Red-capped larks, (3B) ground invertebrate and (3C) flying invertebrate biomass with a linear response function and including a baseline regression (null) model with sex and life history stage as independent variables. Sample size in table 3A represents number of birds measured while in table 3B and 3C it represents the number of months invertebrates were sampled.
3A)
Parameter Window (weeks) Statistic
Sample size ΔAICc Beta ± S.E.
Percentage of models in 95% weight ΔAICc
PAICc 1000 Randomization
Crain 1-0 Minimum 314 1.31 ± 0.21 78 -3.93 0.17 CTmax 3-0 Minimum 316 -0.01 ± 0.24 89 -2.18 0.13 CTmin 6-5 Maximum 316 -0.08 ± 0.21 92 0.18 0.65 3B) Crain 5-1 Maximum 63 0.47 ± 0.41 92 0.87 0.92 CTmax 7-4 Maximum 63 0.56 ± 0.39 92 0.15 0.42 CTmin 5-2 Maximum 63 2.87 ± 0.72 39 -12.30 < 0.01 3C) Crain 4-1 Maximum 60 1.19 ± 0.45 70 -4.62 0.14 Tmax 7-6 Maximum 60 0.42 ± 0.38 92 0.96 0.63 Tmin 5-3 Minimum 60 1.84 ± 0.69 78 -4.66 0.10
Combined socio-environmental factors influencing body mass of A. breeding and molting males and females, and B. females only during breeding, molting and quiescence We analyzed the effects of current weather, food and nesting intensity on body mass of breeding and molting male and female Red-capped larks: after removing the marginally insignificant interaction life history stage x ground invertebrate biomass, we found significant effects of ground invertebrate biomass, and the interactions sex x life history stage and life history stage x Tmin (Figure 2, Table 4). Red-capped larks were heavier when the ground invertebrate biomass was low but decreased in body mass with an increase in ground invertebrate biomass (Figure 2C). Further exploring the interaction sex x life history stage, we found that breeding females were heavier than molting females, while breeding males were lighter than molting males (Figure 2B). Post hoc analyses revealed that the difference between breeding and molting was significant in females (t 251 = 4.80, P<0.01), but not in males (t 251=1.06, P=0.29). Further exploring the interaction life history stage x Tmin revealed that body masses of breeding birds were lower when Tmin was lower, although the slope did not differ significantly from zero (estimate ± S.E = 0.11 ± 0.09, 95% C.I. = -0.06, 0.29). Conversely, body masses of molting birds were higher when Tmin was lower, a significant effect (slope estimate ± S.E = -0.73 ± 0.33, 95% C.I. = -1.37, -0.09 (Figure 2A)).
Table 4: Results of general linear models examining the effects of weather (Crain, CTmax and CTmin), food (ground and flying invertebrate biomass), and nesting intensity on the body mass of breeding and molting male and female Red-capped larks. Each full model also included all 2-way and 3-way interactions between sex and life history stage and all independent variables. In bold are statistically significant P-values.
Df F Value P(>F) Sex 1, 251 2.66 0.10 Life history stage 1, 251 14.18 < 0.01 Ground invertebrates 1, 251 23.67 < 0.01 Flying invertebrates 1, 251 2.11 0.15 CTmax 1, 251 0.01 0.91 CTmin 1, 251 0.66 0.42 Crain 1, 251 2.44 0.12 Nesting intensity 1, 251 1.43 0.23 Sex: life history stage 1, 251 9.29 < 0.01 Life history stage: CTmin 1, 251 6.47 0.01 Life history stage: flying invertebrates 1, 250 2.41 0.12 Life history stage: CTmax 1, 249 2.48 0.12 Life history stage: ground invertebrates 1, 248 3.83 0.051 Sex: CTmin 1, 247 1.42 0.24 Sex: flying invertebrates 1, 246 1.48 0.23 life history stage: nesting intensity 1, 245 0.23 0.63 life history stage: Crain 1, 244 0.34 0.56 Sex: Crain 1, 243 0.31 0.58 Sex: ground invertebrates 1, 242 0.20 0.65 Sex: life history stage: nesting intensity 2, 240 2.52 0.08 Sex: nesting intensity 1, 239 0.00 0.98 Sex: life history stage: Crain 1, 238 1.74 0.19 Sex: life history stage: flying invertebrates 1, 237 1.04 0.31 Sex: life history stage: CTmax 1, 236 0.07 0.80 Sex: life history stage: ground invertebrates 1, 235 0.00 0.96 Sex: life history stage: CTmin 1, 235 0.00 0.96
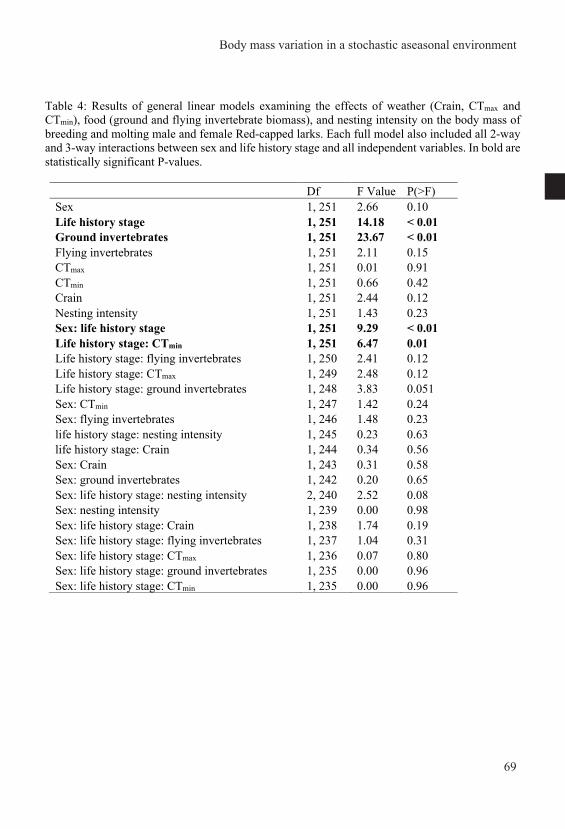
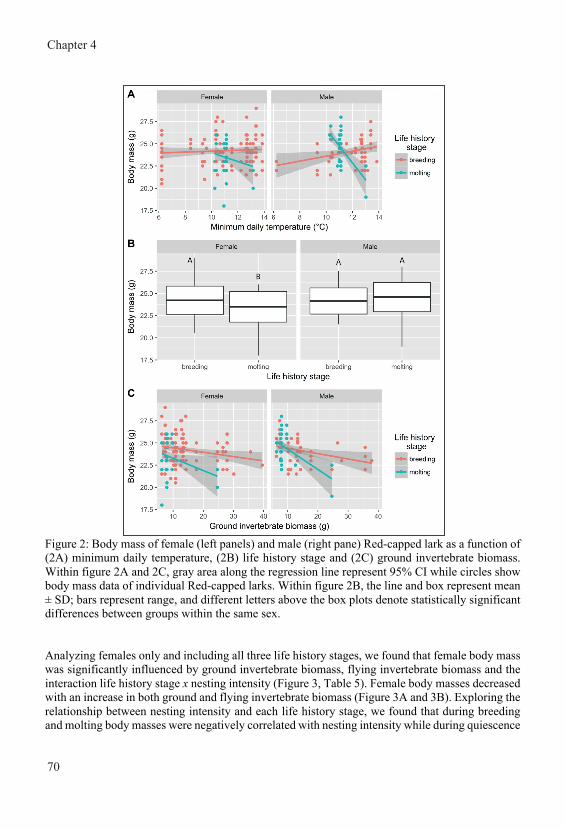
Chapter 4
70
Figure 2: Body mass of female (left panels) and male (right pane) Red-capped lark as a function of (2A) minimum daily temperature, (2B) life history stage and (2C) ground invertebrate biomass. Within figure 2A and 2C, gray area along the regression line represent 95% CI while circles show body mass data of individual Red-capped larks. Within figure 2B, the line and box represent mean ± SD; bars represent range, and different letters above the box plots denote statistically significant differences between groups within the same sex. Analyzing females only and including all three life history stages, we found that female body mass was significantly influenced by ground invertebrate biomass, flying invertebrate biomass and the interaction life history stage x nesting intensity (Figure 3, Table 5). Female body masses decreased with an increase in both ground and flying invertebrate biomass (Figure 3A and 3B). Exploring the relationship between nesting intensity and each life history stage, we found that during breeding and molting body masses were negatively correlated with nesting intensity while during quiescence
body mass was positively correlated with nesting intensity (Figure 3C). Subsequent post-hoc analyses showed that molting females differed significantly from breeding females (estimate ± S.E. = 3.16 ± 0.76, t189 = 4.16, P < 0.01) and those in quiescence (estimate ± SE = -2.41 ± 0.80, t189 = -3.01, P = 0.01), but breeding females were only marginally insignificantly different from quiescent females (estimate ± S.E. = 0.76 ± 0.33, t189=2.26, P= 0.06). Further analyses of the slopes per life history stage showed that the slopes of molting females significantly differed from zero (estimate ± S.E. = -1.70 ± 0.58, 95% C.I. = -2.84, -0.56) while those of breeding females (estimate ± S.E. = -0.09 ± 0.13, 95% C. I. = -0.34, 0.16) and birds in quiescence (estimate ± S.E. = 0.38 ± 0.25, 95% C.I. = -0.12, 0.88) did not significantly differ from zero. Table 5: Results of General Linear Models examining the effect of Crain, maximum (CTmax) and minimum (CTmin) daily temperature, ground and flying invertebrate biomass, nesting intensity and their interactions with life history stage on body mass of female Red-capped larks in breeding, molt and quiescence. Statistically significant P-values are highlighted in bold.
Df F Value P Life history stage 2, 189 7.556 < 0.01 Ground invertebrates 1, 189 8.334 < 0.01 Flying invertebrates 1, 189 5.055 0.03 CTmax 1, 189 0.676 0.41 CTmin 1, 189 0.994 0.32 Crain 1, 189 0.561 0.46 Nesting intensity 1, 189 0.088 0.77 Life history stage: nesting intensity 2, 189 5.926 < 0.01 Life history stage: ground invertebrates 2, 187 0.381 0.68 Life history stage: CTmin 2, 185 0.475 0.62 Life history stage: Crain 2, 183 0.155 0.86 Life history stage: flying invertebrates 2, 181 0.002 0.99 Life history stage: CTmax 2, 181 0.001 0.99
Body mass variation in a stochastic aseasonal environment
71
Figure 2: Body mass of female (left panels) and male (right pane) Red-capped lark as a function of (2A) minimum daily temperature, (2B) life history stage and (2C) ground invertebrate biomass. Within figure 2A and 2C, gray area along the regression line represent 95% CI while circles show body mass data of individual Red-capped larks. Within figure 2B, the line and box represent mean ± SD; bars represent range, and different letters above the box plots denote statistically significant differences between groups within the same sex. Analyzing females only and including all three life history stages, we found that female body mass was significantly influenced by ground invertebrate biomass, flying invertebrate biomass and the interaction life history stage x nesting intensity (Figure 3, Table 5). Female body masses decreased with an increase in both ground and flying invertebrate biomass (Figure 3A and 3B). Exploring the relationship between nesting intensity and each life history stage, we found that during breeding and molting body masses were negatively correlated with nesting intensity while during quiescence
body mass was positively correlated with nesting intensity (Figure 3C). Subsequent post-hoc analyses showed that molting females differed significantly from breeding females (estimate ± S.E. = 3.16 ± 0.76, t189 = 4.16, P < 0.01) and those in quiescence (estimate ± SE = -2.41 ± 0.80, t189 = -3.01, P = 0.01), but breeding females were only marginally insignificantly different from quiescent females (estimate ± S.E. = 0.76 ± 0.33, t189=2.26, P= 0.06). Further analyses of the slopes per life history stage showed that the slopes of molting females significantly differed from zero (estimate ± S.E. = -1.70 ± 0.58, 95% C.I. = -2.84, -0.56) while those of breeding females (estimate ± S.E. = -0.09 ± 0.13, 95% C. I. = -0.34, 0.16) and birds in quiescence (estimate ± S.E. = 0.38 ± 0.25, 95% C.I. = -0.12, 0.88) did not significantly differ from zero. Table 5: Results of General Linear Models examining the effect of Crain, maximum (CTmax) and minimum (CTmin) daily temperature, ground and flying invertebrate biomass, nesting intensity and their interactions with life history stage on body mass of female Red-capped larks in breeding, molt and quiescence. Statistically significant P-values are highlighted in bold.
Df F Value P Life history stage 2, 189 7.556 < 0.01 Ground invertebrates 1, 189 8.334 < 0.01 Flying invertebrates 1, 189 5.055 0.03 CTmax 1, 189 0.676 0.41 CTmin 1, 189 0.994 0.32 Crain 1, 189 0.561 0.46 Nesting intensity 1, 189 0.088 0.77 Life history stage: nesting intensity 2, 189 5.926 < 0.01 Life history stage: ground invertebrates 2, 187 0.381 0.68 Life history stage: CTmin 2, 185 0.475 0.62 Life history stage: Crain 2, 183 0.155 0.86 Life history stage: flying invertebrates 2, 181 0.002 0.99 Life history stage: CTmax 2, 181 0.001 0.99
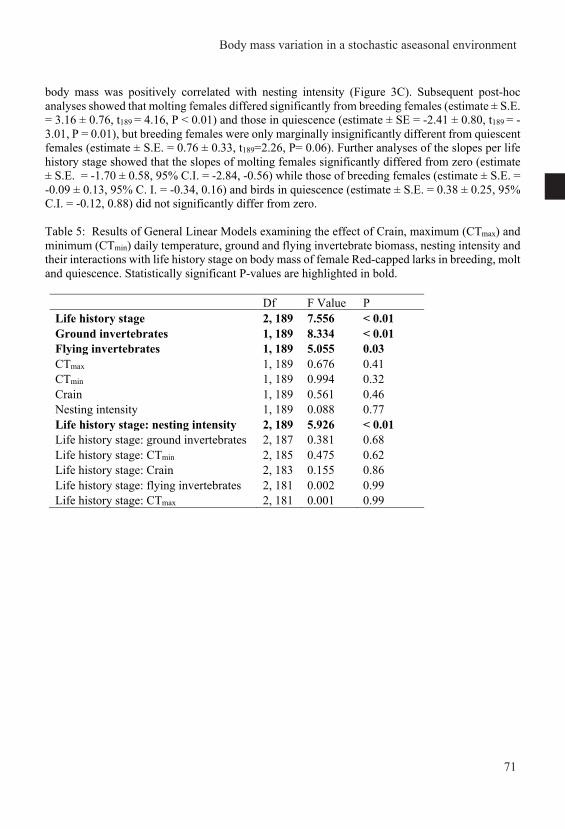
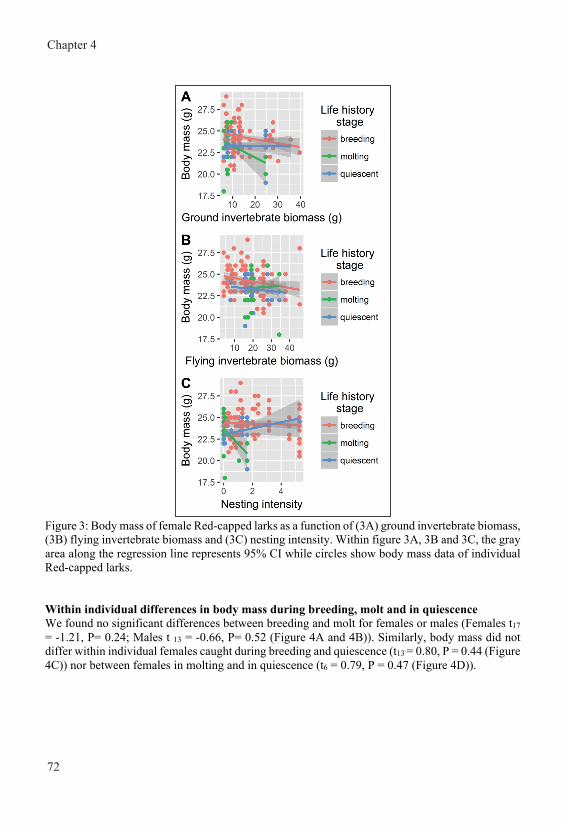
Chapter 4
72
Figure 3: Body mass of female Red-capped larks as a function of (3A) ground invertebrate biomass, (3B) flying invertebrate biomass and (3C) nesting intensity. Within figure 3A, 3B and 3C, the gray area along the regression line represents 95% CI while circles show body mass data of individual Red-capped larks. Within individual differences in body mass during breeding, molt and in quiescence We found no significant differences between breeding and molt for females or males (Females t17 = -1.21, P= 0.24; Males t 13 = -0.66, P= 0.52 (Figure 4A and 4B)). Similarly, body mass did not differ within individual females caught during breeding and quiescence (t13 = 0.80, P = 0.44 (Figure 4C)) nor between females in molting and in quiescence (t6 = 0.79, P = 0.47 (Figure 4D)).
Figure 4: Body mass differences within individual Red-capped larks for (A) males and (B) females caught during breeding and molt (C) females caught during breeding and quiescence, and (D) females caught during molt and quiescence. Lines pair the same individuals across the different life history stages. Middle bold line and box represent mean ± SD while bars represent range of values. Discussion In this study, we show evidence that despite the occurrence of year round breeding and the stochastic nature of the environmental conditions, body mass of Red-capped Larks was only partly explained by phenotypically plastic responses to current weather conditions, and surprisingly also to some extent appeared evolutionarily adapted to long term weather patterns. Specifically, body mass of breeding males correlated positively with CTmax while that of molting males correlated negatively with both LTmax and CTmin. Contrastingly, body mass of females was unrelated to both long term weather patterns and current weather conditions, irrespective of life history stage. Substantiating previous findings by Ndithia et al. (2017b) and consistent with our second
Body mass variation in a stochastic aseasonal environment
73
Figure 3: Body mass of female Red-capped larks as a function of (3A) ground invertebrate biomass, (3B) flying invertebrate biomass and (3C) nesting intensity. Within figure 3A, 3B and 3C, the gray area along the regression line represents 95% CI while circles show body mass data of individual Red-capped larks. Within individual differences in body mass during breeding, molt and in quiescence We found no significant differences between breeding and molt for females or males (Females t17 = -1.21, P= 0.24; Males t 13 = -0.66, P= 0.52 (Figure 4A and 4B)). Similarly, body mass did not differ within individual females caught during breeding and quiescence (t13 = 0.80, P = 0.44 (Figure 4C)) nor between females in molting and in quiescence (t6 = 0.79, P = 0.47 (Figure 4D)).
Figure 4: Body mass differences within individual Red-capped larks for (A) males and (B) females caught during breeding and molt (C) females caught during breeding and quiescence, and (D) females caught during molt and quiescence. Lines pair the same individuals across the different life history stages. Middle bold line and box represent mean ± SD while bars represent range of values. Discussion In this study, we show evidence that despite the occurrence of year round breeding and the stochastic nature of the environmental conditions, body mass of Red-capped Larks was only partly explained by phenotypically plastic responses to current weather conditions, and surprisingly also to some extent appeared evolutionarily adapted to long term weather patterns. Specifically, body mass of breeding males correlated positively with CTmax while that of molting males correlated negatively with both LTmax and CTmin. Contrastingly, body mass of females was unrelated to both long term weather patterns and current weather conditions, irrespective of life history stage. Substantiating previous findings by Ndithia et al. (2017b) and consistent with our second
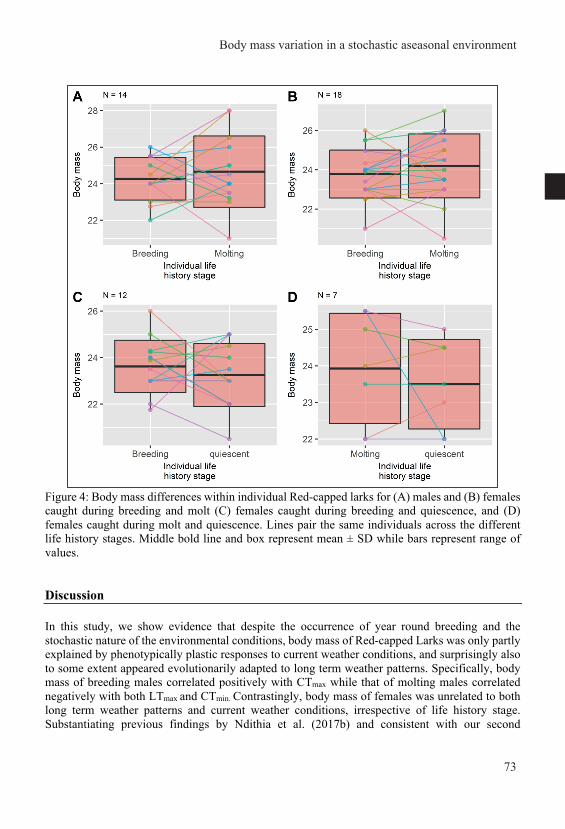
Chapter 4
74
prediction, current or recent weather conditions generally did not explain body mass or food availability based on the climatic window approach. The only exception was that CTmin 5-2 weeks preceding sampling date predicted ground invertebrate biomass mass. When including all current social-environmental factors in a single model, we did not find the expected positive relationships of body mass with rainfall, temperature, invertebrate biomass and nesting intensity, factors which presumably reflect increased food availability and favorable socio-environmental conditions. Instead, independent of life history stage, male and female Red-capped larks had lower body mass with more ground invertebrate biomass, while female body mass was also negatively correlated with flying invertebrate biomass. Likewise, higher nesting intensity, presumably a proxy for good environmental conditions, was associated with a lower body mass in breeding and molting females, while females in quiescence showed the opposite relationship. In addition, molting, but not breeding, males and females had lower body mass when Tmin was higher. Furthermore, molting females were lighter than breeding and quiescent females, which did not differ from each other; males did not differ between molting and breeding. Finally, consistent with our prediction, but in contrast with our results at the population level, within individuals body mass did not differ with life history stage. Phenotypic plasticity versus long term evolutionary adaptation in Red-capped Larks body mass Birds can respond to varying environmental conditions either with evolved adaptive fixed traits over the course of generations or with phenotypic flexibility (Fusco and Minelli 2010). Consistent with the proposal by Piersma and Drent (2003) that plasticity should be especially prominent in stochastic environments, we found that, albeit weakly, body mass of female Red-capped Larks was better explained by current weather conditions, notably temperature, than by long term weather patterns. On the contrary, and surprisingly in this stochastic environment, male body mass was correlated with long term weather patterns, again notably temperature, suggesting phenotypic rigidity although male body masses also responded phenotypically flexible to CTmin. Sex differences in body mass plasticity in Red-capped Larks may reflect differing fitness costs of plasticity (Ball and Ketterson 2008) arising from morphological, physiological and/or behavioral differences between males and females (Mitchell et al. 2012, Goymann and Wingfield 2014, Ball 2016). Although we are not aware of any research that has examined sex differences in the plastic response of body mass to changing environments in birds, sex differences in plasticity of body mass or size have been reported in insects, where the mean plasticity is greater in females than in males (reviewed in Stillwell et al. 2010). Sex differences in body mass plasticity in Red-capped Larks could develop through for instance, differing reproduction costs of mistiming breeding (Verhulst and Nilsson 2008, Low et al. 2015). With females proposed to invest more in breeding than males (Hemborg 1999), in a highly stochastic system a mistake in timing made by a female Red-capped lark is potentially far more costly than a mistake by a male (Ball and Ketterson 2008). In addition it may well take longer for a female to recover from a breeding mistake than a male due to the necessity of generating sufficient resources to produce another egg (Ball and Ketterson 2008). The finding that during molt male body mass was better predicted by current than long term Tmin may not be surprising, because molting birds are known to be susceptible to lower temperature and higher body reserves may buffer against the increased heat loss due to reduced insulation (Klaassen 1995). As our results indeed show, Red-capped Larks are heavier with lower Tmin.
Variation in body mass with increased food availability and favorable social-environmental factors Our study provides strong evidence of the unpredictability of weather as a cue for future food availability in our study system, consistent with previous findings of the stochastic nature of environmental variation in some equatorial tropical environments (Perfito et al. 2007, Tökölyi et al. 2012, Ndithia et al. 2017b). However, contrary to the starvation hypothesis that predicts individuals to opportunistically store more reserves with higher food availability to cover for unanticipated failure in the food supply in unpredictable environments (Bednekoff and Krebs 1995, Cuthill et al. 2000, Speakman 2018), Red-capped Larks’ body masses decreased with increased food availability. A possible explanation for this apparent discrepancy is that food availability may be sufficient year round and at no time limiting, as also suggested by the year round breeding of Red-capped larks (Skutch 1949, Ndithia et al. 2017b, Mwangi et al. 2018). With food sufficient year-round, it may pay off to have a lower body mass with increased food availability to counter associated negative costs of higher body mass that may include increased locomotory costs, reduced agility and speed when escaping predators, and higher predation vulnerability through required intensive foraging (Lima, 1986; Zimmer et al., 2011; Heldstab et al., 2017). As our results indeed show, minimum average daily temperature influences future ground invertebrate biomass but not body mass and that may be indicative that food availability is still dependent on weather in this environment, but the magnitude may not be large enough to influence birds within this environment as is generally observed in seasonal environments (Martin 1987). This may also explain our results that show no interaction between food availability and life history stages in relation to variation in body mass and additionally why food availability does not explain timing of breeding (Ndithia et al. 2017b). Body mass changes associated with life history stage At the population level, breeding females were heavier than molting females, while mass did not differ in males across the two stages. However, in contrast to this population level result, at the individual level body mass of Red-capped Larks did not vary with life history stage for either sex. This inconsistency for the females may be explained by the fact that environmental conditions could not be considered in the individual level analyses. Contrary to common expectation, we did not find evidence that birds accumulate reserves during breeding or molting (Moreno 1987), but on the contrary females in breeding did not differ with birds in quiescence, while females in molting had even a lower body mass than birds in quiescence (Figure 3). The lack of difference between the breeding and quiescent phase in females supports the hypothesis that birds in unpredictable environments with no strong predictive cues always maintain preparedness to opportunistically breed and molt. Contrary to predictable environments where birds have functional gonads but regress their reproductive organs during non-breeding periods, birds in unpredictable environments are thought to maintain their gonads partially activated even outside breeding to allow opportunistic breeding (Perfito et al. 2007). For example in the Australian Zebra Finch Taeniopygia guttata reproductive readiness changed consistently between the breeding and non breeding state while body condition (body mass controlled for size) was lower during non-breeding than breeding season in the predictable habitat, but more non-breeding birds in the unpredictable habitat maintained an activated reproductive system even though they had poorer body condition (Perfito et al. 2007). Since we did not observe molting and breeding in individual Red-capped Larks to co-occur, it is possible that birds in molting are not opportunistically waiting to breed, therefore do not need active gonads nor maintaining physiological preparedness to breed like the birds in breeding and in quiescence (Tökölyi et al. 2012). We note however that body mass variation in
Body mass variation in a stochastic aseasonal environment
75
prediction, current or recent weather conditions generally did not explain body mass or food availability based on the climatic window approach. The only exception was that CTmin 5-2 weeks preceding sampling date predicted ground invertebrate biomass mass. When including all current social-environmental factors in a single model, we did not find the expected positive relationships of body mass with rainfall, temperature, invertebrate biomass and nesting intensity, factors which presumably reflect increased food availability and favorable socio-environmental conditions. Instead, independent of life history stage, male and female Red-capped larks had lower body mass with more ground invertebrate biomass, while female body mass was also negatively correlated with flying invertebrate biomass. Likewise, higher nesting intensity, presumably a proxy for good environmental conditions, was associated with a lower body mass in breeding and molting females, while females in quiescence showed the opposite relationship. In addition, molting, but not breeding, males and females had lower body mass when Tmin was higher. Furthermore, molting females were lighter than breeding and quiescent females, which did not differ from each other; males did not differ between molting and breeding. Finally, consistent with our prediction, but in contrast with our results at the population level, within individuals body mass did not differ with life history stage. Phenotypic plasticity versus long term evolutionary adaptation in Red-capped Larks body mass Birds can respond to varying environmental conditions either with evolved adaptive fixed traits over the course of generations or with phenotypic flexibility (Fusco and Minelli 2010). Consistent with the proposal by Piersma and Drent (2003) that plasticity should be especially prominent in stochastic environments, we found that, albeit weakly, body mass of female Red-capped Larks was better explained by current weather conditions, notably temperature, than by long term weather patterns. On the contrary, and surprisingly in this stochastic environment, male body mass was correlated with long term weather patterns, again notably temperature, suggesting phenotypic rigidity although male body masses also responded phenotypically flexible to CTmin. Sex differences in body mass plasticity in Red-capped Larks may reflect differing fitness costs of plasticity (Ball and Ketterson 2008) arising from morphological, physiological and/or behavioral differences between males and females (Mitchell et al. 2012, Goymann and Wingfield 2014, Ball 2016). Although we are not aware of any research that has examined sex differences in the plastic response of body mass to changing environments in birds, sex differences in plasticity of body mass or size have been reported in insects, where the mean plasticity is greater in females than in males (reviewed in Stillwell et al. 2010). Sex differences in body mass plasticity in Red-capped Larks could develop through for instance, differing reproduction costs of mistiming breeding (Verhulst and Nilsson 2008, Low et al. 2015). With females proposed to invest more in breeding than males (Hemborg 1999), in a highly stochastic system a mistake in timing made by a female Red-capped lark is potentially far more costly than a mistake by a male (Ball and Ketterson 2008). In addition it may well take longer for a female to recover from a breeding mistake than a male due to the necessity of generating sufficient resources to produce another egg (Ball and Ketterson 2008). The finding that during molt male body mass was better predicted by current than long term Tmin may not be surprising, because molting birds are known to be susceptible to lower temperature and higher body reserves may buffer against the increased heat loss due to reduced insulation (Klaassen 1995). As our results indeed show, Red-capped Larks are heavier with lower Tmin.
Variation in body mass with increased food availability and favorable social-environmental factors Our study provides strong evidence of the unpredictability of weather as a cue for future food availability in our study system, consistent with previous findings of the stochastic nature of environmental variation in some equatorial tropical environments (Perfito et al. 2007, Tökölyi et al. 2012, Ndithia et al. 2017b). However, contrary to the starvation hypothesis that predicts individuals to opportunistically store more reserves with higher food availability to cover for unanticipated failure in the food supply in unpredictable environments (Bednekoff and Krebs 1995, Cuthill et al. 2000, Speakman 2018), Red-capped Larks’ body masses decreased with increased food availability. A possible explanation for this apparent discrepancy is that food availability may be sufficient year round and at no time limiting, as also suggested by the year round breeding of Red-capped larks (Skutch 1949, Ndithia et al. 2017b, Mwangi et al. 2018). With food sufficient year-round, it may pay off to have a lower body mass with increased food availability to counter associated negative costs of higher body mass that may include increased locomotory costs, reduced agility and speed when escaping predators, and higher predation vulnerability through required intensive foraging (Lima, 1986; Zimmer et al., 2011; Heldstab et al., 2017). As our results indeed show, minimum average daily temperature influences future ground invertebrate biomass but not body mass and that may be indicative that food availability is still dependent on weather in this environment, but the magnitude may not be large enough to influence birds within this environment as is generally observed in seasonal environments (Martin 1987). This may also explain our results that show no interaction between food availability and life history stages in relation to variation in body mass and additionally why food availability does not explain timing of breeding (Ndithia et al. 2017b). Body mass changes associated with life history stage At the population level, breeding females were heavier than molting females, while mass did not differ in males across the two stages. However, in contrast to this population level result, at the individual level body mass of Red-capped Larks did not vary with life history stage for either sex. This inconsistency for the females may be explained by the fact that environmental conditions could not be considered in the individual level analyses. Contrary to common expectation, we did not find evidence that birds accumulate reserves during breeding or molting (Moreno 1987), but on the contrary females in breeding did not differ with birds in quiescence, while females in molting had even a lower body mass than birds in quiescence (Figure 3). The lack of difference between the breeding and quiescent phase in females supports the hypothesis that birds in unpredictable environments with no strong predictive cues always maintain preparedness to opportunistically breed and molt. Contrary to predictable environments where birds have functional gonads but regress their reproductive organs during non-breeding periods, birds in unpredictable environments are thought to maintain their gonads partially activated even outside breeding to allow opportunistic breeding (Perfito et al. 2007). For example in the Australian Zebra Finch Taeniopygia guttata reproductive readiness changed consistently between the breeding and non breeding state while body condition (body mass controlled for size) was lower during non-breeding than breeding season in the predictable habitat, but more non-breeding birds in the unpredictable habitat maintained an activated reproductive system even though they had poorer body condition (Perfito et al. 2007). Since we did not observe molting and breeding in individual Red-capped Larks to co-occur, it is possible that birds in molting are not opportunistically waiting to breed, therefore do not need active gonads nor maintaining physiological preparedness to breed like the birds in breeding and in quiescence (Tökölyi et al. 2012). We note however that body mass variation in
Chapter 4
76
birds in quiescence may be relatively large, possibly representing a mixture of individuals in different phases (either pre and/or post breeding and molting phase), and therefore less likely to significantly differ from other life history stages. Unfortunately, the majority of studies on body mass change with life history stage have mostly focused on the stages of breeding and molting. Thus understanding body mass change in birds in quiescence with environment requires additional study and further detailed investigation.
Secondly, in addition to molting females being lighter than breeding females, the decrease in body mass with an increase in nesting intensity only differed from zero in molting but not in breeding females. Molting entails aerodynamic costs due to missing flight feathers and reduced wing area (Echeverry-Galvis and Hau 2013). A pattern similar to ours was reported for Ruby-throated hummingbirds Archilochus colubris L. where individuals lost body mass despite the availability of food to alleviate aerodynamic force requirements for weight support during molting (Chai 1997). Consistent with body mass decrease with increased food availability, decreased body mass in molting females under more favorable environmental conditions (as indicated by nesting intensity) may suggest that a lean mass is beneficial for Red-capped Larks under good conditions. Due to reduced flight efficiency during molting (Chai 1997), molting birds may be under actual or perceived higher predation pressure than during breeding or in quiescence and therefore have been proposed to maintain lower body mass to improve escape efficiency (Macleod and Gosler 2006). In addition, during molting flight efficiency is also reduced, which also may select for a lower body mass to reduce flight costs (Carrascal and Polo 2006).
Acknowledgements We thank Peter Kinyanjui, Paul Kimani, Abraham Mwangi, Naomi Wanjiku, Ken Njuguna, and Johana Kamau for the invaluable help in data collection. We would like to thank the management of Kedong for permission to conduct this research in the ranch and the late Sarah Higgins of Lake Naivasha Riparian Association who allowed us to use her archived long term weather data and secondly for providing accommodation and a base for logistics for the research team during the years of fieldwork. The National Museums of Kenya organized permission letters for access to the study area. Funding – Funding for the study was provided by The Netherlands Fellowship Programme of Nuffic (grants no. CF9159/2013 to BIT and JMM, CF6833/2010 to BIT and HKN), the Netherlands Organization for Scientific Research (NWO-VIDI 864.10.012 to BIT), Lucie Burgers foundation (to JMM) and two grants from the Ecology fund of the Royal Netherlands Academy of Arts and Sciences (to JMM).
Supplementary material Appendix 1: Raw Data summaries
Summary by birds life history stage and total by Month Missing Both Breeding Molting Total
January 3 0 22 0 0 25 February 25 0 9 0 8 42 March 23 1 16 2 8 50 April 24 0 78 0 1 103 May 32 0 45 0 9 86 June 56 0 6 28 5 95 July 34 0 14 5 4 57 August 24 1 8 10 13 56 September 19 0 7 8 3 37 October 25 0 11 3 7 46 November 9 0 9 0 0 18 December 3 0 1 0 0 4
Summary by birds life history stage and total by Year Missing Both Breeding Molting Total
2011 26 0 12 3 14 55 2012 17 1 45 0 0 63 2013 7 0 19 7 2 35 2014 99 0 70 32 15 216 2015 78 0 40 11 15 144 2016 50 1 40 3 12 106
Body mass variation in a stochastic aseasonal environment
77
birds in quiescence may be relatively large, possibly representing a mixture of individuals in different phases (either pre and/or post breeding and molting phase), and therefore less likely to significantly differ from other life history stages. Unfortunately, the majority of studies on body mass change with life history stage have mostly focused on the stages of breeding and molting. Thus understanding body mass change in birds in quiescence with environment requires additional study and further detailed investigation.
Secondly, in addition to molting females being lighter than breeding females, the decrease in body mass with an increase in nesting intensity only differed from zero in molting but not in breeding females. Molting entails aerodynamic costs due to missing flight feathers and reduced wing area (Echeverry-Galvis and Hau 2013). A pattern similar to ours was reported for Ruby-throated hummingbirds Archilochus colubris L. where individuals lost body mass despite the availability of food to alleviate aerodynamic force requirements for weight support during molting (Chai 1997). Consistent with body mass decrease with increased food availability, decreased body mass in molting females under more favorable environmental conditions (as indicated by nesting intensity) may suggest that a lean mass is beneficial for Red-capped Larks under good conditions. Due to reduced flight efficiency during molting (Chai 1997), molting birds may be under actual or perceived higher predation pressure than during breeding or in quiescence and therefore have been proposed to maintain lower body mass to improve escape efficiency (Macleod and Gosler 2006). In addition, during molting flight efficiency is also reduced, which also may select for a lower body mass to reduce flight costs (Carrascal and Polo 2006).
Acknowledgements We thank Peter Kinyanjui, Paul Kimani, Abraham Mwangi, Naomi Wanjiku, Ken Njuguna, and Johana Kamau for the invaluable help in data collection. We would like to thank the management of Kedong for permission to conduct this research in the ranch and the late Sarah Higgins of Lake Naivasha Riparian Association who allowed us to use her archived long term weather data and secondly for providing accommodation and a base for logistics for the research team during the years of fieldwork. The National Museums of Kenya organized permission letters for access to the study area. Funding – Funding for the study was provided by The Netherlands Fellowship Programme of Nuffic (grants no. CF9159/2013 to BIT and JMM, CF6833/2010 to BIT and HKN), the Netherlands Organization for Scientific Research (NWO-VIDI 864.10.012 to BIT), Lucie Burgers foundation (to JMM) and two grants from the Ecology fund of the Royal Netherlands Academy of Arts and Sciences (to JMM).
Supplementary material Appendix 1: Raw Data summaries
Summary by birds life history stage and total by Month Missing Both Breeding Molting Total
January 3 0 22 0 0 25 February 25 0 9 0 8 42 March 23 1 16 2 8 50 April 24 0 78 0 1 103 May 32 0 45 0 9 86 June 56 0 6 28 5 95 July 34 0 14 5 4 57 August 24 1 8 10 13 56 September 19 0 7 8 3 37 October 25 0 11 3 7 46 November 9 0 9 0 0 18 December 3 0 1 0 0 4
Summary by birds life history stage and total by Year Missing Both Breeding Molting Total
2011 26 0 12 3 14 55 2012 17 1 45 0 0 63 2013 7 0 19 7 2 35 2014 99 0 70 32 15 216 2015 78 0 40 11 15 144 2016 50 1 40 3 12 106
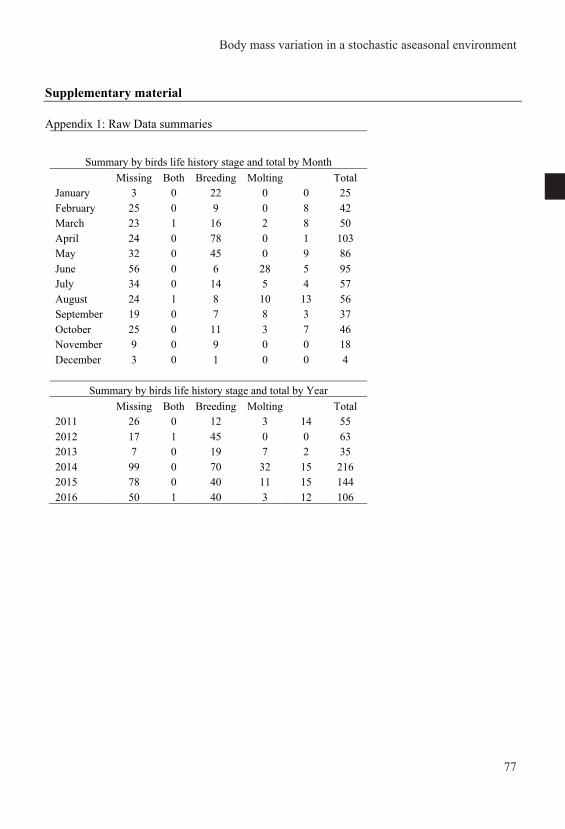
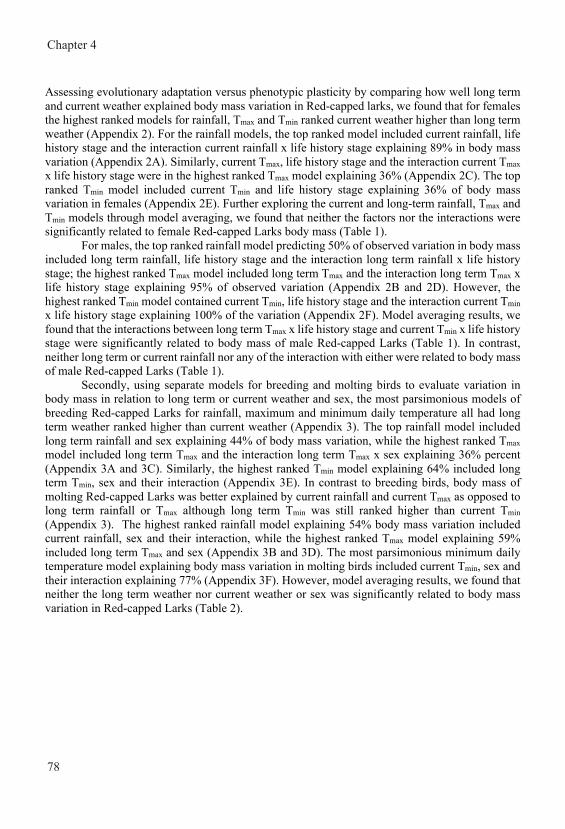
Chapter 4
78
Assessing evolutionary adaptation versus phenotypic plasticity by comparing how well long term and current weather explained body mass variation in Red-capped larks, we found that for females the highest ranked models for rainfall, Tmax and Tmin ranked current weather higher than long term weather (Appendix 2). For the rainfall models, the top ranked model included current rainfall, life history stage and the interaction current rainfall x life history stage explaining 89% in body mass variation (Appendix 2A). Similarly, current Tmax, life history stage and the interaction current Tmax x life history stage were in the highest ranked Tmax model explaining 36% (Appendix 2C). The top ranked Tmin model included current Tmin and life history stage explaining 36% of body mass variation in females (Appendix 2E). Further exploring the current and long-term rainfall, Tmax and Tmin models through model averaging, we found that neither the factors nor the interactions were significantly related to female Red-capped Larks body mass (Table 1).
For males, the top ranked rainfall model predicting 50% of observed variation in body mass included long term rainfall, life history stage and the interaction long term rainfall x life history stage; the highest ranked Tmax model included long term Tmax and the interaction long term Tmax x life history stage explaining 95% of observed variation (Appendix 2B and 2D). However, the highest ranked Tmin model contained current Tmin, life history stage and the interaction current Tmin x life history stage explaining 100% of the variation (Appendix 2F). Model averaging results, we found that the interactions between long term Tmax x life history stage and current Tmin x life history stage were significantly related to body mass of male Red-capped Larks (Table 1). In contrast, neither long term or current rainfall nor any of the interaction with either were related to body mass of male Red-capped Larks (Table 1).
Secondly, using separate models for breeding and molting birds to evaluate variation in body mass in relation to long term or current weather and sex, the most parsimonious models of breeding Red-capped Larks for rainfall, maximum and minimum daily temperature all had long term weather ranked higher than current weather (Appendix 3). The top rainfall model included long term rainfall and sex explaining 44% of body mass variation, while the highest ranked Tmax model included long term Tmax and the interaction long term Tmax x sex explaining 36% percent (Appendix 3A and 3C). Similarly, the highest ranked Tmin model explaining 64% included long term Tmin, sex and their interaction (Appendix 3E). In contrast to breeding birds, body mass of molting Red-capped Larks was better explained by current rainfall and current Tmax as opposed to long term rainfall or Tmax although long term Tmin was still ranked higher than current Tmin (Appendix 3). The highest ranked rainfall model explaining 54% body mass variation included current rainfall, sex and their interaction, while the highest ranked Tmax model explaining 59% included long term Tmax and sex (Appendix 3B and 3D). The most parsimonious minimum daily temperature model explaining body mass variation in molting birds included current Tmin, sex and their interaction explaining 77% (Appendix 3F). However, model averaging results, we found that neither the long term weather nor current weather or sex was significantly related to body mass variation in Red-capped Larks (Table 2).
Appendix 2: Model selection results of the effects of life history stage (Lhs) and (A and B) current (Crain) and long term rainfall (Lrain) on (A) females and (B) males, (C and D) current (CTmax) and long term (LTmax) maximum average daily temperature on (C) females and (D) males, and (E and F) current (CTmin) and long term (LTmin) minimum average daily temperature on (E) females and (F) males on body mass of Red-capped Larks in Kedong Ranch. We restricted the model set to include only those models containing life history stage and either current or long term weather but not both. Model averaged estimates (± SE) are provided in table 1. (A) Long term and current rainfall on female Red-capped Larks Intercept Lrain Crain Lhs Lrain:Lhs Crain:Lhs Df logLik AICc Delta weight
24.05 0.01 + + 5.00 -308.82 628.02 0.00 0.89 24.11 0.00 + 4.00 -312.90 634.04 6.03 0.04 23.96 0.00 + 4.00 -313.07 634.39 6.37 0.04 23.86 0.01 + + 5.00 -312.21 634.80 6.78 0.03
(B) Long term and current rainfall on male Red-capped Larks Intercept Lrain Crain Lhs Lrain:Lhs Crain:Lhs Df logLik AICc Delta weight
22.80 0.02 + + 5.00 -176.68 364.03 0.00 0.50 23.15 0.02 + 4.00 -178.21 364.85 0.82 0.33 24.23 -0.00 + 4.00 -179.21 366.86 2.83 0.12 24.25 -0.00 + + 5.00 -178.90 368.46 4.43 0.05
(C) Long term and current Tmax on female Red-capped Larks Intercept LTmax Lhs CTmax LTmax:Lhs Lhs:CTmax Df logLik AICc Delta weight
24.54 + -0.01 + 5.00 -311.11 632.59 0.00 0.36 29.01 -0.18 + 4.00 -312.58 633.42 0.82 0.24 26.96 -0.11 + + 5.00 -311.64 633.66 1.07 0.21 25.06 + -0.03 4.00 -312.74 633.72 1.13 0.20
(D) Long term and current Tmax on male Red-capped Larks Intercept LTmax Lhs CTmax LTmax:Lhs Lhs:CTmax Df logLik AICc Delta weight
13.09 0.43 + + 5.00 -171.58 353.83 0.00 0.95 27.27 + -0.13 4.00 -175.95 360.34 6.52 0.04 27.19 + -0.13 + 5.00 -175.95 362.56 8.73 0.01 22.00 0.08 + 4.00 -179.26 366.95 13.12 0.00
(E) Long term and current Tmin on female Red-capped Larks Intercept LTmin Lhs CTmin LTmin: Lhs Lhs: CTmin Df logLik AICc Delta weight
23.77 + 0.04 4.00 -313.02 634.30 0.00 0.32 22.65 0.11 + 4.00 -313.05 634.35 0.06 0.31 23.67 + 0.05 + 5.00 -312.27 634.92 0.62 0.24 22.30 0.14 + + 5.00 -312.90 636.18 1.89 0.13
(F) Long term and current Tmin on male Red-capped Larks Intercept LTmin Lhs CTmin LTmin: Lhs Lhs: CTmin Df logLik AICc Delta weight
20.82 + 0.28 + 5.00 -168.01 346.68 0.00 1.00 11.95 0.87 + + 5.00 -173.60 357.86 11.18 0.00 16.26 0.56 + 4.00 -177.20 362.83 16.15 0.00 22.47 + 0.14 4.00 -178.69 365.81 19.13 0.00
Body mass variation in a stochastic aseasonal environment
79
Assessing evolutionary adaptation versus phenotypic plasticity by comparing how well long term and current weather explained body mass variation in Red-capped larks, we found that for females the highest ranked models for rainfall, Tmax and Tmin ranked current weather higher than long term weather (Appendix 2). For the rainfall models, the top ranked model included current rainfall, life history stage and the interaction current rainfall x life history stage explaining 89% in body mass variation (Appendix 2A). Similarly, current Tmax, life history stage and the interaction current Tmax x life history stage were in the highest ranked Tmax model explaining 36% (Appendix 2C). The top ranked Tmin model included current Tmin and life history stage explaining 36% of body mass variation in females (Appendix 2E). Further exploring the current and long-term rainfall, Tmax and Tmin models through model averaging, we found that neither the factors nor the interactions were significantly related to female Red-capped Larks body mass (Table 1).
For males, the top ranked rainfall model predicting 50% of observed variation in body mass included long term rainfall, life history stage and the interaction long term rainfall x life history stage; the highest ranked Tmax model included long term Tmax and the interaction long term Tmax x life history stage explaining 95% of observed variation (Appendix 2B and 2D). However, the highest ranked Tmin model contained current Tmin, life history stage and the interaction current Tmin x life history stage explaining 100% of the variation (Appendix 2F). Model averaging results, we found that the interactions between long term Tmax x life history stage and current Tmin x life history stage were significantly related to body mass of male Red-capped Larks (Table 1). In contrast, neither long term or current rainfall nor any of the interaction with either were related to body mass of male Red-capped Larks (Table 1).
Secondly, using separate models for breeding and molting birds to evaluate variation in body mass in relation to long term or current weather and sex, the most parsimonious models of breeding Red-capped Larks for rainfall, maximum and minimum daily temperature all had long term weather ranked higher than current weather (Appendix 3). The top rainfall model included long term rainfall and sex explaining 44% of body mass variation, while the highest ranked Tmax model included long term Tmax and the interaction long term Tmax x sex explaining 36% percent (Appendix 3A and 3C). Similarly, the highest ranked Tmin model explaining 64% included long term Tmin, sex and their interaction (Appendix 3E). In contrast to breeding birds, body mass of molting Red-capped Larks was better explained by current rainfall and current Tmax as opposed to long term rainfall or Tmax although long term Tmin was still ranked higher than current Tmin (Appendix 3). The highest ranked rainfall model explaining 54% body mass variation included current rainfall, sex and their interaction, while the highest ranked Tmax model explaining 59% included long term Tmax and sex (Appendix 3B and 3D). The most parsimonious minimum daily temperature model explaining body mass variation in molting birds included current Tmin, sex and their interaction explaining 77% (Appendix 3F). However, model averaging results, we found that neither the long term weather nor current weather or sex was significantly related to body mass variation in Red-capped Larks (Table 2).
Appendix 2: Model selection results of the effects of life history stage (Lhs) and (A and B) current (Crain) and long term rainfall (Lrain) on (A) females and (B) males, (C and D) current (CTmax) and long term (LTmax) maximum average daily temperature on (C) females and (D) males, and (E and F) current (CTmin) and long term (LTmin) minimum average daily temperature on (E) females and (F) males on body mass of Red-capped Larks in Kedong Ranch. We restricted the model set to include only those models containing life history stage and either current or long term weather but not both. Model averaged estimates (± SE) are provided in table 1. (A) Long term and current rainfall on female Red-capped Larks Intercept Lrain Crain Lhs Lrain:Lhs Crain:Lhs Df logLik AICc Delta weight
24.05 0.01 + + 5.00 -308.82 628.02 0.00 0.89 24.11 0.00 + 4.00 -312.90 634.04 6.03 0.04 23.96 0.00 + 4.00 -313.07 634.39 6.37 0.04 23.86 0.01 + + 5.00 -312.21 634.80 6.78 0.03
(B) Long term and current rainfall on male Red-capped Larks Intercept Lrain Crain Lhs Lrain:Lhs Crain:Lhs Df logLik AICc Delta weight
22.80 0.02 + + 5.00 -176.68 364.03 0.00 0.50 23.15 0.02 + 4.00 -178.21 364.85 0.82 0.33 24.23 -0.00 + 4.00 -179.21 366.86 2.83 0.12 24.25 -0.00 + + 5.00 -178.90 368.46 4.43 0.05
(C) Long term and current Tmax on female Red-capped Larks Intercept LTmax Lhs CTmax LTmax:Lhs Lhs:CTmax Df logLik AICc Delta weight
24.54 + -0.01 + 5.00 -311.11 632.59 0.00 0.36 29.01 -0.18 + 4.00 -312.58 633.42 0.82 0.24 26.96 -0.11 + + 5.00 -311.64 633.66 1.07 0.21 25.06 + -0.03 4.00 -312.74 633.72 1.13 0.20
(D) Long term and current Tmax on male Red-capped Larks Intercept LTmax Lhs CTmax LTmax:Lhs Lhs:CTmax Df logLik AICc Delta weight
13.09 0.43 + + 5.00 -171.58 353.83 0.00 0.95 27.27 + -0.13 4.00 -175.95 360.34 6.52 0.04 27.19 + -0.13 + 5.00 -175.95 362.56 8.73 0.01 22.00 0.08 + 4.00 -179.26 366.95 13.12 0.00
(E) Long term and current Tmin on female Red-capped Larks Intercept LTmin Lhs CTmin LTmin: Lhs Lhs: CTmin Df logLik AICc Delta weight
23.77 + 0.04 4.00 -313.02 634.30 0.00 0.32 22.65 0.11 + 4.00 -313.05 634.35 0.06 0.31 23.67 + 0.05 + 5.00 -312.27 634.92 0.62 0.24 22.30 0.14 + + 5.00 -312.90 636.18 1.89 0.13
(F) Long term and current Tmin on male Red-capped Larks Intercept LTmin Lhs CTmin LTmin: Lhs Lhs: CTmin Df logLik AICc Delta weight
20.82 + 0.28 + 5.00 -168.01 346.68 0.00 1.00 11.95 0.87 + + 5.00 -173.60 357.86 11.18 0.00 16.26 0.56 + 4.00 -177.20 362.83 16.15 0.00 22.47 + 0.14 4.00 -178.69 365.81 19.13 0.00
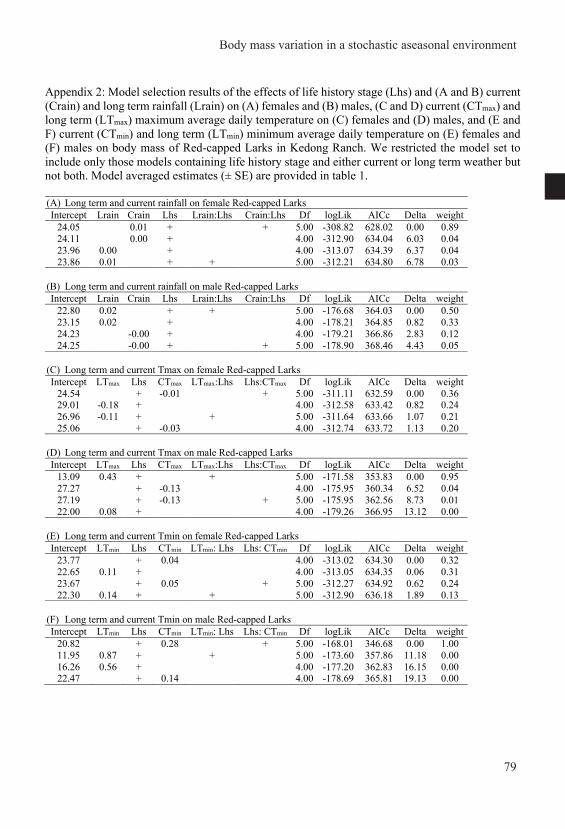
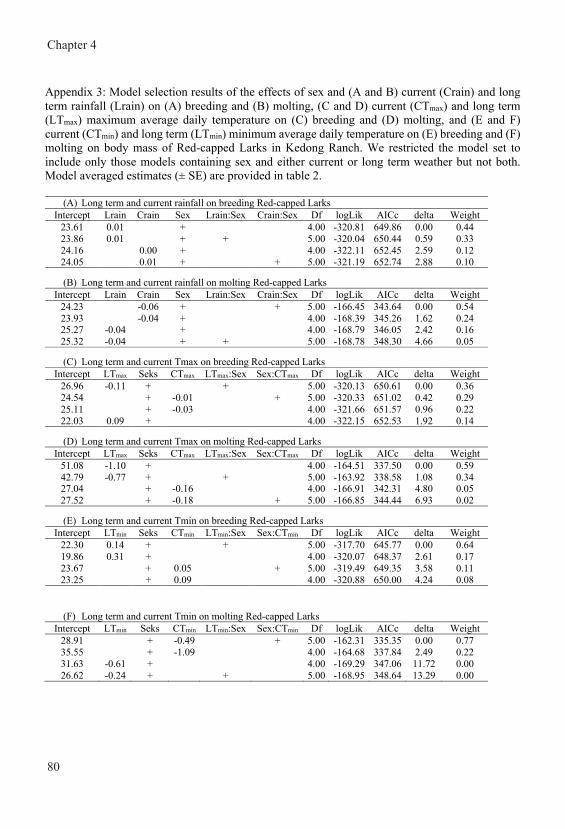
Chapter 4
80
Appendix 3: Model selection results of the effects of sex and (A and B) current (Crain) and long term rainfall (Lrain) on (A) breeding and (B) molting, (C and D) current (CTmax) and long term (LTmax) maximum average daily temperature on (C) breeding and (D) molting, and (E and F) current (CTmin) and long term (LTmin) minimum average daily temperature on (E) breeding and (F) molting on body mass of Red-capped Larks in Kedong Ranch. We restricted the model set to include only those models containing sex and either current or long term weather but not both. Model averaged estimates (± SE) are provided in table 2.
(A) Long term and current rainfall on breeding Red-capped Larks Intercept Lrain Crain Sex Lrain:Sex Crain:Sex Df logLik AICc delta Weight
23.61 0.01 + 4.00 -320.81 649.86 0.00 0.44 23.86 0.01 + + 5.00 -320.04 650.44 0.59 0.33 24.16 0.00 + 4.00 -322.11 652.45 2.59 0.12 24.05 0.01 + + 5.00 -321.19 652.74 2.88 0.10
(B) Long term and current rainfall on molting Red-capped Larks Intercept Lrain Crain Sex Lrain:Sex Crain:Sex Df logLik AICc delta Weight
24.23 -0.06 + + 5.00 -166.45 343.64 0.00 0.54 23.93 -0.04 + 4.00 -168.39 345.26 1.62 0.24 25.27 -0.04 + 4.00 -168.79 346.05 2.42 0.16 25.32 -0.04 + + 5.00 -168.78 348.30 4.66 0.05
(C) Long term and current Tmax on breeding Red-capped Larks Intercept LTmax Seks CTmax LTmax:Sex Sex:CTmax Df logLik AICc delta Weight
26.96 -0.11 + + 5.00 -320.13 650.61 0.00 0.36 24.54 + -0.01 + 5.00 -320.33 651.02 0.42 0.29 25.11 + -0.03 4.00 -321.66 651.57 0.96 0.22 22.03 0.09 + 4.00 -322.15 652.53 1.92 0.14
(D) Long term and current Tmax on molting Red-capped Larks Intercept LTmax Seks CTmax LTmax:Sex Sex:CTmax Df logLik AICc delta Weight
51.08 -1.10 + 4.00 -164.51 337.50 0.00 0.59 42.79 -0.77 + + 5.00 -163.92 338.58 1.08 0.34 27.04 + -0.16 4.00 -166.91 342.31 4.80 0.05 27.52 + -0.18 + 5.00 -166.85 344.44 6.93 0.02
(E) Long term and current Tmin on breeding Red-capped Larks Intercept LTmin Seks CTmin LTmin:Sex Sex:CTmin Df logLik AICc delta Weight
22.30 0.14 + + 5.00 -317.70 645.77 0.00 0.64 19.86 0.31 + 4.00 -320.07 648.37 2.61 0.17 23.67 + 0.05 + 5.00 -319.49 649.35 3.58 0.11 23.25 + 0.09 4.00 -320.88 650.00 4.24 0.08
(F) Long term and current Tmin on molting Red-capped Larks Intercept LTmin Seks CTmin LTmin:Sex Sex:CTmin Df logLik AICc delta Weight
28.91 + -0.49 + 5.00 -162.31 335.35 0.00 0.77 35.55 + -1.09 4.00 -164.68 337.84 2.49 0.22 31.63 -0.61 + 4.00 -169.29 347.06 11.72 0.00 26.62 -0.24 + + 5.00 -168.95 348.64 13.29 0.00
Chapter five
Immune function varies more with socio-environmental factors than with life history stage in a stochastic aseasonal environment
Joseph Mwangi
Henry K. Ndithia
Samuel N. Bakari
Muchane Muchai
B. Irene Tieleman
Unpublished manuscript
Chapter five
Immune function varies more with socio-environmental factors than with life history stage in a stochastic aseasonal environment
Joseph Mwangi
Henry K. Ndithia
Samuel N. Bakari
Muchane Muchai
B. Irene Tieleman
Unpublished manuscript
Chapter five
Immune function varies more with socio-environmental factors than with life history stage in a stochastic aseasonal environment
Joseph Mwangi
Henry K. Ndithia
Samuel N. Bakari
Muchane Muchai
B. Irene Tieleman
Unpublished manuscript
Chapter five
Immune function varies more with socio-environmental factors than with life history stage in a stochastic aseasonal environment
Joseph Mwangi
Henry K. Ndithia
Samuel N. Bakari
Muchane Muchai
B. Irene Tieleman
Unpublished manuscript
Chapter 5
84
Variation in immune function has been explained from either a trade-off with life history stages or in response to a change in socio-environmental conditions. However, discerning independent influences of environmental variation and life history stages in the wild is generally difficult due to co-variation of both, notably in seasonal areas where majority of the studies have been conducted. Also, in light of the recent climatic changes that have disrupted the fit between evolved annual programs and environmental variation, it is becoming increasingly important to understand the relative contributions of genetic adaptation and phenotypic plasticity to coping with socio-environmental factors. In this study, we examined variation of four immune measures in Red-capped Larks in an equatorial system that was previously described as seasonal but that is currently stochastic to, (1) investigate the separate contributions of current socio-environmental conditions and life history stage to explain immune function, and (2) test whether temporal variation in immune indices reflected an evolutionarily adapted program to historical weather patterns, or a phenotypically plastic response to prevailing weather conditions. In this study, we did not find evidence in support of the life-history trade-off hypothesis but instead variation in immune function was strongly related to current socio-environmental factors and may have reflected disease or pathogen level in the environment. In addition, lower haptoglobin was associated with increased ground invertebrates and nesting intensity, while nitric oxide was also higher with higher nesting intensity. This suggests Red-capped larks have lower rates of inflammation resultant of a higher immune function during favourable environmental conditions. Although our study system was historically described as seasonal, we found no support that immune function followed an evolved seasonal or temporal program but rather reflected a plastic response to the current stochastic environmental conditions.
AB
STR
AC
TVariation in immune function with environment and life history stage
85
Variation in immune function has been explained from either a trade-off with life history stages or in response to a change in socio-environmental conditions. However, discerning independent influences of environmental variation and life history stages in the wild is generally difficult due to co-variation of both, notably in seasonal areas where majority of the studies have been conducted. Also, in light of the recent climatic changes that have disrupted the fit between evolved annual programs and environmental variation, it is becoming increasingly important to understand the relative contributions of genetic adaptation and phenotypic plasticity to coping with socio-environmental factors. In this study, we examined variation of four immune measures in Red-capped Larks in an equatorial system that was previously described as seasonal but that is currently stochastic to, (1) investigate the separate contributions of current socio-environmental conditions and life history stage to explain immune function, and (2) test whether temporal variation in immune indices reflected an evolutionarily adapted program to historical weather patterns, or a phenotypically plastic response to prevailing weather conditions. In this study, we did not find evidence in support of the life-history trade-off hypothesis but instead variation in immune function was strongly related to current socio-environmental factors and may have reflected disease or pathogen level in the environment. In addition, lower haptoglobin was associated with increased ground invertebrates and nesting intensity, while nitric oxide was also higher with higher nesting intensity. This suggests Red-capped larks have lower rates of inflammation resultant of a higher immune function during favourable environmental conditions. Although our study system was historically described as seasonal, we found no support that immune function followed an evolved seasonal or temporal program but rather reflected a plastic response to the current stochastic environmental conditions.
Introduction Seasonal or temporal variation in immune function in animals, and in particular vertebrates, has been explained from two different but not mutually exclusive perspectives, namely a trade-off with life history stages or variation with environmental conditions (Sheldon and Verhulst 1996, Martin et al. 2008, Tieleman 2018). Following the first perspective, seasonal or temporal variation in immune function is hypothesized to reflect a trade-off with energetically or nutritionally expensive life-history events such as reproduction and molt (Robbins 1981, Ilmonen et al. 2000, Roman et al. 2009, Moreno‐Rueda 2010), because maintaining immune defenses and responding to immunological challenges is also energetically and nutritionally costly (Jahanian 2009, Moreno‐Rueda 2010, Rauw 2012). Evidence that immune function is involved in trade‐offs with breeding and molting comes from both experimental and correlational studies (e.g. Ilmonen et al. 2000, Moreno‐Rueda 2010). However, despite the insights into the effects of life history stage on immunity through experimental manipulations in wild or captive populations, discerning independent influences of environmental variation and life history stages in the wild is generally difficult due to co-variation of both (Pap et al. 2010), notably in temperate and arctic areas.
The alternative explanation that seasonal or temporal variation in immune function reflects adjustment to changing environmental factors, including temperature, rainfall and social dynamics, that influence resource availability and disease threat, has received considerably less attention (Nelson and Demas 1996, Altizer et al. 2006, Horrocks et al. 2012b, Hegemann et al. 2012, Ezenwa and Worsley-Tonks 2018). However, evidence in support of the influence of socio-environmental conditions in shaping immune function continues to mount (Tieleman 2018). For example, in the wild immune function has been shown to associate with infection risk (Horrocks et al. 2012a, b), aridity (Horrocks et al. 2015, Tieleman et al. in revision), experimentally manipulated food availability (Wilcoxen et al. 2015) and ambient temperatures (Xu et al. 2017), varying both in space (Horrocks et al. 2012b, Ndithia et al in prep) and in time (Hegemann et al. 2012). Recently, several field studies have even suggested that environmental conditions are more forceful in modulating immune function than life history stage (Hegemann et al. 2012, Nwaogu et al in press). However, experimental studies on the effect of specific environmental factors on immune function are limited to single factors instead of the multiple composite factors experienced by natural populations (Wilcoxen et al. 2015, Xu et al. 2017). Moreover, in free-living birds, studies of immune function have been restricted to seasonal environments, limited to one or two annual cycles only and generally have not measured environmental factors directly despite variation within and among years (Buehler et al. 2008, Pap et al. 2010, Horrocks et al. 2012b, but see Ndithia et al. 2017b, Nwaogu et al. 2019).
Seasonal or temporal variation in physiological systems, such as immune function, can result from evolutionary adaptation to predictable environmental dynamics or from phenotypically plastic responses to current environmental conditions (Hahn and MacDougall-Shackleton 2008, Versteegh et al. 2014). In predictable seasonal environments organisms have often evolved adaptive physiological programs and use reliable cues to respond to anticipated variation in environmental conditions; this is generally highly synchronized with life history stage demands (Cresswell 2003, Hotchkiss et al. 2008, Tökölyi et al. 2012, Ruf and Geiser 2015, Abdul-Rahman et al. 2016, Brown et al. 2016). However, environments fall along a continuum from extremely predictable to extremely unpredictable, and at some point, organisms cannot rely on cues to time physiological adjustments (Richard and Gregory 2008). Understanding the relative contributions of genetic adaptation and phenotypic plasticity to coping with environmental conditions has
Chapter 5
84
Variation in immune function has been explained from either a trade-off with life history stages or in response to a change in socio-environmental conditions. However, discerning independent influences of environmental variation and life history stages in the wild is generally difficult due to co-variation of both, notably in seasonal areas where majority of the studies have been conducted. Also, in light of the recent climatic changes that have disrupted the fit between evolved annual programs and environmental variation, it is becoming increasingly important to understand the relative contributions of genetic adaptation and phenotypic plasticity to coping with socio-environmental factors. In this study, we examined variation of four immune measures in Red-capped Larks in an equatorial system that was previously described as seasonal but that is currently stochastic to, (1) investigate the separate contributions of current socio-environmental conditions and life history stage to explain immune function, and (2) test whether temporal variation in immune indices reflected an evolutionarily adapted program to historical weather patterns, or a phenotypically plastic response to prevailing weather conditions. In this study, we did not find evidence in support of the life-history trade-off hypothesis but instead variation in immune function was strongly related to current socio-environmental factors and may have reflected disease or pathogen level in the environment. In addition, lower haptoglobin was associated with increased ground invertebrates and nesting intensity, while nitric oxide was also higher with higher nesting intensity. This suggests Red-capped larks have lower rates of inflammation resultant of a higher immune function during favourable environmental conditions. Although our study system was historically described as seasonal, we found no support that immune function followed an evolved seasonal or temporal program but rather reflected a plastic response to the current stochastic environmental conditions.
AB
STR
AC
T
Variation in immune function with environment and life history stage
85
Variation in immune function has been explained from either a trade-off with life history stages or in response to a change in socio-environmental conditions. However, discerning independent influences of environmental variation and life history stages in the wild is generally difficult due to co-variation of both, notably in seasonal areas where majority of the studies have been conducted. Also, in light of the recent climatic changes that have disrupted the fit between evolved annual programs and environmental variation, it is becoming increasingly important to understand the relative contributions of genetic adaptation and phenotypic plasticity to coping with socio-environmental factors. In this study, we examined variation of four immune measures in Red-capped Larks in an equatorial system that was previously described as seasonal but that is currently stochastic to, (1) investigate the separate contributions of current socio-environmental conditions and life history stage to explain immune function, and (2) test whether temporal variation in immune indices reflected an evolutionarily adapted program to historical weather patterns, or a phenotypically plastic response to prevailing weather conditions. In this study, we did not find evidence in support of the life-history trade-off hypothesis but instead variation in immune function was strongly related to current socio-environmental factors and may have reflected disease or pathogen level in the environment. In addition, lower haptoglobin was associated with increased ground invertebrates and nesting intensity, while nitric oxide was also higher with higher nesting intensity. This suggests Red-capped larks have lower rates of inflammation resultant of a higher immune function during favourable environmental conditions. Although our study system was historically described as seasonal, we found no support that immune function followed an evolved seasonal or temporal program but rather reflected a plastic response to the current stochastic environmental conditions.
Introduction Seasonal or temporal variation in immune function in animals, and in particular vertebrates, has been explained from two different but not mutually exclusive perspectives, namely a trade-off with life history stages or variation with environmental conditions (Sheldon and Verhulst 1996, Martin et al. 2008, Tieleman 2018). Following the first perspective, seasonal or temporal variation in immune function is hypothesized to reflect a trade-off with energetically or nutritionally expensive life-history events such as reproduction and molt (Robbins 1981, Ilmonen et al. 2000, Roman et al. 2009, Moreno‐Rueda 2010), because maintaining immune defenses and responding to immunological challenges is also energetically and nutritionally costly (Jahanian 2009, Moreno‐Rueda 2010, Rauw 2012). Evidence that immune function is involved in trade‐offs with breeding and molting comes from both experimental and correlational studies (e.g. Ilmonen et al. 2000, Moreno‐Rueda 2010). However, despite the insights into the effects of life history stage on immunity through experimental manipulations in wild or captive populations, discerning independent influences of environmental variation and life history stages in the wild is generally difficult due to co-variation of both (Pap et al. 2010), notably in temperate and arctic areas.
The alternative explanation that seasonal or temporal variation in immune function reflects adjustment to changing environmental factors, including temperature, rainfall and social dynamics, that influence resource availability and disease threat, has received considerably less attention (Nelson and Demas 1996, Altizer et al. 2006, Horrocks et al. 2012b, Hegemann et al. 2012, Ezenwa and Worsley-Tonks 2018). However, evidence in support of the influence of socio-environmental conditions in shaping immune function continues to mount (Tieleman 2018). For example, in the wild immune function has been shown to associate with infection risk (Horrocks et al. 2012a, b), aridity (Horrocks et al. 2015, Tieleman et al. in revision), experimentally manipulated food availability (Wilcoxen et al. 2015) and ambient temperatures (Xu et al. 2017), varying both in space (Horrocks et al. 2012b, Ndithia et al in prep) and in time (Hegemann et al. 2012). Recently, several field studies have even suggested that environmental conditions are more forceful in modulating immune function than life history stage (Hegemann et al. 2012, Nwaogu et al in press). However, experimental studies on the effect of specific environmental factors on immune function are limited to single factors instead of the multiple composite factors experienced by natural populations (Wilcoxen et al. 2015, Xu et al. 2017). Moreover, in free-living birds, studies of immune function have been restricted to seasonal environments, limited to one or two annual cycles only and generally have not measured environmental factors directly despite variation within and among years (Buehler et al. 2008, Pap et al. 2010, Horrocks et al. 2012b, but see Ndithia et al. 2017b, Nwaogu et al. 2019).
Seasonal or temporal variation in physiological systems, such as immune function, can result from evolutionary adaptation to predictable environmental dynamics or from phenotypically plastic responses to current environmental conditions (Hahn and MacDougall-Shackleton 2008, Versteegh et al. 2014). In predictable seasonal environments organisms have often evolved adaptive physiological programs and use reliable cues to respond to anticipated variation in environmental conditions; this is generally highly synchronized with life history stage demands (Cresswell 2003, Hotchkiss et al. 2008, Tökölyi et al. 2012, Ruf and Geiser 2015, Abdul-Rahman et al. 2016, Brown et al. 2016). However, environments fall along a continuum from extremely predictable to extremely unpredictable, and at some point, organisms cannot rely on cues to time physiological adjustments (Richard and Gregory 2008). Understanding the relative contributions of genetic adaptation and phenotypic plasticity to coping with environmental conditions has
Chapter 5
86
become important also in light of the recent climatic changes that have disrupted the fit between evolved annual programs and environmental variation (Visser et al. 1998). Under environmental stochasticity, organisms might be selected for phenotypic plasticity, and hence also expected to display flexible responses of immune function to environmental conditions. Yet, no studies have examined temporal variation in immune function in unpredictable environments.
To decouple effects of environmental factors and life history stage on immune function in natural populations, Red-capped larks Calandrella cinerea in equatorial East Africa provide an ideal study system. Red-capped larks breed year-round despite highly stochastic environmental conditions (Ndithia et al. 2017a, Mwangi et al. 2018) and hence at most times breeding and non-breeding individuals co-occur in the same population. This allows evaluation of the adjustment of immune function to varying environmental conditions within a life history stage, in addition to the comparison of immune function of breeding and non-breeding birds under the same environmental conditions. Although the weather conditions are completely stochastic in recent years, East Africa was historically described as seasonal and characterized by a bi-modal rainfall pattern (Brown 1980, Ogalleh et al. 2012, also see Appendix 1). Hence, studying immune function variation in this system also provides the opportunity to investigate if immune function follows an evolved seasonal program in adaptation to the historical weather pattern, or if it is phenotypically plastic and adjusts to the current non-seasonal stochastic environmental conditions.
In this study, we investigated the temporal variation in immune function of Red-capped larks in a stochastic equatorial environment. During 64 months, we quantified four immune indices to account for possible trade-offs between different immune indices where an increase in one measure may evoke a reduction in another (Pap et al. 2010). Specifically, our first objective was to evaluate the separate contributions of current socio-environmental conditions and life history stage to explain immune function. To do so, we simultaneously included rainfall and temperature, ground and flying invertebrates (as proxies for food availability), and population level nesting intensity (a proxy for good breeding conditions) in analyses of immune function of breeding, molting and non-breeding birds. We expected immune indices to be higher with favorable weather conditions and increased food availability. Our second objective was to test whether temporal variation in immune indices reflected an evolutionarily adapted program to historical weather patterns, based on 30-year long historical records of rain and temperature, or a phenotypically plastic response to prevailing weather conditions. Thirdly, based on repeated measures within individual birds, we asked if immune function differed between life history stages within individuals, controlling for environmental conditions, and we assessed the repeatability of immune indices during breeding. Because of the stochastic nature of the environment, we measured all factors at the fine temporal scale of month as opposed to the coarser scale of season used in other studies. Materials and Methods Study system The Red-capped Lark is a highland lark of short grass and bare ground, predominantly feeds on invertebrates (Ndithia et al. 2017a) and occurs across a large range in Africa (Zimmerman et al. 2005). Males and females form pairs during breeding but interact in mixed-sex flocks when not breeding (Mwangi et al. 2018). Previous analyses of our study population in Kedong ranch, Kenya, suggest birds are resident year-round (Mwangi et al. in review). In Kenya, breeding occurs year round with both breeding and non-breeding individuals co-occurring at the same time within the
same population (Ndithia et al. 2017a). They lay an average clutch size of two eggs, but 1–3 egg clutches occur occasionally, and have a nesting period of 24 days from nest building to fledging (Mwangi et al. 2018). Kedong ranch (S 00° 53.04ʹ, E 036° 24.51ʹ, 1890 m above sea level), our study site, is an extensive ranch located on the floor of the Rift valley and sandwiched between two national reserves in Naivasha, Kenya (Ndithia et al. 2017a, Mwangi et al. 2018). The area consists of grasslands interspersed with scattered woodlands and is mainly used by free-ranging wildlife and extensive livestock grazing (Mwangi et al. 2018). Dominant wildlife species in the ranch include Zebra Equus burchelli, Kongoni Alcephalus buselaphus and Thomson's gazelle Gazella thomsonii (Kiringe 1993). Weather, invertebrate biomass and population level breeding intensity To evaluate the immunological responses of birds to environmental conditions, we obtained both current and long-term, historic weather data. To collect data on current weather, we set up a weather station (2011-2014, Alecto WS-3500, Den Bosch, the Netherlands; 2014-2016, Vantage Vue, Davis, the Netherlands) located at the field site. Current rainfall was highly variable, both from month to month and between years. Yearly Crain averaged 421 ± 136 mm (SD) (N = 5) and monthly Crain was 35 ± 37.3 mm (n = 64) with no consistent intra-annual patterns. Mean monthly CTmax was 26.3 ± 3.71 °C (n = 64), while mean monthly CTmin was 11.2 ± 1.73 °C (n = 64) (Mwangi et al. in Prep). To assess long-term historic weather patterns, we obtained records of Lrain, LTmax, and LTmin for the period 1983-2012 collected at Sarah Higgins’ Kijabe farm located 10 kilometers from the field site. We used these historic records to calculate the long-term average monthly Lrain, LTmax and LTmin. Yearly Lrain averaged 680 ± 156 (SD) (N = 30) and monthly Lrain was 57 ± 45.8 mm (n = 359). Mean monthly LTmax was 25.5 ± 1.50 °C (n = 346), while mean monthly LTmin was 13.6 ± 0.98 °C (n = 346).
To monitor the abundance of invertebrates, the primary food of Red-capped Larks as a proxy for food availability, we sampled ground invertebrates using pitfalls and flying invertebrates using sweep nets every month and calculated monthly dry biomass (following Ndithia et al. 2017). To calculate dry invertebrate biomass, we used calibration curves specific for 10 invertebrate taxa categories based on body length and width (Ndithia et al. 2017a). For further details on invertebrate sampling and dry mass calculation, please refer to Ndithia et al. (2017a). The mean ± SD monthly ground invertebrate biomass was 15.6 mg ± 10.89 (n = 61) while the monthly flying invertebrate biomass was 20.8 mg ± 11.24 (n = 57).
Because the concept of “breeding season” as used in seasonal environments does not apply to our study system that is characterized by year-round breeding, we quantified the intensity of breeding at the population level as a proxy for apparent good socio-environmental conditions for breeding. To do so, we calculated a monthly nest index as the total number of nests found in a month per 10 person-hours of search effort. Our search intensity averaged 20 ± 1.0 (SE) days per month (range 7-31 d/mo) and 245 ± 31.2 (SE) hours per month (range 17-825 h/mo) (Mwangi et al. 2018).
Capture and blood sampling We caught adult Red-capped larks between 18 January 2011 and 19 July 2016, using mist nets and nest traps. All birds caught were ringed with a unique numbered aluminum ring and ultraviolet resistant color bands for individual identification. We used a combination of field sexing (for females: presence/absence of brood patch and/or with active nest; for males: with active nests) and molecular methods to determine sex. We extracted DNA from red blood cells using an ammonium acetate method (Richardson et al., 2001) and determined sex following Van der Velde et al. (2017).
Variation in immune function with environment and life history stage
87
become important also in light of the recent climatic changes that have disrupted the fit between evolved annual programs and environmental variation (Visser et al. 1998). Under environmental stochasticity, organisms might be selected for phenotypic plasticity, and hence also expected to display flexible responses of immune function to environmental conditions. Yet, no studies have examined temporal variation in immune function in unpredictable environments.
To decouple effects of environmental factors and life history stage on immune function in natural populations, Red-capped larks Calandrella cinerea in equatorial East Africa provide an ideal study system. Red-capped larks breed year-round despite highly stochastic environmental conditions (Ndithia et al. 2017a, Mwangi et al. 2018) and hence at most times breeding and non-breeding individuals co-occur in the same population. This allows evaluation of the adjustment of immune function to varying environmental conditions within a life history stage, in addition to the comparison of immune function of breeding and non-breeding birds under the same environmental conditions. Although the weather conditions are completely stochastic in recent years, East Africa was historically described as seasonal and characterized by a bi-modal rainfall pattern (Brown 1980, Ogalleh et al. 2012, also see Appendix 1). Hence, studying immune function variation in this system also provides the opportunity to investigate if immune function follows an evolved seasonal program in adaptation to the historical weather pattern, or if it is phenotypically plastic and adjusts to the current non-seasonal stochastic environmental conditions.
In this study, we investigated the temporal variation in immune function of Red-capped larks in a stochastic equatorial environment. During 64 months, we quantified four immune indices to account for possible trade-offs between different immune indices where an increase in one measure may evoke a reduction in another (Pap et al. 2010). Specifically, our first objective was to evaluate the separate contributions of current socio-environmental conditions and life history stage to explain immune function. To do so, we simultaneously included rainfall and temperature, ground and flying invertebrates (as proxies for food availability), and population level nesting intensity (a proxy for good breeding conditions) in analyses of immune function of breeding, molting and non-breeding birds. We expected immune indices to be higher with favorable weather conditions and increased food availability. Our second objective was to test whether temporal variation in immune indices reflected an evolutionarily adapted program to historical weather patterns, based on 30-year long historical records of rain and temperature, or a phenotypically plastic response to prevailing weather conditions. Thirdly, based on repeated measures within individual birds, we asked if immune function differed between life history stages within individuals, controlling for environmental conditions, and we assessed the repeatability of immune indices during breeding. Because of the stochastic nature of the environment, we measured all factors at the fine temporal scale of month as opposed to the coarser scale of season used in other studies. Materials and Methods Study system The Red-capped Lark is a highland lark of short grass and bare ground, predominantly feeds on invertebrates (Ndithia et al. 2017a) and occurs across a large range in Africa (Zimmerman et al. 2005). Males and females form pairs during breeding but interact in mixed-sex flocks when not breeding (Mwangi et al. 2018). Previous analyses of our study population in Kedong ranch, Kenya, suggest birds are resident year-round (Mwangi et al. in review). In Kenya, breeding occurs year round with both breeding and non-breeding individuals co-occurring at the same time within the
same population (Ndithia et al. 2017a). They lay an average clutch size of two eggs, but 1–3 egg clutches occur occasionally, and have a nesting period of 24 days from nest building to fledging (Mwangi et al. 2018). Kedong ranch (S 00° 53.04ʹ, E 036° 24.51ʹ, 1890 m above sea level), our study site, is an extensive ranch located on the floor of the Rift valley and sandwiched between two national reserves in Naivasha, Kenya (Ndithia et al. 2017a, Mwangi et al. 2018). The area consists of grasslands interspersed with scattered woodlands and is mainly used by free-ranging wildlife and extensive livestock grazing (Mwangi et al. 2018). Dominant wildlife species in the ranch include Zebra Equus burchelli, Kongoni Alcephalus buselaphus and Thomson's gazelle Gazella thomsonii (Kiringe 1993). Weather, invertebrate biomass and population level breeding intensity To evaluate the immunological responses of birds to environmental conditions, we obtained both current and long-term, historic weather data. To collect data on current weather, we set up a weather station (2011-2014, Alecto WS-3500, Den Bosch, the Netherlands; 2014-2016, Vantage Vue, Davis, the Netherlands) located at the field site. Current rainfall was highly variable, both from month to month and between years. Yearly Crain averaged 421 ± 136 mm (SD) (N = 5) and monthly Crain was 35 ± 37.3 mm (n = 64) with no consistent intra-annual patterns. Mean monthly CTmax was 26.3 ± 3.71 °C (n = 64), while mean monthly CTmin was 11.2 ± 1.73 °C (n = 64) (Mwangi et al. in Prep). To assess long-term historic weather patterns, we obtained records of Lrain, LTmax, and LTmin for the period 1983-2012 collected at Sarah Higgins’ Kijabe farm located 10 kilometers from the field site. We used these historic records to calculate the long-term average monthly Lrain, LTmax and LTmin. Yearly Lrain averaged 680 ± 156 (SD) (N = 30) and monthly Lrain was 57 ± 45.8 mm (n = 359). Mean monthly LTmax was 25.5 ± 1.50 °C (n = 346), while mean monthly LTmin was 13.6 ± 0.98 °C (n = 346).
To monitor the abundance of invertebrates, the primary food of Red-capped Larks as a proxy for food availability, we sampled ground invertebrates using pitfalls and flying invertebrates using sweep nets every month and calculated monthly dry biomass (following Ndithia et al. 2017). To calculate dry invertebrate biomass, we used calibration curves specific for 10 invertebrate taxa categories based on body length and width (Ndithia et al. 2017a). For further details on invertebrate sampling and dry mass calculation, please refer to Ndithia et al. (2017a). The mean ± SD monthly ground invertebrate biomass was 15.6 mg ± 10.89 (n = 61) while the monthly flying invertebrate biomass was 20.8 mg ± 11.24 (n = 57).
Because the concept of “breeding season” as used in seasonal environments does not apply to our study system that is characterized by year-round breeding, we quantified the intensity of breeding at the population level as a proxy for apparent good socio-environmental conditions for breeding. To do so, we calculated a monthly nest index as the total number of nests found in a month per 10 person-hours of search effort. Our search intensity averaged 20 ± 1.0 (SE) days per month (range 7-31 d/mo) and 245 ± 31.2 (SE) hours per month (range 17-825 h/mo) (Mwangi et al. 2018).
Capture and blood sampling We caught adult Red-capped larks between 18 January 2011 and 19 July 2016, using mist nets and nest traps. All birds caught were ringed with a unique numbered aluminum ring and ultraviolet resistant color bands for individual identification. We used a combination of field sexing (for females: presence/absence of brood patch and/or with active nest; for males: with active nests) and molecular methods to determine sex. We extracted DNA from red blood cells using an ammonium acetate method (Richardson et al., 2001) and determined sex following Van der Velde et al. (2017).
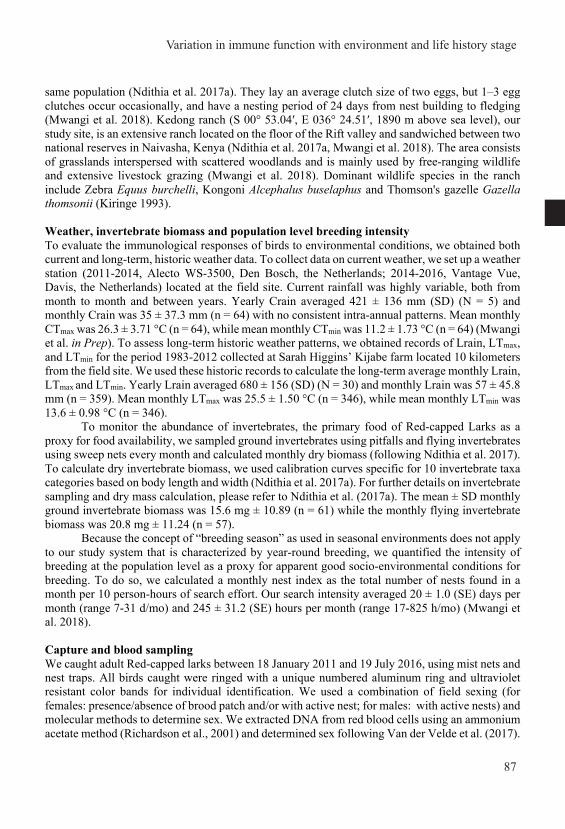
Chapter 5
88
We collected 336 blood samples from 312 individuals using sterile heparinized capillary tubes (75 µL capacity) by puncturing the brachial vein with a 26 gauge needle after sterilizing the area around the vein with 70% ethanol. We collected blood samples immediately after capture (always within three minutes) before any expected impacts of handling stress. Blood was collected into 0.5 ml tubes and stored on ice for transport to the centrifuging station on the same day, after completion of the field activities. We separated plasma and blood cells by centrifuging blood samples for 10 minutes at 7000rpm. Plasma and cells were stored separately at -20 °C until processing (Pap et al. 2010, Matson et al. 2012). Immune assays Before running any of the three described assays, we randomized all samples. To array problems associated with single measures of immune function due to associated trade-offs between different immune branches (Norris and Evans 2000, Pap et al. 2010), we considered four measures of immune function: the ability of plasma to agglutinate and lyse foreign cells (Matson et al. 2005), acute phase protein (haptoglobin) concentrations, which usually increase in response to inflammation or infection (Matson et al. 2012), and nitric oxide, a multifunctional signalling molecule which participates in killing parasites, virus-infected cells, and tumor cells by formation of peroxynitrite (Sild and Hõrak 2009).
We quantified natural antibody-mediated heamagglutination and complement-mediated hemolysis titers of plasma samples against 1% rabbit red blood cells (Envigo RMS Ltd., UK) in phosphate buffered saline as developed by Matson et al. (2005). One person scored all the hemolysis and hemagglutination titers blind to sample and plate identity at least twice and we used the mean in the analyses (Matson et al. 2005).
To quantify plasma haptoglobin concentrations (mg/mL), we used the “manual method” of a commercially available kit that measures the haem-binding capacity of plasma, following manufacturer instructions (Cat. No.: TP801; Tridelta Development Ltd, Maynooth, Ireland) described by Matson et al. (2012).
We quantified concentrations of nitric oxide (NOx mmol/L) using a spectrophotometric assay based on the reduction of nitrate to nitrite by copper-coated cadmium granules followed by color development with Griess reagent (Sild and Hõrak 2009). Statistical Analysis Variation in immune parameters with current socio-environmental factors and life history stage We performed all statistical analyses in R 3.3.0 (R Core Team 2016) within the R-studio graphical user interface (RStudio Team 2016). To analyze effects of current socio-environmental factors on immune parameters, we fitted general linear mixed models separately for nitric oxide, haptoglobin, and haemagglutination immune parameters as the dependent variable and with independent variables monthly Crain, monthly average CTmin and CTmax, ground and flying invertebrate biomass and nesting intensity. We included calendar month (12 months) and month of capture (65 months) as random factors in all models. Data for nitric oxide and haptoglobin were not normally distributed so we used log10 transformations to meet model assumptions. For analyses of haptoglobin, we found that sample redness at 450 nm affected haptoglobin concentration and therefore included sample redness in all haptoglobin models. To prevent pseudoreplication and
non-independence of immune measures, we created a function that randomly selected a single capture per individual for birds sampled more than once during the study period before running the models. Prior to model selection, we checked for collinearity among weather variables with a variance inflation factor (Zuur et al. 2010). Collinearity was low (highest VIF was 1.7) and thus all explanatory variables were considered in the modeling approach (Zuur et al. 2010). We also included the life history stage, sex and all 2-way interactions between life history stage, sex, and all other factors. We used backward elimination using the ‘‘drop1'' function of R to remove non-significant interactions until we either had a combination of significant interactions plus all the main factors as the final model or, in case none of the interactions were significant, a final model with only the main factors. We included the non-significant outputs of all eliminated interactions in our summary tables to show their performance. We employed posthoc tests using the package ‘lsmeans’ (Lenth 2016) to conduct pairwise comparisons when any interaction including sex or life history stage was significant. Due to a low number of positive scores for hemolysis titer throughout the study period, we converted it to a binary factor scored as ‘0’ or ‘1’ (occurrence of lysed cells or not). Hemolysis received positive scores for plasma from only 27 birds while 267 of the total 294 samples scored zero. The poor temporal spread of the data especially in birds with a positive titer did not allow us to test effects of socio-environmental factors on hemolysis titer. We therefore only tested variation in hemolysis with life history stage comparing breeding and non-breeding birds. Evolutionary adaptation versus short-term plasticity in immune function In order to assess if immune indices are evolutionarily adapted to long-term weather patterns or respond phenotypically plastically to current weather conditions, we ran general linear mixed models with current weather, long-term weather, life history stage (two-level factor: breeding and non-breeding), sex and 2-way interactions between all current and long-term weather factors with life history stage and sex. Prior to model selection, we checked for collinearity among explanatory variables with a variance inflation factor. Collinearity was high for Lrain (41) and LTmin (47.9) and thus we ran separate models for rain, Tmax and Tmin. We fitted general linear mixed models one for each immune parameter (nitric oxide, haptoglobin, or agglutination) separately. After running each general linear mixed model, from the global model, we selected a subset of the models using the dredge function (Barton 2018) restricting the subset to include only those models that contained life history stage, sex, and either current or long-term weather but not both within the same model. We used the Akaike information criterion adjusted for sample size (AICc) as recommended by Burnham and Anderson (2002) and ranked the models in ascending order from the smallest to the highest AICc score. Finally, we computed a weighted average of the parameter estimates ± SE and 95% confidence limits for all the variables contained in the selected models. We considered factors as significant in the model average results if the upper and lower limits of the 95% confidence intervals did not include zero. Within individual variation between life history stages and repeatability within breeding For immune measures for which we had repeated measures of the same individual during breeding and non-breeding stages, we tested within individual differences in immune function between life history stages using paired t-tests. This included 8 birds for haptoglobin and 10 birds for haemagglutination. Further, we estimated repeatability of immune indices of birds during breeding using the package ‘rptR’ (Stoffel et al. 2017). This included 25 birds for nitric oxide, 29 for haemagglutination and 34 for haptoglobin. To account for variation due to socio-environmental
Variation in immune function with environment and life history stage
89
We collected 336 blood samples from 312 individuals using sterile heparinized capillary tubes (75 µL capacity) by puncturing the brachial vein with a 26 gauge needle after sterilizing the area around the vein with 70% ethanol. We collected blood samples immediately after capture (always within three minutes) before any expected impacts of handling stress. Blood was collected into 0.5 ml tubes and stored on ice for transport to the centrifuging station on the same day, after completion of the field activities. We separated plasma and blood cells by centrifuging blood samples for 10 minutes at 7000rpm. Plasma and cells were stored separately at -20 °C until processing (Pap et al. 2010, Matson et al. 2012). Immune assays Before running any of the three described assays, we randomized all samples. To array problems associated with single measures of immune function due to associated trade-offs between different immune branches (Norris and Evans 2000, Pap et al. 2010), we considered four measures of immune function: the ability of plasma to agglutinate and lyse foreign cells (Matson et al. 2005), acute phase protein (haptoglobin) concentrations, which usually increase in response to inflammation or infection (Matson et al. 2012), and nitric oxide, a multifunctional signalling molecule which participates in killing parasites, virus-infected cells, and tumor cells by formation of peroxynitrite (Sild and Hõrak 2009).
We quantified natural antibody-mediated heamagglutination and complement-mediated hemolysis titers of plasma samples against 1% rabbit red blood cells (Envigo RMS Ltd., UK) in phosphate buffered saline as developed by Matson et al. (2005). One person scored all the hemolysis and hemagglutination titers blind to sample and plate identity at least twice and we used the mean in the analyses (Matson et al. 2005).
To quantify plasma haptoglobin concentrations (mg/mL), we used the “manual method” of a commercially available kit that measures the haem-binding capacity of plasma, following manufacturer instructions (Cat. No.: TP801; Tridelta Development Ltd, Maynooth, Ireland) described by Matson et al. (2012).
We quantified concentrations of nitric oxide (NOx mmol/L) using a spectrophotometric assay based on the reduction of nitrate to nitrite by copper-coated cadmium granules followed by color development with Griess reagent (Sild and Hõrak 2009). Statistical Analysis Variation in immune parameters with current socio-environmental factors and life history stage We performed all statistical analyses in R 3.3.0 (R Core Team 2016) within the R-studio graphical user interface (RStudio Team 2016). To analyze effects of current socio-environmental factors on immune parameters, we fitted general linear mixed models separately for nitric oxide, haptoglobin, and haemagglutination immune parameters as the dependent variable and with independent variables monthly Crain, monthly average CTmin and CTmax, ground and flying invertebrate biomass and nesting intensity. We included calendar month (12 months) and month of capture (65 months) as random factors in all models. Data for nitric oxide and haptoglobin were not normally distributed so we used log10 transformations to meet model assumptions. For analyses of haptoglobin, we found that sample redness at 450 nm affected haptoglobin concentration and therefore included sample redness in all haptoglobin models. To prevent pseudoreplication and
non-independence of immune measures, we created a function that randomly selected a single capture per individual for birds sampled more than once during the study period before running the models. Prior to model selection, we checked for collinearity among weather variables with a variance inflation factor (Zuur et al. 2010). Collinearity was low (highest VIF was 1.7) and thus all explanatory variables were considered in the modeling approach (Zuur et al. 2010). We also included the life history stage, sex and all 2-way interactions between life history stage, sex, and all other factors. We used backward elimination using the ‘‘drop1'' function of R to remove non-significant interactions until we either had a combination of significant interactions plus all the main factors as the final model or, in case none of the interactions were significant, a final model with only the main factors. We included the non-significant outputs of all eliminated interactions in our summary tables to show their performance. We employed posthoc tests using the package ‘lsmeans’ (Lenth 2016) to conduct pairwise comparisons when any interaction including sex or life history stage was significant. Due to a low number of positive scores for hemolysis titer throughout the study period, we converted it to a binary factor scored as ‘0’ or ‘1’ (occurrence of lysed cells or not). Hemolysis received positive scores for plasma from only 27 birds while 267 of the total 294 samples scored zero. The poor temporal spread of the data especially in birds with a positive titer did not allow us to test effects of socio-environmental factors on hemolysis titer. We therefore only tested variation in hemolysis with life history stage comparing breeding and non-breeding birds. Evolutionary adaptation versus short-term plasticity in immune function In order to assess if immune indices are evolutionarily adapted to long-term weather patterns or respond phenotypically plastically to current weather conditions, we ran general linear mixed models with current weather, long-term weather, life history stage (two-level factor: breeding and non-breeding), sex and 2-way interactions between all current and long-term weather factors with life history stage and sex. Prior to model selection, we checked for collinearity among explanatory variables with a variance inflation factor. Collinearity was high for Lrain (41) and LTmin (47.9) and thus we ran separate models for rain, Tmax and Tmin. We fitted general linear mixed models one for each immune parameter (nitric oxide, haptoglobin, or agglutination) separately. After running each general linear mixed model, from the global model, we selected a subset of the models using the dredge function (Barton 2018) restricting the subset to include only those models that contained life history stage, sex, and either current or long-term weather but not both within the same model. We used the Akaike information criterion adjusted for sample size (AICc) as recommended by Burnham and Anderson (2002) and ranked the models in ascending order from the smallest to the highest AICc score. Finally, we computed a weighted average of the parameter estimates ± SE and 95% confidence limits for all the variables contained in the selected models. We considered factors as significant in the model average results if the upper and lower limits of the 95% confidence intervals did not include zero. Within individual variation between life history stages and repeatability within breeding For immune measures for which we had repeated measures of the same individual during breeding and non-breeding stages, we tested within individual differences in immune function between life history stages using paired t-tests. This included 8 birds for haptoglobin and 10 birds for haemagglutination. Further, we estimated repeatability of immune indices of birds during breeding using the package ‘rptR’ (Stoffel et al. 2017). This included 25 birds for nitric oxide, 29 for haemagglutination and 34 for haptoglobin. To account for variation due to socio-environmental
Chapter 5
90
factors, we included significant environmental variables identified in the socio-environmental analysis per immune measure. Results Current socio-environmental factors are strongly associated with immune function, while life history stage is not Using a general linear mixed model per immune index to simultaneously evaluate all the current socio-environmental factors, we found that all four immune indexes were explained by at least one or more of the socio-environmental factors, while life history stage played a minor role only for haptoglobin. Variation in nitric oxide was significantly explained by CTmax, Crain and nesting intensity (Figure 1, 2, Table 1). In addition, haptoglobin concentration was significantly related to CTmax, nesting intensity, ground invertebrates, and the interaction CTmax x life history stage, while heamagglutination titer was associated with CTmax and CTmin (Figure 1 and 2, Table 1).
Nitric oxide concentration decreased with an increase in CTmax and also decreased with an increase in Crain (Figure 2, Table 1), but contrastingly increased when nesting intensity increased (Figure 1, Table 1).
Opposite to nitric oxide, haptoglobin concentration decreased with an increase in nesting intensity, while it increased with an increase in ground invertebrate biomass (Figure 2, Table 2). Further post hoc analysis to investigate the interaction CTmax x life history stage showed that haptoglobin concentration in both breeding and non-breeding birds increased with an increase in CTmax. Non-breeding birds had a steeper slope than breeding birds and both slopes differed from zero (estimate ± SE, 95% CI: breeding 0.10 ± 0.03, 0.04 - 0.16; non-breeding 0.27 ± 0.05, 0.16 - 0.37, (Figure 1H)).
Similar to the pattern of nitric oxide, haemagglutination decreased significantly with an increase in CTmax but contrastingly increased with an increase in CTmin (Figure 1, Table 2). There was a near significant increase in haemagglutination titer with an increase in nesting intensity (Figure 1, Table 1).
Haemolysis titre did not vary with sex (χ = 0.29, df = 1, P = 0.59), life history stage (χ = 0.51, df = 1, P = 0.47) nor their interaction (χ = 2.85, df = 1, P = 0.09).
No evolutionary adaptation and modest phenotypic plasticity of immune function in relation to rainfall and temperature Using the model selection to evaluate how well long-term weather patterns and current weather conditions explained variation in immune function of Red-capped larks, we found no support for an evolutionary adaptation to long-term weather patterns for any combination of immune indices and weather variables (Figure 2, Table 2). With this approach, we found significant phenotypic flexibility in response to current weather only for the association between haemagglutination titer and CTmax (Figure 2, Table 1): Haemagglutination titer decreased with an increase in CTmax. These results seemingly contrast with the general linear model approach that simultaneously evaluated all the current socio-environmental factors and found multiple significant associations with CTmax, CTmin or rain for all three immune indices. Probably this difference arose due to conditional sub-setting in our model selection approach where only those models that contained life history stage, sex, and either current or long-term weather but not both within the same model were retained
Within individuals immune indices did not vary with life history stage and showed low repeatability Within individual Red-capped larks, haptoglobin concentration (t = 0.30, df = 7, P = 0.77) and haemagglutination titre (t = -1.31, df = 9, P = 0.22) did not differ between breeding and non-breeding stages (Figure 3). We did not test for within individual differences between breeding and non-breeding in nitric oxide because of low sample size (n = 4). Repeatabilities (r) during breeding were low to modest and not significant for all immune measures (nitric oxide r = 0.18, N=25, 95% C.I. 0.00 - 0.50, haptoglobin r = 0.13, N=25, 95% C.I. 0.00 - 0.56, haemagglutination r = 0.00, N=29, 95% C.I. 0.00 - 0.31).
Variation in immune function with environment and life history stage
91
factors, we included significant environmental variables identified in the socio-environmental analysis per immune measure. Results Current socio-environmental factors are strongly associated with immune function, while life history stage is not Using a general linear mixed model per immune index to simultaneously evaluate all the current socio-environmental factors, we found that all four immune indexes were explained by at least one or more of the socio-environmental factors, while life history stage played a minor role only for haptoglobin. Variation in nitric oxide was significantly explained by CTmax, Crain and nesting intensity (Figure 1, 2, Table 1). In addition, haptoglobin concentration was significantly related to CTmax, nesting intensity, ground invertebrates, and the interaction CTmax x life history stage, while heamagglutination titer was associated with CTmax and CTmin (Figure 1 and 2, Table 1).
Nitric oxide concentration decreased with an increase in CTmax and also decreased with an increase in Crain (Figure 2, Table 1), but contrastingly increased when nesting intensity increased (Figure 1, Table 1).
Opposite to nitric oxide, haptoglobin concentration decreased with an increase in nesting intensity, while it increased with an increase in ground invertebrate biomass (Figure 2, Table 2). Further post hoc analysis to investigate the interaction CTmax x life history stage showed that haptoglobin concentration in both breeding and non-breeding birds increased with an increase in CTmax. Non-breeding birds had a steeper slope than breeding birds and both slopes differed from zero (estimate ± SE, 95% CI: breeding 0.10 ± 0.03, 0.04 - 0.16; non-breeding 0.27 ± 0.05, 0.16 - 0.37, (Figure 1H)).
Similar to the pattern of nitric oxide, haemagglutination decreased significantly with an increase in CTmax but contrastingly increased with an increase in CTmin (Figure 1, Table 2). There was a near significant increase in haemagglutination titer with an increase in nesting intensity (Figure 1, Table 1).
Haemolysis titre did not vary with sex (χ = 0.29, df = 1, P = 0.59), life history stage (χ = 0.51, df = 1, P = 0.47) nor their interaction (χ = 2.85, df = 1, P = 0.09).
No evolutionary adaptation and modest phenotypic plasticity of immune function in relation to rainfall and temperature Using the model selection to evaluate how well long-term weather patterns and current weather conditions explained variation in immune function of Red-capped larks, we found no support for an evolutionary adaptation to long-term weather patterns for any combination of immune indices and weather variables (Figure 2, Table 2). With this approach, we found significant phenotypic flexibility in response to current weather only for the association between haemagglutination titer and CTmax (Figure 2, Table 1): Haemagglutination titer decreased with an increase in CTmax. These results seemingly contrast with the general linear model approach that simultaneously evaluated all the current socio-environmental factors and found multiple significant associations with CTmax, CTmin or rain for all three immune indices. Probably this difference arose due to conditional sub-setting in our model selection approach where only those models that contained life history stage, sex, and either current or long-term weather but not both within the same model were retained
Within individuals immune indices did not vary with life history stage and showed low repeatability Within individual Red-capped larks, haptoglobin concentration (t = 0.30, df = 7, P = 0.77) and haemagglutination titre (t = -1.31, df = 9, P = 0.22) did not differ between breeding and non-breeding stages (Figure 3). We did not test for within individual differences between breeding and non-breeding in nitric oxide because of low sample size (n = 4). Repeatabilities (r) during breeding were low to modest and not significant for all immune measures (nitric oxide r = 0.18, N=25, 95% C.I. 0.00 - 0.50, haptoglobin r = 0.13, N=25, 95% C.I. 0.00 - 0.56, haemagglutination r = 0.00, N=29, 95% C.I. 0.00 - 0.31).
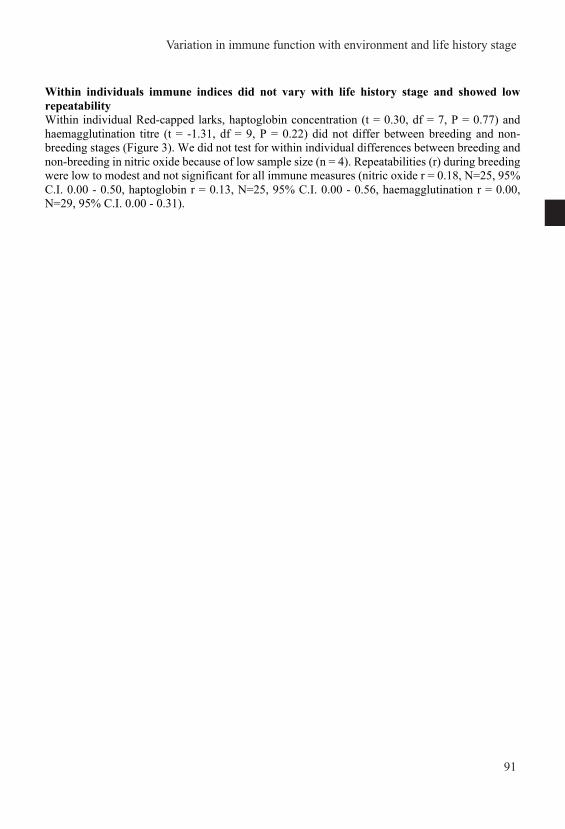
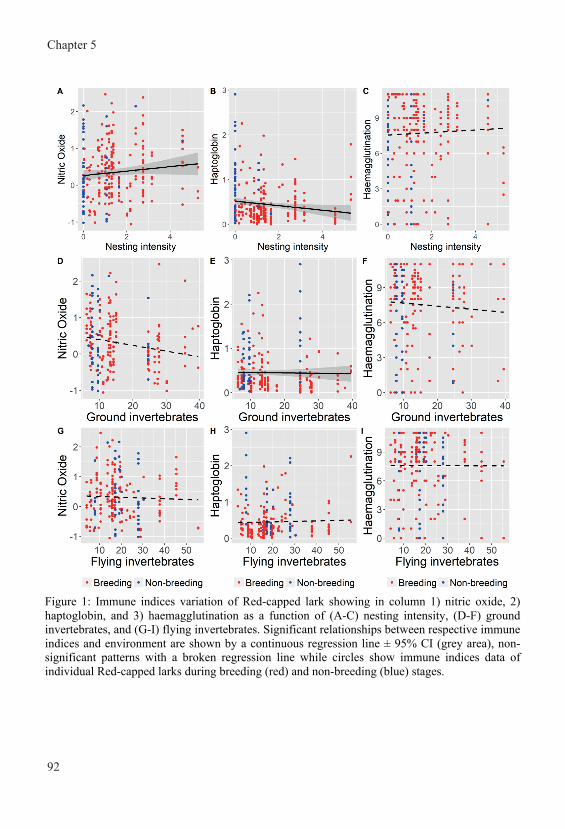
Chapter 5
92
Figure 1: Immune indices variation of Red-capped lark showing in column 1) nitric oxide, 2) haptoglobin, and 3) haemagglutination as a function of (A-C) nesting intensity, (D-F) ground invertebrates, and (G-I) flying invertebrates. Significant relationships between respective immune indices and environment are shown by a continuous regression line ± 95% CI (grey area), non-significant patterns with a broken regression line while circles show immune indices data of individual Red-capped larks during breeding (red) and non-breeding (blue) stages.
Variation in immune function with environment and life history stage
93
Figure 1: Immune indices variation of Red-capped lark showing in column 1) nitric oxide, 2) haptoglobin, and 3) haemagglutination as a function of (A-C) nesting intensity, (D-F) ground invertebrates, and (G-I) flying invertebrates. Significant relationships between respective immune indices and environment are shown by a continuous regression line ± 95% CI (grey area), non-significant patterns with a broken regression line while circles show immune indices data of individual Red-capped larks during breeding (red) and non-breeding (blue) stages.
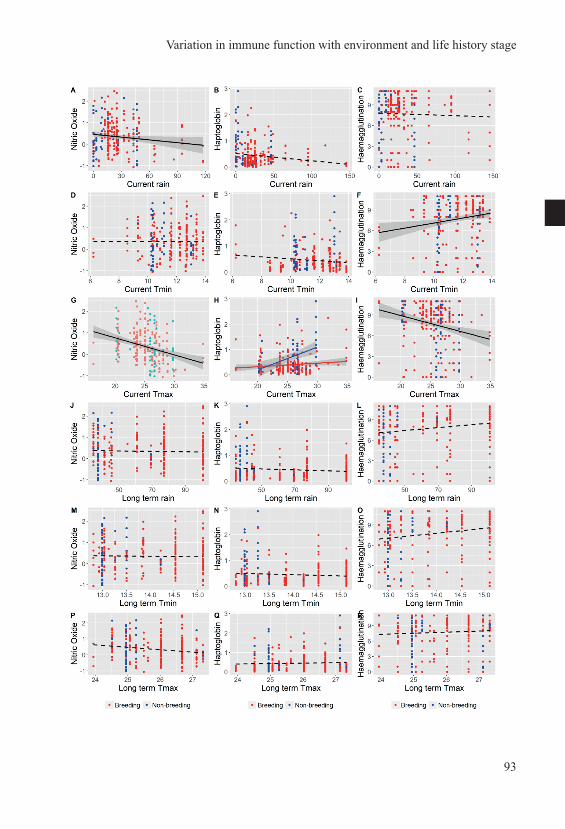
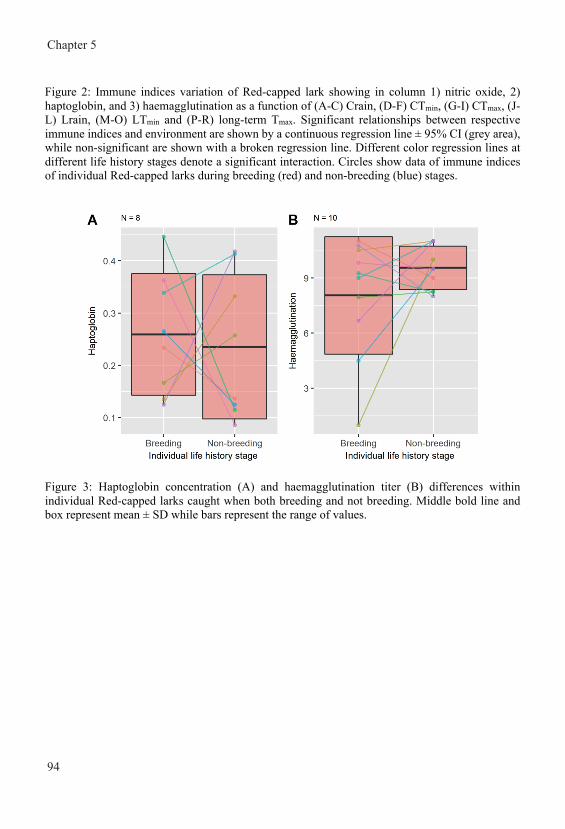
Chapter 5
94
Figure 2: Immune indices variation of Red-capped lark showing in column 1) nitric oxide, 2) haptoglobin, and 3) haemagglutination as a function of (A-C) Crain, (D-F) CTmin, (G-I) CTmax, (J-L) Lrain, (M-O) LTmin and (P-R) long-term Tmax. Significant relationships between respective immune indices and environment are shown by a continuous regression line ± 95% CI (grey area), while non-significant are shown with a broken regression line. Different color regression lines at different life history stages denote a significant interaction. Circles show data of immune indices of individual Red-capped larks during breeding (red) and non-breeding (blue) stages.
Figure 3: Haptoglobin concentration (A) and haemagglutination titer (B) differences within individual Red-capped larks caught when both breeding and not breeding. Middle bold line and box represent mean ± SD while bars represent the range of values.
Table 1: Results of general linear mixed models examining the effects of current weather (Crain, CTmax and CTmin), food (ground (GI) and flying (FI) invertebrate biomass), and nesting intensity (NI) on Red-capped larks nitric oxide concentration (column 1), haptoglobin (column 1), and haemagglutination titre (column 3). Each full model also included life history stage (LHS), sex and all 2-way interactions between all factors with life history stage and sex. We also included calendar month (12 months) and month of capture (65 months) as random factors in all the models. In bold are statistically significant P-values. Nitric Oxide Haptoglobin Haemagglutination Df F P F P F P LHS 1 1.69 0.20 3.38 0.07 . 0.26 0.61 Seks 1 0.41 0.52 0.00 0.98 2.31 0.13 Crain 1 5.96 0.03 * 0.02 0.89 2.42 0.13 Ctmax 1 21.92 <0.01 *** 16.02 <0.01 *** 7.14 0.01 * Ctmin 1 2.71 0.12 3.19 0.08 . 8.46 0.01 ** Nesting intensity 1 12.91 <0.01 ** 9.95 <0.01 ** 3.74 0.06 . Flying invertebrates 1 0.16 0.70 0.03 0.87 0.60 0.45 Ground invertebrates 1 0.07 0.79 5.31 0.03 * 0.08 0.78 LHS: Crain 1 1.99 0.16 1.55 0.25 0.01 0.91 LHS: Ctmax 1 0.64 0.43 9.34 <0.01 ** 2.37 0.14 LHS: Ctmin 1 1.54 0.22 1.66 0.20 0.01 0.91 LHS: Nesting intensity 1 0.14 0.72 0.12 0.73 0.01 0.92 LHS: Flying invertebrates 1 0.02 0.90 0.89 0.37 0.50 0.50 LHS: Ground invertebrates 1 0.10 0.76 0.81 0.37 0.81 0.38 LHS: Seks 1 0.62 0.43 0.07 0.79 1.96 0.16 Sex: Crain 1 0.91 0.34 0.23 0.63 0.74 0.39 Sex: Ctmax 1 0.19 0.67 0.03 0.87 1.54 0.22 Sex: Ctmin 1 0.13 0.72 0.63 0.43 0.0 0.95 Sex: Nesting intensity 1 0.00 0.95 0.65 0.42 2.03 0.16 Sex: Flying invertebrates 1 0.12 0.73 0.56 0.46 1.95 0.16 Sex: Ground invertebrates 1 0.23 0.634 3.19 0.08 . 2.16 0.14
Variation in immune function with environment and life history stage
95
Figure 2: Immune indices variation of Red-capped lark showing in column 1) nitric oxide, 2) haptoglobin, and 3) haemagglutination as a function of (A-C) Crain, (D-F) CTmin, (G-I) CTmax, (J-L) Lrain, (M-O) LTmin and (P-R) long-term Tmax. Significant relationships between respective immune indices and environment are shown by a continuous regression line ± 95% CI (grey area), while non-significant are shown with a broken regression line. Different color regression lines at different life history stages denote a significant interaction. Circles show data of immune indices of individual Red-capped larks during breeding (red) and non-breeding (blue) stages.
Figure 3: Haptoglobin concentration (A) and haemagglutination titer (B) differences within individual Red-capped larks caught when both breeding and not breeding. Middle bold line and box represent mean ± SD while bars represent the range of values.
Table 1: Results of general linear mixed models examining the effects of current weather (Crain, CTmax and CTmin), food (ground (GI) and flying (FI) invertebrate biomass), and nesting intensity (NI) on Red-capped larks nitric oxide concentration (column 1), haptoglobin (column 1), and haemagglutination titre (column 3). Each full model also included life history stage (LHS), sex and all 2-way interactions between all factors with life history stage and sex. We also included calendar month (12 months) and month of capture (65 months) as random factors in all the models. In bold are statistically significant P-values. Nitric Oxide Haptoglobin Haemagglutination Df F P F P F P LHS 1 1.69 0.20 3.38 0.07 . 0.26 0.61 Seks 1 0.41 0.52 0.00 0.98 2.31 0.13 Crain 1 5.96 0.03 * 0.02 0.89 2.42 0.13 Ctmax 1 21.92 <0.01 *** 16.02 <0.01 *** 7.14 0.01 * Ctmin 1 2.71 0.12 3.19 0.08 . 8.46 0.01 ** Nesting intensity 1 12.91 <0.01 ** 9.95 <0.01 ** 3.74 0.06 . Flying invertebrates 1 0.16 0.70 0.03 0.87 0.60 0.45 Ground invertebrates 1 0.07 0.79 5.31 0.03 * 0.08 0.78 LHS: Crain 1 1.99 0.16 1.55 0.25 0.01 0.91 LHS: Ctmax 1 0.64 0.43 9.34 <0.01 ** 2.37 0.14 LHS: Ctmin 1 1.54 0.22 1.66 0.20 0.01 0.91 LHS: Nesting intensity 1 0.14 0.72 0.12 0.73 0.01 0.92 LHS: Flying invertebrates 1 0.02 0.90 0.89 0.37 0.50 0.50 LHS: Ground invertebrates 1 0.10 0.76 0.81 0.37 0.81 0.38 LHS: Seks 1 0.62 0.43 0.07 0.79 1.96 0.16 Sex: Crain 1 0.91 0.34 0.23 0.63 0.74 0.39 Sex: Ctmax 1 0.19 0.67 0.03 0.87 1.54 0.22 Sex: Ctmin 1 0.13 0.72 0.63 0.43 0.0 0.95 Sex: Nesting intensity 1 0.00 0.95 0.65 0.42 2.03 0.16 Sex: Flying invertebrates 1 0.12 0.73 0.56 0.46 1.95 0.16 Sex: Ground invertebrates 1 0.23 0.634 3.19 0.08 . 2.16 0.14
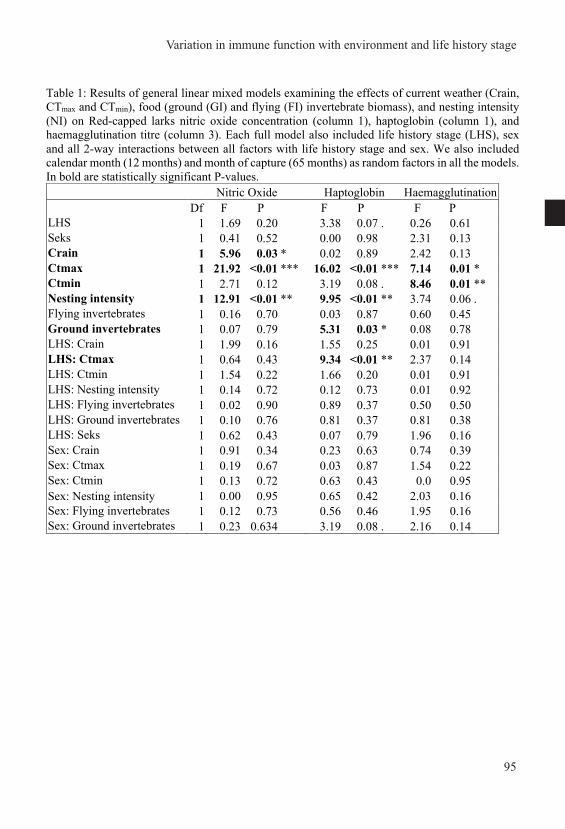
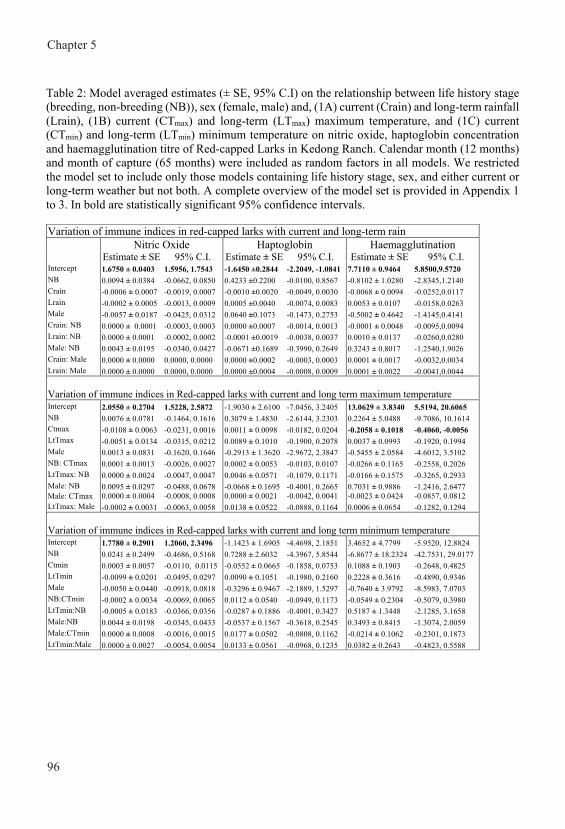
Chapter 5
96
Table 2: Model averaged estimates (± SE, 95% C.I) on the relationship between life history stage (breeding, non-breeding (NB)), sex (female, male) and, (1A) current (Crain) and long-term rainfall (Lrain), (1B) current (CTmax) and long-term (LTmax) maximum temperature, and (1C) current (CTmin) and long-term (LTmin) minimum temperature on nitric oxide, haptoglobin concentration and haemagglutination titre of Red-capped Larks in Kedong Ranch. Calendar month (12 months) and month of capture (65 months) were included as random factors in all models. We restricted the model set to include only those models containing life history stage, sex, and either current or long-term weather but not both. A complete overview of the model set is provided in Appendix 1 to 3. In bold are statistically significant 95% confidence intervals. Variation of immune indices in red-capped larks with current and long-term rain Nitric Oxide Haptoglobin Haemagglutination Estimate ± SE 95% C.I. Estimate ± SE 95% C.I. Estimate ± SE 95% C.I. Intercept 1.6750 ± 0.0403 1.5956, 1.7543 -1.6450 ±0.2844 -2.2049, -1.0841 7.7110 ± 0.9464 5.8500,9.5720 NB 0.0094 ± 0.0384 -0.0662, 0.0850 0.4233 ±0.2200 -0.0100, 0.8567 -0.8102 ± 1.0280 -2.8345,1.2140 Crain -0.0006 ± 0.0007 -0.0019, 0.0007 -0.0010 ±0.0020 -0.0049, 0.0030 -0.0068 ± 0.0094 -0.0252,0.0117 Lrain -0.0002 ± 0.0005 -0.0013, 0.0009 0.0005 ±0.0040 -0.0074, 0.0083 0.0053 ± 0.0107 -0.0158,0.0263 Male -0.0057 ± 0.0187 -0.0425, 0.0312 0.0640 ±0.1073 -0.1473, 0.2753 -0.5002 ± 0.4642 -1.4145,0.4141 Crain: NB 0.0000 ± 0.0001 -0.0003, 0.0003 0.0000 ±0.0007 -0.0014, 0.0013 -0.0001 ± 0.0048 -0.0095,0.0094 Lrain: NB 0.0000 ± 0.0001 -0.0002, 0.0002 -0.0001 ±0.0019 -0.0038, 0.0037 0.0010 ± 0.0137 -0.0260,0.0280 Male: NB 0.0043 ± 0.0195 -0.0340, 0.0427 -0.0671 ±0.1689 -0.3990, 0.2649 0.3243 ± 0.8017 -1.2540,1.9026 Crain: Male 0.0000 ± 0.0000 0.0000, 0.0000 0.0000 ±0.0002 -0.0003, 0.0003 0.0001 ± 0.0017 -0.0032,0.0034 Lrain: Male 0.0000 ± 0.0000 0.0000, 0.0000 0.0000 ±0.0004 -0.0008, 0.0009 0.0001 ± 0.0022 -0.0041,0.0044 Variation of immune indices in Red-capped larks with current and long term maximum temperature Intercept 2.0550 ± 0.2704 1.5228, 2.5872 -1.9030 ± 2.6100 -7.0456, 3.2405 13.0629 ± 3.8340 5.5194, 20.6065 NB 0.0076 ± 0.0781 -0.1464, 0.1616 0.3079 ± 1.4830 -2.6144, 3.2303 0.2264 ± 5.0488 -9.7086, 10.1614 Ctmax -0.0108 ± 0.0063 -0.0231, 0.0016 0.0011 ± 0.0098 -0.0182, 0.0204 -0.2058 ± 0.1018 -0.4060, -0.0056 LtTmax -0.0051 ± 0.0134 -0.0315, 0.0212 0.0089 ± 0.1010 -0.1900, 0.2078 0.0037 ± 0.0993 -0.1920, 0.1994 Male 0.0013 ± 0.0831 -0.1620, 0.1646 -0.2913 ± 1.3620 -2.9672, 2.3847 -0.5455 ± 2.0584 -4.6012, 3.5102 NB: CTmax 0.0001 ± 0.0013 -0.0026, 0.0027 0.0002 ± 0.0053 -0.0103, 0.0107 -0.0266 ± 0.1165 -0.2558, 0.2026 LtTmax: NB 0.0000 ± 0.0024 -0.0047, 0.0047 0.0046 ± 0.0571 -0.1079, 0.1171 -0.0166 ± 0.1575 -0.3265, 0.2933 Male: NB 0.0095 ± 0.0297 -0.0488, 0.0678 -0.0668 ± 0.1695 -0.4001, 0.2665 0.7031 ± 0.9886 -1.2416, 2.6477 Male: CTmax 0.0000 ± 0.0004 -0.0008, 0.0008 0.0000 ± 0.0021 -0.0042, 0.0041 -0.0023 ± 0.0424 -0.0857, 0.0812 LtTmax: Male -0.0002 ± 0.0031 -0.0063, 0.0058 0.0138 ± 0.0522 -0.0888, 0.1164 0.0006 ± 0.0654 -0.1282, 0.1294 Variation of immune indices in Red-capped larks with current and long term minimum temperature Intercept 1.7780 ± 0.2901 1.2060, 2.3496 -1.1423 ± 1.6905 -4.4698, 2.1851 3.4652 ± 4.7799 -5.9520, 12.8824 NB 0.0241 ± 0.2499 -0.4686, 0.5168 0.7288 ± 2.6032 -4.3967, 5.8544 -6.8677 ± 18.2324 -42.7531, 29.0177 Ctmin 0.0003 ± 0.0057 -0.0110, 0.0115 -0.0552 ± 0.0665 -0.1858, 0.0753 0.1088 ± 0.1903 -0.2648, 0.4825 LtTmin -0.0099 ± 0.0201 -0.0495, 0.0297 0.0090 ± 0.1051 -0.1980, 0.2160 0.2228 ± 0.3616 -0.4890, 0.9346 Male -0.0050 ± 0.0440 -0.0918, 0.0818 -0.3296 ± 0.9467 -2.1889, 1.5297 -0.7640 ± 3.9792 -8.5983, 7.0703 NB:CTmin -0.0002 ± 0.0034 -0.0069, 0.0065 0.0112 ± 0.0540 -0.0949, 0.1173 -0.0549 ± 0.2304 -0.5079, 0.3980 LtTmin:NB -0.0005 ± 0.0183 -0.0366, 0.0356 -0.0287 ± 0.1886 -0.4001, 0.3427 0.5187 ± 1.3448 -2.1285, 3.1658 Male:NB 0.0044 ± 0.0198 -0.0345, 0.0433 -0.0537 ± 0.1567 -0.3618, 0.2545 0.3493 ± 0.8415 -1.3074, 2.0059 Male:CTmin 0.0000 ± 0.0008 -0.0016, 0.0015 0.0177 ± 0.0502 -0.0808, 0.1162 -0.0214 ± 0.1062 -0.2301, 0.1873 LtTmin:Male 0.0000 ± 0.0027 -0.0054, 0.0054 0.0133 ± 0.0561 -0.0968, 0.1235 0.0382 ± 0.2643 -0.4823, 0.5588
Discussion Studying Red-capped larks in a stochastic equatorial environment, we found strong support that the variation in immune indices was better explained by socio-environmental factors than by the life history stages of breeding and non-breeding. We found a difference between breeding and non-breeding birds only for haptoglobin: the increase in haptoglobin concentration with higher CTmax was steeper in non-breeding birds than in breeding conspecifics. Independent of life history stage and sex, we found decreased haptoglobin and higher nitric oxide with increased nesting intensity, while haptoglobin also decreased with an increase in ground invertebrate biomass, factors which presumably reflect increased food availability and favorable socio-environmental conditions for breeding. In relation to ambient temperature, nitric oxide and haemagglutination concentration decreased while haptoglobin increased when CTmax increased. In addition, haemagglutination titer increased with an increase in CTmin. Finally, increased Crain was matched with a decrease in nitric oxide. Although our study system was historically described as seasonal, we found no support that immune function followed an evolved seasonal or temporal program. We also did not find evidence for a difference in immune indices across the two life history stages in the within-individual analysis and repeatability of immune indices within the breeding stage was not significant. Overall, our study supports the hypothesis that immune function of Red-capped larks in a stochastic equatorial environment varies flexibly with current environmental conditions and is not influenced by trade-offs with life history events. Temporal variation in immune function: trade-off with life history stages or variation with socio-environmental conditions Contrary to the hypothesis that immune function is traded off with life history stage (Sheldon and Verhulst 1996, Martin et al. 2008, Tieleman 2018), we found no evidence that immune function in Red-capped larks was reduced during breeding. Similar to our finding, Common bulbuls Pycnonotus barbatus in Nigeria (Nwaogu et al. 2019), and Red-capped larks and Rufous-naped larks Mirafra africana in another study site in Kenya (Ndithia et al in submission) showed no variation in immune function with life history stage. For trade-offs to occur, resources for competing needs should be limited, however, in tropical areas food and other resources are hypothesized to be abundant year round (Skutch 1949), and birds may be able to simultaneously engage in breeding and have optimal levels of immune function (Martin II et al. 2004). Previous studies with similar findings include an experiment with Sand martin nestlings Riparia riparia, showing that growth and immune response were positively correlated when resources were plentiful and were only negatively associated in food-restricted nestlings (Brzęk and Konarzewski 2007). Likewise, Buehler et al. (2009) showed that only when food was limited did Red knots Calidris canutus islandica suppress aspects of the acute phase response although the birds did not downregulate other components of their constitutive immunity. Similar to simultaneously engaging in breeding and investing in immune function, in tropical areas breeding and molting frequently co-occur, while they are presumably separated in temperate birds due to their high energetic costs (Johnson et al. 2012, Jahn et al. 2017, Nwaogu et al. 2018). Additional support for the interpretation that food is plentiful year-round comes from the observations that Red-capped larks breed year-round (Ndithia et al. 2017a, Mwangi et al. 2018) and do not differ in body mass between breeding and non-breeding (Mwangi et al., in prep).
Variation in immune function with environment and life history stage
97
Table 2: Model averaged estimates (± SE, 95% C.I) on the relationship between life history stage (breeding, non-breeding (NB)), sex (female, male) and, (1A) current (Crain) and long-term rainfall (Lrain), (1B) current (CTmax) and long-term (LTmax) maximum temperature, and (1C) current (CTmin) and long-term (LTmin) minimum temperature on nitric oxide, haptoglobin concentration and haemagglutination titre of Red-capped Larks in Kedong Ranch. Calendar month (12 months) and month of capture (65 months) were included as random factors in all models. We restricted the model set to include only those models containing life history stage, sex, and either current or long-term weather but not both. A complete overview of the model set is provided in Appendix 1 to 3. In bold are statistically significant 95% confidence intervals. Variation of immune indices in red-capped larks with current and long-term rain Nitric Oxide Haptoglobin Haemagglutination Estimate ± SE 95% C.I. Estimate ± SE 95% C.I. Estimate ± SE 95% C.I. Intercept 1.6750 ± 0.0403 1.5956, 1.7543 -1.6450 ±0.2844 -2.2049, -1.0841 7.7110 ± 0.9464 5.8500,9.5720 NB 0.0094 ± 0.0384 -0.0662, 0.0850 0.4233 ±0.2200 -0.0100, 0.8567 -0.8102 ± 1.0280 -2.8345,1.2140 Crain -0.0006 ± 0.0007 -0.0019, 0.0007 -0.0010 ±0.0020 -0.0049, 0.0030 -0.0068 ± 0.0094 -0.0252,0.0117 Lrain -0.0002 ± 0.0005 -0.0013, 0.0009 0.0005 ±0.0040 -0.0074, 0.0083 0.0053 ± 0.0107 -0.0158,0.0263 Male -0.0057 ± 0.0187 -0.0425, 0.0312 0.0640 ±0.1073 -0.1473, 0.2753 -0.5002 ± 0.4642 -1.4145,0.4141 Crain: NB 0.0000 ± 0.0001 -0.0003, 0.0003 0.0000 ±0.0007 -0.0014, 0.0013 -0.0001 ± 0.0048 -0.0095,0.0094 Lrain: NB 0.0000 ± 0.0001 -0.0002, 0.0002 -0.0001 ±0.0019 -0.0038, 0.0037 0.0010 ± 0.0137 -0.0260,0.0280 Male: NB 0.0043 ± 0.0195 -0.0340, 0.0427 -0.0671 ±0.1689 -0.3990, 0.2649 0.3243 ± 0.8017 -1.2540,1.9026 Crain: Male 0.0000 ± 0.0000 0.0000, 0.0000 0.0000 ±0.0002 -0.0003, 0.0003 0.0001 ± 0.0017 -0.0032,0.0034 Lrain: Male 0.0000 ± 0.0000 0.0000, 0.0000 0.0000 ±0.0004 -0.0008, 0.0009 0.0001 ± 0.0022 -0.0041,0.0044 Variation of immune indices in Red-capped larks with current and long term maximum temperature Intercept 2.0550 ± 0.2704 1.5228, 2.5872 -1.9030 ± 2.6100 -7.0456, 3.2405 13.0629 ± 3.8340 5.5194, 20.6065 NB 0.0076 ± 0.0781 -0.1464, 0.1616 0.3079 ± 1.4830 -2.6144, 3.2303 0.2264 ± 5.0488 -9.7086, 10.1614 Ctmax -0.0108 ± 0.0063 -0.0231, 0.0016 0.0011 ± 0.0098 -0.0182, 0.0204 -0.2058 ± 0.1018 -0.4060, -0.0056 LtTmax -0.0051 ± 0.0134 -0.0315, 0.0212 0.0089 ± 0.1010 -0.1900, 0.2078 0.0037 ± 0.0993 -0.1920, 0.1994 Male 0.0013 ± 0.0831 -0.1620, 0.1646 -0.2913 ± 1.3620 -2.9672, 2.3847 -0.5455 ± 2.0584 -4.6012, 3.5102 NB: CTmax 0.0001 ± 0.0013 -0.0026, 0.0027 0.0002 ± 0.0053 -0.0103, 0.0107 -0.0266 ± 0.1165 -0.2558, 0.2026 LtTmax: NB 0.0000 ± 0.0024 -0.0047, 0.0047 0.0046 ± 0.0571 -0.1079, 0.1171 -0.0166 ± 0.1575 -0.3265, 0.2933 Male: NB 0.0095 ± 0.0297 -0.0488, 0.0678 -0.0668 ± 0.1695 -0.4001, 0.2665 0.7031 ± 0.9886 -1.2416, 2.6477 Male: CTmax 0.0000 ± 0.0004 -0.0008, 0.0008 0.0000 ± 0.0021 -0.0042, 0.0041 -0.0023 ± 0.0424 -0.0857, 0.0812 LtTmax: Male -0.0002 ± 0.0031 -0.0063, 0.0058 0.0138 ± 0.0522 -0.0888, 0.1164 0.0006 ± 0.0654 -0.1282, 0.1294 Variation of immune indices in Red-capped larks with current and long term minimum temperature Intercept 1.7780 ± 0.2901 1.2060, 2.3496 -1.1423 ± 1.6905 -4.4698, 2.1851 3.4652 ± 4.7799 -5.9520, 12.8824 NB 0.0241 ± 0.2499 -0.4686, 0.5168 0.7288 ± 2.6032 -4.3967, 5.8544 -6.8677 ± 18.2324 -42.7531, 29.0177 Ctmin 0.0003 ± 0.0057 -0.0110, 0.0115 -0.0552 ± 0.0665 -0.1858, 0.0753 0.1088 ± 0.1903 -0.2648, 0.4825 LtTmin -0.0099 ± 0.0201 -0.0495, 0.0297 0.0090 ± 0.1051 -0.1980, 0.2160 0.2228 ± 0.3616 -0.4890, 0.9346 Male -0.0050 ± 0.0440 -0.0918, 0.0818 -0.3296 ± 0.9467 -2.1889, 1.5297 -0.7640 ± 3.9792 -8.5983, 7.0703 NB:CTmin -0.0002 ± 0.0034 -0.0069, 0.0065 0.0112 ± 0.0540 -0.0949, 0.1173 -0.0549 ± 0.2304 -0.5079, 0.3980 LtTmin:NB -0.0005 ± 0.0183 -0.0366, 0.0356 -0.0287 ± 0.1886 -0.4001, 0.3427 0.5187 ± 1.3448 -2.1285, 3.1658 Male:NB 0.0044 ± 0.0198 -0.0345, 0.0433 -0.0537 ± 0.1567 -0.3618, 0.2545 0.3493 ± 0.8415 -1.3074, 2.0059 Male:CTmin 0.0000 ± 0.0008 -0.0016, 0.0015 0.0177 ± 0.0502 -0.0808, 0.1162 -0.0214 ± 0.1062 -0.2301, 0.1873 LtTmin:Male 0.0000 ± 0.0027 -0.0054, 0.0054 0.0133 ± 0.0561 -0.0968, 0.1235 0.0382 ± 0.2643 -0.4823, 0.5588
Discussion Studying Red-capped larks in a stochastic equatorial environment, we found strong support that the variation in immune indices was better explained by socio-environmental factors than by the life history stages of breeding and non-breeding. We found a difference between breeding and non-breeding birds only for haptoglobin: the increase in haptoglobin concentration with higher CTmax was steeper in non-breeding birds than in breeding conspecifics. Independent of life history stage and sex, we found decreased haptoglobin and higher nitric oxide with increased nesting intensity, while haptoglobin also decreased with an increase in ground invertebrate biomass, factors which presumably reflect increased food availability and favorable socio-environmental conditions for breeding. In relation to ambient temperature, nitric oxide and haemagglutination concentration decreased while haptoglobin increased when CTmax increased. In addition, haemagglutination titer increased with an increase in CTmin. Finally, increased Crain was matched with a decrease in nitric oxide. Although our study system was historically described as seasonal, we found no support that immune function followed an evolved seasonal or temporal program. We also did not find evidence for a difference in immune indices across the two life history stages in the within-individual analysis and repeatability of immune indices within the breeding stage was not significant. Overall, our study supports the hypothesis that immune function of Red-capped larks in a stochastic equatorial environment varies flexibly with current environmental conditions and is not influenced by trade-offs with life history events. Temporal variation in immune function: trade-off with life history stages or variation with socio-environmental conditions Contrary to the hypothesis that immune function is traded off with life history stage (Sheldon and Verhulst 1996, Martin et al. 2008, Tieleman 2018), we found no evidence that immune function in Red-capped larks was reduced during breeding. Similar to our finding, Common bulbuls Pycnonotus barbatus in Nigeria (Nwaogu et al. 2019), and Red-capped larks and Rufous-naped larks Mirafra africana in another study site in Kenya (Ndithia et al in submission) showed no variation in immune function with life history stage. For trade-offs to occur, resources for competing needs should be limited, however, in tropical areas food and other resources are hypothesized to be abundant year round (Skutch 1949), and birds may be able to simultaneously engage in breeding and have optimal levels of immune function (Martin II et al. 2004). Previous studies with similar findings include an experiment with Sand martin nestlings Riparia riparia, showing that growth and immune response were positively correlated when resources were plentiful and were only negatively associated in food-restricted nestlings (Brzęk and Konarzewski 2007). Likewise, Buehler et al. (2009) showed that only when food was limited did Red knots Calidris canutus islandica suppress aspects of the acute phase response although the birds did not downregulate other components of their constitutive immunity. Similar to simultaneously engaging in breeding and investing in immune function, in tropical areas breeding and molting frequently co-occur, while they are presumably separated in temperate birds due to their high energetic costs (Johnson et al. 2012, Jahn et al. 2017, Nwaogu et al. 2018). Additional support for the interpretation that food is plentiful year-round comes from the observations that Red-capped larks breed year-round (Ndithia et al. 2017a, Mwangi et al. 2018) and do not differ in body mass between breeding and non-breeding (Mwangi et al., in prep).
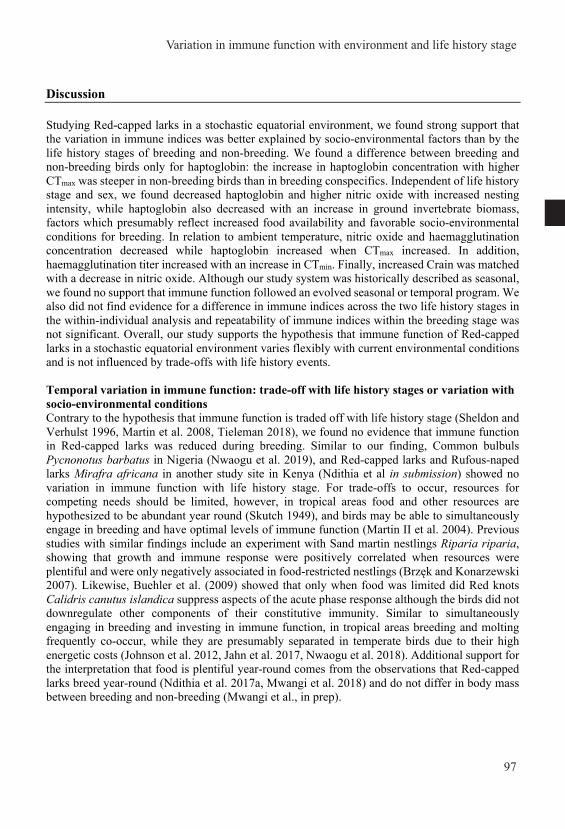
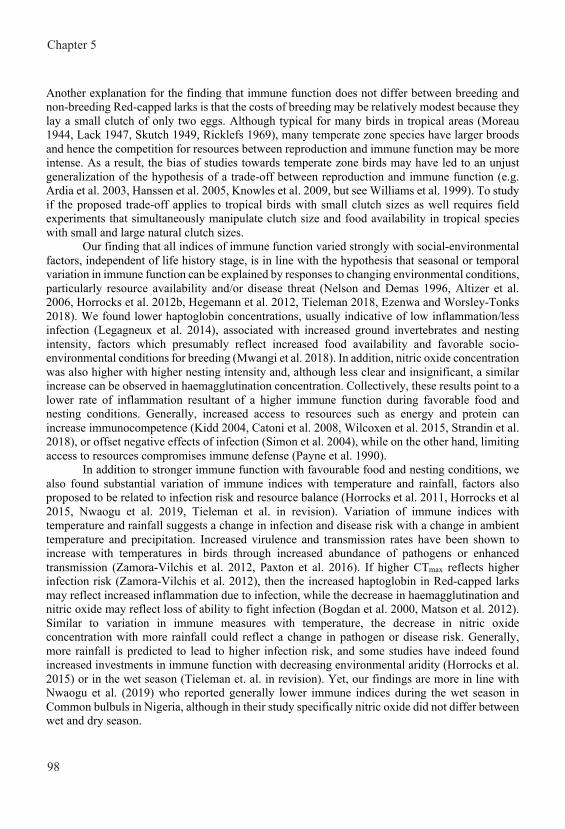
Chapter 5
98
Another explanation for the finding that immune function does not differ between breeding and non-breeding Red-capped larks is that the costs of breeding may be relatively modest because they lay a small clutch of only two eggs. Although typical for many birds in tropical areas (Moreau 1944, Lack 1947, Skutch 1949, Ricklefs 1969), many temperate zone species have larger broods and hence the competition for resources between reproduction and immune function may be more intense. As a result, the bias of studies towards temperate zone birds may have led to an unjust generalization of the hypothesis of a trade-off between reproduction and immune function (e.g. Ardia et al. 2003, Hanssen et al. 2005, Knowles et al. 2009, but see Williams et al. 1999). To study if the proposed trade-off applies to tropical birds with small clutch sizes as well requires field experiments that simultaneously manipulate clutch size and food availability in tropical species with small and large natural clutch sizes.
Our finding that all indices of immune function varied strongly with social-environmental factors, independent of life history stage, is in line with the hypothesis that seasonal or temporal variation in immune function can be explained by responses to changing environmental conditions, particularly resource availability and/or disease threat (Nelson and Demas 1996, Altizer et al. 2006, Horrocks et al. 2012b, Hegemann et al. 2012, Tieleman 2018, Ezenwa and Worsley-Tonks 2018). We found lower haptoglobin concentrations, usually indicative of low inflammation/less infection (Legagneux et al. 2014), associated with increased ground invertebrates and nesting intensity, factors which presumably reflect increased food availability and favorable socio-environmental conditions for breeding (Mwangi et al. 2018). In addition, nitric oxide concentration was also higher with higher nesting intensity and, although less clear and insignificant, a similar increase can be observed in haemagglutination concentration. Collectively, these results point to a lower rate of inflammation resultant of a higher immune function during favorable food and nesting conditions. Generally, increased access to resources such as energy and protein can increase immunocompetence (Kidd 2004, Catoni et al. 2008, Wilcoxen et al. 2015, Strandin et al. 2018), or offset negative effects of infection (Simon et al. 2004), while on the other hand, limiting access to resources compromises immune defense (Payne et al. 1990).
In addition to stronger immune function with favourable food and nesting conditions, we also found substantial variation of immune indices with temperature and rainfall, factors also proposed to be related to infection risk and resource balance (Horrocks et al. 2011, Horrocks et al 2015, Nwaogu et al. 2019, Tieleman et al. in revision). Variation of immune indices with temperature and rainfall suggests a change in infection and disease risk with a change in ambient temperature and precipitation. Increased virulence and transmission rates have been shown to increase with temperatures in birds through increased abundance of pathogens or enhanced transmission (Zamora-Vilchis et al. 2012, Paxton et al. 2016). If higher CTmax reflects higher infection risk (Zamora-Vilchis et al. 2012), then the increased haptoglobin in Red-capped larks may reflect increased inflammation due to infection, while the decrease in haemagglutination and nitric oxide may reflect loss of ability to fight infection (Bogdan et al. 2000, Matson et al. 2012). Similar to variation in immune measures with temperature, the decrease in nitric oxide concentration with more rainfall could reflect a change in pathogen or disease risk. Generally, more rainfall is predicted to lead to higher infection risk, and some studies have indeed found increased investments in immune function with decreasing environmental aridity (Horrocks et al. 2015) or in the wet season (Tieleman et. al. in revision). Yet, our findings are more in line with Nwaogu et al. (2019) who reported generally lower immune indices during the wet season in Common bulbuls in Nigeria, although in their study specifically nitric oxide did not differ between wet and dry season.
Alternative to the explanation that immune indices varied with temperature due to associated variation in infection risk, our results could also point to a trade-off between immune function and thermoregulation (Siegel and Latimer 1984, Sheldon and Verhulst 1996, Thompson 2010). Relatively high CTmax may present thermoregulatory costs to keep Red-capped larks cool, and likewise, relatively low CTmin may lead to thermoregulatory costs to keep larks warm. Experimental manipulations of temperature regimes in studies of captive knots and stonechats have not shown direct effects of temperature on immune function, but in these studies food was available ad libitum (Buehler et al. 2008, Versteegh et al. 2014, but see Horrocks et al. 2015) and hence increased thermoregulatory costs may not have been traded off against immune function. Although from a temperate zone perspective the temperatures that Red-capped larks experience appear moderate over their entire range, previous work in this population has also shown an influence of temperature on body mass (Mwangi et al, in prep), and immune function (Ndithia et al, in prep). With Red-capped larks confined to Afro-tropical areas, it would be informative to test how birds adjust to immune challenges under various thermal conditions to investigate if birds are sensitive to smaller temperature adjustments than their high latitude counterparts. Phenotypic plasticity of immune function in response to current weather patterns Given that genetically fixed adaptive annual programs may be unable to follow changes in stochastic environmental conditions within an individual's lifetime (Guenther and Trillmich 2013), it may not be surprising that immune function variation in Red-capped larks was better explained by current weather conditions than by long-term historical weather patterns. Our results, that variation in all three immune measures was better explained by current social-environmental factors and by none of the long term weather factors, suggest a match to the stochastic environment rather than a mismatch resulting from evolutionary adaptation to a changed environment (Visser et al. 2012). Consistent with plastic immune variation in Red-capped larks, phenotypic plasticity in stochastic environments is exhibited in other physiological mechanisms such as gonad regulation in birds (Tökölyi et al. 2012). However, contrary to our results, Stonechats Saxicola torquata from three genotypically distinct subspecies, originating from three different locations in Kazakhstan, Central Europe and Kenya, show seasonal variation of constitutive immunity coincident with the degree of seasonal variation that a subspecies experiences within its geographic distribution even when kept under similar environmental conditions in a common garden experiment (Versteegh et al. 2014). Variation of constitutive immunity in the three stonechat subspecies therefore indicates a stronger intrinsic endogenous mechanism behind immune function regulation than the current social-environmental factors being experienced by the birds (Versteegh et al. 2014). These differing patterns in immune variation show that immune function can be intrinsic, i.e. adjusted evolutionarily over a long period or phenotypically plastic and environmentally triggered (Kortet and Vainikka 2008). Acknowledgements We thank P. Kinyanjui, P. Kimani, A. Mwangi, N. Wanjiku, K. Njuguna, and J. Kamau for the invaluable help in data collection. We are very grateful to M. van der Velde and C. Nwaogu for assisting with lab work. We would like to thank the management of Kedong for permission to conduct this research in the ranch and the late Sarah Higgins of Lake Naivasha Riparian Association who allowed us to use her archived long term weather data and secondly for providing accommodation and a base for logistics for the research team during the years of fieldwork. The National Museums of Kenya organized permission letters for access to the study area. Funding –
Variation in immune function with environment and life history stage
99
Another explanation for the finding that immune function does not differ between breeding and non-breeding Red-capped larks is that the costs of breeding may be relatively modest because they lay a small clutch of only two eggs. Although typical for many birds in tropical areas (Moreau 1944, Lack 1947, Skutch 1949, Ricklefs 1969), many temperate zone species have larger broods and hence the competition for resources between reproduction and immune function may be more intense. As a result, the bias of studies towards temperate zone birds may have led to an unjust generalization of the hypothesis of a trade-off between reproduction and immune function (e.g. Ardia et al. 2003, Hanssen et al. 2005, Knowles et al. 2009, but see Williams et al. 1999). To study if the proposed trade-off applies to tropical birds with small clutch sizes as well requires field experiments that simultaneously manipulate clutch size and food availability in tropical species with small and large natural clutch sizes.
Our finding that all indices of immune function varied strongly with social-environmental factors, independent of life history stage, is in line with the hypothesis that seasonal or temporal variation in immune function can be explained by responses to changing environmental conditions, particularly resource availability and/or disease threat (Nelson and Demas 1996, Altizer et al. 2006, Horrocks et al. 2012b, Hegemann et al. 2012, Tieleman 2018, Ezenwa and Worsley-Tonks 2018). We found lower haptoglobin concentrations, usually indicative of low inflammation/less infection (Legagneux et al. 2014), associated with increased ground invertebrates and nesting intensity, factors which presumably reflect increased food availability and favorable socio-environmental conditions for breeding (Mwangi et al. 2018). In addition, nitric oxide concentration was also higher with higher nesting intensity and, although less clear and insignificant, a similar increase can be observed in haemagglutination concentration. Collectively, these results point to a lower rate of inflammation resultant of a higher immune function during favorable food and nesting conditions. Generally, increased access to resources such as energy and protein can increase immunocompetence (Kidd 2004, Catoni et al. 2008, Wilcoxen et al. 2015, Strandin et al. 2018), or offset negative effects of infection (Simon et al. 2004), while on the other hand, limiting access to resources compromises immune defense (Payne et al. 1990).
In addition to stronger immune function with favourable food and nesting conditions, we also found substantial variation of immune indices with temperature and rainfall, factors also proposed to be related to infection risk and resource balance (Horrocks et al. 2011, Horrocks et al 2015, Nwaogu et al. 2019, Tieleman et al. in revision). Variation of immune indices with temperature and rainfall suggests a change in infection and disease risk with a change in ambient temperature and precipitation. Increased virulence and transmission rates have been shown to increase with temperatures in birds through increased abundance of pathogens or enhanced transmission (Zamora-Vilchis et al. 2012, Paxton et al. 2016). If higher CTmax reflects higher infection risk (Zamora-Vilchis et al. 2012), then the increased haptoglobin in Red-capped larks may reflect increased inflammation due to infection, while the decrease in haemagglutination and nitric oxide may reflect loss of ability to fight infection (Bogdan et al. 2000, Matson et al. 2012). Similar to variation in immune measures with temperature, the decrease in nitric oxide concentration with more rainfall could reflect a change in pathogen or disease risk. Generally, more rainfall is predicted to lead to higher infection risk, and some studies have indeed found increased investments in immune function with decreasing environmental aridity (Horrocks et al. 2015) or in the wet season (Tieleman et. al. in revision). Yet, our findings are more in line with Nwaogu et al. (2019) who reported generally lower immune indices during the wet season in Common bulbuls in Nigeria, although in their study specifically nitric oxide did not differ between wet and dry season.
Alternative to the explanation that immune indices varied with temperature due to associated variation in infection risk, our results could also point to a trade-off between immune function and thermoregulation (Siegel and Latimer 1984, Sheldon and Verhulst 1996, Thompson 2010). Relatively high CTmax may present thermoregulatory costs to keep Red-capped larks cool, and likewise, relatively low CTmin may lead to thermoregulatory costs to keep larks warm. Experimental manipulations of temperature regimes in studies of captive knots and stonechats have not shown direct effects of temperature on immune function, but in these studies food was available ad libitum (Buehler et al. 2008, Versteegh et al. 2014, but see Horrocks et al. 2015) and hence increased thermoregulatory costs may not have been traded off against immune function. Although from a temperate zone perspective the temperatures that Red-capped larks experience appear moderate over their entire range, previous work in this population has also shown an influence of temperature on body mass (Mwangi et al, in prep), and immune function (Ndithia et al, in prep). With Red-capped larks confined to Afro-tropical areas, it would be informative to test how birds adjust to immune challenges under various thermal conditions to investigate if birds are sensitive to smaller temperature adjustments than their high latitude counterparts. Phenotypic plasticity of immune function in response to current weather patterns Given that genetically fixed adaptive annual programs may be unable to follow changes in stochastic environmental conditions within an individual's lifetime (Guenther and Trillmich 2013), it may not be surprising that immune function variation in Red-capped larks was better explained by current weather conditions than by long-term historical weather patterns. Our results, that variation in all three immune measures was better explained by current social-environmental factors and by none of the long term weather factors, suggest a match to the stochastic environment rather than a mismatch resulting from evolutionary adaptation to a changed environment (Visser et al. 2012). Consistent with plastic immune variation in Red-capped larks, phenotypic plasticity in stochastic environments is exhibited in other physiological mechanisms such as gonad regulation in birds (Tökölyi et al. 2012). However, contrary to our results, Stonechats Saxicola torquata from three genotypically distinct subspecies, originating from three different locations in Kazakhstan, Central Europe and Kenya, show seasonal variation of constitutive immunity coincident with the degree of seasonal variation that a subspecies experiences within its geographic distribution even when kept under similar environmental conditions in a common garden experiment (Versteegh et al. 2014). Variation of constitutive immunity in the three stonechat subspecies therefore indicates a stronger intrinsic endogenous mechanism behind immune function regulation than the current social-environmental factors being experienced by the birds (Versteegh et al. 2014). These differing patterns in immune variation show that immune function can be intrinsic, i.e. adjusted evolutionarily over a long period or phenotypically plastic and environmentally triggered (Kortet and Vainikka 2008). Acknowledgements We thank P. Kinyanjui, P. Kimani, A. Mwangi, N. Wanjiku, K. Njuguna, and J. Kamau for the invaluable help in data collection. We are very grateful to M. van der Velde and C. Nwaogu for assisting with lab work. We would like to thank the management of Kedong for permission to conduct this research in the ranch and the late Sarah Higgins of Lake Naivasha Riparian Association who allowed us to use her archived long term weather data and secondly for providing accommodation and a base for logistics for the research team during the years of fieldwork. The National Museums of Kenya organized permission letters for access to the study area. Funding –
Chapter 5
100
Funding for the study was provided by The Netherlands Fellowship Programme of Nuffic (grants no. CF9159/2013 to BIT and JMM, CF6833/2010 to BIT and HKN), the Netherlands Organization for Scientific Research (NWO-VIDI 864.10.012 to BIT), Lucie Burgers foundation (to JMM) and two grants from the Ecology fund of the Royal Netherlands Academy of Arts and Sciences (to JMM).
Appendix 1 Annual variation in mean monthly long term (a) and current (b) rainfall pattern. The middle bold line within the box plots and the box represent mean ± SD while the bars represent range.
Variation in immune function with environment and life history stage
101
Funding for the study was provided by The Netherlands Fellowship Programme of Nuffic (grants no. CF9159/2013 to BIT and JMM, CF6833/2010 to BIT and HKN), the Netherlands Organization for Scientific Research (NWO-VIDI 864.10.012 to BIT), Lucie Burgers foundation (to JMM) and two grants from the Ecology fund of the Royal Netherlands Academy of Arts and Sciences (to JMM).
Appendix 1 Annual variation in mean monthly long term (a) and current (b) rainfall pattern. The middle bold line within the box plots and the box represent mean ± SD while the bars represent range.
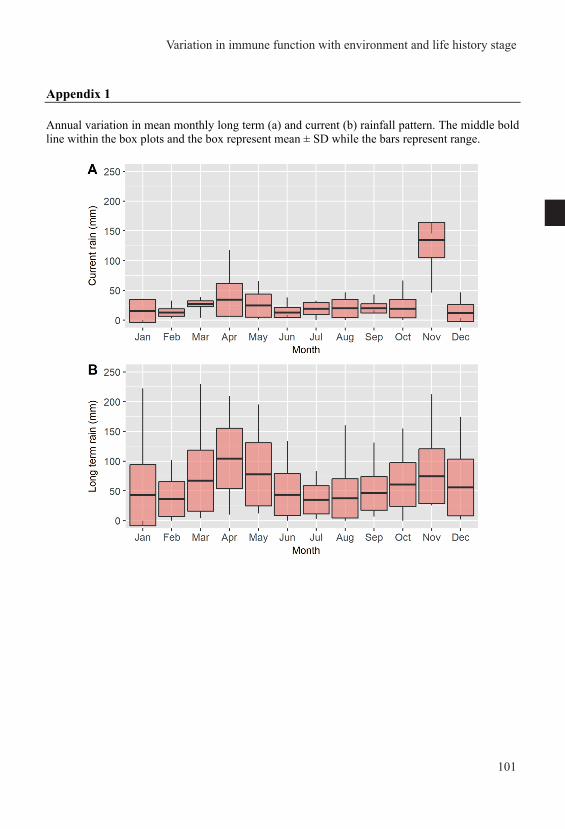

Chapter six
GENERAL DISCUSSION AND SYNTHESIS
Joseph M. Mwangi
Chapter six
GENERAL DISCUSSION AND SYNTHESIS
Joseph M. Mwangi
Chapter six
GENERAL DISCUSSION AND SYNTHESIS
Joseph M. Mwangi
Chapter six
GENERAL DISCUSSION AND SYNTHESIS
Joseph M. Mwangi
Chapter 6
104
Introduction In this thesis, I aimed to investigate how the stochastic environment influences temporal variation in nest success, and whether Red-capped larks adjust their phenotype through behavioral space use and physiological adjustments of body mass and immune function to adapt to the stochastic environment. I also tested whether variation in body mass and immune function followed the historical seasonal or a stochastic pattern reminiscent of current environmental variation. In this last chapter, starting with section 6.1, I revisit the uniqueness of the tropical system by highlighting the diversity encompassed by the occurrence of breeding. The aim of this section is to highlight why the near-equatorial tropical system is suited to tease apart the effects of social-environmental factors and life history stage in influencing nest survival, behavioral and physiological changes in birds. This is followed by section 6.2 that covers a chapter by chapter recap of the main results. In section 6.3, I integrate and synthesize the findings reported in this thesis in relation to other studies and the contribution this thesis makes to the understanding of near-equatorial tropical systems. Specifically, I start by examining the role of food and depredation, the two most advanced factors in determining nest survival in tropical systems. I then evaluate the role of social-environmental factors versus life history stages in influencing behavioral and physiological adjustments of Red-capped larks. I end this section by evaluating whether phenotypic adjustments by Red-capped larks are resultant of a mismatch due to evolutionary adaptation or fixed genetic control to a seasonal environment or alternatively, a match to the current stochastic environment through phenotypic plasticity. Finally, the last section includes potential questions identified during my study to further our understanding of stochastic near-equatorial tropical environments. Tropical near-equatorial environments as model systems to decouple the influence of social-environmental factors and life history stage on nest survival and phenotypic adjustments Skutch (1949, 1966) and Moreau (1950) observed that contrary to seasonal breeding in temperate zones, nesting in tropical birds occurred throughout the year. However, subsequent studies in near-equatorial regions have shown both year-round (Perfito et al. 2007, Ndithia et al. 2017a) and seasonal breeding (Brown and Britton 1980, Wikelski et al. 2000, 2003), with diverse complexity such as seasonal and year-round breeding within the same areas (Chapman 1995), opportunistic breeding characterized by year-to-year variation (Hau et al. 2004, Perfito et al. 2007) and differing breeding schedules in conspecific populations in nearby areas (Brown and Britton 1980) or even for closely related species occupying the same areas (Ndithia et al. unpublished data). The diversity revealed in occurrence of breeding in these near equatorial tropical zones show no clear association between social-environmental factors and reproductive timing. Insights into nesting success at different times of the year and/or under different environmental conditions may help understand the causes and consequences of breeding at different times, by shifting the focus from the number of breeding birds to the success of their nests. Additionally, in these stochastic and unpredictable near equatorial habitats, organisms cannot anticipate change in social-environmental factors making these areas ideal model systems to study behavioral and physiological adaptations to different social-environments factors (Hau et al. 2004).
In this thesis, I exploit the variable occurrence of breeding and the unpredictable nature of equatorial tropical systems to investigate if/how nest survival varies and to understand the behavioral and physiological adjustments of resident birds faced with changing social-environmental factors. Specifically, building on the results by Ndithia et al. (2017) that showed neither current weather conditions nor food availability could explain timing of breeding in the
year-round breeding Red-capped lark, I aimed to investigate how nesting success varied with time and social-environmental conditions and how the Red-capped larks adjust their behavior and physiology to cope with the unpredictable environment. Given that equatorial East Africa was historically considered seasonal, I also investigated whether the discrepancy between the timing of breeding and current environmental conditions could be indicative of a mismatch between the phenotype and the environmental conditions. Coping with uncertainty: A summary of the main findings Variation in Red-capped lark nest survival with social-environmental factors shows evidence of incidental nest predation To better understand the variable breeding schedules in tropical areas and provide more insights by shifting the focus from the more studied question of timing of breeding (Wikelski et al. 2003, Hau et al. 2004, Ndithia et al. 2017a) to the success of their nests, in chapter 2, we exploited the opportunity to tease apart the associations of population-level breeding activity and environmental conditions with the nesting success of year-round breeding Red-capped lark. In this chapter, we show that despite breeding year-round, nesting success is not consistent but rather varies in an inconsistent fashion both among months and years. Birds breeding when most conspecifics are also breeding have a higher nesting success than their counterparts breeding when nesting intensity is low. Adding to the unexpected result by Ndithia et al. (2017) where timing of breeding is not related to food availability and weather conditions, in our study increased food availability did not correlate with increased nest survival and neither did increased rain which is usually associated with increased environmental productivity. On the contrary, increased rain and flying invertebrates decreased nest survival. In addition to the convincing results that nest predation was the single most significant cause of nest failure, the negative correlation of nest success with flying invertebrates and rainfall pointed to incidental depredation. Incidental depredation occurs when nest contents are depredated as a secondary prey encountered by predators searching for a different primary prey (Vickery et al. 1992). Presumably these incidental nest predators were more abundant or active with more rain and flying invertebrates. Individual Red-capped larks exploit large home-ranges while space use changed with intensity of nesting In chapter 3, we aimed to understand year-round variation in home range size in the context of the highly aseasonal and unpredictable variation in weather and food resources, typical of many equatorial habitats. Consistent with our results in chapter 2, in chapter 3 we did not find evidence that food availability influenced space use and home range of Red-capped larks. Instead, intensity of nesting (nest index) was the main factor influencing the home range of Red-capped larks, which applied to both the combined composite home ranges of breeding and non-breeding birds and to the home ranges of non-breeding birds only. Red-capped larks differed in social organization between breeding and non breeding individuals through fusion of pairs to large groups when not in breeding and fission during breeding. In addition to the social organization change, Red-capped larks had larger home ranges in comparison to other phylogenetically related (Garza et al. 2005), and similar sized tropical and neotropical species (Newmark et al. 2010). The larger home ranges pointed to either a behavioral adjustment in response to spatial and/or temporal resource variation
General discussion and synthesis
105
Introduction In this thesis, I aimed to investigate how the stochastic environment influences temporal variation in nest success, and whether Red-capped larks adjust their phenotype through behavioral space use and physiological adjustments of body mass and immune function to adapt to the stochastic environment. I also tested whether variation in body mass and immune function followed the historical seasonal or a stochastic pattern reminiscent of current environmental variation. In this last chapter, starting with section 6.1, I revisit the uniqueness of the tropical system by highlighting the diversity encompassed by the occurrence of breeding. The aim of this section is to highlight why the near-equatorial tropical system is suited to tease apart the effects of social-environmental factors and life history stage in influencing nest survival, behavioral and physiological changes in birds. This is followed by section 6.2 that covers a chapter by chapter recap of the main results. In section 6.3, I integrate and synthesize the findings reported in this thesis in relation to other studies and the contribution this thesis makes to the understanding of near-equatorial tropical systems. Specifically, I start by examining the role of food and depredation, the two most advanced factors in determining nest survival in tropical systems. I then evaluate the role of social-environmental factors versus life history stages in influencing behavioral and physiological adjustments of Red-capped larks. I end this section by evaluating whether phenotypic adjustments by Red-capped larks are resultant of a mismatch due to evolutionary adaptation or fixed genetic control to a seasonal environment or alternatively, a match to the current stochastic environment through phenotypic plasticity. Finally, the last section includes potential questions identified during my study to further our understanding of stochastic near-equatorial tropical environments. Tropical near-equatorial environments as model systems to decouple the influence of social-environmental factors and life history stage on nest survival and phenotypic adjustments Skutch (1949, 1966) and Moreau (1950) observed that contrary to seasonal breeding in temperate zones, nesting in tropical birds occurred throughout the year. However, subsequent studies in near-equatorial regions have shown both year-round (Perfito et al. 2007, Ndithia et al. 2017a) and seasonal breeding (Brown and Britton 1980, Wikelski et al. 2000, 2003), with diverse complexity such as seasonal and year-round breeding within the same areas (Chapman 1995), opportunistic breeding characterized by year-to-year variation (Hau et al. 2004, Perfito et al. 2007) and differing breeding schedules in conspecific populations in nearby areas (Brown and Britton 1980) or even for closely related species occupying the same areas (Ndithia et al. unpublished data). The diversity revealed in occurrence of breeding in these near equatorial tropical zones show no clear association between social-environmental factors and reproductive timing. Insights into nesting success at different times of the year and/or under different environmental conditions may help understand the causes and consequences of breeding at different times, by shifting the focus from the number of breeding birds to the success of their nests. Additionally, in these stochastic and unpredictable near equatorial habitats, organisms cannot anticipate change in social-environmental factors making these areas ideal model systems to study behavioral and physiological adaptations to different social-environments factors (Hau et al. 2004).
In this thesis, I exploit the variable occurrence of breeding and the unpredictable nature of equatorial tropical systems to investigate if/how nest survival varies and to understand the behavioral and physiological adjustments of resident birds faced with changing social-environmental factors. Specifically, building on the results by Ndithia et al. (2017) that showed neither current weather conditions nor food availability could explain timing of breeding in the
year-round breeding Red-capped lark, I aimed to investigate how nesting success varied with time and social-environmental conditions and how the Red-capped larks adjust their behavior and physiology to cope with the unpredictable environment. Given that equatorial East Africa was historically considered seasonal, I also investigated whether the discrepancy between the timing of breeding and current environmental conditions could be indicative of a mismatch between the phenotype and the environmental conditions. Coping with uncertainty: A summary of the main findings Variation in Red-capped lark nest survival with social-environmental factors shows evidence of incidental nest predation To better understand the variable breeding schedules in tropical areas and provide more insights by shifting the focus from the more studied question of timing of breeding (Wikelski et al. 2003, Hau et al. 2004, Ndithia et al. 2017a) to the success of their nests, in chapter 2, we exploited the opportunity to tease apart the associations of population-level breeding activity and environmental conditions with the nesting success of year-round breeding Red-capped lark. In this chapter, we show that despite breeding year-round, nesting success is not consistent but rather varies in an inconsistent fashion both among months and years. Birds breeding when most conspecifics are also breeding have a higher nesting success than their counterparts breeding when nesting intensity is low. Adding to the unexpected result by Ndithia et al. (2017) where timing of breeding is not related to food availability and weather conditions, in our study increased food availability did not correlate with increased nest survival and neither did increased rain which is usually associated with increased environmental productivity. On the contrary, increased rain and flying invertebrates decreased nest survival. In addition to the convincing results that nest predation was the single most significant cause of nest failure, the negative correlation of nest success with flying invertebrates and rainfall pointed to incidental depredation. Incidental depredation occurs when nest contents are depredated as a secondary prey encountered by predators searching for a different primary prey (Vickery et al. 1992). Presumably these incidental nest predators were more abundant or active with more rain and flying invertebrates. Individual Red-capped larks exploit large home-ranges while space use changed with intensity of nesting In chapter 3, we aimed to understand year-round variation in home range size in the context of the highly aseasonal and unpredictable variation in weather and food resources, typical of many equatorial habitats. Consistent with our results in chapter 2, in chapter 3 we did not find evidence that food availability influenced space use and home range of Red-capped larks. Instead, intensity of nesting (nest index) was the main factor influencing the home range of Red-capped larks, which applied to both the combined composite home ranges of breeding and non-breeding birds and to the home ranges of non-breeding birds only. Red-capped larks differed in social organization between breeding and non breeding individuals through fusion of pairs to large groups when not in breeding and fission during breeding. In addition to the social organization change, Red-capped larks had larger home ranges in comparison to other phylogenetically related (Garza et al. 2005), and similar sized tropical and neotropical species (Newmark et al. 2010). The larger home ranges pointed to either a behavioral adjustment in response to spatial and/or temporal resource variation
Chapter 6
106
(Salgado-Ortiz et al. 2008), or an effect of conspecific behavior, specifically breeding on space use of the non breeding individuals (Morganti et al. 2017). Body mass in Red-capped lark decreases with higher food availability and more favorable environmental conditions independent of breeding or non-breeding To understand physiological adjustments in near-equatorial environments, in chapter 4, we examined body mass variation in Red-capped Larks to investigate; (1). If body mass in Red-capped larks was better explained by evolutionary adaptation to long term weather patterns or by phenotypically plastic responses to current weather conditions in light of the system having been previously described as seasonal while it currently is stochastic, (2). How strong of a cue are weather patterns in predicting future food availability or does food vary in an unpredictable manner, and if so, (3). Do Red-capped larks’ body masses increase with higher food availability to buffer against unanticipated harsh times in the stochastic environment or does body mass vary dependent on life history stage? Consistent with past findings (Hau et al. 2004, Perfito et al. 2007, Ndithia et al. 2017a), our results in this chapter attest to the stochasticity and unpredictability of food availability in the equatorial afro-tropical environments and the unreliability of weather as a cue for future food availability. Despite the stochastic nature of the social-environmental factors, body mass of Red-capped Larks was only partly explained by phenotypically plastic responses to current weather conditions, and also to some extent appeared evolutionarily adapted to long term weather patterns. Although in chapter 3 we found evidence that space use differed between birds in breeding and non-breeding birds, body mass did not differ between breeding and non-breeding birds as shown in chapter 4. This is contrary to the proposal that birds accumulate extra reserves for use during breeding (Moreno 1989, Kelly and Weathers 2002). Decreased body mass in Red-capped larks with increased food availability independent of life history stage suggests year-round food availability despite the unpredictable nature of the environment. Alternate to food availability year-round, lack of a difference between breeding and non-breeding birds’ body masses provides indirect support for the hypothesis that birds in unpredictable environments with no strong predictive cues always maintain preparedness to opportunistically breed (Hau 2001, Perfito et al. 2007). However, molting birds decreased mass with higher ambient temperatures and favourable environmental condition to even lower levels than birds in quiescence. With food sufficient year-round, Red-capped larks may opt for a lean mass under good conditions to counter associated negative costs of higher body mass that include increased locomotory costs (Macleod and Gosler 2006), more so during molting when flight efficiency is reduced due to missing feathers and reduced wing area (Carrascal and Polo 2006). Immune function in Red-capped larks varies more with social-environmental factors than with life history stage in a stochastic aseasonal environment In chapter five of this thesis, we tested whether variation in immune function is under a stronger environmental influence or more dependent on life history stages of breeding and non-breeding while testing if it follows the historical seasonal pattern or a stochastic pattern reminiscent of current environmental variation. Contrary to the predicted trade-off between immune function and life history stage, we found no evidence that immune function in Red-capped larks was reduced during breeding both at the population and within-individual level (Sheldon and Verhulst 1996). Instead, we found that all four immune indexes were explained by at least one or more of the socio-environmental factors, while life history stage played a minor role only for haptoglobin. Red-capped larks had lower haptoglobin, and higher nitric oxide with favourable social-environmental
conditions for breeding and lower haptoglobin concentration with increased food availability. Lower haptoglobin concentration indicative of low inflammation/less infection (Legagneux et al. 2014), while higher nitric oxide suggesting increased ability to eliminate pathogens (Bogdan et al. 2000, Sild and Hõrak 2009) point to a lower rate of infection resultant of a better immune function during favorable environmental conditions (Rubenstein et al. 2008). In addition to variation of immune indices with favourable social-environmental factors, we discovered variation with temperature and rain: haemagglutination titer decreased with an increase in maximum daily temperature and a decrease in minimum daily temperature, while nitric oxide concentration decreased with a decrease in maximum daily temperature and increased with less rainfall. With the level of immune indices suggested to be reflective of threat of infection (Horrocks et al. 2011), variation of immune indices with temperature and rainfall may reflect increased disease risk and/or pathogen pressure in the environment (Adamo and Lovett 2011, Horrocks et al. 2012b, Nwaogu et al. 2019). We found no support that immune measures in Red-capped larks adjusted evolutionarily over a long period or are under fixed genetic control to a seasonal environment. Rather, variation in immune indices in relation to weather suggested stronger phenotypic plasticity and environmental dependency. Decoupling social-environmental factors and life history stage in a stochastic environment Not food limitation but nest depredation is the major factor influencing nest survival in the year-round breeding Red-capped larks David Lack (1947) attributed the smaller clutch size in tropical areas to reduced ability to provide food for nestlings due to shorter day length near the equator. Countering the proposal by Lack (1947), Skutch (1949) showed that tropical birds could successfully raise experimentally increased broods and instead, proposed that smaller clutches were to accord the birds less infrequent feeding trips to nests to reduce likelihood of betraying the nest position to nest predators. Following these earlier studies, which process limits annual reproductive success in tropical areas, food-restricted production (Moreau 1944, Lack 1947, 1950) or predator-induced loss (Skutch 1949, 2008, Ricklefs 1969), has been debated in the literature for decades (Zanette et al. 2006).
Nest depredation accounted for most of the nest losses in Red-capped larks, consistent with patterns reported from other tropical and neo-tropical species (Ricklefs 1969, Oniki 1979, Skutch 1985). For many bird species, individuals are thought to time their breeding when the risk of nest depredation is low (Lima 2009, Martin and Briskie 2009). But this is on the assumption that the birds have the capacity to assess and respond to changes in the risk of depredation to both themselves and their eggs or nestlings (Lima 2009) either through use of direct and/or indirect cues (Ibáñez-Álamo et al. 2015). In chapter 2 of this thesis, intensity of breeding did not correlate with nest survival, which suggests Red-capped larks did not time their nesting to coincide with low levels of nest depredation. Red-capped larks in the aseasonal unpredictable habitat probably face a challenge in anticipating or assessing the risk of predation due to the year-to-year variability in the timing and duration of social-environmental factors modulating predation (Hau 2001). Another factor beside environmental stochasticity that may limit Red-capped larks timing their breeding to coincide with low nest depredation, our results in this thesis point to incidental nest depredation (chapter 2). Incidental nest depredation occurs when nest contents are depredated as a secondary prey encountered by predators searching for a different primary prey (Vickery et al. 1992).
General discussion and synthesis
107
(Salgado-Ortiz et al. 2008), or an effect of conspecific behavior, specifically breeding on space use of the non breeding individuals (Morganti et al. 2017). Body mass in Red-capped lark decreases with higher food availability and more favorable environmental conditions independent of breeding or non-breeding To understand physiological adjustments in near-equatorial environments, in chapter 4, we examined body mass variation in Red-capped Larks to investigate; (1). If body mass in Red-capped larks was better explained by evolutionary adaptation to long term weather patterns or by phenotypically plastic responses to current weather conditions in light of the system having been previously described as seasonal while it currently is stochastic, (2). How strong of a cue are weather patterns in predicting future food availability or does food vary in an unpredictable manner, and if so, (3). Do Red-capped larks’ body masses increase with higher food availability to buffer against unanticipated harsh times in the stochastic environment or does body mass vary dependent on life history stage? Consistent with past findings (Hau et al. 2004, Perfito et al. 2007, Ndithia et al. 2017a), our results in this chapter attest to the stochasticity and unpredictability of food availability in the equatorial afro-tropical environments and the unreliability of weather as a cue for future food availability. Despite the stochastic nature of the social-environmental factors, body mass of Red-capped Larks was only partly explained by phenotypically plastic responses to current weather conditions, and also to some extent appeared evolutionarily adapted to long term weather patterns. Although in chapter 3 we found evidence that space use differed between birds in breeding and non-breeding birds, body mass did not differ between breeding and non-breeding birds as shown in chapter 4. This is contrary to the proposal that birds accumulate extra reserves for use during breeding (Moreno 1989, Kelly and Weathers 2002). Decreased body mass in Red-capped larks with increased food availability independent of life history stage suggests year-round food availability despite the unpredictable nature of the environment. Alternate to food availability year-round, lack of a difference between breeding and non-breeding birds’ body masses provides indirect support for the hypothesis that birds in unpredictable environments with no strong predictive cues always maintain preparedness to opportunistically breed (Hau 2001, Perfito et al. 2007). However, molting birds decreased mass with higher ambient temperatures and favourable environmental condition to even lower levels than birds in quiescence. With food sufficient year-round, Red-capped larks may opt for a lean mass under good conditions to counter associated negative costs of higher body mass that include increased locomotory costs (Macleod and Gosler 2006), more so during molting when flight efficiency is reduced due to missing feathers and reduced wing area (Carrascal and Polo 2006). Immune function in Red-capped larks varies more with social-environmental factors than with life history stage in a stochastic aseasonal environment In chapter five of this thesis, we tested whether variation in immune function is under a stronger environmental influence or more dependent on life history stages of breeding and non-breeding while testing if it follows the historical seasonal pattern or a stochastic pattern reminiscent of current environmental variation. Contrary to the predicted trade-off between immune function and life history stage, we found no evidence that immune function in Red-capped larks was reduced during breeding both at the population and within-individual level (Sheldon and Verhulst 1996). Instead, we found that all four immune indexes were explained by at least one or more of the socio-environmental factors, while life history stage played a minor role only for haptoglobin. Red-capped larks had lower haptoglobin, and higher nitric oxide with favourable social-environmental
conditions for breeding and lower haptoglobin concentration with increased food availability. Lower haptoglobin concentration indicative of low inflammation/less infection (Legagneux et al. 2014), while higher nitric oxide suggesting increased ability to eliminate pathogens (Bogdan et al. 2000, Sild and Hõrak 2009) point to a lower rate of infection resultant of a better immune function during favorable environmental conditions (Rubenstein et al. 2008). In addition to variation of immune indices with favourable social-environmental factors, we discovered variation with temperature and rain: haemagglutination titer decreased with an increase in maximum daily temperature and a decrease in minimum daily temperature, while nitric oxide concentration decreased with a decrease in maximum daily temperature and increased with less rainfall. With the level of immune indices suggested to be reflective of threat of infection (Horrocks et al. 2011), variation of immune indices with temperature and rainfall may reflect increased disease risk and/or pathogen pressure in the environment (Adamo and Lovett 2011, Horrocks et al. 2012b, Nwaogu et al. 2019). We found no support that immune measures in Red-capped larks adjusted evolutionarily over a long period or are under fixed genetic control to a seasonal environment. Rather, variation in immune indices in relation to weather suggested stronger phenotypic plasticity and environmental dependency. Decoupling social-environmental factors and life history stage in a stochastic environment Not food limitation but nest depredation is the major factor influencing nest survival in the year-round breeding Red-capped larks David Lack (1947) attributed the smaller clutch size in tropical areas to reduced ability to provide food for nestlings due to shorter day length near the equator. Countering the proposal by Lack (1947), Skutch (1949) showed that tropical birds could successfully raise experimentally increased broods and instead, proposed that smaller clutches were to accord the birds less infrequent feeding trips to nests to reduce likelihood of betraying the nest position to nest predators. Following these earlier studies, which process limits annual reproductive success in tropical areas, food-restricted production (Moreau 1944, Lack 1947, 1950) or predator-induced loss (Skutch 1949, 2008, Ricklefs 1969), has been debated in the literature for decades (Zanette et al. 2006).
Nest depredation accounted for most of the nest losses in Red-capped larks, consistent with patterns reported from other tropical and neo-tropical species (Ricklefs 1969, Oniki 1979, Skutch 1985). For many bird species, individuals are thought to time their breeding when the risk of nest depredation is low (Lima 2009, Martin and Briskie 2009). But this is on the assumption that the birds have the capacity to assess and respond to changes in the risk of depredation to both themselves and their eggs or nestlings (Lima 2009) either through use of direct and/or indirect cues (Ibáñez-Álamo et al. 2015). In chapter 2 of this thesis, intensity of breeding did not correlate with nest survival, which suggests Red-capped larks did not time their nesting to coincide with low levels of nest depredation. Red-capped larks in the aseasonal unpredictable habitat probably face a challenge in anticipating or assessing the risk of predation due to the year-to-year variability in the timing and duration of social-environmental factors modulating predation (Hau 2001). Another factor beside environmental stochasticity that may limit Red-capped larks timing their breeding to coincide with low nest depredation, our results in this thesis point to incidental nest depredation (chapter 2). Incidental nest depredation occurs when nest contents are depredated as a secondary prey encountered by predators searching for a different primary prey (Vickery et al. 1992).
Chapter 6
108
Conform to this pattern, nest survival in Red-capped larks was lower with an increase in flying invertebrates, the primary prey for the incidental nest predators (Vickery et al. 1992). When nest predation is caused by a primary nest predator, the relationship between nest abundance and survival is typically inverse (Schmidt et al. 2001, Gunnarsson and Elmberg 2008), however, nest survival increased when more Red-capped larks in the population were nesting although as earlier stated the relationship was weakly supported (chapter 3).
Besides nest depredation, food availability has been shown to be the other major cause of nest failure in most bird species (Lack 1947, 1950, Ricklefs 1969, Martin 1987). In areas were food constrains breeding, birds time their breeding concurrent with increased food abundance (Skutch 1949, Lack 1950, Perrins 1970, Martin 1987). By timing their breeding with a peak of food abundance, birds increase their nesting success through increased ability to feed themselves (Martin 1987) and their chicks to independence (Becker et al. 2010), reduced intra-specific competition and chick begging (Klenova 2015), and fast growth of chicks (Martin 1987, Ndithia et al. 2017b). However, Ndithia et al. (2017a) found no evidence for adjustments in the timing of breeding in Red-capped larks in response to food availability. Instead, breeding in Red-capped larks occurred year-round despite the stochastic environment. Mistiming of breeding with peak food availability to cover for increased energy demands should have led to a lower nest survival with lower food abundance if food was limited. Low nest survival due to food shortage is typically characterized by partial nest losses usually limited to the nestling stage, an indication of starvation (Ricklefs 1969, Wiley and Wiley 1980), or total clutch loss due to desertion (Ricklefs 1969, Wiley and Wiley 1980, Zanette et al. 2006). In Red-capped larks, we did not observe instances of partial nest loss during the nestling stage or total brood loss attributable to starvation (i.e. no nests in which all the nestlings were dead but otherwise intact), and total clutch loss attributable to nest abandonment was extremely rare (Chapter 3). Nest survival in Red-capped larks was inversely related with increased rain (Shiao et al. 2015). Increased rainfall during breeding can also lead to Red-capped larks encountering adverse foraging conditions, which may result to less food being delivered to nestlings, and, consequently, poor nestling growth and nest failure. However, as earlier stated Red-capped larks did not have partial nest losses during nestling stage while total clutch loss attributable to nest abandonment was extremely rare (Ricklefs 1969). Moreover, the relationship between nest survival in Red-capped larks and invertebrate biomass, our proxy for food availability, showed contrasting results. Nest survival was not related to ground invertebrate biomass, while flying invertebrate biomass was negatively correlated to nest survival pointing to another effect other than as a food resource to the larks.
In conclusion, our results support nest depredation as the major factor influencing nest survival of Red-capped larks. However, Red-capped larks may not be able to time their breeding coincident with times of low depredation due to the stochastic unpredictable variation of social-environmental factors modulating predation and secondly nest loss is through incidental nest predators rather than by a primary predator. Drawing on the evidence that nest loss was not due to food shortage and neither was nest survival related to increased food availability, it is also plausible to conclude that Red-capped larks are faced with low food constraints with food resources sufficient throughout the year to support breeding. Behavioural and physiological adjustments in Red-capped larks are influenced by both social-environmental factors and by life history stage Red-capped larks shifted from flocks to pairs dependent on breeding status at the individual level. The switch to pairs was accompanied by defense of their territories during breeding (personal
observation). Factors that have been shown to lead to the breakdown in sociality from flocks to pairs during breeding are manifold, varying from the need to defend nest sites, coupled with nest attendance and chick provisioning that constrain movement to areas closer to the nest (Morganti et al. 2017), spatiotemporal change in food availability and the need to defend priority sites for access to a stable food supply (Lima 2009, Braun and Bugnyar 2012, Loretto et al. 2017) or to reduce density-dependent nest depredation via the spacing of nests (Lima 2009). Although breeding birds were well-represented, in chapter 3, we could not tease apart the influence of breeding status and socio-environmental factors in occurrence or duration of pair formation. This partly resulted from having to define the breeding period as the period during which an individual was attending its nest (nest building until fledging), a period lasting 24 days in this species (Mwangi et al. 2018).
Home range in Red-capped larks was not related to food availability or weather conditions but rather decreased with an increase in nesting intensity at the population level, which applied to both the combined composite home ranges of breeding and non-breeding birds and to the home ranges of non-breeding birds only (chapter 3). Variation in home ranges of Red-capped larks may, therefore, be influenced more by life history stage than by environmental factors. Consistent with our results in chapter 3, home ranges in birds have been shown to decrease with breeding (Willey & Van Riper Iii 2014, Morganti et al. 2017), but have also been shown to increase (Jahn et al. 2010, Kolts & McRae 2017), or show no variation with breeding (Winiarski et al. 2017). For brooding birds and secondly birds with altricial young such as the Red-capped larks, home range of breeding birds may have been influenced by nest attendance during incubation and maintaining a continuous presence at the nest to minimize the risk of nest predation (Rothenbach and Kelly 2012), while chick provisioning also constrains movement to areas closer to the nest (Morganti et al. 2017). As I stated earlier, Red-capped larks during breeding defend their nest sites against intrusion by conspecifics. Territoriality by breeding birds may explain the decrease of non-breeding birds with increase in nesting intensity as territoriality reduces the area available to non-breeding birds. Consequently, exclusion from some areas creates patchiness in areas accessible for non-breeding birds to exploit, restricting them to smaller areas that are not defended by the breeding pairs.
Contrary to home range variation in response to breeding, body mass in Red-capped larks decreased with increased food availability independent of life history stage. However, molting birds decreased mass with higher minimum daily temperature and favorable environmental condition for breeding to even lower levels than breeding birds and those in quiescence. The general decrease in body mass with more food suggests a stronger influence of environmental factors but the lower mass of molting birds shows partial influence of life history stage as well in body mass variation. Decreased body mass in Red-capped larks with increased food availability despite the unpredictable nature of the environment provides support for the hypothesis of sufficient year-round food availability in near-equatorial tropical systems despite the unpredictable nature of the environment (Skutch 1949, Ricklefs 1969). With food sufficient year-round, it may pay off to have a lower body mass with increased food availability to counter associated negative costs of higher body mass that include increased locomotory costs (Blanckenhorn 2000, Cresswell 2003, Carrascal and Polo 2006). For instance, with year-round breeding, flight efficiency and speed used when flying to and from foraging sites can be an important decision given that in some bird species parent birds makeup to 500 foraging trips per day to gather food for their nestlings (McLaughlin and Montgomerie 1990).
General discussion and synthesis
109
Conform to this pattern, nest survival in Red-capped larks was lower with an increase in flying invertebrates, the primary prey for the incidental nest predators (Vickery et al. 1992). When nest predation is caused by a primary nest predator, the relationship between nest abundance and survival is typically inverse (Schmidt et al. 2001, Gunnarsson and Elmberg 2008), however, nest survival increased when more Red-capped larks in the population were nesting although as earlier stated the relationship was weakly supported (chapter 3).
Besides nest depredation, food availability has been shown to be the other major cause of nest failure in most bird species (Lack 1947, 1950, Ricklefs 1969, Martin 1987). In areas were food constrains breeding, birds time their breeding concurrent with increased food abundance (Skutch 1949, Lack 1950, Perrins 1970, Martin 1987). By timing their breeding with a peak of food abundance, birds increase their nesting success through increased ability to feed themselves (Martin 1987) and their chicks to independence (Becker et al. 2010), reduced intra-specific competition and chick begging (Klenova 2015), and fast growth of chicks (Martin 1987, Ndithia et al. 2017b). However, Ndithia et al. (2017a) found no evidence for adjustments in the timing of breeding in Red-capped larks in response to food availability. Instead, breeding in Red-capped larks occurred year-round despite the stochastic environment. Mistiming of breeding with peak food availability to cover for increased energy demands should have led to a lower nest survival with lower food abundance if food was limited. Low nest survival due to food shortage is typically characterized by partial nest losses usually limited to the nestling stage, an indication of starvation (Ricklefs 1969, Wiley and Wiley 1980), or total clutch loss due to desertion (Ricklefs 1969, Wiley and Wiley 1980, Zanette et al. 2006). In Red-capped larks, we did not observe instances of partial nest loss during the nestling stage or total brood loss attributable to starvation (i.e. no nests in which all the nestlings were dead but otherwise intact), and total clutch loss attributable to nest abandonment was extremely rare (Chapter 3). Nest survival in Red-capped larks was inversely related with increased rain (Shiao et al. 2015). Increased rainfall during breeding can also lead to Red-capped larks encountering adverse foraging conditions, which may result to less food being delivered to nestlings, and, consequently, poor nestling growth and nest failure. However, as earlier stated Red-capped larks did not have partial nest losses during nestling stage while total clutch loss attributable to nest abandonment was extremely rare (Ricklefs 1969). Moreover, the relationship between nest survival in Red-capped larks and invertebrate biomass, our proxy for food availability, showed contrasting results. Nest survival was not related to ground invertebrate biomass, while flying invertebrate biomass was negatively correlated to nest survival pointing to another effect other than as a food resource to the larks.
In conclusion, our results support nest depredation as the major factor influencing nest survival of Red-capped larks. However, Red-capped larks may not be able to time their breeding coincident with times of low depredation due to the stochastic unpredictable variation of social-environmental factors modulating predation and secondly nest loss is through incidental nest predators rather than by a primary predator. Drawing on the evidence that nest loss was not due to food shortage and neither was nest survival related to increased food availability, it is also plausible to conclude that Red-capped larks are faced with low food constraints with food resources sufficient throughout the year to support breeding. Behavioural and physiological adjustments in Red-capped larks are influenced by both social-environmental factors and by life history stage Red-capped larks shifted from flocks to pairs dependent on breeding status at the individual level. The switch to pairs was accompanied by defense of their territories during breeding (personal
observation). Factors that have been shown to lead to the breakdown in sociality from flocks to pairs during breeding are manifold, varying from the need to defend nest sites, coupled with nest attendance and chick provisioning that constrain movement to areas closer to the nest (Morganti et al. 2017), spatiotemporal change in food availability and the need to defend priority sites for access to a stable food supply (Lima 2009, Braun and Bugnyar 2012, Loretto et al. 2017) or to reduce density-dependent nest depredation via the spacing of nests (Lima 2009). Although breeding birds were well-represented, in chapter 3, we could not tease apart the influence of breeding status and socio-environmental factors in occurrence or duration of pair formation. This partly resulted from having to define the breeding period as the period during which an individual was attending its nest (nest building until fledging), a period lasting 24 days in this species (Mwangi et al. 2018).
Home range in Red-capped larks was not related to food availability or weather conditions but rather decreased with an increase in nesting intensity at the population level, which applied to both the combined composite home ranges of breeding and non-breeding birds and to the home ranges of non-breeding birds only (chapter 3). Variation in home ranges of Red-capped larks may, therefore, be influenced more by life history stage than by environmental factors. Consistent with our results in chapter 3, home ranges in birds have been shown to decrease with breeding (Willey & Van Riper Iii 2014, Morganti et al. 2017), but have also been shown to increase (Jahn et al. 2010, Kolts & McRae 2017), or show no variation with breeding (Winiarski et al. 2017). For brooding birds and secondly birds with altricial young such as the Red-capped larks, home range of breeding birds may have been influenced by nest attendance during incubation and maintaining a continuous presence at the nest to minimize the risk of nest predation (Rothenbach and Kelly 2012), while chick provisioning also constrains movement to areas closer to the nest (Morganti et al. 2017). As I stated earlier, Red-capped larks during breeding defend their nest sites against intrusion by conspecifics. Territoriality by breeding birds may explain the decrease of non-breeding birds with increase in nesting intensity as territoriality reduces the area available to non-breeding birds. Consequently, exclusion from some areas creates patchiness in areas accessible for non-breeding birds to exploit, restricting them to smaller areas that are not defended by the breeding pairs.
Contrary to home range variation in response to breeding, body mass in Red-capped larks decreased with increased food availability independent of life history stage. However, molting birds decreased mass with higher minimum daily temperature and favorable environmental condition for breeding to even lower levels than breeding birds and those in quiescence. The general decrease in body mass with more food suggests a stronger influence of environmental factors but the lower mass of molting birds shows partial influence of life history stage as well in body mass variation. Decreased body mass in Red-capped larks with increased food availability despite the unpredictable nature of the environment provides support for the hypothesis of sufficient year-round food availability in near-equatorial tropical systems despite the unpredictable nature of the environment (Skutch 1949, Ricklefs 1969). With food sufficient year-round, it may pay off to have a lower body mass with increased food availability to counter associated negative costs of higher body mass that include increased locomotory costs (Blanckenhorn 2000, Cresswell 2003, Carrascal and Polo 2006). For instance, with year-round breeding, flight efficiency and speed used when flying to and from foraging sites can be an important decision given that in some bird species parent birds makeup to 500 foraging trips per day to gather food for their nestlings (McLaughlin and Montgomerie 1990).
Chapter 6
110
Similar to body mass, immune function varied more with socio-environmental factors than with life history. Specifically, we found that all four immune indexes were explained by at least one or more of the socio-environmental factors, while life history stage played a minor role only for haptoglobin. Although variation in immune function is hypothesized to reflect a trade-off with energetically expensive life-history events, where resources are sufficient, investing in other beneficial physiological expensive traits such as immune function may be selected for and not constrained by resource allocation to other energetically demanding life history traits. For instance, in an experiment on sand martin nestlings, Riparia riparia by Brzęk and Konarzewski (2007), growth and immune response are positively correlated when resources were plentiful and were only negative in food-restricted nestlings. Likewise in female breeding Tree swallows Tachycineta bicolor heavier birds that were more efficient at gathering food still mounted a strong immune response even in low quality habitat (Pigeon et al. 2012).
The stronger influence of social-environmental factors may be due to the hypothesized higher parasite diversity and pathogen pressures in tropical areas compared to temperate regions (Salkeld et al. 2008). The immune system plays an important role in defending an animal against attack by pathogens and parasites (Norris and Evans 2000). Tracking and maintaining an optimal level of immune function dependent on pathogen pressure and disease risk in the environment may, therefore, be critical to Red-capped larks (Horrocks et al. 2011, 2012a).
In conclusion, home range and space use in Red-capped larks show a stronger influence of life history stage than of social environmental factors. During breeding, nesting birds are confined to areas near their nest thereby reducing their home range, while the consequent territoriality of breeding pairs limits access of some areas to non-breeding birds and similarly leads to smaller home ranges. In relation to physiology, both body mass and immune function are better explained by social-environmental factors but also partially by life history stage. Red-capped larks had lower mass with favorable socio-environmental conditions to counter associated negative costs of higher body mass while the stronger relationship between immune function and social-environmental factors may have been due to the hypothesized higher disease risk and pathogens in tropical areas. Phenotypic adjustment in Red-capped larks is more consistent with plasticity to a stochastic environment rather than a mismatch resulting from evolutionary adaptation to a changed environment In the past, studies conducted in East Africa reported seasonal changes in weather between a dry season and two rainy seasons (Brown and Britton 1980, Helm and Gwinner 1999). However, Ndithia et al. (2017a) and our results in chapter 4 reveal current weather patterns as highly stochastic and unpredictable. In seasonal environments, birds can anticipate future conditions by use of ultimate and proximate environmental cues and, in response to the predicted environment, adjust their phenotype. However, the challenge of anticipating future conditions changes dramatically, if the system becomes stochastic characterized by substantial year-to-year variation in the timing or magnitude of environmental factors previously relied upon by the birds as cues leading to incorrect prediction and consequently phenotype‐environment‐mismatch. To investigate if current phenotypic adjustment in Red-capped larks was a mismatch due to evolutionary adaptation or fixed genetic control to a seasonal environment or alternatively, a match to the current stochastic environment through phenotypic plasticity, we assessed whether variation in body mass and immune indices of Red-capped Larks was better explained by long-term average weather patterns or current prevailing weather. Despite the change in seasonality, for body mass we found partial support of a phenotypic plastic response to current weather conditions and also
to some extent adaptations of body mass to long term weather patterns dependent on sex and life history stage. However, variation in all the three immune measures we evaluated were better explained by current social-environmental factors and by none of the long term weather factors reflecting strong plastic response in shaping immune function. Even though our tropical equatorial system was reported as seasonal as determined by long-term averages, it may have been stochastic due to large inter and intra-year variation, as has been shown in other tropical equatorial environments such as the Australian tropics (Hau 2001, Wikelski et al. 2003, Perfito et al. 2007). Therefore, canalized (‘hard-wired’) traits are unlikely to have been selected for in such a system (Shine and Brown 2008), but rather plasticity should be selected for and more prominent (Piersma and Drent 2003). However, based on the available data we cannot at the present time entirely exclude the possibility that there is a mismatch because other than weather, there are alternative factors that modulate physiological adjustments in birds such as parasitic or microbial load that influence disease risk (Møller et al. 2003, Altizer et al. 2006, Horrocks et al. 2012a), predation risk (Cuthill et al. 2000, Cresswell 2003) or food availability (Cuthill 2000). These factors have not been monitored over the long-term. Another key limitation of our study is that we did not have historical body mass and immune indices measured to couple the historical weather data. Recommendations and future work While identifying factors that correlate with nest survival, variation in home range and space use, body mass and immune function has been an important step toward understanding life history strategies of the Red-capped lark our evidence is only correlative. To investigate causation and underlying mechanisms to the correlations reported in this thesis, it is important to combine individual level focus and experimental manipulation in future studies. I propose several future lines of studies I identified during the course of my thesis work to further our understanding of life history strategies in these stochastic unpredictable systems.
Although the findings of year-round breeding had previously been widely reported (Moreau 1944, Skutch 1949, Hau 2001), it would be interesting to check whether reported year-round breeding is due to individuals spreading their clutches year-round or that individual pairs breed at specific times of the years as suggested by Wikelski et al. (2003). Combining old monitoring methods such as bird ringing/colour banding and other new tracking technologies such as radio and satellite transmitters and the use of mobile phone network for animal tracking now make it possible to design research focused to answer individual level questions that will allow an in depth understanding of breeding schedules which cannot be attained by population level studies. Based on anecdotal evidence of color-ringed Red-capped larks, I hypothesize that individual birds breed multiple times per year but to have conclusive data, more long term research is required. To complement the ringing and tracking results, there is need to employ physiological techniques to directly monitor changes in reproductive state and responses to environmental fluctuations to provide more insights as to whether birds maintain physiological preparedness to breed year-round (Wikelski et al. 2003, Hau et al. 2004).
The second attribute identified with tropical systems and also supported by our results is the general consensus that nest predation is a major factor influencing nesting survival in tropical systems (Skutch 1985). However a more complete understanding of nest predation has been limited by lack of studies identifying the actual nest predators responsible for the high levels of depredation. Subsequently even more lacking is information about the ecology of the nest
General discussion and synthesis
111
Similar to body mass, immune function varied more with socio-environmental factors than with life history. Specifically, we found that all four immune indexes were explained by at least one or more of the socio-environmental factors, while life history stage played a minor role only for haptoglobin. Although variation in immune function is hypothesized to reflect a trade-off with energetically expensive life-history events, where resources are sufficient, investing in other beneficial physiological expensive traits such as immune function may be selected for and not constrained by resource allocation to other energetically demanding life history traits. For instance, in an experiment on sand martin nestlings, Riparia riparia by Brzęk and Konarzewski (2007), growth and immune response are positively correlated when resources were plentiful and were only negative in food-restricted nestlings. Likewise in female breeding Tree swallows Tachycineta bicolor heavier birds that were more efficient at gathering food still mounted a strong immune response even in low quality habitat (Pigeon et al. 2012).
The stronger influence of social-environmental factors may be due to the hypothesized higher parasite diversity and pathogen pressures in tropical areas compared to temperate regions (Salkeld et al. 2008). The immune system plays an important role in defending an animal against attack by pathogens and parasites (Norris and Evans 2000). Tracking and maintaining an optimal level of immune function dependent on pathogen pressure and disease risk in the environment may, therefore, be critical to Red-capped larks (Horrocks et al. 2011, 2012a).
In conclusion, home range and space use in Red-capped larks show a stronger influence of life history stage than of social environmental factors. During breeding, nesting birds are confined to areas near their nest thereby reducing their home range, while the consequent territoriality of breeding pairs limits access of some areas to non-breeding birds and similarly leads to smaller home ranges. In relation to physiology, both body mass and immune function are better explained by social-environmental factors but also partially by life history stage. Red-capped larks had lower mass with favorable socio-environmental conditions to counter associated negative costs of higher body mass while the stronger relationship between immune function and social-environmental factors may have been due to the hypothesized higher disease risk and pathogens in tropical areas. Phenotypic adjustment in Red-capped larks is more consistent with plasticity to a stochastic environment rather than a mismatch resulting from evolutionary adaptation to a changed environment In the past, studies conducted in East Africa reported seasonal changes in weather between a dry season and two rainy seasons (Brown and Britton 1980, Helm and Gwinner 1999). However, Ndithia et al. (2017a) and our results in chapter 4 reveal current weather patterns as highly stochastic and unpredictable. In seasonal environments, birds can anticipate future conditions by use of ultimate and proximate environmental cues and, in response to the predicted environment, adjust their phenotype. However, the challenge of anticipating future conditions changes dramatically, if the system becomes stochastic characterized by substantial year-to-year variation in the timing or magnitude of environmental factors previously relied upon by the birds as cues leading to incorrect prediction and consequently phenotype‐environment‐mismatch. To investigate if current phenotypic adjustment in Red-capped larks was a mismatch due to evolutionary adaptation or fixed genetic control to a seasonal environment or alternatively, a match to the current stochastic environment through phenotypic plasticity, we assessed whether variation in body mass and immune indices of Red-capped Larks was better explained by long-term average weather patterns or current prevailing weather. Despite the change in seasonality, for body mass we found partial support of a phenotypic plastic response to current weather conditions and also
to some extent adaptations of body mass to long term weather patterns dependent on sex and life history stage. However, variation in all the three immune measures we evaluated were better explained by current social-environmental factors and by none of the long term weather factors reflecting strong plastic response in shaping immune function. Even though our tropical equatorial system was reported as seasonal as determined by long-term averages, it may have been stochastic due to large inter and intra-year variation, as has been shown in other tropical equatorial environments such as the Australian tropics (Hau 2001, Wikelski et al. 2003, Perfito et al. 2007). Therefore, canalized (‘hard-wired’) traits are unlikely to have been selected for in such a system (Shine and Brown 2008), but rather plasticity should be selected for and more prominent (Piersma and Drent 2003). However, based on the available data we cannot at the present time entirely exclude the possibility that there is a mismatch because other than weather, there are alternative factors that modulate physiological adjustments in birds such as parasitic or microbial load that influence disease risk (Møller et al. 2003, Altizer et al. 2006, Horrocks et al. 2012a), predation risk (Cuthill et al. 2000, Cresswell 2003) or food availability (Cuthill 2000). These factors have not been monitored over the long-term. Another key limitation of our study is that we did not have historical body mass and immune indices measured to couple the historical weather data. Recommendations and future work While identifying factors that correlate with nest survival, variation in home range and space use, body mass and immune function has been an important step toward understanding life history strategies of the Red-capped lark our evidence is only correlative. To investigate causation and underlying mechanisms to the correlations reported in this thesis, it is important to combine individual level focus and experimental manipulation in future studies. I propose several future lines of studies I identified during the course of my thesis work to further our understanding of life history strategies in these stochastic unpredictable systems.
Although the findings of year-round breeding had previously been widely reported (Moreau 1944, Skutch 1949, Hau 2001), it would be interesting to check whether reported year-round breeding is due to individuals spreading their clutches year-round or that individual pairs breed at specific times of the years as suggested by Wikelski et al. (2003). Combining old monitoring methods such as bird ringing/colour banding and other new tracking technologies such as radio and satellite transmitters and the use of mobile phone network for animal tracking now make it possible to design research focused to answer individual level questions that will allow an in depth understanding of breeding schedules which cannot be attained by population level studies. Based on anecdotal evidence of color-ringed Red-capped larks, I hypothesize that individual birds breed multiple times per year but to have conclusive data, more long term research is required. To complement the ringing and tracking results, there is need to employ physiological techniques to directly monitor changes in reproductive state and responses to environmental fluctuations to provide more insights as to whether birds maintain physiological preparedness to breed year-round (Wikelski et al. 2003, Hau et al. 2004).
The second attribute identified with tropical systems and also supported by our results is the general consensus that nest predation is a major factor influencing nesting survival in tropical systems (Skutch 1985). However a more complete understanding of nest predation has been limited by lack of studies identifying the actual nest predators responsible for the high levels of depredation. Subsequently even more lacking is information about the ecology of the nest
Chapter 6
112
predators. Future studies on the identity and ecology on nest predators is of fundamental importance to understanding evolution of avian life histories in these tropical systems. They would also contribute a better understanding of depredation patterns that may be obscured by the current lumping of different predator species. It would therefore be worthwhile to employ recent advances in the development of miniature video technology and more sensitive trail cameras to document nest predators either using active nests or artificial nests and design specific studies focusing on their ecology.
One unique attribute conferred to studying near equatorial tropical birds is the occurrence of birds both in breeding and in quiescence under the same environmental conditions that do not vary in body mass (an acceptable proxy for body condition) and immune indices (chapter 4 and 5 of this thesis). This unique attribute can be exploited to test the effects of; (a) increased infection, (b) mounting an immune challenge or (c) the ability to fight infection using the wild population during the putative expensive life history stage of breeding versus those in quiescence dependent on an individual’s immune function. This can be achieved for instance by experimentally presenting an immune challenge to their system to gain insight into the consequences of disease at different life history stages or environmental factors.
References A Abdul-Rahman, I. I., Robinson, J. E., Obese, F. Y., Jeffcoate, I. A. and Awumbila, B. 2016. Effects
of season on the reproductive organ and plasma testosterone concentrations in guinea cocks (Numida meleagris). - Poult. Sci. 95: 636–644.
Adamo, S. A. and Lovett, M. M. E. 2011. Some like it hot: the effects of climate change on reproduction, immune function and disease resistance in the cricket Gryllus texensis. - J. Exp. Biol. 214: 1997–2004.
Altizer, S., Dobson, A., Hosseini, P., Hudson, P., Pascual, M. and Rohani, P. 2006. Seasonality and the dynamics of infectious diseases. - Ecol. Lett. 9: 467–484.
Anderson, P. C., Kok, O. B. and Erasmus, B. H. 1999. Diet, body mass and condition of lesser kestrels Falco naumanni in South Africa. – Ostrich 70: 112–116.
Anich, N. M., Benson, T. J. and Bednarz, J. C. 2010. Factors Influencing Home-Range Size of Swainson’s Warblers in Eastern Arkansas. - The Condor 112: 149–158.
Ardia, D. R., Schat, K. A. and Winkler, D. W. 2003. Reproductive effort reduces long-term immune function in breeding tree swallows (Tachycineta bicolor). - Proc. R. Soc. B Biol. Sci. 270: 1679–1683.
Arlettaz, R., Schaad, M., Reichlin, T. S. and Schaub, M. 2010. Impact of weather and climate variation on hoopoe reproductive ecology and population growth. – J. Ornithol. 151: 889–899.
Arnold, T. W. 2010. Uninformative parameters and model selection using Akaike’s information criterion. – J. Wildl. Manage. 74: 1175–1178.
Arnold, T. W., Sorenson, M. D. and Rotella, J. J. 1993. Relative success of overwater and upland mallard nests in south western Manitoba. – J. Wildl. Manage. 57: 578–581.
Ausden, M. and Drake, M. 2006. Invertebrates. – In: Sutherland, W. J. (ed.), Ecological census techniques. Cambridge Univ. Press, pp. 214–249.
B Bailey, L. D. and van de Pol, M. 2016. climwin: An R Toolbox for Climate Window Analysis. -
PLoS ONE in press. Baldwin, H. Q., Jeske, C. W., Powell, M. A., Chadwick, P. C. and Barrow, W. C. 2010. Home-
Range Size and Site Tenacity of Overwintering Le Conte’s Sparrows in a Fire Managed Prairie. - Wilson J. Ornithol. 122: 139–145.Burt, W. H. 1943. Territoriality and Home Range Concepts as Applied to Mammals. - J. Mammal. 24: 346–352.
Ball, G. F. 2016. Species variation in the degree of sex differences in brain and behaviour related to birdsong: adaptations and constraints. - Philos. Trans. R. Soc. B Biol. Sci. in press.
Ball, G. F. and Ketterson, E. D. 2008. Sex differences in the response to environmental cues regulating seasonal reproduction in birds. - Philos. Trans. R. Soc. Lond. B Biol. Sci. 363: 231–246.
References
113
predators. Future studies on the identity and ecology on nest predators is of fundamental importance to understanding evolution of avian life histories in these tropical systems. They would also contribute a better understanding of depredation patterns that may be obscured by the current lumping of different predator species. It would therefore be worthwhile to employ recent advances in the development of miniature video technology and more sensitive trail cameras to document nest predators either using active nests or artificial nests and design specific studies focusing on their ecology.
One unique attribute conferred to studying near equatorial tropical birds is the occurrence of birds both in breeding and in quiescence under the same environmental conditions that do not vary in body mass (an acceptable proxy for body condition) and immune indices (chapter 4 and 5 of this thesis). This unique attribute can be exploited to test the effects of; (a) increased infection, (b) mounting an immune challenge or (c) the ability to fight infection using the wild population during the putative expensive life history stage of breeding versus those in quiescence dependent on an individual’s immune function. This can be achieved for instance by experimentally presenting an immune challenge to their system to gain insight into the consequences of disease at different life history stages or environmental factors.
References A Abdul-Rahman, I. I., Robinson, J. E., Obese, F. Y., Jeffcoate, I. A. and Awumbila, B. 2016. Effects
of season on the reproductive organ and plasma testosterone concentrations in guinea cocks (Numida meleagris). - Poult. Sci. 95: 636–644.
Adamo, S. A. and Lovett, M. M. E. 2011. Some like it hot: the effects of climate change on reproduction, immune function and disease resistance in the cricket Gryllus texensis. - J. Exp. Biol. 214: 1997–2004.
Altizer, S., Dobson, A., Hosseini, P., Hudson, P., Pascual, M. and Rohani, P. 2006. Seasonality and the dynamics of infectious diseases. - Ecol. Lett. 9: 467–484.
Anderson, P. C., Kok, O. B. and Erasmus, B. H. 1999. Diet, body mass and condition of lesser kestrels Falco naumanni in South Africa. – Ostrich 70: 112–116.
Anich, N. M., Benson, T. J. and Bednarz, J. C. 2010. Factors Influencing Home-Range Size of Swainson’s Warblers in Eastern Arkansas. - The Condor 112: 149–158.
Ardia, D. R., Schat, K. A. and Winkler, D. W. 2003. Reproductive effort reduces long-term immune function in breeding tree swallows (Tachycineta bicolor). - Proc. R. Soc. B Biol. Sci. 270: 1679–1683.
Arlettaz, R., Schaad, M., Reichlin, T. S. and Schaub, M. 2010. Impact of weather and climate variation on hoopoe reproductive ecology and population growth. – J. Ornithol. 151: 889–899.
Arnold, T. W. 2010. Uninformative parameters and model selection using Akaike’s information criterion. – J. Wildl. Manage. 74: 1175–1178.
Arnold, T. W., Sorenson, M. D. and Rotella, J. J. 1993. Relative success of overwater and upland mallard nests in south western Manitoba. – J. Wildl. Manage. 57: 578–581.
Ausden, M. and Drake, M. 2006. Invertebrates. – In: Sutherland, W. J. (ed.), Ecological census techniques. Cambridge Univ. Press, pp. 214–249.
B Bailey, L. D. and van de Pol, M. 2016. climwin: An R Toolbox for Climate Window Analysis. -
PLoS ONE in press. Baldwin, H. Q., Jeske, C. W., Powell, M. A., Chadwick, P. C. and Barrow, W. C. 2010. Home-
Range Size and Site Tenacity of Overwintering Le Conte’s Sparrows in a Fire Managed Prairie. - Wilson J. Ornithol. 122: 139–145.Burt, W. H. 1943. Territoriality and Home Range Concepts as Applied to Mammals. - J. Mammal. 24: 346–352.
Ball, G. F. 2016. Species variation in the degree of sex differences in brain and behaviour related to birdsong: adaptations and constraints. - Philos. Trans. R. Soc. B Biol. Sci. in press.
Ball, G. F. and Ketterson, E. D. 2008. Sex differences in the response to environmental cues regulating seasonal reproduction in birds. - Philos. Trans. R. Soc. Lond. B Biol. Sci. 363: 231–246.
References
114
Barton, K. 2018. MuMIn: multi-model inference. – R package ver.1.40.4, < https://CRAN.R-project.org/package=MuMIn >. accessed 2018-07-23
Becker, C., Mounce, H., Rassmussen, T., Rauch-Sasseen, A., Swinnerton, K. and Leonard, D. 2010. Nest success and parental investment in the Critically Endangered Maui parrotbill Pseudonestor xanthophrys with implications for recovery. - Endanger. Species Res. 11: 189–194.
Bednekoff, P. A. and Krebs, J. R. 1995. Great Tit Fat Reserves: Effects of Changing and Unpredictable Feeding Day Length. - Funct. Ecol. 9: 457–462.
Berkunsky, I., Segura, L. N., Aramburú, R. M., Ruggera, R. A., Svagelj, W. S. and Reboreda, J. C. 2016. Nest survival and predation in blue-fronted parrots Amazona aestiva: effects of nesting behaviour and cavity characteristics. – Ardea 104: 143–151.
Bevanda, M., Fronhofer, E. A., Heurich, M., Müller, J. and Reineking, B. 2015. Landscape configuration is a major determinant of home range size variation. - Ecosphere 6: 1–12.
Blanckenhorn, W. U. 2000. The Evolution of Body Size: What Keeps Organisms Small? - Q. Rev. Biol. 75: 385–407.
Bleuven Clara and Landry Christian R. 2016. Molecular and cellular bases of adaptation to a changing environment in microorganisms. - Proc. R. Soc. B Biol. Sci. 283: 20161458.
Bogdan, C., Röllinghoff, M. and Diefenbach, A. 2000. The role of nitric oxide in innate immunity. - Immunol. Rev. 173: 17–26.
Börger, L., Franconi, N., Ferretti, F., Meschi, F., Michele, G. D., Gantz, A. and Coulson, T. 2006. An Integrated Approach to Identify Spatiotemporal and Individual‐Level Determinants of Animal Home Range Size. - Am. Nat. 168: 471–485.
Borgmann, K. L., Conway, C. J. and Morrison, M. L. 2013. Breeding phenology of birds: mechanisms underlying seasonal declines in the risk of nest predation. – PLoS One 8: e65909.
Braun, A. and Bugnyar, T. 2012. Social bonds and rank acquisition in raven nonbreeder aggregations. - Anim. Behav. 84: 1507–1515.
Brown, L. H. and Britton, P. L. 1980. The breeding seasons of East African birds. - EANHS: 182. Brown, M., Hablützel, P., Friberg, I. M., Thomason, A. G., Stewart, A., Pachebat, J. A. and
Jackson, J. A. 2016. Seasonal immunoregulation in a naturally-occurring vertebrate. - BMC Genomics in press.
Brzęk, P. and Konarzewski, M. 2007. Relationship between avian growth rate and immune response depends on food availability. - J. Exp. Biol. 210: 2361–2367.
Buehler, D. M., Encinas‐Viso, F., Petit, M., Vézina, F., Tieleman, B. I. and Piersma, T. 2009. Limited Access to Food and Physiological Trade‐Offs in a Long‐Distance Migrant Shorebird. II. Constitutive Immune Function and the Acute‐Phase Response. - Physiol. Biochem. Zool. 82: 561–571.
Buehler, D. M., Piersma, T., Matson, K. and Tieleman, B. I. 2008. Seasonal Redistribution of Immune Function in a Migrant Shorebird: Annual‐Cycle Effects Override Adjustments to Thermal Regime. - Am. Nat. 172: 783–796.
Burkhardt, R. W. 2013. Lamarck, Evolution, and the Inheritance of Acquired Characters. - Genetics 194: 793–805.
Burnham, K., Anderson, D. 2002. Model Selection and Multimodal Inference. -Springer, New York
C
Calenge, C. 2006. The package adehabitat for the R software: a tool for the analysis of space and habitat use by animals. 197: 516–519.
Carrascal, L. M. and Polo, V. 2006. Effects of wing area reduction on winter body mass and foraging behaviour in coal tits: field and aviary experiments. - Anim. Behav. 72: 663–672.
Catoni, C., Schaefer, H. M. and Peters, A. 2008. Fruit for health: the effect of flavonoids on humoral immune response and food selection in a frugivorous bird. - Funct. Ecol. 22: 649–654.
Chai, P. 1997. Hummingbird hovering energetics during moult of primary flight feathers. - J. Exp. Biol. 200: 1527–1536.
Chapman, A. 1995. Breeding and moult of four bird species in tropical West Africa. - Trop. Zool. 8: 227–238.
Chmura, H. E., Kharouba, H. M., Ashander, J., Ehlman, S. M., Rivest, E. B. and Yang, L. H. The mechanisms of phenology: the patterns and processes of phenological shifts. - Ecol. Monogr. in press.
Cooper, S. J. 2007. Daily and seasonal variation in body mass and visible fat in mountain chickadees and juniper titmice. - Wilson J. Ornithol. 119: 720–724.
Cowardin, L. M. and Johnson, D. H. 1979. Mathematics and mallard management. – J. Wildl. Manage. 43: 18–35.
Cox, D. T. C. and Cresswell, W. 2014. Mass gained during breeding positively correlates with adult survival because both reflect life history adaptation to seasonal food availability. - Oecologia 174: 1197–1204.
Cresswell, W. 1998. Diurnal and seasonal mass variation in blackbirds Turdus merula: consequences for mass-dependent predation risk. - J. Anim. Ecol. 67: 78–90.
Cresswell, W. 2003. Testing the mass-dependent predation hypothesis: in European blackbirds poor foragers have higher overwinter body reserves. - Anim. Behav. 65: 1035–1044.
Cuthill, I. C. 2000. Body mass regulation in response to changes in feeding predictability and overnight energy expenditure. - Behav. Ecol. 11: 189–195.
Cuthill, I. C., Maddocks, S. A., Weall, C. V. and Jones, E. K. M. 2000. Body mass regulation in response to changes in feeding predictability and overnight energy expenditure. - Behav. Ecol. 11: 189–195.
D Dallas, T. and Drake, J. M. 2016. Fluctuating temperatures alter environmental pathogen
transmission in a Daphnia–pathogen system. - Ecol. Evol. 6: 7931–7938. Darrah, A. J. and Smith, K. G. 2014. Ecological and behavioral correlates of individual flocking
propensity of a tropical songbird. - Behav. Ecol. 25: 1064–1072. Darwin, C. 1859. On the origin of species by means of natural selection, or, The preservation of
favoured races in the struggle for life /. - John Murray,. Davis, S. K. 2005. Nest-site selection patterns and the influence of vegetation on nest survival of
mixed-grass prairie passerines. – Condor 107: 605–616. Dawson, A., King, V. M., Bentley, G. E. and Ball, G. F. 2001. Photoperiodic control of seasonality
in birds. – J. Biol. Rhythms 16: 365–380. Dinsmore, S. J., White, G. C. and Knopf, F. L. 2002. Advanced techniques for modeling avian
nest survival. – Ecology 83: 3476–3488. Drent, R. H. and Daan, S. 1980. The Prudent Parent: Energetic Adjustments in Avian Breeding. -
Ardea 38–90: 225–252.
References
115
Barton, K. 2018. MuMIn: multi-model inference. – R package ver.1.40.4, < https://CRAN.R-project.org/package=MuMIn >. accessed 2018-07-23
Becker, C., Mounce, H., Rassmussen, T., Rauch-Sasseen, A., Swinnerton, K. and Leonard, D. 2010. Nest success and parental investment in the Critically Endangered Maui parrotbill Pseudonestor xanthophrys with implications for recovery. - Endanger. Species Res. 11: 189–194.
Bednekoff, P. A. and Krebs, J. R. 1995. Great Tit Fat Reserves: Effects of Changing and Unpredictable Feeding Day Length. - Funct. Ecol. 9: 457–462.
Berkunsky, I., Segura, L. N., Aramburú, R. M., Ruggera, R. A., Svagelj, W. S. and Reboreda, J. C. 2016. Nest survival and predation in blue-fronted parrots Amazona aestiva: effects of nesting behaviour and cavity characteristics. – Ardea 104: 143–151.
Bevanda, M., Fronhofer, E. A., Heurich, M., Müller, J. and Reineking, B. 2015. Landscape configuration is a major determinant of home range size variation. - Ecosphere 6: 1–12.
Blanckenhorn, W. U. 2000. The Evolution of Body Size: What Keeps Organisms Small? - Q. Rev. Biol. 75: 385–407.
Bleuven Clara and Landry Christian R. 2016. Molecular and cellular bases of adaptation to a changing environment in microorganisms. - Proc. R. Soc. B Biol. Sci. 283: 20161458.
Bogdan, C., Röllinghoff, M. and Diefenbach, A. 2000. The role of nitric oxide in innate immunity. - Immunol. Rev. 173: 17–26.
Börger, L., Franconi, N., Ferretti, F., Meschi, F., Michele, G. D., Gantz, A. and Coulson, T. 2006. An Integrated Approach to Identify Spatiotemporal and Individual‐Level Determinants of Animal Home Range Size. - Am. Nat. 168: 471–485.
Borgmann, K. L., Conway, C. J. and Morrison, M. L. 2013. Breeding phenology of birds: mechanisms underlying seasonal declines in the risk of nest predation. – PLoS One 8: e65909.
Braun, A. and Bugnyar, T. 2012. Social bonds and rank acquisition in raven nonbreeder aggregations. - Anim. Behav. 84: 1507–1515.
Brown, L. H. and Britton, P. L. 1980. The breeding seasons of East African birds. - EANHS: 182. Brown, M., Hablützel, P., Friberg, I. M., Thomason, A. G., Stewart, A., Pachebat, J. A. and
Jackson, J. A. 2016. Seasonal immunoregulation in a naturally-occurring vertebrate. - BMC Genomics in press.
Brzęk, P. and Konarzewski, M. 2007. Relationship between avian growth rate and immune response depends on food availability. - J. Exp. Biol. 210: 2361–2367.
Buehler, D. M., Encinas‐Viso, F., Petit, M., Vézina, F., Tieleman, B. I. and Piersma, T. 2009. Limited Access to Food and Physiological Trade‐Offs in a Long‐Distance Migrant Shorebird. II. Constitutive Immune Function and the Acute‐Phase Response. - Physiol. Biochem. Zool. 82: 561–571.
Buehler, D. M., Piersma, T., Matson, K. and Tieleman, B. I. 2008. Seasonal Redistribution of Immune Function in a Migrant Shorebird: Annual‐Cycle Effects Override Adjustments to Thermal Regime. - Am. Nat. 172: 783–796.
Burkhardt, R. W. 2013. Lamarck, Evolution, and the Inheritance of Acquired Characters. - Genetics 194: 793–805.
Burnham, K., Anderson, D. 2002. Model Selection and Multimodal Inference. -Springer, New York
C
Calenge, C. 2006. The package adehabitat for the R software: a tool for the analysis of space and habitat use by animals. 197: 516–519.
Carrascal, L. M. and Polo, V. 2006. Effects of wing area reduction on winter body mass and foraging behaviour in coal tits: field and aviary experiments. - Anim. Behav. 72: 663–672.
Catoni, C., Schaefer, H. M. and Peters, A. 2008. Fruit for health: the effect of flavonoids on humoral immune response and food selection in a frugivorous bird. - Funct. Ecol. 22: 649–654.
Chai, P. 1997. Hummingbird hovering energetics during moult of primary flight feathers. - J. Exp. Biol. 200: 1527–1536.
Chapman, A. 1995. Breeding and moult of four bird species in tropical West Africa. - Trop. Zool. 8: 227–238.
Chmura, H. E., Kharouba, H. M., Ashander, J., Ehlman, S. M., Rivest, E. B. and Yang, L. H. The mechanisms of phenology: the patterns and processes of phenological shifts. - Ecol. Monogr. in press.
Cooper, S. J. 2007. Daily and seasonal variation in body mass and visible fat in mountain chickadees and juniper titmice. - Wilson J. Ornithol. 119: 720–724.
Cowardin, L. M. and Johnson, D. H. 1979. Mathematics and mallard management. – J. Wildl. Manage. 43: 18–35.
Cox, D. T. C. and Cresswell, W. 2014. Mass gained during breeding positively correlates with adult survival because both reflect life history adaptation to seasonal food availability. - Oecologia 174: 1197–1204.
Cresswell, W. 1998. Diurnal and seasonal mass variation in blackbirds Turdus merula: consequences for mass-dependent predation risk. - J. Anim. Ecol. 67: 78–90.
Cresswell, W. 2003. Testing the mass-dependent predation hypothesis: in European blackbirds poor foragers have higher overwinter body reserves. - Anim. Behav. 65: 1035–1044.
Cuthill, I. C. 2000. Body mass regulation in response to changes in feeding predictability and overnight energy expenditure. - Behav. Ecol. 11: 189–195.
Cuthill, I. C., Maddocks, S. A., Weall, C. V. and Jones, E. K. M. 2000. Body mass regulation in response to changes in feeding predictability and overnight energy expenditure. - Behav. Ecol. 11: 189–195.
D Dallas, T. and Drake, J. M. 2016. Fluctuating temperatures alter environmental pathogen
transmission in a Daphnia–pathogen system. - Ecol. Evol. 6: 7931–7938. Darrah, A. J. and Smith, K. G. 2014. Ecological and behavioral correlates of individual flocking
propensity of a tropical songbird. - Behav. Ecol. 25: 1064–1072. Darwin, C. 1859. On the origin of species by means of natural selection, or, The preservation of
favoured races in the struggle for life /. - John Murray,. Davis, S. K. 2005. Nest-site selection patterns and the influence of vegetation on nest survival of
mixed-grass prairie passerines. – Condor 107: 605–616. Dawson, A., King, V. M., Bentley, G. E. and Ball, G. F. 2001. Photoperiodic control of seasonality
in birds. – J. Biol. Rhythms 16: 365–380. Dinsmore, S. J., White, G. C. and Knopf, F. L. 2002. Advanced techniques for modeling avian
nest survival. – Ecology 83: 3476–3488. Drent, R. H. and Daan, S. 1980. The Prudent Parent: Energetic Adjustments in Avian Breeding. -
Ardea 38–90: 225–252.
References
116
E Echeverry-Galvis, M. A. and Hau, M. 2013. Flight Performance and Feather Quality: Paying the Price of Overlapping Moult and Breeding in a Tropical Highland Bird. - PLOS ONE 8: e61106. Ekman, J. B. and Hake, M. K. 1990. Monitoring starvation risk: adjustments of body reserves in
greenfinches (Carduelis Chloris L.) during periods of unpredictable foraging success. - Behav. Ecol. 1: 62–67.
Elmberg, J., Folkesson, K., Guillemain, M. and Gunnarsson, G. 2009. Putting density dependence in perspective: nest density, nesting phenology, and biome, all matter to survival of simulated mallard Anas platyrhynchos nests. – J. Avian Biol. 40: 317–326.
Emmering, Q. C. and Schmidt, K. A. 2011. Nesting songbirds assess spatial heterogeneity of predatory chipmunks by eavesdropping on their vocalizations. – J. Anim. Ecol. 80: 1305–1312.
Ezenwa, V. O. and Worsley-Tonks, K. E. L. 2018. Social living simultaneously increases infection risk and decreases the cost of infection. - Proc. R. Soc. B Biol. Sci. 285: 20182142.
F França, L. F., Silva, C. M. da and Paiva, L. V. de 2016. Effects of intrinsic and time-specific factors
on daily nest survival of birds in a semiarid area of South America (Caatinga). – Braz. J. Ornithol. 24: 228–234.
Freed, L. A. and Cann, R. L. 2012. Changes in Timing, Duration, and Symmetry of Molt of Hawaiian Forest Birds. - PLoS ONE in press.
Fuller, A. K. and Harrison, D. J. 2010. Movement paths reveal scale-dependent habitat decisions by Canada lynx. - J. Mammal. 91: 1269–1279.
Fusco, G. and Minelli, A. 2010. Phenotypic plasticity in development and evolution: facts and concepts. - Philos. Trans. R. Soc. B Biol. Sci. 365: 547–556.
G Galipaud, M., Gillingham, M. A. F. and Dechaume‐Moncharmont, F.-X. 2017. A farewell to the
sum of Akaike weights: The benefits of alternative metrics for variable importance estimations in model selection. - Methods Ecol. Evol. 8: 1668–1678.
Garza, V., Suárez, F., Herranz, J., Traba, E., García de la Morena, E. L., Morales, M. B., González, R. and Castañeda, M. 2005. Home range, territoriality and habitat selection by the Dupont’s Lark Chersophilus Duponti during the breeding and post breeding periods. - Ardeola 52: 133–146.
Germain, R. R., Schuster, R., Delmore, K. E. and Arcese, P. 2015. Habitat preference facilitates successful early breeding in an open-cup nesting songbird. - Funct. Ecol. 29: 1522–1532.
Götmark, F. 2002. Predation by sparrowhawks favours early breeding and small broods in great tits. – Oecologia 130: 25–32.
Goymann, W. and Wingfield, J. C. 2014. Male-to-female testosterone ratios, dimorphism, and life history—what does it really tell us? - Behav. Ecol. 25: 685–699.
Grant, P. R. and Boag, P. T. 1980. Rainfall on the Galápagos and the demography of Darwin’s finches. – Auk 97: 227–244.
Grant, T. A., Shaffer, T. L., Madden, E. M. and Pietz, P. J. 2005. Time-specific variation in passerine nest survival: new insights into old questions. – Auk 122: 661–672.
Griesser, M., Barnaby, J., Schneider, N. A., Figenschau, N., Wright, J., Griffith, S. C., Kazem, A. and Russell, A. F. 2009. Influence of Winter Ranging Behaviour on the Social Organization of a Cooperatively Breeding Bird Species, The Apostlebird. - Ethology 115: 888–896.
Grueber, C. E., Nakagawa, S., Laws, R. J. and Jamieson, I. G. 2011. Multimodel inference in ecology and evolution: challenges and solutions. – J. Evol. Biol. 24: 699–711.
Guenther, A. and Trillmich, F. 2013. Photoperiod influences the behavioral and physiological phenotype during ontogeny. - Behav. Ecol. 24: 402–411.
Gunnarsson, G. and Elmberg, J. 2008. Density-dependent nest predation – an experiment with simulated mallard nests in contrasting landscapes. – Ibis 150: 259–269.
H Haff, T. M. and Magrath, R. D. 2011. Calling at a cost: elevated nestling calling attracts predators
to active nests. – Biol. Lett. 7: 493–495. Hahn, T. P. and MacDougall-Shackleton, S. A. 2008. Adaptive specialization, conditional
plasticity and phylogenetic history in the reproductive cue response systems of birds. - Philos. Trans. R. Soc. B Biol. Sci. 363: 267–286.
Haley, K. L. and Rosenberg, D. K. 2013. Influence of food limitation on reproductive performance of burrowing owls. – J. Raptor Res. 47: 365–376.
Hanssen, S. A., Hasselquist, D., Folstad, I. and Erikstad, K. E. 2005. Cost of reproduction in a long-lived bird: incubation effort reduces immune function and future reproduction. - Proc. R. Soc. B Biol. Sci. 272: 1039–1046.
Hau, M. 2001. Timing of Breeding in Variable Environments: Tropical Birds as Model Systems. - Horm. Behav. 40: 281–290.
Hau, M., Wikelski, M., Gwinner, H. and Gwinner, E. 2004. Timing of reproduction in a Darwin’s finch: temporal opportunism under spatial constraints. - Oikos 106: 489–500.
Hegemann, A., Matson, K. D., Both, C. and Tieleman, B. I. 2012. Immune function in a free-living bird varies over the annual cycle, but seasonal patterns differ between years. - Oecologia 170: 605–618.
Helm, B. and Gwinner, E. 1999. Timing of Postjuvenal Molt in African Saxicola torquata axillaris and European Saxicola torquata rubicola Stonechats: Effects of Genetic and Environmental Factors. - The Auk 116: 589–603.
Hemborg, C. 1999. Sexual Differences in Moult-Breeding Overlap and Female Reproductive Costs in Pied Flycatchers, Ficedula hypoleuca. - J. Anim. Ecol. 68: 429–436.
Herremans, M. and Herremans-Tonnoeyr, D. 1997. Social Foraging of the Forktailed Drongo Dicrurus adsimilis: Beater Effect or Kleptoparasitism? - Bird Behav. 12: 41–45.
Hijmans, R. J. 2017. raster: Geographic Data Analysis and Modeling. R package version 2.6-7. https://CRAN.R-project.org/package=raster Holland, A. E., Byrne, M. E., Bryan, A. L., DeVault, T. L., Rhodes, O. E. and Beasley, J. C. 2017.
Fine-scale assessment of home ranges and activity patterns for resident black vultures Coragyps atratus and turkey vultures Cathartes aura. - PLoS ONE 12: 1–16.
Holmes, T. R. 2011. Avian population and community processes in forest ecosystems: long-term research in the Hubbard Brook Experimental Forest. – For. Ecol. Manage. 262: 20–32
Horrocks, N. P. C., Hegemann, A., Matson, K. D., Hine, K., Jaquier, S., Shobrak, M., Williams, J. B., Tinbergen, J. M. and Tieleman, B. I. 2012b. Immune indexes of larks from desert and temperate regions show weak associations with life history but stronger links to
References
117
E Echeverry-Galvis, M. A. and Hau, M. 2013. Flight Performance and Feather Quality: Paying the Price of Overlapping Moult and Breeding in a Tropical Highland Bird. - PLOS ONE 8: e61106. Ekman, J. B. and Hake, M. K. 1990. Monitoring starvation risk: adjustments of body reserves in
greenfinches (Carduelis Chloris L.) during periods of unpredictable foraging success. - Behav. Ecol. 1: 62–67.
Elmberg, J., Folkesson, K., Guillemain, M. and Gunnarsson, G. 2009. Putting density dependence in perspective: nest density, nesting phenology, and biome, all matter to survival of simulated mallard Anas platyrhynchos nests. – J. Avian Biol. 40: 317–326.
Emmering, Q. C. and Schmidt, K. A. 2011. Nesting songbirds assess spatial heterogeneity of predatory chipmunks by eavesdropping on their vocalizations. – J. Anim. Ecol. 80: 1305–1312.
Ezenwa, V. O. and Worsley-Tonks, K. E. L. 2018. Social living simultaneously increases infection risk and decreases the cost of infection. - Proc. R. Soc. B Biol. Sci. 285: 20182142.
F França, L. F., Silva, C. M. da and Paiva, L. V. de 2016. Effects of intrinsic and time-specific factors
on daily nest survival of birds in a semiarid area of South America (Caatinga). – Braz. J. Ornithol. 24: 228–234.
Freed, L. A. and Cann, R. L. 2012. Changes in Timing, Duration, and Symmetry of Molt of Hawaiian Forest Birds. - PLoS ONE in press.
Fuller, A. K. and Harrison, D. J. 2010. Movement paths reveal scale-dependent habitat decisions by Canada lynx. - J. Mammal. 91: 1269–1279.
Fusco, G. and Minelli, A. 2010. Phenotypic plasticity in development and evolution: facts and concepts. - Philos. Trans. R. Soc. B Biol. Sci. 365: 547–556.
G Galipaud, M., Gillingham, M. A. F. and Dechaume‐Moncharmont, F.-X. 2017. A farewell to the
sum of Akaike weights: The benefits of alternative metrics for variable importance estimations in model selection. - Methods Ecol. Evol. 8: 1668–1678.
Garza, V., Suárez, F., Herranz, J., Traba, E., García de la Morena, E. L., Morales, M. B., González, R. and Castañeda, M. 2005. Home range, territoriality and habitat selection by the Dupont’s Lark Chersophilus Duponti during the breeding and post breeding periods. - Ardeola 52: 133–146.
Germain, R. R., Schuster, R., Delmore, K. E. and Arcese, P. 2015. Habitat preference facilitates successful early breeding in an open-cup nesting songbird. - Funct. Ecol. 29: 1522–1532.
Götmark, F. 2002. Predation by sparrowhawks favours early breeding and small broods in great tits. – Oecologia 130: 25–32.
Goymann, W. and Wingfield, J. C. 2014. Male-to-female testosterone ratios, dimorphism, and life history—what does it really tell us? - Behav. Ecol. 25: 685–699.
Grant, P. R. and Boag, P. T. 1980. Rainfall on the Galápagos and the demography of Darwin’s finches. – Auk 97: 227–244.
Grant, T. A., Shaffer, T. L., Madden, E. M. and Pietz, P. J. 2005. Time-specific variation in passerine nest survival: new insights into old questions. – Auk 122: 661–672.
Griesser, M., Barnaby, J., Schneider, N. A., Figenschau, N., Wright, J., Griffith, S. C., Kazem, A. and Russell, A. F. 2009. Influence of Winter Ranging Behaviour on the Social Organization of a Cooperatively Breeding Bird Species, The Apostlebird. - Ethology 115: 888–896.
Grueber, C. E., Nakagawa, S., Laws, R. J. and Jamieson, I. G. 2011. Multimodel inference in ecology and evolution: challenges and solutions. – J. Evol. Biol. 24: 699–711.
Guenther, A. and Trillmich, F. 2013. Photoperiod influences the behavioral and physiological phenotype during ontogeny. - Behav. Ecol. 24: 402–411.
Gunnarsson, G. and Elmberg, J. 2008. Density-dependent nest predation – an experiment with simulated mallard nests in contrasting landscapes. – Ibis 150: 259–269.
H Haff, T. M. and Magrath, R. D. 2011. Calling at a cost: elevated nestling calling attracts predators
to active nests. – Biol. Lett. 7: 493–495. Hahn, T. P. and MacDougall-Shackleton, S. A. 2008. Adaptive specialization, conditional
plasticity and phylogenetic history in the reproductive cue response systems of birds. - Philos. Trans. R. Soc. B Biol. Sci. 363: 267–286.
Haley, K. L. and Rosenberg, D. K. 2013. Influence of food limitation on reproductive performance of burrowing owls. – J. Raptor Res. 47: 365–376.
Hanssen, S. A., Hasselquist, D., Folstad, I. and Erikstad, K. E. 2005. Cost of reproduction in a long-lived bird: incubation effort reduces immune function and future reproduction. - Proc. R. Soc. B Biol. Sci. 272: 1039–1046.
Hau, M. 2001. Timing of Breeding in Variable Environments: Tropical Birds as Model Systems. - Horm. Behav. 40: 281–290.
Hau, M., Wikelski, M., Gwinner, H. and Gwinner, E. 2004. Timing of reproduction in a Darwin’s finch: temporal opportunism under spatial constraints. - Oikos 106: 489–500.
Hegemann, A., Matson, K. D., Both, C. and Tieleman, B. I. 2012. Immune function in a free-living bird varies over the annual cycle, but seasonal patterns differ between years. - Oecologia 170: 605–618.
Helm, B. and Gwinner, E. 1999. Timing of Postjuvenal Molt in African Saxicola torquata axillaris and European Saxicola torquata rubicola Stonechats: Effects of Genetic and Environmental Factors. - The Auk 116: 589–603.
Hemborg, C. 1999. Sexual Differences in Moult-Breeding Overlap and Female Reproductive Costs in Pied Flycatchers, Ficedula hypoleuca. - J. Anim. Ecol. 68: 429–436.
Herremans, M. and Herremans-Tonnoeyr, D. 1997. Social Foraging of the Forktailed Drongo Dicrurus adsimilis: Beater Effect or Kleptoparasitism? - Bird Behav. 12: 41–45.
Hijmans, R. J. 2017. raster: Geographic Data Analysis and Modeling. R package version 2.6-7. https://CRAN.R-project.org/package=raster Holland, A. E., Byrne, M. E., Bryan, A. L., DeVault, T. L., Rhodes, O. E. and Beasley, J. C. 2017.
Fine-scale assessment of home ranges and activity patterns for resident black vultures Coragyps atratus and turkey vultures Cathartes aura. - PLoS ONE 12: 1–16.
Holmes, T. R. 2011. Avian population and community processes in forest ecosystems: long-term research in the Hubbard Brook Experimental Forest. – For. Ecol. Manage. 262: 20–32
Horrocks, N. P. C., Hegemann, A., Matson, K. D., Hine, K., Jaquier, S., Shobrak, M., Williams, J. B., Tinbergen, J. M. and Tieleman, B. I. 2012b. Immune indexes of larks from desert and temperate regions show weak associations with life history but stronger links to
References
118
environmental variation in microbial abundance. - Physiol. Biochem. Zool. PBZ 85: 504–515.
Horrocks, N. P. C., Hegemann, A., Ostrowski, S., Ndithia, H., Shobrak, M., Williams, J. B., Matson, K. D. and Tieleman, B. I. 2015. Environmental proxies of antigen exposure explain variation in immune investment better than indices of pace of life. - Oecologia 177: 281–290.
Horrocks, N. P. C., Matson, K. D. and Tieleman, B. I. 2011. Pathogen Pressure Puts Immune Defense into Perspective. - Integr. Comp. Biol. 51: 563–576.
Horrocks, N. P. C., Matson, K. D., Shobrak, M., Tinbergen, J. M. and Tieleman, B. I. 2012. Seasonal patterns in immune indices reflect microbial loads on birds but not microbes in the wider environment. - Ecosphere 3: art19.
Hotchkiss, A. K., Sternberg, R. M. and LeBlanc, G. A. 2008. Environmental cues trigger seasonal regression of primary and accessory sex organs of the mud snail, Ilyanassa obsoleta. - J. Molluscan Stud. 74: 301–303.
I Ibáñez-Álamo, J. D., Magrath, R. D., Oteyza, J. C., Chalfoun, A. D., Haff, T. M., Schmidt, K. A.,
Thomson, R. L. and Martin, T. E. 2015. Nest predation research: recent findings and future perspectives. – J. Ornithol. 156: 247–262.
Illera, J. C. and Díaz, M. 2006. Reproduction in an endemic bird of a semiarid island: a food-mediated process. – J. Avian Biol. 37: 447–456.
Ilmonen, P., Taarna, T. and Hasselquist, D. 2000. Experimentally activated immune defence in female pied flycatchers results in reduced breeding success. - Proc. R. Soc. B Biol. Sci. 267: 665–670.
J Jahanian, R. 2009. Immunological responses as affected by dietary protein and arginine
concentrations in starting broiler chicks. - Poult. Sci. 88: 1818–1824. Jahn, A. E., Bejarano, V., Guzmán, M. B., Brown, L. M., Carvalho Provinciato, I. C., Cereghetti,
J., Cueto, V. R., Giraldo, J. I., Gómez-Bahamón, V., Husak, M. S., LePage, H. K., MacPherson, M., Marini, M. Â., Pizo, M. A., Quickle, A., Roeder, D. V., Sarasola, J. H. and Tuero, D. T. 2017. Molting while breeding? Lessons from New World Tyrannus Flycatchers. - J. Ornithol. 158: 1061–1072.
Jahn, A., Pinto-Ledezma, J., María Mamani, A., DeGroote, L. and Levey, D. 2010. Seasonal home range size of Tropical Kingbird Tyrannus melancholicus in the southern Amazon Basin. - Ornitol. NEOTROPICAL 21: 39–46.
Jarjour, C., Frei, B. and Elliott, K. H. 2017. Associations between sex, age and species-specific climate sensitivity in migration. - Anim. Migr. in press.
Johnson, E. I., Stouffer, P. C. and Jr, R. O. B. 2012. The phenology of molting, breeding and their overlap in central Amazonian birds. - J. Avian Biol. 43: 141–154.
K Kelly, J. P. and Weathers, W. W. 2002. Effects of feeding time constraints on body mass regulation
and energy expenditure in wintering dunlin Calidris alpina. - Behav. Ecol. 13: 766–775.
Kentie, R., Both, C., Hooijmeijer, J. C .E .W. and Piersma, T. 2015. Management of modern agricultural landscapes increases nest predation rates in black-tailed godwits Limosa limosa limosa. – Ibis 157: 614–625.
Kidd, M. 2004. Nutritional modulation of immune function in broilers. - Poult. Sci. 83: 650–657. Kiringe, J. W. 1993. The Ecology of Large Herbivores in Hell’s Gate National Park, Naivasha,
Kenya. - University of Leicester. Klaassen, M. 1995. Moult and basal metabolic costs in males of two subspecies of stonechats: the
European Saxicola torquata rubicula and the East African S. t. axillaris. - Oecologia 104: 424–432.
Klare, U., Kamler, J. F. and Macdonald, D. W. 2011. The bat-eared fox: a dietary specialist? – Biol. Mamm. 76: 646–650.
Klenova, A. V. 2015. Chick Begging Calls Reflect Degree of Hunger in Three Auk Species Charadriiformes: Alcidae. - PLoS ONE in press.
Knowles, S. C. L., Nakagawa, S. and Sheldon, B. C. 2009. Elevated reproductive effort increases blood parasitaemia and decreases immune function in birds: a meta-regression approach. - Funct. Ecol. 23: 405–415.
Koczur, L., Munters, A., Heath, S., Ballard, B., Green, M. C., Dinsmore, S. and Hernández, F. 2014. Reproductive success of the American oystercatcher Haematopus palliates in Texas. – Waterbirds 37: 371–380.
Kolts, J. R. and McRae, S. B. 2017. Seasonal home range dynamics and sex differences in habitat use in a threatened, coastal marsh bird. - Ecol. Evol. 7: 1101–1111.
Kortet, R. and Vainikka, A. 2008. Seasonality of innate immunity; evolutionary aspects and latest updates. - In: New research on innate immunity. Nova Science Publisher, pp. 13–45.
L Laake, J. L. 2013. RMark: an R interface for analysis of capture– recapture data with MARK. –
AFSC Processed Rep. 2013-01, Alaska Fish. Sci. Cent., NOAA, Natl Mar. Fish. Serv., WA.
Labocha, M. K., Schutz, H. and Hayes, J. P. 2014. Which body condition index is best? - Oikos 123: 111–119.
Lack, D. 1947. The Significance of Clutch‐size. - Ibis 89: 302–352. Lack, D. 1950. The Breeding Seasons of European Birds. - Ibis 92: 288–316. Legagneux, P., Berzins, L. L., Forbes, M., Harms, N. J., Hennin, H. L., Bourgeon, S., Gilchrist, H.
G., Bêty, J., Soos, C., Love, O. P., Foster, J. T., Descamps, S. and Burness, G. 2014. No selection on immunological markers in response to a highly virulent pathogen in an Arctic breeding bird. - Evol. Appl. 7: 765–773.
Lilliendahl, K. 1997. The effect of predator presence on body mass in captive greenfinches. - Anim. Behav. 53: 75–81.
Lima, S. L. 2009. Predators and the breeding bird: behavioral and reproductive flexibility under the risk of predation. - Biol. Rev. 84: 485–513.
Lofts, B. and Murton, R. K. 1968. Photoperiodic and physiological adaptations regulating avian breeding cycles and their ecological significance. - J. Zool. 155: 327–394.
Lopes, L. E. and Marini, M. Â. 2006. Home range and habitat use by Suiriri affinis and Suiriri islerorum (Aves: Tyrannidae) in the central Brazilian Cerrado. - Stud. Neotropical Fauna Environ. 41: 87–92.
References
119
environmental variation in microbial abundance. - Physiol. Biochem. Zool. PBZ 85: 504–515.
Horrocks, N. P. C., Hegemann, A., Ostrowski, S., Ndithia, H., Shobrak, M., Williams, J. B., Matson, K. D. and Tieleman, B. I. 2015. Environmental proxies of antigen exposure explain variation in immune investment better than indices of pace of life. - Oecologia 177: 281–290.
Horrocks, N. P. C., Matson, K. D. and Tieleman, B. I. 2011. Pathogen Pressure Puts Immune Defense into Perspective. - Integr. Comp. Biol. 51: 563–576.
Horrocks, N. P. C., Matson, K. D., Shobrak, M., Tinbergen, J. M. and Tieleman, B. I. 2012. Seasonal patterns in immune indices reflect microbial loads on birds but not microbes in the wider environment. - Ecosphere 3: art19.
Hotchkiss, A. K., Sternberg, R. M. and LeBlanc, G. A. 2008. Environmental cues trigger seasonal regression of primary and accessory sex organs of the mud snail, Ilyanassa obsoleta. - J. Molluscan Stud. 74: 301–303.
I Ibáñez-Álamo, J. D., Magrath, R. D., Oteyza, J. C., Chalfoun, A. D., Haff, T. M., Schmidt, K. A.,
Thomson, R. L. and Martin, T. E. 2015. Nest predation research: recent findings and future perspectives. – J. Ornithol. 156: 247–262.
Illera, J. C. and Díaz, M. 2006. Reproduction in an endemic bird of a semiarid island: a food-mediated process. – J. Avian Biol. 37: 447–456.
Ilmonen, P., Taarna, T. and Hasselquist, D. 2000. Experimentally activated immune defence in female pied flycatchers results in reduced breeding success. - Proc. R. Soc. B Biol. Sci. 267: 665–670.
J Jahanian, R. 2009. Immunological responses as affected by dietary protein and arginine
concentrations in starting broiler chicks. - Poult. Sci. 88: 1818–1824. Jahn, A. E., Bejarano, V., Guzmán, M. B., Brown, L. M., Carvalho Provinciato, I. C., Cereghetti,
J., Cueto, V. R., Giraldo, J. I., Gómez-Bahamón, V., Husak, M. S., LePage, H. K., MacPherson, M., Marini, M. Â., Pizo, M. A., Quickle, A., Roeder, D. V., Sarasola, J. H. and Tuero, D. T. 2017. Molting while breeding? Lessons from New World Tyrannus Flycatchers. - J. Ornithol. 158: 1061–1072.
Jahn, A., Pinto-Ledezma, J., María Mamani, A., DeGroote, L. and Levey, D. 2010. Seasonal home range size of Tropical Kingbird Tyrannus melancholicus in the southern Amazon Basin. - Ornitol. NEOTROPICAL 21: 39–46.
Jarjour, C., Frei, B. and Elliott, K. H. 2017. Associations between sex, age and species-specific climate sensitivity in migration. - Anim. Migr. in press.
Johnson, E. I., Stouffer, P. C. and Jr, R. O. B. 2012. The phenology of molting, breeding and their overlap in central Amazonian birds. - J. Avian Biol. 43: 141–154.
K Kelly, J. P. and Weathers, W. W. 2002. Effects of feeding time constraints on body mass regulation
and energy expenditure in wintering dunlin Calidris alpina. - Behav. Ecol. 13: 766–775.
Kentie, R., Both, C., Hooijmeijer, J. C .E .W. and Piersma, T. 2015. Management of modern agricultural landscapes increases nest predation rates in black-tailed godwits Limosa limosa limosa. – Ibis 157: 614–625.
Kidd, M. 2004. Nutritional modulation of immune function in broilers. - Poult. Sci. 83: 650–657. Kiringe, J. W. 1993. The Ecology of Large Herbivores in Hell’s Gate National Park, Naivasha,
Kenya. - University of Leicester. Klaassen, M. 1995. Moult and basal metabolic costs in males of two subspecies of stonechats: the
European Saxicola torquata rubicula and the East African S. t. axillaris. - Oecologia 104: 424–432.
Klare, U., Kamler, J. F. and Macdonald, D. W. 2011. The bat-eared fox: a dietary specialist? – Biol. Mamm. 76: 646–650.
Klenova, A. V. 2015. Chick Begging Calls Reflect Degree of Hunger in Three Auk Species Charadriiformes: Alcidae. - PLoS ONE in press.
Knowles, S. C. L., Nakagawa, S. and Sheldon, B. C. 2009. Elevated reproductive effort increases blood parasitaemia and decreases immune function in birds: a meta-regression approach. - Funct. Ecol. 23: 405–415.
Koczur, L., Munters, A., Heath, S., Ballard, B., Green, M. C., Dinsmore, S. and Hernández, F. 2014. Reproductive success of the American oystercatcher Haematopus palliates in Texas. – Waterbirds 37: 371–380.
Kolts, J. R. and McRae, S. B. 2017. Seasonal home range dynamics and sex differences in habitat use in a threatened, coastal marsh bird. - Ecol. Evol. 7: 1101–1111.
Kortet, R. and Vainikka, A. 2008. Seasonality of innate immunity; evolutionary aspects and latest updates. - In: New research on innate immunity. Nova Science Publisher, pp. 13–45.
L Laake, J. L. 2013. RMark: an R interface for analysis of capture– recapture data with MARK. –
AFSC Processed Rep. 2013-01, Alaska Fish. Sci. Cent., NOAA, Natl Mar. Fish. Serv., WA.
Labocha, M. K., Schutz, H. and Hayes, J. P. 2014. Which body condition index is best? - Oikos 123: 111–119.
Lack, D. 1947. The Significance of Clutch‐size. - Ibis 89: 302–352. Lack, D. 1950. The Breeding Seasons of European Birds. - Ibis 92: 288–316. Legagneux, P., Berzins, L. L., Forbes, M., Harms, N. J., Hennin, H. L., Bourgeon, S., Gilchrist, H.
G., Bêty, J., Soos, C., Love, O. P., Foster, J. T., Descamps, S. and Burness, G. 2014. No selection on immunological markers in response to a highly virulent pathogen in an Arctic breeding bird. - Evol. Appl. 7: 765–773.
Lilliendahl, K. 1997. The effect of predator presence on body mass in captive greenfinches. - Anim. Behav. 53: 75–81.
Lima, S. L. 2009. Predators and the breeding bird: behavioral and reproductive flexibility under the risk of predation. - Biol. Rev. 84: 485–513.
Lofts, B. and Murton, R. K. 1968. Photoperiodic and physiological adaptations regulating avian breeding cycles and their ecological significance. - J. Zool. 155: 327–394.
Lopes, L. E. and Marini, M. Â. 2006. Home range and habitat use by Suiriri affinis and Suiriri islerorum (Aves: Tyrannidae) in the central Brazilian Cerrado. - Stud. Neotropical Fauna Environ. 41: 87–92.
References
120
Loretto, M.-C., Schuster, R., Itty, C., Marchand, P., Genero, F. and Bugnyar, T. 2017. Fission-fusion dynamics over large distances in raven non-breeders. - Sci. Rep. 7: 380.
Low, M., Arlt, D., Pärt, T. and Öberg, M. 2015. Delayed timing of breeding as a cost of reproduction. - J. Avian Biol. 46: 325–331.
M Macleod, R. and Gosler, A. G. 2006. Capture and mass change: perceived predation risk or
interrupted foraging? - Anim. Behav. 71: 1081–1087. Macleod, R., Barnett, P., Clark, J. A. and Cresswell, W. 2005. Body mass change strategies in
blackbirds Turdus merula: the starvation–predation risk trade-off. - J. Anim. Ecol. 74: 292–302.
Maphisa, D. H., Donald, P. F., Buchanan, G. M. and Ryan, P. G. 2009. Habitat use, distribution and breeding ecology of the globally threatened Rudd’s lark and Botha’s lark in eastern South Africa. – Ostrich 80: 19–28.
Margalida, A., Pérez-García, J. M., Afonso, I. and Moreno-Opo, R. 2016. Spatial and temporal movements in Pyrenean bearded vultures Gypaetus barbatus: Integrating movement ecology into conservation practice. - Sci. Rep. 6: srep35746.
Martin II, L. B., Pless, M., Svoboda, J. and Wikelski, M. 2004. Immune activity in temperate and tropical house sparrows: a common-garden experiment. - Ecology 85: 2323–2331.
Martin, L. B., Weil, Z. M. and Nelson, R. J. 2008. Seasonal changes in vertebrate immune activity: mediation by physiological trade-offs. - Philos. Trans. R. Soc. B Biol. Sci. 363: 321–339.
Martin, T. E. 1987. Food as a Limit on Breeding Birds: A Life-History Perspective. - Annu. Rev. Ecol. Syst. 18: 453–487.
Martin, T. E. 1992. Interaction of Nest Predation and Food Limitation in Reproductive Strategies. - In: Power, D. M. (ed), Current Ornithology. Current Ornithology. Springer US, pp. 163–197.
Martin, T. E. 1993a. Nest predation among vegetation layers and habitat types: revising the dogmas. - Am. Nat. 141: 897–913.
Martin, T. E. 1993b. Nest Predation and Nest Sites. - BioScience 43: 523–532. Martin, T. E. 1995. Avian Life History Evolution in Relation to Nest Sites, Nest Predation, and
Food. - Ecol. Monogr. 65: 101–127. Martin, T. E. and Briskie, J. V. 2009. Predation on Dependent Offspring. - Ann. N. Y. Acad. Sci.
1168: 201–217. Martin, T. E., Martin, P. R., Olson, C. R., Heidinger, B. J. And Fontaine, J. J. 2000. Parental care
and clutch sizes in North and South American birds. – Science 287: 1482–1485. Martínez-Padilla, J. and Fargallo, J. A. 2008. Fear in grasslands: the effect of Eurasian kestrels on
skylark abundances. – Naturwissenschaften 95: 391–398. Matson, K. D., Horrocks, N. P. C., Versteegh, M. A. and Tieleman, B. I. 2012. Baseline
haptoglobin concentrations are repeatable and predictive of certain aspects of a subsequent experimentally-induced inflammatory response. - Comp. Biochem. Physiol. A. Mol. Integr. Physiol. 162: 7–15.
Matson, K. D., Ricklefs, R. E. and Klasing, K. C. 2005. A hemolysis–hemagglutination assay for characterizing constitutive innate humoral immunity in wild and domestic birds. - Dev. Comp. Immunol. 29: 275–286.
Matsushita, B., Yang, W., Chen, J., Onda, Y. and Qiu, G. 2007. Sensitivity of the EVI (EVI) and Normalized Difference Vegetation Index (NDVI) to Topographic Effects: A Case Study in High-density Cypress Forest. - Sensors 7: 2636–2651.
Mayfield, H. F. 1975. Suggestions for calculating nest success. – Wilson Bull. 87: 456–466. McLaughlin, R. L. and Montgomerie, R. D. 1990. Flight speeds of parent birds feeding nestlings:
maximization of foraging efficiency or food delivery rate? - Can. J. Zool. 68: 2269–2274. Merilä, J. and Hoffmann, A. A. 2016. Evolutionary Impacts of Climate Change. - Oxf. Res. Encycl.
Environ. Sci. in press. Minderman, J., Reid, J. M., Hughes, M., Denny, M. J. H., Hogg, S., Evans, P. G. H. and
Whittingham, M. J. 2010. Novel environment exploration and home range size in starlings Sturnus vulgaris. - Behav. Ecol. 21: 1321–1329.
Mitchell, G. W., Wheelwright, N. T., Guglielmo, C. G. and Norris, D. R. 2012. Short- and long-term costs of reproduction in a migratory songbird. - Ibis 154: 325–337.
Møller, A. P., Erritzøe, J. and Saino, N. 2003. Seasonal changes in immune response and parasite impact on hosts. - Am. Nat. 161: 657–671.
Moreau, R. E. 1944. Clutch-size: A Comparative Study, with Special Reference to African Birds. - Ibis 86: 286–347.
Moreau, R. E. 1950. The Breeding Seasons of African Birds— 1. Land Birds. - Ibis 92: 223–267. Moreno, J. 1987. Parental Care in the Wheatear Oenanthe oenanthe: Effects of Nestling Age and
Brood Size. - Ornis Scand. Scand. J. Ornithol. 18: 291–301. Moreno, J. 1989. Body-Mass Variation in Breeding Northern Wheatears: A Field Experiment with
Supplementary Food. - The Condor 91: 178–186. Moreno, J. 1989. Strategies of mass change in breeding birds. - Biol. J. Linn. Soc. 37: 297–310. Moreno‐Rueda, G. 2010. Experimental test of a trade-off between moult and immune response in
house sparrows Passer domesticus. - J. Evol. Biol. 23: 2229–2237. Morganti, M., Assandri, G., Aguirre, J. I., Ramirez, Á., Caffi, M. and Pulido, F. 2017. How
residents behave: home range flexibility and dominance over migrants in a Mediterranean passerine. - Anim. Behav. 123: 293–304.
Morton, E. S. 1971. Nest predation affecting the breeding season of the clay-colored robin, a tropical song bird. – Science 171: 920–921.
Mwangi, J., Ndithia, H. K., Kentie, R., Muchai, M. and Tieleman, B. I. 2018. Nest survival in year-round breeding tropical red-capped larks Calandrella cinerea increases with higher nest abundance but decreases with higher invertebrate availability and rainfall. - J. Avian Biol. 49: e01645.
N Naimi, B. 2015. usdm: uncertainty analysis for species distribution models. – R package ver. 1.1-
15, < https://CRAN.R-project.org/package=usdm >. Nakamura, M. 1995. Territory and group living in the polygynandrous Alpine Accentor Prunella
collaris. - Ibis 137: 477–483. Ndithia, H. K., Bakari, S. N., Matson, K. D., Muchai, M. and Tieleman, B. I. 2017a. Geographical
and temporal variation in environmental conditions affects nestling growth but not immune function in a year-round breeding equatorial lark. - Front. Zool. 14: 28.
Ndithia, H. K., Matson, K. D., Versteegh, M. A., Muchai, M. and Tieleman, B. I. 2017b. Year-round breeding equatorial Larks from three climatically-distinct populations do not use
References
121
Loretto, M.-C., Schuster, R., Itty, C., Marchand, P., Genero, F. and Bugnyar, T. 2017. Fission-fusion dynamics over large distances in raven non-breeders. - Sci. Rep. 7: 380.
Low, M., Arlt, D., Pärt, T. and Öberg, M. 2015. Delayed timing of breeding as a cost of reproduction. - J. Avian Biol. 46: 325–331.
M Macleod, R. and Gosler, A. G. 2006. Capture and mass change: perceived predation risk or
interrupted foraging? - Anim. Behav. 71: 1081–1087. Macleod, R., Barnett, P., Clark, J. A. and Cresswell, W. 2005. Body mass change strategies in
blackbirds Turdus merula: the starvation–predation risk trade-off. - J. Anim. Ecol. 74: 292–302.
Maphisa, D. H., Donald, P. F., Buchanan, G. M. and Ryan, P. G. 2009. Habitat use, distribution and breeding ecology of the globally threatened Rudd’s lark and Botha’s lark in eastern South Africa. – Ostrich 80: 19–28.
Margalida, A., Pérez-García, J. M., Afonso, I. and Moreno-Opo, R. 2016. Spatial and temporal movements in Pyrenean bearded vultures Gypaetus barbatus: Integrating movement ecology into conservation practice. - Sci. Rep. 6: srep35746.
Martin II, L. B., Pless, M., Svoboda, J. and Wikelski, M. 2004. Immune activity in temperate and tropical house sparrows: a common-garden experiment. - Ecology 85: 2323–2331.
Martin, L. B., Weil, Z. M. and Nelson, R. J. 2008. Seasonal changes in vertebrate immune activity: mediation by physiological trade-offs. - Philos. Trans. R. Soc. B Biol. Sci. 363: 321–339.
Martin, T. E. 1987. Food as a Limit on Breeding Birds: A Life-History Perspective. - Annu. Rev. Ecol. Syst. 18: 453–487.
Martin, T. E. 1992. Interaction of Nest Predation and Food Limitation in Reproductive Strategies. - In: Power, D. M. (ed), Current Ornithology. Current Ornithology. Springer US, pp. 163–197.
Martin, T. E. 1993a. Nest predation among vegetation layers and habitat types: revising the dogmas. - Am. Nat. 141: 897–913.
Martin, T. E. 1993b. Nest Predation and Nest Sites. - BioScience 43: 523–532. Martin, T. E. 1995. Avian Life History Evolution in Relation to Nest Sites, Nest Predation, and
Food. - Ecol. Monogr. 65: 101–127. Martin, T. E. and Briskie, J. V. 2009. Predation on Dependent Offspring. - Ann. N. Y. Acad. Sci.
1168: 201–217. Martin, T. E., Martin, P. R., Olson, C. R., Heidinger, B. J. And Fontaine, J. J. 2000. Parental care
and clutch sizes in North and South American birds. – Science 287: 1482–1485. Martínez-Padilla, J. and Fargallo, J. A. 2008. Fear in grasslands: the effect of Eurasian kestrels on
skylark abundances. – Naturwissenschaften 95: 391–398. Matson, K. D., Horrocks, N. P. C., Versteegh, M. A. and Tieleman, B. I. 2012. Baseline
haptoglobin concentrations are repeatable and predictive of certain aspects of a subsequent experimentally-induced inflammatory response. - Comp. Biochem. Physiol. A. Mol. Integr. Physiol. 162: 7–15.
Matson, K. D., Ricklefs, R. E. and Klasing, K. C. 2005. A hemolysis–hemagglutination assay for characterizing constitutive innate humoral immunity in wild and domestic birds. - Dev. Comp. Immunol. 29: 275–286.
Matsushita, B., Yang, W., Chen, J., Onda, Y. and Qiu, G. 2007. Sensitivity of the EVI (EVI) and Normalized Difference Vegetation Index (NDVI) to Topographic Effects: A Case Study in High-density Cypress Forest. - Sensors 7: 2636–2651.
Mayfield, H. F. 1975. Suggestions for calculating nest success. – Wilson Bull. 87: 456–466. McLaughlin, R. L. and Montgomerie, R. D. 1990. Flight speeds of parent birds feeding nestlings:
maximization of foraging efficiency or food delivery rate? - Can. J. Zool. 68: 2269–2274. Merilä, J. and Hoffmann, A. A. 2016. Evolutionary Impacts of Climate Change. - Oxf. Res. Encycl.
Environ. Sci. in press. Minderman, J., Reid, J. M., Hughes, M., Denny, M. J. H., Hogg, S., Evans, P. G. H. and
Whittingham, M. J. 2010. Novel environment exploration and home range size in starlings Sturnus vulgaris. - Behav. Ecol. 21: 1321–1329.
Mitchell, G. W., Wheelwright, N. T., Guglielmo, C. G. and Norris, D. R. 2012. Short- and long-term costs of reproduction in a migratory songbird. - Ibis 154: 325–337.
Møller, A. P., Erritzøe, J. and Saino, N. 2003. Seasonal changes in immune response and parasite impact on hosts. - Am. Nat. 161: 657–671.
Moreau, R. E. 1944. Clutch-size: A Comparative Study, with Special Reference to African Birds. - Ibis 86: 286–347.
Moreau, R. E. 1950. The Breeding Seasons of African Birds— 1. Land Birds. - Ibis 92: 223–267. Moreno, J. 1987. Parental Care in the Wheatear Oenanthe oenanthe: Effects of Nestling Age and
Brood Size. - Ornis Scand. Scand. J. Ornithol. 18: 291–301. Moreno, J. 1989. Body-Mass Variation in Breeding Northern Wheatears: A Field Experiment with
Supplementary Food. - The Condor 91: 178–186. Moreno, J. 1989. Strategies of mass change in breeding birds. - Biol. J. Linn. Soc. 37: 297–310. Moreno‐Rueda, G. 2010. Experimental test of a trade-off between moult and immune response in
house sparrows Passer domesticus. - J. Evol. Biol. 23: 2229–2237. Morganti, M., Assandri, G., Aguirre, J. I., Ramirez, Á., Caffi, M. and Pulido, F. 2017. How
residents behave: home range flexibility and dominance over migrants in a Mediterranean passerine. - Anim. Behav. 123: 293–304.
Morton, E. S. 1971. Nest predation affecting the breeding season of the clay-colored robin, a tropical song bird. – Science 171: 920–921.
Mwangi, J., Ndithia, H. K., Kentie, R., Muchai, M. and Tieleman, B. I. 2018. Nest survival in year-round breeding tropical red-capped larks Calandrella cinerea increases with higher nest abundance but decreases with higher invertebrate availability and rainfall. - J. Avian Biol. 49: e01645.
N Naimi, B. 2015. usdm: uncertainty analysis for species distribution models. – R package ver. 1.1-
15, < https://CRAN.R-project.org/package=usdm >. Nakamura, M. 1995. Territory and group living in the polygynandrous Alpine Accentor Prunella
collaris. - Ibis 137: 477–483. Ndithia, H. K., Bakari, S. N., Matson, K. D., Muchai, M. and Tieleman, B. I. 2017a. Geographical
and temporal variation in environmental conditions affects nestling growth but not immune function in a year-round breeding equatorial lark. - Front. Zool. 14: 28.
Ndithia, H. K., Matson, K. D., Versteegh, M. A., Muchai, M. and Tieleman, B. I. 2017b. Year-round breeding equatorial Larks from three climatically-distinct populations do not use
References
122
rainfall, temperature or invertebrate biomass to time reproduction. - PLOS ONE 12: e0175275.
Nelson, R. J. and Demas, G. E. 1996. Seasonal Changes in Immune Function. - Q. Rev. Biol. 71: 511–548.
Nelson, R. J., Badura, L. L. and Goldman, B. D. 1990. Mechanisms of Seasonal Cycles of Behavior.: 30.
Newmark, W. D. and Stanley, T. R. 2011. Habitat fragmentation reduces nest survival in an Afrotropical bird community in a biodiversity hotspot. – Proc. Natl Acad. Sci. USA 108: 11488–11493.
Newmark, W. D., Mkongewa, V. J. and Sobek, A. D. 2010. Ranging behavior and habitat selection of terrestrial insectivorous birds in north-east Tanzania: implications for corridor design in the Eastern Arc Mountains. - Anim. Conserv. 13: 474–482.
Nilsen, E. B., Pedersen, S. and Linnell, J. D. C. 2008. Can minimum convex polygon home ranges be used to draw biologically meaningful conclusions? - Ecol. Res. 23: 635–639.
Nilsson, J.-A. and Svensson, E. 1993. Energy Constraints and Ultimate Decisions During Egg-Laying in the Blue Tit. - Ecology 74: 244–251.
Nilsson, J.-Ǻke and Svensson, E. 1996. The cost of reproduction: a new link between current reproductive effort and future reproductive success. - Proc R Soc Lond B 263: 711–714.
Norris, K. and Evans, M. R. 2000. Ecological immunology: life history trade-offs and immune defense in birds. - Behav. Ecol. 11: 19–26.
Nwaogu, C. J., Cresswell, W., Versteegh, M. A. and Tieleman, B. I. 2019. Seasonal differences in baseline innate immune function are better explained by environment than annual cycle stage in a year-round breeding tropical songbird. - J. Anim. Ecol. in press.
Nwaogu, C. J., Dietz, M. W., Tieleman, B. I. and Cresswell, W. 2017. Breeding limits foraging time: evidence of interrupted foraging response from body mass variation in a tropical environment. - J. Avian Biol. 48: 563–569.
Nwaogu, C. J., Tieleman, B. I. and Cresswell, W. 2018. Weak breeding seasonality of a songbird in a seasonally arid tropical environment arises from individual flexibility and strongly seasonal moult. - Ibis in press.
O Öberg, M., Arlt, D., Pärt, T., Laugen, A. T., Eggers, S. and Low, M. 2015. Rainfall during parental
care reduces reproductive and survival components of fitness in a passerine bird. – Ecol. Evol. 5: 345–356.
Odum, E. P. and Kuenzler, E. J. 1955. Measurement of territory and home range size in birds. - Auk 72: 128–137.
Ofstad, E. G., Herfindal, I., Solberg, E. J. and Sæther, B.-E. 2016. Home ranges, habitat and body mass: simple correlates of home range size in ungulates. - Proc R Soc B 283: 20161234.
Ogalleh, S. A., Vogl, C. R., Eitzinger, J. and Hauser, M. 2012. Local Perceptions and Responses to Climate Change and Variability: The Case of Laikipia District, Kenya. - Sustainability 4: 3302–3325.
Oniki, Y. 1979. Is Nesting Success of Birds Low in the Tropics? - Biotropica 11: 60–69. Orians, G. H. and Wittenberger, J. F. 1991. Spatial and Temporal Scales in Habitat Selection. -
Am. Nat. 137: S29–S49. P
Pap, P. L., Vágási, C. I., Tökölyi, J., Czirják, G. Á. and Barta, Z. 2010. Variation in Haematological Indices and Immune Function During the Annual Cycle in the Great Tit Parus major. - Ardea 98: 105–112.
Paxton, E. H., Camp, R. J., Gorresen, P. M., Crampton, L. H., Leonard, D. L. and VanderWerf, E. A. 2016. Collapsing avian community on a Hawaiian island. - Sci. Adv. 2: e1600029.
Payne, C. J., Scott, T. R., Dick, J. W. and Glick, B. 1990. Immunity to Pasteurella multocida in Protein-Deficient Chickens. - Poult. Sci. 69: 2134–2142.
Peig, J. and Green, A. J. 2009. New perspectives for estimating body condition from mass/length data: the scaled mass index as an alternative method. - Oikos 118: 1883–1891.
Perfito, N., Zann, R. A., Bentley, G. E. and Hau, M. 2007. Opportunism at work: habitat predictability affects reproductive readiness in free-living zebra finches. - Funct. Ecol. 21: 291–301.
Perrins, C. M. 1970. The Timing of Birds‘ Breeding Seasons. - Ibis 112: 242–255. Picker, M., Griffiths, C. and Weaving, A. 2003. Field guide to insects of South Africa. – Struik
Publishers. Piersma, T. and Drent, J. 2003. Phenotypic flexibility and the evolution of organismal design. -
Trends Ecol. Evol. 18: 228–233. Pigeon, G., Baeta, R., Bélisle, M., Garant, D. and Pelletier, F. 2012. Effects of agricultural
intensification and temperature on immune response to phytohemagglutinin in Tree Swallows Tachycineta bicolor. - Can. J. Zool. 91: 56–63.
Pimentel, R. and Hansbauer, M. 2013. A comparison of five techniques for attaching radio‑transmitters to tropical passerine birds. - Rev. Bras. Ornitol. - Braz. J. Ornithol. 16: 6.
Pol, M. van de, Bailey, L. D., McLean, N., Rijsdijk, L., Lawson, C. R. and Brouwer, L. Identifying the best climatic predictors in ecology and evolution. - Methods Ecol. Evol. 7: 1246–1257.
Polak, M. 2016. Nest survival patterns in Eurasian bittern: effect of nest age, time and habitat variables. – PeerJ 4: e2047.
Praus, L., Hegemann, A., Tieleman, B. I. and Weidinger, K. 2014. Predators and predation rates of skylark Alauda arvensis and woodlark Lullula arborea nests in a semi-natural area in the Netherlands. – Ardea 102: 87–94.
Preston, K. L. and Rotenberry, J. T. 2006. Independent effects of food and predator-mediated processes on annual fecundity in a songbird. – Ecology 87: 160–168.
Price, B., McAlpine, C. A., Kutt, A. S., Ward, D., Phinn, S. R. and Ludwig, J. A. 2013. Disentangling How Landscape Spatial and Temporal Heterogeneity Affects Savanna Birds. - PLOS ONE 8: e74333.
R R Core Team 2016. R: A language and environment for statistical computing. - R Foundation for
Statistical Computing. Radford, A. N., McCleery, R. H., Woodburn, R. J. W. And Morecroft, M. D. 2001. Activity
patterns of parent great tits Parus major feeding their young during rainfall. – Bird Study. 48: 214–220.
Ratikainen, I. I. and Wright, J. 2013. Adaptive management of body mass by Siberian jays. - Anim. Behav. 85: 427–434.
Rauw, W. M. 2012. Immune response from a resource allocation perspective. - Front. Genet. in press.
References
123
rainfall, temperature or invertebrate biomass to time reproduction. - PLOS ONE 12: e0175275.
Nelson, R. J. and Demas, G. E. 1996. Seasonal Changes in Immune Function. - Q. Rev. Biol. 71: 511–548.
Nelson, R. J., Badura, L. L. and Goldman, B. D. 1990. Mechanisms of Seasonal Cycles of Behavior.: 30.
Newmark, W. D. and Stanley, T. R. 2011. Habitat fragmentation reduces nest survival in an Afrotropical bird community in a biodiversity hotspot. – Proc. Natl Acad. Sci. USA 108: 11488–11493.
Newmark, W. D., Mkongewa, V. J. and Sobek, A. D. 2010. Ranging behavior and habitat selection of terrestrial insectivorous birds in north-east Tanzania: implications for corridor design in the Eastern Arc Mountains. - Anim. Conserv. 13: 474–482.
Nilsen, E. B., Pedersen, S. and Linnell, J. D. C. 2008. Can minimum convex polygon home ranges be used to draw biologically meaningful conclusions? - Ecol. Res. 23: 635–639.
Nilsson, J.-A. and Svensson, E. 1993. Energy Constraints and Ultimate Decisions During Egg-Laying in the Blue Tit. - Ecology 74: 244–251.
Nilsson, J.-Ǻke and Svensson, E. 1996. The cost of reproduction: a new link between current reproductive effort and future reproductive success. - Proc R Soc Lond B 263: 711–714.
Norris, K. and Evans, M. R. 2000. Ecological immunology: life history trade-offs and immune defense in birds. - Behav. Ecol. 11: 19–26.
Nwaogu, C. J., Cresswell, W., Versteegh, M. A. and Tieleman, B. I. 2019. Seasonal differences in baseline innate immune function are better explained by environment than annual cycle stage in a year-round breeding tropical songbird. - J. Anim. Ecol. in press.
Nwaogu, C. J., Dietz, M. W., Tieleman, B. I. and Cresswell, W. 2017. Breeding limits foraging time: evidence of interrupted foraging response from body mass variation in a tropical environment. - J. Avian Biol. 48: 563–569.
Nwaogu, C. J., Tieleman, B. I. and Cresswell, W. 2018. Weak breeding seasonality of a songbird in a seasonally arid tropical environment arises from individual flexibility and strongly seasonal moult. - Ibis in press.
O Öberg, M., Arlt, D., Pärt, T., Laugen, A. T., Eggers, S. and Low, M. 2015. Rainfall during parental
care reduces reproductive and survival components of fitness in a passerine bird. – Ecol. Evol. 5: 345–356.
Odum, E. P. and Kuenzler, E. J. 1955. Measurement of territory and home range size in birds. - Auk 72: 128–137.
Ofstad, E. G., Herfindal, I., Solberg, E. J. and Sæther, B.-E. 2016. Home ranges, habitat and body mass: simple correlates of home range size in ungulates. - Proc R Soc B 283: 20161234.
Ogalleh, S. A., Vogl, C. R., Eitzinger, J. and Hauser, M. 2012. Local Perceptions and Responses to Climate Change and Variability: The Case of Laikipia District, Kenya. - Sustainability 4: 3302–3325.
Oniki, Y. 1979. Is Nesting Success of Birds Low in the Tropics? - Biotropica 11: 60–69. Orians, G. H. and Wittenberger, J. F. 1991. Spatial and Temporal Scales in Habitat Selection. -
Am. Nat. 137: S29–S49. P
Pap, P. L., Vágási, C. I., Tökölyi, J., Czirják, G. Á. and Barta, Z. 2010. Variation in Haematological Indices and Immune Function During the Annual Cycle in the Great Tit Parus major. - Ardea 98: 105–112.
Paxton, E. H., Camp, R. J., Gorresen, P. M., Crampton, L. H., Leonard, D. L. and VanderWerf, E. A. 2016. Collapsing avian community on a Hawaiian island. - Sci. Adv. 2: e1600029.
Payne, C. J., Scott, T. R., Dick, J. W. and Glick, B. 1990. Immunity to Pasteurella multocida in Protein-Deficient Chickens. - Poult. Sci. 69: 2134–2142.
Peig, J. and Green, A. J. 2009. New perspectives for estimating body condition from mass/length data: the scaled mass index as an alternative method. - Oikos 118: 1883–1891.
Perfito, N., Zann, R. A., Bentley, G. E. and Hau, M. 2007. Opportunism at work: habitat predictability affects reproductive readiness in free-living zebra finches. - Funct. Ecol. 21: 291–301.
Perrins, C. M. 1970. The Timing of Birds‘ Breeding Seasons. - Ibis 112: 242–255. Picker, M., Griffiths, C. and Weaving, A. 2003. Field guide to insects of South Africa. – Struik
Publishers. Piersma, T. and Drent, J. 2003. Phenotypic flexibility and the evolution of organismal design. -
Trends Ecol. Evol. 18: 228–233. Pigeon, G., Baeta, R., Bélisle, M., Garant, D. and Pelletier, F. 2012. Effects of agricultural
intensification and temperature on immune response to phytohemagglutinin in Tree Swallows Tachycineta bicolor. - Can. J. Zool. 91: 56–63.
Pimentel, R. and Hansbauer, M. 2013. A comparison of five techniques for attaching radio‑transmitters to tropical passerine birds. - Rev. Bras. Ornitol. - Braz. J. Ornithol. 16: 6.
Pol, M. van de, Bailey, L. D., McLean, N., Rijsdijk, L., Lawson, C. R. and Brouwer, L. Identifying the best climatic predictors in ecology and evolution. - Methods Ecol. Evol. 7: 1246–1257.
Polak, M. 2016. Nest survival patterns in Eurasian bittern: effect of nest age, time and habitat variables. – PeerJ 4: e2047.
Praus, L., Hegemann, A., Tieleman, B. I. and Weidinger, K. 2014. Predators and predation rates of skylark Alauda arvensis and woodlark Lullula arborea nests in a semi-natural area in the Netherlands. – Ardea 102: 87–94.
Preston, K. L. and Rotenberry, J. T. 2006. Independent effects of food and predator-mediated processes on annual fecundity in a songbird. – Ecology 87: 160–168.
Price, B., McAlpine, C. A., Kutt, A. S., Ward, D., Phinn, S. R. and Ludwig, J. A. 2013. Disentangling How Landscape Spatial and Temporal Heterogeneity Affects Savanna Birds. - PLOS ONE 8: e74333.
R R Core Team 2016. R: A language and environment for statistical computing. - R Foundation for
Statistical Computing. Radford, A. N., McCleery, R. H., Woodburn, R. J. W. And Morecroft, M. D. 2001. Activity
patterns of parent great tits Parus major feeding their young during rainfall. – Bird Study. 48: 214–220.
Ratikainen, I. I. and Wright, J. 2013. Adaptive management of body mass by Siberian jays. - Anim. Behav. 85: 427–434.
Rauw, W. M. 2012. Immune response from a resource allocation perspective. - Front. Genet. in press.
References
124
Richardson, D. S., Jury, F. L., Blaakmeer, K., Komdeur, J. and Burke, T. 2001. Parentage assignment and extra-group paternity in a cooperative breeder: the Seychelles warbler (Acrocephalus sechellensis). - Mol. Ecol. 10: 2263–2273.
Ricklefs, R. E. 1969. An analysis of nesting mortality in birds. – Smithsonian Contrib. Zool. 9: 1-48.
Ricklefs, R. E. and Wikelski, M. 2002. The physiology/life-history nexus. - Trends Ecol. Evol. 17: 462–468.
Rishworth, G. M. and Pistorius, P. A. 2015. Protection and provisioning: the role of parental behaviour in terms of chick growth and survival in a pelagic seabird. – Mar. Ecol. Prog. Ser. 530: 153–162.
Robbins, C. T. 1981. Estimation of the Relative Protein Cost of Reproduction in Birds. - The Condor 83: 177–179.
Robinson, W. D., Robinson, T. R., Robinson, S. K. and Brawn, J. D. 2000. Nesting success of understory forest birds in central Panama. – J. Avian Biol. 31: 151–164.
Rolando, A. 1998. Factors affecting movements and home ranges in the jay (Garrulus glandarius). - J. Zool. 246: 249–257.
Roman, Y., Bomsel-Demontoy, M.-C., Levrier, J., Ordonneau, D., Chaste-Duvernoy, D. and Saint Jalme, M. 2009. Influence of molt on plasma protein electrophoretic patterns in Bar-headed geese (anser indicus). - J. Wildl. Dis. 45: 661–671.
Rothenbach, C. A. and Kelly, J. P. 2012. The Parental Dilemma under Variable Predation Pressure: Adaptive Variation in Nest Attendance by Great Egrets. - The Condor 114: 90–99.
Rubenstein, D. R., Parlow, A. F., Hutch, C. R. and Martin, L. B. 2008. Environmental and hormonal correlates of immune activity in a cooperatively breeding tropical bird. - Gen. Comp. Endocrinol. 159: 10–15.
Ruf, T. and Geiser, F. 2015. Daily torpor and hibernation in birds and mammals. - Biol. Rev. 90: 891–926.
S Saïd, S., Gaillard, J.-M., Widmer, O., Débias, F., Bourgoin, G., Delorme, D. and Roux, C. 2009.
What shapes intra-specific variation in home range size? A case study of female roe deer. - Oikos 118: 1299–1306.
Salgado-Ortiz, J., Marra, P. P., Sillett, T. S. and Robertson, R. J. 2008. Breeding ecology of the mangrove Warbler ( Dendroica petechia BRYANTI ) and comparative life history of the Yellow warbler subspecies complex. - The Auk 125: 402–410.
Salkeld, D. J., Trivedi, M. and Schwarzkopf, L. 2008. Parasite loads are higher in the tropics: temperate to tropical variation in a single host-parasite system. - Ecography 31: 538–544.
Schmidt, K. A. and Whelan, C. J. 1999. Nest predation on woodland songbirds: when is nest predation density dependent? – Oikos 87: 65–74.
Schmidt, K. A., Goheen, J. R. and Naumann, R. 2001. Incidental nest predation in songbirds: behavioral indicators detect ecological scales and processes. – Ecology 82: 2937–2947.
Scott, J. G., Lovallo, M. J., Storm, G. L. and Tzilkowski, W. M. 1998. Summer Habitat Use by Ruffed Grouse with Broods in Central Pennsylvania (Uso de Hábitat Veraniego en la Pennsylvania Central por Bonasa umbellus con Crías). - J. Field Ornithol. 69: 474–485.
Seaman, D. E., Millspaugh, J. J., Kernohan, B. J., Brundige, G. C., Raedeke, K. J. and Gitzen, R. A. 1999. Effects of Sample Size on Kernel Home Range Estimates. - J. Wildl. Manag. 63: 739–747.
Sergio, F., Blas, J., López, L., Tanferna, A., Díaz-Delgado, R., Donázar, J. A. and Hiraldo, F. 2011. Coping with uncertainty: breeding adjustments to an unpredictable environment in an opportunistic raptor. - Oecologia 166: 79–90.
Shaffer, T. L. and Burger, A. E. 2004. A unified approach to analyzing nest success. – Auk 121: 526–540.
Sharp, P. J. 1996. Strategies in avian breeding cycles. - Anim. Reprod. Sci. 42: 505–513. Sheldon, B. C. and Verhulst, S. 1996. Ecological immunology: costly parasite defences and trade-
offs in evolutionary ecology. - Trends Ecol. Evol. 11: 317–321. Shiao, M.-T., Chuang, M. C., Yuan, H. W. and Wang, Y. 2015. Effects of weather variation on
the timing and success of breeding in two cavity-nesting species in a subtropical montane forest in Taiwan. – Auk 132: 671–684.
Shine, R. and Brown, G. P. 2008. Adapting to the unpredictable: reproductive biology of vertebrates in the Australian wet–dry tropics. - Philos. Trans. R. Soc. B Biol. Sci. 363: 363–373.
Shustack, D. P. and Rodewald, A. D. 2011. Nest predation reduces benefits to early clutch initiation in northern cardinals Cardinalis cardinalis. – J. Avian Biol. 42: 204–209.
Siegel, H. S. and Latimer, J. W. 1984. Interaction of high temperature and Salmonella pullorum antigen concentration on serum agglutinin and corticosteroid responses in white rock chickens. - Poult. Sci. 63: 2483–2491.
Siikamäki, P. 1995. Are large clutches costly to incubate: the case of the pied flycatcher. – J. Avian Biol. 26: 76–80.
Siikamäki, P. 1996. Nestling growth and mortality of pied flycatchers Ficedula hypoleuca in relation to weather and breeding effort. – Ibis 138: 471–478.
Sild, E. and Hõrak, P. 2009. Nitric oxide production: an easily measurable condition index for vertebrates. - Behav. Ecol. Sociobiol. 63: 959–966.
Silk, M. J., Croft, D. P., Tregenza, T. and Bearhop, S. 2014. The importance of fission–fusion social group dynamics in birds. - Ibis 156: 701–715.
Simon, A., Thomas, D., Blondel, J., Perret, P. and Lambrechts, M. M. 2004. Physiological ecology of Mediterranean blue tits (Parus caeruleus L.): effects of ectoparasites (Protocalliphora spp.) and food abundance on metabolic capacity of nestlings. - Physiol. Biochem. Zool. PBZ 77: 492–501.
Simons, L. S. and Martin, T. E. 1990. Food limitation of avian reproduction: an experiment with the cactus wren. – Ecology 71: 869–876.
Skutch, A. F. 1949. Do Tropical Birds Rear as Many Young as They Can Nourish ? - Ibis 91: 430–455.
Skutch, A. F. 1966. A Breeding Bird Census and Nesting Success in Central America. - Ibis 108: 1–16.
Skutch, A. F. 1985. Clutch Size, Nesting Success, and Predation on Nests of Neotropical Birds, Reviewed. - Ornithol. Monogr.: 575–594.
Skutch, A. F. 2008. The nesting seasons of Central American birds in relation to climate and food supply. - Ibis 92: 185–222.
Soderstrom, B. 1999. Artificial nest predation rates in tropical and temperate forests: a review of the effects of edge and nest site. – Ecography 22: 455–463.
Sofaer, H. R., Sillett, T. S., Langin, K. M., Morrison, S. A. And Ghalambor, C. K. 2014. Partitioning the sources of demographic variation reveals density-dependent nest predation in an island bird population. – Ecol. Evol. 4: 2738–2748.
References
125
Richardson, D. S., Jury, F. L., Blaakmeer, K., Komdeur, J. and Burke, T. 2001. Parentage assignment and extra-group paternity in a cooperative breeder: the Seychelles warbler (Acrocephalus sechellensis). - Mol. Ecol. 10: 2263–2273.
Ricklefs, R. E. 1969. An analysis of nesting mortality in birds. – Smithsonian Contrib. Zool. 9: 1-48.
Ricklefs, R. E. and Wikelski, M. 2002. The physiology/life-history nexus. - Trends Ecol. Evol. 17: 462–468.
Rishworth, G. M. and Pistorius, P. A. 2015. Protection and provisioning: the role of parental behaviour in terms of chick growth and survival in a pelagic seabird. – Mar. Ecol. Prog. Ser. 530: 153–162.
Robbins, C. T. 1981. Estimation of the Relative Protein Cost of Reproduction in Birds. - The Condor 83: 177–179.
Robinson, W. D., Robinson, T. R., Robinson, S. K. and Brawn, J. D. 2000. Nesting success of understory forest birds in central Panama. – J. Avian Biol. 31: 151–164.
Rolando, A. 1998. Factors affecting movements and home ranges in the jay (Garrulus glandarius). - J. Zool. 246: 249–257.
Roman, Y., Bomsel-Demontoy, M.-C., Levrier, J., Ordonneau, D., Chaste-Duvernoy, D. and Saint Jalme, M. 2009. Influence of molt on plasma protein electrophoretic patterns in Bar-headed geese (anser indicus). - J. Wildl. Dis. 45: 661–671.
Rothenbach, C. A. and Kelly, J. P. 2012. The Parental Dilemma under Variable Predation Pressure: Adaptive Variation in Nest Attendance by Great Egrets. - The Condor 114: 90–99.
Rubenstein, D. R., Parlow, A. F., Hutch, C. R. and Martin, L. B. 2008. Environmental and hormonal correlates of immune activity in a cooperatively breeding tropical bird. - Gen. Comp. Endocrinol. 159: 10–15.
Ruf, T. and Geiser, F. 2015. Daily torpor and hibernation in birds and mammals. - Biol. Rev. 90: 891–926.
S Saïd, S., Gaillard, J.-M., Widmer, O., Débias, F., Bourgoin, G., Delorme, D. and Roux, C. 2009.
What shapes intra-specific variation in home range size? A case study of female roe deer. - Oikos 118: 1299–1306.
Salgado-Ortiz, J., Marra, P. P., Sillett, T. S. and Robertson, R. J. 2008. Breeding ecology of the mangrove Warbler ( Dendroica petechia BRYANTI ) and comparative life history of the Yellow warbler subspecies complex. - The Auk 125: 402–410.
Salkeld, D. J., Trivedi, M. and Schwarzkopf, L. 2008. Parasite loads are higher in the tropics: temperate to tropical variation in a single host-parasite system. - Ecography 31: 538–544.
Schmidt, K. A. and Whelan, C. J. 1999. Nest predation on woodland songbirds: when is nest predation density dependent? – Oikos 87: 65–74.
Schmidt, K. A., Goheen, J. R. and Naumann, R. 2001. Incidental nest predation in songbirds: behavioral indicators detect ecological scales and processes. – Ecology 82: 2937–2947.
Scott, J. G., Lovallo, M. J., Storm, G. L. and Tzilkowski, W. M. 1998. Summer Habitat Use by Ruffed Grouse with Broods in Central Pennsylvania (Uso de Hábitat Veraniego en la Pennsylvania Central por Bonasa umbellus con Crías). - J. Field Ornithol. 69: 474–485.
Seaman, D. E., Millspaugh, J. J., Kernohan, B. J., Brundige, G. C., Raedeke, K. J. and Gitzen, R. A. 1999. Effects of Sample Size on Kernel Home Range Estimates. - J. Wildl. Manag. 63: 739–747.
Sergio, F., Blas, J., López, L., Tanferna, A., Díaz-Delgado, R., Donázar, J. A. and Hiraldo, F. 2011. Coping with uncertainty: breeding adjustments to an unpredictable environment in an opportunistic raptor. - Oecologia 166: 79–90.
Shaffer, T. L. and Burger, A. E. 2004. A unified approach to analyzing nest success. – Auk 121: 526–540.
Sharp, P. J. 1996. Strategies in avian breeding cycles. - Anim. Reprod. Sci. 42: 505–513. Sheldon, B. C. and Verhulst, S. 1996. Ecological immunology: costly parasite defences and trade-
offs in evolutionary ecology. - Trends Ecol. Evol. 11: 317–321. Shiao, M.-T., Chuang, M. C., Yuan, H. W. and Wang, Y. 2015. Effects of weather variation on
the timing and success of breeding in two cavity-nesting species in a subtropical montane forest in Taiwan. – Auk 132: 671–684.
Shine, R. and Brown, G. P. 2008. Adapting to the unpredictable: reproductive biology of vertebrates in the Australian wet–dry tropics. - Philos. Trans. R. Soc. B Biol. Sci. 363: 363–373.
Shustack, D. P. and Rodewald, A. D. 2011. Nest predation reduces benefits to early clutch initiation in northern cardinals Cardinalis cardinalis. – J. Avian Biol. 42: 204–209.
Siegel, H. S. and Latimer, J. W. 1984. Interaction of high temperature and Salmonella pullorum antigen concentration on serum agglutinin and corticosteroid responses in white rock chickens. - Poult. Sci. 63: 2483–2491.
Siikamäki, P. 1995. Are large clutches costly to incubate: the case of the pied flycatcher. – J. Avian Biol. 26: 76–80.
Siikamäki, P. 1996. Nestling growth and mortality of pied flycatchers Ficedula hypoleuca in relation to weather and breeding effort. – Ibis 138: 471–478.
Sild, E. and Hõrak, P. 2009. Nitric oxide production: an easily measurable condition index for vertebrates. - Behav. Ecol. Sociobiol. 63: 959–966.
Silk, M. J., Croft, D. P., Tregenza, T. and Bearhop, S. 2014. The importance of fission–fusion social group dynamics in birds. - Ibis 156: 701–715.
Simon, A., Thomas, D., Blondel, J., Perret, P. and Lambrechts, M. M. 2004. Physiological ecology of Mediterranean blue tits (Parus caeruleus L.): effects of ectoparasites (Protocalliphora spp.) and food abundance on metabolic capacity of nestlings. - Physiol. Biochem. Zool. PBZ 77: 492–501.
Simons, L. S. and Martin, T. E. 1990. Food limitation of avian reproduction: an experiment with the cactus wren. – Ecology 71: 869–876.
Skutch, A. F. 1949. Do Tropical Birds Rear as Many Young as They Can Nourish ? - Ibis 91: 430–455.
Skutch, A. F. 1966. A Breeding Bird Census and Nesting Success in Central America. - Ibis 108: 1–16.
Skutch, A. F. 1985. Clutch Size, Nesting Success, and Predation on Nests of Neotropical Birds, Reviewed. - Ornithol. Monogr.: 575–594.
Skutch, A. F. 2008. The nesting seasons of Central American birds in relation to climate and food supply. - Ibis 92: 185–222.
Soderstrom, B. 1999. Artificial nest predation rates in tropical and temperate forests: a review of the effects of edge and nest site. – Ecography 22: 455–463.
Sofaer, H. R., Sillett, T. S., Langin, K. M., Morrison, S. A. And Ghalambor, C. K. 2014. Partitioning the sources of demographic variation reveals density-dependent nest predation in an island bird population. – Ecol. Evol. 4: 2738–2748.
References
126
Spaans, B., Blijleven, H. J., Popov, I. U., Rykhlikova, M. E. And Ebbinge, B. S. 1998. Dark-bellied brent geese Branta bernicla bernicla forego breeding when Arctic foxes Alopex lagopus are present during nest initiation. – Ardea 86: 11–20.
Spanhove, T., Callens, T., Hallmann, C. A., Pellikka, P. and Lens, L. 2014. Nest predation in Afrotropical forest fragments shaped by inverse edge effects, timing of nest initiation and vegetation structure. – J. Ornithol. 155: 411–420.
Spanhove, T., Lehouck, V., Boets, P. and Lens, L. 2009. Forest fragmentation relaxes natural nest predation in an Afromontane forest. – Anim. Conserv. 12: 267–275.
Speakman, J. 2018. The evolution of body fatness: Trading off disease and predation risk. - J. Exp. Biol. 221: jeb167254.
Stearns, S. C. 1992. The Evolution of Life Histories. - Oxford University Press. Stillwell, R. C., Blanckenhorn, W. U., Teder, T., Davidowitz, G. and Fox, C. W. 2010. Sex
Differences in Phenotypic Plasticity Affect Variation in Sexual Size Dimorphism in Insects: From Physiology to Evolution. - Annu. Rev. Entomol. 55: 227–245.
Strandin, T., Babayan, S. A. and Forbes, K. M. 2018. Reviewing the effects of food provisioning on wildlife immunity. - Philos. Trans. R. Soc. B Biol. Sci. 373: 20170088.
Stuart, C. T., Stuart, T. and Pereboom, V. 2003. Diet of the bat-eared fox Otocyon megalotis, based on scat analysis, on the Western Escarpment, South Africa. – Canid News 6: 2.
Stutchbury, B. J. M. and Morton, E. S. 2008. Recent advances in the behavioral ecology of tropical birds. – Wilson J. Ornithol. 120: 26–37.
Swaddle, J. P. and Witter, M. S. 1997. The effects of molt on the flight performance, body mass, and behavior of European starlings Sturnus vulgaris: an experimental approach. - Can. J. Zool. 75: 1135–1146.
T Takano, L. L. and Haig, S. M. 2004. Seasonal Movement and Home Range of the Mariana
Common Moorhen. - The Condor 106: 652–663. Thompson, C. F. 2010. Seasonal Metabolic Variation in Birds : Functional and Mechanistic
Correlates. Thomson, A. L. 1950. Factors determining the breeding seasons of birds: an introductory review.
– Ibis 92: 173–184. Tieleman, B. I. 2018. Understanding immune function as a pace of life trait requires environmental
context. - Behav. Ecol. Sociobiol. in press. Tieleman, B. I. and Williams, J. B. 2000. The Adjustment of Avian Metabolic Rates and Water
Fluxes to Desert Environments. - Physiol. Biochem. Zool. 73: 461–479. Tieleman, B. I., Van Noordwijk, H. J. and Williams, J. B. 2008. Nest site selection in a hot desert:
trade-off between microclimate and predation risk. – Condor 110: 116–124. Tökölyi, J., McNamara, J. M., Houston, A. I. and Barta, Z. 2012. Timing of avian reproduction in
unpredictable environments. - Evol. Ecol. 26: 25–42. Tsao, D. C., Takekawa, J. Y., Woo, I., Yee, J. L. and Evens, J. G. 2009. Home Range, Habitat
Selection, and Movements of California Black Rails at Tidal Marshes at San Francisco Bay, California - Ámbito de Hogar, Selección de Hábitat y Movimientos de Laterallus jamaicensis coturniculus en Marismas en la Bahía de San Francisco, California. - The Condor 111: 599–610.
V
van Beest, F. M., Rivrud, I. M., Loe, L. E., Milner, J. M. and Mysterud, A. 2011. What determines variation in home range size across spatiotemporal scales in a large browsing herbivore? - J. Anim. Ecol. 80: 771–785.
van de Pol, M. and Cockburn, A. 2011. Identifying the Critical Climatic Time Window That Affects Trait Expression. - Am. Nat. 177: 698–707.
van de Pol, M., Bailey, L. D., McLean, N., Rijsdijk, L., Lawson, C. R. and Brouwer, L. 2016. Identifying the best climatic predictors in ecology and evolution. - Methods Ecol. Evol. 7: 1246–1257.
Van der Velde, M., Haddrath, O., Verkuil, Y. I., Baker, A. J. and Piersma, T. 2017. New primers for molecular sex identification of waders. - Wader Study 124: xx–xx.
Verhulst, S. and Nilsson, J.-Å. 2008. The timing of birds’ breeding seasons: a review of experiments that manipulated timing of breeding. - Philos. Trans. R. Soc. B Biol. Sci. 363: 399–410.
Versteegh, M. A., Helm, B., Kleynhans, E. J., Gwinner, E. and Tieleman, B. I. 2014. Genetic and phenotypically flexible components of seasonal variation in immune function. - J. Exp. Biol. 217: 1510–1518.
Vickery, P. D., Hunter, M. L. and Wells, J. V. 1992. Evidence of incidental nest predation and its effects on nests of threatened grassland birds. – Oikos 63: 281–288.
Visser, M. E., Noordwijk A. J. van, Tinbergen J. M. and Lessells C. M. 1998. Warmer springs lead to mistimed reproduction in great tits Parus major. - Proc. R. Soc. Lond. B Biol. Sci. 265: 1867–1870.
Visser, M. E., te Marvelde, L. and Lof, M. E. 2012. Adaptive phenological mismatches of birds and their food in a warming world. - J. Ornithol. 153: 75–84.
Visser, M. E., te Marvelde, L. and Lof, M. E. 2012. Adaptive phenological mismatches of birds and their food in a warming world. - J. Ornithol. 153: 75–84.
Vleck, C. M. and Priedkalns, J. 1985. Reproduction in zebra finches: Hormone levels and effect of dehydration. - The Condor 87: 37–46.
W Westneat, D. F. 1992. Nesting synchrony by female red-winged blackbirds: effects on predation
and breeding success. – Ecology 73: 2284–2294. White, G. C. and Burnham, K. P. 1999. Program MARK: survival estimation from populations of
marked animals. – Bird Study 46: S120–S139. White, G. C., Garrott, R. A. 1990. Analysis of wildlife radio-tracking data, London UK. Academic
Press Ltd Wickham, H. 2009. ggplot2: Elegant Graphics for Data Analysis. - Springer-Verlag, New York Wiebe, K. L. and Gow, E. A. 2013. Choice of Foraging Habitat by Northern Flickers Reflects
Changes in Availability of their Ant Prey Linked To Ambient Temperature1. - Ecoscience 20: 122–130.
Wikelski, M., Hau, M. and Wingfield, J. C. 2000. Seasonality of Reproduction in a Neotropical Rain Forest Bird. - Ecology 81: 2458–2472.
Wikelski, M., Hau, M., Douglas Robinson, W. and Wingfield, J. C. 2003. Reproductive seasonality of seven neotropical passerine species. - The Condor 105: 683–695.
Wilcoxen, T. E., Horn, D. J., Hogan, B. M., Hubble, C. N., Huber, S. J., Flamm, J., Knott, M., Lundstrom, L., Salik, F., Wassenhove, S. J. and Wrobel, E. R. 2015. Effects of bird-feeding activities on the health of wild birds. - Conserv. Physiol. in press.
References
127
Spaans, B., Blijleven, H. J., Popov, I. U., Rykhlikova, M. E. And Ebbinge, B. S. 1998. Dark-bellied brent geese Branta bernicla bernicla forego breeding when Arctic foxes Alopex lagopus are present during nest initiation. – Ardea 86: 11–20.
Spanhove, T., Callens, T., Hallmann, C. A., Pellikka, P. and Lens, L. 2014. Nest predation in Afrotropical forest fragments shaped by inverse edge effects, timing of nest initiation and vegetation structure. – J. Ornithol. 155: 411–420.
Spanhove, T., Lehouck, V., Boets, P. and Lens, L. 2009. Forest fragmentation relaxes natural nest predation in an Afromontane forest. – Anim. Conserv. 12: 267–275.
Speakman, J. 2018. The evolution of body fatness: Trading off disease and predation risk. - J. Exp. Biol. 221: jeb167254.
Stearns, S. C. 1992. The Evolution of Life Histories. - Oxford University Press. Stillwell, R. C., Blanckenhorn, W. U., Teder, T., Davidowitz, G. and Fox, C. W. 2010. Sex
Differences in Phenotypic Plasticity Affect Variation in Sexual Size Dimorphism in Insects: From Physiology to Evolution. - Annu. Rev. Entomol. 55: 227–245.
Strandin, T., Babayan, S. A. and Forbes, K. M. 2018. Reviewing the effects of food provisioning on wildlife immunity. - Philos. Trans. R. Soc. B Biol. Sci. 373: 20170088.
Stuart, C. T., Stuart, T. and Pereboom, V. 2003. Diet of the bat-eared fox Otocyon megalotis, based on scat analysis, on the Western Escarpment, South Africa. – Canid News 6: 2.
Stutchbury, B. J. M. and Morton, E. S. 2008. Recent advances in the behavioral ecology of tropical birds. – Wilson J. Ornithol. 120: 26–37.
Swaddle, J. P. and Witter, M. S. 1997. The effects of molt on the flight performance, body mass, and behavior of European starlings Sturnus vulgaris: an experimental approach. - Can. J. Zool. 75: 1135–1146.
T Takano, L. L. and Haig, S. M. 2004. Seasonal Movement and Home Range of the Mariana
Common Moorhen. - The Condor 106: 652–663. Thompson, C. F. 2010. Seasonal Metabolic Variation in Birds : Functional and Mechanistic
Correlates. Thomson, A. L. 1950. Factors determining the breeding seasons of birds: an introductory review.
– Ibis 92: 173–184. Tieleman, B. I. 2018. Understanding immune function as a pace of life trait requires environmental
context. - Behav. Ecol. Sociobiol. in press. Tieleman, B. I. and Williams, J. B. 2000. The Adjustment of Avian Metabolic Rates and Water
Fluxes to Desert Environments. - Physiol. Biochem. Zool. 73: 461–479. Tieleman, B. I., Van Noordwijk, H. J. and Williams, J. B. 2008. Nest site selection in a hot desert:
trade-off between microclimate and predation risk. – Condor 110: 116–124. Tökölyi, J., McNamara, J. M., Houston, A. I. and Barta, Z. 2012. Timing of avian reproduction in
unpredictable environments. - Evol. Ecol. 26: 25–42. Tsao, D. C., Takekawa, J. Y., Woo, I., Yee, J. L. and Evens, J. G. 2009. Home Range, Habitat
Selection, and Movements of California Black Rails at Tidal Marshes at San Francisco Bay, California - Ámbito de Hogar, Selección de Hábitat y Movimientos de Laterallus jamaicensis coturniculus en Marismas en la Bahía de San Francisco, California. - The Condor 111: 599–610.
V
van Beest, F. M., Rivrud, I. M., Loe, L. E., Milner, J. M. and Mysterud, A. 2011. What determines variation in home range size across spatiotemporal scales in a large browsing herbivore? - J. Anim. Ecol. 80: 771–785.
van de Pol, M. and Cockburn, A. 2011. Identifying the Critical Climatic Time Window That Affects Trait Expression. - Am. Nat. 177: 698–707.
van de Pol, M., Bailey, L. D., McLean, N., Rijsdijk, L., Lawson, C. R. and Brouwer, L. 2016. Identifying the best climatic predictors in ecology and evolution. - Methods Ecol. Evol. 7: 1246–1257.
Van der Velde, M., Haddrath, O., Verkuil, Y. I., Baker, A. J. and Piersma, T. 2017. New primers for molecular sex identification of waders. - Wader Study 124: xx–xx.
Verhulst, S. and Nilsson, J.-Å. 2008. The timing of birds’ breeding seasons: a review of experiments that manipulated timing of breeding. - Philos. Trans. R. Soc. B Biol. Sci. 363: 399–410.
Versteegh, M. A., Helm, B., Kleynhans, E. J., Gwinner, E. and Tieleman, B. I. 2014. Genetic and phenotypically flexible components of seasonal variation in immune function. - J. Exp. Biol. 217: 1510–1518.
Vickery, P. D., Hunter, M. L. and Wells, J. V. 1992. Evidence of incidental nest predation and its effects on nests of threatened grassland birds. – Oikos 63: 281–288.
Visser, M. E., Noordwijk A. J. van, Tinbergen J. M. and Lessells C. M. 1998. Warmer springs lead to mistimed reproduction in great tits Parus major. - Proc. R. Soc. Lond. B Biol. Sci. 265: 1867–1870.
Visser, M. E., te Marvelde, L. and Lof, M. E. 2012. Adaptive phenological mismatches of birds and their food in a warming world. - J. Ornithol. 153: 75–84.
Visser, M. E., te Marvelde, L. and Lof, M. E. 2012. Adaptive phenological mismatches of birds and their food in a warming world. - J. Ornithol. 153: 75–84.
Vleck, C. M. and Priedkalns, J. 1985. Reproduction in zebra finches: Hormone levels and effect of dehydration. - The Condor 87: 37–46.
W Westneat, D. F. 1992. Nesting synchrony by female red-winged blackbirds: effects on predation
and breeding success. – Ecology 73: 2284–2294. White, G. C. and Burnham, K. P. 1999. Program MARK: survival estimation from populations of
marked animals. – Bird Study 46: S120–S139. White, G. C., Garrott, R. A. 1990. Analysis of wildlife radio-tracking data, London UK. Academic
Press Ltd Wickham, H. 2009. ggplot2: Elegant Graphics for Data Analysis. - Springer-Verlag, New York Wiebe, K. L. and Gow, E. A. 2013. Choice of Foraging Habitat by Northern Flickers Reflects
Changes in Availability of their Ant Prey Linked To Ambient Temperature1. - Ecoscience 20: 122–130.
Wikelski, M., Hau, M. and Wingfield, J. C. 2000. Seasonality of Reproduction in a Neotropical Rain Forest Bird. - Ecology 81: 2458–2472.
Wikelski, M., Hau, M., Douglas Robinson, W. and Wingfield, J. C. 2003. Reproductive seasonality of seven neotropical passerine species. - The Condor 105: 683–695.
Wilcoxen, T. E., Horn, D. J., Hogan, B. M., Hubble, C. N., Huber, S. J., Flamm, J., Knott, M., Lundstrom, L., Salik, F., Wassenhove, S. J. and Wrobel, E. R. 2015. Effects of bird-feeding activities on the health of wild birds. - Conserv. Physiol. in press.
References
128
Wiley, R. H. and Wiley, M. S. 1980. Spacing and Timing in the Nesting Ecology of a Tropical Blackbird: Comparison of Populations in Different Environments. - Ecol. Monogr. 50: 153–178.
Willey, D. W. and Van Riper Iii, C. 2014. Home Range Characteristics of Mexican Spotted Owls in the Rincon Mountains, Arizona. - Wilson J. Ornithol. 126: 53–59.
Williams, T. D., Christians, J. K., Aiken, J. J. and Evanson, M. 1999. Enhanced immune function does not depress reproductive output. - Proc. R. Soc. B Biol. Sci. 266: 753.
Wilson, S., Martin, K. and Hannon, S. J. 2007. Nest survival patterns in willow ptarmigan: influence of time, nesting stage, and female characteristics. – Condor 109: 377–388.
Winiarski, J. M., Moorman, C. E. and Carpenter, J. P. 2017. Bachman’s Sparrows at the northern periphery of their range: home range size and microhabitat selection. - J. Field Ornithol. 88: 250–261.
Worton, B. J. 1989. Kernel Methods for Estimating the Utilization Distribution in Home-Range Studies. - Ecology 70: 164–168.
Worton, B. J. 1995. Using Monte Carlo Simulation to Evaluate Kernel-Based Home Range Estimators. - J. Wildl. Manag. 59: 794–800.
X Xiao, H., Hu, Y., Lang, Z., Fang, B., Guo, W., Zhang, Q., Pan, X. and Lu, X. 2017. How much do
we know about the breeding biology of bird species in the world? – J. Avian Biol. 48: 513–518.
Xu, D.-L., Hu, X.-K. and Tian, Y.-F. 2017. Effect of temperature and food restriction on immune function in striped hamsters ( Cricetulus barabensis ). - J. Exp. Biol. 220: 2187–2195.
Y Yanes, M. and Suarez, F. 1996. Incidental nest predation and lark conservation in an Iberian
semiarid shrubsteppe. – Conserv. Biol. 10: 881–887. Yom-Tov, Y. 1974. The effect of food and predation on breeding density and success, clutch size
and laying date of the crow (Corvus corone L.). – J. Anim. Ecol. 43: 479–498. Z Zamora-Vilchis, I., Williams, S. E. and Johnson, C. N. 2012. Environmental Temperature Affects
Prevalence of Blood Parasites of Birds on an Elevation Gradient: Implications for Disease in a Warming Climate. - PLOS ONE 7: e39208.
Zanette, L., Clinchy, M. and Smith, J. N. M. 2006. Combined food and predator effects on songbird nest survival and annual reproductive success: results from a bi-factorial experiment. - Oecologia 147: 632–640.
Zimmerman, D. A., Turner, D. A. and Pearson, D. J. 2005. Birds of Kenya and Northern Tanzania. – London; Helm.
Zuur, A. F., Ieno, E. N. and Elphick, C. S. 2010. A protocol for data exploration to avoid common statistical problems. – Methods Ecol. Evol. 1: 3–14.
Summary The increase in biological diversity from the poles toward the equator is one of the most fundamental patterns of life on earth. Opposite of the pattern of increased diversity as you approach the equator, the occurrence and amplitude in seasonality reduce from highly predictable seasons at the poles to aseasonal environments at the equator. In predictable seasonal environments, organisms have often evolved adaptive physiological programs and use reliable cues to respond to anticipated variation in environmental conditions; this is generally highly synchronized with life history stage demands. But how can equatorial afro-tropical birds adjust their phenotype or time their nesting to coincide with environmental conditions that increase nest survival when the environment is constantly changing in an unpredictable stochastic way? Understanding how birds adjust their phenotype in these unpredictable near-equatorial areas provides an important step towards a better understanding of life history strategies in these unpredictable stochastic environments that are suggested to have differences in cue-use and responses to environmental drivers as compared with their much studied high latitude counterparts.
In this thesis, we investigate if/how the stochastic environment influences temporal variation in nest success of Red-capped larks, and whether Red-capped larks adjust their phenotype through behavioral space use and physiological adjustments of body mass and immune function to adapt to the stochastic environment. I also test whether variation in body mass and immune function follows the historical seasonal or a stochastic pattern reminiscent of current environmental variation. Our model species, the red-capped lark is a small gregarious bird found in short-grass and bare-ground habitats widely distributed across Africa. Males and females form pairs during breeding but interact in mixed-sex flocks when not breeding. Pairs build ground-level open-cup nests and typically lay two eggs per clutch. Clutch size is usually two eggs but 1–3 egg clutches occur occasionally.
In chapter 2, we show that despite breeding year-round, nesting success is not consistent but rather varies in an inconsistent fashion both among months and years. Birds breeding when most conspecifics are also breeding have a higher nesting success than their counterparts breeding when nesting intensity is low. Although nest predation was the single most significant cause of nest failure, the negative correlation of nest success with flying invertebrates and rainfall pointed to incidental depredation. Incidental depredation occurs when nest contents are depredated as secondary prey encountered by predators searching for different primary prey. Presumably, these incidental nest predators were more abundant or active with more rain and flying invertebrates.
Our objective in chapter 3 was to understand year-round variation in home-range size in the context of the highly aseasonal and unpredictable variation in weather and resources typical of many equatorial habitats, in addition to the birds’ changing social structure and year-round breeding. The intensity of nesting (total number of nests found per month) was the main factor influencing the home range of Red-capped larks, which applied to both the combined composite home ranges of breeding and non-breeding birds and to the home ranges of non-breeding birds only. Red-capped larks had larger home ranges when few individuals were breeding but the home ranges decreased as the number of breeding pairs increased. Also linked to breeding, Red-capped
Summary
129
Wiley, R. H. and Wiley, M. S. 1980. Spacing and Timing in the Nesting Ecology of a Tropical Blackbird: Comparison of Populations in Different Environments. - Ecol. Monogr. 50: 153–178.
Willey, D. W. and Van Riper Iii, C. 2014. Home Range Characteristics of Mexican Spotted Owls in the Rincon Mountains, Arizona. - Wilson J. Ornithol. 126: 53–59.
Williams, T. D., Christians, J. K., Aiken, J. J. and Evanson, M. 1999. Enhanced immune function does not depress reproductive output. - Proc. R. Soc. B Biol. Sci. 266: 753.
Wilson, S., Martin, K. and Hannon, S. J. 2007. Nest survival patterns in willow ptarmigan: influence of time, nesting stage, and female characteristics. – Condor 109: 377–388.
Winiarski, J. M., Moorman, C. E. and Carpenter, J. P. 2017. Bachman’s Sparrows at the northern periphery of their range: home range size and microhabitat selection. - J. Field Ornithol. 88: 250–261.
Worton, B. J. 1989. Kernel Methods for Estimating the Utilization Distribution in Home-Range Studies. - Ecology 70: 164–168.
Worton, B. J. 1995. Using Monte Carlo Simulation to Evaluate Kernel-Based Home Range Estimators. - J. Wildl. Manag. 59: 794–800.
X Xiao, H., Hu, Y., Lang, Z., Fang, B., Guo, W., Zhang, Q., Pan, X. and Lu, X. 2017. How much do
we know about the breeding biology of bird species in the world? – J. Avian Biol. 48: 513–518.
Xu, D.-L., Hu, X.-K. and Tian, Y.-F. 2017. Effect of temperature and food restriction on immune function in striped hamsters ( Cricetulus barabensis ). - J. Exp. Biol. 220: 2187–2195.
Y Yanes, M. and Suarez, F. 1996. Incidental nest predation and lark conservation in an Iberian
semiarid shrubsteppe. – Conserv. Biol. 10: 881–887. Yom-Tov, Y. 1974. The effect of food and predation on breeding density and success, clutch size
and laying date of the crow (Corvus corone L.). – J. Anim. Ecol. 43: 479–498. Z Zamora-Vilchis, I., Williams, S. E. and Johnson, C. N. 2012. Environmental Temperature Affects
Prevalence of Blood Parasites of Birds on an Elevation Gradient: Implications for Disease in a Warming Climate. - PLOS ONE 7: e39208.
Zanette, L., Clinchy, M. and Smith, J. N. M. 2006. Combined food and predator effects on songbird nest survival and annual reproductive success: results from a bi-factorial experiment. - Oecologia 147: 632–640.
Zimmerman, D. A., Turner, D. A. and Pearson, D. J. 2005. Birds of Kenya and Northern Tanzania. – London; Helm.
Zuur, A. F., Ieno, E. N. and Elphick, C. S. 2010. A protocol for data exploration to avoid common statistical problems. – Methods Ecol. Evol. 1: 3–14.
Summary The increase in biological diversity from the poles toward the equator is one of the most fundamental patterns of life on earth. Opposite of the pattern of increased diversity as you approach the equator, the occurrence and amplitude in seasonality reduce from highly predictable seasons at the poles to aseasonal environments at the equator. In predictable seasonal environments, organisms have often evolved adaptive physiological programs and use reliable cues to respond to anticipated variation in environmental conditions; this is generally highly synchronized with life history stage demands. But how can equatorial afro-tropical birds adjust their phenotype or time their nesting to coincide with environmental conditions that increase nest survival when the environment is constantly changing in an unpredictable stochastic way? Understanding how birds adjust their phenotype in these unpredictable near-equatorial areas provides an important step towards a better understanding of life history strategies in these unpredictable stochastic environments that are suggested to have differences in cue-use and responses to environmental drivers as compared with their much studied high latitude counterparts.
In this thesis, we investigate if/how the stochastic environment influences temporal variation in nest success of Red-capped larks, and whether Red-capped larks adjust their phenotype through behavioral space use and physiological adjustments of body mass and immune function to adapt to the stochastic environment. I also test whether variation in body mass and immune function follows the historical seasonal or a stochastic pattern reminiscent of current environmental variation. Our model species, the red-capped lark is a small gregarious bird found in short-grass and bare-ground habitats widely distributed across Africa. Males and females form pairs during breeding but interact in mixed-sex flocks when not breeding. Pairs build ground-level open-cup nests and typically lay two eggs per clutch. Clutch size is usually two eggs but 1–3 egg clutches occur occasionally.
In chapter 2, we show that despite breeding year-round, nesting success is not consistent but rather varies in an inconsistent fashion both among months and years. Birds breeding when most conspecifics are also breeding have a higher nesting success than their counterparts breeding when nesting intensity is low. Although nest predation was the single most significant cause of nest failure, the negative correlation of nest success with flying invertebrates and rainfall pointed to incidental depredation. Incidental depredation occurs when nest contents are depredated as secondary prey encountered by predators searching for different primary prey. Presumably, these incidental nest predators were more abundant or active with more rain and flying invertebrates.
Our objective in chapter 3 was to understand year-round variation in home-range size in the context of the highly aseasonal and unpredictable variation in weather and resources typical of many equatorial habitats, in addition to the birds’ changing social structure and year-round breeding. The intensity of nesting (total number of nests found per month) was the main factor influencing the home range of Red-capped larks, which applied to both the combined composite home ranges of breeding and non-breeding birds and to the home ranges of non-breeding birds only. Red-capped larks had larger home ranges when few individuals were breeding but the home ranges decreased as the number of breeding pairs increased. Also linked to breeding, Red-capped
Summary
130
larks differed in social organization between breeding and non-breeding individuals through fusion of pairs to large groups when not in breeding and fission during breeding. During breeding, nesting birds are confined to areas near their nest which may explain the smaller home ranges when nesting. For the non-breeding birds, exclusion by the breeding pairs which become territorial may limit access of some areas to non-breeding birds and similarly lead to smaller home ranges.
In chapter 4 of this thesis, we aimed to investigate (1) if body mass variation in Red-capped larks is better explained by evolutionary adaptation to long term weather patterns or by phenotypically plastic responses to current weather conditions? (2). How strong of a cue are weather patterns in predicting future food availability or does food vary in an unpredictable manner, and if so, (3). Do Red-capped Larks’ body masses vary dependent on life history stage or increase with higher food availability to buffer against unanticipated harsh times in the stochastic environment, independent of life history stage? Our results in this chapter attest to the stochasticity and unpredictability of food availability in the equatorial afro-tropical environments and the unreliability of weather as a cue for future food availability. Despite the change in weather patterns from a historical seasonal to a current non-seasonal environment, body mass of Red-capped Larks was only partly explained by phenotypically plastic responses to current weather conditions, and also to some extent appeared evolutionarily adapted to long term weather patterns. Although food availability was unpredictable, we did not find evidence that birds accumulate extra reserves for use during breeding but on the contrary body mass in Red-capped larks decreased with increased food availability independent of life history stage which suggests year-round food availability. However, molting birds decreased mass with higher ambient temperatures and favourable environmental condition to even lower levels than birds in quiescence. With food sufficient year-round, Red-capped larks may opt for a lean mass under good conditions to counter associated negative costs of higher body mass that include increased locomotory costs and higher vulnerability to predation, more so during molting when flight efficiency is reduced due to missing feathers and reduced wing area.
Although temporal variation in immune function in animals, and in particular vertebrates, has been explained proposed to reflect a trade-off with energetically or nutritionally expensive life-history events such as reproduction and molt, in chapter 5 of this thesis, we found no evidence that immune function in Red-capped larks was reduced during breeding. Instead, consistent with the alternative proposal that immune function reflects adjustment to changing environmental factors that influence resource availability and disease threat; all four immune indexes were explained by at least one or more of the socio-environmental factors, while life history stage played a minor role. The immune system plays an important role as the body's natural defence against infection and disease. The stronger influence of social-environmental factors may, therefore, be due to the hypothesized higher parasite diversity and pathogen pressures in tropical areas compared to temperate regions. In addition to variation of immune indices with favourable social-environmental factors, immune function in Red-capped larks was also influenced by variation in temperature and rain. With the level of immune indices suggested to be reflective of the threat of infection, variation of immune indices with temperature and rainfall may reflect increased disease risk and/or pathogen pressure in the environment.
To conclude, our study underlines the relevance of conducting more studies in aseasonal tropical areas in order to disentangle effects of weather, food availability and breeding that vary in an unpredictable and unsynchronized manner, but that peak simultaneously in most seasonal areas, coupled with the high diversity of life history strategies observed in the tropics.
Samenvatting De toenemende biologische diversiteit vanaf de polen tot aan de evenaar, is een van de meest fundamentele patronen van het leven op aarde. Terwijl de soortenrijkdom toeneemt bij het naderen van de evenaar, neemt het voorkomen en de amplitude in seizoensvariatie af: van zeer voorspelbare seizoenen op de polen naar de seizoensloze omgevingen van de evenaar. In voorspelbare seizoensgebonden omgevingen, hebben organismen vaak adaptieve fysiologische programma’s ontwikkeld. Ook maken zij gebruik van betrouwbare aanwijzingen om te kunnen reageren op veranderingen in hun omgeving; dit is over het algemeen sterk afgestemd op de eisen van de levensfase. Maar hoe kunnen equatoriale afro-tropische vogels hun fenotype aanpassen of hun broedtijd laten samenvallen met omgevingsomstandigheden die de nestoverleving verhogen, wanneer de omgeving voortdurend verandert op een onvoorspelbare stochastische manier? Inzicht in hoe vogels hun fenotype aanpassen in deze onvoorspelbare, bijna-equatoriale gebieden, vormt een belangrijke stap naar een beter begrip van levensloopstrategieën in deze onvoorspelbare stochastische omgevingen. Van deze omgevingen wordt gesuggereerd dat ze verschillen in de mate waarin diersoorten reageren op de omgeving in vergelijking met hun veel bestudeerde tegenhangers met een hoge latitude.
In dit proefschrift onderzoeken we of en hoe de stochastische omgeving invloed heeft op de temporele variatie in het broedsucces van roodkapleeuweriken. Ook onderzoeken we of roodkapleeuweriken hun fenotype aanpassen aan de stochastische omgeving door gedragsveranderingen, door gebruik te maken van de ruimte en door fysiologische aanpassingen van lichaamsgewicht en immuunfunctie. We testen ook of de variatie in lichaamsgewicht en immuunfunctie de gemiddelde seizoensvariatie van de afgelopen 29 jaar volgt, of een stochastisch patroon volgt dat doet denken aan de huidige omgevingsvariatie. Onze modelsoort, de roodkapleeuwerik, is een kleine vogel die leeft in groepen. Roodkapleeuweriken zijn wijdverspreid over Afrika te vinden in gebieden met grasland en kale gronden. In het broedseizoen vormen mannetjes en vrouwtjes paartjes, maar wanneer er niet wordt gebroed zijn ze te vinden in gemengde groepen. De paartjes bouwen open nesten op de grond. Meestal worden er twee eieren per keer gelegd, maar één of drie eieren komt ook voor.
In hoofdstuk 2 laten we zien dat het broedsucces niet het hele jaar door consistent is, maar eerder op een inconsistente manier varieert, zowel per maand als per jaar. Roodkapleeuweriken die broeden wanneer de meeste anderen in de kolonie ook broeden, hebben een hoger nestsucces dan vogels die broeden wanneer de broedintensiteit laag is. Hoewel nestpredatie de belangrijkste oorzaak van nestmislukking was, wees de negatieve correlatie van nestsucces met vliegende ongewervelden en neerslag op incidentele depredatie. Incidentele depredatie treedt op wanneer de nestinhoud wordt gedeprecieerd als secundaire prooi door predatoren die op zoek zijn naar verschillende primaire prooien. Vermoedelijk waren er meer incidentele predatoren van nesten aanwezig of zijn ze actiever wanneer het veel regent en er veel vliegende ongewervelden zijn.
Ons doel in hoofdstuk 3 was gedurende het jaar de variatie in de omvang van het activiteitsgebied van de roodkapleeuweriken te begrijpen in de context van de onvoorspelbare
Samenvatting
131
larks differed in social organization between breeding and non-breeding individuals through fusion of pairs to large groups when not in breeding and fission during breeding. During breeding, nesting birds are confined to areas near their nest which may explain the smaller home ranges when nesting. For the non-breeding birds, exclusion by the breeding pairs which become territorial may limit access of some areas to non-breeding birds and similarly lead to smaller home ranges.
In chapter 4 of this thesis, we aimed to investigate (1) if body mass variation in Red-capped larks is better explained by evolutionary adaptation to long term weather patterns or by phenotypically plastic responses to current weather conditions? (2). How strong of a cue are weather patterns in predicting future food availability or does food vary in an unpredictable manner, and if so, (3). Do Red-capped Larks’ body masses vary dependent on life history stage or increase with higher food availability to buffer against unanticipated harsh times in the stochastic environment, independent of life history stage? Our results in this chapter attest to the stochasticity and unpredictability of food availability in the equatorial afro-tropical environments and the unreliability of weather as a cue for future food availability. Despite the change in weather patterns from a historical seasonal to a current non-seasonal environment, body mass of Red-capped Larks was only partly explained by phenotypically plastic responses to current weather conditions, and also to some extent appeared evolutionarily adapted to long term weather patterns. Although food availability was unpredictable, we did not find evidence that birds accumulate extra reserves for use during breeding but on the contrary body mass in Red-capped larks decreased with increased food availability independent of life history stage which suggests year-round food availability. However, molting birds decreased mass with higher ambient temperatures and favourable environmental condition to even lower levels than birds in quiescence. With food sufficient year-round, Red-capped larks may opt for a lean mass under good conditions to counter associated negative costs of higher body mass that include increased locomotory costs and higher vulnerability to predation, more so during molting when flight efficiency is reduced due to missing feathers and reduced wing area.
Although temporal variation in immune function in animals, and in particular vertebrates, has been explained proposed to reflect a trade-off with energetically or nutritionally expensive life-history events such as reproduction and molt, in chapter 5 of this thesis, we found no evidence that immune function in Red-capped larks was reduced during breeding. Instead, consistent with the alternative proposal that immune function reflects adjustment to changing environmental factors that influence resource availability and disease threat; all four immune indexes were explained by at least one or more of the socio-environmental factors, while life history stage played a minor role. The immune system plays an important role as the body's natural defence against infection and disease. The stronger influence of social-environmental factors may, therefore, be due to the hypothesized higher parasite diversity and pathogen pressures in tropical areas compared to temperate regions. In addition to variation of immune indices with favourable social-environmental factors, immune function in Red-capped larks was also influenced by variation in temperature and rain. With the level of immune indices suggested to be reflective of the threat of infection, variation of immune indices with temperature and rainfall may reflect increased disease risk and/or pathogen pressure in the environment.
To conclude, our study underlines the relevance of conducting more studies in aseasonal tropical areas in order to disentangle effects of weather, food availability and breeding that vary in an unpredictable and unsynchronized manner, but that peak simultaneously in most seasonal areas, coupled with the high diversity of life history strategies observed in the tropics.
Samenvatting De toenemende biologische diversiteit vanaf de polen tot aan de evenaar, is een van de meest fundamentele patronen van het leven op aarde. Terwijl de soortenrijkdom toeneemt bij het naderen van de evenaar, neemt het voorkomen en de amplitude in seizoensvariatie af: van zeer voorspelbare seizoenen op de polen naar de seizoensloze omgevingen van de evenaar. In voorspelbare seizoensgebonden omgevingen, hebben organismen vaak adaptieve fysiologische programma’s ontwikkeld. Ook maken zij gebruik van betrouwbare aanwijzingen om te kunnen reageren op veranderingen in hun omgeving; dit is over het algemeen sterk afgestemd op de eisen van de levensfase. Maar hoe kunnen equatoriale afro-tropische vogels hun fenotype aanpassen of hun broedtijd laten samenvallen met omgevingsomstandigheden die de nestoverleving verhogen, wanneer de omgeving voortdurend verandert op een onvoorspelbare stochastische manier? Inzicht in hoe vogels hun fenotype aanpassen in deze onvoorspelbare, bijna-equatoriale gebieden, vormt een belangrijke stap naar een beter begrip van levensloopstrategieën in deze onvoorspelbare stochastische omgevingen. Van deze omgevingen wordt gesuggereerd dat ze verschillen in de mate waarin diersoorten reageren op de omgeving in vergelijking met hun veel bestudeerde tegenhangers met een hoge latitude.
In dit proefschrift onderzoeken we of en hoe de stochastische omgeving invloed heeft op de temporele variatie in het broedsucces van roodkapleeuweriken. Ook onderzoeken we of roodkapleeuweriken hun fenotype aanpassen aan de stochastische omgeving door gedragsveranderingen, door gebruik te maken van de ruimte en door fysiologische aanpassingen van lichaamsgewicht en immuunfunctie. We testen ook of de variatie in lichaamsgewicht en immuunfunctie de gemiddelde seizoensvariatie van de afgelopen 29 jaar volgt, of een stochastisch patroon volgt dat doet denken aan de huidige omgevingsvariatie. Onze modelsoort, de roodkapleeuwerik, is een kleine vogel die leeft in groepen. Roodkapleeuweriken zijn wijdverspreid over Afrika te vinden in gebieden met grasland en kale gronden. In het broedseizoen vormen mannetjes en vrouwtjes paartjes, maar wanneer er niet wordt gebroed zijn ze te vinden in gemengde groepen. De paartjes bouwen open nesten op de grond. Meestal worden er twee eieren per keer gelegd, maar één of drie eieren komt ook voor.
In hoofdstuk 2 laten we zien dat het broedsucces niet het hele jaar door consistent is, maar eerder op een inconsistente manier varieert, zowel per maand als per jaar. Roodkapleeuweriken die broeden wanneer de meeste anderen in de kolonie ook broeden, hebben een hoger nestsucces dan vogels die broeden wanneer de broedintensiteit laag is. Hoewel nestpredatie de belangrijkste oorzaak van nestmislukking was, wees de negatieve correlatie van nestsucces met vliegende ongewervelden en neerslag op incidentele depredatie. Incidentele depredatie treedt op wanneer de nestinhoud wordt gedeprecieerd als secundaire prooi door predatoren die op zoek zijn naar verschillende primaire prooien. Vermoedelijk waren er meer incidentele predatoren van nesten aanwezig of zijn ze actiever wanneer het veel regent en er veel vliegende ongewervelden zijn.
Ons doel in hoofdstuk 3 was gedurende het jaar de variatie in de omvang van het activiteitsgebied van de roodkapleeuweriken te begrijpen in de context van de onvoorspelbare
Samenvatting
132
variatie in weer en bronnen, die kenmerkend is voor veel equatoriale leefgebieden. Deze variatie hebben we onderzocht in samenhang met de veranderende sociale structuur van de vogels en het feit dat het hele jaar door gebroed wordt. De nestintensiteit (het totale aantal gevonden nesten per maand per zoekuur) was de belangrijkste factor die van invloed was op het activiteitsgebied van roodkapleeuweriken, die van toepassing was op het gecombineerde samengestelde activiteitsgebied van zowel broedvogels als niet-broedvogels én op het activiteitsgebied van niet-broedende leeuweriken.
De roodkapleeuweriken hadden grotere activiteitsgebieden als er maar weinig individuen broedden, maar de activiteitsgebieden werden kleiner naarmate het aantal broedparen toenam. De sociale organisatie tussen broedende en niet-broedende dieren verschilde ook: als er niet werd gebroed gingen de paartjes op in de grote groep, maar in de paar- en broedtijd scheidden de paartjes zich af van de rest. Broedende vogels worden beperkt tot gebieden in de buurt van hun nest, wat de kleinere woongebieden in deze periode kan verklaren. Voor niet-broedende vogels kan uitsluiting door de broedparen die territoriaal worden tot kleinere woongebieden leiden.
In hoofdstuk 4 van dit proefschrift hebben we gezocht naar antwoorden op de volgende vragen: (1) Kan de variatie in lichaamsgewicht in roodkapleeuweriken worden verklaard door de evolutionaire aanpassing aan langetermijnpatronen in weersomstandigheden, of door fenotypische plastische reacties op weersomstandigheden van het moment? (2) Hoe sterk zijn de weerpatronen bij het voorspellen van de beschikbaarheid van voedsel in de toekomst of varieert voedsel op een onvoorspelbare manier? (3) Varieert het lichaamsgewicht van roodkapleeuweriken afhankelijk van de levensfase, óf neemt het gewicht toe bij grotere voedselbeschikbaarheid doordat de vogel een buffer aanlegt om zichzelf te beschermen tegen voedselschaarste in de stochastische omgeving, onafhankelijk van de levensfase. Onze resultaten in dit hoofdstuk getuigen van de stochasticiteit en onvoorspelbaarheid van voedselbeschikbaarheid in de equatoriale afro-tropische omgevingen en de onbetrouwbaarheid van het weer als signaal voor toekomstige voedselbeschikbaarheid. Ondanks de verandering in weerpatronen van een historisch seizoensgebonden tot een huidig niet-seizoensgebonden omgeving, was het lichaamsgewicht van roodkapleeuweriken slechts gedeeltelijk te verklaren door fenotypisch plastische reacties op de huidige weersomstandigheden, en leek hij tot op zekere hoogte evolutionair aangepast aan langetermijn-weerpatronen. Hoewel de voedselbeschikbaarheid onvoorspelbaar was, vonden we geen bewijs dat vogels extra reserves accumuleren voor gebruik tijdens de broedtijd. Integendeel: het lichaamsgewicht van roodkapleeuweriken nam af bij een toegenomen voedselbeschikbaarheid, onafhankelijk van de levensfase, wat duidt op het hele jaar door voldoende voedselbeschikbaarheid voor de roodkapleeuweriken. Echter, ruiende vogels verminderden hun lichaamsgewicht bij hogere omgevingstemperaturen en gunstige omgevingscondities zelfs tot lagere niveaus dan vogels in rust. Met de beschikbaarheid van voldoende voedsel gedurende het hele jaar, kunnen roodkapleeuweriken onder gunstige omstandigheden tijdelijk een lager gewicht hebben. Zo worden negatieve effecten van een hoger lichaamsgewicht vermeden, zoals een verhoogde motorische belasting en een hogere gevoeligheid voor predatie. Dit is met name praktisch tijdens de rui, wanneer de vliegefficiëntie is verminderd vanwege ontbrekende veren en verminderd vleugeloppervlak.
Hoewel de temporele variatie in immuunfunctie bij dieren, en in het bijzonder gewervelde dieren, vaak wordt gerelateerd aan energetisch of nutritioneel veeleisende levensfasegebeurtenissen, zoals voortplanting en de rui, vonden we in hoofdstuk 5 van dit proefschrift geen bewijs dat de immuunfunctie van roodkapleeuweriken tijdens de broedtijd was
verminderd. In plaats daarvan, in overeenstemming met een alternatieve verklaring, weerspiegelt de immuunfunctie de aanpassing aan veranderende omgevingsfactoren die de beschikbaarheid van hulpbronnen en de dreiging van ziekten beïnvloeden; variatie in alle vier maten voor het immuunsysteem werden verklaard door ten minste een of meer sociale factoren, terwijl de levensfase een ondergeschikte rol speelde. Het immuunsysteem speelt een belangrijke rol als natuurlijke afweer van het lichaam tegen infectie en ziekte. De sterkere invloed van sociale factoren kan te wijten zijn aan de veronderstelde hogere diversiteit van parasieten en pathogenen in tropische gebieden vergeleken met gematigde streken. Naast de variatie van immuunindexen als gevolg van gunstige sociale factoren, werd de immuunfunctie in roodkapleeuweriken ook beïnvloed door variatie in temperatuur en regen.
Van het niveau van het immuunsysteem wordt gesuggereerd dat het een afspiegeling vormt van de dreiging van infectie. Co-variatie van maten van het immuunsysteem met temperatuur en regenval kan dus een verhoogd risico op ziektes en/of pathogenen in het milieu weerspiegelen.
Concluderend onderstreept onze studie het belang van meer onderzoek in tropische gebieden naar de effecten van voedselbeschikbaarheid, weer en broed. Deze factoren variëren op een onvoorspelbare en niet-gesynchroniseerde manier, maar pieken tegelijkertijd in de meeste seizoensgebieden, in combinatie met de hoge diversiteit van waargenomen levensloopstrategieën in de tropen.
Samenvatting
133
variatie in weer en bronnen, die kenmerkend is voor veel equatoriale leefgebieden. Deze variatie hebben we onderzocht in samenhang met de veranderende sociale structuur van de vogels en het feit dat het hele jaar door gebroed wordt. De nestintensiteit (het totale aantal gevonden nesten per maand per zoekuur) was de belangrijkste factor die van invloed was op het activiteitsgebied van roodkapleeuweriken, die van toepassing was op het gecombineerde samengestelde activiteitsgebied van zowel broedvogels als niet-broedvogels én op het activiteitsgebied van niet-broedende leeuweriken.
De roodkapleeuweriken hadden grotere activiteitsgebieden als er maar weinig individuen broedden, maar de activiteitsgebieden werden kleiner naarmate het aantal broedparen toenam. De sociale organisatie tussen broedende en niet-broedende dieren verschilde ook: als er niet werd gebroed gingen de paartjes op in de grote groep, maar in de paar- en broedtijd scheidden de paartjes zich af van de rest. Broedende vogels worden beperkt tot gebieden in de buurt van hun nest, wat de kleinere woongebieden in deze periode kan verklaren. Voor niet-broedende vogels kan uitsluiting door de broedparen die territoriaal worden tot kleinere woongebieden leiden.
In hoofdstuk 4 van dit proefschrift hebben we gezocht naar antwoorden op de volgende vragen: (1) Kan de variatie in lichaamsgewicht in roodkapleeuweriken worden verklaard door de evolutionaire aanpassing aan langetermijnpatronen in weersomstandigheden, of door fenotypische plastische reacties op weersomstandigheden van het moment? (2) Hoe sterk zijn de weerpatronen bij het voorspellen van de beschikbaarheid van voedsel in de toekomst of varieert voedsel op een onvoorspelbare manier? (3) Varieert het lichaamsgewicht van roodkapleeuweriken afhankelijk van de levensfase, óf neemt het gewicht toe bij grotere voedselbeschikbaarheid doordat de vogel een buffer aanlegt om zichzelf te beschermen tegen voedselschaarste in de stochastische omgeving, onafhankelijk van de levensfase. Onze resultaten in dit hoofdstuk getuigen van de stochasticiteit en onvoorspelbaarheid van voedselbeschikbaarheid in de equatoriale afro-tropische omgevingen en de onbetrouwbaarheid van het weer als signaal voor toekomstige voedselbeschikbaarheid. Ondanks de verandering in weerpatronen van een historisch seizoensgebonden tot een huidig niet-seizoensgebonden omgeving, was het lichaamsgewicht van roodkapleeuweriken slechts gedeeltelijk te verklaren door fenotypisch plastische reacties op de huidige weersomstandigheden, en leek hij tot op zekere hoogte evolutionair aangepast aan langetermijn-weerpatronen. Hoewel de voedselbeschikbaarheid onvoorspelbaar was, vonden we geen bewijs dat vogels extra reserves accumuleren voor gebruik tijdens de broedtijd. Integendeel: het lichaamsgewicht van roodkapleeuweriken nam af bij een toegenomen voedselbeschikbaarheid, onafhankelijk van de levensfase, wat duidt op het hele jaar door voldoende voedselbeschikbaarheid voor de roodkapleeuweriken. Echter, ruiende vogels verminderden hun lichaamsgewicht bij hogere omgevingstemperaturen en gunstige omgevingscondities zelfs tot lagere niveaus dan vogels in rust. Met de beschikbaarheid van voldoende voedsel gedurende het hele jaar, kunnen roodkapleeuweriken onder gunstige omstandigheden tijdelijk een lager gewicht hebben. Zo worden negatieve effecten van een hoger lichaamsgewicht vermeden, zoals een verhoogde motorische belasting en een hogere gevoeligheid voor predatie. Dit is met name praktisch tijdens de rui, wanneer de vliegefficiëntie is verminderd vanwege ontbrekende veren en verminderd vleugeloppervlak.
Hoewel de temporele variatie in immuunfunctie bij dieren, en in het bijzonder gewervelde dieren, vaak wordt gerelateerd aan energetisch of nutritioneel veeleisende levensfasegebeurtenissen, zoals voortplanting en de rui, vonden we in hoofdstuk 5 van dit proefschrift geen bewijs dat de immuunfunctie van roodkapleeuweriken tijdens de broedtijd was
verminderd. In plaats daarvan, in overeenstemming met een alternatieve verklaring, weerspiegelt de immuunfunctie de aanpassing aan veranderende omgevingsfactoren die de beschikbaarheid van hulpbronnen en de dreiging van ziekten beïnvloeden; variatie in alle vier maten voor het immuunsysteem werden verklaard door ten minste een of meer sociale factoren, terwijl de levensfase een ondergeschikte rol speelde. Het immuunsysteem speelt een belangrijke rol als natuurlijke afweer van het lichaam tegen infectie en ziekte. De sterkere invloed van sociale factoren kan te wijten zijn aan de veronderstelde hogere diversiteit van parasieten en pathogenen in tropische gebieden vergeleken met gematigde streken. Naast de variatie van immuunindexen als gevolg van gunstige sociale factoren, werd de immuunfunctie in roodkapleeuweriken ook beïnvloed door variatie in temperatuur en regen.
Van het niveau van het immuunsysteem wordt gesuggereerd dat het een afspiegeling vormt van de dreiging van infectie. Co-variatie van maten van het immuunsysteem met temperatuur en regenval kan dus een verhoogd risico op ziektes en/of pathogenen in het milieu weerspiegelen.
Concluderend onderstreept onze studie het belang van meer onderzoek in tropische gebieden naar de effecten van voedselbeschikbaarheid, weer en broed. Deze factoren variëren op een onvoorspelbare en niet-gesynchroniseerde manier, maar pieken tegelijkertijd in de meeste seizoensgebieden, in combinatie met de hoge diversiteit van waargenomen levensloopstrategieën in de tropen.
Samenvatting
132
variatie in weer en bronnen, die kenmerkend is voor veel equatoriale leefgebieden. Deze variatie hebben we onderzocht in samenhang met de veranderende sociale structuur van de vogels en het feit dat het hele jaar door gebroed wordt. De nestintensiteit (het totale aantal gevonden nesten per maand per zoekuur) was de belangrijkste factor die van invloed was op het activiteitsgebied van roodkapleeuweriken, die van toepassing was op het gecombineerde samengestelde activiteitsgebied van zowel broedvogels als niet-broedvogels én op het activiteitsgebied van niet-broedende leeuweriken.
De roodkapleeuweriken hadden grotere activiteitsgebieden als er maar weinig individuen broedden, maar de activiteitsgebieden werden kleiner naarmate het aantal broedparen toenam. De sociale organisatie tussen broedende en niet-broedende dieren verschilde ook: als er niet werd gebroed gingen de paartjes op in de grote groep, maar in de paar- en broedtijd scheidden de paartjes zich af van de rest. Broedende vogels worden beperkt tot gebieden in de buurt van hun nest, wat de kleinere woongebieden in deze periode kan verklaren. Voor niet-broedende vogels kan uitsluiting door de broedparen die territoriaal worden tot kleinere woongebieden leiden.
In hoofdstuk 4 van dit proefschrift hebben we gezocht naar antwoorden op de volgende vragen: (1) Kan de variatie in lichaamsgewicht in roodkapleeuweriken worden verklaard door de evolutionaire aanpassing aan langetermijnpatronen in weersomstandigheden, of door fenotypische plastische reacties op weersomstandigheden van het moment? (2) Hoe sterk zijn de weerpatronen bij het voorspellen van de beschikbaarheid van voedsel in de toekomst of varieert voedsel op een onvoorspelbare manier? (3) Varieert het lichaamsgewicht van roodkapleeuweriken afhankelijk van de levensfase, óf neemt het gewicht toe bij grotere voedselbeschikbaarheid doordat de vogel een buffer aanlegt om zichzelf te beschermen tegen voedselschaarste in de stochastische omgeving, onafhankelijk van de levensfase. Onze resultaten in dit hoofdstuk getuigen van de stochasticiteit en onvoorspelbaarheid van voedselbeschikbaarheid in de equatoriale afro-tropische omgevingen en de onbetrouwbaarheid van het weer als signaal voor toekomstige voedselbeschikbaarheid. Ondanks de verandering in weerpatronen van een historisch seizoensgebonden tot een huidig niet-seizoensgebonden omgeving, was het lichaamsgewicht van roodkapleeuweriken slechts gedeeltelijk te verklaren door fenotypisch plastische reacties op de huidige weersomstandigheden, en leek hij tot op zekere hoogte evolutionair aangepast aan langetermijn-weerpatronen. Hoewel de voedselbeschikbaarheid onvoorspelbaar was, vonden we geen bewijs dat vogels extra reserves accumuleren voor gebruik tijdens de broedtijd. Integendeel: het lichaamsgewicht van roodkapleeuweriken nam af bij een toegenomen voedselbeschikbaarheid, onafhankelijk van de levensfase, wat duidt op het hele jaar door voldoende voedselbeschikbaarheid voor de roodkapleeuweriken. Echter, ruiende vogels verminderden hun lichaamsgewicht bij hogere omgevingstemperaturen en gunstige omgevingscondities zelfs tot lagere niveaus dan vogels in rust. Met de beschikbaarheid van voldoende voedsel gedurende het hele jaar, kunnen roodkapleeuweriken onder gunstige omstandigheden tijdelijk een lager gewicht hebben. Zo worden negatieve effecten van een hoger lichaamsgewicht vermeden, zoals een verhoogde motorische belasting en een hogere gevoeligheid voor predatie. Dit is met name praktisch tijdens de rui, wanneer de vliegefficiëntie is verminderd vanwege ontbrekende veren en verminderd vleugeloppervlak.
Hoewel de temporele variatie in immuunfunctie bij dieren, en in het bijzonder gewervelde dieren, vaak wordt gerelateerd aan energetisch of nutritioneel veeleisende levensfasegebeurtenissen, zoals voortplanting en de rui, vonden we in hoofdstuk 5 van dit proefschrift geen bewijs dat de immuunfunctie van roodkapleeuweriken tijdens de broedtijd was
verminderd. In plaats daarvan, in overeenstemming met een alternatieve verklaring, weerspiegelt de immuunfunctie de aanpassing aan veranderende omgevingsfactoren die de beschikbaarheid van hulpbronnen en de dreiging van ziekten beïnvloeden; variatie in alle vier maten voor het immuunsysteem werden verklaard door ten minste een of meer sociale factoren, terwijl de levensfase een ondergeschikte rol speelde. Het immuunsysteem speelt een belangrijke rol als natuurlijke afweer van het lichaam tegen infectie en ziekte. De sterkere invloed van sociale factoren kan te wijten zijn aan de veronderstelde hogere diversiteit van parasieten en pathogenen in tropische gebieden vergeleken met gematigde streken. Naast de variatie van immuunindexen als gevolg van gunstige sociale factoren, werd de immuunfunctie in roodkapleeuweriken ook beïnvloed door variatie in temperatuur en regen.
Van het niveau van het immuunsysteem wordt gesuggereerd dat het een afspiegeling vormt van de dreiging van infectie. Co-variatie van maten van het immuunsysteem met temperatuur en regenval kan dus een verhoogd risico op ziektes en/of pathogenen in het milieu weerspiegelen.
Concluderend onderstreept onze studie het belang van meer onderzoek in tropische gebieden naar de effecten van voedselbeschikbaarheid, weer en broed. Deze factoren variëren op een onvoorspelbare en niet-gesynchroniseerde manier, maar pieken tegelijkertijd in de meeste seizoensgebieden, in combinatie met de hoge diversiteit van waargenomen levensloopstrategieën in de tropen.
Samenvatting
133
variatie in weer en bronnen, die kenmerkend is voor veel equatoriale leefgebieden. Deze variatie hebben we onderzocht in samenhang met de veranderende sociale structuur van de vogels en het feit dat het hele jaar door gebroed wordt. De nestintensiteit (het totale aantal gevonden nesten per maand per zoekuur) was de belangrijkste factor die van invloed was op het activiteitsgebied van roodkapleeuweriken, die van toepassing was op het gecombineerde samengestelde activiteitsgebied van zowel broedvogels als niet-broedvogels én op het activiteitsgebied van niet-broedende leeuweriken.
De roodkapleeuweriken hadden grotere activiteitsgebieden als er maar weinig individuen broedden, maar de activiteitsgebieden werden kleiner naarmate het aantal broedparen toenam. De sociale organisatie tussen broedende en niet-broedende dieren verschilde ook: als er niet werd gebroed gingen de paartjes op in de grote groep, maar in de paar- en broedtijd scheidden de paartjes zich af van de rest. Broedende vogels worden beperkt tot gebieden in de buurt van hun nest, wat de kleinere woongebieden in deze periode kan verklaren. Voor niet-broedende vogels kan uitsluiting door de broedparen die territoriaal worden tot kleinere woongebieden leiden.
In hoofdstuk 4 van dit proefschrift hebben we gezocht naar antwoorden op de volgende vragen: (1) Kan de variatie in lichaamsgewicht in roodkapleeuweriken worden verklaard door de evolutionaire aanpassing aan langetermijnpatronen in weersomstandigheden, of door fenotypische plastische reacties op weersomstandigheden van het moment? (2) Hoe sterk zijn de weerpatronen bij het voorspellen van de beschikbaarheid van voedsel in de toekomst of varieert voedsel op een onvoorspelbare manier? (3) Varieert het lichaamsgewicht van roodkapleeuweriken afhankelijk van de levensfase, óf neemt het gewicht toe bij grotere voedselbeschikbaarheid doordat de vogel een buffer aanlegt om zichzelf te beschermen tegen voedselschaarste in de stochastische omgeving, onafhankelijk van de levensfase. Onze resultaten in dit hoofdstuk getuigen van de stochasticiteit en onvoorspelbaarheid van voedselbeschikbaarheid in de equatoriale afro-tropische omgevingen en de onbetrouwbaarheid van het weer als signaal voor toekomstige voedselbeschikbaarheid. Ondanks de verandering in weerpatronen van een historisch seizoensgebonden tot een huidig niet-seizoensgebonden omgeving, was het lichaamsgewicht van roodkapleeuweriken slechts gedeeltelijk te verklaren door fenotypisch plastische reacties op de huidige weersomstandigheden, en leek hij tot op zekere hoogte evolutionair aangepast aan langetermijn-weerpatronen. Hoewel de voedselbeschikbaarheid onvoorspelbaar was, vonden we geen bewijs dat vogels extra reserves accumuleren voor gebruik tijdens de broedtijd. Integendeel: het lichaamsgewicht van roodkapleeuweriken nam af bij een toegenomen voedselbeschikbaarheid, onafhankelijk van de levensfase, wat duidt op het hele jaar door voldoende voedselbeschikbaarheid voor de roodkapleeuweriken. Echter, ruiende vogels verminderden hun lichaamsgewicht bij hogere omgevingstemperaturen en gunstige omgevingscondities zelfs tot lagere niveaus dan vogels in rust. Met de beschikbaarheid van voldoende voedsel gedurende het hele jaar, kunnen roodkapleeuweriken onder gunstige omstandigheden tijdelijk een lager gewicht hebben. Zo worden negatieve effecten van een hoger lichaamsgewicht vermeden, zoals een verhoogde motorische belasting en een hogere gevoeligheid voor predatie. Dit is met name praktisch tijdens de rui, wanneer de vliegefficiëntie is verminderd vanwege ontbrekende veren en verminderd vleugeloppervlak.
Hoewel de temporele variatie in immuunfunctie bij dieren, en in het bijzonder gewervelde dieren, vaak wordt gerelateerd aan energetisch of nutritioneel veeleisende levensfasegebeurtenissen, zoals voortplanting en de rui, vonden we in hoofdstuk 5 van dit proefschrift geen bewijs dat de immuunfunctie van roodkapleeuweriken tijdens de broedtijd was
verminderd. In plaats daarvan, in overeenstemming met een alternatieve verklaring, weerspiegelt de immuunfunctie de aanpassing aan veranderende omgevingsfactoren die de beschikbaarheid van hulpbronnen en de dreiging van ziekten beïnvloeden; variatie in alle vier maten voor het immuunsysteem werden verklaard door ten minste een of meer sociale factoren, terwijl de levensfase een ondergeschikte rol speelde. Het immuunsysteem speelt een belangrijke rol als natuurlijke afweer van het lichaam tegen infectie en ziekte. De sterkere invloed van sociale factoren kan te wijten zijn aan de veronderstelde hogere diversiteit van parasieten en pathogenen in tropische gebieden vergeleken met gematigde streken. Naast de variatie van immuunindexen als gevolg van gunstige sociale factoren, werd de immuunfunctie in roodkapleeuweriken ook beïnvloed door variatie in temperatuur en regen.
Van het niveau van het immuunsysteem wordt gesuggereerd dat het een afspiegeling vormt van de dreiging van infectie. Co-variatie van maten van het immuunsysteem met temperatuur en regenval kan dus een verhoogd risico op ziektes en/of pathogenen in het milieu weerspiegelen.
Concluderend onderstreept onze studie het belang van meer onderzoek in tropische gebieden naar de effecten van voedselbeschikbaarheid, weer en broed. Deze factoren variëren op een onvoorspelbare en niet-gesynchroniseerde manier, maar pieken tegelijkertijd in de meeste seizoensgebieden, in combinatie met de hoge diversiteit van waargenomen levensloopstrategieën in de tropen.
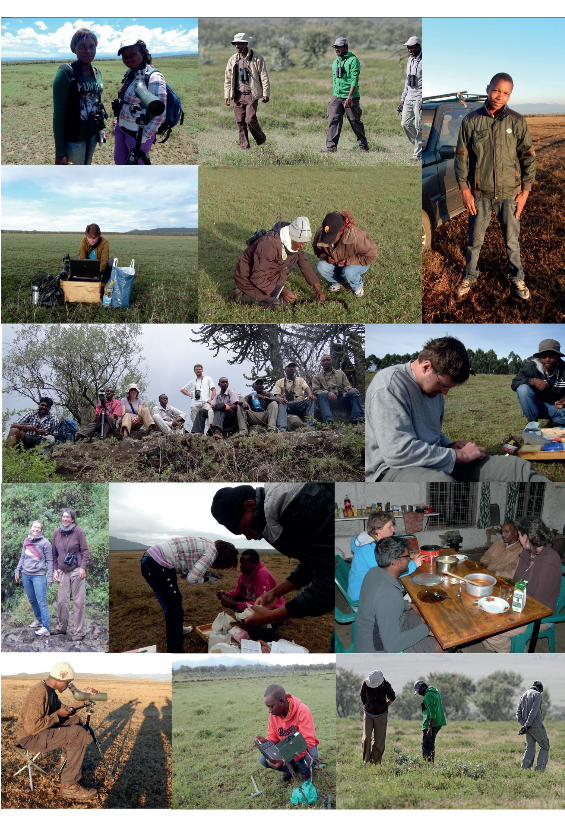

Acknowledgement During a PhD, a lot of people form the core plot and backbone of the story and even many more play support roles. To believe you can mention and acknowledge all their contribution is just but a futile attempt. However, to all of you, even you reading this acknowledgement, thank you for being part of the story. Now, a few words to the many friends and colleagues, without whom this journey would have remained nothing but a distant dream.
I dare to start with my family, for without them, even the academic journey would not have started. My lovely wife Cate, Thank you for everything. No words can express who you have been to me and our kids, Leslie and Seline. You allowed me to pursue my dream despite it taking me so far from home. You willingly took all the tasks and the many responsibilities that come with being a parent. Thank you for your support these past five years of my study. Certificates and other outputs may bear my name, but the accomplishments are as much mine as they are yours. I am truly blessed to have you as my life partner. My two lovely kids’ thank you for always welcoming me with a smile every single day. And for the first question every time I arrived in the Netherlands, Daddy utarudi lini?
Now pertaining to my academic journey. First, I would like to thank my promoter, Prof Irene. My PhD journey was ignited by our meeting at a small office in one of the corners at the National Museums of Kenya. I talked so much that I almost thought I'd chased you away. Poured my heart out and probably narrated my lifetime. I am glad you still gave me an opportunity to join your group and together we fundraised for my PhD. I am so lucky that you were my mentor and supervisor during my PhD. Your insights, critical thinking and clarity during our discussions made it so much easier to develop my scientific thinking. Although my smile briefly disappeared every time I received a repainted draft, I enjoyed every moment of our discussions. Beyond the supervision, I am very grateful to you for being a friend. Studying so far away from my family was a big challenge, but you were always there to advise me and bore with me when my academic outputs were on a slump. Thank you for going out of your way to help ensure I finished my PhD. I look forward to our continued collaboration.
I would like to pay special gratitude to my reading committee Prof J. Komdeur, Prof W. Cresswell and Prof. H. Olff. I am indebted to the three of you for taking the time to read my thesis.
Special thanks go to Kedong management, Amos and Oscar for giving us access to the site. It was a lovely place to conduct our field work. Thank you also for allowing us set our weather stations and for making sure it’s safe free of any disturbance. I also wish to express my gratitude to the late Sarah Higgins who gave us a home to stay during the early day’s fieldwork and for hosting visiting colleagues. Your passion for conservation and dedication towards rehabilitation of birds of prey was a motivation and inspiration to many. Although you were promoted to glory, your spirit lives on.
I would also like to thank my colleagues in Irene's group, and fellow office mates for the many stimulating discussions and lab lunch meetings we had. Sincere apologies for the nagging quick questions, and intruding your work stations. Maaike, Pieter, Nathan, Henry, Chima, Lucie, Marco, Morine, Arne, Kevin, Juan and the many visiting researchers, masters and bachelors
Acknowledgements
137
Acknowledgement During a PhD, a lot of people form the core plot and backbone of the story and even many more play support roles. To believe you can mention and acknowledge all their contribution is just but a futile attempt. However, to all of you, even you reading this acknowledgement, thank you for being part of the story. Now, a few words to the many friends and colleagues, without whom this journey would have remained nothing but a distant dream.
I dare to start with my family, for without them, even the academic journey would not have started. My lovely wife Cate, Thank you for everything. No words can express who you have been to me and our kids, Leslie and Seline. You allowed me to pursue my dream despite it taking me so far from home. You willingly took all the tasks and the many responsibilities that come with being a parent. Thank you for your support these past five years of my study. Certificates and other outputs may bear my name, but the accomplishments are as much mine as they are yours. I am truly blessed to have you as my life partner. My two lovely kids’ thank you for always welcoming me with a smile every single day. And for the first question every time I arrived in the Netherlands, Daddy utarudi lini?
Now pertaining to my academic journey. First, I would like to thank my promoter, Prof Irene. My PhD journey was ignited by our meeting at a small office in one of the corners at the National Museums of Kenya. I talked so much that I almost thought I'd chased you away. Poured my heart out and probably narrated my lifetime. I am glad you still gave me an opportunity to join your group and together we fundraised for my PhD. I am so lucky that you were my mentor and supervisor during my PhD. Your insights, critical thinking and clarity during our discussions made it so much easier to develop my scientific thinking. Although my smile briefly disappeared every time I received a repainted draft, I enjoyed every moment of our discussions. Beyond the supervision, I am very grateful to you for being a friend. Studying so far away from my family was a big challenge, but you were always there to advise me and bore with me when my academic outputs were on a slump. Thank you for going out of your way to help ensure I finished my PhD. I look forward to our continued collaboration.
I would like to pay special gratitude to my reading committee Prof J. Komdeur, Prof W. Cresswell and Prof. H. Olff. I am indebted to the three of you for taking the time to read my thesis.
Special thanks go to Kedong management, Amos and Oscar for giving us access to the site. It was a lovely place to conduct our field work. Thank you also for allowing us set our weather stations and for making sure it’s safe free of any disturbance. I also wish to express my gratitude to the late Sarah Higgins who gave us a home to stay during the early day’s fieldwork and for hosting visiting colleagues. Your passion for conservation and dedication towards rehabilitation of birds of prey was a motivation and inspiration to many. Although you were promoted to glory, your spirit lives on.
I would also like to thank my colleagues in Irene's group, and fellow office mates for the many stimulating discussions and lab lunch meetings we had. Sincere apologies for the nagging quick questions, and intruding your work stations. Maaike, Pieter, Nathan, Henry, Chima, Lucie, Marco, Morine, Arne, Kevin, Juan and the many visiting researchers, masters and bachelors
Acknowledgements
137
Acknowledgement During a PhD, a lot of people form the core plot and backbone of the story and even many more play support roles. To believe you can mention and acknowledge all their contribution is just but a futile attempt. However, to all of you, even you reading this acknowledgement, thank you for being part of the story. Now, a few words to the many friends and colleagues, without whom this journey would have remained nothing but a distant dream.
I dare to start with my family, for without them, even the academic journey would not have started. My lovely wife Cate, Thank you for everything. No words can express who you have been to me and our kids, Leslie and Seline. You allowed me to pursue my dream despite it taking me so far from home. You willingly took all the tasks and the many responsibilities that come with being a parent. Thank you for your support these past five years of my study. Certificates and other outputs may bear my name, but the accomplishments are as much mine as they are yours. I am truly blessed to have you as my life partner. My two lovely kids’ thank you for always welcoming me with a smile every single day. And for the first question every time I arrived in the Netherlands, Daddy utarudi lini?
Now pertaining to my academic journey. First, I would like to thank my promoter, Prof Irene. My PhD journey was ignited by our meeting at a small office in one of the corners at the National Museums of Kenya. I talked so much that I almost thought I'd chased you away. Poured my heart out and probably narrated my lifetime. I am glad you still gave me an opportunity to join your group and together we fundraised for my PhD. I am so lucky that you were my mentor and supervisor during my PhD. Your insights, critical thinking and clarity during our discussions made it so much easier to develop my scientific thinking. Although my smile briefly disappeared every time I received a repainted draft, I enjoyed every moment of our discussions. Beyond the supervision, I am very grateful to you for being a friend. Studying so far away from my family was a big challenge, but you were always there to advise me and bore with me when my academic outputs were on a slump. Thank you for going out of your way to help ensure I finished my PhD. I look forward to our continued collaboration.
I would like to pay special gratitude to my reading committee Prof J. Komdeur, Prof W. Cresswell and Prof. H. Olff. I am indebted to the three of you for taking the time to read my thesis.
Special thanks go to Kedong management, Amos and Oscar for giving us access to the site. It was a lovely place to conduct our field work. Thank you also for allowing us set our weather stations and for making sure it’s safe free of any disturbance. I also wish to express my gratitude to the late Sarah Higgins who gave us a home to stay during the early day’s fieldwork and for hosting visiting colleagues. Your passion for conservation and dedication towards rehabilitation of birds of prey was a motivation and inspiration to many. Although you were promoted to glory, your spirit lives on.
I would also like to thank my colleagues in Irene's group, and fellow office mates for the many stimulating discussions and lab lunch meetings we had. Sincere apologies for the nagging quick questions, and intruding your work stations. Maaike, Pieter, Nathan, Henry, Chima, Lucie, Marco, Morine, Arne, Kevin, Juan and the many visiting researchers, masters and bachelors
Acknowledgements
138
students who joined at various time. In a special way, I would like to express my gratitude to Maaike. Where do I begin! ;-) You made my stay in the Netherlands always feel like home. From the early days, you helped me understand the Netherlands culture. The many discussions we had from naming in our different cultures to the way people relate to each other. Your invitations whenever you had an informal activity enriched my understanding of the Netherlands so much and broke the monotony of always engaging in academics. Beyond your friendship, you were a great office mate. More than any PhD student could ask for. Your guidance in statistics, in R and in the lab was pivotal to finishing my PhD. You were always there whenever I got stuck and for that, I will be forever grateful. I am so humbled that you also accepted to be part of my last PhD ceremony as my Paranymp. You have been a true sister. Asanti sana na Mungu akubariki
Henry, you cleared the path for me and laid a foundation that I built my research on. Together with Irene, you started such an amazing team. I started my study when you were in the thick of things, but you always answered the queries I had. It was so smooth transitioning to my project. Thank you for everything. Congratulations on your PhD Daktari.
Chima, my collabo, together we’ve walked our PhD journeys and it’s an honour that we get to defend the same day. You are such an amazing person and a great friend. The many insightful discussions we had helped bring so much clarity during analysis, writing and tackling the many reviewer comments on the mysterious tropical system. I have learnt so much from you my friend. You are a professor in the making. Keep up with the energy and never-ending constructive critique of current established ‘hypotheses’ for lack of a better word.
Bakari my brother, when we met many years ago, we never imagined together we would find ourselves in a new continent, so different from home that at first even shopping at the supermarket was always an adventure. It was so good having you around. The many barbecues we had even during winter and the frequent social gathering with your friends shortened the long stays away from home. I wish you all the best as you plan to delve into the academic life of pursuing a PhD.
Mi amigo y compañero en el crimen Juan Diego. It was great meeting you and knowing you as a colleague and a friend. You brought so much warmth into our group. Sincere gratitude for the many times you invited me to share dinner with your family. They always brightened my stay and kept the family connect even when I was so far from home. Olivia, thank you for always welcoming me. For the smiles, and the lovely food. And for sharing your home. Marcos and Laura, your invite to join your “games” was always a welcome distraction from the serious discussions we were having with Papi. You reminded me so much about my kids.
Lucie, thank you for being like family when I came to the Netherlands. You were a great office mate. Thank you for the wonderful times during barbecues and the once in a while dances. The many social events and demystifying the Dutch culture from a visitor perspective. Thank you for your constant encouragement and motivation during the early days of my PhD when nothing seemed to be moving. Our trip to the Alps is still my highlight for the stay in Europe. It was so great visiting France, tasting the awesome cheese and most of all visiting your parents. What an experience it was. I am yet to find better tasting Champagne than the one we had at your place. Looking forward to receiving you in Kenya someday. Welcome to the land of Hakuna Matata.
I would like to thanks our research team; Mwangi, Paul, Peter, Bakari, Ciiku, Ken, Kamau, without whom this work would not have completed. Besides the core research time, many more contributed to our amazing fieldwork; Dominic, Maaike, Irene, Claudia, Arne, Otau, Jimmy, Gitogo, Pieter and many more that I might have forgotten to mention. As the Kikuyu saying goes "Kamuingi koyaga ndiri”. The team spirit, dedication and willingness to the project was nothing
short of exceptional. Not even one day did you let me down, nor did you let me feel the weight of the field work on my shoulders. Together we walked the journey and this thesis and other outcomes are as much my accomplishment as they are yours. Paul Kimani, since we met when I was starting my MSc field work in Kinangop, you were always eager to learn. Now you’re a fully fledged ringer and an expert in the field. Your knack for combining science and business remains a mystery. Mwangi, my namesake, few words can describe your contribution to our Lark project. From being my stand-in manager and assistant when I was away to you being our field mechanic. Your drive and ability to think outside the box whenever we were faced with a challenge was always inspiring. And for the “Karofo” reke icio ciume nene. Peter Kinyanjui, I am so happy about the progress you have made. You were always a man of few words, but very thoughtful. Your intriguing questions always made for a good discussion. I see you going far my friend and wish you all the best in your academic journey. Naomi Wanjiku “Ciiku”, when you joined our team, you brought so much laughter with your never-ending jokes. You fitted seamlessly like you were part of the original fabric. Your energy in the field was always a big motivation for all of us. Tirelessly, you tracked birds with a smile on your face. How blessed we were that you were part of the field team. Mary Mwangi, you joined the team for only one year correcting data for your masters. Thank you for your constant encouragement especially when fixing equipment late in the night after a tiring field day. Congratulations on your masters. You fully deserve it for you are such a hard working lady. I am proud of you for how far you've come since our early days at Moi University during our bachelors. A great career waits.
Corine, what would we do as PhD students without you? You epitomize the power of a woman in ways that are difficult to comprehend. You are always there to provide us with direction and advice whenever we are stuck or unsure of who to turn to. I am so grateful for the major role you played when I was requesting an extension and also during my last visit to finish writing my thesis. We as PhD students are truly blessed to have you as our coordinator.
I would also like to acknowledge the Animal ecology group and later the Behavioural and Physiology group for the scientific discussions and the critical feedback that I received during my presentations: Janne, Yvonne, Maaike, Quigqing, Jelle, Long, Lei, Frank, Pieter, Lucie, Raymond, Jelmer, Richard, Marco, Raymond, Christiaan, Joost, Jeroen, Sjouke, Hacen, Martijn, Simon, Blanca, Juan, Inger, Marion, Rienk, Reinaldo, Michela, Jesse, Kat, Berber, Seyed, Christina, Yoran, Claudia, Henry, Chima, Arne, Kevin, Ruth, Annelies, Georgette, Yoran, Marijn and anyone I may have forgotten. It was always great to have you all during the coffee breaks and the social events at the Biotop. Special mention to Ruth for the help and guidance analyzing vegetation index images, Marco for the assistance in the lab and Yoran for translating my short thesis summary to Dutch.
Special gratitude to Joyce and Ingeborg, for the assistance with the many queries and administrative assistance. Thank you, Roos and Allert, for welcoming me to Nioz for the brief visit. I am so glad Roos that the visit bore fruit and we managed to publish the nest survival paper.
Behind the scenes, was the amazing team from the research and volarisation office. Thank you for administering my NFP scholarship. Wiebe, together with your colleagues, past and present, Gonny, Eric and Esme; you always made sure my finances were in order, my travel and my visa arrangements. I am very grateful to you all for such a smooth stay in the Netherlands.
The badminton crew, Juan Diego, Christina, Weiteng, Jing, Yang, and the many who joined later. What a good time we had. The games were always refreshing and filled with laughter. You are all amazing people and it was beautiful sharing the fun moments with you guys.
Acknowledgements
139
students who joined at various time. In a special way, I would like to express my gratitude to Maaike. Where do I begin! ;-) You made my stay in the Netherlands always feel like home. From the early days, you helped me understand the Netherlands culture. The many discussions we had from naming in our different cultures to the way people relate to each other. Your invitations whenever you had an informal activity enriched my understanding of the Netherlands so much and broke the monotony of always engaging in academics. Beyond your friendship, you were a great office mate. More than any PhD student could ask for. Your guidance in statistics, in R and in the lab was pivotal to finishing my PhD. You were always there whenever I got stuck and for that, I will be forever grateful. I am so humbled that you also accepted to be part of my last PhD ceremony as my Paranymp. You have been a true sister. Asanti sana na Mungu akubariki
Henry, you cleared the path for me and laid a foundation that I built my research on. Together with Irene, you started such an amazing team. I started my study when you were in the thick of things, but you always answered the queries I had. It was so smooth transitioning to my project. Thank you for everything. Congratulations on your PhD Daktari.
Chima, my collabo, together we’ve walked our PhD journeys and it’s an honour that we get to defend the same day. You are such an amazing person and a great friend. The many insightful discussions we had helped bring so much clarity during analysis, writing and tackling the many reviewer comments on the mysterious tropical system. I have learnt so much from you my friend. You are a professor in the making. Keep up with the energy and never-ending constructive critique of current established ‘hypotheses’ for lack of a better word.
Bakari my brother, when we met many years ago, we never imagined together we would find ourselves in a new continent, so different from home that at first even shopping at the supermarket was always an adventure. It was so good having you around. The many barbecues we had even during winter and the frequent social gathering with your friends shortened the long stays away from home. I wish you all the best as you plan to delve into the academic life of pursuing a PhD.
Mi amigo y compañero en el crimen Juan Diego. It was great meeting you and knowing you as a colleague and a friend. You brought so much warmth into our group. Sincere gratitude for the many times you invited me to share dinner with your family. They always brightened my stay and kept the family connect even when I was so far from home. Olivia, thank you for always welcoming me. For the smiles, and the lovely food. And for sharing your home. Marcos and Laura, your invite to join your “games” was always a welcome distraction from the serious discussions we were having with Papi. You reminded me so much about my kids.
Lucie, thank you for being like family when I came to the Netherlands. You were a great office mate. Thank you for the wonderful times during barbecues and the once in a while dances. The many social events and demystifying the Dutch culture from a visitor perspective. Thank you for your constant encouragement and motivation during the early days of my PhD when nothing seemed to be moving. Our trip to the Alps is still my highlight for the stay in Europe. It was so great visiting France, tasting the awesome cheese and most of all visiting your parents. What an experience it was. I am yet to find better tasting Champagne than the one we had at your place. Looking forward to receiving you in Kenya someday. Welcome to the land of Hakuna Matata.
I would like to thanks our research team; Mwangi, Paul, Peter, Bakari, Ciiku, Ken, Kamau, without whom this work would not have completed. Besides the core research time, many more contributed to our amazing fieldwork; Dominic, Maaike, Irene, Claudia, Arne, Otau, Jimmy, Gitogo, Pieter and many more that I might have forgotten to mention. As the Kikuyu saying goes "Kamuingi koyaga ndiri”. The team spirit, dedication and willingness to the project was nothing
short of exceptional. Not even one day did you let me down, nor did you let me feel the weight of the field work on my shoulders. Together we walked the journey and this thesis and other outcomes are as much my accomplishment as they are yours. Paul Kimani, since we met when I was starting my MSc field work in Kinangop, you were always eager to learn. Now you’re a fully fledged ringer and an expert in the field. Your knack for combining science and business remains a mystery. Mwangi, my namesake, few words can describe your contribution to our Lark project. From being my stand-in manager and assistant when I was away to you being our field mechanic. Your drive and ability to think outside the box whenever we were faced with a challenge was always inspiring. And for the “Karofo” reke icio ciume nene. Peter Kinyanjui, I am so happy about the progress you have made. You were always a man of few words, but very thoughtful. Your intriguing questions always made for a good discussion. I see you going far my friend and wish you all the best in your academic journey. Naomi Wanjiku “Ciiku”, when you joined our team, you brought so much laughter with your never-ending jokes. You fitted seamlessly like you were part of the original fabric. Your energy in the field was always a big motivation for all of us. Tirelessly, you tracked birds with a smile on your face. How blessed we were that you were part of the field team. Mary Mwangi, you joined the team for only one year correcting data for your masters. Thank you for your constant encouragement especially when fixing equipment late in the night after a tiring field day. Congratulations on your masters. You fully deserve it for you are such a hard working lady. I am proud of you for how far you've come since our early days at Moi University during our bachelors. A great career waits.
Corine, what would we do as PhD students without you? You epitomize the power of a woman in ways that are difficult to comprehend. You are always there to provide us with direction and advice whenever we are stuck or unsure of who to turn to. I am so grateful for the major role you played when I was requesting an extension and also during my last visit to finish writing my thesis. We as PhD students are truly blessed to have you as our coordinator.
I would also like to acknowledge the Animal ecology group and later the Behavioural and Physiology group for the scientific discussions and the critical feedback that I received during my presentations: Janne, Yvonne, Maaike, Quigqing, Jelle, Long, Lei, Frank, Pieter, Lucie, Raymond, Jelmer, Richard, Marco, Raymond, Christiaan, Joost, Jeroen, Sjouke, Hacen, Martijn, Simon, Blanca, Juan, Inger, Marion, Rienk, Reinaldo, Michela, Jesse, Kat, Berber, Seyed, Christina, Yoran, Claudia, Henry, Chima, Arne, Kevin, Ruth, Annelies, Georgette, Yoran, Marijn and anyone I may have forgotten. It was always great to have you all during the coffee breaks and the social events at the Biotop. Special mention to Ruth for the help and guidance analyzing vegetation index images, Marco for the assistance in the lab and Yoran for translating my short thesis summary to Dutch.
Special gratitude to Joyce and Ingeborg, for the assistance with the many queries and administrative assistance. Thank you, Roos and Allert, for welcoming me to Nioz for the brief visit. I am so glad Roos that the visit bore fruit and we managed to publish the nest survival paper.
Behind the scenes, was the amazing team from the research and volarisation office. Thank you for administering my NFP scholarship. Wiebe, together with your colleagues, past and present, Gonny, Eric and Esme; you always made sure my finances were in order, my travel and my visa arrangements. I am very grateful to you all for such a smooth stay in the Netherlands.
The badminton crew, Juan Diego, Christina, Weiteng, Jing, Yang, and the many who joined later. What a good time we had. The games were always refreshing and filled with laughter. You are all amazing people and it was beautiful sharing the fun moments with you guys.
Acknowledgements
138
students who joined at various time. In a special way, I would like to express my gratitude to Maaike. Where do I begin! ;-) You made my stay in the Netherlands always feel like home. From the early days, you helped me understand the Netherlands culture. The many discussions we had from naming in our different cultures to the way people relate to each other. Your invitations whenever you had an informal activity enriched my understanding of the Netherlands so much and broke the monotony of always engaging in academics. Beyond your friendship, you were a great office mate. More than any PhD student could ask for. Your guidance in statistics, in R and in the lab was pivotal to finishing my PhD. You were always there whenever I got stuck and for that, I will be forever grateful. I am so humbled that you also accepted to be part of my last PhD ceremony as my Paranymp. You have been a true sister. Asanti sana na Mungu akubariki
Henry, you cleared the path for me and laid a foundation that I built my research on. Together with Irene, you started such an amazing team. I started my study when you were in the thick of things, but you always answered the queries I had. It was so smooth transitioning to my project. Thank you for everything. Congratulations on your PhD Daktari.
Chima, my collabo, together we’ve walked our PhD journeys and it’s an honour that we get to defend the same day. You are such an amazing person and a great friend. The many insightful discussions we had helped bring so much clarity during analysis, writing and tackling the many reviewer comments on the mysterious tropical system. I have learnt so much from you my friend. You are a professor in the making. Keep up with the energy and never-ending constructive critique of current established ‘hypotheses’ for lack of a better word.
Bakari my brother, when we met many years ago, we never imagined together we would find ourselves in a new continent, so different from home that at first even shopping at the supermarket was always an adventure. It was so good having you around. The many barbecues we had even during winter and the frequent social gathering with your friends shortened the long stays away from home. I wish you all the best as you plan to delve into the academic life of pursuing a PhD.
Mi amigo y compañero en el crimen Juan Diego. It was great meeting you and knowing you as a colleague and a friend. You brought so much warmth into our group. Sincere gratitude for the many times you invited me to share dinner with your family. They always brightened my stay and kept the family connect even when I was so far from home. Olivia, thank you for always welcoming me. For the smiles, and the lovely food. And for sharing your home. Marcos and Laura, your invite to join your “games” was always a welcome distraction from the serious discussions we were having with Papi. You reminded me so much about my kids.
Lucie, thank you for being like family when I came to the Netherlands. You were a great office mate. Thank you for the wonderful times during barbecues and the once in a while dances. The many social events and demystifying the Dutch culture from a visitor perspective. Thank you for your constant encouragement and motivation during the early days of my PhD when nothing seemed to be moving. Our trip to the Alps is still my highlight for the stay in Europe. It was so great visiting France, tasting the awesome cheese and most of all visiting your parents. What an experience it was. I am yet to find better tasting Champagne than the one we had at your place. Looking forward to receiving you in Kenya someday. Welcome to the land of Hakuna Matata.
I would like to thanks our research team; Mwangi, Paul, Peter, Bakari, Ciiku, Ken, Kamau, without whom this work would not have completed. Besides the core research time, many more contributed to our amazing fieldwork; Dominic, Maaike, Irene, Claudia, Arne, Otau, Jimmy, Gitogo, Pieter and many more that I might have forgotten to mention. As the Kikuyu saying goes "Kamuingi koyaga ndiri”. The team spirit, dedication and willingness to the project was nothing
short of exceptional. Not even one day did you let me down, nor did you let me feel the weight of the field work on my shoulders. Together we walked the journey and this thesis and other outcomes are as much my accomplishment as they are yours. Paul Kimani, since we met when I was starting my MSc field work in Kinangop, you were always eager to learn. Now you’re a fully fledged ringer and an expert in the field. Your knack for combining science and business remains a mystery. Mwangi, my namesake, few words can describe your contribution to our Lark project. From being my stand-in manager and assistant when I was away to you being our field mechanic. Your drive and ability to think outside the box whenever we were faced with a challenge was always inspiring. And for the “Karofo” reke icio ciume nene. Peter Kinyanjui, I am so happy about the progress you have made. You were always a man of few words, but very thoughtful. Your intriguing questions always made for a good discussion. I see you going far my friend and wish you all the best in your academic journey. Naomi Wanjiku “Ciiku”, when you joined our team, you brought so much laughter with your never-ending jokes. You fitted seamlessly like you were part of the original fabric. Your energy in the field was always a big motivation for all of us. Tirelessly, you tracked birds with a smile on your face. How blessed we were that you were part of the field team. Mary Mwangi, you joined the team for only one year correcting data for your masters. Thank you for your constant encouragement especially when fixing equipment late in the night after a tiring field day. Congratulations on your masters. You fully deserve it for you are such a hard working lady. I am proud of you for how far you've come since our early days at Moi University during our bachelors. A great career waits.
Corine, what would we do as PhD students without you? You epitomize the power of a woman in ways that are difficult to comprehend. You are always there to provide us with direction and advice whenever we are stuck or unsure of who to turn to. I am so grateful for the major role you played when I was requesting an extension and also during my last visit to finish writing my thesis. We as PhD students are truly blessed to have you as our coordinator.
I would also like to acknowledge the Animal ecology group and later the Behavioural and Physiology group for the scientific discussions and the critical feedback that I received during my presentations: Janne, Yvonne, Maaike, Quigqing, Jelle, Long, Lei, Frank, Pieter, Lucie, Raymond, Jelmer, Richard, Marco, Raymond, Christiaan, Joost, Jeroen, Sjouke, Hacen, Martijn, Simon, Blanca, Juan, Inger, Marion, Rienk, Reinaldo, Michela, Jesse, Kat, Berber, Seyed, Christina, Yoran, Claudia, Henry, Chima, Arne, Kevin, Ruth, Annelies, Georgette, Yoran, Marijn and anyone I may have forgotten. It was always great to have you all during the coffee breaks and the social events at the Biotop. Special mention to Ruth for the help and guidance analyzing vegetation index images, Marco for the assistance in the lab and Yoran for translating my short thesis summary to Dutch.
Special gratitude to Joyce and Ingeborg, for the assistance with the many queries and administrative assistance. Thank you, Roos and Allert, for welcoming me to Nioz for the brief visit. I am so glad Roos that the visit bore fruit and we managed to publish the nest survival paper.
Behind the scenes, was the amazing team from the research and volarisation office. Thank you for administering my NFP scholarship. Wiebe, together with your colleagues, past and present, Gonny, Eric and Esme; you always made sure my finances were in order, my travel and my visa arrangements. I am very grateful to you all for such a smooth stay in the Netherlands.
The badminton crew, Juan Diego, Christina, Weiteng, Jing, Yang, and the many who joined later. What a good time we had. The games were always refreshing and filled with laughter. You are all amazing people and it was beautiful sharing the fun moments with you guys.
Acknowledgements
139
students who joined at various time. In a special way, I would like to express my gratitude to Maaike. Where do I begin! ;-) You made my stay in the Netherlands always feel like home. From the early days, you helped me understand the Netherlands culture. The many discussions we had from naming in our different cultures to the way people relate to each other. Your invitations whenever you had an informal activity enriched my understanding of the Netherlands so much and broke the monotony of always engaging in academics. Beyond your friendship, you were a great office mate. More than any PhD student could ask for. Your guidance in statistics, in R and in the lab was pivotal to finishing my PhD. You were always there whenever I got stuck and for that, I will be forever grateful. I am so humbled that you also accepted to be part of my last PhD ceremony as my Paranymp. You have been a true sister. Asanti sana na Mungu akubariki
Henry, you cleared the path for me and laid a foundation that I built my research on. Together with Irene, you started such an amazing team. I started my study when you were in the thick of things, but you always answered the queries I had. It was so smooth transitioning to my project. Thank you for everything. Congratulations on your PhD Daktari.
Chima, my collabo, together we’ve walked our PhD journeys and it’s an honour that we get to defend the same day. You are such an amazing person and a great friend. The many insightful discussions we had helped bring so much clarity during analysis, writing and tackling the many reviewer comments on the mysterious tropical system. I have learnt so much from you my friend. You are a professor in the making. Keep up with the energy and never-ending constructive critique of current established ‘hypotheses’ for lack of a better word.
Bakari my brother, when we met many years ago, we never imagined together we would find ourselves in a new continent, so different from home that at first even shopping at the supermarket was always an adventure. It was so good having you around. The many barbecues we had even during winter and the frequent social gathering with your friends shortened the long stays away from home. I wish you all the best as you plan to delve into the academic life of pursuing a PhD.
Mi amigo y compañero en el crimen Juan Diego. It was great meeting you and knowing you as a colleague and a friend. You brought so much warmth into our group. Sincere gratitude for the many times you invited me to share dinner with your family. They always brightened my stay and kept the family connect even when I was so far from home. Olivia, thank you for always welcoming me. For the smiles, and the lovely food. And for sharing your home. Marcos and Laura, your invite to join your “games” was always a welcome distraction from the serious discussions we were having with Papi. You reminded me so much about my kids.
Lucie, thank you for being like family when I came to the Netherlands. You were a great office mate. Thank you for the wonderful times during barbecues and the once in a while dances. The many social events and demystifying the Dutch culture from a visitor perspective. Thank you for your constant encouragement and motivation during the early days of my PhD when nothing seemed to be moving. Our trip to the Alps is still my highlight for the stay in Europe. It was so great visiting France, tasting the awesome cheese and most of all visiting your parents. What an experience it was. I am yet to find better tasting Champagne than the one we had at your place. Looking forward to receiving you in Kenya someday. Welcome to the land of Hakuna Matata.
I would like to thanks our research team; Mwangi, Paul, Peter, Bakari, Ciiku, Ken, Kamau, without whom this work would not have completed. Besides the core research time, many more contributed to our amazing fieldwork; Dominic, Maaike, Irene, Claudia, Arne, Otau, Jimmy, Gitogo, Pieter and many more that I might have forgotten to mention. As the Kikuyu saying goes "Kamuingi koyaga ndiri”. The team spirit, dedication and willingness to the project was nothing
short of exceptional. Not even one day did you let me down, nor did you let me feel the weight of the field work on my shoulders. Together we walked the journey and this thesis and other outcomes are as much my accomplishment as they are yours. Paul Kimani, since we met when I was starting my MSc field work in Kinangop, you were always eager to learn. Now you’re a fully fledged ringer and an expert in the field. Your knack for combining science and business remains a mystery. Mwangi, my namesake, few words can describe your contribution to our Lark project. From being my stand-in manager and assistant when I was away to you being our field mechanic. Your drive and ability to think outside the box whenever we were faced with a challenge was always inspiring. And for the “Karofo” reke icio ciume nene. Peter Kinyanjui, I am so happy about the progress you have made. You were always a man of few words, but very thoughtful. Your intriguing questions always made for a good discussion. I see you going far my friend and wish you all the best in your academic journey. Naomi Wanjiku “Ciiku”, when you joined our team, you brought so much laughter with your never-ending jokes. You fitted seamlessly like you were part of the original fabric. Your energy in the field was always a big motivation for all of us. Tirelessly, you tracked birds with a smile on your face. How blessed we were that you were part of the field team. Mary Mwangi, you joined the team for only one year correcting data for your masters. Thank you for your constant encouragement especially when fixing equipment late in the night after a tiring field day. Congratulations on your masters. You fully deserve it for you are such a hard working lady. I am proud of you for how far you've come since our early days at Moi University during our bachelors. A great career waits.
Corine, what would we do as PhD students without you? You epitomize the power of a woman in ways that are difficult to comprehend. You are always there to provide us with direction and advice whenever we are stuck or unsure of who to turn to. I am so grateful for the major role you played when I was requesting an extension and also during my last visit to finish writing my thesis. We as PhD students are truly blessed to have you as our coordinator.
I would also like to acknowledge the Animal ecology group and later the Behavioural and Physiology group for the scientific discussions and the critical feedback that I received during my presentations: Janne, Yvonne, Maaike, Quigqing, Jelle, Long, Lei, Frank, Pieter, Lucie, Raymond, Jelmer, Richard, Marco, Raymond, Christiaan, Joost, Jeroen, Sjouke, Hacen, Martijn, Simon, Blanca, Juan, Inger, Marion, Rienk, Reinaldo, Michela, Jesse, Kat, Berber, Seyed, Christina, Yoran, Claudia, Henry, Chima, Arne, Kevin, Ruth, Annelies, Georgette, Yoran, Marijn and anyone I may have forgotten. It was always great to have you all during the coffee breaks and the social events at the Biotop. Special mention to Ruth for the help and guidance analyzing vegetation index images, Marco for the assistance in the lab and Yoran for translating my short thesis summary to Dutch.
Special gratitude to Joyce and Ingeborg, for the assistance with the many queries and administrative assistance. Thank you, Roos and Allert, for welcoming me to Nioz for the brief visit. I am so glad Roos that the visit bore fruit and we managed to publish the nest survival paper.
Behind the scenes, was the amazing team from the research and volarisation office. Thank you for administering my NFP scholarship. Wiebe, together with your colleagues, past and present, Gonny, Eric and Esme; you always made sure my finances were in order, my travel and my visa arrangements. I am very grateful to you all for such a smooth stay in the Netherlands.
The badminton crew, Juan Diego, Christina, Weiteng, Jing, Yang, and the many who joined later. What a good time we had. The games were always refreshing and filled with laughter. You are all amazing people and it was beautiful sharing the fun moments with you guys.

Acknowledgements
140
Maxwell and Lisbeth, thank you for providing me with an escape away from the buzzing city of Groningen. It was always a highlight visiting you and your family. For the four years, I have been in the Netherlands; you always made me feel at home.
Kirsten, since we met in Kenya, you’ve been awesome. The many invites to your home, dinner with your family both at home and in town, and the social drinks with Maaike. Thank you for your never-ending smile. And for the Groningen book that makes it so easy to tell stories of where I study. I am very grateful to you for accepting to be my paranymph and for translating my thesis summary to Dutch. I hope that your future plans come to fruition and you visit Kenya with your family. It would be so great hosting you. Karibuni sana nyumbani.
And last but definitely not least, I want to thank all those people who were there for me and my family when my daughter got sick. I am so blessed to be surrounded by such amazing people. You gave us a shoulder to lean on and travelled with us during these challenging times. I can never be able to thank you enough but I pray that you find favour in God in all your endeavors.
142
Affiliations of co-authors B. Irene Tieleman 1
Henry K. Ndithia 1, 2 Maaike A, Versteegh 1
Muchane Muchai 2,3
Raymond H. G. Klaassen 1
Rosemarie Kentie 1,4
Samuel N. Bakari 2 1Groningen Institute for Evolutionary Life Sciences, University of Groningen, P.O. Box 11103, 9 9700 CC Groningen, the Netherlands 10 2Ornithology Section, Department of Zoology, National Museums of Kenya, P.O. Box 40658 – 11 00100 GPO, Nairobi, Kenya 12 3Current address: Department of Clinical Studies (Wildlife and Conservation), College of 13 Agriculture and Veterinary Sciences, University of Nairobi. P.O. Box 30197-00100, Nairobi. 4Zoology Department, University of Oxford, Oxford, OX1 3PS, UK.
Coping with uncertainty
Adapting to stochasticity in an unpredictable tropical environment
Joseph Mutahi Mwangi
Coping w
ith uncertainty
Joseph Mutahi M
wangi
2019
InvitationTo attend the public defence
of my PhD thesis entitled
Coping with uncertainty Adapting to stochasticity
in an unpredictable tropical environment
Joseph Mutahi Mwangi
Friday, 14th of June 2019,at 12.45 hours
In the Doopsgezinde Kerk, Oude Boteringestraat 33,
Groningen
Paranymphs
Maaike [email protected]
and
Kirsten [email protected]
Related Documents