University of Groningen A Dual-band Millimeter-wave Kinetic Inductance Camera for the IRAM 30 m Telescope Monfardini, A.; Benoit, A.; Bideaud, A.; Swenson, L.; Cruciani, A.; Camus, P.; Hoffmann, C.; Désert, F. X.; Doyle, S.; Ade, P. Published in: Astrophysical journal supplement series DOI: 10.1088/0067-0049/194/2/24 IMPORTANT NOTE: You are advised to consult the publisher's version (publisher's PDF) if you wish to cite from it. Please check the document version below. Document Version Publisher's PDF, also known as Version of record Publication date: 2011 Link to publication in University of Groningen/UMCG research database Citation for published version (APA): Monfardini, A., Benoit, A., Bideaud, A., Swenson, L., Cruciani, A., Camus, P., ... Giordano, C. (2011). A Dual-band Millimeter-wave Kinetic Inductance Camera for the IRAM 30 m Telescope. Astrophysical journal supplement series, 194(2), [24]. DOI: 10.1088/0067-0049/194/2/24 Copyright Other than for strictly personal use, it is not permitted to download or to forward/distribute the text or part of it without the consent of the author(s) and/or copyright holder(s), unless the work is under an open content license (like Creative Commons). Take-down policy If you believe that this document breaches copyright please contact us providing details, and we will remove access to the work immediately and investigate your claim. Downloaded from the University of Groningen/UMCG research database (Pure): http://www.rug.nl/research/portal. For technical reasons the number of authors shown on this cover page is limited to 10 maximum. Download date: 18-06-2018

Welcome message from author
This document is posted to help you gain knowledge. Please leave a comment to let me know what you think about it! Share it to your friends and learn new things together.
Transcript

University of Groningen
A Dual-band Millimeter-wave Kinetic Inductance Camera for the IRAM 30 m TelescopeMonfardini, A.; Benoit, A.; Bideaud, A.; Swenson, L.; Cruciani, A.; Camus, P.; Hoffmann, C.;Désert, F. X.; Doyle, S.; Ade, P.Published in:Astrophysical journal supplement series
DOI:10.1088/0067-0049/194/2/24
IMPORTANT NOTE: You are advised to consult the publisher's version (publisher's PDF) if you wish to cite fromit. Please check the document version below.
Document VersionPublisher's PDF, also known as Version of record
Publication date:2011
Link to publication in University of Groningen/UMCG research database
Citation for published version (APA):Monfardini, A., Benoit, A., Bideaud, A., Swenson, L., Cruciani, A., Camus, P., ... Giordano, C. (2011). ADual-band Millimeter-wave Kinetic Inductance Camera for the IRAM 30 m Telescope. Astrophysical journalsupplement series, 194(2), [24]. DOI: 10.1088/0067-0049/194/2/24
CopyrightOther than for strictly personal use, it is not permitted to download or to forward/distribute the text or part of it without the consent of theauthor(s) and/or copyright holder(s), unless the work is under an open content license (like Creative Commons).
Take-down policyIf you believe that this document breaches copyright please contact us providing details, and we will remove access to the work immediatelyand investigate your claim.
Downloaded from the University of Groningen/UMCG research database (Pure): http://www.rug.nl/research/portal. For technical reasons thenumber of authors shown on this cover page is limited to 10 maximum.
Download date: 18-06-2018

The Astrophysical Journal Supplement Series, 194:24 (11pp), 2011 June doi:10.1088/0067-0049/194/2/24C© 2011. The American Astronomical Society. All rights reserved. Printed in the U.S.A.
A DUAL-BAND MILLIMETER-WAVE KINETIC INDUCTANCE CAMERA FOR THE IRAM 30 m TELESCOPE
A. Monfardini1, A. Benoit
1, A. Bideaud
1, L. Swenson
1,10, A. Cruciani
1,11, P. Camus
1, C. Hoffmann
1, F. X. Desert
2,
S. Doyle3, P. Ade
3, P. Mauskopf
3, C. Tucker
3, M. Roesch
4, S. Leclercq
4, K. F. Schuster
4, A. Endo
5, A. Baryshev
6,
J. J. A. Baselmans6, L. Ferrari
6, S. J. C Yates
6, O. Bourrion
7, J. Macias-Perez
7, C. Vescovi
7, M. Calvo
8, and C. Giordano
91 Institut Neel, CNRS & Universite Joseph Fourier (UJF), Grenoble F-38042, France; [email protected]
2 Institut de Planetologie et d’Astrophysique, UJF & CNRS-INSU, Grenoble F-38041, France3 Cardiff School of Physics and Astronomy, Cardiff University, Cardiff CF24 3AA, UK
4 Institut de RadioAstronomie Millimetrique (IRAM), Saint Martin d’Heres F-38406, France5 Kavli Institute of NanoScience, Delft University of Technology, 2628 CJ Delft, The Netherlands
6 SRON, Netherlands Institute for Space Research, 3584 CA Utrecht and 9700 AV Groningen, The Netherlands7 Laboratoire de Physique Subatomique et de Cosmologie, UJF & CNRS/IN2P3 & INPG, F-38026 Grenoble, France
8 Dipartimento di Fisica, Universita di Roma La Sapienza, I-00185 Roma, Italy9 Fondazione Bruno Kessler, I-38123 Povo (TN), Italy
Received 2011 February 8; accepted 2011 March 21; published 2011 May 6
ABSTRACT
The Neel IRAM KIDs Array (NIKA) is a fully integrated measurement system based on kinetic inductance detectors(KIDs) currently being developed for millimeter wave astronomy. The instrument includes dual-band optics allowingsimultaneous imaging at 150 GHz and 220 GHz. The imaging sensors consist of two spatially separated arrays ofKIDs. The first array, mounted on the 150 GHz branch, is composed of 144 lumped-element KIDs. The secondarray (220 GHz) consists of 256 antenna-coupled KIDs. Each of the arrays is sensitive to a single polarization;the band splitting is achieved by using a grid polarizer. The optics and sensors are mounted in a custom dilutioncryostat, with an operating temperature of ∼70 mK. Electronic readout is realized using frequency multiplexingand a transmission line geometry consisting of a coaxial cable connected in series with the sensor array and a low-noise 4 K amplifier. The dual-band NIKA was successfully tested in 2010 October at the Institute for MillimetricRadio Astronomy (IRAM) 30 m telescope at Pico Veleta, Spain, performing in-line with laboratory predictions. Anoptical NEP was then calculated to be around 2 × 10⁻¹⁶ W Hz−1/2 (at 1 Hz) while under a background loading ofapproximately 4 pW pixel−1. This improvement in comparison with a preliminary run (2009) verifies that NIKA isapproaching the target sensitivity for photon-noise limited ground-based detectors. Taking advantage of the largerarrays and increased sensitivity, a number of scientifically relevant faint and extended objects were then imagedincluding the Galactic Center SgrB2 (FIR1), the radio galaxy Cygnus A, and the NGC1068 Seyfert galaxy. Thesetargets were all observed simultaneously in the 150 GHz and 220 GHz atmospheric windows.
Key words: instrumentation: detectors – radio continuum: galaxies – radio continuum: general – submillimeter:galaxies – submillimeter: general – techniques: miscellaneous
Online-only material: color figures
1. INTRODUCTION
The importance of millimeter and submillimeter astronomyis now well established. In particular, three main areas ofmillimeter continuum research have motivated the rapid de-velopment of new technologies:
1. The study of star-forming regions in the Galaxy (Ward-Thompson et al. 2007). The pre-stellar phases in molecularclouds are hidden by cold dust (around 10 K) which canonly be observed at submillimeter wavelengths.
2. The investigation of high-redshift galaxies (Lagache et al.2005). The redshift effect at submillimeter wavelengthscounteracts the distance dimming (Blain et al. 2002).
3. The measurement of cosmic microwave background(CMB) temperature anisotropies (either primordial or sec-ondary). At a temperature of 2.725 K, the CMB spectrumpeaks at millimeter wavelengths. Of particular interest isthe Sunyaev–Zel’dovich effect (Birkinshaw 1999), which
10 Current address: California Institute of Technology, 367-17 Pasadena,CA 91125, USA.11 Also at Dipartimento di Fisica, Universita di Roma La Sapienza, I-00185Roma, Italy.
distorts the CMB spectrum at millimeter and radio wave-lengths and can be used to map the distribution of hot gasin clusters of galaxies.
Throughout the previous decade, instruments utilizing hun-dreds of individual bolometers in focal plane arrays have domi-nated continuum submillimeter and millimeter astronomy (e.g.,MAMBO2, BOLOCAM). Full-sampling arrays with up to thou-sands of pixels in a single array are now reaching maturity,offering increased mapping speed and decreased per-pixel man-ufacturing costs (e.g., Apex-SZ, SPT, SCUBA2, LABOCA).Despite these considerable advances, further array scaling isstrongly limited by the multiplexing factor of the readout elec-tronics.
A promising alternative to traditional bolometers is thekinetic inductance detector (KID). First demonstrated less than10 years ago (Day et al. 2003), a KID consists of a high-qualitysuperconducting resonant circuit electromagnetically coupledto a transmission line.
In a superconductor, the conduction electrons are condensedinto charge-carrying Cooper pairs. At DC it is well knownthat these Cooper pairs do not undergo scattering and hencedo not contribute any electrical impedance. However at non-zero frequencies energy can be stored, and later returned to the
1

The Astrophysical Journal Supplement Series, 194:24 (11pp), 2011 June Monfardini et al.
electromagnetic fields, in the inertia of the Cooper pairs. Thisresults in an effective reactive impedance known as the kineticinductance. In contrast, the kinetic inductance is not significantin normal metals. In that case, the very short carrier scatteringtime results in dissipation of the inertial energy through Jouleheating. Mediated by lattice vibrations superconductivity alsoresults in an energy gap in the carrier density of states. Incidentphotons with an energy exceeding the gap energy can breaka Cooper pair, producing two quasiparticles and a concurrentchange in the complex surface impedance σ (ω) = σ1(ω) −jσ2(ω), where σ2(ω) is directly related to the kinetic inductance.The result is a shift in the KID resonance frequency and a changeof the resonator quality factor. Both can be read out by themeasurement electronics. The non-local Mattis–Bardeen theorycan be used to solve for changes in both σ1(ω) and σ2(ω) due toincident radiation, allowing a direct calculation of the resonatorfrequency response to illumination (Gao 2008).
Typically, a KID is designed to resonate from 1 to 10 GHz andexhibits a loaded quality factor exceeding QL > 105. Thus, eachKID occupies a bandwidth of order Δf = f/QL ∼10–100 kHz.A single KID only loads the transmission line within Δfaround its resonant frequency. The KID resonant frequency caneasily be controlled geometrically during the circuit design.It is therefore possible to couple a large number of KIDs to asingle transmission line without interference as long as the inter-resonance frequency spacing exceeds 2Δf . The inter-resonancefrequency spacing and the total bandwidth of the measurementelectronics set a limit on the total number of pixels whichcan be simultaneously read out on a single measurement line(Mazin 2004). Current frequency-multiplexing measurementelectronics are limited to at most a few hundred pixels permeasurement cable. This is expected to grow into the thousandsof pixels per cable within the next decade, vastly improvingthe multiplexing factor in comparison with existing arraytechnologies.
In order to absorb incident radiation, it is necessary toimpedance match the KID to free space at the target wavelength.Currently, there are two methods for meeting this criterion.The first is to use a geometry known as the lumped-elementKID (LEKID) which separates the resonator into an inductivemeander section and a capacitor. At the target wavelength, theinductive meander approximates a solid absorber. By accountingfor the resonator and substrate impedances and the cavity formedwith the sample holder, it is possible to directly impedancematch the LEKID to free space (Doyle et al. 2009). Alternatively,a lens and antenna structure can be used to adapt the resonatorto free space. Due to the increased geometric complexity,it has proven more difficult to achieve satisfactory deviceperformance with antenna structures than with direct absorptionLEKIDs. Despite this drawback, antenna-coupled KIDs remaina very active area of research due to their frequency selectivity(Schlaerth et al. 2008).
For both LEKIDs and antenna-coupled KIDs, detection isachieved in the same manner, described above, once the incidentradiation has been absorbed.
We are currently developing a fully integrated measurementsystem based on KIDs known as the Neel IRAM KIDs Array(NIKA). The two primary goals of NIKA are to assess theviability of KIDs for terrestrial astronomy and to develop afilled-array, dual-band resident instrument for the Institute forMillimetric Radio Astronomy (IRAM) 30 m telescope at PicoVeleta, Spain. Based on a custom-designed dilution cryostatwith a base temperature of ∼70 mK (Benoit et al. 2008), a first
generation single-band NIKA prototype was previously testedat the Pico Veleta telescope in 2009 October (Monfardini et al.2010). This successful measurement was the first to directlycompare the performance of LEKID and antenna-coupled KIDdesigns.
Leveraging the experience gained from the first generationNIKA, an improved instrument has been designed and testedat the IRAM 30 m telescope in 2010 October. This secondgeneration system includes a large number of enhancements.Dual-band optics, integrating a polarization-sensitive splitterand a new baffling structure, allow simultaneous imagingat 150 GHz and 220 GHz. Resonator design modificationsresulted in improved single-pixel sensitivity. Faster digital-signal-processing electronics enable synchronous measurementof up to 112 pixels for each measurement band. Fabrication of asky simulator to replicate typical measurement conditions at thetelescope facilitated improved array testing and quality control.Along with a detailed discussion of these system upgrades,we present here the results of the 2010 October measurementcampaign. This includes a discussion of the limiting noisesources, an analysis of the system performance determinedusing calibration sources such as planets, and an estimateof the improved full-system sensitivity. Finally, we presentastronomically relevant observations of a number of faint andextended sources in both measurement bands which werepreviously unattainable with the less sensitive first generationNIKA.
2. THE DUAL-BAND OPTICS
The new dual-band NIKA is engineered to fit the receivercabin of the IRAM telescope in Pico Veleta, Spain. The 30 mprimary mirror (M1) and the hyperbolic secondary (M2, D =2 m) are installed directly on a large alt-azimuth mounting. Theincident beam is directed into the receiver cabin through a holein M1 using a standard Cassegrain configuration. A rotatingtertiary (M3) provides a fixed focal plane (Nasmyth focus).The optical axis, in order to conform to the dimensions of thecabin, is deviated by two flat mirrors (M4 and M5). M4 canrotate between two fixed positions, selecting either heterodyneor continuum instruments.
NIKA re-images the large telescope focal plane onto the smallsensitive area covered by the KIDs. The demagnification factoris around 6.6, achieving a well-adapted scale of 5 arcsec mm−1
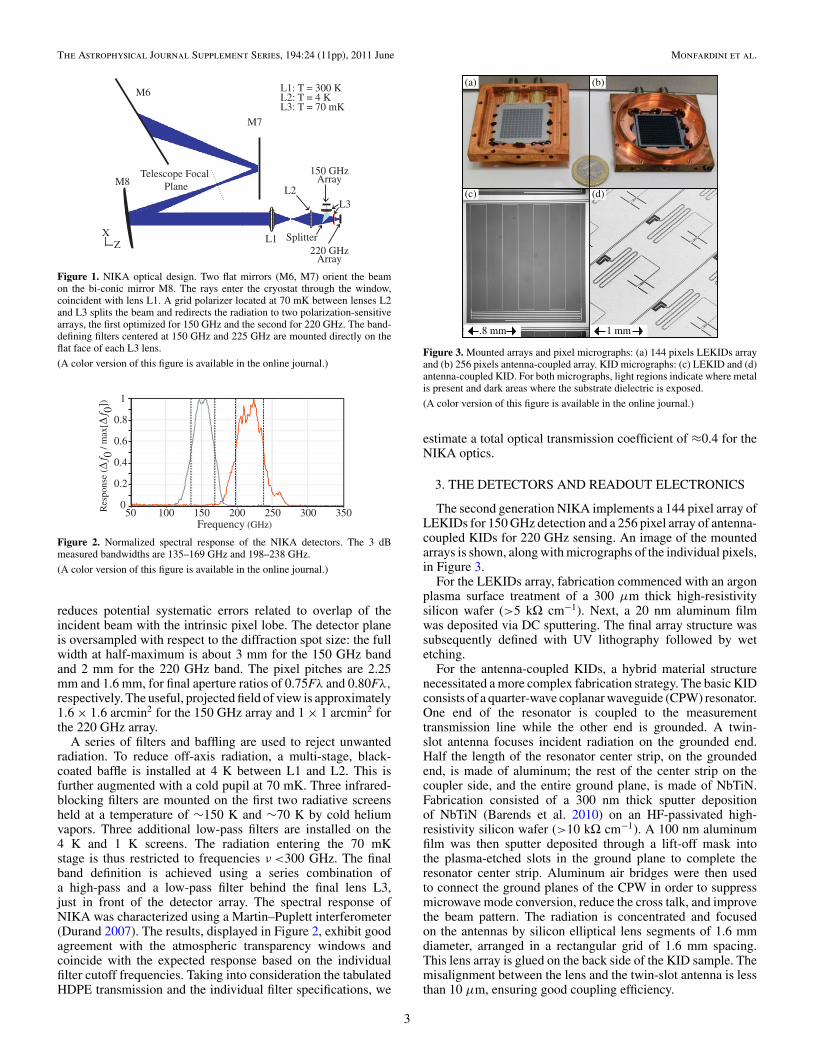
on the detector plane. This is accomplished using two flat mirrors(M6, M7), one bi-conical mirror (M8), and three high-densitypolyethylene (HDPE) corrugated lenses (L1, L2, L3). The lenscorrugation consists of machined concentric grooves, providinga soft transition between vacuum (n = 1) and HDPE (n = 1.56)to reduce reflective losses. The size of the grooves is 0.4 mm ×0.4 mm in depth and width, while the width of the ridges is0.4 mm. L1 is located at room temperature and coincides withthe cryostat vacuum isolation window. L2 is mounted on thescreen at 4 K, while the final L3 lenses (one per array) areinstalled at the coldest stage just in front of the arrays (∼70 mK).A simple grid polarizer with a grid pitch of 4 μm was insertedat 45◦ with respect to the main optical axis before the finalL3 lenses. Since all KID designs currently employed in NIKAare sensitive to a single polarization, this is an efficient way torealize beam splitting for the two frequency bands. A schematicof the optical design is presented in Figure 1.
For both arrays, the lenses are telecentric. That is, each pointof the detector plane is illuminated with the same aperturewith the chief ray perpendicular to the surface. This strongly
2
The Astrophysical Journal Supplement Series, 194:24 (11pp), 2011 June Monfardini et al.
M6
M7
XZ
M8Telescope Focal Plane
L1
L2L3
Splitter
L1: T = 300 KL2: T = 4 KL3: T = 70 mK
150 GHzArray
220 GHzArray
Figure 1. NIKA optical design. Two flat mirrors (M6, M7) orient the beamon the bi-conic mirror M8. The rays enter the cryostat through the window,coincident with lens L1. A grid polarizer located at 70 mK between lenses L2and L3 splits the beam and redirects the radiation to two polarization-sensitivearrays, the first optimized for 150 GHz and the second for 220 GHz. The band-defining filters centered at 150 GHz and 225 GHz are mounted directly on theflat face of each L3 lens.
(A color version of this figure is available in the online journal.)
Res
pons
e ( Δ
f 0/ m
ax[Δ
f 0])
0
0.2
0.4
0.6
0.8
1
50 100 150 200 250 300 350Frequency (GHz)
Figure 2. Normalized spectral response of the NIKA detectors. The 3 dBmeasured bandwidths are 135–169 GHz and 198–238 GHz.
(A color version of this figure is available in the online journal.)
reduces potential systematic errors related to overlap of theincident beam with the intrinsic pixel lobe. The detector planeis oversampled with respect to the diffraction spot size: the fullwidth at half-maximum is about 3 mm for the 150 GHz bandand 2 mm for the 220 GHz band. The pixel pitches are 2.25mm and 1.6 mm, for final aperture ratios of 0.75Fλ and 0.80Fλ,respectively. The useful, projected field of view is approximately1.6 × 1.6 arcmin2 for the 150 GHz array and 1 × 1 arcmin2 forthe 220 GHz array.
A series of filters and baffling are used to reject unwantedradiation. To reduce off-axis radiation, a multi-stage, black-coated baffle is installed at 4 K between L1 and L2. This isfurther augmented with a cold pupil at 70 mK. Three infrared-blocking filters are mounted on the first two radiative screensheld at a temperature of ∼150 K and ∼70 K by cold heliumvapors. Three additional low-pass filters are installed on the4 K and 1 K screens. The radiation entering the 70 mKstage is thus restricted to frequencies ν <300 GHz. The finalband definition is achieved using a series combination ofa high-pass and a low-pass filter behind the final lens L3,just in front of the detector array. The spectral response ofNIKA was characterized using a Martin–Puplett interferometer(Durand 2007). The results, displayed in Figure 2, exhibit goodagreement with the atmospheric transparency windows andcoincide with the expected response based on the individualfilter cutoff frequencies. Taking into consideration the tabulatedHDPE transmission and the individual filter specifications, we
(b)(a)
1 mm.8 mm
(c) (d)
Figure 3. Mounted arrays and pixel micrographs: (a) 144 pixels LEKIDs arrayand (b) 256 pixels antenna-coupled array. KID micrographs: (c) LEKID and (d)antenna-coupled KID. For both micrographs, light regions indicate where metalis present and dark areas where the substrate dielectric is exposed.
(A color version of this figure is available in the online journal.)
estimate a total optical transmission coefficient of ≈0.4 for theNIKA optics.
3. THE DETECTORS AND READOUT ELECTRONICS
The second generation NIKA implements a 144 pixel array ofLEKIDs for 150 GHz detection and a 256 pixel array of antenna-coupled KIDs for 220 GHz sensing. An image of the mountedarrays is shown, along with micrographs of the individual pixels,in Figure 3.
For the LEKIDs array, fabrication commenced with an argonplasma surface treatment of a 300 μm thick high-resistivitysilicon wafer (>5 kΩ cm−1). Next, a 20 nm aluminum filmwas deposited via DC sputtering. The final array structure wassubsequently defined with UV lithography followed by wetetching.
For the antenna-coupled KIDs, a hybrid material structurenecessitated a more complex fabrication strategy. The basic KIDconsists of a quarter-wave coplanar waveguide (CPW) resonator.One end of the resonator is coupled to the measurementtransmission line while the other end is grounded. A twin-slot antenna focuses incident radiation on the grounded end.Half the length of the resonator center strip, on the groundedend, is made of aluminum; the rest of the center strip on thecoupler side, and the entire ground plane, is made of NbTiN.Fabrication consisted of a 300 nm thick sputter depositionof NbTiN (Barends et al. 2010) on an HF-passivated high-resistivity silicon wafer (>10 kΩ cm−1). A 100 nm aluminumfilm was then sputter deposited through a lift-off mask intothe plasma-etched slots in the ground plane to complete theresonator center strip. Aluminum air bridges were then usedto connect the ground planes of the CPW in order to suppressmicrowave mode conversion, reduce the cross talk, and improvethe beam pattern. The radiation is concentrated and focusedon the antennas by silicon elliptical lens segments of 1.6 mmdiameter, arranged in a rectangular grid of 1.6 mm spacing.This lens array is glued on the back side of the KID sample. Themisalignment between the lens and the twin-slot antenna is lessthan 10 μm, ensuring good coupling efficiency.
3
The Astrophysical Journal Supplement Series, 194:24 (11pp), 2011 June Monfardini et al.
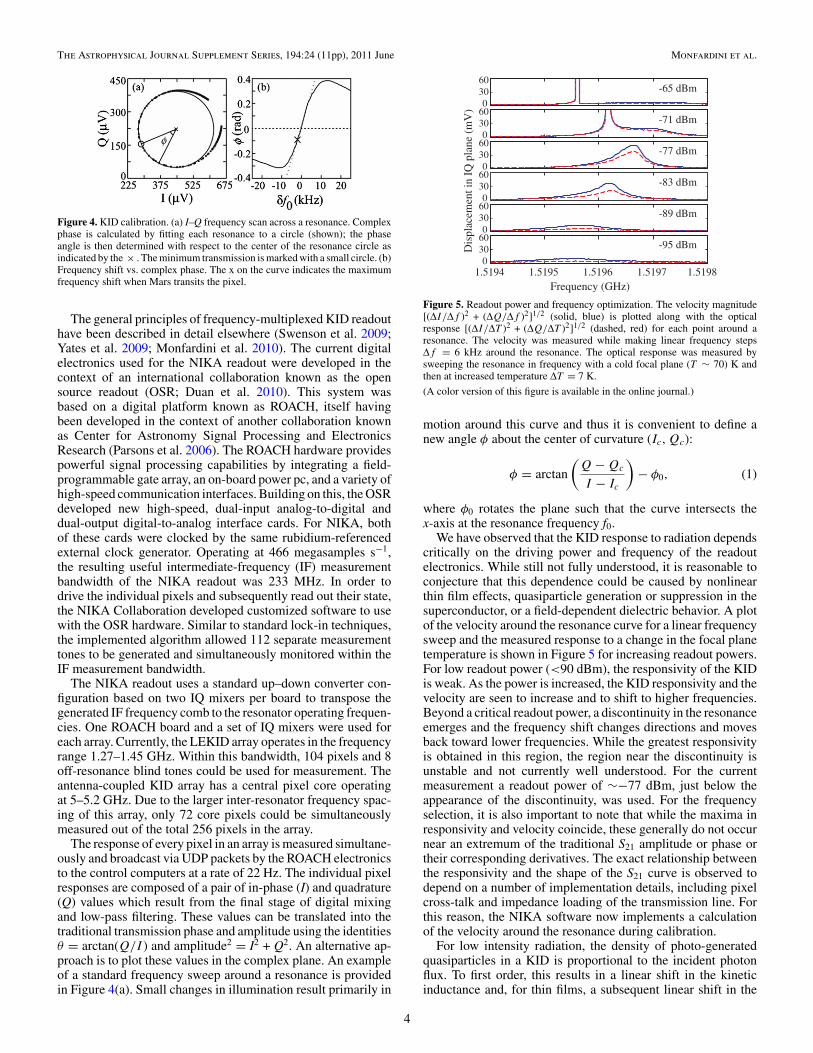
Figure 4. KID calibration. (a) I–Q frequency scan across a resonance. Complexphase is calculated by fitting each resonance to a circle (shown); the phaseangle is then determined with respect to the center of the resonance circle asindicated by the × . The minimum transmission is marked with a small circle. (b)Frequency shift vs. complex phase. The x on the curve indicates the maximumfrequency shift when Mars transits the pixel.
The general principles of frequency-multiplexed KID readouthave been described in detail elsewhere (Swenson et al. 2009;Yates et al. 2009; Monfardini et al. 2010). The current digitalelectronics used for the NIKA readout were developed in thecontext of an international collaboration known as the opensource readout (OSR; Duan et al. 2010). This system wasbased on a digital platform known as ROACH, itself havingbeen developed in the context of another collaboration knownas Center for Astronomy Signal Processing and ElectronicsResearch (Parsons et al. 2006). The ROACH hardware providespowerful signal processing capabilities by integrating a field-programmable gate array, an on-board power pc, and a variety ofhigh-speed communication interfaces. Building on this, the OSRdeveloped new high-speed, dual-input analog-to-digital anddual-output digital-to-analog interface cards. For NIKA, bothof these cards were clocked by the same rubidium-referencedexternal clock generator. Operating at 466 megasamples s−1,the resulting useful intermediate-frequency (IF) measurementbandwidth of the NIKA readout was 233 MHz. In order todrive the individual pixels and subsequently read out their state,the NIKA Collaboration developed customized software to usewith the OSR hardware. Similar to standard lock-in techniques,the implemented algorithm allowed 112 separate measurementtones to be generated and simultaneously monitored within theIF measurement bandwidth.
The NIKA readout uses a standard up–down converter con-figuration based on two IQ mixers per board to transpose thegenerated IF frequency comb to the resonator operating frequen-cies. One ROACH board and a set of IQ mixers were used foreach array. Currently, the LEKID array operates in the frequencyrange 1.27–1.45 GHz. Within this bandwidth, 104 pixels and 8off-resonance blind tones could be used for measurement. Theantenna-coupled KID array has a central pixel core operatingat 5–5.2 GHz. Due to the larger inter-resonator frequency spac-ing of this array, only 72 core pixels could be simultaneouslymeasured out of the total 256 pixels in the array.
The response of every pixel in an array is measured simultane-ously and broadcast via UDP packets by the ROACH electronicsto the control computers at a rate of 22 Hz. The individual pixelresponses are composed of a pair of in-phase (I) and quadrature(Q) values which result from the final stage of digital mixingand low-pass filtering. These values can be translated into thetraditional transmission phase and amplitude using the identitiesθ = arctan(Q/I ) and amplitude2 = I2 + Q2. An alternative ap-proach is to plot these values in the complex plane. An exampleof a standard frequency sweep around a resonance is providedin Figure 4(a). Small changes in illumination result primarily in
3060
0
3060
0
3060
0
3060
0
3060
0
3060
01.5194 1.5195 1.5196 1.5197 1.5198
Frequency (GHz)
Dis
plac
emen
t in
IQ p
lane
(m
V)
-95 dBm
-89 dBm
-83 dBm
-77 dBm
-71 dBm
-65 dBm
Figure 5. Readout power and frequency optimization. The velocity magnitude[(ΔI/Δf )2 + (ΔQ/Δf )2]1/2 (solid, blue) is plotted along with the opticalresponse [(ΔI/ΔT )2 + (ΔQ/ΔT )2]1/2 (dashed, red) for each point around aresonance. The velocity was measured while making linear frequency stepsΔf = 6 kHz around the resonance. The optical response was measured bysweeping the resonance in frequency with a cold focal plane (T ∼ 70) K andthen at increased temperature ΔT = 7 K.
(A color version of this figure is available in the online journal.)
motion around this curve and thus it is convenient to define anew angle φ about the center of curvature (Ic,Qc):
φ = arctan
(Q − Qc
I − Ic
)− φ0, (1)
where φ0 rotates the plane such that the curve intersects thex-axis at the resonance frequency f0.
We have observed that the KID response to radiation dependscritically on the driving power and frequency of the readoutelectronics. While still not fully understood, it is reasonable toconjecture that this dependence could be caused by nonlinearthin film effects, quasiparticle generation or suppression in thesuperconductor, or a field-dependent dielectric behavior. A plotof the velocity around the resonance curve for a linear frequencysweep and the measured response to a change in the focal planetemperature is shown in Figure 5 for increasing readout powers.For low readout power (<90 dBm), the responsivity of the KIDis weak. As the power is increased, the KID responsivity and thevelocity are seen to increase and to shift to higher frequencies.Beyond a critical readout power, a discontinuity in the resonanceemerges and the frequency shift changes directions and movesback toward lower frequencies. While the greatest responsivityis obtained in this region, the region near the discontinuity isunstable and not currently well understood. For the currentmeasurement a readout power of ∼−77 dBm, just below theappearance of the discontinuity, was used. For the frequencyselection, it is also important to note that while the maxima inresponsivity and velocity coincide, these generally do not occurnear an extremum of the traditional S21 amplitude or phase ortheir corresponding derivatives. The exact relationship betweenthe responsivity and the shape of the S21 curve is observed todepend on a number of implementation details, including pixelcross-talk and impedance loading of the transmission line. Forthis reason, the NIKA software now implements a calculationof the velocity around the resonance during calibration.
For low intensity radiation, the density of photo-generatedquasiparticles in a KID is proportional to the incident photonflux. To first order, this results in a linear shift in the kineticinductance and, for thin films, a subsequent linear shift in the
4

The Astrophysical Journal Supplement Series, 194:24 (11pp), 2011 June Monfardini et al.
resonance frequency (Swenson et al. 2010). That is
δf0 = −Cf 30 δLK ∝ −f 3
0
n2s
δPi, (2)
where C is a constant, ns is the Cooper pair density, and δPi is theincident power. A plot of the phase φ versus the frequency shiftfrom resonance δf0 for a typical KID is shown in Figure 4(b)along with the maximum frequency shift during a transit ofMars. From this plot it is clear that ∂φ/∂f is approximatelylinear for relevant astronomical signals. Thus, φ ∝ δPi withthe constant of proportionality being determined during acalibration scan. One caveat is that under large backgroundchanges, which can result from weather changes or telescoperepointing, ns changes substantially and causes a significant shiftin f0. For this reason, an automatic procedure was implementedto properly determine (Ic,Qc) and φ0 before every scan takenon the telescope to assure that the measurement would remainin the dynamic range of the KIDs. This recalibration is currentlyachieved in under 60 s.
4. THE SKY SIMULATOR
In order to replicate real observing conditions and to properlyestimate the amount of stray light on the detectors, we have builta testing tool to complement MP interferometer measurementsand classical chopper tests alternating between hot and coldsources. Simply called the sky simulator, the basic idea consistsin cooling down a large, black disk with the same dimensionsas the telescope focal plane. This cold disk simulates the back-ground temperature in ordinary ground-based observing condi-tions. On a telescope the main contributions to the backgroundare the atmospheric residual opacity, which is weather depen-dent, and the emissivities of the mirrors. The typical backgroundtemperature of the IRAM Pico Veleta telescope is in the range30–100 K. For the sky simulator, the cooling of the backgrounddisk is achieved by using a single-stage pulse-tube refrigerator.A large window in the sky simulator cryostat is fabricated in4 cm thick HDPE which is sufficiently transparent at millimeterwavelengths. The minimum background temperature that canbe achieved is 50 K, limited by the radiation absorbed by thelarge, black, cold disk. An image of the sky simulator can beseen in Figure 6.
To simulate an astronomical source, a high-emissivity ballwith a diameter of 5–10 mm was placed in front of the skysimulator window at room temperature. The ball is mounted ona motorized XY stage enabling movement with respect to thefixed disk. The angular speed on the sky of a typical on-the-flyscan at the IRAM telescope is 10 arcsec s−1. Accounting for the∼300 m effective focal length of M1 and M2, this correspondsto a scan speed of 15 mm s−1 on the telescope focal plane. Thisvelocity is well within the capabilities of the XY translator. Acomparison of two single-pixel transits, the first taken with thetelescope and the second with the sky simulator, is shown inFigure 6(c).
The sky simulator temperature can be adjusted continuouslybetween 50 K and 300 K, allowing an accurate estimation ofthe detector response and a direct determination of the noiseequivalent temperature (NET). To perform this measurement,the spectral noise density Sn(f ), expressed in Hz Hz−1/2, iscalculated at a fixed background temperature. The backgroundtemperature is then increased by δT and the shift in the KIDresonance frequency is measured. This yields the KID frequency
HDPEWindow
(a) (b)
Movingarm
Nylonwire
High ε ball
(c) 0
-1
-2
-3
-4
-5
Δ f 0 (
kHz)
0 20 40 60 80 100 120Time (s)
Figure 6. Sky simulator. (a) HDPE cryostat window removed. The cold disksimulating the sky background is shown; its diameter is 24 cm. (b) Fullyassembled system. The translation arm, nylon wire, and high emissivity ballare outlined for visibility. The ball moves at a controlled rate in front of theHDPE window, faking a real source on the sky. In particular, on-the-fly telescopescans are easily simulated (Bideaud 2010). (c) Sky simulator validation. A realon-the-fly scan of Uranus taken at the 30 m telescope is shown (red, upper)along with a laboratory on-the-fly scan using the sky simulator (blue, lower).The telescope angular scan speed was 10 arcsec s−1. The linear scan speed ofthe sky simulator was 30 mm s−1, corresponding to a telescope angular speedof 20 arcsec s−1. For both traces, the transit of the source was observed with asingle pixel.
(A color version of this figure is available in the online journal.)
response R expressed in Hz K−1. The NET is then given by
NET(f ) = Sf (f )
R. (3)
Laboratory tests performed on the LEKID array indicatedan average NET per pixel of 4 mK Hz−1/2 at a standardrepresentative frequency of 1 Hz. Accounting for the opticalchain transmission and including a 50% reduction due to thepolarizer, this corresponds to an optical noise equivalent power(NEP) of approximately 2 × 10⁻¹⁶ W Hz−1/2. The best single-pixel LEKIDs have an optical NEP, under realistic 4–8 pWloading per pixel, around 6 × 10⁻¹⁷ W Hz−1/2. These resultsindicate that no conceptual limitations exist for using KIDs in thenext generation large arrays of ground-based millimeter-waveinstruments.
The sky simulator has also been used to estimate the amountof undesired stray light incident on the detector arrays. Thismeasurement required two steps. First, the pixel frequencyshifts were recorded, while the sky simulator was moved inthe optical axis direction from its customary position at thetelescope focal plane up to the cryostat window. Next, the skysimulator was returned to the telescope focal plane and thebackground temperature was then increased until an equivalentfrequency shift was affected. This resulted in an estimated stray-light temperature of ∼35 K which corresponds to ∼4 pW ofparasitic power per pixel at 150 GHz. The unwanted radiationhas thus been reduced by more than a factor of two comparedwith the first generation NIKA and is now comparable to thebest sky conditions at Pico Veleta.
5

The Astrophysical Journal Supplement Series, 194:24 (11pp), 2011 June Monfardini et al.
Figure 7. 80% (blue, thin) and 50% (gray, thick) contours of the beams as measured on Mars on the 2010 October 20. Top: 2 mm array (98 valid KID), bottom:1.4 mm array (62 valid KID).
(A color version of this figure is available in the online journal.)
5. RESULTS
The dual-band NIKA run took place in 2010 October. Theinstrument was installed in the receiver cabin of the IRAM30 m telescope at Pico Veleta, Spain, and operated remotelyfrom the control room. The cool-down of the instrument wasalso performed remotely, taking approximately 18 hr to reachthe operating temperature of 70 mK.
Astronomical data from the two arrays are reduced offlinewith dedicated software. The raw data (I,Q) are converted tocomplex phase angle using the closest previous KID calibration.
Then a conversion to an equivalent frequency shift is done withthe same calibration using the derivative of the frequency withthe complex phase at the zero phase, as described in Figure 4.Data are thus internally converted to frequencies which areassumed to be linear with the absorbed photon counts, as inEquation (2). After opacity correction, and using Mars as theprimary calibrator, we obtain that the overall median gain is of14 mJy beam−1 Hz−1 and 9 mJy beam−1 Hz−1 for the 1.4 and2 mm (220 GHz and 150 GHz) channels, with a 30% dispersion.The focal plane geometry of each array is measured by usingscanning maps of planets (see Figure 7).
6

The Astrophysical Journal Supplement Series, 194:24 (11pp), 2011 June Monfardini et al.
Figure 8. Beam contours obtained on Mars with levels at 10%–90%. Azimuthand elevation slices along the center are shown on the sides along with the sliceof a two-dimensional Gaussian fit. The FWHM is 16.7 (resp. 12.4) arcsec at2 mm (resp. 1.4 mm).
The fitted focal plane geometry is found by matching the pixelposition in the array as measured on the wafer to the measuredposition on planets, by optimizing a simple set of parameters: acenter, a tilt angle, and a scaling expressed in arcsec mm−1. Mostdetectors are within less than 2 arcsec of their expected position.The beam width is also found from planet measurements.Typically the FWHM is 12.4 and 16.7 arcsec for the two arrays(1.4 and 2 mm, respectively, see Figure 8) with a dispersion of 1arcsec. This is close to the diffraction limit for the 2 mm array.Pixelization effects have not been removed from this estimate.
This might explain why the 1.4 mm beam is larger by 20% thanthe diffraction size.
We were able to observe many types of objects. We hereshow only examples of the results that are currently analyzed.Usually, the observing scan mode is a simple on-the-fly map-ping, composed of constant-elevation sub-scans, with the tele-scope sweeping in azimuth back and forth. The detector dataare processed in the time domain (calibration and filtering) be-fore being projected on a common map, using the focal planegeometry as described above. The noise is evaluated at the de-tector level by histogram Gaussian fitting outside the sources.The noise is then propagated to the map level. The final map isobtained by co-adding the individual detector maps with an in-verse square noise weighting scheme. From known sources andreproducibility from scan to scan and from detector to detector,the photometric accuracy is estimated to be 30%. New meth-ods are being investigated to improve this photometric offlineprocessing accuracy.
We present SrgB2(FIR1) as an example of extended source,Cygnus A as an example of a multiple source, and NGC1068 asan example of weak source with a new 2 mm flux measurement.
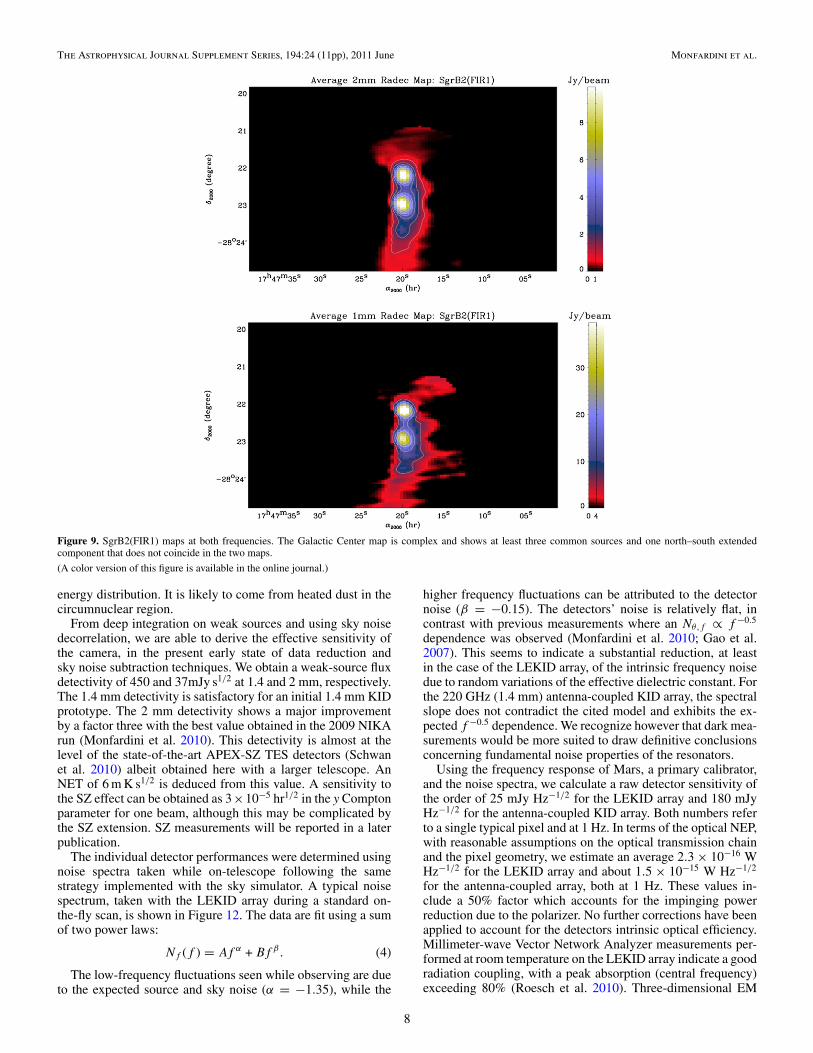
Figure 9 shows a dual map of the Galactic Center obtained in900 s of integration time. This complex region reveals at leastthree compact sources. The very center has a flux of 76 ± 3Jyand 17.7 ± 0.7Jy at 1.4 and 2 mm, respectively.
In Figure 10, we show Cygnus A (3C405), a well-knownradio source with two prominent radio lobes. The maps wereobtained with two scans making a total integration time of2200 s. The central source flux is of 0.76 ± 0.09 Jy (resp.0.89 ± 0.04 Jy) at 1.4 mm (resp. 2 mm). The flux errors aredominated by photometric noise and not detector noise. Thetwo radio lobes (named AB and DE) have a flux (taken at thepositions given by Wright & Birkinshaw 2004) of 1.63 ± 0.09 Jyand 1.65 ± 0.08 Jy at 1.4 mm. At 2 mm, the measured fluxes are2.47 ± 0.13 Jy and 2.36 ± 0.10 Jy. The 1.4 mm fluxes can becompared with BIMA 1.3 mm interferometer observations byWright & Birkinshaw (2004). The BIMA fluxes of the nucleus,and the AB and DE radio lobes are 0.48, 0.54, and 0.97 Jy,respectively. The spectral dependence (Fν ∝ ν−1) as measuredby Wright & Birkinshaw (2004) is recovered on the two radiolobes with the NIKA camera. Nevertheless, the NIKA fluxes area factor 1.70 higher. We think that this is an angular resolutioneffect. For example, using the 1.1 mm flux measured by Ealeset al. (1989) with a 19 arcsec beam and applying the abovespectral dependence, we expect 0.74, 1.1, and 1.5 Jy at 1.4 mmfor the flux of the nucleus and the two radio lobes which is inagreement with what we obtain.
Figure 11 shows a secure detection of NGC1068, a nearbygalaxy with an active galactic nucleus. The map is obtainedwith five scans and a total integration time of 1260 s. Its fluxis 142 ± 25 mJy at 1.4 mm and 66 ± 3 mJy at 2 mm. This isthe central flux measured with a Gaussian of 12 and 19 arcsec,respectively. For this map, a sky noise decorrelation has beenused, which is based on a linear regression with the detectorsignals when off-source. The northeast–southwest extension at1 mm is larger but aligned with interferometric IRAM Plateaude Bure Interferometer (PdBI) observations (Krips et al. 2006).The PdBI measured flux for the core and the jet is 28 ± 2 mJyat 231 GHz. This is smaller than the NIKA flux measurementwhich is more consistent with the flux of 170 ± 30 mJy measuredby Thronson et al. (1987), indicating the presence of a diffuseextended component. This component is expected (Hildebrandet al. 1977), based on consideration of the far-infrared spectral
7
The Astrophysical Journal Supplement Series, 194:24 (11pp), 2011 June Monfardini et al.
Figure 9. SgrB2(FIR1) maps at both frequencies. The Galactic Center map is complex and shows at least three common sources and one north–south extendedcomponent that does not coincide in the two maps.
(A color version of this figure is available in the online journal.)
energy distribution. It is likely to come from heated dust in thecircumnuclear region.
From deep integration on weak sources and using sky noisedecorrelation, we are able to derive the effective sensitivity ofthe camera, in the present early state of data reduction andsky noise subtraction techniques. We obtain a weak-source fluxdetectivity of 450 and 37mJy s1/2 at 1.4 and 2 mm, respectively.The 1.4 mm detectivity is satisfactory for an initial 1.4 mm KIDprototype. The 2 mm detectivity shows a major improvementby a factor three with the best value obtained in the 2009 NIKArun (Monfardini et al. 2010). This detectivity is almost at thelevel of the state-of-the-art APEX-SZ TES detectors (Schwanet al. 2010) albeit obtained here with a larger telescope. AnNET of 6 m K s1/2 is deduced from this value. A sensitivity tothe SZ effect can be obtained as 3×10⁻⁵ hr1/2 in the y Comptonparameter for one beam, although this may be complicated bythe SZ extension. SZ measurements will be reported in a laterpublication.
The individual detector performances were determined usingnoise spectra taken while on-telescope following the samestrategy implemented with the sky simulator. A typical noisespectrum, taken with the LEKID array during a standard on-the-fly scan, is shown in Figure 12. The data are fit using a sumof two power laws:
Nf (f ) = Af α + Bf β. (4)
The low-frequency fluctuations seen while observing are dueto the expected source and sky noise (α = −1.35), while the
higher frequency fluctuations can be attributed to the detectornoise (β = −0.15). The detectors’ noise is relatively flat, incontrast with previous measurements where an Nθ,f ∝ f −0.5
dependence was observed (Monfardini et al. 2010; Gao et al.2007). This seems to indicate a substantial reduction, at leastin the case of the LEKID array, of the intrinsic frequency noisedue to random variations of the effective dielectric constant. Forthe 220 GHz (1.4 mm) antenna-coupled KID array, the spectralslope does not contradict the cited model and exhibits the ex-pected f −0.5 dependence. We recognize however that dark mea-surements would be more suited to draw definitive conclusionsconcerning fundamental noise properties of the resonators.
Using the frequency response of Mars, a primary calibrator,and the noise spectra, we calculate a raw detector sensitivity ofthe order of 25 mJy Hz−1/2 for the LEKID array and 180 mJyHz−1/2 for the antenna-coupled KID array. Both numbers referto a single typical pixel and at 1 Hz. In terms of the optical NEP,with reasonable assumptions on the optical transmission chainand the pixel geometry, we estimate an average 2.3 × 10⁻¹⁶ WHz−1/2 for the LEKID array and about 1.5 × 10⁻¹⁵ W Hz−1/2
for the antenna-coupled array, both at 1 Hz. These values in-clude a 50% factor which accounts for the impinging powerreduction due to the polarizer. No further corrections have beenapplied to account for the detectors intrinsic optical efficiency.Millimeter-wave Vector Network Analyzer measurements per-formed at room temperature on the LEKID array indicate a goodradiation coupling, with a peak absorption (central frequency)exceeding 80% (Roesch et al. 2010). Three-dimensional EM
8

The Astrophysical Journal Supplement Series, 194:24 (11pp), 2011 June Monfardini et al.
Figure 10. Maps at 2 and 1.4 mm of the radio source Cygnus A and its two radio lobes. All the three sources are detected at both wavelengths. Contours are at levelsof 0.088 Jy beam−1 (resp. 0.332 Jy beam−1) and multiples at 1.4 (resp. 2 mm). A Gaussian smoothing of 8 arcsec has been applied to the maps.
(A color version of this figure is available in the online journal.)
simulations suggest about 65% for the antenna-coupled arrayoptical absorption. The estimated NEP is, for both arrays, ingood agreement with the preliminary values obtained using thesky simulator.
6. CONCLUSIONS AND PERSPECTIVES
Work on the NIKA instrument commenced in 2008November. At that time, no millimeter-wave LEKID hadbeen designed and fabricated while substantial research onmillimeter-wave antenna-coupled KID designs had been con-ducted (Schlaerth et al. 2008). In only two years, NIKA has
developed rapidly and the 150 GHz LEKID array sensitivity isnow comparable to the existing IRAM instrument MAMBO2at Pico Veleta. While the sensitivity of the 220 GHz antenna-coupled array did not attain the target performance during thisrun, no significant barrier exists toward a substantial improve-ment in the near future.
For both arrays, further investigation is needed to achieveoptimal photon-noise limited performance. Currently, a numberof avenues are being pursued in order to achieve this goal.
1. New single-pixel geometries are being designed whichpromise to reduce pixel cross-talk, minimize detectionvolume, and absorb both polarizations.
9

The Astrophysical Journal Supplement Series, 194:24 (11pp), 2011 June Monfardini et al.
Figure 11. NIKA maps of NGC1068 galaxy at 2 and 1.4 mm wavelengths. The pixel size is 2 arcsec. The maps have been smoothed with an 8 arcsec Gaussian.Contours are at the levels of 9.2 mJy beam−1 × (2, 3, . . . , 7) for the 2 mm channel and 21, 42, 63 mJy beam−1 for the 1.4 mm channel.
(A color version of this figure is available in the online journal.)
2. Promising materials such as TiN are being characterizedwhich may drastically improve the quantum efficiency ofthe detectors (Leduc et al. 2010).
3. The readout procedure continues to be optimized. A poorphotometric precision, of the order of 30%, was obtainedduring this run. Development of new models of the under-lying superconducting physics is necessary to better under-stand the pixel response to incident radiation. A new offlineprocedure is under development to include the ∂φ/∂f non-linearity and thus improve the photometric accuracy. Also,leveraging experience acquired during previous bolometerarray development, we are implementing a modulation-based readout procedure that should simplify and improve
the photometry by providing the frequency response of ev-ery pixel in real time.
4. New readout electronics are being developed to further in-crease the multiplexing (MUX) factor of each readout cable.The current instrument allows 112 pixels to be read out si-multaneously in 233 MHz of bandwidth. Compared withthe first version of NIKA, this is a six-fold improvementin the MUX factor. While a significant increase, digitalelectronics are readily available that can further improvethe MUX factor by more than an order of magnitude.In order to harness this technology, we are developinga NIKA-dedicated readout system called NIKEL (NIKaELectronics). A first generation NIKEL prototype, unused
10

The Astrophysical Journal Supplement Series, 194:24 (11pp), 2011 June Monfardini et al.
Figure 12. Frequency noise spectrum taken during a typical on-the-fly scanover the G34.3 galactic source. A fit of the function in Equation (4) yields thecontribution to the noise due to low-frequency fluctuations from the source andsky (α = −1.35) and the contribution at higher frequencies from the KIDs andthe electronics (β = −0.15).
in the current measurement, achieved 128 channels over abandwidth of 125 MHz (Bourrion et al. 2011). The nextgeneration NIKEL system is under development and willachieve more than 256 channels over ∼400–500 MHz ofbandwidth, using 12 bit analog-to-digital converters.
5. While greater magnetic shielding was utilized for thesecond generation NIKA system, magnetic field effectsstill limited the system performance. In particular, Earth’smagnetic field was evident when changing the telescopeazimuth angle. Changes in elevations did not strongly affectthe current detectors, but potentially limit the performanceof higher sensitivity instruments. Using a large current-carrying coil of wire, it is now possible to mimic theobserved effects due to Earth’s field in the laboratory.This new testing capability will allow a much more robustmagnetic screening to be implemented and tested beforeinstallation at the telescope.
6. Improved baffling and filters are being designed to continuereducing spurious radiation. Compared with the previousNIKA run, the current instrument reduced the stray lightby more than a factor of two but stray light continues todegrade the detector performance.
7. NIKA will move to a cryogen-free system. While notaffecting the system sensitivity, the use of a standarddilution cryostat is a practical limitation prohibiting long-term installation of NIKA at the Pico Veleta telescope. Thenew cryogen-free cryostat has already been fabricated andis currently undergoing testing.
The current version of NIKA demonstrates the potentialfor KIDs to operate in large, ground-based millimeter-waveinstruments. The NIKA project goal is to be a 6 arcminfield-of-view, dual-band resident instrument at the 30 m PicoVeleta telescope. In order to preserve the telescope intrinsicangular resolution, a Nyquist sampling of the focal plane istargeted (0.50Fλ). This requires ∼1500 pixels at 150 GHz and∼3000 pixels at 220 GHz. As an intermediate step to achievingthis specification, NIKA will be upgraded to a cryogen-free,dual-band instrument covering a field of view of about 3 arcmin.Assuming the present ≈0.75Fλ sampling, a 224 pixel arrayworking at 150 GHz and a 489 pixel array at 220 GHz arerequired. Assuming a MUX factor of 256, only three coldamplifiers and six coaxial cables are necessary. A forthcomingmeasurement, implementing these system improvements isplanned for the near future.
We thank Santiago Navarro, Juan Penalves, Frederic Damour,Carsten Kramer, David John, Juan Luis Santaren, Denise
Riquelme, Salvador Sanchez, Hans Ungerechts, Robert Zylka,and all the IRAM staff for the excellent technical support dur-ing the run. We also acknowledge the technical staff at InstitutNeel that have built the NIKA cryostat and participated inthe electronics development, in particular Henri Rodenas,Gregory Garde, Anne Gerardin, Julien Minet and in general theCryogenics and Electronics Groups. This work was supportedin part by grant ANR-09-JCJC-0021-01 of the French NationalResearch Agency, the Nanosciences Foundation of Grenobleand Region Rhone-Alpes (program CIBLE 2009). Part of thetravel funds for the run have been provided by the FrenchMinistere des Affaires etrangeres et europeennes (PHC Al-liance 2010). This work is supported, in the UK, by STFC.This research, and in particular A. Baryshev, was supportedERC starting Researcher Grant ERC-2009-StG 240602 TFPA.Akira Endo is financially supported by NWO (VENI grant639.041.023) and the Netherlands Research School for Astron-omy (NOVA). We acknowledge the crucial contributions of BenMazin (UCSB), Bruno Serfass (Berkeley), and the OSR (OpenSource Readout for MKIDs) Collaboration to the NIKA 2010electronics.
Facility: IRAM:30m
REFERENCES
Barends, R., Vercruyssen, N., Endo, A., de Visser, P. J., Zijlstra, T., Klapwijk,T. M., & Baselmans, J. J. A. 2010, Appl. Phys. Lett., 97, 033507
Benoit, A., et al. 2008, Proc. SPIE, 7020, 702009-9Bideaud, A. 2010, PhD thesis (in French), Universite Joseph Fourier, Grenoble,
FranceBirkinshaw, M. 1999, Phys. Rep., 310, 97Blain, A. W., Smail, I., Ivison, R.-J., Kneib, J.-P., & Frayer, D. T. 2002, Phys.
Rep., 369, 111Bourrion, O., et al. 2011, J. Instr., submitted (arXiv:1102.1314)Day, P. K., LeDuc, H. G., Mazin, B. A., Vayonakis, A., & Zmuidzinas, J.
2003, Nature, 425, 817Doyle, S., et al. 2009, in AIP Conf. Proc. 1185, 13th International Workshop
On Low Temperature Detectors, ed. B. Young, B. Cabrera, & A. Miller(Melville, NY: AIP), 156
Duan, R., et al. 2010, Proc. SPIE, 7741, 77411VDurand, T. 2007, PhD thesis, Universite Joseph Fourier, Grenoble, France (in
French)Eales, S. A., Alexander, P., & Duncan, W. D. 1989, MNRAS, 240,
817Gao, J. 2008, PhD thesis, California Institute of Technology, USAGao, J., Zmuidzinas, J., Mazin, B. A., LeDuc, H. G., & Day, P. K. 2007, Appl.
Phys. Lett., 90, 102507Hildebrand, R. H., et al. 1977, ApJ, 216, 698Krips, M., Eckart, A., Neri, R., Schodel, R., Leon, S., Downes, D., Garcıa-
Burillo, S., & Combes, F. 2006, A&A, 446, 113Lagache, G., Puget, J.-L., & Dole, H. 2005, ARA&A, 43, 727Leduc, H. G., et al. 2010, Appl. Phys. Lett., 97, 102509Mazin, B. 2004, PhD thesis, California Institute of Technology, USAMonfardini, A., et al. 2010, A&A, 521, A29Parsons, A., et al. 2006, in Proc. Asilomar Conf. on Signals and Systems,
2031Roesch, M., et al. 2010, Proc. SPIE, 7741, 77410NSchlaerth, J., et al. 2008, J. Low Temp. Phys., 151, 684Schwan, D., et al. 2010, arXiv:1008.0342v1Swenson, L. J., Cruciani, A., Benoit, A., Roesch, M., Yung, C. S., Bideaud, A.,
& Monfardini, A. 2010, Appl. Phys. Lett., 96, 23Swenson, L. J., et al. 2009, in AIP Conf. Proc. 1185, 13th International Workshop
On Low Temperature Detectors, ed. B. Young, B. Cabrera, & A. Miller(Melville, NY: AIP), 84
Thronson, H., Walker, C. K., Walker, C. E., & Maloney, Ph. 1987, ApJ, 318,645
Wright, M. C. H., & Birkinshaw, M. 2004, ApJ, 614, 115Ward-Thompson, D., et al. 2007, Protostars and Planets V (Tucson, AZ: Univ.
Arizona Press)Yates, S. J. C., Baselmans, J. J. A., Baryshev, A. M., Klein, B., & Gusten, R.
2009, Appl. Phys. Lett., 95, 042504
11
Related Documents