University of Gondar College Business and Economics Department of Marketing Management The Effect of Service Quality on Customer Satisfaction in Gondar Zuria Woreda, Maksegnit Municipality By Alebachew Addis June 2021 Gondar, Ethiopia

Welcome message from author
This document is posted to help you gain knowledge. Please leave a comment to let me know what you think about it! Share it to your friends and learn new things together.
Transcript
University of Gondar
College Business and Economics
Department of Marketing Management
The Effect of Service Quality on Customer Satisfaction in Gondar
Zuria Woreda, Maksegnit Municipality
By
Alebachew Addis
June 2021
Gondar, Ethiopia
University of Gondar
College of Business and Economics
Department of Marketing Management
The Effect of Service Quality on Customer Satisfaction in Gondar Zuria
Woreda, Maksegnit Municipality
A Thesis Submitted to Department of Marketing Management in
University of Gondar for Partial Fulfilment of the Requirements for the
Degree of Master in Marketing Management
By:
Alebachew Addis
Principal Advisor: Fantaye Kassa (Dr)
Co-advisor: Endris Nuru (Dr)
June 2021
Gondar, Ethiopia
Declaration
I, the undersigned, declare that, this study “The Effect of Service Quality on Customer
Satisfaction in Gondar Zuria Woreda, Maksegnit Municipality” is my original work and
has not been presented for a Degree in any other University, and that all the sources of
materials used for the study have been duly acknowledged.
Declared by:
Name: Alebachew Addis
Signature: ________________
Date: _________________
Certificate
This is to certify that Alebachew Addis has carried out his research work on the topic entitled
“The Effect of Service Quality on Customer Satisfaction in Gondar Zuria Woreda,
Maksegnit Municipality” This work was completed under our guidance in partial
fulfillment for the degree of Master of Marketing Management. In our view, the work is an
original effort of the candidate and all the materials used for the thesis has been dully
acknowledged.
Fantaye Kassa (Dr) ____________________ __________________________
Principaladvisor Signature Date
Endris Nuru (Dr) _____________________ _________________________
Co-advisor Signature Date
Approval
This is to certify that the thesis prepared by Alebachew Addis “The Effect of Service
Quality on Customer Satisfaction in Gondar Zuria Woreda, Maksegnit
Municipality”and submitted in partial fulfillment of the requirements for the Degree of
Master of Marketing Management complies with the regulations of the University of Gondar,
and meets the accepted standards with respect to originality and quality.
The Board of Examiners:
1. _____________________________ _________________ _________________
Advisor Signature Date
2. _____________________________ _________________ _________________
Internal Examiner Signature Date
3. _____________________________ _________________ _________________
External Examiner Signature Date
i
Acknowledgments
First, and for most I would like to thank the almighty God for being my guiding light and
strength throughout my life without whom the completion of this paper wouldn't have been
possible.
Secondly I express my heartfelt thanks and appreciation to my advisors, Principal advisor:
Fantaye Kassa ( Dr ) and Co-advisor:Endris Nuru ( Dr ) especially for their critical comments
and insightful feedback as the research work was on progress. They are really great in
directing my study, giving me with keen advice throughout all the times of doing this
research.
Thirdly I would also like to sincerely pass my deepest thanks to all participants of this
research who were generously sparing their time in providing me with valuable and insightful
information relevant to the study. They have deserved special place in the progress of this
research for their keen collaborations.
Finally, I would like to pass my thanks to all members of my family and friends who had
always been at my side while I was doing this research work.
ii
Table of contents
Declaration ............................................................................................................................................... i
Certificate ................................................................................................................................................ ii
Approval ................................................................................................................................................ iii
Acknowledgments .................................................................................................................................... i
List of Tables .......................................................................................................................................... iv
List of Figures ........................................................................................................................................ iv
Abstract ................................................................................................................................................... v
Chapter One ............................................................................................................................................ 1
1. Introduction ..................................................................................................................................... 1
1.1. Background of the Study .............................................................................................................. 1
1.2. Statement of the Problem ........................................................................................................... 4
1.3. Research Questions ..................................................................................................................... 6
1.4. Objectives of the Study ................................................................................................................ 6
1.4.1. General Objective ................................................................................................................. 6
1.4.2. Specific Objectives ............................................................................................................... 6
1.5 .Significance of the Study .............................................................................................................. 7
1.6. Scope of the Study .................................................................................................................. 7
1.7Organization of the Study .............................................................................................................. 8
Chapter Two............................................................................................................................................ 9
2. Review of Related Literature .......................................................................................................... 9
2.1. Theoretical Review ....................................................................................................................... 9
2.1.1. Definitions and Concepts of Service ..................................................................................... 9
2.1.2 Service Quality ..................................................................................................................... 11
2.1.3. Service Quality Dimensions ............................................................................................... 14
2.1.4. Customer Satisfaction ........................................................................................................ 18
2.1.5. Service Quality and Customer Satisfaction ......................................................................... 19
2.2. Empirical Review ........................................................................................................................ 21
2.3. Conceptual Model ...................................................................................................................... 22
Chapter Three........................................................................................................................................ 24
3. Research Methodology ................................................................................................................. 24
3.1. Research Approach .................................................................................................................... 24
3.2. Research Design ......................................................................................................................... 24
3.3. Target Population....................................................................................................................... 25
3.4. Sample Determination and Sampling Techniques ..................................................................... 25
iii
3.5. Data Collection Instruments and Procedure .............................................................................. 26
3.5.1. Data Collection Instruments ................................................................................................ 26
3.5.2. Data Collection Procedure .................................................................................................. 27
3.6. Validity and Reliability of Instruments ....................................................................................... 28
3.6.1. Validity of Instruments ....................................................................................................... 28
3.6.2. Reliability of Instruments .................................................................................................... 28
3.7. Variables of the Study ................................................................................................................ 30
3.7.1. Dependent variable ............................................................................................................. 30
3.7.2. Independent Variables......................................................................................................... 30
3.8. Data Analysis Method ................................................................................................................ 31
3.9. Ethical Considerations ................................................................................................................ 31
Chapter Four ......................................................................................................................................... 32
4. Data Analysis and Discussion ........................................................................................................... 32
4.1 Demographic Characteristics of the Respondents ...................................................................... 32
4.2. Service Quality Dimensions ........................................................................................................ 33
4.3. Correlation Analysis ................................................................................................................... 40
4.4. Regression Analysis .................................................................................................................... 41
4.4.1. Assumptions’ Test............................................................................................................... 41
4.4.2. Multiple Regression Analysis ............................................................................................. 42
Chapter Five .......................................................................................................................................... 46
Summary, Conclusion and Recommendation ....................................................................................... 46
5.1. Summary of the Major Findings ................................................................................................. 46
5.2. Conclusion .................................................................................................................................. 47
5.3. Recommendation ....................................................................................................................... 48
5.4. Suggestion for Further Study ..................................................................................................... 49
References ............................................................................................................................................. 50
Appendix-I ............................................................................................................................................ 55
Appendix-II ........................................................................................................................................... 58
Appendix III .......................................................................................................................................... 60
APPENDIX IV...................................................................................................................................... 67
APPENDIX V ....................................................................................................................................... 68
Appendix VI-1 ...................................................................................................................................... 69
Charts .................................................................................................................................................... 69
Appendix-IV-2 ...................................................................................................................................... 71
Appendix-IV-3 ...................................................................................................................................... 72
iv
List of Tables Table-3-1: Reliability Coefficients of the Instruments....................................................... 26
Table-3.2: Response Rate of the Questionnaires................................................................ 27
Table-4.1: Demographic Characteristics of the Respondents............................................. 29
Table-4.2: Descriptive Statistics of Reliability................................................................... 31
Table-4.3: Descriptive Statistics of Responsiveness........................................................... 32
Table-4.4: Descriptive Statistics of Tangibility................................................................... 33
Table-4.5: Descriptive Statistics of Assurance................................................................... 34
Table-4.6: Descriptive Statistics of Empathy..................................................................... 35
Table-4.7: Descriptive Statistics of Satisfaction................................................................ 36
Table-4.8: Relationship of Service Quality Dimensions and Customer Satisfaction........ 37
Table-4.9: Multiple Regressions of Service Quality on Customer Satisfaction................ 39
Table-4.10: Hypothesis Testing......................................................................................... 40
List of Figures
Figure-1: Service Quality and Customer Satisfaction.......................................................... 20
v
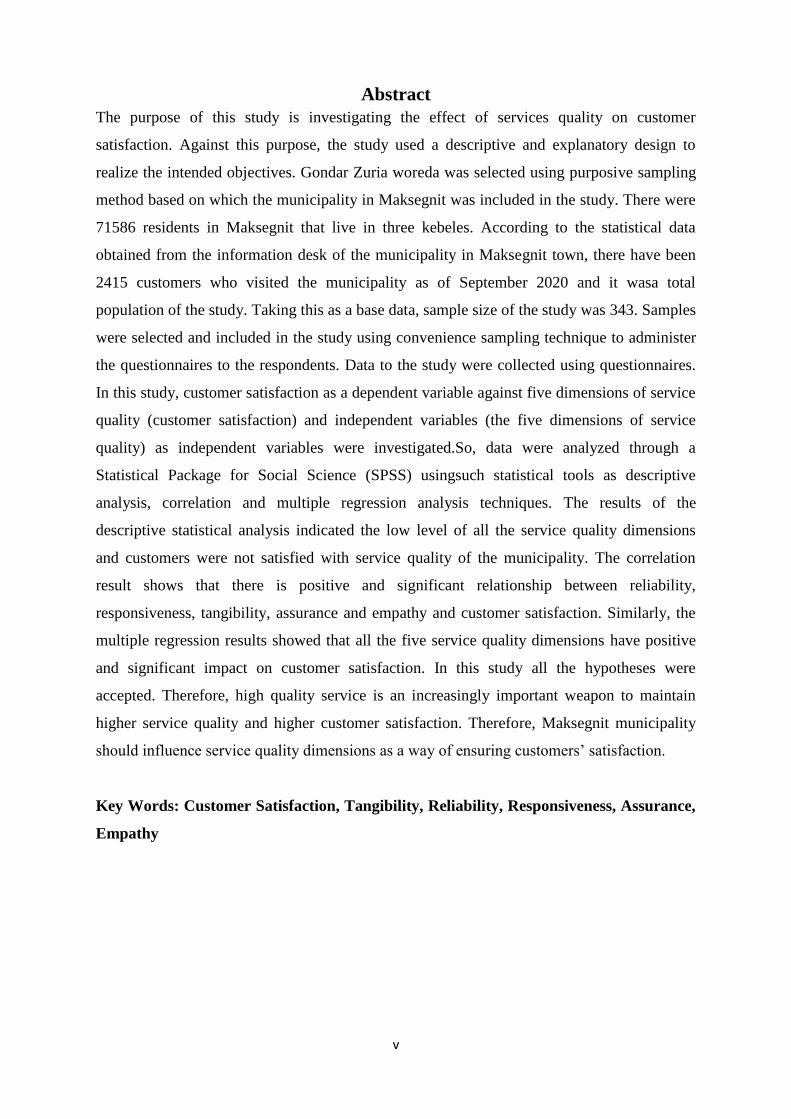
Abstract
The purpose of this study is investigating the effect of services quality on customer
satisfaction. Against this purpose, the study used a descriptive and explanatory design to
realize the intended objectives. Gondar Zuria woreda was selected using purposive sampling
method based on which the municipality in Maksegnit was included in the study. There were
71586 residents in Maksegnit that live in three kebeles. According to the statistical data
obtained from the information desk of the municipality in Maksegnit town, there have been
2415 customers who visited the municipality as of September 2020 and it wasa total
population of the study. Taking this as a base data, sample size of the study was 343. Samples
were selected and included in the study using convenience sampling technique to administer
the questionnaires to the respondents. Data to the study were collected using questionnaires.
In this study, customer satisfaction as a dependent variable against five dimensions of service
quality (customer satisfaction) and independent variables (the five dimensions of service
quality) as independent variables were investigated.So, data were analyzed through a
Statistical Package for Social Science (SPSS) usingsuch statistical tools as descriptive
analysis, correlation and multiple regression analysis techniques. The results of the
descriptive statistical analysis indicated the low level of all the service quality dimensions
and customers were not satisfied with service quality of the municipality. The correlation
result shows that there is positive and significant relationship between reliability,
responsiveness, tangibility, assurance and empathy and customer satisfaction. Similarly, the
multiple regression results showed that all the five service quality dimensions have positive
and significant impact on customer satisfaction. In this study all the hypotheses were
accepted. Therefore, high quality service is an increasingly important weapon to maintain
higher service quality and higher customer satisfaction. Therefore, Maksegnit municipality
should influence service quality dimensions as a way of ensuring customers’ satisfaction.
Key Words: Customer Satisfaction, Tangibility, Reliability, Responsiveness, Assurance,
Empathy
1
Chapter One
1. Introduction
This chapter presents an overview of the entire study. It includes the background of the study,
statement of the problem, objective of the study, research questions, significance of the study,
operational definition, delimitations of the study and limitation of the study and organization
of the study.
1.1. Background of the Study
Both concepts of customer satisfaction and servicequality have increasingly become
important issues in research (Audrey, 2003). From the beginning of the “customer service
revolution” as given in the works of Ron and Dick (1989) almost 30 years ago, a body of
business research has focused on customer satisfaction. Business consultants and
corporations have worked to identify characteristics of organizations that consistently please
their customers, to develop tools for monitoring customer satisfaction, and to build
continuous, quality improvement systems that respond to consumer feedback (Centre for
Study of Social Policy, 2007). Although much of the research has been conducted by and for
the corporate world, customer service and satisfaction is not limited to the private sector.
Publicly funded organizations in the business world provide growing body of experience and
study. Increasingly, federal, state and local government agencies are attempting to gauge their
performance and the effect on those they directly serve. Throughout the public sector,
initiatives have elevated customer service and satisfaction to new priorities. Businesses
monitor customer satisfaction to determine how to increase customer base, loyalty, profits,
and survival. Exemplary businesses work to make their customers happy and see customer
satisfaction as the key to survival. Customersatisfaction in turn hinges on the quality and
effects of their experiences and the goods or services they receive (Centre for Study of Social
Policy, 2007).
Conceptualizing customer satisfaction has been widely debated as organizations increasingly
attempt to measure it. It can however be experienced in a variety of situations and connected
to both goods and services. It is a highly personal assessment that is greatly affected by
customer expectations. Satisfaction also is based on the customer’s experience of both

2
contact with the organization (the “moment of truth” as it is called in business literature) and
personal outcomes (Centre for Study of Social Policy, 2007).
Some researchers define a satisfied customer within the private sector as “one who receives
significant added value” to his/her bottom line, a definition that may apply just as well to
public services (Hanan and Karp,1989).Customer satisfaction differs depending on the
situation and the product or service. A customer may be satisfied with a product or service, an
experience, a purchase decision, a salesperson, store, service provider, or an attribute or any
of these (Padilla, 1996).Some researchers completely avoid “satisfaction” as a measurement
objective because it is “too fuzzy an idea to serve as a meaningful
benchmark”(Wreden,2004). Instead, they focus on the customer’s entire experience with an
organization or service contact and the detailed assessment of that experience. For example,
reporting methods developed for health care patient surveys often ask customers to rate their
providers and experiences in response to detailed questions such as, “How well did your
physicians keep you informed?” These surveys provide “actionable” data that reveal obvious
steps for improvement (Maniema,2005). Some definitions are based on the observation that
customer satisfaction or dissatisfaction results from either the confirmation or
disconfirmation of individual expectations regarding a service or product.
In the public sector, customer satisfaction is often linked to both the personal interaction with
the service provider and the outcomes experienced by service users. This concept addresses
three aspects of customer satisfaction. The first is satisfaction with client-worker interaction
whether in-person, by phone, or by mail; the second is satisfaction with the support payment
(e.g., its accuracy and timeliness); and the third is satisfaction with the effect of support
enforcement (Hutten and Cox,1989).
Research identifies many characteristics that are associated with service quality. Business
researchers Schneider and Bowen (1995) assert that “service organizations must meet three
key customer needs to deliver service excellence:”security, esteem, and justice. Research
identifies an array of service quality factors that are important for customers, including:
timeliness and convenience, personalattention, reliability and dependability, employee
competence and professionalism,empathy,responsiveness,assurance,availability, and
tangibles such as physical facilities and equipment and the appearance of the personnel.
Research shows that these characteristics also apply to citizen satisfaction with public service
quality. Timely service is an especially strong determinant of quality across different types of
3
public services. Fairness and outcomes are additional factors important to public service
customers (Osborne and Peter, 2001).
Public sector quality improvement initiatives are on the rise worldwide as contracting and
private service provision has become more common. At the same time, European researcher,
Pillinger (2005) notes that consumer demand for more transparent, equitable, and consumer-
oriented services has produced a quality gap: a gulf in perceptions of quality and the impact
of services on the end user. She calls for rethinking quality initiatives to interlink quality
improvement with user involvement and participation and with social equality and inclusion
(Pillinger (2005). The experiences of successful businesses both support this perspective and
offer experiences, tools and lessons for putting customers first.
Customer Satisfaction and Service Quality are leading components in the system of external
relations of each organization, as today they largely determine its competitiveness. The desire
to manage relationships with customers leads to the fact that organizations are starting to pay
attention to the development and implementation of service standards (Mike, 2001). Many
industries are paying greater attention to customer satisfaction and service quality, for reasons
such as increased deregulation and competition (Abdissa, 2019). Satisfaction from service
quality is frequently evaluated in terms of functional quality and technical quality (Gronroos,
1984). Regularly, customers do not have lot information about the technical phases of a
service; therefore, functional quality becomes the main aspect from which to form
perceptions of quality of service. Service quality may be described as customer perception of
how well a service assembles or go over’s their expectations. Service quality can be
determined in terms of customer expectation, customer perception, and customer attitude and
customer satisfaction(Mohammad, Abdullah and Rahman, 2011)
Service organizations range in size from huge international corporations like airlines,
banking, insurance, telecommunications, hotel chains, and freight transportation to a vast
array of locally owned and operated small businesses, including restaurants, laundries, taxis,
optometrists, and numerous business-to-business services (Abdissa, 2019). At the same time,
municipalities must balance the revenue they received with the high cost of providing more
efficient services demanded by the citizen. Customer satisfaction and service quality are
important concepts to academic researchers studying consumer evaluations and to
practitioners as a means of creating competitive advantages and customer loyalty
(Mohammad, Abdullah and Rahman, 2011)

4
Cities are important role players in service delivery. They are required by law to find
innovative methods to involve communities in all their affairs. The mandate of a
municipality, according to the Constitution, is to ensure that the service deliveries for which it
is responsible satisfy citizens’ basic needs. These include water supply, sewerage collection
and disposal; refuse removal, electric municipality and gas supply, health services, roads and
storm water drainage, street lighting, and municipal parks and recreation (Boshoff &
Mazibuko, 2008 cited in Abdissa, 2019).
With the increase of the importance of service sector in Ethiopian economy, the
measurements of service quality become important. Many studies indicate that there are links
between customer satisfaction and service quality. In order to meet customer demand, many
companies need to better serve their customers. Better quality of service can usually get a
higher market share and better returns (Sousa & Voss. (2006).Providing high service quality
and generating customer satisfaction are significant mattes and challenge meeting the current
service industry (Wicks & Roethlein, 2009),Thus, this study attempts to investigate the effect
of services quality on customer satisfaction in Maksegnit Municipality
1.2. Statement of the Problem
The delivery of consistent service quality is arguably the most vital factors that contribute to
the establishment of credibility and reputation of the organizations in the eyes of the public
(Sachdev and Verna, 2004).Studies show that outstanding customer service organizations
focus on a clear goal, satisfying the customer and design everything else with that aim in
mind. From the top-down, these organizations act to provide positive customer experiences.
The focus on complete customer satisfaction permeates the organization(Centre for Study of
Social Policy, 2007).
Public services organizations specifically at local government level are not immune to the
pressures to improve the quality of their services on a continuous basis. Municipal authorities
for example, face more daunting tasks than those in the private sector in their efforts to
maintain citizen satisfaction. However, there are influences on the public organizations some
of which arise within from local authorities’ genuine desire of improving the quality of

5
services provided to the community while others are imposed or forced either by public
initiatives due to an increase in consumers’ awareness of their rights (Vazquez,
Gutierrez&Garcia, 2005 cited in Abdissa, 2019).
Despite services are large in the world economies, public organizations’ practices of quality
service delivery are less developed when compared to those in the manufacturing industry.
Service organizations are lagging in the effective use of Total Quality Management (TQM)
practices(Yasin, Alvin, Knut&Zimmer, 2004 cited in Zahari, et al, 2008).Studies have been
done in different service sectors in using SERVQUAL to examine service quality. An initial
application of SERVQUAL in the airline industry was provided by Flick and Ritchie (1991)
that illustrate how the measurement approach can be useful in comparing different
components of a larger service sector in the case of tourism industry (Zahari, et al, 2008).In
developing a modified version of SERVQUAL, Pakdil and Ayden, 2007 cited in Abdissa
(2019)extended the original service quality dimensions to include issues of image, flight
experience and availability of interchange, with airline passengers tending to rate
responsiveness as the most important service dimension. Zisis, Garefalakis and Sariannidis
(2009) used the model to determine customer satisfaction through perceived quality in
Telecommunication industry and found out that reliability, empathy and network quality
proved to significantly effective in contributing to overall service quality and overall
customer satisfaction with mobile services.
In the context of Ethiopia, Gebregziabher(2015) examined the service quality and customers’
satisfaction on three-star hotels in Addis Ababa and stated that the combination of tangibility,
reliability, responsiveness, confidence and communication together has significant and
positive effect on customer satisfaction.Andargie (2013) studied foreign customer satisfaction
in Sheraton Addis and Hilton five star intercontinental hotels and reported that the customers
aren’t satisfied and a gap in their expectation and perception in all service quality dimensions.
A study by Zeleke (2012) on the impact of service quality on customer satisfaction at
National Alcohol and Liquor Factory showed that the five service quality dimensions brought
an impact on customer satisfaction was significant in all factors of service quality.
As noted by Frederick and Kumar (2000) despite customer satisfaction has raised concerns in
the contact center industry; empirical studies have mostly been conducted on staff
dissatisfaction. Studying the effect of service quality with service quality dimensions into
account on customer satisfaction is signifies important in the study area. Hence, this study
6
focuses on assessing the effect of service quality on customer satisfaction in the municipality
of Maksegnit in Gondar Zuria woreda of Central Gondar.
1.3. Research Questions
The researcher tried to answer the following research questions.
1. What is the level of service quality and customer satisfaction in the municipality of
Maksegnit?
2. Is there any relationship between service quality dimensions ( tangibility, reliability,
responsiveness, assurance, and empathy ) and customer satisfaction?
3. What is the effect of service quality (tangibility, reliability, responsiveness, assurance,
and empathy) on customer satisfaction?
4. What is the most influential service quality dimension on customer satisfaction?
1.4. Objectives of the Study
1.4.1. General Objective The general objective of this study is investigating the effect of services quality on customer
satisfaction in Maksegnit municipality in Gondar Zuria woreda of Central Gondar
Administrative Zoneof The Amhara National Regional State.
1.4.2. Specific Objectives Thisstudy also has the following specific objectives.
1. To determine the effect of responsiveness on customer satisfaction
2. To determine the effect of assurance on customer satisfaction
3. To determine the effect of tangibility on customer satisfaction
4. To determine the effect of reliability on customer satisfaction
5. To determine the effect of Empathy on customer satisfaction
6. To reveal the most influential dimensions of service quality on customers’ satisfaction
7
1.5 .Significance of the Study
Since the study aims at investigating the effect of service quality on customer satisfaction, it
renders some benefits. To the municipality: The study can provide an organization with an
information on the existing customer behaviour which helps to respond in unique and
creative ways to the evolving needs and constantly shifting expectations of its customers
towards a lasting competitive advantage. It also helps the municipality to establish a clear
vision of what superior service is, communicate that vision to employees at every level, and
ensure that service quality is personally and positively important to everyone in the
organization.
To policy makers and the management: The study can provide policy makers and the
management with useful information that can help them devise means of supporting sectors
establish concrete standards of service quality and regularly measure themselves against
those standards towards maximizing their customer satisfaction by providing quality service
for customers
To researchers: The study may add a body of knowledge that indicate more other researchers
to engage in the same issue or other issues of concern in service delivery so that it is essential
for interested researchers in the field who want to undertake further studies related to services
of public organizations.
1.6. Scope of the Study
This study was undertaken in Central Gondar administrative zone focusing on the
municipality in Maksegnit town. Quality service and customersatisfactions in the context of
the municipality may touch several dimensions that could be too broad for this specific study.
In order to make the study manageable, special emphasis was given only on the effects of
service quality dimensions reliability, responsiveness, tangibility, assurance, and empathy) on
customers’ satisfaction in the municipality based on data from current customers.
8
1.7 Organization of the Study
The thesis is organized into five chapters. The first chapter introduces about the study and
deals with background of the study, statement of the study, research questions, objectives of
the study, significance of the study, scope of the study, and definition of key terms. The
second chapter focuses on the review of some literature to establish theoretical, conceptual
and empirical framework of the study. The third chapter presents the methodology that
includes the research design, sampling size and sampling technique, source of data and data
collection methods, and data analysis techniques. The fourth chapter deals with data analysis
and result discussion. Chapter five finally addresses conclusions and recommendation.
9
Chapter Two
2. Review of Related Literature
Chapter two focuses on the review of the related literature intended to provide theoretical
bases, conceptual framework and empirical findings to the study in accordance with the
research problem. Accordingly, it focuses on concepts of service, service quality, and the
dimensions of service quality, customer satisfaction, and service quality model
2.1. Theoretical Review
2.1.1. Definitions and Concepts of Service According to Kotler and Armstrong (2012), a service can be defined as economic activities
that produce time, place, form, or psychological utilities. Service as additionally explained by
the writers is any activity or benefit that is essentially intangible and does not result in
ownership of anything. The production of a service may or may not be tied to a physical
product. Service by Conwell, 1984 cited in Messay (2012) is also defined as those activities
that are separately identifiable and can provide satisfaction and are not necessarily tied to the
sale of a product or another service.
The American Society for Marketing defines service as activities or benefits that are offered
for sale or that are offered for being related to a particular product. Kotler (2003) defined
service as 'any behaviour or act based on a contact between two parties: the provider and the
receiver, and the essence of this reciprocal process in intangible. Lovelock et al. (2001)looked
at service as a set of economic activities that provide time, location form and psychological
benefits. Beer (2003) defined service as a set of characteristics and overall properties of the
service which aim to satisfy the clients and meet their needs.
Service has several different determinants from product such as high intangibility, cannot be
seen, and cannot be touched, smelled or even tasted but only can be felt by experiencing the
service itself. Hence, services are more challenging to be visualized by the service provider
and customer and it is difficult for the customer to express their confidence of the service
unless they experience the service by themselves by comparing standard and perceptions of
result performance (Sara et al., 2008). Services could not be owned like product but only
rented by the customer. Due to these determinants, services also involved tangibility features

10
such as facilities, service personnel and service ambient that help the service providers to
perform their service (Sara et al., 2008).
Physical quality relates to the tangible aspects of a service (Zeithaml et al., 1996). In a
nutshell, service not only involves intangibility aspects but also by the tangible aspects to
help the service provider to perform their work. Manufacturing or automobile industry or
even small and medium industries for example, may have to produce a good quality product
in order to have a good expectations from customers and the same goes to service oriented
business where they need to provide a good service quality in term of many aspects such as
service provider itself, facilities, service ambient or environment, technology and many other
aspects in order to attract customer to use the services offered and make them satisfied or
maybe more than satisfied with the service provided (Siddiqi, 2011).
Many service firms/organizations have become successful by identifying a previously
unrecognized or unsatisfied customer needs and wants. Services as described by Messay
(2012) are identifiable, intangible activities that are the main object of a transaction designed
to provide want satisfaction to customers. He further stated that the travel, hospitals, finance,
entertainment, health care communications, utilities and professional services fields are prime
example. Recognizing the importance of marketing, many of these industries and
organizations within them are now adding marketing-related personnel. According to Kotler
and Armstrong (2012) explained more about services as they are growing ever faster in the
world economy, marketing up a quarter of the value of all international trade. A service is an
act or performance that one partly can offer to another that is essentially intangible and
doesn’t result in the ownership of a thing. Its production may or may not be tied to a physical
product.
According to Bitner et al. (1993) service has four characteristics as intangibility,
inseparability, heterogeneity and perishes ability. Concerning intangibility of services, it was
Regan (1963) introduced the idea of services being activities, benefits or satisfactions which
are offered for sale or provided in connection with the sale of goods. The degree of
intangibility has been suggested as a means of differentiating tangible products with services.
Most of the time, services are explained as being intangible since their outcome is considered
to be an action rather than a physical product highlight the fact that the degree of tangibility
has implications for the ease with which consumers can evaluate services and products
(Zeithaml et al. 1985).About inseparability of services, inseparability is taken to show the

11
simultaneous delivery and consumption of services and it is believed to enable consumers to
affect or shape the performance and quality of the service (Zeithaml et al. 1985).
Regarding heterogeneity of services, heterogeneity reveals the degree of high variability in
service delivery. This is a particular problem for services with high labour involvement, as
the service performance is delivered by different people involved in the service provision and
the performance of people can vary from day to day and also from person to person. Besides,
it offers the opportunity to provide high degree of flexibility and customization of the service
and this can be used as a benefit and point of differentiation. The notion of perish ability of
services reflects that services cannot be stored and carried forward to a future time period and
suggest that services are time dependent and time important which make them very
perishable. The issue of perish ability is primarily the concern of the service producer and
that the consumer only becomes aware of the issue when there is insufficient supply and they
have to wait for the service (Bitner et al.,1993).
2.1.2 Service Quality Defining quality may depend on the purpose and whom for one talk about. Quality may not
be defined satisfactorily. Hence, different scientists define it differently. Quality is fitness for
use. Quality is conformance to requirements. Quality is a system of means to economically
produce goods or services which satisfy customers’ requirements (Juan, 1974, Crosby, 1979,
Japanese Industrial Standards Committee, 1981 in Zeithaml et al. 1985). Although there is a
lot of rhetoric around the concept in defining quality, according to the American society for
quality control, quality is the totality of features and characteristics of a product or service
that bear on its ability to satisfy stated or implied needs.
There are many researchers who have defined service quality in different ways. Among these
are found the definition given by Bitner, Booms and Mohr. According to Bitner, Booms and
Mohr (1994) service is defined as the quality that the consumer’s overall impression of the
relative inferiority/superiority of the organization and its services. While other researchers
(e.g. Cronin and Taylor, 1992) view service quality as a form of attitude representing a long-
run overall evaluation, Parasuraman, Zeithaml and Berry (1985) view service quality as a
function of the differences between expectation and performance along the quality
dimensions. This has appeared to be consistent with Roest and Peters (1997) definition that
service quality is a relativistic and cognitive discrepancy between experience-based norms
and performances concerning service benefits. A review on the service marketing literature

12
indicates that there are mainly two types of service quality conceptualizations: Nordic and
American (Vijayadurai, 2008).
The Nordic approach proposes that a customer’s overall perception of service quality consists
of functional and technical quality, with technical quality being what customers get after the
service delivery process in buyer-seller interactions and functional quality is the interaction
between employees and customers during the service encounter (Gronroos, 2001). The
American approach proposes that service quality consists of reliability, responsiveness,
empathy, assurances, and tangibles dimension (Zeithaml et al., 1996). This model, based on
expectancy- disconfirmation theory, views that service qualityis a gap between customers’
perceptions and expectations of service performance.
Hence quality is an integral part of business. Smith, (1997) in his study of Malcolm Bald
ridge National Quality Award reports in US 2003 defines quality as listening to customers
and delivering what they expect. Quality according to Professor Bill Evans asked. A hundred
definitions could be elaborated, but the only one right answer is that quality is what the
customer says it is. Service quality is seen as the gap between the consumers’ expectations
and perceptions, that is, the quality of a service will be rated high when the service delivered
exceeds the consumers’ expectations and will be rated low when it falls short of customers’
expectations. If the performance exceeds expectations, the customer is highly satisfied.
One of the major ways to differentiate a service firm is to consistently deliver higher quality
service than competitors (Kotler, Wong, Saunders and Armstrong, 2005).The key target is to
meet or exceed customers’ quality expectations. Their expectations are formed by their past
experience, word of mouth and service firm advertising. The customers choose providers on
this basis, after receiving the service; they compare the perceived with the expected service.
Various studies of excellently managed service companies show that they share a number of
common practices with respect to service quality. These include: A history of top
management to quality, the setting of high standards, systems for monitoring service
performance, and satisfying the employees as well as customers (Ntaayi, 1998 cited in
Ladhari,2008).Business researchers Schneider and Bowen (1995) assert that service
organizations must meet three key customer needs to deliver service excellence security,
esteem, and justice(Schneider and Bowen, 1995). Research identifies an array of service
quality factors that are important for customers, including: timeliness and convenience,
personalattention, reliability and dependability, employee competence and
13
professionalism,empathy,responsiveness,assurance,availability, and tangibles such as
physical facilities and equipment and the appearance of the personnel.
In public service quality, timely service is an especially strong determinant of quality across
different types of public services. Fairness and outcomes are additional factors important to
public service customers (Osborne and Peter, 2001). Public sector quality improvement
initiatives are on the rise worldwide as contracting and private service provision has become
more common. At the same time, European researcher Pillinger (2005) notes that consumer
demand for more transparent, equitable, and consumer-oriented services have produced a
quality gap: a gulf in perceptions of quality and the impact of services on the end user. She
calls for rethinking quality initiatives to interlink quality improvement with user involvement
and participation and with social equality and inclusion (Pillinger (2005).The experiences of
successful businesses both support this perspective and offer experiences, tools and lessons
for putting customers first.
Service quality is a concept that has attracted considerable interest and debate in the
marketing literature because of the difficulties in both defining it and measuring it with no
consensus emerging on either (Mike,2001). One that is commonly used defines service
quality as the ability of the organization to meet or exceed customer expectations. It is the
result of the comparison between customers’ expectations about a service and their
perception of the way the service has been performed (Zeithaml, Parasuraman and Berry,
1990). If expectations are greater than performance, then perceived quality is less than
satisfactory and hence customer dissatisfaction occurs. Most of the recent work on service
quality in marketing can be credited to the pioneering and continuing work of Parasuraman,
Berry & Zeithaml (1988). In a seminal research study, Zeithaml, Parasuraman and Berry
(1990)identified ten dimensions of service quality based upon a series of focus group studies
including reliability, responsiveness, communication, credibility, security, competence,
courtesy, understanding, and access.
Effective service delivery is an important means for organizations to gain a competitive edge
in today’s service economy (Parasuraman, Zeithaml, & Berry, 1988). Service quality is
generally recognized as a critical success factor in a firm’s endeavours to differentiate itself
from its competitors; and a great deal of research has addressed various aspects of service
quality. Various studies have revealed over the years that good service quality leads to the
retention of existing customers and the attraction of new ones, reduced costs, an

14
enhancedcorporate image, positive word-of-mouth recommendation, and, ultimately,
enhanced profitability (Lee et al., 2008; Park et al., 2005 ).
2.1.3. Service Quality Dimensions Receiving a high level of service is important to customers but understanding how to measure
and evaluate the service quality received is challenging. A reliable measure of service quality
is critical for identifying the aspects of service needing performance improvement, measuring
the degree of improvement needed on each aspect and evaluating the impact of improvement
efforts (Zeithaml et al., 2008).
From that initial research, Parasuraman et al. (1988) developed a service quality instrument
consisted of 22 pairs of statements, which measure customer expectations and perceptions of
service delivered on a seven- or nine-point Likert scale. For each pair of statements, the gap
difference between the two scores is calculated. The idea is that the service is good if
perceptions meet or exceed expectations and problematic if perceptions fall below
expectations. The scale combined ten components into five generic dimensions of service
quality which provides a basic skeleton which can be adapted or supplemented to fit the
characteristics or specific research needs of a particular organization. These dimensions
capture the facets of all ten originally conceptualized dimensions regardless of service
industries (Zeithaml et al., 1990) and they are given below. These five dimensions have
become dominant within service quality research and will be listed and briefly described in
the following.
Tangibility
Tangibles refers to the appearance of physical facilities, equipment, personnel and
communication materials in the service process, such as cleanliness, appearance of staff and
appropriate technical equipment for support and entertainment. The definition of tangibility is
the appearance of physical facilities, equipment, personnel and communication materials
(Santos, 2002 cited in Abdissa, 2019).
Elements of tangibles are used in varying degrees to project an image that will find favor with
consumers. Tangibles will be of particular significance where the customer’s physical
presence at a service facility is necessary for consumption to occur, e.g. hair salon, hotel, and
night club. Tangibility provides physical representations or images of the service being
offered by the organization that customers, particularly new customers, will use to evaluate

15
quality. Service organizations often use tangibles to enhance their image, provide continuity
and signal quality to their respective customers.
In contrast, organizations that do not pay attention to tangibility dimension of the service
quality strategy can confuse and even destroy a good strategy and frustrate their respective
customers (Wilson et al, 2008). According to the author in fact, service intangibility may be
difficult for customers to understand. Owing to the intangible nature of services, it is often
difficult for customers to understand and evaluate services and, therefore, customers often
rely on the tangible evidence that surrounds the service in forming evaluations which is
therefore requiring service providing organizations to carefully give due attention to this
service quality dimension(Jamal & Anastasiadou, 2009 cited in Abdissa, 2019).
The tangibility dimension compares customer expectations to customer perceptions regarding
the organization’s ability to manage its tangibles. Comparing the perception scores to the
expectation scores provides a numerical variable that indicates the tangibles gap (Bateson,
Hoffman, 2011)
Reliability
Reliability as one dimension of service quality is the ability to perform the promised service
dependably and accurately. Reliability as a service quality factor has a significant role of
determining customers’ retention as it focuses on consistent and reliable delivery. For
example the consistency in meeting promises communicated and the completion of tasks on-
time. It is regarded as the most important determinant of perceptions of service quality. This
dimension is particularly crucial for services such as railways, buses, banks, building
societies, insurance companies, delivery services and trade services, e.g. plumbers, carpet
fitters, car repair.
The reliability dimension of service quality refers to the ability of service organizations to
perform the promised service dependably and accurately, and thus reflects the consistency
and dependability of an organization’s performance (Rodriquez, Bonar &Sac chi, 2011).
Wilson et al (2008) state reliability that the organization delivers on its promises about
service delivery, service provision and problem resolution. Even though unreliable service
providers are extremely frustrating for customers, a disturbing number of organizations still
fail to keep their promises regarding service delivery. In many instances, the customer is
ready to spend money if only the service provider will show up and conduct the transaction as

16
promised (Bateson & Hoffman, 2011). Reliability is consistently the most important
determinant of perceptions of service quality (Wilson, et al, 2008).
Responsiveness
Responsiveness as a service quality dimension refers to general willingness to help customers
and provide prompt service, which refers to the ability of responding to individual customer
requirements and showing sincere interest in problem solving. Responsiveness is the
willingness to help customers and to provide prompts service. This dimension emphasizes
attentiveness and promptness in dealing with customer requests, questions, complaints and
problems.
Responsiveness also captures the notion of flexibility and the ability to customize the service
to customer needs. It further deals with the creation of a welcoming organizational climate
that is showing customers a will to solve their problems and to get their needs accomplished.
It is characteristically more concerned with dealing on customers’ needs. Regarding this, the
organization must view all the processes of service delivery in light of customers’ needs and
the handling of requests from the customer’s point of view rather than from the
organization’s point of view (Wilson, et al, 2008).
Responsiveness reflects a service organization’s commitment to provide services in a timely
manner quickly and adequately As such, the responsiveness dimension focuses on concerns
of the willingness and readiness to provide a service ethically, timely as we as completely.
Occasionally, customers may encounter a situation in which employees are engaged in their
own conversations with one another while ignoring the needs of the customer (Bateson,
Hoffman, 2011).Responsiveness as a major service quality dimension generally shows the
willingness to help customers and to provide prompt service. The responsiveness service
quality dimension is particularly prevalent where customers have requests, questions,
complaints and problems.
Assurance
Assurance as one important dimension of service quality includes the competence and
courtesy of employees and their ability to convey trust and credibility. Assurance refers to the
employees’ knowledge and courtesy, and the ability of the service to inspire trust and
confidence. This service quality dimension may be of particular concern for customers of
health, financial and legal services. The dimension would include staff training in competent
17
and courteous charisma among employees and the feeling of safety in the transactions with
the customers.
The assurance dimension of service quality addresses the competence of the organization, the
courtesy it extends to its customers and the security of its operations (Jamal and
Anastasiadou, 2009). They define assurance as one service quality dimension as employees’
knowledge and courtesy, and the ability of the organization and its employees to inspire trust
and confidence.
As far as assurance is concerned, Bateson & Hoffman (2011)add that competence pertains to
the organization’s knowledge and skills in performing the promised service and refers to how
the organization’s employees interact with the customer and the customer’s possessions.
Wilson et al. (2008) warn that this dimension is likely to be particularly important for
services that customers perceive as high risk or for services that customers feel uncertain
about their ability to evaluate the outcomes.
Empathy
Empathy: Encompasses the access to customers, communication to customers and
understanding of customers resulting in individualized attention to customers. It denotes the
caring, individualized attention the service provides its customers. Small service companies
are better placed for treating customers as individuals than their larger, invariably
standardized counterparts. However, relationship marketing is designed to offer a more
individualistic approach for customers of large organizations.
Bateson & Hoffman (2011)define empathy as the caring and individualized attention that the
organization provides its customers. They explain that empathy is the ability to experience
another’s feelings as one’s own. According to Wilson et al. (2008), the essence of empathy is
conveying, through personalized or customized service, that the customers are unique and
special and that their needs are understood.
Empathetic firms have not lost touch with what it is like to be a customer of their own
organization. Assuch, the organization understands customers‟ needs and makes their
services accessible to their customers. In contrast, organizations that do not provide the
requested individualized attention totheir customers and offer, for example, operating hours
18
convenient for the organization and not its customers, fail to demonstrate empathetic
behaviour(Bateson, Hoffman, 2011)
2.1.4. Customer Satisfaction Customer satisfaction has been recognized as one of the most important elements of
contemporary marketing thought, particularly in the case of service sectors and one of the
main goals in marketing (Centre for the Study of Social Policy (2007).Customer satisfaction
currently is emphasized more as one of the most important factor of organizations towards
success including service organizations. Because satisfied customers tend to maintain their
consumption pattern or consume more of the same product or service, customer satisfaction
has become an important indicator of the future behaviour. According to Zeithaml et al.
(2008), customer satisfaction is a broad concept, whereas service quality focuses specifically
on the dimensions of services and, therefore, perceived service quality is a component of
customer satisfaction.
The definition of customer satisfaction has been widely debated as organizations increasingly
attempt to measure it. Customer satisfaction can be experienced in a variety of situations and
connected to both goods and services. It is a highly personal assessment that is greatly
affected by customer expectations. Satisfaction also is based on the customer’s experience of
both contact with the organization (the “moment of truth “as it is called in business literature)
and personal outcomes. Some researchers define satisfied customer within the private sector
as “one who receives significant added value “to his/her bottom line, a definition that may
apply just as well to public services (Hanan and Peter, 1989).
Customer satisfaction differs depending on the situation and the product or service. A
customer may be satisfied with a product or service, an experience, a purchase decision, a
salesperson, store, service provider, or an attribute or any of these (Padilla, 1996).Some
researchers completely avoid “satisfaction” as a measurement objective because itis “too
fuzzy an idea to serve as a meaningful benchmark (Wreden 2004).
Instead, they focus on the customer’s entire experience with an organization or service
contact and the detailed assessment of that experience. For example, reporting methods
developed for health care patient surveys often ask customers to rate their providers and
experiences in response to detailed questions such as, “How well did your physicians keep
19
you informed?”These surveys provide “actionable” data that reveal obvious steps for
improvement. Customer satisfaction is a highly personal assessment that is greatly influenced
by individual expectations.
Some definitions are based on the observation that customer satisfaction or dissatisfaction
results from either the confirmation or disconfirmation of individual expectations regarding a
service or product. To avoid difficulties stemming from the kaleidoscope of customer
expectations and differences, some experts urge companies to concentrate on a goal that’s
more closely linked to customer equity.
Instead of asking whether customers are satisfied, they encourage companies to determine
how customers hold them accountable (Wreden, 2004).In the public sector, the definition of
customer satisfaction is often linked to both the personal interaction with the service provider
and the outcomes experienced by service users. The definition by Hutten and Cox (1998)
addresses three aspects of customer satisfaction: satisfaction with client-worker interaction,
whether in-person, by phone, or by mail; satisfaction with the support payment (e.g., its
accuracy and timeliness); and satisfaction with the effect of child support enforcement on the
child (Hutten and Cox, 1998).
2.1.5. Service Quality and Customer Satisfaction
Much debate have been done on the association between service quality and customers
satisfaction and much confusions have been assigned to the interrelatedness of service quality
and satisfaction and in what sense the concepts differ from each other. In simple terms quality
refers to some attributes about what are offered by organizations whereas concepts regarding
satisfaction or dissatisfaction refer to a customer’s emotive reaction to the services being
offered (Saha& Theingi, 2009). In this logic they are separate, where quality is something the
company is responsible for and satisfaction is an experience in the customer’s domain.
However, the concepts are clearly related since we might use customer reaction
(satisfaction/dissatisfaction) as means of evaluating whether the right quality has been
delivered.
Parasuraman et al. (1985) conceptualized perceived service quality as a totality evaluation of
a service-process, whereas satisfaction is a transaction-specific evaluation. In other words,
they posited that incidents of satisfaction altogether result in perceptions of the service

20
quality. In contrast to this perspective, Cronin & Taylor (1992) argues that perceived service
quality is an antecedent of customer satisfaction. In this optic, the concept of customer
satisfaction is conceived of as a result of service quality in such orders as service quality –
satisfaction - purchase intention.
Oliver (1997) reported that service quality is a casual antecedent of customer satisfaction, due
to the fact that service quality is viewed at transactional level and satisfaction is viewed to be
an attitude. Zeithaml et al. (2009) reported that the service quality divisions are related to
overall service quality and or customer satisfaction. Fornell et al. (1996) expressed that
satisfaction is a consequence of service quality.
To achieve a high level of customer satisfaction, most researchers suggest that a high level of
service quality should be delivered by the service provider as service quality is normally
considered an antecedent of customer satisfaction (Anderson et al., 1994; Cronin and Taylor,
1992). However, the exact relationship between satisfaction and service quality has been
described as a complex issue, characterized by debate regarding the distinction between the
two constructs and the casual direction of their relation- ship (Cronin et al., 2005).
Parasuraman, Zeithaml, and Berry (1994) concluded that the confusion surrounding the
distinction between the two constructs was partly attributed to practitioners and the popular
press using the terms interchangeable, which make theoretical distinctions difficult. Cronin
and Taylor (1992) asserted that consumer satisfaction appeared to exert a stronger influence
on purchase intention than service quality, and concluded that the strategic emphasis of
service organizations should focus on total customer satisfaction programs. The authors
reasoned that consumers may not buy the highest quality service because of factors such as
convenience, price, or availability and that these constructs may enhance satisfaction while
not actually affecting consumers’ perceptions of service quality.
However, Bitner and Hubert (1994) determined that service encounter satisfaction was quite
distinct from overall satisfaction and perceived quality. The authors concluded thatthe
constructs exhibited in- dependence. Despite the strong correlations between service quality
and customer satisfaction in their study, Bitner and Hubert (1994) determined that the two
constructs exhibited independence and concluded that they were in fact different constructs,
at least from the customer’s point of view. Anderson et al. (1994) had endeavoured to clarify
the specification and nature of the service quality and satisfaction constructs and found
21
empirical support for the conceptualization that service quality was an antecedent of the super
ordinate satisfaction construct. In addition, the authors found that explained a greater portion
of the variance in consumers ‘purchase intentions than service quality.
2.2. Empirical Review
Several studies related to service quality and customer satisfaction in different organizational
contexts were conducted by different researchers. The relationship between customer
satisfaction and service quality has received a good deal of attention in the literature of
Bolton and Drew; 1994 as cited inIacobucci et al (1995).
In their study, service quality is a global judgment, or attitude, relating to the superiority of
the service whereas satisfaction is related to a specific transaction. Satisfaction is a post
consumption experience which compares perceived quality with expected quality. The key
difference between service quality and customer satisfaction is that quality relates to
managerial delivery of service while satisfaction reflects customers' experience of service.
There is also a lot of argument regarding whether customer satisfaction is the antecedent of
service quality or the outcome of service quality. Initially, scholars take the position that
satisfaction is an antecedent of service quality since to reach an overall attitude (service
quality) implies an accumulation of satisfactory encounters (Bolton & Drew, 1991 cited in
Iacobucci et al, 1995). However, other scholars take the opposite view that service quality is
the antecedent of customer satisfaction (Cronin & Taylor, 1992).
Empirical research by Cronin & Taylor, (1992) showed that service quality has a significant
effect on customer satisfaction. Similarly, recent studies by Gonzalez & Brea, 2005; and
Echini, 2004 cited in Million (2017) using recursive structural models provided empirical
support that service quality results in customer satisfaction. Customer satisfaction is a broader
concept than service quality which focuses specifically on the dimensions of service as
indicated in (Zeithamlet al.2006).On the relationship between customer satisfaction and
service quality, research was conducted in a bank in Tehran, Iran by Osman; et.al (2010)
cited in Abdissa, 2017 and revealed that service quality would be one of the determinants of
satisfaction. The finding explained that nearly 43 percent of customer’s satisfaction changes
are explained by service quality. On the relationship between service quality, satisfaction and

22
perceived value among customers in Nauru Municipality, Kenya, Daniel (2012) concluded
that service quality and customer satisfaction were positively and significantly associated
indicating 19.8% of the variance in customer satisfaction can be predicted by the service
quality offered by the municipality.
In Ethiopia, a study was conducted by Messay (2012) on the relationship between bank
service quality and customer satisfaction. The researcher concluded that all service quality
dimensions are positively correlated with customer satisfaction indicating 90.7% of the
variance in customer satisfaction can be predicted by the service quality offered by the
private banks. In addition, results of this research show that there is a positive significant
relationship between customer satisfaction and loyalty and explain 62% of the variance.
Potluri and Mangnale (2010) conducted an empirical study to find out the satisfaction level of
ETC customers using the following parameters: service interaction, service delivery process,
customer compliant handling procedure and its outcome and the overall customer satisfaction
level. The findings of their analysis showed that 41% customers of ETC were dissatisfied
with employees‟ interaction skills. Furthermore, another 47% of the customers were also
disappointed with customer service delivery system and 70% customers were not pleased
with the Complaint Handling Procedure and its outcome. And 57% of the customers
expressed overall dissatisfaction on the services provided by ETC.
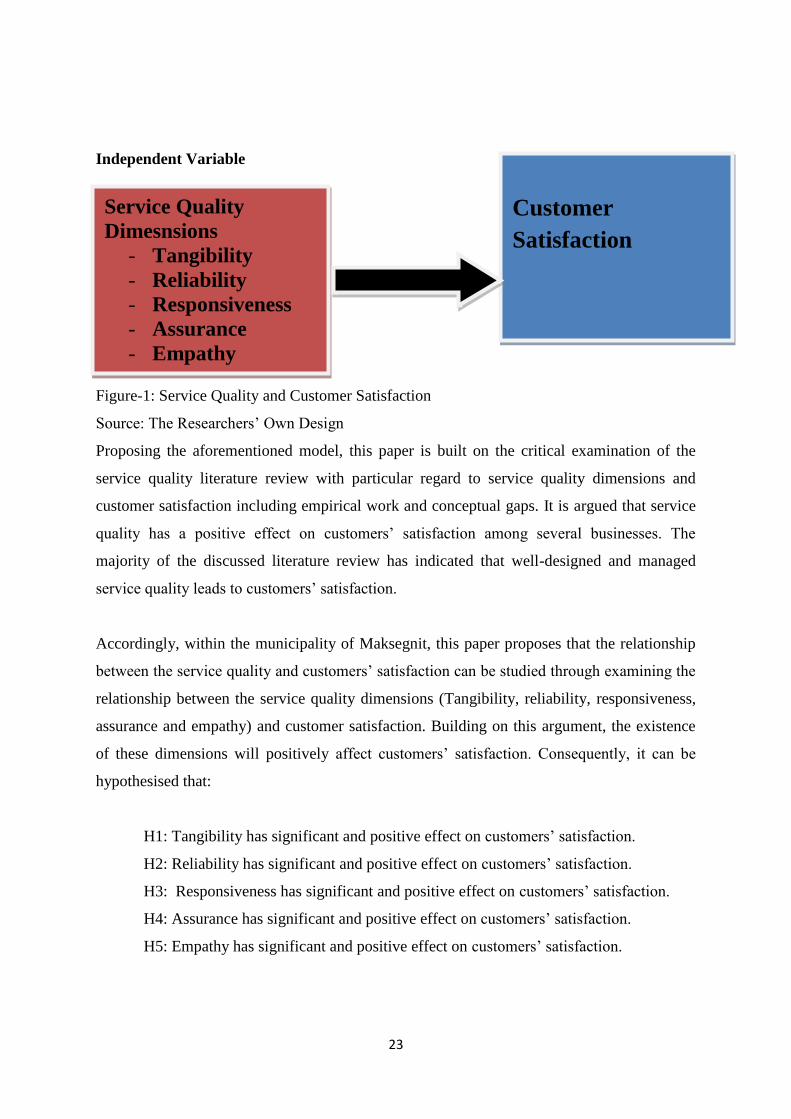
2.3. Conceptual Model
The conceptual framework indicates the crucial process, which is useful to show the direction
of the study. Thus, the purpose of this study is to examine how tangibility, reliability,
responsiveness, assurance, and empathy of services which are the independent variables can
bring effect on the dependent variables, customer satisfaction at the municipality. Based on
the above literature review the following conceptual framework is developed.
23
Independent Variable Dependent Variable
Figure-1: Service Quality and Customer Satisfaction
Source: The Researchers’ Own Design
Proposing the aforementioned model, this paper is built on the critical examination of the
service quality literature review with particular regard to service quality dimensions and
customer satisfaction including empirical work and conceptual gaps. It is argued that service
quality has a positive effect on customers’ satisfaction among several businesses. The
majority of the discussed literature review has indicated that well-designed and managed
service quality leads to customers’ satisfaction.
Accordingly, within the municipality of Maksegnit, this paper proposes that the relationship
between the service quality and customers’ satisfaction can be studied through examining the
relationship between the service quality dimensions (Tangibility, reliability, responsiveness,
assurance and empathy) and customer satisfaction. Building on this argument, the existence
of these dimensions will positively affect customers’ satisfaction. Consequently, it can be
hypothesised that:
H1: Tangibility has significant and positive effect on customers’ satisfaction.
H2: Reliability has significant and positive effect on customers’ satisfaction.
H3: Responsiveness has significant and positive effect on customers’ satisfaction.
H4: Assurance has significant and positive effect on customers’ satisfaction.
H5: Empathy has significant and positive effect on customers’ satisfaction.
Service Quality
Dimesnsions
- Tangibility
- Reliability
- Responsiveness
- Assurance
- Empathy
Customer
Satisfaction

24
Chapter Three
3. Research Methodology
Chapter three focuses on the research methodology and shows all the research
methods/techniques that were used to conduct the study. Accordingly, it presents the research
the research approach, the research design, the study sample and sampling techniques,
sources of data, the instruments that were utilized in collecting data, the procedure of data
collection, and data analysis techniques.
3.1. Research Approach
According to Kothari (2004) research approaches are plans and the procedures for research
that span the steps from broad assumptions to detailed methods of data collection, analysis,
and interpretation. Research approaches are mainly three qualitative, quantitative and mixed.
The selection of a research approach among others is based on the nature of the research
problem being addressed. Accordingly, this research was conducted using a quantitative
research approach as it examined and measured the relationship between service quality
dimensions (reliability, responsiveness, tangibility, assurance and empathy) and customer
satisfaction in Maksegnit municipality. Kothari (2004) states that quantitative approach is the
most appropriate when the purpose of an investigation is to describe the degree of
relationship which exists between variables. The research approach involves the generation of
data in quantitative form which can be subjected to rigorous quantitative analysis in a formal
and rigid ways.
3.2. Research Design
A research design is the arrangement of conditions for collection and analysis of data on an
identified problem in a manner that combines relevance to the research purpose with
economy in procedure. In fact, the research design is the conceptual structure within which
research is conducted; it constitutes the blueprint for the collection, measurement and
analysis of data(Kothari, 2004). Accordingly, the study followed a descriptive research
25
design as it sought to describe in detail the existing state of service quality with due attention
to reliability, responsiveness, tangibility, assurance and empathy dimensions and
customersatisfaction in Maksegnit municipality. Thus, descriptive statistics such as
frequency, percentage, mean and standard deviations were used to assess service quality and
measure customer satisfaction.
This study was also designed to investigate the relationships between the dependent variable
(customer satisfaction) and the independent variables (tangibility, reliability, responsiveness,
assurance and empathy). A descriptive research according to Rose (2005) is used to obtain
information concerning the current status of the phenomena to describe "what exists" with
respect to variables or conditions in a situation. The methods involved range from the survey
which describes the status quo, the correlation study which investigates the relationship
between variables, to developmental studies which seek to determine changes over time.
3.3. Target Population
A population is the group of people whom the study is about. Thus the target population
consists of all the people to whom the survey’s findings to be applied or generalized (Kothari,
2004). The population of this study were the residents that live in Maksegnit town and used
the municipality. As the information from the public relation office of the town indicated, the
total population of the town was 71586. Out of this number, according to the statistical data
obtained from the information desk of the municipality, there were 2415 customers who
visited the municipality as of September 2020 GC. Hence, the target population of the study
accounted for 2415.
3.4. Sample Determination and Sampling Techniques
Sampling technique is the way of drawing inference about a population without studying the
entire population under study (Creswell, 2009).The sampling unit of this study was customers
live in Maksegnit and visited the municipality. The sample frame for this study was therefore
2415 customers who visited the municipality. Taking this as a base data, sample size of the
study was first determined using a mathematical formula provided by Yamane (1887). The
formula is given as follows.

26
n =N
1 + N(e)2
Where:
n -Is the sample size,
N- Is the total population size, and
e- Is the level of sampling error = (0.05)
Out of the total of 2415 customers who received service from the municipality, 343 sample
size of the study was determined. Having determined sample size of the study, samples were
selected and included in the study using convenience or opportunity sampling technique to
administer the questionnaires to the respondents. Here, an important criterion of sample
selection is the researcher’s convenience. Members of the target population are selected for
the purpose of the study if they meet certain practical criteria such as geographical proximity,
availability at a certain time and easy accessibility. This was so the rationale of using this
sampling technique as it was best technique of getting the participants when they come to the
municipality for service due to the fact that it was impossible to contact everyone who might
be sampled.
3.5. Data Collection Instruments and Procedure
3.5.1. Data Collection Instruments The study used both primary and secondary source of data. Primary data offers tailored and
original information while secondary data gives opportunity to support and check the primarily
collected data with already existed information. Secondary data to the study were collected from
sources like books, research papers, journals and websites that were already existed. The
primary data were obtained from the municipality’s customers through questionnaire having
closed-ended items.
Structured questionnaires were prepared to collect the primary data from the respondents
included in the study sample. The questionnaires contained two major parts that were about
demographic data and about the study. The first part that was about personal information of
the respondents mainly involved questions on gender, age educational level and experience of
using the municipality.

27
The second part was about the main study and further delineated into two sections that were
about service quality dimensions and customer satisfaction. Hence, the first section was
designed to measure the level of service quality delivered by the municipality against five
dimensions such as reliability, responsiveness, tangibility, assurance and empathy. The
questionnaire contained items on the demographic data of the respondents a total of 22
closed-ended items of which 5 items described reliability dimension, 4 items described
responsiveness dimension, 4 items described tangibility dimension, 4 items described
assurance dimension and 5 items described empathy dimension.
Each of the item in the questionnaire in this section was measured using a 5-point Likert scale
of agreement or disagreement (5-Strongly agree, 4-Agree, 3-Undecided, 2-Disagree, and 1-
Strongly disagree, neither agree nor disagree, and agree strongly agree). The third part was
about customers’ satisfaction on the quality of services provided by the municipality and
contained 5 closed-ended items in accordance with each of the five service quality
dimensions. Each of the item in this part of the questionnaire was measured using a 5-point
Likert scale of being satisfied or not (5-Strongly satisfied, 4-Satisfied, 3-Nuetral 2-
Dissatisfied, and 1-Strongly dissatisfied).The questionnaires contained closed ended items
which the respondents could easily understand.
3.5.2. Data Collection Procedure
The study used both primary and secondary sources of data to analyze the problem. To do so,
it began with the review of secondary data in developing a detailed theoretical, conceptual
and empirical framework of the study. Having the literature reviewed, a survey questionnaire
was prepared as the main primary data gathering instrument for this study. Primary data are
described as those items that are original to the problem as it is necessary in order to get
relevant, original and reliable first-hand information to analyze and determine about the
problem under study. Questionnaires are also the major tool of capture the primary data
because of its advantages over the other methods and its efficiency or ability to capture more
information from the source (Kothari, 2004).Thus, a survey questionnaire was prepared in
English as the main primary data gathering instrument for this study. Then, the English
version questionnaire was translated into Amharic using simple and clear language in
manners understandable for the respondents. Through this, the primary data were collected
through the questionnaires distributed to the samples. To assure the quality of data, high
28
emphasis was given right from the beginning in designing data collection instruments for its
simplicity. As a result, considerations were given to reliability, validity and pilot testing.
3.6. Validity and Reliability of Instruments
3.6.1. Validity of Instruments Different measures were taken to verify validity of the instruments. Validity is one major
criterion to evaluate a research instruments. A questionnaire was designed to measure the
effect of service quality on customer satisfaction that was organized under the five quality
dimensions.
According to Kothari (2004), in terms of measurement procedures, validity is the ability of an
instrument to measure what it is designed to measure and does so correctly and accurately.
Validity determines whether the research truly measures what it intends to measure or how
truthful the research results are. The major ones were face and content validity. Through face
validity, first, the questionnaire was prepared taking high care into consideration. Primarily, it
was prepared in English and submitted for comment for professionals in the field. Moreover,
the instrument was submitted to advisors for more critical comments before its actual
administration to collect data. In view of content validity, it was checked and verified
whether all the relevant contents were addressed in the questionnaire. Then, the instrument
was translated into Amharic to make items clearer and easily understandable for all the
research participants.
3.6.2. Reliability of Instruments Reliability is the other major criteria for evaluating the research instruments. Reliability
measures the internal consistency of the instruments. According to Bhattacherjee (2012)
internal consistency reliability is a measure of consistency between different items of the
same construct. The study used a multiple item measurement scale for which internal
consistency method was applied. Thus Cronbach alpha was used to measure reliability of the
instruments
Accordingly, Cronbach alpha with acceptable cut off points 0.7 demonstrate that the
instruments for all the service quality dimensions are internally consistent. The reliability test
for the instruments used for the study was conducted using SPSS and the results shows that
the items used were reliable.

29
According to Sekaran and Boogie (2010), in general, reliability coefficients if found less than
0.60 are considered to be under privileged, those in the 0.70 range are considered as
conventional, and those over 0.80 are considered as good. In other words, the closer
Cronbach alpha coefficient is to 1, the higher the internal consistency reliability. The
reliability coefficients of the five service quality dimensions of the study were shown below
in Table 3.1
Table-3.1 Reliability Coefficients the Instruments
No Variables Reliability No of Items
1 Reliability dimension .749 5
2 Responsiveness dimension .740 4
3 Tangibility dimension .801 4
4 Assurance dimension .758 4
5 Empathy dimension .760 5
6 Customer satisfaction .734 5
Table-3.1 above reported the reliability coefficient of the instrument pertained to the five
service quality dimensions and customer satisfaction. The reliability coefficient (Cronbach
alpha) was used to test the self-designed and administered questionnaire to make sure the test
on the grouped items is regular and constant.
As can be seen from the table shown above, the reliability of the instruments were tested and
verified using Cronbach alpha, where the more the alpha coefficients closer to 1, the more
they are considered to be reliable and the higher the internal consistency reliability (Abidin
and Dawd, 2012).
The alpha coefficients for this study were all above 0.749 which ensured reliability of the
instruments. As the above table shows, the alpha value of reliability dimension is .738, the
alpha value of responsiveness dimension is .740, the alpha value for tangibility dimension is
30
.801, the alpha value for assurance dimension is .758, the alpha value of empathy dimension
is .760, and the alpha value of customer satisfaction is 0.734. In this research all the
dependent variable and the independent variables met the requirement.
3.7. Variables of the Study
In this study, customer satisfaction as a dependent variable was measured against the five
service quality dimensions. These variables were reliability, responsiveness, tangibility,
assurance and empathy. The description of both the dependent and the independent variables
were discussed below.
3.7.1. Dependent variable Under this study, the dependent variable was customer satisfaction. This variable was
investigated whether it was affected by the independent variables in the case of the sampled
municipality. The dependent variable is a variable that is affected by other (independent)
variables (Neumann, 2007).
3.7.2. Independent Variables The independent variables are the cause variables or the one that identifies forces or
conditions that acts on something else (Neumann, 2007). In this study, the service quality of
the sampled municipality was the independent variable with due regard to reliability,
responsiveness, tangibility, assurance and empathy.
Table-3.2: Response Rate of the Questionnaires
Rate Number of Distributed
Questionnaires (343)
Percent
Completed 343 100.0%
Not completed 0 0.0%
Total 343 100.0%
Source: Questionnaire (2021)

31
Table 3.2 displays the response rate of the questionnaires after they were filled by customers
of Maksegnit municipality. As can be seen from the table, a total of 334 questionnaires were
administered to the customers included in the study sample of which all (343) the
questionnaires were filled and returned back to the researcher. This was so the basis for the
analysis and interpretation of the effect of service quality dimensions on customer satisfaction
in Maksegnit municipality.
3.8. Data Analysis Method
Data to the study were collected through questionnaires from 343 valid respondents on the
quality service dimensions and customer satisfaction. The collected data were checked and
edited for their correctness and completeness. Then, they were changed and interpreted into
meaningful information, figure and statement.
Data analysis was performed using a Statistical Package for Social Science (SPSS) software
version 20. Hence, the demographic characteristics of the respondents such as sex, age,
educational status and numbers of visiting times to the municipality per year were analyzed
using frequency and percentage analysis technique. The level of service quality dimensions
(reliability, responsiveness, tangibility, assurance and empathy) and customer satisfaction
were analysed descriptively using mean values and standard deviation values. Pearson
correlation coefficients were used to determine the relationships between service quality
dimension (tangible, reliability, responsiveness, assurance, empathy) and customer
satisfaction. As a predictive analysis, multiple linear regressions was used to explain the
relationship between the dependent variable and the independent variables as shown in the
mathematical representation below
Y =β0 +β1X1 + β2X2 + β 3X3 + β 4X4 + β5X5
Where: Y was the dependent variable (customer satisfaction); X was dimensions of service
quality as it was explained by (X1 = Tangibility; X2 =Reliability; X3 = Responsiveness =X4
= Assurance; X5 = Empathy) and β0 was the constant (Y intercept) while β was the
coefficient of the predictors.
3.9. Ethical Considerations
Since the researcher used data from customers which were collected through questionnaire,
permission was obtained from the customers. To maintain the confidentiality of the
information provided by the respondents, the respondents were instructed not to write their

32
names on the questionnaire and assured of that the responses were used only for academic
purpose and kept confidential. Brief description of the central objectives or purpose of the
study and the potential benefit of the research outcome to respondents and the municipality
were clearly given in the introductory part of the questionnaire so as to motivate them and
participate in the study and provide relevant information about the company under study.
Finally, respondents were included in the study based on their free will.
Chapter Four
4. Data Analysis and Discussion
This chapter focuses on the analysis of data collected from the respondents using
questionnaires and the discussion made on the findings of the study in relation to the effect of
service quality dimensions on customer satisfaction in the case of Maksegnit municipality.
The findings of the study were, therefore analyzed based on the specific objectives and
hypotheses of the study.
4.1 Demographic Characteristics of the Respondents
The following table shows the demographic characteristics of the sampled respondents with
respect to customers of Maksegnit municipality and who filled the questionnaires. Their
characteristics were analyzed in terms of sex, age, educational status and how often they
visited the municipality in a year as it is presented in Table-4.1 below.
Table-4.1. Demographic Characteristics of the Respondents
Variable Characteristics Frequency Percent
Sex Male 202 58.9
Female 141 41.1
Total 343 100.0
Age Below 25 years 27 7.9
26 – 35 81 23.6
36 – 45 120 35.0
46 – 55 69 20.1
Above 55 years 46 13.4
Total 343 100.0
Education Read and write 25 7.3
Primary 77 22.4
Secondary 129 37.6
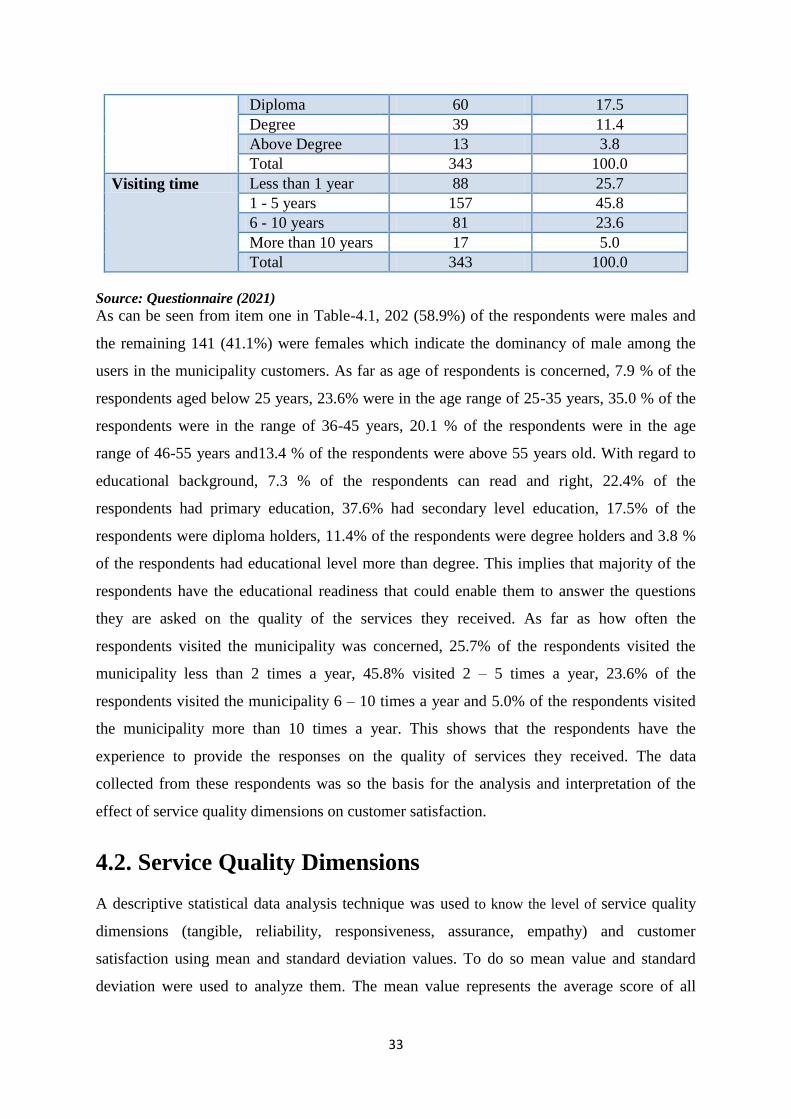
33
Diploma 60 17.5
Degree 39 11.4
Above Degree 13 3.8
Total 343 100.0
Visiting time Less than 1 year 88 25.7
1 - 5 years 157 45.8
6 - 10 years 81 23.6
More than 10 years 17 5.0
Total 343 100.0
Source: Questionnaire (2021)
As can be seen from item one in Table-4.1, 202 (58.9%) of the respondents were males and
the remaining 141 (41.1%) were females which indicate the dominancy of male among the
users in the municipality customers. As far as age of respondents is concerned, 7.9 % of the
respondents aged below 25 years, 23.6% were in the age range of 25-35 years, 35.0 % of the
respondents were in the range of 36-45 years, 20.1 % of the respondents were in the age
range of 46-55 years and13.4 % of the respondents were above 55 years old. With regard to
educational background, 7.3 % of the respondents can read and right, 22.4% of the
respondents had primary education, 37.6% had secondary level education, 17.5% of the
respondents were diploma holders, 11.4% of the respondents were degree holders and 3.8 %
of the respondents had educational level more than degree. This implies that majority of the
respondents have the educational readiness that could enable them to answer the questions
they are asked on the quality of the services they received. As far as how often the
respondents visited the municipality was concerned, 25.7% of the respondents visited the
municipality less than 2 times a year, 45.8% visited 2 – 5 times a year, 23.6% of the
respondents visited the municipality 6 – 10 times a year and 5.0% of the respondents visited
the municipality more than 10 times a year. This shows that the respondents have the
experience to provide the responses on the quality of services they received. The data
collected from these respondents was so the basis for the analysis and interpretation of the
effect of service quality dimensions on customer satisfaction.
4.2. Service Quality Dimensions
A descriptive statistical data analysis technique was used to know the level of service quality
dimensions (tangible, reliability, responsiveness, assurance, empathy) and customer
satisfaction using mean and standard deviation values. To do so mean value and standard
deviation were used to analyze them. The mean value represents the average score of all

34
responses and standard deviation shows the dispersion of the responses from their grand
mean. This means that the dispersion of the responses given by the respondents from their
grand mean value was measured by the standard deviation. Thus, on average, the standard
deviation shows how far the score of each item is located from its grand mean being
indicating whether it has smaller or higher variation. Small value of standard deviation shows
uniformity of responses. Interpretation of the mean scores was described as provided by
Zaidatol & Bagheri (2009) where the mean value below 3.39 is described as low, between
3.40 – 3.79 is described as moderate and above 3.80 is described as high.
Table-4.2. Descriptive Statistics of Reliability
No Reliability Mean Standard
Deviation
1 When the organization promises to deliver within a given
time, it does so 2.75 1.243
2 The organization services are always available as and when
required by the customer 2.67 1.262
3 The employees show sincere in solving customers’ concern 2.84 1.215
4 The organization able to perform the service right first time 2.77 1.283
5 The organization maintains error free customers’ records 2.71 1.288
Grand Mean 2.74 0.934
Source: Questionnaire (2021)
Sample = 343
The reliability service quality dimension was investigated against five items. The result in
Table-4.2shows that the respondents rated all the reliability dimensions with the grand mean
and standard deviation values of 2.74 and .934 respectively. The dispersion of the responses
about their grand mean value 2.74 was measured by SD of .934. That is, on average, each
item score is located at a distance of .934 units from the grand mean of 2.74 which indicated
a small degree of scatter and uniformity in the mean score and the grand mean. This could be
regarded as a higher representative of the description of the scores. Accordingly, there seems
an overall disagreement among the customers on the reliability dimension as the mean values
for all items were found below the mean value of 3.39 indicating low level. This shows that
there is a higher gap between the questions and their responses.

35
As can be seen from item two in the table, whether the organization services are always
available as and when required by the customer was rated by the respondents with a mean
value of 2.67; whether the organization maintains error free customers’ records under item
five was rated by a mean value of 2.71; item one in relation to when the organization
promises to deliver within a given time, it does so was rated by a mean value of 2.75; whether
the employees show sincere in solving customers’ concern in item four was rated by a mean
value of 2.77;and whether the organization able to perform the service right first time under
item three was rated by a mean value of 2.84.This implies that there existsan overall low level
of the reliability service quality which could be generalized that majority of the customers
were dissatisfied in the municipality.
Table-4.3. Descriptive Statistics of Responsiveness
No Responsiveness Mean Standard
Deviation
1 Employees are happy and willing to serve customers 2.70 1.016
2 Employees tell customers exactly when services will be
performed 2.65 2.493
3 The management are accessible, listen and provide prompt
and honest responses to customers inquiries 2.72 2.078
4 The employees are not too busy to respond to user requests 2.63 2.457
Grand Mean 2.67 0.914
Source: Questionnaire (2021)
Sample = 343
Table-4.3 discloses the results on the responsiveness dimension of service quality.
Concerning this, the respondents rated all the items with the grand mean (2.67) and the
standard deviation (0.914). The dispersion of the responses from their grand mean (2.67) was
measured by SD of (0.914). That is, on average, each item score is located at a distance of
0.914 units from the grand mean value of 2.67. This shows a small degree of scatter and a
greater degree of uniformity in the mean scores and the grand mean. So the grand mean could
be representative of description of the scores. Accordingly, there seems to be an overall
disagreement among the customers on this dimension since all the items were rated by the
respondents below the mean value of 3.39 indicating a gap between the questions and their
responses.
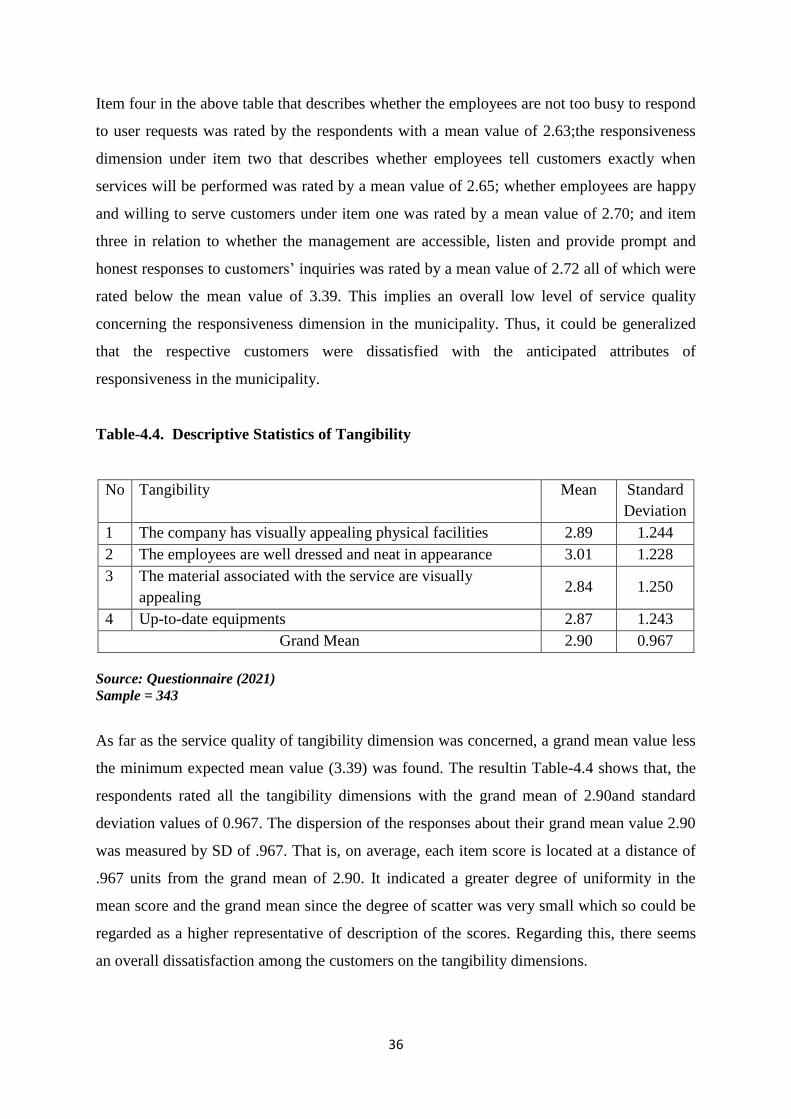
36
Item four in the above table that describes whether the employees are not too busy to respond
to user requests was rated by the respondents with a mean value of 2.63;the responsiveness
dimension under item two that describes whether employees tell customers exactly when
services will be performed was rated by a mean value of 2.65; whether employees are happy
and willing to serve customers under item one was rated by a mean value of 2.70; and item
three in relation to whether the management are accessible, listen and provide prompt and
honest responses to customers’ inquiries was rated by a mean value of 2.72 all of which were
rated below the mean value of 3.39. This implies an overall low level of service quality
concerning the responsiveness dimension in the municipality. Thus, it could be generalized
that the respective customers were dissatisfied with the anticipated attributes of
responsiveness in the municipality.
Table-4.4. Descriptive Statistics of Tangibility
No Tangibility Mean Standard
Deviation
1 The company has visually appealing physical facilities 2.89 1.244
2 The employees are well dressed and neat in appearance 3.01 1.228
3 The material associated with the service are visually
appealing 2.84 1.250
4 Up-to-date equipments 2.87 1.243
Grand Mean 2.90 0.967
Source: Questionnaire (2021)
Sample = 343
As far as the service quality of tangibility dimension was concerned, a grand mean value less
the minimum expected mean value (3.39) was found. The resultin Table-4.4 shows that, the
respondents rated all the tangibility dimensions with the grand mean of 2.90and standard
deviation values of 0.967. The dispersion of the responses about their grand mean value 2.90
was measured by SD of .967. That is, on average, each item score is located at a distance of
.967 units from the grand mean of 2.90. It indicated a greater degree of uniformity in the
mean score and the grand mean since the degree of scatter was very small which so could be
regarded as a higher representative of description of the scores. Regarding this, there seems
an overall dissatisfaction among the customers on the tangibility dimensions.
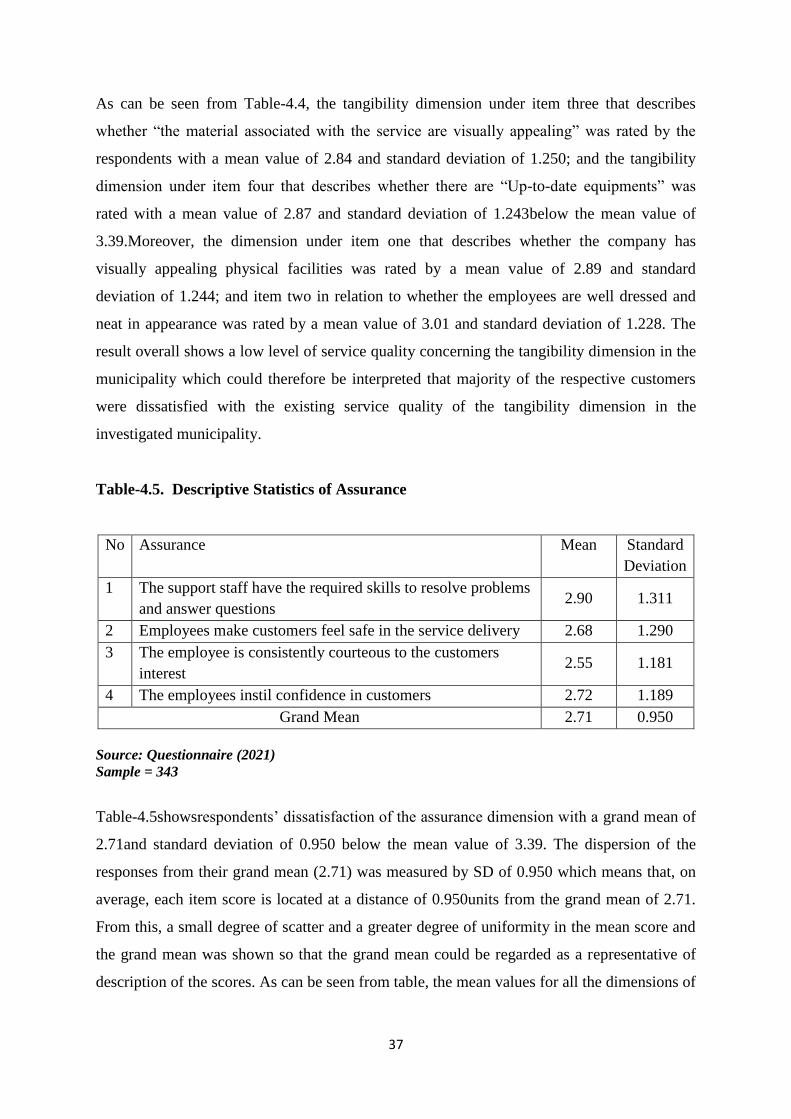
37
As can be seen from Table-4.4, the tangibility dimension under item three that describes
whether “the material associated with the service are visually appealing” was rated by the
respondents with a mean value of 2.84 and standard deviation of 1.250; and the tangibility
dimension under item four that describes whether there are “Up-to-date equipments” was
rated with a mean value of 2.87 and standard deviation of 1.243below the mean value of
3.39.Moreover, the dimension under item one that describes whether the company has
visually appealing physical facilities was rated by a mean value of 2.89 and standard
deviation of 1.244; and item two in relation to whether the employees are well dressed and
neat in appearance was rated by a mean value of 3.01 and standard deviation of 1.228. The
result overall shows a low level of service quality concerning the tangibility dimension in the
municipality which could therefore be interpreted that majority of the respective customers
were dissatisfied with the existing service quality of the tangibility dimension in the
investigated municipality.
Table-4.5. Descriptive Statistics of Assurance
No Assurance Mean Standard
Deviation
1 The support staff have the required skills to resolve problems
and answer questions 2.90 1.311
2 Employees make customers feel safe in the service delivery 2.68 1.290
3 The employee is consistently courteous to the customers
interest 2.55 1.181
4 The employees instil confidence in customers 2.72 1.189
Grand Mean 2.71 0.950
Source: Questionnaire (2021)
Sample = 343
Table-4.5showsrespondents’ dissatisfaction of the assurance dimension with a grand mean of
2.71and standard deviation of 0.950 below the mean value of 3.39. The dispersion of the
responses from their grand mean (2.71) was measured by SD of 0.950 which means that, on
average, each item score is located at a distance of 0.950units from the grand mean of 2.71.
From this, a small degree of scatter and a greater degree of uniformity in the mean score and
the grand mean was shown so that the grand mean could be regarded as a representative of
description of the scores. As can be seen from table, the mean values for all the dimensions of

38
assurance below 3.39 were fell in the low category level depicting a gap between the
questions and their responses.
The assurance dimension that describes whether “the employee is consistently courteous to
the customers’ interest” under item three was rated by the respondents with a mean value of
2.55; item two in relation to whether the employees make customers feel safe in their service
delivery was rated by a mean value of 2.68; item four that describes whether “the employees
instil confidence in customers” was rated by a mean value of 2.72; and item one that
describes whether the support staff has the required skills to resolve problems and answer
questions was rated by a mean value of 2.90indicating below the mean value of 3.39.These
findings show disagreement responses of the respondents against the items of the assurance
dimension. This implies that anexisting overall level of the service quality of the assurance
dimension in the investigated municipality was low. Thus, it could be generalized that the
respective customers of the municipality were not satisfied with the service quality of the
assurance dimension.
Table-4.6. Descriptive Statistics of Empathy
No Empathy Mean Standard
Deviation
1 The staff know what customers needs are 2.43 1.187
2 The employees give customers individual attention 2.50 1.105
3 The employees are committed to ethics and promote ethical
behaviour in the workplace 2.68 1.243
4 Services are adjusted to suit individual customer needs 2.64 1.115
5 The operating hour are convenient to all customers 2.78 1.240
Grand Mean 2.61 0.868
Source: Questionnaire (2021)
Sample = 343
The final service quality dimension investigated in this study was the empathy dimension. As
shown in Table-4.6, the respondents rated all the empathy dimensions with the grand mean of
2.61and standard deviation values of 0.868. This is indicating on average that each item score
is located at a distance of .868units from the grand mean of 2.61 with small degree of scatter

39
and greater degree of uniformity reflecting in the grand mean as a higher representative of
description of the scores. Overall, the finding shows that there seems a disagreement among
the customers on the empathy dimensions as the mean values against all empathy dimension
items were rated below the mean value of 3.39 mean. This shows that there is a higher gap
between the questions and their responses.
The empathy dimension under item one in relation to whether the staff know what customers’
needs are concerned was rated by a mean value of 2.43; item two that describes whether “the
employees give customers individual attention” was rated by a mean value of 2.50; the item
under four in relation to whether services are adjusted to suit individual customer needs was
rated by a mean value of 2.64; the empathy dimension under item three that describes
whether “the employees are committed to ethics and promote ethical behaviour in the
workplace” was rated by a mean value of 2.68; and the item under five in relation to the
operating hour are convenient to all customers was rated by a mean value of 2.78.These
results show that all the empathy service quality dimensions were rated below the mean value
of 3.39 and found in the low category level.
Table-4.7. Descriptive Statistics of Satisfaction
No Satisfaction Mean Standard
Deviation
1 I am satisfied with the municipality service providers 2.51 1.226
2 I am satisfied with the respectful behaviour of the
municipality staff 2.64 1.321
3 I am satisfied with the communicative ability of employees
of the municipality 2.55 1.193
4 I am satisfied with the performance of employees of the
municipality 2.71 1.378
5 I am satisfied with the various range of services of the
municipality 2.61 1.366
Grand Mean 2.60 0.687
Source: Questionnaire (2021)
Sample = 343
The descriptive statistics was also performed to investigate the overall level of customers’
satisfaction on the service quality dimensions. Table-4.7 discloses the study results that the
40
respondents rated all satisfaction items on the five service quality dimensions with the grand
mean of 2.60and standard deviation values of .687. The dispersion of the responses about
their grand mean value 2.60 was measured by SD of .687. That is, on average, each item
score is located at a distance of .687 units from the grand mean of 2.60. The degree of scatter
was very small. This indicated a greater degree of uniformity in the mean score and the grand
mean could be regarded as a higher representative of description of the scores. Accordingly,
there seems to be an overall dissatisfaction among the customers on the service quality
dimensions. As can be seen from table 4.7, the mean values for satisfaction questions were all
fell in the low category level since they were all rated below the mean value of 3.39 and these
results show a higher gap between the questions and their responses. Customers generally felt
dissatisfied with the municipality employees’ service provider with the mean value of 2.51
under item one; with the communicative ability of employees of the municipality with the
mean value of 2.55 under item three; with the various range of services of the municipality by
a mean value of 2.61 under item five; with the respectful behaviour of the municipality staff
by a mean value of 2.64 under item two; and with the performance of employees of the
municipality as indicated by the mean value of 2.71 under item four. These mean values of
customer satisfaction regarding service quality dimensions are low that show a gap between
what they should be and what they actually are.
4.3. Correlation Analysis
To explore the interrelationship between service quality dimensions and customer
satisfaction, Pearson correlation coefficient was performed. When the value of the correlation
is 1 or-1, a perfectly linear positive or negative relationship exists and when the value of
correlation is 0, there is no relationship (Vignaswaran, 2005). In this study the correlation
between the variables is computed based on that: if the value of the correlation coefficient is
0.00 - 0.30, the relationship between the variables will be very low; if the value of correlation
coefficient is 0.30 - 0.50, the relationship between the variables will be low; if the value of
correlation coefficient is 0.50 - 0.70, the relationship between the variables will be high; and
if the value of correlation coefficient is 0.70 – 1.00, the relationship between the variables
will be very high (Vignaswaran, 2005).

41
Table-4.8. The Relationship of Service Quality Dimensions and Customer Satisfaction
Variables Satisfaction
Reliability
Pearson Correlation 651**
Sig. (2-tailed) .000
N 343
Responsiveness
Pearson Correlation .627**
Sig. (2-tailed) .000
N 343
Tangibility
Pearson Correlation .760**
Sig. (2-tailed) .000
N 343
Assurance
Pearson Correlation .640**
Sig. (2-tailed) .000
N 343
Empathy
Pearson Correlation .551**
Sig. (2-tailed) .000
N 343
Correlation is significant at the 0.01 level (2-tailed)
Source: Questionnaire (2021)
As can be seen from Table-4.9, all the service quality dimensions are statistically significant
and the results showed positive relationships between the dimensions and customer
satisfaction. The value of a correlation coefficient .760**; .651**; .640**; .627**; and .551**;
showed a significant positive relationship between the independent variables (tangibility,
reliability, assurance, responsiveness and empathy) and the dependent variable (customer
satisfaction) respectively. In relative term, tangibility has the strongest association with
customers’ satisfaction when empathy has the lowest association.
4.4. Regression Analysis
4.4.1. Assumptions’ Test
42
Before running the regression, assumptions of the study were analyzed. The first assumption
was related to multicolinearity which is a condition when there a high correlation of the
independent variables and if tolerance values are above 0.1 and variance inflation factor,
which is 1 tolerance is less than 10, therefore in this study, it has been shown that there was
no multicolinearity problem to run the regression (sAppendix-V-2).Related to linearity, it
was assumed that the relationship between the dependent and each independent variable
should be linear(Malhotra et al. 2007). The scatter plot of standardized residuals as can be
seen (Appendix-VI-2) did not show systematic pattern in this study. Moreover, normality of
the error term is observed on the normal probability plots of the residuals. Normal
distribution makes a straight diagonal line against which the plotted residuals are compared.
As can be seen from (Appendix-VI-2), the normality probability plots were used to assess
normality and they have approximately a straight line which determined normal distribution
(Hair, et al 1998).Besides, homoscedasticity of the error terms is the other assumption and it
is a situation where the variance of distribution of the dependent variable should be constant
for all values of the independent variable (Hair, et al, 1998). In the scattered residual plots of
this study as can be seen in (Appendix-VI-3) satisfied the assumption for homoscedasticity of
the error terms.
4.4.2. Multiple Regression Analysis Multiple regressions are the most common and widely used to analyze the relationship
between a single continues dependent variable and multiple continues categorical
independent variable (George et al, 2003). In this study multiple regression analysis was
employed to examine the effect of service quality dimensions (reliability, responsiveness,
tangibility, assurance and empathy) on customer satisfaction. Accordingly, it is computed
using the following formula:
Y=β0+β1X1+β2X2+β3X3+β4X4+β5X5+e
Where:Y = is dependent variable (customer satisfaction)
β0 = is constant
ß = is the coefficient of the respective independent variable
X = is independent variable
Hence, based on the finding of the multiple regressions, the linear equation can be stated as:
Customer Satisfaction = -.362+.266 (Reliability) +.178 (Responsiveness) +.323 (Tangibility)
+.180 (Assurance) +.156 (Empathy) +e.In this study, multiple regressions are used to
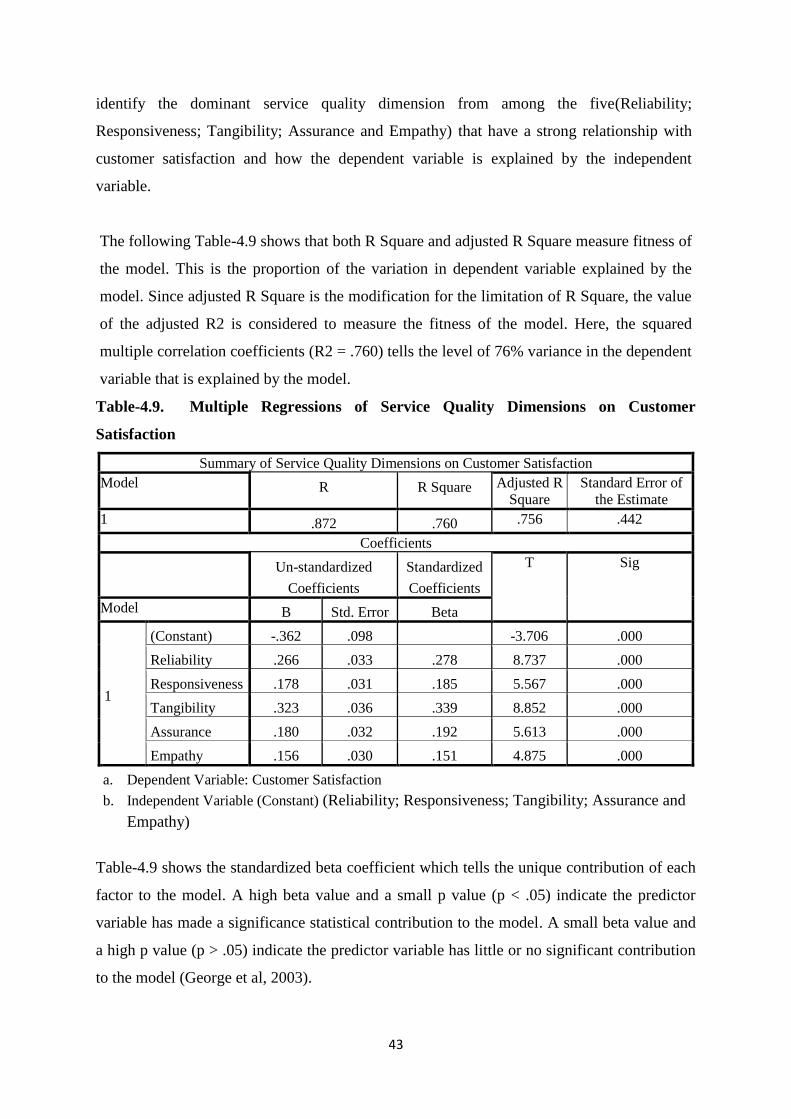
43
identify the dominant service quality dimension from among the five(Reliability;
Responsiveness; Tangibility; Assurance and Empathy) that have a strong relationship with
customer satisfaction and how the dependent variable is explained by the independent
variable.
The following Table-4.9 shows that both R Square and adjusted R Square measure fitness of
the model. This is the proportion of the variation in dependent variable explained by the
model. Since adjusted R Square is the modification for the limitation of R Square, the value
of the adjusted R2 is considered to measure the fitness of the model. Here, the squared
multiple correlation coefficients (R2 = .760) tells the level of 76% variance in the dependent
variable that is explained by the model.
Table-4.9. Multiple Regressions of Service Quality Dimensions on Customer
Satisfaction
Summary of Service Quality Dimensions on Customer Satisfaction
Model R R Square Adjusted R
Square
Standard Error of
the Estimate
1 .872 .760 .756 .442
Coefficients
Un-standardized
Coefficients
Standardized
Coefficients
T Sig
Model B Std. Error Beta
1
(Constant) -.362 .098 -3.706 .000
Reliability .266 .033 .278 8.737 .000
Responsiveness .178 .031 .185 5.567 .000
Tangibility .323 .036 .339 8.852 .000
Assurance .180 .032 .192 5.613 .000
Empathy .156 .030 .151 4.875 .000
a. Dependent Variable: Customer Satisfaction
b. Independent Variable (Constant) (Reliability; Responsiveness; Tangibility; Assurance and
Empathy)
Table-4.9 shows the standardized beta coefficient which tells the unique contribution of each
factor to the model. A high beta value and a small p value (p < .05) indicate the predictor
variable has made a significance statistical contribution to the model. A small beta value and
a high p value (p > .05) indicate the predictor variable has little or no significant contribution
to the model (George et al, 2003).
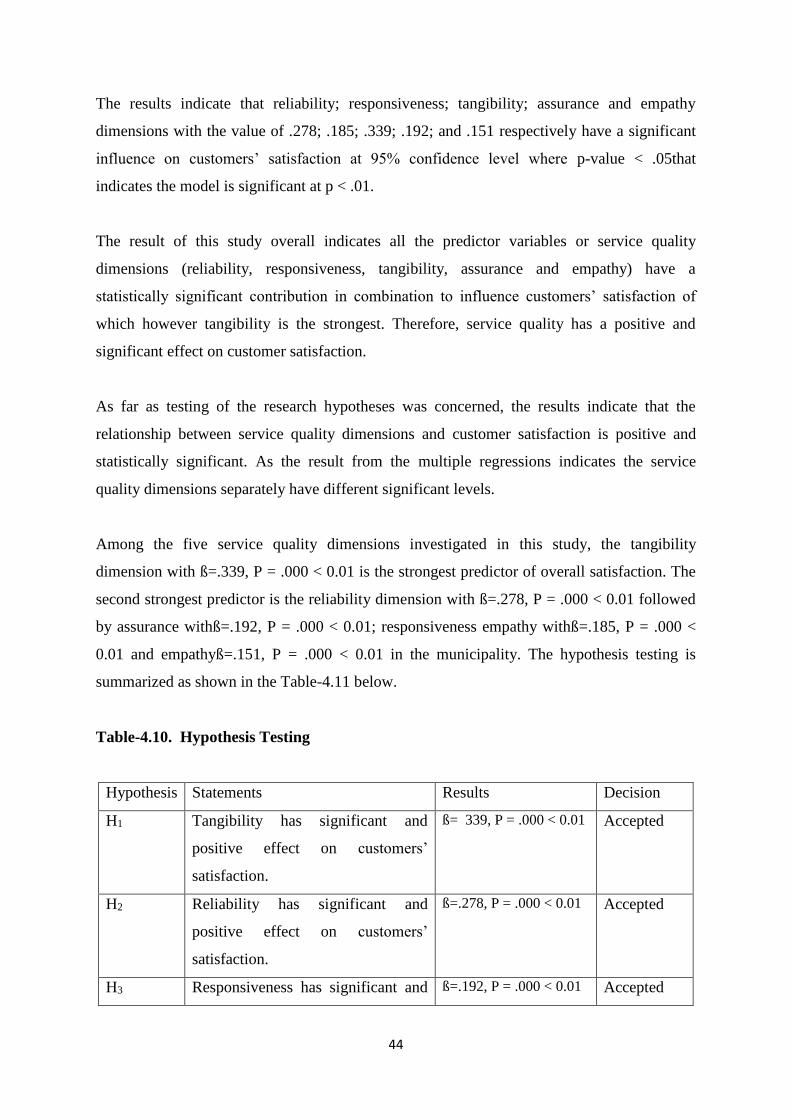
44
The results indicate that reliability; responsiveness; tangibility; assurance and empathy
dimensions with the value of .278; .185; .339; .192; and .151 respectively have a significant
influence on customers’ satisfaction at 95% confidence level where p-value < .05that
indicates the model is significant at p < .01.
The result of this study overall indicates all the predictor variables or service quality
dimensions (reliability, responsiveness, tangibility, assurance and empathy) have a
statistically significant contribution in combination to influence customers’ satisfaction of
which however tangibility is the strongest. Therefore, service quality has a positive and
significant effect on customer satisfaction.
As far as testing of the research hypotheses was concerned, the results indicate that the
relationship between service quality dimensions and customer satisfaction is positive and
statistically significant. As the result from the multiple regressions indicates the service
quality dimensions separately have different significant levels.
Among the five service quality dimensions investigated in this study, the tangibility
dimension with ß=.339, P = .000 < 0.01 is the strongest predictor of overall satisfaction. The
second strongest predictor is the reliability dimension with ß=.278, P = .000 < 0.01 followed
by assurance withß=.192, P = .000 < 0.01; responsiveness empathy withß=.185, P = .000 <
0.01 and empathyß=.151, P = .000 < 0.01 in the municipality. The hypothesis testing is
summarized as shown in the Table-4.11 below.
Table-4.10. Hypothesis Testing
Hypothesis Statements Results Decision
H1 Tangibility has significant and
positive effect on customers’
satisfaction.
ß= 339, P = .000 < 0.01 Accepted
H2 Reliability has significant and
positive effect on customers’
satisfaction.
ß=.278, P = .000 < 0.01 Accepted
H3 Responsiveness has significant and ß=.192, P = .000 < 0.01 Accepted
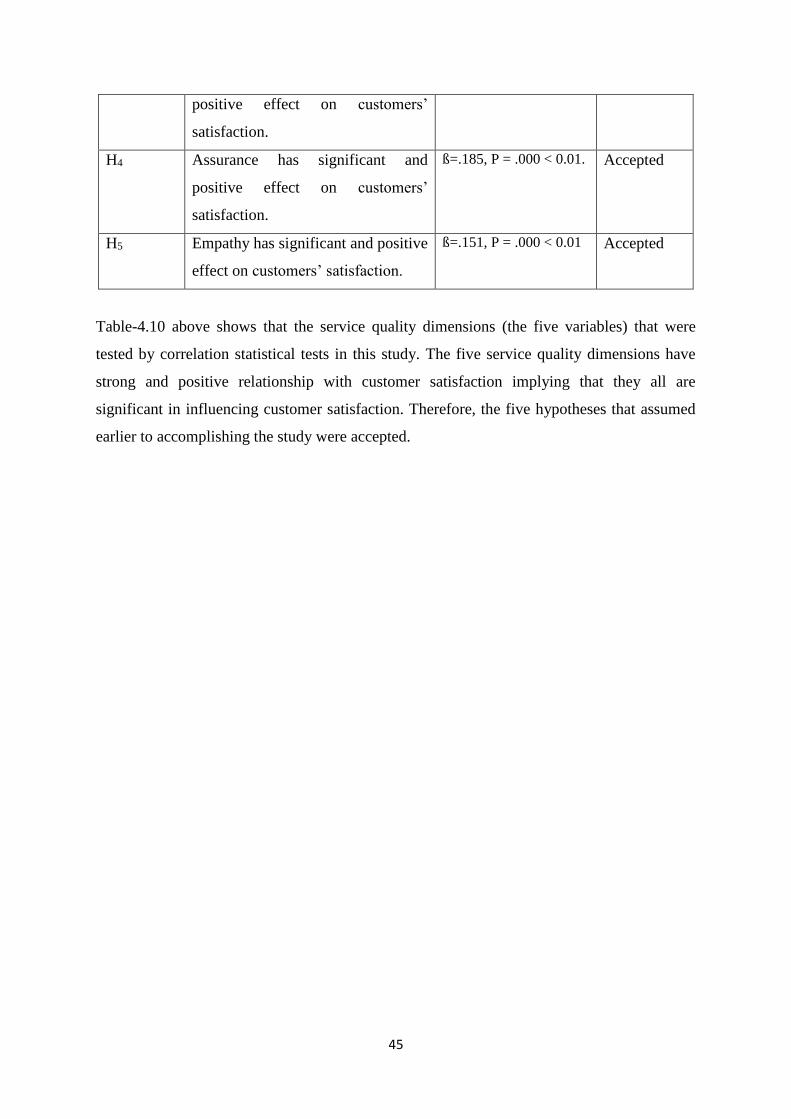
45
positive effect on customers’
satisfaction.
H4 Assurance has significant and
positive effect on customers’
satisfaction.
ß=.185, P = .000 < 0.01. Accepted
H5 Empathy has significant and positive
effect on customers’ satisfaction.
ß=.151, P = .000 < 0.01 Accepted
Table-4.10 above shows that the service quality dimensions (the five variables) that were
tested by correlation statistical tests in this study. The five service quality dimensions have
strong and positive relationship with customer satisfaction implying that they all are
significant in influencing customer satisfaction. Therefore, the five hypotheses that assumed
earlier to accomplishing the study were accepted.
46
Chapter Five
Summary, Conclusion and Recommendation
This chapter focuses on the major findings of the study, the major conclusions drawn from
the study results and recommendations of the study forwarded with the major implications for
further research.
5.1. Summary of the Major Findings
The aim of the study was to identify the effects of service quality on customer satisfaction of
Maksegnit municipality. In conducting this study, the required data is obtained through self
administered structured questionnaires. To determine the sample size from the total
population of the study, the researcher used formula based-sample size determination. To
select respondents, convenience sampling technique was adopted. The service quality was
measured against five service quality dimensions (tangibles, reliability, responsiveness,
assurance and empathy). Both the service quality dimensions and customer satisfaction were
measured using a five point Likert scale. A total of 343 questionnaires were distributed to the
sampled customers all of which were returned and analyzed using a statistical package for
social science (SPSS). In the analysis descriptive statistics, correlation analysis and multiple
regression analysis were performed.
47
The descriptive finding of the study indicated a low level of service quality of all the five
dimensions as they were found between a grand mean value of 2.61 and 2.90 below the
minimum expected mean value of 3.39 between. Accordingly, the tangibility service quality
dimension has relatively the highest mean value of 2.90 and the empathy service quality
dimension on the other hand has a lowest mean value of 2.61. As far as their satisfaction was
concerned, the sampled customers rated it with the mean value of 2.60.
The result from the correlation analysis showed that all the service quality dimensions are
statistically significant at P < 0.01 and have positive relationship with customer satisfaction.
The result of the multiple regression analysis also indicates that all the predictor variables
(reliability, responsiveness, tangibility, assurance and empathy)in combination make a
statistically significant contribution to influence customer
Overall, the adjusted R2
of 0.760 indicates 76% of the variance in customer satisfaction can
be predicted by the service quality offered by the branch municipality showing that the
service quality has a positive and significant effect on customer satisfaction in Maksegnit
municipality. The result from the multiple regressions further indicates that among the five
service quality dimensions investigated in this study, the tangibility dimension with ß=.323, P
= .000 < 0.01 is the strongest predictor of overall satisfaction in the municipality. The
hypothesis testing finally indicates that all the hypotheses developed earlier in this study were
accepted. Hence, reliability, responsiveness, tangibility, assurance and empathy dimensions
all have significant and positive effect on customers’ satisfaction.
5.2. Conclusion
The main purpose of this study was to investigate the effect of service quality on customer
satisfaction, the case of Maksegnit municipality. The findings from the descriptive analysis
showed the low level of service quality against the five dimensions of reliability,
responsiveness, tangibility, assurance and empathy in the municipality. The findings showed
customers were not pleased over poor service currently being offered by the municipality
which so indicated a low ability of the municipality to provide service at the designed and
promised time. Overall, the service quality has a low mean value which shows a gap with
what it should be.

48
Besides, the correlation result shows that there is positive and significant relationship
between all the service quality dimensions (reliability, responsiveness, tangibility, assurance
and empathy) and customer satisfaction. In conclusion, this means that delivering a service with
high quality will lead to a higher customer satisfaction. Furthermore, the multiple regression
results showed that all the five service quality dimensions (reliability, responsiveness,
tangibility, assurance and empathy) have positive and significant impact on customer
satisfaction. This implies that a high quality service is an increasingly important tool of
realizing higher customer satisfaction. Therefore, Maksegnit municipality should strive to
influence quality service as a way of ensuring its customers feel satisfied through service
offerings they expect.
5.3. Recommendation
Based on the major findings and conclusion of the study, the following recommendations
were forwarded;
Municipality managers should be aware that among the various dimensions of service
quality, tangibility was particularly significant in fostering satisfaction for the
customers of Maksegnit municipality. Tangibility plays a key role in providing
physical representations or images of the service that customers use to evaluate
quality. Neglecting to pay attention to tangibility dimension can confuse and even
destroy a good strategy. The municipality managers thus should use tangibles to
enhance its image, provide continuity and signal quality to customers.
In addition, the satisfaction of customers was significantly influenced by the
reliability, assurance and responsiveness dimensions. It is apparent that Maksegnit
municipality should strive to perform the promised service dependably and accurately
in reflecting consistency. Being unreliable causes an extreme state of frustration for
customers. Thus, municipality managers should know that reliability is consistently
the most important determinant of perceptions of service quality. The staff in the
municipality should be skied in resolving problems and answer questions.
Municipality managers should also be attentive and responsive to help customers and
to provide prompt service. Municipality personnel should deal with customers’
requests, questions, complaints and problems. Lack of attention to this dimension can
cause confusions for customers which ultimately influence perception. Municipality
managers and personnel must view the process of service delivery and the handling of
49
requests from the customer’s point of view rather than from the organization’s point
of view.
Generally, Maksegnit municipality management should keep track of the changes in
perceptions and expectations of their customers. As indicated above, tangibility was
the most important driver of service quality whereas according to the literature review
reliability was the most important driver of service quality. These findings therefore
indicate that the management needs to keep abreast with the changes in perceptions
and expectations. This will enable Maksegnit municipality to leverage on those key
aspects that drive customer satisfaction and build loyalty.
5.4. Suggestion for Further Study
The present study was conducted only on the municipality in Maksegnit in Gondar Zuria
woreda of Central Gondar Administration. There are however, several public service
organizations in the woreda. Future studies should consider these public organizations that
provide service in the woreda. As this study analyzed only the relationship between service
quality and customer satisfaction, future researchers may include other factors that can have a
big impact on customer satisfaction and do a survey.
50
References
Abdissa Gemechu. (2019). The impact of service quality on customer satisfaction: A case
study on Nekemte municipality, Oromia Region, Ethiopia. Annals of Social Sciences
and Management Studies4(1):
Anderson, E.W., Fornell, C. and Lehmann, D.R. (1994). Customer satisfaction, market share,
andprofitability: findings from Sweden. Journal of Marketing, 58, 53-66.
Audrey,G. (2003).Services, marketing and management, London: SAGE Publications Ltd.
Bateson J.,& Hoffman, K. (2011). Services marketing international edition, (4th edn),
Canada: South Western Cengage Learning. pp. 277.
Beer, Michael (2003). Why Total Quality Management Programs Do not Persist. The role of
Management Quality and Implication for Leading a TQM Transformation Decision
Science, 34(4), 624-642.
Berry, L., Zeithaml, V.,& Parasuraman, A. (1985).Quality counts in services too, Business
Horizons 28(3): 44-52.
Berry, L., Zeithaml, V., Parasuraman, A. (1990). Five imperatives for improving service
quality. Sloan Manage Rev, 31 (4): 29-38
Bitner, M.J., (1990). Evaluating service encounters: the effect of physical surroundings and
employee responses. Journal of Marketing, 54, 69-82.
Betelihem Tesfaye (2015). ‘The impact of service quality on customer satisfaction the case of
commercial bank of Ethiopia’, St. Mary’s University School of Graduate studies,

51
Addis Ababa (Unpublished)
Bitner, M.J., Fisk R.P. & Brown, S.W. (1993). “Tracking the Evolution of the Services
Marketing Literature”, Journal of Retailing, 69, 1, 61 - 103.
Bitner, M. J., Booms, B. H., and Mohr, L. A. (1994). Critical Service Encounters: The
EmployeeViewpoint. Journal of Marketing, 58(4), 95–106.
Bitner, M.J. and Hubbert, A.R. (1994). Encounter satisfaction versus overall satisfaction
versus quality,Thousand Oaks: Sage Publications
Cassab, H., & Maclachlan, D.L. (2009), “A consumer-based view of multi-channel service”,
Journal of Service Management, Vol. 20 No. 1, pp. 52–75.
Centre for the Study of Social Policy (2007) Improving quality and access to services and
supports in vulnerable neighbourhoods: what the research Washington, DC 20005
Cronin, J.J., & Taylor, S.A. (1992), “Measuring service quality: a re-examination and
extension”, Journal of Marketing, 56(3): 55-68.
Cronin, J. R., Brady, KM. K. and Hulrt, T. M. (2005). Assessing the effects of quality, value,
andcustomer satisfaction on consumer behavioral intentions in service environments.
Journal ofRetailing, 76, 193-218.
Creswell, JW. (2009). Editorial: Mapping the field of mixed methods research`,Journals of
Mixed Methods ResearchVol.3,No.95, pp.95-109
Daniel O. Auka. (2012). Service quality, Satisfaction, Perceived value and Loyalty among
customers in Commercial Banking in Nakuru Municipality, Kenya. African Journal of
Marketing Management Vol. 4(5), pp.185-203
Fornell, C., Johnson, M. D., Anderson, E. W., Cha, J., & Bryant, B. E. (1996). The American
Customer Satisfaction Index: Journal of Marketing, 60(4), 7–18.
Frederick A Frost, Mukesh Kumar (2000) INTSERVQUAL-An Internal Adaptation of the
GAP Model in a Large Service Organization. Journal of Service Marketing 14(5):
358-386.
Grönroos, C. (1984), “A service quality model and its marketing implications”, European
Journal of Marketing, 18, 4, 36-44.
Gronroos, C. (2001). Service Management and Marketing, (2nd ed.). Chichester: John Wiley
&Sons Ltd
Hanan, M and Peter K (1989), Customer Satisfaction: How to Maximize, Measure, and
Market Your Company’s “Ultimate Product” (New York: American Management
Association, 1989), xii.
Hutten, T.V and Cox, B.G (1998) A Child Support Enforcement Customer Satisfaction

52
Survey.(Washington: The Urban Institute and Mathematical Policy Research, Inc.,
1998), http://aspe.os.dhhs.gov/hsp/isp/ocsesrvy.htm
Iacobucci, D., Ostrom, A. & Grayson, K. (1995), Distinguishing Service Quality and
Customer Satisfaction: the voice of the Consumer, Journal of Consumer Psychology,
Vol. 4 No. 3, pp. 277-303.
Kothari, C.R. (2004) Research methodology: methods and techniques, New Delhi: New Age
International Limited Publishers
Kotler,P. Wong,V. Saunders,J. Armestrong,G. (2005) principle of marketing European
edition, Pearson education limited, pp. 201-211.
Kotler, P. and Armstrong, G. (2012). Principles of Marketing. 14th Edition, NewJersy, USA.
Ladhari, R. (2008), “Alternative measure of service quality: A review”, Journal of Managing
Service Quality, 18, 1, 65-86.
Lee, S., Huh, J. and Hong, S. (2008). Determining Behavioral Intention To Visit A Festival
Among First-Time and Repeat Visitors. International Journal of Tourism Sciences,
8(1), 39-55.
Lovelock, C.H., Patterson, P.G. and Walker, R.H. (2001). Services Marketing: Australia and
NewZealand. Pearson Education Australia, French’s Forest.
Meinema, T (2005), European Approaches and Experiences with User Involvement and
Customer Satisfaction in Social Services (The Hague, Netherlands Institute for Care
and Welfare, 2005), 23.
Mesay, S. (2012). Bank Service Quality, Customer Satisfaction and Loyalty in Ethiopian
Banking Sector. Retrieved from http://www.apexjournal.org/JBAMSR.
Mik, W (2001) Assessing Customer Satisfaction with Local Authority Services Using
SERVQUAL. Total Quality Management & Business Excellence 12(7&8): 995-
1002.
Mohammad Mizenur Rahaman, Abdullah, Ataur Rahman (2011) Measuring Service Quality
using SERVQUAL Model: A Study on PCBs (Private Commercial Banks) in
Bangladesh. Business Management Dynamics 1(1): 1-11. 713-737.
Oliver, R.L. (1980). “A cognitive model of the antecedents and consequences of satisfaction
decisions”, Journal of Marketing Research, 17, 4, 460-469.
Oliver, R.L. (1997). Cognitive, affective and attribute bases of the satisfaction response.
Journal ofConsumer Research, 20, 418-30.
Osborne, D and Peter P (2001) The Reinventor’s Fieldbook: Tools for Transforming Your
Government (Indianapolis: John Wiley & Sons, 2001), 332.

53
Padilla, R.A (1996) “Literature Review on Consumer Satisfaction in Modern Marketing.”
Seminar in Consumer Research, Faculty of Commerce and Administration,
Concordia University, December 5, 1996,
Parasuraman, A., Zeithaml, V.A., & Berry, L.L. (1985). “A conceptual model of service
quality and its implications for future research”, Journal of Marketing, 49 (4) 41-50.
Parasuraman, A., Berry, & Zeithaml, V. (1988). A multiple-item scale for measuring
customer perceptions of service quality”, Journal of Retailing, 64,(1):12-40.
Park, J. W., Robertson, R. and Wu, C. L. (2005). The effect of airline service on passengers’
behaviourl intentions: a Korean case study, Journal of Air Transport Management,
10, 435-439.
Pillinger, J (2005) “Rethinking the Quality of Social Services in Europe” Newsletter
Observatory for the Development of Social Services in Europe, (February 2005):
Potluri, R. M. and Mangnale V. S (2010). An Assessment of Ethiopian Telecom Customer
Satisfaction. Global Journal of Management and Business Research, 10(4) pp. 10-15.
Regan, W.J., (1963). “The Service Revolution”, Journal of Marketing, 47, 57 – 62. Retrieved
from http://www.iu.diva-portal.org/smash/get/diva2:434592/
Roger Dow and Susan Cook, Turned On: Eight Vital Insights to Energize Your People,
Customers, and Profits (New York: Harper Business, 1996), 28-29. National
Institute of Science and Technology, “
Rodríguez PG, Burguete JLV, Vaughan R, Edwards J (2009) Quality Dimensions in the
Public Sector: Municipal Services and Citizen’s Perception. Journal of International
Review on Public and Nonprofit Marketing 6(1): 75-90.
Ron, Z and Dick, S (1989) The Service Edge: 101Companies that Profit from Customer Care
(New York: New American Library, 1989),
Roest, H., and Pieters, R. (1997). The Nomological Net of Perceived Service Quality.
InternationalJournal of Service Industry Management, 8(4), 336–351.
Sachdev SB, Verma HV (2004) Relative Importance of Service Quality Dimensions: a
Multispectral study. Journal of Services Research 4(1): 93-116.
Saha GC & Theingi (2009). Service quality, satisfaction, and behavioural intentions: A study
of low-costairline carriers in Thailand. Management Service Quality,19 (3), 350-372.
Saura, I.G., Fraces, D.S., Gontri, G.B. & Blasco, M.F. (2008). Logistic service quality: a new
way toloyalty. Industrial Management and Data System, 108(5), 650-668.
Schneider, D and Bowen, D (1995) Winning the Service Game (Boston: Harvard Business
School Press, 1995), 3. 10
54
Sekaran,U. & Bougie, R.(2010). Research methods for Business; A skill Building Approach
(5thed).Chichester, West Sussex, John Willy & Sons.Inc
Smith (1997) Malcolm Baldrige National Quality Award, 2003 Award Recipient Health Care
Category,” http://www.nist.gov/public_affairs/releases/stlukes.htm.
Siddiqi, K.O. (2011), Interrelations between service quality attributes, customer satisfaction
and customer loyalty in the retail banking sector in Bangladesh. International Journal
of Business andManagement, 6 (3), 12-36.
Sousa, R., & Voss, C.A. (2006), “Service quality in multi-channel service employing virtual
channels”, Journal of Service Research, vol. 8, no. 4, pp. 356–371.
Vijayadurai, J. (2008), Service Quality, Customer Satisfaction and Behavioral Intention in
Hotel Industry. Journal of Marketing & Communication, 3, 14-26.
Wicks, AM, & Roethlein, C J (2009), “A Satisfaction-Based Definition of Quality‟, Journal
of Business & Economic Studies, vol. 15, pp. 82-97.
Wilson A, Zeithaml VA, Bitner MJ & Gremler DD (2008), Services Marketing, McGraw-
Hill Education, New York.
Wreden, N (2004) “What’s Better Than Customer Satisfaction?” Viewpoint (May 24, 2004),
Destination CRM.com (Customer Relationship Management),
Yamane Taro.(1967). Statistics, An Introductory Analysis, 2nd edition, New York: Harper
and Row.York, McGraw-Hill. from http:// www.abebooks.co.uk.
Zahari, W, Yusoff, W Maziah, I, and Graeme, N (2008) FM-SERVQUAL: a new
approach of service quality measurement framework in local authorities. Journal of
Corporate Real Estate 10(2): 130-144.
Zeithaml,V.A., Parasuraman, A. and Berry, L.L. (1985). Problems and Strategies in Services
Marketing, Journal of Marketing, 49, 33–46.
Zeithaml, V.A., Berry, L.L., & Parasuraman, A., (1988).“Communication and Control
Processes in the Delivery of Service Quality”, Journal of Marketing, 52 (02): 3548.
Zeithaml VA, Parasuraman A, Berry LL (1990) Delivering Quality Service. New York: The
Free Press. USA.
Zeithaml, V.A. and Bittner (2006). The Impact of Emerging WLANs on Incumbent Cellular
Service Providers in the U.S. M.J. Services marketing, McGraw-Hill Singapore.
Zeithaml, V.A., Bitner, M.J. and Gremler, D.D., (2009). Services Marketing: Integrating
Customer Focus Across the Firm, (5th ed.). New York: McGraw-Hill.
Zisis P, Garefalakis A, Sariannidis, N (2009) The Application of Performance Measurement
in the Service Quality concept: The Case of a Greek Service Organization. Journal
55
of Money, Investment and Banking 9: 21-47.
Appendices
Appendix-I
University of Gondar
College of Business and Economics
Department of Marketing Management
Questionnair distributed for customers
The Effect of Service Quality on Customer Satisfaction:
(The Case of Maksegnit Municipality)
Dear respondents;
I would like to thank you in advance for taking your time to fill out this questionnaire as your
input will be a key in developing my research on the effects of service quality of Maksegnit
Municipality on customer satisfaction. The purpose of this survey is to make a partial
fulfillment of the requirements for the Masters of art degree in Marketing Management in
Gondar University. The questionnaire has three major parts. Part one deals with the
background of the respondent, part two deals with service quality items to be measured by the
level of customer satisfaction and part three is all about the overall satisfaction level of the
customers. Pplease, you don’t need to write your name so you are kindly requested to fill all
questions completely.Thank you again.

56
Instructions: For each of the following items/questions, circle the letter that holds your
answer or use a tick mark to indicate the letter of your choice
Part I: Background Information
No Items Alternative Response Options
1 Sex: A. Male B. Female
2 Age: A 18 -25 B. 26 -35
C. 36 -45 D. 46 – 55
E. Over 55
3 Educational level A. Illiterate B. Read and write
C. Primary (1-8) D. Secondary (9-12)
E. 10/12+CertificateF. Diploma
G. Degree and Above
4 How long have you
been a customer?
A. Less than 1 year B. 1-5 years
C. 6-10 years D. More than 10 years
Part II: Service Quality Questions
Please rate each statement by using a tick mark in accordance with the choice that holds your
answer on a five point Likert scale questions where 5-Strongly Agree (SA); 4-Agree (A); 3-
Neutral (N); 2-Disagree (D) and 1-Strongly Disagree (SD)
No Reliability SA A N D SD
1 When the organization promises to deliver within a given
time, it does so
2 The organization services are always available as and
when required by the customer
3 The employees show sincere in solving customers’
concern
4 The organization able to perform the service right first
time
5 The organization maintains error free customers’ records
Responsiveness
6 Employees are happy and willing to serve customers
7 Employees tell customers exactly when services will be
performed
8 The management are accessible, listen and provide prompt
and honest responses to customers inquiries
9 The employees are not too busy to respond to user
requests
Tangibility
10 The company has visually appealing physical facilities

57
11 The employees are well dressed and neat in appearance
12 The material associated with the service are visually
appealing
13 Up-to-date equipments
Assurance
14 The support staff have the required skills to resolve
problems and answer questions
15 The employees make customers feel safe in their service
delivery
16 The employee is consistently courteous to the customers
interest
17 The employees instil confidence in customers
Empathy
18 The staff know what customers needs are
19 The employees give customers individual attention
20 The employees are committed to ethics and promote
ethical behaviour in the workplace
21 Services are adjusted to suit individual customer needs
22 The operating hour are convenient to all customers
Part III: Customer Satisfaction
Please rate each statement by using a tick mark in accordance with the choice that holds your
answer on a five point Likert scale questions where 5-Strongly Satisfied (SS); 4-Satisfied (S);
3-Neutral (N); 2-Disatisfied (D) and 1-Strongly Dissatisfied (SD)
No Customer Satisfaction SS S N D SD
1 I am satisfied with the municipality employees service
provider
2 I am satisfied with the respectful behaviour of the
municipality staff
3 I am satisfied with the communicative ability of
employees of the municipality
4 I am satisfied with the performance of employees of the
municipality
5 I am satisfied with the various range of services of the
municipality

58
Appendix-II
የየየየየየየየየየየ
የየየየየየየየየየየየየየየየየ
የየየየየየየየየየየየየየየየ
ለለለለለለለለለለለለለለለለለለለለለለ
ለለለለለለለለለለለለለለለለለለለለለለለለለለለለለ
(ለለለለለለለለለለለለለለለለለለለ)
የየየየየየየ
ለለለለለለለለለለለለለለለለለለለለለለለለለለለለለለለለለለለለለለለለለለለለለለለለለለለለ
ለለለለለለለለለለለለለለለለለለለለለለለለለለለለለለለለለለለለለለለለለለለለለለለለለለለለ
ለለለለለለለለለለለለለለለለለለለለለለለለለለለለለለለ
ለለለለለለለለለለለለለለለለለለለለለለለለለለለለለለለለለለለለለለለለለለለለለለለለለለለለ
ለለለለለለለለለለለለለለለለለለለለለለለለለለ
ለለለለለለለለለለለለለለለለለለለለለለለለለለለለለለለለለ
ለለለለለለለለለለለለለለለለለለለለለለለ
ለለለለለለለለለለለለለለለለለለለለለለለለለለለለለለለለለለለለለለለለለለለለለለለለለለለለ
ለለለለለለለለለለለለለለለለለለለለለለለለለለለለለለለለለለለለለለለ
ለለለለለለለለለለለለለለለለለለለለለለለለለለለለለለለለለለለለለለለለለለለለለለ

59
የየየየ-1የ
ለለለለለለለለለለለለለለለለለለለለለለለለለለለለለለለለለለለለለለለለለለለለለለለለለለለለ
ለለለለለለለለለለለለለለለለለለለ
የየየየየየ: የየየየየየየየየየየየየ
የ.የ የየየየየ የየየየየየየየ
1 ለለ: ለ. ለለለለ. ለለ
2 ለለለ: ለ. 18 -25 ለ. 26 -35
ለ. 36 -45 ለ. 46 – 55
ለ. ለ55 ለለለ
3 ለለለለለለለለለ ለ. ለለለለለለ. ለለለለለለለለ
ለ. ለለለለለለለ (1-8) ለ. ለለለለለለለ (9-12)
ለ. 10/12+ለለለለለለለ. ለለለለ
ለ. ለለለለለለለ
4 ለለለለለለለለለለለለለለለ? A. ለለለለለለለለለለለ. 1-5 ለለለ
ለ. 6-10 ለለለለ. ለለለለለለለለለለ
የየየየየየየየየየየየየየየየየየየየየየየየየየየየ
ለለለለለለለለለለለለለለለለለለለለለለለለለለለለለለለለለለለለለለለለለለለለለለለለለለለለ
ለለለለለለለለለለለለለለለለለ 5-ለለለለለለለለለ (ለለ)ለ 4-ለለለለለለ (ለ)ለ 3-ለለለለለለለለለ
(ለ)ለ 2-ለለለለለለ (ለለ) ለለ 1-ለለለለለለለለለ (ለለ) ለለለለለለለለ
ለለለለለለለለለለለለለለለለለለለለለለለለለለለለለለለለለለለለ”X”
ለለለለለለለለለለለለለለለለለለ
ለ.
ለ
ለለለለለለለለ 5 4 3 2 1
1 ለለለለለለለለለለለለለለለለለለለለለለለለለለለለለለለለለ
2 ለለለለለለለለለለለለለለለለለለለለለለለለለለለለለለለለለለለ
3 ለለለለለለለለለለለለለለለለለለለለለለለለለለለለለለ
4 ለለለለለለለለለለለለለለለለለለለለለለለለለለለለለለለለለ
5 ለለለለለለለለለለለለለለለለለለለለለለለለለለለለለ
ለለለለለለለ
6 ለለለለለለለለለለለለለለለለለለለለለለለለለለለለለለለ
7 ለለለለለለለለለለለለለለለለለለለለለለለለለለለለለለለለለለለለለለለለ
ለለለለለ
8 ለለለለለለለለለለለለለለለለለለለለለለለለለለለለለለለለለለለለለለለለ
ለለለለለለለ
9 ለለለለለለለለለለለለለለለለለለለለለለለለለለለለ
ለለለለለለለለለለ
10 ለለለለለለለለለለለለለለለለለለለለለለለለለለለለለለለለለለለለለለለለ
ለ
11 ለለለለለለለለለለለለለለለለለለለለለለለለለለለለለለለለለለለ
60
12 ለለለለለለለለለለለለለለለለለለለለለለለለለለለለለለለለለለለ
13 ለለለለለለለለለለለለለለለለለለለለለለለለ
ለለለለለለለ
14 ለለለለለለለለለለለለለለለለለለለለለለለለለለለለለለለለለለለለለለለለ
ለለለለለለለለለለለለለለለለለ
15 ለለለለለለለለለለለለለለለለለለለለለለለለለለለለለለለለለለለለለለለለ
ለለለለለለለለለለ
16 ለለለለለለለለለለለለለለለለለለለለለለለለለለለለለለለለለለለለለለለ
17 ለለለለለለለለለለለለለለለለለለለለለለለለለለለለለለ
ለለለለ/ለለለለለለለለ
18 ለለለለለለለለለለለለለለለለለለለለለለለለለለለለለለ
19 ለለለለለለለለለለለለለለለለለለለለለለለለለለለለ
20 ለለለለለለለለለለለለለለለለለለለለለለለለለለለለለለለለለለለለ
21 ለለለለለለለለለለለለለለለለለለለለለለለለለለለለለለለለ
22 ለለለለለለለለለለለለለለለለለለለለለለለለ
የየየየየየየየየየየየየየየየ
ለለለለለለለለለለለለለለለለለለለለለለለለለለለለለለለለለለለለለለለለለለለለለለለለለለለለ
ለለለለለለለለ 5-ለለለለለለለለለለ (ለለለ)ለ 4-ለለለለለለለ (ለለ)ለ 3-ለለለለለለለለለ (ለ)ለ 2-
ለለለለለለለለ (ለለ) ለለ 1-ለለለለለለለለለለለ (ለለለ) ለለለለለለለለ
ለለለለለለለለለለለለለለለለለለለለለለለለለለለለለለለለለለለለለለለለለለለ”X”
ለለለለለለለለለለለለለለለለለለ
ለ.
ለ
ለለለለለለለለለ 5 4 3 2 1
1 ለለለለለለለለለለለለለለለለለለለለለለለለለለለለ
2 ለለለለለለለለለለለለለለለለለለለለለለለለለለለለለለለ
3 ለለለለለለለለለለለለለለለለለለለለለለለለለለለለለለለለለለለለለለለ
ለለለ
4 ለለለለለለለለለለለለለለለለለለለለለለለለለለለለለለለለ
5 ለለለለለለለለለለለለለለለለለለለለለለለለለለለለለለለለ
ለለለለለለለለለለለለለለለ
Appendix III
Frequency Table
Descriptive Statistics of Service Quality Dimensions
Reliability
Reliability one
Frequency Percent Valid Percent Cumulative Percent
Valid
Strongly disagree 61 17.8 17.8 17.8
Disagree 92 26.8 26.8 44.6
Neutral 98 28.6 28.6 73.2
61
Agree 52 15.2 15.2 88.3
Strongly agree 40 11.7 11.7 100.0
Total 343 100.0 100.0
Reliability two
Frequency Percent Valid Percent Cumulative Percent
Valid
Strongly disagree 59 17.2 17.2 17.2
Disagree 124 36.2 36.2 53.4
Neutral 72 21.0 21.0 74.3
Agree 44 12.8 12.8 87.2
Strongly agree 44 12.8 12.8 100.0
Total 343 100.0 100.0
Reliability three
Frequency Percent Valid Percent Cumulative Percent
Valid
Strongly disagree 48 14.0 14.0 14.0
Disagree 89 25.9 25.9 39.9
Neutral 101 29.4 29.4 69.4
Agree 64 18.7 18.7 88.0
Strongly agree 41 12.0 12.0 100.0
Total 343 100.0 100.0
Reliability four
Frequency Percent Valid Percent Cumulative Percent
Valid
Strongly disagree 58 16.9 16.9 16.9
Disagree 110 32.1 32.1 49.0
Neutral 67 19.5 19.5 68.5
Agree 65 19.0 19.0 87.5
Strongly agree 43 12.5 12.5 100.0
Total 343 100.0 100.0
Reliability five
Frequency Percent Valid Percent Cumulative Percent
Valid
Strongly disagree 67 19.5 19.5 19.5
Disagree 101 29.4 29.4 49.0
Neutral 79 23.0 23.0 72.0
Agree 54 15.7 15.7 87.8
Strongly agree 42 12.2 12.2 100.0
Total 343 100.0 100.0

62
Responsiveness
Responsiveness one
Frequency Percent Valid Percent Cumulative Percent
Valid
Strongly disagree 36 10.5 10.5 10.5
Disagree 118 34.4 34.4 44.9
Neutral 114 33.2 33.2 78.1
Agree 60 17.5 17.5 95.6
Strongly agree 15 4.4 4.4 100.0
Total 343 100.0 100.0
Responsiveness two
Frequency Percent Valid Percent Cumulative Percent
Valid
Strongly disagree 66 19.2 19.2 19.2
Disagree 103 30.0 30.0 49.3
Neutral 114 33.2 33.2 82.5
Agree 41 12.0 12.0 94.5
Strongly agree 19 5.5 5.5 100.0
Total 343 100.0 100.0
Responsiveness three
Frequency Percent Valid Percent Cumulative Percent
Valid
Strongly disagree 40 11.7 11.7 11.7
Disagree 110 32.1 32.1 43.7
Neutral 115 33.5 33.5 77.3
Agree 54 15.7 15.7 93.0
Strongly agree 24 7.0 7.0 100.0
Total 343 100.0 100.0
Responsiveness four
Frequency Percent Valid Percent Cumulative Percent
Valid
Strongly disagree 49 14.3 14.3 14.3
Disagree 131 38.2 38.2 52.5
Neutral 111 32.4 32.4 84.8
Agree 36 10.5 10.5 95.3
Strongly agree 17 4.7 4.7 100.0
Total 343 100.0 100.0

63
Tangibility
Tangibility one
Frequency Percent Valid Percent Cumulative Percent
Valid
Strongly disagree 47 13.7 13.7 13.7
Disagree 97 28.3 28.3 42.0
Neutral 92 26.8 26.8 68.8
Agree 60 17.5 17.5 86.3
Strongly agree 47 13.7 13.7 100.0
Total 343 100.0 100.0
Tangibility two
Frequency Percent Valid Percent Cumulative Percent
Valid
Strongly disagree 34 9.9 9.9 9.9
Disagree 100 29.2 29.2 39.1
Neutral 94 27.4 27.4 66.5
Agree 60 17.5 17.5 84.0
Strongly agree 55 16.0 16.0 100.0
Total 343 100.0 100.0
Tangibility three
Frequency Percent Valid Percent Cumulative Percent
Valid
Strongly disagree 52 15.2 15.2 15.2
Disagree 98 28.6 28.6 43.7
Neutral 91 26.5 26.5 70.3
Agree 57 16.6 16.6 86.9
Strongly agree 45 13.1 13.1 100.0
Total 343 100.0 100.0
Tangibility four
Frequency Percent Valid Percent Cumulative Percent
Valid
Strongly disagree 48 14.0 14.0 14.0
Disagree 98 28.6 28.6 42.6
Neutral 94 27.4 27.4 70.0
Agree 56 16.3 16.3 86.3
Strongly agree 47 13.7 13.7 100.0
Total 343 100.0 100.0
64
Assurance
Assurance one
Frequency Percent Valid Percent Cumulative Percent
Valid
Strongly disagree 55 16.0 16.0 16.0
Disagree 93 27.1 27.1 43.1
Neutral 79 23.0 23.0 66.2
Agree 62 18.1 18.1 84.3
Strongly agree 54 15.7 15.7 100.0
Total 343 100.0 100.0
Assurance two
Frequency Percent Valid Percent Cumulative Percent
Vaid
Strongly disagree 70 20.4 20.4 20.4
Disagree 105 30.6 30.6 51.0
Neutral 73 21.3 21.3 72.3
Agree 55 16.0 16.0 88.3
Strongly agree 40 11.7 11.7 100.0
Total 343 100.0 100.0
Assurance three
Frequency Percent Valid Percent Cumulative Percent
Valid
Strongly disagree 75 21.9 21.9 21.9
Disagree 102 29.7 29.7 51.6
Neutral 89 25.9 25.9 77.6
Agree 56 16.3 16.3 93.9
Strongly agree 21 6.1 6.1 100.0
Total 343 100.0 100.0
Assurance four
Frequency Percent Valid Percent Cumulative Percent
Valid
Strongly disagree 59 17.2 17.2 17.2
Disagree 99 28.9 28.9 46.1
Neutral 87 25.4 25.4 71.4
Agree 74 21.6 21.6 93.0
Strongly agree 24 7.0 7.0 100.0
Total 343 100.0 100.0

65
Empathy
Empathy one
Frequency Percent Valid Percent Cumulative Percent
Valid
Strongly disagree 84 24.5 24.5 24.5
Disagree 119 34.7 34.7 59.2
Neutral 75 21.9 21.9 81.0
Agree 40 11.7 11.7 92.7
Strongly agree 25 7.3 7.3 100.0
Total 343 100.0 100.0
Empathy two
Frequency Percent Valid Percent Cumulative Percent
Valid
Strongly disagree 66 19.2 19.2 19.2
Disagree 124 36.2 36.2 55.4
Neutral 83 24.2 24.2 79.6
Agree 55 16.0 16.0 95.6
Strongly agree 15 4.4 4.4 100.0
Total 343 100.0 100.0
Empathy three
Frequency Percent Valid Percent Cumulative Percent
Valid
Strongly disagree 71 20.7 20.7 20.7
Disagree 96 28.0 28.0 48.7
Nuetral 74 21.6 21.6 70.3
Agree 75 21.9 21.9 92.1
Strongly agree 27 7.9 7.9 100.0
Total 343 100.0 100.0
Empathy four
Frequency Percent Valid Percent Cumulative Percent
Valid
Strongly disagree 58 16.9 16.9 16.9
Disagree 105 30.6 30.6 47.5
Neutral 101 29.4 29.4 77.0
Agree 61 17.8 17.8 94.8
Strongly agree 18 5.2 5.2 100.0
Total 343 100.0 100.0
Empathy five

66
Frequency Percent Valid Percent Cumulative Percent
Valid
Strongly disagree 58 16.9 16.9 16.9
Disagree 101 29.4 29.4 46.4
Neutral 79 23.0 23.0 69.4
Agree 70 20.4 20.4 89.8
Strongly agree 35 10.2 10.2 100.0
Total 343 100.0 100.0
Satisfaction
Satisfaction one
Frequency Percent Valid Percent Cumulative Percent
Valid
Strongly disagree 81 23.6 23.6 23.6
Disagree 108 31.5 31.5 55.1
Neutral 81 23.6 23.6 78.7
Agree 43 12.5 12.5 91.3
Strongly agree 30 8.7 8.7 100.0
Total 343 100.0 100.0
Satisfaction two
Frequency Percent Valid Percent Cumulative Percent
Valid
Strongly disagree 68 19.8 19.8 19.8
Disagree 126 36.7 36.7 56.6
Neutral 62 18.1 18.1 74.6
Agree 35 10.2 10.2 84.8
Strongly agree 52 15.2 15.2 100.0
Total 343 100.0 100.0
Satisfaction three
Frequency Percent Valid Percent Cumulative Percent
Valid
Strongly disagree 77 22.4 22.4 22.4
Disagree 97 28.3 28.3 50.7
Neutral 101 29.4 29.4 80.2
Agree 40 11.7 11.7 91.8
Strongly agree 28 8.2 8.2 100.0
Total 343 100.0 100.0
Satisfaction four
Frequency Percent Valid Percent Cumulative Percent
67
Valid
Strongly disagree 71 20.7 20.7 20.7
Disagree 122 35.6 35.6 56.3
Neutral 42 12.2 12.2 68.5
Agree 53 15.5 15.5 84.0
Strongly agree 55 16.0 16.0 100.0
Total 343 100.0 100.0
Satisfaction five
Frequency Percent Valid Percent Cumulative Percent
Valid
Strongly disagree 83 24.2 24.2 24.2
Disagree 111 32.4 32.4 56.6
Neutral 60 17.5 17.5 74.1
Agree 36 10.5 10.5 84.5
Strongly agree 53 15.5 15.5 100.0
Total 343 100.0 100.0
APPENDIX IV
RESULTS OF CORRELATIONS
Correlations
Satisfaction Reliability Responsiven
ess
Tangibility Assurance Empathy
Satisfaction
Pearson Correlation 1 .651** .627** .760** .640** .551**
Sig. (2-tailed) .000 .000 .000 .000 .000
N 343 343 343 343 343 343
Reliability
Pearson Correlation .651** 1 .406** .490** .391** .377**
Sig. (2-tailed) .000 .000 .000 .000 .000
N 343 343 343 343 343 343
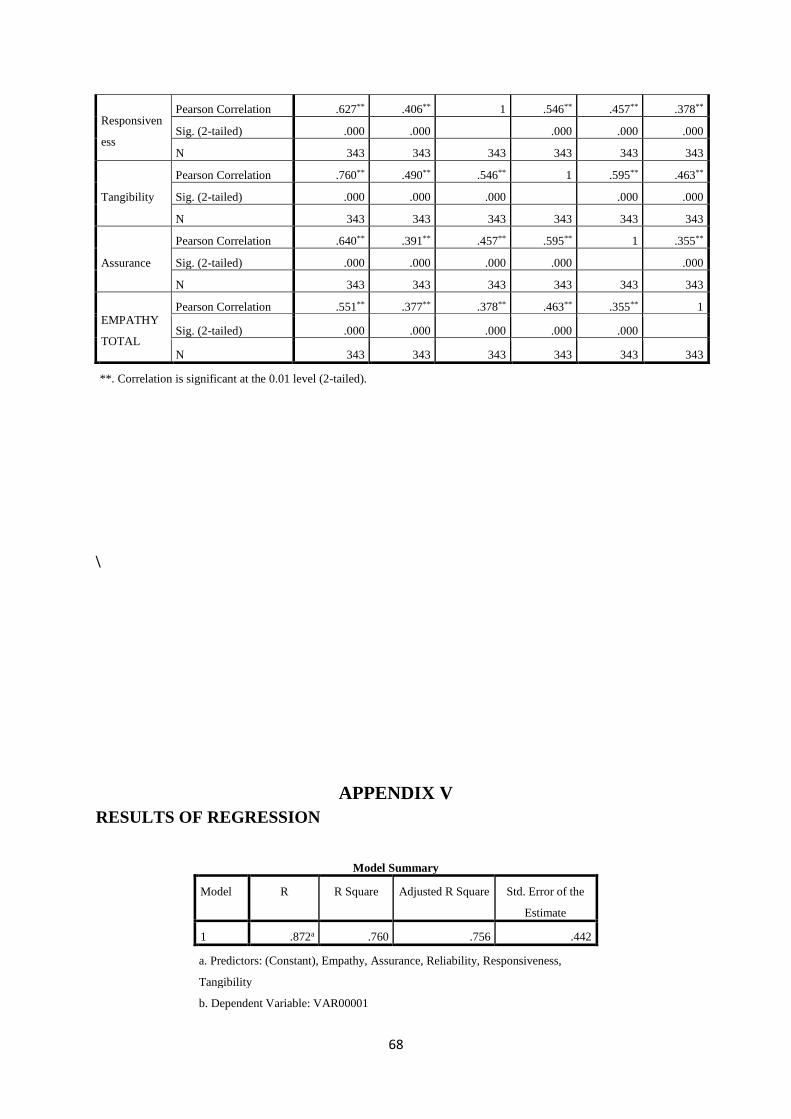
68
Responsiven
ess
Pearson Correlation .627** .406** 1 .546** .457** .378**
Sig. (2-tailed) .000 .000 .000 .000 .000
N 343 343 343 343 343 343
Tangibility
Pearson Correlation .760** .490** .546** 1 .595** .463**
Sig. (2-tailed) .000 .000 .000 .000 .000
N 343 343 343 343 343 343
Assurance
Pearson Correlation .640** .391** .457** .595** 1 .355**
Sig. (2-tailed) .000 .000 .000 .000 .000
N 343 343 343 343 343 343
EMPATHY
TOTAL
Pearson Correlation .551** .377** .378** .463** .355** 1
Sig. (2-tailed) .000 .000 .000 .000 .000
N 343 343 343 343 343 343
**. Correlation is significant at the 0.01 level (2-tailed).
\
APPENDIX V
RESULTS OF REGRESSION
Model Summary
Model R R Square Adjusted R Square Std. Error of the
Estimate
1 .872a .760 .756 .442
a. Predictors: (Constant), Empathy, Assurance, Reliability, Responsiveness,
Tangibility
b. Dependent Variable: VAR00001

69
Coefficientsa
Model Un-standardized Coefficients Standardized
Coefficients
t Sig.
B Std. Error Beta
1
(Constant) -.362 .098 -3.706 .000
Reliability .266 .030 .278 8.737 .000
Responsiveness .181 .032 .185 5.567 .000
Tangibility .323 .036 .339 8.852 .000
Assurance .180 .032 .192 5.613 .000
EMPATHY TOTAL .156 .032 .151 4.875 .000
a. Dependent Variable: Satisfaction
Appendix-V-2: Multicolinearity
Coefficientsa
Model Un0standardized Coefficients Standardize
d
Coefficient
s
t Sig. Collinearity Statistics
B Std. Error Beta Tolerance VIF
1
(Constant) -.362 .098
-3.706 .000
Reliability .266 .030 .278 8.737 .000 .705 1.419
Responsivenes
s .181 .032 .185 5.567 .000 .646 1.547
Tangibility .323 .036 .339 8.852 .000 .486 2.057
Assurance .180 .032 .192 5.613 .000 .611 1.636
EMPATHY
TOTAL .156 .032 .151 4.875 .000 .739 1.353
a. Dependent Variable: Satisfaction
Appendix VI-1
Charts

70
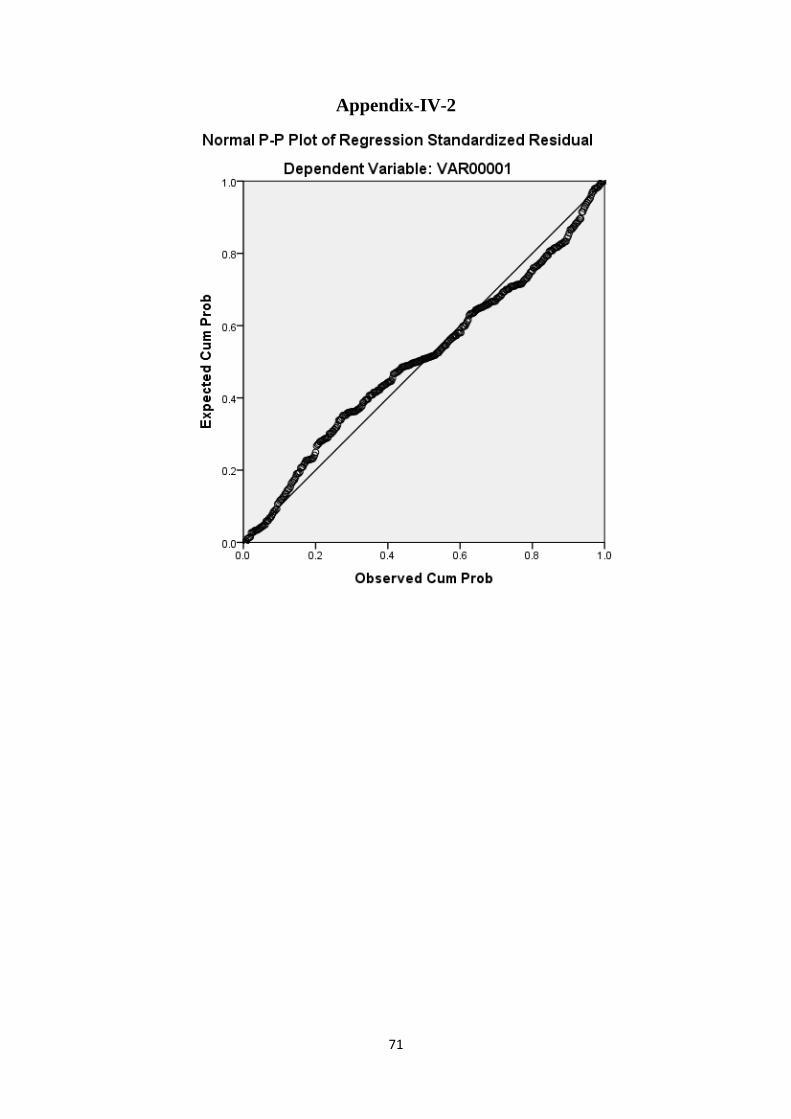
71
Appendix-IV-2

72
Appendix-IV-3
Related Documents