This document consists of 22 printed pages and 2 blank pages. IB12 11_0653_32/3RP © UCLES 2012 [Turn over *3318455889* For Examiner's Use 1 2 3 4 5 6 7 8 9 Total UNIVERSITY OF CAMBRIDGE INTERNATIONAL EXAMINATIONS International General Certificate of Secondary Education COMBINED SCIENCE 0653/32 Paper 3 (Extended) October/November 2012 1 hour 15 minutes Candidates answer on the Question Paper. No Additional Materials are required. READ THESE INSTRUCTIONS FIRST Write your Centre number, candidate number and name on all the work you hand in. Write in dark blue or black pen. You may use a soft pencil for any diagrams, graphs, tables or rough working. Do not use staples, paper clips, highlighters, glue or correction fluid. DO NOT WRITE IN ANY BARCODES. Answer all questions. A copy of the Periodic Table is printed on page 24. At the end of the examination, fasten all your work securely together. The number of marks is given in brackets [ ] at the end of each question or part question. www.XtremePapers.com

Welcome message from author
This document is posted to help you gain knowledge. Please leave a comment to let me know what you think about it! Share it to your friends and learn new things together.
Transcript

This document consists of 22 printed pages and 2 blank pages.
IB12 11_0653_32/3RP © UCLES 2012 [Turn over
*3318455889*
For Examiner's Use
1
2
3
4
5
6
7
8
9
Total
UNIVERSITY OF CAMBRIDGE INTERNATIONAL EXAMINATIONS International General Certificate of Secondary Education
COMBINED SCIENCE 0653/32
Paper 3 (Extended) October/November 2012
1 hour 15 minutes
Candidates answer on the Question Paper.
No Additional Materials are required.
READ THESE INSTRUCTIONS FIRST
Write your Centre number, candidate number and name on all the work you hand in.
Write in dark blue or black pen.
You may use a soft pencil for any diagrams, graphs, tables or rough working.
Do not use staples, paper clips, highlighters, glue or correction fluid.
DO NOT WRITE IN ANY BARCODES.
Answer all questions.
A copy of the Periodic Table is printed on page 24.
At the end of the examination, fasten all your work securely together.
The number of marks is given in brackets [ ] at the end of each question or part question.
www.XtremePapers.com

2
© UCLES 2012 0653/32/O/N/12
For
Examiner's
Use
1 Fig. 1.1 shows a red blood cell and a root hair cell.
Fig. 1.1 (a) Name the red protein found in the cytoplasm of the red blood cell.
[1]
(b) (i) State the function of a root hair cell.
[1]
(ii) Explain how the root hair cell is adapted to carry out this function.
[2]
(c) Fig. 1.2 shows a plant with its roots in a beaker of water containing a blue dye.
X
Fig. 1.2

3
© UCLES 2012 0653/32/O/N/12 [Turn over
For
Examiner's
Use
After 10 minutes, the stem of the plant was cut across at X. Fig. 1.3 shows the appearance of the cut stem seen through a microscope.
Fig. 1.3 (i) On Fig. 1.3, use a pencil to shade all of the parts that would look blue. [1] (ii) The blue dye eventually reached the leaves of the plant. The following parts of the
plant all became blue.
A leaf mesophyll cells
B xylem cells
C root hair cells
List the letters in order, to show the sequence in which the cells would become blue.
first to become blue
last to become blue [1]
(iii) Describe how water is lost from the leaves of plants.
[3]
4
© UCLES 2012 0653/32/O/N/12
For
Examiner's
Use
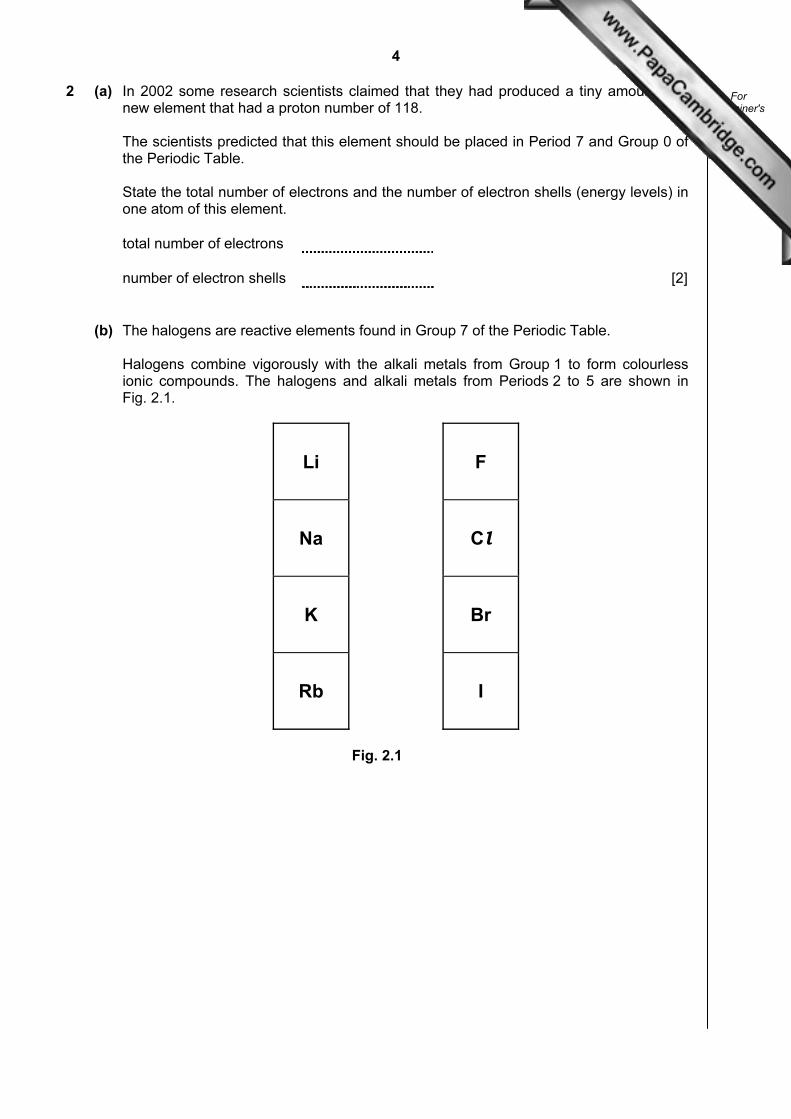
2 (a) In 2002 some research scientists claimed that they had produced a tiny amount of a new element that had a proton number of 118.
The scientists predicted that this element should be placed in Period 7 and Group 0 of
the Periodic Table. State the total number of electrons and the number of electron shells (energy levels) in
one atom of this element.
total number of electrons
number of electron shells [2]
(b) The halogens are reactive elements found in Group 7 of the Periodic Table. Halogens combine vigorously with the alkali metals from Group 1 to form colourless
ionic compounds. The halogens and alkali metals from Periods 2 to 5 are shown in Fig. 2.1.
Li F
Na Cl
K Br
Rb I
Fig. 2.1

5
© UCLES 2012 0653/32/O/N/12 [Turn over
For
Examiner's
Use
(i) A student has a colourless solution which he knows is either potassium bromide or potassium iodide.
The student adds chlorine solution as shown in Fig. 2.2.
chlorinesolution
colourless solution ofeither potassium bromideor potassium iodide
Fig. 2.2 Predict the colour the student would see if the test-tube contained
● potassium bromide,
● potassium iodide.
Explain your predictions.
[3]

6
© UCLES 2012 0653/32/O/N/12
For
Examiner's
Use
(ii) The student is asked to predict which pair of elements, chosen from those shown in Fig. 2.1, would react together most vigorously.
He predicts that the reaction between lithium and fluorine would be the most
vigorous. Explain whether or not the student has made a correct prediction.
[2]
(c) Potassium bromide contains potassium ions, K
+ and bromide ions, Br
–. Construct a balanced symbolic equation for the reaction between potassium and
bromine to form potassium bromide.
[3]

7
© UCLES 2012 0653/32/O/N/12 [Turn over
For
Examiner's
Use
3 Fig. 3.1 shows four swimmers at the start of a race.
Fig. 3.1 (a) The swimmers start their race when they hear a loud, high-pitched sound from a
loudspeaker. (i) Explain why sound travels at a different speed through water than through air.
[2]
(ii) Fig. 3.2 shows the trace of a sound wave as it appears on an oscilloscope screen. On Fig. 3.2 draw another trace of a sound wave from a sound that is louder than
the one shown, but has the same pitch.
Fig. 3.2 [2] (iii) The swimmers can hear the sound from the loudspeaker only if the frequency of
the sound lies within a range of frequencies which the human ear can detect. State this range of frequencies.
Hz to Hz [1]

8
© UCLES 2012 0653/32/O/N/12
For
Examiner's
Use
(iv) Waves are either longitudinal or transverse. State whether each of the following is an example of a transverse or longitudinal
wave.
the sound waves produced by the loudspeaker
the water waves produced by the swimmers in the pool [1]
(b) Sound travels at 330 m / s in air. One swimmer is 0.4 m from the loudspeaker when he
hears the sound. (i) Calculate the time taken for the sound to travel from the loudspeaker to the
swimmer. State the formula that you use and show your working. formula used working
[2]
(ii) The loudspeaker produces a sound with a frequency of 2200 Hz. Calculate the wavelength of this sound. State the formula that you use and show your working. formula used working
[2]
9
© UCLES 2012 0653/32/O/N/12 [Turn over
For
Examiner's
Use
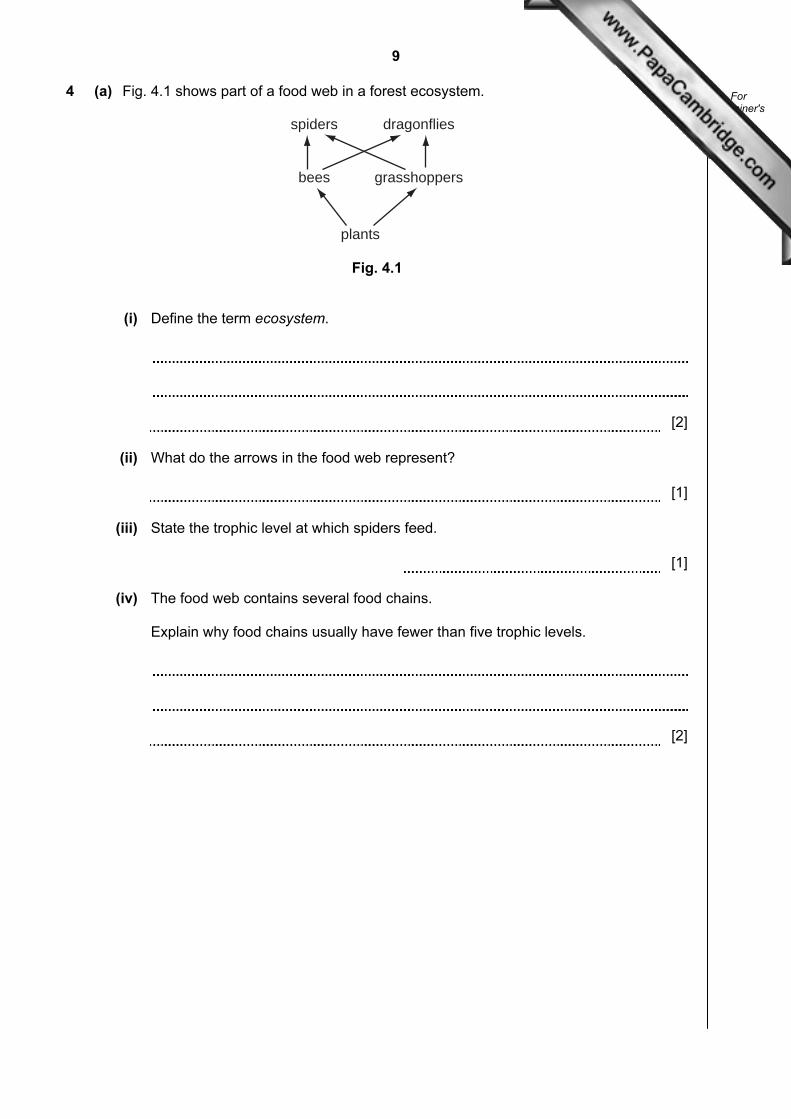
4 (a) Fig. 4.1 shows part of a food web in a forest ecosystem.
plants
bees grasshoppers
spiders dragonflies
Fig. 4.1 (i) Define the term ecosystem.
[2]
(ii) What do the arrows in the food web represent?
[1]
(iii) State the trophic level at which spiders feed.
[1]
(iv) The food web contains several food chains. Explain why food chains usually have fewer than five trophic levels.
[2]

10
© UCLES 2012 0653/32/O/N/12
For
Examiner's
Use
(b) The food web shows that bees depend on plants. Some flowering plants also depend on bees to help them to reproduce.
Explain how bees help flowering plants to reproduce.
[3]

11
© UCLES 2012 0653/32/O/N/12 [Turn over
For
Examiner's
Use
5 (a) A student investigated the reaction between antacid tablets and dilute hydrochloric acid.
The antacid tablets contain a mixture of sodium hydrogencarbonate, calcium carbonate
and magnesium carbonate. Fig. 5.1 shows one of the experiments the student carried out.
side-armtest-tube
dilute hydrochloricacid limewater
antacid tablet
Fig. 5.1 Carbon dioxide gas was given off when the antacid tablet reacted with the dilute
hydrochloric acid. Describe and explain the change in appearance of the limewater during the
experiment.
[2]
12
© UCLES 2012 0653/32/O/N/12
For
Examiner's
Use
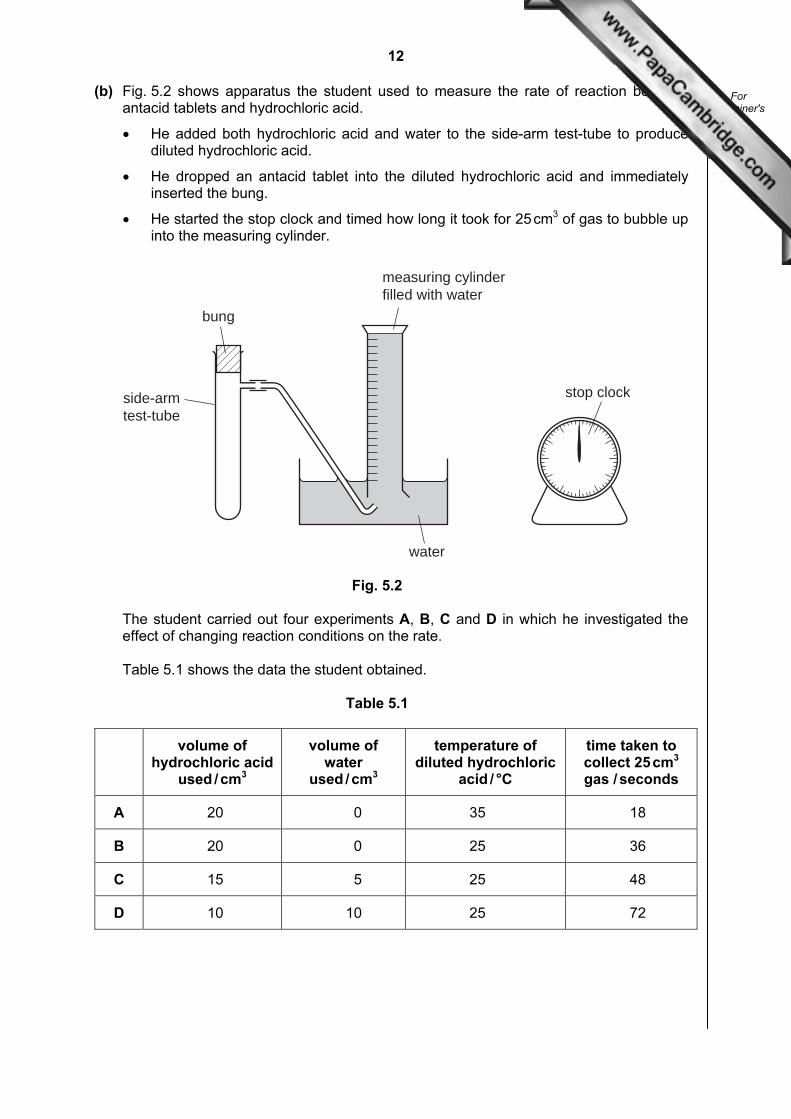
(b) Fig. 5.2 shows apparatus the student used to measure the rate of reaction between antacid tablets and hydrochloric acid.
• He added both hydrochloric acid and water to the side-arm test-tube to produce diluted hydrochloric acid.
• He dropped an antacid tablet into the diluted hydrochloric acid and immediately inserted the bung.
• He started the stop clock and timed how long it took for 25 cm3 of gas to bubble up into the measuring cylinder.
stop clock
water
bung
side-armtest-tube
measuring cylinderfilled with water
Fig. 5.2 The student carried out four experiments A, B, C and D in which he investigated the
effect of changing reaction conditions on the rate. Table 5.1 shows the data the student obtained.
Table 5.1
volume of hydrochloric acid
used / cm3
volume of water
used / cm3
temperature of diluted hydrochloric
acid / °C
time taken to collect 25 cm3 gas / seconds
A 20 0 35 18
B 20 0 25 36
C 15 5 25 48
D 10 10 25 72

13
© UCLES 2012 0653/32/O/N/12 [Turn over
For
Examiner's
Use
(i) State in which experiment, A, B, C or D, the reaction rate was the lowest.
[1]
(ii) State briefly the conclusions the student can draw from the results of experiments
A and B and from the results of experiments B, C and D.
conclusion from experiments A and B
conclusion from experiments B, C and D
[2]
(iii) Explain the conclusion from experiments A and B, in terms of collisions between
particles.
[2]

14
© UCLES 2012 0653/32/O/N/12
For
Examiner's
Use
6 (a) Fig. 6.1 shows a circuit for measuring the current through a filament lamp as the potential difference is changed.
V
A
Fig. 6.1 Fig. 6.2 shows a graph of the results from an experiment using this circuit.
0.35
0.30
0.25
0.20
0.15
0.10
0.05
0.000 1 2
potential difference / V
3 4
current / A
Fig. 6.2

15
© UCLES 2012 0653/32/O/N/12 [Turn over
For
Examiner's
Use
(i) Use the graph to calculate the resistance of the lamp when the potential difference was 2.0 V and when the potential difference was 4.0 V.
State the formula that you use and show your working. formula used working
resistance at 2.0 V
resistance at 4.0 V [2]
(ii) Describe how the current through the filament lamp changes as the voltage
increases above 2.0 V.
[1]
(b) A single ray of light from a torch (flashlight) is shone onto a mirror as shown in Fig. 6.3.
Fig. 6.3 (i) Label the angle of incidence and angle of reflection. [1] (ii) The angle of incidence = 45°. Write down the value of the angle of reflection.
[1]

16
© UCLES 2012 0653/32/O/N/12
For
Examiner's
Use
7 (a) Fig. 7.1 shows the human alimentary canal.
F
E
D
A
B
C
Fig. 7.1 State the letter that indicates
the liver,
the area where digested food is absorbed. [2]
(b) Lipase is an enzyme that catalyses the breakdown of fats to fatty acids and glycerol.
fat fatty acids + glycerol A student carried out an experiment to investigate the effect of temperature on the rate
of the breakdown of fats by lipase. Fig. 7.2 shows how she set up the two test-tubes.
4 °C
liquid fat and indicator
lipase solution
30 °C
liquid fat and indicator
lipase solution
A B
Fig. 7.2

17
© UCLES 2012 0653/32/O/N/12 [Turn over
For
Examiner's
Use
The indicator that the student used changes colour from blue to yellow when the pH falls below 5.
Table 7.1 shows her results.
Table 7.1
time / minutes tube A (4 ºC) tube B (30 ºC)
0 blue blue
5 blue yellow
10 blue yellow
15 yellow yellow
(i) Using the information in the word equation, explain why the indicator eventually
changed to yellow in both tubes.
[2]
(ii) Explain the reason for the difference between the results for tube A and tube B.
[3]
(c) Fat is an important component of a balanced diet. Explain why a balanced diet should not contain too much fat.
[2]

18
© UCLES 2012 0653/32/O/N/12
For
Examiner's
Use
8 Large amounts of chemical energy are stored in the world’s reserves of fossil fuels such as natural gas and petroleum (crude oil).
(a) (i) Name the main compound in natural gas.
Write the word chemical equation for the complete combustion of this compound.
[3]
(ii) Before it is refined, petroleum contains sulfur compounds. Describe and explain how water in rivers and lakes could become polluted if sulfur
compounds are not removed from fossil fuels before they are used.
[4]
(b) Sulfur is removed from petroleum by combining it with hydrogen to form the gaseous
compound hydrogen sulfide, H2S. Sulfur is in Group 6 of the Periodic Table. Complete the bonding diagram of one molecule of hydrogen sulfide below to show
• the chemical symbols of the elements
• how the outer electrons in each element are arranged.
[2]

19
© UCLES 2012 0653/32/O/N/12 [Turn over
For
Examiner's
Use
9 Fig. 9.1 shows a toy car travelling over a plastic surface.
Fig. 9.1 (a) The car, of mass 0.5 kg is moving at a steady speed of 0.5 m / s. Calculate the kinetic energy of the car. State the formula that you use and show your working. formula used working
[2]
(b) While the car is moving, the wheels are rubbing against the plastic surface. The car
becomes electrostatically charged with a positive charge. Explain how this happens.
[3]

20
© UCLES 2012 0653/32/O/N/12
For
Examiner's
Use
(c) A speed – time graph for the car is shown in Fig. 9.2. It shows the motion of the car over a 25 second period.
0.4
0.3
0.2
0.1
0.00 5 10
time / s
15 20 25
speedm / s
A DA D
B CB C
EE
Fig. 9.2 (i) State the part of the graph when the car is not moving.
[1]
(ii) State one part of the graph when the car was travelling at constant speed and
write down the value of this speed.
part of graph
speed [1]

21
© UCLES 2012 0653/32/O/N/12
For
Examiner's
Use
(iii) State one part of the graph when the car was accelerating and calculate this acceleration.
Show your working.
part of graph
acceleration [2]
(iv) Calculate the distance travelled by the car between A and D. Show your working.
[3]


24
Permission to reproduce items where third-party owned material protected by copyright is included has been sought and cleared where possible. Every reasonable effort has been made by the publisher (UCLES) to trace copyright holders, but if any items requiring clearance have unwittingly been included, the publisher will be pleased to make amends at the earliest possible opportunity. University of Cambridge International Examinations is part of the Cambridge Assessment Group. Cambridge Assessment is the brand name of University of Cambridge Local Examinations Syndicate (UCLES), which is itself a department of the University of Cambridge.
© UCLES 2012 0653/32/O/N/12
Gro
up
140
Ce
Cer
ium
58
141
Pr
Pra
seod
ymiu
m
59
144
Nd
Neo
dym
ium
60
Pm
Pro
met
hium
61
150
Sm
Sa
ma
riu
m
62
152
Eu
Eur
opiu
m
63
157
Gd
Gad
olin
ium
64
159
Tb
Terb
ium
65
162
Dy
Dys
pros
ium
66
165
Ho
Hol
miu
m
67
167
Er
Erb
ium
68
169
Tm
Thu
lium
69
173
Yb
Ytte
rbiu
m
70
175
Lu
Lute
tium
71
232
Th
Tho
rium
90
Pa
Pro
tact
iniu
m
91
238 U
Ura
nium
92
Np
Nep
tuni
um
93
Pu
Plu
toni
um
94
Am
Am
eric
ium
95
Cm
Cur
ium
96
Bk
Ber
keliu
m
97
Cf
Cal
iforn
ium
98
Es
Ein
stei
nium
99
Fm
Fer
miu
m
100
Md
Men
dele
vium
101
No
Nob
eliu
m
102
Lr
Law
renc
ium
103
1 HH
ydro
gen
1
7 Li
Lith
ium
3
23 Na
Sod
ium
11
24 Mg
Mag
nesi
um
12
40 Ca
Cal
cium
20
45 Sc
Sca
ndiu
m
21
48 Ti
Tita
nium
22
51 VV
anad
ium
23
52 Cr
Chr
omiu
m
24
55 Mn
Man
gane
se
25
56 Fe
Iron
26
59 Co
Cob
alt
27
59 Ni
Nic
kel
28
64 Cu
Cop
per
29
65 Zn
Zin
c
30
70 Ga
Gal
lium
31
27 Al
Alu
min
ium
13
11 BB
oron
5
12 CC
arbo
n
6
14 NN
itrog
en
7
16 OO
xyge
n
8
19 FF
luor
ine
9
28 Si
Sili
con
14
31 PP
hosp
horu
s
15
32 SS
ulfu
r16
35.5
Cl
Chl
orin
e17
40 Ar
Arg
on18
20 Ne
Neo
n10
4 He
Hel
ium
2
73 Ge
Ger
man
ium
32
75 As
Ars
enic
33
79 Se
Sel
eniu
m
34
80 Br
Bro
min
e
35
84 Kr
Kry
pton
36
39 KP
otas
sium
19
88 Sr
Str
ontiu
m
38
89 YY
ttriu
m
39
91 Zr
Zirc
oniu
m
40
93 Nb
Nio
bium
41
96 Mo
Mol
ybde
num
42
TcTe
chne
tium
43
101
Ru
Rut
heni
um
44
103
Rh
Rho
dium
45
106
Pd
Pal
ladi
um
46
108
Ag
Silv
er
47
112
Cd
Cad
miu
m
48
115
In Indi
um
49
119
Sn
Tin
50
122
Sb
Ant
imon
y
51
128
TeTe
lluriu
m
52
127 I
Iodi
ne
53
131
Xe
Xen
on
54
137
Ba
Bar
ium
56
139
La
Lant
hanu
m
57
*
178
Hf
Haf
nium
72
181
TaTa
ntal
um
73
184
WT
ungs
ten
74
186
Re
Rhe
nium
75
190
Os
Osm
ium
76
192
Ir Irid
ium
77
195
Pt
Pla
tinum
78
197
Au
Gol
d
79
201
Hg
Mer
cury
80
204
Tl
Tha
llium
81
207
Pb
Lead
82
209
Bi
Bis
mut
h
83
Po
Pol
oniu
m
84
At
Ast
atin
e
85
Rn
Rad
on
86
Fr
Fra
nciu
m
87
227
Ac
Act
iniu
m
89
9 Be
Ber
ylliu
m
4
III
IIIIV
VV
IV
II0
85 Rb
Rub
idiu
m
37
133
Cs
Cae
sium
55
226
Ra
Rad
ium
88
The
vol
ume
of o
ne m
ole
of a
ny g
as is
24
dm3
at r
oom
tem
pera
ture
and
pre
ssur
e (r
.t.p.
).
a Xb
a =
rel
ativ
e at
omic
mas
s
X =
ato
mic
sym
bol
b =
pro
ton
(ato
mic
) nu
mbe
r
Key
* 58-
71 L
anth
anoi
d se
ries
90-1
03 A
ctin
oid
serie
s
DA
TA S
HE
ET
Th
e P
erio
dic
Tab
le o
f th
e E
lem
ents
Related Documents