CENTER FOR LABOR ECONOMICS UNIVERSITY OF CALIFORNIA, BERKELEY WORKING PAPER NO. 46 Did Draft Avoidance Raise College Attendance During the Vietnam War? David Card University of California Berkeley Thomas Lemieux University of British Columbia February 2002 ABSTRACT The rise in college attendance rates in the mid-1960s is often attributed to draft avoidance behavior. Throughout most of the Vietnam war men who were enrolled in college could obtain deferments that delayed their eligibility for conscription. Anecdotal and quantitative evidence suggests that these deferments were an effective though imperfect way to avoid military service. We use data on enrollment and completed education of cohorts of men and women born between 1935 and 1959 to estimate the effect of draft avoidance behavior on the schooling choices of men who faced the highest risk of service during the Vietnam-era draft. We assume that in the absence of the draft the relative schooling outcomes of men and women would have followed a smooth inter-cohort trend. We find a strong link between the risk of induction faced by a cohort of men and their enrollment and completed education relative to women. We estimate that draft avoidance raised college attendance rates by 4-6 percentage points in the late 1960s, and raised the fraction of men born in the late 1940s with a college degree by up to 2 percentage points. *We are grateful to Olivier Deschenes and Ethan Lewis for assistance in this project. This research was supported by grants from the National Science Foundation and the National Institute of Child Health and Development.

Welcome message from author
This document is posted to help you gain knowledge. Please leave a comment to let me know what you think about it! Share it to your friends and learn new things together.
Transcript
CENTER FOR LABOR ECONOMICSUNIVERSITY OF CALIFORNIA, BERKELEYWORKING PAPER NO. 46
Did Draft Avoidance Raise College Attendance During the Vietnam War?
David Card University of California Berkeley
Thomas Lemieux University of British Columbia
February 2002
ABSTRACT
The rise in college attendance rates in the mid-1960s is often attributed to draft avoidance behavior.Throughout most of the Vietnam war men who were enrolled in college could obtain deferments thatdelayed their eligibility for conscription. Anecdotal and quantitative evidence suggests that thesedeferments were an effective though imperfect way to avoid military service. We use data onenrollment and completed education of cohorts of men and women born between 1935 and 1959 toestimate the effect of draft avoidance behavior on the schooling choices of men who faced thehighest risk of service during the Vietnam-era draft. We assume that in the absence of the draft therelative schooling outcomes of men and women would have followed a smooth inter-cohort trend.We find a strong link between the risk of induction faced by a cohort of men and their enrollmentand completed education relative to women. We estimate that draft avoidance raised collegeattendance rates by 4-6 percentage points in the late 1960s, and raised the fraction of men born inthe late 1940s with a college degree by up to 2 percentage points.
*We are grateful to Olivier Deschenes and Ethan Lewis for assistance in this project. Thisresearch was supported by grants from the National Science Foundation and the NationalInstitute of Child Health and Development.
1Men who were issued college deferments remained at risk of induction after the completion oftheir studies (technically, until the age of 35). As we argue below, however, men who had finishedcollege were relatively unlikely to be drafted.
2The enrollment series in Figure 1 represents the number of men age 16-24 who completed highschool in the previous spring and were enrolled in college in October. The number of inductionsrepresents the total number of men drafted during the fiscal year ending in July.
Between 1965 and 1975 the enrollment rate of college-age men in the United States rose and
then fell abruptly. Many contemporary observers (e.g., Davis and Dolbeare, 1968) attributed the surge in
college attendance to draft avoidance behavior. Under a policy first introduced in the Korean War, the
Selective Service issued college deferments to enrolled men that delayed their eligibility for
conscription.1 These deferments provided a strong incentive to remain in school for men who wanted to
avoid the draft. As illustrated in Figure 1, the rise in college entry rates of young men between 1964 and
1968 coincided with the rise in the number of men drafted into military service.2 Moreover, the drop in
the number of inductions between 1968 and 1973 was followed by a decline in college entry rates.
Although the parallel trends in Figure 1 are suggestive, they do not necessarily prove that draft avoidance
raised the education of men who were at risk of service during the Vietnam war. Such an inference
requires an explicit specification of the “counterfactual” – what would have happened to schooling
outcomes in the absence of the draft.
In this paper we use trends in enrollment and completed schooling of men relative to those of
women to measure the effects of draft avoidance behavior during the Vietnam war. Our maintained
hypothesis is that in the absence of gender-specific factors such as the draft, the relative schooling
outcomes of men and women from the same cohort would follow a smooth trend. In light of the sharp
discontinuity in military induction rates between 1965 and 1970, we look for similar patterns in the
relative enrollment rate of men, and in the relative college graduation rate of men from cohorts that were
at risk of induction during this period. Our key finding is that the Vietnam-era draft led to a rise in male
college attendance rates between 1965 and 1970, and a corresponding rise in college completion rates for
men born between 1945 and 1950, with a peak impact of about 2 percentage points for men born in 1947.

3For reference, Appendix Table 1 reports the number of men inducted into the military in semi-annual periods from 1960 to 1973.
4A relatively high fraction of potential inductees failed the tests. In fiscal year 1965 (just prior tothe ramp-up of inductions associated with the war), 44 percent of examinees were found unfit for service:about one-half of these failed the medical standards and one-half failed the mental standards (NationalAdvisory Commission on Selective Service, 1967, Table 9.3). In the first half of 1970 the overall failurerate was very similar (Semiannual Report of the Director of the Selective Service, 1970).
2
The timing of the rise in college attendance rates suggests that the effect of the Vietnam war arose
through draft avoidance behavior, rather than through an effect of GI-Bill benefits on post service college
attendance. Moreover, unlike cohorts who were at risk of service in World War II, only a small fraction
of Vietnam-era veterans returned to complete a college degree after their military service. Thus, we
believe that draft avoidance was the main causal mechanism at work during the Vietnam era.
I. The Draft and College Deferments
Table 1 presents a brief summary of key events in the Vietnam-era draft.3 During most of the
war the draft operated under procedures similar to those used in World War II and the Korean war
(National Advisory Commission on Selective Service, 1967, pp. 17-29). Men who reached the age of 18
were required to report to their local draft board for classification. The board could issue deferments for
a variety of reasons, including school attendance or the presence of dependent children, or it could
classify a registrant as ‘available for service’ and require that he undergo pre-induction tests of physical
and mental abilities.4 Those who passed the tests were liable for induction, and could be ordered to
report for duty depending on the needs of the military and the allocation of national manpower
requirements to the local draft boards. Men who were drafted were nearly all assigned to the Army, and
served for up to 3 years. Registrants who were liable for induction could volunteer for service and
thereby obtain a potential choice of which service to enter, and also qualify for a shorter period of

5Until January 1966 men who were ordered for induction could voluntarily enlist for service inthe Reserves or National Guard. After 1966 these highly sought positions were only available to thosewho volunteered prior to receiving orders to report for induction. (Annual Report of the Director of theSelective Service, 1966, p. 26).
6See Annual Report of the Director of the Selective Service (1966, p. 19; 1969, p. 16). Delinquents were men who failed to register or failed to report for pre-induction testing or otherwiseviolated Selective Service laws.
7For example, the National Advisory Commission on Selective Service (1967, p. 41) noted that”...what starts out as a temporary deferment for college enrollment is easily extended into a de factoexemption – by graduate school, by occupation, by fatherhood, and ultimately by the passage of time andadvance of age.”
3
service.5
The process of deciding which men were actually drafted was controversial from the earliest
days of the Vietnam war. Until the institution of the draft lottery, the sequence of induction from among
those available for service was set by order of the President, with the highest priority for ‘delinquents’,
second priority for volunteers, and third priority for non-volunteers between the ages of 19 and 25, in
order of their dates of birth (i.e., from oldest to youngest).6 Although other groups could be called, most
draft boards were able to fill their quotas from the these three categories, even at the peak of the draft
(see Semiannual Report of the Director of the Selective Service, 1969, p. 8). Technically, men who had
held college or other deferments were eligible for induction until age 35. Since few men between the
ages of 26 and 35 were ever drafted, however, men who were able to maintain a college deferment until
their 26th birthday could avoid service. Those who finished a bachelors degree before reaching age 25
could apply for a graduate deferment in the early and middle years of the war (up to 1968) and could
apply for occupational or dependent deferments throughout the period from 1965 to 1970.
Although contemporary observers agreed that college attendance was an effective draft-
avoidance technique during the early and middle years of the Vietnam war7, it is surprisingly difficult to
find evidence on the relative probability of induction faced by men with different levels of education.
We used data from the 1973 Occupational Change in a Generation (OCG) Survey to construct a rough

8We estimate the risk of service for those with a degree as the ratio of the number of men whoentered the military after completing 16 or more years of school, divided by the sum of this total plus thenumber of men with a college degree who never served. For men born in 1945-47, this risk was 19percent.
4
estimate of the risk of military service for men who had obtained a college degree prior to service relative
to those who had not. Among men born between 1945 and 1947 (50 percent of whom served in the
military), we estimate that men with a college degree were only one-third as likely to serve as those
without a degree.8 Considering that a high fraction of men with low levels of education were found unfit
for service, this ratio confirms that college attendance was a powerful, albeit imperfect, way to avoid the
draft.
The draft process was substantially changed by the introduction of the draft lottery in late 1969.
The first lottery, held December 1, 1969, assigned numbers by month and day of birth to men born
between 1944 and 1950. Priority for induction in 1970 was based on these random sequence numbers,
and was in principle independent of age. Importantly, however, educational deferments continued to be
issued until September 1971, and men who were in college at that time were allowed to maintain their
deferment for duration of the school year. Thus, individuals enrolled in college could delay their risk of
induction through most of the years of the draft lottery. Since the rate of inductions slowed to a trickle
after June 1971 (see Appendix Table 1), most individuals who obtained deferments in 1970 or 1971
permanently avoided military service.
Another key feature of the lottery was that each cohort was at risk of induction for only a single
year, rather than for the entire period between the ages of 19 and 25. Individuals born between 1944 and
1950 who had not already served in the military were at risk in 1970, and thereafter each successive birth
cohort was only at risk during the year of its twentieth birthday. In fact, the period of exposure was even
shorter, since the Selective Service announced a ceiling (a maximum lottery number that would be
called) at some point during the year. The limited period of exposure, coupled with the relatively low
9In reality, of course, there were substantial differences within and across states in the applicationof deferment policies, and in rates of disqualification for service based on mental or physical fitness (seeNational Advisory Commission on Selective Service, 1967, Section II) . It is an open question whetheryoung men were aware of these differences and responded differently to the threat of induction in placeswith more or less lenient deferment policies.
5
rate of inductions after 1969, substantially reduced the incentives for enrolling or staying in college to
avoid the draft. In contrast to the pre-lottery draft, only men with low random sequence numbers were at
any risk of induction: the majority of men had no need to pursue draft avoidance strategies. Moreover,
after age 20, men who had not been called had no need to prolong their stay in college. Evidence
presented below suggests that draft avoidance behavior had little or no effect on the average schooling
outcomes of men born after 1950. Even among men who were assigned low lottery numbers and faced
the highest risk of conscription, Angrist and Krueger (1992) found no indication of elevated schooling
levels relative to those who were assigned higher numbers and faced negligible risk of being drafted.
II. Educational Outcomes of Men and Women
The universal character of the pre-lottery draft constrains the feasible set of evaluation strategies
that can be used to measure its effect on educational outcomes. Since draft avoidance was an essentially
a cohort-wide phenomenon, any evaluation has to rely on differences in education outcomes for cohorts
that were more or less likely to pursue draft avoidance strategies relative to some baseline specification
for these outcomes in the absence of the draft.9 In this paper we make the counterfactual assumption that
the relative schooling choices of men and women would follow a smooth inter-cohort trend in the
absence of gender-specific factors such as the draft. We also assume that draft avoidance was
proportional to the risk of induction faced by a cohort. Under these assumptions, draft avoidance effects
can be measured by regressing the relative education outcomes of men and women in the same cohort on

10Formally, let E(m,c) represent an education outcome measure for men in cohort c, let E(f,c)represent an education outcome measure for women in the same cohort, and let R(c) represent somemeasure of the risk of induction faced by men in cohort c. We assume that
log {E(m,c) / E(f,c)} = g(c) + �R(c) + �(c) ,where g(c) is a smooth trend function of year of birth and �(c) is a residual.
11The data are drawn from the 5 percent public use samples of the 1980 and 1990 Censuses. Weuse 1980 Census data for people born up to 1939, and 1990 Census data for later cohorts. Cohortaverages of college graduation rates for men over age 40 are quite similar in the consecutive Censuses, asare veteran service rates by cohort. College graduation rates for women are about 11 percent higher inthe 1990 Census, even for cohorts over age 40 in 1980. We therefore adjusted the college graduationrates obtained from the 1980 Census for pre-1939 cohorts upward by 11 percent.
12Excluding the three ‘war cohorts’ a third-order polynomial in year of birth explains 99 percentof the inter-cohort variation in male-female relative college rates for cohorts born from 1914 to 1960.
6
a measure of the risk of induction faced by men in the cohort and an inter cohort trend function.10
As an illustration of the potential insights that can be gleaned from a comparison of male and
female relative education outcomes across cohorts, Figure 2 plots the relative graduation rate of white
men versus white women for cohorts born between 1914 and 1960, along with the fraction of men in
each cohort who served in the military.11 The relative graduation rates show an interesting pattern of
deviations between men and women, with ‘spikes’ in the relative graduation rates of men born in the
early 1920s and early 1930s, and a smaller but noticeable upward deflection in the relative graduation
rate of men born in the late 1940s. All three of these departures were associated with a rise in male
veteran rates. The 1920-25 cohort includes men who likely to serve in World War II and were young
enough to easily return to school under the GI Bill program (Bound and Turner, 1999). The 1930-35
cohort includes men who were likely to be drafted during the Korean war and were eligible for GI Bill
benefits (Stanley, 1999). Finally, the 1944-50 cohort includes men who were at high risk of service in
the Vietnam war, and were potentially affected by draft avoidance behavior (as well as the availability of
GI Bill benefits after service). Apart from these three groups, the male-female relative college graduation
rate follows a smooth (hump-shaped) inter-cohort trend.12
Further evidence of the potential value of comparing male and female schooling outcomes is

13The data are from published tabulations of the October Current Population Survey in Bruno andCurry (1996).
14We estimate cohort size using data on the number of 17 year olds in each year from the Digestof Education Statistics (2000, Table 104).
7
presented in Figure 3, which plots enrollment rates of 20-21 year old men and women over the period
from 1960 to 1980.13 These data show that enrollment rates of college-age men and women gradually
converged over the 1960-1980 period, with a deviation in the 1965-71 period coinciding with the
Vietnam-era draft. The peak in the male-female enrollment gap in 1968 represents behavior by
individuals born in 1947-1948 – the same group whose relative college graduation rate is noticeably
above the inter-cohort trend in Figure 2.
To estimate the effect of draft avoidance behavior we have to quantify the extent of this behavior
across different cohorts. In the absence of any direct measures we assume that draft avoidance activities
were proportional to the risk of induction perceived by men in a cohort. Given our focus on the incentive
to stay in college, we use the average number of inductions over the years each cohort was 19 to 22 years
of age divided by an estimate of the size of the cohort as our measure of induction risk.14 Figure 4 plots
this risk measure for cohorts born from 1935 to 1959 along with the fraction of men in the cohort who
actually served in the military. The two series are very highly correlated and show a pattern of declining
risk for cohorts born from 1935 to 1941, followed by a sharp rise and rapid decline associated with the
beginning and end of the Vietnam war. Both the estimated induction risk measure and the rate of
military service peak with the 1946 cohort. Cohorts born after 1953 faced no risk of induction and had
relatively stable military service rates.
Table 2 presents a series of estimated regression models which relate the log of the ratio of male
to female education outcomes for a cohort to a linear inter-cohort trend and our index of induction risk.
We consider three outcomes: the enrollment rate at ages 20-21 (estimated using the Current Population
enrollment rates in Figure 4; the fraction who completed a college degree (estimated from 1990 Census

15These entries are estimated by multiplying the induction risk coefficient by the estimated riskfor the cohort (reported in the footnote of the table), and then multiplying this result by the averageenrollment rate or fraction completed college or with some college for the 1941 cohort to translate theeffect on the log of the outcome into an effect on levels.
8
microdata) and the fraction with at least some college education (also estimated from 1990 Census data).
The three dependent variables are graphed in Figure 5. All three series show steady downward trends,
interrupted by a rise in male schooling for cohorts born in the 1942-50 period. Apart from this feature
the trends are approximately linear: hence, the models in Table 2 include only a linear inter-cohort trend.
As a starting point for our analysis, the models in columns 1, 4 and 7 of Table 2 include a linear
trend and a simple dummy for cohorts born between 1942 and 50, but exclude any measure of induction
risk. Consistent with the data in Figure 5 the estimated coefficients of the 1942-50 cohort dummy are
positive and significant. The models in columns 2, 5 and 8 drop the 1942-50 cohort dummy and add our
induction risk measure. In all three cases the estimated coefficient of the risk variable is positive and
significant, confirming the high degree of correlation between the relative education outcomes of men
and the relative risk of induction. The lower three rows of the table illustrate the implications of the
estimated induction risk effect. The entries are estimates of the percent of men in three cohorts (1941,
1947, and 1951) who were enrolled in school or who completed some college or a college degree as a
result of draft avoidance behavior.15 These estimates suggest that draft avoidance raised enrollment at
ages 20-21 by about 6.5 percentage points for men in the 1947 cohort, raised the fraction with some
college by about 4 percentage points, and raised the fraction with a college degree by just over 2
percentage points.
Finally, the models in columns 3, 6, and 9 of Table 2 include both the induction risk measure and
the dummy for cohorts born between 1942 and 1950. In these models the coefficient of the 1942-50
cohort dummy provides a simple specification check: if the excess relative education of men in these
cohorts is entirely attributable to draft avoidance, and our induction risk measure is valid, then the
16The first Army troops were sent to Vietnam in May 1965: see Carland (2000, chapter 2).
9
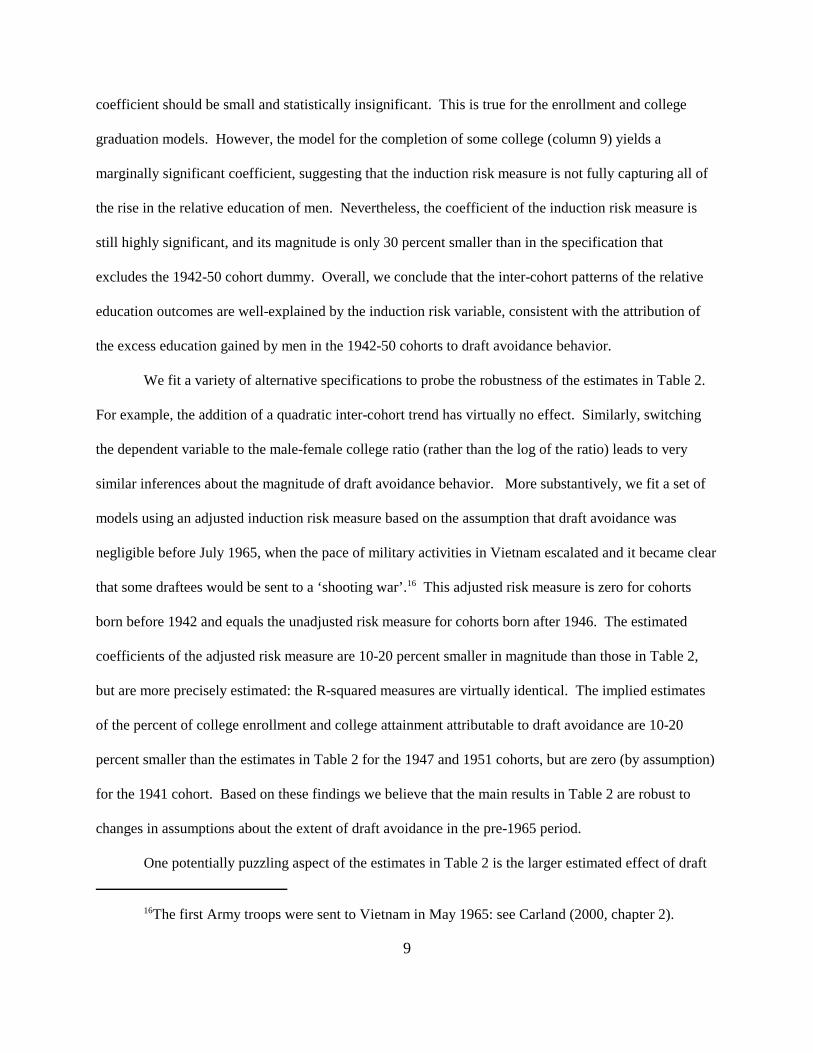
coefficient should be small and statistically insignificant. This is true for the enrollment and college
graduation models. However, the model for the completion of some college (column 9) yields a
marginally significant coefficient, suggesting that the induction risk measure is not fully capturing all of
the rise in the relative education of men. Nevertheless, the coefficient of the induction risk measure is
still highly significant, and its magnitude is only 30 percent smaller than in the specification that
excludes the 1942-50 cohort dummy. Overall, we conclude that the inter-cohort patterns of the relative
education outcomes are well-explained by the induction risk variable, consistent with the attribution of
the excess education gained by men in the 1942-50 cohorts to draft avoidance behavior.
We fit a variety of alternative specifications to probe the robustness of the estimates in Table 2.
For example, the addition of a quadratic inter-cohort trend has virtually no effect. Similarly, switching
the dependent variable to the male-female college ratio (rather than the log of the ratio) leads to very
similar inferences about the magnitude of draft avoidance behavior. More substantively, we fit a set of
models using an adjusted induction risk measure based on the assumption that draft avoidance was
negligible before July 1965, when the pace of military activities in Vietnam escalated and it became clear
that some draftees would be sent to a ‘shooting war’.16 This adjusted risk measure is zero for cohorts
born before 1942 and equals the unadjusted risk measure for cohorts born after 1946. The estimated
coefficients of the adjusted risk measure are 10-20 percent smaller in magnitude than those in Table 2,
but are more precisely estimated: the R-squared measures are virtually identical. The implied estimates
of the percent of college enrollment and college attainment attributable to draft avoidance are 10-20
percent smaller than the estimates in Table 2 for the 1947 and 1951 cohorts, but are zero (by assumption)
for the 1941 cohort. Based on these findings we believe that the main results in Table 2 are robust to
changes in assumptions about the extent of draft avoidance in the pre-1965 period.
One potentially puzzling aspect of the estimates in Table 2 is the larger estimated effect of draft

17The World War II draft had no college deferments: thus going to college to avoid the draft wasnot an issue. College deferments were available during most of the Korean war, and may have led tosome draft avoidance behavior.
10
avoidance on enrollment at ages 20 and 21 than on the likelihood of obtaining some college. We suspect
that this is due to the fact that active military servicemen are excluded from the Current Population
Survey (the source of the enrollment data). At the peak of the Vietnam war, a relatively high fraction of
young men who were not in school were in the military, leading to an upward bias in the CPS enrollment
rate. For example, if an extra 400,000 20-21 year olds were in the military in 1968 (relative to the trend
from 1965 to 1975), the CPS enrollment rate would be upward biased by 11 percent. As a check on the
implication of such a bias, we constructed an adjusted enrollment rate for men which assumes a peak
upward bias of 11 percent in 1968, with no bias before 1965 and none after 1972. We then re-estimated
the models in columns 1-3 of Table 2, and found that the coefficients on the induction risk variable were
reduced in magnitude by about one-half, with the implication that the estimated draft avoidance effects
were about one-half as large as those reported in the table. With this admitted crude adjustment, the
estimated draft avoidance effects on enrollment of 20-21 year olds are comparable to the effects on the
probability of completing some college.
Draft Avoidance or The GI Bill?
As noted in the discussion of Figure 2, men who were at risk of service in World War II and the
Korean war also had elevated relative schooling levels. The effects of these earlier conflicts are generally
attributed to post-service schooling incentives provided by the GI Bill, rather than to draft avoidance.17
Veterans of the Vietnam era were also eligible for GI Bill benefits. In particular, veterans who enrolled
in college or training programs could receive a monthly stipend for up to three years, depending on their
length of service. The monthly stipend in the early 1970s was $220 for a single veteran – about $1000
per month in current dollars – with higher amounts for men with dependent families (see Bound and

18We used the October 1968-70 CPS files to derive this estimate.
11
Turner, 1999, Appendix Table I). Administrative data suggest that a relatively large number of Vietnam
veterans received at least some benefits, raising the possibility that some of the higher relative education
of men who were at high risk of service in the Vietnam war is attributable to post-service GI Bill
benefits, rather than to draft avoidance.
Nevertheless, two key pieces of evidence lead us to conclude that draft avoidance is the main
explanation for the patterns in Figure 5 and the results in Table 2. First, the estimates in Table 2 point to
a significant effect of the risk of induction on enrollment at ages 20 and 21. Although some of the
enrollment of 20-21 year olds is attributable to men who had already completed their military service, in
1968-70 less than 10 percent of this group (and only 5 percent of enrollees) were veterans.18 Thus, most
of the excess enrollment of a 20-21 year old man was attributable to men who had not yet served in the
military. Even after adjusting for the undercount of men in active service, the estimated draft avoidance
effect on enrollment at ages 20 and 21 is about equal to the estimated effect on obtaining some college,
suggesting that most of the extra education gained by men at high risk of induction during the Vietnam
war was gained prior to their military service.
Second, although many Vietnam veterans attended school after their military service, this was
also true of veterans who served before the Vietnam war. Tabulations from the OCG show that about 5.5
percent of veterans born between 1936 and 1938 entered the military without a college degree and
obtained one after. A similar calculation for men in the peak Vietnam cohort (born 1944-47) shows only
about 4 percent completed college after their service. If anything, the rate of post-service degree
attainment was lower for Vietnam-era veterans than for those who served 10 years earlier. Even
assuming a constant rate of post-service degree attainment among veterans, however, the rise and fall in
the fraction of veterans can only explain a tiny fraction of the observed rise and fall in the fraction of men
with a college degree from the late 1930s cohort to the early 1950s cohort.

12
III. Summary
Throughout most of the Vietnam war men who were in college could obtain deferments that
delayed their eligibility for conscription. It was widely believed by contemporaneous observers that
college deferment was an effective means of draft avoidance, and that draft avoidance led to a rise in the
college enrollment rates of young men. We use data on the enrollment and completed education of men
relative to women to estimate the effect of draft avoidance behavior on the education choice of men who
were at high risk of being drafted during the Vietnam war. We find a strong correlation between the risk
of induction faced by a cohort and the relative enrollment and completed education of men. Our
estimates suggest that draft avoidance raised college attendance rates by 4-6 percentage points in the late
1960s, and raised the fraction of men born in the mid-1940s with a college degree by up to 2 percentage
points. While significant, these effects are modest relative to the overall slowdown in the rate of growth
of educational attainment that occurred between cohorts born in the 1940s and those born in the 1950s
(see Card and Lemieux, 2000). The end of conscription is therefore only part of the explanation for the
slowdown in educational trends that affected the baby boom generation. In fact, similar showdowns in
college attendance and completion rates occurred in the United Kingdom and in Canada (Card and
Lemieux, 2001). Other factors such as cohort size effects and changes in the perceived economic returns
to education presumably played a role in depressing college enrollment rates in the late 1960s and
throughout the 1970s.
13
References
Angrist, Joshua D. and Alan B. Krueger. “Estimating the Payoff to Schooling Using the Vietnam-EraDraft Lottery.” National Bureau of Economic Research Working Paper No. 4067. Cambridge, MA:NBER, May 1992.
Bound, John and Sarah Turner. “Going to War and Going to College: Did World War II and the G.I. BillIncrease Educational Attainment for Returning Veterans?” National Bureau of Economic ResearchWorking Paper No. 7452. Cambridge, MA: NBER, December 1999.
Bruno, Rosalind R. and Andrea Curry. School Enrollment - Social and Economic Characteristics ofStudents” October 1994.” U.S. Department of Commerce Bureau of the Census Current PopulationReports P20-487. Washington D.C.: USGPO, September 1996.
Card, David and Thomas Lemieux. “Dropout and Enrollment Trends in the Post-war Period: What WentWrong in the 1970s?” In Jonathan Gruber, editor, An Economic Analysis of Risky Behavior AmongYouth. Chicago: University of Chicago Press, 2000.
Card, David and Thomas Lemieux. “Can Falling Supply Explain the Rising Return to College forYounger Men? A Cohort-Based Analysis.” Quarterly Journal of Economics, (August 2001).
Carland, John M. Combat Operations: Stemming the Tide May 1965 to October 1966. United StatesArmy Center of Miliary History. Washington, D.C.: USGPO, 2000.
Davis, James W. Jr. and Kenneth M. Dolbeare. Little Groups of Neighbors: The Selective ServiceSystem. Chicago: Markham Publishing, 1968.
National Advisory Commission on Selective Service. In Pursuit of Equity: Who Serves When Not AllServe? Washington D.C.: USGPO, 1967.
Stanley, Marcus. “College Education and the Mid-Century G.I. Bills: Effects on Access and EducationalAttainment.” Harvard university Department of Economics Unpublished Manuscript. March 1999.
United States Department of Education. Digest of Education Statistics. Washington D.C.: USGPO,2000.
United States Selective Service. Semiannual Report of the Director of Selective Service. WashingtonD.C.: USGPO, various years.

Appendix Table 1: Number of Inductions by Six-Month Interval, 1960-1973
Period Total Inductions Monthly Rate
1960-1 38,510 6,4181960-2 48,092 8,0151961-1 12,978 2,1631961-2 105,628a 17,605a
1962-1 51,857 8,6431962-2 30,203 5,0341963-1 41,541 6,9241963-2 77,724 12,9541964-1 73,084 12,1811964-2 39,302 6,5501965-1 64,026 10,6711965-2 166,965 27,8281966-1 176,516 29,4191966-2 205,494 34,2491967-1 93,065 15,5111967-2 205,494 34,2491968-1 251,204 41,8671968-2 90,200 15,0331969-1 172,446 28,7411969-2 111,140 18,5231970-1 92,567 15,4281970-2 70,179 11,6971971-1 83,677 13,9461971-2 10,640 1,7731972-1 14,633 2,4391972-2 34,881 5,8141973-1 0 01973-2 0 0
Source: Annual Report of the Director of Selective Service, various issues.
aHigh rate of inductions in the second half of 1961 was a result of the Berlin Crisis.

Table 1: Chronology of Key Events in the Vietnam Draft
August 2, 1964. Gulf of Tonkin incident leads to Congressional authority for expanded military role inSouth Vietnam. Gradual increase in U.S. troop presence in fall 1964 and spring 1965.
August 1965. Public Law 89-152 increases penalties for non-registration and non-compliance with DraftBoard orders. Executive Order 11241 eliminates deferment for married men without children.
Fall 1965. Rapid and sustained increase in inductions, from 8,700/month (average over January 1962-June 1965) to 29,000/month.
July 1966. National Advisory Commission on Selective Service appointed to investigate fairness of thedraft. The Commission’s report (released February 1967) calls for a draft lottery and the elimination of student and occupational deferments.
June 1967. Military Selective Service Act of 1967. Amendments to selective service system eliminatemost deferments for post-graduate education, but retain I-S deferment for high school students and II-Sdeferment for undergraduate students under age 24.
Spring 1968. Rate of induction reaches peak of 42,000/month, with widespread student protests of theVietnam war and the draft.
November 1968. Richard Nixon, who had campaigned for an all-volunteer force, is elected President,and quickly appoints a commission to study the elimination of the draft.
Spring 1969. Nixon proposes the creation of a draft lottery with limited (1-year) period of vulnerability.
November 1969. HR 14001 authorizes a draft lottery, scheduled for December 1969. Executive Order11497 establishes priority for induction, based on lottery numbers, for men age 19-26 as of January 1,1970. Deferments for undergraduate study are retained. Rate of induction in fall 1969 is 19,000 permonth.
April 1970. Executive Order 11527 eliminates all new occupational and family deferments.
July 1970. Second lottery held for men born in 1951, to be inducted in 1971.
August 1971. Third lottery held for men born in 1952, to be inducted in 1972. Rate of induction in fall1971 is 2,000/month.
September 1971. HR 6531 ends all new undergraduate (II-S) deferments.
February 1972. Fourth lottery held for men born in 1953 to be inducted in 1973. Average rate ofinduction in 1972 is 4,100/month.
February 1973. Draft is suspended.
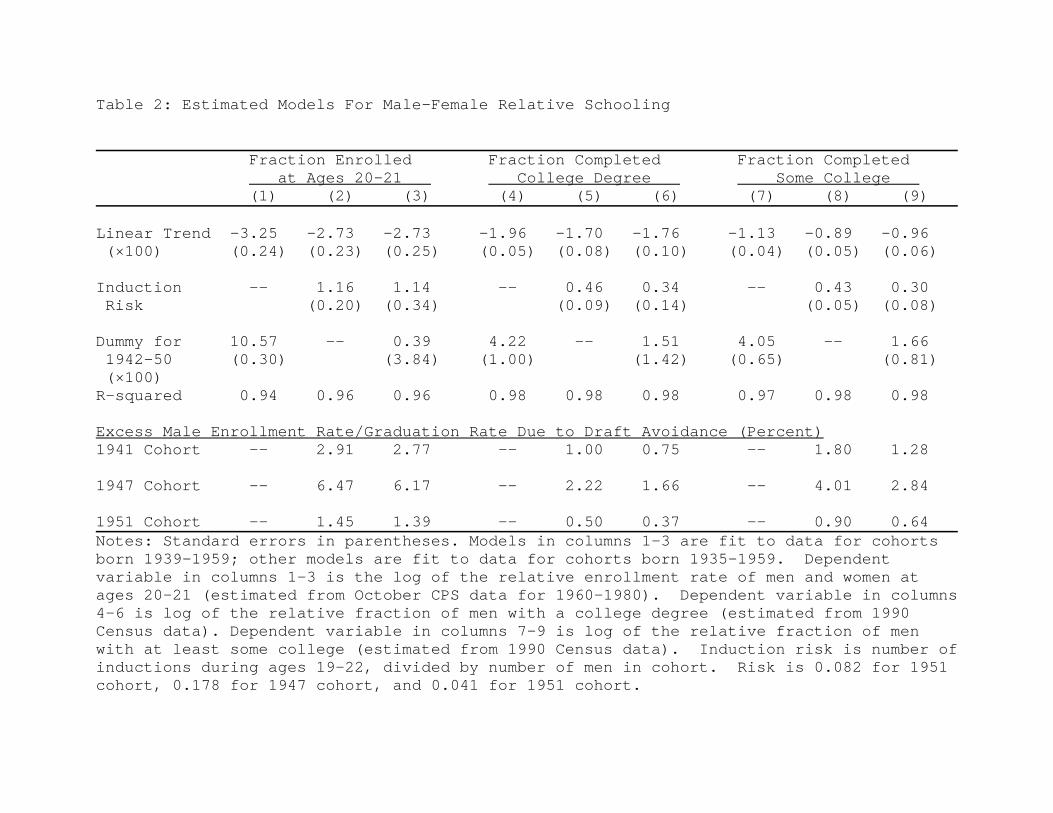
Table 2: Estimated Models For Male-Female Relative Schooling
Fraction Enrolled Fraction Completed Fraction Completed at Ages 20-21 College Degree Some College (1) (2) (3) (4) (5) (6) (7) (8) (9)
Linear Trend -3.25 -2.73 -2.73 -1.96 -1.70 -1.76 -1.13 -0.89 -0.96 (×100) (0.24) (0.23) (0.25) (0.05) (0.08) (0.10) (0.04) (0.05) (0.06)
Induction -- 1.16 1.14 -- 0.46 0.34 -- 0.43 0.30 Risk (0.20) (0.34) (0.09) (0.14) (0.05) (0.08)
Dummy for 10.57 -- 0.39 4.22 -- 1.51 4.05 -- 1.66 1942-50 (0.30) (3.84) (1.00) (1.42) (0.65) (0.81) (×100)R-squared 0.94 0.96 0.96 0.98 0.98 0.98 0.97 0.98 0.98
Excess Male Enrollment Rate/Graduation Rate Due to Draft Avoidance (Percent)1941 Cohort -- 2.91 2.77 -- 1.00 0.75 -- 1.80 1.28
1947 Cohort -- 6.47 6.17 -- 2.22 1.66 -- 4.01 2.84
1951 Cohort -- 1.45 1.39 -- 0.50 0.37 -- 0.90 0.64Notes: Standard errors in parentheses. Models in columns 1-3 are fit to data for cohortsborn 1939-1959; other models are fit to data for cohorts born 1935-1959. Dependentvariable in columns 1-3 is the log of the relative enrollment rate of men and women atages 20-21 (estimated from October CPS data for 1960-1980). Dependent variable in columns4-6 is log of the relative fraction of men with a college degree (estimated from 1990Census data). Dependent variable in columns 7-9 is log of the relative fraction of menwith at least some college (estimated from 1990 Census data). Induction risk is number ofinductions during ages 19-22, divided by number of men in cohort. Risk is 0.082 for 1951cohort, 0.178 for 1947 cohort, and 0.041 for 1951 cohort.
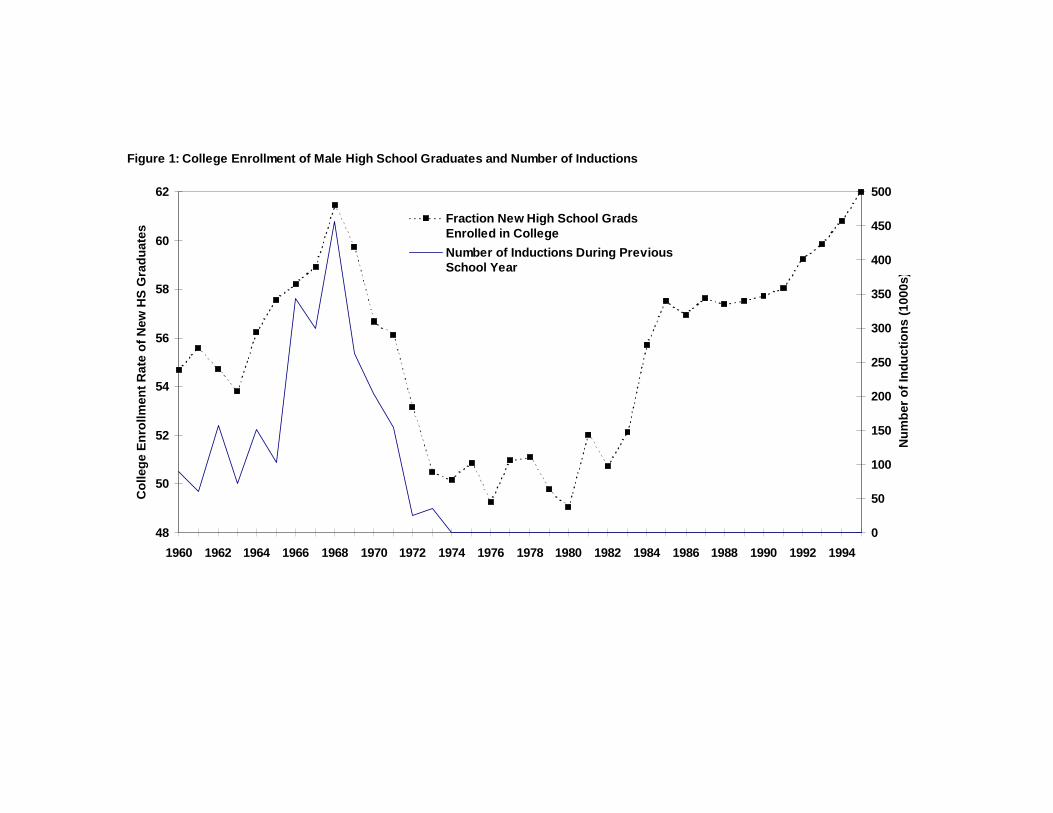
Figure 1: College Enrollment of Male High School Graduates and Number of Inductions
48
50
52
54
56
58
60
62
1960 1962 1964 1966 1968 1970 1972 1974 1976 1978 1980 1982 1984 1986 1988 1990 1992 1994
Col
lege
Enr
ollm
ent R
ate
of N
ew H
S G
radu
ates
0
50
100
150
200
250
300
350
400
450
500
Num
ber
of In
duct
ions
(10
00s
)
Fraction New High School GradsEnrolled in College
Number of Inductions During PreviousSchool Year
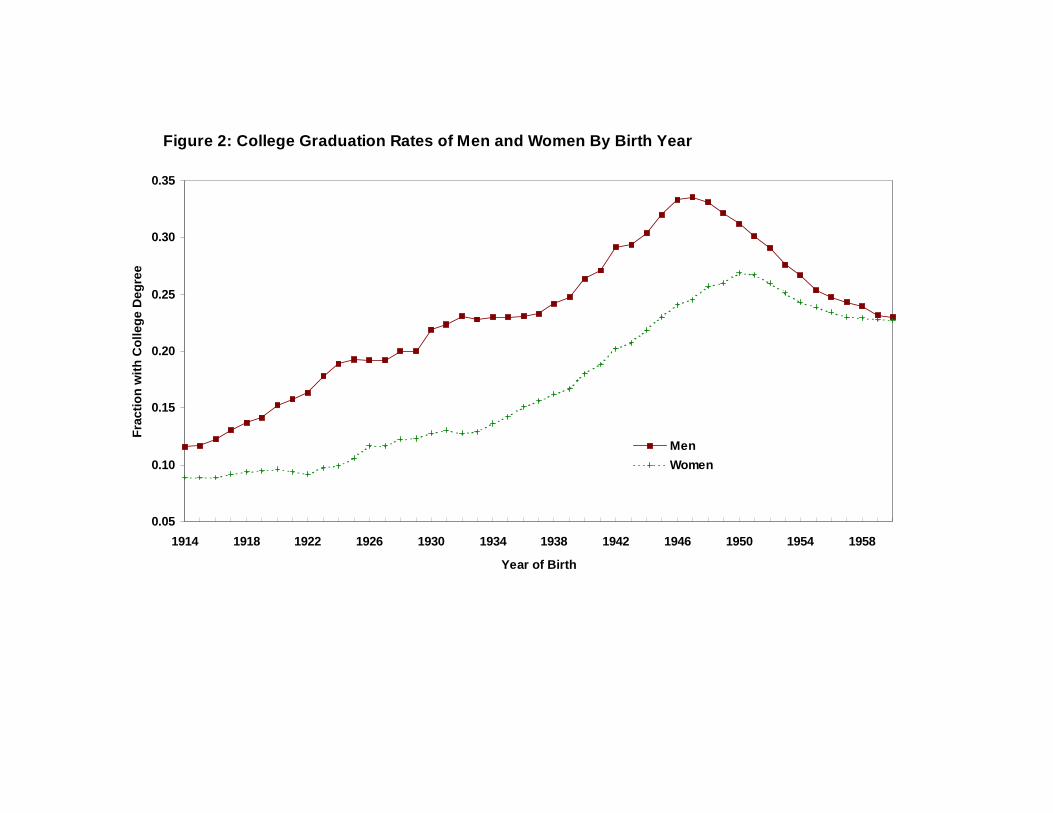
Figure 2: College Graduation Rates of Men and Women By Birth Year
0.05
0.10
0.15
0.20
0.25
0.30
0.35
1914 1918 1922 1926 1930 1934 1938 1942 1946 1950 1954 1958
Year of Birth
Fra
ctio
n w
ith C
olle
ge D
egre
e
Men
Women

Figure 3: Male-Female College Ratio Versus Male Veteran Rate
0.9
1.1
1.3
1.5
1.7
1.9
1914 1918 1922 1926 1930 1934 1938 1942 1946 1950 1954 1958
Year of Birth
Mal
e-F
emal
e C
olle
ge R
atio
0.0
0.1
0.2
0.3
0.4
0.5
0.6
0.7
0.8
0.9
Mal
e V
eter
an R
ate
Male/Female College Ratio
Male Veteran Rate

Figure 4: Enrollment Rates of 20-21 Year Old Men and Women, 1960-1980
10
15
20
25
30
35
40
45
50
1960 1962 1964 1966 1968 1970 1972 1974 1976 1978 1980
Enr
ollm
ent R
ate
Men
Women
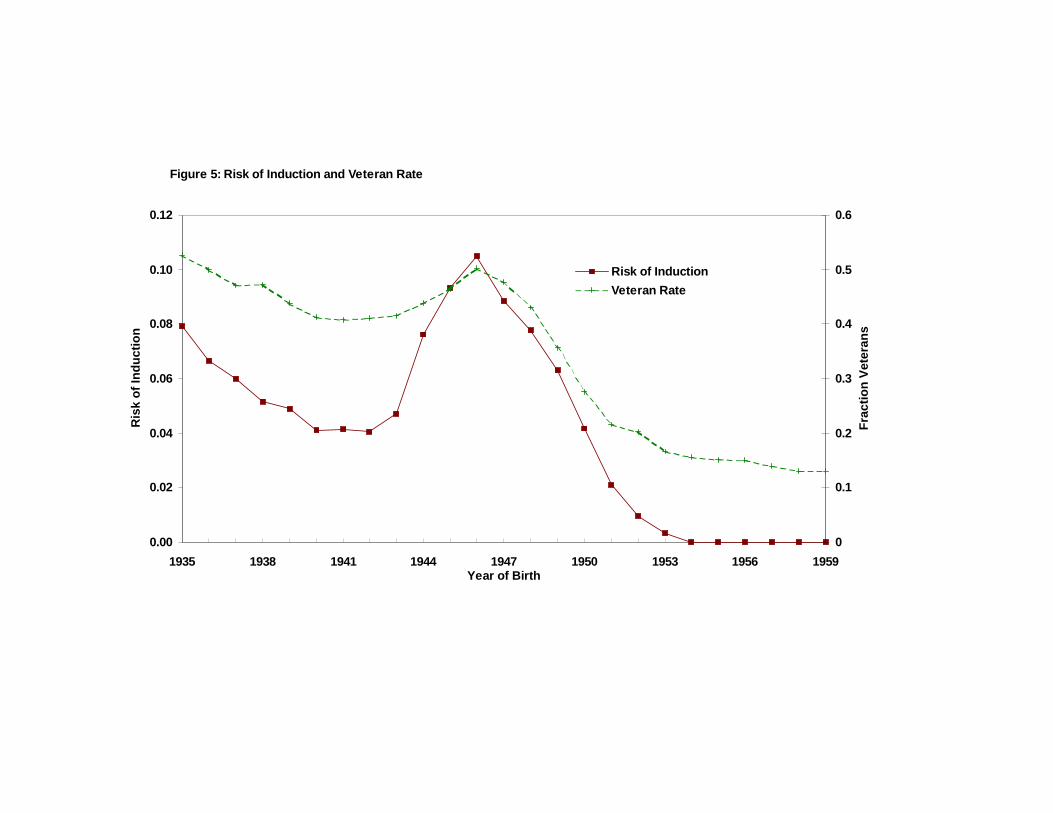
Figure 5: Risk of Induction and Veteran Rate
0.00
0.02
0.04
0.06
0.08
0.10
0.12
1935 1938 1941 1944 1947 1950 1953 1956 1959Year of Birth
Ris
k of
Indu
ctio
n
0
0.1
0.2
0.3
0.4
0.5
0.6
Fra
ctio
n V
eter
ans
Risk of Induction
Veteran Rate

Figure 6: Male-Female Relative Schooling Outcomes, by Cohort
-0.2
-0.1
0.0
0.1
0.2
0.3
0.4
0.5
0.6
0.7
0.8
1935 1937 1939 1941 1943 1945 1947 1949 1951 1953 1955 1957 1959Year of Birth
Log
of M
ale-
Fem
ale
Rat
io
Relative Enrollment Rate Ages 20-21
Relative College Graduation Rate
Relative Fraction with Some College
Dashed line=linear interpolation from 1941 to 1951
Related Documents


![sole [Read-Only]cle.berkeley.edu/DC_SOLE/sole.pdf · SOLE . HorLL R . Examples of Policies Health Care Reform • Taxes • Subsidies Financial Regulatory Reform • Insurance Capital](https://static.cupdf.com/doc/110x72/5fabc4cb348980287c12b6ae/sole-read-onlycle-sole-horll-r-examples-of-policies-health-care-reform-a.jpg)