Hybrid Packet/Fluid Flow Network Simulation Cameron Kiddle, Rob Simmonds, Carey Williamson, and Brian Unger kiddlec,simmonds,carey,unger @cpsc.ucalgary.ca Department of Computer Science University of Calgary Calgary, Alberta, Canada Abstract P acket-l evel discrete-event network simulators use an event to model the movement of each packet in the network. This results in accu rate models , but require s that many events are executed to simulate large, high bandwidth net- works. Fluid-based networ k simulators abstract the model to conside r only changes in rates of traffic flows. This can res ult in lar ge perf orman ce advan tag es, thoug h info rmat ion about the individu al pac kets is lost makin g this appr oach in- appropriate for many simulation and emulation studies. Thi s paper pr ese nts a hyb rid mod el in whic h pac ket flows and fluid flows coexist and interact. This enables studies to be performed with background traffic modeled using fluid flows and foreground traffic modeled at the packet level. Results presented show up to 20 times speedup using this technique. Accuracy is within 4% for latency and 15% for jitter in many cases. Keywords: Network Simulation, Simulation Abstracti on T echniques, Fluid Simulation, Scalable Network Simulation 1. Introducti on Disc rete-event network simu lato rs often mode l traf fic at the pack et le ve l, wit h an ev ent being use d to repre- sent packet arrivals or departures from network devices or buffers. This can lead to accurate models. However, when simu lati ng larg e networks and high bandwidt h link s, the computational cost of processing the resulting huge num- ber of events representing the traffic as packet flows can be prohibitive . When simulators are used within real-time network emul atio n env ironments , this cost sev erel y rest rict s the size and type of network that can be modeled. Para llel disc rete -ev ent simulation (PDES) techn iques can increase model scalability, i.e., the size of network and the traffic densities that can be executed in real-time. Mod- eling larger bandwidth links is less amenable to paralleliza- tion techniques due to the sequential nature of each packet flow at each network por t. Ther efor e, model abstra ctio n techniques are required to simulate large traffic flows. Fluid -based model ing can be used to simp lify traffi c flows in a network simulat ion [2, 3, 4, 8, 9]. Wi th a fluid model, events are only generated when the rate of a flow changes. If the flows change rate infrequently, large perfor- mance gains can be achieved using this technique. Since model detail is reduced, the level of accuracy of the simu- lation results obtained using this abstraction technique will not be as high as when packet-level simulation is used. As with all abstraction techniques, the appropriateness of the method depends on the simulation requirements. One problem with fluid models is that information about indi vidua l packets is lost . There fore , they canno t be used for simulations studying subtle protocol dynamics on indi- vidual flows. They can also not be used for simulators that act as components of network emulation systems that inter- act with real applications running on real networks. These real applications communicate using individual packets, so a simulator interacting with them must handle individual packets. One approach to maintaining packet information while reducing the overall traffic modeling cost is to use hybrid simulators that handle both packet and fluid flows [5, 11, 13]. Tra ffic flows that must carry the full packe t info rma- tion are modeled using an event for each packet arrival or departure while background flows, for which less detailed info rmat ion is required , are modele d using fluid flows . A challenge faced by t hese systems is accurately modeling the interactions between packet flows and fluid flows. This paper describes the design of a hybrid model that has been implemented within a parallel IP packet-level net- work simulator called the Internet Protocol Traffic and Net- work (IP-TN) simulator [12]. This simulator forms the ba- sis of the IP-TNE network emulation system making it es- sential that abstracti on techniques employed do not prohibit the modeling of individual packets. Results are presented showing the performance and accuracy achieve d. The rest of the paper is laid out as follows. Section 2 de- scribes related work in the area. Section 3 describes the de-

Welcome message from author
This document is posted to help you gain knowledge. Please leave a comment to let me know what you think about it! Share it to your friends and learn new things together.
Transcript
8/3/2019 University of Calgary - Hybrid Packet-Fluid Flow Network Simulation
http://slidepdf.com/reader/full/university-of-calgary-hybrid-packet-fluid-flow-network-simulation 1/10
Hybrid Packet/Fluid Flow Network Simulation
Cameron Kiddle, Rob Simmonds, Carey Williamson, and Brian Unger kiddlec,simmonds,carey,unger @cpsc.ucalgary.ca
Department of Computer Science
University of Calgary
Calgary, Alberta, Canada
Abstract
Packet-level discrete-event network simulators use an
event to model the movement of each packet in the network.
This results in accurate models, but requires that many
events are executed to simulate large, high bandwidth net-works. Fluid-based network simulators abstract the model
to consider only changes in rates of traffic flows. This can
result in large performance advantages, though information
about the individual packets is lost making this approach in-
appropriate for many simulation and emulation studies.
This paper presents a hybrid model in which packet flows
and fluid flows coexist and interact. This enables studies to
be performed with background traffic modeled using fluid
flows and foreground traffic modeled at the packet level.
Results presented show up to 20 times speedup using this
technique. Accuracy is within 4% for latency and 15% for
jitter in many cases.
Keywords: Network Simulation, Simulation AbstractionTechniques, Fluid Simulation, Scalable Network Simulation
1. Introduction
Discrete-event network simulators often model traffic
at the packet level, with an event being used to repre-
sent packet arrivals or departures from network devices or
buffers. This can lead to accurate models. However, when
simulating large networks and high bandwidth links, the
computational cost of processing the resulting huge num-
ber of events representing the traffic as packet flows can
be prohibitive. When simulators are used within real-timenetwork emulation environments, this cost severely restricts
the size and type of network that can be modeled.
Parallel discrete-event simulation (PDES) techniques
can increase model scalability, i.e., the size of network and
the traffic densities that can be executed in real-time. Mod-
eling larger bandwidth links is less amenable to paralleliza-
tion techniques due to the sequential nature of each packet
flow at each network port. Therefore, model abstraction
techniques are required to simulate large traffic flows.
Fluid-based modeling can be used to simplify traffic
flows in a network simulation [2, 3, 4, 8, 9]. With a fluid
model, events are only generated when the rate of a flow
changes. If the flows change rate infrequently, large perfor-
mance gains can be achieved using this technique. Since
model detail is reduced, the level of accuracy of the simu-
lation results obtained using this abstraction technique will
not be as high as when packet-level simulation is used. As
with all abstraction techniques, the appropriateness of the
method depends on the simulation requirements.
One problem with fluid models is that information about
individual packets is lost. Therefore, they cannot be used
for simulations studying subtle protocol dynamics on indi-
vidual flows. They can also not be used for simulators that
act as components of network emulation systems that inter-
act with real applications running on real networks. These
real applications communicate using individual packets, soa simulator interacting with them must handle individual
packets.
One approach to maintaining packet information while
reducing the overall traffic modeling cost is to use hybrid
simulators that handle both packet and fluid flows [5, 11,
13]. Traffic flows that must carry the full packet informa-
tion are modeled using an event for each packet arrival or
departure while background flows, for which less detailed
information is required, are modeled using fluid flows. A
challenge faced by these systems is accurately modeling the
interactions between packet flows and fluid flows.
This paper describes the design of a hybrid model that
has been implemented within a parallel IP packet-level net-work simulator called the Internet Protocol Traffic and Net-
work (IP-TN) simulator [12]. This simulator forms the ba-
sis of the IP-TNE network emulation system making it es-
sential that abstraction techniques employed do not prohibit
the modeling of individual packets. Results are presented
showing the performance and accuracy achieved.
The rest of the paper is laid out as follows. Section 2 de-
scribes related work in the area. Section 3 describes the de-

8/3/2019 University of Calgary - Hybrid Packet-Fluid Flow Network Simulation
http://slidepdf.com/reader/full/university-of-calgary-hybrid-packet-fluid-flow-network-simulation 2/10
sign of the hybrid model. Section 4 presents the experimen-
tal methodology and Sections 5 and 6 present the results.
Conclusions and future work are presented in Section 7.
2. Related Work
The accuracy and/or performance of fluid-based tech-niques for network simulation have been examined in [2,
3, 4, 8, 9]. Reasonable accuracy has been achieved along
with considerable performance improvement under certain
circumstances. Compared to packet-level simulation, the
largest performance gains are achieved with small networks
and cases where the number of packets represented is much
larger than the number of rate changes. For larger networks,
a property described as the ripple effect can reduce the per-
formance advantage in the fluid-based simulator. The ripple
effect describes the situation where the propagation of rate
changes leads to rate changes in other flows which then need
to be propagated.
On/Off sources are commonly used as traffic models inthe fluid simulation literature. The use of these models
makes it easy to study accuracy and performance issues.
Some work has involved the use of fluid-based TCP mod-
els [6, 7].
The hybrid technique in which packet flows and fluid
flows are integrated is a recent development. An extension
adding fluid models to the QualNet simulator is presented
in [13]. QualNet is the commercial version of Global Mo-
bile Information System Simulator (GloMoSim) [14]. The
simulated system is divided into components that model at
the packet level and components that use analytical fluid-
based models. The fluid-based components calculate delays
and loss of traversing packet flows and pass this informationto the destination packet modeling components.
The Hybrid Discrete-Continuous Flow Network Simula-
tor (HDCF-NS) [5] also enables packet flows andfluid flows
to coexist. The manner in which fluid flows are modeled is
described in detail, but little information is given on how
the packet and fluid flows interact.
A third hybrid approach is described in [11]. This uti-
lizes two simulators that interact via the Georgia Tech Run-
time Infrastructure Kit (RTIKIT) [1]. The HDCF-NS sim-
ulator is used to simulate the background fluid flows and
the parallel and distributed ns (pdns) simulator [10] is used
to simulate the packet flows. Messages are sent to pdns
from HDCF-NS via RTIKIT whenever fluid changes occur.
Packet loss and queuing delay in pdns are based on both
packet and fluid levels. The system currently does not al-
low packet flows to affect fluid flows.
3. Hybrid Implementation
The hybrid scheme presented in this paper is similar to
the one used in HDCF-NS since it combines packet and
fluid discrete-event models in a single simulator. However,
little information is given in [5] on the hybrid implemen-
tation details of HDCF-NS. QualNet differs from our ap-
proach in that different sections of the network support ei-
ther fluid or packet flows but not both. Also the fluid sec-
tions use an analytical model instead of a discrete-event
model. The approach using both HDCF-NS and pdns dif-fers from the approach taken here in that multiple simulators
are used and packet flows cannot affect background fluid
flows.
The approach taken in this paper adds fluid modeling to
the IP-TN simulator by adding a new type of output buffer
at network links. This hybrid buffer must be able to pro-
cess packets and fluid advertisements. A fluid advertise-
ment specifies a rate change for a particular fluid flow. It is
possible for a packet and multiple advertisements to be sent
at the same time; in this case they are represented by a single
event. The IP routing lookup was modified to demultiplex
packets and advertisements that arrive together.
The hybrid buffer models a FIFO queue that operates in
one of three modes: packet mode , fluid mode or hybrid
mode . Initially, the mode of the buffer is undefined. If a
buffer first receives a packet, it enters packet mode and re-
mains in packet mode as long as it only processes packets.
If a buffer first receives a fluid advertisement, it enters fluid
mode and remains in fluid mode as long as it only processes
fluid advertisements. A buffer switches to hybrid mode if
it is in packet mode and receives a fluid advertisement or if
it is in fluid mode and receives a packet. Currently, once
a buffer switches into hybrid mode, it remains in hybrid
mode for the remainder of the simulation. The hybrid buffer
modes are described in the following sections.
3.1. Packet Mode
Operation of the hybridbuffer in packet mode is depicted
in Figure 1, where Ü ́ Ø µ is the buffer usage at time Ø , Ü
is
the maximum buffer capacity and
is the buffer service
rate, which is the bandwidth of the outgoing link. If there is
xC 0 00 01 11 10 00 01 11 1 00001111000011110000111100001111x(t)
λ
Figure 1. Hybrid buffer in packet mode.
insufficient space in the buffer, the packet is dropped when
it arrives. Otherwise, the packet is added to the buffer and
the arrival time at the next node calculated based on queu-
ing delay, transmission delay and propagation delay. A new
event to represent the packet is generated and dispatched to
the next node in the network.

8/3/2019 University of Calgary - Hybrid Packet-Fluid Flow Network Simulation
http://slidepdf.com/reader/full/university-of-calgary-hybrid-packet-fluid-flow-network-simulation 3/10
3.2. Fluid Mode
In fluid mode, state is maintained for each fluid flow in-
dicating its advertised incoming rate«
́ Ø µ
, advertised out-
going rate ¬
́ Ø µ and loss rate Ð
́ Ø µ at time Ø . Other state
maintained by the buffer includes the aggregate input rate
« ́ Ø µ , the aggregate output rate ¬ ́ Ø µ , the aggregate loss rate
Ð ́ Ø µ
, the buffer usageÜ ́ Ø µ
, the buffer capacityÜ
and the
buffer service rate , which is the bandwidth of the outgo-
ing link. Operation of the buffer in fluid mode is depicted
in Figure 2.
xC
α(t)
x(t)
λ
(t)β
l(t)
Figure 2. Hybrid buffer in fluid mode.
When a fluid advertisement(s) arrives at time Ø , the buffer
usage, packet loss, the new aggregate input rate and output
flow rates are calculated. The buffer usage Ü ́ Ø µ is calculated
as follows:
Ü ́ Ø µ Ü ́ Ø
Ð
µ · ́ « ́ Ø
Ð
µ µ £ ́ Ø Ø
Ð
µ
where Ø
Ð
is the time at which the last fluid advertisements
arrived. If the calculated value of Ü ́ Ø µ ¼ then Ü ́ Ø µ is set
to be 0. If the calculated value of Ü ́ Ø µ Ü
thenÜ ́ Ø µ
is
set to be Ü
. Loss rates and output rates of individual flows
at timeØ
are calculated afterÜ ́ Ø µ
has been determined as
follows:
1. (Underload/Empty) if « ́ Ø µ and Ü ́ Ø µ ¼ then
¬
́ Ø µ «
́ Ø µ
andÐ ́ Ø µ ¼
.
2. (Underload/Draining) if « ́ Ø µ and ¼ Ü ́ Ø µ Ü
then ¬
́ Ø µ
«
́ Ø µ
« ́ Ø µ
¢ and Ð ́ Ø µ ¼ . (Note that an
event must be generated for the predicted time that the
buffer will empty, so output rates can be re-advertised.)
3. (Overload/Filling) if « ́ Ø µ
and¼ Ü ́ Ø µ Ü
then ¬
́ Ø µ
«
́ Ø µ
« ́ Ø µ
¢
andÐ ́ Ø µ ¼
. (Note that an
event does not need to be generated for the predicted
time that the buffer will become full, as the output rates
of the flows will remain the same. Packet loss can be
determined upon arrival of the next set of fluid adver-
tisements.)
4. (Overload/Loss) if « ́ Ø µ
andÜ ́ Ø µ Ü
then
¬
́ Ø µ
«
́ Ø µ
« ́ Ø µ
¢ , Ð ́ Ø µ « ́ Ø µ and Ð
́ Ø µ
«
́ Ø µ
« ́ Ø µ
¢ Ð ́ Ø µ
.
For each flow in which the output rate changed, a fluid
advertisement is created. The next hop arrival time of the
fluid advertisements is calculated based on queuing and the
propagation delay of the link. An event is then generated to
signal the arrival of the fluid advertisements at the next hop
at the time calculated. Note that transmission delay is not
included in the calculation of the arrival time. Characteriz-
ing the transmission delay is difficult since different flows
may have different packet sizes. Usually, propagation delayis significantly larger than transmission delay and therefore
should not introduce much inaccuracy.
3.3. Hybrid Mode
In hybrid mode, a single buffer that operates in a simi-
lar way as the buffer in fluid mode is used. As both packet
flows and fluid flows are handled, it is important that packet
flow levels affect fluid flow levels and vice versa. This is
achieved by estimating the aggregate input rate of packet
flows«
Ô
́ Ø µ
and adding this to the aggregate input rate of
fluid flows «
́ Ø µ to get the overall aggregate input rate « ́ Ø µ .
An output rate is not advertised for the packet flows so there
is only an aggregate outputrate of fluid flows ¬
́ Ø µ . The op-
eration of the buffer in hybrid mode can be seen in Figure 3.
xC 0 00 01 11 1α (t)f
α (t)p0 00 01 11 1 x(t)
λ
l(t)
(t)f β
Figure 3. Hybrid buffer in hybrid mode.
The process and calculations involved for handling fluid
advertisements is the same as for fluid mode except that thecurrent value for «
Ô
́ Ø µ is included as part of « ́ Ø µ . Fluid
advertisements are sent for all fluid flows with rate changes.
Each time a packet arrives, a new«
Ô
estimate is calcu-
lated. The estimate is based on a sliding window of the last
packets that have arrived. It is calculated by taking the
sum of the size of the last packets and dividing it by the
time interval in which the last
packets arrived. Other
rate estimation algorithms based on exponentially weighted
moving averages and time windows were explored but were
found to be too sensitive to parameter settings.
Once the new«
Ô
estimate has been calculated it is com-
pared with the current «
Ô
. If the difference between the
new estimate and the current rate is greater than a thresh-old percentage, then the current rate is set to the new esti-
mate. Modifying«
Ô
each time a packet arrives could lead
to a greater impact from the ripple effect in fluid flows. The
threshold value allows for some control in balancing accu-
racy and performance.
Each time «
Ô
is modified, a timeout event is generated.
This allows «
Ô
to be reset to zero during a period when no
packets are arriving. The timeout is set to occur when it is
8/3/2019 University of Calgary - Hybrid Packet-Fluid Flow Network Simulation
http://slidepdf.com/reader/full/university-of-calgary-hybrid-packet-fluid-flow-network-simulation 4/10
expected that
packets will have arrived according to the
current «
Ô
. When the timeout occurs, «
Ô
is set to zero if no
packets arrived since the timeout was generated. Otherwise,
a new timeout is generated in the same manner as before.
The next time a packet arrives, the last
packets are still
used in the «
Ô
estimation.
For each packet arrival, buffer usage is calculated as influid mode. Loss in fluid flows, the aggregate input rate and
new output rates of fluid flows are calculated if «
Ô
was mod-
ified, or if the packet arrived with fluid advertisements. If
the buffer is full, the packet is lost with probability ́ « µ
«
,
which is the same proportion in which fluid flows lose pack-
ets. If the packet is not lost, it is sent along with any fluid
advertisements that may have been created due to a change
in «
Ô
. The arrival time at the next network node is calcu-
lated based on the queuing delay and propagation delay as
is done in fluid mode.
Since fluid modeling principles are used, the transmis-
sion delay of a packet is ignored. Also, if two packets were
to arrive at the buffer at the same time, they would both ar-
rive at the next network node at the same time. To account
for transmission delays and queuing among packet flows,
an alternative solution with two buffers could be used. One
buffer could handle packets and the other buffer could han-
dle fluid flows. Effects of fluid flows on packet flows could
be modeled by adjusting buffer usage of the packet buffer
based on the amount of data arriving from fluid flows. An
estimate of the aggregate input rate of packet flows could be
used to affect the output rates and loss of the fluid flows.
The alternative solution could potentially lead to more
accurate results, but would be difficult to implement effi-
ciently. Buffer usage in the two buffers could differ andthis could result in events that signal arrivals of packets and
fluid advertisements being sent out of arrival time order.
IP-TN uses conservative parallel discrete-event simulation
techniques, which require that events sent between nodes
are received in arrival time order. To achieve this, the al-
ternative solution would require two events, instead of just
one event, to be generated each time a packet or set of fluid
advertisements is to be sent. One event would be used to
signal the actual sending of the packet or set of fluid ad-
vertisements. The other event would be used to signal the
arrival of the packet or set of fluid advertisements at the next
hop. The send events would be processed in send time or-
der ensuring that arrival events are received in arrival timeorder.
4. Experimental Methodology
This section describes the methodology for the simula-
tion experiments, including the experimental environment,
network model, experimental design, and performance met-
rics.
4.1. Experimental Environment
Simulation experiments were conducted on an 8-
processor Compaq Proliant server with 700 MHz Intel PIII
Xeon processors and 4 GB RAM. The Proliant was run-
ning RedHat Linux 7.3 with the v2.4.18 kernel. The GNU
g++ V2.96 compiler was used with the -O2 optimizationflag. Tests were run using sequential execution on one pro-
cessor to examine effects of just the hybrid model without
interference from the effects of parallelism. In runs compar-
ing packet and hybrid simulations, identical random number
seeds were used.
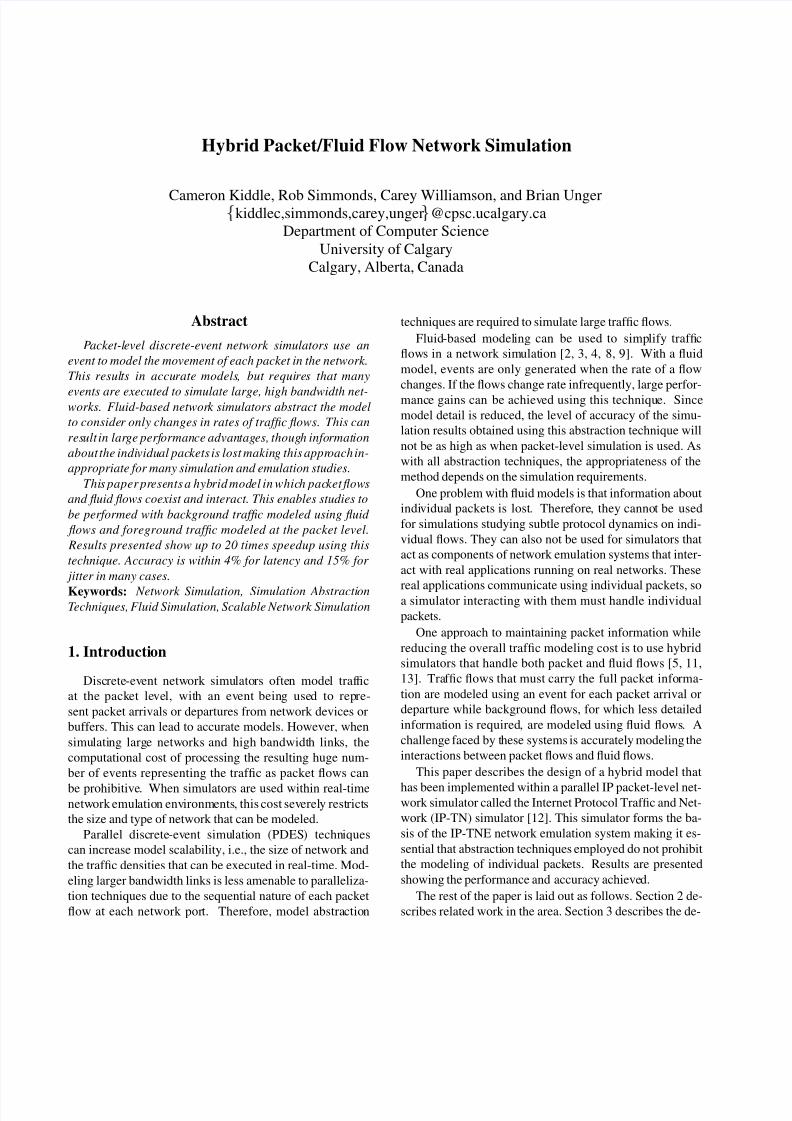
4.2. Network Model
The network model used for the simulation experiments
is shown in Figure 4. This model is a variation of the clas-
sic “tandem” network model, but with bi-directional links.
With this model, we can test the performance and the ac-
curacy of our hybrid simulation methodology as the size of
the network and the number of traffic flows are varied.
Figure 4. Simulated network model.
Three main parameters characterize the network model:
à , Ä , and Æ . à is the number of foreground flows in the
network. These flows traverse the entire backbone of the
network, from end to end. Ä is the number of background
flows on each link in the network backbone. One of the
background flows traverses the entire network. The other
background flows each traverse only a single link in the net-
work backbone. The total number of traffic flows on any
given backbone link isÅ Ã · Ä
. TheseÅ
flows com-
pete for resources on the network (i.e., for network band-width, and for the buffers at the router output queues).
Æ
is the number of links (router hops) in the backbone of the
network. In particular, Æ is the number of queues at which
flows interact and compete for resources.
The details of the network topology model are as fol-
lows. Links from the traffic sources to routers have a 1 mil-
lisecond propagation delay and 10 Mbps transmission ca-
pacity, as do the links from routers to the traffic sinks. Each
8/3/2019 University of Calgary - Hybrid Packet-Fluid Flow Network Simulation
http://slidepdf.com/reader/full/university-of-calgary-hybrid-packet-fluid-flow-network-simulation 5/10
link in the network backbone has a 5 millisecond propaga-
tion delay and transmission capacity Mbps. This capacity
is set to achieve different target levels of offered network
load in the experiments. Output buffers on routers have a
maximum size that corresponds to 20 milliseconds of queu-
ing delay for a link capacity of Mbps.
In our experiments, the foreground flows are alwaysmodeled as packet flows. The background flows are mod-
eled either as fluid flows or as packet flows, depending on
the simulation experiment.
4.3. Traffic Source Models
Two different types of traffic source models are used in
the experiments: open-loop and closed-loop. An open-loop
model generates traffic according to its statistical parame-
ters, independent of the state of the network. That is, there
is no feedback control in the model. All traffic moves uni-
directionally from source to sink in our network model. A
closed-loop model has a built-in feedback loop for trafficcontrol. Data packets flow from source to sink in our net-
work model, while acknowledgment packets traverse the re-
verse route.
The open-loop source model used is an Exponential
On/Off traffic source. In the On state, the source generates
traffic at a specified peak rate of 5 Mbps. In the Off state,
no traffic is generated. The sojourn times in each state are
drawn independently from an exponential distribution with
a specified mean. In our model, each source spends (on av-
erage) 50% of the time in each state with a resulting mean
rate of 2.5 Mbps. During each On period, an average of 100
packets of size 576 bytes are generated. Both packet-based
and fluid-based versions of this model exist in IP-TN.The closed-loop source model used is a simulated ver-
sion of TCP Reno. This protocol model includes TCP’s
three-way handshake, sequence numbers, acknowledg-
ments, sliding window flow control, slow-start, congestion
avoidance, timeouts, and retransmissions. In particular,
each TCP source transmits packets according to TCP’s flow
control and congestion control algorithms. Only a packet-
based version of this model exists in IP-TN at this time.
4.4. Experimental Design
Table 1 summarizes the experimental factors and levels
used in the experiments. A multi-factorexperimentaldesign
is used. For space reasons, only a subset of these experi-
ments appear in the paper. Packet rate estimation algorithm
parameter values of ½ ¼ , ½ ¼ and Ø Ö × Ó Ð ½ ±
were used.
4.5. Performance Metrics
The performance metrics fall into two main categories:
metrics for simulation execution-time performance, and
Table 1. Experimental factors and levels forsimulation experiments.
Factor Levels
Foreground Flows à 1, 2, 4
Background Flows Ä 2, 4, 8, 16, 32Router Hops Æ 1, 2, 4, 8, 16
Traffic Flow Type Open-loop, Closed-loop
Background Flow Model Packet, Fluid
Network Load Light(25%), Medium(70%),
Heavy(100%)
metrics for quantifying the results of the network simula-
tion. The latter network-centric metrics are used to assess
the accuracy of the hybrid simulation results compared to
the packet simulation results.
The metric used for simulation execution-time perfor-
mance is relative speedup. This is defined as the ratio of
the execution time for the packet simulation to the execu-
tion time for the hybrid simulation. Higher values of this
metric indicate performance advantages for the hybrid sim-
ulation.
The metrics used for assessing network-level perfor-
mance include the mean end-to-end packet transfer latency
and the jitter (e.g., standard deviation) of the end-to-end
packet transfer latency. For simplicity, these performance
metrics are calculated for only one of the foreground traffic
flows in the network, called the primary flow. The results
then focus on the relative error in these metrics for the pri-
mary flow in the hybrid simulation. That is, we express thelatency results from the hybrid simulation as a percentage
difference from the latency results for the packet simula-
tion. A similar calculation applies for the jitter metric.
The experiments with the closed-loop TCP traffic model
use one additional metric, namely the TCP transfer dura-
tion. This metric represents the elapsed time between re-
ceiving the first byte and the last byte of a TCP data transfer.
This metric is used to assess the cumulative modeling error
over the duration of a multi-packet TCP transfer.
5. Results for Open-Loop Traffic
The first set of simulation experiments studies the perfor-mance and the accuracy of the hybrid implementation using
open-loop traffic. Identical and independent Exponential
On/Off sources, as described in Section 4.3, are used. The
sources generate unidirectional traffic to the sinks.
In these experiments, the number Æ of router hops in
the network is varied from 1 to 16. The number of fore-
ground flows à is varied from 1 to 4, while the number of
background flows Ä is varied from 2 to 32. Each simula-

8/3/2019 University of Calgary - Hybrid Packet-Fluid Flow Network Simulation
http://slidepdf.com/reader/full/university-of-calgary-hybrid-packet-fluid-flow-network-simulation 6/10
0
2
4
6
8
10
12
14
16
18
20
1 2 4 8 16
R e l a t i v
e S p e e d u p
N
(a) Medium load, K=1
L=2L=4L=8
L=16L=32
0
1
2
3
4
5
6
7
1 2 4 8 16
R e l a t i v
e S p e e d u p
N
(b) Heavy load, K=1
L=2L=4L=8
L=16L=32
Figure 5. Plots of relative speedup of hybrid implementation vs N for (a) Medium load with K=1 and(b) Heavy load with K=1.
tion configuration was run 10 times using different random
number seeds, with the average values for the performance
metrics calculated from the 10 runs. Each run simulated
600 seconds.
Three different levels of network load are studied: Light,
Medium, and Heavy. These scenarios correspond to no
packet loss, low packet loss, and high packet loss, respec-
tively. For Light load, the backbone link capacities are set
to Å £ ½ ¼ Mbps, which is double the capacity re-
quired to handleÅ
flows that are simultaneously in the On
state. The average offered network load is 25%, and queu-
ing within the network is negligible. (For space reasons,
these results are omitted from the paper.) For Medium load,the backbone link capacities are set to Å £ ¿ Mbps.
The average offered network load is about 70%, though the
peak load when many flows are active can clearly exceedthe
network capacity. These transient overloads induce queuing
delays at the points of congestion, and occasional losses of
packets. For Heavy load, the backbone link capacities are
set to Å £ ¾ Mbps. This is exactly enough capac-
ity to handle the long-term average load fromÅ
On/Off
sources. Significant queuing delays and packet losses can
occur when instantaneous demand exceeds this capacity.
5.1. Simulation Performance
Figure 5 shows the relative speedup results for the hybrid
simulation compared to the packet simulation, for a sin-
gle foreground flow in the network ( Ã ½ ). Figure 5(a)
presents the results for Medium load, while Figure 5(b)
presents the results for Heavy load. Each line on the graphs
represents a different number of background flows; these
are fluid flows in the hybrid simulation, and packet flows in
the packet simulation. In both graphs, the relative speedup
values are shown as a function of network sizeÆ
, the num-
ber of router hops. Note that the horizontal axes use a loga-
rithmic scale.
The simulation results in Figure 5 show (as expected)
that the hybrid simulation is faster than the packet simula-
tion. The relative speedup advantage varies from a factor of
2 to a factor of 20, depending on the network topology and
traffic model used.
Figure 5(a) presents the results for Medium network
load. Here, the performance advantage of the hybrid simu-
lation clearly increases as the number of (fluid) background
flows increases. However, there is a “diminishing returns”effect as well, which limits the relative speedup achieved
as the network size Æ increases. This phenomenon is at-
tributed to the “ripple effect”: as the number of possi-
ble congestion points in the network increases, it is more
likely that flow interactions and packet losses trigger rate
changes in the fluid flows, increasing the number of simu-
lation events in the hybrid model. The diminishing returns
effect is not present for the Light load scenario: relative
speedup always improves asÆ
is increased and asÄ
is in-
creased.
The impact of the “ripple effect” is even more pro-
nounced in Figure 5(b), for Heavy network load. The rela-
tive speedup values here are much lower than in Figure 5(a).Furthermore, adding more (fluid) background flows does
not always improve speedup. Initially, as the number of
background flows is doubled from 2 to 4, and from 4 to 8,
the speedup advantage of the hybrid simulation improves.
However, doubling Ä again to 16 improves speedup only
marginally on small networks, and makes speedup worse
(compared to Ä ) for large networks. Doubling Ä again
to 32 reduces the speedup advantage (compared to Ä ½ )

8/3/2019 University of Calgary - Hybrid Packet-Fluid Flow Network Simulation
http://slidepdf.com/reader/full/university-of-calgary-hybrid-packet-fluid-flow-network-simulation 7/10
-2
-1
0
1
2
3
4
1 2 4 8 16
R e l a t i v e P e r c e
n t E r r o r i n L a t e n c y
N
(a) Medium load, K=1
L=2L=4L=8
L=16L=32
-2
-1
0
1
2
3
4
1 2 4 8 16
R e l a t i v e P e r c e
n t E r r o r i n L a t e n c y
N
(b) Heavy load, K=1
L=2L=4L=8
L=16L=32
0
2
4
6
8
10
12
14
1 2 4 8 16
R e l a t i v e P e r c e n t E r
r o r i n J i t t e r
N
(c) Medium load, K=1
L=2L=4L=8
L=16L=32
-14
-12
-10
-8
-6
-4
-2
0
2
4
6
8
1 2 4 8 16
R e l a t i v e P e r c e n t E r
r o r i n J i t t e r
N
(d) Heavy load, K=1
L=2L=4L=8
L=16L=32
Figure 6. Plots of relative percent error in latency vs N for (a) Medium load with K=1 and (b) Heavyload with K=1 and relative percent error in jitter vs N for (c) Medium load with K=1 and (d) Heavy load
with K=1.
of the hybrid simulation across the full range of network
sizes considered. In general, speedup tends to decrease as
Æ
increases, due to the increased ripple effect. For larger
Ä or larger Æ , the hybrid implementation could be slower
than the packet implementation.
The relative speedup for à foreground flows at
Medium load (not shown here) is about half that in Fig-
ure 5(a) for à ½ . This decrease makes sense, given
the increase in the number of packet events in the simu-
lation. The qualitative shape of the speedup curves remainsthe same as the number of foreground flows is varied.
5.2. Simulation Accuracy
Figure 6 shows the simulation accuracy results for the
Medium and Heavy network load scenarios, for à ½
foreground flow. These graphs present the relative percent-
age error in mean end-to-end transfer latency (Figures 6(a)
and (b)) and jitter (Figures 6(c) and (d)) for the hybrid sim-
ulation, compared to the packet simulation.
These results show that the relative error in mean transfer
latency is low (e.g., less than 4% for all cases depicted in
Figure 6). Results for Light load (not shown here) also have
a relative error less than 4%, as expected.
The relative error in the jitter metric tends to be higher,
though it is still under 15% in all cases considered. This ob-
servation implies that the distribution of end-to-end delays
is similar in both the packet and hybrid simulations. For
Light load (not shown here), relative error in jitter is almost-100%. This is because there is little or no jitter in the hy-
brid simulation due to negligible queueing, whereas there is
some jitter in the packet simulation due to some queueing.
The results in Figure 6 also show that the relative er-
ror in latency and jitter tends to decrease (and stabilize) as
the number of background flows is increased. One possible
explanation is that as the number of background flows in-
creases, the flow interactions at the buffers increase, result-
8/3/2019 University of Calgary - Hybrid Packet-Fluid Flow Network Simulation
http://slidepdf.com/reader/full/university-of-calgary-hybrid-packet-fluid-flow-network-simulation 8/10
-2
0
2
4
6
8
10
12
14
16
1 2 4 8 16
R e l a t i v e P e r c e
n t E r r o r i n L a t e n c y
N
(a) Medium load, K=4
L=2L=4L=8
L=16L=32
0
20
40
60
80
100
1 2 4 8 16
R e l a t i v e P e r c
e n t E r r o r i n J i t t e r
N
(b) Medium load, K=4
L=2L=4L=8
L=16L=32
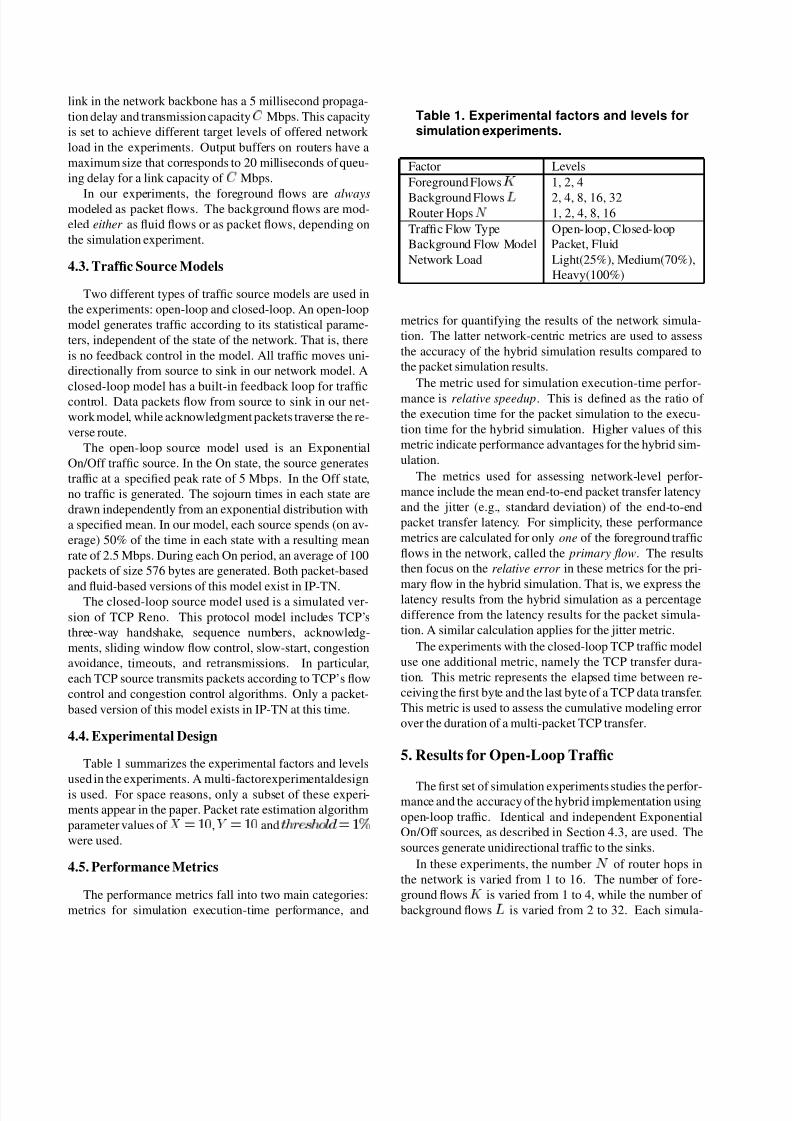
Figure 7. Plots of (a) relative percent error in latency vs N for Medium load with K=4 and (b) relativepercent error in jitter vs N for Medium load with K=4.
ing in fluid dynamics that better approximate the statisti-
cal multiplexing in the packet simulation. Furthermore, the
variance of the background traffic tends to decrease relative
to the mean as sources are aggregated, since the sources are
independent.
Increasing the number of foreground flows tends to in-
crease the relative error in both the latency and jitter met-
rics. This effect is illustrated in Figure 7 for à . This
effect is attributed to the dynamics of the packet rate esti-
mation algorithm.
6. Results for Closed-Loop Traffic
The second set of simulation experiments studies the ac-
curacy of the hybrid simulation for closed-loop traffic. A
Web client/server model is used to model a single fore-
ground flow, with multiple TCP transfers taking place (one
at a time, 100 seconds apart) on this foreground flow dur-
ing the simulation. Background flows use the Exponen-
tial On/Off source model (packet or fluid). The unidirec-
tional background traffic competes with the TCP data pack-
ets flowing from the server to the client. TCP acknowledg-
ment packets return on the uncontested reverse channel.
The purpose of the experiment is to compare TCP trans-
fer durations for both the packet and hybrid simulations. In
particular, we study the cumulative effect of the relative er-rors in packet transfer latencies on the overall TCP transfer
duration observed by a Web client.
For this experiment, we consider TCP transfer sizes
ranging from 1 KB to 50 KB, which spans the typical range
of Web document sizes. We focus only on the simulation
accuracy results for this performance metric, using a single
simulation run. The speedup results are not presented, since
they are overly optimistic: they are dominated by efficient
fluid-only execution of the background flows in between the
arrivals of the foreground TCP transfers.
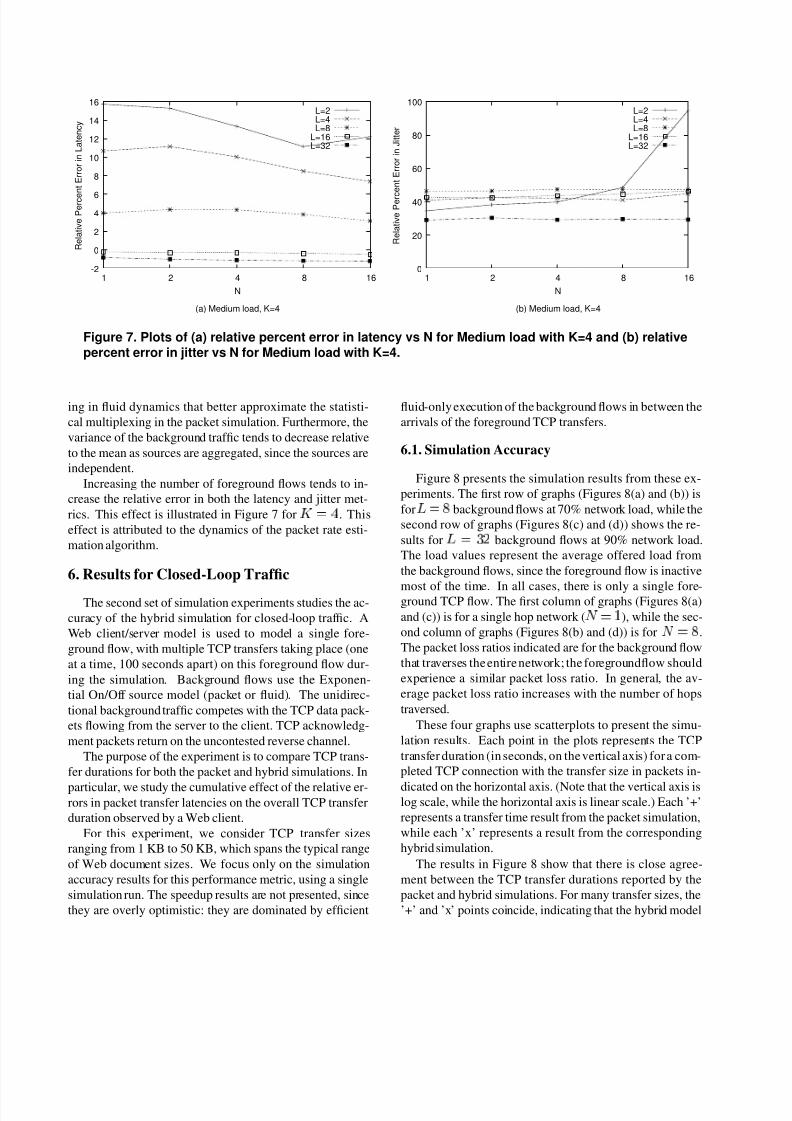
6.1. Simulation Accuracy
Figure 8 presents the simulation results from these ex-
periments. The first row of graphs (Figures 8(a) and (b)) is
for Ä background flows at 70% network load, while the
second row of graphs (Figures 8(c) and (d)) shows the re-
sults for Ä ¿ ¾ background flows at 90% network load.
The load values represent the average offered load from
the background flows, since the foreground flow is inactive
most of the time. In all cases, there is only a single fore-ground TCP flow. The first column of graphs (Figures 8(a)
and (c)) is for a single hop network ( Æ ½ ), while the sec-
ond column of graphs (Figures 8(b) and (d)) is forÆ
.
The packet loss ratios indicated are for the background flow
that traverses the entire network; the foregroundflow should
experience a similar packet loss ratio. In general, the av-
erage packet loss ratio increases with the number of hops
traversed.
These four graphs use scatterplots to present the simu-
lation results. Each point in the plots represents the TCP
transfer duration (in seconds, on the vertical axis) for a com-
pleted TCP connection with the transfer size in packets in-
dicated on the horizontal axis. (Note that the vertical axis islog scale, while the horizontal axis is linear scale.) Each ’+’
represents a transfer time result from the packet simulation,
while each ’x’ represents a result from the corresponding
hybrid simulation.
The results in Figure 8 show that there is close agree-
ment between the TCP transfer durations reported by the
packet and hybrid simulations. For many transfer sizes, the
’+’ and ’x’ points coincide, indicating that the hybrid model

8/3/2019 University of Calgary - Hybrid Packet-Fluid Flow Network Simulation
http://slidepdf.com/reader/full/university-of-calgary-hybrid-packet-fluid-flow-network-simulation 9/10
0.01
0.1
1
10
100
0 10 20 30 40 50 60 70 80 90 100
T r a n s f e r T
i m e ( s e c o n d s )
Transfer Size (packets)
(a) N=1, L=8, packet loss=0.1%
Packet ModelHybrid Model
0.01
0.1
1
10
100
0 10 20 30 40 50 60 70 80 90 100
T r a n s f e r T
i m e ( s e c o n d s )
Transfer Size (packets)
(b) N=8, L=8, packet loss=1%
Packet ModelHybrid Model
0.01
0.1
1
10
100
0 10 20 30 40 50 60 70 80 90 100
T r a n s f e r T i m e ( s e c o n d s )
Transfer Size (packets)
(c) N=1, L=32, packet loss=0.5%
Packet ModelHybrid Model
0.01
0.1
1
10
100
0 10 20 30 40 50 60 70 80 90 100
T r a n s f e r T i m e ( s e c o n d s )
Transfer Size (packets)
(d) N=8, L=32, packet loss=3%
Packet ModelHybrid Model
Figure 8. Plots of transfer time vs transfer size for (a) N=1, L=8, packet loss=0.1% (b) N=8, L=8, packetloss=1% (c) N=1, L=32, packet loss=0.5% and (d) N=8, L=32, packet loss=3%.
provides an excellent approximation of the TCP transfer du-
ration in the packet simulation.
All four graphs show a distinctive structure representa-
tive of TCP. In particular, as the transfer size is increased, a
step-like structure appears, indicating the additional round-
trip times required to complete the transfer. The step-like
structure is most evident at Light load (not shown here),
since there is little or no queuing delay in the network. At
higher loads, queuing delays, packet losses, and retrans-
missions can add to the transfer duration, producing points
above the lower bound corresponding to network round-triptimes.
The encouraging observation is the close agreement in
transfer durations even for some points above the TCP
lower bound. This suggests that the hybrid model pro-
duces queuing delays and packet losses that are similar to
the packet model, triggering similar TCP behaviors at the
endpoints. In addition, these results suggest that relative
errors in modeling end-to-end packet transfer delay do not
accumulate; rather, they seem to average out over a multi-
packet transfer. This observation is particularly promising
for network emulation purposes.
The fidelity of the hybrid simulation is better for the
single-hop network (Figures 8(a) and (c)) than for Æ
(Figures 8(b) and (d)), and better at 70% load (Figures 8(a)
and (b)) than at 90% load (Figures 8(c) and (d)). There
are some discrepancies between ’+’ and ’x’ points in all
four graphs. These discrepancies may represent packet loss
events triggered in one simulation model but not the other,
or simply packet losses that occur at different places withinthe multi-packet transfer. Nevertheless, the distribution of
transfer durations appears similar in both the packet and hy-
brid models.
7. Conclusions and Future Work
This paper presented a hybrid network simulation model
that integrates both packet and fluid flows. Initial results

8/3/2019 University of Calgary - Hybrid Packet-Fluid Flow Network Simulation
http://slidepdf.com/reader/full/university-of-calgary-hybrid-packet-fluid-flow-network-simulation 10/10
show up to 20 times speedup using the hybrid approach
over using a purely packet-based approach. Accuracy is
within 4% for latency and 15% for jitter in many cases,
though accuracy decreases as the number of packet fore-
ground flows increases. Performance improves when more
fluid background flows are modeled, as long as congestion
is not too high. Performance decreases in cases where alarge congested network leads to the ripple effect dominat-
ing. Increasing the ratio of packet flows to fluid flows also
decreases performance.
In the network model for which simulation results are
presented, each link is modeled to have approximately the
same congestion level. Therefore, each backbone link was
a bottleneck when congestion levels were high. Since it is
unusual for all links to be bottlenecks, performance levels
achieved using these techniques with real simulation mod-
els is likely to be much higher than for the benchmark re-
sults presented. However, this approach may not be appro-
priate for use in models with large numbers of packet flows
and high congestion.Further research is required to fully understand the im-
pact the hybrid implementation has on accuracy and perfor-
mance. It is possible that components of the hybrid imple-
mentation could be improved to offer greater accuracy and
performance. Also, studies need to be performed to deter-
mine the performance capabilities using this approach along
with parallel discrete event simulation techniques. Finally,
experiments need to be performed to determine how much
performance can be increased for real-time network emula-
tion experiments using this approach.
8. Acknowledgments
Financial support for this research was provided by
NSERC (Natural Sciences and Engineering Research Coun-
cil of Canada), iCORE (Informatics Circle of Research Ex-
cellence) and ASRA (Alberta Science and Research Au-
thority). Other members of the IP-TN development team
include Mike Bonham, Roger Curry, Mark Fox, Hala Taleb,
Kitty Wong and Xiao Zhong-e. The authors wish to thank
Christiane Lemieux, who supervised a course project con-
ducted by Cameron Kiddle on fluid modeling techniques.
Also, the authors wish to thank the anonymous referees for
their constructive comments regarding the paper.
References[1] R. M. Fujimoto, T. McLean, K. Permualla, and I. Tacic. De-
sign of high performance RTI software. In Proceedings of
the Fourth IEEE Workshop on Distributed Simulation and
Real-Time Applications, pages 89–96, 2000.
[2] G. Kesidis, A. Singh, D. Cheung, and W. W. Kwok. Feasi-
bility of fluid event-driven simulation for ATM networks. In
Proceedings of the IEEE Global Telecommunications Con-
ference, pages 2013–2017, 1996.
[3] B. Liu, D. R. Figueiredo, Y. Guo, J. Kurose, and D. Towsley.
A study of networks simulation efficiency: Fluid simulation
vs. packet-level simulation. In Proceedings of the Twentieth
Annual Joint Conference of the IEEE Computer and Commu-
nications Societies (INFOCOM), pages 1244–1253, 2001.
[4] B. Liu, Y. Guo, J. Kurose, D. Towsley, and W. Gong. Fluid
simulation of large scale networks: Issues and tradeoffs. In
Proceedings of the International Conference on Parallel and
Distributed Processing Techniques and Applications, pages
2136–2142, 1999.
[5] B. Melamed, S. Pan, and Y. Wardi. Hybrid discrete-
continuous fluid-flow simulation. In Scalability and Traffic
Control in IP Networks, Sonia Fahmy, Kihong Park, Editors,
Proceedings of SPIE Vol. 4526, pages 263–270, 2001.
[6] V. Misra, W. Gong, and D. Towsley. Fluid-based analysis
of a network of AQM routers supporting TCP flows with
an application to RED. Computer Communication Review,
30(4):151–160, 2000.
[7] D. Nicol. Discrete event fluid modeling of TCP. In Pro-
ceedings of the 2001 Winter Simulation Conference, pages
1291–1299, 2001.
[8] D. Nicol, M. Goldsby, and M. Johnson. Fluid-based simula-
tion of communication networks using SSF. In Proceedings
of the 11th European Simulation Symposium, pages 270–
274, 1999.
[9] J. M. Pitts. Cell-rate modelling for accelerated simulation of
ATM at the burst level. IEE Proceedings-Communications,
142(6):379–385, 1995.
[10] G. F. Riley, R. M. Fujimoto, and M. H. Ammar. A
generic framework for parallelization of network simula-
tions. In Proceedings of the Seventh International Sympo-
sium on Modeling, Analysis and Simulation of Computer and
Telecommunication Systems, pages 128–135, 1999.
[11] G. F. Riley, T. M. Jaafar, and R. M. Fujimoto. Integratedfluid and packet network simulations. In Proceedings of the
Tenth IEEE International Symposium on Modeling, Analy-
sis and Simulation of Computer and Telecommunication Sys-
tems, pages 511–518, 2002.
[12] R. Simmonds, R. Bradford, and B. Unger. Applying paral-
lel discrete event simulation to network emulation. In Pro-
ceedings of the 14th Workshop on Parallel and Distributed
Simulation, pages 15–22, 2000.
[13] T. K. Yung, J. Martin, M. Takai, and R. Bagrodia. Integration
of fluid-based analytical model with packet-level simulation
for analysis of computer networks. In Internet Performance
and Control of Network Systems II , Robert D. van der Mei,
Frank Huebner-Szabo de Bucs, Editors, Proceedings of SPIE
Vol. 4523, pages 130–143, 2001.
[14] X. Zeng, R. Bagrodia, and M. Gerla. GloMoSim: A library
for parallel simulation of large-scale wireless networks. In
Proceedings of the 12th Workshop on Parallel and Dis-
tributed Simulation, pages 154–161, 1998.
Related Documents